Environmental responsiveness of fibre diameter in grazing fine wool Merino sheep
12
CSIRO PUBLISHING www.publish.csiro.au/journals/ajar Australian Journal of Agricultural Research, 2005, 56, 673–684 Environmental responsiveness of fibre diameter in grazing fine wool Merino sheep D. J. Brown A,B,D and B. J. Crook A,C A Animal Science, University of New England, Armidale, NSW 2350, Australia. B Present address: Animal Genetics and Breeding Unit, University of New England, Armidale, NSW 2350, Australia. C Present address: Agricultural Business Research Institute, University of New England, Armidale, NSW, Australia. D Corresponding author. Email: [email protected] Abstract. Fibre diameter, fibre length, and the ratio of fibre length growth to mean fibre diameter (L/D), fibre diameter profile characteristics, and staple strength were examined in 16 fine wool Merino wethers in a 12-month field experiment. Variations in fibre diameter, fibre length, and L/D were shown to be associated with fibre diameter profile characteristics and staple strength. At constant fibre diameter, L/D was significantly positively related to variation in fibre diameter along the staple. A positive correlation between seasonal variation in L/D and variation in diameter between fibres was also observed. Staple length was significantly positively correlated with along-staple variation in fibre diameter and negatively correlated with variation in fibre diameter among fibres. Among-fibre variation in fibre diameter was not significantly correlated with along-staple variation in fibre diameter. Seasonal variation in fibre length growth, fibre diameter, and the ratio of length to diameter throughout the year was associated with increased variation in fibre diameter along the fibre diameter profile and reduced staple strength in grazing sheep. Seasonal variation in fibre diameter was mostly related to mean fibre diameter, L/D, and seasonal variation in fibre length growth rate. Changes in fibre diameter throughout the year were also related to seasonal changes in body weight, fat depth, and skin thickness. Additional keywords: fibre diameter profile, L/D, body weight, fat depth, skin thickness. Introduction Fibre diameter profile (FDP) characteristics vary among environments, bloodlines, sire groups, and individual sheep (Jackson and Downes 1979; Denney 1990; Hansford 1994, Adams et al. 1996, 1997, 1998; Adams and Briegel 1998; Brown et al. 1999, 2002) and explain significant variation in staple strength (Adams and Briegel 1998; Adams et al. 1998; Peterson et al. 1998; Brown et al. 1999, 2002). At present, variation among sheep and bloodlines in their seasonal changes in fibre diameter is not fully understood. The contribution of fibre diameter and length to wool growth varies among fibres, over time, and between sheep. The ratio of fibre length growth to fibre diameter (L/D) is an important consideration for changing wool growth and the characteristics of the fibre grown and also may determine the way in which it responds, in terms of fibre diameter, to changes in nutrition (Woods and Orwin 1988; Hynd 1992). Although individual sheep maintain a relatively constant L/D, there are significant differences among fibres and sheep in L/D (Woods and Orwin 1988), ranging approximately from 10 : 1 to 30 : 1 (Hynd 1992; Reis 1992). Therefore direct or indirect selection of sheep with high L/D should have 2 desirable outcomes: greater fibre lengths and reduced fibre diameter variability along fibres (Hynd 1992). Actual changes in fibre length and fibre diameter are also highly variable between sheep (Hynd 1992). The ratio of the change in fibre length to the change in fibre diameter for individual sheep ranged from 13 : 1 to 80 : 1 (Hynd 1992). Differences in these characteristics may explain some of the large differences among sheep in staple strength. L/D was thought to be independent of nutrition (Downes 1971; Cottle 1987; Reis 1992) and remain constant with changes in the rate of wool growth (Reis 1991). Studies conducted throughout a year of wool growth demonstrated that L/D exhibits a seasonal trend (Woods and Orwin 1988; Schlink et al. 1996a). No explanation is apparent for these trends; however, it has been suggested that the mechanisms determining these growth parameters in the follicle are complex (Woods and Orwin 1988). The evidence indicates that not only does the L/D vary among sheep but the level of seasonal variation of these characteristics also varies among sheep (Woods and Orwin 1988). Variation © CSIRO 2005 10.1071/AR04182 0004-9409/05/070673
-
Upload
independent -
Category
Documents
-
view
0 -
download
0
Transcript of Environmental responsiveness of fibre diameter in grazing fine wool Merino sheep

CSIRO PUBLISHING
www.publish.csiro.au/journals/ajar Australian Journal of Agricultural Research, 2005, 56, 673–684
Environmental responsiveness of fibre diameter in grazing fine woolMerino sheep
D. J. BrownA,B,D and B. J. CrookA,C
AAnimal Science, University of New England, Armidale, NSW 2350, Australia.BPresent address: Animal Genetics and Breeding Unit, University of New England, Armidale, NSW 2350, Australia.CPresent address: Agricultural Business Research Institute, University of New England, Armidale, NSW, Australia.
DCorresponding author. Email: [email protected]
Abstract. Fibre diameter, fibre length, and the ratio of fibre length growth to mean fibre diameter (L/D),fibre diameter profile characteristics, and staple strength were examined in 16 fine wool Merino wethers in a12-month field experiment. Variations in fibre diameter, fibre length, and L/D were shown to be associated withfibre diameter profile characteristics and staple strength. At constant fibre diameter, L/D was significantly positivelyrelated to variation in fibre diameter along the staple. A positive correlation between seasonal variation in L/Dand variation in diameter between fibres was also observed. Staple length was significantly positively correlatedwith along-staple variation in fibre diameter and negatively correlated with variation in fibre diameter among fibres.Among-fibre variation in fibre diameter was not significantly correlated with along-staple variation in fibre diameter.Seasonal variation in fibre length growth, fibre diameter, and the ratio of length to diameter throughout the year wasassociated with increased variation in fibre diameter along the fibre diameter profile and reduced staple strength ingrazing sheep. Seasonal variation in fibre diameter was mostly related to mean fibre diameter, L/D, and seasonalvariation in fibre length growth rate. Changes in fibre diameter throughout the year were also related to seasonalchanges in body weight, fat depth, and skin thickness.
Additional keywords: fibre diameter profile, L/D, body weight, fat depth, skin thickness.
IntroductionFibre diameter profile (FDP) characteristics vary amongenvironments, bloodlines, sire groups, and individual sheep(Jackson and Downes 1979; Denney 1990; Hansford 1994,Adams et al. 1996, 1997, 1998; Adams and Briegel1998; Brown et al. 1999, 2002) and explain significantvariation in staple strength (Adams and Briegel 1998;Adams et al. 1998; Peterson et al. 1998; Brown et al.1999, 2002). At present, variation among sheep andbloodlines in their seasonal changes in fibre diameter is notfully understood.
The contribution of fibre diameter and length to woolgrowth varies among fibres, over time, and between sheep.The ratio of fibre length growth to fibre diameter (L/D)is an important consideration for changing wool growthand the characteristics of the fibre grown and also maydetermine the way in which it responds, in terms offibre diameter, to changes in nutrition (Woods and Orwin1988; Hynd 1992). Although individual sheep maintaina relatively constant L/D, there are significant differencesamong fibres and sheep in L/D (Woods and Orwin 1988),ranging approximately from 10 : 1 to 30 : 1 (Hynd 1992;
Reis 1992). Therefore direct or indirect selection of sheepwith high L/D should have 2 desirable outcomes: greaterfibre lengths and reduced fibre diameter variability alongfibres (Hynd 1992). Actual changes in fibre length andfibre diameter are also highly variable between sheep (Hynd1992). The ratio of the change in fibre length to the changein fibre diameter for individual sheep ranged from 13 : 1to 80 : 1 (Hynd 1992). Differences in these characteristicsmay explain some of the large differences among sheep instaple strength.
L/D was thought to be independent of nutrition (Downes1971; Cottle 1987; Reis 1992) and remain constant withchanges in the rate of wool growth (Reis 1991). Studiesconducted throughout a year of wool growth demonstratedthat L/D exhibits a seasonal trend (Woods and Orwin1988; Schlink et al. 1996a). No explanation is apparentfor these trends; however, it has been suggested that themechanisms determining these growth parameters in thefollicle are complex (Woods and Orwin 1988). The evidenceindicates that not only does the L/D vary among sheep butthe level of seasonal variation of these characteristics alsovaries among sheep (Woods and Orwin 1988). Variation
© CSIRO 2005 10.1071/AR04182 0004-9409/05/070673

674 Australian Journal of Agricultural Research D. J. Brown and B. J. Crook
among sheep in the levels of seasonal variation in fibrelength growth rate, fibre diameter, and L/D may influencestaple strength.
L/D may influence the degree to which individual sheeprespond to their environment and differences in L/D maybe associated with differences in FDP characteristics andstaple strength; however, these relationships have not yet beeninvestigated.
Sheep with a lower initial fibre diameter can show a smallerrelative proportion of fibre diameter change with improvednutrition compared with those sheep with a higher initial fibrediameter (Jackson and Downes 1979; Thompson 1993; Bowand Hansford 1994; Earl et al. 1994; Kopke and HockingEdwards 1998; Brown et al. 2002). Therefore, differencesamong sheep in FDP characteristics may be influencedby differences in mean fibre diameter. These relationshipshave not been investigated in combination with L/D, staplestrength, and body traits.
Wool growth is influenced by many physiological andnutritional factors throughout the year that vary throughoutthe year (Adams et al. 1994). The major factor controllingwool growth is the availability of nutrients to the woolfollicle (Allden 1979; Reis 1979, 1991). The supply of thesenutrients is influenced by changes in nutrient partitioningand body composition. Given that it is the skin that supportsand nourishes the massive population of wool follicles it isnot surprising that skin thickness is related to wool growth(Gregory 1982; Williams and Thornberry 1992) and is relatedto the body condition of sheep (Hutchinson 1957; Lyne 1964;Williams and Morley 1994; Murray 1996; Schlink et al.1996b). It may be possible that differences in skin thicknessand seasonal variation in skin thickness among animals maybe associated with differences in FDPs. Sheep that have lessvariation in skin thickness throughout the year may be able tobetter maintain skin condition and therefore follicle nutrition.This would result in reduced fibre diameter variation alongthe FDP.
Adams and Briegel (1998) suggested that large body sizemight provide a buffer of body reserves for wool growth.Furthermore, empty body weight, carcass fat, carcass muscle,and visceral lean can show significant oscillation throughoutthe year when sheep are fed a constant intake (Ball et al.1996). This may be due to seasonal shifts in metabolismand seasonal effects on the priorities for tissue depositionand retrieval that are independent of variation in feed intakeand seasonal variation in the utilisation of feed. Differencesamong sheep in body weight and composition, and seasonalvariation in these traits, may be associated with seasonalvariation in fibre diameter and staple strength.
This study aims to define the relationships between initialfibre diameter, average L/D, and seasonal variation in L/D andFDP variation and staple strength. The influence of seasonalchanges in body weight, body condition, and skin thicknesson these relationships will also be investigated.
Materials and methodsAnimals
Forty-eight 2-year-old fine wool Merino wethers were obtained from theKirby Rural Research Station. All animals originated from the same moband had similar management histories. The mean fibre diameter of the48 wethers was measured using a small wool sample from the left-handmid-side patch. This sample was scoured (3 hexane washes followedby 1 hot water wash), dried, and the fibre diameter was measured usingthe Sirolan Laserscan (Sirolan Laserscan Technology) (Charlton 1995).The 48 animals were ranked on mean fibre diameter and divided into 16consecutive groups of 3 animals. Sixteen experimental animals werethen selected using a stratified selection technique. One sheep wasrandomly selected from each group to give a relatively even distributionof initial fibre diameters (IMFD).
After the animals were selected, all the sheep were maintained as asingle grazing mob (in an experimental paddock) for a 4-week pre-experimental period to reduce the environmental differences amongsheep in fibre diameter.
Environment
The sheep were maintained for the duration of the experiment at theKirby Rural Research Station, 10 km north-west of Armidale, NSW(30◦31′00 S, 151◦39′50 E). The experimental paddocks consisted ofnative and improved grass pasture species.
Sampling regime
The animals were sampled at 12 times throughout the experiment,approximately 4 weeks apart. At each of these samplings the unfastedbody weight (Bwt) of the sheep was measured using electronic sheepscales (Ruddweigh). The skin thickness and fat depth were measured(using callipers and ultrasound) and a dyeband inserted at each of thesesamplings as described below.
Wool measurements
Dyebands
At each sampling time a dyeband was inserted at the base of a lineof staples (approx. 10-cm long running in a dorsal–ventral direction)using a blunt 21-gauge needle and 1-mL syringe. The dyeband fluid wasmixed at 0.8% (w/v) Durafur Black flakes and 0.8% (w/v) concentratedhydrogen peroxide dissolved in cold water. These staples were locatedapproximately 10 cm anterior of the right mid-side patch.
At the end of the experiment a mid-side sample was collected. Thissample was not from the true mid-side region as this site was used forskin measurements. The sample used to represent the mid-side samplewas collected adjacent to the mid-side area. This sample consisted ofall wool staples between the clipped patch used for the skin thicknessmeasurements and the staples that were dyebanded.
Three wool staples were randomly selected from the dyebandedstaples and used to measure fibre diameter at, and staple lengthbetween, each dyeband. Staple length was measured 3 times betweeneach dyeband using a standard steel ruler. These measurements wereaveraged to give staple length growth between each dyeband. Fromthese measurements, average (AvSLBands) and variation (SDSLBands
and CVSLBands) in staple length growth between the dyebands werecalculated. A 2-mm snippet was guillotined at each dyeband on eachof the 3 staples, washed (3 × 5-min hexane washes and one 5-min hotwater wash), dried overnight, and the fibre diameter measured using500 counts by the Sirolan Laserscan.
L/Ds
Fibre length and fibre diameter were measured betweenDays 64–92, 204–232, and 318–344 using autoradiography (modified
Environmental responsiveness of fibre diameter Australian Journal of Agricultural Research 675
from Hynd 1994). The measurements were made on a small bundle ofstaples located approximately 120 mm dorsally of the right mid-sidepatch. Each measurement period consisted of 2 intradermal injectionsapproximately 28 days apart with 0.3 mL of normal saline solutioncontaining 5.1 µCi/mL of 35S-cysteine hydrochloride (based on activityat harvest). Twenty-one days after the second injection the labelledstaples were harvested (clippers), cleaned (3 hexane washes followedby 1 hot water wash), stained with picric acid, washed in hot water, anddried overnight. Approximately 70 fibres were randomly selected fromthe sample and mounted on glass slides with Polyvinylpyrrolidone (BDHLimited Poole England) and exposed to X-ray film (AGFA StructurixD7FW) for 7 days. The film was superimposed onto the slides withDPX (Ajax Chemicals). The fibre diameter was measured at 10 sitesapproximately equidistant between the labelled areas on at least 50fibres, using an image analysis system (Leica Quantimet 500MC LeicaCambridge Ltd). The image analysis program was calibrated using astandard haemocytometer. Fibre length was measured on 50 fibres foreach sheep by tracing the fibre between the labelled points using thesame image analysis system. The mean fibre diameter, fibre diametervariation, mean fibre length, and fibre length variation for the periodof wool growth were calculated for each sheep. The ratio of fibrelength growth per day (µm/day) to mean fibre diameter was calculated(L/D). The 3 periods were combined to obtain average fibre length(AvFL), fibre length variation (AvFLCV), L/D (AvL/D), variation inL/D (L/DCV), variation in average fibre diameter (FDCV), and thevariation in fibre growth rate (FGCV) for each animal. The averageabsolute change in fibre length growth rate (�FL), fibre diameter(�FD), and the ratio of change in fibre length growth to change infibre diameter (�FL/�FD) between the 3 measurement periods werealso calculated.
FDPs and FDP characteristics
A FDP was generated for each sheep using the FDP predictiontechnique (1 in 4 level of inclusion) described by Brown et al. (2000).Briefly, a wool staple was randomly selected from the mid-side sampleof each animal and was scoured (3 × 5 min in hexane and 1 × 5 min inhot water), dried overnight, wrapped in cling wrap, and segmented ina series of 2-mm snippets for the entire length of the staple. The totalnumber of snippets in the original FDP was recorded. The first, last, andevery fourth snippet in-between were measured for fibre diameter usingthe Sirolan Laserscan. A cubic spline was fitted using S-Plus (StatisticalSciences 1995), which generated a predicted FDP for each animal, thesame length as the original FDP.
The FDP for each sheep was described using a number ofcharacteristics, which were selected to suit the general shape of theFDP, which was a generalised ‘N shape’. Three major points wereidentified in each of the profiles at which fibre diameter and positionwere recorded. These points were at the position of the minimumfibre diameter (Mindiam) between the 2 distinct points of maximumfibre diameter, the maximum fibre diameter between the Mindiamand the tip of the profile, and the maximum fibre diameter betweenthe Mindiam and the base of the profile. Using these 3 points, 2rates of fibre diameter change were calculated. The first rate ofchange was calculated between the first point of maximum fibrediameter and the Mindiam (Roc1) and the second rate of change wascalculated between the Mindiam and the second point of maximumfibre diameter (Roc2). These rates of change were calculated by fittinga linear regression to all points between the respective maximumand minimum. The FDP characteristics of overall maximum fibrediameter (Max) and along-staple variation in fibre diameter (AstCV)were also calculated for each FDP. The coefficient of variation of fibrediameter within each snippet was averaged over all snippets within eachoriginal FDP to give an estimate of between-fibre variation in fibrediameter (AvSnipCV).
Staple strength and staple length
Ten staples were randomly selected from the mid-side sample byusing a sampling board. The board was 24-cm wide and 30-cm long, with5 randomly placed holes (32 mm in diameter). This board was randomlyplaced on the mid-side sample, which was spread out on a bench. Astaple was randomly selected from each hole and the board was rotated90 degrees and another staple selected from each hole. These stapleswere left to condition overnight (20 ± 2◦C and 63 ± 2% humidity).Staple length (SL) and staple strength (SS) were measured for eachstaple using the Agritest StapleBreaker Model 2 (Vizard et al. 1994;Baxter 1996).
Fibre diameter
The remaining mid-side sample was used to measure mean fibrediameter. The entire sample of approximately 10 g was scoured using2 hot water and Lissapol detergent (manufactured by ICI Chemicaland distributed by Spectrum Distributors as Hydropol TN450) washesand a final plain hot water wash. The samples were then spun forapproximately 2 min and dried at 70◦C for 30 min. The sample was thenmini-cored and the fibre diameter (mid-side MFD) and fibre diametervariation (mid-side MFDCV) measured using 2000 counts by the SirolanLaserscan.
Fat depth
The depth of subcutaneous fat at the C site (over the eye muscle ofthe 12th rib) was measured within 3 days either side of each of the12 sampling times. These measurements were made using an Aloka500V real time ultrasound scanner at a frequency of 3.5 Mega Hertz.The probe was 17.5-cm long and designed for use in cattle. Althoughit would have been more appropriate to use a smaller, higher frequencyprobe, financial constraints made this unfeasible.
Skin thickness
The average skin thickness of the sheep was measured at eachsampling time using a technique described by Williams and Thornberry(1992). Skin thickness was measured at 2 points randomly selectedon the right mid-side after close clipping (Oster small animalclippers, size 30 blade). These 2 points were marked with apermanent marking pen and used for the skin measurements at eachsampling. A double fold of skin was measured using dial gaugecallipers that exerted a constant pressure of 1250 g/cm2 (Lyne 1964).A measurement was made at each spot with the callipers facing inanterior–posterior direction and a second measurement was made ina dorsal–ventral direction. For each animal, average skin thickness(Skin) and variation in skin thickness (SkinCV) over the experimentalperiod were calculated.
Statistical analysis
The strength and direction of the relationships between the variousfibre, staple, and body characteristics were examined using simplecorrelation and stepwise multiple regression analysis performed usingthe CORR and REG procedures of SAS (1990). The stepwise multipleregression fitted the most highly correlated variable first and thenindividual variables were added one at a time to see which had thegreatest effect on the proportion of variation explained. Only variablesthat added significantly (P < 0.15) to the explained variance wereretained in the model. Least squares analysis of variance was alsoused to compare L/D among measurements and initial and mid-sidemean fibre diameter measurements. The model for each analysis ofvariance included the random effects of animal and measurementwithin animal.

676 Australian Journal of Agricultural Research D. J. Brown and B. J. Crook
Results
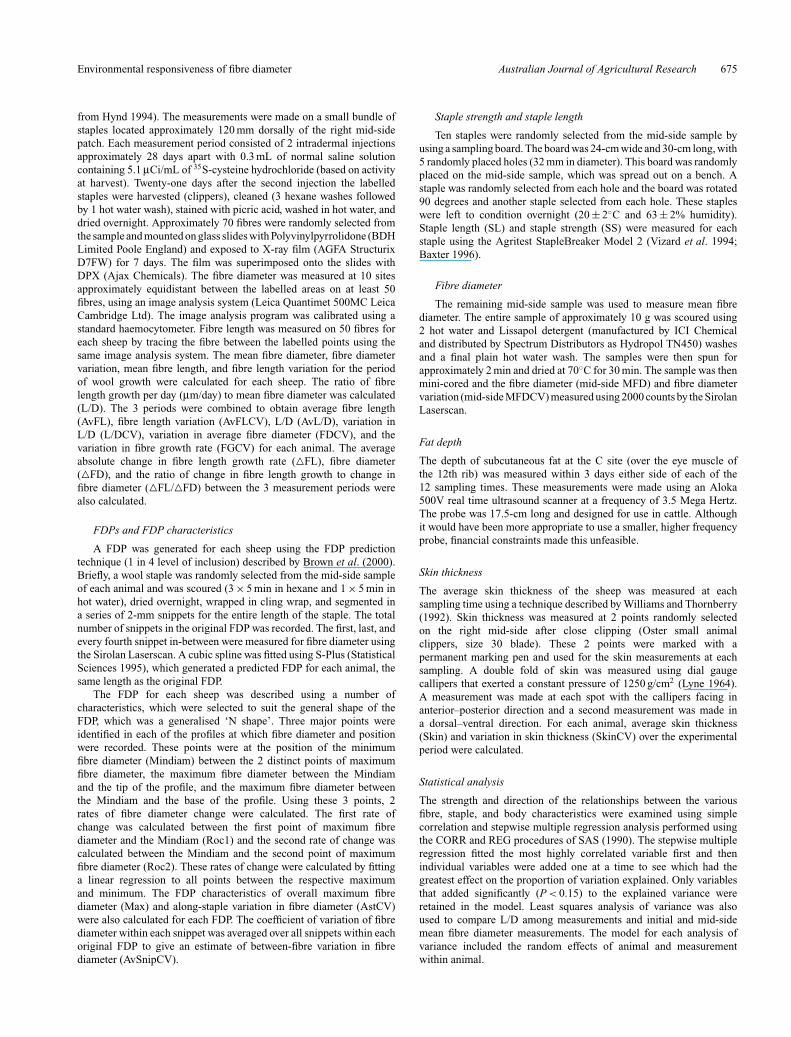
There was large variation (>20% CV) among the 16experimental sheep for most traits and also in their FDP.FDPs from sheep with similar initial mean fibre diameterand FDP length exhibited markedly different patterns offibre diameter throughout the experiment (Fig. 1). Bodyweight (Bwt) showed a steady increasing trend throughout theexperiment, rising from 40.1 kg at the start of the experimentto 51.1 kg at the end of the experiment (Fig. 2). Fat depthshowed a seasonal trend that was similar to that of the FDPsand feed on offer. The variation in skin thickness throughoutthe experiment was smaller relative to that of Fat andthe FDPs.
There were significant (P < 0.001) differences in L/Damong animals and among measurements of L/D. The firstL/D measurement was significantly lower (P < 0.05) than the2nd and 3rd measurements (the least square means were16.8 ± 0.3, 18.4 ± 0.3, and 18.9 ± 0.3 µm/day.µm for the1st, 2nd, and 3rd measurements, respectively) but highlycorrelated with each (r = 0.87, P < 0.05 and c = 0.93,P < 0.05, respectively). The 2nd and 3rd L/D measurements
14
15
16
17
18
19
20
21
22
23
24
4 12 20 28 36 44 52 60 68 76 84 92
FDP length (mm)
Fib
re d
iam
eter
(µm
)
Fig. 1. Example of the FDPs from 3 of the experimental animals ofsimilar fibre diameter profile length and initial fibre diameter.
30
33
36
39
42
45
48
51
54
1 2 3 4 5 6 7 8 9 10 11 12
Sampling No.
Bod
y w
eigh
t (kg
)
1.5
1.7
1.9
2.1
2.3
2.5
2.7
2.9
3.1
3.3
Fat
dep
th a
nd s
kin
thic
knes
s(m
m)
Fig. 2. Body weight (�), fat depth (•) and skin thickness (�)throughout the experimental period.
were also highly correlated (r = 0.90, P < 0.05) and notsignificantly different (P > 0.05).
Relationship between the FDP characteristicsand the fibre-based measurements
Average L/D was negatively correlated with Max, Mindiam,Roc1, and Roc2 (Table 1). Over all animals in the study,average L/D was not highly correlated with AstCV (r = 0.14);however, there were strong relationships observed withinfibre diameter groups. The relationship between averageL/D and AstCV increased to r = 0.70 when only the 8animals with mid-side MFD values between 17.5 and 18.8 µmwere examined. This relationship further strengthened(r = 0.98) when the 5 animals with values 18.2 and 18.8 µmwere compared.
Seasonal variation in L/D (L/DCV) was negativelycorrelated with along-staple variation in fibre diameter(r = −0.36) and the rates of fibre diameter change butpositively correlated with variation among fibres (r = 0.46).Average fibre length growth was positively correlated withalong-staple variation in fibre diameter (r = 0.52). �FL and�FD were positively correlated with all FDP characteristics.In a multiple regression equation the characteristics of CVSL(bands) (13.6%), �FD (42.3%), �FL (2.5%), and FDCV(18.6%) explained in total 77% (P < 0.05) of the variationof AstCV. The remaining characteristics did not significantlyexplain any additional variation in AstCV.
Relationship between FDP characteristics and mid-sidewool quality characteristics
Initial MFD and mid-side MFD were significantly andpositively correlated with all FDP characteristics exceptAvSnipCV (Table 2). Initial MFD and AstCV werepositively associated (r = 0.61). Initial MFDCV was onlysignificantly correlated with AvSnipCV (r = 0.53), whereasmid-side fibre diameter variation was significantly andpositively correlated with absolute fibre diameter valuesin the FDP. Mid-side variation in fibre diameter was notsignificantly correlated with along-staple variation in fibrediameter (r = –0.09, P > 0.05) but significantly positivelycorrelated with between-fibre variation in fibre diameter(r = 0.79, P < 0.001).
Staple length was significantly positively correlated withalong-staple variation in fibre diameter but negativelycorrelated with variation in fibre diameter among fibres.Among fibre variation in fibre diameter was also notsignificantly correlated with along-staple variation in fibrediameter (r = −0.10, P > 0.05).
Relationship between FDP characteristicsand body traits
Variation in body weight (BwtCV) was significantlypositively correlated with AstCV. Skin thickness waspositively correlated with absolute fibre diameter within the

Environmental responsiveness of fibre diameter Australian Journal of Agricultural Research 677
Table 1. Correlation coefficients for the relationships between the wool fibre characteristics and thefibre diameter profile characteristics
Max, maximum fibre diameter; Mindiam, minimum fibre diameter; AstCV, coefficient of variation in fibrediameter along the fibre diameter profile; Roc1, first rate of fibre diameter change; Roc2, second rate offibre diameter change; AvSnipCV, average along the fibre diameter profile of the CV in fibre diameterwithin each snippet; AvL/D, average ratio of fibre length to fibre diameter over the three measurementperiods; L/DCV, CV in the ratio of fibre length to fibre diameter over the three measurement periods;
FGCV, variation in FG between the 3 measurement periods; FDCV, CV in FG between the3 measurement periods; AvFL, average fibre length; AvFLCV, average CV in fibre length over the3 measurement periods; �FL, change in fibre length growth between measurements; �FD, change
in fibre diameter between measurements; AvSL(bands), the average staple length growthbetween dyebands; CVSL(bands), CV in staple length growth between dyebands
Characteristics Max Mindiam AstCV Roc1 Roc2 AvSnipCV
AvL/D −0.61* −0.70* 0.14 −0.42* −0.08 0.12L/DCV 0.16 0.28 −0.36 −0.17 −0.19 0.46*FGCV −0.08 −0.20 0.32 0.09 0.04 −0.17FDCV −0.11 −0.09 0.11 0.42* −0.16 0.10AvFL −0.08 −0.25 0.52* −0.11 0.31 0.17AvFLCV 0.35 0.48* −0.27 −0.10 −0.37 −0.15�FL 0.05 0.10 0.46* 0.15 0.12 −0.12�FD 0.43* 0.32 0.65* 0.74* 0.44* −0.18�FL/�FD 0.00 −0.14 0.29 −0.04 −0.02 −0.31AvSL(bands) 0.28 0.06 0.63* 0.09 0.50* 0.23CVSL(bands) 0.18 0.03 0.18 −0.01 −0.13 0.33
*P < 0.05.
Table 2. Correlation coefficients for the relationships between the wool quality characteristics andthe fibre diameter profile characteristics
Max, maximum fibre diameter; Mindiam, minimum fibre diameter; AstCV, CV in fibre diameter alongthe fibre diameter profile; Roc1, first rate of fibre diameter change; Roc2, second rate of fibre diameter
change; AvSnipCV, average along the fibre diameter profile of the CV in fibre diameter within eachsnippet; IMFD, initial mean fibre diameter (at start of experiment); IMFDCV, CV in fibre diameter from
measurement of initial mean fibre diameter; Mid-side MFD, mean fibre diameter measurement frommid-side sample at the end of experiment; Mid-side MFDCV, CV in fibre diameter from measurement
of mid-side mean fibre diameter; SL, staple length
Characteristics Max Mindiam AstCV Roc1 Roc2 AvSnipCV
IMFD 0.86* 0.79* 0.61* 0.61* 0.59* 0.22IMFDCV 0.20 −0.06 0.30 0.01 0.21 0.53*Mid-side MFD 0.92* 0.88* 0.45* 0.51* 0.44* 0.42Mid-side MFDCV 0.54* 0.63* −0.09 0.03 −0.09 0.79*SL −0.05 −0.19 0.51* 0.01 0.50* −0.54*
*P < 0.05.
FDP and variation among fibres but negatively correlatedwith variation in fibre diameter along fibres and the rates offibre diameter change (Table 3). Seasonal variation in skinthickness and fat depth was generally positively correlatedwith all FDP characteristics.
Average fat depth was negatively correlated with all FDPcharacteristics except AvSnipCV, and seasonal variation infat depth was negatively correlated with variation in fibrediameter among fibres (r = −0.46).
Body weight was negatively correlated with skin thickness(r = −0.23) and positively correlated with fat depth
(r = 0.62). Seasonal variation in body weight was notsignificantly (P > 0.05) but positively correlated withboth seasonal variation in skin thickness and fat depth(r = 0.22 and 0.14) and seasonal variation in skin thicknesswas not correlated (r = 0.07) with seasonal variation insubcutaneous fat.
Multiple regression analysis indicated that seasonalvariation in skin thickness (21.9%) and average skinthickness (14.2%) were the only body traits that significantlyexplained the variation in along-staple fibre diameter(r2 = 0.36, P < 0.05).

678 Australian Journal of Agricultural Research D. J. Brown and B. J. Crook
Table 3. Correlation coefficients for the relationships between the body characteristics and the fibrediameter profile characteristics
Max, maximum fibre diameter; Mindiam, minimum fibre diameter; AstCV, CV in fibre diameter alongthe fibre diameter profile; Roc1, first rate of fibre diameter change; Roc2, second rate of fibre diameter
change; AvSnipCV, average along the fibre diameter profile of the CV in fibre diameter within eachsnippet; Bwt, average body weight; BwtCV, CV in body weight throughout experiment; Skin,
average skin thickness; SkinCV, CV in skin thickness throughout experiment; Fat, averagesubcutaneous fat depth; BwtCV, CV in subcutaneous fat depth throughout experiment
Characteristics Max Mindiam AstCV Roc1 Roc2 AvSnipCV
Bwt −0.11 −0.02 −0.02 −0.40 −0.24 0.11BwtCV 0.30 0.24 0.46* 0.36 0.37 −0.10Skin 0.35 0.48* −0.46* −0.10 −0.27 0.61*SkinCV 0.20 0.03 0.47* 0.56* 0.43* 0.31Fat −0.30 −0.14 −0.11 −0.45* −0.26 0.14FatCV 0.01 0.04 0.09 0.35 0.57* −0.46
*P < 0.05.
Relationships between the fibre-basedand mid-side measurements
Initial MFD was positively correlated with �FL, �FD,and �FL/�FD (r = 0.31, 0.63, and 0.17, respectively).Average L/D was positively correlated with �FL and theratio of �FL/�FD (r = 0.67 and 0.41 respectively) whilenegatively correlated with �FD (r = −0.12). �FL waspositively correlated with �FD (r = 0.35). Sheep that hadhigher average L/D also had less seasonal variation in L/D(r = −0.47), mid-side mean fibre diameter (r = −0.65) andmid-side fibre diameter variation (r = −0.61). Mid-side fibrediameter variation was also significantly positively correlated(r = 0.62) with variation in fibre length.
Relationships between the fibre-based measurementsand body traits
Body weight (r = 0.30 and 0.33) and fat depth (r = 0.50 and0.53) were both positively correlated with L/D and fibrelength growth, whereas average skin thickness was negativelycorrelated with L/D and fibre length growth (r = −0.75 and−0.71). Seasonal variation in body weight, fat depth, and skin
Table 4. Correlation coefficients for the relationships between the fibre diameter profile and mid-sidemeasurements and staple strength
Max, maximum fibre diameter; Mindiam, minimum fibre diameter; AstCV, CV in fibre diameter alongthe fibre diameter profile; Roc1, first rate of fibre diameter change; Roc2, second rate of fibre diameter
change; AvSnipCV, average along the fibre diameter profile of the CV in fibre diameter within eachsnippet; IMFD, initial mean fibre diameter (at start of experiment); IMFDCV, CV in fibre diameter from
measurement of initial mean fibre diameter; Mid-side MFD, mean fibre diameter measurement frommid-side sample at the end of experiment; Mid-side MFDCV, CV in fibre diameter from measurement
of mid-side mean fibre diameter; SL, staple length
Characteristics Max Mindiam AstCV Roc1 Roc2 AvSnipCV
Correlation −0.22 −0.06 −0.17 0.13 0.08 −0.71*
Characteristics IMFD IMFDCV Mid-side MFD Mid-side MFDCV SL
Correlation −0.16 −0.66* −0.24 −0.60* 0.14
*P < 0.05.
thickness was positively correlated with the absolute changesin fibre length and diameter among the measurementsof L/D.
Relationship between FDP and mid-side measurementswith staple strength
AvSnipCV, initial MFDCV, mid-side MFD, and mid-sideMFDCV were all significantly negatively correlated withstaple strength (Table 4). In a multiple regression of FDPcharacteristics with staple strength, AvSnipCV significantlyexplained 50.6% of the variation in staple strength(P < 0.05), whereas the remaining FDP characteristicsdid not significantly explain any additional variation instaple strength. Mid-side fibre diameter variation (MFDCV)was the only mid-side wool quality characteristic thatsignificantly explained any proportion (36%) of the variationof staple strength (P < 0.05). In the stepwise multipleregression with all FDP and mid-side wool qualitycharacteristics, AvSnipCV (50.6%) and staple length (8.4%)significantly explained 59% (P < 0.05) of the variation instaple strength.

Environmental responsiveness of fibre diameter Australian Journal of Agricultural Research 679
Relationship between the fibre-based measurementsand staple strength
All the characteristics except �FD and FDCV werenegatively correlated with staple strength (Table 5). AverageL/D was not significantly correlated with staple strength.Seasonal variation in fibre length growth was negativelycorrelated with staple strength, r = −0.23, −0.31, and −0.63for FGCV, �FL, and CVSLBands, respectively. The ratio of�FL to �FD and FLCV were also significantly negativelycorrelated with staple length (r = −0.51 and −0.47).
When combined in a stepwise multiple regression theonly characteristics from Table 5 that significantly explainedvariation in staple strength were CVSLBands (39.9%), L/DCV(10.9%), and �FL/�FD (16.9%), which in total explained67.7% (r2 = 0.68, P < 0.05) of the variation in staple strength.
Relationship between the body traits and staple strength
Of the body traits, FatCV was the only trait that wassignificantly related to staple strength (r = 0.45) and the onlybody trait in the multiple regression analysis that significantlyexplained a proportion (29%) of the variation in staplestrength (r2 = 0.29, P < 0.05).
Discussion
Mean fibre diameter influences seasonal variationin fibre diameter
Mean fibre diameter is related to the level of variation in fibrediameter along the FDP in grazing sheep. Sheep with highermean fibre diameter have greater absolute changes in fibrediameter throughout the year. Associated with this, sheepwith higher mean fibre diameter also had greater variationin fibre diameter along the staple, changes in fibre diameterthat occur over a shorter length of the staple, and greatervariation of fibre diameter among fibres. Previous authorshave observed that sheep with greater mean fibre diameterhave greater variation in fibre diameter throughout the woolgrowth period (Jackson and Downes 1979; Thompson 1993;
Table 5. Correlation coefficients for the relationships between the wool fibre characteristics andstaple strength
AvL/D, average ratio of fibre length to fibre diameter over the 3 measurement periods; L/DCV, CV inthe ratio of fibre length to fibre diameter over the 3 measurement periods; FGCV, variation in FG
between the 3 measurement periods; FDCV, CV in FG between the 3 measurement periods; AvFL,average fibre length; AvFLCV, average CV in fibre length over the 3 measurement periods; �FL,
change in fibre length growth between measurements; �FD, change in fibre diameter betweenmeasurements; AvSL(bands), the average staple length growth between dyebands; CVSL(bands),
CV in staple length growth between dyebands
Characteristics AvL/D L/DCV FGCV FDCV AvFL AvFLCV
Correlation −0.02 −0.20 −0.23 0.31 −0.17 −0.51*
Characteristics �FL �FD �FL/�FD AvSL(bands) CVSL(bands)
Correlation −0.31 0.18 −0.47* −0.10 −0.63*
*P < 0.05.
Bow and Hansford 1994; Earl et al. 1994). Furthermore,Hynd (1992) also observed that initial fibre diameter waspositively correlated with absolute change in fibre diameter.In contrast, Adams and Briegel (1998) did not find anyevidence to suggest that variation in diameter, measured byvariance along fibres, might be correlated with mid-side meanfibre diameter.
The biological causes for these relationships have not beenestablished. As sheep with greater fibre diameter have largerfollicles and bulbs (Schinckel 1961; Hynd 1995; Hill et al.1997) they may therefore have a greater capacity to obtain ahigher fibre diameter. Alternatively, sheep with follicles thatproduce finer fibres do not have the physical ability to producelarge fibres and as a result do not change fibre diameters asmuch relative to the broader fibres. Furthermore, mean fibrediameter is negatively correlated with the ratio of secondaryto primary follicles (Skerritt et al. 1997). Therefore, sheepwith higher mean fibre diameter should have a greaterproportion of fibres from primary follicles, which have beensuggested to be more sensitive in terms of fibre diameterresponses to changes in wool growth (Lockart 1956; Onions1962; Quinnell et al. 1973). Furthermore, secondary folliclesare more affected by changes in nutrition than primaryfollicles (Lyne 1964; Ryder and Stephenson 1968) and aretherefore more susceptible to follicle shutdown. These resultssuggest that sheep differing in their ratio of secondary toprimary follicles, and therefore fibre diameter, may responddifferently to changes in their environment.
Neither average fibre length nor change in fibrelength growth throughout the experiment was significantlycorrelated with mean fibre diameter measurements. Hynd(1992) also found that initial fibre diameter was notsignificantly correlated with change in fibre length.
The overall effect of increasing initial and mid-sidemean fibre diameter on staple strength was not large,with initial mean fibre diameter and mid-side mean fibrediameter being negatively, but not significantly, correlatedwith staple strength. These results are in contrast to the

680 Australian Journal of Agricultural Research D. J. Brown and B. J. Crook
majority of correlations reported (Hansford and Kennedy1990; Lewer and Ritchie 1992; Lewer and Li 1994; Greeffet al. 1995; Brown et al. 1999; Yamin et al. 1999), which aregenerally positive.
L/D Ratio
Differences among grazing sheep in L/D are associatedwith differences in their responsiveness of fibre diameterthroughout the year and therefore FDP characteristics. Theinfluence of L/D on the FDP characteristics is a combinationof the influence of fibre length growth and mean fibrediameter. Examining these individually first, sheep withhigher average fibre length growth had greater variationin fibre diameter along and among fibres. As detailedabove, average fibre diameter was positively associated withvariation in fibre diameter along the staple. There was nosignificant relationship between average fibre length growthand average fibre diameter.
L/D was significantly and negatively correlated with thefirst rate of fibre diameter change within the FDP. Thesheep with higher L/D may alter fibre length preferentiallyto diameter, resulting in the changes in fibre diameterthroughout the year being over longer length of fibregrowth and hence lower rates of fibre diameter change.However, L/D was not significantly associated with theoverall level of along-staple and between-fibre variation infibre diameter.
The lack of relationship between L/D and along-staplevariation in fibre diameter can be explained by examininghow L/D is related to fibre length growth and averagefibre diameter. Sheep with higher L/Ds, although havingsignificantly greater fibre length growth rates also hadsignificantly lower average fibre diameters. As fibre lengthgrowth and average fibre diameter were both positivelyassociated with along-staple variation in fibre diameter, theincreased fibre length growth rate and reduced mean fibrediameter resulting from higher L/Ds appear to counteracteach other and result in no significant relationship betweenL/D and along-staple variation in fibre diameter. Thissuggests that the relationship between L/D and FDPcharacteristics is due to both length and fibre diameter, ratherthan fibre diameter or fibre length alone. When animals wereexamined within micron group, which removed the influenceof mean fibre diameter, L/D was strongly and positivelycorrelated with along-staple variation in fibre diameter.
The relationships between fibre diameter and lengthmay be better described by using independent regressionequations for each animal (Scobie and Saville 2000). Thiswould also allow for curvilinear relationships within eachanimal, i.e. where L/D is not constant across all fibrediameters within an animal. This analysis may help tountangle relationships observed in this study.
The negative relationships between L/D and meanfibre diameter are consistent with the negative correlation
observed by Hynd (1992) between initial fibre diameter andL/D. These results confirm that sheep with higher averagefibre diameter have lower fibre length growth relative toaverage fibre diameter.
Sheep with greater L/Ds had slightly smaller changes infibre diameter among measurements of L/D, greater changesin fibre length among L/D measurements, and a greater ratioof change in fibre length to that of change in fibre diameter.These relationships observed in grazing fine wool Merinowethers strongly agree with those of Hynd (1992) usinghoused and pen-fed South Australian strong wool Merinosheep. Hynd (1992) also observed that sheep with higherL/Ds had lower increases in fibre diameter, slightly smallerchanges in fibre length, and a greater ratio of change infibre length to that of change in fibre diameter. This authorconcluded that direct or indirect selection for sheep withhigh L/D would have the 2 desirable outcomes of greaterfibre length and reduced fibre diameter variability. In thisexperiment, L/D was positively correlated with average fibrelength growth and staple length but negatively correlatedwith most characteristics that describe fibre diametervariation along the staple and among fibres. These resultssupport these previous conclusions, although at a phenotypiclevel only.
Seasonal variation in fibre diameter and length is relatedto staple strength
Seasonal variation in fibre length growth, fibre diameter,and the ratio of length to diameter throughout the year isassociated with increased variation in fibre diameter alongthe FDP and reduced staple strength in grazing sheep.All the measures of changes in fibre length growth andfibre diameter throughout the experiment measured at theindividual fibre, FDP, and mid-side levels were negativelycorrelated with staple strength to varying degrees. All theseresults have illustrated that increasing variation in fibrelength growth and diameter throughout the year increasesthe variation of fibre diameter along the FDP and reducesstaple strength.
Variation in fibre diameter and variation in fibre lengthamong fibres were of approximately equal importance inexplaining variation in staple strength. Fibre diameter andlength tend to change together in response to changesin nutritional conditions (Hynd 1994). Therefore, it isanticipated that sheep with lower variation in fibre diameteramong fibres would have lower variation in fibre length. Thesignificant positive correlations observed between mid-sidefibre diameter variation and variation in fibre diameteramong fibres within snippets with fibre length variationsupport these theories. Peterson et al. (1998) also observeda weak positive relationship among fibre diameter variationbetween fibres and variation in fibre length. Contrary tothese results, Schlink et al. (1998) found no significantrelationship between variation in fibre diameter and variation

Environmental responsiveness of fibre diameter Australian Journal of Agricultural Research 681
in fibre length within a staple. Lower variation in fibre lengthcan result in greater staple strength (de Jong et al. 1985;Thompson 1993; Swan 1994; Bray et al. 1995; Peterson1997; Peterson et al. 1998). This again was supported in thisstudy, with a significant negative correlation between fibrelength variation and staple strength.
This experiment demonstrated that the FDP characteristicsare correlated with staple strength and explain additionalvariation in staple strength above that which could beexplained by the measurements of mid-side mean fibrediameter, mid-side fibre diameter variation and staple length.These results agree with those of Brown et al. (1999, 2002)and Brown (2000) by illustrating a distinct benefit, in terms ofexplaining staple strength, of using both mid-side and FDPmeasurements. The FDP characteristics used alone and incombination with the mid-side measurements explained agreater proportion of the variation among animals in staplestrength compared with the mid-side measurements usedalone. This confirms the benefits that can be gained bymeasuring FDPs.
Seasonal variation in body weight and composition
Seasonal variation in body weight, fat depth, and skinthickness is related to variation in fibre diameter along theFDP in grazing sheep. Seasonal variation in body weight,fat depth, and skin thickness was positively correlatedwith the overall fibre diameter of the FDP, variation infibre diameter along the FDP, and rates of fibre diameterchange throughout the FDP. Variation in skin thickness wasthe body measurement that was most related to variationin fibre diameter along the FDP. Sheep that had greaterseasonal variation in body weight and condition may havealtered feed intake and/or metabolism throughout the year,which resulted in increased variation in the availability ofnutrients to the wool follicle. As fibre diameter and lengthgrowth rates depend heavily on the quantity and qualityof nutrients available to the follicle, the increased variationin skin thickness throughout the year may have resulted ingreater variations in follicle nutrition and therefore woolgrowth throughout the experiment. This supports the theoriesthat skin thickness is related to the level of overall sheepnutrition and follicle nutrition (Hutchinson 1957; Lyne 1964;Williams and Thornberry 1992; Williams and Morley 1994;Schlink et al. 1996b). Although these body characteristicswere correlated with variation in fibre diameter along thestaple, they explained less overall variation in the FDPcharacteristics than the fibre-based measurements.
Despite the positive association between seasonalvariation in body weight and condition and fibre diametervariation along the staple, sheep that showed greater variationin body weight and fat depth throughout the experiment alsotended to have stronger wool. In contrast, sheep that showedgreater variation in skin thickness tended to have reducedstaple strength. The positive association between seasonal
variation of body weight and fat depth and staple strengthmay indicate that some animals partition more nutrientstowards the skin and therefore wool growth when nutrientsbecome limiting rather than maintaining body weight andfat depth. However, these relationships were not a result ofreductions in variation in fibre diameter along the staple butrather reductions in the variation in fibre diameter and lengthamong fibres. Seasonal variation in body weight and fat depthwas negatively associated with variation in fibre diameterand length among fibres, whereas seasonal variation in skinthickness was positively associated with variation in fibrediameter and length among fibres. These results indicatethat the reduced variation in skin thickness throughout theyear may have resulted in less variation in nutrient supply tothe follicle and therefore reduced variation in fibre diameterand length among fibres, which was both significantly andnegatively correlated with staple strength.
Seasonal variation in body weight was not significantlycorrelated with either variation in fat depth or variation inskin thickness. Williams and Thornberry (1992) also foundthat skin thickness was not significantly related to eitherliveweight or body condition score. Seasonal variation infat depth and skin thickness was also not related. Theserelationships further indicate that body weight, fat depth, andskin thickness follow different seasonal patterns throughoutthe year.
Furthermore, sheep with thicker skins have less variationin fibre diameter along the FDP but greater fibre diameter,fibre length growth, and variation in fibre diameter and fibrelength among fibres. The greater skin thickness may indicatethat the follicles of the sheep with greater skin thicknesshave improved nutrition to express a higher wool growthand therefore fibre diameter and length variation amongfibres. The thicker skins may also provide a buffer of nutrientreserves for when nutrients become limiting and hence lessvariation in fibre diameter along fibres.
Despite finding significant differences in the level ofvariation in wool growth and fibre diameter patternsthroughout year, Adams and Briegel (1998) found nosignificant differences among 3 strains of grazing Merinowethers in the pattern of liveweight change throughout theyear. Furthermore, there were no significant relationshipsbetween wool growth rate and either loss of lean or loss of fat.There have been no other published studies of the relationshipbetween seasonal variation in body weight and condition andFDP characteristics. Adams and Briegel (1998) also rejectedthe hypothesis that the large sheep could buffer wool growththroughout the year by mobilising body reserves. The fact thatin the present study average body weight and fat depth werenon-significantly correlated with the level of fibre diametervariation along the FDP supports these previous findings.However, mean skin thickness and seasonal patterns of bodyweight, fat depth, and skin thickness were related to bothvariation in fibre diameter and length growth among fibres.

682 Australian Journal of Agricultural Research D. J. Brown and B. J. Crook
Seasonal variation in L/D
The three L/D measurements during this experiment wereall highly correlated. The second L/D measurement was alsosignificantly higher than the first L/D measurement. Theseresults indicate that although there is seasonal variation inL/D measurements, the animals maintain their rankings onL/D. These results agree with those of Hynd (1992) whofound that L/D was highly repeatable with nutritional change(r = 0.95). Schlink et al. (1996a) and Woods and Orwin(1988) observed significant seasonal variation in L/D ingrazing sheep throughout the year, and also noted that despitethe seasonal variations in L, D, and L/D the ranking of theanimals for these characteristics remained similar throughoutthe experiment.
Conclusions
Differences among sheep in fibre length, diameter, and L/Dare associated with differences in FDP characteristics. Meanfibre diameter of the sheep has a strong influence on the levelsof variation along and among fibres; however, sheep can beidentified that have similar levels of mean fibre diameter butmarkedly different levels of variation of fibre diameter alongthe staple. Within sheep of similar fibre diameter there wasa strong positive relationship between fibre length growthrate and L/D with along-staple variation in fibre diameter.Seasonal variation in fibre length and diameter growthincreased the variation in fibre diameter along the FDP andreduced staple strength. Seasonal changes in body weight,body condition, and skin thickness can be related to changesin fibre diameter and length among fibres, fibre diameteralong the FDP, and staple strength. The influence of bodyweight and fat depth on wool growth was different to that ofskin thickness.
As this study only involved 16 sheep, a larger studyis required using more sheep of different genotypes overa number of environments to confirm these relationships.However, the technique required to calculate L/D is very timeconsuming and expensive. Therefore, it would be beneficialif the technique could be modified to make estimation of fibrelength more practical.
These relationships are complex and much research isrequired to fully examine how these characteristics combineto influence variation in fibre diameter throughout the yearand staple strength. With further research, variation in fibrediameter, length, and L/D might be able to be used incombination with FDPs, wool quality characteristics, andbody traits to reduce seasonal environmental responsivenessof fibre diameter.
Acknowledgments
The authors thank the staff in the Division of AnimalScience at UNE for their assistance throughout theexperiment. While conducting this project, D. B. received
an Australian government scholarship and also partlyfunded by the Cooperative Research Centre for PremiumQuality Wool.
References
Adams NR, Briegel JR (1998) Liveweight and wool growth responsesto a Mediterranean environment in three strains of merino sheep.Australian Journal of Agricultural Research 49, 1187–1193.doi: 10.1071/A98053
Adams NR, Briegel JR, Ritchie JM (1997) Wool and liveweightresponses to nutrition by Merino sheep genetically selected for highor low staple strength. Australian Journal of Agricultural Research48, 1129–1137. doi: 10.1071/A97025
Adams NR, Briegel JR, Ritchie AJM (1998) Relationship of staplestrength to variation in fibre diameter in sheep selected for or againststaple strength. Proceedings of the Australian Society of AnimalProduction 22, 423.
Adams NR, Greeff JC, Kelly RW, Peter DW (1996) Repeatability of therate of wool growth across seasons in a Mediterranean environment.Proceedings of the Australian Society of Animal Production 21,127–130.
Adams NR, Sanders MR, Briegel JR (1994) Wool growth and liveweightgain during spring in a seasonal environment. Proceedings of theAustralian Society of Animal Production 20, 305–308.
Allden WG (1979) Feed intake, diet composition and wool growth,In ‘Physiological and environmental limitations to growth’.(Eds JL Black, PJ Reis) p. 61. (University of New EnglandPublishing Unit: Armidale, NSW)
Ball AJ, Thompson JM, Hinch GN (1996) Seasonal oscillations inthe mass of body components of mature ewes fed at a constantintake. Proceedings of the Australian Society of Animal Production21, 479.
Baxter P (1996) Description and performance of the Agritest staplebreaker Model 2. Wool Technology and Sheep Breeding 44,119–137.
Bow MR, Hansford KA (1994) Fibre diameter variability, In ‘Woolspec94, Proceedings of a seminar on Specification of Australian Wool andits Implications for Marketing and Processing’. (Eds RA Rottenbury,A Hansford, JP Scanlan) (CSIRO Division of Wool Technology:Sydney)
Bray AR, Scobie DR, Woods JL (1995) Genetic improvement inthe wool strength of Romney sheep. In ‘Proceedings of the9th International Wool Textile Research Conference’. Biella.pp. 173–181. (International Wool Secretariat: Biella, Italy)
Brown DJ (2000) The estimation and utilisation of variation infibre diameter profile characteristics between sheep. PhD thesis,University of New England, Armidale, Australia.
Brown DJ, Crook BJ, Purvis IW (1999) Genotype and environmentaldifferences in fibre diameter profile characteristics and theirrelationship with staple strength in Merino sheep. Proceedings of theAssociation for the Advancement of Animal Breeding and Genetics13, 274–277.
Brown DJ, Crook BJ, Purvis IW (2000) The estimation of fibre diameterprofile characteristics using reduced profiling techniques. WoolTechnology and Sheep Breeding 48, 1–14.
Brown DJ, Crook BJ, Purvis IW (2002) Differences in fibre diameterprofile characteristics in wool staples from Merino sheep andtheir relationship with staple strength between years, environmentsand bloodlines. Australian Journal of Agricultural Research 53,481–491. doi: 10.1071/AR00129
Charlton D (1995) Sirolan-Laserscan – A review of its development,performance and application Wool Technology and Sheep Breeding43, 212–228.

Environmental responsiveness of fibre diameter Australian Journal of Agricultural Research 683
Cottle DJ (1987) Fleece weight: Fibre diameter ratios andsheep selection. Wool Technology Sheep Breeding 35,186–189.
Denney GD (1990) Phenotypic variance of fibre diameter along woolstaples and its relationship with other raw wool characters. AustralianJournal of Agricultural Research 30, 463–467.
Downes AM (1971) Variation in wool length and diameter with sheepnutrition. Applied Polymer Symposia 18, 895–904.
Earl CR, Stafford JE, Rowe JP, Ross RA (1994) The effect of stockingrate on fibre diameter, staple strength and wool weight in highand low fibre diameter wool sheep on clover based pastures.Proceedings of the Australian Society of Animal Production 20,309–312.
Greeff JC, Lewer RP, Ponzoni RW, Purvis I (1995) Staple strength:Progress towards elucidating its place in Merino breeding.Proceedings of the Australian Association of Animal Breeding andGenetics 11, 595–601.
Gregory IP (1982) Genetic studies of South Australian Merino sheep. 4.Genetic, phenotypic and environmental correlations between variouswool and body traits. Australian Journal of Agricultural Research33, 363–373. doi: 10.1071/AR9820363
Hansford KA (1994) Fleece specifications and processing prediction,In ‘Woolspec 94, Proceedings of a seminar on Specification ofAustralian Wool and its Implications for Marketing and Processing’.(Eds RA Rottenbury, A Hansford, JP Scanlan) (CSIRO Division ofWool Technology: Sydney)
Hansford KA, Kennedy JP (1990) The relationship between variationin fibre diameter along staples and staple strength, In ‘Proceedingsof the 8th International Wool Textile Research Conference’.Christchurch, New Zealand, Vol. 1. p. 590. (International WoolSecretariat: Christchurch, New Zealand)
Hill JA, Hynd PI, Ponzoni RW, Grimson RJ, Jaensch KS, Kenyon RV,Penno NM (1997) Skin and follicle characters II. Correlations withobjectively measured and subjectively assessed wool characters.Proceedings of the Association for the Advancement of AnimalBreeding and Genetics 12, 524–528.
Hutchinson KJ (1957) Changes in the thickness, weight andprotein content of the skin of two adult Merino ewes.Journal of the Australian Institute of Agricultural Science 23,238–241.
Hynd PI (1992) Responses of sheep differing in fibre length to diameterratio to nutritional change. Proceedings of the Australian Associationof Animal Production 19, 152.
Hynd PI (1994) Follicular determinants of the length and diameter ofwool fibres. I. Comparison of sheep differing in fibre length/diameterratio at two levels of nutrition. Australian Journal of AgriculturalResearch 45, 1137–1147. doi: 10.1071/AR9941137
Hynd PI (1995) Skin and follicle-based selection for woolproduction and quality. Wool Technology and Sheep Breeding 43,15–23.
Jackson N, Downes AM (1979) The fibre diameter profile of wool staplesfrom individual sheep. Australian Journal of Agricultural Research30, 163–171. doi: 10.1071/AR9790163
de Jong S, Kavanagh WJ, Andrews MW (1985) Factors contributingto the strength of wool. In ‘Proceedings of the 7th InternationalWool and Textile Research Conference’. Tokyo. Vol. 2,pp. 147–156. (International Wool Secretariat: Tokyo)
Kopke E, Hocking Edwards JE (1998) Do sheep with soft rollingskins produce wool more efficiently than sheep with other skintypes. Proceedings of the Australian Society of Animal Production22, 397.
Lewer R, Li Y (1994) Some aspects of selection for staplestrength. Wool Technology and Sheep Breeding 42,103–111.
Lewer RP, Ritchie AJM (1992) Genetics for staple strength. In‘Management for wool quality in Mediterranean environments’.(Eds PT Doyle, JA Fortune, NR Adams) (Western AustralianDepartment of Agriculture: Perth, W. Aust.)
Lockart LW (1956) The reaction of primary and secondary wool fibresto changes in nutrition. Australian Journal of Agricultural Research7, 147–151. doi: 10.1071/AR9560147
Lyne AG (1964) Effect of adverse nutrition on the skin and wool folliclesin Merino sheep. Australian Journal of Agricultural Research 15,788–801. doi: 10.1071/AR9640788
Murray PJ (1996) The effect of nutrition on wool growth, fibre andskin characteristics and liveweight gain of broad and fine woolsheep within two Merino strains. PhD thesis, University of WesternAustralia, Perth.
Onions WJ (1962) ‘Wool, An introduction to its properties, varieties,uses and production.’ (Ernest Benn Limited: London)
Peterson AD (1997) The components of staple strength. Masters thesis,The University of Western Australia, Perth.
Peterson AD, Gherardi SG, Doyle PT (1998) Componentsof staple strength in fine and broad wool Merinohoggets run together in a Mediterranean environment.Australian Journal of Agricultural Research 49, 1181–1186.doi: 10.1071/A98039
Quinnell B, Whiteley KJ, Roberts EM (1973) Variations in fibrediameter of wool fibres: A review. In ‘AWC Technical Report,Objective Measurement of Wool in Australia’. pp. 4.1–4.20.(Eds MW Andrews, JG Downes) (Australian Wool Corporation:Melbourne, Vic.)
Reis PJ (1979) Effects of amino acids on the growth and properties ofwool, In ‘Physiological and environmental limitations to growth’.(Eds JL Black, PJ Reis, NR Adams) p. 223. (University of NewEngland Publishing Unit: Armidale, NSW)
Reis PJ (1991) Nutritional regulation of wool growth in Merino sheep.In ‘Wool biology’. (Ed. PI Hynd) (AWC)
Reis PJ (1992) Length growth and diameter relationships ofMerino wool fibres. Wool Technology and Sheep Breeding 40,52–55.
Ryder ML, Stephenson SK (1968) ‘Wool growth.’ (Academic Press:London)
SAS (1990) ‘SAS/STAT User’s Guide. Version 6.’ 4th edn (SASInstitute: Cary, NC)
Schinckel PG (1961) Mitotic activity in wool follicle bulbs. AustralianJournal of Biological Sciences 14, 659–676.
Schlink AC, Lea J, Ritchie AJM, Saunders M (1996a) Impact of aMediterranean environment on wool follicles and fibre growth inhigh and low staple strength Merino wethers. Wool Technology andSheep Breeding 44, 81–82.
Schlink AC, Mata G, Lewis RM (1998) Consequences of differingwool growth rates on staple strength of Merino wethers withdivergent staple strength. Wool Technology and Sheep Breeding 46,271–285.
Schlink T, Adams N, Peterson A (1996b) Components of staple strength.In ‘Proceedings of the Cooperative Research Centre Roadshow’.p. 29. (CRC for Premium Quality Wool)
Scobie DR, Saville DJ (2000) The misuse of ratios and percentagesin wool research. Asian-Australian Journal of Animal Sciences 13,461–464.
Skerritt JW, Reverter A, Kaiser CJ, Tier B (1997) Genetic parametersestimates for wool follicle traits are similar in selected and randombred populations. Proceedings of the Australian Association ofAnimal Breeding and Genetics 12, 163–166.
Statistical Sciences (1995) ‘S-PLUS Reference Manual, Version3.3 for Windows.’ (StatSci, A Division of MathSoft Inc.:Seattle, WA)

684 Australian Journal of Agricultural Research D. J. Brown and B. J. Crook
Swan PG (1994) Staple structure and fibre specification. In ‘Woolspec94, Proceedings of a seminar on Specification of Australian Wool andits Implications for Marketing and Processing’. (Eds RA Rottenbury,A Hansford, JP Scanlan) (CSIRO Division of Wool Technology:Sydney)
Thompson A (1993) Is genetically fine wool also tender? In ‘Merinosheep breeding — some directions for the future’. (Ed. DR Gifford)(SAR&DI, Turretfield Research Centre: Rosdale, S. Aust.)
Vizard AL, Scrivener CJ, Anderson GA (1994) The agreement andrepeatability of ATLAS and StapleBreaker for estimating the staplestrength of mid side wool samples taken from Merino sheep. WoolTechnology and Sheep Breeding 42, 112–119.
Williams AJ, Morley FC (1994) Influence of dietary intake and geneticcapacity for wool growth on the composition of mid-trunk skinof Merino sheep. Australian Journal of Agricultural Research 45,1715–1729.
Williams AJ, Thornberry KJ (1992) The skin thickness of mediumwool Merino sheep and its relationship to wool production.Proceedings of the Australian Society of Animal Production 19,138–141.
Woods JL, Orwin DFG (1988) Seasonal variations in the dimensionsof individual Romney wool fibres determined by a rapidautoradiographic technique. New Zealand Journal of AgricultureResearch 31, 311–323.
Yamin M, Hynd PI, Ponzoni RW, Hill JA, Pitchford WS, Hansford KA(1999) Is fibre diameter variation along the staple a good indirectselection criterion for staple strength? Wool Technology and SheepBreeding 47, 151–158.
Manuscript received 11 August 2004, accepted 12 May 2005
http://www.publish.csiro.au/journals/ajar