15.2 MM (0.6 IN.) DIAMETER PRESTRESSING - CiteSeerX
107
RESEARCH REPORT 580-2 T RANSFER AND D EVELOPMENT L ENGTH OF 15.2 MM (0.6 IN .) D IAMETER P RESTRESSING S TRAND IN H IGH P ERFORMANCE C ONCRETE : R ESULTS OF THE H OBLITZELL -B UCKNER B EAM T ESTS Shawn P. Gross and Ned H. Burns C ENTER FOR T RANSPORTATION R ESEARCH BUREAU OF ENGINEERING RESEARCH THE UNIVERSITY OF TEXAS AT AUSTIN JUNE 1995
-
Upload
khangminh22 -
Category
Documents
-
view
0 -
download
0
Transcript of 15.2 MM (0.6 IN.) DIAMETER PRESTRESSING - CiteSeerX
RESEARCH REPORT 580-2
TRANSFER AND DEVELOPMENT LENGTH OF15.2 MM (0.6 IN.) DIAMETER PRESTRESSINGSTRAND IN HIGH PERFORMANCE CONCRETE:RESULTS OF THE HOBLITZELL -BUCKNERBEAM TESTS
Shawn P. Gross and Ned H. Burns
CENTER FOR TRANSPORTATION RESEARCHBUREAU OF ENGINEERING RESEARCH
THE UNIVERSITY OF TEXAS AT AUSTIN
JUNE 1995
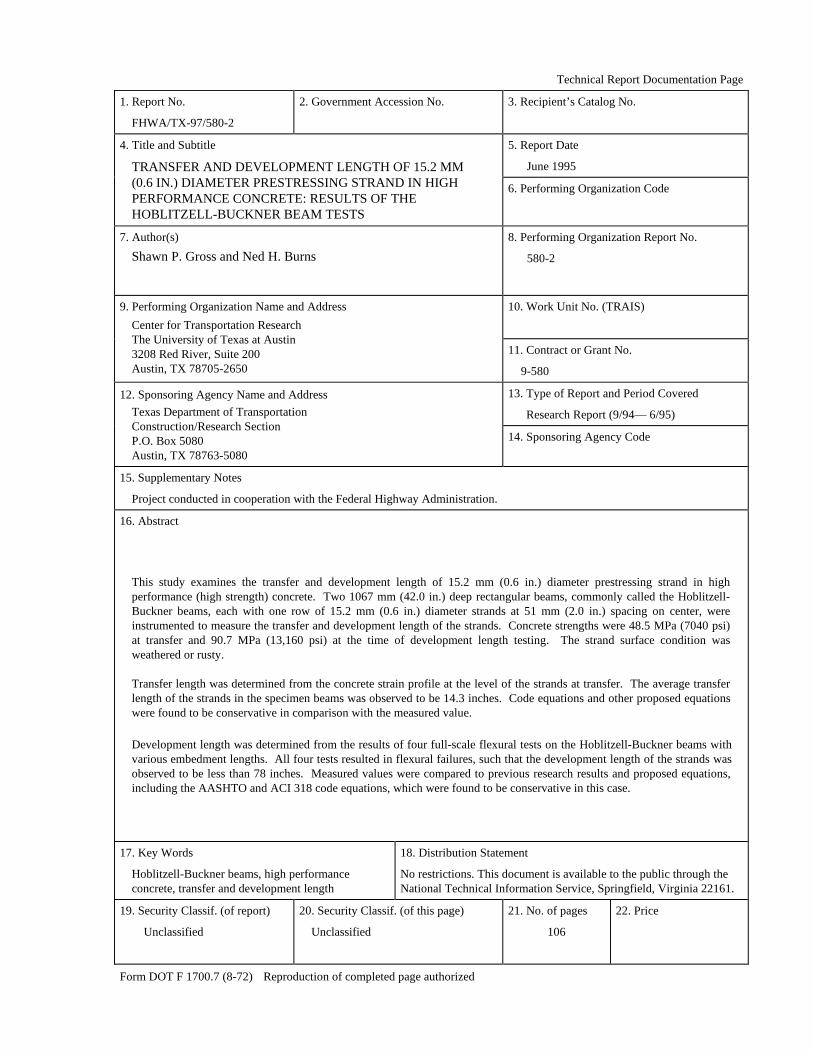
Technical Report Documentation Page
1. Report No.
FHWA/TX-97/580-2
2. Government Accession No. 3. Recipient’s Catalog No.
5. Report Date
June 1995
4. Title and Subtitle
TRANSFER AND DEVELOPMENT LENGTH OF 15.2 MM (0.6 IN.) DIAMETER PRESTRESSING STRAND IN HIGHPERFORMANCE CONCRETE: RESULTS OF THEHOBLITZELL-BUCKNER BEAM TESTS
6. Performing Organization Code
7. Author(s)
Shawn P. Gross and Ned H. Burns
8. Performing Organization Report No.
580-2
10. Work Unit No. (TRAIS)9. Performing Organization Name and Address
Center for Transportation ResearchThe University of Texas at Austin3208 Red River, Suite 200Austin, TX 78705-2650
11. Contract or Grant No.
9-580
13. Type of Report and Period Covered
Research Report (9/94— 6/95)
12. Sponsoring Agency Name and Address
Texas Department of TransportationConstruction/Research SectionP.O. Box 5080Austin, TX 78763-5080
14. Sponsoring Agency Code
15. Supplementary Notes
Project conducted in cooperation with the Federal Highway Administration.
16. Abstract
This study examines the transfer and development length of 15.2 mm (0.6 in.) diameter prestressing strand in highperformance (high strength) concrete. Two 1067 mm (42.0 in.) deep rectangular beams, commonly called the Hoblitzell-Buckner beams, each with one row of 15.2 mm (0.6 in.) diameter strands at 51 mm (2.0 in.) spacing on center, wereinstrumented to measure the transfer and development length of the strands. Concrete strengths were 48.5 MPa (7040 psi)at transfer and 90.7 MPa (13,160 psi) at the time of development length testing. The strand surface condition wasweathered or rusty.
Transfer length was determined from the concrete strain profile at the level of the strands at transfer. The average transferlength of the strands in the specimen beams was observed to be 14.3 inches. Code equations and other proposed equationswere found to be conservative in comparison with the measured value.
Development length was determined from the results of four full-scale flexural tests on the Hoblitzell-Buckner beams withvarious embedment lengths. All four tests resulted in flexural failures, such that the development length of the strands wasobserved to be less than 78 inches. Measured values were compared to previous research results and proposed equations,including the AASHTO and ACI 318 code equations, which were found to be conservative in this case.
17. Key Words
Hoblitzell-Buckner beams, high performanceconcrete, transfer and development length
18. Distribution Statement
No restrictions. This document is available to the public through theNational Technical Information Service, Springfield, Virginia 22161.
19. Security Classif. (of report)
Unclassified
20. Security Classif. (of this page)
Unclassified
21. No. of pages
106
22. Price
Form DOT F 1700.7 (8-72) Reproduction of completed page authorized

TRANSFER AND DEVELOPMENT LENGTH OF 15.2 MM (0.6 IN.) DIAMETER
PRESTRESSING STRAND IN HIGH PERFORMANCE CONCRETE: RESULTS
OF THE HOBLITZELL-BUCKNER BEAM TESTS
by
Shawn P. Gross
and
Ned H. Burns
Research Report 580-2
Research Project 9-580Design and Construction of Extra-High Strength Concrete Bridges
Conducted for the
TEXAS DEPARTMENT OF TRANSPORTATION
in cooperation with the
U.S. DEPARTMENT OF TRANSPORTATIONFEDERAL HIGHWAY ADMINISTRATION
by the
CENTER FOR TRANSPORTATION RESEARCHBureau of Engineering Research
THE UNIVERSITY OF TEXAS AT AUSTIN
June 1995

ii

iii
DISCLAIMERS
The contents of this report reflect the views of the authors, who are responsible forthe facts and the accuracy of the data presented herein. The contents do not necessarilyreflect the official views or policies of the Federal Highway Administration (FHWA) or theTexas Department of Transportation (TxDOT). This report does not constitute a standard,specification, or regulation.
There was no invention or discovery conceived or first actually reduced to practicein the course of or under this contract, including any art, method, process, machine,manufacture, design or composition of matter, or any new and useful improvement thereof,or any variety of plan, which is or may be patentable under the patent laws of the UnitedStates of America or any foreign country.
NOT INTENDED FOR CONSTRUCTION, BIDDING, OR PERMIT PURPOSES
Ned H. Burns, P.E. (Texas No. 20801)Research Supervisor
IMPLEMENTATION
On October 26, 1988, the FHWA issued a memorandum that disallowed the use of15.2 mm (0.6 in.) diameter strands in pretensioned applications, increased minimum strandspacing requirements, and increased the required development length for fully bondedstrands to 1.6 times the AASHTO AND ACI 318 code requirements. The results of thisresearch show that the transfer and development of 15.2 mm (0.6 in.) diameter strand inhigh performance (high strength) concrete is clearly adequate.
The results of this study, along with the results from other recent and ongoingstudies around the country, show that the use of 15.2 mm (0.6 in.) diameter strand alongwith high performance concrete should be allowed in pretensioned applications.Furthermore, the current code provisions are shown to be quite conservative with respect tohigh concrete strengths, demonstrating the need to include concrete strength as a parameterin prediction equations for transfer and development length.
ACKNOWLEDGMENTS
The authors acknowledge the support of the TxDOT project director, Ms. Mary LouRalls (DES). Also appreciated is the support provided by the other members of the TxDOTProject Monitoring Committee, which included A. Cohen (DES), W. R. Cox (CMD), D.Harley (FHWA), G. D. Lankes (MAT), L. Lawrence (MAT), J. J. Panak (Retired), D. VanLanduyt (DES), J. P. Vogel (HOU), L. M. Wolf (DES), and T. M. Yarbrough (CSTR).
Research performed in cooperation with the Texas Department of Transportation and theU.S. Department of Transportation, Federal Highway Administration.

iv

v
TABLE OF CONTENTS
CHAPTER 1. INTRODUCTION ...................................................................................... 11.1 Background and Problem Definition.................................................................... 11.2 Objective of the Research Program...................................................................... 11.3 Objective of this Study......................................................................................... 21.4 High Performance Concrete versus High Strength Concrete............................... 21.5 Organization of Presentation................................................................................ 3
CHAPTER 2. LITERATURE REVIEW............................................................................ 52.1 Introduction .......................................................................................................... 52.2 Nature of Bond Stresses ....................................................................................... 52.3 Definitions............................................................................................................ 82.4 Effect of Variables ............................................................................................... 92.5 Previous Research .............................................................................................. 112.6 Equations for Transfer and Development Length .............................................. 14
CHAPTER 3. TEST PROGRAM .................................................................................... 173.1 Introduction and Scope of Tests......................................................................... 173.2 Specimen Design and Designation..................................................................... 173.3 Material Properties ............................................................................................. 203.4 Specimen Fabrication......................................................................................... 223.5 Instrumentation for Transfer Length Measurements.......................................... 263.6 Development Length Test Setup........................................................................ 273.7 Instrumentation for Development Length Tests................................................. 303.8 Development Length Test Procedure................................................................. 34
CHAPTER 4. TEST RESULTS....................................................................................... 374.1 Introduction ........................................................................................................ 374.2 Transfer Length Measurements.......................................................................... 374.3 Development Length Test Results ..................................................................... 42
CHAPTER 5. DISCUSSION OF TEST RESULTS ........................................................ 555.1 Introduction ........................................................................................................ 555.2 Transfer Length Measurements.......................................................................... 555.3 Development Length Tests................................................................................. 595.4 Effect of Variables ............................................................................................. 63
CHAPTER 6. SUMMARY AND CONCLUSIONS ....................................................... 656.1 Summary ............................................................................................................ 656.2 Conclusions........................................................................................................ 65
REFERENCES.................................................................................................................. 67
vi
APPENDIX A—CONTRACTOR DRAWINGS FOR HOBLITZELL-BUCKNER BEAMS.......................................................................................... 71
APPENDIX B—MATERIAL PROPERTY PLOTS ........................................................ 75APPENDIX C—DEVELOPMENT LENGTH TEST SETUPS ....................................... 81APPENDIX D—MOMENT-CURVATURE SECTION ANALYSIS ............................. 87APPENDIX E—NOTATION ........................................................................................... 93
vii
SUMMARY
This study examines the transfer and development length of 15.2 mm (0.6 in.)diameter prestressing strand in high performance (high strength) concrete. Two 1067 mm(42.0 in.) deep rectangular beams, commonly called the Hoblitzell-Buckner beams, eachwith one row of 15.2 mm (0.6 in.) diameter strands at 51 mm (2.0 in.) spacing on center,were instrumented to measure the transfer and development length of the strands. Concretestrengths were 48.5 MPa (7040 psi) at transfer and 90.7 MPa (13,160 psi) at the time ofdevelopment length testing. The strand surface condition was weathered or rusty.
Transfer length was determined from the concrete strain profile at the level of thestrands at transfer. The average transfer length of the strands in the specimen beams wasobserved to be 14.3 inches. Code equations and other proposed equations were found to beconservative in comparison with the measured value.
Development length was determined from the results of four full-scaleflexural tests on the Hoblitzell-Buckner beams with various embedment lengths. All fourtests resulted in flexural failures, such that the development length of the strands wasobserved to be less than 78 inches. Measured values were compared to previous researchresults and proposed equations, including the AASHTO and ACI 318 code equations,which were found to be conservative in this case.

viii

1
CHAPTER 1. INTRODUCTION
1.1 BACKGROUND AND PROBLEM DEFINITION
For several decades, prestressed concrete has been an efficient, economical designoption for highway structures. With the use of modern, higher strength materials specifically high performance concretes and 15.2 mm (0.6 in.) diameter prestressingstrandthe benefits of prestressed concrete can be enhanced further. Longer spans andlarger girder spacing may result in significantly more efficient structures. Before thesematerials become the standard in practice, however, more must be learned about theirinteraction in prestressed concrete members.
Prestressing strand and concrete in a pretensioned, prestressed member interactthrough bond. Bond is the mechanism through which tension in a strand is transferred tocompression in the concrete. The entire concept of prestressed, pretensioned concrete as astructural material is thus based on this bond between the strand and concrete. Withoutbond, no transfer of forces would occur and the member would not act integrally.
As modern high strength materials are adopted for use in prestressed concrete,higher forces must be transmitted between the strand and the concrete. As a result, thedemand on bond is magnified. For the implementation of these modern materials to beeffective at the structural-member level, their interaction at the level of bond must first beunderstood.
On October 26, 1988, the Federal Highway Administration (FHWA) issued amemorandum that disallowed the use of 15.2 mm (0.6 in.) diameter strand in pretensionedapplications, increased minimum strand spacing requirements, and increased the requireddevelopment length for fully bonded strands to 1.6 times the AASHTO and ACI 318 coderequirements. The memorandum was issued because the code requirements for bond werebased on tests using materials that were effectively outdated, and because recent researchresults (10) had questioned the conservatism of the code (15).
As a result of the FHWA memorandum, numerous researchers have studiedprestressing bond, transfer length, and development length, over the last half decade. Thisstudy specifically addresses the use of high performance concrete and 15.2 mm (0.6 in.)diameter strands and their effect on transfer and development length.
1.2 OBJECTIVE OF THE RESEARCH PROGRAM
This study is part of a research project entitled “Design and Construction of ExtraHigh Strength Concrete Bridges,” funded by the FHWA and the Texas Department ofTransportation (TxDOT). The objective of the research program is to develop guidelinesfor the design and construction of high strength prestressed concrete bridges. The projectrevolves around the construction of two adjacent high strength highway bridges in Houston,Texas, namely, the northbound and southbound Louetta Road Overpass on Texas StateHighway 249.

2
The design utilizes the new Texas Type U54 beam and 15.2 mm (0.6 in.) diameterprestressing strand at 50 mm (1.97 in.) spacing. The benefits of the U54 beam arediscussed by Ralls et al. (22). The use of high performance concrete with 15.2 mm (0.6 in.)diameter strands allows for greater prestressing forces and, therefore, longer spans thanmay be accommodated by current standard materials. Required compressive strengths attransfer for the structural girders range from 47.6 MPa (6,900 psi) to 60.7 MPa (8,800 psi).Required 56-day compressive strengths range from 67.6 MPa (9,800 psi) to 90.3 MPa(13,100 psi). Details of the design process used for the Louetta Road Overpass arepresented by Barrios (2).
A pilot study was performed to verify the adequate performance of the designbeams at transfer. Results of the pilot study were very positive and are discussed in detailby Barrios (2). The current study was then performed to examine the development lengthof 15.2 mm (0.6 in.) diameter strands at 51 mm (2.0 in.) spacing in high performanceconcrete under ultimate flexural loads. An extensive quality control program is underwayto monitor the fabrication of the actual structural beams. Beams are currently beinginstrumented for camber, strain, and temperature measurements during the casting process.Long-term performance will be monitored before and after completion of the structure.Guidelines and recommendations for the design and construction of high strength concretebridges will be developed.
1.3 OBJECTIVE OF THIS STUDY
The purpose of this study is to determine the development length of 15.2 mm (0.6in.) diameter prestressing strand at 51 mm (2.0 in.) spacing in high performance concrete.Full-scale rectangular beams were cast at a prestressing plant and instrumented todetermine the transfer length of the strands. Beams were tested in flexure to determine ifthe ultimate strength of the strands could be developed by bond. The required developmentlength for the strands was determined from the results of the flexural tests.
1.4 HIGH PERFORMANCE CONCRETE VERSUS HIGH STRENGTHCONCRETE
Simply defined, high performance concrete is any concrete that exhibits beneficialstrength and/or durability properties. Beneficial strength properties may includecompressive strength, tensile or flexural strength, modulus of elasticity, and creep andshrinkage characteristics. Beneficial durability properties may include low permeability,good abrasion resistance, and good freeze-thaw characteristics. A concrete does not haveto have both good strength characteristics and good durability characteristics to beconsidered a high performance concrete, though these strength and durability properties areoften inseparable.
The terms high strength concrete and high performance concrete are usedsomewhat interchangeably throughout the report. This is not meant to imply that all highperformance concretes exhibit high strength (although all high strength concretes are high
3
performance concretes). The terms are used interchangeably because the content of thisreport is primarily concerned with the strength aspects of high performance concrete.Throughout this report, both terms are simply meant to refer to a concrete that has highstrength.
1.5 ORGANIZATION OF PRESENTATION
Chapter 1 has presented a brief introduction to the study described in this report.Chapter 2 provides background material on the subject of transfer and development lengthof pretensioned members. The test program is described in detail in Chapter 3, and theresults are presented in Chapter 4. Chapter 5 discusses the results of the test program. Asummary of the study and a list of conclusions are provided in Chapter 6.

4
5
CHAPTER 2. LITERATURE REVIEW
2.1 INTRODUCTION
This chapter is intended to provide a brief theoretical background on transfer anddevelopment length of pretensioned, prestressed concrete members. First, a generaloverview of bond stresses is presented. Transfer and development length are then definedand the many variables that affect them are discussed. Selected experimental researchprograms from the past 40 years are summarized, and a list of the many proposed equationsfor transfer and development length is provided.
2.2 NATURE OF BOND STRESSES
2.2.1 Bond Mechanisms
There are three mechanisms by which the concrete and steel strand bond to oneanother in pretensioned, prestressed concrete members: adhesion, Hoyer’s effect (wedgeaction), and mechanical interlock. Each mechanism is discussed briefly below:
Adhesion—There is a small adhesive effect between the prestressing strand and surroundingconcrete that contributes to bond in pretensioned members. This adhesion is present onlyprior to any relative slip that may occur between the strand and the concrete. Therefore,this component of bond is often neglected.
Hoyer’s effect (wedge action)—As a strand is tensioned, its diameter and cross-sectionalarea reduce an amount determined by Poisson’s ratio of the strand. Upon transfer, thestrand near the end of a pretensioned beam tries to return to its original unstressed state.However, the surrounding concrete prevents the lateral expansion of the strand back to itsoriginal diameter and area. This restraint, in the form of a normal (radial) force on thestrand, induces a frictional force along the longitudinal axis of the strand. This frictionalforce opposes any relative movement between the strand and surrounding concrete. SinceHoyer’s effect may be visualized as the strand wedging itself against the surroundingconcrete to prevent slip, it is often referred to as wedge action.
Mechanical interlock—Seven-wire strands consist of six small wires wound around onecenter wire to form a helical shape. Because of this helical shape, a component of thenormal force between the outer wires of the strand and the surrounding concrete acts alongthe axis of the strand. This component acts to resist slip between the strand and concrete.This mechanism is extremely similar to the pullout resistance provided by patterneddeformations on reinforcing bars in reinforced concrete. Mechanical interlock will developin pretensioned members only if twisting of the strand is prevented (23). When strand twist

6
is not restrained, the strand will simply slide through the member, as normal forces will notbe developed.
2.2.2 Transfer Bond Stresses
A plot of stress and strain in the transfer zone is illustrated in Figure 2.1. Forstandard seven-wire prestressing strand, the stress and strain profiles are linear in thetransfer zone. The increase in steel stress, from zero at the beam end to the effectiveprestress fse at the end of the transfer zone, must be developed by transfer bond stresses.
Steel(Tension)
Transfer Zone
0
f
se
si
ce ce
si
seε
0
f
f
ε
ε
ε ε εsi sece
f
-=f f
nsi se-
ce =
Concrete(Compression)at level of steel
Figure 2.1 Stress and strain in the transfer zone
Bond stresses, by definition, are directly proportional to the rate of change, orderivative, of the steel stress. Thus, in the transfer zone, bond stresses must be uniform,because the steel stress varies linearly. This uniform bond stress in the transfer zone mustbe developed by the three mechanisms discussed in Section 2.2.1.
Since strain compatibility between the strand and concrete does not occur in thetransfer zone, adhesion does not contribute to bond in the transfer zone. Hoyer’s effect willserve to anchor the strand near the beam ends, as the large reduction in steel stress (from fsi
to the steel stress line in Figure 2.1) induces sufficient wedge action. Further into thetransfer zone, the steel loses a smaller proportion of its initial stress, and the contribution of
DISTANCE FROM BEAM END
εce
εse
εsi
ST
RA
IN
ST
RE
SS
7
Hoyer’s effect is reduced. Mechanical interlock is effective here, because Hoyer’s effectcloser to the end prevents strand twist. At the inner end of the transfer zone, mechanicalinterlock is fully effective and accounts for nearly the entire transfer bond stress.
2.2.3 Flexural Bond Stresses
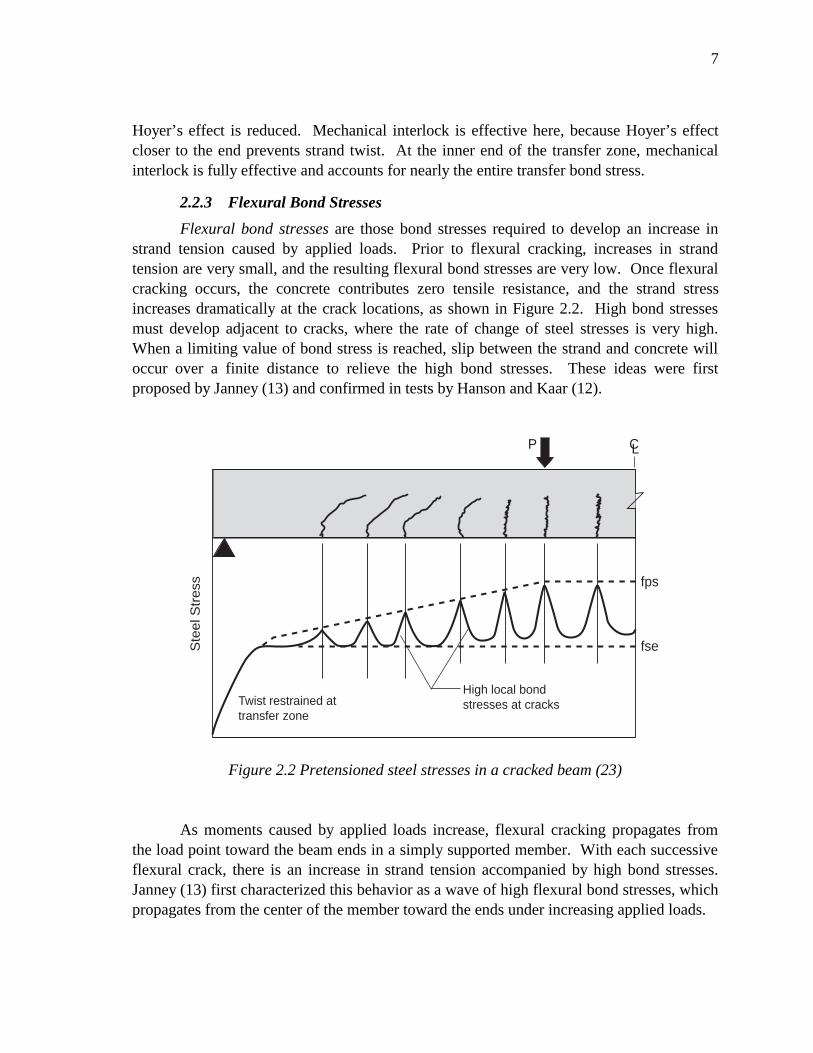
Flexural bond stresses are those bond stresses required to develop an increase instrand tension caused by applied loads. Prior to flexural cracking, increases in strandtension are very small, and the resulting flexural bond stresses are very low. Once flexuralcracking occurs, the concrete contributes zero tensile resistance, and the strand stressincreases dramatically at the crack locations, as shown in Figure 2.2. High bond stressesmust develop adjacent to cracks, where the rate of change of steel stresses is very high.When a limiting value of bond stress is reached, slip between the strand and concrete willoccur over a finite distance to relieve the high bond stresses. These ideas were firstproposed by Janney (13) and confirmed in tests by Hanson and Kaar (12).
High local bondstresses at cracksTwist restrained at
transfer zone
Ste
el S
tres
s fps
CLP
fse
Figure 2.2 Pretensioned steel stresses in a cracked beam (23)
As moments caused by applied loads increase, flexural cracking propagates fromthe load point toward the beam ends in a simply supported member. With each successiveflexural crack, there is an increase in strand tension accompanied by high bond stresses.Janney (13) first characterized this behavior as a wave of high flexural bond stresses, whichpropagates from the center of the member toward the ends under increasing applied loads.
8
2.2.4 General Bond Failure
Janney (13) suggested that a general bond failure would occur when the wave ofhigh flexural bond stresses reaches the transfer zone of a pretensioned member. Anincrease in strand tension in the transfer zone after release will cause Hoyer’s effect to bereduced. As a result, twist restraint may not be adequate to develop full mechanicalinterlock between the strand and concrete. The probable scenario is a sudden bond failure.
Russell and Burns (23) noted that anchorage failure also occurs when web-shearcracks in the transfer zone propagate to the level of the strand. Similar failures werereported by Burdette et al. (7) and by Mitchell et al. (19). The ultimate failure mechanismin these cases is the same as that for flexural cracking in the transfer zone: an increase instrand tension in the transfer zone results in a loss of anchorage from Hoyer’s effect.
In general, any significant increase in strand tension in the anchorage zone willresult in a general bond failure. Since large increases in strand tension may be the result ofeither flexural or shear cracking, the prediction model for general bond failure is stated byRussell and Burns (23) as follows:
If cracks propagate through the anchorage zone of a strand, or immediatelynext to the transfer zone, then failure of the strand anchorage is imminent.
2.3 DEFINITIONS
Transfer length, flexural bond length, development length, and embedment lengthare defined below and illustrated in Figure 2.3.
2.3.1 Transfer Length
Transfer length is defined as the length of bond required to develop the effectiveprestress force, fse, in the strand. Alternatively, transfer length may be defined as the lengthof bond required to transfer the fully effective prestress force from the strand to theconcrete.
2.3.2 Flexural Bond Length
Flexural bond length is defined as the length of bond required to develop anincrease in strand tension, from fse to fps, caused by applied loads. Note that fps is the stressin the strand at the ultimate strength of the member.
2.3.3 Development Length
Development length is defined as the total length of bond required to develop thesteel stress fps at the ultimate strength of the member. Development length is the algebraicsum of transfer length and flexural bond length.

9
Transfer Length Flexural Bond Length
Distance from free end of strand
Development Length
f psf se
fseps
-f
Figure 2.3 Variation of steel stress with distance from free end of strand (6)
2.3.4 Embedment Length
Embedment length is defined as the length of bond from the critical section to thebeginning of bond. The critical section is the location at which the steel stress is maximumand usually occurs at the point of maximum moment. The beginning of bond occurs at theend of the member for a fully bonded strand, and at the end of debonding for a debondedstrand.
In order to prevent a general bond failure, the available embedment length must belarger than the required development length:
L Le d≥
2.4 EFFECT OF VARIABLES
The transfer and development length of prestressing steel is affected by manyparameters (26), including:
SteelStress

10
1. Type of steel, e.g., wire, strand/stress-relieved, low relaxation2. Steel size (diameter)3. Steel stress level4. Surface condition of steelclean, oiled, rusted, epoxy coated5. Concrete strength6. Type of loading, e.g., static, repeated, impact7. Type of release, e.g., gradual, sudden8. Confinement9. Time-dependent effects (losses)10. Consolidation and consistency of concrete around steel11. Cover and spacing
The effects of some of these variables are discussed below.
2.4.1 Strand Diameter
Many studies (7, 8, 12, 14, 16, 19, 23) have investigated the variation of transferand/or development length with strand diameter. All of these studies, with one exception(7), have shown that transfer and development lengths increase for larger strand diameters.Kaar et al. (14) determined that the variation in transfer length is nearly linear with respectto strand diameter. This linear relationship is incorporated into many of the proposedequations for transfer and development length presented in Section 2.6.
2.4.2 Concrete Strength
In 1963, Kaar et al. (14) reported little influence of concrete strength on transferlengths for up to 12.7 mm (0.5 in.) diameter strands. Concrete strengths at transfer in thattest program ranged from 11.4 to 34.5 MPa (1,660 to 5,000 psi). More recently, therelationship between transfer and development lengths and concrete strength has beeninvestigated for high strength concretes. Castrodale et al. (9) observed transfer lengthsapproximately 30% shorter for concrete with f’ ci = 64.8 MPa (9,400 psi), compared toconcrete with f’ ci = 35.2 MPa (5,100 psi). Mitchell et al. (19), in tests with f’ ci ranging from21.0 to 50.0 MPa (3,050 to 7,250 psi), and f’ c ranging from 31.0 to 88.9 MPa (4,500 to12,900 psi), concluded that both transfer and development lengths decrease with increasingconcrete strength. More recent equations developed for transfer and development lengthincorporate these conclusions.
2.4.3 Strand Surface Condition
The effect of strand surface condition is probably the most important variableaffecting transfer length, yet it is the most difficult to determine (23). Strands may belightly rusted, well rusted, epoxy coated with grit, oiled, or indented. Each of theseconditions will affect the coefficient of frictionand thus the bondsbetween the strandand the concrete. The variation in transfer and development lengths with strand surface

11
conditions has been noted by many researchers (7, 10, 11, 12, 13, 16, 23). In general, well-rusted and epoxy-coated strands with grit have significantly shorter transfer anddevelopment lengths than clean strands. Likewise, the presence of oils on the surface of astrand will substantially increase transfer and development lengths.
2.4.4 Type of Release
It is generally accepted that a sudden transfer of prestress caused by flame cutting orsawing will result in longer transfer lengths. This trend was reported by Kaar et al. (14),who noted a 20% to 30% increase in transfer length for flame-cut strands. Likewise,Hanson (11) reported an average increase in transfer length of 4 in. for flame-cut strands.
2.4.5 Effective Prestress Force
Transfer length will logically increase with a higher effective prestress force, fse,since a higher strand stress must be developed in the transfer zone. Flexural bond lengthwill correspondingly decrease for a higher fse, since the additional strand tension to bedeveloped at the critical section will be lower. Most proposed equations presented inSection 2.6 assume that the decrease in flexural bond length will be larger than the increasein transfer length for a given increase in fse. As a result, the development length decreaseswith increasing effective prestress forces.
2.4.6 Strand Spacing
Only recently, and after the 1988 FHWA memorandum discussed in Section 1.1,has the effect of strand spacing on transfer and development length been examined. Russelland Burns (23) reported no difference in measured transfer lengths for 15.2 mm (0.6 in.)diameter strands at 51 and 57 mm (2.0 and 2.25 in.) spacings. Burdette et al. (7) reportedsimilar findings for 12.7 mm (0.5 in.) diameter strands at 44 and 51 mm (1.75 and 2.0 in.)spacings. Naturally, there is a minimum spacing for a given strand diameter at which thesplitting resistance of the concrete will be exceeded. Further testing is required todetermine this minimum spacing for larger diameter strands. However, it is important tonote that splitting was not observed in the tests of 15.2 mm (0.6 in.) diameter strands at 51mm (2.0 in.) spacing by Russell and Burns (23).
2.5 PREVIOUS RESEARCH
Numerous experimental research programs have investigated the transfer anddevelopment of prestressing strand. Selected research programs are summarized brieflybelow.
2.5.1 Hanson and Kaar (12)Portland Cement Association Laboratories(1959)
The work of Hanson and Kaar at the Portland Cement Association (PCA)Laboratories in the late 1950s created the framework for much of today’s development
12
length testing. Twenty-four rectangular prisms, each containing one to six Grade 250stress-relieved strands, were tested in a series of flexural tests. The main variables in thetest series were strand diameter (6.4, 9.5, and 12.7 mm, or 1/4, 3/8, and 1/2 in.) andembedment length. Secondary variables included concrete strength and strand surfacecondition.
Hanson and Kaar’s work verified the wave of high bond stress theory proposed byJanney (13) by measuring strand stresses (strains) at various stages before and after flexuralcracking. Based on an analytical model developed from measured strand stresses,minimum suggested embedment lengths that could prevent bond slip were proposed: 70 in.,106 in., and 134 in. for 6.4, 9.5, and 12.7 mm (1/4, 3/8, and 1/2 in.) diameter strand,respectively. Although these recommendations are generally considered to beoverconservative, the results of Hanson and Kaar’s test program became the basis for theACI 318 and AASHTO code equation for development length (6, 24).
2.5.2 Cousins, Johnston, and Zia (10)North Carolina State University (1986)
Cousins, Johnston, and Zia studied the effects of epoxy coating on the transfer anddevelopment of prestresssing strand. Single-strand rectangular prisms were instrumented tomeasure transfer length, and later tested in flexure with various embedment lengths in orderto determine a development length. Strand diameters were 9.5, 12.7, or 15.2 mm (3/8, 1/2,or 0.6 in.), and strand surfaces were either left uncoated or epoxy coated with gritimpregnated in the surface to improve bonding characteristics.
Although Cousins, Johnston, and Zia established a pattern of significant reductionin transfer and development lengths for epoxy-coated strands, their most significantfindings may have been their measurements on uncoated strands. They reported averagetransfer lengths of 34, 50, and 56 in., and development lengths of 57, 119, and 132 in., for9.5, 12.7, or 15.2 mm (3/8, 1/2, and 0.6 in.) strands, respectively. These measured valueswere significantly larger than values predicted by the AASHTO and ACI 318 codeequations. This apparent lack of conservatism in the code equations was a factor thatultimately led to the FHWA memorandum discussed in Section 1.1 (15).
2.5.3 Burdette, Deatherage, and Chew (7)Univ. of Tenn., Knoxville (1991)
Burdette, Deatherage, and Chew measured transfer and development lengths ontwenty full-scale AASHTO Type I beams with large strand diameters (12.7, 14.3, and 15.2mm, or 1/2, 9/16, and 0.6 in.). Average transfer lengths of 32, 35, and 24 in. weremeasured for 12.7, 14.3, and 15.2 mm (1/2, 9/16, and 0.6 in.) strands, respectively. Thesmaller measured transfer length for 15.2 mm (0.6 in.) strand contradicts the general trendin the literature of transfer length increasing with strand diameter. Approximatedevelopment lengths for 12.7, 14.3, and 15.2 mm (1/2, 9/16, and 0.6 in.) strand sizes were80, 105, and 85 in. Based on the data, the researchers proposed conservative modificationsto the existing AASHTO and ACI 318 code equations.
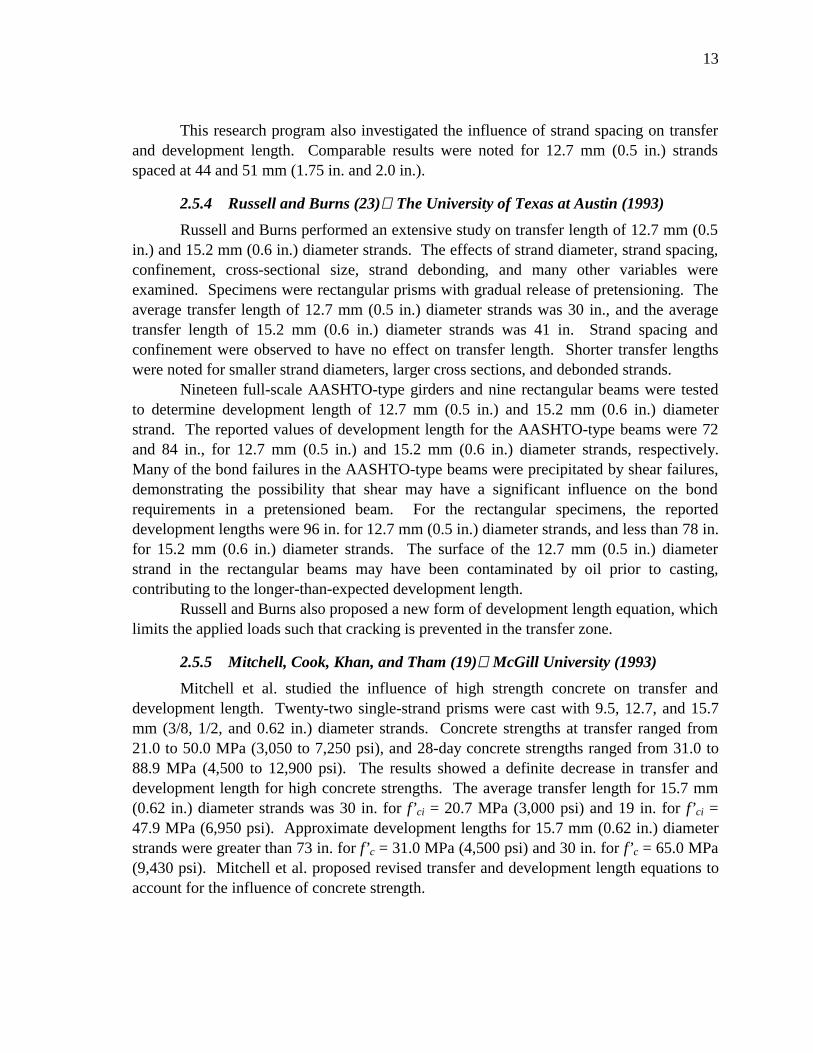
13
This research program also investigated the influence of strand spacing on transferand development length. Comparable results were noted for 12.7 mm (0.5 in.) strandsspaced at 44 and 51 mm (1.75 in. and 2.0 in.).
2.5.4 Russell and Burns (23)The University of Texas at Austin (1993)
Russell and Burns performed an extensive study on transfer length of 12.7 mm (0.5in.) and 15.2 mm (0.6 in.) diameter strands. The effects of strand diameter, strand spacing,confinement, cross-sectional size, strand debonding, and many other variables wereexamined. Specimens were rectangular prisms with gradual release of pretensioning. Theaverage transfer length of 12.7 mm (0.5 in.) diameter strands was 30 in., and the averagetransfer length of 15.2 mm (0.6 in.) diameter strands was 41 in. Strand spacing andconfinement were observed to have no effect on transfer length. Shorter transfer lengthswere noted for smaller strand diameters, larger cross sections, and debonded strands.
Nineteen full-scale AASHTO-type girders and nine rectangular beams were testedto determine development length of 12.7 mm (0.5 in.) and 15.2 mm (0.6 in.) diameterstrand. The reported values of development length for the AASHTO-type beams were 72and 84 in., for 12.7 mm (0.5 in.) and 15.2 mm (0.6 in.) diameter strands, respectively.Many of the bond failures in the AASHTO-type beams were precipitated by shear failures,demonstrating the possibility that shear may have a significant influence on the bondrequirements in a pretensioned beam. For the rectangular specimens, the reporteddevelopment lengths were 96 in. for 12.7 mm (0.5 in.) diameter strands, and less than 78 in.for 15.2 mm (0.6 in.) diameter strands. The surface of the 12.7 mm (0.5 in.) diameterstrand in the rectangular beams may have been contaminated by oil prior to casting,contributing to the longer-than-expected development length.
Russell and Burns also proposed a new form of development length equation, whichlimits the applied loads such that cracking is prevented in the transfer zone.
2.5.5 Mitchell, Cook, Khan, and Tham (19)McGill University (1993)
Mitchell et al. studied the influence of high strength concrete on transfer anddevelopment length. Twenty-two single-strand prisms were cast with 9.5, 12.7, and 15.7mm (3/8, 1/2, and 0.62 in.) diameter strands. Concrete strengths at transfer ranged from21.0 to 50.0 MPa (3,050 to 7,250 psi), and 28-day concrete strengths ranged from 31.0 to88.9 MPa (4,500 to 12,900 psi). The results showed a definite decrease in transfer anddevelopment length for high concrete strengths. The average transfer length for 15.7 mm(0.62 in.) diameter strands was 30 in. for f’ ci = 20.7 MPa (3,000 psi) and 19 in. for f’ ci =47.9 MPa (6,950 psi). Approximate development lengths for 15.7 mm (0.62 in.) diameterstrands were greater than 73 in. for f’ c = 31.0 MPa (4,500 psi) and 30 in. for f’ c = 65.0 MPa(9,430 psi). Mitchell et al. proposed revised transfer and development length equations toaccount for the influence of concrete strength.
14
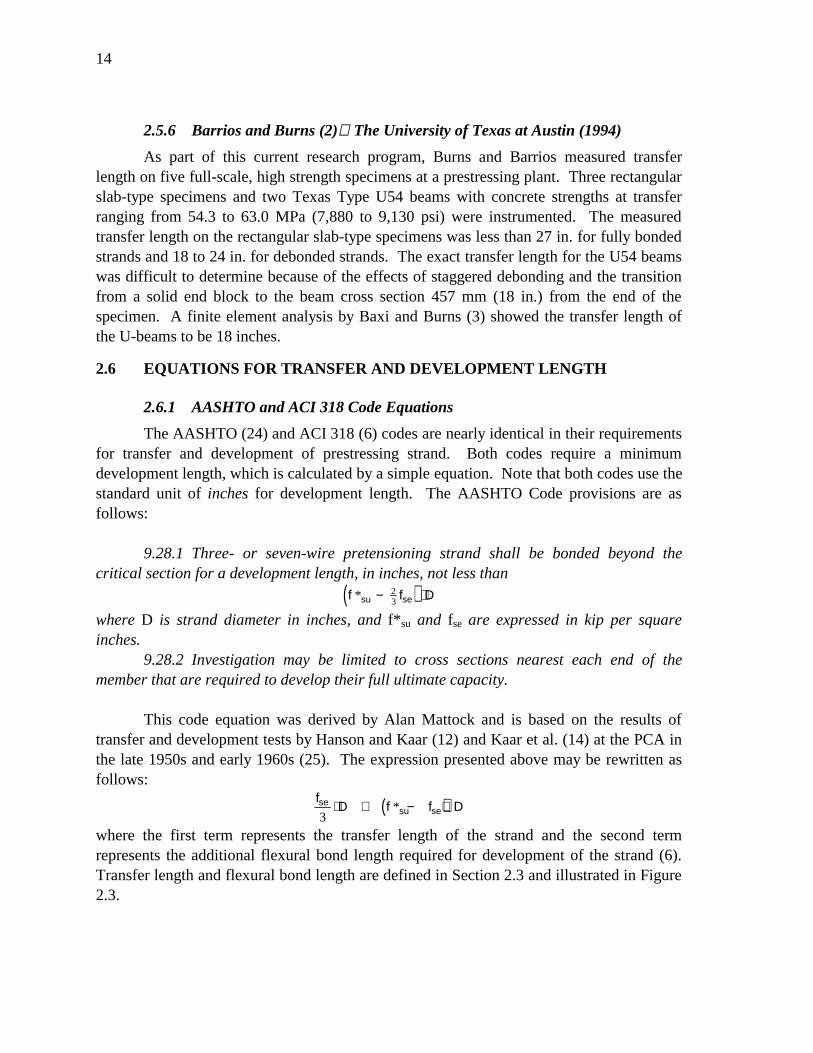
2.5.6 Barrios and Burns (2)The University of Texas at Austin (1994)
As part of this current research program, Burns and Barrios measured transferlength on five full-scale, high strength specimens at a prestressing plant. Three rectangularslab-type specimens and two Texas Type U54 beams with concrete strengths at transferranging from 54.3 to 63.0 MPa (7,880 to 9,130 psi) were instrumented. The measuredtransfer length on the rectangular slab-type specimens was less than 27 in. for fully bondedstrands and 18 to 24 in. for debonded strands. The exact transfer length for the U54 beamswas difficult to determine because of the effects of staggered debonding and the transitionfrom a solid end block to the beam cross section 457 mm (18 in.) from the end of thespecimen. A finite element analysis by Baxi and Burns (3) showed the transfer length ofthe U-beams to be 18 inches.
2.6 EQUATIONS FOR TRANSFER AND DEVELOPMENT LENGTH
2.6.1 AASHTO and ACI 318 Code Equations
The AASHTO (24) and ACI 318 (6) codes are nearly identical in their requirementsfor transfer and development of prestressing strand. Both codes require a minimumdevelopment length, which is calculated by a simple equation. Note that both codes use thestandard unit of inches for development length. The AASHTO Code provisions are asfollows:
9.28.1 Three- or seven-wire pretensioning strand shall be bonded beyond thecritical section for a development length, in inches, not less than
( )f f Dsu se* − ⋅23
where D is strand diameter in inches, and f* su and fse are expressed in kip per squareinches.
9.28.2 Investigation may be limited to cross sections nearest each end of themember that are required to develop their full ultimate capacity.
This code equation was derived by Alan Mattock and is based on the results oftransfer and development tests by Hanson and Kaar (12) and Kaar et al. (14) at the PCA inthe late 1950s and early 1960s (25). The expression presented above may be rewritten asfollows:
( )fD f f Dse
su se3⋅ + − ⋅*
where the first term represents the transfer length of the strand and the second termrepresents the additional flexural bond length required for development of the strand (6).Transfer length and flexural bond length are defined in Section 2.3 and illustrated in Figure2.3.
15
The code equation for required development length is clearly flexural in nature.The accompanying provision, however, implies that any critical section nearest the end of amember that may develop the design strength of the strand, regardless of its nature (flexure,shear, axial loads), should be investigated. The possibility of shear cracking as aprecipitator of bond failure is discussed in Section 2.2.4.
The shear provisions of each code (AASHTO Section 9.20.4/ACI 318 Section11.4.4) assume a transfer length of 50 strand diameters for purposes of computing Vcw, theresistance to web-shear cracking of the concrete alone. This assumption is merely asimplification of the transfer length portion of the development length equation, based on astrand stress after losses of 1030 MPa (150 ksi) (25). With the Grade 270 prestressingstrand used today, this simplification becomes slightly less conservative.
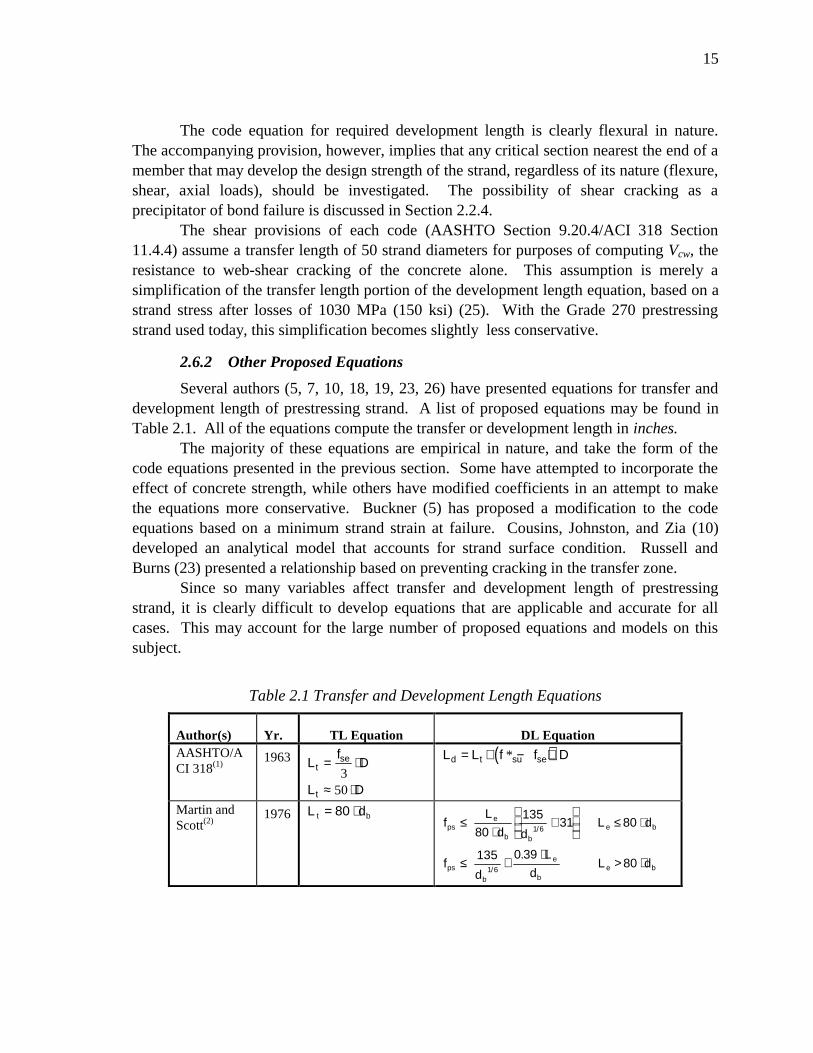
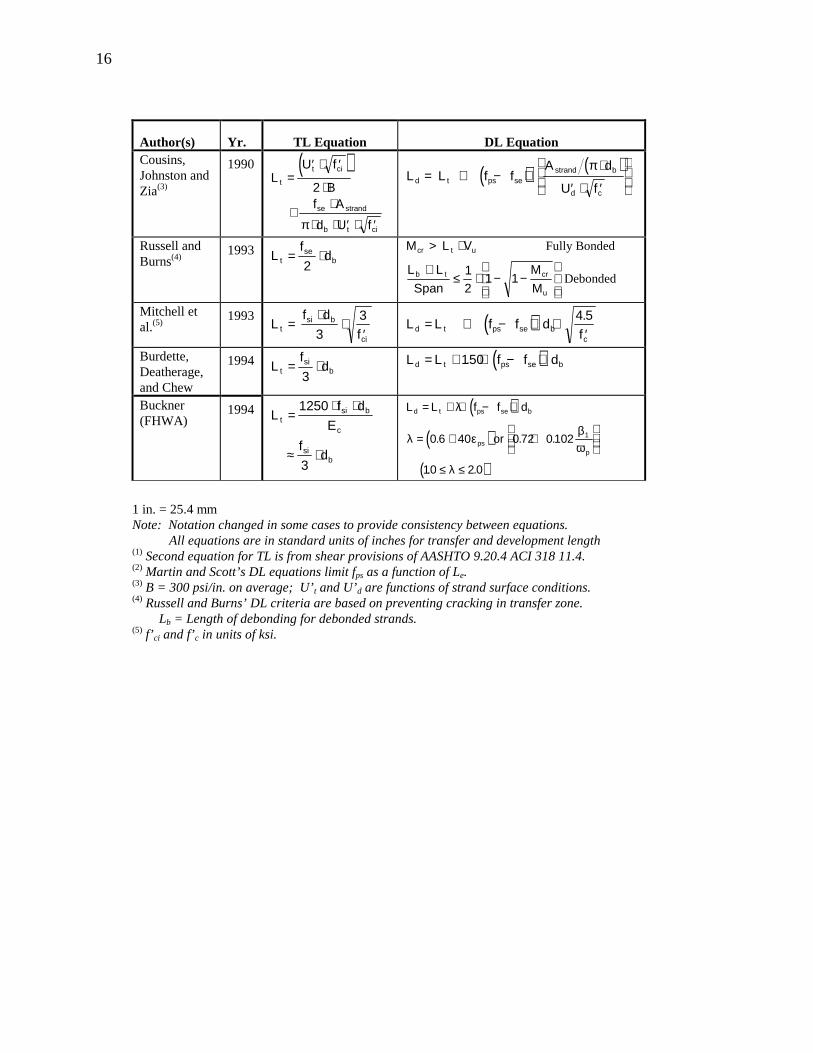
2.6.2 Other Proposed Equations
Several authors (5, 7, 10, 18, 19, 23, 26) have presented equations for transfer anddevelopment length of prestressing strand. A list of proposed equations may be found inTable 2.1. All of the equations compute the transfer or development length in inches.
The majority of these equations are empirical in nature, and take the form of thecode equations presented in the previous section. Some have attempted to incorporate theeffect of concrete strength, while others have modified coefficients in an attempt to makethe equations more conservative. Buckner (5) has proposed a modification to the codeequations based on a minimum strand strain at failure. Cousins, Johnston, and Zia (10)developed an analytical model that accounts for strand surface condition. Russell andBurns (23) presented a relationship based on preventing cracking in the transfer zone.
Since so many variables affect transfer and development length of prestressingstrand, it is clearly difficult to develop equations that are applicable and accurate for allcases. This may account for the large number of proposed equations and models on thissubject.
Table 2.1 Transfer and Development Length Equations
Author(s) Yr. TL Equation DL EquationAASHTO/ACI 318(1)
1963 Lf
D
L D
tse
t
= ⋅
≈ ⋅3
50
( )L L f f Dd t su se= + − ⋅*
Martin andScott(2)
1976 L dt b= ⋅80f
L
d dL d
fd
L
dL d
pse
b b
e b
ps
b
e
be b
≤⋅
+
≤ ⋅
≤ +⋅
> ⋅
80135
31 80
135 0 3980
1 6
1 6
/
/
.
16
Author(s) Yr. TL Equation DL EquationCousins,Johnston andZia(3)
1990 ( )L
U f
Bf A
d U f
t
t ci
se strand
b t ci
=′ ⋅ ′
⋅
+⋅
⋅ ⋅ ′ ⋅ ′
2
π
( ) ( )L L f f
A d
U fd t ps se
strand b
d c
= + − ⋅⋅
′ ⋅ ′
π
Russell andBurns(4)
1993 Lf
dtse
b= ⋅2
M L V
L L
Span
M
M
cr t u
b t cr
u
> ⋅
+≤ ⋅ − −
Fully Bonded
Debonded12
1 1
Mitchell etal.(5)
1993L
f d
ftsi b
ci
=⋅
⋅′33 ( )L L f f d
fd t ps se bc
= + − ⋅ ⋅′
4 5.
Burdette,Deatherage,and Chew
1994 Lf
dtsi
b= ⋅3
( )L L f f dd t ps se b= + ⋅ − ⋅150.
Buckner(FHWA)
1994 Lf d
E
fd
tsi b
c
sib
=⋅ ⋅
≈ ⋅
1250
3
( )
( )( )
L L f f d
or
d t ps se b
psp
= + ⋅ − ⋅
= + +
≤ ≤
λ
λ εβω
λ
0 6 40 0 72 0102
10 2 0
1. . .
. .
1 in. = 25.4 mmNote: Notation changed in some cases to provide consistency between equations. All equations are in standard units of inches for transfer and development length(1) Second equation for TL is from shear provisions of AASHTO 9.20.4 ACI 318 11.4.(2) Martin and Scott’s DL equations limit fps as a function of Le.(3) B = 300 psi/in. on average; U’t and U’d are functions of strand surface conditions.(4) Russell and Burns’ DL criteria are based on preventing cracking in transfer zone. Lb = Length of debonding for debonded strands.(5) f’ ci and f’c in units of ksi.

17
CHAPTER 3. TEST PROGRAM
3.1 INTRODUCTION AND SCOPE OF TESTS
The main portion of the test program consisted of four experimental tests performedon full-scale rectangular prestressed concrete beams. The goal of the test program was todetermine the development length of the prestressing strands in the specimens. Specimenswere designed to be identical, while the test setup was designed to be variable for each ofthe four tests. Specific characteristics of the test specimens included:
1) 15.2 mm (0.6 in.) diameter prestressing strands2) high performance concrete (high concrete strengths)3) minimal strand spacing and cover4) fully bonded strands
The original rectangular section was designed in May 1993 by Jim Hoblitzell of theFederal Highway Administration (FHWA). Dale Buckner, of the Virginia Military Instituteand author of an analysis of recent transfer and development research for the FHWA (5),suggested slight modifications to the section in June 1993. Two identical beams,commonly referred to as the Hoblitzell-Buckner beams, were then cast in December 1993at Texas Concrete Company in Victoria, Texas. Both beams were shipped to the Phil M.Ferguson Structural Engineering Laboratory at The University of Texas at Austin inJanuary 1994 for structural testing. A series of four experimental tests, one on each beamend, began in April 1994.
A second portion of the test program involved the measurement of the transferlength of the 15.2 mm (0.6 in.) diameter strands. The same two beams fabricated for thedevelopment length tests were instrumented during the casting process in Victoria, Texas.Measurements were made to determine the strain profile in the concrete at the level of thestrands at transfer for each of the four specimen ends. The constructed strain profile wasthen used to determine the transfer length of the strands.
This chapter discusses the specimen design and fabrication, as well as theinstrumentation and test setup, for both transfer length measurements and developmentlength tests.
3.2 SPECIMEN DESIGN AND DESIGNATION
3.2.1 Specimen Design
The specimen cross section was designed to permit the examination of the transferand development of 15.2 mm (0.6 in.) diameter prestressing strands with minimal spacingand cover. A single row of six strands was selected with 51 mm (2.0 in.) spacing on center
18
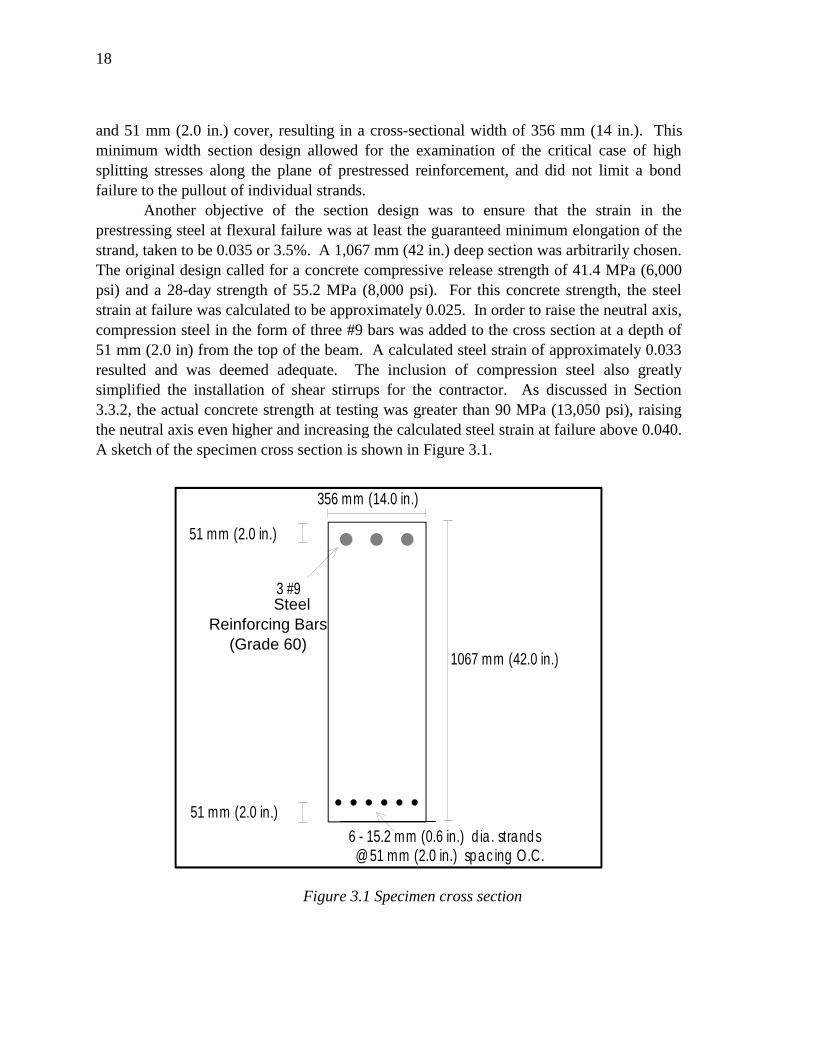
and 51 mm (2.0 in.) cover, resulting in a cross-sectional width of 356 mm (14 in.). Thisminimum width section design allowed for the examination of the critical case of highsplitting stresses along the plane of prestressed reinforcement, and did not limit a bondfailure to the pullout of individual strands.
Another objective of the section design was to ensure that the strain in theprestressing steel at flexural failure was at least the guaranteed minimum elongation of thestrand, taken to be 0.035 or 3.5%. A 1,067 mm (42 in.) deep section was arbitrarily chosen.The original design called for a concrete compressive release strength of 41.4 MPa (6,000psi) and a 28-day strength of 55.2 MPa (8,000 psi). For this concrete strength, the steelstrain at failure was calculated to be approximately 0.025. In order to raise the neutral axis,compression steel in the form of three #9 bars was added to the cross section at a depth of51 mm (2.0 in) from the top of the beam. A calculated steel strain of approximately 0.033resulted and was deemed adequate. The inclusion of compression steel also greatlysimplified the installation of shear stirrups for the contractor. As discussed in Section3.3.2, the actual concrete strength at testing was greater than 90 MPa (13,050 psi), raisingthe neutral axis even higher and increasing the calculated steel strain at failure above 0.040.A sketch of the specimen cross section is shown in Figure 3.1.
3 #9
6 - 15.2 mm (0.6 in.) dia. strands @ 51 mm (2.0 in.) spacing O.C.
51 mm (2.0 in.)
1067 mm (42.0 in.)
51 mm (2.0 in.)
356 mm (14.0 in.)
Figure 3.1 Specimen cross section
SteelReinforcing Bars
(Grade 60)

19
The selection of a rectangular section had two major advantages. First, therectangular section permitted the use of simple formwork by the contractor, as discussed inSection 3.4.3. More importantly, the rectangular section eliminated any potential for web-shear cracking because of its wide web. As discussed in Section 2.2.4, web-shear crackingnear beam ends can precipitate general bond failure.
Each beam was designed to be 13.56 m (44.5 ft) in length, so that both ends of eachbeam could be tested individually. Approximate lengths of cracked sections werecalculated to verify that an adequate length of uncracked beam would remain for a secondtest on the opposite beam end. Nominal shear reinforcement for each beam consisted ofGrade 60 U-shaped #4 bars at 457 mm (18 in.) spacing along the beam length and twoadditional stirrups at the beam ends. Note that only minimum shear reinforcement wasrequired because of the wide web of the rectangular section. Additional anchorage zonereinforcement, in the form of Grade 60 #3 bars that completely circle the six strands, wasincluded to resist splitting stresses resulting from the transfer of prestress force.Prestressing strands were fully bonded along the length of each beam. The contractordrawings for the test beams may be found in Appendix A.
3.2.2 Specimen and Test Designation
The two identical specimen beams were designated D1 and D2 at casting. Eachspecimen end was then identified based on its orientation during casting. For example,specimen D1S was the south end (during casting) of beam D1.
Each test was designated in three parts, as summarized in Table 3.1. The first partis the number of the experimental test. The second part is the beam end designation, asdiscussed above. The third part is the embedment length for that test, in the standard unitof inches. Embedment length was defined in Section 2.3.4.
Table 3.1 Experimental test designations
Test Designation Test Number Beam End Embedment Length (in.)
1-D1N-163 1 D1N 163
2-D1S-119 2 D1S 119
3-D2N-102 3 D2N 102
4-D2S-78 4 D2S 78
20
3.3 MATERIAL PROPERTIES
3.3.1 Pretensioning Strands
The pretensioning reinforcement used in the test specimens was 15.2 mm (0.6 in.)diameter Grade 270 low-relaxation seven-wire strand. The 15.2 mm (0.6 in.) diameterstrand is the largest diameter strand currently produced by strand manufacturers. Thenominal cross-sectional area is 140 mm2 (0.217 in.2), which is 41.8% larger than the 98.7mm2 (0.153 in.2) nominal area of 12.7 mm (0.5 in.) diameter strand. This permits asignificant increase in the load-carrying capacity of each strand. However, an increasedload capacity results in a higher bond stress per unit length of strand. These higher bondstresses raise the potential for both anchorage slip and splitting cracks parallel to the strand.This increased potential for bond failures when using 15.2 mm (0.6 in.) diameter strands isthe fundamental purpose of this study. Bond and bond stresses are discussed in greaterdetail in Section 2.2.
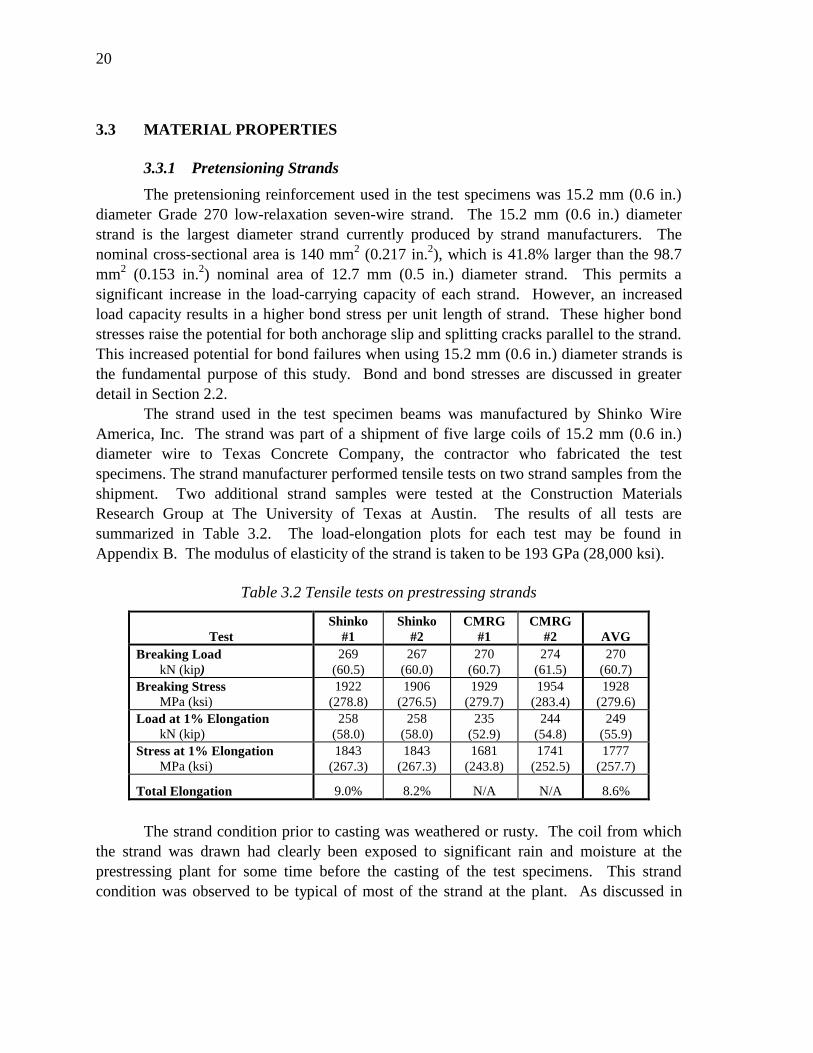
The strand used in the test specimen beams was manufactured by Shinko WireAmerica, Inc. The strand was part of a shipment of five large coils of 15.2 mm (0.6 in.)diameter wire to Texas Concrete Company, the contractor who fabricated the testspecimens. The strand manufacturer performed tensile tests on two strand samples from theshipment. Two additional strand samples were tested at the Construction MaterialsResearch Group at The University of Texas at Austin. The results of all tests aresummarized in Table 3.2. The load-elongation plots for each test may be found inAppendix B. The modulus of elasticity of the strand is taken to be 193 GPa (28,000 ksi).
Table 3.2 Tensile tests on prestressing strands
TestShinko
#1Shinko
#2CMRG
#1CMRG
#2 AVGBreaking Load kN (kip)
269(60.5)
267(60.0)
270(60.7)
274(61.5)
270(60.7)
Breaking Stress MPa (ksi)
1922(278.8)
1906(276.5)
1929(279.7)
1954(283.4)
1928(279.6)
Load at 1% Elongation kN (kip)
258(58.0)
258(58.0)
235(52.9)
244(54.8)
249(55.9)
Stress at 1% Elongation MPa (ksi)
1843(267.3)
1843(267.3)
1681(243.8)
1741(252.5)
1777(257.7)
Total Elongation 9.0% 8.2% N/A N/A 8.6%
The strand condition prior to casting was weathered or rusty. The coil from whichthe strand was drawn had clearly been exposed to significant rain and moisture at theprestressing plant for some time before the casting of the test specimens. This strandcondition was observed to be typical of most of the strand at the plant. As discussed in
21
Section 2.4.3, the strand condition is one of many variables that affects transfer anddevelopment length
3.3.2 Concrete
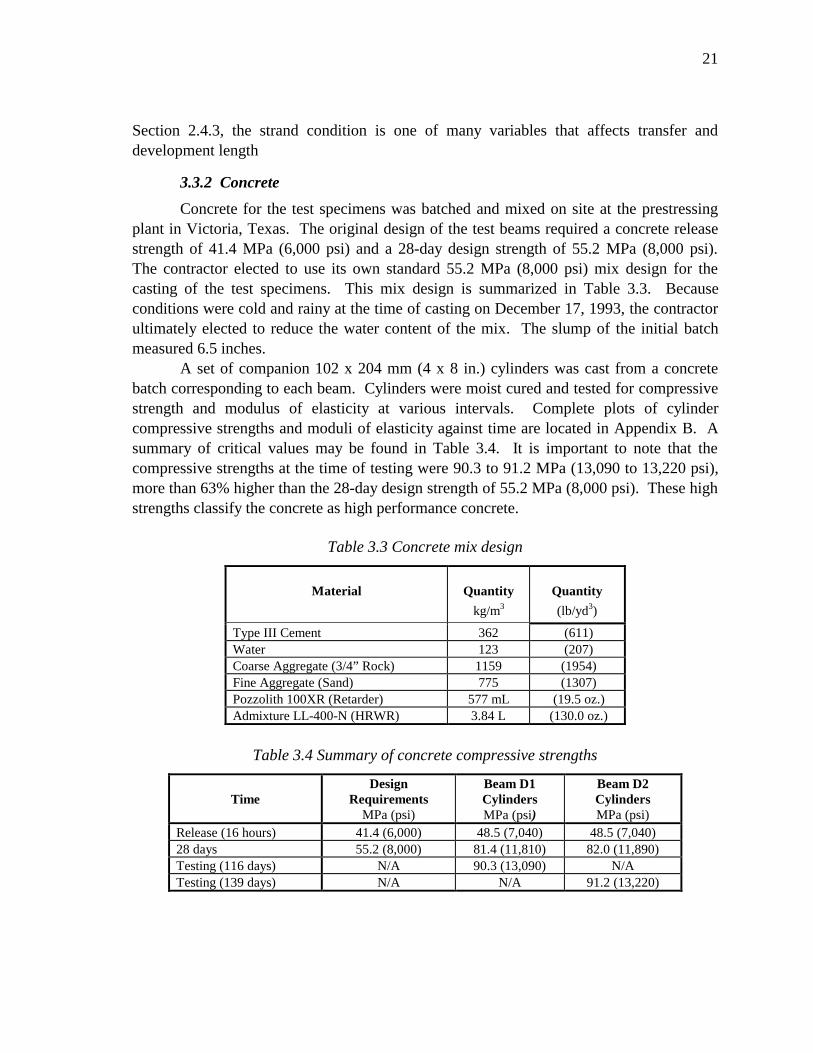
Concrete for the test specimens was batched and mixed on site at the prestressingplant in Victoria, Texas. The original design of the test beams required a concrete releasestrength of 41.4 MPa (6,000 psi) and a 28-day design strength of 55.2 MPa (8,000 psi).The contractor elected to use its own standard 55.2 MPa (8,000 psi) mix design for thecasting of the test specimens. This mix design is summarized in Table 3.3. Becauseconditions were cold and rainy at the time of casting on December 17, 1993, the contractorultimately elected to reduce the water content of the mix. The slump of the initial batchmeasured 6.5 inches.
A set of companion 102 x 204 mm (4 x 8 in.) cylinders was cast from a concretebatch corresponding to each beam. Cylinders were moist cured and tested for compressivestrength and modulus of elasticity at various intervals. Complete plots of cylindercompressive strengths and moduli of elasticity against time are located in Appendix B. Asummary of critical values may be found in Table 3.4. It is important to note that thecompressive strengths at the time of testing were 90.3 to 91.2 MPa (13,090 to 13,220 psi),more than 63% higher than the 28-day design strength of 55.2 MPa (8,000 psi). These highstrengths classify the concrete as high performance concrete.
Table 3.3 Concrete mix design
Material Quantity
kg/m3
Quantity
(lb/yd3)
Type III Cement 362 (611)Water 123 (207)Coarse Aggregate (3/4” Rock) 1159 (1954)Fine Aggregate (Sand) 775 (1307)Pozzolith 100XR (Retarder) 577 mL (19.5 oz.)Admixture LL-400-N (HRWR) 3.84 L (130.0 oz.)
Table 3.4 Summary of concrete compressive strengths
TimeDesign
RequirementsMPa (psi)
Beam D1CylindersMPa (psi)
Beam D2CylindersMPa (psi)
Release (16 hours) 41.4 (6,000) 48.5 (7,040) 48.5 (7,040)28 days 55.2 (8,000) 81.4 (11,810) 82.0 (11,890)Testing (116 days) N/A 90.3 (13,090) N/ATesting (139 days) N/A N/A 91.2 (13,220)
22
3.4 SPECIMEN FABRICATION
The test specimens were fabricated December 16−18, 1993, at Texas ConcreteCompany in Victoria, Texas. The stressing operations and mild steel placement wereperformed on the first afternoon. Formwork was erected the second morning and beamswere cast that afternoon. Formwork removal and the release of prestress took place thenext day.
3.4.1 Pretensioning Procedure
The six strands were pretensioned according to the standard method used by thecontractor. Each strand was first cut to an approximate length, anchored at the dead end(north end) of the bed using a strand chuck, and was then stretched the length of the bed.Strands were individually tensioned at the live end (south end) of the bed to a specifiedelongation of 316 mm (12.43 in.) using a hydraulic jack. This calculated elongation isderived from the common strength of materials equation:
δ = PLAE
where
δ = the total elongation between end anchorages,
P = the force in one strand,
L = the length of the strand between end anchorages,
A = the area of one strand, and
E = the modulus of elasticity of the strand.
Strands were stressed an extra 9.5 mm (3/8 in.) in order to account for the slipresulting from anchorage of the strand. Calculations were based on a desired force perstrand of 195.5 kN (43.95 kip). The actual force per strand, as calculated during stressingoperations, was 196.6 kN (44.21 kip). This is an overstress error of 0.6%, which is wellwithin acceptable tolerance.
3.4.2 Mild Steel Placement
Following the stressing operation, shear and anchorage zone reinforcement wasplaced. Stirrups were first tied to the row of stressed strands. The compression steel,consisting of three #9 bars, was then tied to the stirrups along the length of the beam. Tofinalize the mild steel fabrication, anchorage zone reinforcement was placed at the ends ofeach beam. Figure 3.2 is a photograph of the mild steel reinforcement in one of the testbeams.

23
3.4.3 Formwork
Steel rectangular forms owned by the contractor were used for the specimenfabrication. After the bottom of the prestressing bed was lubricated with form oil, eachside form was lowered into place by crane. Once the side pieces had been placed, theywere tied together every few feet using small cross pieces. End forms consisted of simpleplywood cutouts placed at each beam end prior to the stressing of the strands.
Figure 3.2 Mild steel reinforcement
3.4.4 Placement and Curing of Concrete
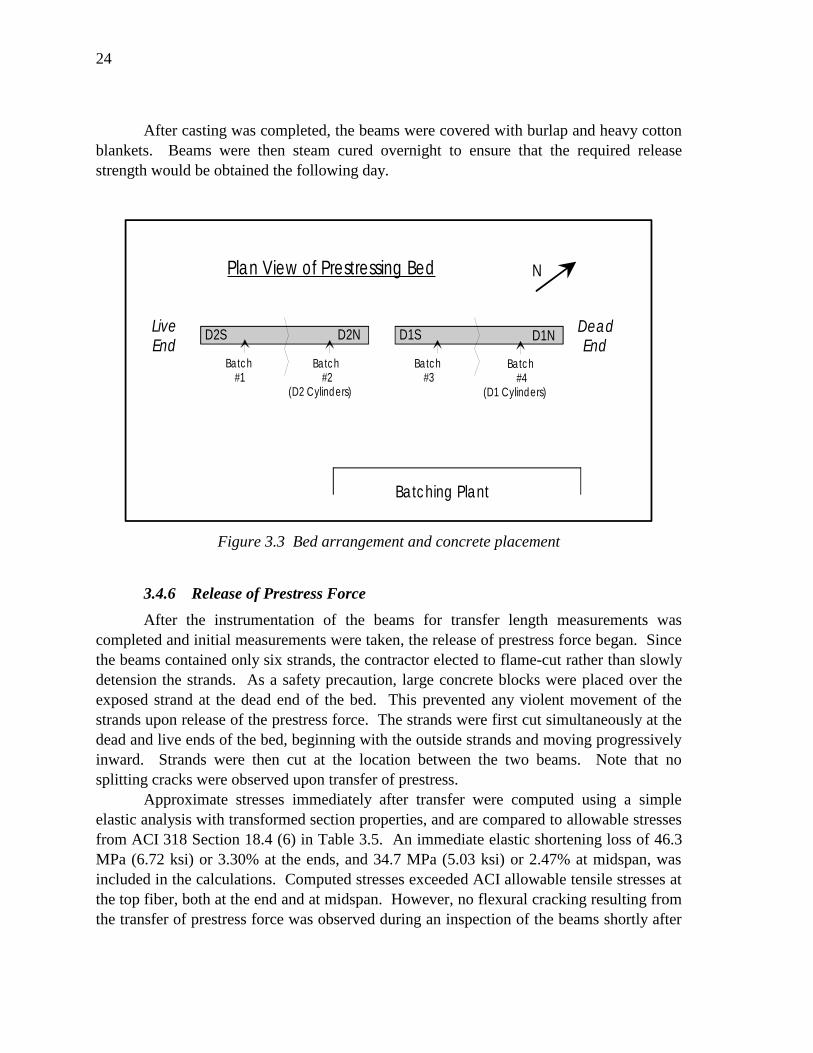
Concrete for the specimens was mixed at the on-site batching plant and transportedin 4-cubic yard buckets to the prestressing bed. Concrete was placed in the beams andvibrated internally. The entire casting required four batches; the first two batches wereplaced in beam D2, and the second two batches were placed in beam D1. Concrete forcompanion cylinders was sampled from the second and fourth batches. The bedarrangement and concrete placement are shown in Figure 3.3.
The concrete was cast between 2:00 p.m. and 2:30 p.m. on December 17, 1993.The weather conditions during casting were cold and rainy, with a temperature ofapproximately 7°C (45°F). Because of the rain, temporary shelters were held over thebeams by cranes during the casting operation.
24
After casting was completed, the beams were covered with burlap and heavy cottonblankets. Beams were then steam cured overnight to ensure that the required releasestrength would be obtained the following day.
Plan View of Prestressing Bed N
D1ND1SD2ND2S
Batch#1
Batch#2
(D2 Cylinders)
Batch#3
Batch#4
(D1 Cylinders)
LiveEnd
DeadEnd
Batching Plant
Figure 3.3 Bed arrangement and concrete placement
3.4.6 Release of Prestress Force
After the instrumentation of the beams for transfer length measurements wascompleted and initial measurements were taken, the release of prestress force began. Sincethe beams contained only six strands, the contractor elected to flame-cut rather than slowlydetension the strands. As a safety precaution, large concrete blocks were placed over theexposed strand at the dead end of the bed. This prevented any violent movement of thestrands upon release of the prestress force. The strands were first cut simultaneously at thedead and live ends of the bed, beginning with the outside strands and moving progressivelyinward. Strands were then cut at the location between the two beams. Note that nosplitting cracks were observed upon transfer of prestress.
Approximate stresses immediately after transfer were computed using a simpleelastic analysis with transformed section properties, and are compared to allowable stressesfrom ACI 318 Section 18.4 (6) in Table 3.5. An immediate elastic shortening loss of 46.3MPa (6.72 ksi) or 3.30% at the ends, and 34.7 MPa (5.03 ksi) or 2.47% at midspan, wasincluded in the calculations. Computed stresses exceeded ACI allowable tensile stresses atthe top fiber, both at the end and at midspan. However, no flexural cracking resulting fromthe transfer of prestress force was observed during an inspection of the beams shortly after

25
transfer. The lack of cracking was probably caused by the presence of compression steeland a factor of safety against cracking inherent in the ACI allowable stresses. According toCarrasquillo et al. (8), the modulus of rupture for high strength concrete is between
8 f and 12 fc c′ ′ . Camber, measured on each side of both beams at midspan using a steel
ruler, is compared to predicted values in Table 3.6.
Table 3.5 Fiber stresses immediately after transfer
Location Computed Stress fromElastic Analysis (1)
MPa (psi)
Allowable Stressfrom ACI 318 (2)
MPa (psi)Top Fiber at Ends -4.73 (-686) -3.63 (-527)
Bottom Fiber at Ends 10.74 (1,557) 31.94 (4,632)Top Fiber at Midspan -1.94 (-282) -1.82 (-264)
Bottom Fiber at Midspan 7.94 (1,152) 31.94 (4,632)
(1) Assumed Eci = 41.4 GPa (6,000 ksi) at transfer in computing elastic losses.(2) Based on cylinder strength of f’ci = 53.2 MPa (7,720 psi) at transfer.Notes: Compressive stresses are positive, tensile stresses are negative. Stresses were computed using transformed section properties.
Table 3.6 Camber immediately after transfer
Calculated Midspan Camber 5.8 mm (0.23 in.)Measured Midspan CamberBeam D1 East Side 3.3 mm (0.13 in.)Beam D1 West Side 4.8 mm (0.19 in.)Beam D2 East Side 2.3 mm (0.09 in.)Beam D2 West Side 5.6 mm (0.22 in.)AVERAGE 4.1 mm (0.16 in.)
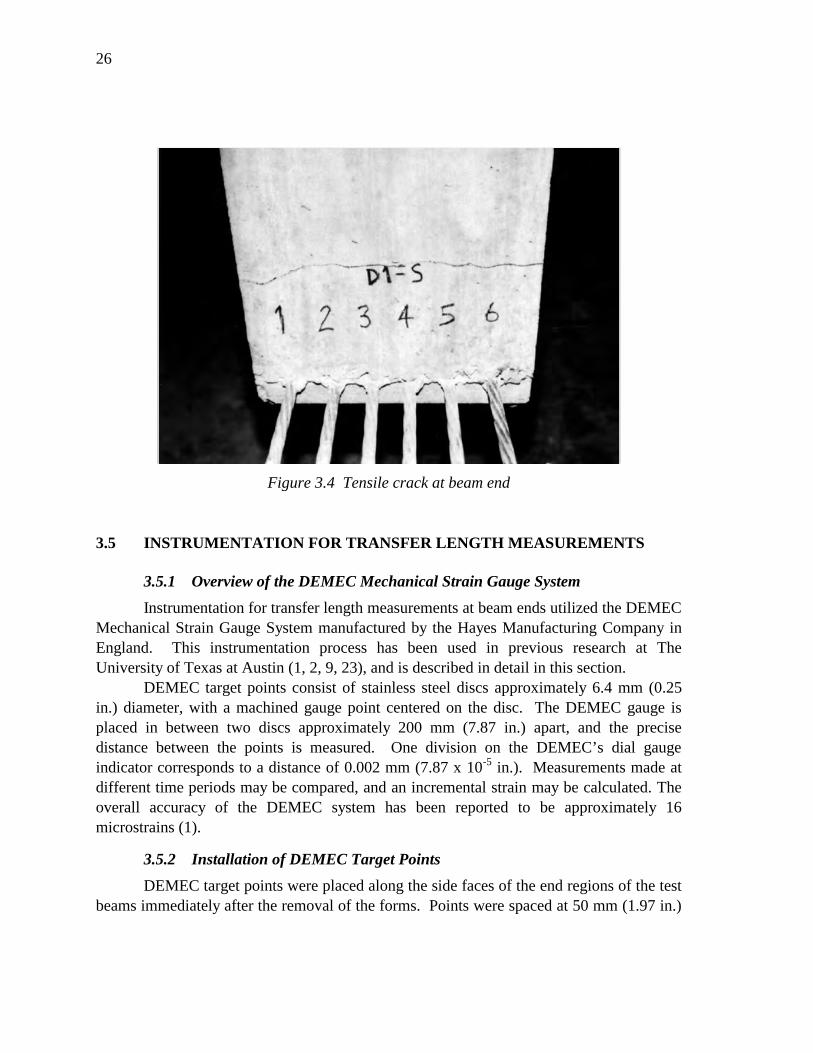
One month after release, a tensile crack was observed on each beam endapproximately 178 mm (7.0 in.) above the level of the strands. Each crack extendedroughly 102 to 152 mm (4 to 6 in.) along each side face of the beam before closing. Thiscrack, which is not structurally significant, is typical of many prestressed concrete beams,and results from a significant principal tensile stress acting perpendicular to the prestressingforce as a result of the flow of compressive stresses in the end region (20). A typical tensilecrack may be seen at a beam end in Figure 3.4.
26
Figure 3.4 Tensile crack at beam end
3.5 INSTRUMENTATION FOR TRANSFER LENGTH MEASUREMENTS
3.5.1 Overview of the DEMEC Mechanical Strain Gauge System
Instrumentation for transfer length measurements at beam ends utilized the DEMECMechanical Strain Gauge System manufactured by the Hayes Manufacturing Company inEngland. This instrumentation process has been used in previous research at TheUniversity of Texas at Austin (1, 2, 9, 23), and is described in detail in this section.
DEMEC target points consist of stainless steel discs approximately 6.4 mm (0.25in.) diameter, with a machined gauge point centered on the disc. The DEMEC gauge isplaced in between two discs approximately 200 mm (7.87 in.) apart, and the precisedistance between the points is measured. One division on the DEMEC’s dial gaugeindicator corresponds to a distance of 0.002 mm (7.87 x 10⁻⁵ in.). Measurements made atdifferent time periods may be compared, and an incremental strain may be calculated. Theoverall accuracy of the DEMEC system has been reported to be approximately 16microstrains (1).
3.5.2 Installation of DEMEC Target Points
DEMEC target points were placed along the side faces of the end regions of the testbeams immediately after the removal of the forms. Points were spaced at 50 mm (1.97 in.)
27
intervals along the level of the strand for a distance of 1.83 m (6.0 ft.) from the beam ends.Approximate point locations were first marked out on all sides using a tape measure. Agroup of four points was then placed using 5-minute epoxy gel and a standard placementbar supplied by the gauge manufacturer. The epoxy was allowed a minimum of 10 minutesto set before the following group of points was installed. This installation procedureensured that distances between each set of points for a single reading remainedapproximately 200 mm (7.87 in.). A total of 304 DEMEC points were installed in about 2hours.
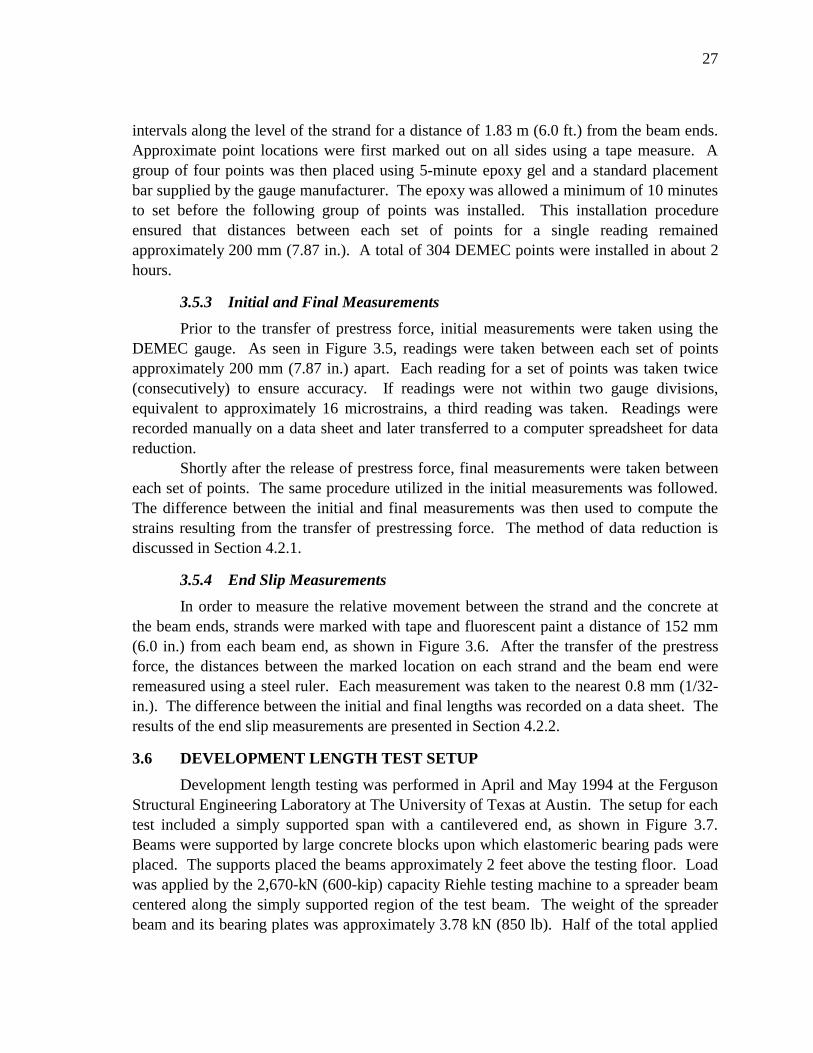
3.5.3 Initial and Final Measurements
Prior to the transfer of prestress force, initial measurements were taken using theDEMEC gauge. As seen in Figure 3.5, readings were taken between each set of pointsapproximately 200 mm (7.87 in.) apart. Each reading for a set of points was taken twice(consecutively) to ensure accuracy. If readings were not within two gauge divisions,equivalent to approximately 16 microstrains, a third reading was taken. Readings wererecorded manually on a data sheet and later transferred to a computer spreadsheet for datareduction.
Shortly after the release of prestress force, final measurements were taken betweeneach set of points. The same procedure utilized in the initial measurements was followed.The difference between the initial and final measurements was then used to compute thestrains resulting from the transfer of prestressing force. The method of data reduction isdiscussed in Section 4.2.1.
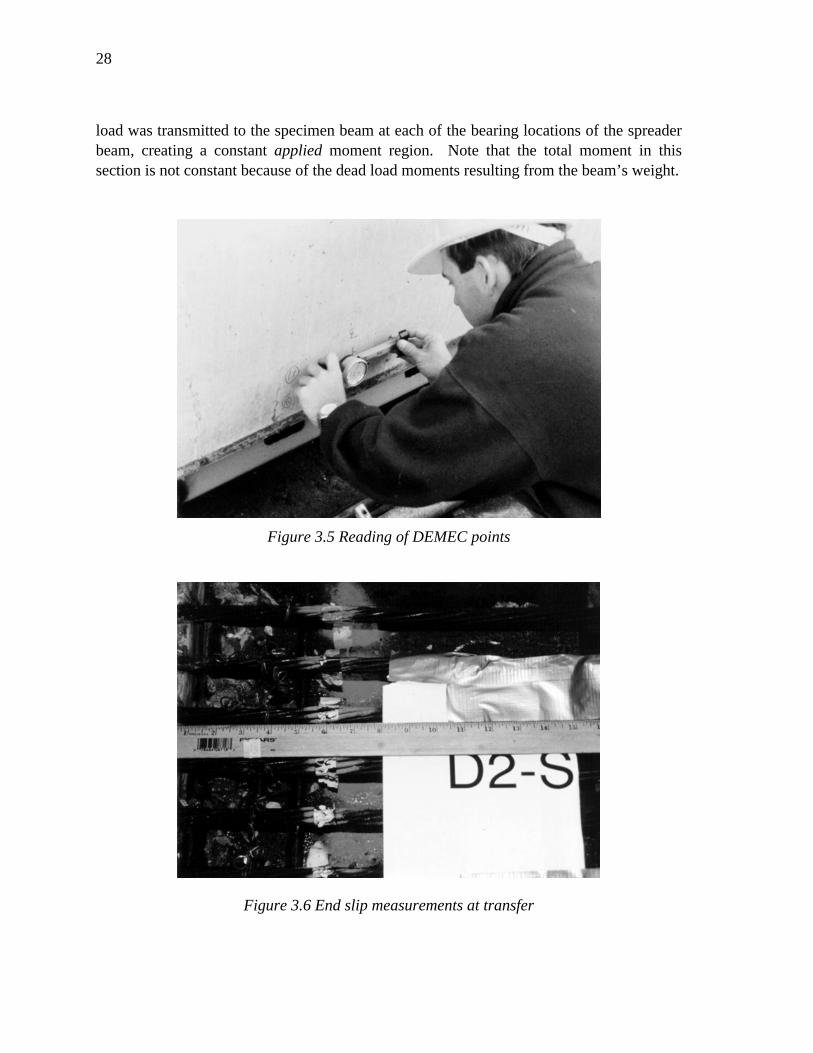
3.5.4 End Slip Measurements
In order to measure the relative movement between the strand and the concrete atthe beam ends, strands were marked with tape and fluorescent paint a distance of 152 mm(6.0 in.) from each beam end, as shown in Figure 3.6. After the transfer of the prestressforce, the distances between the marked location on each strand and the beam end wereremeasured using a steel ruler. Each measurement was taken to the nearest 0.8 mm (1/32-in.). The difference between the initial and final lengths was recorded on a data sheet. Theresults of the end slip measurements are presented in Section 4.2.2.
3.6 DEVELOPMENT LENGTH TEST SETUP
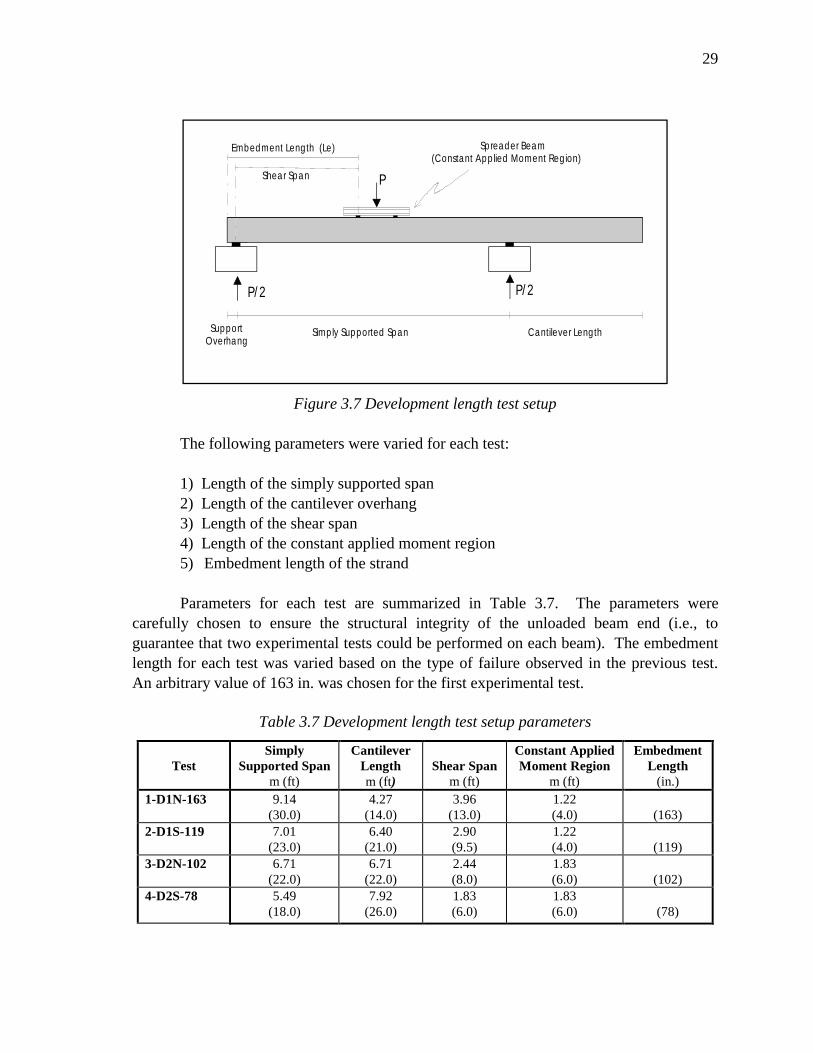
Development length testing was performed in April and May 1994 at the FergusonStructural Engineering Laboratory at The University of Texas at Austin. The setup for eachtest included a simply supported span with a cantilevered end, as shown in Figure 3.7.Beams were supported by large concrete blocks upon which elastomeric bearing pads wereplaced. The supports placed the beams approximately 2 feet above the testing floor. Loadwas applied by the 2,670-kN (600-kip) capacity Riehle testing machine to a spreader beamcentered along the simply supported region of the test beam. The weight of the spreaderbeam and its bearing plates was approximately 3.78 kN (850 lb). Half of the total applied
28
load was transmitted to the specimen beam at each of the bearing locations of the spreaderbeam, creating a constant applied moment region. Note that the total moment in thissection is not constant because of the dead load moments resulting from the beam’s weight.
Figure 3.5 Reading of DEMEC points
Figure 3.6 End slip measurements at transfer
29
P
P/2 P/2
Embedment Length (Le)
Shear Span
Simply Supported Span Cantilever LengthSupportOverhang
Spreader Beam(Constant Applied Moment Region)
Figure 3.7 Development length test setup
The following parameters were varied for each test:
1) Length of the simply supported span2) Length of the cantilever overhang3) Length of the shear span4) Length of the constant applied moment region5) Embedment length of the strand
Parameters for each test are summarized in Table 3.7. The parameters werecarefully chosen to ensure the structural integrity of the unloaded beam end (i.e., toguarantee that two experimental tests could be performed on each beam). The embedmentlength for each test was varied based on the type of failure observed in the previous test.An arbitrary value of 163 in. was chosen for the first experimental test.
Table 3.7 Development length test setup parameters
TestSimply
Supported Spanm (ft)
CantileverLengthm (ft)
Shear Spanm (ft)
Constant AppliedMoment Region
m (ft)
EmbedmentLength
(in.)1-D1N-163 9.14
(30.0)4.27
(14.0)3.96
(13.0)1.22(4.0) (163)
2-D1S-119 7.01(23.0)
6.40(21.0)
2.90(9.5)
1.22(4.0) (119)
3-D2N-102 6.71(22.0)
6.71(22.0)
2.44(8.0)
1.83(6.0) (102)
4-D2S-78 5.49(18.0)
7.92(26.0)
1.83(6.0)
1.83(6.0) (78)
30
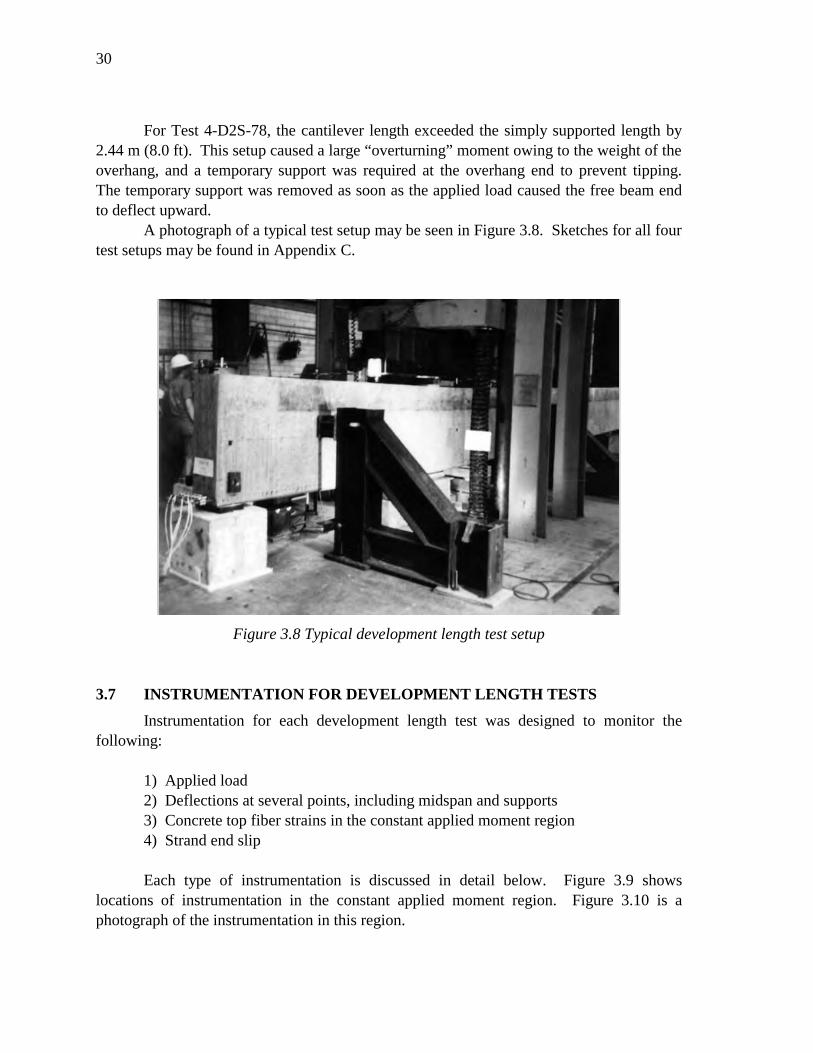
For Test 4-D2S-78, the cantilever length exceeded the simply supported length by2.44 m (8.0 ft). This setup caused a large “overturning” moment owing to the weight of theoverhang, and a temporary support was required at the overhang end to prevent tipping.The temporary support was removed as soon as the applied load caused the free beam endto deflect upward.
A photograph of a typical test setup may be seen in Figure 3.8. Sketches for all fourtest setups may be found in Appendix C.
Figure 3.8 Typical development length test setup
3.7 INSTRUMENTATION FOR DEVELOPMENT LENGTH TESTS
Instrumentation for each development length test was designed to monitor thefollowing:
1) Applied load2) Deflections at several points, including midspan and supports3) Concrete top fiber strains in the constant applied moment region4) Strand end slip
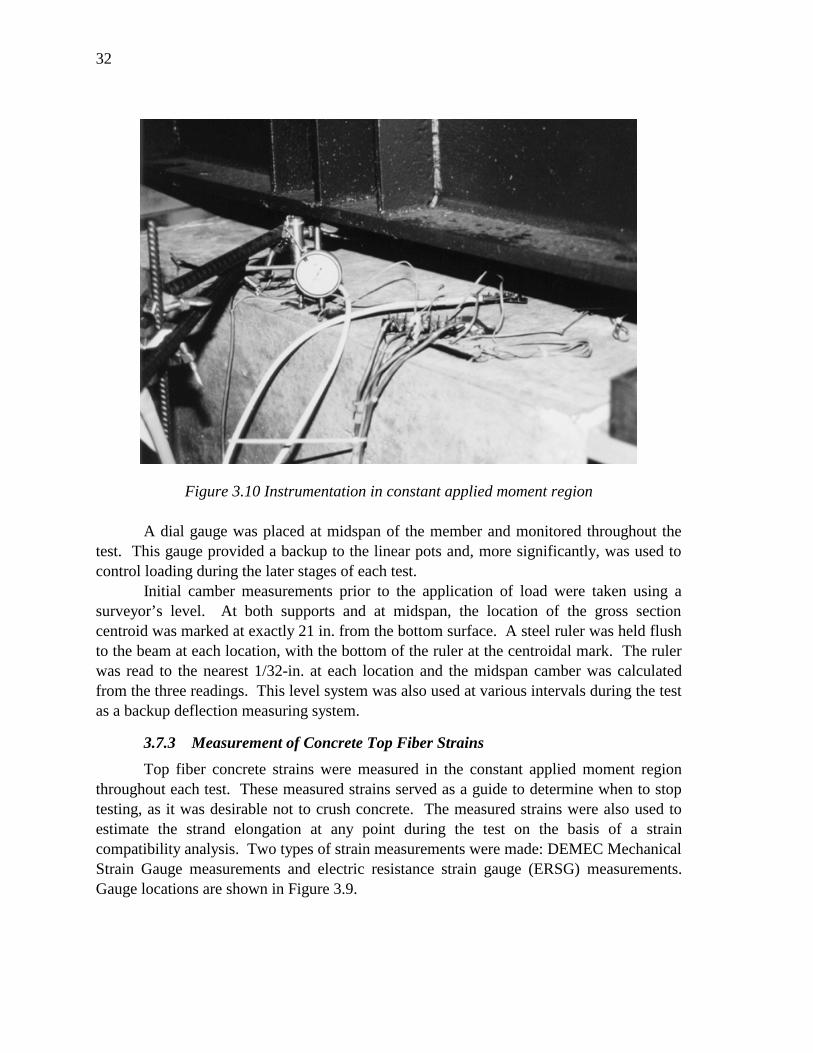
Each type of instrumentation is discussed in detail below. Figure 3.9 showslocations of instrumentation in the constant applied moment region. Figure 3.10 is aphotograph of the instrumentation in this region.
31
3.7.1 Data Acquisition System
Measurements from all electronic gauges were taken using a computerized dataacquisition system comprised of a Hewlett-Packard scanner and an IBM personal computer.Each channel was electronically scanned for a voltage reading as desired. All voltagereadings were later converted to engineering units by the HPDAS2 conversion programwritten by Alex Tahmassebi. Data were formatted for use in a spreadsheet and stored in adisk file.
3.7.2 Load and Deflection Measurements
Applied load was measured using a load cell that is part of the Riehle testingmachine. The load cell was connected to the data acquisition system described in Section3.7.1. Calibration of the load cell was performed approximately one month before testingbegan.
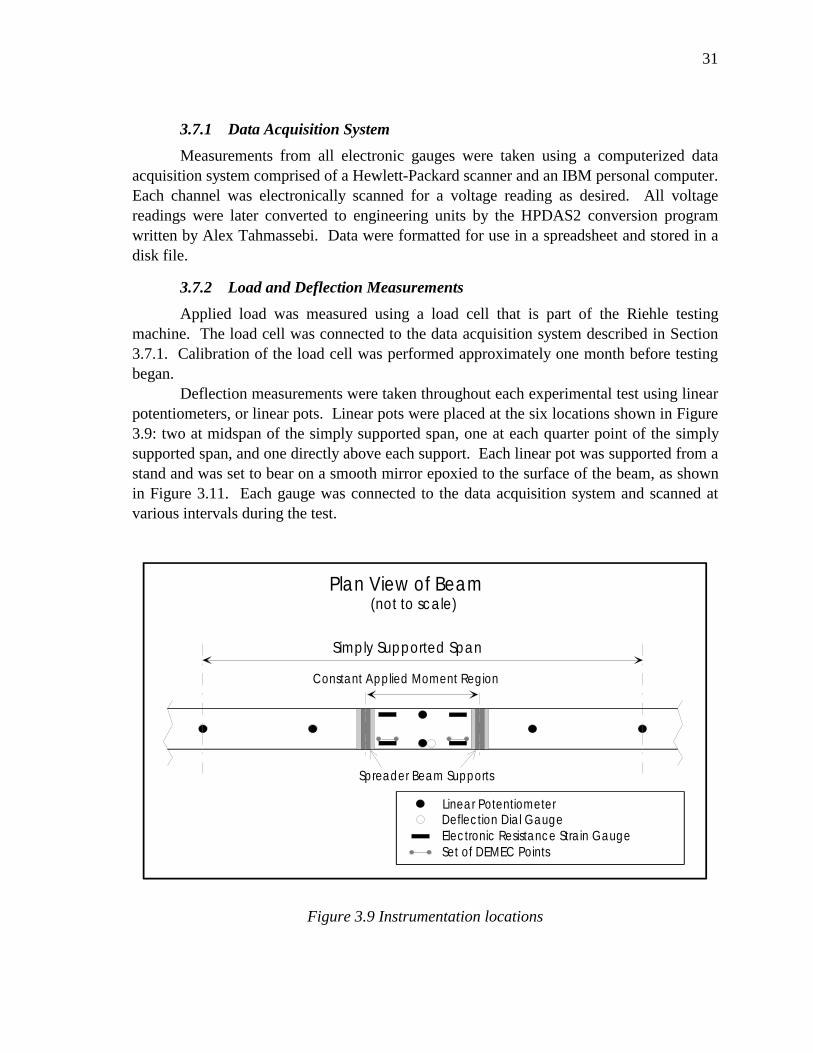
Deflection measurements were taken throughout each experimental test using linearpotentiometers, or linear pots. Linear pots were placed at the six locations shown in Figure3.9: two at midspan of the simply supported span, one at each quarter point of the simplysupported span, and one directly above each support. Each linear pot was supported from astand and was set to bear on a smooth mirror epoxied to the surface of the beam, as shownin Figure 3.11. Each gauge was connected to the data acquisition system and scanned atvarious intervals during the test.
Linear PotentiometerDeflection Dial GaugeElectronic Resistance Strain GaugeSet of DEMEC Points
Spreader Beam Supports
Simply Supported Span
Plan View of Beam(not to scale)
Constant Applied Moment Region
Figure 3.9 Instrumentation locations
32
Figure 3.10 Instrumentation in constant applied moment region
A dial gauge was placed at midspan of the member and monitored throughout thetest. This gauge provided a backup to the linear pots and, more significantly, was used tocontrol loading during the later stages of each test.
Initial camber measurements prior to the application of load were taken using asurveyor’s level. At both supports and at midspan, the location of the gross sectioncentroid was marked at exactly 21 in. from the bottom surface. A steel ruler was held flushto the beam at each location, with the bottom of the ruler at the centroidal mark. The rulerwas read to the nearest 1/32-in. at each location and the midspan camber was calculatedfrom the three readings. This level system was also used at various intervals during the testas a backup deflection measuring system.
3.7.3 Measurement of Concrete Top Fiber Strains
Top fiber concrete strains were measured in the constant applied moment regionthroughout each test. These measured strains served as a guide to determine when to stoptesting, as it was desirable not to crush concrete. The measured strains were also used toestimate the strand elongation at any point during the test on the basis of a straincompatibility analysis. Two types of strain measurements were made: DEMEC MechanicalStrain Gauge measurements and electric resistance strain gauge (ERSG) measurements.Gauge locations are shown in Figure 3.9.

33
Two sets of DEMEC target points were placed in the constant applied momentregion centered approximately 30 mm (12 in.) from each load point. Installation andreading of points were performed using the same procedure described in Section 3.5.Initially, a DEMEC Mechanical Strain Gauge reading was taken manually at every secondload increment. At higher loads, a DEMEC reading was taken at every load increment.
ERSGs were mounted to the top surface of the beam at four locations in theconstant applied moment region. As shown in Figure 3.9, two gauges correspondeddirectly to the location of sets of DEMEC points, and two gauges corresponded to similarlocations on the opposite side of the top surface. ERSGs were connected to the dataacquisition system and scanned at each load increment.
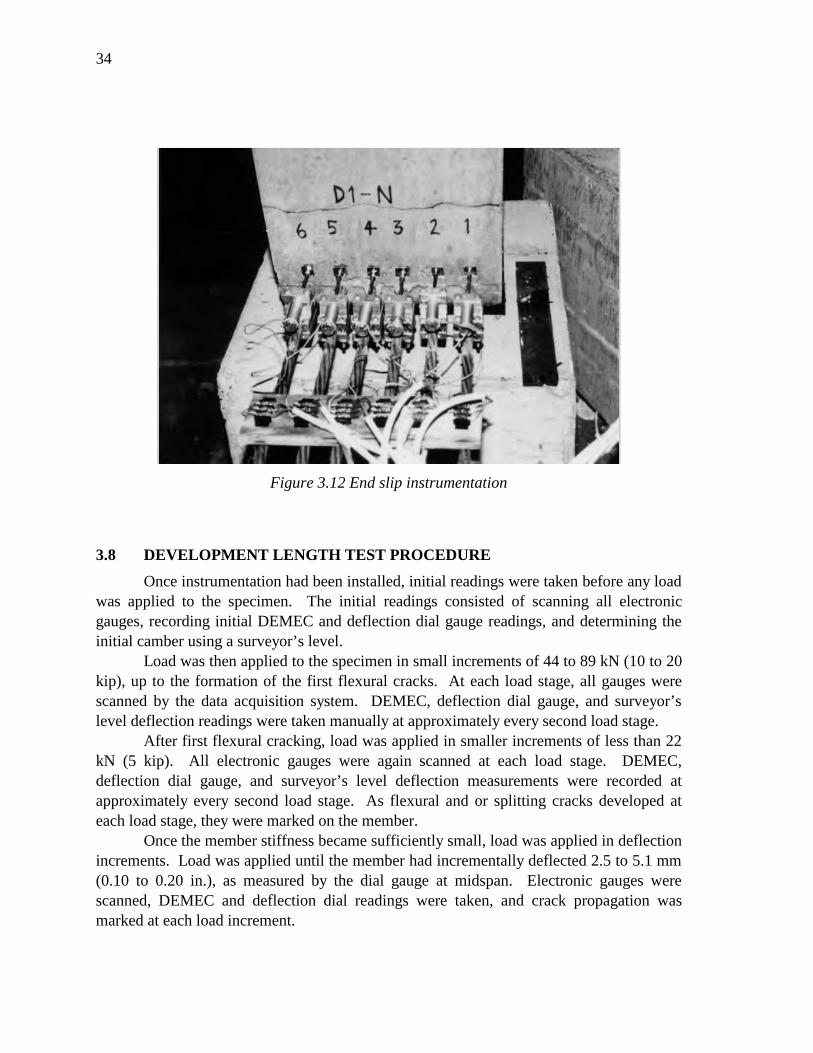
3.7.4 End Slip Measurements
End slip measurements were taken during testing using linear pots. A linear potwas anchored to each strand a few inches from the end of the beam, as seen in Figure 3.12.Small mirrors were epoxied to the concrete surface to provide smooth bearing locations foreach gauge. Each linear pot was connected to the data acquisition system and read at eachload interval. If the strand slipped with respect to the beam end, the linear pot readingwould show the magnitude of the relative displacement.
Figure 3.11 Linear potentiometer
34
Figure 3.12 End slip instrumentation
3.8 DEVELOPMENT LENGTH TEST PROCEDURE
Once instrumentation had been installed, initial readings were taken before any loadwas applied to the specimen. The initial readings consisted of scanning all electronicgauges, recording initial DEMEC and deflection dial gauge readings, and determining theinitial camber using a surveyor’s level.
Load was then applied to the specimen in small increments of 44 to 89 kN (10 to 20kip), up to the formation of the first flexural cracks. At each load stage, all gauges werescanned by the data acquisition system. DEMEC, deflection dial gauge, and surveyor’slevel deflection readings were taken manually at approximately every second load stage.
After first flexural cracking, load was applied in smaller increments of less than 22kN (5 kip). All electronic gauges were again scanned at each load stage. DEMEC,deflection dial gauge, and surveyor’s level deflection measurements were recorded atapproximately every second load stage. As flexural and or splitting cracks developed ateach load stage, they were marked on the member.
Once the member stiffness became sufficiently small, load was applied in deflectionincrements. Load was applied until the member had incrementally deflected 2.5 to 5.1 mm(0.10 to 0.20 in.), as measured by the dial gauge at midspan. Electronic gauges werescanned, DEMEC and deflection dial readings were taken, and crack propagation wasmarked at each load increment.

35
The test continued in this manner until a bond or flexural failure resulted. A bondfailure would show a significant loss in the member’s load capacity, accompanied by anend slip of one or more strands. A flexural failure was acknowledged to have occurredwhen the maximum measured top fiber strain was at least 0.00225. This top fiber straincorresponds to a strand elongation of at least 3.49%, and is clearly indicative of ductilemember behavior. It was desired that spalling of concrete at the top fiber be minimized,both for safety purposes and to preserve the integrity of the beam. This would allow asecond experimental test to be formed on the opposite end of the beam.
Once a bond or flexural failure had occurred, the specimen was unloaded in three orfour load increments. All electronic and manual measurements were made at eachunloading stage. Upon completion of unloading, a detailed crack pattern of the memberwas sketched and all instrumentation was removed. Measurements from the dataacquisition system were loaded onto a floppy disk and stored for later manipulation. Asingle experimental test typically took 7 to 8 hours.

36

37
CHAPTER 4. TEST RESULTS
4.1 INTRODUCTION
The results of both the transfer length measurements and the development lengthtests are included in this chapter. Methods of data reduction are discussed along with thepresentation of the data. All data in this chapter are found in the form of graphical plots.
4.2 TRANSFER LENGTH MEASUREMENTS
4.2.1 Method of Data Reduction
Strain measurements were taken at transfer on each of the four beam ends accordingto the procedure outlined in Section 3.5.3. Raw data values were manually input into acomputer spreadsheet and manipulated according to the procedure described in this section.The data reduction scheme for measured strains is illustrated in Figure 4.1.
First, the two readings for each measurement on a set of DEMEC points wereaveraged. This average was found for both initial and final readings, and the differencebetween the two averages at every set of points was then multiplied by a gauge factor of 8.1to produce a differential strain. This differential strain is the average strain between thetwo given DEMEC points caused by the transfer of prestress force. For simplification, thestrain at the midpoint of any set of two points was assumed to be equivalent to this averagevalue. The differential strain values from one beam face were then averaged with theircorresponding values on the opposite beam face, resulting in a measured strain value at anygiven distance from the beam end.
The measurements are then smoothed to reduce large amounts of variability in thedata. The smoothing process utilizes a running average of three consecutive points andmay be summarized by the equation below (23):
StrainStrain Strain Strain
ii i i=
+ +− +1 1
3
It may be shown that the combined effect of data smoothing and a 200 mm (8 in.)gauge length for raw measurements is that the reported strain at a single point is actually aweighted average of the strain over a 300 mm (12 in.) interval centered around that point.Strain closer to the actual point is weighted more heavily than strain at the edges of theinterval. The effect of smoothing data may be seen in Figure 4.2, which shows the strainprofile for beam end D2S in both smoothed and unsmoothed form. Because of thesmoothing process, the first data point is 175 mm (6.91 in.) from the beam end, eventhough the first DEMEC point was located only 1 in. from the beam end.
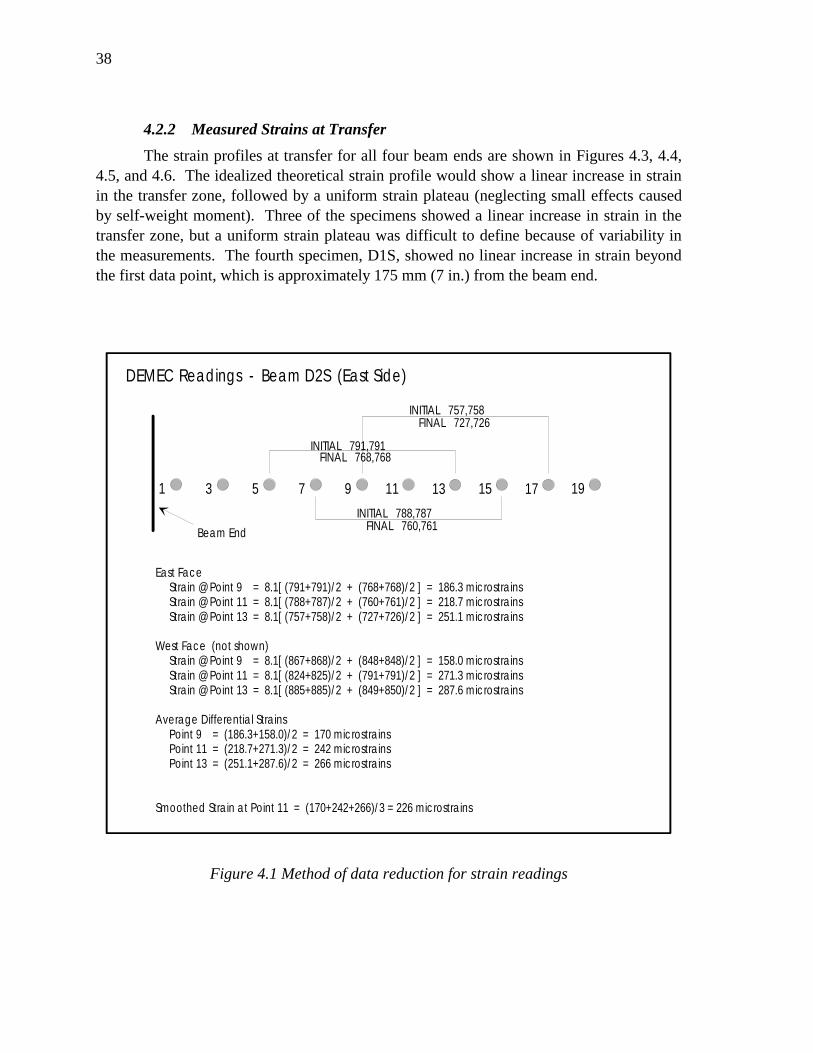
38
4.2.2 Measured Strains at Transfer
The strain profiles at transfer for all four beam ends are shown in Figures 4.3, 4.4,4.5, and 4.6. The idealized theoretical strain profile would show a linear increase in strainin the transfer zone, followed by a uniform strain plateau (neglecting small effects causedby self-weight moment). Three of the specimens showed a linear increase in strain in thetransfer zone, but a uniform strain plateau was difficult to define because of variability inthe measurements. The fourth specimen, D1S, showed no linear increase in strain beyondthe first data point, which is approximately 175 mm (7 in.) from the beam end.
5 7 9 11 13 15 171 3 19
INITIAL 791,791FINAL 768,768
INITIAL 788,787FINAL 760,761
INITIAL 757,758FINAL 727,726
Beam End
DEMEC Readings - Beam D2S (East Side)
East Face Strain @ Point 9 = 8.1[ (791+791)/2 + (768+768)/2 ] = 186.3 microstrains Strain @ Point 11 = 8.1[ (788+787)/2 + (760+761)/2 ] = 218.7 microstrains Strain @ Point 13 = 8.1[ (757+758)/2 + (727+726)/2 ] = 251.1 microstrains
West Face (not shown) Strain @ Point 9 = 8.1[ (867+868)/2 + (848+848)/2 ] = 158.0 microstrains Strain @ Point 11 = 8.1[ (824+825)/2 + (791+791)/2 ] = 271.3 microstrains Strain @ Point 13 = 8.1[ (885+885)/2 + (849+850)/2 ] = 287.6 microstrains
Average Differential Strains Point 9 = (186.3+158.0)/2 = 170 microstrains Point 11 = (218.7+271.3)/2 = 242 microstrains Point 13 = (251.1+287.6)/2 = 266 microstrains
Smoothed Strain at Point 11 = (170+242+266)/3 = 226 microstrains
Figure 4.1 Method of data reduction for strain readings
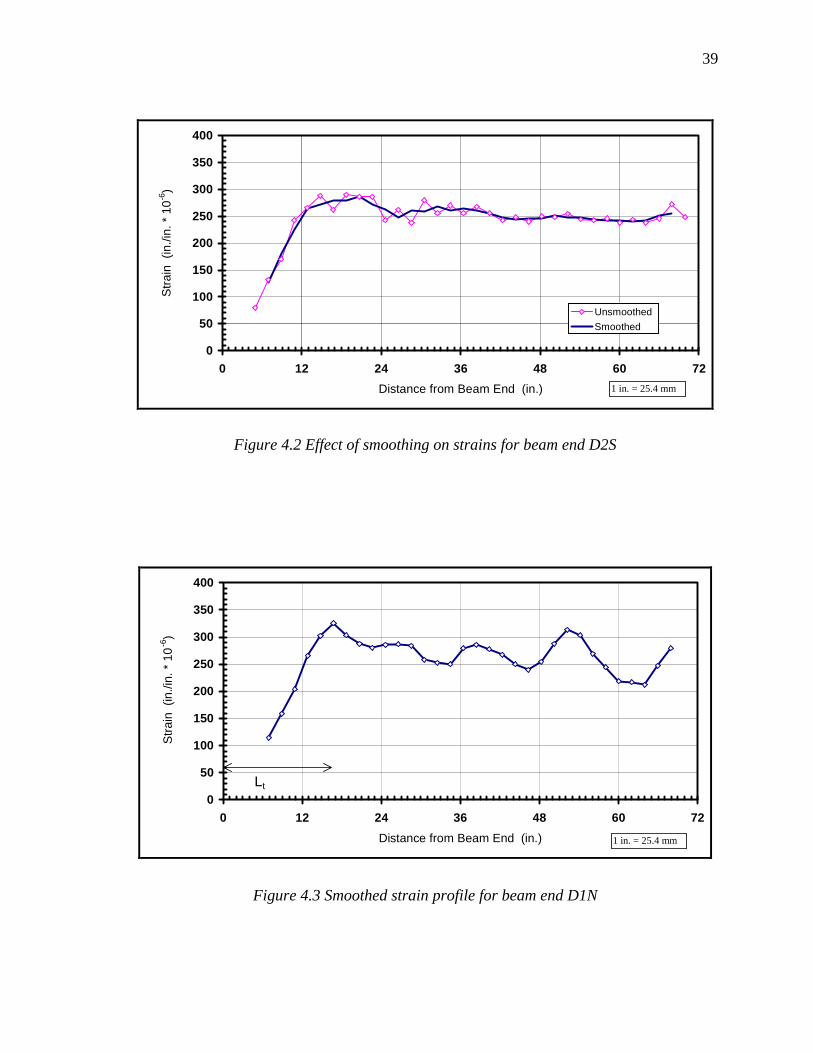
39
0
50
100
150
200
250
300
350
400
0 12 24 36 48 60 72
Distance from Beam End (in.)
Str
ain
(in
./in.
* 1
0-6)
Unsmoothed
Smoothed
1 in. = 25.4 mm
Figure 4.2 Effect of smoothing on strains for beam end D2S
0
50
100
150
200
250
300
350
400
0 12 24 36 48 60 72
Distance from Beam End (in.)
Str
ain
(in
./in.
* 1
0-6
)
1 in. = 25.4 mm
Lt
Figure 4.3 Smoothed strain profile for beam end D1N

40
0
50
100
150
200
250
300
350
400
0 12 24 36 48 60 72
Distance from Beam End (in.)
Str
ain
(in
./in.
* 1
0-6
)
1 in. = 25.4 mm
Figure 4.4 Smoothed strain profile for beam end D1S
0
50
100
150
200
250
300
350
400
0 12 24 36 48 60 72
Distance from Beam End (in.)
Str
ain
(in
./in.
* 1
0-6
)
1 in. = 25.4 mm
Lt
Figure 4.5 Smoothed strain profile for beam end D2N
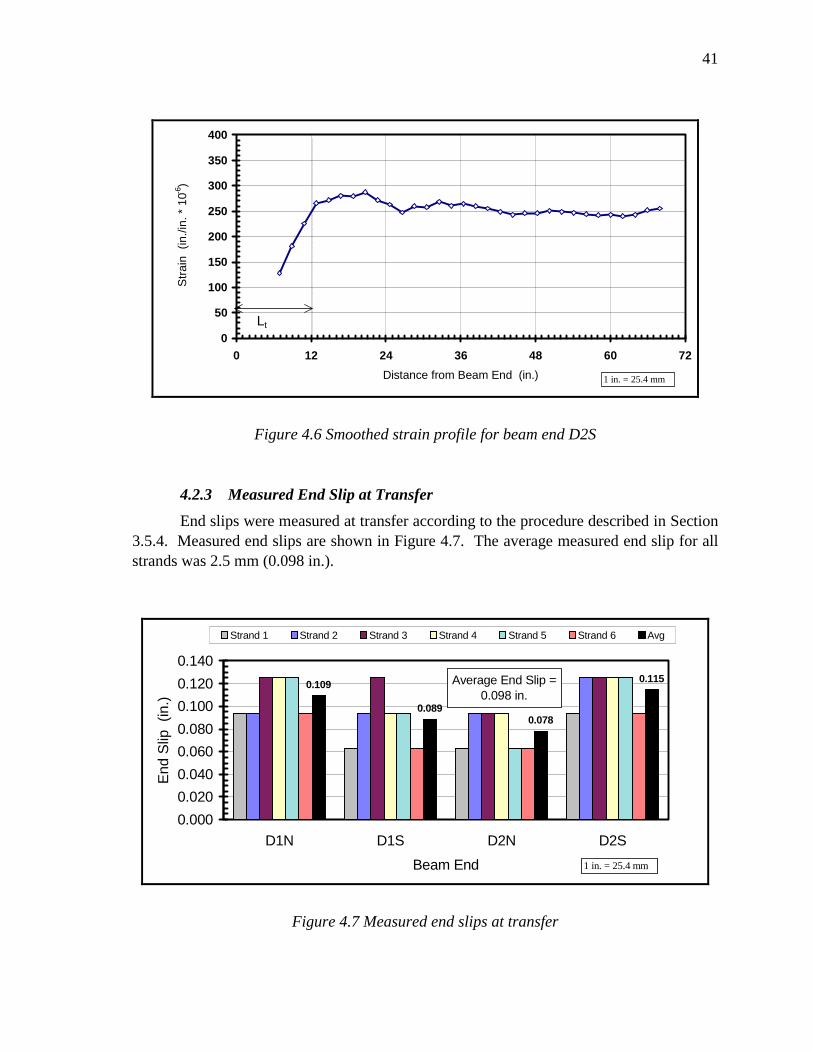
41
0
50
100
150
200
250
300
350
400
0 12 24 36 48 60 72
Distance from Beam End (in.)
Str
ain
(in
./in.
* 1
0-6)
1 in. = 25.4 mm
Lt
Figure 4.6 Smoothed strain profile for beam end D2S
4.2.3 Measured End Slip at Transfer
End slips were measured at transfer according to the procedure described in Section3.5.4. Measured end slips are shown in Figure 4.7. The average measured end slip for allstrands was 2.5 mm (0.098 in.).
0.0890.078
0.1150.109
0.000
0.020
0.040
0.060
0.080
0.100
0.120
0.140
D1N D1S D2N D2S
Beam End
End
Slip
(in
.)
Strand 1 Strand 2 Strand 3 Strand 4 Strand 5 Strand 6 Avg
Average End Slip = 0.098 in.
1 in. = 25.4 mm
Figure 4.7 Measured end slips at transfer
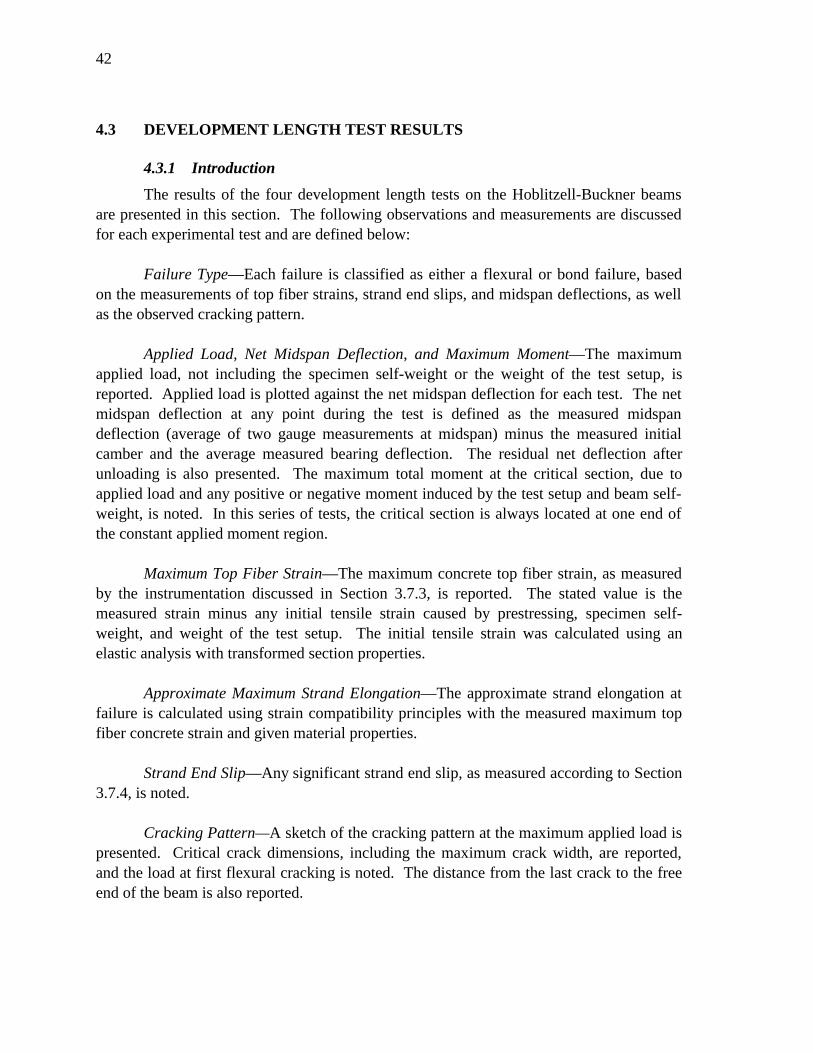
42
4.3 DEVELOPMENT LENGTH TEST RESULTS
4.3.1 Introduction
The results of the four development length tests on the Hoblitzell-Buckner beamsare presented in this section. The following observations and measurements are discussedfor each experimental test and are defined below:
Failure Type—Each failure is classified as either a flexural or bond failure, basedon the measurements of top fiber strains, strand end slips, and midspan deflections, as wellas the observed cracking pattern.
Applied Load, Net Midspan Deflection, and Maximum Moment—The maximumapplied load, not including the specimen self-weight or the weight of the test setup, isreported. Applied load is plotted against the net midspan deflection for each test. The netmidspan deflection at any point during the test is defined as the measured midspandeflection (average of two gauge measurements at midspan) minus the measured initialcamber and the average measured bearing deflection. The residual net deflection afterunloading is also presented. The maximum total moment at the critical section, due toapplied load and any positive or negative moment induced by the test setup and beam self-weight, is noted. In this series of tests, the critical section is always located at one end ofthe constant applied moment region.
Maximum Top Fiber Strain—The maximum concrete top fiber strain, as measuredby the instrumentation discussed in Section 3.7.3, is reported. The stated value is themeasured strain minus any initial tensile strain caused by prestressing, specimen self-weight, and weight of the test setup. The initial tensile strain was calculated using anelastic analysis with transformed section properties.
Approximate Maximum Strand Elongation—The approximate strand elongation atfailure is calculated using strain compatibility principles with the measured maximum topfiber concrete strain and given material properties.
Strand End Slip—Any significant strand end slip, as measured according to Section3.7.4, is noted.
Cracking Pattern—A sketch of the cracking pattern at the maximum applied load ispresented. Critical crack dimensions, including the maximum crack width, are reported,and the load at first flexural cracking is noted. The distance from the last crack to the freeend of the beam is also reported.

43
4.3.2 Test 1-D1N-163
Specimen D1N was tested with an embedment length of 4 m (163 in.), a simplysupported span measuring 9.14 m (30 ft.), and a constant moment region measuring 1.22 m(4 ft.) in length. A flexural failure was observed in this test.
A plot of applied load versus net midspan deflection is shown in Figure 4.8. Loadwas applied until flexural cracking was first observed at which time the beam wascompletely unloaded. Upon reloading, the maximum applied load was 762.4 kN (171.7kip) and the maximum net midspan deflection was 70.6 mm (2.78 in.). The correspondingmaximum moment at the critical section was 1,577 kN-m (1163 ft-kip). After unloading, aresidual net midspan deflection of 15.7 mm (0.62 in.) was measured.
0
25
50
75
100
125
150
175
200
-0.50 0.00 0.50 1.00 1.50 2.00 2.50 3.00
Average Net Midspan Deflection (in.)
App
lied
Load
(ki
p)
1 in. = 25.4 mm1 kip = 4.45 kN
Figure 4.8 Load versus deflection for Test 1-D1N-163
The maximum top fiber concrete strain at the peak load was 0.00245, as measuredby the electronic resistance strain gauge in the southwest corner of the constant momentregion. The approximate strand elongation, based on this top fiber strain, was 3.90%. Nosignificant end slip was measured on any of the six strands at any point during the test.

44
48 in.
40 in. 39 in.
39 in. 39 in.
Constant Moment RegionP/2P/2
A
BBB
Failure Crack PatternDevelopment Length Test # 1
31/2 in. 3 in. 31/2 in. 8 in.31/2 in.6 in.
31/2 in. 8 in.31/4 in.31/4 in.61/2 in.
West Face(Reverse Image)
N
East Face
Bottom Face
W
E
Figure 4.9 Cracking pattern for Test 1-D1N-163
Flexural cracking was first observed at a load of 489 kN (110 kip), with the firstnoticeable loss of member stiffness at 560 kN (126 kip). A sketch of the cracking pattern atultimate load may be found in Figure 4.9. Cracking extended to within 3.12 m (123 in.) ofthe free end of the beam. The maximum crack width was 6.4 mm (0.25 in.). At the peakload, flexural cracks had propagated as high as 76 mm (3 in.) from the top fiber. Crackingwas well distributed in and around the constant applied moment region. Three splittingcracks along the axis of the strand were observed on the bottom face of the beam near thepeak load. Each of these splitting cracks occurred beneath one of the inner strands in theconstant moment region. Measuring less than 300 mm (12 in.) in length, the splittingcracks had no noticeable impact on the beam behavior. A photograph of one of the threelongitudinal splitting cracks may be found in Figure 4.10.

45
Figure 4.10 Longitudinal splitting crack on bottom face (Test 1-D1N-163)
4.3.3 Test 2-D1S-119
Specimen D1S was tested next with an embedment length of 2.98 m (119 in.). Thetest setup included a 7.01 m (23.0 ft) simply supported span and a 1.22 m (4.0 ft) constantapplied moment region. This test resulted in a flexural failure.
The applied load versus net midspan deflection for this test is shown in Figure 4.11.A maximum load of 1,115 kN (250.6 kip) was applied to the specimen, resulting in amaximum net midspan deflection of 61.2 mm (2.41 in.). The maximum moment at thecritical section was 1,597 kN-m (1178 ft-kip). A net deflection of 16.8 mm (0.66 in.)remained after unloading. A photograph of the test specimen under 1,093 kN (245.7 kip)applied load appears in Figure 4.12.
A top fiber concrete strain of 0.00242 was measured at the peak load using aDEMEC mechanical strain gauge in the northeast corner of the constant applied momentregion. The approximate strand elongation based on this top fiber strain was 3.84%. Localconcrete crushing was observed near the north load point at failure and is shown in Figure4.13. None of the six strands showed a significant end slip during the test.
A sketch of the crack pattern for Test 2-D1S-119 is shown in Figure 4.14. Firstflexural cracking occurred at a load of 823 kN (185 kip). Cracking extended to within 1.85m (73 in.) of the free end of the beam. The maximum crack width was measured to be 8.6mm (0.34 in.), and flexural cracks propagated to 64 mm (2.5 in.) from the top fiber of thespecimen. Cracking was well distributed in the constant moment region. A few splittingcracks, similar to those found in Test 1-D1N-163, were observed on the bottom face of thebeam near the maximum applied load.
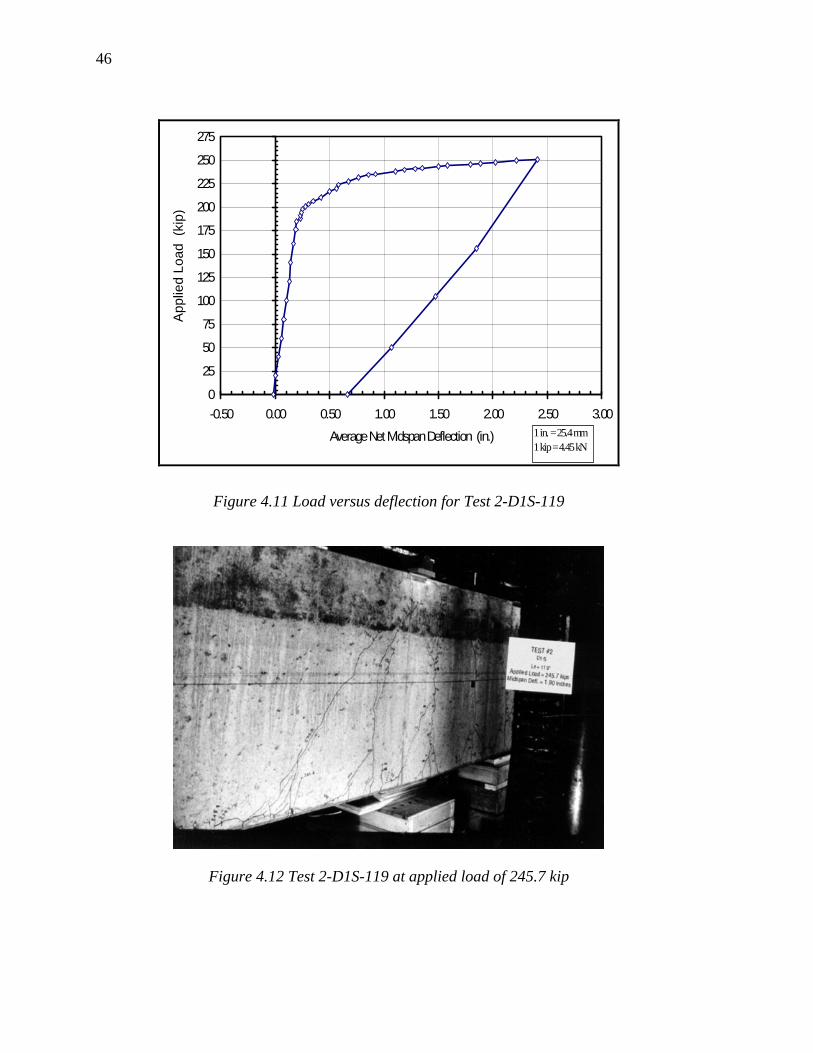
46
0
25
50
75
100
125
150
175
200
225
250
275
-0.50 0.00 0.50 1.00 1.50 2.00 2.50 3.00
Average Net Midspan Deflection (in.)
App
lied
Load
(ki
p)
1 in. = 25.4 mm1 kip = 4.45 kN
Figure 4.11 Load versus deflection for Test 2-D1S-119
Figure 4.12 Test 2-D1S-119 at applied load of 245.7 kip
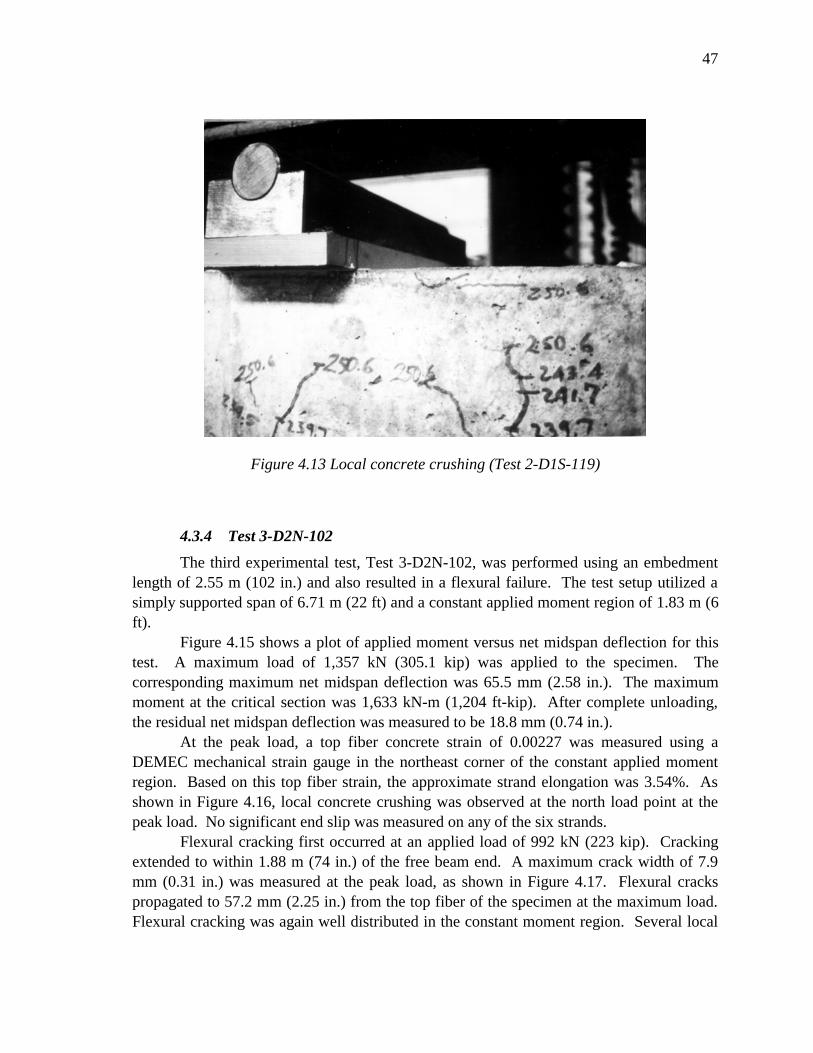
47
Figure 4.13 Local concrete crushing (Test 2-D1S-119)
4.3.4 Test 3-D2N-102
The third experimental test, Test 3-D2N-102, was performed using an embedmentlength of 2.55 m (102 in.) and also resulted in a flexural failure. The test setup utilized asimply supported span of 6.71 m (22 ft) and a constant applied moment region of 1.83 m (6ft).
Figure 4.15 shows a plot of applied moment versus net midspan deflection for thistest. A maximum load of 1,357 kN (305.1 kip) was applied to the specimen. Thecorresponding maximum net midspan deflection was 65.5 mm (2.58 in.). The maximummoment at the critical section was 1,633 kN-m (1,204 ft-kip). After complete unloading,the residual net midspan deflection was measured to be 18.8 mm (0.74 in.).
At the peak load, a top fiber concrete strain of 0.00227 was measured using aDEMEC mechanical strain gauge in the northeast corner of the constant applied momentregion. Based on this top fiber strain, the approximate strand elongation was 3.54%. Asshown in Figure 4.16, local concrete crushing was observed at the north load point at thepeak load. No significant end slip was measured on any of the six strands.
Flexural cracking first occurred at an applied load of 992 kN (223 kip). Crackingextended to within 1.88 m (74 in.) of the free beam end. A maximum crack width of 7.9mm (0.31 in.) was measured at the peak load, as shown in Figure 4.17. Flexural crackspropagated to 57.2 mm (2.25 in.) from the top fiber of the specimen at the maximum load.Flexural cracking was again well distributed in the constant moment region. Several local

48
longitudinal splitting cracks were observed on the bottom face at large applied loads, asshown in the sketched crack pattern in Figure 4.18.
4 3/4 in. 41/2 in.
48 in.Constant Moment RegionP/2
Failure Crack PatternDevelopment Length Test # 2
21/2 in. 3 in. 10 in.3 3/4 in.5 in.West Face
(Reverse Image)
N
East Face
Bottom Face
W
E
P/2
32 in. 36 in.46 in.
18 in.30 in.
30 in.45 in.
41/2 in. 21/2 in. 12 in.5 in. 5 in. 41/2 in.4 in. 3 in.
Figure 4.14 Cracking pattern for Test 2-D1S-119
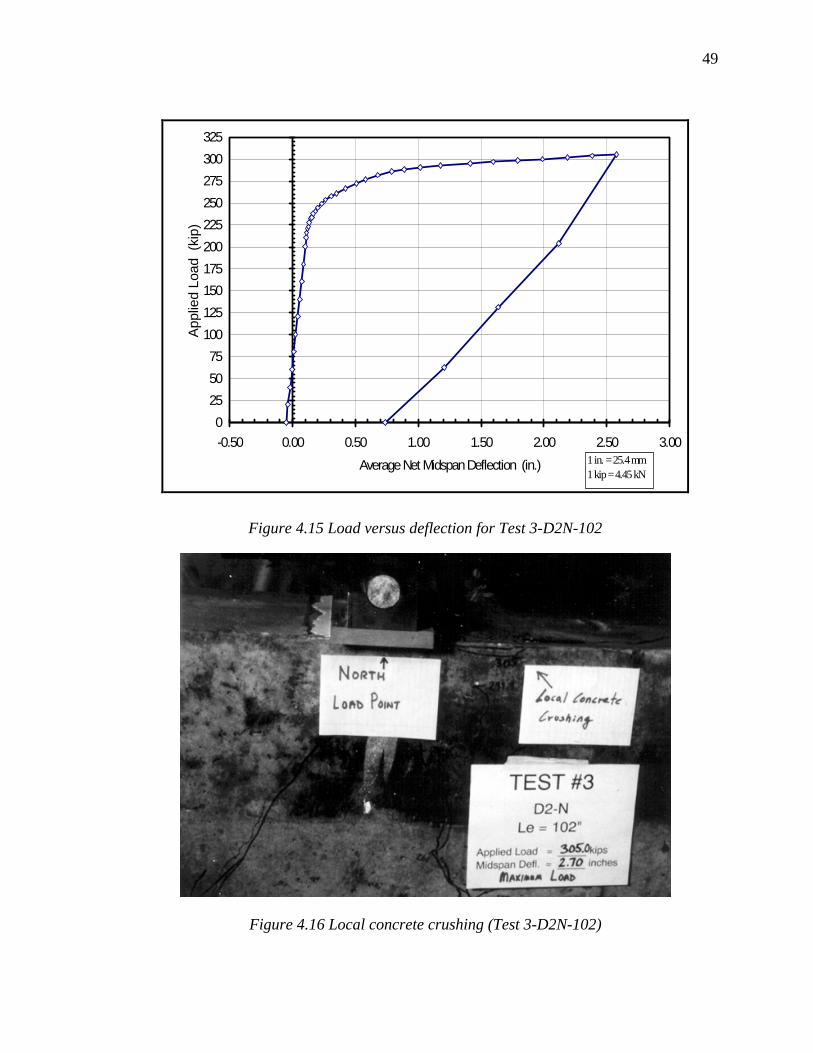
49
0
25
50
75
100
125
150
175
200
225
250
275
300
325
-0.50 0.00 0.50 1.00 1.50 2.00 2.50 3.00
Average Net Midspan Deflection (in.)
App
lied
Load
(ki
p)
1 in. = 25.4 mm1 kip = 4.45 kN
Figure 4.15 Load versus deflection for Test 3-D2N-102
Figure 4.16 Local concrete crushing (Test 3-D2N-102)
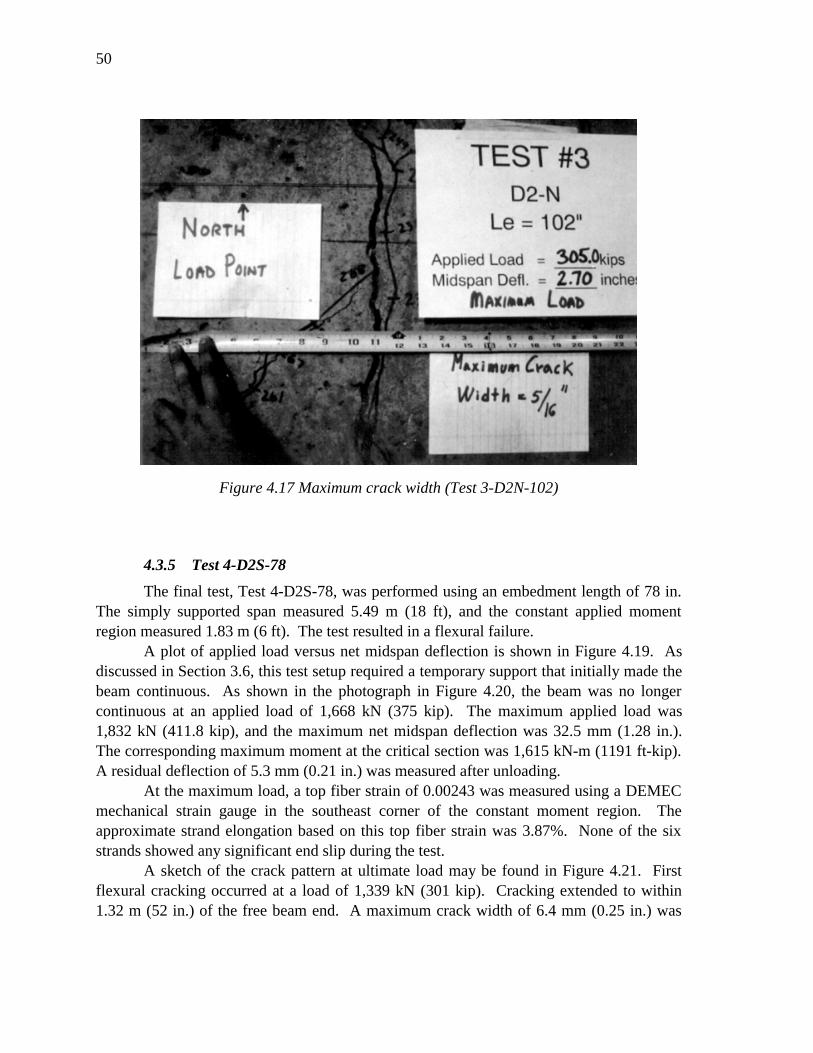
50
Figure 4.17 Maximum crack width (Test 3-D2N-102)
4.3.5 Test 4-D2S-78
The final test, Test 4-D2S-78, was performed using an embedment length of 78 in.The simply supported span measured 5.49 m (18 ft), and the constant applied momentregion measured 1.83 m (6 ft). The test resulted in a flexural failure.
A plot of applied load versus net midspan deflection is shown in Figure 4.19. Asdiscussed in Section 3.6, this test setup required a temporary support that initially made thebeam continuous. As shown in the photograph in Figure 4.20, the beam was no longercontinuous at an applied load of 1,668 kN (375 kip). The maximum applied load was1,832 kN (411.8 kip), and the maximum net midspan deflection was 32.5 mm (1.28 in.).The corresponding maximum moment at the critical section was 1,615 kN-m (1191 ft-kip).A residual deflection of 5.3 mm (0.21 in.) was measured after unloading.
At the maximum load, a top fiber strain of 0.00243 was measured using a DEMECmechanical strain gauge in the southeast corner of the constant moment region. Theapproximate strand elongation based on this top fiber strain was 3.87%. None of the sixstrands showed any significant end slip during the test.
A sketch of the crack pattern at ultimate load may be found in Figure 4.21. Firstflexural cracking occurred at a load of 1,339 kN (301 kip). Cracking extended to within1.32 m (52 in.) of the free beam end. A maximum crack width of 6.4 mm (0.25 in.) was
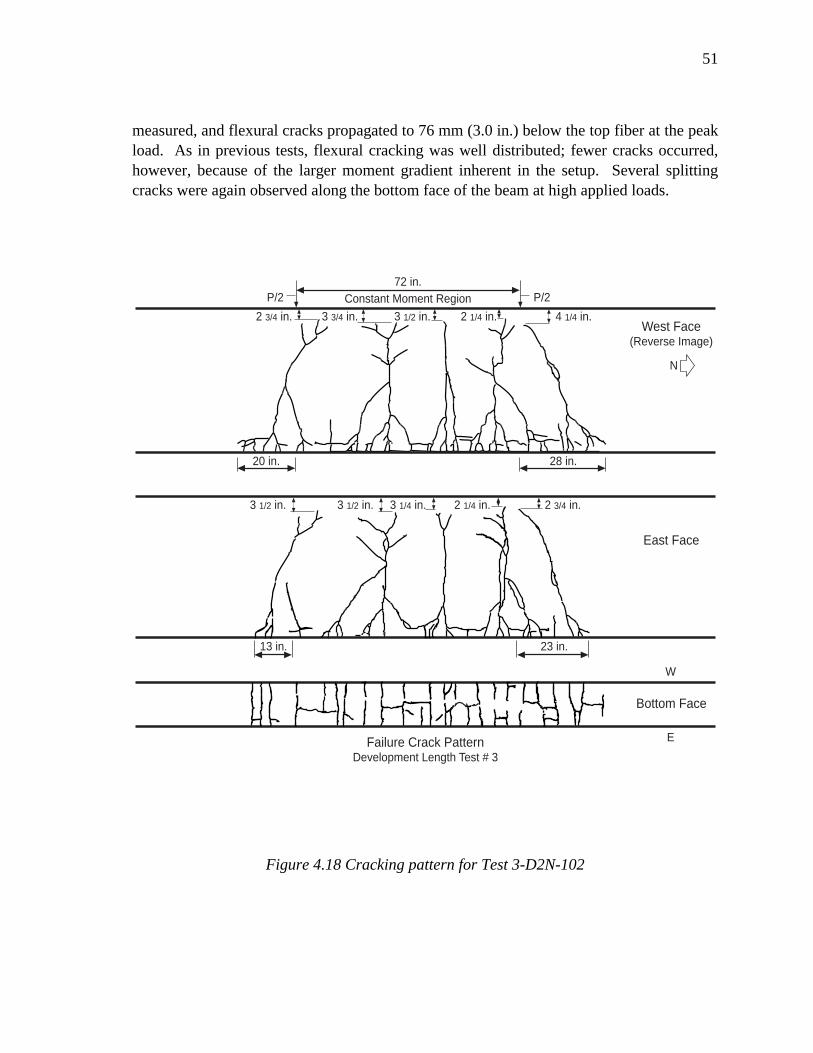
51
measured, and flexural cracks propagated to 76 mm (3.0 in.) below the top fiber at the peakload. As in previous tests, flexural cracking was well distributed; fewer cracks occurred,however, because of the larger moment gradient inherent in the setup. Several splittingcracks were again observed along the bottom face of the beam at high applied loads.
72 in.Constant Moment RegionP/2
Failure Crack PatternDevelopment Length Test # 3
3 1/2 in.2 3/4 in.West Face
(Reverse Image)
N
East Face
Bottom Face
W
E
P/2
3 3/4 in.
20 in.
13 in. 23 in.
2 3/4 in.
28 in.
2 1/4 in. 4 1/4 in.
2 1/4 in.3 1/4 in.3 1/2 in.3 1/2 in.
Figure 4.18 Cracking pattern for Test 3-D2N-102

52
0
50
100
150
200
250
300
350
400
450
-0.50 0.00 0.50 1.00 1.50 2.00
Average Net Midspan Deflection (in.)
App
lied
Load
(ki
p)
1 in. = 25.4 mm1 kip = 4.45 kN
Figure 4.19 Load versus deflection for Test 4-D2S-78
Figure 4.20 Temporary support (Test 4-D2S-78)

53
72 in.Constant Moment RegionP/2
Failure Crack PatternDevelopment Length Test # 4
2 3/4 in.West Face
(Reverse Image)
N
East Face
Bottom Face
W
E
P/2
3 1/2 in.
26 in.
25 in. 23 in.
7 1/2 in.
11 in.
9 1/4 in. 7 1/2 in.
8 in.4 1/2 in.3 in.
8 1/2 in.7 in.
52 in.
53 in.
8 in.
5 1/4 in.
3 1/2 in. 4 1/2in.
Figure 4.21 Cracking pattern for Test 4-D2S-78
4.3.6 Summary of Results
The results of the four experimental development length tests on the Hoblitzell-Buckner beams are summarized in Table 4.1. All four tests resulted in flexural failureswith measured top fiber concrete strains above 0.00225 and approximate steel elongationsabove 3.5%. No significant end slip was measured in any of the four tests. Flexural crackswere well distributed in the constant moment region, and propagated to within 51 to 76 mm(2.0 to 3.0 in.) of the top fiber. Localized, discontinuous, longitudinal splitting cracks werecommon on the bottom face of each test specimen at high applied loads.

54
Table 4.1 Summary of development length test results
Test 1-D1N-163 2-D1S-119 3-D2N-102 4-D2S-78Failure Type Flexural Flexural Flexural FlexuralMax. Applied Load kN (kip)
762.4 (171.7) 1,115 (250.6) 1,357 (305.1) 1,832 (411.8)
Moment at Critical Section kN-m (ft-kip)
1,577 (1,163) 1,597 (1,178) 1,633 (1,204) 1,615 (1,191)
Max. Net Midspan Deflection mm (in.)
70.6 (2.78) 61.2 (2.41) 65.5 (2.58) 32.5 (1.28)
Max. Top Fiber Strain mm/mm or in./in.
0.00245 0.00242 0.00227 0.00243
Approx. Strand Elongation 3.90% 3.84% 3.54% 3.87%

55
CHAPTER 5. DISCUSSION OF TEST RESULTS
5.1 INTRODUCTION
A brief analysis and discussion of the experimental results are presented in thischapter. Measured transfer and development lengths are compared to reported results fromprevious research. The results are also compared with values calculated from severalproposed transfer and development length equations, including those found in theAASHTO and ACI 318 codes. The variables that affected the results of this study arediscussed, and potential sources of error are listed.
5.2 TRANSFER LENGTH MEASUREMENTS
5.2.1 Determination of Transfer Length
A value for transfer length is generally determined from the constructed strainprofile at each beam end. Methods for determining transfer length include the 95%Average Maximum Strain Method (11, 23), the 100% Average Maximum Strain Method(9, 16), and the Slope-Intercept Method (7, 19). All of these methods require a fairly well-defined uniform strain plateau, which was not present in the strain profiles for the beamends in this study shown in Section 4.2.2. These methods were therefore inapplicable.
In this study, transfer lengths were determined by inspection of the strain profile foreach beam end. The transfer length was determined as the length from the beam end atwhich the linearly increasing region of the strain profile ends. Strain profiles for each beamend may be found in Section 4.2.2. Transfer lengths are presented in units of inches forcomparison with previous research and empirical equations presented in the literature.
The transfer length for beam end D1N was thus approximately 17 inches. For beamends D2N and D2S, the transfer length was approximately 13 inches. The transfer lengthfor beam end D1S was indeterminable owing to the lack of a linearly increasing strainregion, though the transfer length is possibly less than 7 inches. The average transfer length,as reported in Table 5.1, is 14.3 inches.
Table 5.1 Transfer lengths for specimen beam ends
Beam End Transfer Length (in.)
D1N 17
D1S N/A (1)
D2N 13
D2S 13
Average Transfer Length 14.3
(1) Transfer length for beam end D1S was indeterminable due to lack of a linearly increasing strain region.

56
5.2.2 Discussion of End Slip Measurements
The measured end slip may be used to approximate transfer length. The elasticshortening of the strand over the 150 mm (6.0 in.) free length is subtracted from themeasured end slip to determine the actual end slip. The transfer length can then bedetermined from the corrected end slip by the equation (23):
LSlip E
ftps
si
=⋅ ⋅2
Transfer lengths based on the average measured end slips for each beam endreported in Section 4.2.3 were computed and are listed in Table 5.2. The average measuredend slip of 2.5 mm (0.098 in.) relates to a computed transfer length of 14.8 inches. Thisvalue correlates extremely well with the average transfer length of 14.3 in. reported inSection 5.2.1. However, since end slips were made only to the nearest 0.8 mm (1/32-in.),the accuracy of this computation is somewhat marginal.
Table 5.2 Calculation of transfer length from measured end slips
Beam End Measured EndSlip
Actual End Slip(1) Lt =
⋅ ⋅2 Slip E
fps
si
D1N 0.109 0.065 17.9
D1S 0.089 0.045 12.4
D2N 0.078 0.034 9.3
D2S 0.115 0.071 19.5
AVERAGE 0.098 0.054 14.8(1) Actual end slip = (Measured end slip) − (elastic shortening)
( )( )Elastic Shortening
f Free Length
Esi
ps
=⋅
= =2037 6
28000044
. .. .
ksi in
ksiin
Note: All values are in inches
1 in. = 25.4 mm
5.2.3 Comparisons with Previous Research
The measured transfer lengths reported by selected researchers are summarized inTable 5.3. Little data are available on the transfer length of 15.2 mm (0.6 in.) diameterstrands in high performance (high strength) concrete. The results of Barrios and Burns (2)and Mitchell et al. (19) are comparable to, though slightly larger than, the average measured

57
transfer length of 14.3 in. in this study. The results of Bruce et al. (4) and Castrodale et al.(9) for 12.7 mm (0.5 in.) strands in high performance concrete also fall into the samegeneral range of low transfer lengths. The transfer lengths reported in those studies thatused 15.2 mm (0.6 in.) diameter strands in normal strength concrete are significantly higherthan the results of this study. Note that the strand condition, an important variable affectingtransfer length, is difficult to quantify in any of these tests. However, in this study and thatof Barrios and Burns (2), the surface condition of the 15.2 mm (0.6 in.) diameter strandswas rusty.
Table 5.3 Reported transfer lengths from previous research
Strand Diametermm (in.)
f’ ci
MPa (psi)Transfer Length
(in.)15.2 mm (0.6 in.) diameter strandsBurdette et al. (1994) (7) 15.2
(0.6)28.3− 37.6
(4,100−5,450) (21−30)Cousins et al. (1990) (10) 15.2
(0.6)32.7−32.8
(4,740−4,750) (44−68) (1)
Cousins et al. (1990) (10) 15.2(0.6)
28.9−32.7(4,190−4,740) (22−39) (2)
Russell and Burns (1993) (23) 15.2(0.6)
26.5−33.0(3,850−4,790) (41)
Lane (1992) (16) 15.2(0.6)
29.9 (4,330)(43) (1)
Lane (1992) (16) 15.2(0.6)
29.9 (4,330)(26) (2)
Kaar et al. (1963) (14) 15.2(0.6)
11.4−34.5(1,660−5,000) (28−52)
High Performance ConcreteBruce et al. (1994) (4) 12.7
(0.5)59.3−70.3
(8,600−10,200) (21)Castrodale et al. (1988) (9) 12.7 (0.5) 64.8 (9,400) (11−19)15.2 mm (0.6 in.) Diameter StrandsAND High Performance Concrete
Barrios and Burns (1994) (2) 15.2(0.6)
54.3−63.0(7,880−9,130) (18−27) (3)
Mitchell et al. (1993) (19) 15.7 (0.62) 47.9 (6,950) (17−21)
1 in. = 25.4 mm(1) Uncoated strands.(2) Epoxy coated strands with grit.(3) Finite element analysis by Baxi (3) reported transfer length of 18 in.
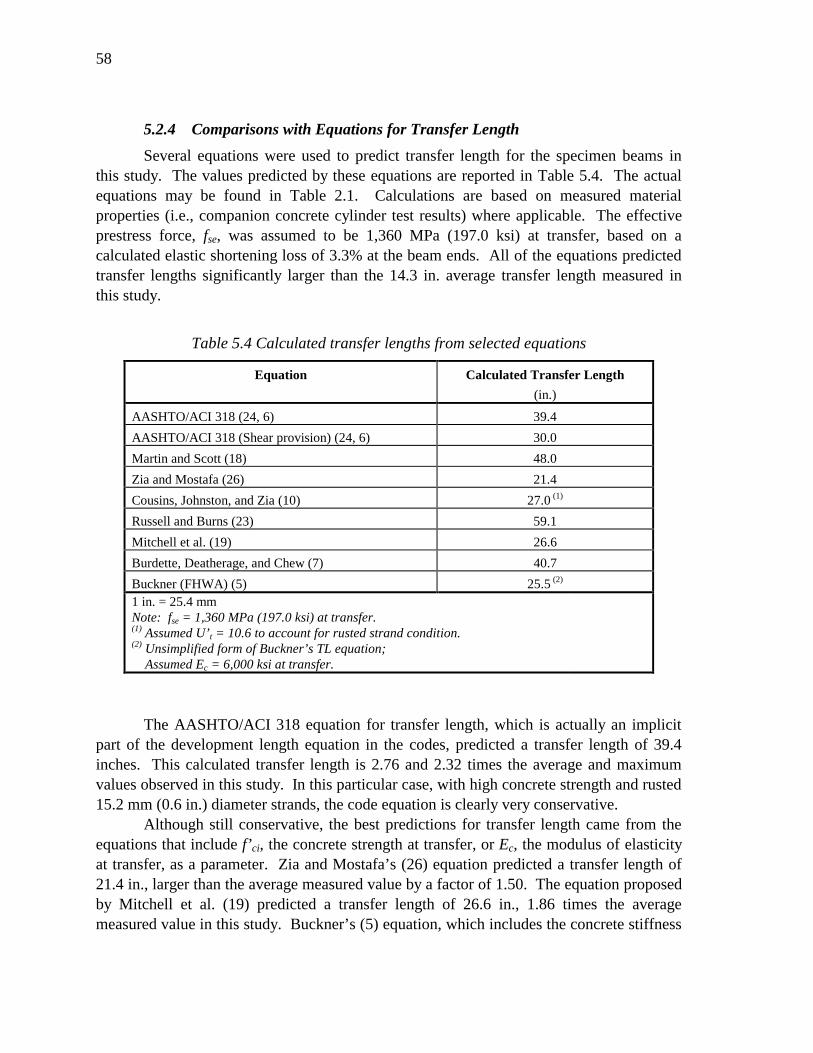
58
5.2.4 Comparisons with Equations for Transfer Length
Several equations were used to predict transfer length for the specimen beams inthis study. The values predicted by these equations are reported in Table 5.4. The actualequations may be found in Table 2.1. Calculations are based on measured materialproperties (i.e., companion concrete cylinder test results) where applicable. The effectiveprestress force, fse, was assumed to be 1,360 MPa (197.0 ksi) at transfer, based on acalculated elastic shortening loss of 3.3% at the beam ends. All of the equations predictedtransfer lengths significantly larger than the 14.3 in. average transfer length measured inthis study.
Table 5.4 Calculated transfer lengths from selected equations
Equation Calculated Transfer Length
(in.)
AASHTO/ACI 318 (24, 6) 39.4
AASHTO/ACI 318 (Shear provision) (24, 6) 30.0
Martin and Scott (18) 48.0
Zia and Mostafa (26) 21.4
Cousins, Johnston, and Zia (10) 27.0 (1)
Russell and Burns (23) 59.1
Mitchell et al. (19) 26.6
Burdette, Deatherage, and Chew (7) 40.7
Buckner (FHWA) (5) 25.5 (2)
1 in. = 25.4 mmNote: fse = 1,360 MPa (197.0 ksi) at transfer.(1) Assumed U’t = 10.6 to account for rusted strand condition.(2) Unsimplified form of Buckner’s TL equation; Assumed Ec = 6,000 ksi at transfer.
The AASHTO/ACI 318 equation for transfer length, which is actually an implicitpart of the development length equation in the codes, predicted a transfer length of 39.4inches. This calculated transfer length is 2.76 and 2.32 times the average and maximumvalues observed in this study. In this particular case, with high concrete strength and rusted15.2 mm (0.6 in.) diameter strands, the code equation is clearly very conservative.
Although still conservative, the best predictions for transfer length came from theequations that include f’ ci, the concrete strength at transfer, or Ec, the modulus of elasticityat transfer, as a parameter. Zia and Mostafa’s (26) equation predicted a transfer length of21.4 in., larger than the average measured value by a factor of 1.50. The equation proposedby Mitchell et al. (19) predicted a transfer length of 26.6 in., 1.86 times the averagemeasured value in this study. Buckner’s (5) equation, which includes the concrete stiffness

59
at transfer, predicted a transfer length of 25.5 in., 1.78 times the measured value. Cousins,Johnston, and Zia’s (10) analytical model, the only equation to include a factor for thestrand condition, predicted a value of 27.0 in., 1.89 times the measured value. Note that theresults of this equation are highly sensitive to the assumption of U’ t, the bond stress factor,which is dependent on the strand condition.
5.2.5 Problems and Sources of Error
The only significant problem in the transfer length measurements in this study wasthe scatter of data and the resulting lack of a well-defined strain plateau. This scatter iseffectively the result of the use of a mechanical concrete surface strain gauge system. Thepossible sources of error that may have contributed to the scatter of data are listed below:
Bonding of DEMEC Target Discs—DEMEC target discs must be fully bonded tothe concrete surface before initial readings are performed. Because of the low ambienttemperature during the installation of points, the epoxy took longer to set than anticipated.As a result, certain points may not have completely bonded before initial readings weretaken.
Temperature Fluctuation—Temperature fluctuations of the concrete surfacebetween readings will induce apparent strains that will be incorporated into measurements.Though the ambient temperature was relatively constant during both sets of readings, thetemperature of the concrete surface was likely changing because of the high temperaturegradient between the beam and the surrounding air. This is especially a problem wheninstrumenting high strength concrete specimens at early ages because of the very highhydration temperatures.
Reading Errors—In an effort to increase repeatability of readings, initial and finalmeasurements on each beam end were read by the same person. However, the DEMECpoints were located approximately 300 mm (12 in.) from the ground, making themeasurements difficult to read. The possibility of reading errors was therefore increased.
As mentioned in Section 3.5.1, the overall accuracy of the DEMEC system isreported to be approximately 16 microstrains (1). The accuracy may have been decreasedby any of these factors.
5.3 DEVELOPMENT LENGTH TESTS
5.3.1 Determination of Development Length
The determination of a value for development length is an iterative procedureinvolving many experimental tests. Identical specimens must be tested with variousembedment lengths and the modes of failure of each experimental test must be noted. The

60
development length is the embedment length at which either flexural or bond failure maytheoretically occur. Tests with embedment lengths longer than the development length willresult in flexural failures, and tests with embedment lengths shorter than the developmentlength will result in bond failures.
In the series of experimental tests in this study, flexural failures were noted forembedment lengths of 163, 119, 102, and 78 in., and no bond failures were observed. As aresult, an exact value for development length could not be determined. It can only be statedthat for this test series the development length is less than 78 in.
5.3.2 Discussion of Moment Capacities
The ultimate moment capacity of the specimen cross section was calculated usingtwo methods: the ACI 318 method (6), and a strain compatibility analysis. The momentcapacity calculated using ACI 318 Equation (18-3), which is similar to AASHTO Equation(9-17), and a rectangular stress block approach is 4,644 kN-m (1,044 ft-kip). With theinclusion of a strength reduction factor of 0.90, the ACI moment capacity becomes 4,179kN-m (940 ft-kip). Based on the strain compatibility analysis, the ultimate momentcapacity is 5,206 kN-m (1,171 ft-kip). A complete moment-curvature analysis for thespecimen cross section, based on the strain compatibility approach, may be found inAppendix D.
The maximum total moment for each test, Mtest, and a comparison to calculatedmoment capacities may be found in Table 5.5. The maximum total moment for each test isthe algebraic sum of the moment due to applied loads, moment caused by the test setup(i.e., spreader beam and bearing plates), and the beam self-weight.
Table 5.5 Measured and predicted moment capacities for development length tests
Test
Mtest (1)
kN-m(ft-kip)
Mu ACI,
kN-m(ft-kip)
M
Mtest
u ACI,
φMu ACI,
kN-m(ft-kip)
M
Mtest
u ACIφ ,
Mu analysis,
kN-m(ft-kip)
M
Mtest
u analysis,
1-D1N-163 5,173
(1,163)
4,644
(1,044)1.11
4,179
(940)1.24
5,206
(1,171)0.99
2-D1S-119 5,240
(1,178)
4,644
(1,044)1.13
4,179
(940)1.25
5,206
(1,171)1.01
3-D2N-102 5,355
(1,204)
4,644
(1,044)1.15
4,179
(940)1.28
5,206
(1,171)1.03
4-D2S-78 5,298
(1,191)
4,644
(1,044)1.14
4,179
(940)1.27
5,206
(1,171)1.02
(1) Mtest includes applied load, self-wt., and test setup moments.
Note: Mu,ACI is calculated using ACI Eq. 18-3, which is similar to AASHTO Eq. 9-17.
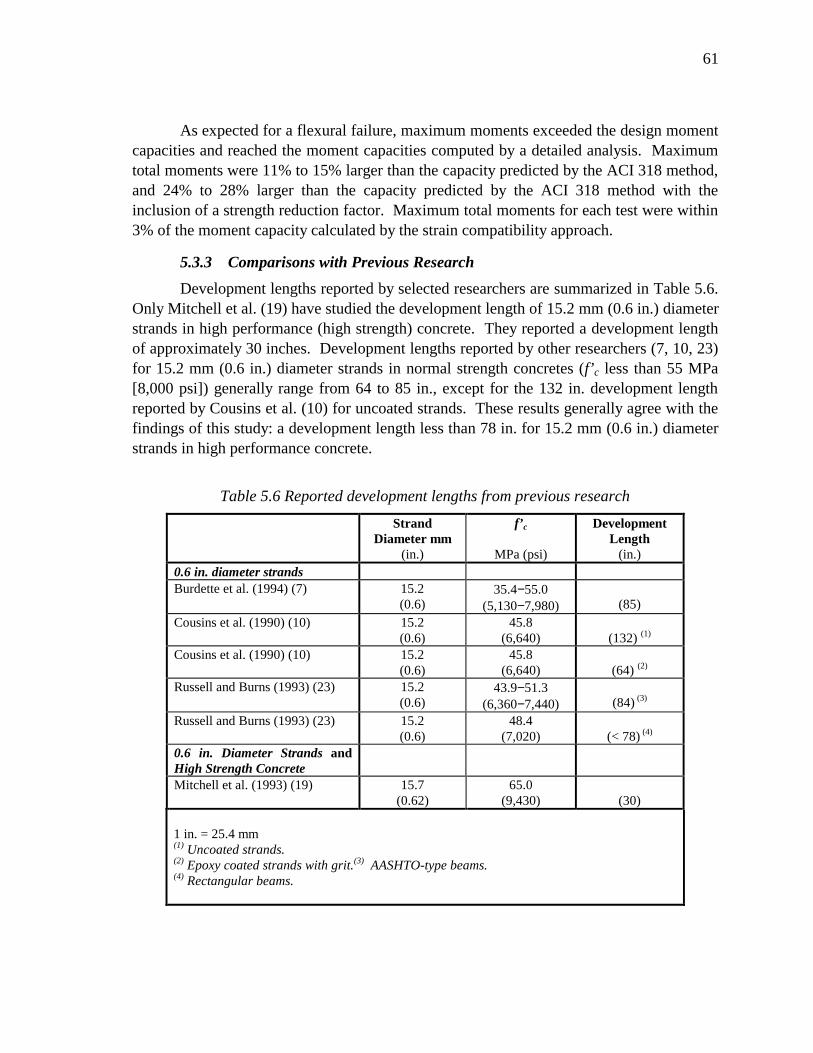
61
As expected for a flexural failure, maximum moments exceeded the design momentcapacities and reached the moment capacities computed by a detailed analysis. Maximumtotal moments were 11% to 15% larger than the capacity predicted by the ACI 318 method,and 24% to 28% larger than the capacity predicted by the ACI 318 method with theinclusion of a strength reduction factor. Maximum total moments for each test were within3% of the moment capacity calculated by the strain compatibility approach.
5.3.3 Comparisons with Previous Research
Development lengths reported by selected researchers are summarized in Table 5.6.Only Mitchell et al. (19) have studied the development length of 15.2 mm (0.6 in.) diameterstrands in high performance (high strength) concrete. They reported a development lengthof approximately 30 inches. Development lengths reported by other researchers (7, 10, 23)for 15.2 mm (0.6 in.) diameter strands in normal strength concretes (f’ c less than 55 MPa[8,000 psi]) generally range from 64 to 85 in., except for the 132 in. development lengthreported by Cousins et al. (10) for uncoated strands. These results generally agree with thefindings of this study: a development length less than 78 in. for 15.2 mm (0.6 in.) diameterstrands in high performance concrete.
Table 5.6 Reported development lengths from previous research
StrandDiameter mm
(in.)
f’ c
MPa (psi)
DevelopmentLength
(in.)0.6 in. diameter strandsBurdette et al. (1994) (7) 15.2
(0.6)35.4−55.0
(5,130−7,980) (85)Cousins et al. (1990) (10) 15.2
(0.6)45.8
(6,640) (132) (1)
Cousins et al. (1990) (10) 15.2(0.6)
45.8(6,640) (64) (2)
Russell and Burns (1993) (23) 15.2(0.6)
43.9−51.3(6,360−7,440) (84) (3)
Russell and Burns (1993) (23) 15.2(0.6)
48.4(7,020) (< 78) (4)
0.6 in. Diameter Strands andHigh Strength ConcreteMitchell et al. (1993) (19) 15.7
(0.62)65.0
(9,430) (30)
1 in. = 25.4 mm(1) Uncoated strands.(2) Epoxy coated strands with grit.(3) AASHTO-type beams.(4) Rectangular beams.

62
5.3.4 Comparisons with Equations for Development Length
Development length for the Hoblitzell-Buckner beams was predicted using severalequations. Calculated development lengths are summarized in Table 5.7. The actualequations are listed in Table 2.1. Since almost all of the equations significantly depend onthe assumed value of fps, the ultimate stress in the strands, two calculations were performedwith each equation. The first calculation assumed fps = 1,725 MPa (250.2) ksi, the valuecalculated by ACI 318 Equation (18-3). The second calculation assumed fps = 1,917 MPa(278.0 ksi), the ultimate stress in the strands calculated by a strain compatibility analysisbased on measured material properties. For all calculations, the effective prestress forcewas assumed to be 1,264 MPa (183.3 ksi), based on prestress losses of 10% at the time oftesting, calculated by the PCI General Method (21).
Table 5.7 Calculated development lengths from selected equations
EquationCalculated Development
Lengthfps = 250.2 ksi
(in.)
Calculated DevelopmentLength
fps = 278.0 ksi(in.)
AASHTO/ACI 318(24, 6) 79.5 96.2Martin and Scott (18) 158.8 201.5Zia and Mostafa (26) 86.4 86.4Cousins, Johnston, and Zia (10) 41.8 (1) 47.9 (1)
Mitchell et al. (19) 50.1 59.8Burdette, Deatherage, and Chew (7) 100.9 125.9Buckner (FHWA) (5) 105.8 (2) 139.11 in. = 25.4 mmNote: fse = 1264 MPa (183.3 ksi) at time of flexural testing.(1) Assumed U’d = 4.55 to account for rusted strand condition.(2) λ=2.0 for both cases; TL calculated using unsimplified equation (see Table 2.1).
The AASHTO/ACI 318 equation for development length predicted a value of 79.5in. for fps = 1,725 MPa (250.2 ksi). This value is conservative compared to the results ofthis study, though the exact factor of safety is unknown. The calculated developmentlength using the AASHTO/ACI 318 equation and fps = 1,917 MPa (278.0 ksi) was 96.2inches. This value predicts the length of bond required to develop the actual stress in thestrands at failure. This calculation is therefore more physically representative of thedevelopment length and is conservative by at least a factor of 1.23.
Calculated values for development length using other equations exhibited a largedegree of scatter. Predicted development lengths ranged from 41.8 inches to 201.5 inches.The predicted development lengths from those equations that considered the effect ofconcrete strength (10, 19) ranged from 41.8 inches to 59.8 inches. It is impossible todetermine the degree, if any, to which these equations are conservative.

63
Note that both the Burdette et al. (7) and Buckner (5) equations predict conservativevalues for development length compared to the measured values. Both equationsessentially take the form of the AASHTO/ACI 318 equation, with a multiplier greater than1.0 applied to the flexural bond length term. Since the AASHTO/ACI 318 equation isconservative to some degree, both the Burdette et al. and Buckner equations are clearlyconservative with respect to the results of this study.
5.3.5 Problems and Sources of Error
The main deficiency in the test program was the inability to determine an exactvalue for development length. It would have been desirable to have at least one bondfailure out of the four tests, so that a lower bond for the development length might beobtained. Unfortunately, tests performed with embedment lengths much lower than 78 in.would have fallen into the category of deep beams, since the depth of the cross section was42 inches. This would have made the results of such tests questionable.
Significant measurement errors did not occur during the four development lengthtests. The only source of error occurred in the measurement of maximum top fiber concretestrains, as the measured maximum strains generally did not coincide with crack locations.The actual maximum top fiber strains, which would occur at the crack locations, maytherefore have been somewhat higher than the reported values. Each test was stopped whenthe actual top fiber strain was felt to be very close to the crushing strain.
5.4 EFFECT OF VARIABLES
The effect of several variables on transfer and development length is discussed inSection 2.4. This study examined one specific combination of these variables. Largediameter strands (15.2 mm or 0.6 in.), with high initial prestress (1,404 MPa or 203.7 ksi)and flame-cut at release, would generally be expected to produce high transfer anddevelopment lengths. However, these effects were apparently outweighed in this case bythe effects owing to high concrete strength (f’ ci = 48.5 MPa [7,040 psi] and f’ c = 90.7 MPa[13,160 psi]) and a rusted strand condition, resulting in a very low average transfer length(14.3 in.), and a reasonably short development length (less than 78 in.). These resultsverify the potential benefits of high performance concrete and roughened strand conditionsfor transfer and development length. Although the benefits of high concrete strength maybe incorporated into empirical equations, once sufficient data are available the benefitscaused by roughened strand conditions may be difficult to quantify.

64

65
CHAPTER 6. SUMMARY AND CONCLUSIONS
6.1 SUMMARY
This study examined the transfer and development length of 15.2 mm (0.6 in.)diameter prestressing strands at 51 mm (2.0 in.) spacing in fully bonded high strengthrectangular beams. Specimen beams, called the Hoblitzell-Buckner beams, were 1,067 mm(42 in.) deep and 356 mm (14 in.) wide, and contained six 15.2 mm (0.6 in.) diameterstrands at 51 mm (2.0 in.) spacing and cover. Nonprestressed compression reinforcementwas provided in the specimens in the form of three #9 top bars, to raise the neutral axis inbending and to induce high strains in the strand. Concrete strengths were 48.5 MPa (7,040psi) at transfer and 90.7 MPa (13,160 psi) at the time of development length testing. Thestrand condition was weathered or rusty.
Transfer length was determined by constructing a concrete strain profile at the levelof the strand at transfer. The strain profile was constructed using the DEMEC mechanicalstrain gauge system in which small stainless steel discs are bonded to the concrete surfaceand small changes in distance between the points, or strains, are read using a mechanicalstrain gauge. All instrumentation and measurements for transfer length were performedduring the fabrication process at the prestressing plant.
Development length was measured through an iterative process involving four full-scale flexural tests performed at the Phil M. Ferguson Structural Engineering Laboratory atThe University of Texas at Austin. The Hoblitzell-Buckner beams were loaded withvarious embedment lengths, and the mode of failure in each test was monitored. Appliedload, deflections, end slips, and top fiber concrete strains were measured continuouslythroughout each test. Crack patterns were documented in detail.
6.2 CONCLUSIONS
The following conclusions were drawn from this study:
1) The average transfer length for the 15.2 mm (0.6 in.) diameter strands in highperformance concrete with a rusty surface condition is 14.3 inches.
2) The development length for the 15.2 mm (0.6 in.) diameter strands in highperformance concrete with a rusty surface condition is less than 78 inches.
3) The AASHTO/ACI 318 Code equations for transfer and development length areconservative in this case. The code prediction for transfer length is conservativeby a factor of 2.76. The degree to which the development length equation isconservative cannot be determined.
4) All proposed transfer length equations selected from the literature areconservative compared with the results of this study. Many of the developmentlength equations proposed in the literature are conservative.

66
5) The following parameters significantly reduced transfer and development lengthin this study: high concrete strengths and rusted strand conditions.
6) Little data are available on transfer and development length of 15.2 mm (0.6 in.)diameter strands in high performance concrete. Significant amounts of researchare needed as the use of these materials becomes standard in practice.
67
REFERENCES
1. Arrellaga, J. A., “Instrumentation Systems for Post-Tensioned Segmental Box GirderBridges,” Master’s Thesis, The University of Texas at Austin, December 1991.
2. Barrios, A. O., “Behavior of High Strength Concrete Pretensioned Girders During
Transfer of Prestressing Forces,” Master’s Thesis, The University of Texas at Austin,May 1994.
3. Baxi, A., and Burns, N. H., Technical Memorandum No. 2, Research Project 9-580,
Center for Transportation Research (CTR), The University of Texas at Austin, March1993.
4. Bruce, R. N., Martin, B. T., Russell, H. G., and Roller, J. J., “Feasibility Evaluation of
Utilizing High-Strength Concrete in Design and Construction of Highway BridgeStructures,” Research Report No. 282, Louisiana Transportation Research Center,January 1994.
5. Buckner, C. D., “An Analysis of Transfer and Development Lengths for Pretensioned
Concrete Structures,” Publication No. FHWA-RD-94-049, Federal HighwayAdministration (FHWA), December 1994.
6. Building Code Requirements for Reinforced Concrete, ACI 318-89, American Concrete
Institute, 1989. 7. Burdette, E. G., Deatherage, J. H., and Chew, C. K., “Development Length and Lateral
Spacing Requirements of Prestressing Strand for Prestressed Concrete Bridge Girders,”PCI Journal, Vol. 39, No. 1, January/February 1994, pp. 70–83.
8. Carrasquillo, R. L., Nilson, A. H., and Slate, F. O., “Properties of High Strength
Concrete Subject to Short-Term Loads,” ACI Journal, Vol. 78, No. 3, May/June 1981,pp. 171–178.
9. Castrodale, R. W., Burns, N. H., and Kreger, M. E., “A Study of Pretensioned High
Strength Concrete Girders in Composite Highway BridgesLaboratory Tests,”Research Report 381-3, CTR, The University of Texas at Austin, January 1988.
10. Cousins, T., Johnston, D., and Zia, P., “Transfer and Development Length of Epoxy
Coated Prestressing Strand,” PCI Journal, Vol. 35, No. 4, July/August 1990, pp. 92–103.
68
11. Hanson, N. W., “Influence of Surface Roughness of Prestressing Strand in BondPerformance,” PCI Journal, Vol. 14, No. 1, January/February 1969, pp. 32–45.
12. Hanson, N. W., and Kaar, P. H., “Flexural Bond Tests of Pretensioned Prestressed
Beams,” ACI Journal, Vol. 55, No. 7, 1959, pp. 783–803. 13. Janney, J. R., “Nature of Bond in Pre-Tensioned, Prestressed Concrete,” ACI Journal,
Vol. 50, 1954, pp. 717–736. 14. Kaar, P. H., LaFraugh, R. W., and Mass, M. A., “Influence of Concrete Strength on
Strand Transfer Length,” PCI Journal, Vol. 8, No. 5, 1963, pp. 47–67.
15. Lane, S. N., “Development Length of Prestressing Strand,” Public RoadsA Journal ofHighway Research and Development, FHWA, Vol. 54, No. 2, September 1990, pp.200–205.
16. Lane, S. N., “Transfer Lengths in Regular Prestressed Concrete Concentric Beams,”
Public RoadsA Journal of Highway Research and Development, FHWA, Vol. 56,No. 2, September 1992, pp. 67–71.
17. Lin, T. Y., and Burns, N. H., Design of Prestressed Concrete Structures, John Wiley
and Sons, 1981. 18. Martin, L. D., and Scott, N. L., “Development of Prestressing Strand in Pretensioned
Members,” ACI Journal, Vol. 73, No. 8, 1976, pp. 453–456. 19. Mitchell, D., Cook, W. D., Khan, A. A., and Tham, T., “Influence of High Strength
Concrete on Transfer and Development Length of Pretensioning Strand,” PCI Journal,Vol. 38, No. 3, May/June 1993, pp. 52–66.
20. Nilson, A. H., Design of Prestressed Concrete, John Wiley and Sons, 1987. 21. PCI Design Handbook, Prestressed Concrete Institute, Third Edition, 1985. 22. Ralls, M. L., Ybanez, L., and Panak, J. J., “The New Texas U-Beam Bridges: An
Aesthetic and Economical Design Solution,” PCI Journal, Vol. 38, No. 5,September/October 1993, pp.20–29.
23. Russell, B. W., and Burns, N. H., Design Guidelines for Transfer, Development, and
Debonding of Large Diameter Seven Wire Strands in Pretensioned Concrete Girders,Research Report 1210-5F, CTR, The University of Texas at Austin, January 1993.
69
24. Standard Specifications for Highway Bridges, American Association of State Highwayand Transportation Officials, Washington, D.C., 1992.
25. Tabatabai, H., and Dickson, T. J., “The History of the Prestressing Strand Development
Length Equation,” PCI Journal, Vol. 38, No. 6, November/December 1993, pp. 64–75. 26. Zia, P., and Mostafa, T., “Development of Prestressing Strands,” PCI Journal, Vol. 22,
No. 5, 1977, pp. 54–65.

70

71
APPENDIX A
CONTRACTOR DRAWINGS FORHOBLITZELL-BUCKNER BEAMS

72
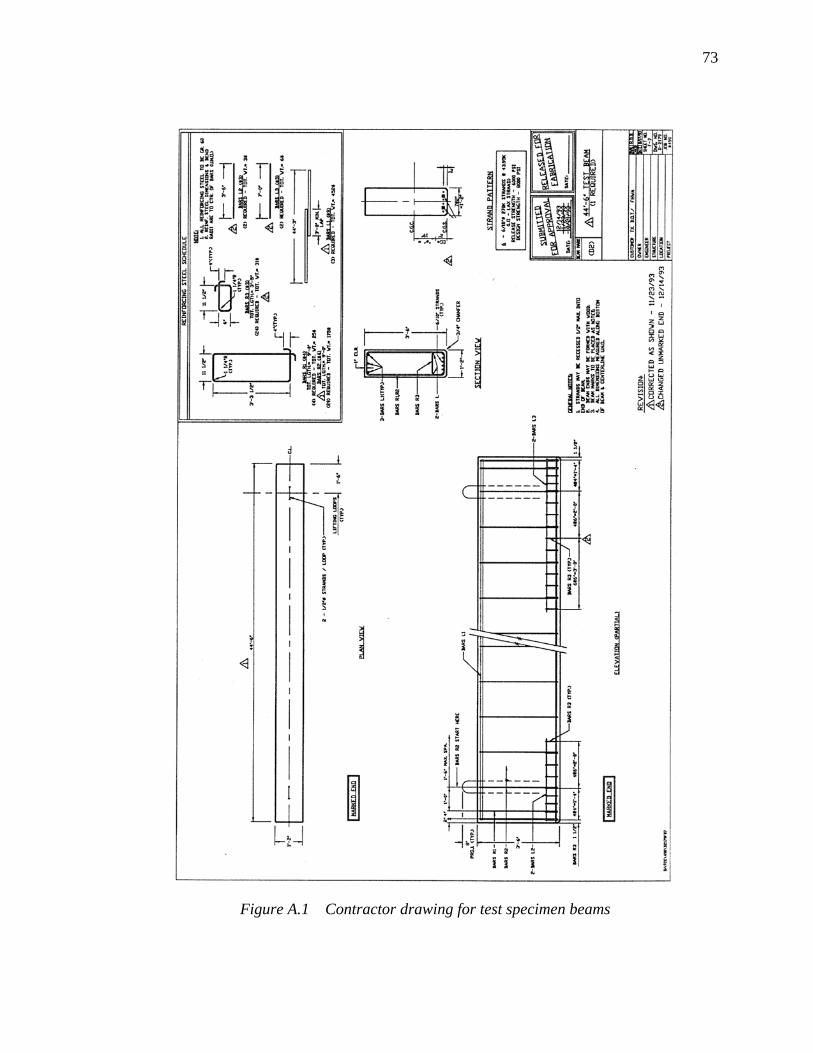
73
Figure A.1 Contractor drawing for test specimen beams

74

75
APPENDIX B
MATERIAL PROPERTY PLOTS

76

77
YS YS
NUMBER:
DIAMETER:
BREAKING LOAD:
LOAD AT 1% EXTENSION:
ELONGATION IN 24 INCHES:
STEEL AREA:
MODULUS OF ELASTICITY:
0.6006050058000
31023-1
9.00.21728.0x105
IN.
LBS.
LBS.
%
SQ.I.
P.S.I.
NUMBER:
DIAMETER:
BREAKING LOAD:
LOAD AT 1% EXTENSION:
ELONGATION IN 24 INCHES:
STEEL AREA:
MODULUS OF ELASTICITY:
0.6006000058000
31115-1
8.20.21728.0x105
IN.
LBS.
LBS.
%
SQ.I.
P.S.I.
3 1 11 5
- 1
31023-1
LOA
D (
LBS
)
ENLOGATION (%)
0.25 0.50 0.75 1.00 1.25 1.50 1.75 2.00
120,000
110,000
100,000
90,000
80,000
70,000
60,000
50,000
40,000
30,000
20,000
10,000
LOAD ELONGATION DIAGRAM
SWAI
Figure B.1 Strand manufacturer tensile test results
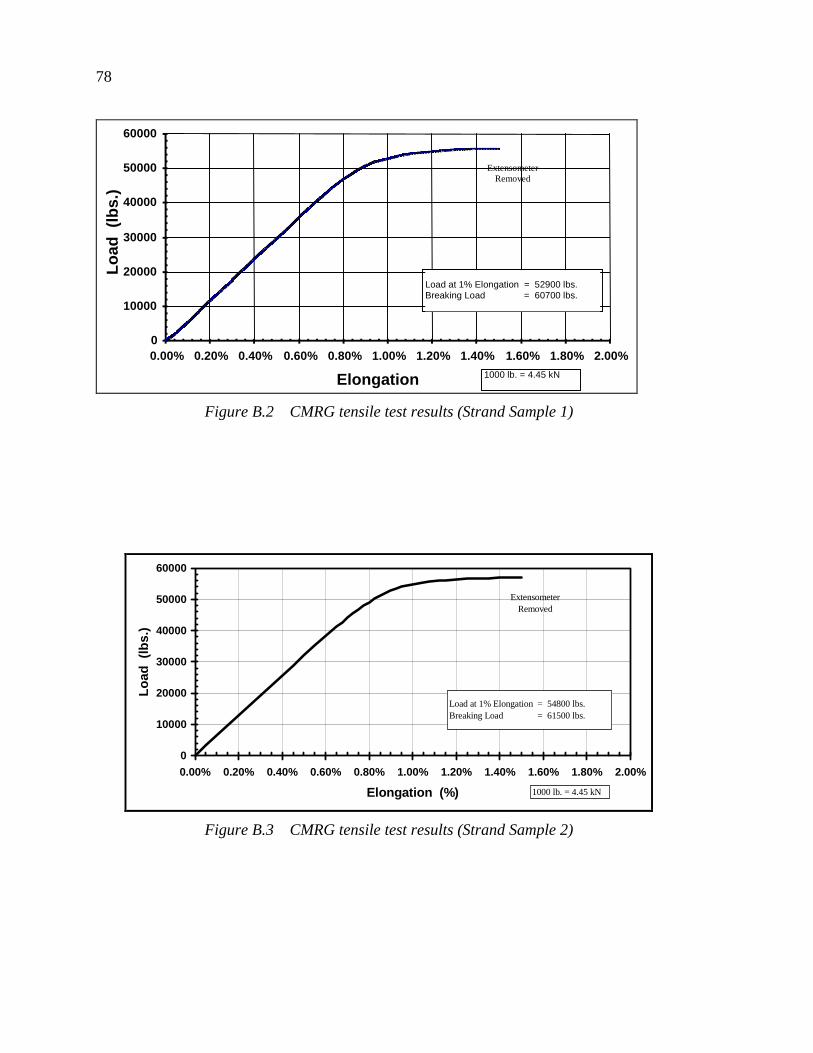
78
ExtensometerRemoved
0
10000
20000
30000
40000
50000
60000
0.00% 0.20% 0.40% 0.60% 0.80% 1.00% 1.20% 1.40% 1.60% 1.80% 2.00%
Elongation( )
Load
(lb
s.)
Load at 1% Elongation = 52900 lbs.Breaking Load = 60700 lbs.
1000 lb. = 4.45 kN
Figure B.2 CMRG tensile test results (Strand Sample 1)
ExtensometerRemoved
0
10000
20000
30000
40000
50000
60000
0.00% 0.20% 0.40% 0.60% 0.80% 1.00% 1.20% 1.40% 1.60% 1.80% 2.00%
Elongation (%)
Load
(lb
s.)
Load at 1% Elongation = 54800 lbs.Breaking Load = 61500 lbs.
1000 lb. = 4.45 kN
Figure B.3 CMRG tensile test results (Strand Sample 2)

79
0
2000
4000
6000
8000
10000
12000
14000
0 14 28 42 56 70 84 98 112 126 140
Time (days)
Str
engt
h (
psi)
Beam D1
Beam D2
1000 psi = 6.895 MPa
Figure B.4 Companion concrete cylinder compressive strength versus time
0
1000
2000
3000
4000
5000
6000
7000
8000
0 14 28 42 56 70 84 98 112 126 140
Time (days)
Mod
ulus
of E
last
icity
(ks
i)
Beam D1
Beam D2
1000 ksi = 6.895 GPa
Figure B.5 Companion concrete cylinder modulus of elasticity versus time

80

81
APPENDIX C
DEVELOPMENT LENGTHTEST SETUPS

82

83
P
P/2 P/2
Embedment Length (Le)
Shear Span
Simply Supported Span Cantilever LengthSupportOverhang
Spreader Beam(Constant Applied Moment Region)
163"
3.96 m (13.0 ft.)
1.22 m (4.0 ft.)
9.14 m (30.0 ft.) 4.27 m (14.0 ft.)
kN-m(ft-kips)
56.5(41.7)
81.4(-60.0)
45.7(33.7)
Figure C.1 Test 1-D1N-163 setup
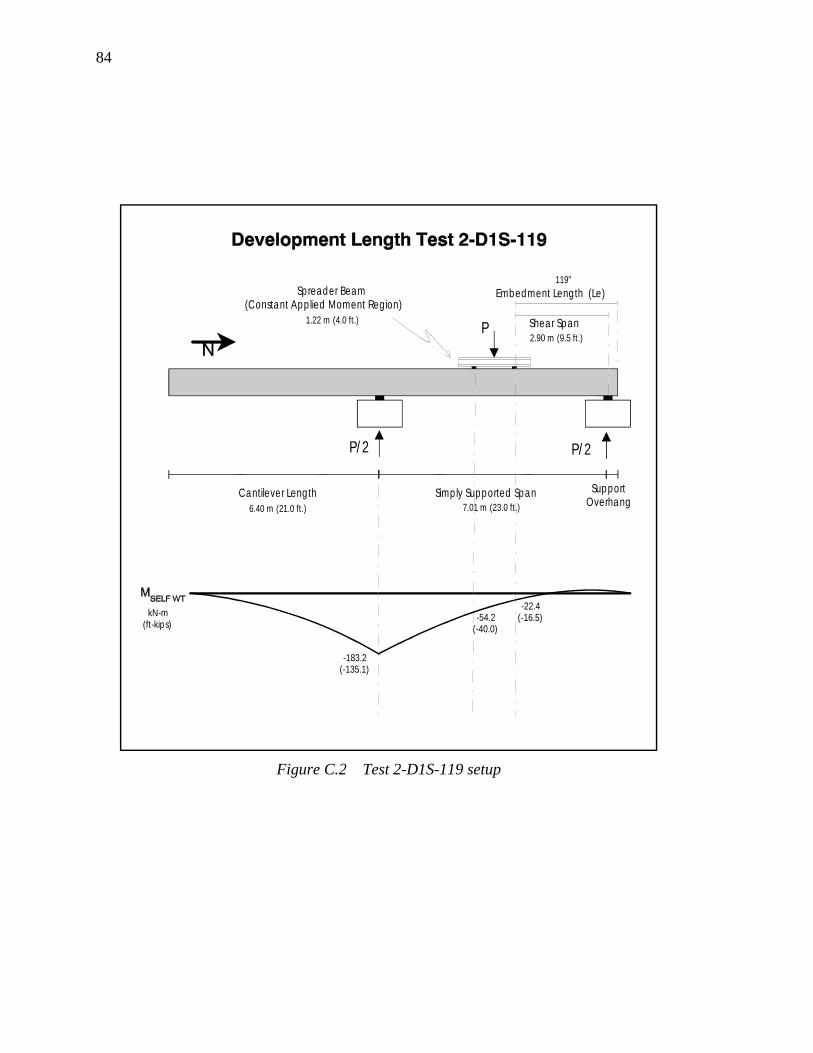
84
P
P/2P/2
Embedment Length (Le)
Shear Span
Simply Supported SpanCantilever Length SupportOverhang
Spreader Beam(Constant Applied Moment Region)
119"
kN-m(ft-kips)
-54.2(-40.0)
-183.2(-135.1)
-22.4(-16.5)
6.40 m (21.0 ft.) 7.01 m (23.0 ft.)
1.22 m (4.0 ft.)
2.90 m (9.5 ft.)
Figure C.2 Test 2-D1S-119 setup
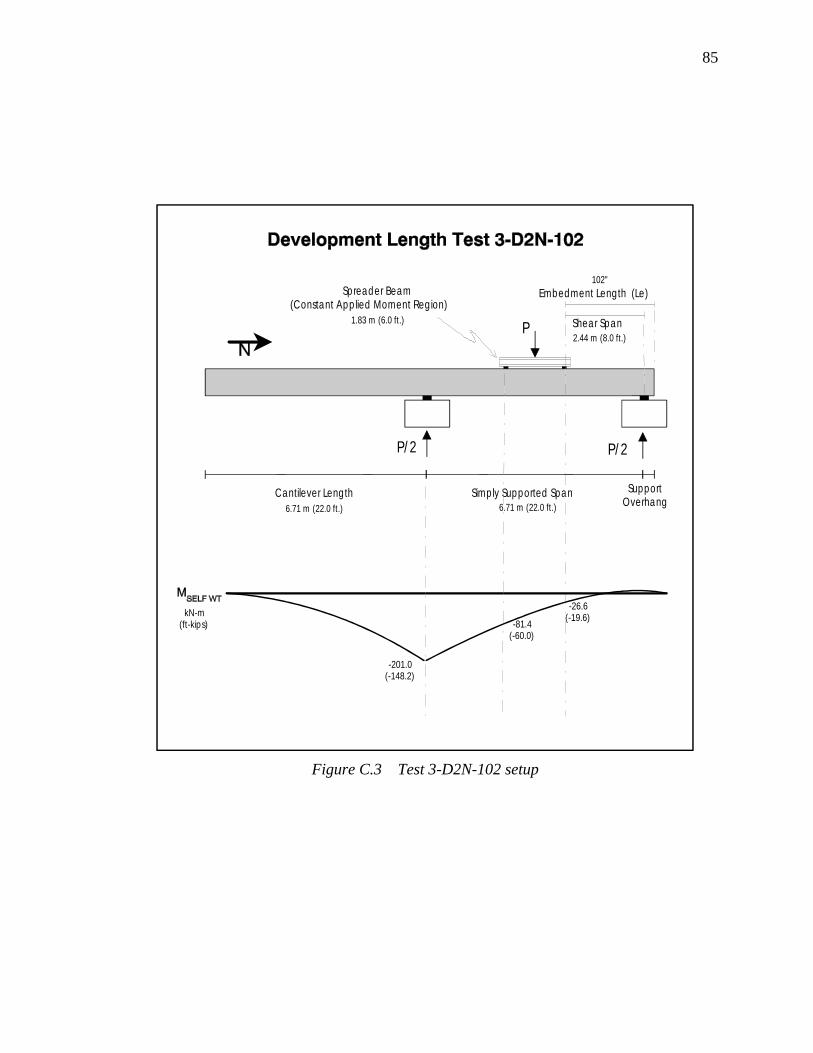
85
P
P/2P/2
Embedment Length (Le)
Shear Span
Simply Supported SpanCantilever Length SupportOverhang
Spreader Beam(Constant Applied Moment Region)
102"
1.83 m (6.0 ft.)
2.44 m (8.0 ft.)
6.71 m (22.0 ft.) 6.71 m (22.0 ft.)
kN-m(ft-kips) -81.4
(-60.0)
-201.0(-148.2)
-26.6(-19.6)
Figure C.3 Test 3-D2N-102 setup
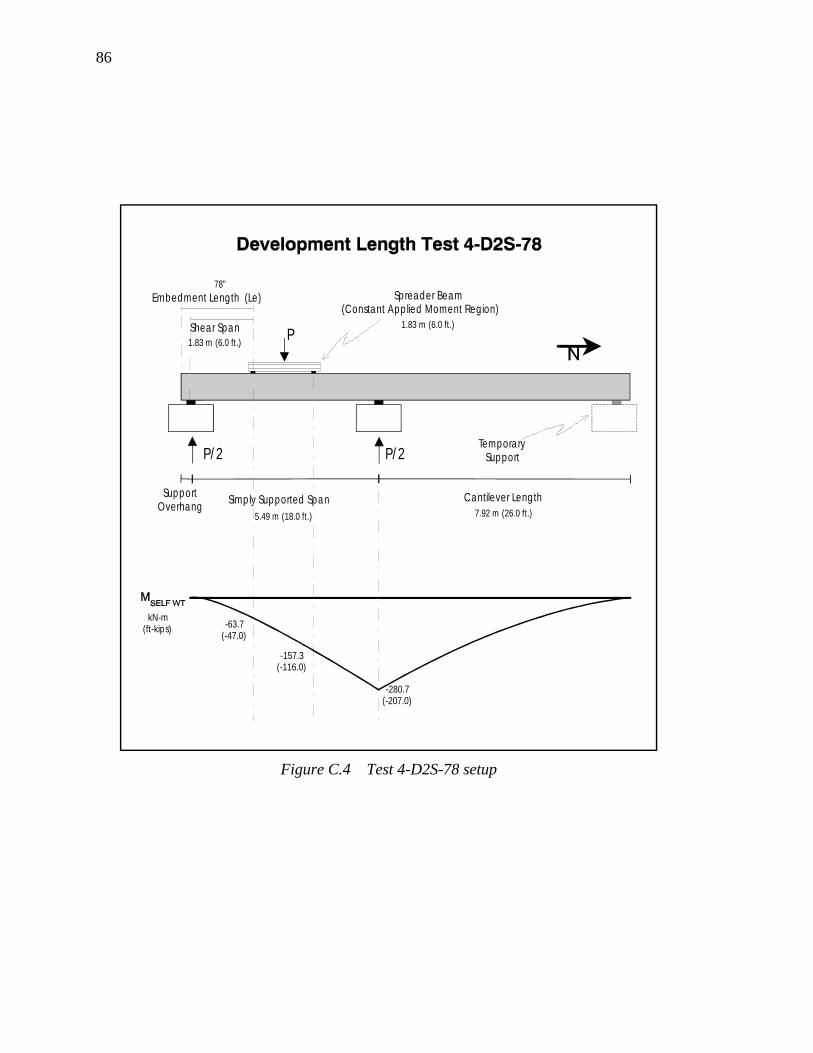
86
P
P/2 P/2
Embedment Length (Le)
Shear Span
Simply Supported Span Cantilever LengthSupportOverhang
Spreader Beam(Constant Applied Moment Region)
78"
TemporarySupport
1.83 m (6.0 ft.)
1.83 m (6.0 ft.)
5.49 m (18.0 ft.) 7.92 m (26.0 ft.)
kN-m(ft-kips) -63.7
(-47.0)
-157.3(-116.0)
-280.7(-207.0)
Figure C.4 Test 4-D2S-78 setup
87
APPENDIX D
MOMENT-CURVATURESECTION ANALYSIS

88
89
A moment-curvature relationship was developed for the test specimen cross sectionon the basis of a strain-compatibility analysis. Specific details of the analysis procedure arediscussed by Lin and Burns (17). The analysis is divided into two stages: before flexuralcracking when elastic behavior is assumed, and after cracking when the actual stress-strainrelationships of the materials are used. Results of the analysis are shown in Figure D.3 andTable D.1.
ASSUMPTIONS USED IN THE ANALYSIS:
Material PropertiesPrestressing SteelThe assumed strand stress-strain relationship is shown in Figure D.1. The
approximate equation is of the same form as that given by the PCI Handbook Section11.2.5 (21), with modifications to accommodate the average measured strand propertiesreported in Section 3.3.1:
f in ksips
ps ps
psps
( )
, .
..
..
=⋅ ≤
−−
>
28 000 0 008
279 60723
00670 008
ε ε
εε
The assumed ultimate tensile strength of the strands is 1.928 GPa (279.6 ksi). Themodulus of elasticity of the strands is taken as 193 GPa (28,000 ksi).
Material PropertiesConcreteThe assumed concrete stress-strain curve, based on the Hognestad model, is shown
in Figure D.2. The relationship is approximated by the equation:
f fc c= ′ ⋅ ⋅ −
2
0 0
2ε
εε
ε
For this case, f’ c = 90.7 MPa (13,160 psi) and ε0 = 0.003151.
The modulus of elasticity at the time of flexural testing is assumed to be 49.2 GPa(7,130 ksi), based on the material properties reported in Section 3.3.2. The modulus ofrupture, fr, is approximated as:
f fr c= ′ =10 1147 psi = 7.909 MPa
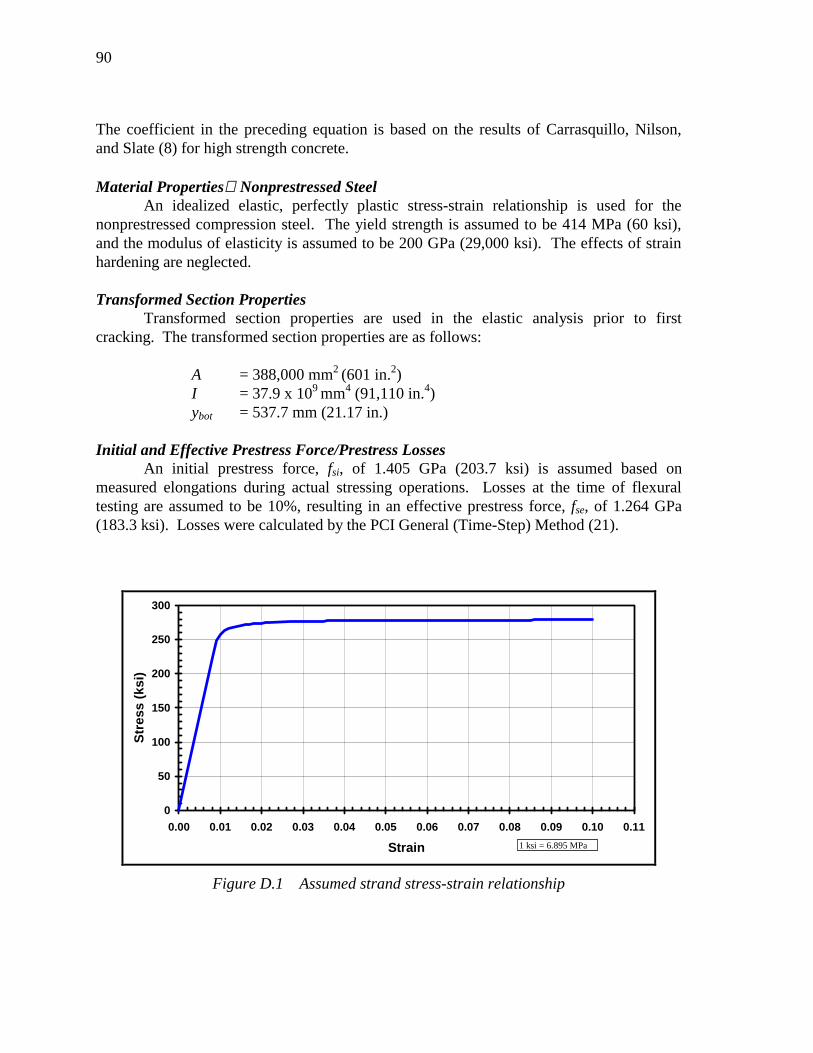
90
The coefficient in the preceding equation is based on the results of Carrasquillo, Nilson,and Slate (8) for high strength concrete.
Material PropertiesNonprestressed SteelAn idealized elastic, perfectly plastic stress-strain relationship is used for the
nonprestressed compression steel. The yield strength is assumed to be 414 MPa (60 ksi),and the modulus of elasticity is assumed to be 200 GPa (29,000 ksi). The effects of strainhardening are neglected.
Transformed Section PropertiesTransformed section properties are used in the elastic analysis prior to first
cracking. The transformed section properties are as follows:
A = 388,000 mm2 (601 in.2)I = 37.9 x 109 mm4 (91,110 in.4)ybot = 537.7 mm (21.17 in.)
Initial and Effective Prestress Force/Prestress LossesAn initial prestress force, fsi, of 1.405 GPa (203.7 ksi) is assumed based on
measured elongations during actual stressing operations. Losses at the time of flexuraltesting are assumed to be 10%, resulting in an effective prestress force, fse, of 1.264 GPa(183.3 ksi). Losses were calculated by the PCI General (Time-Step) Method (21).
0
50
100
150
200
250
300
0.00 0.01 0.02 0.03 0.04 0.05 0.06 0.07 0.08 0.09 0.10 0.11
Strain
Str
ess
(ksi
)
1 ksi = 6.895 MPa
Figure D.1 Assumed strand stress-strain relationship

91
0
2000
4000
6000
8000
10000
12000
14000
0 0.001 0.002 0.003 0.004 0.005 0.006 0.007 0.008
Strain
Str
ess
(psi
)
1 psi = 6.895 kPa
Figure D.2 Assumed concrete stress-strain relationship
0
200
400
600
800
1000
1200
1400
-2.0E-4 0.0E+0 2.0E-4 4.0E-4 6.0E-4 8.0E-4 1.0E-3 1.2E-3 1.4E-3 1.6E-3 1.8E-3 2.0E-3
Curvature (radians/in.)
Mom
ent
(ft.-
kips
)
1 ft-kip = 1.356 kN-m1 rad/in. = 0.0394 rad/mm
Figure D.3 Moment-curvature relationship for specimen cross section

92
Table D.1 Calculated moment-curvature points
εtop φ M εps fps c(in./in.) (rad/mm) (rad/in.) (kN-m) (ft-kips) (%) (MPa) (ksi) (mm) (in.)-0.000080 -2.67E-07 -6.78E-06 0 0 0.655% 1264 183.3 301 11.860.000119 1.18E-07 2.99E-06 750 553 0.674% 1300 188.6 1016 40.000.000272 4.06E-07 1.03E-05 1287 949 0.688% 1327 192.5 670 26.380.000700 3.63E-06 9.22E-05 1409 1039 0.973% 1763 255.7 193 7.590.000800 4.65E-06 1.18E-04 1448 1068 1.060% 1802 261.3 172 6.790.000900 5.79E-06 1.47E-04 1477 1089 1.170% 1828 265.2 156 6.130.001000 7.05E-06 1.79E-04 1498 1105 1.290% 1847 267.9 142 5.590.001200 9.92E-06 2.52E-04 1527 1126 1.560% 1872 271.5 121 4.770.001400 1.31E-05 3.34E-04 1544 1139 1.870% 1886 273.6 106 4.190.001600 1.68E-05 4.26E-04 1557 1148 2.220% 1896 274.9 96 3.760.001800 2.06E-05 5.23E-04 1566 1155 2.590% 1902 275.8 87 3.440.002000 2.47E-05 6.27E-04 1572 1159 2.980% 1906 276.5 81 3.190.002250 2.99E-05 7.60E-04 1578 1164 3.490% 1910 277.0 75 2.960.002500 3.54E-05 8.99E-04 1582 1167 4.020% 1913 277.4 71 2.780.002750 4.09E-05 1.04E-03 1585 1169 4.550% 1915 277.7 67 2.650.003000 4.65E-05 1.18E-03 1588 1171 5.080% 1917 278.0 65 2.550.003500 5.71E-05 1.45E-03 1592 1174 6.130% 1919 278.3 61 2.410.004000 6.77E-05 1.72E-03 1593 1175 7.170% 1920 278.5 59 2.32

93
APPENDIX E
NOTATION

94

95
A (Transformed) area of cross sectionAstrand Area of prestressing strandB Bond stress factor used in transfer length equation in Reference 10db, D Diameter of prestressing strandEc Modulus of elasticity of concreteEci Modulus of elasticity of concrete at transferEps Modulus of elasticity of prestressing strandfc Stress in concretefce Stress in concrete at level of strands (after losses)fps, f* su Stress in strands at failurefpu Ultimate tensile strength of strandsfr Modulus of rupture of concretefse Stress in strands after lossesfsi Stress in strands immediately before transferf’ c Concrete compressive strength at 28 daysf’ ci Concrete compressive strength at transferI (Transformed) moment of inertia of cross sectionLb Length of debonding for debonded strandsLd Development length of prestressing strandsLe Embedment length of prestressing strandsL t Transfer length of prestressing strandsMcr Cracking moment for cross sectionMtest Maximum total moment acting on cross section during testingMu Moment capacity of cross sectionn Modular ratio of steel with respect to concreteU’d Strand surface coefficient used in development length equation in
Reference10U’ t Strand surface coefficient used in transfer length equation in Reference 10Vu Ultimate factored shear acting at a location along memberybot Location of (transformed) centroid of cross section from bottom fiberε Strain in concreteεce Strain in concrete at level of strands (after losses)εse Strain in strands after losses (due to prestressing only)εsi Strain in strands immediately before transferε0 Strain in concrete at compressive strength (f’c)φ Strength reduction factor used in Reference 6

96