Enclosure 3, "Steam Generator Tubing Outside Diameter Stress ...
291
Enclosure 3 Steam Generator Tubing Outside Diameter Stress Corrosion Cracking at Tube Support Plates Database for Alternate Repair Limits - Addendum 6 Non-Proprietary Version Is . _S
-
Upload
khangminh22 -
Category
Documents
-
view
0 -
download
0
Transcript of Enclosure 3, "Steam Generator Tubing Outside Diameter Stress ...

Enclosure 3
Steam Generator Tubing Outside Diameter Stress Corrosion Crackingat Tube Support Plates Database for
Alternate Repair Limits - Addendum 6
Non-Proprietary Version
Is
. _S

NON-PROPRIETARY
Steam Generator Tubing OutsideDiameter Stress Corrosion Crackingat Tube Support Plates Database forAlternate Repair LimitsUpdate 2004
1011456
Interim Report, January 2005
EPRI Project ManagerE. Blandford
EPRI * 3412 Hillview Avenue, Palo Alto, California 94304 * PO Box 10412, Palo Alto, California 94303 * USA800.313.3774 * 650.855.2121 * askepri epri.com * www.epri.com
_ , z

DISCLAIMER OF WARRANTIES AND LIMITATION OF LIABILITIES
THIS DOCUMENT WAS PREPARED BY THE ORGANIZATION(S) NAMED BELOW AS ANACCOUNT OF WORK SPONSORED OR COSPONSORED BY THE ELECTRIC POWER RESEARCHINSTITUTE, INC. (EPRI). NEITHER EPRI, ANY MEMBER OF EPRI, ANY COSPONSOR, THEORGANIZATION(S) BELOW, NOR ANY PERSON ACTING ON BEHALF OF ANY OF THEM:
(A) MAKES ANY WARRANTY OR REPRESENTATION WHATSOEVER, EXPRESS OR IMPLIED, (I)WITH RESPECT TO THE USE OF ANY INFORMATION, APPARATUS, METHOD, PROCESS, ORSIMILAR ITEM DISCLOSED IN THIS DOCUMENT, INCLUDING MERCHANTABILITY AND FITNESSFOR A PARTICULAR PURPOSE, OR (II) THAT SUCH USE DOES NOT INFRINGE ON ORINTERFERE WITH PRIVATELY OWNED RIGHTS, INCLUDING ANY PARTY'S INTELLECTUALPROPERTY, OR (III) THAT THIS DOCUMENT IS SUITABLE TO ANY PARTICULAR USER'SCIRCUMSTANCE; OR
(B) ASSUMES RESPONSIBILITY FOR ANY DAMAGES OR OTHER LIABIUTY WHATSOEVER(INCLUDING ANY CONSEQUENTIAL DAMAGES, EVEN IF EPRI OR ANY EPRI REPRESENTATIVEHAS BEEN ADVISED OF THE POSSIBILITY OF SUCH DAMAGES) RESULTING FROM YOURSELECTION OR USE OF THIS DOCUMENT OR ANY INFORMATION, APPARATUS, METHOD,PROCESS, OR SIMILAR ITEM DISCLOSED IN THIS DOCUMENT.
ORGANIZATION(S) THAT PREPARED THIS DOCUMENT
Westinghouse Electric Company, LLC
ORDERING INFORMATION
Requests for copies of this report should be directed to EPRI Orders and Conferences, 1355 WillowWay, Suite 278, Concord, CA 94520, (800) 313-3774, press 2 or internally x5379, (925) 609-9169,(925) 609-1310 (fax).
Electric Power Research Institute and EPRI are registered service marks of the Electric PowerResearch Institute, Inc. EPRI. ELECTRIFY THE WORLD is a service mark of the Electric PowerResearch Institute, Inc.
Copyright © 2005 Electric Power Research Institute, Inc. All rights reserved.

CITATIONS
This report was prepared by
Westinghouse Electric Company, LLCNuclear Services DivisionP.O. Box 158Madison, PA 15663
Principle InvestigatorsT. PitterleR. Keating
The work described in this report was procured according to EPRI's Quality Assurance programand prepared under Westinghouse Electric Company's Quality Assurance Program, both ofwhich comply with the requirements of title 10 of the code of federal regulations, Part 50,Appendix B.
The report is a corporate document that should be cited in the literature in the following manner:
Steam Generator Tubing Outside Diameter Stress Corrosion Cracking at Tube Support PlatesDatabase forAltenmate Repair Limits: Update 2004, EPRI, Palo Alto, CA: 2005. 1011456.
iii
REPORT SUMMARY
This Addendum 6 (2004) updates the NP-7480-L Addendum 5 database report (2002) for outsidediameter stress corrosion cracking at tube support plates.
BackgroundAddendum 6 updates the NP-7480-L databases for 3/4- and 7/8-inch tubing. Five new or revisedmethod updates-which have been submitted to the Nuclear Regulatory Commission (NRC) forapproval or information-also are included in this report. Revisions to the methods includemajor changes to the probability of prior cycle detection (POPCD) and voltage dependent growthanalysis methods. The new methods include allowances for extreme growth values in operationalassessments, alternate plugging criteria (ARC) noise analysis requirements, and preventive repairguidelines.
ObjectivesTo update the NP-7480-L Addendum 5 database for outside diameter stress corrosion cracking attube support plates (TSPs).
ApproachStarting with Addendum 5, the project team's approach has been to significantly extend theoverall content of the addenda to incorporate essentially all applicable prior information onupdates to nondestructive examination (NDE) techniques, ARC analysis methods, and ARCprogrammatic information. The intent is to maintain the addenda as a self-standing document fordata and method changes since the release of Addendum 1 and NRC Generic Letter 95-05.
Results* Pulled tube data from one plant with 3/4-inch tubes and two plants with 7/8-inch tubes have
been added to the database (Sections 3, 4, and 5). Based on these data, two bobbinindications have been added to the 3/4-inch database and three bobbin indications to the 7/8-inch database. All five of these new indications had leakage at steam line burst (SLB)conditions. Additional destructive examination results are included for intersections at TSPsthat had no detectable degradation in the field inspection, including two 3/4-inch and one7/8-inch datapoints.
* The revised databases are used to update the ARC correlations (Section 6) for burst pressure,probability of leakage, and SLB leak rate as a function of bobbin coil voltage for both 3/4-and 7/8-inch diameter tubing.
v

-1 IL_
* A major revision to the Addendum 5 probability of POPCD as a function of bobbin voltage isdeveloped in Section 7 for use in ARC supporting analyses for end-of-cycle voltagedistribution projections.
* Section 8 provides new updates to methodology supporting ARC applications. For thisaddendum, new methods are included for extreme values of outside diameter stress corrosioncracking (ODSCC) ARC indications or growth, noise requirements for voltage-based ARC,and ARC guidelines for preventive repair of large +point indications.
* Section 9 documents NRC approved changes to ARC databases, analysis methods, andprogram. There are no changes to Section 9 for this addendum.
* Section 10 includes industry-recommended changes to ARC databases, analysis methods,and program that are either below the level required for NRC approval or recommended onlyfor sensitivity analyses.
* Section 10 also provides a major revision to ARC analysis methods for voltage-dependentgrowth rates.
EPRI PerspectiveAlthough changes to the ARC correlations are modest, the new correlations for both 3/4- and7/8-inch tubing should be implemented in all new ARC analyses beginning with fall 2004outages. Implementing POPCD methods for reference ARC operational assessments requiresNRC approval, which is not yet available for general applications. In Section 8, the method forextreme growth values requires NRC-approved POPCD methods and NRC approval. The noiseanalysis requirements require NRC approval to implement the recommended changes to theassociated repair limits (although the methods in Section 8 can be used to select indications withhigh noise levels for rotating pancake coil, or RPC, inspection). The guidelines for preventiverepair do not require NRC approval. Since the voltage-dependent growth methods in Section 10do not conflict with GL 95-05, NRC approval is not required for voltage-dependent growthanalyses for the reference ARC analyses in operational assessments when voltage dependence isindicated by the growth rate data.
KeywordsAxialODSCCTSPPOPCD
vi

EPRI Proprietary Licensed Material
ABSTRACT
This Addendum 6 to report NP-7480-L updates and extends the database for outside diameterstress corrosion cracking at tube support plates previously reported in Addendum 5 of the report.Pulled tube data from two plants for 7/8 inch tubing are added to the database. The ARCcorrelations for burst pressure, probability of leakage and SLB leak rate are updated to reflectthese changes. The updated 3/4 inch burst and leakage correlations and the 7/8 inch burstcorrelation are not significantly different from the Addendum 5 correlations. The 7/8" leak ratecorrelation is meaningfully affected in that the p value for the leak rate correlation is reduced towell below 5%. This is expected to lead to a reduction in the calculated total leak rates for plantswith 7/8" diameter tubes.
A major revision to the Addendum 5 probability of prior cycle detection (POPCD) as a functionof bobbin voltage is presented in this report. The revised POPCD methods utilize regressionanalyses to calculate the POD distribution, and the database formats have been revised.Implementation of the POPCD methods for reference ARC operational assessments requiresNRC approval, which has not yet obtained for general applications. The updated POD includesforty-one inspections from thirteen plants versus thirty-seven inspections for Addendum 5.
For Addendum 5, the overall content of the addenda was significantly extended to incorporateessentially all applicable prior information on updates to NDE techniques, ARC analysismethods and ARC programmatic information. The intent is to maintain the addenda as a self-standing document for data and methods changes since the release of Addendum 1 and NRCGeneric Letter 95-05. This addendum provides a major revision to the Addendum 5 ARCanalysis methods for voltage dependent growth (VDG) rates. Since GL 95-05 requires anassessment for voltage dependent growth and the voltage dependent growth methods do notconflict with the GL, NRC approval is not required to apply voltage dependent growth analysesfor the reference ARC analyses in operational assessments when voltage dependence is indicatedby the growth rate data. In most applications without preventative plugging, it is expected thatthe use of voltage dependent growth rates will lead to more conservative predictions of SLBburst probability and leakage. This addendum also defines three new methods in addition to thePOPCD and VDG revisions including "Extreme Values of ODSCC ARC Indications orGrowth", "Noise Requirements for Voltage Based ARC", and "ARC Guidelines for PreventiveRepair of Large +Point Indications". The method for extreme growth values is intended forapplication only with NRC approved POPCD methods and requires NRC approval forimplementation. The noise analysis requirements require NRC approval to implement therecommended changes to the associated repair limits although the methods can be used to selectindications with high noise levels for RPC inspection. The guidelines for preventive repair donot require NRC approval.
vii

EPRI Proprietary Licensed Material
LIST OF ACRONYMS
ARC Alternate Plugging CriteriaASME American Society of Mechanical EngineersAVT All Volatile TreatmentCSA Cross-Sectional AreaDoF Degrees of FreedomEdF Electricitie de FranceEDM Electro-Deposition MachiningEDS Energy Dispersive SpectroscopyEOC End of CycleEPRI Electric Power Research InstituteFDB Flow Distribution BaffleFS Free SpanICC Intergranular Cellular CorrosionIGA Intergranular AttackIGSCC Intergranular Stress Corrosion CrackingLTL Lower Tolerance LimitMBM Manufacturing Buff MarkNDE Nondestructive ExaminationNDD No Degradation DetectedNRC Nuclear Regulatory CommissionOD Outside DiameterODSCC Outside Diameter Stress Corrosion CrackingPOD Probability of DetectionPoL Probability of LeakPOPCD Probability of Prior Cycle DetectionPoR Probability of RuptureRG Regulatory GuideRPC Rotating Pancake CoilRSS Residual Sum of SquaresRT Room TemperatureSEM Scanning Electron MicroscopeSD Standard DeviationSG Steam GeneratorSLB Steam Line BurstTEM Transmission Electron MicroscopeVDG Voltage Dependent Growth
ix

EPRI Proprietary Licensed Afaterial
CONTENTS
1 INTRODUCTION ...................................................... 1-1
2 SUMMARY AND CONCLUSIONS ...................................................... 2-1
2.1 Updated Database and Correlations for 3/4 Inch Diameter Tubing ............................. 2-1
2.2 Updated Database and Correlations for 7/8 Inch Diameter Tubing ............................. 2-1
2.3 Supplemental Test Data ..................................... 2-2
2.4 Recommended Probability of Detection (POD) ..................................... 2-2
2.5 NDE, Analysis Methods and Program Updates ..................................... 2-2
2.6 References ..................................... 2-4
3 EVALUATION OF PULLED TUBE DATA FOR 3/4 INCH DIAMETER TUBING .................. 3-1
3.1 Plant DW 2003 Pulled Tubes .................................................. 3-1
3.1.1 Tube Examination Summary .......................................................... 3-1
Non Destructive Examination .......................................................... 3-1
Destructive Examination .......................................................... 3-1
3.1.2 Plant DW Pulled Tube Evaluation for ARC Applications .................................... 3-2
Eddy Current Data Review .......................................................... 3-2
Plant DW Data for ARC Applications .......................................................... 3-3
3.2 References ........... 3-3
4 EVALUATION OF PULLED TUBE DATA FOR 7/8 INCH DIAMETER TUBING .................. 4-1
4.1 Plant Y-1 2004 Pulled Tube .......................................................... 4-1
4.1.1 Tube Examination Summary ........................................................... 4-1
Non Destructive Examination .......................................................... 4-1
Destructive Examination ........................................................... 4-2
4.1.2 Plant Y-1 Pulled Tube Evaluation for ARC Applications ..................................... 4-3
Eddy Current Data Review ........................................................... 4-3
Plant Y-1 Data for ARC Applications .......................................................... 4-3
4.2 Plant Y-2 2003 Pulled Tubes ........................................................... 4-4
xi

HI
EPRI Proprietary Licensed Material
4.2.1 Tube Examination Summary ................................................... 4-4
Non Destructive Examination ................................................... 4-4
Destructive Examination ................................................... 4-5
4.2.2 Plant Y-2 Pulled Tube Evaluation for ARC Applications ..................................... 4-6
Eddy Current Data Review ................................................... 4-6
Plant Y-2 Data for ARC Applications ................................................... 4-6
4.3 References ................................................... 4-7
5 UPDATED ARC DATABASES ................................................... 5-1
5.1 3/4" Data ................................................... 5-1
5.2 7/8" Data ................................................... 5-1
5.3 Data for Burst Inside the TSP ................................................... 5-2
5.4 Data for Axial Tensile Tearing ................................................... 5-2
5.5 Summary of Field NDD Data ................................................... 5-2
5.6 References ................................................... 5-2
6 UPDATED ARC CORRELATIONS ................................................... 6-1
6.1 3/4" Diameter Tubes Data Analysis ................................................... 6-2
6.1.1 Free Span Burst Correlation for 3/4" Tubes ................................................... 6-2
6.1.2 Probability of Leak Correlation for 3/4" Tubes ................................................... 6-3
6.1.3 Free Span SLB Leak Rate Correlation for 3/4" Tubes ........................................ 6-4
6.1.4 General Conclusions Regarding 3/4" Data ................................................... 6-5
6.2 7/8" Diameter Tubes Data Analysis ................................................... 6-5
6.2.1 Free Span Burst Correlation for 7/8" Tubes .6-5
6.2.2 Probability of Leak Correlation .6-7
6.2.3 Free Span SLB Leak Rate Correlation for 7/8" Tubes .6-8
6.2.4 Consideration of EdF Data .6-9
6.2.5 General Conclusions Regarding 7/8" Tubes .6-9
6.3 Axial Tensile Tearing Correlation ............................................. 6-9
6.4 Summary/Conclusions .. .......................................... 6-10
6.5 References ............................................ . 6-10
7 PROBABILITY OF PRIOR CYCLE DETECTION (POPCD) ............................................ 7-1
7.1 Introduction ............................................ . 7-1
7.2 POPCD Definition and Classification of Indications ................................. 7-2
7.2.1 POPCD Definition .7-2
xii

EPRI Proprietary Licensed Material
7.2.2 Classification of Indications and Assignment for POPCD Analyses ................. 7-4
7.3 Calculation of the POPCD Distribution Including Uncertainties . ................................. 7-5
7.3.1 Loglogistic Fitting .. 7-5
7.3.2 Monte Carlo Techniques ........................ 7-6
7.3.3 Goodness of Fit Assessment .. 7-7
7.4.1 Provision for Outlier Growth Rates .. 7-8
7.4.2 Development of Growth Rate Distributions .. 7-10
7.5 Noise Considerations for POPCD Applications . ....................................................... 7-10
7.6 Benchmarking of POPCD ............................................................... 7-12
7.7 POPCD Evaluation for the Industry Database .......................................................... 7-13
7.7.1 Industry POPCD Distribution ............................................. 7-13
7.7.2 Effect of Uncertainties in the Upper Voltage Range . ........................... 7-13
7.7.3 Comparisons of Industry POPCD with DCPP POPCD, ANL POD fromRound Robin Testing and EPRI POD from Multiple Analyst Testing . ..................... 7-14
7.8 Option for Developing Plant Specific POPCD Distributions . ..................................... 7-15
7.9 Continuing Assessment and Reporting for POPCD . ................................................. 7-17
7.10 Conclusions . .............................................................. . 7-20
7.11 References . .............................................................. 7-20
8 RECOMMENDED NEW UPDATES TO NDE, ANALYSIS METHODS ANDPROGRAMS ................................................................ 8-1
8.1 Extreme Values of ODSCC ARC Indications or Growth . ............................................ 8-1
8.1.1 Introduction ............................................................... 8-2
8.1.2 Regulatory Topics of Interest .. 8........................................... -4
8.1.2.1 Function of the Analysis ............................................................... 8-5
8.1.2.2 The "Fractional Flaw Paradox" .............................................................. 8-5
8.1.2.3 Extreme Growth of Indications at V. C. Summer .......................................... 8-7
8.1.3 Objective of the Analyses ............................................................... 8-8
8.1.4 Distribution of ODSCC ARC Growth Rates .................................. 8-10
8.1.4.1 Analysis of SG Data ............................................................... 8-10
8.1.4.2 Generic Letter Requirements .............................................................. 8-10
8.1.4.3 Root Cause of Extreme Growth ............................................................... 8-11
8.1.4.4 Growth Rate Predictions .............................................................. 8-12
8.1.5 Potential Approaches ............................................................... 8-13
8.1.6 Insertion of Random Extreme Values .............................................................. 8-13
8.1.6.1 Factors Affecting Growth .............................................................. 8-14
xiii

n
EPRI Proprietary Licensed Material
8.1.6.1.1 Maturity of the Population of Indications ............................ 8-14
8.1.6.1.2 Number of Indications in the SG ............................ 8-14
8.1.6.1.3 Chemistry of the Secondary Side ............................ 8-14
8.1.6.1.4 Temperature of Operation ............................ 8-15
8.1.6.1.5 Normal Operation Differential Pressure ............................ 8-15
8.1.6.1.6 Adjustment of Voltage Growth ............................ 8-16
8.1.6.2 Simulation Approach Based on SG ARC Applications . . 8-16
8.1.6.3 Simulations Based on the Total Number of Indications . . 8-17
8.1.7 Extreme Value Distributions .. . . 8-21
8.1.8 Fitting a Distribution Function to the Growth Rate .... 8-22
8.1.9 Empirical/Exponential Simulation of Growth Rates .... 8-23
8.1.9.1 The Empirical Model .. 8-24
8.1.9.2 Fitting the Exponential Distribution .. 8-26
8.1.9.3 Simulation of the Empirical-Exponential Distribution . . 8-29
8.1.9.4 Conclusions .. 8-30
8.1.10 Chebyshev's Inequality .. . . 8-31
8.1.11 Summary/Recommendation .. . . 8-32
8.2 Noise Requirements for Voltage Based ARC .. . . 8-33
8.2.1 Introduction .. .8-33
8.2.2 Considerations for Noise at TSP Intersections .... 8-34
8.2.3 Tube Repair Requirements for Indications Found by RPC at Noisy TSPIntersections .. 8-36
8.2.3.1 Bobbin Voltage Sizing for Indications Found by RPC . 8-36
8.2.3.2 Tube Repair Requirements for Indications Found by RPC at NoisyTSP Intersections .. 8-36
8.2.4 RPC Inspection Requirements for Noise at TSP Intersections . . 8-37
8.2.5 Conclusions .. 8-39
8.3 ARC Guidelines for Preventive Repair of Large +Point Indications . .. 8-40
8.3.1 Introduction ................................ . 8-40
8.3.2 Background Information .. .............................. 8-41
8.3.3 Guidelines for Preventive Repair .. .............................. 8-42
8.3.4 Guidelines for Supplemental RPC Inspection . ............................... 8-44
8.3.5 Conclusions ................................. 8-44
8.4 References .. . 8-45
xiv

EPRI Proprietary Licensed Material
9 NRC APPROVED REVISIONS TO ARC PROGRAM, DATABASES, AND ANALYSISMETHODS .................................................................. 9-1
9.1 NRC/Industry SGDSM Database Protocol ................................................................. 9-1
9.2 Requirements for Pulling Tubes in Support of the Voltage Based Repair Limits ......... 9-2
9.2.1 Description of the Issue .................................................................. 9-2
9.2.2 Bases for Tube Removal Guidelines ................................................................. 9-3
9.2.3 Criteria for Tube Removal and Examination/Testing .......................................... 9-4
9.3 Data Exclusion Criteria .................................................................. 9-6
9.3.1 Introduction .................................................................. 9-6
9.3.2 Data Exclusion Criteria .................................................................. 9-6
9.4 Exclusion of the French Data from the ARC Database . ............................. 9-11
9.5 Revisions to Leak Rate Analysis Methods ................................................................ 9-11
9.6 References .................................................................. 9-12
10 PRIOR INDUSTRY RECOMMENDED UPDATES TO ARC ANALYSIS METHODSAND DATA APPLICATIONS .................................................................. 10-1
10.1 Determination of Bobbin Voltages for Indications Detected Only by RPCInspection ................................................................... 10-1
10.1.1 Background .................................................................. 10-1
10.1.2 Bobbin Voltages Obtained from Flaw Identification at SingleFrequencies Such as 200kHz .................................................................. 10-2
10.1.3 Bobbin Voltages Inferred from Correlation of Bobbin Voltage to RPCVoltage 10-2
10.2 NDE Technique for Cross Calibration of ASME Standards to the ReferenceStandard ................................................................... 10-7
10.2.1 Background .. 10-7
10.2.2 Theoretical Critique of the Four Methods .. 10-8
10.2.3 Experimental Study .. 10-8
10.2.4 Results .. 10-9
10.2.5 Recommendations .. 10-9
10.3 Voltage Dependent Growth Rate Methods . . . .................... 10-10
10.3.1 Introduction .............. 10-10
10.3.2 Piecewise Linear Regression Analysis ................................... 10-12
10.3.3 Discussion of Growth Plotting ................................... 10-13
10.3.4 Analysis ................................... . 10-14
10.3.4.1 Upper Range Number of Data ................................... 10-14
10.3.4.2 Bilinear Regression .10-14
xv

-I-- -
EPRI Proprietary Licensed Material
10.3.4.3 Trilinear Regression ................. 10-16
10.3.4.4 Quadrilinear Regression ................ 10-16
10.3.5 Example Application to Plant DCPP Data . . 10-17
10.3.5.1 SG 2-4 Cycle 11 Growth Data .. 10-17
10.3.5.2 SG 2-4 Cycle 10 Growth Data .. 10-17
10.3.6 Discussion .. 10-18
10.3.7 Summary .. 10-19
10.4 Growth Rate in Deplugged Tubes Returned to Service . . . 10-21
10.4.1 Introduction .. 10-21
10.4.2 Selection of a Bounding Growth Distribution for Deplugged Tubes .. 10-21
10.4.3 Method of Combining Active and Deplugged Tube Growth Data .. 10-22
10.4.4 Comparison of Leak and Burst Projections Considering IncreasedDeplugged Tube Growth with those Based on Actual Voltages .... 10-23
10.4.5 Conclusions .. 10-27
10.5 References . . . 10-28
xvi

EPRI Proprietary Licensed Material
LIST OF FIGURES
XVii

EPRI Proprietary Licensed laterial
xviii

EPRI Proprietary Licensed AMaterial
xix

EPRI Proprietary Licensed Material
LIST OF TABLES
xxi

_____ Prpretr Licensed ____---U-
EPRI Proprietary Licensed Material _
xxii

EPRI Proprietary Licensed Material
xxiii

EPRI Proprietary Licensed Material
INTRODUCTION
This addendum provides a 2004 update to the NP-7480-L Addendum 5 database report (2002)for outside diameter stress corrosion cracking at tube support plates. Specifically, the databasesfor 3/4 and 7/8 inch tubing are updated by this Addendum 6. In addition, five new or revisedmethods updates, which have been submitted to the NRC for approval or information, areincluded in this report as described below. The revisions to the methods include major changesto the POPCD and voltage dependent growth analysis methods. The new methods includeallowances for extreme growth values in operational assessments, ARC noise analysisrequirements and preventive repair guidelines.
Pulled tube data from one plant with 3/4 inch tubes and two plants with 7/8 inch tubes are addedto the database (Sections 3, 4 and 5). The data are evaluated against the EPRI data exclusioncriteria and indications not excluded on this basis are included in the ARC database andcorrelations. Based on these evaluations, two bobbin indications are added to the 3/4 inchdatabase and three bobbin indications are added to the 7/8 inch database. All five of these newindications had leakage at SLB conditions. Additional destructive examination results areincluded for intersections at TSPs that had no detectable degradation in the field inspectionincluding two 3/4 inch and one 7/8 inch datapoints. No new test results have been obtained forthe forces required for axial tensile tearing of cellular indications, and the correlations ofAddendum 2 remain applicable for axial tensile tearing.
The revised databases are used to update the ARC correlations (Section 6) for burst pressure,probability of leakage and SLB leak rate as a function of bobbin coil voltage for both 3/4 and 7/8inch diameter tubing. Although the changes to the ARC correlations are modest, the newcorrelations for both 3/4 and 7/8 inch tubing should be implemented in all new ARC analysesbeginning with the fall 2004 outages. The 7/8" leak rate correlations were meaningfully affectedin that the p value for the leak rate correlation was reduced to well below 5%. This is expectedto lead to a reduction in the calculated total leak rates for plants with 7/8" diameter tubes.
A major revision to the Addendum 5 probability of prior cycle detection (POPCD) as a functionof bobbin voltage is developed in Section 7 for use in ARC supporting analyses for end of cyclevoltage distribution projections. Implementation of the POPCD methods for reference ARCoperational assessments requires NRC approval, which is not yet obtained for generalapplications. The recommended POD is developed from field inspection results since 1994 forinspections implementing the ARC for ODSCC at TSP intersections. The POPCD developmentuses results of one inspection to evaluate the POD at the prior inspection. The updated PODincludes forty-one inspections from thirteen plants in contrast to the Addendum 5 thirty-seveninspections.
1-1

-Il-
EPRI Proprietary Licensed Material
Introduction
For Addendum 5, the overall content of the addenda was significantly extended to incorporateessentially all applicable prior information on updates to NDE techniques, ARC analysismethods and ARC programmatic information. The intent is to maintain the addenda as a self-standing document for data and methods changes since the release of Addendum I and NRCGeneric Letter 95-05. Sections 5 and 6 include all data and correlations even if not revised froma prior addendum. Section 8 provides new updates to methodology supporting ARCapplications. For this addendum, new methods are included for "Extreme Values of ODSCCARC Indications or Growth", "Noise Requirements for Voltage Based ARC", and "ARCGuidelines for Preventive Repair of Large +Point Indications". The method for extreme growthvalues is intended for application only with NRC approved POPCD methods and requires NRCapproval for implementation. The noise analysis requirements require NRC approval toimplement the recommended changes to the associated repair limits although the methods givenin the section can be used to select indications with high noise levels for RPC inspection. Theguidelines for preventive repair do not require NRC approval. Section 9 documents NRCapproved changes to the ARC databases, analysis methods and program. For example, thissection includes the protocol for updating the ARC correlations, the tube removal requirements,changes to the database such as excluding the French data and revisions to the analysis methodssuch as techniques for leak rate analyses. There are no changes to Section 9 for this addendum.Section 10 includes industry recommended changes to the ARC databases, analysis methods andprogram that are either details below the level required for NRC approval or recommended onlyfor sensitivity analyses. Examples of the industry recommendations below the level requiringNRC approval are techniques for calibrating NDE standards against the reference standard,methods for obtaining bobbin voltages for indications found by RPC in less than 5 volt dents andgrowth rate data for deplugged tube indications. This addendum provides a major revision to theARC analysis methods for voltage dependent growth rates in Section 10. Since GL 95-05requires an assessment for voltage dependent growth and the voltage dependent growth methodsdo not conflict with the GL, NRC approval is not required to apply voltage dependent growthanalyses for the reference ARC analyses in operational assessments when voltage dependence isindicated by the growth rate data. In most applications without preventative plugging, it isexpected that the use of voltage dependent growth rates will lead to more conservativepredictions of SLB burst probability and leakage.
1-2

EPRI Proprietary Licensed Material
2SUMMARY AND CONCLUSIONS
2.1 Updated Database and Correlations for 3/4 Inch Diameter Tubing
The database report for 3/4 inch diameter tubing of Addendum 5 of NP 7480-L (Reference 2-1)was based on laboratory and pulled tube data available to 2002. Two 3/4" diameter tubes fromPlant DW were pulled in 2003 for destructive examination since the preparation of Addendum 5.Two TSP intersections for each of the two tubes were destructively examined. Tube RIOC39had a bobbin indication of 4.51 volts at TSP 2 and was bobbin NDD at TSP 3. Maximum depthsof 100% and 39% were found by destructive examination for the two intersections. The TSP 2indication leaked at normal operation and SLB conditions. Tube RI IC41 had a bobbinindication of 2.45 volts at TSP 3 and was bobbin NDD at TSP 2. Maximum depths of 100% and54% were found by destructive examination for the two intersections. The TSP 3 indicationleaked at normal operation and SLB conditions. The pulled tube data were incorporated intoupdated burst pressure, probability of leakage and leak rate versus bobbin coil voltagecorrelations for ARC applications. Evaluation of data for inclusion in the correlations isconsistent with the EPRI data exclusion criteria. Addition of these pulled tube data to the ARCburst and leakage data resulted in negligible changes in the burst and leakage correlations.
2.2 Updated Database and Correlations for 7/8 Inch Diameter Tubing
This report updates the database for 7/8 inch diameter tubing given in Addendum 5 of NP7480-L (Reference 2-1). Two tubes were pulled in 2003 from Plant Y-2 and one tube in 2004from Plant Y-1. Voltages for the two indications from Plant Y-2 tubes R44C45 and R35C57 are21.5 and 5.09 volts. The 21.5 volt indication in R44C45 is the largest pulled tube bobbin voltagein the 7/8 inch ARC database. Both indications leaked at SLB conditions. Two TSPintersections from Plant Y-1 tube R20C54 were destructively examined. The TSP 1 intersectionhad a bobbin voltage of 5.60 volts and the TSP 2 intersection was bobbin NDD. The maximumdepths for the two indications were 100% and 46%. The TSP 2 indication with a throughwalllength of 0.12 inch leaked only at SLB conditions. -The pulled tube data were incorporated intoupdated burst pressure, probability of leakage and leak rate versus bobbin coil voltagecorrelations for ARC applications. Evaluation of data for inclusion in the correlations isconsistent with the EPRI data exclusion criteria. Addition of these pulled tube data to the ARCburst and leakage resulted in a negligible change in the burst correlation and a significant changein the leak rate correlation. The 7/8" leak rate correlations were meaningfully affected in that thep value for the leak rate correlation was reduced to well below 5%. This is expected to lead to areduction in the calculated total leak rates for plants with 7/8" diameter tubes.
2-1

I-
EPRI Proprietary Licensed Material
Sunmnary and Conclusions
2.3 Supplemental Test Data
The pulled tube results add two 3/4 inch and one 7/8 inch data points to the pulled tubedestructive examination results for intersections at TSPs that had no reportable degradation(NDD) in the field inspection. As noted above, the maximum depths for the NDD indicationswere 54%, 39% and 46%. The lowest measured burst pressure for these three NDD indicationswas 10,428 psi. No additional data have been obtained since Addendum 2 to update pulled tubetest data for the forces required for axial tensile rupture of cellular ODSCC indications or forburst data on indications pressurized inside a TSP. The available data from prior addenda areincluded in Section 5 for complete documentation of the EPRI database.
The field NDD results are provided to demonstrate the size of indications that may not bedetected in a field inspection. There are 262 field bobbin indications that have been destructivelyexamined. The maximum crack depth of any field bobbin NDD indication is only 62%. Theseresults strongly support adequate detection of ODSCC indications and imply a high POD atsignificant voltages, consistent with the voltage dependent POD developed in this report. Burstpressures were obtained with the lowest measured burst pressure of 9,063 psi which shows anegligible decrease compared to a typical value of about 10,500 psi for undegraded tubing.
2.4 Recommended Probability of Detection (POD)
The Addendum 5 information on probability of prior cycle detection (POPCD) for a voltagedependent POD is completely revised in this report to reflect a new statistical method forcalculating the POD distribution based on a generalized linear model. The tabular format forreporting the detection data is also significantly revised in this report. The recommended PODas a function of bobbin voltage is updated based on evaluation of additional inspection resultsfrom plants implementing the ARC for ODSCC at TSP intersections. This POD developmentutilizes extensive experience integrated over forty-one (increased from thirty-seven inAddendum 5) ARC inspections and thus uses historical ARC operating experience as the basisfor the recommended POD. Inspection results from SGs with both 3/4 and 7/8 inch diametertubing are used to obtain the POD. The development uses the POPCD based on the ratio ofindications reported at the prior inspection to the total indications (reported in prior cycle plusnew indications) found at tile subsequent inspection. The resulting POPCD for combined 3/4and 7/8 inch tubing ranges from about 20% at 0.1 volt to about 90% at 1.4 volts and 98% at 5volts. The revised methods and additional data do not significantly change the POPCDdistribution reported in Addendum 5. The recommended POD is in good agreement with anEPRI POD developed using multiple analysts to evaluate a large number of field indications with"truth" for indications based on "expert" opinion.
2.5 NDE, Analysis Methods and Program Updates
For Addendum 5, the overall content of the addenda was significantly extended to incorporateessentially all applicable prior information on updates to NDE techniques, ARC analysismethods and ARC programmatic information. The intent is to maintain the addenda as a self-standing document for data and methods changes since the release of Addendum I and NRCGeneric Letter 95-05. Section 8 provides new methods supporting ARC applications. Section 9
2-2

EPRI Proprietary Licensed Material
Summary and Conclusions
documents NRC approved changes to the ARC databases, analysis methods and program, andSection 10 includes industry recommended changes to the ARC databases, analysis methods andprogram that are either details below the level required for NRC approval or recommended onlyfor sensitivity analyses. New methods in Section 8 would be moved to either Section 9 or 10 inthe next addendum.
For this addendum, new methods are included in Section 8 for "Extreme Values of ODSCC ARCIndications or Growth", "Noise Requirements for Voltage Based ARC", and "ARC Guidelinesfor Preventive Repair of Large +Point Indications". The method for extreme growth values isintended for application only with NRC approved POPCD methods and requires NRC approvalfor implementation. The extreme values methodology utilizes a historical database for largegrowth rates > 5 volts/EFPY to include the potential for obtaining an extreme growth value in theARC operational assessment. The occurrence of extreme growth values is generally a randomevent, particularly for 7/8 inch tubing. The database on large growth values is sampled in theMonte Carlo analyses based on the historical probability of occurrence. The noise analysisrequirements revise the inspection and tube repair requirements for noise considerations that arecurrently based on mixed residual measurements per GL 95-05. The revised noise analysistechniques use noise amplitude measurements as developed under the EPRI Integrity ToolsProgram for application to future ETSSs and field noise analyses. This methodology requiresNRC approval to implement the recommended changes to the associated repair limits althoughthe methods given in the section can be used to select indications with high noise levels for RPCinspection. The guidelines for preventive repair are defined to improve detection of indicationswith large +Point voltages for preventive repair in order to reduce the potential for large voltagegrowth indications. Since these guidelines lead to optional implementation of preventive tuberepair, these methods do not require NRC approval.
There are no changes from Addendum 5 for Section 9 for NRC approved methods updates sincethe new methods submitted to the NRC for approval have not yet been completely reviewed bythe NRC. This section includes the protocol for updating the ARC correlations, the tube removalrequirements, the EPRI data exclusion criteria, changes to the database such as excluding theFrench data and revisions to the analysis methods such as techniques for leak rate analyses.
The industry recommendations in Section 10 below the level requiring NRC approval aremethods for obtaining bobbin voltages for indications found by RPC, techniques for crosscalibrating NDE standards against the reference standard, voltage dependent growth ratemethods and growth rate data for deplugged tube indications returned to service. This addendumprovides a major revision to the ARC analysis methods for voltage dependent growth rates inSection 10. The revised methods are applied to divide the growth rate data into voltage binsbased on statistical methods to define the break points between voltage bins. Since GL 95-05requires an assessment for voltage dependent growth and the voltage dependent growth methodsdo not conflict with the GL, NRC approval is not required to apply voltage dependent growthanalyses for the reference ARC analyses in operational assessments when voltage dependence isindicated by the growth rate data. In most applications without preventative plugging, it isexpected that the use of voltage dependent growth rates will lead to more conservativepredictions of SLB burst probability and leakage.
2-3

- -
EPRI Proprietary Licensed Material
Summary and Conclusions
2.6 References
2-1 NP-7480-L, Addendum 5, 2002 Database Update, "Steam Generator Tubing ODSCC atTube Support Plates Database for Alternate Repair Limits" prepared for EPRI byWestinghouse (November 2002), 1007660.
2-4

EPRI Proprietary Licensed Material
3EVALUATION OF PULLED TUBE DATA FOR 3/4 INCHDIAMETER TUBING
This section provides an update to the 3/4" tubing database of Addendum 5 based on addition ofthe data from the Plant DW 2003 pulled tubes.
3.1 Plant DW 2003 Pulled Tubes
3.1.1 Tube Examination Summary
Sections of hot leg tubes were removed from Plant DW SG 2 for tubes RIOC39 and RI IC41.The tube cuts were located below the 04H support, thus the TSP 1 (flow distribution baffle), TSP2 and TSP 3 intersections were removed for examination. Bobbin DSI indications and +Pt axialOD indications were reported at the RIOC39 TSP 2 and RI IC41 TSP 3 intersections. The flowdistribution baffle plate intersections were NDD by both field and laboratory bobbin and +Pointexaminations and were not destructively examined. The principal results of the tube examination(Reference 3-1) are described in this section.
Non Destructive Examination
A summary of the field and laboratory eddy current results for this tube is provided in Table 3-1.Similar probes were used in the laboratory as in the field, namely a 0.6 10" diameter bobbinprobe and 0.610" diameter +Pt probe. Reviews of the field analysis results produced essentiallyequal results to the original field calls as shown in Table 3-1. The laboratory NDE of the post-pull tube sections yielded results very close to the field calls indicating that there was likelynegligible ligament tearing during the tube pulling operations. The RIOC39 TSP 3 and RI IC41TSP 2 intersections were NDD in the field and post pull examinations. The +Point resultsindicate that the R1OC39 TSP 2 and RI IC41 TSP 3 indications are dominantly single axialindications with a potential small second indication at the RlOC39 TSP 2 intersection.
Destructive Examination
Following NDE of the as-received tube sections, elevated temperature (600°F) leakage testingwas performed for the TSP 2 intersection of RIOC39 and TSP 3 intersection of RI IC41. Thetesting program included holds at the normal operating pressure differential, intermediate testpressures between normal operating pressure differential and SLB, and SLB pressuredifferential. Leakage was reported at the normal operating pressure differential and for all test
3-1

.- - t
EPRI Proprietary Licensed Material
Evaluation of Pulled Tube Data for 3/4 Inch Diameter Tubing
pressures for both tubes. Between about 2085 psi and 2402 psi for RIOC39 TSP 2, a ligamentlikely tore, thus producing a factor of four increase in leak rate between these two pressuredifferentials. Table 3-3 presents the leak rate test results for the elevated temperature leak ratetesting of the RIOC39 TSP 2 intersection. The leak testing for the RI 1C41 TSP 3 indication,given in Table 3-4, suggests that ductile tearing of a ligament likely occurred between about1999 and 2095 psi, resulting in a leak rate increase from 0.0004 gpm to 0.0016 gpm.
Following elevated temperature leak testing, room temperature burst testing was conducted forthe TSP 2 regions, TSP 3 regions, and freespan regions of both tubes. Pressurization rate waslimited to 200 psi/second during the burst test. All burst testing was performed in a freespanmode, i.e., no TSP restraint was provided. The lowest burst pressure was reported for the TSP 2region of R IOC39, at 4,931 psi. The TSP 3 region of RI IC41 burst at 6,999 psi. The burstpressures for the TSP NDE NDD locations and the freespan burst pressures were greater than12,000 psi as provided in Table 3-2. All burst openings were axially oriented.
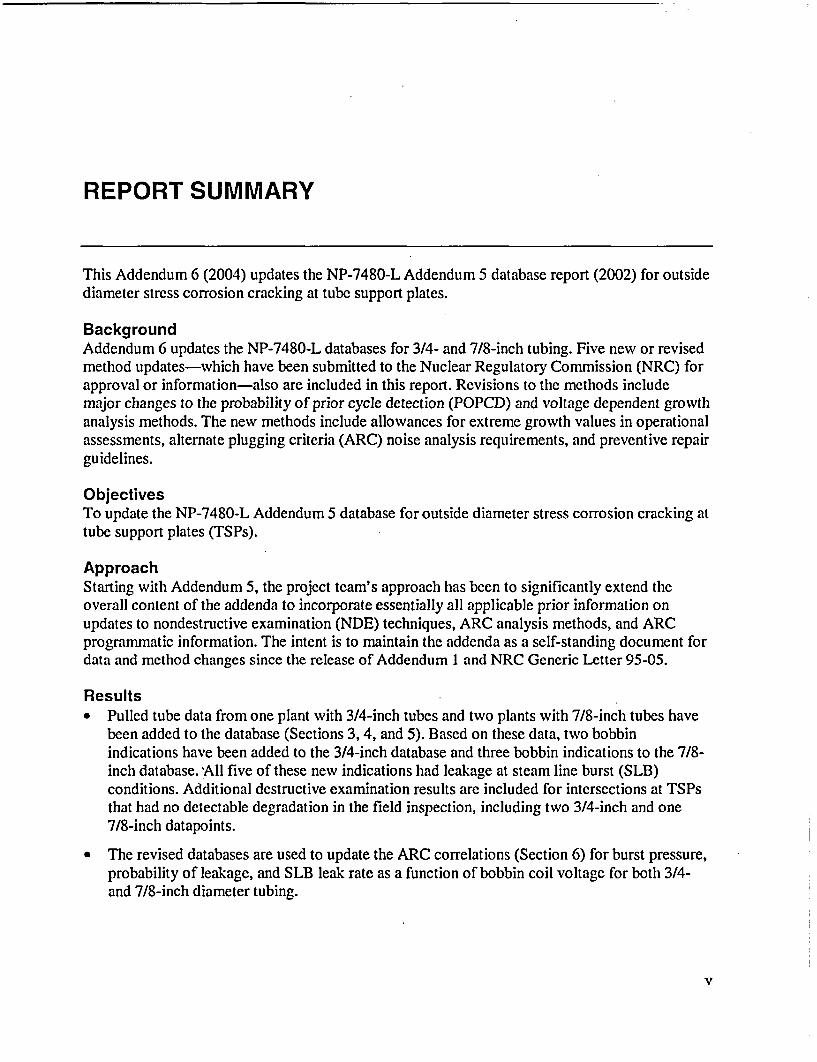
Table 3-5 provides the destructive exam depth profiles for all four TSP intersections. The NDDintersections were found to have corrosion cracks with maximum depths of 39.3% for RIOC39TSP 3 and 53.7% for RI IC41 TSP 2. Both of the indications that leaked had maximum depthsof 100%. Hlowever, only one point in the depth profile had 100% depth such that thethroughwall lengths were very short. The RIOC39 TSP 2 intersection had a length of 0.062" thatwas greater than 98% deep, which likely tore in the leak tests to lead to higher leakage for thislocation than the RI IC41 TSP 3 location.
The yield and ultimate strength values were determined using a tensile tests for the freespansections of the pulled tubes. The yield and ultimate strengths for the tubes are given in Table 3-2. The material properties are high compared to nominal material properties for 3/4 inch tubing.
Transverse metallography indicated that the OD cracking was limited in angular involvementwith negligible cellular or intergranular corrosion. The predominant degradation mode ischaracterized as axial ODSCC typical of the ARC database morphology.
3.1.2 Plant DW Pulled Tube Evaluation for ARC Applications
The pulled tube examination results were evaluated for application to the EPRI database forARC applications. The data for incorporation into the EPRI database were then defined andreviewed against the EPRI data exclusion criteria to provide acceptability for the database.
Eddy Current Data Review
Table 3-I provides a summary of the eddy current data evaluations for the Plant DW pulled tube.The field and laboratory reevaluations of the field bobbin data are in good agreement for theindications. The post-pull laboratory inspection results show negligible differences from thefield results, which indicates insignificant ligament tearing during the tube pulling operations.
3-2

EPRI Proprietary Licensed Material
Evaluation of Pulled Tube Data for 3/4 Inch Diameter Tubing
Plant DW Data for ARC Applications
The pulled tube leak test, burst test and destructive examination results are summarized in Table3-2. The leak rate data in Table 3-2 are adjusted to reference SLB conditions based on applyingthe EPRI leak rate adjustment procedure of Reference 3-2 to the measured data of Table 3-2.
The Plant DW pulled tube results were evaluated against the EPRI data exclusion criteria ofSection 9.3 for potential exclusions from the database. Criteria la to le apply primarily tounacceptable voltage, burst or leak rate measurements and indications without leak testmeasurements. Data exclusion Criterion Id provides for tube damage from tube pull forces, butrequires that supporting analyses show that the uncorroded ligaments would not have torn underSLB conditions. None of the Criteria la to le are applicable to the Plant DW pulled tubeindications. Criterion 2a applies to atypical ligament morphology and states that indications withS 2 uncorroded ligaments in shallow cracks'< 60% deep shall be excluded from the database.Table 3-2 identifies the number of remaining ligaments and the maximum depths for theindications. The indications have more than two remaining uncorroded ligaments and Criterion2a is not applicable to the pulled tubes. Criterion 3 applies to potential errors in the leakagemeasurements and is not applicable to the indications since there are no known issues associatedwith the leakage measurements.
As shown in the last column of Table 3-2, the TSP 2 indication of RIOC39 and the TSP 3indication of RI IC41 are to be included in the probability of leakage, leak rate and burstcorrelations. The NDE NDD locations at TSP 3 of RIOC39 and TSP 2 of Rl IC41 are notincluded in the ARC correlation database but are added to the tabulation of field NDE NDDpulled tube indications in Section 5.5 and Table 5-5.
3.2 References
3-1 SG-SGDA-04-1, Rev. 1, "Steam Generator Pulled Tube Examination, Watts Bar Unit 1 -Cycle 5 RFO," Westinghouse Electric Company, March 2004.
3-2 EPRI Report NP-7480-L, Volume 2, Revision 1, "Steam Generator Tubing OutsideDiameter Stress Corrosion Cracking at Tube Support Plates - Database for AlternateRepair Limits, Volume 1: 3/4 Inch Diameter Tubing", Appendix B, August 1996.
3-3

EPRI Proprietary Licensed Alaterial
Evaluation of Pulled Tube Data for 3/4 Inch Diamieter Tubing
Table 3-1Summary of Plant DW 2003 Pulled Tube Eddy Current Results
Field Call Lab. Reevaluation of Field Data Post Pull DataTube TSP Bobbin + Point Bobbin 1 Depth + Point Bobbin + Point
Voltsl') Volts Voltst1 ) I Volts Volts Volts
1. Field and laboratory data include cross calibration of ASME standard to the reference laboratory standard.
Table 3-2Plant DW 2003 Pulled Tube Data for ARC Applications
T Bobbin Data Destructive Examination Results Leak Rate-l1hr Burst Pressure Data - ksi Use inTube S +Point Max. Avg. Crack No. N. 0. SLB SLB Meas. (YsU Adj.(3) Corr.
P Volts Depth Volts Depth Depth Length Lig. (2) 1450 2405 2560 Burst Burst Note 4(inch) psid psid psid Press. Press.
Notes:
3-4
H

EPRI Proprietary Licensed AMaterial
Evaluation of Pulled Tube Data for 3/4 Inch Diameter Tubing
Table 3-3R1 OC39 TSP 2 Elevated Temperature Leak Rate Test Data
Primary | Secondary 1 Primary Leak Ratee IPressure Pressure Temperature (gal/min)
Min.Test 1 Max .
AverageMin
Test 2 Max
Average
Test 3 Max .Average
MinTest 4 Max
Average
Test 5 MaxAverage
Test 6 MaxAverage- .Min
Test 7 MaxAverageMin
Test 8 Max .< Average
Test 9 MaxAverageM ini_ _ _ _ _ _ _ _ _ _ _ _ _ _
Test 10 MaxAverage.
Test 11 Max .AverageMin
Test 12 Max_ _ Average
M ini_ _ _ _ _ _ _ _ _ _ _ _ _ _ _ _ _
Test 13 Max
._ _ _ A verage _ _ _ _ _ _ _ _ _ _ _ _ _ _ _ _ _ _ _ _ _ _ _ _ _ _ _
3-5

EPRI Proprietary Licensed Material
Evaluation of Pulled Tube Data for 3/4 Inch Diameter Tubing
Table 3-4R11C41 TSP 3 Elevated Temperature Leak Rate Test Data
I Primary Secondary Primary Leak RateDelta P Pressure Pressure Temperature (gal/mmn)
MinTest 1 Max l
Average
Test 2 MaxAverageMin
Test 3 Max l
AverageMinl
Test 4 Max
____ ___ Average_ _ _ _ _ _
MinlTest 5 Maxl
AverageMin
Test 6 Max l
A verage__ _ _ _ ___ _ _ _ _ _ _ __ _ _ _ _
MinlTest 7 Max l
AverageMinl
Test 8 Max l
MinTest 9 Max l
Average
Test 10 MaxAveragelMinl
Test 11 MaxAverage l
MinlTest 12 Max
AverageMin
Test 13 Max__ _ _
3-6
EPRI Proprietary Licensed Material
Evaluation of Pulled Tube Data for 3/4 Inch Diameter Tubing
Table 3-5Plant DWTubes R10C39 and R11C41 Burst Macrocrack Depth Profiles
R1OC39 TSP 2 R1OC39TSP3 R11C41 TSP 2 R11 C41 TSP 3
Axial Axial Axial AxialPosition Depth Position Depth Postion Depth Postion Depth
(mils) (%/) (mils) (%/) (mils) (%) (mils) (/)
3-7

EPRI Proprietary Licensed Material
4EVALUATION OF PULLED TUBE DATA FOR 7/8 INCHDIAMETER TUBING
This section provides an update of the database for 7/8" diameter tubing based on pulled tubeexaminations completed since the preparation of Addendum 5 of this report. Additional pulledtube data were obtained from Plant Y-1 and Plant Y-2. One tube was pulled from Plant Y-1 andtwo intersections were destructively examined. Two tubes were pulled from Plant Y-2 with oneTSP intersection destructively examined for each tube. Tube R44C45 from Plant Y-2 had a 21.5volt bobbin indication, which is the largest voltage indication for any pulled tube in the ARCdatabase.
4.1 Plant Y-1 2004 Pulled Tube
4.1.1 Tube Examination Summary
A section of hot leg tube was removed from Plant Y- 1, R20C54, SG 11 in 2004. The tube cutwas located approximately below the 03H support, thus the TSP 1 and TSP 2 intersections wereremoved for examination. A bobbin DSI indication and +Pt axial OD indications were reportedat the TSP 1 intersection while the TSP 2 intersection was NDD by both the bobbin and +Pointinspections. The tube was pulled after chemical cleaning of the SGs that included both a bulkremoval process targeted at removal of OD deposits on the tube freespan sections and top oftubesheet region. No additional cleaning steps were applied for cleaning of the TSP crevices.The principal results of the tube examination (References 4-1 to 4-3) are described in thissection.
Non Destructive Examination
A summary of the field and laboratory eddy current results for this tube is provided in Table 4-1.Similar probes were used in the laboratory as in the field, namely a 0.720" diameter bobbinprobe and 0.720" diameter +Pt probe. TSP 1 had a 5.6 volt bobbin indication and a 4.0 +Pointindication. The laboratory NDE of the post-pull tube sections indicated modest flaw amplituderesponse increases for both the bobbin and +Pt coils. Figure 4-1 shows the field +Point terrainplot for the TSP 1 intersection. The intersection is dominated by a substantial axial indicationwith two smaller parallel axial indications (0.27 and 0.08 volt) in close proximity to thedominant flaw. No indications were detected by either the bobbin or +Point coils at the TSP 2intersection in the field inspection. The post-pull bobbin was also NDD and a small 0.15 voltindication interpreted as a volumetric indication was identified. Based on the destructive
4-1

U.
EPRI Proprietary Licensed ,Material
Evaluation of Pulled Tube Data for 7/8 Ilelc Diameter Tubing
examination results described below, the volumetric call is attributable to a cellular corrosionpatch.
Destructive Examination
Following NDE of the as-received tube sections, room temperature leakage testing wasperformed for the TSP 1 and TSP 2 intersections of R20C54. The testing program includedholds at the normal operating pressure differential, an intermediate test pressure between normaloperating pressure differential and SLB, and the SLB pressure differential. For the 01intersection, leakage was reported only at 2705 psi which includes a 10% increase fortemperature and a 100 psi increase for pressure measurement uncertainty above the targeted SLBpressure differential of 2405 psi. Table 4-3 presents the leak rate test results for the elevatedtemperature leak rate testing of the TSP intersections. The room temperature measurement atTSP I of 0.002 gprn corresponds to 0.00078 gpm or 0.17 liter/hr at elevated temperature and2450 psi. For the TSP 2 indication, no leakage was reported for any test pressure.
Following the leak testing, the crack surfaces were oxidized at elevated temperature tocharacterize ligament tearing during the leak tests and to distinguish tearing at SLB conditionsfrom tearing during the burst tests. Room temperature burst testing was conducted for the TSP Iregion, TSP 2 region, and freespan region of the tube. The pressurization rate was limited to<800 psi/second during the burst test. All burst testing was performed in a freespan mode, i.e.,no TSP' restraint was provided. The lowest burst pressure was reported for the TSP I region at5,819 psi. The TSP 2 region burst at 10,428 psi. The freespan burst pressure was 11,695 psi.All burst openings were axially oriented. Based on examination of the oxides on the crack facesfollowing the burst testing, it was concluded that no ligament tearing occurred during the SLBleak tests although tearing would have been predicted by analytical models for ligament tearing.
The yield and ultimate strength values were determined using a tensile test for a freespan sectionof the pulled tube. The yield strength was 52.03 ksi, ultimate strength was 105.64 ksi, for a flowstress (sumn of yield + ultimate divided by 2) of 79.33 ksi. The mean room temperature flowstress for 7/8" OD x 0.050" nominal wall mill annealed Alloy 600 tubing is 75.47 ksi, thus theflow stress was only slightly higher than the average flow stress for all 7/8" OD tubing.
The burst crack faces of R20C54 were examined by fractography to measure the ODSCC depthsas a function of axial position. The depth profiles are given in Table 4-4. TSP I wasthroughlwall with a throughwall length of about 0.12 inch with an overall crack length of 0.701inch and average crack depth of about 54.3%. If the two very short microcracks at the end of thecrack are ignored, the average depth over the 0.649 inch length would be 58.5%. The TSP 2crack had a maximum depth of 45.6% with an average depth of 25.6%. This indication, whichwas bobbin and +Point NDD, extended outside of the TSP by about 0.045 inch. The maximumdepth at the top edge of the TSP was about 16%. The very shallow depth outside of tile TSP istypical of the few indications found to extend outside the TSP. It is very likely that the shallowcracking outside the TSP occurred in deposits on top of the TSP. The SGs were chemicallycleaned during the outage that the tubes were pulled, which would significantly decrease thepotential for future cracking outside the TSP.
4-2

EPRI Proprietary Licensed Material
Evaluation of Pulled Tube Datafor 7/8 Inch Diameter Tubing
The TSP intersections were visually examined following the burst tests. For the TSP 1indication, the OD cracking was dominated by a single crack. One of the secondary cracks couldbe seen visually following the burst test. Transverse metallography sections were examined atthe TSP centerline and about 0.1 inch above the TSP centerline. At the TSP centerline, 19 crackscould be identified by metallography, principally between 2380 and 620, with the maximumdepth of 53% found for one of the two indications identified in the +Point inspection. At 0.1inch above the centerline, 10 cracks were identified between 220° and 3300 with a maximumdepth of 65%. The predominant degradation mode is characterized as axial ODSCC.
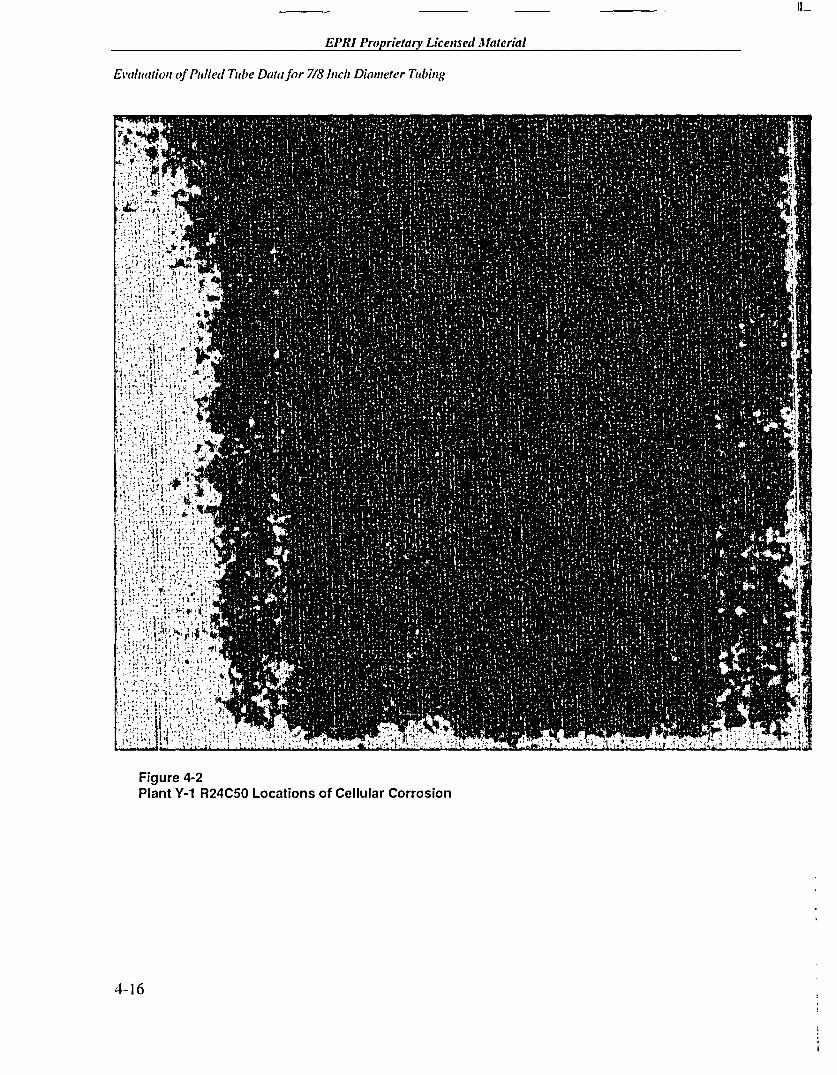
For the TSP 2 location, as seen in the sketch of Figure 4-2, two cellular corrosion patches werevisually identified following the burst test including one adjacent to the burst opening. Thecellular patch near the burst opening could be seen to extend slightly outside the TSP. Radialgrinds in 0.005 inch increments were performed to assess the depth of the oblique crackingforming the cellular patches. Figure 4-3 shows the results from four radial grinds at an areaadjacent to the burst opening. It can be seen that the cellular corrosion decreases significantlybetween depths of 9.6 and 21%. At 42% depth, no cellular patches are seen and no degradationwas found at a depth of 54%. Similar results were found for the other two radial grinds wherethe deepest grind at 69% had no corrosion present. The crack morphology for the TSP 2indication is dominantly shallow cellular corrosion, which is a morphology consistent with theARC database.
4.1.2 Plant Y-1 Pulled Tube Evaluation forARCApplications
The pulled tube examination results were evaluated for application to the EPRI database forARC applications. The data for incorporation into the EPRI database were then defined andreviewed against the EPRI data exclusion criteria to provide acceptability for the database.
Eddy Current Data Review
Table 4-1 provides a summary of the eddy current data evaluations for the Plant Y-1 pulled tube.The field and laboratory reevaluations of the field bobbin data are in good agreement for theindications. The post-pull laboratory inspection results show a modest 22% increase in bobbinamplitude and a 12% increase in +Pt amplitude for the TSP 1 intersection. These increases tendto indicate that minor ligament tearing or opening of the crack faces occurred during the tubepulling operation.
Plant Y-1 Data for ARC Applications
The pulled tube leak test, burst test and destructive examination results are summarized in Table4-2. The leak rate data in Table 4-2 are adjusted to reference SLB conditions based on applyingthe EPRI leak rate adjustment procedure of Reference 4-4 to the measured data of Table 4-3.
The Plant Y-I pulled tube results were evaluated against the EPRI data exclusion criteria ofSection 9.3 for potential exclusions from the database. The TSP 2 indication was bobbin NDDand there is no need to evaluate the indication against the exclusion criteria since the data is not
4-3

UI-
EPRI Proprietary Licensed Material
Evaluation of Pulled Tube Data for 7/8 Inch Diameter Tubing
included in the ARC burst and leakage correlations. Criteria la to le apply primarily tounacceptable voltage, burst or leak rate measurements and indications without leak testmeasurements. Data exclusion Criterion Id provides for tube damage from tube pull forces, butrequires that supporting analyses show that the uncorroded ligaments would not have torn underSLB conditions. The number or size of the uncorroded ligaments were not reported in the tubeexamination. However, there is no basis to exclude the TSP I indication based on the exclusionCriterion Id. Criterion 2a applies to atypical ligament morphology and states that indicationswith < 2 uncorroded ligaments in shallow cracks < 60% deep shall be excluded from thedatabase. The TSP I indication is too deep for application of Criterion 2a. Criterion 3 applies topotential errors in the leakage measurements and is not applicable to the indications since thereare no known issues associated with the leakage measurements.
As shown in the last column of Table 4-2, the TSP I indication of R20C54 is to be included inthe probability of leakage, leak rate and burst correlations. The TSP 2 indication is excludedfrom all correlations since there was no detectable bobbin indication.
4.2 Plant Y-2 2003 Pulled Tubes
4.2.1 Tube Examination Summary
Two tubes were removed from the hot leg side of SG-24 of Plant Y-2 (R44C45 and R35C57)and examined (Reference 4- 1) by Areva in support of the 2 volt ARC application. Tube R44C45was pulled due to its very high bobbin voltage of 21.5 volts. Tube R35C57 was pulled as a highvoltage indication expected to leak and help rill data gaps in the leak rate correlation. Theexamination was conducted by Areva-Framatome to assess burst pressures and leak rates as wellas to characterize corrosion at the steam generator TSP crevice locations. The TSP 2 indicationswere destructively examined for both tubes based on high voltage indications by both the bobbinand +Point coils. The TSP I intersections had no detectable degradation and were notdestructively examined. The principal results of the tube examination (References 4-5 to 4-7)are described in this section.
Non Destructive Examination
A summary of the field and laboratory eddy current results for the two tubes is provided in Table4-5. There are no significant differences between the field voltage calls and the reevaluation ofthe field data. The R44C45 21.5 bobbin volt indication is the largest pulled tube voltage in theARC database. Similar probes were used in the laboratory as in the field, namely a 0.720"diameter bobbin probe and 0.720" diameter +Pt probe.
The laboratory NDE of the post-pull indications show flaw amplitude response increases by 52%and 66% for bobbin and 25% to 29% for +Point. These voltage increases are indicative of someligament tearing or crack face opening as a result of the tube pull operations. The R44C45 TSP2 intersection had two +Point indications both of which were destructively examined.
4-4

EPRI Proprietary Licensed Material
Evaluation of Pulled Tube Datafor 7/8 Inch Diameter Tubing
The R44C45 bobbin voltage had increased from 2.0 to 21.5 volts over the last operating cycleand the +Point voltage increased from 2.97 to 12.24 volts. Based on amplitude sizing of theindication from the +Point data, the crack grew from near of just throughwall to a throughwalllength of about 0.4". The large voltage increase over the operating cycle is attributable to theexponential dependence of voltage on depth and throughwall length for which voltage increasesrapidly near throughwall depths and again approximately exponentially with throughwall cracklength.
Destructive Examination
Following NDE of the as-received tube sections, the two TSP intersections were leak tested atroom temperature conditions. The testing program included holds at the normal operatingpressure differential, an intermediate test pressure between normal operating pressure differentialand SLB, and SLB pressure differential. Table 4-7 presents the leak rate test results. The resultsshow an exponential dependence of leakage on pressure differential. The R35C57 indication didnot leak at normal operating pressures even though the indication was found to have a 0.217 inchthroughwall crack length.
Following the leak testing, the crack surfaces were oxidized at elevated temperature tocharacterize ligament tearing during the leak tests and distinguish from tearing during the bursttests. Room temperature burst testing was conducted for the TSP 2 regions and freespan regionsof the two tubes. All burst testing was performed in a freespan mode, i.e., no TSP restraint wasprovided. The lowest burst pressure was reported for the R44C45 indication at 4,226 psi. Eventhough the flaw was a 21.5 volt indication and predicted by the ARC burst correlation to have aburst probability near the reporting threshold of 0.01, the burst pressure significantly exceededSLB pressures and the 1.4 APSLB burst margin requirements for Plant Y-2. The R35C57indication burst at 5,961 psi. The freespan burst pressures were above 12,000 psi as given inTable 4-6. All burst openings were axially oriented. Based on examination of the oxides on thecrack faces following the burst testing, it was concluded that only negligible ligament tearingoccurred for the R44C45 indication and that no ligament tearing occurred for the R35C57indication during the SLB leak tests although tearing would have been predicted by analyticalmodels for ligament tearing.
The yield and ultimate strength values were determined based on tensile tests for freespansections of the pulled tube. The room temperature yield strengths were 54.5 ksi and 58.1 ksi andultimate strengths were 99.7 and 105.4 ksi for R44C45 and R35C57, respectively. The meanroom temperature flow stress for 7/8" OD x 0.050" nominal wall mill annealed Alloy 600 tubingis 75.47 ksi, thus the flow stresses of the pulled tubes are about 2-8% higher than the averageflow stress for all 7/8" OD tubing.
Following the burst testing, the two intersections were visually examined. A second crack wasvisible at both the R44C45 and R35C57 intersections, but there was no apparent cellularcorrosion at either intersection.
Crack depths were obtained by fractography for the burst openings. Two indications for R44C45and the burst crack for R35C57 were depth profiled with the profiles given in Table 4-8. The
4-5
U.-
EPRI Proprietary Licensed Material
Evaluation of Pulled Tube Data for 7/8 Inch Diameter Tubing
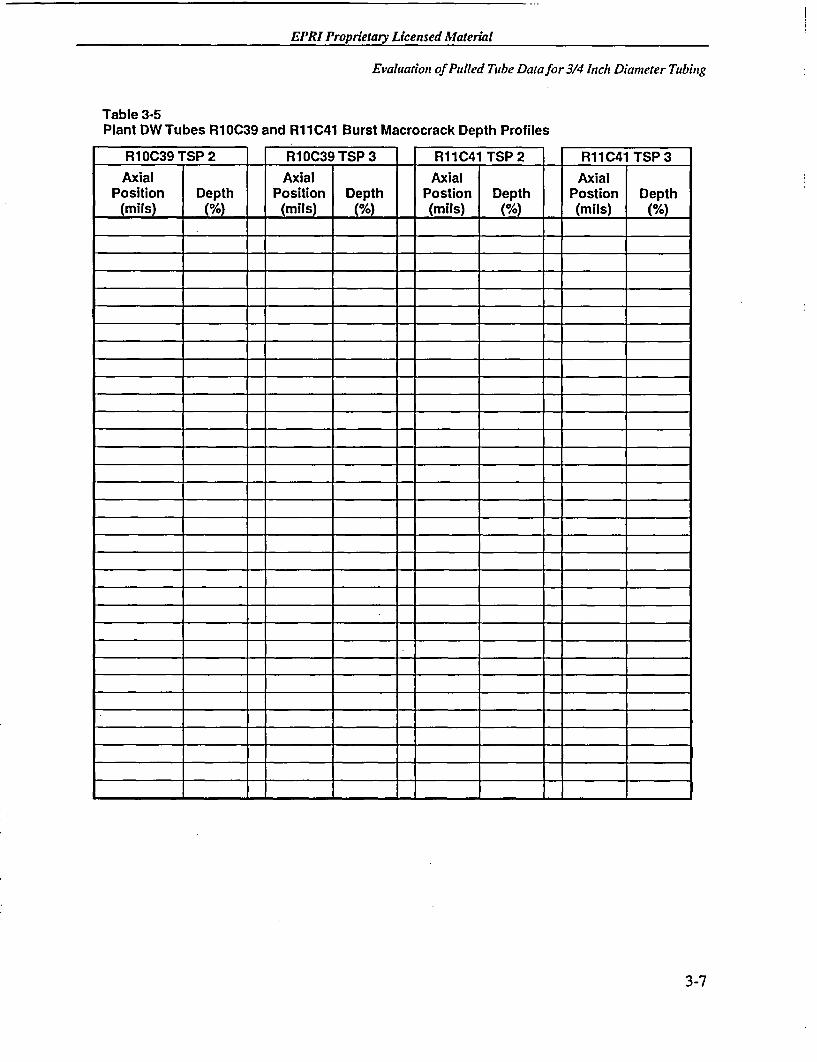
maximum depths for the two R44C45 indications were 100% and 78%, respectively. TheR35C57 burst crack was also throughwall for 0.217 inch with a crack length of 0.519 inch. TheR44C45 burst crack length was 0.701 inch with a throughwall length of 0.374 inch. The burstopened a microcrack offset by about 0.025 inch from the main crack that had a throughwalllength of 0.056 inch. The R44C45 secondary crack length was 0.356 inch. All crack lengthswere within the TSP.
Transverse metallographic sections were prepared for both TSP intersections. The resultsshowed cracking near the burst opening of R44C45 and two additional closely spaced crackswith depths of 53% and 65% at the location of the transverse section cut. The fractography afterbending open the region of the two additional cracks revealed the 78% maximum depth crackdescribed above. The transverse cut for R35C57 identified a near throughwall crack about 100from the burst opening that was too close to the burst crack to permit detection by eddy currentor opening for depth profiling.
In summary, the crack morphology for both tubes is dominated by a few axial intergranularcorrosion cracks with no apparent cellular corrosion and the morphology is typical of that in theEPRI ARC database.
4.2.2 Plant Y-2 Pulled Tube Evaluation for ARC Applications
The pulled tube examination results were evaluated for application to the EPRI database forARC applications. The eddy current data were reviewed, including reevaluation of the fielddata, to finalize the voltages assigned to the indications. The data for incorporation into theEPRI database were then defined and reviewed against the EPRI data exclusion criteria toprovide acceptability for the database.
Eddy Current Data Review
Table 4-5 provides a summary of the eddy current data evaluations for the Plant Y-2 pulled tube.The field and laboratory reevaluations of the field bobbin data are in good agreement for theindications. The post-pull laboratory inspection results show voltage increases by factors of 1.52to 1.66 for bobbin and 1.25 to 1.29 for +Point. The amplitude increases tend to indicate thatsome ligament tearing or crack face opening from the tube pulling operation.
Plant Y-2 Data for ARC Applications
The pulled tube leak test, burst test and destructive examination results are summarized in Table4-6. The leak rate data in Table 4-6 are adjusted to reference SLB conditions based on applyingthe EPRI leak rate adjustment procedure of Reference 4-4 to the measured data of Table 4-7.
The Plant Y-2 pulled tube results were evaluated against the EPRI data exclusion criteria ofSection 9.3 for potential exclusions from the database. Criteria la to le apply primarily tounacceptable voltage, burst or leak rate measurements and indications without leak test
4-6

EPRI Proprietary Licensed Material
Evaluation of Pulled Tube Datafor 7/8 Inch Diameter Tubing
measurements. Data exclusion Criterion Id provides for tube damage from tube pull forces, butrequires that supporting analyses show that the uncorroded ligaments would not have torn under
SLB conditions. However, it is not possible to demonstrate that any potential uncorrodedligaments would not have torn under SLB conditions, and there is no basis to exclude the twoindications based on exclusion Criterion Id. Criterion 2a applies to atypical ligamentmorphology and states that indications with •2 uncorroded ligaments in shallow cracks < 60%deep shall be excluded from the database. The uncorroded ligaments for the indications are notincluded in the destructive exam report. However, both indication depths are throughwall andCriterion 2a is not applicable. Criterion 3 applies to potential errors in the leakage measurementsand is not applicable to the indications since there are no known issues associated with theleakage measurements.
As shown in the last column of Table 4-6, the TSP 2 indications of R44C45 and R35C57 are tobe included in the probability of leakage, leak rate and burst pressure correlations.
4.3 References
4-1 51-5046570-01, "Examination of Diablo Canyon Unit I Steam Generator Tube No.R20C54", Revision 1, Final Report, August 2004, Areva - Framatome ANP, Inc.
4-2 51-5044913-00, "Eddy Current Tube Pull Examination for PG&E Diablo Canyon Unit 1April 2004", June 2004, Areva - Framatome ANP, Inc.
4-3 51-5044611-00, "Diablo Canyon Unit 1 Tube Pull Leak Rate Test Results", May, 2004,Areva - Framatome ANP, Inc.
4-4 EPRI Report NP-7480-L, Volume 1, Revision 2, "Steam Generator Tubing OutsideDiameter Stress Corrosion Cracking at Tube Support Plates - Database for AlternateRepair Limits, Volume 1: 7/8 Inch Diameter Tubing", Appendix B, August 1996
4-5 51-5027436-00, "Examination of Diablo Canyon Unit 2 Steam Generator Tubes", May2003, Framatome ANP, Inc.
4-6 5028414-01, 'DCPP 2R1 1 DE Input Transmittal to Westinghouse", May 30, 2003,Framatome ANP, Inc.
4-7 51-5025823-00, "Eddy Current Tube Pull Examination for PG&E Diablo Canyon Unit 2march 2003", Framatome, ANP, Inc.
4-7

EPRI Proprietaty Licensed Alaterial
Evaluation of Pulled Tube Datafor 7/8 Inch Diameter Tubing
Table 4-1Summary of Plant Y-1 2004 Pulled Tube Eddy Current Results
Field Call Lab. Reevaluation of Field Data Laboratory Post Pull DataTube TSP Bobbin + Point Bobbin Bobbin + Point Bobbin + Point
_ Volts(1 ) Volts"2 ) Volts~1 ) Depth Volts Volts Volts
Notes:2. Field and laboratory data include cross calibration of ASME standard to the reference laboratory standard.3. Two small cracks identified in close proximity to the burst crack.
Table 4-2Plant Y-1 2004 Pulled Tube Data For ARC Applications
T Bobbin Data Destructive Examination Results LeakRate-I/hr Burst Pressure Data - ksi Use inTube S +Point Max. Avg. Crack No. N.O. SLB SLB Meas. ay oU Adj. Corr.
P Volts Depth Volts Depth Depth Length Lig.(2) 1450 2405 2560 Burst Burst Note 4(inch) psid psid psid Press. Press.
Notes:
4-8

EPRI Proprietary Licensed AMaterial
Evaluation of Pulled Tube Data for 7/8 Inch Diameter Tubing
Table 4-3Plant Y-1 R20C54 Room Temperature Leak Test Measurements
TSP Pressure Hold Hold Time Leak Rate AveragePoints (psi) (min) (gpm) Pressurization
1Rate (psi sec)
4-9

EPRI Proprietary Licensed,1Material
Evaluation of Pulled Tube Data for 7/8 hIch Diameter Tubing
Table 4-4R20C54 Burst Macrocrack Depth Profiles
I R20C54, TSP 1 R20C54, TSP 2Axial Position (inch) Depth (%) Axial Position (inch) Depth (%)
4 4-4 4
4 4-4 4
4 4-4 4
4 4-4 4
¶ 4-4
$ 4-4 4
4 4-4I
4 4-4 4
4 4-4 4
4 t-4 4
4 4-4 *1
Ii I
4 4-4 4
4 4-4 .4
I *�I J
4-10

EPRI Proprietary Licensed faterial
Evaluation of Pulled Tube Datafor 7/8 Inch Diameter Tubing
Table 4-5Summary of Plant Y-2 2003 Pulled Tube Eddy Current Results
Field Call Reevaluation of Field Data Laboratory Post Pull DataTube TSP Bobbin + Point Bobbin Bobbin + Point Bobbin + Point
Volts~') Volts Depth Volts 2 ) Volts Volts
Notes:
Field and laboratory data include cross calibration of ASME standard to the reference laboratory standard.Maximum +Point Volts based on depth profiling of indications.
4-11

Il-
L.-
0=L) 0
*. o* av
.S 3 f)
(ACU
Cm(a0)
0~U)
a3
O
t3l
a2) 0X
%a
4
to
2
'.Z
Cl
2.
-
U)
76
._
C
0.
C-
coat
0)
1070I-
a-
n(L(CI
0 -.
0)-
Caj
U))
U) -L
Ca a
E
x
cm 7
> Q
0
C U,
Cu-
- 0
0 0
1.cn n.cl
0.0I-
aL
z

EPRI Proprielary Licensed Material
Evaluation of Pulled Tube Datafor 7/8 Inch Diameter Tubing
Table 4-7Plant Y-2 Room Temperature Leak Test Measurements
TSP Pressure Hold Hold Time Leak Rate AveragePoints (psi) (min) (gpm) Pressurization
._ Rate (psilsec)
4-13

fi-
EPRI Proprietary Licensed .1Iaterial
Evaluation of Pulled Tube Datafor 7/8 Inc/h Diameter Tubing
Table 4-8Destructive Exam Depth Profiles for R44C45 and R35C57 Indications at TSP 2H
R44C45-Crack 1 R44C45-Crack 2 R35C57Position Depth 0.025" Offset Position Position
(inch) ( Crack Depth _ (inch) Depth ((inch) Depth (%)
4-14

EPRI Proprietary Licensed Material
Evaluation of Pulled Tube Datafor 7/8 Inch Diameter Tubing
Figure 4-1Plant Y-1 R20C54 +Point Data for Indications at TSP 1
4-15
II -
EPRI Proprietary Licensed M1aterial
Evaliuation of Pulled Tube Datafor 7/8 Inch Diameter Tubing
Figure 4-2Plant Y-1 R24C50 Locations of Cellular Corrosion
4-16

EPRI Proprietary Licensed Material
Evaluation of Pulled Tube Datafor 7/8 Inch Diameter Tubing
Figure 4-3Plant Y-1 R20C54-1 Radial Grinds at Depths of 9.6%, 210/%, 33% and 42%
4-17

EPRI Proprietary Licensed Material
5UPDATED ARC DATABASES
This section presents updated databases obtained by adding the pulled tube specimen dataobtained in 2003 and 2004 to the Addendum 5 database presented in Reference 5-1. Thedatabases for 3/4" diameter tubes and 7/8" diameter are discussed separately below. The newdata added to the database are described in detail in Sections 3 and 4. The updated databasepresented have been utilized to develop updated ARC correlations for probability of leakage,leak rate, tube burst probability and axial rupture force presented in the next section (Section 6).
The database shows adjusted leak rates corresponding to two Aps: 2405 psi and 2560 psi. Thedata at 2405 psi Ap are applicable to a plant whose Tech Spec allows credit for operability of SGpower operated relief valve (PORV) under accident conditions in accordance with GL 95-05. Asin the past data, leak rates at 2560 psi Ap are applicable when no credit can be taken for SGPORV operability.
5.1 3/4" Data
The database for 3/4" diameter tubes has been revised in Table 5-1 to include the 2003 pulledtube data for two tubes with one bobbin indication for each tube from Plant DW as described inSection 3.
The database shown in Table 5-1 includes adjusted leak rates at two accident condition pressuredifferentials of 2405 psi and 2650 psi. The leak rate values were obtained using the same leakrate adjustment procedure as described in Reference 5-3. Leak rate data at 2405 psi Ap areapplicable to plants for which credit can be taken for operability of SG PORV in the design-basisaccident analyses.
5.2 7/8" Data
The database for 7/8" diameter tubes has been revised to include the Plant Y-1, 2004 with onebobbin indication from one tube and Plant Y-2, 2003 pulled tube data for two tubes with onebobbin indication from each tube. The new data included in the database for 7/8" diameter tubesare described in detail in Section 4.
The revised database is presented in Table 5-2. Table 5-2 identifies that the French data forPlants J-1, J-2, BA-1 and BB-4 have been excluded from the ARC database as discussed inSection 9.4.
5-1

HI
EPRI Proprietary Licensed Material
Updalted ARC Databases
As with the revised database for 3/4" diameter tubes, the revised database for 7/8" diameter tubesshown in Table 5-2 shows adjusted leak rate data at two accident condition pressure differentialsincluding 2405 psi and 2560 psi. Leak rate data at 2405 psi Ap are applicable to plants for whichcredit can be taken for operability of SG PORV under accident conditions in accordance with GL95-05.
5.3 Data for Burst Inside the TSP
No new tests have performed since 1995 to measure burst pressure for crack indications insidethe TSP. Therefore, no clhanges are needed to the current version of this database sinceAddendum 1, Reference 5-2. The data from Addendum I are included as Table 5-3.
5.4 Data for Axial Tensile Tearing
No new data have become available for axial tensile tearing of cellular corrosion at TSPintersections. A summalry of all of the applicable data through Addendum 5 (Reference 5-I) isprovided in Table 5-4.
5.5 Summary of Field NDD Data
Three new indications that were called NDD in the field have been obtained since Addendum 5including two NDD indications in 3/4 inch tubing from Section 3 and one in 7/8 inch tubingfrom Section 4. The database for field NDD indications is included as Table 5-5. Tile totalnumber of indications in the database is 262. The maximum crack depth for the database is 62%,and the lowest measured burst pressure in the database is 9,063 psi. The database stronglysupports the conclusion that ODSCC indications at TSP intersections not detected by the bobbininspection are not structurally significant and would not contribute to SLB leakage or burstprobability.
5.6 References
5-1 Addendum 5 to EPRI Report NP-7480-L (Report TR- 113861), "Steam Generator TubingODSCC at Tube Support Plates for Alternate Repair Limits, Database Update 2002",November 2002, 1007660.
5-2 Addendum I to EPRI Report, "Steam Generator Tubing Outside Diameter StressCorrosion Cracking at Tube Support Plates - Database for Alternate Repair Limits, NP-7480-L, August 1996.
5-2

EPRI Proprietaty Licensed Material
Updated ARC Databases
Table 5-13/4 Inch Diameter Pulled and Model Boiler Tube Leak Rate and Burst Pressure Measurements
BbiColDsrcie Normal SLB Leak Rate 2 x CorrelationSpecimen T BobbinColl Destructie Operation (1/hr)( 3 ) Burst Yield Ult| Flow Adjusted Application lPlant Number rPC.. Exami Leak Pressure Differential Press. Stress Stress Stress Burst
Code Row/rCo P Volts Depth Vows Max. LengthtZ Rate(3' 2405 2560 (psi) ( Su)j (ksl) Su Press.1 41 PoL Leak BurstC( 1/r) (psi)1li p sl ) . - ksD (ksl (psi Rate Press.
5-3

EPRI Proprielary Liceiised Alaterial
Updated ARC Databases
Table 5-1 (continued)3/4 Inch Diameter Pulled and Model Boiler Tube Leak Rate and Burst Pressure Measurements
- II-Dsrcie Normal SLB Leak Rate Bus il l. 2 x CorrelationCod e cie orobi Voilt Dstructive_ Operation (11hr) (3 us il l. Flow Adjusted Application (5)
Plant Number S RPC Exam Leak P (1/hr) n|lPress. Stress Stress Stress Burst
C Row/Col P Volts Depth Max. Lengtht Rate° | 2405 2560 (psi) (ksi) (ksi) S y+ SLI Press. | PoL Leak BurstI w__ _ _ _ Depth tin.) (1/hr) (psi) (psi) (s____ (ksi) (psi) Rate I Press.
5-4

EPRI Proprietary Licensed Afaterial
Updated ARC Databases
Table 5-1 (continued)3/4 Inch Diameter Pulled and Model Boiler Tube Leak Rate and Burst Pressure Measurements
IIr Dsrcie rNormal SLB Leak Rate 2 x Correlation|Specimen | Bobbin Col Destructive Operation (1/hr) i3 Burst Yield U|t. Flow Adjusted Application (5)
Codt ume r Row/ColLa PesueDifr~-a Press. Stress Stress Stress BurstCd or P Volts Depth Vot Max. Length"" Rate(3) 2405 12560 ( Si) ( si) ( Si y+ Su Press. 4)PoL Leak Burst
C Row/ICol P I____ Depth (in.) (1/hr) (Psil I (ps ( (psi) (ksi) (kso l) (psi __ Rate Press.
I I I I= I -I1
= - I---- .- = = = i I_ I-
5-5

EPRI Proprietary Licensed Alaterial
Updated ARC Databases
Table 5-1 (continued)314 Inch Diameter Pulled and Model Boiler Tube Leak Rate and Burst Pressure Measurements
PlnNubrBbinCi Pxmoprmatio S hr 3 Pres.Stek StreseFlo AdjusedrAplation(5Specimen T Bobbin Coil Destructive Operation l (1ShL L) Burst Yield USt. x Corre ldjuss |pBationurtCodt umeor Volts Exam____ Leak Pressure Ditterential 1rss Stes trs Stress Burst
C o/ P Volts Depth Max 1 Length"" Rate1 3 1 2405 2560 (psi) (ksi) (ksi) | S+ s Press.1 4 PRow/Co_ I ___ Depth J (in.) (1/hr) (psi) 56 (psi) ________si (ksi) (psi) [ Reate BuPress.
(p i (p i IRatIIIIe IIII
5-6

EPRI Proprietary Licensed AMaterial
Updated ARC Databases
Table 5-1 (continued)314 Inch Diameter Pulled and Model Boiler Tube Leak Rate and Burst Pressure Measurements
SpcmnI Dsrcie fNormal SLB Leak Rate Brt Yed U. 2 x CorrelationTSpecimen Bobbin Coill Detructive Operation | (1hr) |BPress. |ress | Str Flaw Adjusted Application (5)
Plant Number s Volt _ Exam Leak 'Pressure Differential Pe s. , Stes-tes -es usRow/Cal P -Volts" Depth Vot Max. Length('e Rate13) 2405 2560 ps) (SY) (Si) Sv 5 Press.( 4) a Leak Burst_ow__o_ Depth (in. (1/hr) 1 (psi) ! (psi = ! ks___ (ksl) (psi _____J Rate Press.
E - __ _
NOTES:
5-7

EPRI 1roprielary Licensed AMaterial
Updated ARC Databases
Table 5-27/8 Inch Diameter Pulled and Model Boiler Tube Leak Rate and Burst Pressure Measurements
Specimen Detutve Nra Vhr) 13) Burst Yield Ult. 2 x Adutd Cr rltoPlant Number T Bobbin Coil RPC Exam Operation | Pr eu S | Burst Application (5)
Latek rsue PrsueSrs Stress Flw Ajutd CrrltoCode or P Volts Leak Differential S, I S ress Pressure(4 _
Row/Col Volts", Depth Max. Lengtht' (Uhr) 2405 2560 (psi) (ksi) (ksi) (ksi) (psi) PoL Leak BurstDepth (in.) (psi) _s _ _ _ate Press..
= =___ ______ Dept ________ _____ _ (psi (psi _ _i
5-8

EPRI Proprietaty Licensed Afaterial
Updated ARC Databases
Table 5-2 (continued)7/8 Inch Diameter Pulled and Model Boiler Tube Leak Rate and Burst Pressure Measurements
Dsrcve Normal SLB Leak Rate 2 xPlant Number Destructive Orai (I/hr)(3) Burst Yield UB. Adjusted CorrelationSPeciNmben T Bobbin Coll RPC Exam Lperatio Pressure Pressure Stress Stress Flow Adurste Corrlation )Code or P Volts _Rate(3) Differential Sy Su Stress Pressure"')
Row/Col Volts Depth Max. Lengthi" (Vr) 2405 2560 (psi) (ksi) (ksl) (SU (psi PoL Leak BurstDepth (in.) _(psi) (ps Rate Press..
5-9

EPRI Proprietary Licensed Mtaterial
Updated ARC Databases
Table 5-2 (continued)7/8 Inch Diameter Pulled and Model Boiler Tube Leak Rate and Burst Pressure Measurements
INormal SLB Leak )RateSpecimen T Bobbin Coil Destructive Operation (Vhr)('3 Burst YieldNumber S RPC Exam Leak Pressure Pressure Stress
or 1Volts Ranei3) Differential SIor Vo t _ _ _ _ _ _ _ R ate~3Row/Col Volts" Depth Max. (iLength" Vhr) 2405 2560 (psi) (ksi)
Depth (in.) (psi) (psi)
5 -__ = - _= _ =
5- ==10 =
I
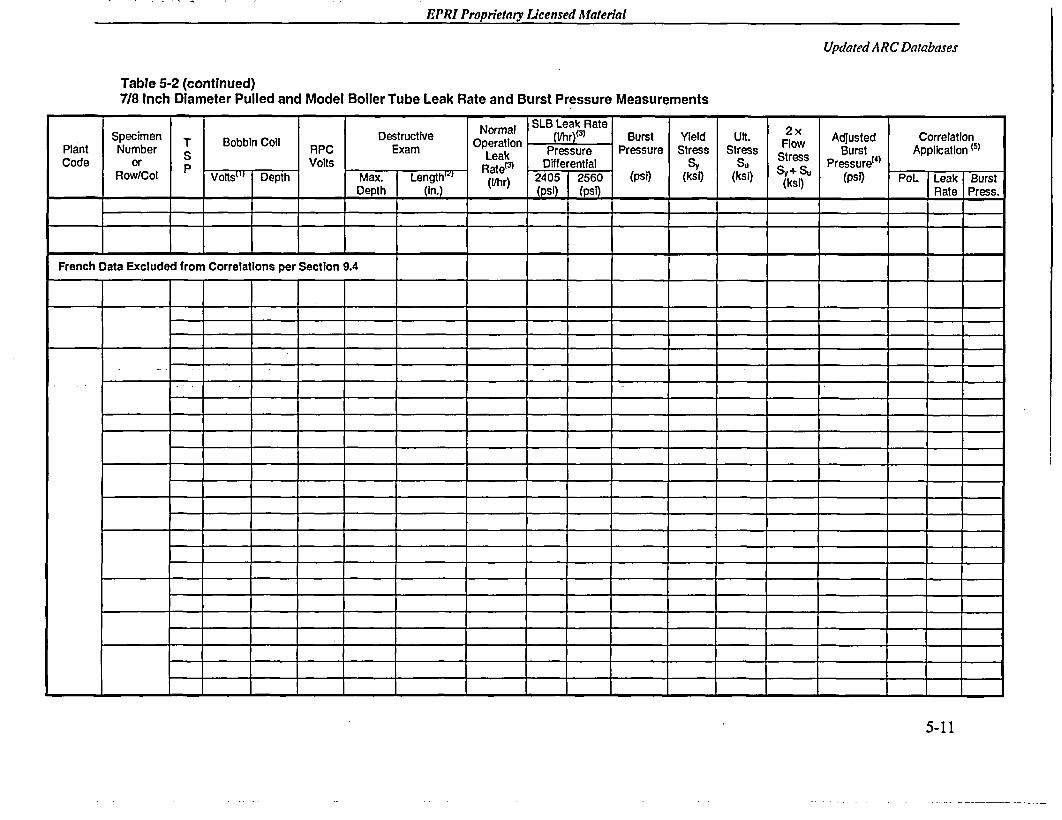
EPRI Proprietary Licensed AMaterial
Updated ARC Databases
Table 5-2 (continued)718 Inch Diameter Pulled and Model Boiler Tube Leak Rate and Burst Pressure Measurements
T BbiColDsrcie Normal SLB Leak Rate2x
Specimen Detutie(/hr) (3 Burst Yield Wil. 2Xlw Adjusted CorrelationPlant Number T Bobbin Coll RPC Exam Operation Pressure Pressure Stress Stress S trs ust Application (5)
Code or P VoVts Ratea 3 Dfferential SY Su S'esU PressureBRow/Col 2405Length a 40 2560 (Ps) (ks) {ksi) S) S D (P, PoL Leak Burst
Depth (in.) _____(psi) (psi) -I kl Rate Press.,
French Data Excluded from Correlations per Section 9.4
5-11

EPRI Proprietary Licensed M1alerial
Updated ARC Databases
Table 5-2 (continued)7/8 Inch Diameter Pulled and Model Boiler Tube Leak Rate and Burst Pressure Measurements
- . I NormalSLB Leak Rate 2Specimen T Bobbin Coil Destructive NOral (Vhr)(3) | Burst Yield Ult. 2 x Adjusted Correlation
Plant Numbe RPCl ExmOperation Flo Bus(Apiato)Pln ubr sRPExmLa Pressure Pressure Stress Stress Flows Adursted4 Corrlation
Code or Dth Volts Ranth' ea (ps) (pseeni)l (kSI ) RateSUPress.r
- Row/Col Volts Max. Len(th r) 2405 2560 (psi) (ksi) (ksi) | + SU (psi) PoL Leak Burst
Dept (in. (Vhr) (Pi (Pi k< aePes
5-12

EPRI Proprietary Licensed Material
UpdatedARC Databases
Table 5-2 (continued)7/8 Inch Diameter Pulled and Model Boiler Tube Leak Rate and Burst Pressure Measurements
NomlSLB Leak Rate 2Specimen T BbnColDestructive Noprmatio Vhr) 3) Burst Yield URt. Flow Adjusted Correlation
Plant Number T Bobbin Col RPC Exam Leat Pressure Pressure Stress Stress Flow Burst Application '5)Code or P Volts Rate(3) Differential Sy. S S Pressure4')
Row/Col Volts' Depth Max. Length" (Vhr) 2405 2560 (psi (ksi) (kS) (ksl) (psi) PoL Leak BurstDepth (in.) (pso (ps _Rate Press.
5-13

EPRI Proprielary Licensed Alaterial
Updated ARC Databases
NOTES:
19.
5-14

EPRI Proprietary Licensed Alaterial
Updated ARC Databases
Table 5-3Burst Capability for Indications Within the TSP -
5-15

11-
El'RI Proprietary Licensed Material
Updated ARC Databases
Table 5-4Database for Correlating Axial Rupture Strength of Cellular ODSCC Specimens withBobbin Amplitude
Yield Ultimate Rupture Strength Size NormalizedPlat TubeJTSP Bobbin AV A ., Force Normalized (klbf)
an Voltage (ksi) ksi (klbf) (klbf)
l_ _ _ _ _ _ __ _ _ _ _ _ _ l_ _ _ _ _ _ __ _ _ _ _ _ _ l_ _ _ _ _ _ _ _ _ _ _ _ _ _ _ _ _ _ _ _ _ _ _ l
Note: NUU specimens were assigned a value of 0.1 Volt similar to the assignment for NLU specimens usedin the development of the burst strength to bobbin amplitude correlations.
5-16

EPRI Proprietary Licensed AMaterial
Updated ARCDatabases
Table 5-5Pulled Tubes with Field Bobbin NDD Indications
Plant Tube TSP Field Field Destructive Exam Destructive TestsRPC Reevaluation
Bobbin I RPC Max. Ave. Crack Leak BurstVolts Volts Depth Depth Length Rate Press.
% % in. (Uhr) (psi)7/8" Tubes
_ __ __ __I__I___I __ _ _ __
I I ', I I I I I I II I I I I I I I I
5-17

I-
EPRI Proprietary Licensed Material
Updated ARC Databases
Table 5-5 (continued)Pulled Tubes with Field Bobbin NDD Indications
Plant Tube TSP Field Field Destructive Exam Destructive TestsRPC Reevaluation l
Bobbin RPC Max. Ave. Crack Leak BurstVolts Volts Depth Depth Length Rate Press.
_ % % in. (11hr) (psi)
5-18

EPRI Proprietary Licensed Material
6UPDATED ARC CORRELATIONS
This section reports on evaluations performed of results obtained from leak rate and burst testingof tubes removed from operating SGs at utility sites after the publication of Addendum 5 to theARC database in 2002. The original database for the structural and leak analyses of ODSCCindications was documented in References 6-1 and 6-2 for 7/8" and 3/4" diameter SG tubesrespectively. Modifications and additions to the database for both sizes of tubes were reported inReferences 6-3, -4, -5, -6 and -7 (Addenda 1, 2, 3, 4 and 5), and further in Sections 3, 4 and 5 ofthis report. The specific use of the data is also delineated in Section 5 of this report. Table 6-1provides the number of additional pulled tube data points obtained since Addendum 5 of thisreport was issued in 2002. In summary, separate correlations were developed for Westinghousedesigned SGs with drilled hole TSPs which employ 3/4 and 7/8" nominal diameter tubes whichrelate the burst pressure, the probability of leak (POL), and the leak rate to the bobbin inspectionamplitude for ODSCC at locations where degradation has occurred. It has also been postulatedthat axial tensile tearing of the tube could be of concern if the extent of the degradation were tobecome extreme in the circumferential direction. For this reason, a correlation was developedbetween the axial tensile tearing strength and the magnitude of the bobbin amplitude (no newdata have been added since the preparation of Addendum 2). Each of the correlations isdiscussed in the following sections.
Reference Database for 3/4" Diameter SG Tubes
A discussion of the additional data for 3/4" diameter tubes is provided in Section 3 of this report.The reference database for 3/4" diameter SG tubes is that of Addendum 5, Reference 6-7.Additional data were obtained from tests conducted on tube sections removed from Plant DW.The results from the destructive examination of the tube sections are provided in Section 3 of thisreport. The data values used in the analyses are summarized in Section 5. The parameters for theregression correlation equations were updated to reflect this change to the database.
Reference Database for 7/8" Diameter SG Tubes
A discussion of the additional data for 7/8" diameter tubes is provided in Section 4 of this report.The reference database for 7/8" diameter SG tubes is that of Addendum 5, Reference 6-7.Additional data were obtained from tests conducted on tube sections removed from Plants Y1and Y2. The results from the destructive examinations are provided in Section 4 of this report,and the data values to be used in the analyses are summarized in Section 5.
6-1

1l -
EPRI Proprietary Licensed laterial
Updated ARC Correlations
Reference Database for Axial Tensile Tearing
The database has not been changed from that which was documented in Addendum 2 toReferences 6-1 and 6-2 aIs no additional data have been obtained since then. Therefore, the axial,or tensile, tearing correlation. reported in Addendumn 2 remains valid.
6.1 3/4" Diameter Tubes Data Analysis
This section reports on the evaluations of data obtained from leak and burst testing of Alloy 600MA SG tubes with a nominal OD of 3/4" and a nominal thickness of 0.043".
6.1.1 Free Span Burst Correlation for 3/4" Tubes
The result from burst tests, performed on both tube specimens which exhibited a non-zerobobbin amplitude at a TSP elevation location, were considered for evaluation. The measuredburst pressures of the Plant DW tube specimens are depicted on Figure 6-1 and Figure 6-2relative to the burst pressure correlation developed using the Addendum 5 database. Figure 6-1illustrates the results relative to a 90% tolerance band expected for future test results. Thefollowing observations are apparent from an examination of that figure:
1. A visual examination of the data relative to the EPRI database indicates that the measuredburst pressures fall within the scatter band of the reference data.
2. The datia points for both of the indications fall within the 95% confidence band for 90% ofthe population about the regression line (5% in each tail). There is no strong indication of astatistical anlomlllly although the RIOC39 burst pressure is less than expected andapproximately on the lower tolerance line.
The net result is that the visual examination of the plot of the data indicates that there is nosignificant departure from the reference database. Based on the placement of the new data it maybe juidge(d that there would be no significant effect on the analysis of the residuals of theregression; either on the scatter plot of the residuals as a function of the predicted burst pressuresor on the normal probability plot of the residuals.
Since the Plant DW burst pressure data were not indicated to be from a separate population fromthe reference data, the regression analysis of the burst pressure on the common logarithm of thebobbin amplitude was repeated with the additional data included. A comparison of the regressionresults obtained by including these data in the regression analysis is provided in Table 6-2.Regression predictions obtained by including these data in the regression analysis are also shownOln Figure 6-2. A summiiary of the changes is as follows:
1. Intercept -The intercept of the burst pressure, Pi,. as a linear function of the commonlogarithim of the bobbin amplitude regression line is decreased by 0.3%, or about 20 psi.This has the effect of decreasing the predicted burst pressure as a function of the bobbinamplitude for small amplitudes. Although there is a tendency to decrease the value of the
6-2
EPRI Proprietary Licensed Material
Updated ARC Correlations
structural limit slightly, an examination of the figure reveals that the practical effects of thechange are negligible.
2. Slope -The absolute slope of the regression line is increased by 0.4%, i.e., the slope issteeper with the additional data. This has the effect of decreasing the burst pressure as afunction of bobbin amplitude for large indications. As with the change in the intercept, thetendency is to decrease the value of the structural limit, but the practical effect of the slopechange is negligible.
3. Standard Error- There is an increase in the standard error of the residuals of 1.0%. Theeffect of this change is reflected in a slightly larger deviation of the 95% prediction linefrom the regression line, leading to a tendency to decrease the calculated value of thestructural limit and minor changes in the probability of burst for a given voltage level.
The net effect of the changes on the 2560 psi differential pressure SLB structural limit (found as1.4-AP), using 95%/95% lower tolerance limit material properties, is to decrease it by 0.15V (to4.70V). The corresponding change on the 2405 psi structural limit is a 0.18V reduction (to5.65V). The decrease of the intercept and slope and the increase in the standard error leads tosmall increases in the expected probability of burst. Given the relatively small change in thestructural limit, the change in the probability of burst would also be expected to be small.Predicted values of the probability of burst of a single indication as a function of the bobbinamplitude are illustrated on Figure 6-3. The probability of burst is increased slightly over the fullrange of the data used for the correlation and beyond the effective range of interest.
6.1.2 Probability of Leak Correlation for 3/4" Tubes
The plant DW data were examined relative to the reference correlation for the POL as a functionof the common logarithm of the bobbin amplitude. Figure 6-4 illustrates the plant DW datarelative to the reference correlation. The lower amplitude indication had a calculated POL of16% and it leaked. The POL for the higher amplitude indication was calculated to be 70% and italso leaked. There is no implication of irregular results, i.e., outlying behavior is not indicated.The fact that the lower voltage indication leaked is not totally unexpected although the oddsagainst leakage were 5:1. Two other tube indications in the ODSCC ARC database exhibitedleakage at lower voltage levels.
In order to assess the quantitative effect of the new data on the correlation curve, the databasewas expanded to include the two Plant DW data points and a Generalized Linear Modelregression of the POL on the common logarithm of the bobbin amplitude was repeated. Acomparison of the regression parameters with those for the reference database is shown inTable 6-3. These results indicate:
1. Intercept - A 7.5% reduction in the absolute value of the logistic intercept parameter. Sincethe intercept is negative, this increases the intercept slightly. This is not unexpected giventhe fact that the lower voltage indication leaked.
2. Slope - A 4.2% decrease in the logistic slope parameter.
6-3

U1
EPRI Proprietary Licensed ,Material
Updated ARC Correlations
3. Variance/Covariance - The values of the elements of the covariance matrix of theparameters diminished in absolute value from 14 to 19%. Examination of Figure 6-4indicates that there is an increase in the POL over the entire range of interest for theapplication of the ARC. The POL increased by a factor of two at an amplitude of 0. IV (from1.7 to 3.5 10-6 ) and by a factor of 1.4 at IV (from 8-10 ' to 1.1.10-2). However, the POL is ofsecondary importance in determining the total estimated leak rate and the effect on predicted9 5 th percentile values would be expected to be small.
4. Mean Square Error - The mean square error (deviance divided by number of degrees offreedom) increased by 8.8%. The deviance increased, however this is expected when data isadded to the database because the deviance is akin to the error sum of squares. The Pearsonstandard deviation decreased slightly from 0.967 to 0.874. The ideal value for this indicatoris unity, however, change is judged to be not significant.
The ratio of the probabilities of leak as a function of bobbin amplitude is shown on Figure 6-5.As previously noted, when the total leak rate is determined using the leak rate to bobbin voltscorrelation, the result is usually quite insensitive to the form of the POL function. So, the effectof the cainges in the parameter values and variances would be expected to be small orimmaterial relative to the calcula6tion of the 95% confidence bound of the total leak rate from aSG.
6.1.3 Free Span SLB Leak Rate Correlation for 3/4" Tubes
The laboratory leak rate values are listed in Section 3 for the tested specimens. The leak rate testswere performed at elevated temperature conditions aind the results adjusted slightly to postulatedaccident conditions using the methodology described in Appendix B of Reference 6-2. The effectof the test results on the correlation parameters of the log-leak rate to log bobbin voltage arelisted in Table 6-4 for a differential pressures of 2560 and 2405 psi respectively. The changesdue to the inclusion of the additional data are as follows (described for two values of thedifferential pressure associated with a postulated steam line break event):
1. Intercepts - The intercepts of the regression equations decreased in absolute value by 7.2and 4.6% for postulated SLB event differential pressures of 2560 and 2405 psi respectively.
2. Slopes -The slopes of the regression equations decreased by 3.6 and 2.6% for differentialpressures of 2560 and 2405 psi respectively.
3. Standard Error Values - The standard deviations of the log leak rate prediction errors as afunction of the log bobbin amplitude were essentially unchanged, decreasing by 0.5 and1.2% respectively.
4. p Value - The one-sided p value for the correlation at a differential pressure of 2560 psidecreased from 2. 1.1 011 to 8.1.10-12, while the change for a AP of 2405 psi was from9.6- 10.1 to 2.1 0.12. In other words, the one-sided 95% confidence interval for thepopulaktion slope for the correlation of log leak rate to log bobbin amplitude does not includezero for either differential pressure of interest.
Figure 6-6 illustrates the results from the tests of the leaking specimens relative to the databasefor a (lifferential pressure of 2560 psi. Figure 6-8 provides a similar illustration for a differential
6-4

EPRI Proprietary Licensed Afaterial
Updated ARC Correlations
pressure of 2405 psi. The magnitude of the leakage from both indications is not remarkablerelative to the rest of the database. Both figures illustrate the effect of the added data points ontheir respective fitted regression lines (the median of the log-normal distribution) and on theexpected leak rate (the mean of the log-normal distribution). The net effect of adding the resultsis a slight increase in the predicted leak rates for bobbin amplitudes up to about 1OV, regardlessof the differential pressure of consideration, with a slight decrease thereafter.
Both the scatter and normal plots of the residuals of the regression analysis for both SLBdifferential pressures were confirmatory of assumptions made in performing the regressionanalysis, i.e., the residual log leak rates are independent of the predicted log leak rates, and theresiduals of the log leak rates approximate a normal distribution. Finally, an illustration of thecombined effect of the added data on the POL and leak rate is provided by the ratio informationpresented on Figure 6-7 and 6-9 for 2560 and 2405 psi, respectively. The relative increase in theleak rates is greatest for small indications with small leak rates.
6.1.4 General Conclusions Regarding 3/4" Data
The review of the effect of the Plant DW data indicates that the burst pressure and the probabilityof leak correlations to the common logarithm of the bobbin amplitude are slightly changed by theinclusion of the test data. Therefore, it is likely that the EOC probability of burst would not besignificantly affected by the addition of the Plant DW data. This was illustrated on Figure 6-3.
The effect of the data on the 9 5 th percentile of the total leak rate when only the POL isconsidered could be meaningful. However, when taken in conjunction with the minor changes inthe leak rate as a function of bobbin amplitude regression, the effect of the test data on the 9 5 th
percentile of the total leak rate is expected to be not significant.
6.2 7/8" Diameter Tubes Data Analysis
This section reports on the evaluations of data obtained from leak and burst testing of Alloy 600MA SG tubes with a nominal diameter of 0.875" and a nominal thickness of 0.050".
6.2.1 Free Span Burst Correlation for 7/8" Tubes
The result from burst tests, performed on the three tube specimens which exhibited a non-zerobobbin amplitude at a TSP elevation location, were considered for evaluation. The measuredburst pressures of the Plants Y1 and Y2 tube specimens are depicted on Figures 6-10 and 6-11relative to the burst pressure correlation developed using the Addendum 5 database. Figure 6-10illustrates the results relative to a 90% tolerance band expected for future test results. Thefollowing observations are apparent from an examination of that figure:
1. A visual examination of the data relative to the EPRI database indicates that the measuredburst pressures fall within the scatter band of the reference data.
6-5

1l
EPRI Proprietary Licensed,1Material
Updated ARC Correlations
2. The data points for all of the indications fall within the 95% confidence band for 90% of thepopulation about the regression line (5% in each tail), hence no statistical anomaly isindicated.
The conclusion to be drawn from the visual examination of the plot is that no significantdeparture from the reference database is indicated. Based on the placement of the new data, itcan also be judged that there would be no significant effect on the analysis of the residuals of theregression; either on the scatter plot of the residuals as a function of the predicted burst pressuresor oil the normal probability plot of the residuals. It is noted that the random probability of anyone indication result being below the regression line is 0.5. Thus, the probability of three randomresults being simultaneously below the regression line is 0.125. The departures from theregression line do not appear to be significant and further calculations regarding the data werenot performed.
Since the Plants YI aland Y2 burst pressure data were not indicated to be from a separatepopulation from the reference data, the regression analysis of the burst pressure on the commonlogarithm of the bobbin amplitude was repeated with the additional data included. A comparisonof the regression results obtained by including these data in the regression analysis is provided inTable 6-5. Regression predictions obtained by including these data in the regression analysis arealso shown on Figure 6-1 1. A summary of the changes is as follows:
1. Intercept - The intercept of the burst pressure, PI,, as a linear function of the comlimionlogarithii of the bobbin aamplitude regression line is decreased by 0.2%, or about 13 psi.This has the effect of decreasing the predicted burst pressure as a function of the bobbinamiplitudle for small amplitudes. AlthOughl there is a tendency to decrease the value of thestructural limit slightly, an examination of the figure reveals that the practical effects of tilechalige are negligible.
2. Slope -The absolute slope of the regression line is increased by 1 %, i.e., the slope issteeper with the additional data. This has the effect of decreasing the burst pressure as afunction of bobbin amplitude for large indications. As with the change in the intercept, thetendency is to decrease the value of the structural limit, but the practical effect of the slopechange is negligible.
3. Standard Error - There is a decrease in the standard error of the residuals of 0.6%. Theeffect of this change is reflected in a slightly smaller deviation of the 95% prediction linefrom the regression line, leading to a tendency to increase the calculated value of thestructural limit and insignificant changes in the probability of burst tbr a given voltage level.The tendency to increase the structural limit does not compensate fully for the decreaseeffected by changes in the intercept and slope.
The net effect of the changes on the 2560 psi differential pressure SLB structural limit (found asI .4-AP), using 95%195% lower tolerance limit material properties, is to decrease it by 0. 16 V (to7.51 V). The corresponding change on the 2405 psi structural limit is a 0.22 V reduction (to9.40 V). The decrease of the intercept and standard error and the increase in the slope leads tosmall changes in the expected probability of burst. Given the relatively smiall change in thestructural limit, the change in the probability of burst would also be expected to be small.Predicted VaIlIuCS of tile probability of burst of a single indication as a function of the bobbinamilplitude are illustrated on Figures 6-12 and 6-13 for differential pressures of 2560 and 2405 psi
6-6

EPRI Proprietary Licensed Material
Updated ARC Correlations
respectively. The probability of burst is reduced slightly up to an amplitude of about 0.9 V.Beyond that value the probability of burst is increased by a maximum of 11% at an amplitude of12.6 V, beyond the effective range of interest.
6.2.2 Probability of Leak Correlation
The Plants Y1 and Y2 data were examined relative to the reference correlation for the POL as afunction of the common logarithm of the bobbin amplitude. Figure 6-14 illustrates the Plants Y1and Y2 data relative to the reference correlation. The lower amplitude specimen had a calculatedPOL of 52% and it leaked. The POL for the higher amplitude indication was calculated to be0.99 and the indication leaked. There is no implication of irregular results, i.e., outlyingbehavior is not indicated.
In order to assess the quantitative effect of the new data on the correlation curve, the databasewas expanded to include the two Plants Y1 and Y2 data points and a Generalized Linear Modelregression of the POL on the common logarithm of the bobbin amplitude was repeated. Acomparison of the regression parameters with those for the reference database is shown in Table6-6. These results indicate:
1. Intercept - A 1.2% reduction in the absolute value of the logistic intercept parameter. Sincethe intercept is negative, this increases the intercept slightly.
2. Slope - A 2.7% increase in the logistic slope parameter.
3. Variance/Covariance - The values of the elements of the covariance matrix of theparameters changed from -3 to +5%. Examination of Figure 6-14 indicates that there is avery slight increase in the POL in the range of about 1.5 to 20 V. However, the POL is ofsecondary importance in determining the'total estimated leak rate and the effect on predicted9 5 th percentile values would be expected to be small.
4. Mean Square Error - The mean square error (deviance divided by number of degrees offreedom) increased by 4.4%. The deviance increased, however this is expected when data isadded to the database because the deviance is akin to the error sum of squares. The Pearsonstandard deviation increased slightly from 57.9 to 61.1%. The ideal value for this indicatoris unity, hence the change is insignificant.
In order to confirm the judgment that the changes are not significant, the reference correlationand the new correlation were also plotted on Figure 6-15 and Figure 6-16. The predicted POL foran indication with an amplitude of 0.1 V decreases by about 13%, increases by 13% foramplitudes slightly less than 3 V, increases by about 2% at 10 V, and the change is essentially nilat 20 V, see Figure 6-16. As noted, when the total leak rate is determined using the leak rate tobobbin volts correlation, the result is usually quite insensitive to the form of the POL function.So, the effect of the changes in the parameter values and variances would be expected to be smallor immaterial relative to the calculation of the 95% confidence bound of the total leak rate from aSG.
6-7

II
EPRI Proprietary Licensed Material
Updated ARC Correlations
6.2.3 Free Span SLB Leak Rate Correlation for 7/8" Tubes
The test leak rate values are listed in Section 4 for the tested specimens. The leak rate tests wereperformed at ambient conditions and the results adjusted to postulated accident conditions usingthe methodology described in Appendix B of Reference 6-2. The effect of the test results on thecorrelation parameters of the log leak rate to log bobbin voltage are listed in Table 6-7 fordifferential pressures of 2560 and 2405 psi respectively. The inclusion of the Plants Y I and Y2data tends to reverse the effect of data included for the Addendum 5 update to the database,w"here two indications leaked more than expected based on the previous regression analysis.Here, two of the indications with low voltages leaked less than expected. The changes due to theadditional data are as follows (described for two values of the differential pressure associatedwith a postulated steam line break event):
1. Intercepts - The intercepts of the regression equations decreased by factors of 4.8 and 1.5for postulated SLB event differential pressures of 2560 and 2405 psi respectively. Themedian and expected leak rates for an indication with a bobbin amlplitUde of I V decreasedsignificantly.
2. Slopes - The slopes of the regression equations increased by 33 and 25% for differentialpressures of 2560 and 2405 psi respectively. This is a necessary result corresponding to thereduction in the locations of the intercepts.
3. Standard Error Values - The standard deviations of the log leak rate prediction errors as afunction of the log bobbin amplitude were essentially uncainged, an increase of about 1%.
4. p Value - The one-sided p value for the correlation at a differential pressure ol 2560 psidecreased from 7.6% to 2.4%, wvhile the change for a AP of 2405 psi was from 2.3 to 0.5%.In other wvords, the one-sided 95% confidence interval for the population slope for thecorrelation of log leak rate to log bobbin amplitude does not include zero for eitherdifferential pressure of interest.
Figure 6-17 illustrates the results from the tests of the leaking specimens relative to the databasefor a differential pressure of 2560 psi at 616'F. Figure 6-20 provides a similar illustration for adifferential pressure of 2405 psi. Both figures illustrate the effect of the added data points ontheir respective fitted regression lines (the median of the log-normial distribution) and on theexpected leak rate (the mean of the log-normal distribution). The net effect of adding the resultsis a decrease in the predicted leak rates for bobbin -,amplitudes up to about 10 V, regardless of thedifferential pressure of consideration, with a slight increase thereafter.
Both the scatter and normal plots of the residuals of the regression analysis for both SLBdifferential pressures wvere confirinatory of assumptions made in performing the regressionanalysis, i.e., the residual log leak rates are independent of the predicted log leak rates, and theresiduals of the log leak rates approximate a normal distribution. Finally, illustrations of thecombined effect of the added data on the POL and leak rate are provided on Figures 6-18 and6-21 for the expected leak rate and by the ratio information presented on Figures 6-19 and 6-22for 2560 and 2405 psi, respectively.
The implication of the change in the p value is that an decreased fraction of Monte Carlosimulations will be performed considering that there is no correlation of the log leak rate to the
6-8

EPRI Proprietary Licensed Material
Updated ARC Correlations
log bobbin amplitude. This is because the number of simulations considering no correlation isdirectly proportional to the p value of the correlation. The effects of the uncorrelated test data onthe database itself are also listed in Table 6-7 for SLB differential pressures of 2560 and2405 psi. The mean of the log leak rate data decreased slightly for the differential pressures ofinterest. The standard deviation of the log leak rate data increased by 4% for a AP of 2560 psi,and 5% for 2405 psi.
6.2.4 Consideration of EdF Data
A commitment was made by the industry prior to the preparation of Reference 6-7 that futureupdates of the ODSCC ARC database would include the results of calculations made todetermine if the statistical findings regarding the French data remained valid with the inclusionof new data. The original statistical findings were that there existed a systematic bias in theFrench data that resulted in a regression curve with a significantly higher intercept than the USdata. Since the inclusion of the Plants YI and Y2 data actually reduces the intercept of theregression curve, see Table 6-5, even though the reduction is slight, the previous statisticalfindings would be expected to remain valid. Table 6-8 was updated to include the results of arepeat of the Reference 6-2 comparisons. As expected, the probability that the French data isfrom the same population as the US data was reduced, from 0.4 to 0.3%. The French data alsoincluded indications with large bobbin amplitudes that did not leak at SLB differential pressures.Since the inclusion of the Plants Y1 and Y2 data resulted in a slight increase in the POL atintermediated amplitudes, see Figure 6-16, the POL associated with the French data continues tobe counter to the corresponding experience with US data. In summary, the decision to excludethe French data from consideration for the analysis of US plants is supported by the inclusion ofthe Plants Y1 and Y2 data.
6.2.5 General Conclusions Regarding 7/8" Tubes
The review of the effect of the Plants YI and Y2 data indicates that the burst pressure and theprobability of leak correlations to the common logarithm of the bobbin amplitude are slightlychanged by the inclusion of the test data. Therefore, it is likely that the conclusions relative toEOC probability of burst would not be significantly affected by the addition of the Plants YI andY2 data. This was illustrated on Figure 6-12 and 6-13.
The effect of the data on the 9 5 th percentile of the total leak rate when only the POL isconsidered would also likely be small. However, the effect of the test data on the 9 51h percentileof the total leak rate is expected to lead to significant reductions due to changes in the regressionparameters of the log of the leak rate as function of the log of the bobbin amplitude as shown bythe leak rate ratios of Figures 6-19 and 6-22. Finally, it is noted that thep value for the regressionof the log of the leak rate on the log of the bobbin amplitude is reduced to a value less than 5%.
6.3 Axial Tensile Tearing Correlation
Section 6.3 of Addendum 2, Reference 6-4, presents axial strength information for cellularcorrosion based on a correlation of the remaining cross section area (CSA) of the tube as a
6-9

II
EIPRI Proprietary Licensed ,1aterial
Updated ARC Correlations
function of the bobbin amplitude of the TSP ODSCC. There have been no additional testsperformed since the Addendum 2 report was issued and no changes to the analysis of theAddendunm 2 data.
6.4 Summary/Conclusions
The 3/4" leak rate correlations were not meaningfully affected by the addition of the Plant DWdata to the ARC database. The 7/8" leak rate correlations were meaningfully affected in that thep value for the leak rate correlation was reduced to well below 5%. This is expected to lead to asignificant reduction in the calculated total leak rates for plants with 7/8" diameter tubes.
6.5 References
6-1. NP-7480-L, Volume 1, Revision 2, "Steam Generator Tubing Outside Diameter StressCorrosion Cracking at Tube Support Plates - Database for Alternate Repair Limits,Volume 1: 7/8 Inch Diameter Tubing," Prepared for EPRI by NVestinghiouse (August,1996).
6-2. NP-7480-L, Volume 2, Revision I, "Steam Generator Tubing Outside Diameter StressCorrosion Cracking at Tube Support Plates - Database for Alternate Repair Limits,Volume 2: 3/4 Inch Diameter Tubing," Prepared for EPRI by Westinghouse (August,1996).
6-3. NP-7480-L, Addendu mu 1, "Steam GeneratorTubing Outside Diameter Stress CorrosionCracking at Tube Support Plates Database for Alternate Repair Limits 1996 DatabaseUpdate," EPRI, Palo Alto, CA (November, 1996).
6-4. NP-7480-L, Addendum 2, "Steam Generator Tubing Outside Diameter Stress CorrosionCracking at Tube Support Plates Database for Alternate Repair Limits 1998 DatabaseUpdate," EPRI, Palo Alto, CA (April, 1998).
6-5. NP-7480-L, Addendum 3, "Steam Generator Tubing Outside Diameter Stress CorrosionCracking at Tube Support Plates Database for Alternate Repair Limits 1999 DatabaseUpdate," EPRI, Palo Alto, CA (November, 1999).
6-6. "Steam Generator Tubing Outside Diameter Stress Corrosion Cracking at Tube SupportPlates Database for Alternate Repair Limits, Update 2001," EPRI, Palo Alto, CA(August, 2001), 1006255 (Also known as Addendum 4)
6-7. "Steami Generator Tubing Outside Diameter Stress Corrosion Cracking at Tube SupportPlates Database for Alternate Repair Limits, NP 7480-L, Addendum 5, 2002 DatabaseUpdate," EPRI, Palo Alto, CA (November, 2002), 1007660
6-10

EPRI Proprietary Licensed Material
Updated ARC Correlations
Table 6-1Summary of Additional Data Relative to the Addendum 5 Database
Plant Identification | Burst Probability of | Leak | AxialI -Leak I Rate [ Rupture
Notes: None
Table 6-2Effect of Additional 3/4" Tube Data on the Burst Pressure versus Bobbin AmplitudeCorrelation
PB = a, + a, log(Volts) 1Parameter | Addendum 5 Addendum 6
Database Value Database Value
Intercept, ao
Slope, a,
Index of Deter., r2
Std. Error, aEr,,
Mean of log(V)
SS 1og(V) __
N (data pairs) __
Str. Limit (2560 psi) (1
Str. Limit (2405 psi) (1)
p Value for al (2)
11
, I . I
Reference ay _ _ _ : ;, '_____________I_______
Notes: (1) Values reflect a safety factor of 1.4 on the differential pressure associatedwith the postulated SLB event.
(2) Numerical values are reported only to demonstrate compliance with therequirement that the value be less than 0.05.
6-11

Il
EJPRI Proprietary Licensed Material
UpIared ARC Correlations
Table 6-3Effect of Database Changes on the 3/4" Tubes Probability of Leak Correlation
Pr(Leak) = 11+e -[b,+b 2log(Volts)]
Parameter | Addendum 5 | Addendum 6 1 New / Old| Database Value Database Value Ratio
Logistic Intercept, bi
Logistic Slope, bf
Intercept Variance, V,, (1
Covariance, V12
Slope Variance, V22
No. of Data, N
Deviance
Mean Square Error
Pearson Std. Deviation
Notes: (1) Parameters Vi are elements of the covariance matrix of the coefficients, b,, of theregression equation.
6-12

EPRI Proprietary Licensed AMaterial
Updated ARC Correlations
Table 6-4Leak Rate Data for 3/4" Tubes Leak Rate vs. Bobbin Amplitude Correlation(2560 & 2405 psi)
Q = 1 0 [b3 +b4 log (Volts)]
Parameter Addendum 5 Addendum 6 New / Old________ Database Value Database Value Ratio
SLB AP = 2560 psi
Intercept, b3
Slope, b4
Index of Determination,?
Std. Deviation, crEo, ( b,5Mean of Iog(Q)
SS of log(Q)
p Value for b2
Intercept, b3
Slope, b4
Index of Determination, __
Std. Deviation, (E,,,r ( b5) _
Mean of log(Q) . ._:.:
SS of log(Q) - . __, __ __
p Value for b2Common Data
6-13

1l
EPRI Proprietary Licensed M1faterial
Updated ARC Correlations
Table 6-5Effect of Database Changes on the 7/8" Tube Burst Pressure vs.Bobbin Amplitude Correlation
P11 = a, + a, log(Volts)Parameter Addendum 5 Addendum 6 New / Old
Database Value Database Value Ratio
Intercept, al
Slope, a1
2Index of Deter., r
Std. Deviation, GError
Mean of Log( V)
SS of Log(V)
N (data pairs)
Str. Limit (2560 psi)
Str. Limit (2405 psi)
p Value for a (2)
Reference A1
Notes:
6-14

EPRI Proprietary Licensed Material
Updated ARC Correlations
Table 6-6Effect of Additional Data on the 7/8" Tube Probability of Leak Correlation
Pr(Leak) =1+ebj+b2](V0tS)
Parameter | Addendum 5 1 Addendum 6 | New / Old_ Database Value [ Database Value Ratio
Logistic Intercept, b1 _
Logistic Slope, b2
Intercept Variance, VI, (2)
Covariance, V12
Slope Variance, V22
Number of Data, N if '
Deviance
Pearson SD
MSE
Notes:
6-15

II
EPRI Proprietary Licensed Material
Updawed ARC Correlations
Table 6-7Effect of Added Data on the 718" Tubes Leak Rate vs. Bobbin Amplitude Correlation(2560 psi)
Q = 1 0[b3+b4 log(Volts)]
Parameter Addendum 5 | Addendum 6 Effect_ _ _ _ _ Database Value Database Value [ Ratio
SLB AP = 2560 psi
Intercept, b3
Slope, b4
Index of Determination, ,2
Residuals, aEror (b5 )
Mean of Log(Q)
SS of Log(Q)
p Value for b4
SLB AP = 2405 psi
Intercept, b3
Slope, b4
Index of Determination, 2
Residuals, aE,,, (b5)
Mean of Log(Q)
SS of Log(Q)
p Value for b4 .
Common Data
Data Pairs, N
Mean of Log(lt)
SS of Log(__
6-16
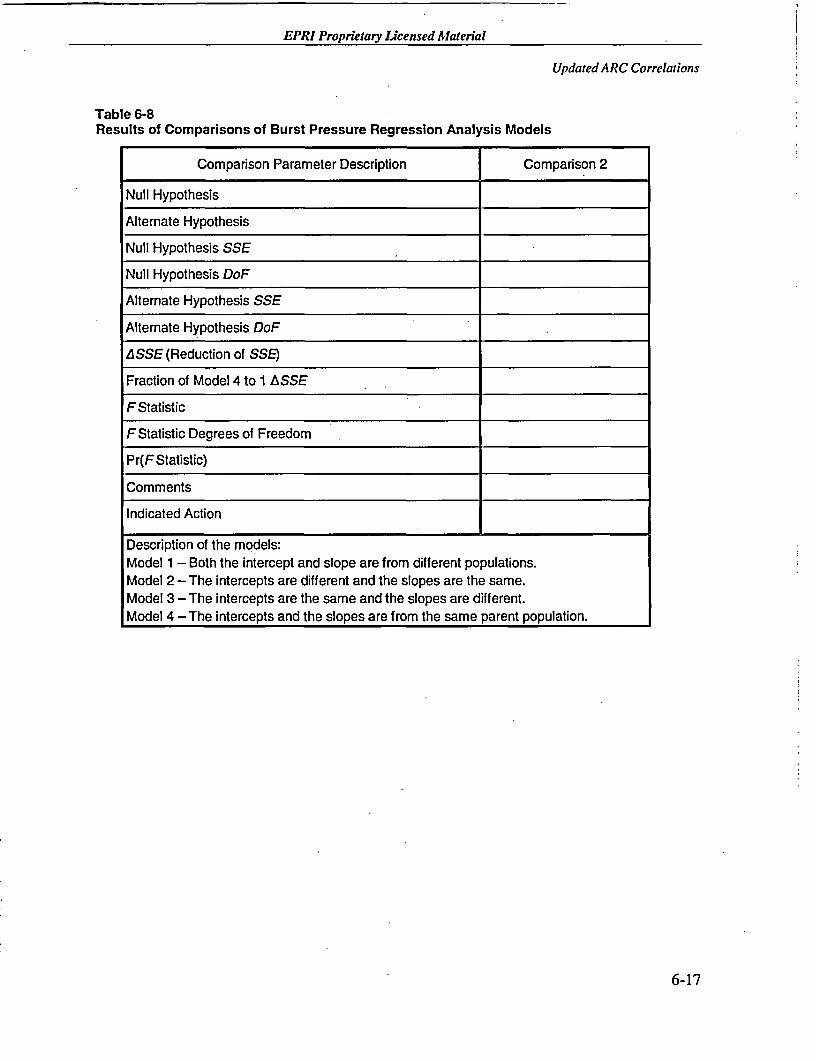
EPRI Proprietary Licensed Alaterial
Updated ARC Correlations
Table 6-8Results of Comparisons of Burst Pressure Regression Analysis Models
Comparison Parameter Description Comparison 2
Null Hypothesis
Alternate Hypothesis
Null Hypothesis SSE
Null Hypothesis DoF
Alternate Hypothesis SSE
Alternate Hypothesis DoF
ASSE (Reduction of SSE)
Fraction of Model 4 to 1 ASSE
FStatistic
F Statistic Degrees of Freedom
Pr(F Statistic)
Comments
Indicated Action
Description of the models:Model 1 - Both the intercept and slope are from different populations.Model 2 -The intercepts are different and the slopes are the same.Model 3 - The intercepts are the same and the slopes are different.Model 4 - The intercepts and the slopes are from the same parent population.
6-17
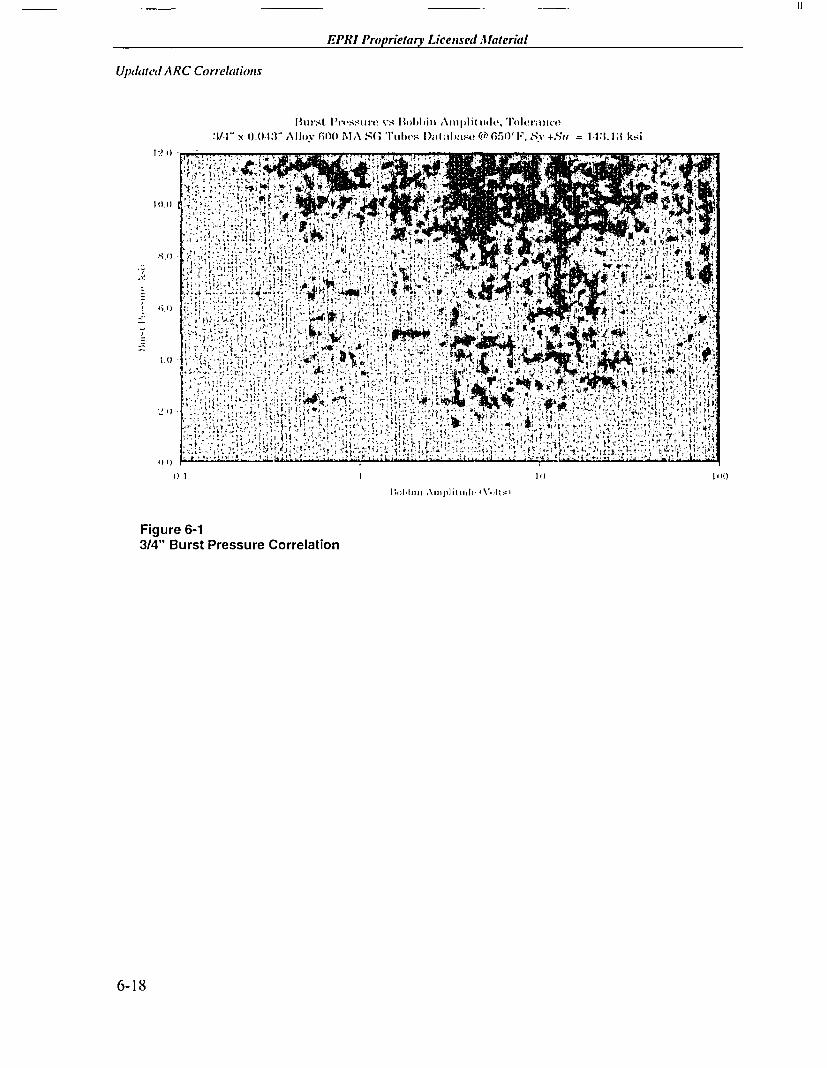
II
EP'RI Proprietary Licensed .llaierial
Updated ARC Correlations
1J1112St lilrSslMtl vs V8obbOi)l A\mIiplitldt!. To(leldl3ctO/4" x ).04j3 A I joyvf1) 0MA aS(, I'Gibes T )ube DIalns @)O 6 ' . Sy +.'S; = 1- .1.1 i ksi
l- I)
I lit.1
,;.I)
l. O
2 '1
I).{)
I) I IIt Idle)
H W ': I' IAI\Inpi it II, tII V-Ats'
Figure 6-13/4" Burst Pressure Correlation
6-18
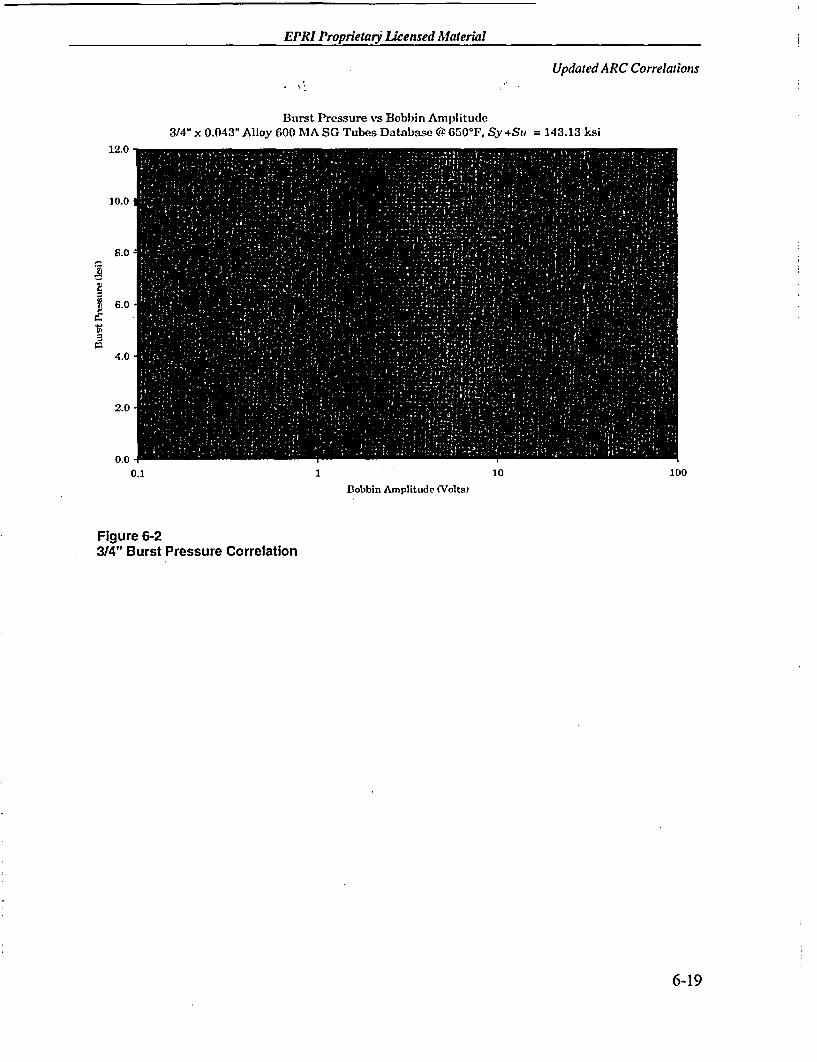
EPRI Proprietary Licensed Material
Updated ARC Correlations
Burst Pressure vs Bobbin Amplitude3/4" x 0.043" Alloy 600 IA SG Tubes Datab..-e @ 650'F, Sy +SU = 143.13 ksi
12.0
10.0
8.0
6.0
4.0
2.0
0.00.1 1 10
Bobbin Amplitude (Volts)
100
Figure 6-23/4" Burst Pressure Correlation
6-19

II
EJ'RI Proprietary Licensed Material
Updated ARC Correlations
I "'(1- ) i it fer roeI Spalin' BuitRs Vs. 1'.O1h)jill A IDJIIlide
3.1' ()1) x 0.04: ( 1 I'iick. AlI by (;(() G 1A, S(' 'I' lzbes (3) 650ol
I I'.' 1))
I.i. ()I
I. E .-l)l
I .E05
I.I.;-o7
I IC 01.
1.1.-1 I
l) I it} I (}(l
Amli pi, hill lidi,,iX. -l.
Figure 6-33/4" Burst Probability
6-20

EPRI Proprietary Licensed Material
Updated ARC Correlations
Probability of Leak for 3/4" SG Tubes ( 650F, DP = 2560 psiEPRI. Addendum 5 Reference Database
1.(
= 0.7
*G 0.6
y 0.5
- 0.3
0.2
0.1
0.00.01 0.1 1.0 10.0
Bobbin Amplituidc (Volts)
100.0
Figure 6-43/4" Probability of Leak
6-21

II
EPRI Proprietary Licensed laterial
Updated ARC Correlations
HM'1[cL of ddi I( ii I.)Iii ~aolt IItPa ,of'3C4" S( n ItT I f./Ualtio of. P'l (fic ( iolns \Vil ]I mi ( Wit botit NcwD' I)t a
2 2
2.1
2.')_ .1I
1.8
1.7
1I ;
1.1
I.:3
1.2
1.1
I) 9
(, I I It'
mu;h IIAI I,,, III|,l ,,d. * 'Vo1 I-
I 1(
Figure 6-53/4" Ratio of Addendum 6 to Addendum 5 POL
6-22

EPRI Proprietary Licensed Material
Updated ARC Correlations
Figure 6-63/4" SLB Leak Rate at 2560 psi
6-23

Il
EP'RI Proprietary Licensed laterial
UpdIated ARC Correlations
Effir-t o * ,i lt iona:i I1 )t:L. on ,3/4I" Titie Ls I k I?: IIIS I' rle'issti re 4 25(i() [psi.
I )
1. I,,., III I II I
I;1'A .ji I .\X1, l tha I i , I" . ."~
Figure 6-73/4" SLB Leak Rate at 2560 psi
6-24

EPRI Proprietaty Licensed Material
Updated ARC Correlations
Figure 6-83/4" SLB Leak Rate at 2405 psi
6-25

1I
EPRI Proprietry Licensed Material
Updwaed ARC Correlations
(.l. It IN)I IiIt' Yos Ixpited I IA hk IL ut.e
:I ()
.,.'
Ii '
1.1 1*' III)(
:. l Iill .\gItIlit]-lS '\-- It->
Figure 6-93/4" SLB Leak Rate at 2405 psi
6-26

EPRI Proprietary Licensed Material
Updated ARC Correlations
Burst Pressure vs. Volts for 7/8" Alloy 600 SG TubesAdditional Data, Reference Sy +Su = 137.56 ksi
12
10
8-
6
4
00.1 1 10
Bobbin Amplitude (Volts)
100
Figure 6-107/8" Burst Pressure Correlation Tolerance Bounds
6-27

I If
EPRI Proprietary Licensed Material
Updated ARC Correlations
Burst Pressure vs Volts for 7/8" OD Alloy 600 SG TubesReference Database, Reference Sy +Su = 137.56 ksi
12.0
10.0
8.0
6.0
-1.0
2.0
0.0 -
0.1 10 100
Bobbin Amplituide (Volts)
Figure 6-117/8" Burst Pressure Correlation
6-28

EPRI Proprietary Licensed Material
Updated ARC Correlations
Probability of Burst of 7/8" SG Tubes During SLB,Effect of Additional Data, AP = 2560 psi
n:3
M
1E+00
IE-O1
1E-02
IE-03
IE-04
IE-05
1E-06
IE-07
lE-08
IE-09
lE-10
1E-l10.1 1 10 100
Bobbin Amplitude (Volts)
Figure 6-127/8" Probability of Burst at 2560 psi
6-29

if
EPRI Proprietary Licensed Material
Updated ARC Correlations
Probability of Burst of 7/8" SG Tubes During SLB,Effect of Additional Data. AP = 2405 psi
i~PIAo
IE+00
lE-01
IE-02 -
I E-03
IE-04
I E-05 -
1E-06 -
IE-07
1E-08 -
IE-09
lE-10
IE-110.1 10 100
Bobbin Amplitude (Volts)
Figure 6-137/8" Probability of Burst at 2405 psi
6-30

EPRI Proprietary Licensed Material
Updated ARC Correlations
Probability of Leak vs. Bobbin Amplitude7/8" x 0.050" SG Tubes, Effect of Inclusion of New Data
100%
90%
80%
70%
C.-
C,
P
60%
4 0%.
30%,
20%
lo0
0% -F0.01 0.1 1 10
Bobbin Amplitude (Volts)100
Figure 6-147/8" Probability of Leak
6-31

IIt
EPRI Proprietary Licensed Material
Updated ARC Correlations
Comparison of Probability of Leak Curves7/8" x 0.050" Alloy 600 MA SG Tubes
l
.5MM
:2
i-:I1�01-1
J4
0.1
0.01
0.001 MM
(.001 0.01 0.1 I
Data.base Addendum Probability of Leak
Figure 6-157/8" POL Comparison
6-32

EPRI Proprietary Licensed Material
Updated ARC Correlations
Ratio of POL Predictions, w/ to *v/o Ncew Data7/8" x 0.050" Alloy 600 MA SG Tubes
1.2
C 1.1
C
4-
C.
c~ 1.00.93
0.90.1 10 100
Bobbin Amplitude (Volts)
Figure 6-167/8" Ratio of POLs
6-33

I n-
EPRI Proprietary Licensed Material
Updated ARC Correlations
SLB Leak Rate (2560 psi) vs Bobbin Amplitude7/8" x 0.050" Alloy 600 MA Tubes
1000
100
2-.E-
6�i
-4
10
I
0.1*
0.0110
B~obbin Amplitude, V (Volts)
100
Figure 6-177/8" Mean Leak Rate for 2560 psi
6-34
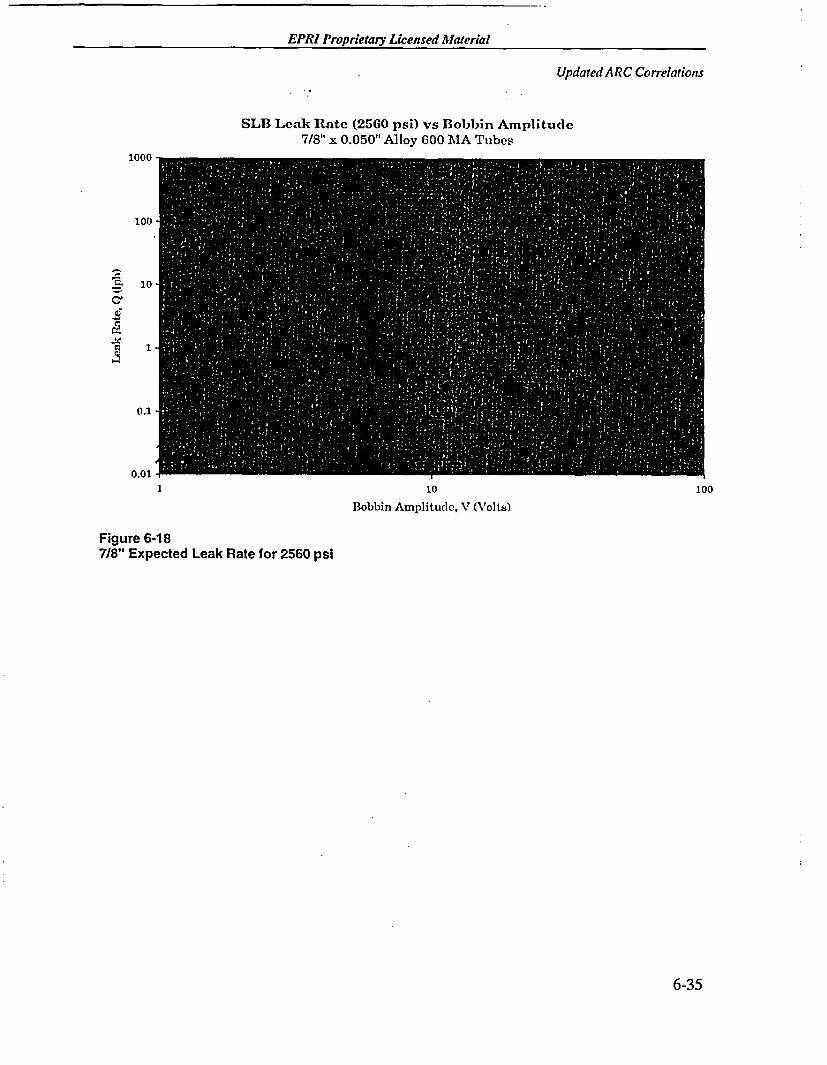
EPRI Proprietary Licensed Material
Updated ARC Correlations
SLB Leak Rate (2560 psi) vs Bobbin Amplitude7/8" x 0.050" Alloy 600 MA Tubes
1000
100
la
at.9
10
0.1
0.011 10
Bobbin Amplitude, V (Volts)
100
Figure 6-187/8" Expected Leak Rate for 2560 psi
6-35

I IL-
EPRI Proprietary Licensed Material
Updated ARC Correlations
Effect of Added Data on Expected Leak Rate7/8" x 0.050" Alloy 600 MA SG Tubes, AP = 2560 psi
10
.l
CI
3
0
l
0.1 -
0.1 1. 1.()
Bobbin Amnplitude (WTolts)
100
Figure 6-197/8" Leak Rate Ratio for 2560 psi
6-36

EPRI Proprietary Licensed Material
Updated ARC Correlations
SLB Leak Rate (2405 psi) vs Bobbin Amplitude7/8" x 0.050" Alloy 600 MA Tubes Data
1000
100
1
0.1
0.011 10
Bobbin Amplitude, V (Volts)100
Figure 6-207/8" Mean Leak Rate for 2405 psi
6-37

iU-
EPRI Proprietary Licensed material
Updated ARC Correlations
SLB Leak Rate (2405 psi) vs Bobbin Amplitude7/8" x 0.050" Alloy 600 MIA Tubes Data
1000
100
10
1
0.1
0.0110
Bobhii Amnplitude, V VoltRsI
100
Figure 6-217/8" Expected Leak Rate for 2405 psi
6-38
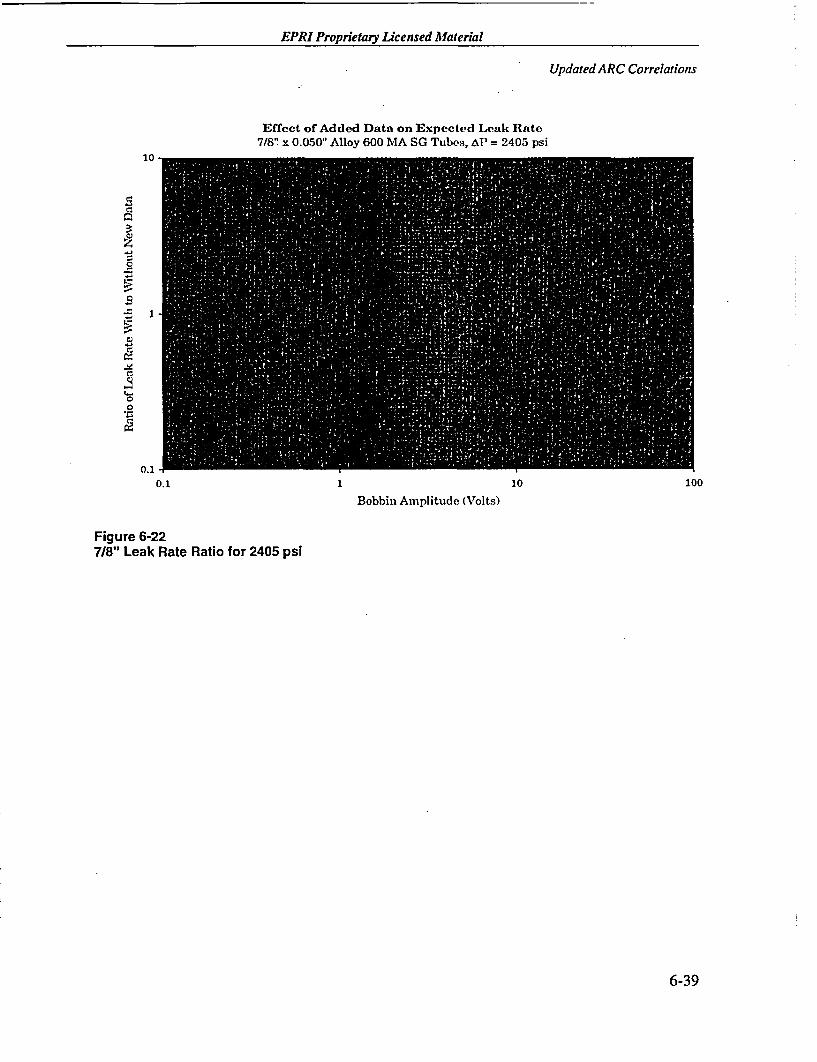
EPRI Proprietary Licensed Material
Updated ARC Correlations
Effect of Added Data on Expected Leak Rate7/8" x 0.050" Alloy 600 MA SG Tubes, AP = 2405 psi
10
C-
rs
0
0
C..
1
0.1
0.1 1 10
Bobbin Amplitude (Volts)
100
Figure 6-227/8" Leak Rate Ratio for 2405 psi
6-39

EPRI Proprietary Licensed Material
7PROBABILITY OF PRIOR CYCLE DETECTION(POPCD)
This section provides a complete revision to Section 7 of Addendum 5. The methods fordefining the probability of Prior Cycle Detection (POPCD) and for calculating the resulting PODdistribution have been completely revised based on interactions with the NRC in support oflicensing POPCD for Diablo Canyon Units 1 and 2 ARC analyses. The information in thissection was transmitted on June 2, 2004 by NEI to the NRC for approval. However, this sectionupdates the NRC submittal by including POPCD data from the 2004 inspection in DCPP Unit 1 .Therefore, all references to DCPP POPCD include data through the IR12 outage (March 2004).All references to 7/8 inch POPCD include industry 7/8 inch tubing data through 2003 outages,plus DCPP Unit 1 IR12. All references to 3/4 inch POPCD include industry 3/4 inch tubing datathrough 2003 outages.
The methods of this section are the same as licensed for Diablo Canyon with the exception thatbobbin indications that were found to be NDD by RPC are treated as bobbin detected indicationsfor the POPCD analysis, whereas the Diablo Canyon basis treats these indications as undetectedfor POPCD calculations. It is recommended that the utility treat these indications as undetectedfor POPCD calculations based on the precedent established by NRC approval of the DiabloCanyon POPCD and to limit further NRC review on this topic. However, since the RPC NDDindications must be included in the ARC operational assessments as detected indications perNRC GL 95-05, it is technically consistent to treat these indications as detected for the POPCDanalyses.
7.1 Introduction
This report provides guidelines for developing steam generator (SG) detection probabilitiesbased on the Probability of Prior Cycle Detection (POPCD). The POPCD method was initiallydescribed in Reference 7-1 with the latest update to the data provided in Reference 7-2 and wasdeveloped for application with the NRC GL 95-05 (Reference 7-3) voltage based repair criteria.GL 95-05 requires NRC approval for implementing POPCD. This report provides POPCDguidelines and results supporting a generic industry POPCD submittal for NRC approval, andincludes an option for applying a plant specific POPCD when adequate data is available on aplant specific basis. NRC approval of a one cycle POPCD was provided for DCPP Unit-2, Cycle12 in Reference 7-4. NRC approval of a permanent POPCD for DCPP Units I and 2 wasprovided in Reference 7-13. The POPCD guidelines and data of this report reflect changes toReferences 7-1 and 7-2 based on the NRC review reflected in the DCPP approval of References7-4 and 7-13.
7-1

I if
EPRI Proprietary Licensed Material
Probability of Prior Cycle Detection (POPCD)
POPCD is defined in Section 7.2 including the classification of indications for POPCD analyses.Methods for calculating POPCD distributions including uncertainties are given in Section 7.3.Growth rate and noise considerations for POPCD applications are provided in Sections 7.4 and7.5. Section 7.6 summarizes benchmarking results for industry wide POPCD applications.Section 7.7 provides the POPCD evaluation for the industry database with Section 7.8 definingrequirements for applying plant specific POPCD distributions. Sections 7.9 and 7.10 providereporting requirements for POPCD applications and conclusions of the report. References areprovided in Section 7.11.
7.2 POPCD Definition and Classification of Indications
7.2.1 POPCD Definition
POPCD is calculated as the ratio of indications reported at the prior inspection to the totalindications found at the subsequent inspection (all indications reported in the prior cycle plusnew indications). POPCD for the EOC, inspection (EOCn) is defined as:
EOC,,. I RPC confirned plus EOCn bobbin detected, RPCEOC RPC inspecte d bobbin + confirmed plus notdetected at EOC b inspected and repaired at
POPCD E=~EOC,+ I RPC confirmed plus EOC, bobbin detected, RPC + New EOC,+, RPC confirmed ornot RPC inspected and bobbin + confirlmed plus not only RPC detected plus notdetected at EOC, inspected and repaired at RPC inspected indications (i.e.,
EOC, not detected at EOCQ)
Notes for POPCD definition:
1. RPC is intended to include an RPC probe or equivalent such as a +Point coil.
2. RPC confirmed means a bobbin flaw signal was detected with a RPC probe.
3. Not RPC inspected means a flaw signal was detected with a bobbin probe and was notfurther inspected with a RPC probe.
This definition of POPCD is based on the premise that all indications that can contributesignificantly to burst and leakage for voltage-based repair criteria application can be confirmedby rotating pancake coil (RPC) inspections. The term RPC is meant to include an RPC probe orequivalent, which includes a +Point coil. The POPCD definition that is used for ODSCC ARCanalyses is based on RPC confirmed indications plus indications not RPC inspected.
This application of the RPC results is applied to exclude from POPCD the probable false bobbincalls that would not contribute to tube integrity concerns at EOCn, 1 for both previously reported
7-2

EPRI Proprietary Licensed Material
Probability of Prior Cycle Detectiorz (POPCD)
and new indications. The use of RPC confirmation provides a measure of confidence thatirrelevant prior and new bobbin calls are not allowed to influence the POD either as an increaseor a decrease in the POD. EOCn bobbin calls that were RPC no detectable degradation (NDD) atEOCn but were RPC confirmed or not inspected at EOCn+2 are included in POPCD as bobbindetected indications at EOCn. This can be interpreted as a difference in the application of RPC todefine a 'true' indication at EOCn+ 1 from that at EOC. The intent is that the EOCn+1 RPC shoulddefine the significance of the bobbin indication for POD considerations such that theinsignificant RPC NDD indications are excluded from POPCD for both previously reported andnew bobbin indications. The inclusion of RPC NDD EOCD bobbin indications as detectedindications in POPCD when RPC confirmed or not inspected at EOCn+,, but excluding EOC,+2RPC NDD from POPCD is consistent with the GL 95-05 Section 2.b. 1 guidelines. Thisguideline requires that all bobbin indications at EOCn are to be included in the OA independentof RPC confirmation with the alternative, upon NRC approval, that a fraction of RPC NDDindications may be excluded. The appropriate fraction to exclude would be the indications thatremain RPC NDD at EOCn+,, which is the fraction excluded from POPCD. In addition,including the EOCQ RPC NDD in the BOC,+, population together with decreasing POPCD byconsidering these indications as undetected approximates double accounting for these indicationsin defining the BOCn+1 population. If GL 95-05 is revised to exclude all RPC NDD from the OABOC+, population, it would be acceptable to define the EOCn RPC NDD bobbin indications asundetected in the POPCD calculations. If GL 95-05 is not revised, it is recommended that theutility treat these indications as undetected for POPCD calculations based on the precedentestablished by NRC approval of the Diablo Canyon POPCD and to limit further NRC review onthis topic.
The POPCD approach treats all new indications at an inspection as having been undetected at theprior inspection even though some of the new indications may have initiated during the operatingcycle. The application of POPCD for OA then accounts for newly initiated indications as well aspreviously undetected indications. This differs from the conventional POD definitions based ononly detection of known flaws, but is applied for the operational assessments to eliminate theneed for additional terms to account for newly initiated indications.
The single-cycle basis for a POPCD evaluation assumes that large flaws would be detectedduring the EOCn+, inspection. This assumption is supported by the industry POPCD database of37 inspections. The multi-cycle development of a POPCD database over sequential inspectionsprovides additional assurance that the potential for large undetected indications is included inPOPCD. If an indication is undetected, it can be expected to grow over subsequent inspectionsto a detectable level. When detected, it is included at the BOC voltage as an undetected or newindication. As an example, for a 3-volt undetected indication, it can be expected that furthergrowth would lead to detection at the next inspection and the indication would be included inPOPCD as a 3-volt undetected indication. The industry data includes up to 5 successiveinspections in a plant with noise levels (i.e., support plate residuals) significantly higher thancurrently active SGs. Nine inspections from the 2 units of the plant with high noise levelsaccount for 70 percent of the new or undetected indications above 1.6 volts, including 4 of the 5new indications above 2.5 volts in the industry database. However, none of the undetectedindications exceeded 3.2 volts.
7-3

I IU-
EPRI Proprietary Licensed Material
Probability of Prior Cycle Detection (POPCD)
7.2.2 Classification of Indications and Assignment for POPCD Analyses
Table 7-1 identifies all potential classifications for tracking bobbin coil indications betweenEOCn and EOCn+1. The classification of an indication is dependent upon whether theindication is bobbin detected at each cycle and whether the indication is confirmed by RPCinspection or not RPC inspected. The letters in the columns of Table 7-1 reflect the column forentering data in the Table 7-2 reporting format for POPCD data results. The revised Table 7-2format for reporting POPCD data, as compared to the NP 7480-L Addendum 5 POPCD tableformat, is used to develop the POPCD distributions following the guidelines described in thissubsection. The columns provide the source of input data including the basis for defining theCycle n voltage for the indications. Guidelines for assigning bobbin voltages to bobbin NDDindications are provided at the end of this subsection. The rows show the voltage bin widths.Voltage bin widths may be 0.1 or 0.2 volt wide when at least 20 indications are included in thebin. In this case, the data can be reasonably assumed to span the bin width such that the mid-binvoltage can be used to represent the bin voltage for input data to calculate the POPCDdistribution. Above the highest consecutive 0.2-volt bin, the bin width is limited to 0.1 volts toprovide a more accurate mid-bin width for calculating the POPCD distribution.
Indications that were not detected at EOC, or EOCn + by the standard bobbin inspection, but thatare detected during EOCn+j as a result of other RPC inspection activities are considered as newEOCn+1 RPC confirmed indications for the POPCD analyses for EOCn (column F in Table 7-2).At the time of the initial POPCD development, there were so few small indications not detectedvia the standard bobbin inspection, but detected as a result of other RPC inspection activities,that these indications could be ignored in POPCD applications. Recent RPC inspections haveresulted in increases in the numbers of these indications although they continue to be low voltageindications. These indications will continue to be included as new indications in subsequentcycles unless the indication is reported in the normal bobbin coil inspection at a cycle followingEOC,+ 1 . Thus, the indications will be considered as undetected at a minimum of two cycles, theEOC, and EOCn+1 inspections.
The following indications are considered to be false bobbin coil calls and are not included in thePOPCD analyses. The numbers are tabulated in column G in Table 7-2.
* Bobbin indications reported at EOCn but found to be NDD by RPC inspection at EOCn+l.EOCn bobbin indications confirmed by RPC at EOCn and found to be RPC NDD at EOCn+1are not expected to occur but would be excluded from the POPCD analyses if they wouldoccur since the Cycle n+1 inspection would expect to find a larger indication if the EOCnindication was not a false call.
* Bobbin indications reported at EOCn but not found by the bobbin inspection at EOCn+1.These indications are classified as indications not reportable (INR) and require resolutionanalysis to confirm that an indication is not present at EOCn+l. Again, the Cycle n+linspection would expect to find a larger indication if the EOCn indication was not a falsecall.
* New bobbin indications reported at EOCn+1 but found to be NDD by RPC inspection atEOCn+l. RPC NDD indications at EOCn+l are assumed to be false bobbin calls forPOPCD applications.
7-4

EPRI Proprietary Licensed Material
Probability of Prior Cycle Detection (POPCD)
The following guidelines are to be applied for determination of detection and bobbin voltages forthe POPCD analyses:
* All determinations of detection at EOCn and voltages assigned to EOCn detected indicationsare to be based on the inspection records for the EOCD inspection. An exception is appliedfor plants that reevaluated EOCn indications based on the detected EOCn+1 indications fordeveloping growth rates. In the latter case, the reevaluated voltages have been used in theARC analyses and are used for the POPCD evaluation. Determination of detection at EOCnis always based on the inspection records.
* Lookback analyses are applied to assign voltages for new indications detected at EOC,+1such that EOC. voltages are not available from the inspection records. When the look-backanalysis leads to a voltage at EOCn greater than the EOCn+1 voltage, such as can occur for alow amplitude signal, the EOC,+1 voltage can be applied for EOC,.
* For indications remaining bobbin NDD at EOCn by the lookback analyses, the EOCn bobbinvoltage should be obtained by subtracting the average growth rate from the EOCn+, voltage.
* When new EOCn+1 indications are found by RPC inspection but not reported as EOCn+1bobbin indications, the voltages for EOCn+1 may be obtained by identifying the flaw based ona review of the 200 kHz data or by applying a site specific bobbin voltage to RPC voltagecorrelation (guidance for these methods is provided in Section 10.1 of Reference 7-2 -Addendum 5 to the ARC database). These methods should also be applied to obtain bobbinvoltages for EOCn indications found only by RPC and repaired at EOCn.
* If the RPC inspection identifies more than one ODSCC indication at the same TSPintersection, the bobbin voltage assigned to the TSP is estimated as the square root of thesum of squares for the bobbin voltages inferred from the RPC indications. This is anapproximation to the effect on bobbin voltage of multiple indications around the tubecircumference.
* Indications found only by RPC inspection in deplugged tubes returned to service at EOCn areincluded as new indications at EOCn if found by bobbin and/or RPC at the EOCn+,inspection.
For some cases in the industry database, an estimated bobbin voltage has not been reported forindications found only by RPC. In this case, the bobbin to RPC voltage correlation of Section10.1.3 of Addendum 5 (Reference 7-2) has been applied to obtain the EOCn+,l voltage with anaverage growth rate of 0.15 volt applied to obtain the estimated EOCn voltage. Due to the smallnumber of indications requiring this estimate, the impact on the industry POPCD distribution isnegligible.
7.3 Calculation of the POPCD Distribution Including Uncertainties
7.3.1 Loglogistic Fiffing
The preferred approach to simulating the POD is to fit a loglogistic cumulative distributionfunction to the empirical data. The statistically based POD distribution such as the loglogistic
7-5

U-
EPRI Proprietary Licensed Material
Probability of Prior Cycle Detection (POPCD)
provides uncertainties in the POD distribution. The POD uncertainties are included in MonteCarlo analyses as described below. This allows for an analytical simulation of the PODanalogous to the simulation of the probability of leak for ODSCC indications at TSPs. Thesimulation of the probability of leak for ODSCC indications at TSPs is discussed in severaldocuments pertaining to the application of the ODSCC ARC. The functional form of theloglogistic equation is,
l +[Eq. 7-1
where P is the POD, V is the bobbin amplitude, and bO and bI are parameters obtained byperforming a regression analysis of the empirical POD data. The equation can be easilyrearranged into the log-odds form as,
In P = bo + b, log(V) Eq. 7-2
where the ratio in the parentheses is the odds of detection, i.e., the ratio of the POD to theprobability of nondetection.
For application to POPCD analyses, the data are sorted into 0.1 or 0.2 volt bins representingvarious voltage levels, and the POPCD distributions used for ARC analyses are developed usingfits to weighted binary data (hit/miss = 1/0), where weighting is based on the number ofindications in each bin.
7.3.2 Monte Carlo Techniques
The following is a description of the Monte Carlo techniques that are used to apply POPCDcurves. The Monte Carlo analysis consists of simulating all of the indications in a SG severalthousand times. Each simulation of all of the indications in a SG is referred to as one simulationof the SG. For each simulation of a SG, a set of random possible parameters for the PODequation, the intercept, slope and error standard deviation, for the population of ODSCCindications is determined and applied to all of the detected indications to establish a populationof detected and undetected indications. For a given POD, P, the number of indications thatremain in service, N, in a given bin is given by,
N= N P Eq. 7-3
where ND is the number of indications detected and Np is the number of indications plugged.Because the POD is a decimal value, the fraction in the above equation will not return an integernumber of tubes. The result is truncated to an integer value and a random draw from a uniform
7-6

EPRI Proprietary Licensed Material
Probability of Prior Cycle Detection (POPCD)
distribution is used to determine if an additional indication should be added to the total as furtherdescribed following Equation 74 below. The methodology to employ an analytic form for thePOD is essentially identical to that used to simulate indications for evaluating the probability ofburst and leak. The process is repeated so that each simulation of all of the indications in a SG isindependent of the other simulations of all of the indications in the SG. In this manner,thousands of variations of the possible levels of degradation within the SG are considered. Thedetermination of the POB and the potential leak rate during a postulated steam line break eventthen proceeds according the methodology outlined in GL 95-05.
For each of the Monte Carlo simulations of a SG, the elements of the populationvariance-covariance matrix for the parameters of the loglogistic equation are found using theestimated values from the regression analysis and a random value from the Chi-Squaredistribution corresponding to the degrees of freedom associated with the regression analysis.Once the population values for the variance-covariance matrix have been calculated, populationparameters of the POD equation, D30 and PI corresponding to bO and bl, can be calculated usingtwo random values from the standardized normal distribution based on the assumption that theyare bivariate normally distributed. Given the population parameters, the POD for any indicationvoltage, Vi, with a bin can be calculated as,
Pi ={I1 +exp[-5P 0-A log(V)]Y' Eq. 7-4
where the j values are the estimated population parameters corresponding to the regressionparameters bo and b1. For each bin of indications found during the current outage, the number ofindications present that gave rise to finding the number reported for that bin is found bysubstituting the calculated Pi values into Equation 7-3. This will likely give rise to predictingthat a fraction of an indication is mathematically present in one or more of the bins. Whether ornot the fraction of an indication represents a whole indication being present or not during thesimulation of the indications in the bin is determined by making a random draw from a uniformdistribution. If the value obtained from the uniform distribution is greater than the value of thefractional indication, an indication representing the fractional indication is not present.Likewise, if the value is less than the fractional indication value then a whole indicationrepresenting the fractional indication is present and is included in the analysis to determine thePOB and potential total leak rate for that simulation of the SG. The application of this approachresults in one additional indication being present in the prediction bin for a fraction of the SGsimulations that matches the average value of the predicted fractional indication. For example,10 indications in a bin with a POD of 0.33 gives rise to predicting that 30.3 indications wereoriginally present. If the random draw from a uniform distribution is less than or equal to 0.3 theindication is present. If the number drawn is greater than 0.3 the indication is not present.
7.3.3 Goodness of Fit Assessment
Single-cycle POPCD distributions can be expected to change from cycle-to-cycle dependentupon the number and size of indications in a given inspection. For inspections with a largenumber of indications spanning up to at least 5 volts, the differences between a single-cyclePOPCD and a combined cycle POPCD would be expected to be modest. Multi-cycle POPCD
7-7

- I -__ U -
EPRI Proprietary Licensed Material
Probability of Prior Cycle Detection (POPCD)
distributions are recommended for ARC applications. The integrated inspection experience isthen included in POPCD to represent the history of undetected indications. For example, if thelast inspection resulted in the largest undetected voltage indication, the last inspection results donot imply similar occurrences for the next cycle and the overall integrated history would be thebest estimate for the next cycle. This conclusion is applicable as long as SG conditions at TSPintersections do not significantly degrade with operating time, which is typical of operating timesafter the first one or two cycles during which the residual signals form at TSP intersections.Significant increases in denting are not occurring in currently operating SGs.
The p-value from the POPCD regression analysis is the probability of observing a value of x2 assmall as the one calculated from the data. If the p-value is found to be greater than 5 percent,i.e., the probability of randomly observing a value as small as the one calculated would begreater than 5 percent, the associated implication would be that there could be sufficient noise atthe location of the indications to interfere with the detection of the indications. In this case, theutility should propose an alternate POD and submit the recommendation to the NRC for approvalto apply for operational assessments. For the regression results presented in Section 7.7, the p-values were calculated to be effectively zero.
7.4 Growth Rate Considerations for POPCD Applications
7.4.1 Provision for Outlier Growth Rates
Calculations applying POPCD or 0.6 as the POD will not predict flaws which result from voltagegrowth rates which are higher than previously seen (e.g. the R44C45-2H flaw which wasdetected as a 21.5-volt flaw at DCPP in the 2R II inspection and was detected as a 2.0-volt flawin 2R10 and left in service per the ODSCC ARC repair criteria) and both POD methods lead tounderestimates of the 2R1 I maximum flaw size, burst probability, and leak rate. The overlyconservative and arbitrary application of a POD of 0.6 has not have changed any assessments forcorrective actions following identification of a large growth rate indication. For smaller growthrate under predictions, the application of a POD of 0.6 can mask a real growth rate issue byleading to artificially high burst and leakage predictions with an associated conclusion that nocorrective action is necessary.
A high voltage growth rate can be expected to periodically occur and cannot be predicted for aspecific cycle. Normal growth in depth can lead to a large voltage increase when the upper rangeof depth growth occurs for a near throughwall or short throughwall indication. This occurs asthe result of the exponential dependence of voltage on depth and again on throughwall lengthand is inherent to the voltage-based methods for tube integrity assessments. For manyoccurrences of large growth rates with associated large EOC voltages (i.e., greater than 8 volts),the indications have been pulled and destructively examined. Although the largest indicationsfound in ARC inspections have been destructively examined, all indications have demonstratedburst pressures exceeding APSLB and leak rates generally consistent with the ARC correlations.
If the NRC approves the methods described in Section 8.1 and Reference 7-5 for an outliergrowth rate, the methods will be included in the ARC operational assessments upon NRCapproval of the generic industry POPCD for ARC applications.
7-8

EPRI Proprietary Licensed Material
Probability of Prior Cycle Detection (POPCD)
7-9

II
EPRI Proprietary Licensed Material
Probability of Prior Cycle Detection (POPCD)
7.4.2 Development of Growth Rate Distributions
Conservative growth rates should be used in the operational assessments for ARC analyses. Theoutlier growth method noted above, as required for POPCD applications, is one technique foradding conservatism to the growth distributions. GL 95-05 requires the use of the most limitingof the two previous growth rate distributions for the next operating cycle.
GL 95-05 notes that a single growth distribution in terms of AV rather than percent AV can beused provided the conservatism of this approach continues to be supported by operationalexperience. This requires an assessment for the potential onset of voltage dependent growth(VDG). The onset of VDG can generally be seen from plots of voltage growth versus BOCvoltage. The occurrence of a higher frequency of large growths or increased growth rates withincreased BOC voltage is an indication of the presence of VDG. Methods for calculating voltagedependent growth rate distributions are described in Section 10.3 and Reference 7-6. Thesemethods define techniques for determining break points in voltage bins with each bin defining aseparate growth distribution. When applying POPCD, the assessment for the onset of VDGshould be performed and the methods of Section 10.3 applied when growth rates show adependence on the BOC voltage.
7.5 Noise Considerations for POPCD Applications
The POPCD approach to detection probabilities considers the potential for missing indicationsthat might challenge structural or leakage integrity. The database includes successiveinspections such as five consecutive inspections for one of the units in the industry database withhigh noise levels. If a large indication was missed in one inspection, it would continue to growuntil finally detected in a later inspection. The POPCD methodology includes all newindications as assumed missed indications and large new indications found in an inspection arereevaluated at the prior outage to define the undetected indication voltages for a POPCD cycle.Based on the POPCD data described in Section 7.7, 70 percent of the missed indications above1.6 volts in the industry database occurred in 2 units (SGs since replaced) that represent only 24percent of the 37 inspections in the database. No new indications throughout the industry werefound to have a prior inspection voltage greater than 3.2 volts, which is well below an indicationof about 9.6 volts challenging structural integrity and a 3.2 volt indication would have a leakageprobability of only about 20 percent based on NP 7480-L, Addendum 5, data. Thus, thehistorical POPCD data show that noise effects have not masked large voltage indications. Alllarge voltage indications challenging structural or leakage integrity found in ARC inspectionscan be traced to large growth rates and not to missed indications.
The two units dominating the missed indications above 1.6 volts had high noise levels at TSPintersections compared to the currently operating SGs. Although not numerically demonstratedby noise analyses, the noise levels for the industry POPCD database can be expected to bracketcurrent ARC applications. Evaluations of noise levels for the extensive industry POPCDdatabase would be a major task that is not warranted based on the detection experience citedabove. The ARC pulled tube database is a representative sample of the overall POPCD databasesince the number of pulled tubes from a given plant reflects the number of cycles for which the
7-10

EPRI Proprietary Licensed Material
Probability of Prior Cycle Detection (POPCD)
ARC has been implemented and the detection data included in the POPCD database.Consequently, noise levels for the pulled tube database can be adequately applied to representthe POPCD database.
Based on work performed under the EPRI Tools for Tube Integrity Program, noise analyses fortube integrity applications are based on maximum noise voltage amplitudes at the area of interestfor detection. TSP ODSCC indications are dominantly located near the center of the TSP orspan the center of the TSP. Thus, the area of interest for noise analyses is the center 1/3 of theTSP thickness. For application of ETSS PODs to be developed from performance testing ofmultiple analysis teams under the EPRI tools program, the plant noise distribution must beshown to be bounded by the ETSS noise distributions based on applying the Kolmogorov-Smirnov (KS) two sample test for compatible distributions. For TSP indications, the bobbin mixvertical maximum amplitude at the center 1/3 of the TSP is the appropriate noise measurementfor assessing POD applicability.
The noise requirement to apply the industry POPCD on a plant specific basis is that the plantbobbin vert max noise amplitude at the TSP center be bounded by the pulled tube noisedistribution as demonstrated by passing the one-sided (pulled tubes bound plant) KS test at a 5%probability level. Figure 7-1 provides an example of this application for Plant DW. Asexpected, the noise levels for the pulled tube data base, which includes data from replaced SGswith higher noise levels than active SGs, bounds the plant noise distribution for Plant DW.
With regard to the presence of mix residuals and the influence of the mix residuals on sizing theindications, it must be emphasized that all TSP intersections have mix residuals after the first oneor two cycles of operation. After about two cycles, the mix residuals generally do not changewith operating time. The dominant voltage for the mix residual signals is not affected by themixing used to analyze the bobbin data so the mix residual signal amplitude does not vary withoperating time or nondestructive examination (NDE) analyst. Frequently, a significant part ofthe mix residual signal is present in bobbin data obtained without a TSP for pulled tubesexamined in the laboratory. Some of the model boiler specimens show mix residuals althoughgenerally smaller than field data due to the shorter time at temperature. The bobbin responseapparently includes an effect of the time at temperature at a TSP on the magnetic properties ofthe tube. Metallography was performed on a pulled tube to attempt to identify the cause for thesignal, but was not successful in identifying any physical change to the tube or grain structure.
Many of the pulled tubes in the ARC database (and the POPCD database) have mix residualsignals larger than typically found in currently operating SGs. Whatever influence the mixresiduals may have on voltage sizing for TSP indications is built into the ARC database by thepulled tubes. The mix residuals may be more easily understood as TSP noise. The noise maydistort the flaw signal particularly when the two phase responses are similar. The mix residualvoltage is not being used in current assessments (e.g., noise distributions described above) of theinfluence of noise on detection or sizing. For signal to noise evaluations, the noise is beingevaluated as the peak vertical amplitude response over one third sections of the TSP to reflect thelarger noise near the edges of the TSP. The noise differences between the center and edge of aTSP affect detectability of short, low voltage indications located at the edges of the TSP. Theshort indications at the TSP edges must grow to the center of the TSP to become structurally
7-1l

- - Iit
EPRI Proprietary Licensed Mlaterial
Probability of Prior Cycle Detection (POPCD)
significant and the lower noise levels at the TSP center provide for detection of even low voltageindications. It is not feasible or necessary to attempt to define bobbin voltages that are notaffected by the TSP noise or mix residuals. All indications have a range of noise influence onvoltage sizing, and the ARC database includes many indications with larger noise levels thanDCPP and other plant active SGs.
7.6 Benchmarking of POPCD
In a letter dated January 24, 1997, the NRC issued a request for additional information to theNuclear Energy Institute (NEI) requesting supplemental information in support of NP 7480-L,Addendum 1. Question 9, Part 2 requested an assessment of the ability of the POPCD approachto conservatively project the EOC voltage distribution. The NEI response to this request foradditional information dated September 14, 1998, provided extensive benchmarking of POPCDanalyses as summarized below. In addition, the DCPP POPCD distribution for the last operatingcycle has been benchmarked against the inspection results at DCPP 2RI I as described below.
The NEI letter to the NRC dated September 14, 1998 (Reference 7-8), provided a response to anNRC request for additional information on benchmarking OA using POPCD for the POD ratherthan a POD of 0.6. The response included Monte Carlo analyses for 32 cases including 18 SGswith 7/8 inch tubing and 14 SGs with 3/4 inch tubing together with an additional 17 sensitivitycases. The analyses compared EOC voltages with the projected values in addition tocomparisons of burst probabilities and leak rates based on projected and actual (inspectionresults) voltage distributions. With a leak rate acceptance basis for POPCD projections beinggreater than or within 0.25 gpm (typically less than 5 percent of allowable limits) of the leak rateobtained from the EOC voltage distributions, the POPCD projections were in agreement with theactual EOC voltage distribution for 31 of the 32 SGs analyzed. The only exception was a case ofan indication found at EOC with a very high voltage growth that could not be predicted oraccommodated using either POPCD or a 0.6 POD for the projections. With a burst probabilitymethods acceptance basis for POPCD projections being greater than or within 5x10 4 (5 percentof the 10-2 POB reporting requirement) of the burst probability obtained from the EOC actualvoltages, the POPCD projections were in agreement with the actual EOC voltage distribution for30 of the 32 SGs analyzed. One exception required a methods update included in NP 7480-LAddendum 2 for deplugged tube growth rates and the second exception was the high voltagegrowth indication that also led to the leakage under prediction. The two exceptions could not bepredicted or accommodated using either POPCD or a 0.6 POD for the projections. Thesebenchmark analyses strongly support the use of POPCD for ARC analyses.
Benchmarking analyses were also performed by DCPP to show the adequacy of using a DCPPPOPCD distribution (Reference 7-9). Monte Carlo POB and leak rate projections wereperformed for multiple cycles using the DCPP POPCD. The results of these analyses indicatethat the methodology used to predict EOC conditions were generally although not alwaysconservative. The underpredictions were not significant relative to the as-found inspectionresults.
7-12

EPRI Proprietary Licensed Material
Probability of Prior Cycle Detection (POPCD)
Under predictions when applying POPCD are more likely to be due to growth rate uncertaintiesthan POPCD uncertainties. The above benchmarking results support the adequacy of thePOPCD methodology for ARC applications.
7.7 POPCD Evaluation for the Industry Database
7.7.1 Industry POPCD Distribution
The POPCD industry database was updated in EPRI Topical Report NP 7480-L, Addendum 5.The industry POPCD data were reevaluated for this report to provide the data consistent with thenew format of Table 7-2. The POPCD data were obtained from 29 inspections in plants with 7/8inch including 6 inspections from the DCPP units and from 12 inspections in plants with 3/4 inchtubing. The POPCD data include results from inspections through 2003 outages plus the DCPPUnit I outage IR12 in March 2004. Tables 7-2 to 7-4 provide the resulting POPCD database for7/8" tubes, 3/4" tubes, and combined 7/8" plus 3/4" tubes, respectively.
The bin mid-range voltages of the POPCD data tables are used to develop the loglogistic POPCDdistribution. The general linear model (GLM) regression analyses of the data are based onweighted binary input as described in Section 7.3.1.
Figures 7-2 and 7-3 show the POPCD loglogistic fits to the 7/8" and 3/4" data including thelower 95% confidence bounds on the POPCD distributions. The 95% lower bound confidencelimit on POD is also shown for information only since the POPCD uncertainty distribution isincluded in the Monte Carlo operational assessment. The lower 95% confidence bounds showonly a small reduction relative to the nominal regression fits, which supports small uncertaintiesfor the industry POPCD distributions based on the large databases available. The uncertaintiesin the upper voltage range above about 3 volts are further discussed below.
Figure 7-4 compares the 7/8" and 3/4" POPCD distributions together with the POPCD obtainedby combining the two datasets. The 3/4" POPCD is slightly lower than that obtained from the7/8" data, although the differences are insignificant above about 2 volts. This POPCD differenceresults from the larger number of new indications below one volt for 3/4" tubing. Above onevolt, the bin average POPCD values for 3/4" tubing in Table 3 are generally higher than that for3/4" tubing in Table 7-2.
Given that the 3/4" tubing POPCD is slightly more conservative than that for 7/8" tubing, the3/4" POPCD distribution can be conservatively applied for all plants that do not have a sufficientnumber of indications for a plant specific POPCD.
7.7.2 Effect of Uncertainties in the Upper Voltage Range
The industry POPCD databases are well-defined relative to the number of indications in thedatabase up to about 2.8 volts with at least 10 indications in each 0.1 volt bin. From Tables 7-2and 7-3, all indications above 3.2 volts for the industry database are detected. However, thelimited number of indications above 3.2 volts leads to a reduction in the POD below unity as
7-13

EPRI Proprietary Licensed Material
Probability of Prior Cycle Detection (POPCD)
seen by the reduction from 1.0 for the fraction detected at about 3.5 volts to about 0.97 for thenominal regression fits of Figures 7-2 and 7-3. The undetected indications in the industryPOPCD database above approximately 1.6 volts are dominated by the data from 2 units (9 of the37 inspections or 24 percent, SGs with 7/8 inch tubing since replaced) that had very high noiselevels at the TSP intersections. The 9 inspections in these 2 units account for 70 percent of thenew indications (POPCD assumption of missed indications) above 1.6 volts in Table 7-4including 3 of the 5 new indications above 2.5 volts. The 5 new indications above 2.5 volts andthe total of 22 new indications in the 2.0 to 2.5 volt range all occurred in 1994 to 1997inspections. This supports improved detectability since 1997 based on increased analystexperience for ARC inspections. For the SGs still operating, the industry database is thereforevery conservative above about 1.6 volts.
The industry database in Table 7-4 above 3.2 volts includes 32 indications all of which weredetected. There have been about 50 indications above 3.2 volts detected and repaired at the lastinspection before SG replacement, which are not included in POPCD evaluations. The largenumber of indications above 3.2 volts provides a good statistical database to define a completePOD distribution and is only used for POPCD to define the higher voltage range POD. Giventhe large numbers of indications above the lowest undetected indications in the database, there isno need to truncate the POPCD curve or transform the curve to a horizontal line at any voltage.
Overall, it is concluded that the upper voltage range (above 2 volts) uncertainty is adequatelyaddressed by the industry database and the statistical GLM regression analyses describedpreviously.
7.7.3 Comparisons of Industry POPCD with DCPP POPCD, ANL POD from RoundRobin Testing and EPRI POD from Multiple Analyst Testing
A comparison of the industry POPCD distributions with the DCPP POPCD (Reference 7-10)approved by the NRC in Reference 7-4 is shown in Figure 7-5. The DCPP POPCD is lower inthe low voltage range due to the large number of new, small voltage indications found in recentinspections. Above about 1.0 volt, the DCPP POPCD is higher than the industry values sinceDCPP had no missed indications above 1.6 volts. Since the DCPP SGs have lower noise levelsthan some of the SGs in the industry database, a higher POPCD at increased voltages can beexpected.
As discussed above, substantial industry benchmarking has been performed to support POPCDapplications. An independent POD assessment that supports the POPCD results and eliminationof the 0.6 POD for ARC applications is described in the ANL study contained in NUREG/CR-6791 (Reference 7-11) under work sponsored by the NRC. The ANL POD results were obtainedfrom round-robin NDE analyses of data from a SG mock-up. The ANL results discussed in thissection were obtained from Figures 2.54 and 2.55 of NUREG/CR-6791, which are based on testresults for axial ODSCC at TSP intersections. POD distributions as a function of bobbin coilvoltage are described in the report. The NUREG/CR-6791 figures are shown in Figure 7-4 ofthis letter.
7-14

EPRI Proprietary Licensed Material
Probability of Prior Cycle Detection (POPCD)
Based on the methods applied in this report; the ANL logistic fit shown in the lower part ofFigure 7-6 appears to represent too high a POD distribution for the data shown in the upperfigure. For example, the nominal fit approaches unity near 2 volts where the data indicate abouta 0.9 POD. To permit an equivalent comparison of POD curves between the DCPP and ANLdata, the ANL bin data from the upper graph in Figure 7-6 were processed in the same manner asthe industry POPCD data described previously, except for using fractional data rather thanweighted binary data, to obtain a loglogistic fit to the ANL data. Figure 7-7 compares theIndustry and ANL loglogistic nominal PODs. The comparisons show that the Industry POPCDresults are significantly higher than the ANL results and both are near unity above 5 volts. TheANL data are based exclusively on laboratory specimens, which may have morphologydifferences from pulled tubes that lead to the differences in the PODs. The trends of POD withincreasing voltage are essentially the same for all distributions.
EPRI also conducted blind testing of NDE analysts to develop a POD versus voltage curve. Theresulting POD distribution (Reference 7-12) is also reported in NP 7480-L, Addendum 5, as theEPRI POD curve. For this evaluation, the EPRI POD data were reevaluated by applying aweighted GLM analysis to the data for 1363 indications evaluated by 12 NDE analysts. Figure7-8 provides a comparison of the DCPP POPCD, 3/4" and 7/8" industry POPCDs, ANL, andEPRI POD curves. The comparison shows consistent high detectability for bobbin indicationsabove one volt at TSP intersections independent of the methods used to develop the PODdistributions. Below about two volts, the ANL results show a lower POD than POPCD and theEPRI POD. The POPCD results are based on the conservative assumption that all newindications in the inspection outage were not detected in the prior outage. For POPCD, "truth"as an indication is defined as inspection results for RPC confirmed plus not RPC inspectedindications. The EPRI POD is based on testing analysts against field data for about 5726 TSPintersections from three plants with 3/4 inch tubing. The definition of "truth" (flaws in thepopulation) for the EPRI POD is based on 890 indications confirmed by RPC, 222 indicationsnot confirmed by RPC or not RPC inspected and 251 added indications based on expert opinion.The results shown in Figure 7-8 clearly demonstrate the inadequacy of a POD of 0.6 to representthe strong dependence of POD on voltage, and the results support the consistency of the POPCDresults. The differences in POPCD are primarily dependent on the number of new indicationsfound below about I volt.
7.8 Option for Developing Plant Specific POPCD Distributions
Application of a plant specific POPCD requires satisfaction of minimum data requirements forwhich guidelines are described below. If a plant does not meet the minimum data requirements,the industry POPCD distribution must be applied unless it is shown that the plant specificPOPCD distribution for ARC analyses yields a uniformly lower POD above 1.0 volt and has aPOD less than the industry POPCD in the range of 0.1 to 0.2 volt. Alternately, a plant specificPOPCD can be constructed by applying the lower of the plant specific and industry POPCDdistribution above I volt and the lower of the two distributions below 1.0 volt, particularly nearabout 0.2 volt. The latter may require changes to Monte Carlo analysis codes to accommodatedifferences in POPCD uncertainties below and above 1.0 volt. These options permit applicationof conservative POPCD distributions while the plant specific database is increased to meet theguidelines for applying a plant specific POPCD distribution.
7-15

I A
EPRI Proprielary Licensed Material
Probability of Prior Cycle Detection (POPCD)
Guidelines for applying a plant specific POPCD distribution are:
7-16

EPRI Proprietary Licensed Material
Probability of Prior Cycle Detection (POPCD)
Minimum Number of Inspections for Plant Specific POPCD Application
* Minimum of three consecutive inspections for a plant with one unit applying the ARC and aminimum of four inspections with at least two inspections in each unit for a plant with twounits applying the ARC. If a two unit plant has the minimum of three consecutiveinspections for one unit, that unit can apply a plant specific POPCD.
Minimum Total Number of Indications for'Plant Specific POPCD Application
The total number of indications must be at least 500 for a plant specific application. Thisrepresents a very conservative population for defining a POD distribution when the datasatisfies the higher voltage range requirement given below.
Minimum Number of Detected and RPC Confirmed Indications in Upper VoltageRange
* The POPCD database must include a minimum of 20 detected and RPC confirmedindications above 1.0 volt with at least 5 indications above 2.0 volts for a plant with 3/4"tubing and above 2.0 volts with at least 5 above 3.0 volts for a plant with 7/8" tubing. Theminimum of 20 indications is typical of a lower range for statistical acceptability to define atotal POD distribution for reasonably distributed indications, and is typical of current EPRIETSS requirements. The requirement of at least 5 indications greater than I volt above theGL 95-05 ARC repair limits assures detected indications near the voltage of about 3 volts forwhich the POD is expected to be near unity. The minimum of 20 indications above the repairlimit also shows that the ODSCC population has matured to repairable indications to supportthe POD development.
If the plant specific POPCD satisfies the above minimum data requirements, there is no need tocompare the plant specific and industry POPCD distributions to select the more conservativedistribution. The database for POPCD would be much larger than generally applied to developPOD distributions (e.g., EPRI ETSS) with a representative sample of indications at least twovolts above the ARC repair limits.
7.9 Continuing Assessment and Reporting for POPCD
Upon implementation of POPCD, if the EOC conditional SLB burst probability, the projectedSLB leak rate or number of indications are under predicted by the previous cycle operationalassessment (using the actual cycle length), the following guidelines will be applied to assess theneed for methods adjustments:
The probable causes for the under predictions will be assessed and documented in the 90-dayreport. If the under predictions are significant relative to the burst pressure reportingthreshold or site specific allowable leak rate, an assessment must be made of the potentialneed to revise the ARC analysis methods, and this assessment must be documented in theARC 90-day report. A significant under prediction of burst probability is defined as 10percent of the reporting threshold, i.e., 0.001. A significant under prediction of SLB leak rate
7-17

It
EPRI Proprietary Licensed Material
Probability of Prior Cycle Detection (POPCD)
is defined as 0.5 gpm. A methods assessment will also be made for smaller burstprobabilities or leak rates if the CM results are under predicted by an order of magnitude.
* An assessment will also be made for significant underestimates of the number of indicationsbased on the following criterion. If the total number of as-found indications isunderestimated by greater than 15 percent or by greater than 150 indications, a methodsassessment will be performed to determine the cause and corrective actions will be proposedin the 90 day report. The evaluation should include an assessment of the need to adjust theBOC distribution, and to determine the amount of the adjustment. Note - An underestimateof the less than I volt population when accompanied by an increase in the population above Ivolt may be partially attributable to conservative growth rates which would increase thepopulation above about I volt.
Historically, there have been no ARC cases where undetected indications (POD effects) have ledto a challenge to structural or leakage integrity. These cases have been associated with underpredictions in growth rates. It is expected that growth rates would be the first potential causeexamined for ARC under predictions. Potential POD effects as the cause for under predictionswould also be assessed if the probable cause for the low predictions is a larger than anticipatedundetected indication or due to cumulative numbers of indications above about I volt. The 90-day report will document any recommended changes to POD or growth methodology indicatedby the assessments.
Upon implementation of POPCD, the following additional information shall be included in the90 day report:
* To assess POPCD for potential changes over time, the 90-day report should compare themulti-cycle POPCD distribution applied for the last operational assessment with the POPCDdistribution obtained for only the last operating cycle. Differences in the two POPCDdistributions should be assessed relative to the potential for significant changes in detectioncapability.
* For RPC confirmed indications at EOCn that are RPC NDD at EOCn+1, an assessment isrequired for the cause for the "disappearing flaws" if the RPC (+Point or pancake coil)voltage is greater than 0.5 volt. If there are a significant number of occurrences (such asmore than three occurrences in any one SG) of these "disappearing flaws", the cause shouldbe evaluated independent of the +Point voltage.
* The POPCD data reported in the 90 day report shall include the plant specific historicalresults and the last cycle results reported in the format of Table 7-2.
* In support of this evaluation, Table 7-1 requires an RPC inspection at EOCn+1 for RPCconfirmed indications at EOCQ (either bobbin detected or bobbin NDD) that are bobbin NDDat EOC,+1. This inspection is necessary to ensure that all known ODSCC indications areincluded in the condition monitoring and operational assessments as well as properlycategorized for the POPCD evaluation.
* For plants that assign bobbin voltages to ODSCC confirmed by RPC but are NDD by bobbin,assess these assigned bobbin voltages to verify they are conservative. That is, for prior cycle
7-18

EPRI Proprietary Licensed Material
Probability of Prior Cycle Detection (POPCD)
NDD indications that become detectable by bobbin, the review should assess the prior cycleassigned bobbin voltages, the current cycle actual bobbin voltages, and growth rates.
7-19

I II
EPRI Proprietary Licensed Material
Probability of Prior Cycle Detection (POPCD)
7.10 Conclusions
The current licensed ARC methodology of using a uniform POD value of 0.6, based onGL 95-05, results in an overly conservative and counter intuitive estimate of the number andseverity of indications remaining in the SGs following the inspection. Results of POPCDevaluations support a high POD for bobbin indications above about I volt and lead to near unityfor POD above about 5 volts. All POPCD and voltage dependent POD results show that use of aconstant POD of 0.6 is nonconservative below about 0.5 volts and very conservative above Ivolt, which leads to excessively conservative probability of burst and leakage predictions. ThePOD averaged over all indications, as shown in the lower right hand corner of Table 7-4, is about0.66, which is approximately consistent with the GL 95-05 value of 0.6 also developedindependent of voltage. POD uncertainties are adequately accounted for in the POPCDapplications through the statistical methods applied and the allowances for uncertainties includedin the operational assessments. Therefore, the application of the POPCD method is justified andappropriate for ARC analyses.
POPCD distributions are developed based on fitting the inspection results used to define POPCDby loglogistic functions, which are commonly applied in tube integrity analyses for PODdistributions. Uncertainties in the resulting POD distributions are obtained from the analyses. Inaddition, the industry POPCD results for bobbin coil detection are shown to be in goodagreement with POD results obtained from ANL round-robin test results in NUREG/CR-6791,the DCPP POPCD results, and an EPRI POD obtained from blind testing of analysts.
Based on industry and plant specific bobbin detection data for ODSCC within the SG TSPregion, large voltage bobbin indications that can individually challenge structural or leakageintegrity can be detected with near 100 percent certainty and would not be left in service. Theselarge voltage indications should not be included in the BOC voltage distribution, other than asinferred from the voltage dependent POD, for the purpose of the operational assessment. ThePOPCD approach to probability of detection considers the potential for missing indications thatmight challenge structural or leakage integrity by applying the POPCD data from successiveinspections. The database used to develop the POPCD values includes data from successiveinspections. If a large indication was missed in one inspection, it would continue to grow untilfinally detected in a later inspection. Therefore, the use of the POPCD method to determine theBOC voltage distribution will improve EOC projections and lead to appropriate estimates of themargin in SG tube structural and leakage integrity.
7.11 References
7-1 EPRI Topical Report NP 7480-L, Addendum 1, "Steam Generator Tubing OutsideDiameter Stress Corrosion Cracking at Tube Support Plates Database for AlternateRepair Limits 1996 Database Update," dated November 1996.
7-2 EPRI Topical Report NP 7480-L, Addendum 5, "Steam Generator Tubing OutsideDiameter Stress Corrosion Cracking at Tube Support Plates Database for AlternateRepair Limits, Update 2002," dated November 2002, 1007660.
7-20

EPRI Proprietary Licensed Material
Probability of Prior Cycle Detection (POPCD)
7-3 Generic Letter 95-05, "Voltage-Based Repair Criteria for Westinghouse Steam GeneratorTubes Affected by Outside Diameter Stress Corrosion Cracking," dated August 3, 1995
7-4 NRC Letter, G. S. Shukla (NRC) to G. M. Rueger (PG&E), "Review of Diablo CanyonNuclear Power Plant, Unit No. 2 - Issuance of Amendment - Revised Steam GeneratorVoltage-Based Repair Criteria Probability of Detection Method for Diablo Canyon Unit 2Cycle 12 (TAC No. MB9742)," dated October 21, 2003.
7-5 Enclosure I ("Extreme Values of ODSCC ARC Indications Growth") to Nuclear EnergyInstitute Letter, Alex Marion (NEI) to Document Control Desk (NRC), "Revision toODSCC ARC Task Extreme Values of ODSCCARC Growth,"dated July 9, 2004.
7-6 Enclosure 3 ("Voltage Dependent Growth Break Point Determination") to NuclearEnergy Institute Letter, Alex Marion (NEI) to Document Control Desk (NRC), "GenericLetter 95-05 Alternate Repair Criteria Methodology Updates," dated June 2, 2004.
7-7 WCAP-14277, Revision 1, "SLB Leak Rate and Tube Burst Probability AnalysisMethods for ODSCC at TSP Intersections," December 1996
7-8 Nuclear Energy Institute Letter, D. Modeen (NEI) to Document Control Desk (NRC),"Steam Generator Degradation Specific Management Database, Addendum 2 andResponses to NRC Requests for Additional Information (RAI)," dated September 14,1998.
7-9 Letter from Lawrence F. Womack, PG&E, to the NRC, "Diablo Canyon Unit 2, PG&EResponse to NRC Questions on 2R1 I Steam Generator Tube Inspections," datedSeptember 30, 2003, letter DCL-03-121.
7-10 Letter from David H. Oatley, PG&E, to the NRC, "Supplemental Information to SupportLicense Amendment Request 03-10, Revised Steam Generator Voltage-based RepairCriteria Probability of Detection Method for Diablo Canyon Unit 2 Cycle 12," datedSeptember 30, 2003, letter DCL-03-123.
7-11 NUREG/CR-6791, ANL-02/07, "Evaluation Current Reliability Results from the SteamGenerator Mock-Up Analysis Round-Robin," Published November 2002, ArgonneNational Laboratory.
7-12 Jackson, P. S., EPRI Project 6424/RP-3580, Tetra Eng. Group, Inc., TR-95-001,"Probability of Detection by Bobbin Inspection," February 6, 1995.
7-13 NRC Letter, G. S. Shukla (NRC) to G. M. Rueger (PG&E), "Diablo Canyon Power Plant,Unit Nos. I and 2 - Issuance of Amendment Re: Permanently Revised Steam GeneratorVoltage-Based Repair Criteria Probability of Detection Method (TAC Nos. MC2313 andMC2314)," dated October 28, 2004.
7-21

EPRI Proprietary Licensed Mfaterial
Probability of Prior Cycle Detection (POPCD)
Table 7-1Data Table for Tracking Indications Between EOCn and EOCn+1
BDD at EOCn+1 BND at EOCn+1
EOCn BDD w/o RPC BDD w/RDD BDD w/RND BND w/o RPC BND w/RDD BND w/RND
Not Not | Not | Not Not | NotPlugged Plugged Plugged Plugged Plugged gged Plugged Plugged Plugged Plugged Plugged Plugged
Plugged -- : -.- - -. . . .BDD w/o RPC Not Plugged
aBEDoD BDDw/D I oPlugged - __..___' :: E ____ ,.__ _ _ :.: >- . : =. :- -_____ ,._
BDDw RND Plugged :_; -- -. -- - - --PluggNot Plugged
BND wlo RPC Not Plugged =
aB~ND BND w/ RDD Plugged - - . -. : --. ..at__EOnNot Plugged
BND w/ RND Plugged =: :: ___ .. - - -- ; .:Not Plugged _
General Notes:
Specific Notes:
1) For EOCn bobbin indications that are confirmed by RPC or detected only by RPC, EOCn+1 RPC should be performed when bobbin is NDD and the number in this categorywill be 'O" for future inspections.
2) If indications are RPC confirmed at EOCn but RPC NDD at EOCn+1, the causative factors for this change in RPC detection should be discussed in the ARC 90 day report.
7-22
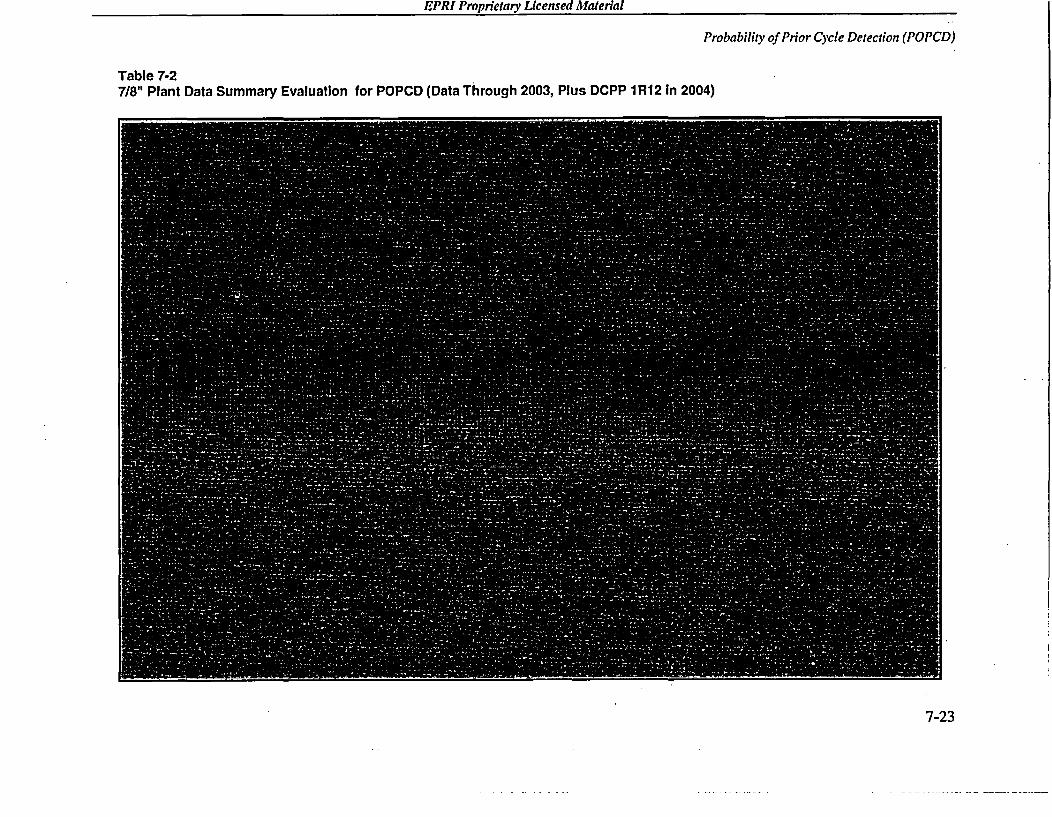
EPRI Proprietary Licensed Material
Probability of Prior Cycle Detection (POPCD)
Table 7-27/8" Plant Data Summary Evaluation for POPCD (Data Through 2003, Plus DCPP 1R12 in 2004)
7-23
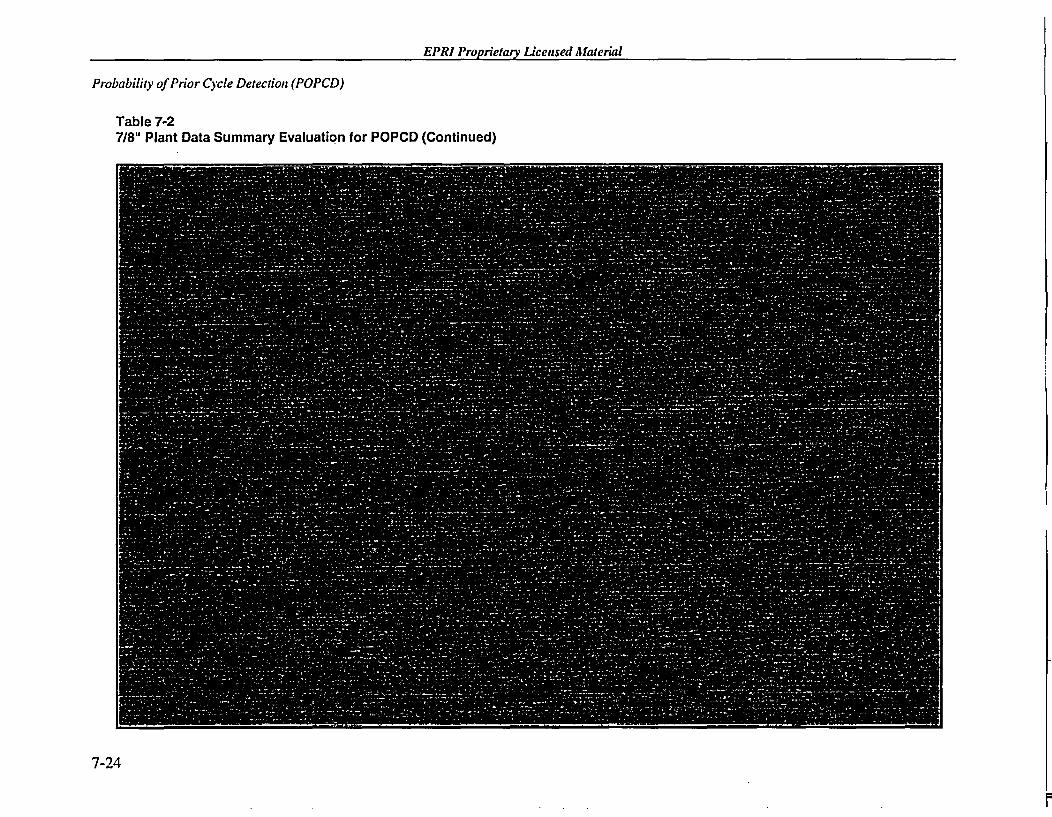
EPRI Proprietary Licensed Material
Probability of Prior Cycle Detection (POPCD)
Table 7-27/8" Plant Data Summary Evaluation for POPCD (Continued)
7-24

EPRI Proprietary Licensed Material
Probability of Prior Cycle Detection (POPCD)
Table 7-27/8" Plant Data Summary Evaluation for POPCD (Continued)
t.I
7-25

EPRI Proprietary Licensed Material
Probability of Prior Cycle Detection (POPCD)
Table 7-33/4" Plant Data Summary Evaluation for POPCD (Data Through 2003)
7-26
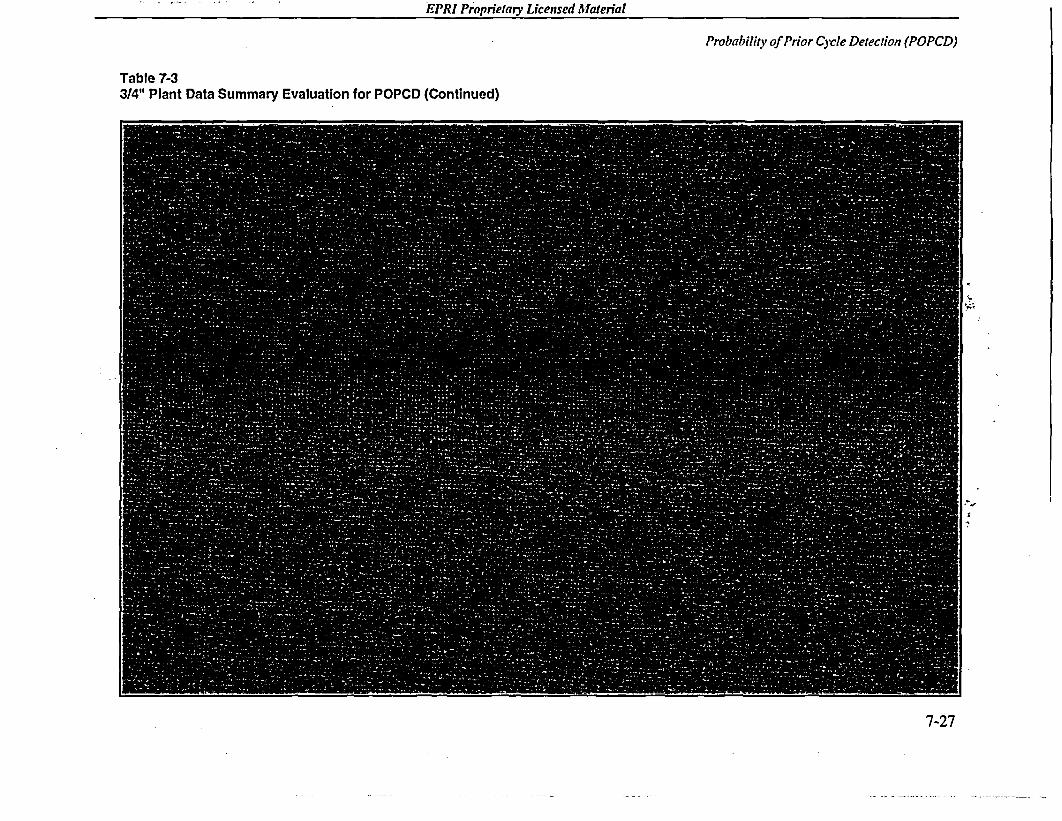
EPRI Proprietary Licensed Material
Probability of Prior Cycle Detection (POPCD)
Table 7-33/4" Plant Data Summary Evaluation for POPCD (Continued)
_ _ __ Y"
-I
7-27

EPRI Proprietary Licensed Material
Probability of Prior Cycle Detection (POPCD)
Table 7-33/4" Plant Data Summary Evaluation for POPCD (Continued)
7-28

EPRI Proprietary Licensed Material
Probability of Prior Cycle Detection (POPCD)
Table 7-4314" and 718" Summary Evaluation for POPCD
7-29

EPRI Proprietary Licensed Material
Probability of Prior Cycle Detection (POPCD)
Table 7-43/4" and 7/8" Summary Evaluation for POPCD (Continued)
7-30
F

EPRI Proprietary Licensed Material I
Probability of Prior Cycle Detection (POPCD)
Table 7-43/4" and 7/8" Summary Evaluation for POPCD (Continued)
7-31

EPRI Proprietary Licensed Material
Probability of Prior Cycle Detection (POPCD)
Bobbin Drilled Hole TSP DatabaseTSP Center P1 Mix Vvmax Noise Distributions
1
0.9
0.8
0.7
0.6
LIa 0.5C-)
0.4
0.3
0.2
0.1
0
0 0.1 0.2 0.3 0.4 0.5 0.6 0.7 0.8 0.9 1 1.1 1.2 1.3 1.4P1 Mix Vvmax Noise Amplitude (volts)
Figure 7-1Bobbin Drilled Hole TSP Database TSP Center P1 Mix Vvmax Noise Distributions
7-32

EPRI Propretary Licensed Alaterial
Probability of Prior Cycle Detection (POPCD)
Gcneric idustry 'Ol'CI) as Function or Bobbin Ainplifticle: 7/8" TubingWeiyhted Gencralized Lhnar Model Loglogistic Solution
100E -
90'; -
W80% -
701 -
60£ -
50% -
40 ;-
.%tO-
20% -
10 -
v;J -FM
0.01 0.1 I 10
Bobbin Amplitude (Volts)
Figure 7-2Generic Industry POPCD as a Function of Bobbin Amplitude: 7/8" Tubing
Generic Indcistry I'OI'CD its lulnction of IBol)b)in Amlplitulde: 3/4" TubingWcighred Generalized Uncar Model LogIogistic Solution
90%
>.t
*s
70'.
60%
50%,
40%
30%
20%
10%
0% -f
0.01 I). I 10
Bo0)bbin Ainplitude (Volts)
Figure 7-3Generic Industry POPCD as a Function of Bobbin Amplitude: 3/4" Tubing
7-33

I 11 l
EPRI Proprietary Licensed Material
Probability of Prior Cycle Detection (POPCD)
(eneric industry 11OPCD as Func(ion of Bobbin AllplittuieCormpurismin of Combinied 7/8" + 3/4" POPCI) with 7/8" PO)PCD anti 3/4" PO PCD
WVighted Gcncralizcd Linear Model Loglogistic Solurion100%, -
9K) .
30% -
20%1 -
O% 'En.fl n I Bozbb~in Ampllilfude IVoults I 10
Figure 7-4Generic Industry POPCD as a Function of Bobbin Amplitude: Comparison of Combined7/8" + 3/4" POPCD with 7/8" POPCD and 3/4" POPCD
Figure 7-5Comparison of Log Logistic Industry 3/4" & 718" POPCD with DCPP POPCD
7-34

EPRI Proprietary Licensed Material
Probability of Prior Cycle Detection (POPCD)
.
Figure 7-6Percentage of Correct TSP BC Calls (Average of Resolution Analysts)
7-35

I ifu
EPRI Proprietary Licensed Material
Probability of Prior Cycle Detection (POPCD)
Figure 7-7Comparison of LogLogistic Industry POPCD and ANL POD
Figure 7-8Comparison of Industry POPCD, DCPP POPCD, ANL POD and EPRI POD
7-36

EPRI Proprietary Licensed Material
8RECOMMENDED NEW UPDATES TO NDE, ANALYSISMETHODS AND PROGRAMS
This section provides recommended new updates to NDE and analysis methods applied inapplications of the ARC for ODSCC at TSP intersections. NRC approved updates are given inSection 9 of this report, and prior industry updates recommended for ARC implementation areincluded in Section 10 of this report.
Updates in this section requiring NRC approval for implementation are "Extreme Values ofODSCC ARC Indications or Growth" in Section 8.1 and "Noise Requirements for Voltage BasedARC" in Section 8.2. The noise analysis methods of Section 8.2 may be applied without NRCapproval to select indications for RPC inspection but the increased repair limits of this sectionbeyond that permitted by GL 95-05 cannot be applied without NRC approval. Section 8.3, "ARCGuidelines for Preventive Repair of Large +Point Indications" can be implemented without NRCapproval as this section identifies optional supplemental inspections and preventive repair, whichdo not conflict with GL 95-05.
The POPCD methods given in Section 7 of this report and the methods given in Section 10.3 forvoltage dependent growth rate analyses are also new updates. Since these two methods replace aprior methodology, the new methods are given as entire replacements for the prior Addendum 5sections.
The extreme growth values methods of Section'8.1 and the noise analysis requirements ofSection 8.2 were submitted for NRC approval by NEI letters of July 9, 2004 and April 13, 2004,respectively. The preventive repair guidelines of Section 8.3 were submitted for informationonly to the NRC in the NEI letter of April 13. Based on subsequent NRC acceptance of POPCDfor Diablo Canyon in October 2004, the April 13 guidelines have been slightly modified inSection 8.3 to increase the recommended RPC inspection to 100% of indications between 1.7and 2.0 volts for plants with 7/8 inch tubing.
8.1 Extreme Values of ODSCC ARC Indications or Growth
This section describes a methodology for incorporating allowances for extreme growth values inthe ARC operational assessments. These methods were submitted for NRC approval in July 2004for inclusion in ARC analyses upon NRC approval to apply POPCD (see Section 7 of this report)rather than a POD of 0.6 for the analyses and are not intended for analyses applying the GL95-05 POD of 0.6.
8-1

11
EPRI Proprietary Licensed Material
Recommended New Updates to NDE, Analysis Methods and Programs
There have been infrequent occurrences of large voltage growth rates in ARC inspections. Inmost cases, particularly for 7/8 inch tubing, the occurrences of large growth rates appear to berandom events. The rapid exponential increase in voltages near and at throughwall crackpenetration and the additional approximately exponential increase in voltage with throughwalllength appears to be a principal contributor to the large growth rates. The extreme values forvoltage growth can occur without correspondingly large average depth growth rates.
The extreme value methodology of this section is based on the probability of occurrence of alarge growth rate based on historical data. Separate probabilities would be applied for 3/4 and 7/8inch tubing based on differences in the historical probabilities of large growth values. Table 8-3provides the historical values for extreme growth rates for both tubing sizes. Upon NRCapproval of the extreme value methods, Table 8-3 together with the number of historical ODSCCindications in each tubing size are to be updated in future ARC addenda.
8.1. 1 Introduction
Alternate repair criteria (ARC) have been in use for outside diameter stress corrosion cracking(ODSCC) indications in steam generator (SG) tubes since the early 1990'sl. The criteria apply totubes in Westinghouse SGs with drilled hole tube support plates (TSPs) when the cracking isconfined to the crevice between the tube and the TSP. A detailed description of the criteria andthe conditions for their application is provided in Generic Letter (GL) 95-05, Reference 8-1,issued by the United States Nuclear Regulatory Commission (NRC). The ARC replace the 40%depth criterion generally used for SG tube degradation with a repair limit based of the eddycurrent test (ECT) bobbin coil amplitude. The ARC plugging limit for plants with 3/4 inchnominal diameter tubes is I volt and the limit for plants with 7/8 inch diameter tubes is 2 volts. 2
Typical maximum or extreme indication amplitudes are usually expected to be on the order of5V. The largest value found in an inspection of a SG is an extreme, although extremes may alsobe defined as any indication exceeding a specified threshold. The values meeting the latterdefinition are usually referred to as exceedances. Five methods are evaluated in this report forpotentially including the influence of extreme growth values in the ARC analyses. Therecommended method, as noted in Section 8.1.1 1, is described in Section 8.1.6.3 and is based onsampling the frequency and distribution of large extreme growth values, which are dependentupon tube size based on historical data. This extreme growth methodology is to be applied inconjunction with the use of POPCD as the licensed POD since the use of a POD of 0.6 alreadyincludes large numbers of high voltage indications in the BOC distribution.
An indication with a bobbin coil inspection amplitude of 21.5 Volts (V) was found during arecent inspection of the SG tubes at Diablo Canyon 2, References 8-2, 8-3 and 8-4. The largeend-of-cycle (EOC) amplitude resulted from a growth rate of I 1.9V per effective full power year(EFPY or EY) during the previous plant operating cycle with a hot leg temperature of 603'F.Both the end-of-cycle amplitude and the growth of the indication would be considered to be
'The first applications were referred to as interim plugging criteria or IPC.
2 Speciflic exceptions to these standard limits have been approved for use by the NRC staff on a case basis.
8-2

EPRI Proprietary Licensed Material
Recommended New Updates to NDE, Analysis Methods and Programs
unusually large extreme values and are very rare: A destructive examination of the indicationshowed that it had a large throughwall length and extended through the thickness of the tube, acombination that is expected given the amplitude of the indication, but is not normallyanticipated to be associated with the application of the ARC. The probability of leak (POL) forTSP ODSCC indications in 7/8 inch diameter tubes is illustrated on Figure 8-1. The probabilityof leak under steam line break (SLB) conditions, roughly equivalent to being throughwall duringoperation, is about 5% for a 2 volt indication and 99% for a 20 volt indication. The occurrence ofsuch an indication is not restricted to tubes where the ARC have been implemented. The randomoccurrence of extremely large indications would be less likely when the standard 40% depthplugging criterion is being applied because the corresponding size of the indications at thebeginning of the operating cycle would be expected to be smaller. Regardless, it is desired thatactions be taken to better understand the potential for significant extremes to occur along withtheir attendant consequences relative to plant performance during a postulated SLB situation.
One of the ARC requirements is that the total or joint probability of burst (POB) of all of theTSP ODSCC indications in a single SG should not exceed I -0 during accident eventconditions when the ARC are being applied. The POB of the Diablo Canyon indication wascalculated to be relatively significant. While the results from the destructive testing of the pulledtube section demonstrated that all performance criteria were met, the calculation result basedonly on the nondestructive examination (NDE) measurements indicated that the POB criterion ofthe ARC was exceeded, i.e., a 95% one-sided upper confidence value for the POB was calculatedto be 2.4-10-2 per Enclosure 4 of Reference 8-3. The calculation leads to a statistical prediction ofwhat might happen. Although all indications are constrained from burst by the presence of theTSP during normal and most other operating conditions, the elevation of the TSPs has beenassumed to shift relative to the tubes during the usual limiting accident condition of a postulatedsteam line break (SLB) event. The primary-to-secondary pressure can reach a peak value on theorder of 2405 to 2560 psi, corresponding to pressure relief valve set points of 2335 and 2500 psirespectively, at a temperature on the order of 600'F near the terminus of such an event.
The magnitude of the maximum observed growth is relatively rare and the next largest voltagegrowth was found to be 3.OV per EFPY at Diablo Canyon. However, none of the methodologiesemployed for predicting the growth of indications remaining in service would lead to theexpectation of a value on the order of that observed, including methods that consider thepotential for growth to depend on the magnitude of the indication at the start of the cycle.Singularly large growth values have been observed at several plants during the 10-yearapplication history of the ODSCC ARC. Thus, while the observation at Diablo Canyon 2 isrelatively rare, it is not unique. In greater than eighty (80) applications of the ODSCC ARC therehave been few extremes, or outliers as they have been referred to. There have been three (3)indications in 7/8 inch diameter tubes that have exhibited a growth in excess of 5V/EY whenadjusted to an operating temperature of 603 0F, including the most recent Diablo Canyon 2indications. Moreover, the frequency of occurrence of indications greater than 5V/EY does notappear to be increasing.
The concern to be addressed from this observation is the development of a model aimed atpredicting singularly large values of amplitude growth. The largest indication that is found in anysingle inspection is the extreme value for that inspection, thus it is the appearance of very large
8-3

UL-
EPRI Proprietary Licensed faterial
Recommended New Updates to NDE, Analysis Methods and Programs
extremes of growth that is to be accounted for. However, it must be recognized that individualoccurrences of the largest extreme cannot be predicted. The historical approach to compensatingfor the lack of a direct prediction model for large growth rates was employed in the GL in theform of using a uniform probability of detection (POD) of ODSCC indications of 0.6. Simplyput, for every three indications detected during an inspection of the SG tubes, two indications ofthe same magnitude are assumed to go undetected. The number of indications present at thebeginning of a operating cycle is calculated as,
N = ND -NP +NRPOD Eq. 8-1
where ND is the number of indications detected during the inspection, Np is the number ofindications plugged, and NR is the number of previously plugged indications returned to service.The application of a uniform POD means that a large number of significant indications areassumed to be initially present when the plant starts up following an inspection for the purpose ofpredicting the level of degradation at the end of the next period of operation. However, thelargest indications are typically in the range of 5 to 6V with maximum observed growth rates onthe order of 3V, thus the maximum end-of-cycle (EOC) predicted amplitudes would not exceedthe 9V structural limit. Hence, the rationale for the use of 5V/EY is based on the consideration ofadding 5V growth to a 2 to 4V indication effectively remaining below the 7/8 inch diametertubes structural limit as defined in Reference 8-1.
The use of a uniform value for the POD of 0.6 was originally conceived by the NRC staff toaccount for both the probability of detection and the initiation of new indications. It has beendemonstrated through experience to frequently provide conservative predictions of the number ofindications present at the next inspection, however it does not result in a good prediction of thedistribution of the indications nor does it, or can it, result in the prediction of the largest extremevalues.
In order to address the problem of predicting the value of the extremes, or exceedances, a goodpredictor of the number of indications is needed. The industry has developed a methodology forpredicting the number of indications and their severity based on using information available atthe current inspection to update the probability of detection as a function of indication amplitudeobserved at the previous inspection. The POD thus calculated is then used predict the numberand distribution of amplitudes expected to be found in the following inspection. The method hasbeen designated as the probability of prior cycle detection (POPCD) and has been demonstratedto agree fairly well with inspection data, see Reference 8-5 (four more addenda provideadditional data to support the application of the methodology).
8.1.2 Regulatory Topics of Interest
Information gleaned from the several discussions with the NRC staff on the subject of the DiabloCanyon ODSCC degradation indicates that their interests parallel that of the industry, e.g.,Reference 8-8. There are several items of interest regarding the performance of the ODSCCARC process and the results of subsequent evaluations. Of course, one must identify what is to
8-4

EPRI Proprietary Licensed Material
Recommended New Updates to NDE, Analysis Methods and Programs
be classified as an extreme, for example, an indication is an extreme if its magnitude ofdegradation is outside of the expected bounds, i.e.,- an exceedance. The concept of a triggervoltage based on the probability of burst could also be considered based on the number ofindications that could be permitted to occur. For example, if the ARC POB is limited to 1-10-2,any indication with a POB of 2-10-3 might be considered to be an extreme. it also appears fromthe discussions that it is technically desirable to keep track of normal and extreme values for thePOB and growth rate, however, this is somewhat impractical because there are no criteria thatcould be applied based on the results of the calculations.
8.1.2.1 Function of the Analysis
The primary function of the analysis is to demonstrate whether or not the requirements of GL95-05 were complied with, e.g., to demonstrate that the results of the inspection of the tubes areconsistent with meeting the 5% criterion for the probability of burst. Recall that the totalprobability of burst limit is 5.10--2, but that one-fifth of that or 1 -l 102 is allotted for the ODSCCARC. In keeping with the spirit of that requirement, if the probability of burst of the extremeindication is the only thing that results in exceeding the limit then the probability of an extremeshould be low. If an extreme is going to cause leakage in excess of the limit, you have toquantify the frequency of occurrence. The assumption of an extreme value may increase theprobability of not meeting the performance criteria.
The second primary function of the analysis is to determine if the process of implementing theARC is maintaining an understanding of the initiation and progress of the degradation undertechnical control, i.e., it must be verified that the methodology is not degrading in its ability toreliably estimate the consequences associated with a postulated SLB event.
Consideration must also be given with regard to the potential for multiple phenomena to beactive, e.g., causative as at Diablo Canyon or potentially random as for an indication in one ofthe Braidwood I SGs prior to their replacement (the prior inspection amplitude was small). Thisis based on the supposition that extremes for cause,- if such can be identified, are potentiallydifferent than those from random occurrence and implies the need to understand the source forthose extremes or exceedances. With regard to dealing with root cause, consideration has beengiven to implementing ameliorative measures, e.g.,'the increased use of lower RPC information.Enclosure I to Reference 8-9 provides guidelines for supplemental RPC inspection of indicationswith bobbin amplitudes below the ARC repair limit to increase the likelihood of identifyingthose ODSCC indications with large +Point amplitudes for 7/8 inch diameter tubes. The'expressed rationale is that large +Point voltages are indicative of an increased potential for largegrowth during the next cycle of operation. Moreover, quantitative guidelines are provided forpreventive tube repair at less than the licensed voltage based repair limit to reduce the potentialfor large voltage growth rates for indications left in service.
8.1.2.2 The "Fractional Flaw Paradox'
In References 8-10 and 8-1 1 the NRC staff discussed the use of a variable POD, i.e., a POD thatis a function of the indication size; the application of the probability of prior cycle detection,
8-5

I 11.I
EPRI Proprietary Licensed faterial
Recommended Newv Updates to NDE, Analysis Methods and Programs
POPCD, is such an approach. The NRC staff discussed what they first termed the "paradox" ofthe use of a fractional flaw approach associated with the use of a variable POD in Reference 8-10with regard to analysis information presented in Reference 8-12. The fractional flaw referred tois the mathematical construct that results from the application of Equation 8-1 to the number ofindications found. The fraction term in the Equation 8-1 leads to the need to consider a fractionof an indication for each indication found. For example, a POD of 0.6 results in the considerationthat 1.7 flaws were actually present when one indication was detected. If the detected indicationis removed from service, 0.7 of an indication must be considered to remain in the SG. When thePOD is a function of the size of the indication, say area or depth, the fraction remaining will varyby the size of the detected indication population; the detection and plugging of an indication witha POD of 0.8 results in 0.3 if a like indication being considered to remain undetected. Themethod used for the treatment of the fractional indications per Reference 8-12 was to accumulatethe fractional indications into groups summing to one indication. "Profiles with fractionalindications from the POD corrected are grouped from highest to lowest depth until the sum of thefractional indications totals unity to define a POD group number for burst pressure distributioncalculations. In the Monte Carlo sampling for a POD group, the profiles comprising the groupare sampled at the frequency of their contribution to unity for the group." The POD grouprepresents a single indication in each Monte Carlo simulation analysis but the initial morphologyof the indication changes from simulation to simulation. The POD group concept is used toassess whether each POD group satisfies the burst pressure margin requirement, but does notinfluence the burst probability calculation compared to the ODSCC ARC methods for evaluatingfractional indications.
The paradoxical concern as described by the NRC staff in Reference 8-10 was as follows:
"In certain situations, the fractional flaw approach appears to lead to a paradox whenused in conjunction with a variable POD. As an illustration, plant A experiences a tuberupture near the end of its operating cycle after a flaw grows to 90% through wall. A lookback analysis of the failed tube indicates that a 70% through wall flaw was present duringthe previous inspection but was missed. No other indications are found. Because the PODof a 90% through wall flaw is essentially 1, no corresponding fractional flaw needs to beconsidered in the operational assessment." On the other hand, plant B shuts down for itsplanned inspection outage. The inspection reveals one flaw, 60% through wall. A lookback analysis indicates that a 40% through wall flaw was present during the previousinspection but was missed. The POD for a 60% flaw is less than 1, so a correspondingfractional flaw must be assumed in the operational assessment. Plant B's operationalassessment will predict a larger flaw to be present at the end of the next operating cyclethan plant A's."
Evidently the staff considered the paradox of this example to be the fact that Plant B has toassume that a flaw will be present at the end of its next operating cycle while Plant A does not,even though it was Plant A that had the forced outage due to a tube rupture event. There is noparadox associated with this discussion, simply the stating of one of the random events that couldoccur in an extreme situation without consideration of its probability of occurrence. This line ofreasoning would lead the staff to a similar conclusion in any situation where an one severe eventwas postulated to occur more frequently than a more likely event. Moreover, the example doesn'thave anything to do with the application of the fractional flaw methodology. The appropriateoperational assessment (OA) methodology to address the "paradox" is that the Plant A POD used
8-6

EPRI Proprietary Licensed Material
Recommended New Updates to NDE, Analysis Methods and Programs
for the OA should be sufficiently degraded such that there is a much higher probability of notdetecting a 70% or deeper flaw than the POD applied for Plant B.
The NRC staff's conclusion from the example was that an alternative to the "fractional flaw"approach would be needed to provide for a realistic analysis when using a variable PODassumption. The NRC staff reiterated the above concern in Reference 8-11 as:
Issue 9: Use of a 'fractionalflaw" method or other similar methodsfor determining a beginning-of-cycleflaw distribution may lead to nonconservative results wulhen used in colljnction with aPOD parameter that varies as afunction offlaw size or voltage.
The NRC staff noted that the issue derived from their review of the Indian Point 2 (IP-2)licensee's operational assessment, i.e., Reference 8-12, to support restart after the SG tube failureevent on February 15, 2000. The staff went on to state that
"...the fractional flaw method is based on the assumption that for each flaw found byinspection, there are flaws of the same size which were not detected by the inspection.For each detected flaw of a given size, the number of undetected flaws of that size isassumed equal to I/POD - l. This methodology has been approved by the staff forimplementing voltage-based alternate repair criteria in accordance with NRC GenericLetter 95-05 and for implementing an alternate repair criterion for PWVSCC at dented tubesupport plates. For these applications, licensees are currently assuming a constant POD of0.6.
The fractional flaw method was recently used in an operational assessment of smallradius U-bend PWSCC at IP-2. However, the operational assessment used a PODparameter that varied with crack size. The effect of the variable POD function inconjunction with the fractional flaw method made the results of the analysis insensitive tothe size of the indications found by [the] inspection. The staff considered this findingunrealistic."
The industry's response, Reference 8-13, was as follows, in summary, the use of a variable POD(dependent upon depth, area, or volts) that results in fractional indications for the undetectedpopulation is technically correct and appropriate for operational assessments. Theappropriateness of this POD technique is not dependent upon specific Monte Carlo applications,wherein the undetected indications can be evaluated as fractional indications for each SG sampleor as whole indications occurring in SG samples at the fractional frequency. The application ofvariable PODs correctly simulates the inspection process and does not arbitrarily introduceconservatism or non-conservatism in an operational assessment. Interpretation of the IP-2example as a non-conservative basis for requiring a constant POD introduces arbitraryconservatism that inhibits benchmarking and the causal assessment of finding larger indicationsin an inspection such as larger growth rates or a poor prior cycle POD.
8.1.2.3 Extreme Growth of Indications at V. C. Summer
Five atypical voltage indications were found in SG B at the V. C. Summer plant in 1993,Reference 8-14. A summary of the indications is provided in Table 8-4, note that all of theindications were at the elevation of the flow distribution baffle (FDB). Sections of the tubes in
8-7

___ ___ __ I JL_
EPRI Proprietary Licensed Material
Recommended New Updates to NDE, Analysis Afethods and Programs
locations R28C41, R33C20, and R42C43 were removed for examination to ascertain the strengthand the root cause of the tube indications. Each of the indications was found to have regions thatwere 100% of the tube wall thickness deep over lengths ranging from 0.33 to 0.50 inch. Thepresence of the FDB would have prevented the burst pressure of the tubes falling below the 3APstructural performance criterion. An analysis of the FDB displacement during postulated SLBconditions resulted in the conclusion that the 1.4 APSLB structural performance criterion wouldhave also been met.
The examination of the pulled tube sections demonstrated that the cause of the high growth ratesof the indications was the presence of high cation-to-anion ratios in a copper oxidizingenvironment. It was also concluded that there was a synergistic relationship between threecausative factors, dissolved copper species, a localized caustic environment, and a partiallypacked hot leg flow distribution baffle (FDB) location. The copper plays a direct role inaccelerating the crack growth; the presence of the copper resulted from an incomplete copperremoval step in chemical cleaning the SGs during a prior outage. The analysis of the SGblowdown sodium and chloride data indicated that an alkaline environment was likely which ledto strong caustic environments in regions of high superheat, provided by the partially packedcrevice locations. The partially packed FDB crevices were identified as being more susceptibleto rapid growth over short periods of chemistry imbalance due to the greater surface area of thecrevice deposits and higher superheat which facilitated the accumulation of impurities. Thepotential for a reoccurrence of the V. C. Summer incident is unlikely and modification of theODSCC ARC analysis methodology to account for such a possibility is unrealistic andimpractical.
8.1.3 Objective of the Analyses
The overall objective of the ODSCC ARC analyses is to demonstrate compliance with therequirements of Reference 8-1 with regard to the probability of burst of tubes with ODSCC atTSP intersections and the total leak rate that could result from those same tubes during apostulated SLB event. Two such demonstrations are required, one for the as-found condition ofthe SG tubes at the time of the inspection and one for the projected condition of the SG tubes atthe end of the next operating cycle. These evaluations are referred to as Condition Monitoring(CM) and Operational Assessment (OA) respectively. Monte Carlo simulations of the size of theODSCC indications, the material of construction of the SG tubes, and the error associated withpredicting the burst pressure as a function of the bobbin amplitude are performed to demonstratecompliance with the structural requirement of Reference 8-1 that the probability of burst of oneor more tubes with ODSCC indications is less than 1.10.2. The second portion of the tubeintegrity evaluation results in the prediction of the total primary-to-secondary leak rate that couldbe expected to occur during a postulated SLB event and a comparison of that result against anallowable value that is within the licensing basis for the plant. The size of the indications, thegrowth rate, and the probability of leak and the leak rate from indications that leak as a functionof the size of the indications is simulated for the leak rate analysis. The details of themethodology are described in Reference 8-22. A projection of the distribution of the size ofindications that might be present at the end of the next operating cycle based on the probabilityof detection of the current indications and their potential growth during the next operating cycleis required for the performance of the Operational Assessment.
8-8

EPRI Proprfietaqy Licensed Material
Recommended New Updates to NDE, Analysis Methods and Programs
There are two approaches that were considered as exemplifying the objective of the analysis. Thefirst is based on modifying the simulation process so as to increase the total growth rate reportedfor all analyses of SG indications. The second is based on changing the reporting philosophy sothat two values of the total growth rate are reported, the expected 9 5 th percentile and anunexpected 9 5th percentile. There are merits to both approaches, however, it is the statistics thatare important to demonstrating safe operation of the plant that are important while maintainingcompliance with current regulatory requirements. The first approach is considered to be such thatit can be implemented within the current guidance of the ODSCC ARC generic letter, Reference8-1, because additional conservatism is introduced and the reporting requirements for the resultsare unchanged.
One potential methodology that adds conservatism to the analysis consists of simulating a largeextreme of the growth rate with a representative frequency and include it in the growth rateanalysis. The net effect will be that the 9 5 th percentile total growth rate will increase slightlybecause the extreme growth rate will always be the maximum value in the sorted list of growthrates.
As an example, suppose the number of simulations performed was 1000. The 9 5 th percentilegrowth rate at 95% confidence is the 961" value in the list of results once the simulations havebeen completed and the results sorted in ascending order. Suppose now, that the simulationprocess has been modified to include the potential for extreme values to occur in the MonteCarlo analysis. Extremes would not be expected to occur during all of the simulations, but forthose simulation where extremes were predicted to occur, they would become the 10 00th value inthe sorted list. If one simulation included an extreme value, the list element that would haveformerly been number 962 would be shifted into the 961] position and would be reported as the9 5 th percentile at 95% confidence. The net effect being that the reported value from the conditionmonitoring and operational assessment simulations would be increased slightly, or significantlydepending upon the frequency assigned to the large extreme values and the slope of the leak ratecurve near the 9 5 ih percentile. While this approach adds conservatism to the reported results ofevery analysis, there would still be situations where an extreme growth value would occur andnot be bounded by the operational assessment from the previous cycle. However, the nature ofextremes is that the timing of the occurrence of the largest extreme cannot be predicted only theprobability that the extreme in any given analysis will be bounded by some calculated value.
The second approach considered was to address the issue of extremes of the growth rate directlyby reporting the expected 9 5 h percentile of the probability of burst and the growth rate withoutextremes being present and the POB and the growth rate with extremes being present along withthe probability of the extreme occurring. This information would be expected to be of the mostuse to anyone performing risk-based integrity calculations with regard to the SG. However, suchreporting is not within the current framework associated with GL 95-05, Reference 8-1, and theacceptance criteria associated with such a change to the methodology would likely requireregulatory approval. Since the probability of a large extreme would be based on historical dataand is not like to change dramatically with future inspections, acceptability can only be based onthe results of risk-based integrity calculations.
8-9

I 1LU
EPRI Propretary Licensed Material
Recommended New Updates to NDE, Analysis Methods and Programs
In summary, the modification of the analysis to account for the potential for large extreme valuesto occur for each analysis of the SGs is recommended on the basis that it can be incorporatedwithin the current regulatory requirements of Reference 8-1 without changing the reportingrequirements.
8.1.4 Distribution of ODSCC ARC Growth Rates
Experience has shown that large extremes of the growth rate appear infrequently, as expected.Extremes of growth affect both the probability of burst and the 9 5 th percentile predicted total leakrate. The appearance of large extremes is expected to be random in nature, although there is asignificant example where the extremes occurred for cause, i.e., the previously discussed incidentat the V. C. Summer plant was such a case and would not be expected to be applicable to theprediction of the appearance of large extremes at other plants. Singularly large growth rates areobserved infrequently, that this occurs is simply due to the fact that the maximum values fromrepeated sample observations from a population of data follow a different distribution than theparent distribution of the data. The appearance of large extremes has historically been morefrequent in SGs with 3/4 inch diameter tubes than in SGs with 7/8 in diameter tubes. Severalwere in the SGs at a single plant, ostensibly due to the operating conditions, e.g., hightemperature, in those SGs.
8.1.4.1 Analysis of SG Data
An analysis of data from SG 2-4 at Plant Y illustrates the growth rate model; the distribution isillustrated on Figure 8-2 for indications exhibiting positive growth. The fit of the lognormaldistribution to the histogram data is quite strong and further illustrated on Figure 8-3 against theordered raw data. A normal distribution plot of the logarithmic data is shown on Figure 8-4. Thereplication of results in the lower tail of the distribution, first shown on Figure 8-2 is a result ofthe lack of resolution of when the bobbin amplitude is small.
8.1.4.2 Generic Letter Requirements
The requirements of the GL allow for the distribution of the growth rate to be considered as anempirical distribution function (EDF) or by fitting a functional cumulative distribution function(CDF) equation to the data. It is noted in the GL that it is intended that the analysisconservatively model the tail of the distribution of the growth rate of the ODSCC indications. Itis also stipulated that the growth rate can be modeled in units of Volts, viz. AVolts, or as apercent of the previous voltage amplitude, viz. percent AVolts. There is guidance provided inReference 8-1 relative to the use of a functional growth rate instead of an empirical distributionfunction, to wit,
"It is acceptable to use a statistical model fit of the observed growth rate distribution aspart of the tube integrity analysis provided that the statistical model conservativelyaccounts for the tail of the distribution. It is also acceptable that the voltage growthdistribution be in terms of A volts rather than percent A volts, provided the conservatismof this approach continues to be supported by operating experience. For the purposes of
8-10

EPRI Proprietary Licensed Material
Recommended New Updates to NDE, Analysis Methods and Programs
assessing the conditional probability of burst and conditional growth rate, negativegrowth rates should be included as zero growth rates in the assumed growth ratedistribution. However, for the purposes of determining the upper voltage repair limit inaccordance with Sections 2.a.2 and 2.a.3, it is appropriate to consider negative growthrates as part of the estimate for average growth rate."
The following are some examples of modeling the growth that would be acceptable within theframework of the generic letter:
1. Model the probability of an indication exhibiting positive growth binomially, forexample, the probability of an indication exhibiting positive growth is 90%. This simplyaccounts for the occurrence of large extremes directly.
2. Model the distribution of growth using a lognormal distribution for example. This type ofapproach to modeling empirical was specifically mentioned in Reference 8-1 regardingthe leak rate data.
3. Model the distribution of extremes of the growth using an appropriate distribution for theexpected maximum value in any given sample. The extremes of the lognormaldistribution follow a Gumbel distribution.3
In this manner the probability of occurrence of a large extreme value would be expected to bepredicted as described by the first approach described in Section 0 of this report.
8.1.4.3 Root Cause of Extreme Growth
The appearance of extreme growth of an indication is with respect to the bobbin amplitude. Forexample, the indication in the Plant Y tube increased to an amplitude level of 21.5V. This doesnot mean that there was an extreme level of growth in either the depth or the length of theindication. Historical information was presented in References 8-2 and 8-7 demonstrating alinear dependence of the logarithm of the bobbin amplitude on the destructive examinationmaximum depth as a fraction of the tube thickness. Moreover, a linear dependence of thelogarithm of the bobbin amplitude on the destructive examination throughwall length was alsodemonstrated. Indications that are near throughwall can be expected to exhibit a bobbinamplitude on the order of 2 or 3V. Thus, a joint dependence of the form
V = exp(go +g1h +g2 L +g3hL) Eq. 8-2
could expected. Thus, it is possible for an indication to be on the verge of becoming throughwalland have its bobbin amplitude increase significantly with a small amount of depth growth.
3 The consideration that this is within the framework is based on the fact that it is essentially a simulation of theextremes of the tail of the lognormal distribution.
8-11

-l ~
EPRI Proprietary Licensed Alaterial
Recommended New Updates to NDE, Analysis Methods and Programs
8.1.4.4 Growth Rate Predictions
Note that one of the implications of the exponential form of Equation 8-2 is that all growth interms of bobbin amplitude depends on the beginning voltage, i.e., it is voltage dependent. Inpractice, it is assumed that the cross-term between depth and length can be ignored, i.e., g3 istaken to be zero. Thus, for a constant or relatively constant length, if the growth rate in depth isrelatively constant, then,
dV = gd ego+glh dh = V g A Eq. 8-3dt dt dt
Thus, the growth in bobbin amplitude is a function of the current bobbin amplitude, i.e., voltagedependent growth. Moreover, the growth of cracks in A600MA SG tubes has been described asfollowing an Arrhenius relation, i.e.,
r =-= b-= Aa e RT Eq. 8-4dt dt
where r is the rate of crack growth in units of length per time, e.g., mils per month or meters persecond, b is the tube thickness, h is the relative crack depth, t is time, A is a constant ofproportionality, a is applied stress, n is a constant in the range of 2 to 4, Q is the activationenergy for the growth of cracks in the material, typically 30 kcal/mole for A600MA, R is theuniversal gas constant, and T is the absolute temperature measured in units matching R, that is,'K or 'R. Combining the two equations and taking the derivative of the logarithm of V yields,
dV g- =V -' Acne RT. Eq. 8-5dt b
Thus, the rate of growth of the bobbin amplitude depends on its current value and on the absolutetemperature at the location of the crack. This observation has been noted in discussions ofvoltage dependent growth (VDG), Reference 8-6 (provided as Attachment 2 to Enclosure 4 ofReference 8-3). This result is in concert with the previously discussed observation that thegrowth can be well described as following a lognormal distribution, a factor affecting growthincreases with the size of the indication. This does not mean that VDG must always be modeled.It is apparent from the discussion and figures in Reference 8-6 that the relation is usually soweak that the dependence can be ignored up to an amplitude of about 1.5 Volts. The implicationis that the dependence on stress, which appears directly in Equation 8-5, is weak relative to othereffects, such as environmental factors, and approximations that consider the growth to be a linearfunction of time can be used. The VDG approach is a refinement that results in parsing theempirical distribution function (EDF) growth curve into two or more segments to identify wherea series of piecewise EDFs should be developed and applied as a function of increasing voltage.In summary, although the growth rate depends on the current amplitude of the indication signal,
8-12

EPRI Proprietary Licensed Material
Recommended New Updates to NDE, Analysis Methods and Programs
the dependence can be effectively modeled by piecewise empirical distribution functions. Inaddition, adjustments for temperature can be accounted for by the use of ratios of the Arrheniusmodel values. Note that the constants in the relation that are not in the exponential cancel.
8.1.5 Potential Approaches
There are several potential approaches to dealing with the extremes.
I. Insert randomly chosen samples from the observed extremes in the applications of the ARCsince it inception, or shortly thereafter, to model the observed frequency of large extremes ofgrowth. This is the recommended approach per the conclusions of this document in Section8.1.11.
2. Use an extreme value distribution to describe the tail values. The extremes of the lognormaldistribution follow a Gumbel distribution. If the extreme value distribution approach is used adecision has to be made regarding the determination of the extremes to be evaluated, i.e.,values that exceed a threshold value or simply the maxima.
3. Fit a distribution, e.g., lognormal, to the growth data and sample from the fitted distribution.The potential drawback to this approach is the determination of the appropriate growthfunction to use.
4. Add an exponential tail to the empirical distribution function to account for growth in excessof the observed values. This could be enhanced by simulating the empirical distributionfunction and finding different exponential tails with each simulation.
5. Use Tchebycheff's inequality to generate upper tail values of the growth distribution.
Each of these are discussed in the following Sections 8.1.6 through 8.1.10, however, theconclusion of the evaluation is that approach I as delineated in Section 8.1.6.3 is recommended.
8.1.6 Insertion of Random Extreme Values
During the course of application of the ODSCC ARC a number of large indications have beenfound at the end of an operating cycle. A summary of the maximum voltage growth values isprovided in Table 8-2. It has been noted that the frequency of occurrence of singularly largegrowth rates, while small, is not insignificant. It is possible in such cases for a single largeindication to be responsible for the total probability of burst or predicted leak rate being near orin excess of the condition monitoring criteria. That this occurs is simply due to the fact that ifobservations from a distribution of data are repeated, it will be found that the largest observedvalues follow a different distribution than the parent distribution of the data. This approach isappealing because it directly addresses the issue of the potential for large extremes of growth tooccur and distributes those large extremes in proportion to the frequency of occurrence observedduring application of the ARC. There are several factors that affect growth that may need to beaccounted for because the database used for developing the statistics was obtained from a varietyof plants with different size tubes, normal operation temperatures, and operating cycle lengths.The potential effects are considered in the following sections.
8-13

ii-
EPRI Proprietary Licensed Material
Recommended New Updates to NDE, Analysis Methods and Programs
8.1.6.1 Factors Affecting Growth
Potential factors affecting the appearance of a large indication are maturity of the population ofindications in the SG, the number of indications in the SG, the chemistry of the secondary side ofthe SG, the temperature of operation, and the length of the operating cycle. The tube size is not afactor in the stress analysis because the radius-to-thickness ratios for the sizes underconsideration are effectively the same, 8.22 and 8.25 respectively for nominal 3/4 and 7/8 inchdiameter tubes. This means that the hoop stress as a function of pressure is the same for eachplant. However, experience has shown that the frequency of designated large extremes is greaterin SGs with 3/4 inch diameter tubes relative to 7/8 inch diameter tubes, e.g., see the list of largerextremes in Table 8-3.
The ODSCC ARC regression curves relate the burst pressure, the probability of leak and thelogarithm of the leak rate for indications that leak to the logarithm of the amplitude of signalfrom the bobbin inspection probe. The growth of the indications is measured in terms of thechange in volts from one outage to the next as opposed to the change in the depth of theindications or the change in their length.
8.1.6.1.1 Maturity of the Population of Indications
The issue here is whether or not the maturity of population of the indications has a bearing on theprobability of a plant experiencing and extreme growth indication. The maturity does not appearto be a significant factor other than indirectly through the number of indications and the numberof indications in service at or near throughwall in depth. There have been instances where ananomalous growth of a single indication has occurred when the remainder of the indicationsexperienced no such abnormalities.
8.1.6.1.2 Number of Indications in the SG
The appearance of extremes of growth would be expected to be a function of the number ofindications in a SG if the combination of contributing factors leading to the development of anextreme growth is random. In other words, if the probability of a tube experiencing a growthextreme is constant, then the probability of a growth extreme occurring in a SG bundle increaseswith the number of indications in the bundle. In other cases extremes can appear for cause, seeSection 8.1.2.3 for example.
8.1.6.1.3 Chemistry of the Secondary Side
The chemistry of the crevice must have an affect on the average growth rate of the indications.However, it is likely of secondary importance regarding the probability of a plant experiencingan extreme growth indication.
8-14

EPRI Proprietary Licensed Material
Recommended New Updates to NDE. Analysis Methods and Programs
8.1.6.1.4 Temperature of Operation
The rate of growth of the indications, r, is considered to be a direct function of the applied stress,a, raised to some power, n, on the order of 2 to 4.4 depending on the environment, and anArrhenius relation function of the absolute temperature, T, of operation, i.e.,
Qr =Aa~ RT Eq. 8-6
where Q is the activation energy of the material, 30 kcal/mole for A600MA, and R is theuniversal gas constant 1.986 cal/mol/IK or 1.103 cal/mol/R (absolute zero is -459.670 F). As thetemperature increases, the value of the exponent decreases and the inverse of the exponential andthe rate of growth increases. Using the above expression the time at temperature, t, taken aseffective full power days or years, EFPD or EFPY, can be converted from one operatingtemperature to another, i.e.,
Q(1 1It2 =tl eR T2 T.) Eq. 8-7
where t2 is the adjusted time of operation corresponding to temperature T2, and t, is the time ofoperation at temperature T1. For example, if T2 is greater than T1, the term in parentheses inEquation 8-7 is negative and the time that Plant 2 could operate for the same expected indicationgrowth is shorter than for Plant 1. The approach considered herein is to normalize all of the datafrom the operating plant conditions to a standard temperature, 610'F, using Equation 8-7 for thebobbin probe amplitude growth instead of the depth of penetration.
8.1.6.1.5 Normal Operation Differential Pressure
Equation 8-6 relates the rate of indication growth, usually crack size, to the applied stress raisedto a numerical power, about 4. The stress is directly proportional to the differential pressure.Thus, unrestrained indications in a plant with a normal AP of 1450 psi would be expected toexperience growth on the order of 1.6 times that of indications in a plant operating with a AP of1300 psi. The example pressures roughly correspond to plants with 7/8 and 3/4 inch nominaldiameter tubes respectively. The reason unrestrained indications were specified in the example isthat the stress field associated with tube indications at tube support plate elevations is not likelyto be similar to that at freespan locations. The reason for the cracking is associated with theconcentration of a corrosive environment within the tube-to-TSP crevice that also leads tocorrosion of the TSP material to the extent that the crevice may become closed, especially truefor SGs with carbon steel TSPs. Thus, the difference in operating AP would be expected to notbe meaningful. The second consideration for this variable is that stress is usually considered tobe secondary relative to environmental effects. This is supported by the observation that tubeswith large indications show no apparent geometric differences or other stress risers from tubeswith low growth. In conclusion, there is no apparent reason to believe that the differentialpressure stress has a significant effect on growth for ODSCC.
8-15

EPRI Proprietary Licensed Material
Recommended New Updates to NDE, Analysis Methods and Programs
8.1.6.1.6 Adjustment of Voltage Growth
The growth of the indications is taken to be a linear function of the length of the operating cycleper the ODSCC ARC references, e.g., Reference 8-1.
Q (I 1)AV2= AV A2 eR1T 2 TI)
1 Eq. 8-8
where AV2 is the growth during the cycle to be simulated and AVI is the growth during the cycletaken as a reference. The same identification is made for the EFPD of operation of the cyclebeing simulated, At2, versus the EFPD for the reference cycle, Atl. The terms in the exponentialfollow those of Equation 8-6, i.e., activation energy, universal gas constant, and absolutetemperatures of operation.
8.1.6.2 Simulation Approach Based on SG ARC Applications
There are two approaches that can be taken using the available data from the applications of theODSCC ARC. The first is to consider the frequency of occurrence of large extreme values as afunction of the number of SGs for which the ARC have been applied and the other is to considerthe frequency of occurrence of large extreme values, i.e., exceedances, as a function of the totalnumber of indications that have been observed, discussed in Section 8.1.6.3.
The general approach to a simulation using the frequency of occurrence of large extreme valueson a per SG inspection basis is to:
1. Adjust the growth to a reference temperature of 620'F.
2. Adjust the growth to be in units of Volts/EFPY.
3. Identify all of the indications with growth exceeding 5 Volts/EFPY when normalized to620'F, see Table 8-3.
4. Adjust the frequency of simulating large extremes for the number of indications in the SGpopulation for the simulation of the tube degradation.
The first three steps are common to both approaches to the simulation process, SG or indicationbasis. The last step is necessary because the frequency of occurrence of a large extreme shouldalso depend on the number of indications in the SG. Step 0 is also common to both approaches,but is easier to apply if the simulation is based on the total number of exceedances on anindication basis as described in Section 8.1.6.3, which is also the recommended approach. Thefollowing describes the steps that could be taken based on the frequency of exceedances on a SGbasis:
Given the database of extreme values of voltage growth, AVE, at a reference temperature, TRand for one EFPY. The total number of applications of the ARC is NA and the total numberof SGs for which the ARC has been applied is NG.
8-16

EPRI Proprietary Licensed Material
Recommended New Updates to NDE, Analysis Methods and Programs
Simulating a SG with NJ indications. The probability of a SG having an extreme is givenby,
P NE
PE .N Eq. 8-9
Draw random numbers until one is drawn that is greater than PE to determine the totalnumber of extremes in the SG during that simulation of the SG, i.e., the number of extremesis the number of draws minus one. For example, there is no extreme during that simulation ofthe SG if the first number drawn is greater than PE. However, there is at least one extremeduring that simulation of the SG if the first number is less than PE. There will be thepotential for at least two extremes if the second number is also less than PE, et cetera.
Pick the voltages of the potential extremes from the population of extremes withoutreplacement. If there are to be NGE extremes for that simulation of the SG, pick NGE voltagevalues from the list of extremes. Keep track of the number of indications in the SGs that gowith those extremes.
For each of the potential extreme values, calculate the ratio of the number of indications inthe SG being simulated to the number that go with the growth extreme value. Pick a uniformrandom number, U3, the indication is retained in that simulation of the SG if U3 is less thanthe ratio. If the ratio number is greater than one, that value will appear in the simulation andthe value of U3 will be used to determine if a second extreme is to be included in thatsimulation of the SG. This is to be repeated for each extreme growth value that is determinedin Step (0.
Pick an indication at random from the population of indications that are expected to bepresent at the end of the operating cycle and add that value of growth to the BOC amplitudeto obtain the EOC amplitude for that indication.
In summary, the number of times that large extremes have occurred is counted, that value is thenweighted by the number of indications in the SG; the number of extremes that occur is correlatedto the number of indications in the SG and there is a joint probability of occurrence that issimulated by following the previous steps. Say that there have been 25 extremes of growth in thegreater than eighty (80) applications of the ARC. Further note that there have been 250 SGsinvolved in those applications. Some of the SGs in which extremes occurred had almost 2000indications. The Diablo Canyon extreme had almost 1000 indications in it. This increases thelikelihood of an extreme value of growth taking place, i.e., the fraction of large extreme growthvalues per indication that is found at the end of the operating cycle is effectively constant.
8.1.6.3 Simulations Based on the Total Number of Indications
For the large number of indications observed in both 3/4 and 7/8 inch diameter tubes and thesmall number of large extremes of growth it is acceptable to use statistics based on the binomial
8-17

I II
EPRI Proprietary Licensed Material
Recommended New Updates to NDE, Analysis Methods and Programs
distribution. Before proceeding with the discussion, some background on the statistical equationsis appropriate. The individual probability, p, of any one indication exhibiting a large extreme ofgrowth when K is the number of large extremes in the population and M is the number ofindications in the population is calculated as,
P K Probability of Large Extreme Eq. 8-10
The probability of zero large extremes occurring, P(0), in a sample of n indications in the SG isgiven by,
P (0) = (1 -p) = qf Probability of Zero Eq. 8-11
where q is the probability of a single indication not being a large extreme, i.e., I-p. Theprobability of one large extreme occurring in the same sample of indications is given by,
P (1) = n P P (0). Probability of One Eq. 8-12q
The following recurrence formula can be applied to obtain the probability of exactly z largeextremes occurring,
P(z)=fn+lz p P(z-1)= )! pzq n Eq. 8-13
the latter term being the standard notation for the binomial distribution density function. Hence,the probability of three large extremes occurring is found as,
p (3 ) =-P p (2 )* Eq. 8-143 q
For example, if the total number of indications of one or both tube sizes was 100,000 and 20large extremes had been observed, the probability, p, of any one indications being a largeextreme is 0.0002, and the probability that an indication is not a large extreme, q, is 0.9998. Theprobability of no extremes being observed in the simulation of 500 indications is 0.905 and theprobability of at least one large extreme being observed is 0.095. The probability of exactly onelarge extreme being observed in the sample is 0.0905, 0.0045 for two, 1.5-10 4for three, 3.7-l1o0for four and so forth. A summary of the calculations of this example is provided in Table 8-5. Itis apparent that a practical limit for the number of large extremes in SG indication populations of
8-18

EPRI Proprietary Licensed Material
Recommended New Updates to NDE, Analysis Methods and Programs
less than about 1,000 is four for 100,000 simulations, depending on the values of K and n. Apractical approach would be to find the value of z for which P(z) is less than about 5-10-5, anengineering judgment, to obtain a reasonable upper bound for the number of large extremes to beconsidered. Even at the potential for four, the effect on the results of the calculation of the totalleak rate and the probability of burst would be expected to be negligible. The probability of thelargest of the K largest extremes being present in any simulation where a large extreme ispredicted to occur is 1/K.
There have been greater than eighty (80) applications of the ODSCC ARC to over 250 SGinspections using data from historical records of inspection campaigns at seventeen (1 7) plantsstarting with information available in 1988, which was prior to the technical development of theARC. More than 115,000 indications, for both 3/4 and 7/8 inch diameter tubes, have been foundwith only twenty-one (21) detected large extremes, 2 5V, occurring corresponding to anoperating temperature of 6030 F as listed in Table 8-3. Thus, the probability of an extreme isabout 19 in 100,000 on a per tube basis. These values are similar to those used in the aboveexample. Thus, the probability of at least one or more of those large extremes occurring in 500detected indications is on the order of 9.5%. The 3/4 inch diameter tube values dominate thedetermination of the total number of extremes, i.e., dictate a higher number, but the 7/8 inchdiameter tube data contains the two largest extremes values. Thus, simulating the 7/8 inchdiameter tubes only results in less large extremes being simulated, but the ones that are simulatedare larger. This proportion is not expected to change significantly. The data of Table 8-3 werecomplete through the ARC inspections conducted in the Spring of 2004 and subject to change asmore data are collected from future SG tube inspections. Plants that apply the ODSCC ARC arerequired to report their findings and growth data in 90-Day ARC reports. Thus, the plants thatapply the extreme growth methods for their 90-Day Operational Assessments are required toreview the recently published ARC data and update the Table 8-3 growth data and factor theresults into their growth calculations.
It is recommended that ODSCC ARC simulations of large extremes of growth be tube sizespecific. Consideration of SG tubes in United States plants with 7/8 inch diameter tubing needonly consider the 3 defined large extremes of growth for the 56,874 found indications of Table 8-6. The probability listed in Table 8-6 of no extremes occurring in a SG with 500 predicted foundindications is 0.9740. The simulation process'does not effectively change with PODconsiderations. The probability of one extreme indication being present is 0.0257 and theprobability of two extremes being present is 0.00034. Thus, one of the large extremes of growthwould be expected to appear in 2,568 of 100,000 simulations of the indications in the SG. Thefollowing steps would be taken in order to incorporate the simulation of the extremes of growthinto the Monte Carlo analysis, where the example probabilities correspond to the operation at603'F with 500 BOC indications after application of the probability of detection process:
1. Generate a uniform random number, U, for each simulation of the indications in the SG.
2. Determine the number of large extremes to be considered for that simulation of the SG usingthe following logic where Pr(z) is the cumulative probability of occurrence of at least zspecified indications,
if U < Pr(z = 0) there will be 0 large extreme indications, othenvise,if U < Pr(z • I) there will be I large extreme indications,..., otherwise,
8-19
_ _ _ __ -
EPRI Proprietary Licensed laterial
Recommended New Updates to NDE, Analysis Methods and Programs
if U > Pr(z < in-l) there will be in large extreme indications to consider for that SGsimulation, where in is the maximum number of large extremes to be considered.
For the 7/8 inch diameter tubes for example, in is 2 for a SG with 500 indications per Table8-6, that is the maximum credible number of large extremes is 2 in one SG at the same time.So, if U is < 0.97397 there will be no large extremes for that simulation. If U is > 0.97397and < 0.99966 there will be one large extreme in the SG for that simulation. Finally, if U is> 0.99966 there will be two large extremes in the SG for that simulation.
3. Following the example of the previous step, pick one of the extremes associated with the 7/8inch diameter tubes at random, i.e., generate a random integer from I to 3 to determine whichof the three extreme values will be present for that simulation. Multiple integer values needto be selected if there is more than one extreme to be considered, noting that sampling can beperformed with replacement.
4. Generate an integer random number between I and the total number of indications to remainin service in the SG and assign the large extreme value of growth to that indication. If there ismore than one large extreme value to be simulated, the number of indications to be assigneda large extreme value must be selected. If voltage dependent growth (VDG) has beenconfirmed to be evident in the SG the selection of the indication to be assigned the largegrowth value should be selected from the upper bin if there is only one break point or fromthe upper two bins if there are two break points, etc.
5. Simulate the remaining indications in the SG using the growth curve determined to beapplicable for the SG. Alternatively the analyst may consider the number of indications to beincreased by one, the indication from Step 4, and simulate all of the indications in the SG.Although acceptable, it is only identified as a means of reducing the complexity of thesimulation, the appearance of large extreme values do not change the number of indicationsin service.
6. Accumulate the total leak rate and probability of burst for all of the simulations of the SGand report the results according to the methodology described in References 8-22 and 8-23,the latter was approved for use by Reference 8-24.
It is recommended that the above method be applied to the separate frequencies for 7/8 and 3/4inch diameter tubes, according to the temperature dependent frequency of large extremesspecified in Table 8-3. This frequency should be applied to the number of indications returned toservice prior to application of the POD for consistency in the method of defining the frequencies.Since this methodology is to be applied in conjunction with POPCD applications, the number ofindications in the database after POD application cannot practically be defined. The distributionof large extreme growths should be obtained from Table 8-3 for the plant specific tube size andoperating temperature closest to, but greater than one of those listed in Table 8-3, alternativelylinear interpolation of the growth values as a function of the temperature can be used. Forexample, for an operating temperature of 608'F the growth rates for 610'F could be used, oralternatively, interpolated rates can be found by interpolating between 603 and 6100 F or between600 and 620'F for that matter. For a temperature of 608'F the linearly interpolated largestextreme growth rate is 13.73V while the Arrhenius equation calculation yields 13.38V, thus thelinear interpolation is conservative.
8-20
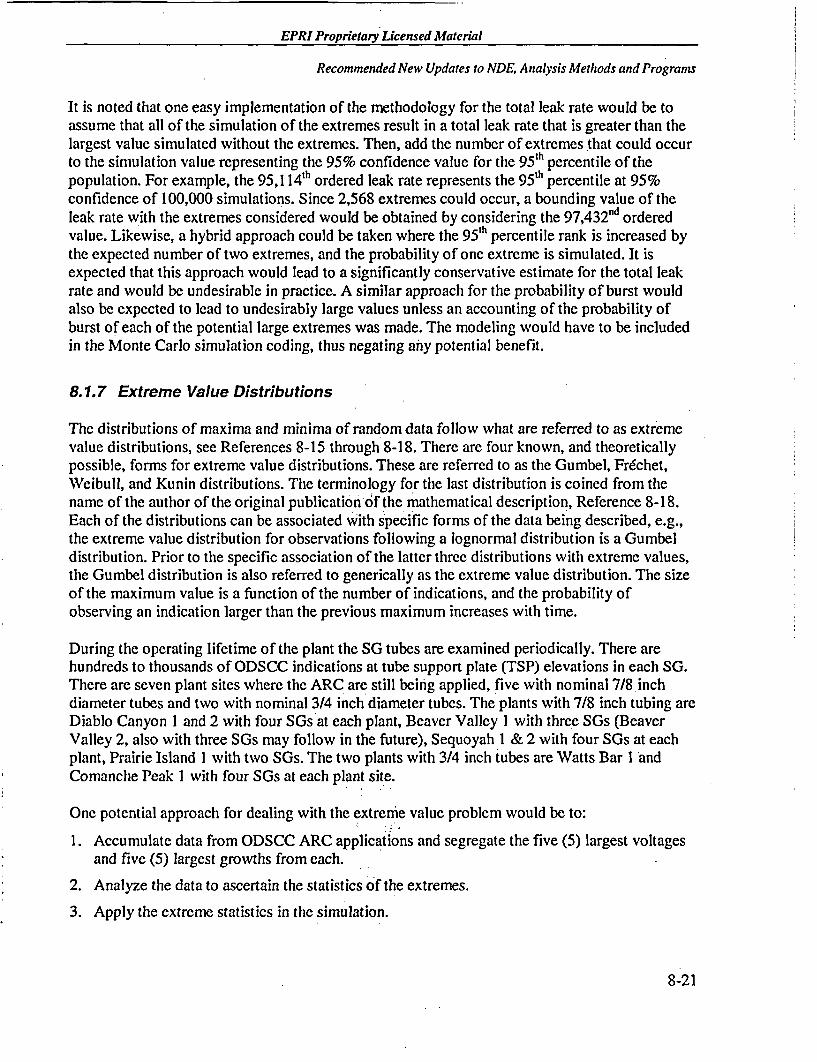
EPRI Proprietary Licensed Material
Recommended New Updates to NDE. Analysis Methods and Programs
It is noted that one easy implementation of the methodology for the total leak rate would be toassume that all of the simulation of the extremes result in a total leak rate that is greater than thelargest value simulated without the extremes. Then, add the number of extremes that could occurto the simulation value representing the 95% confidence value for the 9 5th percentile of thepopulation. For example, the 95,1 1 4th ordered leak rate represents the 95th percentile at 95%confidence of 100,000 simulations. Since 2,568 extremes could occur, a bounding value of theleak rate with the extremes considered would be obtained by considering the 9 7,43 2nd orderedvalue. Likewise, a hybrid approach could be taken where the 95th percentile rank is increased bythe expected number of two extremes, and the probability of one extreme is simulated. It isexpected that this approach would lead to a significantly conservative estimate for the total leakrate and would be undesirable in practice. A similar approach for the probability of burst wouldalso be expected to lead to undesirably large values unless an accounting of the probability ofburst of each of the potential large extremes was made. The modeling would have to be includedin the Monte Carlo simulation coding, thus negating any potential benefit.
8.1.7 Extreme Value Distributions
The distributions of maxima and minima of random data follow what are referred to as extremevalue distributions, see References 8-15 through 8-18. There are four known, and theoreticallypossible, forms for extreme value distributions. These are referred to as the Gumbel, Frechet,WVeibull, and Kunin distributions. The terminology for the last distribution is coined from thename of the author of the original publication of the mathematical description, Reference 8-18.Each of the distributions can be associated with specific forms of the data being described, e.g.,the extreme value distribution for observations following a lognormal distribution is a Gumbeldistribution. Prior to the specific association of the latter three distributions with extreme values,the Gumbel distribution is also referred to generically as the extreme value distribution. The sizeof the maximum value is a function of the number of indications, and the probability ofobserving an indication larger than the previous maximum increases with time.
During the operating lifetime of the plant the SG tubes are examined periodically. There arehundreds to thousands of ODSCC indications at tube support plate (TSP) elevations in each SG.There are seven plant sites where the ARC are still being applied, five with nominal 7/8 inchdiameter tubes and two with nominal 3/4 inch diameter tubes. The plants with 7/8 inch tubing areDiablo Canyon I and 2 with four SGs at each plant, Beaver Valley I with three SGs (BeaverValley 2, also with three SGs may follow in the future), Sequoyah 1 & 2 with four SGs at eachplant, Prairie Island I with two SGs. The two plants with 3/4 inch tubes are Watts Bar I andComanche Peak I with four SGs at each plant site.
One potential approach for dealing with the extreme value problem would be to:
1. Accumulate data from ODSCC ARC applications and segregate the five (5) largest voltagesand five (5) largest growths from each.
2. Analyze the data to ascertain the statistics of the extremes.
3. Apply the extreme statistics in the simulation.
8-21

-1 - - R-
EPRI Proprietary Licensed material
Recommended New Updates to NDE, Analysis Methods and Programs
The evaluation steps could be modified to account for other variations. As discussed previously,there are two approaches to defining the extreme values, the first is to simply take the maximumoccurring value for each SG inspection, which is by definition the extreme value for thatinspection, and consider each inspection in turn. The second definition treats all indications withamplitudes that exceed a specified value, exceedances, as extreme values, this is the approachsuggested for application. Note that this latter definition leads to the expectation of more extremevalues based on the number of indications present in the SG. Simply stated, the more indications,the more times the threshold will be exceeded.
The latter approach is probably preferred. For example, Figure 8-8 presents the probability oftube burst at a SLB differential pressure of 2405 psi as a function of the amplitude of the tubeindication for 7/8 inch diameter tubes. An indication with an amplitude of I OV, just larger thanthe structural limit, has a probability of burst during a SLB event of about 2-10-3 and an 8Vindication has a POB of about l-l0-3. The implication is that 8V should be considered to be anupper bound defining an extreme value. A 4V indication has a probability of burst of less thanI04 and a 5V indication has a probability of burst of about 2- 104. Thus, a reasonable choice forthe exceedance amplitude threshold appears to be about 5V. If the number of indications withamplitudes greater than 8V exceeds, say, three, an evaluation would likely be necessary tosupport continued application of the methodology; the question here being what is a reasonablechoice for growth, noting that l -10-2 corresponds to a =l6V indication.
Growth data in general exhibit a lognormal distribution, hence the expected extreme valuedistribution is the Gumbel distribution, where the cumulative probability of occurrence is givenby,
G(x) = exp[-exp(X X )] Eq. 8-15
where X and 8 are the location and shape parameters respectively, X is the location of the modeof the distribution and 5 is related to the standard deviation by a scalar. However, the concernexpressed in the previous paragraph indicates that this approach is less desirable than a directsimulation of the large extremes. Moreover, applications would likely result in values similar tothose obtained from the fitting of a distribution to the growth rate as described in the followingsection.
8.1.8 Fitting a Distribution Function to the Growth Rate
Experience has shown that growth data for multiple forms of degradation may be wellrepresented by a lognormal growth distribution. This is, however, not always the case. As notedin Section 8.1.4.1, the distribution of growth data for the indications that exhibited a positivegrowth for the Diablo Canyon SG 24 is shown of Figure 8-2. The empirical distribution functionfor the same data is also compared to that of a lognormal distribution on Figure 8-3. Only thedata that exhibited positive growth were analyzed because the two-parameter lognormal
8-22

EPRI Proprietary Licensed Material
Recommended New Updates to NDE, Analysis Methods and Programs
distribution cannot be used for negative data. The problem with this type of an approach is that itis not likely to be generic because the ODSCC ARC data are measured with error.
There are two sources of measurement error that are taken as a fraction of the true value asdiscussed in Reference 8-22. In the first case the probe error represents the difference betweenthe measured value and that which would be obtained from a postulated ideal probe. Probe errorarises from probe wear and may be influenced by calibration of the field probes against multiplestandards, the latter should be effectively eliminated by cross-calibrating all ARC standards toone reference standard. The second source of error is due to the eddy current analyst and is thedifference between the analyst reported value and the value that would be reported from apostulated ideal analyst, determined by the consensus of a group of eddy current experts. Theanalyst error is taken as a fraction of the value that would be reported by the ideal analyst. Astandard approach to assessing the parameters of the growth distribution is to simulate thedistribution of the measured growth by considering the measurement error to be normallydistributed and the true growth to be lognormally distributed. The measurement error distributionparameters are usually known, thus the problem is solved by simulating different growthdistribution parameters and accepting the pair that result in the best fit of the actual data. For theODSCC ARC data, the measurement error is somewhat small and the growth data may bedirectly compared to a distribution function, in this case the lognormal distribution.
The information presented in Section 8.1.4.1 refers to the growth data from SG 2-4 at DiabloCanyon 2 to illustrate the growth rate model. For indications exhibiting positive growth thedistribution of growth rates during Cycle I I is illustrated on Figure 8-2 where it was noted thatthe fit of the lognormal distribution to the histogram data is quite strong. Similar data for growthduring Cycle 10 for the same SG are illustrated on Figure 8-3. The growth data were used todevelop the probability of one or more indications occurring as a function of the voltage growthfor the predicted number of indications to be present at the end of Cycle I I of operation, i.e., 850using POPCD for the probability of detection model, see Figure 8-12. This is the growth thatwould have been used in making the 2R1 I projections. The number of simulations that wouldhave included a growth on the order of 20V for the operating cycle is about 0.6% of the total.Similarly, about 5% of the simulations would have included at least one indication with a growthof 11.6V for the operating cycle. An amplification of this approach would be to put a 95%confidence bound on the cumulative distribution curve and use it for the simulations. It isspeculated that this would likely result in the prediction of an unrealistic and intolerable numberof large indications.
8.1.9 EmpiricallExponential Simulation of Growth Rates
A third approach is to simulate the empirical data directly, without consideration of theunderlying distribution of the data. This approach does not result in a simulation of theparameters of a fitted distribution to the growth rates. Conservatism in the analysis is achievedbecause the upper tail is simulated to be loJnger than that of the empirical distribution by using amixed empirical and exponential distribution model. The methodology is described inReference 8-25; Reference 8-26 also provides worthwhile information for simulationmethodologies. The calculations are similar to those that would be performed using a bootstrapmethod of estimating the parameters of a distribution in that the empirical distribution is
8-23

II
EPRI Proprietary Licensed Material
Recommended New Updates to NDE, Analysis Methods and Programs
repeatedly sampled with replacement to obtain growth rate estimates for individual indications.However, in order to account for variation in the upper tail of the growth rate distribution thatmay not be reflected in the data, the growth rate distribution is simulated as the empirical distri-bution for the first n-k data points, where n is the total number of points in the empiricaldistribution, and an exponential distribution fitted to the last k data points. The parameters of themixed distribution, i.e., the mean and k, are calculated such that the same mean and variance ofthe stepwise cumulative distribution function (CDF) of the data is maintained by the mixeddistribution. For the simulation, a uniformly distributed random number' (URN), U, is generatedand the inverse of the cumulative distribution of growth rates is calculated to obtain a growthrate.
The steps in developing the model are as follows:
1. The mean of the growth rate data is calculated considering the distribution to be a stepfunction. In other words the growth rate is not considered to be piecewise continuous.
2. The growth distribution is to be mathematically modeled as an empirical distribution to atransition value of the growth and as a shifted exponential distribution thereafter. Theempirical portion is to be treated as being piecewise linear for the purpose of calculating themean and variance of the combined distribution, and determining the parameters of theshifted exponential distribution, which includes the transition value.
3. The growth distribution is to be simulated as an empirical distribution to the transition valueand the shifted exponential distribution thereafter. The empirical portion is to be simulated asbeing stepwise.
The first step assures the maximum value of the mean of the actual growth distribution is used indetermining the parameters of the exponential distribution. The second step assures that the meanof the exponential portion of the model is conservatively biased in the increasing direction. Thethird step assures that the simulation of the empirical portion of the distribution is not biased in adecreasing direction.
8.1.9.1 The Empirical Model
The base model for the stepwise, or discrete, cumulative empirical distribution function (EDF) ofthe growth rates when ranked in ascending order is given by,
F(Xe) Eq. 8-16n
where i is the index number of the value of the growth rate for which the EDF of the growth ratesis wanted. It is assumed that F(O) is zero so i ranges from I to n. The value of n for the growthrate data for Plant Y, SG24, Cycle 1O is 488, hence each increment of the CDF corresponds to a
4 The word random is taken here to mean pseudo-random, the term applied to computer code generated estimates ofa sequence of random numbers.
8-24

EPRI Proprietary Licensed Material
Recommended New Updates to NDE, Analysis Methods and Programs
value of l/n or 0.00205. For example, the twentieth sorted value of the growth rate, X20, corre-sponds to a cumulative probability, F(X20), of 20/488 or 0.0410. A random growth rate for anyindication could be calculated by generating a random integer between I and n and returning thecorresponding value of the ranked growth rates. For example, a cumulative distribution value of0.73 would result in an integer value of 357, thus, the random growth rate would be X357. Thevalue of the integer is found as the truncation of 0.73-488 plus I so that the growth rates rangefrom the 1 st to the nth values of the growth rates.
In practice, the CDF may be piecewise linearly interpolated to obtain values of F correspondingto growth rate values, X, between the test data points. This is accomplished as,
F(X)= i + - X -Xi) q81n 'T _(x~i+ -xi) Eq. 8-17
where i ranges from 0 to n-I and the whole distribution ranges from 0 to 1.0. The second term inEquation 8-17 is simply the EDF incremental probability, l/n, times the ratio of the growth rateincrement from X to the first test growth rate less than X, i.e., Xi, to the growth rate incrementfrom Xi to Xi+,. In other words, a linear interpolation of the cumulative distribution betweendiscrete points from the data.
In order to obtain a random growth rate from the EDF, a uniform random number, U, iscalculated and the index number, i, for the corresponding growth rate value less than or equal toa cumulative probability of occurrence of U is found as U n. The growth rate, X, is then interpo-lated between the ith and ith plus 1 value,
x=x+( *( ) Eq. 8-18
The drawback to using only the EDF of the growth rates is that a rate larger than the largestobserved value cannot be simulated. Each growth rate in the database would be simulatedapproximately I/n- 100 percent of the time. Computer generated uniform random numbersgenerally lie in the range of 0< U< 1, hence, the probability of occurrence of the exact largestgrowth rate will be l/n minus the smallest significant value represented in the computer. Howev-er, in operation, growth rates larger than the largest sample values could occur. To simulate thiseventuality, one option is to simulate the first n-k data points as an empirical distribution, and fitan exponential distribution to the last k data points to simulate the tail of the distribution. Thedata are sorted in ascending order and a piecewise-linear EDF is fitted to the first n-kobservations. A shifted exponential distribution is fitted to the right of observation Xn.k with amean chosen so that the means of the overall fitted distribution and the sample are the same andthe value of k selected so that the variance of the fitted distribution matches that of the sample.
8-25

I 11--
EPRI Proprietary Licensed Mlaterial
Recommended New Updates to NDE, Analysis Methods and Programs
8.1.9.2 Fitting the Exponential Distribution
The unshifted exponential distribution is a one parameter function with a CDF, F(X), given by,
xFO(X)=1-e e Eq. 8-19
where the parameter I1 is the mean of the distribution, estimated from the mean of the data, andX is any number greater than or equal to zero. The maximum value of Fo is unity and occurs for avalue of X of positive infinity. The minimum value of Fo is zero corresponding to a value of X ofzero. The value of the variate corresponding to a random value of the CDF of U is given by,
X = -0ln(1 -U) Eq. 8-20
Thus, if the mean is known, or estimated, random values of the distribution can be generatedfrom uniform random numbers.
In order to determine the appropriate expression for the exponential tail to be substituted for thelast k data points of the empirical distribution, we note that if Equation 8-19 is written as,
k -x-xF(x) = 1 - e 0 , Eq. 8-21
n
that the maximum value is still unity as x - co, however, the minimum value is I - k/n when X isequal to Xn-k instead of being zero when X is zero. In essence, Xn.k is a shift of the distribution inthe X direction with the value of ken determining the corresponding value of the cumulativeprobability when X = X,.k. Thus, by shifting the distribution the minimum cumulative probabilityof the exponential tail will match the cumulative distribution of the empirical values at the kthdata point.
However, it is desired to only fit the tail of the empirical distribution, i.e., the last k data points,to an exponential distribution. The exponential distribution can be shifted in both the X andprobability direction by rewriting Equation 8-19 as,
kX-xF(x) = 1--e 0-. Eq. 8-22
n
Here, k is the number of data points to be in the tail, thus, Xn k is the value of X where theexponential distribution is to start, i.e., the amount of the shift in the X direction. Table 8-7 listsvalues of the standard, Fo, and shifted, F, exponential distribution as a function of theindependent variable, X. The exponential distribution parameter 0 controls the rate of decay ofthe distribution. The length of the tail of the distribution gets longer with increasing 0. Thus, the
8-26

EPRI Proprietary Licensed Material
Recommended New Updates to NDE, Analysis Methods and Programs
rate at which F approaches unity is controlled by the rate at which the second term in Equation 8-22 approaches zero. The exponential term is in the denominator, hence, the rate that Fapproaches unity is controlled by the rate at which (X-X,.k)I0 approaches infinity and, therefore,inversely proportional to the magnitude of 0. The effect of increasing 0 is illustrated on Figure8-9.
The upper bound of the shifted distribution is still unity for X going to infinity. Now, however,when the variate is Xn.k the shifted distribution has a value corresponding to that of the empiricaldistribution of the growth data at the kth data point. If there are n data points, each has aprobability of occurrence of I In, the probability density function for each of the points is theinverse of the number of points. Thus, the cumulative distribution function is i/n where i rangesfrom 1 to n. Likewise, the value of the cumulative distribution function of the empirical data atthe growth value of X".* is simply (n-k)/n. Hence, this is the starting value for the shiftedexponential distribution that will replace the tail of the empirical growth distribution from thevalue of Xk.k and up. There are two unknowns in the use of the empirical and shifted exponentialdistribution, k, the point at which the exponential tail takes effect, and 0.
The next step is to find a value for 0 that results in the average growth rate from the piecewisecontinuous mixed distribution matching the average growth rate from the stepwise empiricaldistribution. If the data are plotted in ascending order with the abscissa representing probabilityor sample number and the ordinate representing the growth rate, the stepwise cumulativedistribution function is visualized as a histogram with columns of increasing heightcorresponding to the individual values of the growth rate. The mean, X, of the stepwisedistribution is found as,
-nX n-k n=Xi Eq. 8-23
i=1 n z=1 n i=n-k+l n
where the Xi are the individual measured growth rates. However, the mixed model considers theempirical distribution of the first n-k data points to be piecewise continuous based on a linearinterpolation between the data points. Hence, the mean from the portion of the mixed distributionto the left of the ,_kth will be less than that of the stepwise distribution to the same data point.Since it is the mean of the overall stepwise distribution that is matched, the exponential tail of themixed distribution will be longer than if the entire distribution as simulated as piecewisecontinuous.
The value of 0 is calculated so the mean of the empirical plus the exponential tail of thesimulated distribution is equal to the stepwise mean of the empirical data, i.e.,
zxiMean Growth Value X = .=1 Eq. 8-24
n
8-27

11
EPRI Proprietary Licensed Milateral
Recommended New Updates to NDE. Analysis Methods and Programs
To bias the upper tail of the empirical-exponential distribution (EED), the empirical portion ofthe distribution as treated as being piecewise linear. The mean of the EED consists of acontribution from the empirical portion from XI to X,.kI and the exponential portion from X,.k toX,. The former is found as,
Xl = n )X. +-! A . Eq. 8-25
The contribution from the exponential tail is given by,
X 2 = -ee dt =-. Eq. 8-26n n
The value of 0 is found by solving the expression,
X = Xi +X 2 so 0 = O (X -X1 ). Eq. 8-27k
The solution for the exponential parameter is,
Exponential Parameter = - + Z(X,X-k Eq. 8-28kL n-k-si
If k is known, random values of the growth rate distribution, X, can be simulated empirically orexponentially from randomly generated values from a uniform distribution, U, as,
Xi +(nU -i)(Xi+l -Xi) for U <1- kX = nk where i = int(n U). Eq. 8-29
X,, * - Ink _YU fo U > 1--
Equation 8-29 uses a piecewise linear formulation for the empirical portion simulation. Thedistribution tail, i.e., the exponential part, is sensitive to the number of data values, k, used to findthe exponential distribution parameters. Thus, the last k+l data points are actually used to findthe exponential tail through the determination of the value of 0. The larger the value of k, thegreater the probability range over which the exponential distribution is used. However, the rateof decay of the distribution is also greater, hence the length of the tail of growth rates isdecreased relative to using lower values of k. This is a result of the requirement to maintain thesame mean for the combined empirical and exponential distribution as for the original data. The
8-28

EPRI Proprietary Licensed Material
Recommended New Updates to NDE, Analysis Methods and Programs
decision of which value of k to use is based on seeking the best match of the variance of themixed distribution to the variance of the data.
As with the mean, there are two contributions to the variance of the EED, the piecewise linearfrom 0 to X,.k.l and the exponential from Xn.k to cc* The variance of a distribution can becalculated as,
V(X)=E(X2)-E(X)2 = E(X2) _X2 Eq. 8-30
where E stands for the expected value. The variance of the EED is calculated as,
nk n-k-i 1V(X)= -2 2+ +X)Xi2i+Xn +kk ]-X Eq. 8-31
3n j=1 5=1
Here, the first term is due to the piecewise linear portion of the distribution, the second term isdue to the exponential tail of the distribution and the third term is the contribution from thesquare of the mean of the distribution. The variance of the original data is calculated as,
i nV(XD)=-_Xi2 _X 2 Eq. 8-32
n j=1
where XD stands for the growth data. Since 0 was found to make the mean of the EED match themean of the empirical distribution as a function k, the variance of the EED must also becalculated as a function of k. In practice this means tabulating the variance as a function of k andfinding the value that results in a match to the original distribution. Figure 8-13 illustrates theresults from calculations of the parameter 0 and the variance of the EED as a function of k for aset of growth data from the Diablo Canyon power plant. Here the variance of the raw data is0.989 V2. The results are also tabulated in Table 8-8. The entire distribution is approximated asbeing piecewise linear if k is set to zero and the resulting variance is less than that of the datawhich is initially considered as being stepped. This is an acceptable result because the intent ofthe solution approach is to reduce the contribution to the variance from the empirical portion ofthe EED in order to place more emphasis on the contribution from the exponential portion.
8.1.9.3 Simulation of the Empirical-Exponential Distribution
If the growth was to be simulated in a piecewise linear fashion, then Equation 8-29 would beused. However, the simulation is to be performed in a stepwise fashion. Thus a modification tothe equations is necessary. The following equations would be used for a stepwise simulation ofthe empirical portion of the growth and the exponential tail,
8-29

I i
EPRI Proprietary Licensed Alaterial
Recommended New Updates to NDE, Analysis Methods and Programs
X,+1 for U <- k+1n
X = n k +1 . where i = int(nU). Eq. 8-33X'.fk-0 In A _1U) for U>1- +
In practice, using Equation 8-33 to simulate the growth of the indications in a SG results in thesimulation of the tail occurring after shifting the starting point for the exponential curve to acumulative probability value corresponding to the start of the bin as is done for the simulation ofthe empirical distribution in a stepwise fashion. For example, in a stepwise simulation the Xivalue of growth corresponds to selecting a random growth cumulative probability, F, in the range(i-l )hz < F < i/n. An illustration of the detail of the tail of the simulation curve is shown onFigure 8-14. The anticipated effect of using the method on the simulation of the growth ofindications in SG24 at Diablo Canyon 2 during Cycle II operation is illustrated on Figure 8-15.The expected number of indications at the end of the operating cycle based on the use of POPCDfor the POD was 850 with an operation length of 1.64 EFPY, Reference 8-3. The curve on theleft of Figure 8-15 gives the probability of at least one occurrence of growth per EFPY as afunction of the growth value. The curve on the right is scaled to the length of the operating cycle.The probability is 10% that at least one indication would exhibit a growth of 8.4V during theoperating cycle, about 5.5V/EY. However, the probability that at least one indication wouldexhibit a growth of I I.5VIEY or almost 20V during the operating cycle is about nil. Thus, theuse of the exponential tail would not have resulted in any meaningful probability of prediction ofthe growth observed during Cycle I I in SG 24.
8.1.9.4 Conclusions
The simulation of the growth rate when there is no evident correlation between the growth rateand the bobbin amplitude may be performed by simulating the distribution of the test growthrates with the tail of the distribution modified to simulate an exponential distribution. The formof the exponential distribution is selected to match the mean of the sample distribution and, asmuch as practicable, the variance of the sample distribution. The use of the current method ofsimulating a normal distribution of the log-growth rates results in grossly biased estimates of thegrowth rate distribution and the 95% confidence level of the total growth rate. A comparison ofthe predictions to the observations of the growth in SG 24 at Diablo Canyon 2 during Cycle IIleads to the conclusion that the prediction of the large extreme value of the growth with afrequency that was observed in practice, e.g., the occurrence of one indication with that level ofgrowth, would be extremely unlikely, less than 0. 1 % for the simulation of 850 indications.
The application of this method would essentially ensure that the exponential tail is sampled inevery SG simulation. The number of indications returned to service is generally larger than thenumber of indications in the growth distribution due to new indications and POD adjustments.Thus the tail would be sampled in all cases. The frequency and magnitude of the large growthtail is also not tied to the frequency of extreme growths found in the ARC historical data.Consequently, this approach is not recommended for ARC applications.
8-30

EPRI Proprietary Licensed Material
Recommended New Updates to NDE, Analysis Methods and Programs
8.1.10 Chebyshev's Inequality
Chebyshev's Inequality, or Theorem, Reference 8-27, can be applied to calculate bounds for anydistribution with a finite mean and variance, the variance must also be greater than zero. Theinequality is written as follows for a two-sided test,
Pr(L Ik)•<k2, Eq. 8-34
and, as follows for a one-sided test, Reference 8-28,
Pr(jXH4~kJ k 2 Eq. 8-35
The small change on the right side of the one-sided equation occurs because the distributioncould be asymmetric. It is noted that the mean and standard deviation of the population are usedand not the mean and standard deviation of a sample of the population. The error introduced byusing the sample mean and standard deviation would not be expected to be meaningful becausethe number of data associated with a growth distribution is large. For the two-sided case, at least75 percent of the area under a distribution curve is within the range of p ± 2a, and at least 89.9percent is within 1t ± 3a. The problem with this approach is that the predicted values are likely tobe extremely conservative. When the distribution form is unknown, Chebyshev's Theoremwould predict that 99% of the population lies within the range of , - 10 a, however, the extent ofthe range would be reduced to g ± 2.6a if it is known that the population is normally distributed.The difference of almost a factor of four could make the application of the theorem extremelyundesirable. The average growth for the indications with a positive growth was 0.255V perEFPY and the standard deviation was 0.537 for the cycle 11 growth data for SG 24 at DiabloCanyon 2. The maximum observed growth was .11 .9V or k = 21.6 standard deviations from themean. By the one-sided version of Chebyshev's inequality, Equation 8-35, the probability ofoccurrence is 0.213%. The probability of all 900 indications exhibiting a growth rate of < 11.9Vwould only be 14.7%. Using Chebyshev's inequality to predict the growth of indications in SG24would result in an indication with a growth 2 11 .9V/EY for about 85% of the simulations of theindications in the SG. A modification to Equation 8-35 was also provided in Reference 8-28 inwhich the term on the right is multiplied by 4/9. In the modified case the growth > I 1.9V/EYwould appear in about 57% of the simulations of the indications in the SG. Finally, if the 11 .9Vgrowth indication is omitted from the calculation of the mean and standard deviation, the numberof standard deviations that this indication is from the mean becomes significantly greater than thenumber that would result from simulating the growth as a lognormal distribution.
There were 431 indications in non-deplugged tubes that provided growth data to predict EOC 11values. The average growth was 0.2 V/EY with a standard deviation of 0.317 V/EY. Using ascheme based on Chebyshev's inequality the probability of simulating a growth of 11.9 V/EY
8-31
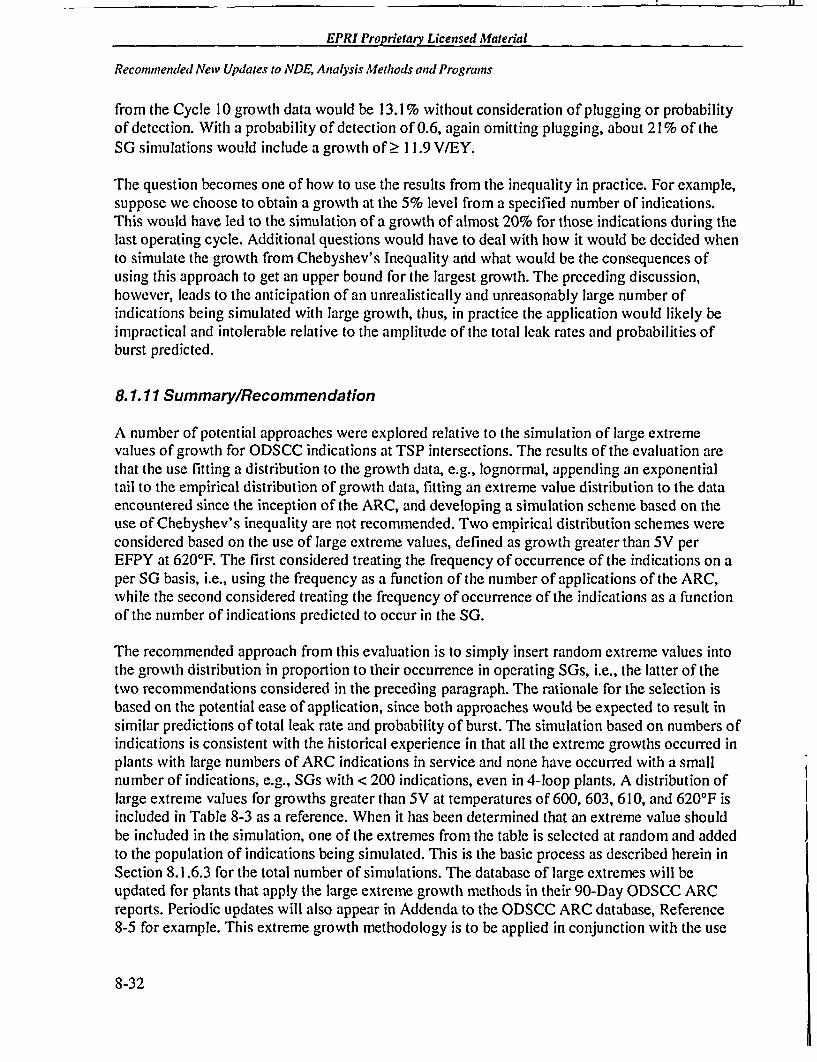
11--
EPRI Proprietary Licensed Material
Recommended New Updates to NDE, A nalysis Methods and Programs
from the Cycle 10 growth data would be 13.1% without consideration of plugging or probabilityof detection. With a probability of detection of 0.6, again omitting plugging, about 21% of theSG simulations would include a growth of 2 11.9 V/EY.
The question becomes one of how to use the results from the inequality in practice. For example,suppose we choose to obtain a growth at the 5% level from a specified number of indications.This would have led to the simulation of a growth of almost 20% for those indications during thelast operating cycle. Additional questions would have to deal with how it would be decided whento simulate the growth from Chebyshev's Inequality and what would be the consequences ofusing this approach to get an upper bound for the largest growth. The preceding discussion,however, leads to the anticipation of an unrealistically and unreasonably large number ofindications being simulated with large growth, thus, in practice the application would likely beimpractical and intolerable relative to the amplitude of the total leak rates and probabilities ofburst predicted.
8.1. 11 Summary/Recommendation
A number of potential approaches were explored relative to the simulation of large extremevalues of growth for ODSCC indications at TSP intersections. The results of the evaluation arethat the use fitting a distribution to the growth data, e.g., lognormal, appending an exponentialtail to the empirical distribution of growth data, fitting an extreme value distribution to the dataencountered since the inception of the ARC, and developing a simulation scheme based on theuse of Chebyshev's inequality are not recommended. Two empirical distribution schemes wereconsidered based on the use of large extreme values, defined as growth greater than 5V perEFPY at 620'F. The first considered treating the frequency of occurrence of the indications on aper SG basis, i.e., using the frequency as a function of the number of applications of the ARC,while the second considered treating the frequency of occurrence of the indications as a functionof the number of indications predicted to occur in the SG.
The recommended approach from this evaluation is to simply insert random extreme values intothe growth distribution in proportion to their occurrence in operating SGs, i.e., the latter of thetwo recommendations considered in the preceding paragraph. The rationale for the selection isbased on the potential ease of application, since both approaches would be expected to result insimilar predictions of total leak rate and probability of burst. The simulation based on numbers ofindications is consistent with the historical experience in that all the extreme growths occurred inplants with large numbers of ARC indications in service and none have occurred with a smallnumber of indications, e.g., SGs with < 200 indications, even in 4-loop plants. A distribution oflarge extreme values for growths greater than 5V at temperatures of 600, 603, 610, and 620'F isincluded in Table 8-3 as a reference. When it has been determined that an extreme value shouldbe included in the simulation, one of the extremes from the table is selected at random and addedto the population of indications being simulated. This is the basic process as described herein inSection 8. 1.6.3 for the total number of simulations. The database of large extremes will beupdated for plants that apply the large extreme growth methods in their 90-Day ODSCC ARCreports. Periodic updates will also appear in Addenda to the ODSCC ARC database, Reference8-5 for example. This extreme growth methodology is to be applied in conjunction with the use
8-32

EPRI Proprietary Licensed Material
Recommended New Updates to NDE, Analysis Methods and Programs
of POPCD as the licensed POD because the use of a POD of 0.6 already includes large numbersof high voltage indications in the BOC distribution.
8.2 Noise Requirements for Voltage Based ARC
8.2.1 Introduction
This section provides recommendations on noise inspection, analysis and repair for applicationto the ARC for'ODSCC at TSP intersections. These recommendations differ from the noiseguidelines for mix residuals given in GL 95-05.. The noise analysis methods may be appliedwithout NRC approval to select indications for RPC inspection but the increased repair limits ofthis section beyond that permitted by GL 95-05 cannot be applied without NRC approval. Themethods of this section were submitted to the NRC by NEI letter on April 13, 2004.
Tube noise considerations for indications at TSP intersections for the voltage based ARC arecurrently based on measurements of the mix residual signal. The mix residual was applied in theearly development of the ARC as a measure of noise prior to more recent efforts in the industryto assess the effects of noise on detection. The mix residual is a measure of the noise across theentire TSP length and is not an appropriate quantity for assessing the effects of noise ondetection since most TSP indications develop at the TSP center where noise influence isminimal. The noise at TSP intersections develops over the first and second cycle of operationand is not significantly sensitive to the NDE setup for the frequency mix at TSP intersections orsignificantly variable from cycle to cycle. To update the ARC noise inspection and repairrequirements to current noise assessment methodology, revised requirements for inspection andrepair at noisy TSP intersections are developed in this report.
NRC Generic Letter 95-05 (Reference 8-1) requires RPC inspection of intersections with largemix residuals that could cause a 1.0 volt bobbin signal to be masked or misread. The GL statesthat "Any indications found at such intersections with RPC should cause the tube to be repaired."The latter GL requirement has had two interpretations. The industry interpretation, as given inSection 10.1.1 of this report as well as Addendum 5 (Reference 8-30) and originally reported inSection 8.1.1 of Addendum 3 (Reference 8-29) in 1999, is that repair "at such intersections"refers to repair at intersections having mix residuals that mask a 1.0 volt indication so that repairis only required when the bobbin voltage is estimated to be >1.0 volt. The statement hasalternately been interpreted by the NRC to imply that all indications found by RPC during mixresidual inspections are to be repaired independent of the estimated bobbin voltage. Asdiscussed in Section 8.2.2, all TSP intersections have mix residual signals and the influence ofthe mix residual signals (better defined as a measure of TSP noise) on voltage measurements isbuilt into the ARC burst and leak rate correlations. The concept of misreading a voltage due toTSP noise should not be applied for the ARC since the effects of noise on voltage measurementsare already included in the ARC database and contribute to the voltage variability in the ARCburst and leakage correlations. The repair criteria for .ODSCC indications found at noisy TSP.intersections are redefined in this note to more closely tie the noise intersection repair limits tothe plant specific voltage based repair limits. As shown in this report, bobbin voltages can beadequately assigned to indications found by RPC inspections so that the indications can be
8-33

I 1i
EPRI Proprietary Licensed Afaerial
Recommended New Updates to NDE. Analysis Methods and Programs
included in condition monitoring and operational assessments, thus eliminating any need forlower repair limits based on potential influence on burst and leakage.
GL 95-05 also requires 100% inspection of all dents > 5 volts and repair of any indications foundin dents > 5 volts. Since these indications can be adequately sized using correlations of bobbinto RPC volts such that the indications can be included in condition monitoring and operationalassessments, this report also recommends that repair for these indications be tied to the plantspecific voltage based repair limits.
Section 8.2.2 discusses noise considerations at TSP intersections to demonstrate the importanceof applying noise measurements specific to the center of the TSP rather than the mix residualsignal, which measures noise across the entire TSP resulting in an overestimate of noise at thelocation of the cracks near the center of the TSP. In Section 8.2.3, the adequacy of theReferences 8-29 and 8-30 methods for assigning bobbin voltages to RPC indications isdemonstrated by field data and recommendations for repair of the RPC indications are provided.Section 8.2.4 defines the recommended requirements for selecting samples for RPC inspection ofnoisy TSP intersections and for expanding the inspections if indications exceeding the GL 95-05ARC repair limits are found in the sample inspection. Section 8.2.5 summarizes the conclusionsof this report.
8.2.2 Considerations for Noise at TSP Intersections
With regard to the presence of mix residuals and their influence on sizing of indications, it mustbe emphasized that all TSP intersections have mix residuals after the first one or two cycles ofoperation. The mix residuals may be more easily understood as a measure of TSP noise. Afterabout two cycles, the mix residuals generally do not change significantly with operating time.The dominant voltage for the mix residual signals is not strongly affected by the mixing used toanalyze the bobbin data so the mix residual signal amplitude does not vary significantly withoperating time or NDE analyst. Frequently, a significant part of the mix residual signal ispresent in bobbin data obtained without a TSP for pulled tubes examined in the laboratory.Some of the model boiler specimens show mix residuals although generally smaller than fielddata due to the shorter time at temperature. The bobbin response apparently includes an effect ofthe time at temperature at a TSP on the electrical and/or magnetic properties of the tube.Metallography was performed on a pulled tube to attempt to identify the cause for the signal, butwas not successful in identifying any physical change to the tube or grain structure.
Many of the pulled tubes in the ARC database (and the prior cycle probability of detection orPOPCD database) have mix residual signals larger than typically found in currently operatingSGs. Figure 8-16 shows the 1.87 flaw voltage and the 3.23 mix residual voltage for pulled tubeR27C54 from plant A- I in the ARC database. This is only one example of the pulled tube data.The flaw signal is easily detectable which would imply easy detection at signal to noise (SIN) ofabout 0.58 for the associated flaw and mix residual peak-to-peak voltages. As shown in Section8.2.3, a SIN of 0.58 would be expected to have a probability of detection of about 0.25. Thisindicates that the use of the mix residual as a measure of noise is not appropriate for assessingdetection.
8-34

EPRI Proprietary Licensed Material
Recommended New Updates to NDE, Analysis Methods and Programs
The mix residual voltage is not being used, nor'should it be used, in current assessments of theinfluence of noise on detection or sizing. For signal to noise evaluations, the noise is beingevaluated as the maximum voltage response over approximately one third sections of the TSP todistinguish the relatively low noise at the center of the TSP from the larger noise near the edgesof the TSP. Figure 8-17 shows the lower and upper TSP noise amplitudes for R27C54-IH.Noise at the middle section cannot be evaluated due to the presence of the flaw. Figure 8-18shows the mix residual voltage and noise levels at the' center, upper and lower one-third sectionsof the R27C54-2H TSP, where the mix residual is the same as at I H. The noise level affectingdetection and sizing at the center of the TSP, where most of the TSP ODSCC indications arefound, is 0.70 volts peak-to-peak while the edge noise amplitudes are 1.70 and 1.52 volts. Thesenoise levels are in the upper 20% of noise amplitudes expected at TSP intersections. The noisedifferences between the center and edge affect detectability of short, low voltage indicationslocated at the edges of the TSP. The short indications at the TSP edges must grow to the centerof the TSP to become structurally significant and'the lower noise levels at the TSP center providefor detection of even low voltage indications. The noise levels in these figures are peak-to-peakamplitudes although the vertical amplitudes are more appropriate for assessing signal to noise forflaw detection. However, the applications of this report are related to amplitude sizing for whichpeak-to-peak flaw and noise amplitudes are the recommended quantities. Applying the peak-to-peak amplitudes of 1.87 volts for the flaw from Figure 8-16 and 0.70 volt for the noise at theTSP center from Figure 8-18, the SIN for the' flaw would be about 2.7 (expected POD about 0.96from Section 8.2.3), which supports the ease of detection found for the flaw. This result isconsistent with the recommended use of the flaw and noise evaluated at the TSP center.
The above noise and mix residual discussion demonstrates that it is neither feasible nor necessaryto attempt to define bobbin flaw voltages that are not affected by the TSP noise or mix residuals.All indications have negligibly small to a range'of noise influence on voltage sizing, and theARC database includes many indications with larger noise levels than most currently active SGs.Whatever influence the mix residuals may have on voltage sizing for TSP indications is built intothe ARC database by the pulled tubes and the concept of misreading voltages is irrelevant to theARC.
Since nearly all TSP indications are located near the'center of the TSP or span the center of theTSP, the appropriate quantity for assessing the influence of noise is the amplitude overapproximately the center 1/3 of the TSP between the peaks associated with TSP edge effects.Short indications at the edges of the TSP would not have a significant influence on tube integrity.Amplitude measurements at the area of interest are being applied for tube integrity applicationsunder the EPRI Tools for Tube Integrity Program. These measurements are being utilized todevelop ETSSs and PODs based on performance testing of multiple analyst teams. The use ofamplitude noise measurements are recommended for ARC noise assessments for consistencywith the EPRI methodology for tube integrity applications. The following sections apply theamplitude noise measurements at the center of the TSP to develop RPC repair and inspectionrequirements for ARC applications.
8-35
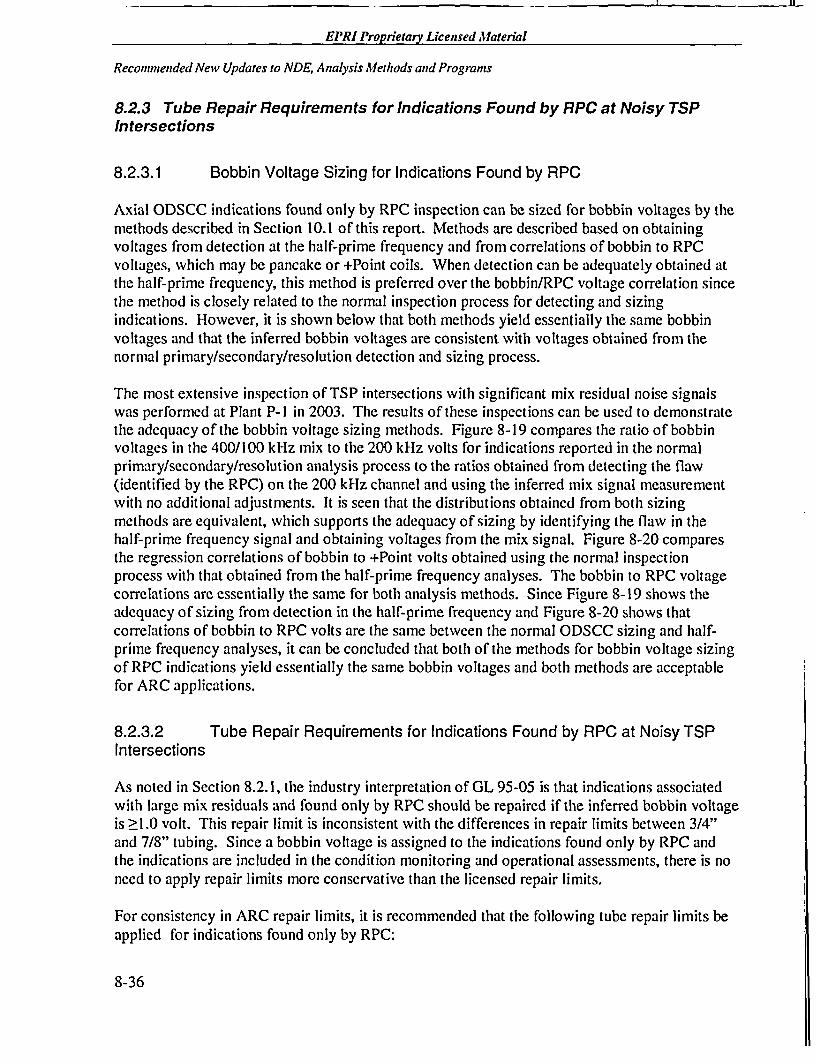
- I 1-.- -
EPRI Proprietary Licensed Mlaterial
Recommended New Updates to NDE, Analysis Methods and Programs
8.2.3 Tube Repair Requirements for Indications Found by RPC at Noisy TSPIntersections
8.2.3.1 Bobbin Voltage Sizing for Indications Found by RPC
Axial ODSCC indications found only by RPC inspection can be sized for bobbin voltages by themethods described in Section 10.1 of this report. Methods are described based on obtainingvoltages from detection at the half-prime frequency and from correlations of bobbin to RPCvoltages, which may be pancake or +Point coils. When detection can be adequately obtained atthe half-prime frequency, this method is preferred over the bobbin/RPC voltage correlation sincethe method is closely related to the normal inspection process for detecting and sizingindications. However, it is shown below that both methods yield essentially the same bobbinvoltages and that the inferred bobbin voltages are consistent with voltages obtained from thenormal primary/secondary/resolution detection and sizing process.
The most extensive inspection of TSP intersections with significant mix residual noise signalswas performed at Plant P-I in 2003. The results of these inspections can be used to demonstratethe adequacy of the bobbin voltage sizing methods. Figure 8-19 compares the ratio of bobbinvoltages in the 400/100 kHz mix to the 200 kHz volts for indications reported in the normalprimary/secondary/resolution analysis process to the ratios obtained from detecting the flaw(identified by the RPC) on the 200 kHz channel and using the inferred mix signal measurementwith no additional adjustments. It is seen that the distributions obtained from both sizingmethods are equivalent, which supports the adequacy of sizing by identifying the flaw in thehalf-prime frequency signal and obtaining voltages from the mix signal. Figure 8-20 comparesthe regression correlations of bobbin to +Point volts obtained using the normal inspectionprocess with that obtained from the half-prime frequency analyses. The bobbin to RPC voltagecorrelations are essentially the same for both analysis methods. Since Figure 8-19 shows theadequacy of sizing from detection in the half-prime frequency and Figure 8-20 shows thatcorrelations of bobbin to RPC volts are the same between the normal ODSCC sizing and half-prime frequency analyses, it can be concluded that both of the methods for bobbin voltage sizingof RPC indications yield essentially the same bobbin voltages and both methods are acceptablefor ARC applications.
8.2.3.2 Tube Repair Requirements for Indications Found by RPC at Noisy TSPIntersections
As noted in Section 8.2.1, the industry interpretation of GL 95-05 is that indications associatedwith large mix residuals and found only by RPC should be repaired if the inferred bobbin voltageis >1.0 volt. This repair limit is inconsistent with the differences in repair limits between 3/4"and 7/8" tubing. Since a bobbin voltage is assigned to the indications found only by RPC andthe indications are included in the condition monitoring and operational assessments, there is noneed to apply repair limits more conservative than the licensed repair limits.
For consistency in ARC repair limits, it is recommended that the following tube repair limits beapplied for indications found only by RPC:
8-36

EPRI Proprietary Licensed Material
Recommended New Updates to NDE, Analysis Methods and Programs
* Based on bobbin voltages determined by the methods of Section 10.1.1 of this report fromindications found only by RPC inspection, indications with inferred bobbin voltagesexceeding the licensed plant specific bobbin voltage repair limit are to be repaired. The GL95-05 repair limits are > 1.0 volt for 3/4" tubing and > 2.0 volts for 7/8" tubing. Some plantsmay have larger repair limits such as obtained from locked TSP intersections.
* This repair limit applies for RPC indications found at noisy TSP intersections and at dentedTSP intersections for dents of any voltage. For indications found at TSP intersections withboth ODSCC and PWSCC indications for plants having a licensed PWSCC ARC, the aboverepair limit can be applied only if consistent with the licensed requirements.
* The bobbin voltages obtained by the Section 10.1.1 methods from RPC testing of noisy TSPand dented TSP intersections are to be included in the ARC condition monitoring andoperational assessments.
8.2.4 RPC Inspection Requirements for Noise at TSP Intersections
The selection of noisy TSP intersections for potential RPC inspection is to be based on PODversus signal/noise (SIN) correlations for axial ODSCC at TSP intersections. When available,the POD vs. S/N correlations for noise levels at the center of the TSP as obtained from ETSSsbased on multiple analyst testing should be applied. Until these ETSS POD correlations areavailable, the POD vs. SIN correlation from SSPD testing of multiple analysts described inReference 8-31, as shown in Figure 8-22, is to be applied. Figure 8-22 is based on flaw andnoise peak-to-peak amplitudes to permit application of peak-to-peak voltage repair limits indefining S/N. For more general applications of SIN for detection, the vertical max voltageswould be used as this quantity is more closely tied to NDE detection methods.
The GL 95-05 repair limits are the appropriate limits for detection of indications found at noisyTSP intersections based on burst and leakage considerations. The lowest voltages found forleaking indications in the ARC database (Section 5 of this report) is 1.13 volts for 3/4" tubingand 2.81 volts for 7/8" tubing. The leak rates for these two indications were very small at0.000088 and 0.00035 gpm, respectively. Thus, indications below the GL 95-05 repair limitswould not be expected to leak and, if they do leak, would have a negligible leak rate. Theprobability of burst for indications at the GL 95-05 repair limits are less than about 5xl06(Section 6 of this report) for both 3/4" and 7/8" tubing, and thus undetected indications below therepair limits would have a negligible contribution to the burst probability. The GL 95-05 repairlimits are to be applied to develop the inspection requirements of this section even for plants withhigher licensed repair limits in order to assure that indications with potential significant leakageare included in the ARC analyses.
A S/N value for a nominal POD of 0.9 is to be obtained from the POD versus SIN correlation foraxial ODSCC peak-to-peak amplitudes at the center of the TSP. For plants licensed to apply theProbability of Prior Cycle Detection (POPCD) for operational assessments, the POD value to beapplied to obtain S/N values is the nominal POPCD POD at the appropriate GL 95-05 repairlimit. The use of POPCD distributions (Section 7 of this report) at 1.0 and 2.0 volt repair limitswould likely lead to POD values within about 4- 0.05 of 0.9. The use of a POD on the order of0.9 to define a SIN value at the ARC repair limit assures that the detection for ODSCC at noisy
8-37

11
EPRI Proprietary Licensed Material
Recommended New Updates to NDE, Analysis Methods and Programs
intersections is consistent with or conservative relative to the POD used in ARC operationalassessments. From Figure 8-21, the associated S/N value for a POD of 0.9 is 1.9. To obtain anoise threshold for potential RPC inspections, detection at a POD of 0.9 (or that from POPCD atthe repair limit when POPCD is licensed) is applied to obtain the SIN value and the signal, S, isapplied at the ARC repair limit. The noise threshold value for the mix at the center of the TSP isthen 0.53 volt for a repair limit of 1.0 volt and 1.05 volt for a repair limit of 2.0 volt. As noted,these values are to be updated when the EPRI ETSS POD versus SIN correlations from multipleanalyst testing are available.
Noise evaluations should be performed for a minimum of 100 hot leg TSP intersections per SGto identify noisy TSP intersections. Since the TSP noise levels do not change significantly fromcycle to cycle, the noise analyses may be performed on the bobbin data from the last inspectionor the current inspection. RPC inspection shall be performed for a minimum of 25 intersections(total summed over all SGs) exceeding the noise threshold values. The noise measurements shallbe made at the TSP intersections where most of the ODSCC indications are found, which aretypically the lower three hot leg TSPs. If this sample does not identify at least 25 intersectionswith noise levels exceeding the noise threshold values, the noise evaluation sample size shall beincreased to include an additional 100 TSP intersections per SG to obtain a total noise samplepopulation of 200 TSP intersections per SG to identify intersections for RPC inspection. TheRPC inspection shall then be performed at the 25 TSP intersections with the highest noise levelsin the noise analysis population evaluated.
If axial ODSCC indications are found in the sample RPC inspection, the following guidelines areto be applied to determine whether an expansion of the inspection is required:
* If the inferred bobbin voltage of any indication found in the RPC inspection of noisy TSPintersections (sample with noise exceeding threshold values) is found to exceed the GL 95-05repair limits of 1.0 and 2.0 volts for 3/4" and 7/8" tubing respectively, the noisy TSPintersection RPC inspection shall be expanded to include an additional 100 TSP intersectionswith the next highest noise levels in the noise sample population. If this inspectionexpansion identifies a flaw with a bobbin voltage exceeding the GL 95-05 repair limit, theinspection should be expanded in 100 sample increments until one of the samples is foundwith no indications exceeding the GL repair limit.
* The fraction of TSP intersections inspected that are found to have axial ODSCC indicationsdefines an average undetected fraction, or I-POD, for the base inspection since the RPCinspection is a supplemental sample inspection applied to assess the adequacy of the baseinspection. If the operational assessment applies the GL 95-05 POD of 0.6, the associatedundetected fraction is 0.4. If POPCD is applied for the operational assessment, the averagebobbin voltage for the ODSCC indications should be used to determine an average orexpected POD for the indications by application of the latest licensed nominal industry orplant specific POPCD distribution (Figure 7-4 in Section 7 of this provides an industryPOPCD distribution for combined 3/4 and 7/8 inch tubing). The expected POD is defined asthe POPCD value at the average bobbin voltage for the ODSCC indications found by RPCinspection. If the sample fraction of intersections with detected flaws in the RPC inspection(undetected in base inspection) is greater than the expected 1-POD (0.4 if POPCD is notlicensed) by more than a 0.1 difference, the inspection should be expanded in 50 sample
8-38

EPRI Proprietary Licensed Material
Recommended New Updates to NDE, Analysis Methods and Programs
increments (applying next highest noise levels in the noise sample population) until one ofthe samples is found with an average POD equal to or greater than the expected POD. Thisrequirement is applied to provide reasonable confidence that the detection capability in noisytubes is comparable to that used in the operational assessments for the overall population ofindications.
The required expansion sample size of 50 samples for the POD comparison is smaller than the100 samples required if an indication is found to exceed the repair limits. This difference isapplied to reflect the significance on the operational assessment between the two conditions.Undetected indications left in service below the GL 95-05 repair limits are expected to have anegligible impact on leakage or burst as described above.
Examples of peak-to-peak amplitude noise distributions are shown in Figure 8-22 for a plantwith 3/4" tubing and for a TSP dataset used for performance testing to development ETSSsunder the EPRI Tools for Tube Integrity Program. The planned ETSS and plant noisedistributions are very similar. For a plant with 3/4" inch tubing and a 0.53 volt noise thresholdfor potential RPC inspection, about 40% of the intersections exceed this level. The sampleinspection would start at the highest noise levels in the distribution. Due to the low 1.0 voltrepair criterion, the noise threshold for RPC inspection is very conservative. The noisedistributions for plants with 7/8" tubing are expected to be similar to those in Figure 8-22. Forthe associated 1.05 volt noise threshold with 7/8" tubing, less than 5% of the TSP intersectionswould be expected to exceed this threshold. The sample size applied to develop the noisedistribution for 7/8" tubing may have to be expanded to 200 TSP intersections per SG in order toidentify the 25 intersections with the highest noise levels for RPC inspection. It can be notedthat the POD versus S/N curves, such as Figure 8-21, are used to assess differences in noiselevels and a plant specific noise distribution does not have to be bounded by the noisedistribution used in developing the POD correlation.
8.2.5 Conclusions
The use of mix residuals to characterize noise at TSP intersections was initiated in the early1990s and is shown in this report to be a poor measure of the influence of noise on detection.The noise at TSP intersections for bobbin probes varies significantly between the center andedges of the TSP whereas the mix residual is a single measure of noise across the entire TSP.Since nearly all ODSCC indications at TSP intersections extend through the center of the TSP,the noise levels at the TSP center provide the'bekt measure of noise for the influence on detectionand amplitude sizing. The few indications found only at the edges of the TSP that could bemasked by the higher noise levels are very short and would have negligible impact on burst andleakage. Therefore, it is recommended that the ARC noise methods be based on evaluations ofthe noise amplitude at the center of the TSP.
The EPRI Tools for Tube Integrity Program is developing ETSSs based on performance testingof multiple analysts. Noise analyses are an integral part of this program with noise analyses fortube integrity applications based on measurements of the noise amplitudes at the regions ofinterest. As part of this program, PODs as a function of SIN are being developed. Thesecorrelations permit identification of the noise level that supports a specified POD level at the
8-39

IlE _if
EPRI Proprietary Licensed faterial
Recommended New Updates to NDE, Analysis Methods and Programs
ARC voltage based repair limits. The recommended threshold noise value for RPC sampling ofnoisy intersections is based on obtaining a POD of 0.9 at the ARC repair limits of 1.0 and 2.0 for3/4" and 7/8" tubing, respectively. Plant noise analyses for a minimum of 100 TSP intersectionsper SG are recommended to characterize the plant specific noise levels. If this sample does notidentify at least 25 intersections with noise levels exceeding the noise threshold values, the noiseevaluation sample size shall be increased to include an additional 100 TSP intersections per SGto obtain a total noise sample population of 200 intersections per SG to identify intersections forRPC inspection. The 25 TSP intersections with the largest noise levels are recommended forRPC inspection. If an axial ODSCC indication exceeding the ARC repair limit of GL 95-05 isfound in the noise sample inspection, the inspection would be expanded by steps of 100 TSPintersections until no ODSCC indication exceeding the repair limits is found in the 100intersection sample. The inspection would also be expanded in steps of 50 TSP intersections ifthe fraction of indications found in the RPC inspection, which represents the fraction undetectedin the base inspection, exceeds the undetected fraction expected from the POD used foroperational assessment by more than 0.1. Bobbin flaw amplitudes for the RPC indications canbe obtained either by identification of the flaw in the half-prime frequency response or bycorrelations of bobbin to RPC voltage. It is shown by plant data that these two methods yieldvery similar bobbin voltages and voltages consistent with the normalprimary/secondary/resolution analysis.
It is recommended that indications found by the RPC inspection be repaired if they exceed thelicensed plant specific repair limit based on bobbin voltages assigned to the RPC indications.This provides a consistent ARC repair limit independent of how the indication was found in theinspection. Based on the bobbin voltages assigned to the indications, all indications found in theRPC inspection are to be included in the ARC condition monitoring and operational assessments.The bobbin voltages for the RPC indications are adequately defined to obtain tube integritymargins consistent with all bobbin indications, and there is no need to define different repairlimits for the indications found by RPC. Since indications found by RPC inspection in dents > 5volts can be adequately sized using correlations of bobbin to RPC volts, it is also recommendedthat repair for these indications be based on the plant specific voltage based repair limits. SinceGL 95-05 requires 100% inspection of all dents > 5 volts, no additional inspection or expansionrequirements are necessary for the dented TSP intersections.
If the guidelines of this section are to be implemented for selecting TSP intersections forinspection prior to NRC approval, the repair limit must be applied at one volt for consistencywith GL 95-05 as discussed in Section 8.2.1, and the RPC inspection requirements of Section8.2.4 should be applied based on a one volt repair limit.
8.3 ARC Guidelines for Preventive Repair of Large +Point Indications
8.3.1 Introduction
This note provides guidelines for preventive tube repair (i.e., repair at less than the licensedvoltage based repair limits) to reduce the potential for finding large voltage growth rates forindications left in service under the ARC for axial ODSCC at TSP intersections. Since the
8-40

EPRI Proprietary Licensed Material
Recommended New Updates to NDE, Analysis Methods and Programs
guidelines apply to preventive repair, implementation of these guidelines is optional on a plantspecific basis.
ARC inspections periodically find large voltage indications (such as > 8 volts) that are notpredicted to occur and generally do not occur in successive inspections. These indications withunusually large voltage growth have been shown, where successive RPC inspection data areavailable, to occur with normal growth in depth. Voltage increases exponentially with depth andagain approximately exponentially with increasing throughwall length. Consequently, anindication that is near throughwall over a significant length at the BOC can grow with normaldepth growth to a significant throughwall length over one operating cycle with an associatedlarge voltage growth rate. Most of the large voltage growth indications found in ARCinspections have been pulled and found to satisfy burst margins at the EOC conditions.However, the ARC burst versus voltage correlation will predict burst probabilities near the ARCreporting threshold of 0.01 due to the large uncertainties in the correlation.
The likelihood of finding a large voltage indication can be reduced by preventive plugging at lessthan the ARC repair limit. The best currently available methods for depth sizing of axialODSCC are based on correlations of depth with +Point voltage when developed to provide agood estimate of the voltage at initial throughwall penetration. The latter is a principal factor inthe development of sizing correlations under the EPRI Tools for Tube Integrity Program andassociated correlations are applied in this report'to provide a recommended +Point voltage forpreventive tube repair for axial ODSCC at TSP intersections.
Section 8.3.2 provides additional background information and Section 8.3.3 provides guidelinesfor preventive repair. Section 8.3.4 provides guidelines for supplemental inspections to furtherinspect for indications potentially desirable for preventive repair. Section 8.3.5 summarizes theconclusions of this report.
8.3.2 Background Information
The largest voltage indication found during ARC inspections was a 21.5 volt bobbin indication(12.2 volt by +Point) at Plant Y-2. Fortunately, for providing a good database for evaluation,this indication had been +Point inspected at the prior outage. At the prior inspection, thisindication was found to measure 2.0 volt by bobbin and 2.97 volt by +Point (maximum voltsfrom profile analysis). The occurrence of +Point amplitudes greater than the bobbin voltage isinfrequent for ODSCC partially due to the bobbin coil integrating degradation around thecircumference of the tube while RPC measures a single crack location. The two voltages tend tobe closer in magnitude when there is a single dominant crack at the TSP intersection.
The range of +Point amplitudes for a short throughwall axial ODSCC indication is about 2.0 to3.0 volts. The lowest throughwall +Point amplitude in the ARC database is 1.89 volts. Thisindication had two interacting axial cracks, which tends to result in a +Point voltage reductiondue to cancellation between the two coils. It can be expected that the Plant Y-2 indication wasnear or just throughwall at the BOC condition. The growth rate in average depth for thisindication was about 12% per EFPY which is in the range of the upper 90% to 95% probabilityfor normal growth rates and considerably smaller than ODSCC indications found to have large
8-41

I 11i-
EPRI Proprietaqy Licensed Material
Recommended New Updates to NDE, Analysis Methods and Programs
growth rates. The Plant Y-2 indication grew from imminent throughwall at BOC to thethroughwall length of 0.42 inch found by destructive examination. The large voltage growthresulted from throughwall penetration and growth in throughwall length.
Plants P-l, Y- I and Y-2 have performed significant +Point inspections below the 2.0 volt repairlevel that include some indications with data from two or three +Point inspections over the lastthree cycles. These data permit an assessment of the larger +Point voltage and +Point to bobbinvoltage ratio indications retained in service. The last three cycles of data were reviewed toidentify the largest +Point volts left in service, the largest ratio of +Point to bobbin voltage andthe largest bobbin indications. The resulting data for Plant P-I cycles IR13 to IRI5 are given inTable 8-9 and for Plants Y- I and Y-2 cycles 9 to I I are given in Tables 8-10 and 8-1 1. For PlantP-1, the largest +Point volts returned to service that can be assessed at the subsequent cycle are1.65 volts at IR13 and 1.71 volts at IR14. None of the indications with +Point volts up to 1.71had a large bobbin or +Point voltage growth in the subsequent cycle. The largest bobbinindication of 4.57 volts, which would not be considered an outlier indication, for tube RI IC77had a prior cycle +Point 0.61 volt indication. Similarly, indications with +Point to bobbinvoltage ratios up to 2.0 showed no significant bobbin voltage growth in the subsequent cycle.The Plant Y- I data of Table 8-10 show that there have been no high +Point volts or +Point tobobbin voltage ratios for data with successive +Point inspections. Thus, these data do notprovide any additional insight on potentially limiting +Point voltages. The Plant Y-2 data ofTable 8-11 show the 2.97 +Point volt indication left in service that led to the 21.5 bobbin voltoutlier indication. Indications with +Point volts as high as 1.6 volts and +Point to bobbin voltageratios up to 2.07 did not show any significant bobbin voltage growth in the subsequent cycle.The higher ratios of +Point to bobbin voltage, such as > 1.4, are generally associated withdominant single indications with relatively small bobbin voltages (i.e., < 0.7 volt) such that theeffect of increasing bobbin voltage with increasing cracking around the tube circumference is notpresent. There is no technical reason to expect that single indications have a higher potential forlarge voltage growth in the next cycle since voltage growth rates are highest for crack depthsnear 100% and for increases in throughwall length rather than multiple indication effects. TheTables I to 3 results indicate that the +Point to bobbin voltage ratio is not a meaningful predictorfor large bobbin voltage growth and is, therefore, not recommended for considerations ofpreventive plugging.
The Table 8-9 results also indicate that +Point voltages up to about 1.71 do not appear to be ameaningful predictor of large bobbin voltage growth. As discussed in Section 8.2.3 below, thecrack depth for a 1.71 +Point voltage indication would be expected to be too shallow to grow toa significant throughwall length with normal growth rates over one cycle of operation. Thethreshold for considering preventive plugging should be greater than about 1.71 volts.
8.3.3 Guidelines for Preventive Repair
Based on the discussion of Section 8.2.2, only +Point indications greater than about 1.71 voltappear to be candidates for preventive repair considerations and the use of +Point to bobbinvoltage ratios for preventive repair considerations is not recommended. The objective forpreventive repair considerations is to prevent significantly large throughwall lengths, but to notexclude the potential for any throughwall cracks which would too conservative for a repair
8-42

EPRI Proprietaiy Licensed Material
Recommended New Updates to NDE, Analysis Methods and Programs
guideline. Growth in average depth is applied to estimate a reasonable depth for preventiverepair as growth over a significant length rather than local crack penetration is of interest. Agrowth rate of about 10% in average depth per EFPY is a reasonable estimate for normal growthat about the 90% confidence level. Thus, for preventive repair based on +Point amplitude sizingconsiderations, the amplitude should be based on average crack depths in the range of 85% overthe deepest segment of about 0.1 to 0.2 inch. Since the amplitude sizing correlations are basedon maximum crack depth, the 85% segment average depth must be adjusted upward to define apreventive repair guideline. Since the ratio of maximum depth to average depth over the bursteffective crack length for a crack is typically about 1.25, it is reasonable to assume that themaximum depth for a deep crack segment would be at least 10% greater than the average depth.Thus, the maximum depth for preventive repair should be about 95% with a lower bound ofabout 90%. The +Point amplitude for these depths can be estimated from a correlation ofmaximum depth to +Point amplitude as described below.
Sizing correlations based on +Point amplitudes are being developed under the EPRI Tools forTube Integrity Program but these correlations have not been finalized at this time. The sizingdevelopments show that the expected exponential dependence of voltage with depth is consistentwith pulled tube data and should be the basis for amplitude based sizing correlations. Given theexponential behavior, only two data points are needed to define a sizing correlation, one ofwhich should be tied to providing good estimates of throughwall crack lengths. Thedevelopment efforts show that +Point amplitudes in the range of 2.25 to 2.75 volt provide goodestimates of initial throughwall penetration and throughwall lengths for ODSCC at TSPintersections. The second point for a sizing correlation can be tied to an amplitude at a givendepth such as about 40%. A mean estimate for depths near 35% to 40% for ODSCC at TSPintersections is about 0.1 +Point volt. To avoid being overly conservative for preventiveplugging, an estimate for depths near 95% can be based on amplitude sizing fit to 2.5 volts forthroughwall and 0.1 volt at 35% depth. Since depth is being inferred from volts, depth has alogarithmic dependence on volts.
Figure 8-23 shows a sizing correlation fit to 0.1 volt at 35% depth and 2.5 volts at 100% depth.For a 95% maximum depth repair guideline, the +Point indication would be about 1.9 volts. At amaximum depth of about 90%, the +Point indication would be about 1.55 volts, which is tooconservative for a preventive repair guideline based on the plant experience described in Section8.2.3. It is suggested that consideration be given to preventive repair of ODSCC indicationsfound to have a +Point maximum voltage of 1.9 volts.
Although the data of Tables 8-9 to 8-11 were obtained for plants with 7/8 inch tubing, +Pointamplitudes for deep indications are not significantly different for 3/4 inch tubing since voltagesare calibrated for all tube sizes to 20 volts for a throughwall notch. For +Point amplitude sizingof axial ODSCC, the same correlation is applied to both 3/4 and 7/8 inch tubing. Consequently,the suggested preventive repair limit of 1.9 volts would be applicable to both 3/4 and 7/8 inchtubing. Since the GL 95-05 repair limit for 3/4 inch tubing is >1.0 bobbin volts and +Point voltsare less than bobbin volts for the dominant population of indications, the suggested preventiverepair limit of 1.9 +Point volts is not likely to impact plants with 3/4 inch tubing. Figure 8-24shows the trend of +Point volts versus bobbin volts for an inspection in a plant with 3/4 inch
8-43

II
EPRI Proprietary Licensed Material
Recommended New Updates to NDE, Analysis Methods and Programs
tubing. For this inspection, essentially all +Point volts are less than the bobbin volts and nopreventive repair would need to be considered.
The preventive repair guideline is developed based on considerations of normal growth in depth.Most plants found with large growth rates as a function of depth have had outlier bobbin voltageindications that initiated from bobbin voltages less than one volt. These plants generally hadhigh operating temperatures which may have contributed to larger growth rates in depth. Itwould be excessively conservative for currently operating SGs to consider preventive repairlimits low enough to encompass large growth in depth considerations.
8.3.4 Guidelines for Supplemental RPC Inspection
Figures 8-25 and 8-26 show +Point versus bobbin voltage trends for two plants with 7/8 inchtubing. Some tubes are found to have +Point volts comparable to or slightly exceeding thebobbin voltages. Thus, +Point voltages of about 1.9 volts may be found below the GL 95-05repair limit for 7/8 inch tubing. A +Point to bobbin voltage ratio of about 1.1 envelopes nearlyall bobbin indications. Thus, there is a high probability that bobbin indications less than 1.7bobbin volts would have less than 1.9 +Point volts.
To increase the likelihood of identifying ODSCC indications with >1.9 +Point volts for plantswith 7/8 inch tubing, a 100% RPC inspection of bobbin indications between 1.7 volts and the GL95-05 repair limit of > 2.0 volts should be considered for preventive repair applications.Indications greater than the GL 95-05 repair limit of >2.0 volts are required to be inspected andare repaired so that preventive repair considerations are not applicable. If a plant applies lockedTSPs to prevent burst and has a repair limit greater than the GL 95-05 limits, there is no need toapply preventive repair unless leakage from a single large voltage indication would potentiallycause leakage limits to be exceeded. There is no identified basis to suggest expansion of +Pointinspections for plants with 3/4 inch tubing.
8.3.5 Conclusions
ARC inspections periodically find large voltage indications (such as > 8 volts) that are notpredicted to occur and generally do not occur in successive inspections. Since voltage increasesexponentially with depth and again approximately exponentially with increasing throughwalllength, an indication that is near throughwall over a significant length at the BOC can grow withnormal depth growth to a significant throughwall length over one operating cycle with anassociated large voltage growth rate. The likelihood of finding a large voltage indication can bereduced by preventive plugging at less than the ARC repair limit. Plant experience indicates that+Point volts up to about 1.71 volts and +Point to bobbin volt ratios as high as 2.07 have notresulted in large +Point indications in subsequent cycles. Since a +Point to bobbin ratio of about2.0 bounds essentially all bobbin indications, this ratio does not provide a meaningful indicatorfor considerations of preventive tube repair. The data indicate that +Point amplitudes shouldexceed 1.7 volts for preventive repair considerations. The most appropriate measure forpreventive repair considerations would be near throughwall depths that can grow to largethroughwall lengths for which 95% maximum depth is shown to be a reasonable depth for
8-44

EPRI Proprietary Licensed Material
Recommended New Updates to NDE, Analysis Methods and Programs
preventive repair considerations. The best current methods for depth sizing of axial ODSCC arebased on correlations of depth with +Point volts.
Based on applying a typical amplitude sizing correlation, a preventive tube repair at 1.9 +Pointvolts is suggested corresponding to about 95% maximum ODSCC depth. Since a +Point tobobbin voltage ratio of about 1.1 bounds most ODSCC indications, it is suggested that a 100%RPC inspection be performed for indications >1.7 bobbin volts. Since the GL 95-05 repair limitfor 3/4 inch tubing is 1.0 bobbin volt and +Point volts are less than bobbin volts for the dominantpopulation of indications, the suggested preventive repair limit of 1.9 +Point volts is not likely toimpact plants with 3/4 inch tubing. Given the lower repair limit, no supplemental inspection forpreventive repair considerations is recommended for plants with 3/4 inch tubing.
8.4 References
8-1 Generic Letter 95-05, "Voltage Based Repair Criteria for Westinghouse SteamGenerator Tubes Affected by Outside Diameter Stress Corrosion Cracking," UnitedStates Nuclear Regulatory Commission, Office of Nuclear Reactor Regulation,Washington, DC (1995).
8-2 Presentation Material, "DCPP Unit 2 Steam Generators Operational Assessment forVoltage-Based Alternate Repair Criteria," PG&E and NRC Staff Meeting, One WhiteFlint, Rockville, MD, pp. 42-56 (April 15, 2003).
8-3 DCL-03-076, "Docket No. 50-323, OL-DPR-82 Diablo Canyon Unit 2 Special Report03-02 - Results of Steam Generator Inspections for Diablo Canyon Power Plant Unit 2Eleventh Refueling Outage," Pacific Gas & Electric Company, Diablo Canyon PowerPlant, Avila Beach, CA (June 23, 2003).
8-4 NRC IN 2003-13, "Steam Generator Tube Degradation at Diablo Canyon," UnitedStates Nuclear Regulatory Commission, Office of Nuclear Reactor Regulation,Washington, DC (August 28, 2003).
8-5 NP-7480L, "Steam Generator Tubing Outside Diameter Stress Corrosion Cracking atTube Support Plates Database for Alternate Repair Criteria, 1996 Database Update,"a.k.a. Addendum l, EPRI, Palo Alto, CA (1996).
8-6 LTR-SGDA-03-137, "Voltage Dependent Growth Bin Width Determination,"Westinghouse Electric Company LLC, Madison, PA (June 17, 2003).
8-7 Presentation Material, "DCPP Unit 2 Steam Generators Operational Assessment andCause Analysis," PG&E and NRC Staff Meeting, One White Flint, Rockville, MD, pp.42-56 (March 4, 2003).
8-8 Presentation Material, "DCPP Unit 2 Steam Generators Operational Assessment forVoltage-Based Alternate Repair Criteria," PG&E and NRC Staff Meeting, One WhiteFlint, Rockville, MD (April 15, 2003).
8-45
11
EPRI Proprietary Licensed Material
Recommended Newv Updates to NDE, Analysis Methods and Programs
8-9 "ARC Guidelines for Preventive Repair of Large +Point Indications and NoiseRequirements for Voltage Based ARC," A. Marion to USNRC Document ControlDesk, Nuclear Energy Institute, Washington, DC (April 13, 2004).
8-10 Docket No. 50-247 TER, "Indian Point Nuclear Generating Unit No. 2 - TechnicalEvaluation Report of Steam Generator Tube Failure, Inspection Results, andOperational Assessment," United States Nuclear Regulatory Commission, Office ofNuclear Reactor Regulation, Washington, DC (October 11, 2000).
8-11 RIS-2000-22, "Issues Stemming from NRC Staff Review of Recent DifficultiesExperienced in Maintaining Steam Generator Tube Integrity," United States NuclearRegulatory Commission, Office of Nuclear Reactor Regulation, Washington, DC(November 3, 2000).
8-12 SG-00-05-008, "Indian Point 2 U-Bend PWSCC Cycle 14 Condition Monitoring andCycle 15 Operational Assessments," Westinghouse Electric Company LLC, Madison,PA (May 30, 2000).
8-13 Riley, J., "Industry Responses to SGAP Items - RIS Responses," electronic mail toEdmund Sullivan (USNRC), Nuclear Energy Institute, Washington, DC (April 24,2001).
8-14 Presentation Material, "NRC/SCE&G/Westinghouse Meeting Steam Generator PulledTubes Examination Results," SCE&G and NRC Staff Meeting, One White Flint,Rockville, MD (July 27, 1993).
8-15 Gumbel, E. J., Statistical Theory of Extreme Values and Some Practical Applications,National Bureau of Standards, Applied Mathematics Series 33, US GovernmentPrinting Office, Washington, DC, USA (1954).
8-16 Gumbel, E. J., Statistics of Extremes, Columbia University Press, New York, NY(1958).
8-17 Castillo, E., Extreme Value Theory in Engineering, Academic Press, Boston, MA(1988).
8-18 Kunin, B., "A New Type of Extreme Value Distributions," Engineering FractureMechanics, Vol. 58, pp. 557-570 (1997).
8-19 Ribes, B., et al., "Statistical Analysis and Model Prediction for Steam GeneratorDegradation," Fontevraud III, Contribution of Materials Investigation to the Resolutionof Problems Encountered in Pressurized Water Reactors, Chinon, FR (1994).
8-20 Coles, S., An Introduction to Statistical Modeling of Extreme Values, Springer-Verlag,London, UK (2001).
8-46

EPRI Proprietary Licensed Material
Recommended New Updates to NDE, Analysis Methods and Programs
8-21 Reiss, R.-D., et al., Statistical Analysis of Extreme Values: With Applications toInsurance, Finance, Hydrology and Other Fields, Birkhauser Boston, Cambridge, MA(2001).
8-22 WCAP-14277, Revision 1, "SLB Leak Rate and Tube Burst Probability AnalysisMethods for ODSCC at TSP Intersections," Westinghouse Electric Corporation,Energy Systems Business Unit, Pittsburgh, PA (December, 1996).
8-23 Marion, Alex, "Refining the Leak Rate Sampling Methodology for ODSCC ARCApplications (Generic Letter 95-05)," Nuclear Energy Institute, Washington, DC(March 15, 2002).
8-24 Bateman, William, "Refining the Leak Rate Sampling Methodology for ODSCC ARCApplications (Generic Letter 95-05)," United States Nuclear Regulatory Commission,Washington, DC (March 27, 2002).
8-25 Bratley, P., Fox, B. L., and Schrage, L. E., A Guide to Simulation, Second Edition,Springer-Verlag, New York, NY (1987).
8-26 Law, A. M., and Kelton, W. D., Simulation Modeling & Analysis, Second Edition.McGraw-Hill, New York, NY (1991).
8-27 Feller, William, An Introduction to Probability Theory and Its Applications, Volume I,Third Edition, John Wiley & Sons, New York, NY (1968).
8-28 Bottomley, H., "One Tailed Version of Chebyshev's Inequality," Internet Web Site,www.btinternet.com/-sel 6/hgb/cheb.htm, UK (October, 1999).
8-29 EPRI Topical Report NP 7480-L, Addendum 3, "Steam Generator Tubing ODSCC atTube Support Plates Database for Alternate Repair Limits, Update 1999," datedJanuary 2003.
8-30 EPRI Topical Report NP 7480-L, Addendum 5, "Steam Generator Tubing OutsideDiameter Stress Corrosion Cracking at Tube Support Plates Database for AlternateRepair Limits, Update 2002," dated January 2003.
8-31 EPRI Report, unpublished, "Assessment of Bobbin Coil Noise Analysis Methods forTube Integrity Applications," July 2003.
8-47

It
EPRI Proprietary Licensed Material
Recommended New Updates to NDE, A nalysis Methods and Programs
Table 8-1List of Plants That Use/Used the ODSCC ARC
Index Plant Still In-Use
1
2
3
4
5
6
7
8
9
10
1 1
12
13
14
15
16
17
8-48

EPRI Proprietary Licensed Mlaterial
Recommended New Updates to NDE, Analysis Methods and Programs
Table 8-2List of Extreme Growth Values, Volts/EFPY Adjusted to 61 00F
Plant Plant Tube Size Growth,e Name ID (inch) AN (Volts)
1
234
67
9
10 =
1 11213
1415161718
1920__ _ _ _ _ _
21222 3 __ _ _ _ _ _ _ _ _
242 5 __ _ _ _ _ _ _ _ _
2 6 __ _ _ _ _ _ _ _ _
27282 9 _ _ _ _ _ _ _ _ _ _
.30
8-49

EPRI Proprietary Licensed Alaterial
Recoontended New Updates to NDE, Analysis Methods and Programs
Table 8-3Listing of Extreme Growth Values
(Data Through Spring 2004, M =115,179 Total Bobbin Indications)
r r Ind. Tube EOC EOC EOC EOC BOC BOCj BOC BOC AV2 AV2 A 2 IAV2
InleTube Plant ylInp EFPY Tep SGId in all Row & Bobbi RPC RCRPC B1obbi RCRPC RPC 60O 63F 1__ 2011 Dia. Dlate O inSG SGs Column Volts Volt L(In.) Dmax Volt t L(in.) Dmax
=- = = = -_ TT = - =l - s-
8-50

I-I'RI iropnetaiy LIcensea latenal
Recommended New Updates to NDE, Analysis Methods and Programs
Table 8-3 (continued)Listing of Extreme Growth Values
(Data Through Spring 2004, M = 115,179 Total Bobbin Indications)_ 1 1 Ind. Tube EOC EOC EOC 2EocI BOC BO BOC2 AV2
Index Tube Plant I nspDt EFPY Temp. SG Ind. in all Row & Bobbir RPC RPC RPC Bobbir RPC RPC RPC 6 60 61 OVF 620L~al I~c Date OJ F j~In SG JSGs Column Volts Volt L(In.) JDmax Volts Volt L(in.)jDmx60F03F10F20
=_= =- -1 =11 111-11'1-=
8-51

EPRI Proprietary Licensed AMaterial
Recommended New Updates to NDE, Analysis Methods and Programs
Table 8-3 (continued)Listing of Extreme Growth Values
(Data Through Spring 2004, M = 115,179 Total Bobbin Indications)_ T Ind. Tube EOC EOC EOC EOC")J BOC BC BI BOC A AVI VI V
Indei Tube Plant Il Insp EFPY Temp. SG ind. in all Row & Bobbir RPC RPC RPC D Bobbir RPC RPC Da 600°F 603°F 610 V 2 AV2 V2__Dia. Dae in SG SGs Column Volts Volt L(in.) Dmax Volts Volt L(In.) lDmax
- -= - a == - -- = -= -- --- = r- =-------=
8-52

EPRI Proprietary Licensed Material
Recommended New Updates to NDE, Analysis Methods and Programs
Table 8-4Summary of Large V. C. Summer Indications (FDB Elevation, 1993)
Steam Rw Clm tBobbin LctoGenerator Row |Column mplitude Location
IT i17 177 177
1 I I10 I ITable 8-5Probability of Large Extremes for Two Sample Sizes
Number of Probability of Large ExtremesLarge Based on M = 1 00,000 & K = 20
Extremes Sample Frequency in Sample Frequency500 100,000 1,000 in 100,000
8-53

I IL-
EPRI Proprietary Licensed laaterial
Recommended New Updates to NDE, Analysis Methods and Programs
Table 8-6Total Expected Number of Extremes
M | K Pr(Extreme) N Number(Total) g(Extremes) (Indications) of Sims
_ _ _ I __ _ _ _
Extremes Limited to 7/8' Tubes
M K PExrm) N Number(Total) (Extremes) Pr(Extreme) (Indications) of Sims
Extremes Limited to 3/4" Tubes
M K Pr(Extreme N Number(Total) (Extremes) e (Indications) of Sims
_ _ I _ __ I __ l _
4 4,-
8-54

EPRI Proprietary Licensed Ala!erial
Recommended New Updates to NDE, Analysis Methods and Programs
Table 8-7Exponential CDF Values
X Fo F
Table 8-8Estimates of Theta, 0, and Variance for Diablo Canyon GrowthExponential)
Data (Piecewise Empirical +
Tail Parameter Growth dOPoints, Theta, Variance,
k 0 (Volts) A
8-55

lI
EPRI Proprietary Licensed Material
Recommended New Updates to NDE, Analysis Methods and Programs
Table 8-9Plant P-1: Successive Cycle +Point Data for Highest Bobbin Volts, +Point Volts and Ratioof +Point to Bobbin Volts
Tube Bobbin Volts +Point Volts Bobbin Volts
SG RowICol 1R13 1R1 4 1R15 1R1 3 1R1 4 1 R15 1R13 1R14 1R15
8-56

EPRI Proprietary Licensed Material
Recommended New Updates to NDE, Analysis Methods and Programs
Table 8-10Plant Y-1: Successive Cycle +Point Data for Highest Bobbin Volts, +Point Volts and Ratioof +Point to Bobbin Volts
Tube Bobbin Volts +Point Volts Ratio +Point to Bobbin
SG Row Col 1R9 1R10 1R11 1R9 1R10 1R11 1R9 1R10 1R11
8-57
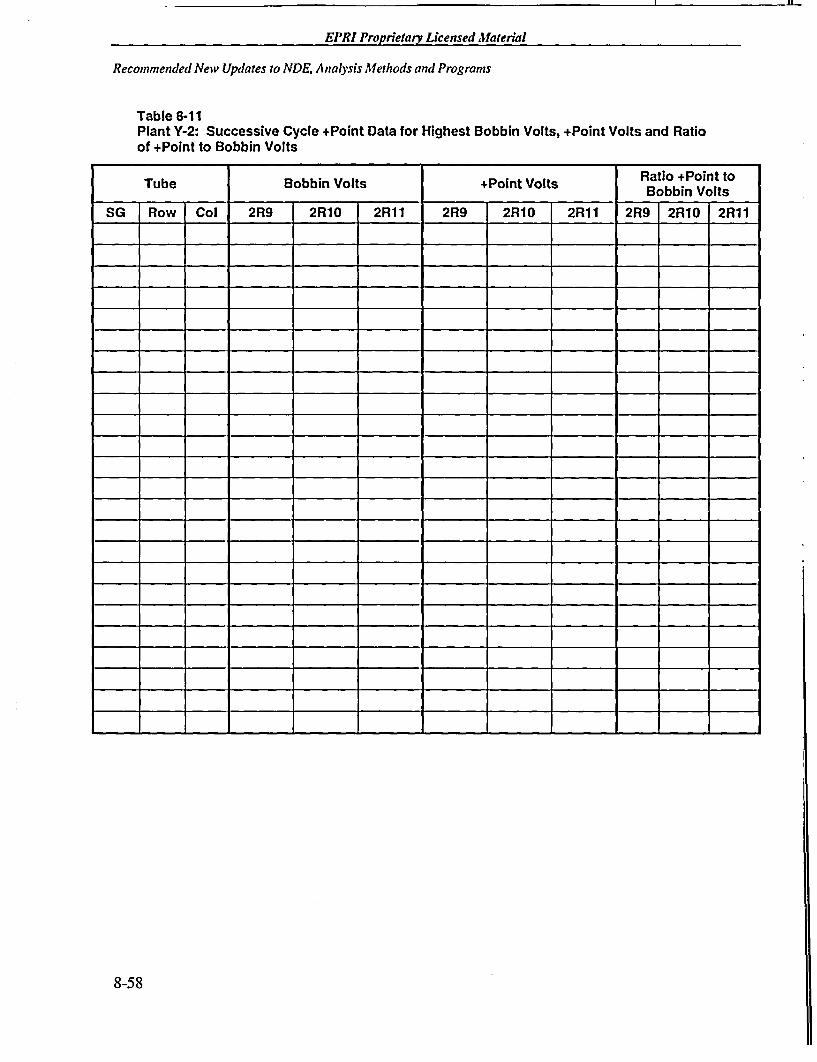
I H-
EPRI Proprietary Licensed Material
Recommended New Updates to NDE, Analysis Methods and Programs
Table 8-11Plant Y-2: Successive Cycle +Point Data for Highest Bobbin Volts, +Point Volts and Ratioof +Point to Bobbin Volts
Tube Bobbin Volts +Point Volts Ratio +Point to_______Bobbin Volts
SG Row Col 2R9 2R10 2R11 2R9 2R10 2R11 2R9 2R10 2R11
8-58

EPRI Proprietary Licensed Afaterial
Recommended New Updates to NDE, Analysis Methods and Programs
Probability of Leak vs. Bobbin Amplitude7/8" x 0.050" SG Tubes, Effect of Inclusion of Nev Data
100%
8(yLf
-gr.
70*
o%A
CYC
4 40r.
0%0.01I 0.1 1 10
Bobbin Amplitude (Volts)100
Figure 8-1Probability of Leak for 7/8" Diameter Tubes
Distribution of SG 2-4 Voltage Growth for Indicationsthat Exhibited Positive Growth During the Cycle
0 I1
100%
W0%MN, I1(,2'
81Su10%
.t_
WA , E:.C
0
4(Y% '
30%.oU
20%.
10Y%
M0
elI el … … __- O 0 0 G. IO: C00 O e 0 0 0O -
Common LOG of Voltage Grouwth per EEITY
Figure 8-2Distribution of Amplitude Growth for Cycle 11
8-59

- - L -U-
EPRI Proprietarjy Licensed Material
Recommended New Updates to NDE, Analysis Methods and Programs
Distribution of SG 24 Growth
100fw I 11100%
80%
70%
6 0%
450'40%o I30%
20%
-4.00 -3.00 -2.00 -1.00 0.00 1.00 2.O
Lognormal Resi(IuaI Deviate
Figure 8-3Amplitude Growth CDF vs. Lognormal CDF
Nul1al Distribution l'ot of LC)G(dV) Rc-iduatqDistribution of Voltage Growvth/EFPY
4.00)
4(X)
2.0a
LWii
-1.0.I
-4.(X II-3.0 -2.0 -1.0 0.0 1.0 2.0
SLUad. riliztd Nt-sidwul uof Il.Y; V(,Its 1'r ElI"
Figure 8-4Normal Distribution Plot of Logarithm Residuals
I0 3.00 t.00 5.00
3.0) 4.0 5.(
IY
8-60
EPRI Proprietary Licensed Material
Recommended New Updates to NDE, Analysis Methods and Programs
Distribution of SG 2-4 Voltage Growth for Indicationsthat Exhibited Positive Growth During Cycle 10
14%
12%
2
lo-
.E8%X,
C
100%
-90%
s80C
70%
-00,,.tI60,v-
* 5 0%
-40%~
* 201%,
10%7
*( 0%
jC
X.
4%
2%
0%C CG e - : t u s 0* - C? N. C C,.~ 0, t- C: -: 0 C5 -~ N v
02…- mon 10;fVlgGwhE
Common LOG of Voltage.Gruwth p[wr E11'Y
Figure 8-5Distribution of Amplitude Growth for Cycle 10
Distribution of SG 2-4 Growth for Indicationsthat Exhibited Positive Growth During Cycle 10
r
2
e
0
6
100%
90%.
80.
70%
,00
600%
40%
30%Z
20%
10%
20%
0.01 0.1 1
Voltage Growth. Volts per El'l'Y
10
Figure 8-6CDF of Amplitude Growth for Cycle 10
8-61

II
EPRI Proprietary Licensed Material
Recommended New Updates to NDE, Analysis Methods and Programs
llobhin Volts vs. Dcpth for El'RI ODSCC ARC l)atabaseI) -
If
.9
3l
'
s4
I
1i. -
(M% IIY.;, 301. 4%. 5.% 7%.
IPcsiruoite c lainaltioiiii Nltajimum Rl(Iafis Deiptli
So%. tr'4- lox),;,
Figure 8-7Correlation of Bobbin Amplitude to Maximum Depth
Probability of Burst of 7/8' SG Tubes During SLB,EFfect of Additional Data, AP = 210S ywi
3>}
IE+00
I E-01
1E-02
IE-03
IE-04
1E-05
IE-OG
1E-07
IE-OS
IE-09
lE-lO
I E-1l0.1 10 100
Bobbin Amplitude (Volts)
Figure 8-8Probability of Burst for 718 Inch Diameter Tubes
8-62

EPRI Proprietary Licensed Material
Reconmmended New Updates to NDE, Analysis Methods and Prograns
Shifted Exponential Distribution,Effect of Increasing Theta (0)
20.0
18.0
16.0
14.0
12.0
cg 10.0
8.0
6.(0
4.0
2.0
o.o I
0%. I 0% 20% .10% 4(0% 0% 60% 70%.< 80% 9% 10 0%
Cumulative rknsily. F(O
Figure 8-9Effect of Theta (0) on Exponential Distribution
ODSCC ARC Voltage Growth DatnDinblo Canyon, SG24-C1O
3.5.
3.0
. 2.5
*O 2.0
B.5 1C
A 1.0
.5;P 0.6CZa
0.0
-0.5IIIIIIII0.00 0.25 0.50 0.75 1.00 1.25 1.50 1.75 2.00 2.25 2.50
Bobbin Amplitude, V (V'olts)
Figure 8-10Example Distribution of Growth Data
8-63

Ii
EPRI Proprietary Licensed Material
Recommended New Updates to NDE, Analysis Methods and Programs
Probability & Cumulative Distribution of GrowthDiablo Canyon, SG24-C1O
40%.f
35%
30%
. _
A 25%m
I 15%ff
10%
5%.
100%
90%k
80%
70% . 3
60% oF;
50% g
40% .
20%,
10-
0'.:.- - - - . . . . . . . .
0.0 0.2 0.4 0.6 0.8 1.0 1.2 1.A 1.6 1.8 2.0 2.2 2.4 2.6 2.8 3.0
Difierential Growth
Figure 8-11Cumulative Distribution of Growth Data
LogNorinal Tail Probability of GrowthSG24, 2R10 Operating Cycle
1O(,
93 '9 o -
;,70%-e
4 t
3 20'.;
0'40(1
IW ()t%
I I().t)%
2.(0 1.( 6.0 8.0 1.W 12.0 11.0
BoIbbin; Amliplittide Ct'.r ffi (Wzlts)
Figure 8-12Expected Frequency of SG 24 Large Growth for Cycle 11
8-64

EPRI Proprietary Licensed Material
Recommended New Updates to NDE, Analysis Methods and Programs
. I
Theta and Variance as a Function of "k"Diablo Canyon Growth Data
C
0C
1.60
1.60
1.40
1.20
1.00
0.80
0.0
0.40
0.20
0.00
0.12
0.10
0.06 j
0.06
0.04
0.02
0.00
0 6 10 15 20 25 80 . 35 40 45 50 55 60
Points in Exponential Tail. k
Figure 8-13Considerations in the Determination of k
Empirical-Exponential Simulation of Growth DataAlagnification of the Exponential Tail
I
S
5X
100.0% -
99.5A -
99.0%. -
93.5%.5
100.0%
,
-
E
-98.5%;
98.0%5
1.0 1.5 2.0 2.5 3.0 3.5 4.0 4.5
Bobbin Amplitude Growth, Volts
Figure 8-14Exponential Distribution Function for the Growth Tail
8-65

it
EPRI Proprietary Licensed Material
Recommended New Updates to NDE, Analysis Methods and Programs
Exponentail Tail Probability of GrowthSG24, 2R10 Operating Cycle
0.o
a
Al
I-
2^
I(100%
90%
80%
70% -
60%c
WI% -
30% e
20%.. -
10%
0.0 2.0 4.0 6.0 8.0 10.( 12.0 14.0
Bobbin Amplitude Growth (Volts)
Figure 8-15Expected Frequency of SG 24 Large Growth for Cycle 11
8-66

EPRI Proprietary Licensed Alaterial
Recommended New Updates to NDE, Analysis Methods and Programs
Figure 8-16Flaw and Mix Residual (400/1 00 Mix) for Plant A-1 Pulled Tube R27C54-1H
Figure 8-17Upper and Lower TSP Noise Signals for Plant A-1 R27C54-1 H (Center 1/3 of TSP Cannot beEvaluated Due to Flaw Signal)
8-67

It
EPRI Proprietary Licensed Material
Recommended New Updates to NDE. Analysis Methods and Programs
Figure 8-18Mix Residual and Center, Upper and Lower 1/3 TSP Noise Signals (400/100 kHz Mix) forPlant A-1 R27C54 at 2H
8-68

EPRI Proprietary Licensed Material
Recommended New Updates to NDE, Analysis Methods and Programs
-... ;' . 1.
Figure 8-19Plant P-1: TSP ODSCC 400/100 to 200 kHz Bobbin Voltage Ratios: Comparison of Ratiosfrom Normal Resolution Process with Ratios Inferred from 200 kHz Mix Residual Analysis
8-69

--- M-
EPRI Proprietary Licensed Material
Recommended New Updates to NDE. Analysis Methods and Programs
Figure 8-20Comparison of Bobb in Flaw Mix Volts for Reported DSIs and DSIs Inferred from 200 kHzMix Residual Analysis vs. 200 kHz + Point Volts
8-70

EPRI Proprietary Licensed Material
Recommended New Updates to NDE, Analysis Methods and Programs
POD as Function of Mix P1 S/N (FlawN Vpp/Noisc Vpp)(Generalized Linear Model Loglogistic Solution)
01Z
U
S
.C
c.
1.0
0.9
0.8
0.7
0.6
0.6
0.4
0.3
0.2
0.1
0.00.01 0.1 1 10 100
SIN PI Flaw Vpp/Noise Vpp
Figure 8-21POD as Function of Mix P1 SIN (Flaw Vpp/Noise Vpp)
8-71

It
EPRI Proprietary Licensed Material
Recommended New Updates to NDE, Analysis Methods and Programs
TSP Bobbin P1 Mix Peak-to-Peak Amplitude Noise DistributionsPreliminary ETSS Data and Plant DW Data
0.9
0.8
0.7
Jo 06M.0
0.2
0.14
03
O 2
00
Figure 8-22TSP Bobbin
0.2 0.4 0.6 0.8 1 1.2
P1 Mix Peak-to-Peak Noise Amplitude - Volts1.4 1.6
P1 Mix Peak-to-Peak Amplitude Noise Distributions
+Ioint Amplitude Sizing Correlation for Estimating D)epths Blased on AmplitudeLogarithmic Fit to 2.5 Volts at 1 00% lXptl and 0.1 Volt at 40% Depth
I ()t
¶Y,
,*7o
E SO
-z
U*~ 4))
(1~
2(1
10
0.3
+P.,inlt l'ealk-tilleak Volbi!
1(3
Figure 8-23+Point Amplitude Sizing Correlation for Estimating Depths Based on Amplitude
8-72

EPRI Proprietary Licensed Material
Recommended New Updates to NDE, Analysis Methods and Programs
Plant DIN' +Point Volts versms Bobbin Coil \'olts45
4
35
3
2.5
I
C.o
*E
I -5
0510
1.5 1 1.5 2 2.5 3 3.5 4 4.5 5
Bobbin Coil Volts
Figure 8-24Plant DW + Point Volts versus Bobbin Coil Volts
PJllnt 1'-1 IR15: +I'oint versus Bobbin Vo<LsAxial Ol)SCC at TSP Intersections
3
2.5
v
X-
F
0.5
oI 0s I 1.5 2 2.5 3 .ls 4 4.5 5
Bobbin Coil Volts
Figure 8-25Plant P-1 Ri 5: +Point versus Bobbin Volts: Axial ODSCC at TSP Intersections
8-73

II
EPRI Proprietary Licensed Material
Recommended New Updates to NDE, Analysis Methods and Programs
Figure 8-26DCPP-2 All SGs, 2R11: + Point to Bobbin Voltage Comparison for ODSCC at TSPs
8-74

EPRI Proprietary Licensed Material
9NRC APPROVED REVISIONS TO ARC PROGRAM,DATABASES, AND ANALYSIS METHODS
This section documents NRC approved revisions to the ARC program requirements, databasesand analysis methods applied in applications of the ARC for ODSCC at TSP intersections. TheARC program requirements include the protocol for updating the database and the tube pullrequirements. ARC database changes included in Addendum 5 were the NRC approved EPRIdata exclusion criteria and exclusion of the French data from the ARC database. Analysismethods updates in Addendum 5 included revisions to the leak rate analysis methods based onclarification of the confidence level required for a correlation and the methods for including theconfidence level for a correlation in the leak rate analyses. There are no new NRC approvedrevisions in this Addendum 6. The only change in this section from Addendum 5 is the update toTable 9-2 as described below.
The requirements for pulling tubes in Section 9.2 includes Table 9-2, which identifies thenumber of indications needed to complete voltage bins for the leak rate data. This table andrelated Section 9.2.2 are updated for this addendum to reflect the new pulled tube resultsdescribed in Sections 3 and 4 and will be further updated for future addenda. The remaininginformation in this section is not expected to change between addenda. Any future NRCapproved changes will be added as additional subsections to this section.
9.1 NRC/lndustry SGDSM Database Protocol
The NRC/industry SGDSM database protocol for updating the ARC database is given in Table9-1. Items I and 2 were developed when annual updates to the database were anticipated. Dueto the reduced number of plants implementing the ARC, the addenda updates are issued onlywhen required due to additional pulled tubes. Item 2 should therefore be interpreted as plants inan outage season when a new addenda is issued have the option of using the prior addendaprovided there is not a significant, non-conservative shift in the ARC correlations. Item 3provides for requesting NRC approval of changes to the exclusion criteria of Section 9.3 orexclusions of data, such as described in Section 9.4. If issuing of an addendum update to thecorrelations does not include any request for changes to the exclusion criteria or data exclusions,NRC approval of the updated correlations is not required for plant implementation. Item 4provides for excluding data from the database only when applying the NRC approved dataexclusion criteria given in Section 9.3. Item 5 provides the requirements for issuing interimARC correlations in the event that new pulled data leads to significant non-conservative changesto the correlations.
9-1

-- --- it -
EPRI Proprietary Licensed laterial
NRC Approved Revisions to ARC Program, Databases, and Analysis Methods
Items 1 to 5 were submitted to the NRC by NEI in Reference 9-3 and items I to 4 were approvedby the NRC in Reference 9-4. Item 5 was submitted by Reference 9-1 and approved by the NRCin Reference 9-2.
9.2 Requirements for Pulling Tubes in Support of the Voltage BasedRepair Limits
The industry recommended requirements for pulling tubes were initially defined in Addendum 3and updated to incorporate the NRC approval with comments in Reference 9-5. The NRCcomments were incorporated and transmitted to the NRC in Reference 9-6. To maintainimportant documentation supporting the ARC, the NRC approved tube pull requirements aregiven below, as previously reported in Addendum 4.
9.2.1 Description of the Issue
The pulled tube database supporting the voltage based repair limits has been significantlyincreased since the issuance of GL 95-05. It is therefore appropriate to update the requirementsfor pulling tubes in support of the ARC. This section describes industry recommended and NRCapproved requirements for pulling tubes.
Pulled tubes are required to characterize the crack morphology as dominantly axial ODSCC forconsistency with that of the EPRI database and to increase the pulled tube database supportingthe ARC. There have been no pulled tubes for which the ODSCC crack morphology differsfrom that found in the initial EPRI database prior to issuance of GL 95-05. The morphology isdominantly axial ODSCC with differences between pulled tubes being principally in the degreeof cellular corrosion found at a given intersection. The cellular involvement can differ betweenTSP intersections on the same tube as much as differences between SGs or plants. The onlymorphology difference from the EPRI database found in the pulled tubes has been one case ofcombined local wall thinning with ODSCC, which was identified as a volumetric indication inthe field inspection and was pulled to clarify the morphology of the indication. Tubes pulledwith RPC axial ODSCC field calls have had morphologies consistent with the EPRI database.Consequently, removal of tubes specifically for morphology verification can be a low priority fortube removal. As a result of this consistent morphology experience, it is acceptable to delay theinitial tube pull for morphology confirmation to the end of the first cycle following ARCimplementation if this delay can improve the value of the pulled tube data to the database.
The principal objective for the tube pulls should be to support the database where the databasehas limited data. The burst pressure versus bobbin voltage correlation has not changedsignificantly with additional pulled tube data since before issuance of GL 95-05 in 1995. Theadditional data have resulted in changes in the structural limit by about half a volt or less.Changes in the leak rate versus voltage correlation have been more significant due to the smallerdatabase on leaking tubes. Thus the primary objective for pulling tubes should be to increase theleak rate database. The tubes should have a large enough voltage to have a significant likelihoodof leaking. The correlations of Section 6 show that to obtain a 30% probability of leakage, boththe 3/4 inch and 7/8 inch (excluding French data) tubes should have bobbin voltages > 3.2 volts.
9-2

EPRI Proprietary Licensed Material
NRCApproved Revisions to ARC Program, Databases, and Analysis Methods
These considerations lead to emphasis on pulling tubes based on having large enough voltages tocontribute to the leak rate database.
The GL 95-05 requirements for tube removal can be summarized as follows:
1. Number and Frequency of Tube Pulls
- Two pulled tubes with a minimum of four intersections should be obtained during theplant SG inspection outage implementing the ARC or a preceding outage.
- Additional tube pulls with a minimum of two intersections should be obtained at therefueling outage following accumulation of 34 EFPM of operation following the previoustube pull.
2. Selection Criteria
- The emphasis should be on removing tube intersections with large voltage indications
- Where possible, the removed intersections should cover a range of voltages, includingintersections with no detectable degradation.
- Selected intersections should include a representative number of intersections with RPCsignatures of a single dominant crack as compared to intersections with two or moredominant RPC signatures around the circumference.
The following provides the NRC approved changes to the above requirements for tube removal.
9.2.2 Bases for Tube Removal Guidelines
Based on the above considerations, the primary emphasis for pulled tubes should be to supportthe leak rate correlation, while also obtaining information on crack morphology. Table 9-2summarizes the number of ODSCC indications pulled and destructively examined and thenumber of intersections that had leak rates contributing to the correlations for both 3/4 and 7/8inch diameter tubing. Table 9-2 has been updated to the Addendum 6 database and will beupdated with each future addendum update. It is seen that 136 out of a total of 188 indications(excluding the French data) had voltages less than 2 volts. This voltage range, which is typicalof indications found during the first outage implementing the ARC, has more data than neededand emphasis for tube removal should be on higher voltage indications. In this low voltageregion, crack morphology features typically are not well established and the data provide onlyOD cracking as a morphology confirmation. Therefore, the tube removal requirements should bedefined to minimize the need for pulling low voltage indications.
For 3/4 inch tubing, indications greater than about 3 volts would have a 30% probability ofleakage and would likely contribute to the leak rate correlation database. As seen in Table 9-2,the existing leak rate database for 3/4 inch tubing is extensive and only 4 indications are neededto complete a database of 2 indications in each one volt bin up to 12 volts. For 7/8 inch tubing,indications less than about 3 volts have a very low leakage probability with only I small leakingindication in 33 pulled tube indications between 1 and 3 volts. The probability of leakagecorrelation shows < 20% leakage potential at 3 volts. Therefore, indications > 3 volts are
9-3

_______________________ I,
EPRI Proprietary Licensed Material
NRC Approved Revisions to ARC Program, Databases, and Analysis Methods
desirable to have a reasonable likelihood of contributing to the leak rate database. It is thereforerecommended that tube pulls be targeted toward obtaining a leak rate database of 2 indications ineach one volt range above a minimum of 2 volts for 3/4 inch tubing and above 3 volts for 7/8inch tubing.
9.2.3 Criteria for Tube Removal and Examination/Testing
Implementation of the voltage based repair criteria should include a program of tube removalsfor testing and examination as described below. The purposes of this program, in order ofpriority, are: I) to provide additional data to enhance the conditional leak rate, burst pressure andprobability of leakage correlations; 2) to verify axial ODSCC as the dominant degradationmechanism at or near the time of ARC implementation; 3) to assess inspection capability; and 4)to monitor the degradation mechanism over time.
The principal database goal to support the ARC correlations is to enhance the leak ratecorrelation. Table 9-2 identifies voltage ranges for additional leaking indications (target number)to work toward a leak rate database that includes at least two indications with leakage in one voltintervals for which leakage is reasonably expected. Tube removals should be targeted towardsatisfying the target number of indications. As noted below, the required times for tube pullsmay optionally (utility option) be delayed up to one fuel cycle if no pullable tube indications arefound that satisfy the target indication voltage ranges. The data of Table 9-2, including targetindications, shall be updated and included in the EPRI ARC database addenda so that the targetindications reflect the latest available pulled tube results.
The following criteria for tube removal and examination shall be followed.
Number and Frequency of Tube Pulls
* Two pulled tube specimens with an objective of retrieving as many intersections as ispractical (a minimum of four intersections) should be obtained for each plant either duringthe SG inspection outage that implements the voltage based repair criteria or during aninspection outage preceding initial application of these criteria. However, if no pullable tubeindications are found in this inspection that would satisfy the industry database targetindications, the tube removal may be delayed (utility option) to the next planned inspectionwith the goal of obtaining indications satisfying the database target. The tube pulls may notbe delayed more than one planned outage following implementation of the repair criteria.
* On an ongoing basis, an additional (follow-up) pulled tube specimen with an objective ofretrieving as many intersections as is practical (minimum of two intersections) should beobtained at the refueling outage following accumulation of three operating cycles followingthe previous tube pull. However, if no pullable tube indications are found in this inspectionthat would satisfy the industry database target indications, the tube removal may be delayed(utility option) to the next planned inspection with the goal of obtaining indications satisfyingthe database target. The tube pulls may not be delayed more than one planned outagefollowing the required time for an additional pulled tube specimen. Consequently, the
9-4

EPRI Proprietary Licensed AMaterial
NRCApproved Revisions to ARC Program, Databases, and Analysis Methods
maximum interval between tube removals is four operating cycles to provide a periodicconfirmation of crack morphology.
* If the above time requirements for a pulled tube specimen coincide with the plant's lastscheduled outage before SG replacement, the requirement for a tube pull is waived.However, this waiver does not apply if the plant has not previously pulled tubes to supportthe ARC database. For example, if the last scheduled outage is the first or second outageimplementing the ARC, the waiver does not apply where tube pull specimens have not beenobtained during the plant SG inspection outage that implements the voltage based repaircriteria or during an inspection outage preceding initial application of these criteria.
* If indications with unanticipated voltage levels substantially higher than the structural limit(for example, > 10 volts) from the burst correlation are found in an inspection, the indicationshould be considered for removal and destructive examination if the test results are likely todetermine whether or not condition monitoring or operational assessment results wouldsatisfy acceptance limits.
Tube Removal Selection Criteria
* The primary emphasis for selecting an intersection for removal should be an indication thatsatisfies the target indication voltages of Table 9-2. If the target voltage range cannot besatisfied, the emphasis should be on intersections with large voltage indications.
* Where possible, the removed tube intersections should cover a range of voltages, includingintersections with no detectable degradation.
* For selection between indications of comparable voltage levels, the preference for removalshould be intersections with RPC (or equivalent probe) signatures indicative of a singledominant crack as compared to intersections with RPC signatures indicative of two or moredominant cracks about the circumference.
Pulled Tube Examination and Testing
* Removed tube intersections should be subjected to leak and burst tests under simulatedMSLB conditions to confirm that the failure mode is axial and to permit enhancement of thesupporting data sets for the burst pressure and leakage correlations. The systems for leaktesting should accommodate and permit measurements of leak rates as high as practicalincluding leak rates that may be in the upper tail of the leak rate distribution for a givenvoltage. Leak rate data should be collected at temperature for the differential pressureloadings associated with the maximum postulated MSLB. When it is not practical to performhot temperature leak tests, room temperature leak rate testing may be performed as analternative. Burst testing may be performed at room temperature. The burst and leak ratecorrelations and/or data should be normalized to reflect the appropriate pressure andtemperature assumptions for a postulated MSLB.
* Subsequent to burst testing, the intersections should be destructively examined to confirmthat the degradation morphology is consistent with the EPRI database morphology forODSCC at tube to TSP intersections. The destructive examination techniques should includetechniques such as metallography and scanning electron microscope (SEM) fractography as
9-5

I 1I-
EPRI Proprietary Licensed Aaterial
NRC Approved Revisions to ARC Program, Databases, and Analysis Methods
necessary to characterize the degradation morphology (e.g., axial ODSCC, circumferentialODSCC, IGA involvement, cellular IGA and combinations thereof) and to characterize thelargest crack networks with regard to their orientation, length, depth and ligaments. Foruncorroded ligaments, the following information should be reported: location within theelevation of the overall macrocrack; angular orientation (approximate degrees) relative to theprimary direction of the macrocrack; and size of the ligament such as uncorroded ligamentarea. The purpose of these examinations is to verify that the degradation morphology isconsistent with the assumptions made in NRC GL 95-05 as well as that included in the EPRIdatabase.
9.3 Data Exclusion Criteria
9.3.1 Introduction
This section describes the criteria for excluding data from the Alternate Repair Criteria (ARC)database supporting the burst, probability of leakage and leak rate correlations. The criteria areapplied to identify specimens to be excluded from the correlations. Exclusion Criteria I and 2submitted by References 9-7 and 9-8 are consistent with NRC guidelines given in Paragraph2.b.3(2) of Generic Letter 95-05. In addition, the NRC has accepted a modification to Criterion3a as originally drafted in Reference 9-9. The NRC acceptance (References 9-10 and 9-1 1) ofCriterion 3a is based on increasing the confidence level for application of this criterion from 95%to 99%. Criterion 3a then excludes leak rate data that is outside the lower 99% predictioninterval on both the leak rate versus voltage and leak rate versus crack length correlations. In theNRC RAI of Reference 9-12, the NRC provided a staff position on exclusion Criterion 2a thatthis criterion should be applied to all data rather than the original criterion application to data thathad high burst pressures. This change is included in Criterion 2a.
Reference 9-1 I provided approval of the ARC database in Addendum 2 as an update to thedatabase approved in GL 95-05. The approval of Criterion 3a led to exclusion from the leak ratedatabase of model boiler specimens 598-3 and 604-2. Reference 9-11 also approved a revisionof the SLB leak rate for Plant S Tube R28C41 from 2496 Vhr to 1250 I/hr as a revision to GL 95-05 Paragraph 2.b.3(2) requirements.
The complete data exclusion criteria, as approved by the NRC, are given in this section.Criterion 3b of Reference 9-9 was not accepted by the NRC and is not included in this section.Data resulting from application of these criteria form the database for the ARC correlations.Evaluations of new data against these exclusion criteria are given in Sections 3 and 4 of eachARC database addendum.
9.3.2 Data Exclusion Criteria
NRC guidelines for acceptance of data used in developing the correlations are based onaccepting all data that do not satisfy specific criteria for exclusion from the database. The NRC'sgeneral guidelines for exclusion of data from the database are:
9-6

EPRI Proprietary Licensed Material
NRCApproved Revisions to ARC Program, Databases, andAnalysis Methods
1. Data associated with an invalid test.
2. Data associated with atypical morphology must be based on morphology criteria which arerigorously defined and applied to all data.
3. Data exclusion criteria must be able to be unambiguously applied by an independentobserver.
4. Data can be excluded if it results in conservatism associated with application of the affectedcorrelation.
Specific criteria developed for exclusion of data following the above guidelines and approved bythe NRC are:
Criterion 1. Invalid or Inadequate Test
An invalid test is associated with unacceptable test specimens or invalid test measurements asexemplified by one of the following situations:
la. Eddy current signal corruption. This condition results in the data point not beingused in any of the three correlations. Examples of this condition are tube specimensthat have been severely damaged for reasons other than the operating corrosion,specimens exhibiting extraneous eddy current signal effects (e.g., due to proximity ofthe degradation to a specimen weld), both of which result in inappropriate orexcessive eddy current voltage response.
lb. Inadequate or inappropriate burst test. This condition results in the data point notbeing used in the burst correlation. Examples of this condition are: tube specimensthat did not attain a true burst condition (e.g., caused by the specimen's internal re-enforcing bladder leaking), a test fixture malfunction with inability to retest andspecimens tested for other purposes (e.g., specimen burst tested inside a supportplate).
Ic. Inadequate leak test. This condition results in the data point not being used in theleak rate correlation. Examples of this condition are: insufficient test loop flowcapacity to reach the specimen's leak rate for SLB conditions and test malfunctionwith inability to retest.
Id. Tube damage from field induced tube pullforces. This condition results in the datapoint not being used in the leak rate correlation. It may be used in the probability ofleak correlation if justified by analysis. An example of this condition is radialligament tearing as indicated by excessive post-pull measured voltage for the fieldobtained specimen and higher than expected leak rates at or below normal operatingconditions. Supporting analyses must show that the uncorroded ligament would nothave torn to increase the leak rate under SLB conditions.
9-7

R-
EPRI Propretary Licensed Material
NRC Approved Revisions to ARC Program, Databases, and Analysis Methods
le. Unavailable test infonnation for estimating probability of leakage. This conditionresults in the data point not being used in the probability and leak rate correlation. Anexample of this situation is a number of tube specimens for which no leak rate testswere performed and the specimens exhibit short throughwall crack lengths (less than0.1 ") for which experience shows they do not leak. An additional example is aspecimen with no leak test and no destructive exam data to estimate whether or notthe indication would leak at SLB conditions.
Criterion 2. Morphology Related Criteria
These criteria identify atypical degradation that if incorporated into the database wouldinappropriately bias the correlations over the range of interest. Pulled tube specimens with thisatypical degradation do not invalidate the application of the correlations to the plants from whichthe tubes were pulled. The specific criteria are as follows:
2a. Atypical degradation ligament morphology. This condition results in the data notbeing used in any of the three correlations. The morphology for exclusion is definedto be degradation with less then or equal to 2 ligaments within the macrocrack and themaximum corrosion depth is less than 60%. This criterion is to be appliedirregardless of the magnitude of the burst pressure (i.e., such as a high burst pressure)associated with the indication. Experience indicates that this degradation results intubes exhibiting relative high bobbin voltages but maintaining relatively high burstpressures close to that of undegraded tubing. Such degradation is atypical of thedominant ODSCC degradation in the database for which the ARC correlations aredeveloped and would be considered an inappropriate bias to the correlation ifincorporated into the database. The correlation uncertainty distribution is associatedwith random effects (e.g., due to non-quantifiable changes in the degradationmorphology) about the correlation mean. However, data for atypical degradationexhibits a non random effect that is physically definable and different from thedominant ODSCC morphology.
Removal of data under this criterion from the correlation's database results in aconservative shift of, for example, the mean of the burst correlation. Since theremoved data are positioned in the tail of the correlation's uncertainty distribution,their removal from the database may decrease the distribution's variance. This effectis acceptable because scientific argument does not suggest that the existence of thesedata located on one side of the uncertainty distribution dictates an equal probability ofsome type of effect on the other side of the distribution.
2b. Severe degradation. This condition results in the data point not being used in any ofthe correlations. The condition is defined to be a data point that has a voltagemeasurement more than 20 volts higher than the next adjacent point located at thehigh voltage boundary of the data. Note that this criterion applies only to one side ofthe correlation, specifically to the high voltage region of the correlation. Such data isfar removed from the voltage range of interest over which the correlation is applied. Itis not appropriate to allow one data point, which represents an extreme form of
9-8

EPRI Proprietary Licensed Material
NRC Approved Revisions to ARC Program, Databases, and Analysis Methods
degradation compared to the majority of the data, to have a significant influence onthe linear regression correlation. If additional data is obtained in this very highvoltage region, such that there is a more uniform distribution of data in this extremevoltage region, review of all data will be performed with consideration ofincorporating data previously filtered from the correlation by this criterion. Exclusionof such data has a varied effect on the correlation mean. Its effect is dependent on thevoltage range of interest. Removal of the data point could for example, addconservatism in the high voltage region from which the data is excluded, with areduction in conservatism in the low voltage region because of the linear nature of theregression.
Criterion 3. Probable Test Error in Leakage Measurement
Criterion 3 is intended to exclude leakage measurements exhibiting extreme behavior, such as avery low measurement, although the specific cause for the probable test measurement errorcannot be identified. In the performance of leak tests, the crack can become plugged by depositsresulting in abnormally low leak rates or a measurement error (e.g., piping leakage betweenspecimen and leakage collection tank, collection time error, etc.) could occur. For these cases,the cause for the measurement error is not as apparent as for Category I and the test results mustbe evaluated for probable errors. It is not appropriate to include the spread in leak rates resultingfrom plugging of cracks during leak tests in the leak rate correlation and each leak ratemeasurement should be evaluated against Criterion 3 before including the data in the database.Criterion 3a provides for excluding SLB leak rates much lower than expected for the throughwallcrack length found by destructive examination.
3a. Probable Test Error in Leakage Measurements. Data with throughwall crack lengthmeasurements are excluded from the leak rate correlation if the measured leak rate isbelow the lower, one-sided 99% prediction interval from regression analyses forcorrelations of both SLB leak rate versus corrosion throughwall length and SLB leakrate versus bobbin voltage as obtained without including the suspect data point in theregression analysis. For application of this criterion, the throughwall crack lengthmust have no remaining uncorroded ligaments over the throughwall length.Uncorroded ligaments, if present, could contribute to the lower than expected leakrate.
Basis for Criterion 3a
The potential for plugging of a crack due to deposits in a leak rate test has existed and willcontinue to exist in leak rate measurements. Prototypic borated primary water, as used in theearlier database tests, is being eliminated in future tests to reduce the potential for deposits in thecracks. Indications that have extremely low leakage, based on quantified lower 99% predictionintervals on the voltage correlation for leak rates are candidates for further evaluation. The leakrate versus voltage correlation, by itself, does not adequately identify probable deposits affectingthe leak rate since the voltage could be influenced by crack morphologies or distortions in thebobbin response. Thus, when crack length measurements are available from destructiveexamination of the specimen, the indication must be a low outlier on both the voltage and the
9-9
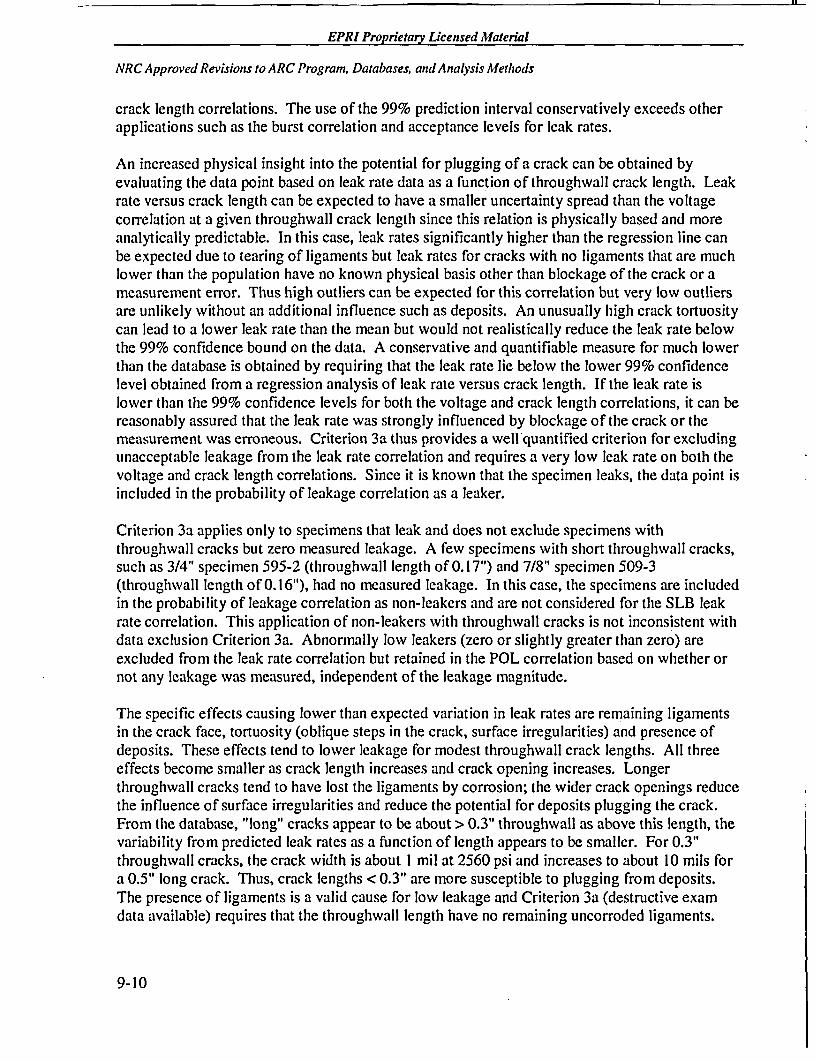
I I l
EPRI Proprietary Licensed Material
NRC Approved Revisions to ARC Program, Databases, and Analysis Methods
crack length correlations. The use of the 99% prediction interval conservatively exceeds otherapplications such as the burst correlation and acceptance levels for leak rates.
An increased physical insight into the potential for plugging of a crack can be obtained byevaluating the data point based on leak rate data as a function of throughwall crack length. Leakrate versus crack length can be expected to have a smaller uncertainty spread than the voltagecorrelation at a given throughwall crack length since this relation is physically based and moreanalytically predictable. In this case, leak rates significantly higher than the regression line canbe expected due to tearing of ligaments but leak rates for cracks with no ligaments that are muchlower than the population have no known physical basis other than blockage of the crack or ameasurement error. Thus high outliers can be expected for this correlation but very low outliersare unlikely without an additional influence such as deposits. An unusually high crack tortuositycan lead to a lower leak rate than the mean but would not realistically reduce the leak rate belowthe 99% confidence bound on the data. A conservative and quantifiable measure for much lowerthan the database is obtained by requiring that the leak rate lie below the lower 99% confidencelevel obtained from a regression analysis of leak rate versus crack length. If the leak rate islower than the 99% confidence levels for both the voltage and crack length correlations, it can bereasonably assured that the leak rate was strongly influenced by blockage of the crack or themeasurement was erroneous. Criterion 3a thus provides a well quantified criterion for excludingunacceptable leakage from the leak rate correlation and requires a very low leak rate on both thevoltage and crack length correlations. Since it is known that the specimen leaks, the data point isincluded in the probability of leakage correlation as a leaker.
Criterion 3a applies only to specimens that leak and does not exclude specimens withthroughwall cracks but zero measured leakage. A few specimens with short throughwall cracks,such as 3/4" specimen 595-2 (throughwall length of 0. 17") and 7/8" specimen 509-3(throughwall length of 0. 16"), had no measured leakage. In this case, the specimens are includedin the probability of leakage correlation as non-leakers and are not considered for the SLB leakrate correlation. This application of non-leakers with throughwall cracks is not inconsistent withdata exclusion Criterion 3a. Abnormally low leakers (zero or slightly greater than zero) areexcluded from the leak rate correlation but retained in the POL correlation based on whether ornot any leakage was measured, independent of the leakage magnitude.
The specific effects causing lower than expected variation in leak rates are remaining ligamentsin the crack face, tortuosity (oblique steps in the crack, surface irregularities) and presence ofdeposits. These effects tend to lower leakage for modest throughwall crack lengths. All threeeffects become smaller as crack length increases and crack opening increases. Longerthroughwall cracks tend to have lost the ligaments by corrosion; the wider crack openings reducethe influence of surface irregularities and reduce the potential for deposits plugging the crack.From the database, "long" cracks appear to be about > 0.3" throughwall as above this length, thevariability from predicted leak rates as a function of length appears to be smaller. For 0.3"throughwall cracks, the crack width is about I mil at 2560 psi and increases to about 10 mils fora 0.5" long crack. Thus, crack lengths < 0.3" are more susceptible to plugging from deposits.The presence of ligaments is a valid cause for low leakage and Criterion 3a (destructive examdata available) requires that the throughwall length have no remaining uncorroded ligaments.
9-10
EPRI Proprietary Licensed Material
NRCApproved Revisions to ARC Program, Databases, and Analysis Methods
9.4 Exclusion of the French Data from the ARC Database
In the initial evaluation of the French data in Addendum 1, it was recommended that the Frenchdata not be included in the ARC database due to significant differences in crack morphology andleakage behavior from the domestic data. The recommendation included a statistical evaluationthat concluded that the French data had a low likelihood of being from the same population asthe balance of the EPRI database. In Reference 9-13, the NRC staff commented that they did notconcur that there was conclusive physical evidence to demonstrate that the French data should beseparated from domestic plant data, hence, the remaining statistical analyses alone did notprovide a basis for excluding the French data. Addendum 4 proposed a new data exclusionCriterion 2c for atypical deep crack degradation morphology that also led to a recommendationto exclude the French data. Additional physical evidence and updated statistical evaluationssupporting exclusion of the French data were provided to the NRC (References 9-14 and 9-15) inresponse to the requests for additional information. The NRC then approved exclusion of theFrench data from the ARC database in Reference 9-16 although exclusion Criterion 2c was notapproved. The industry submittal of Reference 9-15 and the NRC approval of Reference 9-16require that each ARC database addendum update provide confirmatory analyses to demonstratethat the French data remain statistically and physically different from the domestic data.
The specific industry commitments for updating the assessments of the French data are:
The statistical analysis for Comparison 2 of Table 9-3 (Table I of Reference 9-15) will beupdated for each new addenda for the ARC database in NP-7480-L.
If the probability, Pr(F Statistic) in Table 9-3 that the null hypothesis for common regressionlines (model 4) is true increases to 5% (the current value is 0.4%), the statistical analyses forTables 9-3 and 9-4 (Table 5 of Reference 9-15) addressing both the burst and POL correlationswill be updated.
If the burst correlation probability increases to 5% and the POL correlation test statistic (e.g.,0.54 in Table 9-4) decreases to less than or equal to the critical value at the 5% level ofsignificance (e.g., 0.25 in Table 9-4), the EdF data would be included in the burst, POL and leakrate correlations issued for the new addenda. The EdF data would not be included in thecorrelations unless supported by the statistical analyses for both the burst pressure correlationand the POL correlation.
The required updates to the statistical analysis, including Tables 9-3 and 9-4, in the RAI responseof Reference 9-15 are included in Section 6 of this addendum.
9.5 Revisions to Leak Rate Analysis Methods
One clarification of the GL 95-05 p-value requirements and one change to the leak rate analyseshave been approved by the NRC.
In Reference 9-17, industry representatives recommended that the GL 95-05 requirement for a95% confidence interval on the p-value for the slope parameter of the leak rate correlation be
9-11

- _ _ - I I
EPRI Proprietary Licensed Material
NRCApproved Revisions to ARC Program, Databases, and Analysis Methods
clarified to apply as a one-sided confidence level. At the Reference 9-17 meeting and byReference 9-2, the NRC concurred that the one-sided p-test for the leak rate correlation isappropriate. This approval permits the leak rate correlation with voltage to be applied when theone side p-value for the correlation slope parameter is less than 5%.
By Reference 9-18, the NRC approved an updated method for accounting for the p-value inMonte Carlo leak rate calculations as submitted in Reference 9-19. This method determineswhether a correlation should be applied during each Monte Carlo simulation of the generator.After simulating a potential value for the population slope, the value defines the leak ratecorrelation to be applied. If the population slope is less than or equal to zero, then no correlationis assumed and the simulation of the leak rate is based on the mean and standard deviation of theleak rate data. If the population slope is greater than zero, the correlation is applicable and theleak rate is based on the regression line slope and intercept. This analysis method is required tobe implemented in all ARC leak rate analyses after September 23, 2002.
9.6 References
9-1 Letter from R. Clive Callaway (NEI) to Mr. Edmund J. Sullivan (NRC), "SteamGenerator Degradation Specific Management Tube Pull Database Addendum andProtocol (Project No. 689)", dated October 28, 1997
9-2 Letter from Mr. Edmund J. Sullivan (NRC) to David J. Modeen (NEI), "EPRI Report:Steam Generator Tubing Outside Diameter Stress Corrosion Cracking at Tube SupportPlates Database for Alternate Repair Limits, NP-7480-L, Addendum 1, November 1996",dated January 20, 1998
9-3 Letter from David J. Modeen (NEI) to Gus C. Lainas (NRC), "Steam GeneratorDegradation Specific Management Tube (SGDSM) Database Protocol (Project No.689)", dated January 15, 1997
9-4 Letter from Brian W. Sheron (NRC) to D. Modeen (NEI), dated April 10, 1997
9-5 Letter from Jack Strosnider (NRC) to D. Modeen (NEI), "Industry Recommended SteamGenerator Tube Pull Program," dated January 31, 2000
9-6 Letter from David J. Modeen to Document Control Desk, USNRC, Project Number 689,"Steam Generator Degradation Specific Management Database, Addendum 3", June 2,2000
9-7 Letter from David A. Steininger, EPRI, to Jack Strosnider, NRC, "Exclusion of Datafrom Alternate Repair Criteria (ARC) Databases Associated with 7/8 Inch TubingExhibiting ODSCC", April 22, 1994
9-8 Letter from David J. Modeen (NEI) to Brian Sheron (NRC), June 9, 1994
9-12

EPRI Proprietary Licensed Material
NRCApproved Revisions to ARC Program, Databases, and Analysis Methods
9-9 EPRI Report NPL-7480-L, Volume 2, Revision 1, "Steam Generator Tubing OutsideDiameter Stress Corrosion Cracking at Tube Support Plates Database for AlternateRepair Limits, Volume 2: 3/4 Inch Diameter Tubing", August 1996
9-10 NRC letter from Thomas H. Essig to David J. Modeen (NEI), "EPRI Report: ProposedData Exclusion Criteria and Adjustments to Measure Leak Rate for Tube R28C41 (PlantS), February 26, 1996
9-11 NRC letter from Gus C. Lainas to David J. Modeen (NEI), "Evaluation of ProposedUpdate to SGDSM Database and Modifications to the Methodology to Assess SteamGenerator Tubing Outside Diameter Stress Corrosion Cracking", November 20, 1998
9-12 NRC Letter, "Request for Additional Information Regarding NP 7480-L, Addendum 1,'Steam Generator Tubing Outside Diameter Stress Corrosion Cracking at Tube SupportPlates, Database for Alternate Repair Limits,' 1996 Database Update, November 1996,"S. L. Magruder (NRC) to D. Modeen (NEI), January 24, 1997.
9-13 NRC letter to David J. Modeen, NEI, "EPRI Report: Steam Generator Tubing OutsideDiameter Stress Corrosion Cracking at Tube Support Plates - Database for AlternateRepair Limits, NP-7480-L, Addendum 1, November 1996", January 20, 1998
9-14 NEI letter from A. Marion to Brian W. Sheron, "Exclusion of French Data from theSteam Generator Degradation specific Management Database (Generic Letter 95-05),July 25, 2002
9-15 NEI letter from A. Marion to Brian W. Sheron, "Exclusion of French Data from theSteam Generator Degradation specific Management Database (Generic Letter 95-05),October 4, 2002
9-16 NRC letter from William H. Bateman to Alexander Marion, "Exclusion of French Datafrom the Steam Generator Degradation Specific Management Database", October 8, 2002
9-17 Public meeting between industry and NRC staff representatives on the subject ofstatistical methods for the regression analysis of ARC data (December 3, 1997)
9-18 NRC letter from William H. Bateman to Alex Marion (NEI), "Refining the Leak RateSampling Methodology for Generic Letter 95-05 Voltage-Based Alternate Repair CriteriaApplication", March 27, 2002
9-19 NEI letter from A. Marion to Brian W. Sheron (NRC), "Refining the Leak Rate SamplingMethodology for ODSCC ARC Applications (Generic Letter 95-05)", March 15, 2002
9-13

I M1_
EPRI Proprietary Licensed Mtaterial
NRC Approved Revisions to ARC Program, Databases, and Analysis AMethods
Table 9-1NRC/Industry SGDSM Database Protocol
1. The pulled tube database will be updated each March to add additional data from the prior calendaryear for steam generator tubes which have been burst, leak, and metallurgically tested, asnecessary. This updated database will include updated correlations and a list of plants whichprovided pulled tube data (including the number of intersections).
2. Utilities with spring outages commencing prior to June 1 will have the option of using the latestdatabase and correlations submitted as an information copy to the NRC (by the end of March) or theprior version of the database and correlations, providing there is not a significant, non-conservativeshift in the correlations submitted as an information copy to the NRC (by the end of March) or theprior version of the database and correlations, providing there is not a significant, non-conservativeshift in the correlations as discussed in item 5 below. This approach is necessary to ensure sufficienttime is available to finalize plant-specific procedures and conduct analyst training prior to the outage.
3. Utilities may request NRC approval of modifications to the database and correlations in accordancewith the guidance contained in Generic Letter (GL) 95-05. Examples which would require specificapproval include questionable data, application of revised exclusion criteria, or use of a revisedprobability of detection. The annual update of the correlations discussed in item 1 above will occurregardless of specific requests for NRC approval of changes to the database or correlations. Ifspecific approval of modifications to the database or correlations is requested from the NRC staff, themodifications will not be used until the NRC approves the correlations.
4. Data may be excluded as appropriate under the approved exclusion criteria referenced in GL 95-05.Exclusion of data will be reported in the individual utility 90-day reports and in the pull tube database.
5. If any domestic, pulled tube data fall outside the 95% prediction interval using the latest, approvedcorrelations, the data will be identified to the NRC staff in accordance with Generic Letter (GL) 95-05by the appropriate utility in the required 90 day report. If the inclusion of the new data results in anon-conservative and significant shift in the correlation predictions, industry representatives willdiscuss potential database changes with the NRC staff and/or issue a new database and associatedcorrelations. If a revision to the correlations is required, the NRC will be notified, and it will be issuedand effective within three (3) months of submittal of the 90 day report.A nonconservative shift in the correlations is one that results in a lowering of the structural limit,thereby increasing the probability of burst, or an increase in the probability of leak as a function ofbobbin amplitude (voltage) associated with an ODSCC indication, or an increase in the predicted leakrate as a function of indication voltage.Significant is a term relative to the approved limits of operation and that involves the application ofgood engineering practice. For example, if the overall probability of burst increases from 1-104 to2.104,, while the absolute change is 100% of the original value, the change relative to the GL 95-05reporting threshold is inconsequential and would not be considered significant if it was suspected thatan order of magnitude change in the value associated with indications at a plant previouslydetermined to have an ed of cycle (EOC) probability on the order of 1*1 Q.3 could result in thecalculated probability of burst exceeding the GL 95-05 limit. The term significant relative to leakage(i.e., probability of leak and leak rate correlations) should be viewed in a similar manner as discussedabove for burst pressure. Because the requirements for EOC leakage are plant specific,consideration should be given to the relative margin between the plant specific calculated leak rateand the leak rate limit.Significant is also to be interpreted relative to the change histories of the correlations. If the changeassociated with the inclusion of a new data set is on the order of twice that of the largest changeassociated with a previous data set with a like number of indications, the inclusion of the additionaldata will be considered to be significant.
9-14

EPRI Proprietary Licensed Material
NRC Approved Revisions to ARC Program, Databases, and Analysis Methods
Table 9-2Summary of Current (October 2002) Number and Target Number for Pulled TubeIntersections with Leakage - Excludes French Data
Total No. of TSP Current and Additional Target Number ofVoltage Intersections Indications with Leakage CommentsRange 3/4" Tubing . 7/8" Tubing
3/4" 7/8" Current Additional Current AdditionalTubing Tubing No. Target No. Target No.
Leakers No. Leakers Leakersl___ Leakers
9-15

EPRI Proprietary Licensed Material
NRC Approved Revisions to ARC Program, Databases, and Analysis Methods
Table 9-3Results of Comparisons of Burst Pressure Regression Analysis Models Copy of Table 1 ofReference 9-15
Comparison Parameter Comparison I Comparison 2 Comparison 3Description 1996 2002 1996 | 2002 1996 | 2002
9-16

EPRI Proprietaty Licensed Material
NRC Approved Revisions to ARC Program, Databases, and Analysis Methods
Table 9-4Kolmogorov-Smimov Test of Equality of EdF and US POL Data Distributions Copy of Table5 of Reference 9-15
EdF Bobbin Sample US Calc Absolute TestAmplitude Rank Cum. Dist. Cum. Dist. Value Statistic Critical D
(Volts) S(x) F(x) [S(x) - F(x)] (Dn=Sup (x)) @ .05
A
9-17

EPRI Proprietary Licensed Material
10PRIOR INDUSTRY RECOMMENDED UPDATES TO ARCANALYSIS METHODS AND DATA APPLICATIONS
This section provides industry recommended updates to ARC analysis methods and dataapplications. These recommendations provide details to analysis methods below the levelrequiring NRC approval. The methods updates include determination of bobbin voltages forindications detected only by RPC inspection, NDE techniques for cross calibration of ASMEstandards, voltage dependent growth rates and growth rates for deplugged tubes.
For this Addendum 6, the entire Section 10.3 of Addendum 5 for voltage dependent growth ratemethods has been revised. The revised methods are applied to divide the growth rate data intovoltage bins based on statistical methods to define the break points between voltage bins. SinceGL 95-05 requires an assessment for voltage dependent growth, NRC approval is not required toapply voltage dependent growth analyses for the reference ARC analyses in operationalassessments when voltage dependence is indicated by the growth rate data. The voltagedependent growth methods of Section 10.3 were submitted to the NRC for information by NEIon June 2, 2004. In most applications without preventative plugging, it is expected that the useof voltage dependent growth rates will lead to more conservative predictions of SLB burstprobability and leakage.
10.1 Determination of Bobbin Voltages for Indications Detected Only byRPC Inspection
10.1.1 Background
GL 95-05 requires repair of ODSCC indications found by RPC (or equivalent probe such as+ Point) as a result of inspecting intersections for copper deposits, dents greater than 5 volts,axial ODSCC and PWSCC at the same TSP intersection and large mixed residuals that couldcause a 1.0 volt bobbin signal to be missed or misread. GL 95-05 does not require indicationsfound in dents < 5 volts or mixed residuals that do not mask a 1.0 volt bobbin flaw signal to berepaired. In these cases, the indications have not been detected by the bobbin coil and a bobbinvoltage is not directly available for the indications. In addition to the inspection cases identifiedin GL 95-05, ODSCC indications at TSP intersections may be found as a result of RPCinspections for dents less than 5 volts and as a result of inspecting the TSP intersections for othercauses. The latter could include the use of the TSP intersection as a locating position forinspection of freespan indications. It is desirable to obtain bobbin voltages for these ODSCCRPC indications in order to include the indications in the SLB burst probability and leak rate
10-1
I II
EPRI Proprietary Licensed Material
Prior Industry Recommended Updates to ARC Analysis Methods and Data Applications
analyses and to determine the potential need for tube repair. The need for tube repair could be aresulting bobbin voltage greater than the repair limit or greater than one volt at a mixed residual.
One method for determining bobbin voltages for dents less than about 5 volts is based onidentification of the flaw in a lower frequency channel (increased sensitivity to OD degradation)and reading the mix voltage for the identified flaw. A second means of inferring bobbin voltagesfrom the RPC data is to develop a correlation between bobbin voltage and RPC voltage. Acorrelation can be reasonably expected since both voltages are primarily dependent upon theresponse to the deepest part of the indication.
10.1.2 Bobbin Voltages Obtained from Flaw Identification at Single FrequenciesSuch as 200kHz
The 200 kHz channel, or alternate single frequency such as 400 kHz, can sometimes be used toidentify the flaw when the OD degradation found by RPC inspection cannot be identified in theprime/quarter frequency differential process channel (400/100 kHz for 7/8" tubing and550/130kHz for 3/4" tubing). For many flaws at dents less than 5 volts, the flaw can beidentified by evaluating the 200 kHz channel for a flaw-like response. A peak to peak voltagemeasurement is then made on the flaw-like response at 200 Khz (or alternate single frequency).The flaw segment ("dots" in Lisajous analysis) viewed without reevaluation in the prime/quarterfrequency mix channel is recorded to obtain the reference bobbin voltage for the indication. Theapplication of this technique for determining the mix voltage is limited to dents < 5 volts. Whenthe RPC flaw can be identified for bobbin sizing by this technique at non-dented intersections ormixed residuals, the technique may also be applied for these cases. Indications found in dents >5 volts, indications that have a resulting bobbin voltage greater than the repair limit andindications found in mixed residuals that have a resulting bobbin voltage > 1.0 volt must berepaired.
10.1.3 Bobbin Voltages Inferred from Correlation of Bobbin Voltage to RPCVoltage
A general method for inferring bobbin coil voltages for indications found by RPC inspection butnot identifiable in the bobbin data is based on application of a correlation between bobbin coiland RPC voltages. This method does not depend upon identification of a flaw-like response inthe 200 kHz channel and can be applied for any RPC indication independent of dent size ormixed residual size. However, to maintain consistency with GL 95-05 requirements thatindications found in dents > 5 volts are to be repaired, the applications of this technique areseparated for dents < 5 volts and for dents > 5 volts. GL 95-05 also requires repair ofintersections having both ODSCC and PWSCC indications. A bobbin/RPC voltage correlationcan be applied to obtain a voltage for the ODSCC indication. If an ARC is in place for axialPWSCC, the correlation could be applied to obtain the bobbin voltage to assess the need for tuberepair based on the repair limits for both degradation mechanisms, but this application wouldrequire NRC approval as an exception to the GL 95-05 requirements. This section describes amethod for obtaining a correlation. A bobbin-to-RPC voltage correlation obtained using data for
10-2

EPRI Proprietary Licensed Material
Prior Industry Recommended Updates to ARC Analysis Methods and Data Applications
a plant with 7/8" tubes is included as an example, although not considered to be a genericcorrelation.
A database containing both bobbin voltage and RPC voltage for ODSCC indications is needed todevelop the desired regression correlation between the bobbin and RPC voltages. Only data pointswith a RPC voltage between about 0.1 to 3 volts are of interest since voltages below about 0.1 voltare difficult to size, thus have a significant uncertainty, and indications above about 3 volts arebeyond the range of interest (i.e., clearly require tube repair). Also, since the data outside the abovevoltage range are relatively sparse, variability in a few data points at the tail of the correlation coulddistort the correlation. Multiple axial indications with more than one deep flaw having significantRPC voltages should also be excluded since such indications could distort the correlation.
The ARC databases for 7/8" and 3/4" tubes were examined for developing generic bobbin-to-RPC voltage correlations for 7/8" and 3/4" plants. RPC voltages are available for only about50% of the tube specimens in both these databases, and among those tube specimens, only 50%of the RPC voltages fall within the range of interest (0.1 to 3 volts). Hence, only about 25% ofthe data in the ARC database may be used to develop a correlation between bobbin coil and RPCvoltages, and such a database is considered too small to yield a reliable correlation. Therefore, atpresent it is not feasible to develop generic bobbin-to-RPC voltage correlations for 7/8" and 3/4"tube plants. However, historical data from EOC steam generator inspections may be used todevelop a plant-specific correlation. Development of a correlation between bobbin and RPCvoltages based on plant operational data is described below.
Description of a Prior Plant-Specific Analysis
Historical data from a plant with 7/8" diameter tubes were used to develop a correlation betweenthe bobbin and RPC voltages. The RPC voltage data considered were obtained from 80 milpancake coil probes. It is expected that pancake coil voltage data would correlate better withbobbin voltage data than +Point voltage data, although adequate +Point data were not availableat the time this evaluation was performed to confirm this expectation. The method of leastsquares was used to obtain a correlation between the bobbin voltage and RPC voltageamplitudes. Both linear and logarithmic forms of the variables were considered to determine theoptimum combination of variables. The bobbin voltage versus RPC voltage data were plottedconsidering all four possible combinations of variable forms, and the data distributions wereexamined. A fifth case wherein the intercept for the linear bobbin to RPC correlation is forced tobe zero was also considered. The data distribution did not suggest outright elimination of any ofthe variable combinations. Therefore, least squares regression analysis was performed for all fiverelationships. In addition, sensitivity analyses were performed for the range of RPC voltsincluded in the correlation.
Table 10-1 provides a summary of the regression results. The square of the correlationcoefficient (r2, also called Index of Determination) and the p-values for the slope parameter inthe regression are shown. The p-value for all five correlations considered are very small and theymeet the 5% criteria recommended in Generic Letter 95-05 for an acceptable correlation. The rvalues in Table 10-I suggest a linear relationship between RPC voltage and bobbin voltage asshown below.
10-3

El
EPRI Proprietary Licensed laterial
Prior Industry Recommended Updates to ARC Analysis Methods and Data Applications
Vb = bo + bi Vr80 , Eq. 10-1
where Vb represents the bobbin amplitude and Vr represents the RPC voltage amplitude.
Analyses were performed to assess the sensitivity of the correlation r2 and the RPC volts at 2bobbin volts to the RPC voltage range used in the correlation. The data of Figure 1 0- 1 suggestthat a range between 0.2 and 2.0 RPC volt might be more appropriate for the correlation than the0. I to 2.0 volts range used. Table 10-2 provides the results of the sensitivity study. It is seen inthe table that r2 does not significantly change for the 0.2 to 2 volt range but is notably reduced forthe smaller RPC voltage intervals with a smaller database. The RPC voltage at 2 bobbin voltsfrom the mean regression line does not change significantly between the correlations. Largerdifferences could be expected when confidence levels are added due to changes in the databasesize, but the mean correlation value at 2 bobbin volts appears to be well defined by thecorrelation. Since there is little difference in the correlation between 0.2 to 2 volts and 0. 1 to 3volts, the latter was used for the correlation to reduce the potential need to extrapolate beyondthe range of the correlation in field applications. The regression relationship along with the dataused in the regression analysis are shown in Figure 10-1.
An analysis of the regression residuals was also performed to check if the assumptions inherentin the least square analysis apply. A plot of the residuals of the bobbin voltage versus the bobbinvoltage obtained using the regression correlation was prepared for each of the 5 relationshipsexamined. The residuals plot should show random scatter without suggesting any type ofcorrelation. The data for all relationships examined show random scatter indicating that acorrelation does not exist between the residuals and the predicted values, and that the variance ofthe residuals is uniform. Figure 10-2 shows the residual scatter plot for the linear relationshipshown in Equation 10-1.
Another implicit assumption in the least square analysis is that the regression residuals arenormally distributed. To confirm the validity of this assumption for each correlation considered,the residuals were sorted in ascending order and then plotted against an ordinate representingcumulative percent value for a variable given by
100 x 2n
where n is the number of data points used in the regression and i is an index ranging from 1 to n.The data should fall approximately on a straight line if the residuals are normally distributed.The residuals for all 5 relationships considered approximate a straight line, thus indicating thatthe assumption of normal distribution for residuals is valid. Figure 10-3 shows the orderedresiduals plot for the linear relationship shown in Equation 10- I.
10-4

EPRI Proprietary Licensed Material
Prior Industry Recommended Updates to ARC Analysis Methods and Data Applications
Uncertainties in the Predicted Bobbin Voltage
The voltage predicted using the correlation described above provides a mean value for thebobbin voltage at a given RPC voltage. Since eddy current inspection and voltage-based repairlimits are based upon the nominal voltage indicated by a bobbin probe, it is appropriate to use themean value predicted with the regression correlation. To account for uncertainties in thepredicted mean value, 95% confidence intervals for the mean were established and the upper95% confidence bound on the mean was used to obtain a conservative bobbin voltage estimate ata given RPC voltage. A one-sided upper 95% confidence bound for the bobbin voltage is alsoshown in Figure 10-1. The difference between the upper, one-sided 95% confidence bound andthe mean vary slightly with the RPC voltage (between 0.1 to 0.4 volt bobbin voltage in the RPCvoltage range 0.2 to 3 volts). The use of the 95% confidence band reduces the RPC voltage thatcorresponds to 2 bobbin volts from 1.51 to 1.38 volts. The RPC voltage at I bobbin volt isreduced from 0.40 to 0.28 volts for the 95% confidence value.
Application of Regression Correlation
The RPC voltage corresponding to 2 volts bobbin voltage at the upper, one-sided 95%confidence bound on the mean can be used to define tube repair requirements as well as thethreshold to determine the need for expansion of the augmented RPC inspection of dentedintersections and mixed residual signals. The use of RPC voltage corresponding to 2 volts bobbinvoltage is appropriate for mixed residuals or dented intersections since it is used to assess thesignificance of the detected indication by comparison with the repair limit. The curve representingthe one-sided 95% confidence bound in Figure 10-1 can be represented by the followingequation.
Vb = 0.77 + 0.82 x V ,,c + 0.06 xV2 Eq. 10-2
where Vb represents the bobbin voltage and V~p represents the RPC voltage. The abovecorrelation is valid for RPC voltages between 0.1 to 3 volts. It is noted that Equation 10-2 ispresented as an example, and it is not recommended as a generic correlation.
The above equation may be used to obtain equivalent RPC voltage at the repair limit. For theexample case presented, the RPC voltage from an 80 mil pancake probe corresponding to 2 voltsmean bobbin voltage is 1.38 volts.
Recommendations
When a correlation between the bobbin and RPC voltages can be developed on a plant-specificbasis, the correlation can be applied to determine the need for tube repair based on the estimatedbobbin voltage (corresponding to a measured RPC voltage). The ODSCC indications detected atdented or mixed residual intersections should be included in the tube integrity evaluationsperformed to support voltage-based repair criteria. A correlation similar to Equation 10-2 canbe used to convert the RPC voltage measured for an ODSCC indication at dented intersections orintersections with large bobbin residual signals into an equivalent bobbin voltage for use in the
10-5
IL-
EPRI Proprietary Licensed Material
Prior Industry Recommended Updates to ARCAnalysis Methods and Data Applications
tube integrity analyses. However, it is necessary to separate the application of the correlation forconsistency with the GL 95-05 requirements on dents as given below:
Application to Dents •5 Volts and Mixed Residuals
* Bobbin voltages are to be inferred from the bobbin to RPC voltage correlation at 95%confidence on the mean correlation.
* Bobbin voltages inferred from RPC volts by application of a correlation are to be included inthe condition monitoring and operational assessments for burst probability and SLB leak ratecalculations.
* Bobbin voltages greater than the ARC repair limit are to be repaired.
* Bobbin voltages greater than or equal to 1.0 volt found in a bobbin coil mixed residual signalare to be repaired.
Application to Dents > 5 Volts
Several indications have been found to date in dents > 5 volts. Bobbin voltages for indicationsfound in dents < 5 volts have been small and have negligible influence on the ARC leak andburst analysis results. When found by RPC in > 5 volt dents, the indications could potentiallyhave larger bobbin voltages since bobbin coil detection of flaws in large dents would be expectedto be significantly poorer than for small dents. Therefore, the application above 5 volts requiresadditional uncertainty considerations in the ARC leak and burst analyses as included in thefollowing requirements for application of a correlation to > 5 volt dents:
* The bobbin to RPC voltage correlation must satisfy a p-value of < 5% for an acceptablecorrelation and bobbin voltages are to be inferred from the correlation at 95% confidence onthe mean correlation.
* If a utility desires to leave ODSCC in service at > 5 volt dents, NRC approval for theapplication of a bobbin to RPC correlation is required since the application above 5 voltdents represents a deviation from GL 95-05.
* Bobbin voltages inferred from RPC volts by application of a correlation are to be included inthe condition monitoring and operational assessments for burst probability and SLB leak ratecalculations. The uncertainty in the bobbin to RPC voltage correlation must be comparedwith the bobbin voltage uncertainties to assess the need for including additional uncertaintiesin the leak and burst analyses.
The requirements for tube repair based on the inferred bobbin voltages would be the same asgiven above for dents < 5 volts although tube repair is currently required by GL 95-05 forindications in dents > 5 volts.
10-6

EPRI Proprietary Licensed Material
Prior Industry Recommended Updates to ARCAnalysis Methods and Data Applications
10.2 NDE Technique for Cross Calibration of ASME Standards to theReference Standard
10.2.1 Background
Methodology for the normalization of EC standards to the reference standard in the ARC database has not been uniquely defined. This led to multiple methods for normalization beingapplied. Experience obtained with many different standards has shown that the differences in thenormalization technique can, in some cases, lead to larger than expected differences in thecalibrated signal amplitudes. This, in turn, may lead to unexpectedly large changes in the growthrate information. This review of calibration methods was initiated based on finding unusuallylarge negative growth rates at one plant.
There have been at least four separate methodologies used for the normalization of thecalibration standards used in the field to the ARC reference standard. The normalization getstransferred from one standard to the next, frequently to two standards removed from thereference standard, but conceivably through four or more generations removed from thereference standard. Ideally any methodology used should be able to be set up on a standard fromany generation and the measured amplitudes should correlate directly to the reference values.Based upon recent experience, this is not necessarily true of all methodologies used. The datahave shown that there is, for some methodologies, a greater than expected dependence of thenormalization of the mix channel upon both the tube and support plate material properties. Thishas led to the evaluation of the various techniques outlined in this report. The techniquesevaluated in this report are:
I. Perform the mix on the new standard and set the prime frequency amplitude for the 20% flat-bottomed holes on the reference (or transfer) standard to the reference (or transfer) standardassigned value. This setting is saved and stored to all channels including the mix. Thevalues for the new standard are then read for both the prime frequency and mix channels.(Method 1)
2. Perform the mix on the reference (or transfer) standard and independently set the primefrequency and mix amplitudes for the 20% flat-bottomed holes on the reference (or transfer)standard to their respective values. The values for the new standard are then read for both theprime frequency and mix channels. (Method 2)
3. Perform the mix on the new standard and independently set the prime frequency and mixamplitudes for the 20% flat-bottomed holes on the reference (or transfer) standard to theirrespective values. The values for the new standard are then read for both the primefrequency and mix channels. (Method 3)
4. Set the prime frequency amplitude for the 20% flat-bottomed holes on the reference (ortransfer) standard to its assigned value. The values for the new standard are then read for theprime frequency. The ratio of the prime frequency amplitude for the new standard to that forthe reference standard is multiplied by the ideal mix amplitude (2.75 Vpp) to get the mixamplitude for the new standard.
10-7

I 1I
EPRI Proprietary Licensed Material
Prior Industry Recommended Updates to ARC Analysis Methods and Data Applications
10.2.2 Theoretical Critique of the Four Methods
As stated previously, any methodology used should be able to be set up on a standard from anygeneration and the measured amplitudes should correlate directly to the reference values. Thisimplies that the normalization technique is performed in a manner which tends to cancel outdifferences in the electrical and magnetic characteristics of both tube and support ring materialused on a standard. In principle, the standard being correlated to the reference standard couldhave a different tube material (for example Inconel 690), or the support plate material coulddiffer in origin (bar versus plate stock), but the correlation back to the reference standard shouldbe successful. With this concept of normalization, the four methods described above can beassessed as follows:
Method 1:
Method 2:
Method 3:
The idea of mixing on the new standard is good. This is where the mix will beperformed in the field. However, the use of only the prime frequency for thenormalization tends to ignore the effect of the variations in the support ringmaterial on the scaling of the mix amplitudes. Because this does not relate themix amplitudes measured to those for the reference standard, there may bevariations in the relationship of the mix on the new standard to the referencestandard.
The idea of mixing on the reference standard ignores the possibility of differencesin the support ring material leading to variations in the measured amplitudes.However, the direct relationship to the mix value on the reference standard shouldminimize the differences.
The idea of mixing on the new standard is good. This, coupled with, the directrelationship to the mix value on the reference standard should lead to the smallestvariations when comparing a new standard to the reference.
Method 4 This method assumes that the mix is unaffected by the materials (tube or supportring) involved, and that the relationship of the amplitude on the prime frequencyon the new standard to that on the reference standard applies equally to the mixchannel. It does, however, tie back to the mix amplitude for the referencestandard. This method is unaffected by differences in mixes and is, therefore, alsounaffected by chaining of transfer amplitudes through generations of standards.
Based upon this brief critique, an expected ranking of the ability of the methods to relate directlyto the reference standard can be developed. It is expected that Method 3 and Method 2 shouldproduce the best results. Methods I and 4 ignore certain variations in material parameters whichcan affect the result. It is expected, based upon a stronger relationship to an ideal mix amplitude,that Method 4 should prove to be better than Method 1.
10.2.3 Experimental Study
After reviewing the transfer values for a large number of standards, it was determined that thelargest variations in data appeared in the population of 0.875" O.D. x 0.050" wall tube standards.
10-8

EPRI Proprietary Licensed Material
Prior Industry Recommended Updates to ARCAnalysis Methods and Data Applications
Ten standards were selected for direct comparison with the master reference standard at theWestinghouse Science and Technology Center. By collecting all of these standards together, anumber of relationships could be developed in terms of the transfer of the amplitude values. Ifthe reference standard is considered to be 'first generation', all of the standards could beevaluated as second generation. Then one of these could be used to transfer the voltages to theothers to make them third generation. This was done until a fourth generation was developed forthe two most promising methods.
The relative quality of the methods was evaluated by setting up on the transfer values for the nthgeneration, as would be done in the field, and then going back to the reference standard andmeasuring the amplitude on the mix channel. The evaluation was done by looking at theoutcome as a percentage deviation from the true value (positive or negative relative to the ARCreference standard). A deviation of zero implies perfect correlation to the reference standard. Inorder to check the material insensitivity of the methods, the standards used include more thanone heat of Inconel 600 tubing, Inconel 690 tubing, multiple heats of bar stock support platematerial, and multiple heats and types of plate stock support plate material. The carbon steel barand plate support material are in the same nominal range of compositions. The sampleinformation can be found in Table 10-3.
10.2.4 Results
The results of the testing are summarized in Table 10-4. As expected, Method 3 and Method 2produced the best results. Method I showed the greatest variability. The variability observedcan be attributed to the variation in tube and support plate material properties. Methods I and 4are the most sensitive to these differences. The average results are graphically illustrated inFigure 10-4. Figure 10-4 is a radial plot where the ten axes represent the ten standards. Thesolid ring denotes zero error relative to the relationship with the reference standard. The pointsplotted represent the average errors for all generations evaluated by any given method. Method 3shows a small positive error while Method 2 shows a small negative error.
10.2.5 Recommendations
It is recommended that Method 3 be applied for ARC applications requiring cross calibration ofASME standards to the reference laboratory standard. Method 3 provides for direct crosscalibration of the mix amplitudes from the reference or transfer standard to the new standardbeing calibrated. The mix is established on the new standard for this method. This methodshould be applied to obtain the cross calibrated standards for all ARC inspections beginning inthe fall of 1998.
For existing standards to be used in future ARC inspections, it is further recommended that thevalues for standards normalized using Methods I and 4 be re-evaluated using Method 3.Standards normalized using Method 2 need not be re-evaluated since the difference from Method3 is negligible and re-evaluation is not warranted.
10-9

.I 1
EPRI Proprietary Licensed Material
Prior hidustry Recommended Updates to ARCAnalysis Methrods and Data Applications
The re-normalization of standards previously normalized using Methods I and 4 could affectgrowth rate information for ARC plants. It is recognized that there may be a change in thegrowth rates if the re-normalized standards/data are used. If a plant has been consistently usingstandards normalized by a single method, the historical growth data would be reliable since thegrowth rate information would have all been gathered using a single type of normalization. Ifthe voltage normalization method changed between inspections, growth rates could be influencedby the change in calibration methods. In this case, growth rates should be adjusted to obtain aconsistent normalization method between the two inspections used to develop the growth rateunless it can be demonstrated that the growth data are conservatively high. Since the ARCanalyses use only the last two cycles of growth data (including the current cycle to the nextinspection), data for only the last two completed inspections would need to be reviewed. It isrecommended that an evaluation be made as to whether or not the re-normalization needs to beperformed for growth rates and that the conclusions be documented.
The effects of the different normalization methods on absolute voltages are within about onestandard deviation (13%) or less of the NDE uncertainty. Consequently, there is no need toreview non-growth rate related data for voltage indications. For example, pulled tube indicationsincluded in the ARC database do not have to be re-evaluated.
10.3 Voltage Dependent Growth Rate Methods
This section is a complete revision to Section 10.3 of Addendum 5 for voltage dependent growthrate methods. The revised methods are applied to divide the growth rate data into voltage binsbased on statistical methods to define the break points between voltage bins. Since GL 95-05requires an assessment for voltage dependent growth, NRC approval is not required to applyvoltage dependent growth analyses for the reference ARC analyses in operational assessmentswhen voltage dependence is indicated by the growth rate data. The voltage dependent growthmethods of this section were submitted to the NRC for information by NEI on June 2, 2004. Inmost applications without preventative plugging, it is expected that the use of voltage dependentgrowth rates will lead to more conservative predictions of SLB burst probability and leakage.Significant voltage dependent growth has been identified in two plants with 7/8" tubing and a 2volt repair criteria. It is recommended that the revised methodology described in this section beapplied only after confirming voltage-dependent growth trends for a plant. Plants with two voltrepair criteria should continue to monitor growth data for a BOC voltage dependence.
10.3.1 Introduction
The voltage dependent growth (VDG) methods in the previous ARC database addenda weredeveloped from Braidwood and Byron experiences and were assumed to be necessary only withthe application of a 3 volt ARC limit. The Diablo Canyon Unit 2 (DCPP2) experience in 2003demonstrated that voltage dependent growth could become significant for repair limits of 2 volts.As a part of Pacific Gas and Electric's (PG&E) efforts in support of the DCPP2 OperationalAssessment (OA), methods were developed for applying VDG based on a statistical analysis todefine the number and voltage values for the break points between voltage growth bins. Thisreport provides for incorporation of the methods developed for PG&E in the ARC database.
10-10
EPRI Proprietary Licensed Material
Prior Industry Recommended Updates to ARC Analysis Methods and Data Applications
The information presented in this report was prepared to document the development of amethodology for the determination of break points to be used for the application of voltagedependent growth in performing ODSCC ARC evaluations of SG tube degradation. The resultsfrom this effort were presented to the NRC staff on behalf of PG&E regarding the evaluation ofindications in the SGs at DCPP2 in 2003. The results of the development are believed to begenerically applicable when the use of VDG is appropriate, hence, the inclusion of theinformation in the EPRI database for ODSCC ARC applications. Although the analysis resultscan be useful in examining the data for changes that would be indicative of VDG, thedevelopment of criteria for making that determination was not within the work scope for thepreparation of this report. An Excel™m workbook for performing the VDG analyses was providedto EPRI with this report. Although the workbook was checked for correctness, it was notsubjected to the effort necessary to be considered verified and validated to the extent that it couldbe directly placed under configuration control, nor were built-in safeguards included to preventits misuse.
The application of growth rates to predict end-of-cycle (EOC) voltage distributions frombeginning-of-cycle (BOC) amplitude distributions for the evaluation of outside diameter stresscorrosion cracking (ODSCC) of steam generator (SG) tubes is described in Reference 10-1. It isrecognized therein that the growth rate of the degradation may depend on the current size of theindication, i.e., the growth of an indication during one cycle of operation can depend on the sizeor amplitude at the beginning of the cycle. Utilities employing alternate repair criteria (ARC) forthe disposition of ODSCC indications at tube intersections with drilled tube support plate (TSP)holes in Westinghouse SGs are advised to be alert for the appearance of voltage dependentgrowth (VDG). It is further recommended that use of VDG techniques be considered in theMonte Carlo analyses performed to predict distributions of indications that may be present at theend of the next operating cycle. It can be formally demonstrated that all growth measured interms of bobbin amplitude must be voltage dependent, however, the level of that dependence hasusually been small and could be neglected without introducing meaningful errors in theprediction of end-of-cycle bobbin amplitudes.
The Monte Carlo simulation of the growth of tube degradation indications is accomplished byrandomly sampling the empirical distribution function (EDF) of the observed growth rates fromprevious operating periods where guidelines for the analysis are provided in Reference 10-2. IfVDG is suspected, the data may be separated to form an EDF for low voltage indications and oneor more independent EDFs for higher voltage indications. The historical practice was for anengineer familiar with the ODSCC ARC analysis to make a judgment from an examination ofthe data as to where the demarcation or break points should be located to segregate the voltagegrowth regions. The following information describes a mathematical method that can be appliedto determine where the break point locations should be determined based on an evaluation of thedata being analyzed. This allows for the growth data to be segregated or separated into bins,"binned," according to a mathematical indicator of where the growth rates are exhibitingmeaningful change.
The concept of establishing the break points is based on approximating a curve using linearsegments. No break points are needed if the data do not exhibit significant curvature, meaningthat VDG is not apparent. Once VDG is apparent in the population, the break points are
10-lo
I 11 I
EPRI Proprietary Licensed Material
Prior Industry Recommended Updates to ARCAnalysis Methods and Data Applications
determined to result in linear segments that best fit the curve. As the size of the populationincreases and ages, VDG is expected to occur and fitting of the data using a curve would beappropriate if the fitted curve was being simulated in the analysis. Since a curve is not beingfitted, i.e., the empirical distribution function (EDF) of the growth data is being used in the SGanalysis, it is appropriate to identify break points where separate EDFs would be developed toaccommodate changes that are implied by the data exhibiting significant curvature. Thus, thebreak points would be expected to move according to the strength of the VDG as indicated bythe curvature of the instantaneous mean of the data as a function of voltage. The break points arefound by minimizing the sum-of-squares of the errors of the data from the predictions from thepiecewise linear function fitted to the data. The lowest break point would not be expected to shiftsignificantly since the population curvature in the lower volts range would likely be consistentfrom one outage to the next. The upper break point or points could be expected to be relativelyinsensitive with time if the overall shape of the growth data remains constant. A change in thebreak point values and the number of break points could be expected with an increase in theamplitude of indications being retained in service.
Analyses were performed of tube ODSCC growth data for SG 2-4 at DCPP2 to identifyappropriate break points for the performance of the operational assessment for the SG tubes,Reference 10-3. The analyses resulted in the identification of appropriate break points for theperformance of EOC predictions for Cycle 12. The rationale for the method is to minimize thesum-of-squares of prediction errors (SSE) from multiple linear regression relations of the growthdata by adjusting the locations where one regression line would terminate and another regressionline would begin. It is emphasized that the method is not for the purpose of developing voltagegrowth regression relations for use in operational assessments (that is done by sampling theEDFs), but only to identify those voltage locations where the results from an analysis of the dataindicate a change in the relation, i.e., a change in the intercept and slope of the regression lines.The relationship is characterized as being bilinear if two linear relations are used to describe thedata. The concept can be extended to consider descriptions of data which would be characterizedas trilinear and quadrilinear for two and three break points respectively. An ExcelTV workbookused for the analysis will analyze data for up to three break points.
10.3.2 Piecewise Linear Regression Analysis
The concept of piecewise linear regression analysis follows from the concept of the use of"dummy" variables in multiple regression analysis, Reference 10-4 for example. The purpose ofthe analysis is to depict relations where the dependent variable (EOC amplitude) follows aparticular linear relation up to some specific value of the independent variable (BOC amplitude)and a different linear relation beyond that value. An example of a bilinear dependence relation isillustrated on Figure 10-5. To the left of the break point, i.e., the discontinuity between lineslopes, the linear relation follows one intercept and slope combination and to the right of thebreak point it follows a different combination of intercept and slope, where both relationsintersect at that particular point. A trilinear regression relation is illustrated on Figure 10-6 and aquadrilinear regression relation is illustrated on Figure 10-7. Each of these are discussed in thefollowing sections relative to the analysis of the DCPP 2 data as an example, but themethodology is equally applicable to the data from any plant.
10-12

EPRI Proprietary iUcensed Material
Prior Industry Recommended Updates to ARC Analysis Methods and Data Applications
10.3.3 Discussion of Growth Plotting
The bobbin amplitude growth data are usually plotted on the ordinate axis of a scatter chart so asto indicate a dependence, or lack thereof, on the BOC voltage which is plotted on the abscissa.Thus, a linear 1 st order correlating relationship would be represented as,
AV = V2 -V, = bo +b1V1, Linear Growvth Eq. 10-3
where bo and b1 are coefficients to be obtained from a regression analysis of the data. Acorrelation of the growth relative to the initial voltage must exist because the initial voltage, VI,appears on both sides of the equation. Rearranging, it is seen that the relation being examined byEquation 10-3 is,
V2 = bo + (b1 + 1)V1 . Eq. 10-4
The measured value of the initial and final voltages are VI and V2, where both are subject tomeasurement error, so,
V,= V, + £,where E - N(0, tV 0 1 ). Measured Voltage Eq. 10-5
That is, the error of measurement is a constant fraction of the magnitude being measured. Themeasurement error consists of two parts, the error associated with the eddy current probe wearand the error associated with the eddy current analyst recording of the amplitude of theindication.
A rearrangement of the equations is provided in the following to provide a visualization of thefact that there is the potential for negative slopes to be observed from the analysis of the data. IfV2 were plotted on the ordinate axis the regression relation would be of the form,
V2 = g 0 + g 1 V1 , Eq. 10-6
where the regression coefficients are represented by go and gi to avoid confusion. Then therelation for the growth becomes,
AV = V2-VI = g 0 + (g1 -1)V1 Eq. 10-7
Thus, it is readily apparent that the slope term in Equation 10-3 could become negative. Theappearance of slightly negative slope terms for the first line segment from the regression analysisshould not be interpreted as indicative that an error has occurred.
10-13

I it
EPRI Proprietary Licensed Material
Prior Industry Recommended Updates to ARC Analysis Methods and Data Applications
10.3.4 Analysis
For the example data considered, the analysis of the growth data to determine break points issomewhat insensitive to the locations determined for the break points, i.e., the optimizedvariable, the sum of squares of the regression errors, does not change much with small changesin the location of the break point. This means that the past practice of using engineeringjudgment did not likely result in significant contributions to the overall uncertainty of theanalysis results. The following sections describe considerations made to process the growth dataand the types of analyses that can be performed. Three levels of piecewise linear regression wereconsidered for the DCPP data sets, bilinear, trilinear, and quadrilinear. The results for thequadrilinear fits did not aid in understanding the data and are not recommended for the initialanalyses of VDG. Conclusions are provided at the end of this section.
10.3.4.1 Upper Range Number of Data
One of the considerations that has been made regarding growth rates since the inception of VDGconcepts has been with regard to the number of indications binned into the upper range of thedata. The determination of the break point can be significantly skewed by one or two indicationsif the number of indications is too few. For example, there was one extremely high growth valueassociated with the data of DCPP SG 2-4. A break point at the extreme indication will becalculated if the analysis algorithm does not restrict the number of indications in the upper rangeto some minimum value. This is because the square of the error of prediction for that indicationis much larger than for the other indications, causing it to exert undue leverage on theestablishment of the break point. The minimum number of data for the upper range wasestablished to be fifteen based on engineering judgment. If the number is chosen too small, theinfluence of a single large indication could bias the results of the analysis to always converge tothe minimum allowable. The experience with using the number fifteen has been that the analysisgenerally converges to leaving a larger number, than fifteen, of indications in the upper bin. Thisis evident by the results illustrated on the figures accompanying the following discussions forpiecewise linear regression analysis. It is also noted that the single largest growth value, whichwas much larger than the remaining growth data, was omitted from consideration for theseanalyses. Inclusion would have the effect of always making the solution converge to the binlimitation instead of a true or more intuitively correct solution.
10.3.4.2 Bilinear Regression
Table 10-5 illustrates a data set used in a bilinear regression analysis of the DCPP SG 2-4 growthdata. A snapshot of the screen from the ExcelTM worksheet analysis of the data is shown onFigure 10-8 and the discussion of the analysis is keyed to the cell coordinates of that figure. Theoriginal independent variable data are listed in column B with the initial dependent data incolumn D. The dummy independent variable data, one set, are listed in column C. Each cell incolumn C contains a formula that returns the maximum of the difference between theindependent variable, VI, at that row and the break point value, VBP, which is listed in cell F5.Thus, the regression line is of the form,
10-14

EPRI Proprietary Licensed Material
Prior Industry Recommended Updates to ARCAnalysis Methods and Data Applications
VG = bo + b1V1 + b2 (V1 -VEBP) Eq. 10-8
where the coefficients, bo through b2, are found by a standard least squares procedure. The anglebrackets, ( and ), indicate a singularity notation that is zero if the operation in the brackets isnegative or zero and the value of the operation otherwise. Here it is understood that the exponenton the brackets is unity. Examination of the equation shows that the intercept and slope when VIis less than Vfp are bo and b1 respectively. When the converse is true the intercept is bo minusb2-VBp and the slope becomes b1 plus b2. The principle extends readily to multiple break points.
In many instances the value of the break point is known a priori and the regression proceeds inthe usual fashion. The approach to the analysis of the growth data is to perform the analysis in amanner in which the value of the break point is also determined. A nonlinear regression analysiscould be performed to effect a solution. An equally valid approach, the method employed herein,is to use the Excel solver routine to calculate the value of the break point that results in aminimum value for the sum of squares of the errors of regression. The solver interface windowfor the analysis of this document is illustrated on Figure 10-9 and the information depicted iskeyed to the cell coordinates shown on Figure 10-8. The target cell, J9, is the sum of squares ofthe prediction errors from the regression analysis. The break point value is entered in cell F5; thesolver routine changes the value in that cell to minimize the value calculated for the target cell.There are two constraints identified in the interface window, the solution value has to be lessthan or equal to the number in cell G8, identified as "Bound 2," and greater than or equal to thevalue in cell F8, "Bound L." The value of the first bound was picked, i.e., the value of 0.5 wasselected based on engineering judgment, as a standard for the width of the first data region. Thevalue in cell F8 can be set to less than 0.5 to give the solver more latitude in calculating a breakpoint, which could then be less than 0.5. This approach was used by DCPP for the evaluation ofthe Unit I Cycle 12 data, with the results being illustrated of Figures 3-1 and 3-4 of theReference 10-5. The value in cell G8 is obtained from the data in column B, referring again toFigure 10-8, using the value in cell G9 to count from the bottom of the data. This thendetermines the upper bound value allowed for the solution. Cell G6 of Figure 10-8 contains theactual number of data in the upper range and serves as a check that the solution for the breakpoint is actually less than the bounding value. One other feature of the regression analysis isnoted. The intercept term for the regression equation was not restricted to zero, see cell KS onFigure 10-8. This is not a necessary feature and the determination of the break points is likelyinsensitive to this specification. The solution value for this case was 0.59, comfortably greaterthan the lower bound of 0.5 and significantly less than the specified upper bound of 1.67. Theresults of the regression analysis for a sample set of data are illustrated separately on Figure 10-10.
10-15

EPRI Proprietary Licensed faterial
Prior Industry Recommended Updates to ARC Analysis Methods and Data Applications
10.3.4.3 Trilinear Regression
The worksheet for the performance of a trilinear analysis is shown on Figure 10-11. The solverinterface is shown on Figure 10-12. A point to note is that there are two cells to be changed toeffect the desired solution, F5 and G5. In addition, the lower bound constraint is only on thevalue in cell F5 and the upper bound constraint is on the value in cell G5. The other point is thatthe cell to minimize the value has been specified as 17, which is the standard error of prediction.This is really the same specification as J9 since the standard error of prediction is the square rootof the sum of squares of the errors of prediction after dividing by the degrees of freedom. Theequation for a trilinear regression analysis is,
VG =bo +b1V4 +b2 (V1 -VBl)+b3 (Vl -VB2 ), Eq. 10-9
where VBI and VB are the two break points needed in the analysis. The solution is independentlyillustrated on Figure 10-13. The trilinear regression analysis illustrated is for a different data setthan used for the bilinear regression, since upper range values from the growth during Cycle 10were included to increase the probability of experiencing some of the larger growth values. Thesum of squares of the errors is greater for the trilinear regression than for the bilinear becausedifferent data sets were analyzed for the two examples. However, the improvement as measuredby decreasing the SSE for the latter set of data which was obtained by increasing the complexityof the model was marginal at best. Although the SSE was only marginally improved, the use ofthe trilinear regression was and is recommended where practical. Recall that the purpose of theanalysis is not to fit useable regression functions to the data, but only to find locations wherethere is evidence that the growth may be changing. The results for the break points are readilyapparent from an examination of the information presented on Figure 10-13. An additional breakpoint is found at location 1.66 Volts which results in greater predicted growth for the largervalues. This is a desirable feature to include in the operational assessment. There are nineteen(19) data pairs included in the solution for the upper bin, indicating that the solution was notconverging to the remaining single highest growth value. Had the single extreme growth valuebeen included in these analyses, the solution would have converged to whatever limit was inplace for the upper bin, e.g., fifteen (15) in this case.
10.3.4.4 Quadrilinear Regression
The expansion of the model from three to four line segments follows in the same manner asincreasing the number of segments from two to three. A worksheet for performing a quadrilinearregression analysis of the data is illustrated on Figure 10-14, where provisions have been made toinclude three break points and three bounds for the break points (a lower bound for the firstbreak point, and upper bounds for the second and third). The solver screen for performing theanalysis is shown on Figure 10-15. One constraint has been added to account for the additionalbreak point. The equation for a quadrilinear regression analysis is,
VG = bo + blVl + b2 (V1-VBI) + b3 (V1-VB 2 ) + b4 (V1-VB 3 ), Eq. 1 0-1 0
10-16

EPRI Proprietary Licensed Material
Prior Industry Recommended Updates to ARCAnalysis Methods and Data Applications
where VBI, VB2 and VB3 are the three break points to be calculated. The results of extending themodel to consider four regression lines are illustrated on Figure 10-16. An undesirableconsequence, the third line has a lower slope than the second line, is immediately apparent. Thisis counter to expectation and is a flag that the added complexity should not be included in themodel.
By comparing the numerical information on Figure 10-14 with that on Figure 10-8, it is apparentthat the improvement in the SSE is minimal 85.9 versus 86.1. A similar result is obtained if thetrilinear fit is compared to the bilinear fit.
10.3.5 Example Application to Plant DCPP Data
10.3.5.1 SG 2-4 Cycle 11 Growth Data
As previously noted, data were obtained from the examination of the SG tubes at DCPP Unit 2during refueling outage 1, referred to as 2R1 1, Reference 10-3, and analyzed to estimatelocations for the break points for the analysis considering voltage dependent growth. The datawere used to develop the information presented in this report for an operational assessment of theDCPP 2 SG tubes. The steam generator with the most significant degradation and growth wasDCPP SG 2-4.
The Cycle 1 I growth data for the 975 indications found in the SG were analyzed using apiecewise linear regression analysis and break points of 0.61 and 1.66 Volts were obtained. Asecond analysis was performed by adding the 30 largest indications in the SG from theinspection at the end of Cycle 10 of operation to the Cycle 11 data. The number of indicationscorresponded to a growth break point value of 1.17 Volts which was obtained from the analysisof the growth data for that cycle. The analysis is discussed in the following section. The resultsof the analysis indicate that the break points for the Cycle 1 growth rates should be at 0.59 and1.66 Volts for a three region simulation. It is noteworthy that the break points obtained from bothanalyses are similar and the upper break point is unaffected by the presence of the Cycle 10indications. This is likely due to the fact that most of the indications had BOC amplitudes thatwere less than the upper break point value.
10.3.5.2 SG 2-4 Cycle 10 Growth Data
The growth data from Cycle 10 for SG 2-4, a total of 488 indications, were analyzed using thesame techniques to find break points in the growth that would minimize the corrected sum ofsquares of deviations from the piecewise regression predictions. The Excel screen for theanalysis is shown of Figure 10-17. The results of the analysis indicate that break points of 0.69and 1.17 Volts should be used for analyses employing the Cycle 10 growth data. The dependenceof growth on BOC amplitude is significant above the second break point where it is apparent thatthe change in slope is somewhat dramatic. The results are illustrated in larger scale on Figure 10-18.
10-17
I 11-
EPRI Proprietary Licensed Material
Prior Industry Recommended Updates to ARC Analysis Methods and Data Applications
The Cycle 10 data also provide an illustration for a potential drawback in using quadrilinearregression without a restriction on the minimum number of data that may be used for the thirdsegment or piece of the curve. A near step function results as illustrated on Figure 10-19 from theinfluence of the large growth value at about 1.25 volts, i.e., minimization of the standard error ofthe regression is achieved by having a step at that value, with a smaller slope for the fourthsegment of the curve. The noted point, and two others, are also influential in the determination ofthe slope of the third segment for the trilinear regression. A comparison of the two curves showsthat the growth in the range of less than 1.2 Volts is less than if the trilinear curve is used, in therange of 1.2 to 1.5 Volts the growth is greater if the quadrilinear curve is used, and growth forindications greater than 1.5 Volts is greater if the trilinear curve is used. Figure 10-20 illustratesthe Excel input screen for setting a data limitation on the number of data in the third and fourthbins respectively and Figure 10-21 illustrates the solution for the same data if the limitation onthe number of data for the third segment is used. In this case, the growth rate in the range belowabout 1.2 Volts is greater for the trilinear curve and slightly lower thereafter to about 1.5 Volts. Itshould be noted that for the trilinear fit, the number of data in the upper bin is 30 even though thespecified minimum was 15. For the quadrilinear fit the number of data in the third and fourthbins exactly matches the specified minimum. Thus, the analysis is converging to the specifiedlimits instead of seeking out the natural break point. As for the analysis of the Cycle 11 data,there is no advantage to using a quadrilinear fit to determine the break points.
10.3.6 Discussion
The following discussion was developed to provide clarification based on the tenor of requestsfor additional information (RAIs) transmitted by the NRC staff to PGE following submittal ofDCPP 2RI I inspection report. A question was asked regarding the accuracy of pinpointing thebreak points with the following response being developed to that request. The pinpointing of thebreak points is achieved by the fitting of the prior cycle growth data once VDG has beenestablished. The implementation protocol for the determination of the break points prevents thenumber of data in the upper bin from becoming too small (i.e., <15), thus arbitrary shifting of theupper point is not possible. The establishment of the break points is not subject to meaningfulvariation once the growth data have been obtained. The break points will always be accuratelycalculated to achieve the best locations for the simulation of the current growth curve if it wereintended to be approximated by piecewise linear segments. The statistically based methods forcalculating the break points eliminate any arbitrary choice of the break points. A study witharbitrary shifts in the break points would not provide meaningful information relative to theestablishment of the break points.
In the case of the DCPP U2 Cycle 12 analyses, it is anticipated that moving of the lower breakpoint would not be expected to have a significant effect on the probability of burst simplybecause of the range of indications in the lower bin near the break point with the middle bin andbecause of the relatively small growth rates for this bin. It is noted that there are two results thatensue from arbitrarily moving the upper break point in the positive direction, something that isnot permitted under the VDG methods guidelines. The first is the number of growth points in theupper bin would decrease, leading to an attendant increase in the frequency at which the largestgrowth value(s) would be sampled during the simulation for indications in the upper bin. Thesecond effect is that the number of indications that would be in the BOC voltage range for which
10-18

EPRI Proprietary Licensed Material
Prior IndustryRecommended Updates toARCiAnalysisMethzods and DataApplications
the upper growth values would be sampled would also decrease. For most analyses withoutpreventive plugging, the number of indications returned to service in the upper bin would usuallyexceed the number of indications in the upper bin growth distribution, which ultimately leads toconservative frequencies for the large growth values. Preventive plugging at 1.2 volts, as appliedat DCPP-2 for Cycle 12, reduces the number of BOC indications in the upper voltage bin, thusreducing the potential for indications to have large growth rates. The two effects of large growthfrequency and number of indications returned to service in the bin may or may not offset eachother in the calculation of the probability of burst or potential total leak rate depending on thepopulation being simulated. However, the voltages for the population being simulated willalways well represent the voltages for the population from which the bin growth rates werederived.
An addition query was made regarding whether the method could be reasonably expected to beapplicable from plant-to-plant or would the evaluation be plant specific. Since the break pointsrepresent locations where a least-squares piecewise linear approximation to the growth of thedata is being estimated, it can be assumed that the results would be plant-specific but themethodology can be applied from plant-to-plant. A related question requested that considerationbe given as to whether or not the break points could be assumed to be defined by a maturepopulation and used on a generic basis. This question is of a similar nature and using a genericset of break points is not recommended unless an analysis is performed demonstrating that asignificant shift in their locations has not occurred. However, performing such an analysis resultsin the calculation of the break points so no advantage would be gained by trying to establish ageneric set. In addition, the ARC populations continue to mature as more indications left inservice approach the repair limit such that the best estimate of a mature population increases withoperating time or with increases in the repair limit.
Finally, the staff requested that DCPP address the potential for shifts in the VDG break points tooccur under increases in the ARC repair criterion, e.g., 4V. It was noted that implementation ofan ARC on the order of 4V could be expected to lead to the need to utilize three break points, aquadrilinear regression analysis, in order to achieve a reasonable level of agreement between thepiecewise linear function and the curvature exhibited by the data. This is based on anticipating anincrease in the range of the growth data and the need for a more complex model, achieved byincreasing the number of break points, to approximate the curvature of the growth data as afunction of initial amplitude.
10.3.7Summary
The purpose in performing the analysis is to "let the data determine" where the break pointsshould be. Recall the caution that the analysis is not being performed to obtain growthrelationships to be used in the analysis of the ODSCC indications. Care must be taken to avoidmaking judgments about the analysis results stemming from an unintentional anticipation ofusing the relationships for analysis simulations or predictions. Moreover, the purpose of theanalysis is to identify break points when it is suspected that VDG is taking place, not todetermine if VDG is taking place. This is because criteria for use with the curve fittingworksheets were not developed for this effort. Howevert, the analyst could perform the evaluationof the break points independently and conclude that a change in slope at a break point appeared
10-19

EPRI Proprietary Licensed Material
Prior Industry Recommended Updates to ARC Analysis Methods and Data Applications
to be meaningful, thus indicating that additional consideration of the potential for VDG shouldbe made.
The following are observations based on the analysis of data from a plant where VDG was quiteevident. It is to be expected that the observations are generic in nature and constitute a set ofapplicable directions for other plants.
1. The trilinear regression performed as well as or better than a quadrilinear regression. Thestandard error of the regression and, hence, the correlation coefficients were the same for theanalysis of the Plant Y data. Increasing the complexity of the model is not indicated since itis not likely to improve the fit. There may be instances where the quadrilinear model simplyconverges to the specified limits instead of a pseudo natural break point. If the BOC voltagesinclude significant numbers of indications above about 2 volts, it might be expected that aquadrilinear model may become appropriate due to the exponential dependence of voltage oncrack depth and throughwall length.
2. The analyst should reject adding additional break points to the model if the analysis results inany succeeding line slope being less than its predecessor. This applies to intermediate andfinal line segments. For example, a bilinear dependence would be indicated if the centersegment of a trilinear fit has a slope less than that of the first segment. This caution does notapply to the insertion of the first break point, see item 3 below.
However, suppose a trilinear fit is attempted and it is apparent that the slope of the finalsegment is significant while the slope of the second segment is less than that of the firstsegment. One would expect the bilinear fit to result in a break point near that of the secondbreak point of the trilinear fit. This should result from the process of minimizing the errorsum-of-squares. If it is found that this is not the case, then additional analysis must beperformed.
3. It is expected that there will be cases where the slope of the data in the first segment will benegative. This region of the growth curve is expected to have the a slope approaching zeroeven if VDG is evident in the data. VDG is controlled by the growth of the largest indicationsand the smallest indications would be expected to exhibit no VDG. If there were not VDGfor the data, i.e., a true slope of zero, obtaining a negative slope from the data would be aslikely as obtaining a positive slope due to uncertainties in the voltage measurements.
4. Although the trilinear fit is recommended because of its potential flexibility in handlinggrowth variations, there may be occasions when the bilinear fit is acceptable. For example, abilinear fit would be judged to be appropriate when the change between the 2nd and 3rd slopesof a trilinear fit are small.
5. Improvements in the fit in going from a bilinear to a trilinear model are not large, e.g., thereduction in the SSE can be absolutely and relatively small. This would normally indicatethat the increase in complexity is not balanced by the improvement in the model. However,the use of a trilinear curve permits more sensitivity to the voltage dependent growth andtherefore has an engineering advantage.
10-20

EPRI Proprietary Licensed Material
Prior Industry Recommended Updates to ARCAnalysis Methods and Data Applications
6. There may not be statistically best locations where the break points are strongly indicated,simply meaning that several choices may offer similar results. However, the analysis resultsdo indicate where changes in the growth rate as a function of initial amplitude are likely to beoccurring.
The analysis methodology for location of the break points is a recommended ARC analysismethodology.
10.4 Growth Rate in Deplugged Tubes Returned to Service
10.4.1 Introduction
In several plants with 7/8" diameter steam generator tubing, deplugged tubes returned to servicehave experienced a significantly larger in-service growth rate than tubes active during the priorcycle. For one of these plants, SLB leak rate and tube burst probability calculated using theactual measured voltages after one cycle of operation following deplugged tubes returned toservice were found to be higher than the projections performed at the beginning of the cycle.The higher growth rates of the deplugged tubes are the primary causative factor leading tounderestimates of the projections.
For ARC leak and tube burst projections following the return of deplugged tubes to service, it isnecessary to account for potential growth rate increases in order to maintain margins in theprojected SLB leak rate and burst analyses. To accomplish this objective, a method ofcombining the growth data for active tubes with those for deplugged tubes should be established.If plant-specific, historical growth data for deplugged tubes are available from prior cycles, thesedata can be used. If there are no plant specific prior deplugged tube growth rates, it is suggestedthat a conservative growth distribution based on deplugged tube growth data available from othersimilarly designed and operated plants be used to provide an increased growth allowance forindications in deplugged tubes. Details of a bounding growth distribution recommended for firstcycle of operation for deplugged tubes returned to service and a method for combining thegrowth data for previously active tubes with the deplugged tube growth data are discussedbelow.
10.4.2 Selection of a Bounding Growth Distribution for Deplugged Tubes
In the absence of a plant-specific deplugged tube growth database, a conservative growthdistribution should be selected based on data from similarly designed and operated plants. Thisapproach is consistent with the guidance given in Generic Letter 95-05 for selecting growth datafor leak and burst analysis for plants where adequate plant-specific growth data are not available.It is recommended that a growth rate distribution that bounds all available deplugged tube datafrom similar plants be used. Only the growth data for the cycle in which deplugged tubes arereturned to service are of interest. Deplugged tube growth rates during the second andsubsequent cycles after return to service are not included since no adjustment is necessary forthose cycles (i.e., measured growth rates already reflect any increase in growth rate fordeplugged tubes).
10-21

EPRI Proprietary Licensed Material
Prior Industry Recommended Updates to ARC Analysis Methods and Data Applications
At present, growth data during the first cycle of operation after returning deplugged tubes toservice are available from 4 inspections, all in 7/8" tube steam generators. The cumulativeprobability distributions for the available growth data are plotted in Figure 10-22. The datashown for each plant represent the composite data from all SGs in the plant, and they wereconverted to growth rates per EFPY to account for different plant operating periods. It is evidentthat growth rates observed for deplugged tubes vary significantly between plants and betweencycles for one plant.
Clearly, deplugged growth data for Plant A-2 envelopes the data from the other threeinspections; thus, it provides an upper bound growth distribution for deplugged tubes returned toservice in plants with 7/8 inch diameter tubes. It is recommended that the deplugged tubegrowth distribution for Plant A-2 (composite data from all SGs) be used as a conservativeapproximation when plant-specific data are not available for deplugged tubes. Table 10-7provides the recommended distribution in a tabular format.
10.4.3 Method of Combining Active and Deplugged Tube Growth Data
It would be convenient to perform leak and burst calculations for the combined indicationpopulation in active and deplugged tubes. The growth distribution applied in such an analysisfor the combined indication population must be representative of growth rates for indications inboth active and deplugged tubes. The growth rates for active and deplugged tubes should becombined in such a manner as to reflect the fraction of the total population that each type ofindication represents. It is therefore recommended that each growth distribution be weighted bythe number of each type of indication returned to service. As the growth data applied to leak andburst calculations are binned in small voltage intervals (usually 0.1 volt intervals), the number ofindications in bins defining the composite growth distribution should be established per theequation below.
n ( | x Na + ILL x Nd, Eq. 10-11
where, nicomb = number of indications in the ith bin of composite growth distribution,
nfiag = number of indications in the izh bin of active tube growth distribution,
ni dg = number of indications in the ith bin of deplugged tube growth distribution,
N, = total number indications in active tubes returned to service,
Ndp = total number indications in deplugged tubes returned to service,
nt;,g = total number indications in the active tube growth distribution,
nI.dg = total number indications in the deplugged tube growth distribution.
10-22

EPRI Proprietary Licensed Alaterial
Prior Industry Recommended Updates to ARCAnalysis Methods and Data Applications
The active and deplugged tube growth data used to define the composite distribution must benormalized to the same cycle duration, say one year, prior to combining them. The aboveequation results in normalizing the active and deplugged tube growth distributions to thecorresponding number of indications returned to service. The ni.comb values define the cumulativeprobability growth distribution for the combined active and deplugged indications.
Table 10-8 shows an example of composite growth data established by combining growth datafor active tubes (obtained from prior cycles) and the limiting growth data for deplugged tubesrecommended above. The three growth distributions are also illustrated in Figure 10-23.
10.4.4 Comparison of Leak and Burst Projections Considering IncreasedDeplugged Tube Growth with those Based on Actual Voltages
Benchmarking analyses were performed to support the proposed method of obtaining acomposite growth distribution considering both active and deplugged tube growth data for use inSLB leak and burst projections. Results projected with the composite growth distribution werecompared with those based on the actual measured voltages. Two of the three plants for whichdeplugged tube growth data are available were chosen for benchmarking: Plants A-2 and P. Thelimiting growth distribution recommended above for the deplugged tube indications actuallyoccurred in the cycle selected for Plant A-2. The actual growth observed for deplugged tubeswas used to project EOC conditions for Plant A-2. With Plant P, tubes were deplugged andreturned to service in two consecutive cycles. Therefore, deplugged tube growth rates for thefirst cycle having deplugged tubes returned to service were used to project EOC conditions forthe next cycle.
Table 10-8 shows the growth distributions for indications in active and deplugged tubes for PlantA-2 as well as the composite growth distribution obtained using the method described above.Growth rate data for the active tube indications were taken to be the higher of growth data for theprior two inspections. The active tube indication growth distribution shown is based on datafrom 81 indications, and the deplugged tube indication growth distribution is based on data from11 indications. For the cycle simulated, there were 97 indications in active tubes and 89
indications in deplugged tubes returned to service. The composite growth distribution obtainedby weighting the two growth distributions by the number of each type of indication returned toservice is shown in Table 10-8.
Results from leak and burst projections as well as those based on the actual EOC measuredvoltage distribution for Plant A-2 are summarized in Table 10-9. Leak and burst analyses werecarried out for the following four cases:
1. Considering only indications in tubes active in the previous cycle.
2. Considering only indications in deplugged tubes returned to service.
3. Based on combined EOC voltage distribution for Cases I and 2 (more rigorous application ofupper 95% leak rate than adding Cases I and 2).
10-23

EPRI Proprietary Licensed Material
Prior Industry Recommended Updates to ARCAnalysis Methods and Data Applications
4. Calculations for the combined active and deplugged tube population using the compositegrowth distribution shown in Table 10-8.
For the actual distribution, SLB leak rate and tube burst probability calculated using a NDEanalyst uncertainty consistent with GL 95-05 (standard deviation of 10.3%) are 2.8 gpm and8.2x l04, respectively, (Case 1 in Table 10-9). The actual voltage distribution includes 41indications over 2 volts, and over 65% of the leak rate and 75% of the tube burst probability resultedfrom those indications. The NDE uncertainty of 10.3% was developed from analyses of indicationsdominantly less than about 2 volts. Comparisons of independent NDE analyses for indicationsabove 2 to 3 volts have shown excellent agreement, and the NDE uncertainty would be bounded byabout 5% or less. Therefore, the actual EOC calculations were repeated using a NDE uncertainty of5%, and the leak and tube burst probability decreased to 2.6 gpm and 5.8x 10⁴ , respectively (Case 2in Table 10-9). Results based on 5% NDE uncertainty are judged to be more accurate estimates forcomparison with projected values.
Table 10-9 also shows the leak and burst projections performed for the same cycle considered in theanalysis with actual volts. Results obtained using a constant POD of 0.6 as well as a voltage-dependent POD distribution (POPCD) presented in Reference 10-6. The application of POPCDprovides results which are not artificially made conservative using a POD value too conservative forindications over about I volt. The analyses utilize leak rate not correlated with voltage (applicableARC method at the time of the Plant A-2 inspection).
Case 3 in Table 10-9 shows leak and burst results obtained using the standard methodologywithout distinguishing indications in active tubes from those in deplugged tubes. It is evidentthat the predicted maximum EOC volts, SLB leak rate and tube burst probability are significantlybelow the corresponding values based on the actual EOC distribution. Cases 4 through 8 inTable 10-9 utilize the POPCD distribution for POD adjustment. Case 4 shows leak and burstresults obtained considering only indications present in tubes active during the last cycle, andCase 5 shows the results for only indications in deplugged tubes calculated using the limitinggrowth distribution recommended for deplugged tubes. Straight addition of leak rates and tubeburst probabilities calculated separately for the active and deplugged tubes would not necessarilyrepresent results for the combined population at the 95%/95% limit. To obtain leak and burstvalues at the 95%/95% limit for the combined indication population, EOC voltage distributionscalculated separately for the active and deplugged tube indications were combined, and anadditional leak and burst calculation was performed for the combined EOC distribution. NoNDE uncertainties or POD correction were applied to the combined EOC voltage distributionsince these factors are already included in the individual voltage projections. Case 6 in Table 10-9 shows the results for the combined EOC voltage distribution, and the results compare well withthose based on the actual measured voltages and NDE uncertainty of 5%.
Case 7 in Table 10-9 shows results obtained by applying a composite growth distributioncalculated as described in Section 10.4.3 to the combined active and deplugged tube population.The peak EOC voltage, leak rate and burst probability values are essentially the same as thoseobtained by combining the EOC voltage distributions calculated separately for the active anddeplugged tubes. This demonstrates acceptability of a single analysis for the combined activeand deplugged tube indication population by applying a composite growth distribution calculated
10-24
EPRI Proprietary Licensed Material
Prior Industry Recommended Updates to ARCAnalysis Methods and Data Applications
as described in Section 10.4.3. Thus, instead of calculating EOC Voltage distributions separatelyfor the active and deplugged tubes and then performing leak and burst calculations for thecombined EOC voltage distribution, a single analysis can be performed for the combined activeand deplugged tube indication population by applying a composite growth distribution calculatedas described in Section 10.4.3.
The recommended growth distribution for deplugged tubes (shown in Table 10-7) is based oncombined data from all SGs in the inspection chosen for the benchmarking calculations. Thespecific SG for which calculations were performed had a slightly larger growth rate than the allSG composite growth. Therefore, calculations for Case 7 in Table 10-9 were repeated using theSG-specific growth for deplugged tubes and the results are shown under Case 8. The use of SG-specific growth for the deplugged tubes improved the agreement between the projected resultsand those based on the actual measured voltages, but the absolute magnitude of the impact issmall. Since the all SG composite distribution is based on a larger number of data points (Illvs. 89 for the largest SG-specific distribution), it is recommended for leak and burst projections.
Case 9 in Table 10-9 shows the results when a constant POD=0.6 is utilized along with thecomposite growth distribution. The predicted leak rate exceeds that calculated based on actualmeasured and NDE uncertainty of 5%. The corresponding burst probability values are withinabout 104 which is considered as good agreement.
For ARC analyses applying a POD of 0.6, the indication population in deplugged tubes returnedto service was not adjusted with a POD factor because all indications in such tubes areadequately detected compared to a detection probability of 60%. However, the POD factor alsoaccounts for new indications formed during the cycle analyzed. Available data for the first yearof operation of deplugged tubes returned to service were examined to ascertain if a significantnumber of new indications are detected, and the results are summarized in Table 10-10. It isevident that new indications found in the first inspection after return to service vary from 0% to11.7% of the total indication detected, with an average of about 8.3%. Thus, the number of newindications appearing in deplugged tubes is much smaller than the 67% implied for the NRCmandated POD=0.6. It is recommended that while performing leak and burst projections usingvoltage-dependent POPCD, the POD factor should be applied to BOC indications in depluggedtubes also. This was done for Cases 3 through 8 in Table 10-9. Results shown in Table 10-9 fora constant POD of 0.6 (Case 9) were obtained without applying a POD correction for depluggedtube indications. Good agreement between these results and those based on the actual measuredvoltages indicate that additional conservatism introduced by applying the conservative POD=0.6to deplugged tube indications is unnecessary. Therefore, a POD adjustment for deplugged tubeindications is not recommended when a constant POD of 0.6 is applied.
It is evident from leak and burst projected results for Cases 6 and 7 that projections based onPOPCD slightly under predict those based on the actual voltages. To find a means for furtherimproving the agreement between projected and actual results, the growth data for active anddeplugged tubes were examined more closely. Figure 10-24 shows growth data for thedeplugged tubes plotted against the beginning of cycle (BOC) voltage (composite data for allSGs). Examination of data in Figure 10-24 suggests that beyond about I volt at BOC theproportion of indications in a selected voltage range experiencing larger growths (say, above 0.5
10-25

EPRI Proprietary Licensed Material
Prior hidustry Recommended Updates to ARC Analysis Methods and Data Applications
volt) appears to increase with the BOC voltage, which suggests that the growth rate fordeplugged tubes increases with the BOC voltage. Therefore, a second set of calculations wasperformed considering deplugged tube growth rates to be dependent on BOC voltage. Theguidelines for binning growth data to account for dependency on BOC voltage used for thisanalysis were based on judgment for the break points as these analyses preceded that given inSection 10.3. There are about 50 indications in the BOC voltage range above 1.2 volts.Therefore, the deplugged tube growth data were represented by two separate growthdistributions, one representing BOC voltages up to 1.2 volts and the other above 1.2 volts, andthey were used in the analyses to project EOC conditions. These two distributions are shown intabular form in Table 10-Il and in graphical form in Figure 10-25. It is evident that indicationswith a BOC voltage above 1.2 volts show a higher probability of experiencing larger growth. Inthe analysis for the combined active and deplugged tube population, the combined growth datawere also split into two groups and the active and deplugged data for each group were combinedto obtain a composite distribution for each BOC voltage range using the methodology discussedin Section 10.4.3.
Results for projection analysis using voltage-dependent growth are also shown in Table 10-9(Cases 10 to 12). It is evident that the use of voltage-dependent growth simulation slightlyincreased the peak voltage and burst probability values, but the leak rate values did not changesignificantly from Cases 5 to 7. The impact of voltage-dependent growth varies with the BOCvoltage distribution, and the effect could be significant in other cases. It is recommended thatvoltage dependency of growth rate for deplugged tubes be considered only when the active tubegrowth data also show dependency on BOC voltage. Table 10-12 shows the actual growth (perEFPY) vs. BOC voltage data for the recommended limiting growth distribution. This datashould be used if it is necessary to split the growth distribution at a BOC voltage other than 1.2volts.
Results from projection analyses performed for Plant P are shown in Table 10-13. As notedearlier, plant-specific deplugged tube growth rates obtained from one cycle can be used toproject EOC conditions for a subsequent cycle in which additional deplugged tubes werereturned to service. Cases 2 and 5 in Table 10-13 show leak rate and tube burst probabilityvalues calculated by applying the same growth rate distribution for active and deplugged tubesthat was determined using the standard methodology (Reference 10-6). These cases utilize aconservative POD value of 0.6; therefore, the results are higher than those based on the actualvoltages. The analysis utilizing a composite growth based on active and deplugged tube growthrates use more realistic POD values given by the POPCD distribution (Cases 3 and 6 in Table10-13), and those results are also conservative relative to those for the actual conditions. Thereason for both projection results based on POD=0.6 and EPRI POPCD over predicting thosebased on the actual measured voltages is that the actual growth during the cycle simulated wasless than that assumed in the projections. Also, growth rates in deplugged tubes returned toservice were comparable to those in the active tubes, and they were less than the deplugged tubegrowth rates assumed in the projection.
10-26

EPRI Proprietary Licensed Material
Prior Industry Recommended Updates to ARC Analysis Methods and Data Applications
10.4.5 Conclusions
Data available from several plants indicate that indications in tubes deplugged and returned toservice may experience a significantly higher growth rate in the first cycle of operation thanthose in tubes active in the prior cycles. Therefore, analysis to project EOC leak rate and tubeburst probability for a cycle in which deplugged tubes are returned to service should account forpotentially larger growth rates for deplugged tube indications. The following guidelines areprovided regarding the method of calculating leak rate and tube burst probability for thecombined indication population in active and deplugged tubes, and selection of growth data fordeplugged tubes.
A single analysis is recommended for the combined active and deplugged tube indicationpopulation. The growth distribution applied to the combined indication population should berepresentative of both active and deplugged growth distributions.
If plant-specific data is not available for growth in deplugged tubes, the limiting growth distributionin Table 10-7, which was obtained considering data from several plants, should be used.
An acceptable method of combining growth distributions for indications in active and depluggedtubes is shown by Equation 10-1. The two growth distributions are weighted by the number ofindications in active and deplugged tubes returned to service.
For the limiting growth distribution suggested for deplugged tubes, growth dependency on BOCvoltage needs to be considered only when the growth data for active tubes also show a similardependency. A method for considering voltage-dependency of growth is described in Section 10.3of this report.
When the voltage-dependent POPCD distribution is used, the POD correction should also beapplied for indications in deplugged tubes returned to service. However, if a constant POD of 0.6 isapplied, POD adjustment for deplugged tubes is not recommended since there is significantconservatism already present when POD=0.6 is applied.
10-27

EPRI Proprietary Licensed Material
Prior hidustry Recommended Updates to ARCAnalysis Methods and Data Applications
10.5 References
10-1 NP-7480-L, "Steam Generator Tubing Outside Diameter Stress Corrosion Cracking atTube Support Plates Database for Alternate Repair Limits, EPRI, Palo Alto, CA, USA(October 2002).
10-2 WCAP-14277, Revision 1, "SLB Leak Rate and Tube Burst Probability AnalysisMethods for ODSCC at TSP Intersections," Westinghouse Electric Company, LLC,Madison, PA, USA (December 1996).
10-3 51-5027557-00, "2R1 I DCPP Growth Rates," Framatome ANP, Lynchburg, VA, USA,May 13, 2003.
10-4 Draper, N. and Smith, H., Applied Regression Analysis, Second Edition, John Wiley &Sons, New York, NY, USA (1981).
10-5 DCL-04-019, "DCPP Unit I Voltage-Based Repair Criteria Benchmarking and EOC-12Projections," L. Womack, Pacific Gas and Electric Company, Diablo Canyon PowerPlant, Avila Beach, CA (April 2004).
10-6 Addendum-I to EPRI Report, "Steam Generator Tubing Outside Diameter StressCorrosion Cracking at Tube Support Plates - Database for Alternate Repair Limits, NP-7480-L, August 1996.
10-28

EPRI Proprietary Licensed AMaterial
Prior Industry Recommended Updates to ARC Analysis Methods and Data Applications
Table 1 0-1Summary of Alternate Bobbin to RPC Voltage Correlations 80 mil Pancake Coil RPC Data
Functional Form Index of p-value RPC Voltage('Determination, r2 for Slope Corresponding to
. Parameter Bobbin 2 volt|_ . Repair Limit
Note 1. Mean Correlation Values
Table 10-2Bobbin to RPC Voltage Correlation Sensitivity Analysis on Data Range
RPC Voltage Correlation Coefficient (r2) RPC Volts<') at 2 Bobbin VoltsRange Linear-Linear Regression
I 4
4 4
I I
Notes:
(1) Mean correlation values
(2) There is only one data point between 2 to 3 volts
10-29

EPRI Proprietary Licensed Material
Prior Industry Recommended Updates to ARCAnalysis Methods and DataApplications
Table 10-3Sample Information
Standard ID Tube Material Tubing Heat Support Support HeatMaterial
10-30

EPRI Proprietary Licensed Material
Prior Industry Recommended Updates to ARCAnalysis Methods and Data Applications
Table 10-4Percentage Variation in Mix Measurements Relative to the APC Reference Standard
Stnad | Method |Generation 2 | Generation 3 | Generation 4
I
I> I
___-_ _
4 .1. -4I
1 t
I + 4 I
4 + 4 4
4 .4- .4I
1 4 4 4
1 + 4 4
4 + 4 4
I 4 I
4 + 4 4
4 .4. .4I
.5. __________________ 4
10-31

EPRI Proprietary Licensed Material
Prior Industry Recommended Updates to ARCAnalysis Methods and Data Applications
Table 10-5Bilinear Regression Sample Data
Index Previous Dummy Volts I EFPYNumber Voltage Variable 1
4 4
4 4
4 4
+ 1 4
+ 1 4
+ 1 4
+ 1 4
+ 1 4
+ 1 4
+ I 4
4 1 4
l 4
4 l 4
4 1 4
4 1 4
4 1 4
10-32

EPRI Proprietary Licensed Material
Prior Industry Recommended Updates to ARC Analysis Methods and Data Applications
Table 10-6Cycle 10 Data Added to Cycle 11
Index . BOC Amplitudel GrowthValue I (Volts) (VoltsIEFPY)
I I
I I
I I
I I
I - I
I I
I 4
I 4
I 4
I 4
* 4
I 4
I 4
I 4
I 4
I
10-33

EPRI Proprietary Licensed laterial
Prior Industry Recommended Updates to ARC Analysis Methods and Data Applications
Table 10-7Recommended Limiting Growth Distribution for Indications in Deplugged Tubes DuringFirst Cycle of Operation
Growth Number of CumulativeVoltstEFPY I Indications (nidg) I Probability
4 1
4 I
I I
I I
I I
I I
I I
I I
I I
t I
I I
10-34

EPRI Proprietary Licensed Material
Prior Industry Recommended Updates to ARC Analysis Methods and Data Applications
Table 10-8Combining Growth Data For Active and Deplugged Tubes Indications UsingRecommended Method
10-35

EPRI Proprietary Licensed Material
Prior Industry Recommended Updates to ARC Analysis Methods and Data Applications
Table 10-9Comparison of Leak and Burst Results for a Cycle in which Deplugged Tubes areReturned to Service - Plant A-2
Burst SIBCase Analysis POD No. of Max. Probability Leak
Type Indica- Volts(2) 1 Tube 1 or more Ratetions~l Vlt Tubes (gpm)
Based on Actual Measured Voltages l
I I _ _ _ _ _ _ _ _ _ _ _ _
3
5
6
7
9
1 1
12
Notes
(9)
10-36

EPRI Proprietary Licensed Material
Prior Industry Recommended Updates to ARCrAnalysis Methods and Data Applications
Table 10-10New Indications During First Year of Operation In Deplugged Tubes Returned to Service
10-37

EPRI Proprietary Licensed Afaterial
Prior Industry Recommended Updates to ARCAnalysis Methods and Data Applications
Table 10-11Recommended Limiting Growth Distribution During First Cycle of Operation forIndications in Deplugged Tubes
Growth Dependent on BOC Voltage
10-38

EPRI Proprietary Licensed Material
Prior Industry Recommended Updates to ARCAnalysis Methods and Data Applications
Table 10-12Data Used to Obtain Recommended Limlting'Growth Distribution for Indications inDeplugged Tubes
10-39

EPRI Proprietary Licensed Material
Prior Industry Recommended Updates to ARCAnalysis Methods and Data Applications
Table 10-13Comparison of Leak and Burst Results for a Cycle in which Deplugged Tubes areReturned to Service - Plant P
I Burst SLBCase Analysis POD No. of Max. Probability Leak
LType Indicas() VoIts¢2 1 Tube 1 or more Rate________________________ tins1 ~Tubes (gpm)
Steam Generator A
10-40

- rKi rroprnerary Licensed Material
Prior Industry Recommended Updates to ARCAnalysis Methods and DataApplications
Figure 10-1Bobbin to RPC Voltage Correlation for an Example Case - Bobbin Volts vs. 80 mil Mid Range Pancake RPC Volts
10-41

EPRI Proprietary Licensed Material
Prior Industry Recommended Updates to ARC Analysis Methods and Data Applications
Figure 10-2Bobbin to RPC Voltage Correlation for an Example Case - Scatter Plot of Residuals - Linear Bobbin vs Linear RPC
10-42
.. rKI rropnerary Licensed Material
Prior Industry Recommended Updates to ARCAnalysis Methods and Data Applications
Figure 10-3Bobbin to RPC Voltage Correlation for an Example Case - Normal Plot of Residuals - Linear Bobbin vs. Linear RPC
10-43

EPRI Proprietary Licensed Afaterial
Prior Industry Recommended Updates to ARC Analysis Metlods and Data Applications
Figure 10-4Average Errors in All Methods
10-44

EPRI Proprietary Licensed Material
Prior Industry Recommended Updates to ARCAnalysis Methods and Data Applications
Figure 10-5Bilinear Regression Line Illustration
Figure 10-6Trilinear Regression Line Illustration
10-45

EPRI Proprietary Licensed Material
Prior Industry Recommended Updates to ARC Analysis Methods and Data Applications
Figure 10-7Quadrilinear Regression Line Illustration
Figure 10-8Excel Screen for Bilinear Regression Analysis
10-46

EPRI Proprietary Licensed Material
Prior Industry Recommended Updates to ARCAnalysis Methods and Data Applications
Figure 10-9Excel Solver Screen for Bilinear Regression Analysis
Figure 10-10Bilinear Regression Lines for SG 2-4 Cycle 11 Growth Data
10-47

EPRI Proprietary Licensed Material
Prior Industry Recommended Updates to ARCAnalysis Methods antd Data Applications
Figure 10-11Excel Screen for Trilinear Regression Analysis
Figure 10-12Excel Solver Screen for Trilinear Regression Analysis
10-48

EPRI Proprietary Licensed Material
Prior Industry Recommended Updates to ARC Analysis Methods and Data Applications
Figure 10-13Trilinear Regression Lines for SG 2-4 Cycle 11 Growth Data
Figure 10-14Excel Screen for Quadrilinear Regression Analysis
10-49

EPRI Proprietary Licensed Mfaterial
Prior Industry Recommended Updates to ARC Analysis Methods and Data Applications
Figure 10-15Excel Solver Screen for Quadrilinear Regression Analysis
Figure 10-16Quadrilinear Regression of SG 2-4 Cycle 11 Growth Data
10-50
EPRI Proprietary Licensed AMaterial
Prior Industry Recommended Updates to ARC Analysis Methods and Data Applications
Figure 10-17Excel Screen for SG 2-4 Cycle 10 Growth Data
Figure 10-18Quadrilinear Regression Without a Data Limit On Piece 3
10-51

EPRI Proprietary Licensed Material
Prior Industry Recommended Updates to ARCAnalysis Methods and Data Applications
Figure 10-19Trilinear Regression of SG 2-4 Cycle 10 Growth Data
Illustration of an unsatisfactory analysis result.
Figure 10-20Quadrilinear Regression With a Data Limit On Piece 3
10-52

EPRI Proprietary Licensed Alaterial
Prior Industry Recommended Updates to ARC Analysis Methods and Data Applications
Figure 10-21Quadrilinear Regression of SG 2-4 Cycle 10 Growth Data
10-53

EPRI Proprietary Licensed AMaterial
Prior Industry Reconmnended Updates to ARCAnalysis Methods and Data Applications
Figure 10-22Growth Rates for Deplugged Tubes in the First Cycle after Return to Service: Composite of Data from All SGs in a Plant;Cumulative Probability Distributions for Growth on an EFPY Basis
10-54
I

-tRKI Proprietary Licensed Material
Prior Industry Recommended Updates to ARC Analysis Methods and Data Applications
Figure 10-23Composite Growth Distribution Based on Active and Deplugged Tube Growth Distributions
10-55

EPRI Proprietary Licensed Material
Prior Industry Recommended Updates to ARC Analysis Methods and Data Applications
Figure 10-24Voltage Growth vs. BOC Voltage - Deplugged Tube Data is for First Cycle of Operation after Tubes Deplugged
10-56

EPRI Proprietnry Licensed Mlaterial
Prior Industry Recommended Updates to ARCAnalysis Methods and Data Applications
Figure 10-25Limiting Growth Distribution Recommended for Deplugged Tube Indications - Growth Considered Dependent on BOC Voltage
10-57