Environmental Assessment of the Lower Cape Fear River ...
45
Environmental Assessment of the Lower Cape Fear River System, 2020 By Michael A. Mallin, Matthew R. McIver and James F. Merritt October 2021 CMS Report No. 21-02 Center for Marine Science University of North Carolina Wilmington Wilmington, N.C. 28409
-
Upload
khangminh22 -
Category
Documents
-
view
3 -
download
0
Transcript of Environmental Assessment of the Lower Cape Fear River ...

Environmental Assessment of the Lower Cape Fear River System, 2020
By
Michael A. Mallin, Matthew R. McIver and James F. Merritt October 2021
CMS Report No. 21-02 Center for Marine Science
University of North Carolina Wilmington Wilmington, N.C. 28409

Executive Summary Background – Multi-parameter water quality sampling for the Lower Cape Fear River Program (LCFRP) http://www.uncw.edu/cms/aelab/LCFRP/index.htm, has been ongoing since June 1995. Scientists from the University of North Carolina Wilmington’s (UNCW) Aquatic Ecology Laboratory perform the sampling effort. The LCFRP currently encompasses 32 water sampling stations throughout the lower Cape Fear, Black, and Northeast Cape Fear River watersheds (Table 1.1; Fig. 1.1). The LCFRP sampling program includes physical, chemical, and biological water quality measurements and analyses of the benthic and epibenthic macroinvertebrate communities, and has in the past included assessment of the fish communities. Principal conclusions of the UNCW researchers conducting these analyses are presented below, with emphasis on water quality of the period January - December 2020. There were no data collected in April 2020 due to restrictions from the Covid-19 pandemic. The opinions expressed are those of UNCW scientists and do not necessarily reflect viewpoints of individual contributors to the Lower Cape Fear River Program. The mainstem lower Cape Fear River is a 6th order stream characterized by periodically turbid water containing moderate to high levels of inorganic nutrients. It is fed by two large 5th order blackwater rivers (the Black and Northeast Cape Fear Rivers – Fig. 1.1) that have low levels of turbidity, but highly colored water with less inorganic nutrient content than the mainstem. While nutrients are reasonably high in the river channels, major algal blooms are normally rare because light is attenuated by water color or turbidity, and flushing in the estuary is usually high (Ensign et al. 2004). During periods of low flow algal biomass as chlorophyll a increases in the Cape Fear River because lower flow causes settling of more solids and improves light conditions for algal growth. Periodically major algal blooms are seen in the tributary stream stations, some of which are impacted by point source discharges. Below some point sources, nutrient loading can be high and fecal coliform contamination occurs. Other stream stations drain blackwater swamps or agricultural areas (traditional agriculture and/or industrialized animal production), and some sites periodically show elevated pollutant loads or effects (Mallin et al. 2015). This region has been hit by hurricanes several times in the past three decades and such storms have a marked impact on water quality and organisms. GenX Issues - During the past four years there has been considerable controversy in the lower Cape Fear River watershed regarding a family of manufactured chemical compounds popularly known as GenX. To briefly summarize, DuPont constructed a facility known as Fayetteville Works near the river downstream of Fayetteville, where it manufactured fluoropolymers since 1971. DuPont manufactured a chemical called PFOA at Fayetteville Works beginning in 2001, than later stopped its manufacture due to health concerns surrounding this chemical. They then developed a substitute chemical called GenX, which they began manufacturing there, along with GenX’s parent compound, called HFPO-DA fluoride. Both compounds hydrolize in water to a third compound called HFPO-DA, CAS; the toxicity of this group of chemicals is unclear. Subsequently, DuPont spun-off a company called Chemours, which assumed plant operations in 2015. In the past few years researchers from US EPA, North Carolina
1

State University, and the University of North Carolina Wilmington have found HFPO-DA and related fluoroethers (which tend to be lumped under the blanket term GenX) in river water, river sediments, well water near the plant, in air samples, aquatic organism tissue, bird tissue, and in finished drinking water at the Wilmington water treatment facility, which obtains its water near Lock and Dam #1. Fayetteville Works says they have stopped the GenX discharge, and in 2019 built a thermal oxidizer to heat waste gases and reduce >99% of the chemicals from escaping; however these chemicals are still found in river water that enters the Cape Fear Public Utility Authority water treatment plant. Legal actions were initiated against the company from NC Attorney General, NCDEQ and Cape Fear River Watch to provide financial compensation for the pollution and for installation of pollution-reduction equipment. Sampling and analysis of GenX and related compounds is outside of the purview of the scientific staff of the Lower Cape Fear River Program and will not be discussed in this report. Summary of water quality data results from 2020 – Hurricane Isaias impacted southeastern North Carolina August 3rd with rain and tornadoes, and made landfall at Ocean Isle Beach. The Category 1 hurricane passed rapidly with little impact to water quality in the Cape Fear region (Chapter 2). Year after year there is a dissolved oxygen sag in the main river channel that begins at Station DP below a paper mill discharge and near the Black River input, and persists into the mesohaline portion of the estuary. Mean oxygen levels are highest at the upper river stations NC11 and ANC and in the low-to-middle estuary at stations M35 to M18 (Fig. 1.1). Lowest mainstem mean DO levels normally occur at the river and upper estuary stations NAV, HB, BRR and M61. The Northeast Cape Fear and Black Rivers are classified as blackwater systems because of their tea colored water. The Northeast Cape Fear and Black Rivers generally have lower DO levels than the mainstem Cape Fear River. DO concentrations in the tributary streams were briefly impacted by the hurricane, but some sites are chronically bad year-after-year. In 2020 GS (Goshen Swamp) was below standard 45% of occasions samples; ANC (Angola Creek), SR (upper South River), NCF117 and NCF6 (both on the Northeast Cape Fear River) were below standard 27% of the time sampled, but all of the other stream stations were below standard less than 25% of the time. Considering all sites sampled in 2020, we rated 28% as poor for dissolved oxygen, 6% as fair, and 66% as good. Annual mean turbidity levels for 2020 were lower than the long-term average at all stations. Highest mean riverine turbidities (18-16 NTU) were at NC11-DP (Fig. 1.1) with turbidities generally low in the middle to lower estuary. The estuarine stations did not exceed the estuarine turbidity standard on our sampling trips. Turbidity was considerably lower in the Northeast Cape Fear River and Black River than in the mainstem river. Turbidity levels were low in the freshwater streams, with all streams rated as good for 2020. Suspended solids were generally low except at NC11 and AC, the upper river sites.
2

Average chlorophyll a concentrations across most sites were low in 2020. The standard of 40 µg/L was exceeded once each at Stations GS and SR, and there were several smaller algal blooms as well. We note the highest chlorophyll a levels in the river and estuary typically occur late spring to late-summer. Nuisance cyanobacterial blooms did not occur in the river and upper estuary in 2020. For the 2020 period UNCW rated 100% of the stations as good in terms of chlorophyll a. Fecal bacteria counts in the estuary and at many of the stream stations were elevated in 2020. Sites with the highest counts in general were BRN (Browns Creek), PB (Panther Branch), HAM (Hammond Creek), LCO (Little Coharie Creek), 6RC (Six Runs Creek), ROC (Rockfish Creek), NC403 (uppermost Northeast Cape fear river site) and LRC (Little Rockfish Creek). However, the main river and estuary sites were generally in good condition in 2020. For bacterial water quality overall, 32% of the sites rated as poor, 10% as fair, and 58% as good.. In addition, according to our experimentally-derived key concentrations, excessive nitrate and phosphorus concentrations were problematic at a number of stations. Sites with high nutrient concentrations included point-source locations NC403 and PB, and non-point locations ROC, 6RC, and GCO (Great Coharie Creek). A 20-year analysis of nitrate concentrations found several stream stations with both high concentrations and continuing upward trends, especially Six Runs Creek (6RC), Rockfish Creek (ROC), Great Coharie Creek (GCO) and Little Coharie Creek (LCO). Note that all of these creeks have no point sources but their watersheds contain numerous swine CAFOs, as well as a considerable number of poultry CAFOs.
3

Table of Contents Executive Summary…………………………………………………………………………….1 1.0 Introduction...........................................................................………...............…........5
1.1 Site Description................................................………....................................6 1.2 Report Organization………………………………………………………..…..…7
2.0 Physical, Chemical, and Biological Characteristics of the Lower Cape Fear River
and Estuary………………………………………………..……………………..............10 Physical Parameters..…......................………..........................................……....13 Chemical Parameters…....……..……….........................................................…..16 Biological Parameters.......……….....……......................................................…..20
4

1.0 Introduction
Michael A. Mallin
Aquatic Ecology Laboratory Center for Marine Science
University of North Carolina Wilmington The Lower Cape Fear River Program is a unique science and education program that has a mission to develop an understanding of processes that control and influence the ecology of the Cape Fear River, and to provide a mechanism for information exchange and public education. This program provides a forum for dialogue among the various Cape Fear River user groups and encourages interaction among them. Overall policy is set by an Advisory Board consisting of representatives from citizen’s groups, local government, industries, academia, the business community, and regulatory agencies. This report represents the scientific conclusions of the UNCW researchers participating in this program and does not necessarily reflect opinions of all other program participants. This report focuses on the period January through December 2020. The scientific basis of the LCFRP consists of the implementation of an ongoing comprehensive physical, chemical, and biological monitoring program. Another part of the mission is to develop and maintain a data base on the Cape Fear basin and make use of this data to develop management plans. Presently the program has amassed a 26-year (1995-2020) data base that is available to the public, and is used as a teaching tool. Using this monitoring data as a framework the program goals also include focused scientific projects and investigation of pollution episodes. The scientific aspects of the program are carried out by investigators from the University of North Carolina Wilmington Center for Marine Science. The monitoring program was developed by the Lower Cape Fear River Program Technical Committee, which consists of representatives from UNCW, the North Carolina Division of Environmental Quality, The NC Division of Marine Fisheries, the US Army Corps of Engineers, technical representatives from streamside industries, the Cape Fear Public Utility Authority, Cape Fear Community College, Cape Fear River Watch, the North Carolina Cooperative Extension Service, the US Geological Survey, forestry and agriculture organizations, and others. This integrated and cooperative program was the first of its kind in North Carolina. The physical, chemical and biological data are state-certified and submitted to the US EPA. Broad-scale monthly water quality sampling at 16 stations in the estuary and lower river system began in June 1995 (UNCW Aquatic Ecology Laboratory, directed by Dr. Michael Mallin). Sampling was increased to 34 stations in February of 1996, 35 stations in February 1998, and 36 stations in 2005, then lowered to 33 in 2011; currently it stands at 32 water quality stations. The Lower Cape Fear River Program added another component concerned with studying the benthic macrofauna of the system in 1996. This component is directed by Dr. Martin Posey and Mr. Troy Alphin of the UNCW Biology Department and includes the benefit of additional data collected by the
5

Benthic Ecology Laboratory under various grant-funded projects in the Cape Fear Estuary. These data are collected and analyzed depending upon the availability of funding. The third major biotic component (added in January 1996) was an extensive fisheries program directed by Dr. Mary Moser of the UNCW Center for Marine Science Research, with subsequent (1999) overseeing by Mr. Michael Williams and Dr. Thomas Lankford of UNCW-CMS. This program involved cooperative sampling with the North Carolina Division of Marine Fisheries and the North Carolina Wildlife Resources Commission. The fisheries program ended in December 1999, but was renewed with additional funds from the Z. Smith Reynolds Foundation from spring – winter 2000.
1.1. Site Description The mainstem of the Cape Fear River is formed by the merging of the Haw and the Deep Rivers in Chatham County in the North Carolina Piedmont. However, its drainage basin reaches as far upstream as the Greensboro area (Fig. 1.1). The mainstem of the river has been altered by the construction of several dams and water control structures. In the Coastal Plain, the river is joined by two major tributaries, the Black and the Northeast Cape Fear Rivers (Fig. 1.1). These 5th order blackwater streams drain extensive riverine swamp forests and add organic color to the mainstem. The watershed (about 9,164 square miles) is the most heavily industrialized in North Carolina with 203 permitted wastewater discharges with a permitted flow of approximately 429 million gallons per day, and (as of 2010) over 2.07 million people residing in the basin (NCDENR Basinwide Information Management System (BIMS) & 2010 Census). Approximately 23% of the land use in the watershed is devoted to agriculture and livestock production (2006 National Land Cover Dataset), with livestock production dominated by swine and poultry operations. Thus, the watershed receives considerable point and non-point source loading of pollutants. However, the estuary is a well-flushed system, with flushing time ranging from 1 to 22 days with a median flushing time of about seven days, much shorter than the other large N.C. estuaries to the north (Ensign et al. 2004). Water quality is monitored by boat at eight stations in the Cape Fear Estuary (from Navassa to Southport) and one station in the Northeast Cape Fear Estuary (Table 1.1; Fig. 1.1). We note that after July 2011 sampling was discontinued at estuarine stations M42 and SPD, per agreement with the North Carolina Division of Water Quality; and in 2012 sampling was expanded at Smith Creek at the Castle Hayne Road bridge (Table 1.1) and initiated at a new site along the South River (SR-WC). Riverine stations sampled by boat include NC11, AC, DP, IC, and BBT (Table 1.1; Fig. 1.1). NC11 is located upstream of any major point source discharges in the lower river and estuary system, and is considered to be representative of water quality entering the lower system (we note that the City of Wilmington and portions of Brunswick County get their drinking water from the river just upstream of Lock and Dam #1). Station BBT is located on the Black River between Thoroughfare (a stream connecting the Cape Fear and Black Rivers) and the mainstem Cape Fear, and is influenced by both rivers. We consider B210 and NCF117 to represent water quality entering the lower Black and Northeast Cape Fear Rivers, respectively. Data has also been collected at stream and
6

river stations throughout the Cape Fear, Northeast Cape Fear, and Black River watersheds (Table 1.1; Fig. 1.1; Mallin et al. 2001).
1.2. Report Organization
Section 1 of this report provides a summary and introduction, and Section 2 of this report presents a detailed overview of physical, chemical, and biological water quality data from the 32 individual stations, and provides tables of raw data as well as figures showing spatial or temporal trends. LCFRP data are freely available to the public. The LCFRP has a website that contains maps and an extensive amount of past water quality, benthos, and fisheries data gathered by the Program available at: www.uncw.edu/cms/aelab/LCFRP/. Additionally, there is an on-line data base. http://lcfrp.uncw.edu/riverdatabase/
References Cited Ensign, S.H., J.N. Halls and M.A. Mallin. 2004. Application of digital bathymetry data in
an analysis of flushing times of two North Carolina estuaries. Computers and Geosciences 30:501-511.
Mallin, M.A., S.H. Ensign, M.R. McIver, G.C. Shank and P.K. Fowler. 2001.
Demographic, landscape, and meteorological factors controlling the microbial pollution of coastal waters. Hydrobiologia 460:185-193.
7

Table 1.1 Description of sampling locations for the Lower Cape Fear River Program, 2020.
Collected by Boat
AEL Station DWR Station # Description Comments County Lat Lon Stream Class. HUC
NC11 B8360000 Cape Fear River at NC 11 nr East Arcadia
Below Lock and Dam 1, Represents water entering lower basin
Bladen 34.3969 -78.2675 WS-IV Sw 03030005
AC B8450000 Cape Fear River at Neils Eddy Landing nr Acme
1 mile below IP, DWR ambient station
Columbus 34.3555 -78.1794 C Sw 03030005
DP B8465000 Cape Fear River at Intake nr Hooper Hill
AT DAK intake, just above confluence with Black R.
Brunswick 34.3358 -78.0534 C Sw 03030005
BBT Black River below Lyons Thorofare UNCW AEL station Pender 34.3513 -78.0490 C Sw ORW+ 0303005
IC B9030000 Cape Fear River ups Indian Creek nr Phoenix
Downstream of several point source discharges
Brunswick 34.3021 -78.0137 C Sw 0303005
NAV B9050025 Cape Fear River dns of RR bridge at Navassa
Downstream of several point source discharges
Brunswick 34.2594 -77.9877 SC 0303005
HB B9050100 Cape Fear River at S. end of Horseshoe Bend nr Wilmington
Upstream of confluence with NE Cape Fear River
Brunswick 34.2437 -77.9698 SC 0303005
BRR B9790000 Brunswick River dns NC 17 at park nr Belville
Near Belville discharge Brunswick 34.2214 -77.9787 SC 03030005
M61 B9800000 Cape Fear River at Channel Marker 61 at Wilmington
Downstream of several point source discharges
New Hanover 34.1938 -77.9573 SC 03030005
M54 B9795000 Cape Fear River at Channel Marker 54
Downstream of several point source discharges
New Hanover 34.1393 -77.946 SC 03030005
M35 B9850100 Cape Fear River at Channel Marker 35
Upstream of Carolina Beach discharge
Brunswick 34.0335 -77.937 SC 03030005
M23 B9910000 Cape Fear River at Channel Marker 23
Downstream of Carolina Beach discharge
Brunswick 33.9456 -77.9696 SA HQW 03030005
M18 B9921000 Cape Fear River at Channel Marker 18
Near mouth of Cape Fear River Brunswick 33.913 -78.017 SC 03030005
NCF6 B9670000 NE Cape Fear nr Wrightsboro Downstream of several point source discharges
New Hanover 34.3171 -77.9538 C Sw 0303007
Collected by Land
6RC B8740000 Six Runs Creek at SR 1003 nr Ingold Upstream of Black River, CAFOs in watershed
Sampson 34.7933 -78.3113 C Sw ORW+ 03030006
LCO B8610001 Little Coharie Creek at SR 1207 nr Ingold
Upstream of Great Coharie, CAFOs in watershed
Sampson 34.8347 -78.3709 C Sw 03030006
GCO B8604000 Great Coharie Creek at SR 1214 nr Butler Crossroads
Downstream of Clinton, CAFOs in watershed
Sampson 34.9186 -78.3887 C Sw 03030006
SR B8470000 South River at US 13 nr Cooper Downstream of Dunn Sampson 35.156 -78.6401 C Sw 03030006
BRN B8340050 Browns Creek at NC87 nr Elizabethtown
CAFOs in watershed Bladen 34.6136 -78.5848 C 03030005
HAM B8340200 Hammond Creek at SR 1704 nr Mt. Olive
CAFOs in watershed Bladen 34.5685 -78.5515 C 03030005
COL B8981000 Colly Creek at NC 53 at Colly Pristine area Bladen 34.4641 -78.2569 C Sw 03030006
B210 B9000000 Black River at NC 210 at Still Bluff 1st bridge upstream of Cape Fear River
Pender 34.4312 -78.1441 C Sw ORW+ 03030006
NC403 B9090000 NE Cape Fear River at NC 403 nr Williams
Downstream of Mt. Olive Pickle, CAFOs in watershed
Duplin 35.1784 -77.9807 C Sw 0303007
PB B9130000 Panther Branch (Creek) nr Faison Downstream of Bay Valley Foods Duplin 35.1345 -78.1363 C Sw 0303007
GS B9191000 Goshen Swamp at NC 11 and NC 903 nr Kornegay
CAFOs in watershed Duplin 35.0281 -77.8516 C Sw 0303007
SAR B9191500 NE Cape Fear River SR 1700 nr Sarecta
Downstream of several point source discharges
Duplin 34.9801 -77.8622 C Sw 0303007
ROC B9430000 Rockfish Creek at US 117 nr Wallace Upstream of Wallace discharge Duplin 34.7168 -77.9795 C Sw 0303007
LRC B9460000 Little Rockfish Creek at NC 11 nr Wallace
DWR Benthic station Duplin 34.7224 -77.9814 C Sw 0303007
ANC B9490000 Angola Creek at NC 53 nr Maple Hill DWR Benthic station Pender 34.6562 -77.7351 C Sw 0303007
SR WC B8920000 South River at SR 1007 (Wildcat/Ennis Bridge Road)
Upstream of Black River Sampson 34.6402 -78.3116 C Sw ORW+ 03030006
NCF117 B9580000 NE Cape Fear River at US 117 at Castle Hayne
DWR ambient station, Downstream of point source discharges
New Hanover 34.3637 -77.8965 B Sw 0303007
SC-CH B9720000 Smith Creek at US 117 and NC 133 at Wilmington
Urban runoff, Downstream of Wilmington Northside WWTP
New Hanover 34.2586 -77.9391 C Sw 0303007
8

Figure 1.1. Map of the Lower Cape Fear River system and the LCFRP sampling stations.
9
2.0 Physical, Chemical, and Biological Characteristics of the Lower Cape Fear River and Estuary
Michael A. Mallin and Matthew R. McIver
Aquatic Ecology Laboratory Center for Marine Science
University of North Carolina Wilmington 2.1 - Introduction
This section of the report includes a discussion of the physical, chemical, and biological water quality parameters, concentrating on the January-December 2020 Lower Cape Fear River Program monitoring period. These parameters are interdependent and define the overall condition of the river. Physical parameters measured during this study included water temperature, dissolved oxygen, field turbidity and laboratory turbidity, total suspended solids (TSS), salinity, conductivity, pH and light attenuation. The chemical makeup of the Cape Fear River was investigated by measuring the magnitude and composition of nitrogen and phosphorus in the water, and metals as requested by NCDEQ. Selected biological parameters including fecal coliform bacteria (in freshwater) or Enterococcus bacteria (in the estuary) and chlorophyll a were examined. 2.2 - Materials and Methods Samples and field parameters collected for the estuarine stations of the Cape Fear River (NAV down through M18) were gathered (when possible) on an ebb tide. This was done so that the data better represented the river water flowing downstream through the system rather than the tidal influx of coastal ocean water. Sample collection and analyses were conducted according to the procedures in the Lower Cape Fear River Program Quality Assurance/Quality Control (QA/QC) manual. Technical Representatives from the LCFRP Technical Committee and representatives from the NC Division of Environmental Quality inspect UNCW laboratory procedures and periodically accompany field teams to verify proper procedures are followed. By agreement with N.C. Division of Environmental Quality, changes have periodically occurred in the sampling regime. Station SC-CH (lower Smith Creek) was added October 2004; sampling was discontinued at Stations M42 and SPD (June 2011); sampling at Stations BCRR and BC117 was discontinued (December 2012); sampling was added at Station SR-WC on the South River (March 2013); and sampling was discontinued at Station LVC2 (July 2015). Special sampling for dissolved metals was initiated at selected stations by NCDEQ in 2015 and is ongoing. Physical Parameters Water Temperature, pH, Dissolved Oxygen, Turbidity, Light, Salinity, Conductivity Field parameters other than light attenuation were measured at each site using a YSI EXO3 or YSI Pro D55. Each parameter is measured with individual probes on the sonde. At stations sampled by boat (see Table 1.1) physical parameters were measured at 0.1 m
10

and at the bottom (up to 12 m); only surface data are reported within. Occasionally, high flow prohibited the sonde from reaching the actual bottom and measurements were taken as deep as possible. At the terrestrially sampled stations (i.e. from bridges or docks) the physical parameters were measured at a depth of 0.1 m. The Aquatic Ecology Laboratory at the UNCW CMS is State-certified by the N.C. Division of Environmental Quality to perform field parameter measurements. The light attenuation coefficient k was determined from data collected on-site using vertical profiles obtained by a Li-Cor LI-1000 integrator interfaced with a Li-Cor LI-193S spherical quantum sensor. Chemical Parameters Nutrients A local State-certified analytical laboratory was contracted to conduct all chemical analyses except for orthophosphate, which is performed at CMS. The following methods detail the techniques used by CMS personnel for orthophosphate analysis. Orthophosphate (PO4-3) Water samples were collected ca. 0.1 m below the surface in triplicate in amber 125 mL Nalgene plastic bottles and placed on ice. In the laboratory 50 mL of each triplicate was filtered through separate1.0 micron pre-combusted glass fiber filters, which were frozen and later analyzed for chlorophyll a. The triplicate filtrates were pooled in a glass flask, mixed thoroughly, and approximately 100 mL was poured into a 125 mL plastic bottle to be analyzed for orthophosphate. Samples were frozen until analysis. Orthophosphate analyses were performed in duplicate using an approved US EPA method for the Bran-Lubbe AutoAnalyzer (Method 365.5). In this technique the orthophosphate in each sample reacts with ammonium molybdate and anitmony potassium tartrate in an acidic medium (sulfuric acid) to form an anitmony-phospho-molybdate complex. The complex is then reacted with ascorbic acid and forms a deep blue color. The intensity of the color is measured at a wavelength of 880 nm by a colorimeter and displayed on a chart recorder. Standards and spiked samples were analyzed for quality assurance. Biological Parameters Fecal Coliform Bacteria / Enterococcus Fecal coliform bacteria were analyzed by a State-certified laboratory contracted by the LCFRP. Samples were collected approximately 0.1 m below the surface in sterile plastic bottles provided by the contract laboratory and placed on ice for no more than eight hours before analysis. After August 2011 the fecal coliform analysis was changed to Enterococcus bacteria in the estuarine stations downstream of NAV and HB (Stations BRR, M61, M35, M23 and M18).
11

Chlorophyll a The analytical method used to measure chlorophyll a is described in Welschmeyer (1994) and US EPA (1997) and was performed by UNCW Aquatic Ecology Laboratory personnel. Chlorophyll a concentrations were determined utilizing the 1.0 micron filters used for filtering samples for orthophosphate analysis. All filters were wrapped individually in foil, placed in airtight containers and stored in the freezer. During analysis each filter was immersed in 10 mL of 90% acetone for 24 hours, which extracts the chlorophyll a into solution. Chlorophyll a concentration of each solution was measured on a Turner 10-AU fluorometer. The fluorometer uses an optimal combination of excitation and emission bandwidth filters which reduces the errors inherent in the acidification technique. The Aquatic Ecology Laboratory at the CMS is State-certified by the N.C. Division of Environmental Quality for the analysis of chlorophyll a (chlorophyll at three LCFRP stations are required by NCDEQ to be analyzed by state-certified methods); the rest of the large amount of chlorophyll a data presented here were not State-certified. Biochemical Oxygen Demand (BOD) Five sites were originally chosen for BOD analysis. One site was located at NC11, upstream of International Paper, and a second site was at AC, about 3 miles downstream of International Paper (Fig.1.1). Two sites were located in blackwater rivers (NCF117 and B210) and one site (BBT) was situated in an area influenced by both the mainstem Cape Fear River and the Black River. For the sampling period May 2000-April 2004 additional BOD data were collected at stream stations 6RC, LCO, GCO, BRN, HAM and COL in the Cape Fear and Black River watersheds. In May 2004 those stations were dropped and sampling commenced at ANC, SAR, GS, N403, ROC and BC117 in the Northeast Cape Fear River watershed for several years. BOD analysis was stopped in August 2015 due to insufficient funding; previous BOD results are published (Mallin et al. 2006). Parameter Method NC DEQ Certified
Water Temperature SM 2550B-2000 Yes
Dissolved Oxygen SM 4500O G-2001 Yes
pH SM 4500 H+B-2011 Yes
Specific Conductivity SM 2510 B-2011 Yes
Lab Turbidity SM 2130 B-2001 Yes
Field Turbidity SM 2130 B-2001 No
Chlorophyll a EPA 445.0 Rev. 1.2 Yes
Biochemical Oxygen Demand SM 5210 B-2001 No
12

Parameter Method NC DEQ Certified
Total Nitrogen By addition
Nitrate + Nitrite EPA 353.2 Rev 2.0 1993 Yes
Total Kjeldahl Nitrogen EPA 351.2 Rev 2.0 1993 Yes
Ammonia Nitrogen EPA 350.1 Rev 2.0 1993 Yes
Total Phosphorus SM 4500 PF-2012 Yes
Orthophosphate EPA 365.5 No
Fecal Coliform SM 9222 D-1997 Yes
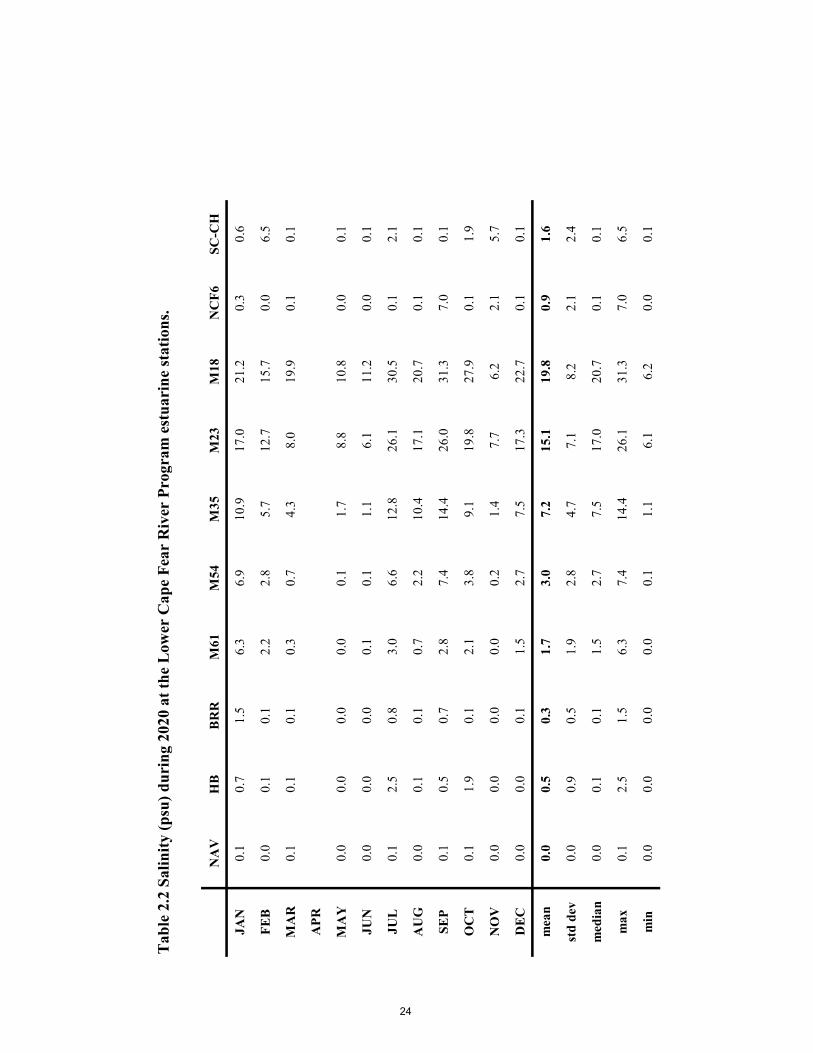
Enterococcus Enterolert IDEXX Yes 2.3 - Results and Discussion This section includes results from monitoring of the physical, biological, and chemical parameters at all stations for the time period January-December 2020. Discussion of the data focuses both on the river channel stations and stream stations, which sometimes reflect poorer water quality than the channel stations. The contributions of the two large blackwater tributaries, the Northeast Cape Fear River and the Black River, are represented by conditions at NCF117 and B210, respectively. The Cape Fear region experienced minor impacts from Hurricane Isaias in early August 2020; therefore this report reflects its impacts that summer. Physical Parameters Water temperature Water temperatures at all stations ranged from 5.7 to 30.9oC, and individual station annual averages ranged from 17.9 to 20.2oC (Table 2.1). Highest temperatures occurred during July and lowest temperatures during December. Stream stations were generally cooler than river stations, most likely because of shading and lower nighttime air temperatures affecting the shallower waters. Salinity Salinity at the estuarine stations (NAV through M18; also NCF6 in the Northeast Cape Fear River) ranged from 0.0 to 31.3 practical salinity units (psu) and station annual means ranged from 0.0 to 19.8 psu (Table 2.2). Lowest salinities occurred in late spring and early summer of 2020 and again in November. The annual mean salinities for 2020 were somewhat lower than the twenty-five year average for 1995-2019 (Figure 2.1). Two stream stations, NC403 and PB, had occasional oligohaline conditions due to discharges from pickle production facilities. SC-CH is a blackwater tidal creek that enters the
13

Northeast Cape Fear River just upstream of Wilmington and salinity there ranged from 0.0 to 7.0 psu. Conductivity Conductivity at the estuarine stations ranged from 0.07 to 48.26 mS/cm and from 0.05 to 1.65 mS/cm at the freshwater stations (Table 2.3). Temporal conductivity patterns followed those of salinity. Dissolved ionic compounds increase the conductance of water, therefore, conductance increases and decreases with salinity, often reflecting river flow conditions due to rainfall. Stations PB and NC403 are below industrial discharges, and often have elevated conductivity. Smith Creek (SC-CH) is an estuarine tidal creek and the conductivity values reflect this (Table 2.3). pH System pH values ranged from 3.3 to 8.1 and station annual means ranged from 3.8 (at COL) to 7.8 (Table 2.4). pH was typically lowest upstream due to acidic swamp water inputs and highest downstream as alkaline seawater mixes with the river water. Low pH values at COL predominate because of naturally acidic blackwater inputs in this wetland-rich rural watershed. Dissolved Oxygen Dissolved oxygen (DO) problems have long been a major water quality concern in the lower Cape Fear River and its estuary, and several of the tributary streams. There is an annual dissolved oxygen sag in the main river channel that begins at DP below a paper mill discharge and persists into the mesohaline portion of the estuary (Fig. 2.2). Working synergistically to lower oxygen levels are two factors: lower oxygen carrying capacity in warmer water and increased bacterial respiration (or biochemical oxygen demand, BOD), due to higher temperatures in summer. Unlike other large North Carolina estuaries (the Neuse, Pamlico and New River) the Cape Fear estuary rarely suffers from dissolved oxygen stratification. This is because, despite salinity stratification, the oxygen remains well mixed due to strong estuarine gravitational circulation and high freshwater inputs (Lin et al. 2006). Thus, hypoxia in the Cape Fear is present throughout the water column. Surface concentrations for all sites in 2020 ranged from 2.0 to 11.8 mg/L (both at GS) and station annual means ranged from 5.5 to 8.6 mg/L (Table 2.5). Overall, average dissolved oxygen levels for 2020 were slightly lower compared with the long-term average (Fig. 2.2). River dissolved oxygen levels were low during the summer and early fall (Table 2.5), often falling below the state standard of 5.0 mg/L at several river and upper estuary stations. Although Hurricane Isaias impacted the area in early August, it had little impact on dissolved oxygen levels. NAV, IC, HB, and BRR were below 5.0 mg/L on 36% of occasions sampled, and M61 was below 5.0 mg/L on 46% of occasions. Based on number of occasions the river stations were below 5 mg/L dissolved oxygen UNCW rated NAV, HB, IC, BRR and M61 as poor for 2020; the lower estuary stations were rated as good. On a year-to-year basis, discharge
14

of BOD waste from the paper/pulp mill just above the AC station, as well as inflow of blackwater from the Northeast Cape Fear and Black Rivers, helps to decrease oxygen in the lower river and upper estuary. Additionally, algal blooms periodically form behind Lock and Dam #1 (including the blue-green algal blooms from 2009-2012), and the chlorophyll a they produce is strongly correlated with BOD at Station NC11 (Mallin et al. 2006); thus algal blooms do contribute to lower DO in the river. As the water reaches the lower estuary higher algal productivity, mixing and ocean dilution help alleviate oxygen problems.
Most tributary Stations were rated fair or good in 2020, except ANC and GS, rated poor (Table 2.5). Some hypoxia can be attributed to low summer water conditions and some potentially to CAFO runoff; however point-source discharges also likely contribute to low dissolved oxygen levels at NC403 and possibly SR, especially via nutrient loading (Mallin et al. 2004). Hypoxia is thus a continuing problem but improved with only 34% of stations impacted compared to 50% of the sites impacted in 2019. Field Turbidity Field turbidity levels ranged from 0 to 37 Nephelometric turbidity units (NTU) and station annual means ranged from 2 to 18 NTU (Table 2.6). The State standard for estuarine turbidity is 25 NTU. Highest mean turbidities were at the upper river sites NC11-DP (18 NTU), with turbidities generally low in the middle to lower estuary (Figure 2.3). The estuarine stations did not exceed the estuarine turbidity standard on our 2020 sampling trips. As in the previous year, mean turbidity levels for 2020 were well below the long-term average at all estuary sites (Fig. 2.3). Turbidity was considerably lower in the blackwater tributaries (Northeast Cape Fear River and Black River) than in the mainstem river. Average turbidity levels were low in the freshwater streams. The State standard for freshwater turbidity is 50 NTU. Note: In addition to the laboratory-analyzed turbidity that are required by NCDEQ for seven locations, the LCFRP uses nephelometers designed for field use, which allows us to acquire in situ turbidity from a natural situation. North Carolina regulatory agencies are required to use turbidity values from water samples removed from the natural system, put on ice until arrival at a State-certified laboratory, and analyzed using laboratory nephelometers. Standard Methods (APHA 1995) notes that transport of samples and temperature change alters true turbidity readings. Our analysis of samples using both methods shows that lab turbidity is nearly always lower than field turbidity; thus we do not discuss lab turbidity in this report. Total Suspended Solids (TSS) An altered monitoring plan was developed for the LCFRP in September 2011. These changes were suggested by the NC Division of Environmental Quality (then DWQ). NCDEQ suggested the LCFRP stop monitoring TSS at Stations ANC, GS, 6RC, LCO, SR, BRN, HAM, COL, SR-WC and monitor turbidity instead. DWQ believed turbidity would be more useful than TSS in evaluating water quality at these stations because there are water
15

quality standards for turbidity. TSS is used by the NCDEQ NPDES Unit to evaluate discharges. No LCFRP subscribers discharge near these sites. Total suspended solid (TSS) values system wide ranged from 1.3 to 38.8 mg/L with station annual means from 3.0 to 17.6 mg/L (Table 2.7). The overall highest river values were at NC11, DP and AC. In the stream stations TSS was generally considerably lower than the river and estuary. Although total suspended solids (TSS) and turbidity both quantify suspended material in the water column, they do not always go hand in hand. High TSS does not mean high turbidity and vice versa. This anomaly may be explained by the fact that fine clay particles are effective at dispersing light and causing high turbidity readings, while not resulting in high TSS. On the other hand, large organic or inorganic particles may be less effective at dispersing light, yet their greater mass results in high TSS levels. While there is no NC ambient standard for TSS, many years of data from the lower Cape Fear watershed indicates that 25 mg/L can be considered elevated (reached on several occasions but only at NC11 and AC in the 2020 data). The fine silt and clay in the upper to middle estuary sediments are most likely derived from the Piedmont and carried downstream to the estuary, while the sediments in the lowest portion of the estuary are marine-derived sands (Benedetti et al. 2006). Light Attenuation Due to instrumentation problems, compounded by the Covid-19 pandemic, light attenuation values will not be reported for 2020. Chemical Parameters – Nutrients Total Nitrogen Total nitrogen (TN) is calculated from TKN (see below) plus nitrate; it is not analyzed in the laboratory. TN ranged from 50 (detection limit) to 7,780 µg/L (at ROC) and station annual means ranged from 639 to 2,017 µg/L (at ROC; Table 2.8). Previous research (Mallin et al. 1999) has shown a positive correlation between river flow and TN in the Cape Fear system. In the main river total nitrogen concentrations were highest at NC11, then declining into the lower estuary, most likely reflecting uptake of nitrogen into the food chain through algal productivity and subsequent grazing by planktivores as well as through dilution and marsh denitrification. The highest median TN value at the stream stations was at NC403 with 1,640 µg/L; other sites with elevated TN were ROC, PB, ANC, 6RC and LRC. Nitrate+Nitrite Nitrate+nitrite (henceforth referred to as nitrate) is the main species of inorganic nitrogen in the Lower Cape Fear River. Concentrations system wide ranged from 10 (detection limit) to 6,160 µg/L (at ROC) and station annual means ranged from 23 to 912 µg/L (at 6RC; Table 2.9). The highest average riverine nitrate levels were at NC11 through DP (344-211 µg/L) indicating that much of this nutrient is imported from upstream. Moving downstream,
16

nitrate levels decrease most likely as a result of uptake by primary producers, microbial denitrification in riparian marshes and tidal dilution. Despite this, the rapid flushing of the estuary (Ensign et al. 2004) permits sufficient nitrate to enter the coastal ocean in the plume and contribute to offshore productivity (Mallin et al. 2005). Nitrate can limit phytoplankton production in the lower estuary in summer (Mallin et al. 1999). The blackwater rivers carried lower concentrations of nitrate compared to the mainstem Cape Fear stations; i.e. the Northeast Cape Fear River (NCF117 mean = 149 µg/L) and the Black River (B210 = 215 µg/L). Lowest river nitrate occurred during August-September. Several stream stations showed high levels of nitrate on occasion including NC403, PB, ROC and 6RC. ROC and 6RC primarily receive non-point agricultural or animal waste drainage, while point sources contribute to NC403 and PB. In general, the stream stations showed elevated nitrate in late winter and early spring. A considerable number of experiments have been carried out by UNCW researchers to assess the effects of nutrient additions to water collected from blackwater streams and rivers (i.e. the Black and Northeast Cape Fear Rivers, and Colly and Great Coharie Creeks). These experiments have collectively found that additions of nitrogen (as either nitrate, ammonium, or urea) significantly stimulate phytoplankton production and BOD increases. Critical levels of these dissolved nutrients were in the range of 200 to 500 µg-N/L (Mallin et al. 2004; Mallin and Cahoon 2020). Thus, we conservatively consider nitrate concentrations exceeding 500 µg-N/L in Cape Fear watershed streams to be potentially problematic to stream environmental health. We performed a 20-year (2000-2019) analysis of nitrate changes at select stations (Fig. 2.4). Prior to 2000 there were several large hurricanes impacting water quality of the Lower Cape Fear River system, so we wanted to factor out impacts of those acute events. Results showed several statistical increases in nitrate concentrations, especially at 6RC, ROC, GCO and LCO (Fig. 2.4). All of those watersheds contain numerous swine CAFOs, as well as many poultry CAFOs. We note that Colly Creek (COL) which as very few CAFOs but abundant wetlands showed no increase over that same period. Angola Creek (ANC) which has several CAFOs but a considerable amount of wetlands coverage showed a significant increase in nitrate, but concentrations were very low (Fig. 2.4). Overall, there has been a significant nitrate increase in several stations which is likely a result of watershed livestock production and the type of waste disposal from those operations. Ammonium/ammonia Ammonium concentrations ranged from 10 (detection limit) to 1,680 µg/L and station annual means ranged from 36 to 399 µg/L (Table 2.11). River areas with the highest mean ammonium levels this monitoring period included AC and DP, which are downstream of a pulp mill discharge, and M54, M23 and M18 in the mid-to-lower estuary. At the stream stations Colly Creek (COL) showed two occasions of high ammonium, an improvement from 2019 (Table 2.10). This station is in a wetland-rich watershed that has a low level of human development. Most previous years have showed generally low levels of ammonium; however, beginning in 2005 a few unusual peaks began to occur, which increased in magnitude and frequency after 2012, particularly in 2016, 2017 and 2018.
17

We do not have a solid explanation for this increase in ammonium. We are aware that White Lake, located in the upper Colly Creek watershed has had problems with eutrophication (NC DEQ 2017), with nearby upper groundwater and surface runoff showing elevated nutrient concentrations (especially ammonium; potentially from failing local sewage infrastructure in the densely-developed area immediately surrounding the lake). General nutrient concentrations in the lake increased over time as well (NCDEQ 2017). Thus, possibly ammonium-rich drainage from this area has made its way down to the COL station. Additional areas with periodic elevated ammonium in 2020 included 6RC, N403, ANC, ROC and PB (Table 2.11). Total Kjeldahl Nitrogen Total Kjeldahl Nitrogen (TKN) is a measure of the total concentration of organic nitrogen plus ammonium. TKN ranged from 50 (detection limit) to 3,850 µg/L (at LRC) and station annual means ranged from 469 to 1,493 µg/L (Table 2.11). TKN concentration decreases ocean-ward through the estuary, likely due to ocean dilution and food chain uptake of nitrogen. Stations with highest median concentrations included COL, ANC and ROC. As with ammonium, upper groundwater in the White Lake drainage contained high TKN (NC DEQ 2017), some of which may have gone downstream. Total Phosphorus Total phosphorus (TP) concentrations ranged from 10 (detection limit) to 1,530 µg/L (at LRC) and station annual means ranged from 120 to 560 µg/L (LRC; Table 2.12). For the mainstem and upper estuary, average TP for 2020 was considerably higher than the 1995-2019 average (Figure 2.5). The experiments discussed above in the nitrate subsection also involved additions of phosphorus, either as inorganic orthophosphate or a combination of inorganic plus organic P. The experiments showed that additions of P exceeding 500 µg/L led to significant increases in bacterial counts, as well as significant increases in BOD over control. Thus, we consider concentrations of phosphorus above 500 µg/L to be potentially problematic to blackwater streams (Mallin et al. 2004; Mallin and Cahoon 2020). Streams frequently exceeding this critical concentration included ANC and ROC. SAR, GS, and SC-CH each yielded two values exceeding 500 µg/L. Stations NC403 and PB are downstream of wastewater discharges, while ROC, GS and ANC are in non-point agricultural areas.
Orthophosphate Orthophosphate ranged from 5 to 550 µg/L (at ROC) and station annual means ranged from 7 to 188 µg/L (Table 2.13). Much of the main river orthophosphate load is imported into the Lower Cape Fear system from upstream areas, as NC11 or AC typically have high levels; there are also inputs of orthophosphate from the paper mill above AC (Table 2.14. Orthophosphate can bind to suspended materials and is transported downstream via particle attachment; thus high levels of turbidity at the uppermost river stations may be an important factor in the high orthophosphate levels. Turbidity declines toward the lower
18

estuary because of settling, and orthophosphate concentration also declines. In the estuary, primary productivity helps reduce orthophosphate concentrations by assimilation into biomass. Orthophosphate levels typically reach maximum concentrations during summertime, when anoxic sediment releases bound phosphorus. Also, in the Cape Fear Estuary, summer algal productivity is limited by nitrogen, thereby allowing the accumulation of orthophosphate (Mallin et al. 1999). In spring, productivity in the estuary is usually limited by phosphorus (Mallin et al. 1999). ROC, ANC and GCO had the highest stream station orthophosphate concentrations. All of those sites are in non-point source areas. Chemical Parameters - EPA Priority Pollutant Metals The LCFRP had previously sampled for water column metals (EPA Priority Pollutant Metals) on a bimonthly basis. However, as of 2007 this requirement was suspended by the NC Division of Water Quality and these data are no longer regularly collected by the LCFRP. Revised metals sampling (dissolved, not total metals) was re-initiated in late 2015 and has continued periodically upon request from NCDEQ. Results showed that for stations M35 and M23, concentrations of As, Cd, Cr, Cu, Pb, Ni and Zn were below detection limits on all sampling occasions. Iron (Fe) concentrations were measurable but not at harmful levels. M35 and M23 were previously on the 303(d) list being impaired for Copper Arsenic and Nickel. The DWR determined that these sites could be de-listed using the new dissolved metals criteria. There were two metals samples collected in December 2018 at IC and NAV, with no unusual or adversely high concentrations. Samples were also collected at those two sites in June and December 2019. Most metals were below detection limits. Mercury at IC was 3.39 ng/L in June and 2.39 ng/L in December, and Hg at NAV was 2.79 in December 2019. Zinc was 0.012 µg/L at IC in December 2019. LCFRP has voluntarily collected samples on 10 occasions using EPA Method 1669. Metals were not collected in 2020, but sampling was reinitiated in summer 2021. Biological Parameters Chlorophyll a During this monitoring period, chlorophyll a was low in the river and estuary locations (Table 2.14). The state standard was not exceeded in the river or estuary samples in 2020 but approached it (38 µg/L at M35) in August. We note that at the upper site NC11 it has been demonstrated that chlorophyll a biomass is significantly correlated with biochemical oxygen demand (BOD5 – Mallin et al. 2006). Multiple statistical approaches demonstrated that chlorophyll a near Lock and Dam #1 is strongly associated with nitrate generated upstream about 100 km, in an area of point source dischargers downstream of Fayetteville (Saul et al. 2019). System wide, chlorophyll a ranged from undetectable to 111 µg/L, and station annual means ranged from 1-16 µg/L, generally low because of high river discharge in 2020 (see below). Production of chlorophyll a biomass is usually low to
19

moderate in the rivers and estuary primarily because of light limitation by turbidity in the mainstem (Dubbs and Whalen 2008) and high organic color and low inorganic nutrients in the blackwater tributary rivers. Spatially, along the river mainstem highest values are normally found in the mid-to-lower estuary stations because light becomes more available downstream of the estuarine turbidity maximum (Fig. 2.6). On average, flushing time of the Cape Fear estuary is rapid, ranging from 1-22 days with a median of 6.7 days (Ensign et al. 2004). This does not allow for much settling of suspended materials, leading to light limitation of phytoplankton production. However, under lower-than-average flows there is generally clearer water because of less suspended material and less blackwater swamp inputs. We note that there were a series of problematic cyanobacterial (blue-green algae) blooms of Microcyctis aeruginosa on the mainstem river in summers of 2009-2012 (Isaacs et al. 2014). For the growing season May-September, long-term (1995-2020) average monthly flow at Lock and Dam #1 was approximately 3,685 CFS; however, for cyanobacterial bloom years 2009-2012 the growing season average flow was 1,698 CFS (USGS data; (http://nc.water.usgs.gov/realtime/real_time_cape_fear.html). For 2020, discharge in May-September was 7,584 CFS, much higher than the 2009-2012 average, and nuisance cyanobacterial blooms did not occur in the river and upper estuary in 2020. As noted, the blooms in 2009-2012 all occurred when average river discharge for May-September was below 1,900 CFS. Algal bloom formation was probably suppressed by elevated river flow in 2013-2014 and 2016-2020. Flow in 2015 was well within the range when blooms can occur, yet blooms did not occur in 2015. Clearly other factors are at work in bloom formation. Phytoplankton blooms occasionally occur at the stream stations, with a few occurring at various months in 2020 (Table 2.14). These streams are generally shallow, so vertical mixing does not carry phytoplankton cells down below the critical depth where respiration exceeds photosynthesis. In areas where the forest canopy opens up large blooms can occur. When blooms occur in blackwater streams they can become sources of BOD upon death and decay, reducing further the low summer dissolved oxygen conditions common to these waters (Mallin et al. 2004; 2015; 2020; 2015). A stream station bloom exceeding the state standard of 40 µg/L occurred on one occasion at Station GS (44 µg/L) and on one occasion at SR (111 µg/L), and lesser blooms occurred on occasion at PB, SC-CH and ANC (Table 2.15). Biochemical Oxygen Demand Beginning in 2015 samples for BOD5 and BOD20 are no longer collected for the program due to insufficient funds. Fecal Coliform Bacteria/ Enterococcus bacteria Fecal coliform (FC) bacterial counts ranged from 5 to 30,000 CFU/100 mL and station annual geometric means ranged from 27 to 352 CFU/100 mL (Table 2.15). The state
20

human contact standard (200 CFU/100 mL) was exceeded in the mainstem river in only one month (January) in 2020 (Table 2.15). During 2020 some stream stations showed elevated fecal coliform pollution levels. HAM, PB and LRC exceeded 200 CFU/100 mL 50% of the time sampled and ROC and BRN 45% of the time sampled. Other stations had periodic elevated counts particularly May-August – August may have been influenced by Hurricane Isaias. NC403 and PB are located below point source discharges and the other sites are primarily influenced by non-point source pollution. Beginning in 2015 but especially in 2017 COL had a number of unusually high fecal coliform counts; but counts had no exceedences of the standard in 2020. Enterococcus counts were initiated in the estuary in mid-2011, as this test is now the standard used by North Carolina regulators for swimming in salt waters. Sites covered by this test include BRR, M61, M54, M35, M23 and M18. The State has a single-sample level for Tier II swimming areas in which the enterococci level in a Tier II swimming area shall not exceed a single sample of 276 enterococci per 100 milliliter of water (15A NCAC 18A .3402); the LCFRP is using this standard for the Cape Fear estuary samples in our rating system. As such, in 2020 this standard was exceeded in the estuary samples once each at M23 and M18. Geometric mean enterococci counts for 2020 were lower than those of the 2012-2019 period for the lower Cape Fear Estuary (Fig. 2.7). Overall, elevated fecal coliform and Enterococcus counts are problematic in this system, with 42% of the stations rated as fair or poor in 2020, the same as 2019. 2.4 - References Cited APHA. 1995. Standard Methods for the Examination of Water and Wastewater, 19th ed.
American Public Health Association, Washington, D.C. Benedetti, M.M., M.J. Raber, M.S. Smith and L.A. Leonard. 2006. Mineralogical indicators
of alluvial sediment sources in the Cape Fear River basin, North Carolina. Physical Geography 27:258-281.
Dubbs, L. L. and S.C. Whalen. 2008. Light-nutrient influences on biomass, photosynthetic
potential and composition of suspended algal assemblages in the middle Cape Fear River, USA. International Review of Hydrobiology 93:711-730.
Ensign, S.H., J.N. Halls and M.A. Mallin. 2004. Application of digital bathymetry data in an
analysis of flushing times of two North Carolina estuaries. Computers and Geosciences 30:501-511.
Isaacs, J.D., W.K. Strangman, M.A. Mallin, M.R. McIver, and J.L.C. Wright. 2014.
Microcystins and two new micropeptin cyanopeptides produced by unprecedented Microcystis aeruginosa blooms in North Carolina’s Cape Fear River. Harmful Algae 31:82-86.
Lin, J. L. Xie, L.J. Pietrafesa, J. Shen, M.A. Mallin and M.J. Durako. 2006. Dissolved
oxygen stratification in two microtidal partially-mixed estuaries. Estuarine, Coastal and Shelf Science. 70:423-437.
21

Mallin, M.A. and L.B. Cahoon. 2020. The hidden impacts of phosphorus pollution to streams and rivers. BioScience. 70:315-329.
Mallin, M.A., L.B. Cahoon, M.R. McIver, D.C. Parsons and G.C. Shank. 1999. Alternation
of factors limiting phytoplankton production in the Cape Fear Estuary. Estuaries 22:985-996.
Mallin, M.A., M.R. McIver, S.H. Ensign and L.B. Cahoon. 2004. Photosynthetic and
heterotrophic impacts of nutrient loading to blackwater streams. Ecological Applications 14:823-838.
Mallin, M.A., L.B. Cahoon and M.J. Durako. 2005. Contrasting food-web support bases for
adjoining river-influenced and non-river influenced continental shelf ecosystems. Estuarine, Coastal and Shelf Science 62:55-62.
Mallin, M.A., V.L. Johnson, S.H. Ensign and T.A. MacPherson. 2006. Factors contributing
to hypoxia in rivers, lakes and streams. Limnology and Oceanography 51:690-701. Mallin, M.A., M.R. McIver, A.R. Robuck and A.K. Dickens. 2015. Industrial swine and
poultry production causes chronic nutrient and fecal microbial stream pollution. Water, Air and Soil Pollution 226:407, DOI 10.1007/s11270-015-2669-y.
NCDEQ 2017. 2017 White Lake Water Quality Investigation, White Lake, Bladen County
(Cape Fear Basin). North Carolina Department of Environmental Quality, Division of Water Resources.
Saul, B., M.G. Hudgens and M.A. Mallin. 2019. Upstream causes of downstream effects.
Journal of the American Statistical Association. https://doi.org/10.1080/01621459.2019.1574226.
U.S. EPA 1997. Methods for the Determination of Chemical Substances in Marine and
Estuarine Environmental Matrices, 2nd Ed. EPA/600/R-97/072. National Exposure Research Laboratory, Office of Research and Development, U.S. Environmental Protection Agency, Cincinnati, Ohio.
Welschmeyer, N.A. 1994. Fluorometric analysis of chlorophyll a in the presence of
chlorophyll b and phaeopigments. Limnology and Oceanography 39:1985-1993.
22

Tab
le 2
.1 W
ater
tem
pera
ture
(o C) d
urin
g 20
20 a
t the
Low
er C
ape
Fear
Riv
er P
rogr
am st
atio
ns.
NA
VH
BB
RR
M61
M54
M35
M23
M18
NC
11A
CD
PB
BT
ICN
CF6
JAN
9.1
9.7
9.7
10.4
10.2
10.1
9.8
9.7
JAN
9.6
9.7
9.9
10.1
10.2
12.2
FEB
10.1
9.7
9.8
10.4
10.1
10.8
11.2
11.4
FEB
11.4
11.5
11.7
12.2
12.0
12.8
MA
R10
.810
.711
.011
.211
.311
.512
.312
.4M
AR
16.6
16.7
16.6
16.8
16.6
16.6
APR
APR
MA
Y21
.221
.421
.522
.122
.222
.423
.123
.2M
AY
21.6
21.7
22.6
22.6
22.4
23.8
JUN
25.0
25.2
25.3
25.6
25.5
25.6
24.2
23.9
JUN
23.0
22.9
23.0
21.7
23.2
22.6
JUL
28.0
28.1
28.0
28.2
28.3
28.4
28.4
28.5
JUL
28.3
28.3
28.9
26.7
27.8
27.5
AU
G27
.928
.027
.929
.028
.428
.928
.828
.6A
UG
26.6
26.5
26.4
26.3
26.4
26.7
SEP
29.4
30.1
30.6
30.3
30.4
30.9
30.2
30.9
SEP
26.3
26.4
26.2
26.2
26.3
26.7
OC
T20
.321
.121
.421
.921
.922
.422
.823
.4O
CT
19.3
19.5
19.7
19.8
23.0
21.5
NO
V13
.613
.713
.914
.114
.114
.415
.115
.9N
OV
16.5
16.7
17.4
16.3
16.9
18.8
DE
C10
.310
.210
.411
.411
.512
.213
.214
.1D
EC
9.6
9.8
10.0
9.0
9.8
10.8
mea
n18
.718
.919
.019
.519
.419
.819
.920
.2m
ean
19.0
19.1
19.3
18.9
19.5
20.0
std
dev
8.1
8.3
8.3
8.1
8.1
8.1
7.7
7.7
std
dev
6.8
6.8
6.8
6.5
6.7
6.2
med
ian
20.3
21.1
21.4
21.9
21.9
22.4
22.8
23.2
med
ian
19.3
19.5
19.7
19.8
22.4
21.5
max
29.4
30.1
30.6
30.3
30.4
30.9
30.2
30.9
max
28.3
28.3
28.9
26.7
27.8
27.5
min
9.1
9.7
9.7
10.4
10.1
10.1
9.8
9.7
min
9.6
9.7
9.9
9.0
9.8
10.8
AN
CSA
RG
SN
C40
3PB
LR
CR
OC
NC
F117
SC-C
HB
210
CO
LSR
WC
6RC
LC
OG
CO
SRB
RN
HA
MJA
N10
.17.
78.
98.
97.
39.
68.
712
.812
.2JA
N15
.117
.416
.017
.016
.817
.317
.417
.217
.2FE
B14
.613
.614
.713
.813
.614
.214
.610
.610
.8FE
B8.
98.
37.
97.
88.
69.
29.
110
.39.
7M
AR
17.6
18.1
20.4
18.0
16.5
16.6
16.8
13.9
14.7
MA
R19
.919
.020
.020
.320
.119
.318
.215
.515
.0A
PRA
PRM
AY
21.9
21.4
21.9
22.9
22.9
23.6
21.9
22.0
23.0
MA
Y21
.322
.019
.419
.219
.218
.918
.021
.419
.7JU
N25
.324
.924
.725
.926
.725
.425
.023
.624
.3JU
N25
.625
.825
.226
.326
.226
.627
.125
.524
.3JU
L28
.027
.726
.728
.827
.327
.328
.030
.630
.3JU
L28
.026
.727
.626
.926
.326
.826
.526
.726
.0A
UG
26.5
26.2
27.1
27.5
27.4
26.9
25.7
26.7
27.3
AU
G25
.925
.224
.824
.824
.924
.925
.525
.024
.2SE
P21
.120
.921
.021
.722
.323
.821
.821
.823
.3SE
P25
.424
.623
.924
.824
.525
.125
.025
.024
.1O
CT
21.0
21.2
21.1
22.0
22.5
22.7
22.1
21.9
21.8
OC
T19
.919
.219
.019
.119
.320
.020
.419
.418
.2N
OV
18.7
18.3
18.7
19.0
19.9
20.0
18.3
17.7
20.0
NO
V16
.112
.114
.613
.712
.612
.112
.312
.411
.8D
EC
10.9
9.1
9.8
10.7
9.4
11.8
11.1
13.6
13.3
DE
C6.
85.
75.
85.
76.
05.
86.
97.
16.
6m
ean
19.6
19.0
19.5
19.9
19.6
20.2
19.5
19.6
20.1
mea
n19
.418
.718
.618
.718
.618
.718
.818
.717
.9st
d de
v6.
06.
66.
16.
67.
16.
26.
26.
36.
5st
d de
v7.
07.
27.
07.
27.
07.
27.
06.
76.
6m
edia
n21
.020
.921
.021
.722
.322
.721
.821
.821
.8m
edia
n19
.919
.219
.419
.219
.319
.318
.219
.418
.2m
ax28
.027
.727
.128
.827
.427
.328
.030
.630
.3m
ax28
.026
.727
.626
.926
.326
.827
.126
.726
.0m
in10
.17.
78.
98.
97.
39.
68.
710
.610
.8m
in6.
85.
75.
85.
76.
05.
86.
97.
16.
6
23
Tab
le 2
.2 S
alin
ity (p
su) d
urin
g 20
20 a
t the
Low
er C
ape
Fear
Riv
er P
rogr
am e
stua
rine
stat
ions
.
NA
VH
BB
RR
M61
M54
M35
M23
M18
NC
F6SC
-CH
JAN
0.1
0.7
1.5
6.3
6.9
10.9
17.0
21.2
0.3
0.6
FEB
0.0
0.1
0.1
2.2
2.8
5.7
12.7
15.7
0.0
6.5
MA
R0.
10.
10.
10.
30.
74.
38.
019
.90.
10.
1
APR
MA
Y0.
00.
00.
00.
00.
11.
78.
810
.80.
00.
1
JUN
0.0
0.0
0.0
0.1
0.1
1.1
6.1
11.2
0.0
0.1
JUL
0.1
2.5
0.8
3.0
6.6
12.8
26.1
30.5
0.1
2.1
AU
G0.
00.
10.
10.
72.
210
.417
.120
.70.
10.
1
SEP
0.1
0.5
0.7
2.8
7.4
14.4
26.0
31.3
7.0
0.1
OC
T0.
11.
90.
12.
13.
89.
119
.827
.90.
11.
9
NO
V0.
00.
00.
00.
00.
21.
47.
76.
22.
15.
7
DE
C0.
00.
00.
11.
52.
77.
517
.322
.70.
10.
1
mea
n0.
00.
50.
31.
73.
07.
215
.119
.80.
91.
6
std
dev
0.0
0.9
0.5
1.9
2.8
4.7
7.1
8.2
2.1
2.4
med
ian
0.0
0.1
0.1
1.5
2.7
7.5
17.0
20.7
0.1
0.1
max
0.1
2.5
1.5
6.3
7.4
14.4
26.1
31.3
7.0
6.5
min
0.0
0.0
0.0
0.0
0.1
1.1
6.1
6.2
0.0
0.1
24

051015202530
NA
VH
BB
RR
M61
M54
M35
M23
M18
NC
F6SC
-CH
Salinty (PSU)Fi
gure
2.1
Sal
inity
at t
he L
ower
Cap
e Fe
ar R
iver
Pro
gram
est
uari
ne st
atio
ns19
95-2
019
vers
us 2
020.
1995
-201
920
20
25

Tab
le 2
.3 C
ondu
ctiv
ity (m
S/cm
) dur
ing
2020
at t
he L
ower
Cap
e Fe
ar R
iver
Pro
gram
stat
ions
.
NA
VH
BB
RR
M61
M54
M35
M23
M18
NC
11A
CD
PB
BT
ICN
CF6
JAN
0.11
1.44
3.18
10.9
612
.22
18.3
727
.68
33.9
3JA
N0.
080.
090.
100.
100.
100.
61FE
B0.
090.
110.
124.
035.
2510
.08
21.1
225
.67
FEB
0.07
0.08
0.08
0.07
0.07
0.09
MA
R0.
100.
100.
110.
531.
377.
6613
.96
31.9
4M
AR
0.09
0.21
0.11
0.10
0.10
0.12
APR
APR
MA
Y0.
070.
070.
080.
100.
283.
1614
.90
17.0
4M
AY
0.07
0.08
0.08
0.07
0.07
0.07
JUN
0.10
0.09
0.10
0.10
0.11
2.18
11.0
819
.68
JUN
0.08
0.09
0.09
0.08
0.11
0.10
JUL
0.21
4.70
1.50
5.50
11.6
021
.40
40.3
547
.17
JUL
0.09
0.10
0.16
0.08
0.11
0.11
AU
G0.
100.
121.
121.
334.
1510
.35
25.6
233
.31
AU
G0.
090.
100.
090.
080.
090.
11SE
P0.
150.
921.
475.
2312
.77
23.9
740
.86
48.2
6SE
P0.
120.
110.
130.
130.
1512
.20
OC
T0.
113.
590.
143.
966.
8515
.65
31.6
443
.32
OC
T0.
090.
110.
110.
100.
110.
15N
OV
0.08
0.08
0.08
0.09
0.39
2.61
13.3
210
.85
NO
V0.
130.
130.
120.
110.
113.
98D
EC
0.10
0.09
0.12
2.92
4.96
13.0
028
.12
35.9
0D
EC
0.10
0.11
0.10
0.09
0.10
0.12
mea
n0.
111.
030.
733.
165.
4511
.67
24.4
231
.55
mea
n0.
090.
110.
110.
090.
101.
60st
d de
v0.
041.
621.
003.
324.
887.
5710
.55
12.2
6st
d de
v0.
020.
040.
020.
020.
023.
70m
edia
n0.
100.
110.
122.
924.
9610
.35
25.6
233
.31
med
ian
0.09
0.10
0.10
0.09
0.10
0.12
max
0.21
4.70
3.18
10.9
612
.77
23.9
740
.86
48.2
6m
ax0.
130.
210.
160.
130.
1512
.20
min
0.07
0.07
0.08
0.09
0.11
2.18
11.0
810
.85
min
0.07
0.08
0.08
0.07
0.07
0.07
AN
CSA
RG
SN
C40
3PB
LR
CR
OC
NC
F117
SC-C
HB
210
CO
LSR
WC
6RC
LC
OG
CO
SRB
RN
HA
MJA
N0.
150.
170.
150.
460.
370.
140.
160.
151.
26JA
N0.
090.
060.
070.
130.
090.
110.
080.
070.
10FE
B0.
090.
140.
130.
380.
500.
100.
120.
090.
12FE
B0.
070.
050.
060.
120.
090.
110.
070.
090.
11M
AR
0.08
0.15
0.14
0.41
0.81
0.11
0.20
0.10
0.16
MA
R0.
090.
060.
060.
130.
090.
130.
080.
110.
15A
PRA
PRM
AY
0.08
0.13
0.12
0.46
0.57
0.12
0.10
0.07
0.10
MA
Y0.
080.
050.
050.
080.
060.
090.
070.
110.
16JU
N0.
070.
130.
110.
430.
720.
130.
100.
080.
10JU
N0.
060.
060.
050.
130.
080.
090.
070.
100.
16JU
L0.
110.
330.
271.
180.
420.
140.
260.
123.
94JU
L0.
090.
060.
070.
140.
070.
150.
080.
090.
06A
UG
0.09
0.16
0.14
0.41
1.65
0.12
0.22
0.11
0.19
AU
G0.
080.
060.
050.
120.
090.
090.
060.
100.
17SE
P0.
100.
200.
180.
651.
100.
120.
150.
110.
28SE
P0.
100.
060.
060.
150.
100.
150.
060.
110.
18O
CT
0.08
0.21
0.18
1.21
1.44
0.10
0.11
0.10
3.63
OC
T0.
090.
060.
070.
140.
110.
130.
080.
110.
15N
OV
0.10
0.20
0.18
0.95
1.16
0.14
0.19
0.15
10.0
4N
OV
0.06
0.06
0.05
0.10
0.07
0.08
0.06
0.09
0.14
DE
C0.
090.
140.
140.
440.
560.
110.
120.
100.
12D
EC
0.08
0.06
0.06
0.07
0.08
0.09
0.11
0.09
0.13
mea
n0.
090.
180.
160.
630.
840.
120.
160.
111.
81m
ean
0.08
0.06
0.06
0.12
0.08
0.11
0.07
0.10
0.14
std
dev
0.02
0.06
0.04
0.32
0.43
0.01
0.05
0.03
3.08
std
dev
0.01
0.00
0.01
0.03
0.01
0.02
0.02
0.01
0.03
med
ian
0.09
0.16
0.14
0.46
0.72
0.12
0.15
0.10
0.19
med
ian
0.08
0.06
0.06
0.13
0.09
0.11
0.07
0.10
0.15
max
0.15
0.33
0.27
1.21
1.65
0.14
0.26
0.15
10.0
4m
ax0.
100.
060.
070.
150.
110.
150.
110.
110.
18m
in0.
070.
130.
110.
380.
370.
100.
100.
070.
10m
in0.
060.
050.
050.
070.
060.
080.
060.
070.
06
26

Tab
le 2
.4 p
H (s
u) d
urin
g 20
20 a
t the
Low
er C
ape
Fear
Riv
er P
rogr
am st
atio
ns.
NA
VH
BB
RR
M61
M54
M35
M23
M18
NC
11A
CD
PB
BT
ICN
CF6
JAN
7.3
7.5
7.6
7.4
7.7
8.0
8.1
8.1
JAN
5.5
5.9
6.2
6.3
6.4
6.7
FEB
6.5
6.7
6.8
7.0
7.2
7.6
7.9
8.0
FEB
6.0
6.2
6.5
6.3
6.4
6.1
MA
R6.
96.
97.
16.
97.
07.
27.
68.
0M
AR
6.7
6.9
6.7
6.4
6.5
6.3
APR
APR
MA
Y7.
06.
46.
46.
36.
66.
97.
37.
5M
AY
6.3
6.4
6.3
6.1
6.2
5.7
JUN
5.9
6.1
6.2
5.9
6.1
6.7
7.1
7.5
JUN
6.9
6.7
6.6
6.3
6.7
6.4
JUL
6.1
6.4
6.6
6.5
7.0
7.4
7.9
8.1
JUL
6.5
6.4
6.5
5.9
6.8
6.0
AU
G7.
37.
37.
67.
08.
07.
97.
97.
9A
UG
6.5
6.6
6.5
6.2
6.2
6.2
SEP
6.6
6.5
6.6
6.8
7.1
7.5
7.9
8.0
SEP
6.7
6.7
6.6
6.5
6.5
6.8
OC
T6.
56.
56.
96.
76.
87.
27.
98.
0O
CT
6.7
6.8
6.8
6.6
6.7
6.8
NO
V6.
46.
56.
36.
46.
56.
57.
06.
8N
OV
7.0
7.0
7.0
6.7
6.7
6.6
DE
C6.
66.
56.
86.
87.
07.
48.
08.
0D
EC
6.7
6.7
6.7
6.5
6.8
6.3
mea
n6.
66.
76.
86.
77.
07.
37.
77.
8m
ean
6.5
6.6
6.6
6.3
6.5
6.4
std
dev
0.4
0.4
0.5
0.4
0.5
0.5
0.4
0.4
std
dev
0.4
0.3
0.2
0.2
0.2
0.4
med
ian
6.6
6.5
6.8
6.8
7.0
7.4
7.9
8.0
med
ian
6.7
6.7
6.6
6.3
6.5
6.3
max
7.3
7.5
7.6
7.4
8.0
8.0
8.1
8.1
max
7.0
7.0
7.0
6.7
6.8
6.8
min
5.9
6.1
6.2
5.9
6.1
6.5
7.0
6.8
min
5.5
5.9
6.2
5.9
6.2
5.7
AN
CSA
RG
SN
C40
3PB
LR
CR
OC
NC
F117
SC-C
HB
210
CO
LSR
WC
6RC
LC
OG
CO
SRB
RN
HA
MJA
N6.
66.
66.
86.
76.
76.
66.
96.
76.
3JA
N5.
53.
35.
26.
25.
65.
96.
05.
86.
0FE
B4.
96.
87.
26.
86.
86.
96.
76.
26.
5FE
B6.
04.
05.
86.
66.
36.
76.
66.
56.
7M
AR
5.4
6.9
7.2
7.1
6.7
7.0
6.7
6.3
6.7
MA
R5.
93.
85.
86.
66.
46.
66.
56.
77.
0A
PRA
PRM
AY
5.3
6.3
6.1
6.5
6.6
7.0
6.4
5.1
6.1
MA
Y5.
94.
05.
15.
95.
96.
05.
86.
56.
6JU
N5.
16.
36.
06.
46.
66.
86.
45.
65.
8JU
N5.
64.
15.
06.
76.
36.
46.
27.
17.
1JU
L6.
66.
96.
76.
86.
86.
96.
76.
56.
1JU
L5.
63.
66.
66.
76.
56.
66.
16.
26.
5A
UG
5.7
6.7
6.6
6.8
7.0
7.6
6.9
6.2
6.7
AU
G5.
84.
15.
56.
66.
46.
46.
16.
76.
6SE
P5.
46.
76.
56.
76.
87.
06.
75.
96.
8SE
P6.
44.
06.
26.
96.
76.
76.
26.
87.
1O
CT
4.8
6.8
6.7
6.9
6.9
6.9
6.5
6.3
6.5
OC
T6.
24.
16.
36.
76.
76.
66.
36.
76.
8N
OV
6.2
6.8
6.6
6.6
6.8
7.0
7.0
6.6
6.8
NO
V5.
63.
44.
86.
05.
96.
26.
26.
26.
6D
EC
5.3
6.7
6.8
6.6
6.8
6.8
6.5
6.2
6.4
DE
C5.
83.
75.
46.
36.
06.
56.
46.
16.
6m
ean
5.6
6.7
6.7
6.7
6.8
7.0
6.7
6.1
6.4
mea
n5.
83.
85.
66.
56.
26.
46.
26.
56.
7st
d de
v0.
60.
20.
40.
20.
10.
20.
20.
50.
3st
d de
v0.
30.
30.
60.
30.
40.
30.
20.
40.
3m
edia
n5.
46.
76.
76.
76.
86.
96.
76.
26.
5m
edia
n5.
84.
05.
56.
66.
36.
56.
26.
56.
6m
ax6.
66.
97.
27.
17.
07.
67.
06.
76.
8m
ax6.
44.
16.
66.
96.
76.
76.
67.
17.
1m
in4.
86.
36.
06.
46.
66.
66.
45.
15.
8m
in5.
53.
34.
85.
95.
65.
95.
85.
86.
0
27
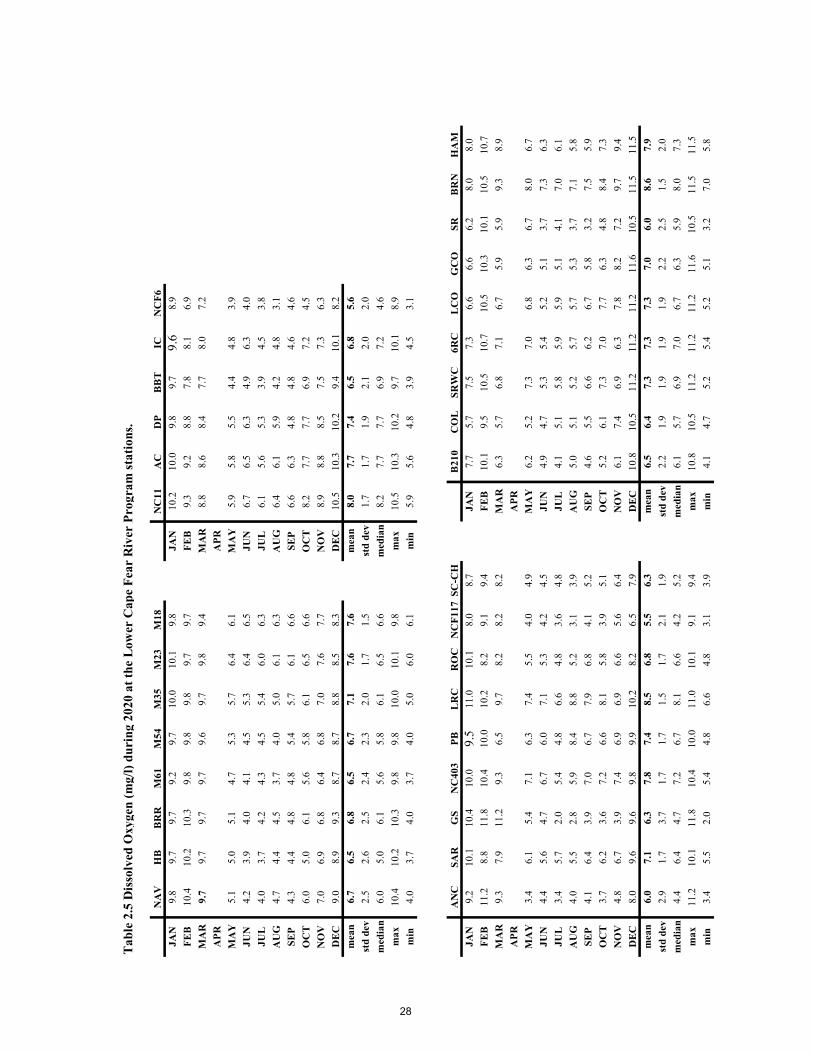
Tab
le 2
.5 D
isso
lved
Oxy
gen
(mg/
l) du
ring
202
0 at
the
Low
er C
ape
Fear
Riv
er P
rogr
am st
atio
ns.
NA
VH
BB
RR
M61
M54
M35
M23
M18
NC
11A
CD
PB
BT
ICN
CF6
JAN
9.8
9.7
9.7
9.2
9.7
10.0
10.1
9.8
JAN
10.2
10.0
9.8
9.7
9.6
8.9
FEB
10.4
10.2
10.3
9.8
9.8
9.8
9.7
9.7
FEB
9.3
9.2
8.8
7.8
8.1
6.9
MA
R9.
79.
79.
79.
79.
69.
79.
89.
4M
AR
8.8
8.6
8.4
7.7
8.0
7.2
APR
APR
MA
Y5.
15.
05.
14.
75.
35.
76.
46.
1M
AY
5.9
5.8
5.5
4.4
4.8
3.9
JUN
4.2
3.9
4.0
4.1
4.5
5.3
6.4
6.5
JUN
6.7
6.5
6.3
4.9
6.3
4.0
JUL
4.0
3.7
4.2
4.3
4.5
5.4
6.0
6.3
JUL
6.1
5.6
5.3
3.9
4.5
3.8
AU
G4.
74.
44.
53.
74.
05.
06.
16.
3A
UG
6.4
6.1
5.9
4.2
4.8
3.1
SEP
4.3
4.4
4.8
4.8
5.4
5.7
6.1
6.6
SEP
6.6
6.3
4.8
4.8
4.6
4.6
OC
T6.
05.
06.
15.
65.
86.
16.
56.
6O
CT
8.2
7.7
7.7
6.9
7.2
4.5
NO
V7.
06.
96.
86.
46.
87.
07.
67.
7N
OV
8.9
8.8
8.5
7.5
7.3
6.3
DEC
9.0
8.9
9.3
8.7
8.7
8.8
8.5
8.3
DEC
10.5
10.3
10.2
9.4
10.1
8.2
mea
n6.
76.
56.
86.
56.
77.
17.
67.
6m
ean
8.0
7.7
7.4
6.5
6.8
5.6
std
dev
2.5
2.6
2.5
2.4
2.3
2.0
1.7
1.5
std
dev
1.7
1.7
1.9
2.1
2.0
2.0
med
ian
6.0
5.0
6.1
5.6
5.8
6.1
6.5
6.6
med
ian
8.2
7.7
7.7
6.9
7.2
4.6
max
10.4
10.2
10.3
9.8
9.8
10.0
10.1
9.8
max
10.5
10.3
10.2
9.7
10.1
8.9
min
4.0
3.7
4.0
3.7
4.0
5.0
6.0
6.1
min
5.9
5.6
4.8
3.9
4.5
3.1
AN
CSA
RG
SN
C40
3PB
LRC
RO
CN
CF1
17SC
-CH
B21
0C
OL
SRW
C6R
CLC
OG
CO
SRB
RN
HA
MJA
N9.
210
.110
.410
.09.
511
.010
.18.
08.
7JA
N7.
75.
77.
57.
36.
66.
66.
28.
08.
0FE
B11
.28.
811
.810
.410
.010
.28.
29.
19.
4FE
B10
.19.
510
.510
.710
.510
.310
.110
.510
.7M
AR
9.3
7.9
11.2
9.3
6.5
9.7
8.2
8.2
8.2
MA
R6.
35.
76.
87.
16.
75.
95.
99.
38.
9A
PRA
PRM
AY
3.4
6.1
5.4
7.1
6.3
7.4
5.5
4.0
4.9
MA
Y6.
25.
27.
37.
06.
86.
36.
78.
06.
7JU
N4.
45.
64.
76.
76.
07.
15.
34.
24.
5JU
N4.
94.
75.
35.
45.
25.
13.
77.
36.
3JU
L3.
45.
72.
05.
44.
86.
64.
83.
64.
8JU
L4.
15.
15.
85.
95.
95.
14.
17.
06.
1A
UG
4.0
5.5
2.8
5.9
8.4
8.8
5.2
3.1
3.9
AU
G5.
05.
15.
25.
75.
75.
33.
77.
15.
8SE
P4.
16.
43.
97.
06.
77.
96.
84.
15.
2SE
P4.
65.
56.
66.
26.
75.
83.
27.
55.
9O
CT
3.7
6.2
3.6
7.2
6.6
8.1
5.8
3.9
5.1
OC
T5.
26.
17.
37.
07.
76.
34.
88.
47.
3N
OV
4.8
6.7
3.9
7.4
6.9
6.9
6.6
5.6
6.4
NO
V6.
17.
46.
96.
37.
88.
27.
29.
79.
4D
EC8.
09.
69.
69.
89.
910
.28.
26.
57.
9D
EC10
.810
.511
.211
.211
.211
.610
.511
.511
.5m
ean
6.0
7.1
6.3
7.8
7.4
8.5
6.8
5.5
6.3
mea
n6.
56.
47.
37.
37.
37.
06.
08.
67.
9st
d de
v2.
91.
73.
71.
71.
71.
51.
72.
11.
9st
d de
v2.
21.
91.
91.
91.
92.
22.
51.
52.
0m
edia
n4.
46.
44.
77.
26.
78.
16.
64.
25.
2m
edia
n6.
15.
76.
97.
06.
76.
35.
98.
07.
3m
ax11
.210
.111
.810
.410
.011
.010
.19.
19.
4m
ax10
.810
.511
.211
.211
.211
.610
.511
.511
.5m
in3.
45.
52.
05.
44.
86.
64.
83.
13.
9m
in4.
14.
75.
25.
45.
25.
13.
27.
05.
8
28

0123456789
NC
11A
CD
PIC
NA
VH
BB
RR
M61
M54
M35
M23
M18
NC
F117
NC
F6B
210
BB
T
Dissolved Oxygen (mg/L)Fi
gure
2.2
Dis
solv
ed O
xyge
n at
the
Low
er C
ape
Fear
Riv
er P
rogr
am m
ains
tem
stat
ions
19
95-2
019
vers
us 2
020.
1995
-201
920
20
29

Tab
le 2
.6 F
ield
Tur
bidi
ty (N
TU
) dur
ing
2020
at t
he L
ower
Cap
e Fe
ar R
iver
Pro
gram
stat
ions
.
NA
VH
BB
RR
M61
M54
M35
M23
M18
NC
11A
CD
PB
BT
ICN
CF6
JAN
1215
1010
76
713
JAN
3634
3629
2914
FEB
1718
2113
1410
65
FEB
3537
3114
214
MA
R10
99
910
107
5M
AR
67
85
74
APR
APR
MA
Y15
1513
1418
147
6M
AY
3331
228
124
JUN
96
55
55
89
JUN
2724
218
155
JUL
67
54
31
25
JUL
87
63
54
AU
G11
108
57
44
3A
UG
1313
216
104
SEP
44
54
32
32
SEP
44
44
53
OC
T6
55
44
24
6O
CT
1413
98
95
NO
V13
1312
911
95
6N
OV
87
55
43
DEC
1311
138
95
54
DEC
1818
1810
164
mea
n11
1010
88
65
6m
ean
1818
169
125
std
dev
45
54
54
23
std
dev
1212
117
83
med
ian
1110
98
75
55
med
ian
1413
188
104
max
1718
2114
1814
813
max
3637
3629
2914
min
44
54
31
22
min
44
43
43
AN
CSA
RG
SN
C40
3PB
LRC
RO
CN
CF1
17SC
-CH
B21
0C
OL
SRW
C6R
CLC
OG
CO
SRB
RN
HA
MJA
N3
11
43
32
312
JAN
35
39
72
720
13FE
B5
31
45
79
56
FEB
22
24
10
47
6M
AR
52
14
44
44
9M
AR
33
25
32
49
6A
PRA
PRM
AY
25
16
68
55
10M
AY
54
3035
77
277
4JU
N5
55
89
57
48
JUN
45
16
23
68
5JU
L7
69
421
48
314
JUL
44
35
144
511
8A
UG
65
34
94
142
8A
UG
32
25
22
214
5SE
P4
31
25
35
24
SEP
42
34
45
39
3O
CT
54
22
47
83
4O
CT
52
26
32
37
4N
OV
72
13
57
53
13N
OV
72
44
22
38
5D
EC6
00
38
35
26
DEC
51
21
32
65
4m
ean
53
24
75
73
9m
ean
43
58
43
610
6st
d de
v2
23
25
23
13
std
dev
11
89
42
74
3m
edia
n5
31
45
45
38
med
ian
42
25
32
48
5m
ax7
69
821
814
514
max
75
3035
147
2720
13m
in2
00
23
32
24
min
21
11
10
25
3
30

0510152025
NC
11A
CD
PIC
NA
VH
BB
RR
M61
M54
M35
M23
M18
NC
F117
NC
F6B
210
BB
T
Field Turbidity (NTU)Fi
gure
2.3
Fie
ld T
urbi
dity
at t
he L
ower
Cap
e Fe
ar R
iver
Pro
gram
mai
nste
m st
atio
ns,
1995
-201
9 ve
rsus
202
0.
1995
-201
920
20
31

Tab
le 2
.7 T
otal
Sus
pend
ed S
olid
s (m
g/L
) dur
ing
2020
at t
he L
ower
Cap
e Fe
ar R
iver
Pro
gram
stat
ions
.
NA
VH
BB
RR
M61
M54
M35
M23
M18
NC
11A
CD
PIC
NC
F6JA
N10
.912
.111
.512
.411
.510
.819
.630
.8JA
N35
.838
.819
.635
.520
.0FE
B11
.912
.511
.513
.613
.511
.912
.114
.6FE
B26
.829
.624
.614
.33.
7M
AR
7.0
7.3
7.0
7.5
10.1
11.2
10.6
16.3
MA
R3.
33.
96.
45.
75.
7A
PRA
PRM
AY
13.5
12.1
11.0
18.1
23.3
15.4
12.6
8.9
MA
Y30
.030
.724
.014
.65.
0JU
N8.
86.
06.
27.
66.
47.
112
.418
.8JU
N29
.831
.621
.917
.27.
5JU
L6.
69.
67.
96.
98.
16.
312
.120
.7JU
L5.
64.
53.
83.
48.
2A
UG
13.0
9.6
8.8
5.4
9.9
11.7
14.4
12.2
AU
G14
.015
.219
.69.
25.
6SE
P2.
94.
05.
98.
89.
710
.313
.615
.2SE
P3.
02.
52.
65.
710
.2O
CT
5.4
7.1
3.1
5.1
6.2
5.9
7.1
16.6
OC
T15
.113
.96.
53.
69.
1N
OV
10.5
9.5
8.4
5.1
9.5
8.0
8.0
8.7
NO
V9.
87.
23.
11.
34.
7D
EC
7.8
7.9
7.3
10.2
10.3
10.8
7.7
21.6
DE
C13
.715
.617
.315
.94.
7m
ean
8.9
8.9
8.1
9.2
10.8
9.9
11.8
16.8
mea
n17
.017
.613
.611
.511
.5st
d de
v3.
32.
72.
64.
14.
72.
93.
66.
3st
d de
v11
.713
.09.
09.
79.
7m
edia
n8.
89.
57.
97.
69.
910
.812
.116
.3m
edia
n14
.015
.217
.38.
99.
2m
ax13
.512
.511
.518
.123
.315
.419
.630
.8m
ax35
.838
.824
.65.
435
.5m
in2.
94.
03.
15.
16.
25.
97.
18.
7m
in3.
02.
52.
68.
91.
3
AN
CSA
RG
SN
C40
3PB
LR
CR
OC
NC
F117
SC-C
HB
210
CO
LSR
WC
6RC
LC
OG
CO
SRB
RN
HA
MJA
N1.
34.
71.
32.
84.
53.
818
.2JA
N4.
21.
3FE
B4.
84.
44.
05.
67.
73.
76.
5FE
B2.
71.
3M
AR
2.9
5.5
3.9
3.3
18.9
4.3
14.8
MA
R3.
83.
4A
PRA
PRM
AY
2.6
6.6
5.9
10.0
5.0
4.7
9.8
MA
Y4.
26.
9JU
N5.
57.
05.
43.
36.
72.
511
.0JU
N4.
24.
0JU
L6.
44.
313
.22.
52.
63.
420
.3JU
L3.
63.
4A
UG
6.5
6.8
9.6
8.3
3.0
10.2
AU
G1.
51.
3SE
P5.
02.
53.
31.
34.
53.
15.
5SE
P3.
46.
6O
CT
6.8
3.3
4.7
7.8
6.6
3.6
5.7
OC
T3.
82.
6N
OV
1.3
2.5
12.4
10.5
1.3
12.1
2.6
NO
V6.
01.
3D
EC
1.3
3.7
4.5
4.1
6.3
3.4
4.6
DE
C3.
81.
3m
ean
3.8
4.6
5.9
5.5
6.6
4.3
9.9
mea
n3.
73.
0st
d de
v2.
21.
63.
73.
44.
62.
65.
8st
d de
v1.
12.
1m
edia
n3.
94.
44.
74.
16.
33.
69.
8m
edia
n3.
82.
6m
ax6.
87.
013
.210
.518
.912
.120
.3m
ax6.
06.
9m
in1.
32.
51.
31.
31.
32.
52.
6m
in1.
51.
3
32

Tab
le 2
.8 T
otal
Nitr
ogen
(µg/
l) du
ring
202
0 at
the
Low
er C
ape
Fear
Riv
er P
rogr
am st
atio
ns.
* Th
is n
umbe
r is a
n ad
ditio
n of
TK
N a
nd N
O3.
If <
val
ue is
repo
rted
we
use
1/2
that
val
ue in
the
calc
ulat
ion.
NA
VH
BB
RR
M61
M54
M35
M23
M18
NC
11A
CD
PIC
NC
F6JA
N20
030
040
040
020
050
200
50JA
N1,
590
490
490
500
430
FEB
1,44
01,
360
1,56
01,
500
1,24
01,
840
900
1,00
0FE
B1,
730
1,54
01,
440
1,19
01,
540
MA
R39
051
010
037
030
046
050
060
0M
AR
1,04
01,
040
790
730
880
APR
APR
MA
Y69
069
079
076
084
080
068
062
0M
AY
930
860
780
840
710
JUN
870
940
850
1,25
087
087
084
059
0JU
N85
080
089
087
087
0JU
L98
01,
050
1,07
01,
210
890
840
530
530
JUL
970
880
1,11
085
088
0A
UG
1,17
01,
280
1,11
01,
100
1,24
01,
060
1,02
076
0A
UG
810
840
830
940
1,11
0SE
P1,
270
930
930
1,07
01,
040
1,04
088
050
0SE
P1,
050
820
860
860
810
OC
T1,
200
840
710
1,02
098
083
047
064
0O
CT
1,49
079
070
084
090
0N
OV
1,10
080
084
01,
180
950
780
670
950
NO
V1,
310
500
620
550
920
DE
C1,
230
710
720
1,17
060
080
068
079
0D
EC
1,51
070
087
090
01,
060
mea
n95
885
582
51,
003
832
852
670
639
mea
n1,
207
842
853
825
919
std
dev
388
311
378
353
340
432
236
254
std
dev
328
282
251
186
272
med
ian
1,10
084
084
01,
100
890
830
680
620
med
ian
1,05
082
083
085
088
0m
ax1,
440
1,36
01,
560
1,50
01,
240
1,84
01,
020
1,00
0m
ax1,
730
1,54
01,
440
1,19
01,
540
min
200
300
100
370
200
5020
050
min
810
490
490
500
430
AN
CSA
RG
SN
C40
3PB
LR
CR
OC
NC
F117
SC-C
HB
210
CO
LSR
-WC
6RC
LC
OG
CO
SRB
RN
HA
MJA
N1,
500
1,10
050
02,
660
1,11
01,
200
1,52
090
034
0JA
N90
01,
300
700
1,10
01,
130
600
700
1,20
01,
900
FEB
1,88
02,
550
1,85
05,
870
5,41
02,
410
2,98
01,
780
1,71
0FE
B2,
190
1,84
01,
580
2,85
01,
460
1,87
01,
880
2,57
02,
130
MA
R1,
220
930
500
2,32
02,
300
740
1,01
048
058
0M
AR
1,26
01,
000
800
1,18
01,
460
190
910
1,72
01,
290
APR
APR
MA
Y85
075
052
01,
640
2,14
081
01,
150
920
900
MA
Y68
01,
700
1,31
01,
540
1,51
01,
260
1,58
01,
190
980
JUN
1,52
071
081
01,
190
1,23
03,
850
1,06
090
092
0JU
N1,
090
1,93
080
01,
740
1,28
084
096
01,
420
1,27
0JU
L2,
110
950
1,93
01,
780
1,92
01,
840
7,78
01,
560
1,26
0JU
L1,
160
1,79
01,
190
1,72
01,
330
1,16
01,
030
1,40
01,
310
AU
G1,
740
1,05
091
01,
900
980
1,00
01,
790
1,42
084
0A
UG
1,25
01,
390
1,19
01,
040
1,44
01,
000
980
1,04
098
0SE
P2,
020
900
1,04
01,
140
1,16
01,
210
1,32
01,
060
980
SEP
1,24
01,
380
1,32
02,
480
1,38
01,
060
1,29
01,
140
910
OC
T1,
800
900
940
840
980
1,50
01,
130
910
980
OC
T1,
100
2,23
096
01,
240
1,10
082
072
074
01,
980
NO
V1,
570
820
790
1,10
01,
860
960
1,63
076
01,
320
NO
V93
01,
170
880
1,17
01,
090
680
900
1,76
01,
870
DE
C1,
430
620
1,05
01,
390
1,09
01,
410
820
670
950
DE
C1,
220
730
930
2,76
02,
110
1,01
091
01,
680
1,76
0m
ean
1,60
41,
025
985
1,98
51,
835
1,53
92,
017
1,03
398
0m
ean
1,18
41,
496
1,06
01,
711
1,39
095
41,
078
1,44
21,
489
std
dev
364
525
491
1,40
11,
283
907
1,99
939
536
4st
d de
v38
044
427
568
128
342
536
448
844
9m
edia
n1,
570
900
910
1,64
01,
230
1,21
01,
320
910
950
med
ian
1,16
01,
390
960
1,54
01,
380
1,00
096
01,
400
1,31
0m
ax2,
110
2,55
01,
930
5,87
05,
410
3,85
07,
780
1,78
01,
710
max
2,19
02,
230
1,58
02,
850
2,11
01,
870
1,88
02,
570
2,13
0m
in85
062
050
084
098
074
082
048
034
0m
in68
073
070
01,
040
1,09
019
070
074
091
0
33

Figure 2.4. 20-year changes in nitrate at selected non-point source sites in the Lower Cape Fear basin; note general increasing trend except for wetland-rich Colly Creek. CAFO numbers are approximates.
y = 37.647x - 74972R² = 0.6443
0
200
400
600
800
1,000
1,200
1,400
2000 2005 2010 2015 2020
Median Annual Nitrate Concentrations over 20 Years, Six Runs Creek - 179 swine CAFOs
y = 44.767x - 89106R² = 0.3217
0
200
400
600
800
1,000
1,200
1,400
1,600
1,800
2000 2005 2010 2015 2020
Median Annual Nitrate Concentrations over 20 years, Rockfish Creek - 75 Swine CAFOs
y = 20.408x - 40799R² = 0.7557
0
100
200
300
400
500
600
700
2000 2005 2010 2015 2020
Median Annual Nitrate Concentrations over 20 years, Great Coharie Creek - 91Swine Cafos
y = 19.699x - 39274R² = 0.5511
0
100
200
300
400
500
600
700
2000 2005 2010 2015 2020
Median Annual Nitrate Concentrations over 20 Years, Little Coharie Creek - 86 Swine CAFOs
y = 0.5368x - 1062.4R² = 0.1317
0
50
100
150
200
250
2000 2005 2010 2015 2020
Median Annnual Nitrate Concentrations over 20 Years , Colly Creek - 4 Swine CAFOs
y = 8.0353x - 16058R² = 0.5388
0
50
100
150
200
250
2000 2005 2010 2015 2020
Median Annual Nitrate Concenttrations over 20 years, Angola Creek, 2000-2019 - 13 Swine CAFOs
34

Tab
le 2
.9 N
itrat
e/N
itrite
(µg/
l) du
ring
202
0 at
the
Low
er C
ape
Fear
Riv
er st
atio
ns.
NA
VH
BB
RR
M61
M54
M35
M23
M18
NC
11A
CD
PIC
NC
F6JA
N10
1010
1010
1010
10JA
N90
9090
030
FEB
140
160
160
1040
4010
10FE
B53
054
054
049
014
0M
AR
190
110
1070
1060
1010
MA
R74
074
079
043
038
0A
PRA
PRM
AY
290
290
290
360
340
300
280
220
MA
Y43
036
038
034
021
0JU
N27
014
025
025
027
027
024
019
0JU
N50
100
290
270
70JU
L20
026
030
026
022
017
060
10JU
L80
100
180
6010
AU
G42
039
038
030
033
022
016
010
0A
UG
1010
1010
10SE
P36
010
4030
010
1010
10SE
P20
1010
1010
OC
T28
010
1028
010
1010
10O
CT
540
1010
1010
NO
V35
010
1032
010
1010
280
NO
V67
010
1010
10D
EC
500
1010
460
1010
1018
0D
EC
620
1010
1010
mea
n27
412
713
423
811
510
174
94m
ean
344
180
211
149
81st
d de
v13
613
514
614
614
311
610
310
5st
d de
v29
325
326
419
311
9m
edia
n28
011
040
280
1040
1010
med
ian
430
9090
1010
max
500
390
380
460
340
300
280
280
max
740
740
790
490
380
min
1010
1010
1010
1010
min
1010
100
10
AN
CSA
RG
SN
C40
3PB
LR
CR
OC
NC
F117
SC-C
HB
210
CO
LSR
-WC
6RC
LC
OG
CO
SRB
RN
HA
MJA
N10
100
1046
031
010
120
1040
JAN
200
1010
1030
1010
1010
FEB
280
1,35
085
04,
670
3,91
01,
110
1,18
068
041
0FE
B59
040
380
1,75
046
01,
070
380
770
1,03
0M
AR
2013
010
1,72
01,
500
240
510
180
80M
AR
260
1010
068
046
019
011
062
029
0A
PRA
PRM
AY
5025
012
094
01,
540
310
550
420
400
MA
Y80
1021
01,
240
510
6048
049
028
0JU
N10
1010
130
6010
4010
10JU
N10
010
8078
037
060
7054
042
0JU
L18
010
310
580
480
610
6,16
029
025
0JU
L22
030
330
920
560
370
180
480
370
AU
G10
1010
100
3010
210
1040
AU
G22
050
140
510
280
4030
310
200
SEP
130
1040
9030
290
8010
190
SEP
1030
150
1,19
032
030
5037
090
OC
T14
010
7010
100
540
3010
220
OC
T10
1013
032
042
010
6010
10N
OV
8010
1090
970
120
7010
180
NO
V10
1040
810
490
1060
740
1,06
0D
EC
340
9036
013
010
034
010
1024
0D
EC
670
4026
01,
820
1,38
047
031
077
01,
130
mea
n11
418
016
481
182
132
681
514
918
7m
ean
215
2316
691
248
021
115
846
544
5st
d de
v11
439
526
01,
379
1,17
433
01,
808
226
137
std
dev
225
1611
755
833
232
516
027
242
6m
edia
n80
1040
130
310
290
120
1019
0m
edia
n20
010
140
810
460
6070
490
290
max
340
1,35
085
04,
670
3,91
01,
110
6,16
068
041
0m
ax67
050
380
1,82
01,
380
1,07
048
077
01,
130
min
1010
1010
3010
1010
10m
in10
1010
1030
1010
1010
35

Tab
le 2
.10
Am
mon
ia (µ
g/l)
duri
ng 2
020
at th
e L
ower
Cap
e Fe
ar R
iver
stat
ions
.
NA
VH
BB
RR
M61
M54
M35
M23
M18
NC
11A
CD
PIC
NC
F6JA
N10
3010
2030
1017
017
0JA
N70
4050
5040
FEB
1070
3040
110
7070
120
FEB
2010
1010
10M
AR
1010
5060
8070
6016
0M
AR
5016
090
6030
APR
APR
MA
Y40
4040
5080
6070
110
MA
Y70
7050
6060
JUN
6050
4080
5050
6010
JUN
110
130
110
100
70JU
L60
6030
7016
040
140
60JU
L70
7015
060
20A
UG
4050
5070
130
8012
025
0A
UG
4070
5050
40SE
P80
9050
100
7010
300
330
SEP
9090
100
9040
OC
T50
6050
5060
1010
10O
CT
3060
5050
40N
OV
6050
9070
230
5010
20N
OV
100
9090
8090
DE
C80
6010
080
7010
4010
DE
C80
120
120
150
100
mea
n45
5249
6397
4295
114
mea
n66
8379
6949
std
dev
2621
2622
5728
8510
7st
d de
v29
4241
3628
med
ian
5050
5070
8050
7011
0m
edia
n70
7090
6040
max
8090
100
100
230
8030
033
0m
ax11
016
015
015
010
0m
in10
1010
2030
1010
10m
in20
1010
1010
AN
CSA
RG
SN
C40
3PB
LR
CR
OC
NC
F117
SC-C
HB
210
CO
LSR
-WC
6RC
LC
OG
CO
SRB
RN
HA
MJA
N19
010
101,
680
2070
1020
30JA
N10
050
8060
1020
5040
70FE
B30
4010
8060
5013
020
20FE
B20
1010
120
1010
1060
20M
AR
4020
1090
3020
4020
40M
AR
1080
1040
2010
6050
30A
PRA
PRM
AY
170
3010
310
100
7010
060
40M
AY
3016
030
220
3060
110
4050
JUN
110
6050
170
130
9017
060
70JU
N80
280
6019
080
7014
070
70JU
L16
060
100
110
100
180
9030
70JU
L40
340
4070
5060
5030
40A
UG
6050
2086
010
060
8050
70A
UG
110
100
4090
6043
040
6042
0SE
P18
050
5080
7013
040
7010
0SE
P60
8050
390
8050
8080
60O
CT
110
100
4070
8070
6070
90O
CT
3080
1010
1010
1030
20N
OV
110
4040
110
210
5046
070
80N
OV
5080
4060
4050
3016
070
DE
C20
060
7083
090
120
9090
60D
EC
1070
7010
010
2050
150
70m
ean
124
4737
399
9083
115
5161
mea
n49
121
4012
336
7257
7084
std
dev
6124
2951
751
4512
325
25st
d de
v35
101
2410
828
121
4045
113
med
ian
110
5040
110
9070
9060
70m
edia
n40
8040
9030
5050
6060
max
200
100
100
1,68
021
018
046
090
100
max
110
340
8039
080
430
140
160
420
min
3010
1070
2020
1020
20m
in10
1010
1010
1010
3020
36

Tab
le 2
.11
Tot
al K
jeld
ahl N
itrog
en (µ
g/l)
duri
ng 2
020
at th
e L
ower
Cap
e Fe
ar R
iver
Pro
gram
stat
ions
.
NA
VH
BB
RR
M61
M54
M35
M23
M18
NC
11A
CD
PIC
NC
F6JA
N20
030
040
040
020
050
200
50JA
N1,
500
400
400
400
400
FEB
130
120
140
150
120
180
9010
0FE
B1,
200
1,00
090
070
01,
400
MA
R20
040
010
030
030
040
050
060
0M
AR
300
300
5030
050
0A
PRA
PRM
AY
400
400
500
400
500
500
400
400
MA
Y50
050
040
050
050
0JU
N60
080
060
01,
000
600
600
600
400
JUN
800
700
600
600
800
JUL
780
790
770
950
670
670
470
530
JUL
890
780
930
790
880
AU
G75
089
073
080
091
084
086
066
0A
UG
810
840
830
940
1,11
0SE
P91
093
089
077
01,
040
1,04
088
050
0SE
P1,
030
820
860
860
810
OC
T92
084
071
074
098
083
047
064
0O
CT
950
790
700
840
900
NO
V75
080
084
086
095
078
067
067
0N
OV
640
500
620
550
920
DEC
730
710
720
710
600
800
680
610
DEC
890
700
870
900
1,06
0m
ean
579
635
582
644
625
608
529
469
mea
n86
566
665
167
184
4st
d de
v29
527
726
928
332
330
224
621
7st
d de
v32
621
427
521
529
6m
edia
n73
079
071
074
060
067
050
053
0m
edia
n89
070
070
070
088
0m
ax92
093
089
01,
000
1,04
01,
040
880
670
max
1,50
01,
000
930
940
1,40
0m
in13
012
010
015
012
050
9050
min
300
300
5030
040
0
AN
CSA
RG
SN
C40
3PB
LRC
RO
CN
CF1
17SC
-CH
B21
0C
OL
SR-W
C6R
CLC
OG
CO
SRB
RN
HA
MJA
N1,
500
1,00
050
02,
200
800
1,20
01,
400
900
300
JAN
700
1,30
070
01,
100
1,10
060
070
01,
200
1,90
0FE
B1,
600
1,20
01,
000
1,20
01,
500
1,30
01,
800
1,10
01,
300
FEB
1,60
01,
800
1,20
01,
100
1,00
080
01,
500
1,80
01,
100
MA
R1,
200
800
500
600
800
500
500
300
500
MA
R1,
000
1,00
070
050
01,
000
5080
01,
100
1,00
0A
PRA
PRM
AY
800
500
400
700
600
500
600
500
500
MA
Y60
01,
700
1,10
01,
300
1,00
01,
200
1,10
070
070
0JU
N1,
520
710
810
1,06
01,
170
3,85
01,
020
900
920
JUN
990
1,93
072
096
091
078
089
088
085
0JU
L1,
930
950
1,62
01,
200
1,44
01,
230
1,62
01,
270
1,01
0JU
L94
01,
760
860
800
770
790
850
920
940
AU
G1,
740
1,05
091
01,
800
950
1,00
01,
580
1,42
080
0A
UG
1,03
01,
340
1,05
053
01,
160
960
950
730
780
SEP
1,89
090
01,
000
1,05
01,
130
920
1,24
01,
060
790
SEP
1,24
01,
350
1,17
01,
290
1,06
01,
030
1,24
077
082
0O
CT
1,66
090
087
084
088
096
01,
100
910
760
OC
T1,
100
2,23
083
092
068
082
066
074
01,
980
NO
V1,
490
820
790
1,01
089
084
01,
560
760
1,14
0N
OV
930
1,17
084
036
060
068
084
01,
020
810
DEC
1,09
053
069
01,
260
990
1,07
082
067
071
0D
EC55
069
067
094
073
054
060
091
063
0m
ean
1,49
385
182
61,
175
1,01
41,
215
1,20
489
079
4m
ean
971
1,47
989
589
191
075
092
197
91,
046
std
dev
343
212
334
466
275
913
435
326
294
std
dev
297
449
200
315
186
299
268
316
461
med
ian
1,52
090
081
01,
060
950
1,00
01,
240
900
790
med
ian
990
1,35
084
094
01,
000
790
850
910
850
max
1,93
01,
200
1,62
02,
200
1,50
03,
850
1,80
01,
420
1,30
0m
ax1,
600
2,23
01,
200
1,30
01,
160
1,20
01,
500
1,80
01,
980
min
800
500
400
600
600
500
500
300
300
min
550
690
670
360
600
5060
070
063
0
37

Tab
le 2
.12
Tot
al P
hosp
horu
s (µ
g/l)
duri
ng 2
020
at th
e L
ower
Cap
e Fe
ar R
iver
Pro
gram
stat
ions
.
NA
VH
BB
RR
M61
M54
M35
M23
M18
NC
11A
CD
PIC
NC
F6JA
N10
090
8090
7070
7060
JAN
250
200
150
230
100
FEB
140
100
130
130
120
200
150
170
FEB
340
120
6060
60M
AR
8070
4012
011
060
100
50M
AR
260
160
250
100
110
APR
APR
MA
Y11
010
010
022
015
013
090
60M
AY
160
160
140
110
160
JUN
550
290
710
640
520
650
170
100
JUN
140
130
140
120
130
JUL
160
340
130
100
8024
080
190
JUL
170
170
180
130
130
AU
G20
016
019
015
014
090
170
280
AU
G30
1040
2090
SEP
570
200
170
180
170
140
140
120
SEP
180
170
240
200
160
OC
T68
034
041
048
064
068
041
038
0O
CT
150
200
180
130
250
NO
V22
011
023
018
090
310
5050
NO
V29
047
01,
400
610
1,42
0D
EC
300
330
180
350
260
260
170
370
DE
C27
032
020
025
027
0m
ean
283
194
215
240
214
257
145
166
mea
n20
419
227
117
817
8st
d de
v20
510
618
216
918
220
793
119
std
dev
8311
236
215
237
2m
edia
n20
016
017
018
014
020
014
012
0m
edia
n18
017
018
013
013
0m
ax68
034
071
064
064
068
041
038
0m
ax34
047
01,
400
610
610
min
8070
4090
7060
5050
min
3010
4020
20
AN
CSA
RG
SN
C40
3PB
LR
CR
OC
NC
F117
SC-C
HB
210
CO
LSR
-WC
6RC
LC
OG
CO
SRB
RN
HA
MJA
N14
070
4011
080
8020
050
80JA
N11
060
6016
010
015
070
130
160
FEB
560
130
100
190
160
120
350
100
170
FEB
120
230
8014
090
120
8012
010
0M
AR
880
150
140
160
150
140
250
150
170
MA
R10
010
040
130
5021
010
022
022
0A
PRA
PRM
AY
530
100
9015
018
010
024
016
016
0M
AY
250
260
120
260
9021
038
030
011
0JU
N55
090
9015
017
050
210
130
150
JUN
100
230
4015
070
240
190
100
220
JUL
130
290
420
290
170
260
1,01
016
090
JUL
150
170
8010
1080
1012
023
0A
UG
370
3070
250
250
230
630
160
200
AU
G19
022
010
7010
180
1036
032
0SE
P84
051
073
089
048
048
096
063
060
0SE
P23
041
017
024
019
040
017
013
024
0O
CT
710
330
220
270
310
210
300
180
220
OC
T42
061
042
044
058
076
065
071
045
0N
OV
880
880
870
350
470
1,53
01,
340
380
920
NO
V31
032
022
050
200
180
220
190
170
DE
C57
080
310
440
220
290
430
170
300
DE
C70
8080
100
4080
5070
70m
ean
560
242
280
295
240
317
538
206
278
mea
n18
624
512
015
913
023
717
522
320
8st
d de
v25
324
427
021
012
440
137
515
524
4st
d de
v10
315
211
111
415
418
618
217
610
3m
edia
n56
013
014
025
018
021
035
016
017
0m
edia
n15
023
080
140
9018
010
013
022
0m
ax88
088
087
089
048
01,
530
1,34
063
092
0m
ax42
061
042
044
058
076
065
071
045
0m
in13
030
4011
080
5020
050
80m
in70
6010
1010
8010
7070
38

050100
150
200
250
300
NC
11A
CD
PIC
NA
VH
BB
RR
M61
M54
M35
M23
M18
NC
F117
NC
F6B
210
Total Phosphorus (µg/L)Fi
gure
2.5
Tot
al P
hosp
horu
s at t
he L
ower
Cap
e Fe
ar R
iver
Pro
gram
mai
nste
m st
atio
ns,
1995
-201
9 ve
rsus
202
0.
1995
-201
920
20
39

Tab
le 2
.13
Ort
hoph
osph
ate
(µg/
l) du
ring
202
0 at
the
Low
er C
ape
Fear
Riv
er P
rogr
am st
atio
ns.
NA
VH
BB
RR
M61
M54
M35
M23
M18
NC
11A
CD
PB
BT
ICN
CF6
JAN
1010
1010
1010
1010
JAN
2020
2020
2010
FEB
2010
2010
2020
1010
FEB
1020
1010
1020
MA
R10
1010
2010
1010
10M
AR
2030
2010
2010
APR
APR
MA
Y30
4030
5050
4030
30M
AY
5050
4030
3070
JUN
3040
3060
5040
4030
JUN
6060
5040
5060
JUL
5050
5050
4030
2010
JUL
6050
7040
5050
AU
G40
4040
4040
3020
10A
UG
4020
3040
4070
SEP
5050
5040
4030
2010
SEP
6060
6050
5040
OC
T30
5040
5040
3030
20O
CT
5050
5050
5060
NO
V20
3030
5050
4030
40N
OV
5060
5040
4050
DE
C40
4040
4040
3020
20D
EC
4040
4030
4040
mea
n30
3432
3835
2822
18m
ean
4242
4033
3644
std
dev
1416
1417
1511
1011
std
dev
1817
1814
1422
med
ian
3040
3040
4030
2010
med
ian
5050
4040
4050
max
5050
5060
5040
4040
max
6060
7050
5070
min
1010
1010
1010
1010
min
1020
1010
1010
AN
CSA
RG
SN
C40
3PB
LR
CR
OC
NC
F117
SC-C
HB
210
CO
LSR
-WC
6RC
LC
OG
CO
SRB
RN
HA
MJA
N30
510
1010
1040
1010
JAN
1020
520
530
510
10FE
B14
010
1010
1010
3010
10FE
B10
105
105
2010
1010
MA
R12
010
1010
105
3020
10M
AR
1020
1020
1050
510
10A
PRA
PRM
AY
340
4030
5050
2010
080
70M
AY
3060
5012
040
110
1020
50JU
N38
040
4060
6012
110
6070
JUN
5090
7050
3010
010
2060
JUL
120
6040
605
4055
060
20JU
L60
100
2050
3014
05
4012
0A
UG
270
5050
5080
3050
5040
AU
G50
6010
5020
305
3090
SEP
290
6030
110
7030
130
6040
SEP
4060
1050
2016
010
3090
OC
T18
040
4050
7011
040
50O
CT
4050
1050
2060
020
50N
OV
100
3030
100
5030
7040
40N
OV
3030
1050
2020
530
30D
EC
100
3030
5050
3040
4040
DE
Cm
ean
188
3429
5142
2211
543
36m
ean
3350
2047
2072
722
52st
d de
v11
419
1433
2812
149
2222
std
dev
1830
2230
1152
310
39m
edia
n14
040
3050
5025
7040
40m
edia
n35
5510
5020
555
2050
max
380
6050
110
8040
550
8070
max
6010
070
120
4016
010
4012
0m
in30
510
105
530
1010
min
1010
510
520
010
10
40

Tab
le 2
.14
Chl
orop
hyll
a (µ
g/l)
duri
ng 2
020
at th
e L
ower
Cap
e Fe
ar R
iver
Pro
gram
stat
ions
.
NA
VH
BB
RR
M61
M54
M35
M23
M18
NC
11A
CD
PB
BT
ICN
CF6
JAN
12
23
34
49
JAN
43
22
33
FEB
45
54
57
711
FEB
44
42
32
MA
R5
56
55
44
6M
AR
11
11
12
APR
APR
MA
Y2
22
23
22
2M
AY
33
32
21
JUN
54
43
33
43
JUN
21
21
21
JUL
23
36
46
612
JUL
11
21
12
AU
G1
21
46
3833
16A
UG
11
11
11
SEP
35
911
216
88
SEP
11
10
03
OC
T1
11
11
23
4O
CT
00
00
01
NO
V1
11
11
11
1N
OV
00
00
01
DE
C1
11
11
12
3D
EC
21
11
10
mea
n2
33
45
77
7m
ean
21
21
12
std
dev
22
33
611
95
std
dev
11
11
11
med
ian
22
23
34
46
med
ian
11
11
11
max
55
911
2138
3316
max
44
42
33
min
11
11
11
11
min
00
00
00
AN
CSA
RG
SN
C40
3PB
LR
CR
OC
NC
F117
SC-C
HB
210
CO
LSR
-WC
6RC
LC
OG
CO
SRB
RN
HA
MJA
N1
11
32
11
11
JAN
12
14
33
73
2FE
B2
22
44
22
12
FEB
12
11
11
32
1M
AR
23
34
32
11
3M
AR
11
11
01
41
1A
PRA
PRM
AY
61
28
49
21
2M
AY
12
27
34
102
2JU
N5
11
73
32
12
JUN
14
11
11
75
1JU
L27
344
912
22
226
JUL
12
12
23
83
2A
UG
131
111
814
11
7A
UG
11
11
11
22
0SE
P5
13
58
31
17
SEP
06
11
12
111
21
OC
T1
13
94
72
11
OC
T0
10
11
15
21
NO
V5
12
634
20
10
NO
V1
00
11
12
10
DE
C2
11
35
51
01
DE
Cm
ean
61
66
85
11
5m
ean
12
12
12
162
1st
d de
v8
113
39
41
07
std
dev
02
12
11
341
1m
edia
n5
12
64
31
12
med
ian
12
11
11
62
1m
ax27
344
1134
142
226
max
16
27
34
111
52
min
11
13
21
00
0m
in0
00
10
12
10
41

012345678
NC
11A
CD
PIC
NA
VH
BB
RR
M61
M54
M35
M23
M18
NC
F117
NC
F6B
210
BB
T
Chlorophyll a (µg/L)Fi
gure
2.6
Chl
orop
hyll
aat
the
Low
er C
ape
Fear
Riv
er P
rogr
am m
ains
tem
stat
ions
, 199
5-20
19
vers
us 2
020.
1995
-201
9
2020
42

Tab
le 2
.15
Feca
l Col
iform
(cfu
/100
mL
) and
Ent
eroc
occu
s (M
PN) d
urin
g 20
20 a
t the
Low
er C
ape
Fear
Riv
er P
rogr
am st
atio
ns.
EN
TER
OC
OC
CU
SN
C11
AC
DP
ICN
CF6
NA
VH
BB
RR
M61
M54
M35
M23
M18
JAN
864
864
364
1,50
012
032
32JA
N5
2041
2010
5FE
B73
100
375
3746
28FE
B31
3141
105
20M
AR
514
319
1919
14M
AR
105
55
55
APR
APR
MA
Y15
895
6868
5583
59M
AY
173
150
134
205
5JU
N13
017
512
568
3732
23JU
N63
3120
510
5JU
L32
2323
5032
3755
JUL
3130
510
2010
AU
G50
5941
110
8686
50A
UG
1947
128
262
1,30
068
7SE
P5
2832
3215
557
73SE
P41
2010
55
5O
CT
1410
510
5046
245
OC
T10
2031
105
5N
OV
235
528
5527
14N
OV
520
55
1010
DE
C20
2522
1619
2819
DE
C10
3130
1041
20m
ean
125
127
6617
360
4556
mea
n36
3741
3312
971
std
dev
239
238
100
421
4121
63st
d de
v47
3744
7337
119
5m
ax86
486
436
41,
500
155
8624
5m
ax17
315
013
426
21,
300
687
min
55
35
1919
14m
in5
55
55
5G
eom
ean
3943
2741
4940
38G
eom
ean
2027
2212
1411
AN
CSA
RG
SN
C40
3PB
LR
CR
OC
NC
F117
SC-C
HB
210
CO
LSR
WC
6RC
LC
OG
CO
SRB
RN
HA
MJA
N59
185
8217
073
175
140
4150
JAN
115
160
768
10,6
001,
100
4620
51,
650
1,18
0FE
B68
135
3232
9129
577
321
015
5FE
B64
541
175
3241
4664
59M
AR
1059
1923
7741
8255
59M
AR
4619
5064
195
3712
518
0A
PRA
PRM
AY
4619
095
175
265
290
205
4150
MA
Y23
8227
,500
11,0
0015
,000
2,40
017
,000
180
250
JUN
130
910
455
2,05
01,
250
637
500
115
82JU
N37
823
137
6814
010
028
023
5JU
L13
513
51,
200
955
30,0
0081
915
573
319
JUL
4368
3743
637
9110
018
221
0A
UG
110
180
195
1,10
059
125
527
523
155
AU
G41
115
270
175
260
215
110
1,80
027
0SE
P14
021
011
512
577
355
8637
64SE
P46
195
115
135
6437
281,
100
220
OC
T11
313
541
7720
559
200
3264
OC
T77
9150
319
115
500
145
205
77N
OV
5912
055
4619
086
410
059
19N
OV
8210
573
115
110
105
110
195
145
DE
C50
500
3268
115
8677
314
559
DE
C28
1914
5546
6819
4112
0m
ean
8425
121
143
83,
057
325
299
7698
mea
n55
862,
629
2,07
41,
586
332
1,62
752
926
8st
d de
v42
235
335
625
8,52
729
325
055
81st
d de
v26
567,
868
4,11
54,
254
667
4,86
262
829
6m
ax68
910
1,20
02,
050
30,0
0086
477
321
031
9m
ax11
519
527
,500
11,0
0015
,000
2,40
017
,000
1,80
01,
180
min
1059
1923
7341
8223
19m
in23
53
4319
519
4159
Geo
mea
n69
188
9215
735
219
921
860
75G
eom
ean
4959
9826
017
398
117
262
191
43

0102030405060
NC
11A
CD
PIC
NA
VH
BN
CF1
17N
CF6
B21
0B
RR
M61
M54
M35
M23
M18
Bacteria (CFU/100 mL)Fi
gure
2.7
Geo
met
ric
Mea
n Fe
cal C
olifo
rm (N
C11
-B21
0) a
nd E
nter
ococ
cus (
BR
R-M
18) a
t th
e L
CFR
P m
ains
tem
stat
ions
, 199
6-20
19 (E
nter
o 20
12-2
014
) vs.
2020
. 1996
-201
9
2020
44