Sensors for Environmental Monitoring and Long-Term Environmental Stewardship

C180-E059A
Analysis Guidebook Environmental
Analyses

Index
1. Drinking Water
1. 1 Analysis of Anions in Tap Water – Ion Chromatograph>>>>>>>>>1
1. 2 Analysis of Cations in Tap Water – Ion Chromatograph >>>>>>>>2
1. 3 Analysis of Anions in Tap Water – PIA-1000>>>>>>>>>>>>>3
1. 4 Analysis of Volatile Organic Compound (VOC) in Tap Water (1) – Purge &Trap GC/MS >>>4
Analysis of Volatile Organic Compound (VOC) in Tap Water (2) – Purge & Trap GC/MS >>>>5
1. 5 Analysis of Musty Smelling Components in Tap Water (1) – Purge & Trap GC/MS >>>>>>6
Analysis of Musty Smelling Components in Tap Water (2) – Purge & Trap GC/MS >>>>>7
1. 6 Analysis of Non-organic Components in Tap Water (1) – ICP-AES >>>>8
Analysis of Non-organic Components in Tap Water (2) – ICP-AES >>>>9
1. 7 Analysis of Non-organic Components in Mineral Water (1) – ICP-AES >>10
Analysis of Non-organic Components in Mineral Water (2) – ICP-AES >>11
2. Environment Water
2. 1 Analysis of Anions in River Water – Ion Chromatograph>>>>>>>>12
2. 2 Analysis of Cations in River Water – Ion Chromatograph >>>>>>>13
2. 3 Analysis of Anions in Lake Water – Ion Chromatograph >>>>>>>>14
2. 4 Analysis of Cations in Lake Water – Ion Chromatograph>>>>>>>>15
2. 5 Analysis of Anions in River Water – PIA-1000>>>>>>>>>>>>16
2. 6 Analysis of Cations in River Water – PIA-1000 >>>>>>>>>>>17
2. 7 Analysis of Calcium and Magnesium in River Water – AA >>>>>>>18
2. 8 Analysis of Total Nitrogen and Total phosphorus in River Water – UV >>19
2. 9 Analysis of Non-organic Components in River Water (1) – ICP-MS >>>20
Analysis of Non-organic Components in River Water (2) – ICP-MS >>>21
2.10 Analysis of Anions in Hot Spring Water – Ion Chromatograph >>>>>22
2.11 Analysis of Cations in Hot Spring Water (1) – Ion Chromatograph >>>>23
Analysis of Cations in Hot Spring Water (2) – Ion Chromatograph >>>>24
2.12 Analysis of Anions in Rainwater – Ion Chromatograph >>>>>>>>25
2.13 Analysis of Cations in Rainwater – Ion Chromatograph >>>>>>>>26
2.14 Analysis of Anions in Rainwater – PIA-1000 >>>>>>>>>>>>27
2.15 Analysis of Cations in Rainwater – PIA-1000 >>>>>>>>>>>>28
2.16 Analysis of Sulfurous Acid in Rainwater – HPLC>>>>>>>>>>>29
2.17 Analysis of Anions in Snow Water – Ion Chromatograph >>>>>>>30
2.18 Analysis of Anions in Sea Water – HPLC>>>>>>>>>>>>>>31
2.19 Analysis of Ammonia Ions in Sea Water – HPLC>>>>>>>>>>>32
2.20 Analysis of Fluoride Ions in Sea Water (1) – Ion Chromatograph >>>>33
Analysis of Fluoride Ions in Sea Water (2) – Ion Chromatograph >>>>34
2.21 Analysis of Microcystin in Blue-green Algae (1) – HPLC>>>>>>>>35
Analysis of Microcystin in Blue-green Algae (2) – HPLC>>>>>>>>36
2.22 Analysis of Cyanogen Compounds by Chemical Classification (1) – HPLC >>37
Analysis of Cyanogen Compounds by Chemical Classification (2) – HPLC >>38
2.23 Analysis of Alkyl Mercury Compound (1) – GC >>>>>>>>>>>39
Analysis of Alkyl Mercury Compound (2) – GC >>>>>>>>>>>40
2.24 Analysis of PCB in Water (1) – GC >>>>>>>>>>>>>>>>41
Analysis of PCB in Water (2) – GC >>>>>>>>>>>>>>>>42
2.25 Analysis of Residual Organic Phosphorus Compounds (1) – GC >>>>43
Analysis of Residual Organic Phosphorus Compounds (2) – GC>>>>>44
2.26 Analysis of Volatile Organic Compound (VOC) in Wastewater and Environment
Water using Head Space Method (1) – GC/MS >>>>>>>>>>>45
Analysis of Volatile Organic Compound (VOC) in Wastewater and Environment
Water using Head Space Method (2) – GC/MS >>>>>>>>>>>46
3. Wastewater
3. 1 Analysis of Anions in Wastewater – Ion Chromatograph>>>>>>>>47
3. 2 Analysis of Cations in Wastewater – Ion Chromatograph >>>>>>>48
3. 3 Analysis of Anions in Wastewater – PIA-1000>>>>>>>>>>>>49
3. 4 Analysis of Cations in Wastewater – PIA-1000 >>>>>>>>>>>50
3. 5 Analysis of Volatile Organic Compound (VOC) in Wastewater – GC >>>51
4. Atmosphere
4. 1 Analysis of Acidic Substances in Exhaust Gas – Ion Chromatograph >>>52
4. 2 Analysis of Exhaust Gas Absorption Solution – PIA-1000 >>>>>>>53
4. 3 Analysis of Tolylenediisocyanate (TDI) in Work Environment Monitoring (1) – HPLC >>>54
Analysis of Tolylenediisocyanate (TDI) in Work Environment Monitoring (2) – HPLC >>>55
4. 4 Analysis of Aldehyde/Ketonic products in Exhaust Gas – HPLC>>>>>56
4. 5 Analysis of Aldehyde/Ketonic products in Room Atmosphere – HPLC >>57
4. 6 Analysis of Aldehyde Types in Atmosphere (1) – GC >>>>>>>>>58
Analysis of Aldehyde Types in Atmosphere (2) – GC >>>>>>>>>59
4. 7 Analysis of Formaldehyde in Room Atmosphere – UV >>>>>>>>60
4. 8 Analysis of Volatile Organic Components (VOC) in Atmosphere (1) – Solid-phase Adsorption &Thermal Desorption GC/MS>61
Analysis of Volatile Organic Components (VOC) in Atmosphere (2) – Solid-phase Adsorption & Thermal Desorption GC/MS>62
4. 9 Analysis of Volatile Organic Components (VOC) in Atmosphere (1) – Container Collection Method GC/MS >63
Analysis of Volatile Organic Components (VOC) in Atmosphere (2) – Container Collection Method GC/MS >64
4.10 Analysis of Non-organic Elements in Atmosphere Dust (1) – ICP-AES>>>>65
Analysis of Non-organic Elements in Atmosphere Dust (2) – ICP-AES>>>>66
5. Industrial Waste
5. 1 Screening of Waste Plastic Material using Horizontal ATR (1) – FTIR>>>67
Screening of Waste Plastic Material using Horizontal ATR (2) – FTIR>>>68
5. 2 Analysis of Non-organic Elements in Eluate of incineration ash (1) – ICP-AES >>69
Analysis of Non-organic Elements in Eluate of incineration ash (2) – ICP-AES >>70
5. 3 X-ray Fluorescence Spectrometric Analysis of Industrial Waste (Sludge) – XRF>>71
6. Others
6. 1 Analysis of Non-agitated Soil Core Sample using Microscopic FTIR (1) – FTIR >>72
Analysis of Non-agitated Soil Core Sample using Microscopic FTIR (2) – FTIR >>73
6. 2 Analysis of Volatile Organic Compounds (VOC) in Soil (1) – GC/MS >>>74
Analysis of Volatile Organic Compounds (VOC) in Soil (2) – GC/MS >>>75
1
1.1 Analysis of Anions in Tap Water - Ion Chromatograph
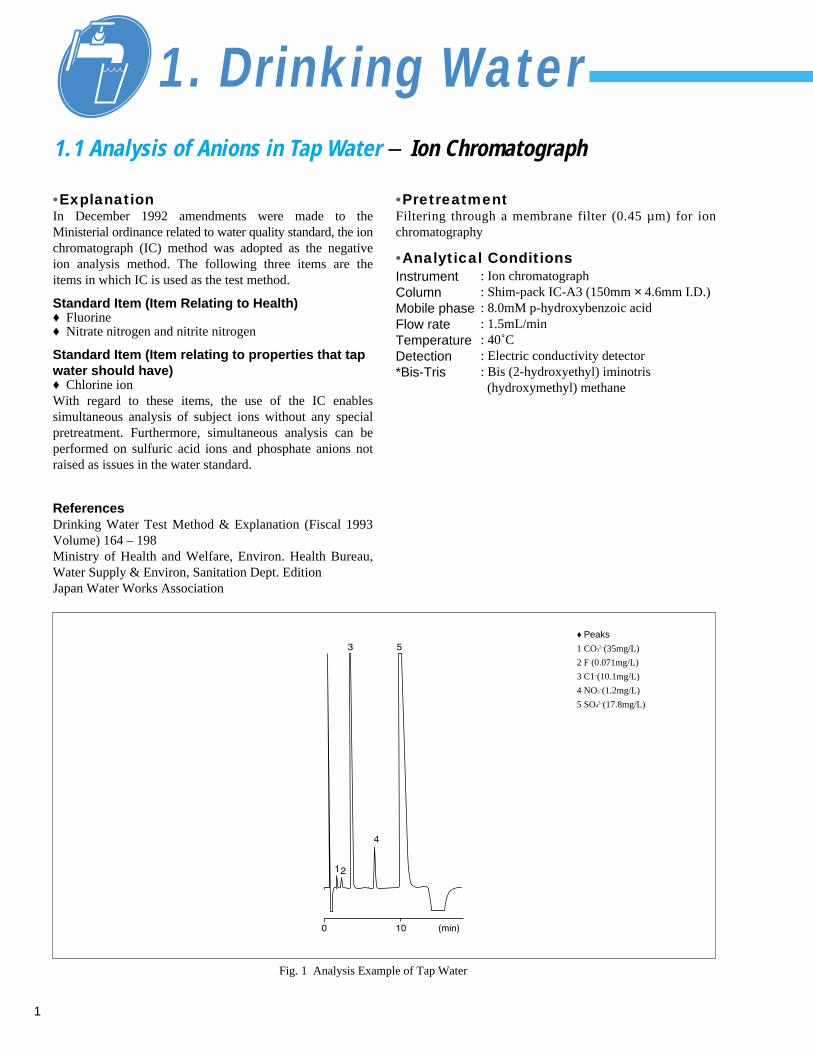
•ExplanationIn December 1992 amendments were made to theMinisterial ordinance related to water quality standard, the ionchromatograph (IC) method was adopted as the negativeion analysis method. The following three items are theitems in which IC is used as the test method.
Standard Item (Item Relating to Health)♦ Fluorine♦ Nitrate nitrogen and nitrite nitrogen
Standard Item (Item relating to properties that tapwater should have)♦ Chlorine ionWith regard to these items, the use of the IC enablessimultaneous analysis of subject ions without any specialpretreatment. Furthermore, simultaneous analysis can beperformed on sulfuric acid ions and phosphate anions notraised as issues in the water standard.
•PretreatmentFiltering through a membrane filter (0.45 µm) for ionchromatography
•Analytical Conditions
ReferencesDrinking Water Test Method & Explanation (Fiscal 1993Volume) 164 – 198Ministry of Health and Welfare, Environ. Health Bureau,Water Supply & Environ, Sanitation Dept. EditionJapan Water Works Association
0 10 (min)
12
4
3 5
Fig. 1 Analysis Example of Tap Water
♦ Peaks
1 CO32–(35mg/L)
2 F–(0.071mg/L)
3 C1–(10.1mg/L)
4 NO3–(1.2mg/L)
5 SO42–(17.8mg/L)
1. Drinking Water
InstrumentColumnMobile phaseFlow rateTemperatureDetection*Bis-Tris
: Ion chromatograph: Shim-pack IC-A3 (150mm × 4.6mm I.D.): 8.0mM p-hydroxybenzoic acid: 1.5mL/min: 40˚C: Electric conductivity detector: Bis (2-hydroxyethyl) iminotris (hydroxymethyl) methane
2
1.2 Analysis of Cations in Tap Water - Ion Chromatograph
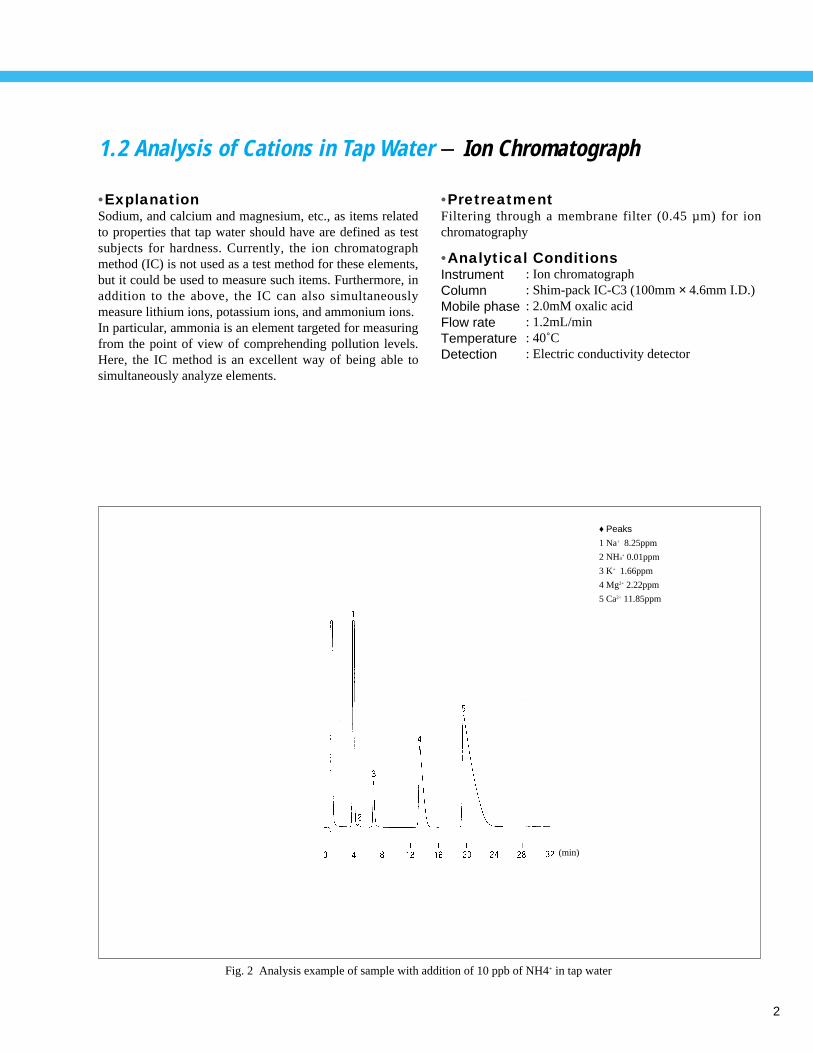
•ExplanationSodium, and calcium and magnesium, etc., as items relatedto properties that tap water should have are defined as testsubjects for hardness. Currently, the ion chromatographmethod (IC) is not used as a test method for these elements,but it could be used to measure such items. Furthermore, inaddition to the above, the IC can also simultaneouslymeasure lithium ions, potassium ions, and ammonium ions. In particular, ammonia is an element targeted for measuringfrom the point of view of comprehending pollution levels.Here, the IC method is an excellent way of being able tosimultaneously analyze elements.
•PretreatmentFiltering through a membrane filter (0.45 µm) for ionchromatography
•Analytical Conditions
Fig. 2 Analysis example of sample with addition of 10 ppb of NH4+ in tap water
♦ Peaks
1 Na+ 8.25ppm
2 NH4+ 0.01ppm
3 K+ 1.66ppm
4 Mg2+ 2.22ppm
5 Ca2+ 11.85ppm
InstrumentColumnMobile phaseFlow rateTemperatureDetection
: Ion chromatograph: Shim-pack IC-C3 (100mm × 4.6mm I.D.): 2.0mM oxalic acid: 1.2mL/min: 40˚C: Electric conductivity detector
(min)

1.3 Analysis of Anions in Tap Water - PIA-1000
•ExplanationThis is a tap-water analysis example using the personal ionanalyzer PIA-1000. Not only is the PIA-1000 usefulbecause of its portability but it also proves effective as asub-device in the laboratory. Although a compact model,the accuracy of the PIA-1000 is on a par with conventionalmodels, which makes it a potent force in everyday analysiswork.
•PretreatmentFiltering through a membrane filter (0.45 µm) for ionchromatography
•Analytical Conditions
Fig. 3 Analysis Example of Tap Water (PIA-1000)
♦ Peaks
1 HCO3–(32.83mg/L)
2 F–(0.130mg/L)
3 Cl–(12.62mg/L)
4 NO3–(0.158mg/L)
5 SO42–(16.49mg/L)
Drinking Water
3
InstrumentColumnMobile phase
Flow rate
: PIA-1000: Shim-pack IC-A3(S): PIA-1000 dedicated anion analysis mobile phase, IC-MA3-1
: 0.2mL/min

4
1.4 Analysis of Volatile Organic Compound (VOC) in Tap Water (1) - Purge & Trap GC/MS
•ExplanationThe purge trap method involves purging volatile organiccompound that exists in water using helium or nitrogen gas,holding it in a trap tube, then quickly heating it to induct itinto a GC/MS column. Nearly all the volatile constituentsincluded in a 5mL sample are concentrated in the trap tubeto enable highly sensitive analysis.Figure 4 is a SIM chromatograph of the 23 constituentcompounds targeted and individual 0.1µg/L concentrationsof p-bromofluorbenzene (IS). The chart 1 shows the namesof the targeted compounds and the SIM selected ions.
References(1) Drinking Water Test Method & Explanation,
Japan Water Works Association volume(2) Environmental Water Analysis Manual,
Environmental Science Research Group volume(3) New Wastewater Standards and Other Analysis
Methods,Environmental Science Research Group volume
Trap tubeSample purge timeDesorption
: GI (TENAX): 6min: 225˚C, 2min
8 10 12 14 16 18 20 22 24 26 28 30 32
12
3
4
5
6
7
8
9
10
23
1112
13
14
15
16
17
1819
20
21
22
Ion set number:1 SIM=1205609
Ion set number:2 SIM=746888
Ion set number:3 SIM=5754303
61.00
78.00
96.00
62.00
84.00
64.00
86.00
97.00
83.00 85.00
130.00
91.00
132.00
92.00
63.00
97.00
65.00
166.00
83.00
164.00
85.00
129.00
110.00
127.00
112.00
117.00 119.00
91.00 106.00 173.00 175.00 95.00 174.00 146.00 148.00
Fig. 4 Measuring example of 0.1 µg/L added water
Column
Column temperatureCarrier gas
Shimadzu GCMS-QP5050A
P&T: Tekmer-Dohrmann LSC3000J (No cryofocus)
•Analytical Conditions
(min)
: DB-624 60m × 0.32mm I.D., 1.8µm (df)
: 40˚C (1min)-10˚C/min 200˚C (5min)
: He 100kPa

5
1.4 Analysis of Volatile Organic Compound (VOC) in Tap Water (2) - Purge & Trap GC/MS
Trap
Test
water
5mL
225:
Adsorpt ion tube
TENAX
GC/MS
20mL/min 35:
Cryofocus not used
Fig. 5 Purge & trap GC/MS system
Drinking Water
123456789101112
ID1,1-dichloroetheneDichloromethanetrans-1,2-dichloroethanecis-1,2-dichloroethaneChloroform1,1,1-trichloroethaneTetrachloromethaneBenzene1,2-dichloroethaneTrichloroethene1,2-dichloropropaneBromodichloromethane
Name96,6184,8696,6196,6183,8597,99117,11978,7762,64130,13263,6283,85
SIM Selected Ions1314151617181920212223
IDcis-1,3-dichloroproeneToluenetrans-1,3-dichloropropene1,1,2-trichloroetheneTetrachloroetheneDibromochloromethanem,p-xyleneo-xyleneBromoformp-bromofluorbenzene(IS)p-dichlorobenzene
Name75,11092,9175,11097,99166,164129,127106,91106,91173,175174,176146,148
SIM Selected Ions
Chart 1 SIM selected ions

6
1.5 Analysis of Musty Smelling Components in Tap Water (1) - Purge & Trap GC/MS
•ExplanationJapanese tap water has an established reputation in the areaof quality as drinking water; however, in recent years, it hasa musty odor depending on the season. And the substancesthat cause this musty odor are known to be 2-methylisoborneol and geosmin. The threshold value for theodors of these compounds is approximately 10ppt, which islow, and cannot be detected in source state by GC/MSanalysis, so the purge trap method, as shown in the drinkingwater test method, is used to concentrate the compounds foranalysis by GC/MS. This purge trap method involvesforcing the targeted compound into a gas phase usingaeration, holding this gas phase in a concentration tubefilled with TENAX TA, then forcing out of theconcentration tube by heating.
References (1) Drinking Water Test Method & Explanation,
Japan Water Works Association volume(2) Environmental Water Analysis Manual,
Environmental Science Research Group volume
•Analytical Conditions
15.014.5
159058
31094
95.00
108.00
112.00
126.00
12.011.5
Fig. 6 Analysis example of musty odor 3.0ppt(Upper: 2-MIB, lower: geosmin)
0
4.0
8.0
104
104
2.5Conc
Conc
5.0
0
4.0
8.0
2.5 5.0
ID #1 Mass No.: 95.00 Element name: 2-MIB
Surface area = 11829.5 *Concentration + 16926
Contribution ratio = 0.997846
ID #2 Mass No.: 112.00 Element name: geosmin
Surface area = 14468.8 *Concentration + 5982.67
1234
0.5001.0003.0005.000
1234
0.5001.0003.0005.000
Concentration (ppt)
Concentration (ppt)
Area
Area
Fig. 7 Calibration curve(Upper: 2-MIB, lower: geosmin)
P&T: Tekmer-Dohrmann LSC3000J
Shimadzu GCMS-QP5050A
Trap tubeSample purge timeForce out
: G1 (TENAX TA): 11min: 225˚C, 8min
Column
Column temperature
Carrier gas
: DB-1701 30m × 0.32mm I.D. 1µm(df)
: 60˚C(3min)-10˚C(min)240˚C(10min)
: He 40kPa

7
1.5 Analysis of Musty Smelling Components in Tap Water (2) - Purge & Trap GC/MS
Reference Example 1
Drinking Water
CH3 CH3
CH3
CH3
CH3
OHCH3
OH
2-Methyl isoborneol :m/z 95,108 Geosmin:m/z 112.126
Trap
Testwater5mL
225
Adsorpt ion tube
TENAX
GC/MS
20mL/min 35
Cryofocus not used
Fig. 9 Principle diagram of purge & trap method
Fig. 8 Structures of 2-MIB and geosmin

8
1.6 Analysis of Non-organic Components in Tap Water (1) - ICP-AES
•ExplanationWith regard to the testing method for metals in tap water,there are an analysis method using ICP emissionspectroscopic method or atomic absorption method, and anabsorptiometric analysis as colorimetric method. Here, anICP emission spectroscopic analysis method as asimultaneous analysis method will be introduced.Tap water was qualified and quantified using the ultrasonicnebulizer in the ICP-AES. The results of the qualitativeanalysis revealed Al, B, Ba, Ca, Cd, Cu, Fe, K, Mg, Mn,Na, S, Si, Sr, and Zn. Quantitative analysis was performedfor the elements detected by qualitative analysis and theelements laid down in the water quality standard.
References(1) Partial amendment of Ministerial ordinance related to
water quality standard for drinking water and WaterSupply Law Operation Regulations, etc., introduced onDecember 21, 1992
(2) Drinking Water Test Method & Explanation,Japan Water Works Association volume
•PretreatmentA water sample of 100mL was prepared, 1mL of nitric acidadded, and thermally concentrated without quite boiling.Heating was stopped once solution volume dropped below100mL, cooled, and measured up with purified water tocreate a 100mL sample for analysis.
•Analytical Conditions
Element
Ar
As
B
Ba
Ca
Cd
0.0048
<0.005
0.025
0.0052
9.84
0.0003
Analytical Value (mg/L) Element
Cr
Cu
Fe
K
Mg
Mn
<0.0005
0.0005
0.0034
1.36
1.72
0.0002
Analytical Value (mg/L) Element
Na
Pb
S
Si
Sr
Zn
8.76
<0.002
4.45
0.77
0.056
0.0022
Analytical Value (mg/L)
Chart 2 Tap water analysis results (µg/mL)
Instrument
High-frequencyHigh-frequency outputCooling gasPlasma gasCarrier gasPurge gasSample suction rateObservation method
: ICPS-7500Ultrasonic nebulizer UAG-1
: 27.12MHz: 0.8kW: Ar 14.0L/min: Ar 1.2L/min: Ar 0.7L/min: Ar 3.5L/min: 2.0mL/min: longitudinal

9
1.6 Analysis of Non-organic Components in Tap Water (2) - ICP-AES
Fig. 10 Cd calibration curve
Drinking Water
Fig. 11 Al calibration curve
Fig. 12 Profile of Al 167.079nm Fig. 13 Profile of Cd 228.802nm Fig. 14 Profile of Cu 324.754nm
10
1.7 Analysis of Non-organic Components in Mineral Water (1) - ICP-AES
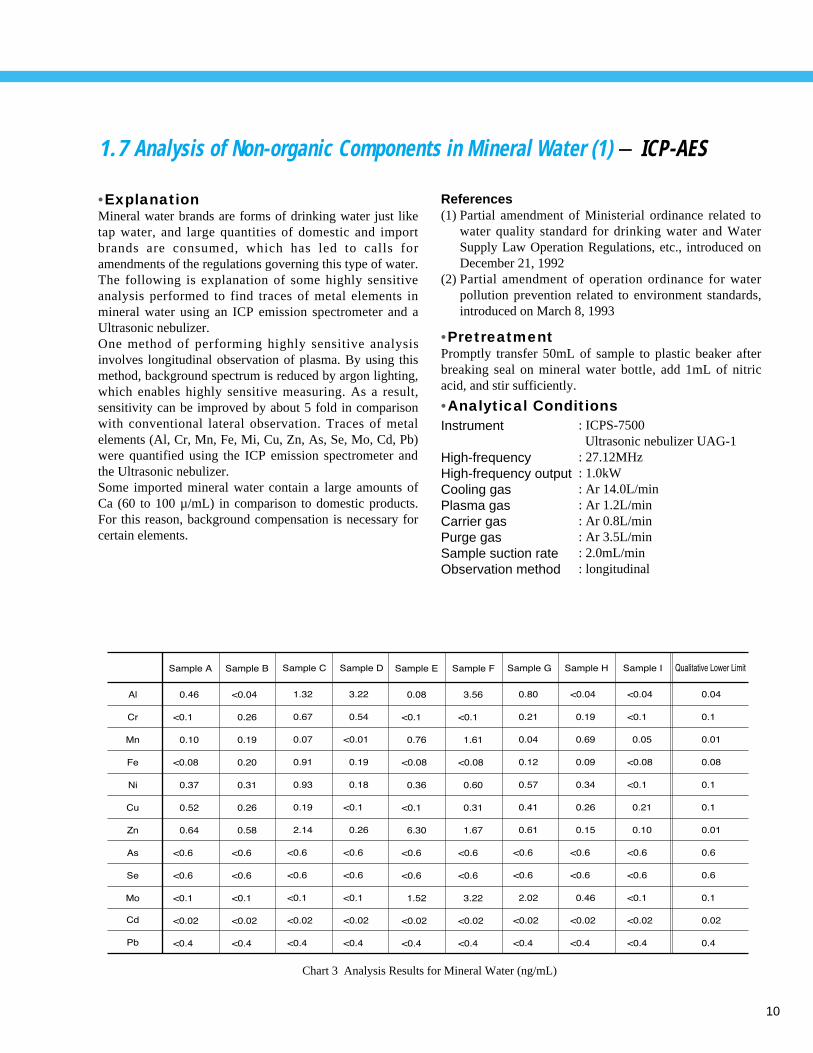
•ExplanationMineral water brands are forms of drinking water just liketap water, and large quantities of domestic and importbrands are consumed, which has led to calls foramendments of the regulations governing this type of water.The following is explanation of some highly sensitiveanalysis performed to find traces of metal elements inmineral water using an ICP emission spectrometer and aUltrasonic nebulizer.One method of performing highly sensitive analysisinvolves longitudinal observation of plasma. By using thismethod, background spectrum is reduced by argon lighting,which enables highly sensitive measuring. As a result,sensitivity can be improved by about 5 fold in comparisonwith conventional lateral observation. Traces of metalelements (Al, Cr, Mn, Fe, Mi, Cu, Zn, As, Se, Mo, Cd, Pb)were quantified using the ICP emission spectrometer andthe Ultrasonic nebulizer.Some imported mineral water contain a large amounts ofCa (60 to 100 µ/mL) in comparison to domestic products.For this reason, background compensation is necessary forcertain elements.
References(1) Partial amendment of Ministerial ordinance related to
water quality standard for drinking water and WaterSupply Law Operation Regulations, etc., introduced onDecember 21, 1992
(2) Partial amendment of operation ordinance for waterpollution prevention related to environment standards,introduced on March 8, 1993
•PretreatmentPromptly transfer 50mL of sample to plastic beaker afterbreaking seal on mineral water bottle, add 1mL of nitricacid, and stir sufficiently.
Sample A
0.46
<0.1
0.10
<0.08
0.37
0.52
0.64
<0.6
<0.6
<0.1
<0.02
<0.4
Sample B
<0.04
0.26
0.19
0.20
0.31
0.26
0.58
<0.6
<0.6
<0.1
<0.02
<0.4
Sample C
1.32
0.67
0.07
0.91
0.93
0.19
2.14
<0.6
<0.6
<0.1
<0.02
<0.4
Sample D
3.22
0.54
<0.01
0.19
0.18
<0.1
0.26
<0.6
<0.6
<0.1
<0.02
<0.4
Sample E
0.08
<0.1
0.76
<0.08
0.36
<0.1
6.30
<0.6
<0.6
1.52
<0.02
<0.4
Sample F
3.56
<0.1
1.61
<0.08
0.60
0.31
1.67
<0.6
<0.6
3.22
<0.02
<0.4
Sample G
0.80
0.21
0.04
0.12
0.57
0.41
0.61
<0.6
<0.6
2.02
<0.02
<0.4
Sample H
<0.04
0.19
0.69
0.09
0.34
0.26
0.15
<0.6
<0.6
0.46
<0.02
<0.4
Sample I
<0.04
<0.1
0.05
<0.08
<0.1
0.21
0.10
<0.6
<0.6
<0.1
<0.02
<0.4
Qualitative Lower Limit
0.04
0.1
0.01
0.08
0.1
0.1
0.01
0.6
0.6
0.1
0.02
0.4
Al
Cr
Mn
Fe
Ni
Cu
Zn
As
Se
Cd
Pb
Mo
Chart 3 Analysis Results for Mineral Water (ng/mL)
•Analytical ConditionsInstrument
High-frequencyHigh-frequency outputCooling gasPlasma gasCarrier gasPurge gasSample suction rateObservation method
: ICPS-7500Ultrasonic nebulizer UAG-1
: 27.12MHz: 1.0kW: Ar 14.0L/min: Ar 1.2L/min: Ar 0.8L/min: Ar 3.5L/min: 2.0mL/min: longitudinal

11
Drinking Water
Fig. 15 Pb calibration curve
Fig. 16 As calibration curve
1.7 Analysis of Non-organic Components in Mineral Water (2) - ICP-AES
Fig. 17 Peak profile of Mo Fig. 18 Peak profile of Cd Fig. 19 Peak profile of Pb

12
2. Environment Water2.1 Analysis of Anions in River Water - Ion Chromatograph
•ExplanationThe river and lake water – which is the source of our dailytap water – needs to be constantly analyzed and monitoredas any change in the water quality can directly affect humanhealth. Furthermore, the non-organic negative ioncomponents in river and lake water reflect the nature of thewater source and soil, so that each variation in ionconcentration can be used to indicate change in theenvironment. Also, in recent years, eutrophication problemsare occurring in rivers and lakes due to the inflow ofdomestic wastewater. And, once again, the analysis of non-organic ions is important for research work on the causesand levels of pollution.
•PretreatmentFiltering through a membrane filter (0.45 µm) for ionchromatography
•Analytical Conditions
ReferencesDrinking Water Test Method & Explanation (Fiscal 1993Volume) 164 – 198Ministry of Health and Welfare Environ. Health Bureau,Water Supply & Environ. Sanitation Dept. EditionJapan Water Works Association
Fig. 20 Analysis of River Water A
♦ Peaks
1 CO32–
2 F–(0.088mg/L)
3 Cl–(6.10mg/L)
4 NO2–(0.048mg/L)
5 Br–(0.21mg/L)
6 NO3–(1.28mg/L)
7 SO42–(7.78mg/L)
Fig. 21 Analysis of River Water B
♦ Peaks
1 CO32–
2 PO43–(0.106mg/L)
3 F–(0.148mg/L)
4 Cl–(10.19mg/L)
5 NO2–(0.138mg/L)
6 Br–(0.019mg/L)
7 NO3–(2.55mg/L)
8 SO42–(15.73mg/L)
InstrumentColumn
Mobile phase
Flow rateTemperatureDetection*Bis-Tris
: Ion chromatograph: Shim-pack IC-A3 (150mm × 4.6mm I.D.): 8.0mM p-hydroxybenzoic acid, 3.2mM
Bis-Tris*: 1.5mL/min: 40˚C: Electric conductivity detector: Bis (2-hydroxyethyl) iminotris
(hydroxymethyl) methane
13
Environment Water
2.2 Analysis of Cations in River Water - Ion Chromatograph
•PretreatmentFiltering through a membrane filter (0.45 µm) for ionchromatography
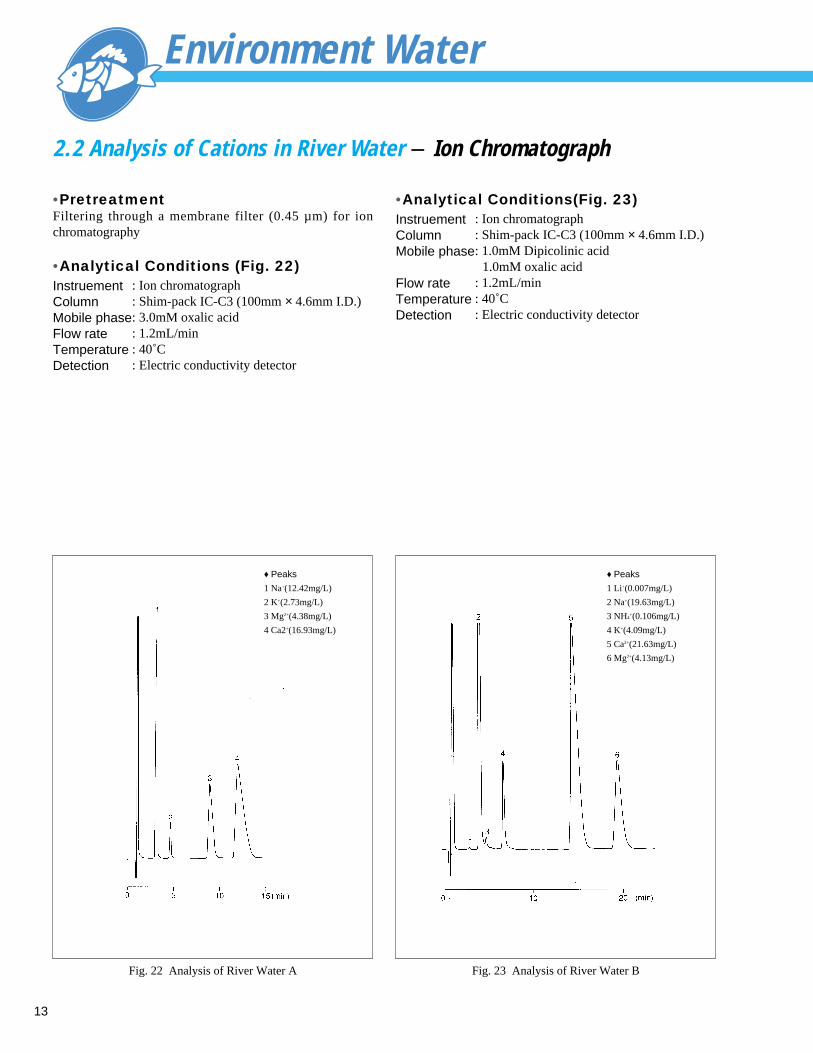
•Analytical Conditions (Fig. 22)InstruementColumnMobile phaseFlow rateTemperatureDetection
: Ion chromatograph: Shim-pack IC-C3 (100mm × 4.6mm I.D.): 3.0mM oxalic acid: 1.2mL/min: 40˚C: Electric conductivity detector
•Analytical Conditions(Fig. 23)InstruementColumnMobile phase
Flow rateTemperatureDetection
: Ion chromatograph: Shim-pack IC-C3 (100mm × 4.6mm I.D.): 1.0mM Dipicolinic acid
1.0mM oxalic acid: 1.2mL/min: 40˚C: Electric conductivity detector
Fig. 22 Analysis of River Water A
♦ Peaks
1 Na+(12.42mg/L)
2 K+(2.73mg/L)
3 Mg2+(4.38mg/L)
4 Ca2+(16.93mg/L)
Fig. 23 Analysis of River Water B
♦ Peaks
1 Li+(0.007mg/L)
2 Na+(19.63mg/L)
3 NH4+(0.106mg/L)
4 K+(4.09mg/L)
5 Ca2+(21.63mg/L)
6 Mg2+(4.13mg/L)

14
2.3 Analysis of Anions in Lake Water - Ion Chromatograph
•ExplanationThe river and lake water – which is the source of our dailytap water – needs to be constantly analyzed and monitoredas any change in the water quality can directly affect humanhealth. Furthermore, the non-organic negative ioncomponents in river and lake water reflect the nature of thewater source and soil, so that each variation in ionconcentration can be used to indicate change in theenvironment. Also, in recent years, eutrophication problemsare occurring in rivers and lakes due to the inflow ofdomestic wastewater, which makes the analysis of non-organic ions even more important for research work on thecauses and levels of pollution.
ReferencesDrinking Water Test Method & Explanation (Fiscal 1993Volume) 164 – 198Ministry of Health and Welfare, Environ. Health Bureau,Water Supply & Environ. Sanitation Dept. EditionJapan Water Works Association
•PretreatmentFiltering through a membrane filter (0.45 µm) for ionchromatography
•Analytical Conditions
Fig. 24 Analysis of Lake Water A
♦ Peaks
1 CO32–
2 F–(0.147mg/L)
3 Cl–(9.65mg/L)
4 NO2–(0.059mg/L)
5 Br–(0.030mg/L)
6 NO3–(0.309mg/L)
7 SO42–(12.38mg/L)
InstrumentColumnMobile phase
Flow rateTemperatureDetection*Bis-Tris
: Ion chromatograph: Shim-pack IC-A3 (150mm × 4.6mm I.D.): 8.0mM p-hydroxybenzoic acid, 3.2mM
Bis-Tris*: 1.5mL/min: 40˚C: Electric conductivity detector: Bis (2-hydroxyethyl) iminotris
(hydroxymethyl) methane

15
2.4 Analysis of Cations in Lake Water - Ion Chromatograph
•PretreatmentFiltering through a membrane filter (0.45 µm) for ionchromatography
Fig. 25 Analysis of Lake Water B
♦ Peaks
1 Na+(12.42mg/L)
2 K+(2.73mg/L)
3 Mg2+(4.38mg/L)
4 Ca2+(16.93mg/L)
Environment Water
•Analytical ConditionsInstrumentColumnMobile phaseFlow rateTemperatureDetection
: Ion chromatograph: Shim-pack IC-C3 (100mm × 4.6mm I.D.): 3.0mM oxalic acid: 1.2mL/min: 40˚C: Electric conductivity detector

16
2.5 Analysis of Anions in River Water - PIA-1000
•ExplanationThis is a river-water analysis example using the personalion analyzer PIA-1000. In this kind of example, the PIA-1000 is a potent force as it can be taken directly to ananalyzing site.
•PretreatmentFiltering through a membrane filter (0.45 µm) for ionchromatography
•Analytical ConditionsInstrumentColumnMobile phase
Flow rateTemperature
: PIA-1000: Shim-pack IC-A3(S): PIA-1000 dedicated anion analysis mobile
phase, IC-MA3-1: 0.2mL/min: 35˚C
Fig. 26 Analysis example of river water (PIA-1000)
♦ Peaks
1 HCO3–(52.77mg/L)
2 PO43–(0.235mg/L)
3 F–(0.076mg/L)
4 Cl–(15.72mg/L)
5 NO3–(7.44mg/L)
6 SO42–(15.04mg/L)

17
2.6 Analysis of Cations in River Water - PIA-1000
•PretreatmentFiltering through a membrane filter (0.45 µm) for ionchromatography
Environment Water
•Analytical ConditionsInstrumentColumnMobile phase
Flow rateTemperature
: PIA-1000: Shim-pack IC-C3(S): PIA-1000 dedicated cation analysis mobile
phase, IC-MC3-1: 0.2mL/min: 35˚C
Fig. 27 Analysis Example of River Water (PIA-1000)
♦ Peaks
1 Na+(13.33mg/L)
2 NH4+(0.396mg/L)
3 K(2.786mg/L)
4 Mg2+(4.336mg/L)
5 Ca2+(17.07mg/L)
18
2.7 Analysis of Calcium and Magnesium in River Water - AA
•ExplanationThe atomic absorption method is one of the widely usedanalysis methods for analyzing chemical elements insolutions because of its simplicity and speed. Here is ananalysis example for Ca and Mg in standard substances inriver water currently on the market.
ReferencesWater test method for factories (JIS K0101)
Quantitative lower limit value (target)Ca : 0.09mg/LMg: 0.004mg/L
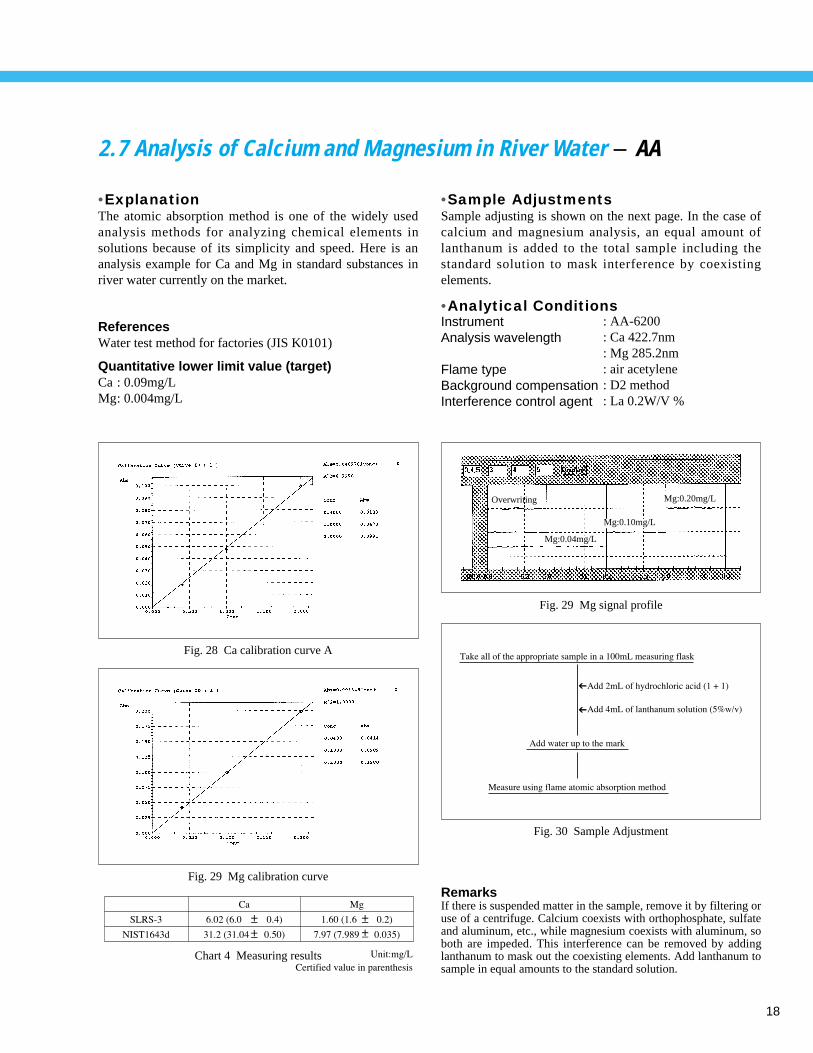
•Sample AdjustmentsSample adjusting is shown on the next page. In the case ofcalcium and magnesium analysis, an equal amount oflanthanum is added to the total sample including thestandard solution to mask interference by coexistingelements.
•Analytical Conditions
Fig. 28 Ca calibration curve A
Fig. 29 Mg calibration curveRemarksIf there is suspended matter in the sample, remove it by filtering oruse of a centrifuge. Calcium coexists with orthophosphate, sulfateand aluminum, etc., while magnesium coexists with aluminum, soboth are impeded. This interference can be removed by addinglanthanum to mask out the coexisting elements. Add lanthanum tosample in equal amounts to the standard solution.
InstrumentAnalysis wavelength
Flame typeBackground compensationInterference control agent
: AA-6200: Ca 422.7nm: Mg 285.2nm: air acetylene: D2 method: La 0.2W/V %
Fig. 29 Mg signal profile
SLRS-3
NIST1643d
Ca
6.02 (6.0 0.4)
31.2 (31.04 0.50)
Mg
1.60 (1.6 0.2)
7.97 (7.989 0.035)
Unit:mg/L
Certified value in parenthesis
Chart 4 Measuring results
Fig. 30 Sample Adjustment
Take all of the appropriate sample in a 100mL measuring flask
Add water up to the mark
Measure using flame atomic absorption method
Add 2mL of hydrochloric acid (1 + 1)
Add 4mL of lanthanum solution (5%w/v)
Overwriting
Mg:0.04mg/L
Mg:0.10mg/L
Mg:0.20mg/L
19
2.8 Analysis of Total Nitrogen and Total phosphorus in River Water - UV
Environment Water
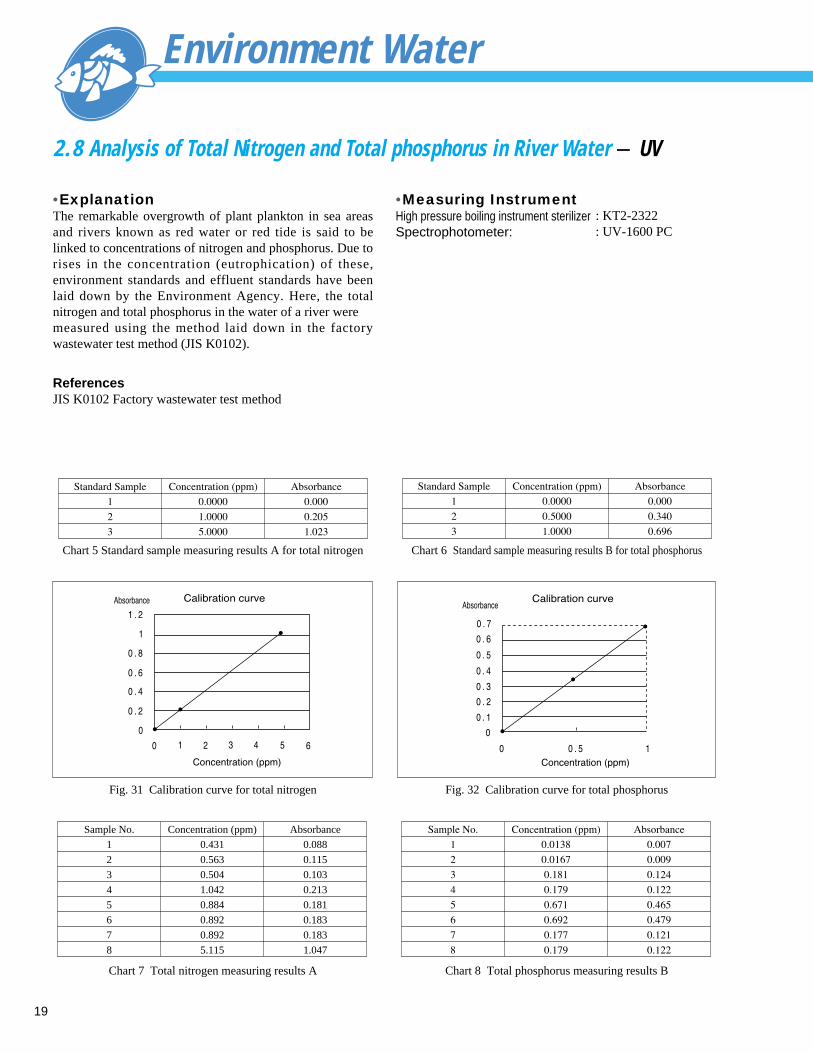
•ExplanationThe remarkable overgrowth of plant plankton in sea areasand rivers known as red water or red tide is said to belinked to concentrations of nitrogen and phosphorus. Due torises in the concentration (eutrophication) of these,environment standards and effluent standards have beenlaid down by the Environment Agency. Here, the totalnitrogen and total phosphorus in the water of a river were measured using the method laid down in the factorywastewater test method (JIS K0102).
ReferencesJIS K0102 Factory wastewater test method
•Measuring InstrumentHigh pressure boiling instrument sterilizerSpectrophotometer:
: KT2-2322: UV-1600 PC
Standard Sample
1
2
3
Concentration (ppm)
0.0000
1.0000
5.0000
Absorbance
0.000
0.205
1.023
Chart 5 Standard sample measuring results A for total nitrogen
Standard Sample
1
2
3
Concentration (ppm)
0.0000
0.5000
1.0000
Absorbance
0.000
0.340
0.696
Chart 6 Standard sample measuring results B for total phosphorus
Fig. 31 Calibration curve for total nitrogen Fig. 32 Calibration curve for total phosphorus
Sample No.
1
2
3
4
5
6
7
8
Concentration (ppm)
0.431
0.563
0.504
1.042
0.884
0.892
0.892
5.115
Absorbance
0.088
0.115
0.103
0.213
0.181
0.183
0.183
1.047
Sample No.
1
2
3
4
5
6
7
8
Concentration (ppm)
0.0138
0.0167
0.181
0.179
0.671
0.692
0.177
0.179
Absorbance
0.007
0.009
0.124
0.122
0.465
0.479
0.121
0.122
Chart 7 Total nitrogen measuring results A Chart 8 Total phosphorus measuring results B
Calibration curve
1 . 2
0 . 8
0 . 6
0 . 4
0 . 2
0
0
1
1 2 3 4 5 6
Concentration (ppm)
Absorbance
0 . 7
0 . 6
0 . 5
0 . 4
0 . 3
0 . 2
0 . 1
0
0 10 . 5
Calibration curve
Concentration (ppm)
Absorbance

20
2.9 Analysis of Non-organic Components in River Water (1) - ICP-MS
Element Detection LimitsMass NumberMeasured Value
8.6
13.4
0.16
0.43
0.2
0.86
0.74
0.27
0.13
0.005
0.029
95
100
111
93
-
98
94
98
-
-
112
57.8
62.7
10.1
5.4
10.1
10.2
10.9
5.7
5.2
1.06
10.3
98
103
100
100
99
97
96
104
100
106
104
0.004
0.002
0.006
0.003
0.003
0.003
0.001
0.005
0.03
0.001
0.001
11
27
52
55
60
63
66
75
77
114
208
B
Al
Cr
Mn
Ni
Cu
Zn
As
Se
Cd
Pb
Guaranteed Value
River Water Standards JAC 0031 (without addition)
Recovery (%) Recovery (%)Measured Value Guaranteed Value
River Water Standards JAC 0032 (added)
Unit: ng/mL( ): Referencial value
•ExplanationThe testing methods of the Environment Standard itemhave been amended, so that the ICP mass spectrometry(ICP-MS) method has been adopted for analysis of non-organic metal elements. ICP-MS is noted for the feature ofbeing able to handle many of the chemical elements with atechnique that simultaneously analyzes with highsensitivity. Here, an example of river water analysis usingthe inductively coupled plasma mass spectrometer ICPM-8500 will be introduced. As river water is a source of tapwater, it is one of the most commonly tested and importantsamples among environment samples. In this test,quantitative analysis of standard substances in river waterJAC0031 and JAC0032 (Japan Society for AnalyticalChemistry Approval) was performed.
References(1) Partial amendment of Ministerial ordinance related to
water quality standard for drinking water and WaterSupply Law Operation Regulations, etc., introduced onDecember 21, 1992
(2) Revision of Water Quality Pollution Prevention Law,etc, introduced on March 8, 1993
•PretreatmentNitric acid was added to 50mL of sample, boiled forapproximately 10 minutes over a hot plate, cooled,measured up to 50mL with ultra purified water, and stirredthoroughly.
•Analytical ConditionsInstrumentHigh-frequencyHigh-frequency outputCooling gasPlasma gasCarrier gasSample induction unit
Sample suction rateIon induction system
: ICPM-8500: 27.12MHz: 1.2kW: Ar 7.0L/min: Ar 1.5L/min: Ar 0.7L/min: Coaxial nebulizer/water cooling
chamber (5˚C): 0.4mL/min: Pt type sampling cone: Pt type skimmer cone
Chart 9 River water analysis results (ng/mL)

21
2.9 Analysis of Non-organic Components in River Water (2) - ICP-MS
Environment Water
Fig. 33 Pb calibration curve
Fig. 34 Cd calibration curve
Fig. 35 Pb 208 mass spectra Fig. 36 Cd 114 mass spectra Fig. 37 Cr 52 mass spectra

22
2.10 Analysis of Anions in Hot Spring Water - Ion Chromatograph
•ExplanationThis shows an analysis example for non-organic anions andcations in hot spring water.
•PretreatmentFiltering through a membrane filter (0.45 µm) for ionchromatography
Fig. 38 Analysis of hot spring water
♦ Peaks
1 HCO3–
2 Cl–
3 NO3–
4 SO42–
•Analytical ConditionsColumnMobile phase
Flow rateTemperatureDetector
: Shim-pack IC-A1: 6.0mM boric acid
1.8mM mannitol7. 5mM Tris (hydroxymethyl)aminomethane (pH 7.9)
: 1.5mL/min: 40˚C: Electric conductivity detector

23
2.11 Analysis of Cations in Hot Spring Water (1) - Ion Chromatograph
Fig. 39 Hot spring water
♦ Peaks
1 Na+
2 NH4+
3 K+
Environment Water
•PretreatmentFiltering through a membrane filter (0.45 µm) for ionchromatography
•Analytical ConditionsColumnMobile phaseFlow rateTemperatureDetector
: Shim-pack IC-C1: 5mM of nitric acid: 1.5mL/min: 40˚C: Electric conductivity detector

24
2.11 Analysis of Cations in Hot Spring Water (2) - Ion Chromatograph
Fig. 40 Hot spring water
♦ Peaks
1 Mg2+
2 Ca2+
•PretreatmentFiltering through a membrane filter (0.45 µm) for ionchromatography
•Analytical ConditionsColumnMobile phaseFlow rateTemperatureDetector
: Shim-pack IC-C1: 4mM of tartaric acid, 2mM ethylenediamine: 1.5mL/min: 40˚C: Electric conductivity detector

25
2.12 Analysis of Anions in Rainwater - Ion Chromatograph
•ExplanationIn recent years, the acidification of rainfall has progressed,and is adversely affecting ecosystems. The main cause ofacid rain is thought to be that SOx and Nox converts toH2SO4, HNO3, etc., in Rainwater. The pH level in Rainwateris set as the criteria for acid rain; however, as pH isstandardized from the equivalent weight relationship ofacidic elements and alkali elements, the detailed causes andaffects of acid rain cannot be fully determined from the pHvalue alone. As shown in chart 10, the EnvironmentAgency have designated 8 elements as analysis items. Anion chromatograph – which can handle simultaneousmultiple ion analysis - is suitable for the analysis of theseitems.
Fig. 41 Rainwater
♦ Peaks
1 Cl (64.1µg/L)
2 NO2–(21.1µg/L)
3 NO3–(827.8µg/L)
4 SO42–(739.6µg/L)
Environment Water
•PretreatmentFiltering through a membrane filter (0.45 µm) for ionchromatography
•Analytical ConditionsInstrumentColumn
Mobile phase
Flow rateTemperatureDetection*Bis-Tris
: Ion chromatograph: Shim-pack IC-A3 (150mm × 4.6mm I.D.): 8.0mM p-hydroxybenzoic acid,
3.2mM Bis-Tris*: 1.5mL/min: 40˚C: Electric conductivity detector: Bis (2-hydroxyethyl) iminotris
(hydroxymethyl) methane
Chart 10 Rainwater element analysis items in Environment Agency Studies
Ion
SO42-
NO3-
CI-
Na+
NH4+
K+
Mg2+
Ca2+
Sample Amt
2
2
2
2
2
2
2
2
Conc Allowed
0.06
0.05
0.01
0.03
0.02
0.02
0.01
0.02

26
2.13 Analysis of Cations in Rainwater - Ion Chromatograph
Fig. 42 Analysis of Rainwater
♦ Peaks
1 Na+(420µg/L)
2 NH4+(139µg/L)
3 K+(554µg/L)
4 Mg2+(158µg/L)
5 Ca2+(178µg/L)
•PretreatmentFiltering through a membrane filter (0.45 µm) for ionchromatography
•Analytical ConditionsInstrumentColumnMobile phaseFlow rateTemperatureDetection
: Ion chromatograph: Shim-pack IC-C3 (100mm × 4.6mm I.D.): 2.5mM oxalic acid: 1.0mL/min: 40˚C: Electric conductivity detector
27
2.14 Analysis of Anions in Rainwater - PIA-1000
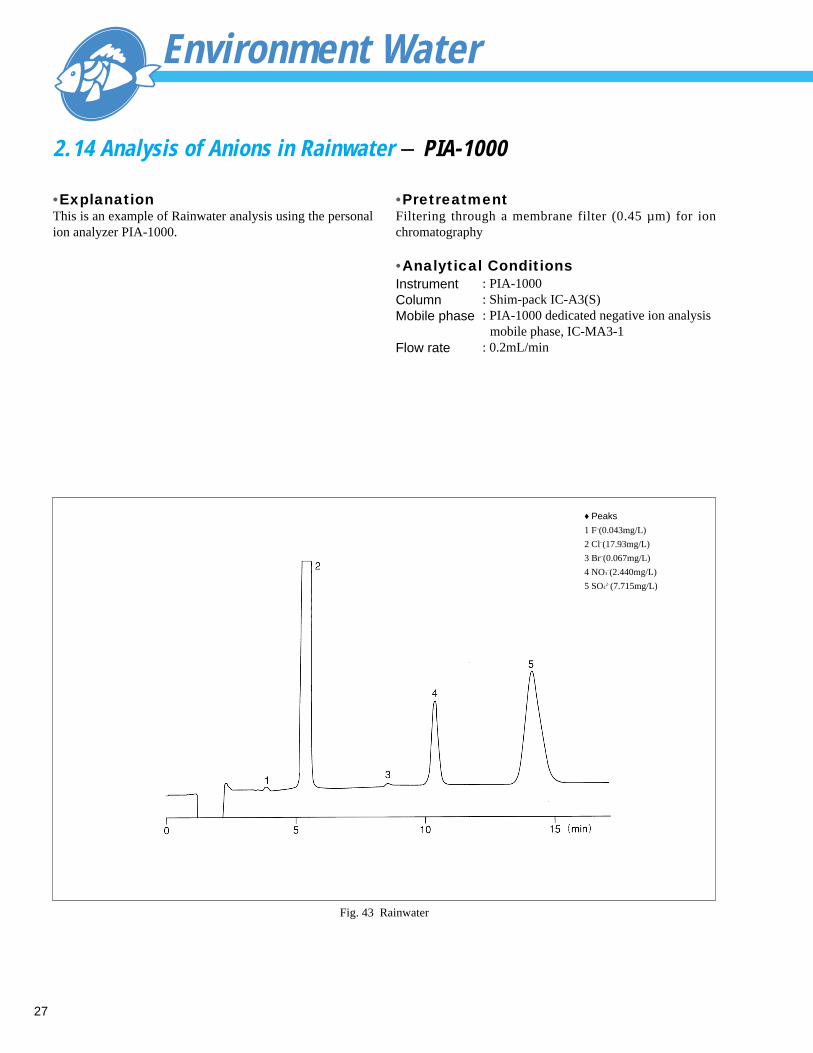
•ExplanationThis is an example of Rainwater analysis using the personalion analyzer PIA-1000.
Fig. 43 Rainwater
♦ Peaks
1 F–(0.043mg/L)
2 Cl–(17.93mg/L)
3 Br–(0.067mg/L)
4 NO3–(2.440mg/L)
5 SO42–(7.715mg/L)
Environment Water
•PretreatmentFiltering through a membrane filter (0.45 µm) for ionchromatography
•Analytical ConditionsInstrumentColumnMobile phase
Flow rate
: PIA-1000: Shim-pack IC-A3(S): PIA-1000 dedicated negative ion analysis
mobile phase, IC-MA3-1: 0.2mL/min

28
2.15 Analysis of Cations in Rainwater - PIA-1000
•ExplanationThis is an example of rainwater analysis using the personalion analyzer PIA-1000.
•PretreatmentFiltering through a membrane filter (0.45 µm) for ionchromatography
Fig. 44 Rainwater
♦ Peaks
1 Na+(9.673mg/L)
2 NH4+(0.607mg/L)
3 K+(0.638mg/L)
4 Mg+(1.196mg/L)
5 Ca2+(1.294mg/L)
•Analytical ConditionsInstrumentColumnMobile phase
Flow rateTemperature
: PIA-1000: Shim-pack IC-C3(S): PIA-1000 dedicated positive ion analysis
mobile phase, IC-MC3-1: 0.2mL/min: 35˚C
29
2.16 Analysis of Sulfurous Acid Ions in Rainwater - HPLC
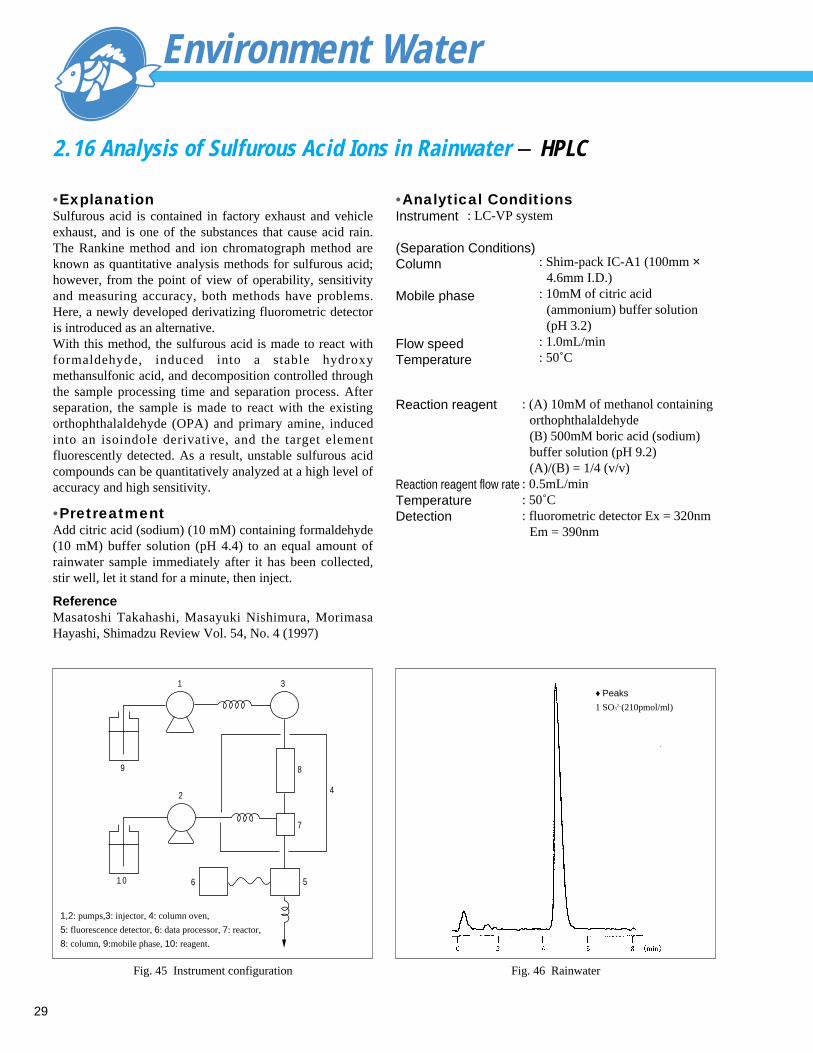
•ExplanationSulfurous acid is contained in factory exhaust and vehicleexhaust, and is one of the substances that cause acid rain.The Rankine method and ion chromatograph method areknown as quantitative analysis methods for sulfurous acid;however, from the point of view of operability, sensitivityand measuring accuracy, both methods have problems.Here, a newly developed derivatizing fluorometric detectoris introduced as an alternative.With this method, the sulfurous acid is made to react withformaldehyde, induced into a stable hydroxymethansulfonic acid, and decomposition controlled throughthe sample processing time and separation process. Afterseparation, the sample is made to react with the existingorthophthalaldehyde (OPA) and primary amine, inducedinto an isoindole derivative, and the target elementfluorescently detected. As a result, unstable sulfurous acidcompounds can be quantitatively analyzed at a high level ofaccuracy and high sensitivity.
•PretreatmentAdd citric acid (sodium) (10 mM) containing formaldehyde(10 mM) buffer solution (pH 4.4) to an equal amount ofrainwater sample immediately after it has been collected,stir well, let it stand for a minute, then inject.
ReferenceMasatoshi Takahashi, Masayuki Nishimura, MorimasaHayashi, Shimadzu Review Vol. 54, No. 4 (1997)
Fig. 46 Rainwater
♦ Peaks
1 SO32–(210pmol/ml)
1
9
3
2
8
4
7
561 0
Fig. 45 Instrument configuration
Environment Water
•Analytical ConditionsInstrument
(Separation Conditions)Column
Mobile phase
Flow speedTemperature
Reaction reagent
Reaction reagent flow rateTemperatureDetection
: (A) 10mM of methanol containingorthophthalaldehyde(B) 500mM boric acid (sodium)buffer solution (pH 9.2)(A)/(B) = 1/4 (v/v)
: 0.5mL/min: 50˚C: fluorometric detector Ex = 320nm
Em = 390nm
: Shim-pack IC-A1 (100mm ×4.6mm I.D.)
: 10mM of citric acid(ammonium) buffer solution(pH 3.2)
: 1.0mL/min: 50˚C
: LC-VP system
1,2: pumps,3: injector, 4: column oven,
5: fluorescence detector, 6: data processor, 7: reactor,
8: column, 9:mobile phase, 10: reagent.

30
2.17 Analysis of Anions in Snow Water - Ion Chromatograph
•ExplanationSnow water shows acidification tendencies similar toRainwater, and is having an adverse affect on ecosystems.In recent years, there have been reports stating that snowcrystals have deformed into T-shaped and bar-shapedcrystals due to sulfur oxide in exhaust smoke and exhaustgas. This comes about from foreign matter in theatmosphere acidifying snow, which hinders the formationof snow crystals causing them to become deformed. Thisphenomenon has tended to increase from 1993 onward.
Fig. 48 Analysis of snow water
♦ Peaks
1 Cl–
2 NO3–
3 SO42–
Fig. 47 Analysis of snow water
♦ Peaks
1 Cl–
2 NO3–
3 SO42–
•PretreatmentFiltering through a membrane filter (0.45 µm) for ionchromatography
•Analytical ConditionsInstrumentColumnMobile phase
Flow rateTemperatureDetection
: Ion chromatograph: Shim-pack IC-A1 (100mm × 4.6mm I.D.): 2.5mM of phthalic acid, 2.4mM of Tris
(hydroxymethyl) aminomethane (pH 4.0): 1.5mL/min: 40˚C: Electric conductivity detector

31
2.18 Analysis of Anions in Sea Water - HPLC
•ExplanationNitrogen atoms in seawater are said to exist as ions ofwhich nearly all are composed from either NO2
–, NO3–, or
NH4+. Ion chromatography is well configured as
identification analysis method for nitrogen in seawater as itis able to quantify each of the above ions separately.However, conventional ion chromatography using electricconductivity detection has problems accurately quantifyingthese ions because of the influence of sodium and chlorideions, which exists in vast amounts in seawater. NO2
– andNO3
– absorb comparatively well in the ultraviolet region,whereas the ions of Cl– and SO4
2–, etc., are hardly able toabsorb any ultraviolet, so an ultraviolet absorption detectionmethod is a well-suited method for analyzing NO2
– andNO3
–. In this case, phosphoric acid buffer solution, whichhas little ultraviolet absorption is used as the mobile phasefor analysis, and detection is conducted at the 210nm level.Also, under these conditions, bromide ions can be analyzedat high accuracy.
Fig. 49 Seawater
♦ Peaks
1 NO2–
2 Br–
3 NO3–
Environment Water
•PretreatmentFiltering through a membrane filter (0.45 µm) for ionchromatography
•Analytical ConditionsInstrumentColumn
Mobile phase
Flow rateTemperatureDetection
: LC-VP system: Asahipak NH2P-50 (250mm × 4.6mm
I.D.): 10mM of phosphoric acid (sodium) buffer
solution (pH 6.9) containing 150mM of sodium perchlorate
: 0.8mL/min: 35˚C: UV-VIS detector 214nm

32
2.19 Analysis of Ammonia Ions in Sea Water - HPLC
•ExplanationNH4
+ reacts with orthophthalaldehyde (OPA) to formfluorescent chromaphore. When this reaction is applied toanalysis of seawater, the various ions that coexist do notinfluence analysis, thus enabling highly accuratequantifying of NH4
+. The following is an example of NH4+
analyzed in seawater using an amino acid analysis system.
•PretreatmentFiltering through a membrane filter (0.45 µm) for ionchromatography
Fig. 50 Seawater
♦ Peaks
1 NH4+
•Analytical ConditionsInstrumentColumnTrap columnMobile phase
Flow rateTemperatureReaction reagentReaction reagent flow rateDetection
: LC-VP system: Shim-pack ISC-07/S1504Na: Shim-pack ISC-30/S1504Na: 0.60 N of sodium citrate, 0.20 M of
boric acid (pH 10.0, adjusted withNaOH solution)
: 0.3mL/min: 55˚C: OPA solution: 0.3mL/min: Fluorometric detector Ex = 348nm
Em = 450nm

33
2.20 Analysis of Fluoride Ions in Sea Water (1) - Ion Chromatograph
•ExplanationWhen analyzing fluoride ions with an ion chromatograph,chloride ions - that are amply contained in seawater -interfere with analysis, and prior selective removal of thesechlorine ions is required using a silver-type cationreplacement cartridge. However, this method causes a dropin the collection rate, and accurate analysis cannot beperformed. Here, the diffusive separation method iseffective in resolving this problem. A combination of thediffusive separation method and ion chromatography wasinvestigated by professor Okutani et al of the NihonUniversity, and it was found that Shim-pack IC-A3 columnhas the most suitable features for this method, so nowfluorine ions of 1 ppm or less in seawater can be measuredwith high accuracy.
Fig. 51 Fluoride ions in seawater
♦ Peaks
1 F–(1.15mg/L)
Environment Water
•PretreatmentSee next item for details.
•Analytical ConditionsInstrumentColumnGuard column
Mobile phase
Flow rateTemperatureDetection*Bis-Tris
: Ion chromatograph: Shim-pack IC-A3 (150mm × 4.6mm I.D.): Shim-pack IC-GA3 (10mm × 4.6mm
I.D.): 8.0mM p-hydroxybenzoic acid, 3.2mM
Bis-Tris*: 1.5mL/min: 40˚C: Electric conductivity detector: Bis (2-hydroxyethyl) iminotris
(hydroxymethyl) methane

34
2.20 Analysis of Fluoride Ions in Sea Water (2) - Ion Chromatograph
Reference Example 1(Diffusive Separation Method)Diffusive separation uses an acrylic resin diffusioncontainer configured of a box within a box, with the innerbox being able to divide the outer box when the wholecontainer is tilted on its side. The diagrams on the rightdepict the diffusion container from overhead and side view.When diffusion is actually performed, first the outer boxcompartments (A and B) divided by the inner box areseparately filled with 10mL of sample and 10mL ofreaction solution (hexamethyldisiloxane saturated
2.7NHClO4), the inner box (C compartment) is filled with10mL of absorption solution (0.1N NaOH). After sealingthe lid on the container, the sample and reaction solution ofthe outer box are mixed, and left to stand for a night so thatthe fluoride ions will be quantitatively absorbed into theabsorption solution. As the absorption solution has strongalkalinity, it is neutralized in H type ion replacementcartridge column before being injected into the ionchromatograph.
A
C
B
Fig. 52 Diffusive separation container

35
2.21 Analysis of Microcystin in Blue-green Algae (1) - HPLC
•ExplanationIn recent years, social problems are developing aseutrophication takes a stronger grip in lakes such as LakeBiwa and Lake Kasumigaura along with the phenomenonknow as blue-green algae. Toxins are manufactured in someof the blue-green algae, which form blue-green algae, andthere have been examples overseas of cattle dying afterdrinking lake water affected by blue-green algae.Microcystin is a typical toxin (liver toxin) contained inblue-green algae, and there are said to be more than 50kinds of microcystins in the circular peptides made from the7 amino acids. The representative types found in Japaneselakes are microcystin LR, YR, and RR.
References(1)K.I.Harada, et al.: Toxicon, 26(5), 433-439, 1988(2)K.I.Harada, et al.: J. Chromatogr., 448, 275-283, 1988
•PretreatmentMicrocystin is extracted from blue-green algae using aceticacid (5%). This is stirred and centrifugally separated in 3repeated operations, then this is cleaned up in accordancewith the supernatant. The cleanup operation involvespassing the supernatant through an ODS cartridge for solid-phase extraction to adsorb the elements, washing it, thensolve it out using methanol.
H H HH
H
O
O
O
O
O
N
R4
CH2HN
NH
H
HH
H
H
NH
H
OCH3
H3C
H3C
R3
R2
R1
CO2H
CO2H
CH3 CH3 HN
Microcystin LR
R4R1 R2 R3
Microcystin YR
Microcystin RR
Leu
Tyr
Arg Arg
Arg
Arg CH3
CH3
CH3
CH3
CH3
CH3
Fig. 53 Microcystin structure
Environment Water
•Analytical ConditionsInstrumentColumnMobile phase
Flow rateTemperatureDetection
: LC-VP system: STR ODS-II (150mm × 6.0mm I.D.): 50mM of sodium phosphate buffer
solution (pH 3.0)/methanol = 4/6 (v/v): 1.0mL/min: 40˚C: UV-VIS Detector 240nm
Peaks1. Microcystin RR2. Microcystin YR3. Microcystin LR
1
2 3
0 5 10 15(min)
Fig. 54 Analysis of blue-green algae

36
2.21 Analysis of Microcystin in Blue-green Algae (2) - HPLC
Pretreatment Method Flow Chart
Blue-green algaeExtraction of microcystin1) 50mL of 5% acetic acid 2) Stir for 30 min3) Centrifuge<Repeat operations 1) to 3) three times>
SupernatantCleanup with solid-phase extraction method(Use Sep-Pak Plus tC18)1) Wash cartridge with 20mL of methanol and 20mL of water2) Liquid permeation of supernatant in cartridge at 10 to 20mL/min flow speed
(adsorb the microcystin)3) Wash cartridge with 20mL washing liquid (water/methanol = 9/1)4) Pour 2mL of methanol into cartridge to solve out microcystin
Solving out (2mL)
HPLC
Reference Example 1
Sample was provided by Mr. Kunimitsu Hitani of the Environmental Chemistry Division of the National Institute of Environmental Studies
37
Environment Water
2.22 Analysis of Cyanogen Compounds by Chemical Classification (1) - HPLC
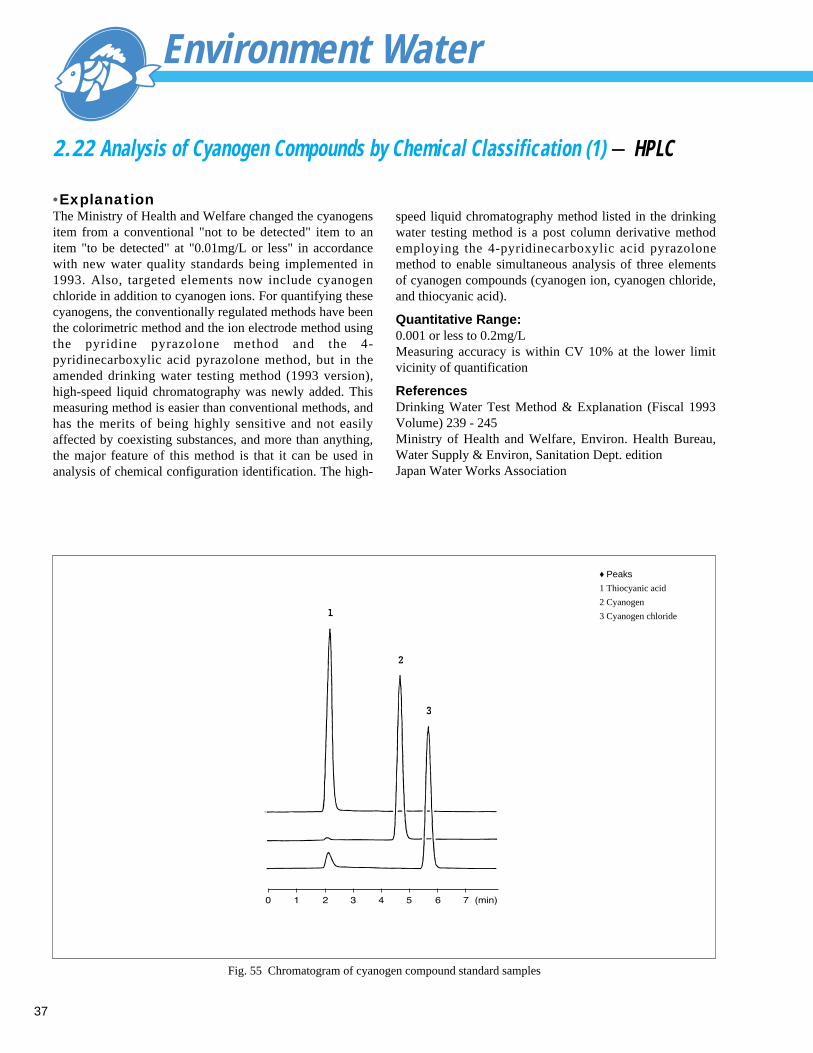
•ExplanationThe Ministry of Health and Welfare changed the cyanogensitem from a conventional "not to be detected" item to anitem "to be detected" at "0.01mg/L or less" in accordancewith new water quality standards being implemented in1993. Also, targeted elements now include cyanogenchloride in addition to cyanogen ions. For quantifying thesecyanogens, the conventionally regulated methods have beenthe colorimetric method and the ion electrode method usingthe pyridine pyrazolone method and the 4-pyridinecarboxylic acid pyrazolone method, but in theamended drinking water testing method (1993 version),high-speed liquid chromatography was newly added. Thismeasuring method is easier than conventional methods, andhas the merits of being highly sensitive and not easilyaffected by coexisting substances, and more than anything,the major feature of this method is that it can be used inanalysis of chemical configuration identification. The high-
speed liquid chromatography method listed in the drinkingwater testing method is a post column derivative methodemploying the 4-pyridinecarboxylic acid pyrazolonemethod to enable simultaneous analysis of three elementsof cyanogen compounds (cyanogen ion, cyanogen chloride,and thiocyanic acid).
Quantitative Range:0.001 or less to 0.2mg/LMeasuring accuracy is within CV 10% at the lower limitvicinity of quantification
ReferencesDrinking Water Test Method & Explanation (Fiscal 1993Volume) 239 - 245Ministry of Health and Welfare, Environ. Health Bureau,Water Supply & Environ, Sanitation Dept. editionJapan Water Works Association
0 1 2 3 4 5 6 7 (min)
Fig. 55 Chromatogram of cyanogen compound standard samples
♦ Peaks
1 Thiocyanic acid
2 Cyanogen
3 Cyanogen chloride

38
2.22 Analysis of Cyanogen Compounds by Chemical Classification (2) - HPLC
Apparatus;
1 : Pump for mobile phase
2 : Sample injector
3 : Column oven
4 : Column
5 : Pump for reagent 1
6 : Reaction chamber
7 : Reactor (0.3mm¿ ´ 2m)
8 : Pump for reagent 2
9 : Reactor (0.5mm¿ ´ 2m)
10 : Cooling coil (0.3 mm¿ ´ 2m)
11 : Absorption detector
12 : Data processor
Fig. 56 Analysis system flow route
•Analytical ConditionsInstrument
Column
Mobile phase
Flow rateTemperature
: LC-VP system(Separation Conditions)
: Shim-pack AMINO-Na (100mm × 6.0mmI.D.)
: 10mM of tartaric acid (sodium) buffersolution (pH 4.2)
: 0.6mL/min: 50˚C
[Chlorination]Reagent solution
Flow rateReaction unitTemperature[Coloring]Reagent solution
Flow rateReaction unitTemperatureCooling unitDetector
Post column derivative method
: 200mM of phosphoric acid (sodium)buffer solution containing 2mM ofchloramine T (pH 6.8)
: 0.3mL/min: SUS coil (2m × 0.3mm I.D.): 100˚C
: a mixed solution of ethanol solution of100mM of 1-phenyl 7-3-methyl-5-pyarozolone and water solution of20mM of pyridine-4-carboxylic acid(1/3, V/V)
: 0.3mL/min: SUS coil (2m × 0.5mm I.D.): 100˚C: SUS coil (2m × 0.3mm I.D.): UV-VIS detector 638nm
(Detection Conditions)

39
2.23 Analysis of Alkyl Mercury Compound (1) - GC
•ExplanationThere are two methods for measuring mercury in theenvironment – one is the total mercury measuring methodemploying ultraviolet absorption and atomic absorption andthe other is the organic mercury measuring methodemploying gas chromatography (GC). The GC orientatedmeasuring method is known as the effective analysismethod for organic mercury, which was the cause ofMinamata disease. As most organic mercury exists in theenvironment as methyl mercury and ethyl mercury, GCenables highly sensitive and selective detection with ECDusing chlorination.
ReferencesEnvironment Water Quality Analysis Method Manual 411 –416Environment Chemical Research Association volume
Quantitative Lower Limit Value (according toabove reference material)0.5µg/L (for analysis of 200mL sample)
Fig. 58 Methyl mercury in snakehead mullet conserved in river AFig. 57 Standard products (100ppb each)
Environment Water
•Analytical ConditionsInstrumentColumn
Column temperatureInjection inlet temperatureDetector temperatureCarrier gas
: GC-14BPFE: Thermon-HG 10% Chromosorb
W (AW-DMCS)80-100 mesh 0.5m × 3.0mm I.D.
: 150˚C: 250˚C: 280˚C (ECD): N2 40mL/min
4,98
3
Eth
ylch
lori
dem
ercu
ry
Met
hylc
hlor
ide
mer
cury
2,86
7
2×10⁻¹⁰g
Met
hylc
hlor
ide
mer
cury

40
2.23 Analysis of Alkyl Mercury Compound (2) - GC
Pretreatment Method Flowchart
200mL sample (500mL separatory funnel used)When not neutral, ammonia water or hydrochloric acid are used to neutralize beforeadding hydrochloric acid to provide approximately 2N.
ExtractionAdd 50mL of benzene, shake well for 2 min, transfer water chamber to separatoryfunnel, and store benzene layer. Once again add 50mL of benzene to the waterchamber, stir well for 2 min, and throw away water layer.
Washing the Benzene LayerCombine benzene layers, add 20mL of sodium chloride solution (200g/L), stir forapproximately 1 min to wash benzene layer, and throw away water layer.
StrippingAdd 8mL of (1) L-cystine and sodium acetate solution to the benzene layer, stir well forapproximately 2 min, allow to stand, then transfer water layer to separatory funnel (20-30 mL).
ExtractionAdd 2mL of hydrochloric acid and 5mL of benzene, shake well for 2 min, allow tostand, then transfer benzene layer to test tube with joint valve.
GC Analysis
(1) L-cystine and sodium acetate solutionDissolve hydrochloric acid L-cystine hydrate 1g, sodium acetate trihydrate 0.8g,and sodium sulphate (anhydrous) 12.8g into water to make 100mL solution.
Reference Example 1
Reference Example 2 Example of Recommended Instrument ConfigurationMain unitDetectorColumn
Auto injectorData processing system
: GC-17AAFwE (with WBI) or GC-14BPFE: ECD: Thermon-HG 10% Chromosorb W (AW-DMCS) 80-100 mesh, 0.5m × 3mm I.D. glass
column, HR-Thermon-HG 15m × 0.53mm I.D.
: AOC-20i/s: CLASS-GC10 or Chromatopac C-R7A plus

41
2.24 Analysis of PCB in Water (1) - GC
•ExplanationThe polychlorinated biphenyl (PCB) analysis method usinggas chromatography (GC) is performed using the methodannounced by the PCB analytical research group of theEnvironmental Health Bureau of the Ministry of Health andWelfare. This method is configured from (1) extraction, (2)cleanup, (3) separation from agricultural chemicals, (4)confirmation of PCB, and (5) quantifying of total PCB bymeans of GC with ECD.
ReferencesEnvironmental Water Quality Analysis Method Manual 417– 428Environment Chemical Research Association volume
Quantitative Lower Limit Value (according to abovereference material) 1µg/L
AN
AL
8
4 8
12
16
20
24
28
32
36 (min)
Fig. 59 Standard Products (KC-300/400/500/600 = 1/1/1/1) 1ppm chromatogram
Environment Water
•Analytical ConditionsInstrumentColumn
Column temperatureInjector inlet temperatureDetector temperatureCarrier gas
: GC-14BPFE: OV-1 2% Chromosorb W (AW-
DMCS)80-100 mesh 2.1m × 3.2mm I.D.
: 210˚C: 240˚C: 280˚C (ECD): N2 40mL/min

42
2.24 Analysis of PCB in Water (2) - GC
Reference Example 2 Example of Recommended Instrument Configuration
Main unitDetectorColumn
Auto injectorData processing system
: GC-17AAFwE (with WBI) or GC-14BPFE: ECD: OV-1 2% Chromosorb W (AW-DMCS) 80-100 mesh,
2.1m × 3.2mm I.D. glass column: AOC-20i/s: CLASS-GC10 or Chromatopac C-R7A plus
Sample 1L (2L separatory funnel used)
Extraction
Concentration (K-D concentrator used) 5mL
Silica gel column chromate tube elution test
1. Activation 30min cooling at 130; 18 hr by desiccator
2. Mixture (2:1) of KC-300, KC-600, 10ppm n-hexane
3. Chromate tube 10mm *30cm
Filling
2mL of separate screen test solution
(dropping as far as the sodium sulphate surface)
GC Analysis 5 µm injection
(Confirm stability and collection rate of run-off range 2 or 3 times.)
50mL of acetone
50mL of n-hexane
2nd measure of 50mL of n-hexane (throw away water layer)
Washing with absorbent cotton or glass wool
permeated with 10mL of n-hexane
Place 4g of silica gel and 10mL of n-hexane in beaker.
Flow down n-hexane... stabilize silica gel layer.
Place 1g of Sodium sulphate (anhydrous) on top of silica gel.
Wash inside of chromate tube twice (1mL each time)
Attach 300mL separatory funnel, divide 200ml of n-hexane
effluent into 10mL batches in 20 test tubes.
Reference example)
1. Silica gel column (Wakogel S-1)
10mm internal diameter of glass, silica weight 4g, height 220mm
Runoff n-hexane with valve fully open, runoff speed 2.6mL/min.
2. Florisil PR
10mm internal diameter of glass, florisil weight 4g, height 120mm
Runoff n-hexane with valve fully open, runoff speed 10.5mL/min.
Reference Example 1 Pretreatment Flowchart
43
2.25 Analysis of Residual Organic Phosphorus Compounds (1) - GC
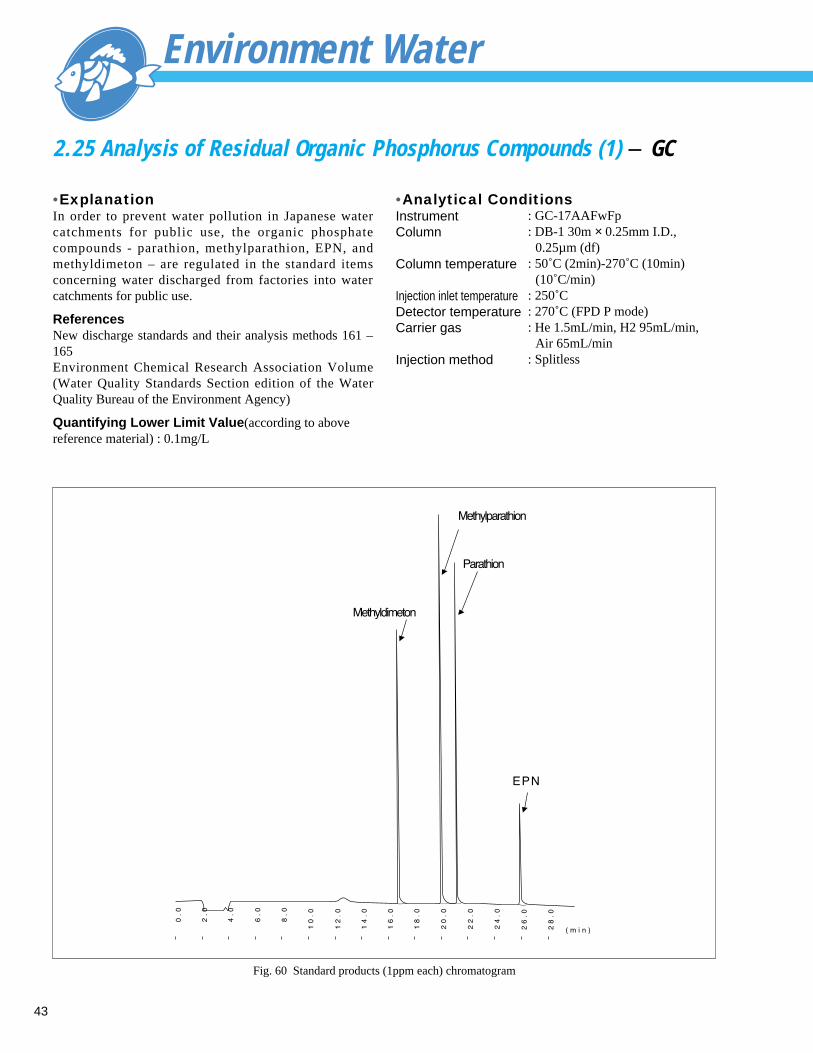
•ExplanationIn order to prevent water pollution in Japanese watercatchments for public use, the organic phosphatecompounds - parathion, methylparathion, EPN, andmethyldimeton – are regulated in the standard itemsconcerning water discharged from factories into watercatchments for public use.
ReferencesNew discharge standards and their analysis methods 161 –165Environment Chemical Research Association Volume(Water Quality Standards Section edition of the WaterQuality Bureau of the Environment Agency)
Quantifying Lower Limit Value(according to abovereference material) : 0.1mg/L
EPN
Methyldimeton
Methylparathion
Parathion
0.0
2.0
4.0
6.0
8.0
10.0
12.0
14.0
16.0
18.0
20.0
22.0
24.0
26.0
28.0
( m i n )
Fig. 60 Standard products (1ppm each) chromatogram
Environment Water
•Analytical ConditionsInstrumentColumn
Column temperature
Injection inlet temperatureDetector temperatureCarrier gas
Injection method
: GC-17AAFwFp: DB-1 30m × 0.25mm I.D.,
0.25µm (df): 50˚C (2min)-270˚C (10min)
(10˚C/min): 250˚C: 270˚C (FPD P mode): He 1.5mL/min, H2 95mL/min,
Air 65mL/min: Splitless

44
2.25 Analysis of Residual Organic Phosphorus Compounds (2) - GC
Reference Example 2 Example of Recommended Instrument Configuration
Reference Example 1 Pretreatment Method Flowchart
Main unitDetectorColumnAuto injectorData processing system
: GC-17AAFwFp or GC-14BPFFp: FPD: DB-1 30m × 0.25mm I.D., 0.25µm(df): AOC-20i/s: CLASS-GC10 or Chromatopac C-R7A plus
Sample 100mL
Extraction
Conversion Solution (10mL of acetone)
5g of sodium chloride
Adjust to pH 3 Ð 4 with hydrochloric acid (1 + 1)
Extract 40mL of n-hexane twice.
Add sodium sulphate (anhydrous) to n-hexane to remove water.
Volatize the n-hexane.
GC Analysis 2µL

45
2.26 Analysis of Volatile Organic Compound (VOC) in Wastewater andEnvironment Water using Head Space Method (1) - GC/MS
•ExplanationIn addition to the amendments to the water quality standardin tap water in December 1992 and the environmentstandard for environment water suitable as a source ofdrinking water in March 1993, a further amendment wasalso implemented for the wastewater standard in February1994. The analysis of the compounds itemized in theseamendments is performed using the head space method, thesolvent extraction method, and the purge trap method. Here,the head space method has the features of being easy tooperate, has good reproducibility, an auto sampler can beused, and carry over (pollution levels of conventionalanalytical instruments caused by components with highconcentration levels) is minimal.
ReferencesDrinking Water Test Method & Explanation Japan WaterWorks Association volumeEnvironment Water Quality Analysis Manual Environment Chemical Research Association volumeNew wastewater standards and their analysis methods
12
3
4 5
6
9
1011
12
13
14
1516
17
20
2221
IS
19
187
8
93377
6 8 10 12 14 16 18 20
TIC
(min)
Fig. 61 Analysis example of standard sample (VOC 2ug/L)
26
9
5
12
1418
1920
21
83186
6 8 10 12 14 16 18 20 (min)
TIC
Fig. 62 Analysis example of tap water
Environment Water
•Analytical Conditions
Sample temp.Condition timeNeedle temp.Transfer temp.Pressueriz. timeInjection time
Carrier gasColumn
Column temp.
: 60˚C: 30min: 120˚C: 150˚C: 2min: 0.20min
: He120kPa : DB624 60m × 0.32mm I.D.
1.8µm(df): 40˚C (2min)-10˚C /min-200˚C
(2min)
Perkin Elmer HS-40
Shimadzu GCMS-QP5050A
Sample : 10ml+NaCl3g

46
2.26 Analysis of Volatile Organic Compound (VOC) in Wastewater andEnvironment Water using Head Space Method (2) - GC/MS
24 5
69
112
10
14
17 19
20
22
64907
6 8 10 12 14 16 18 20 (min)
TIC
Fig. 63 Analysis example of wastewater
1
2
3
4
5
6
7
8
9
10
11
12
13
14
15
16
17
18
19
20
21
22
IS
1,1-dichloroethene
Dichloromethane
trans-1,2-dichloroethane
cis-1,2-dichloroethane
Chloroform
1,1,1-trichloroethane
Tetrachloromethane
1,2-dichloroethane
Benzene
Trichloroethene
1,2-dichloropropane
Bromodichloromethane
cis-1,3-dichloropropene
Toluene
trans-1,3-dichloropropene
1,1,2-trichloroethene
Tetrachloroethene
Dibromochloromethane
m,p-xylene
o-xylene
Bromoform
p-dichlorobenzene
p-bromofluorobenzene
0.02
0.02
0.04
0.04
0.06
0.3
0.002
0.004
0.01
0.03
0.06
0.03
*1
0.6
*1
0.006
0.01
0.1
*2
*2
0.09
0.3
Same as left
Same as left
Same as left
Same as left
Same as left
1.0
Same as left
Same as left
Same as left
Same as left
Same as left
Same as left
Same as left
Same as left
Same as left
Same as left
Same as left
Same as left
Same as left
Same as left
Same as left
Same as left
Same as left
Same as left
_
Same as left
_
1.0
Same as left
Same as left
Same as left
Same as left
_
_
Same as left
_
Same as left
Same as left
Same as left
_
_
_
_
_
0.2
0.2
_
0.4
_
3.0
0.02
0.04
0.1
0.3
_
_
*3
_
*3
0.06
0.1
_
_
_
_
_
ID Name Tap Water (mg/L)Environment Water
(mg/L)Soil (mg/L)
Wastewater,
Sewage,
Industrial waste
(mg/L)
*1: Total 0.002mg/L*2: Total 0.4mg/L*3: Total 0.02mg/L_: Not regulated
Chart 11 Names of measured target compounds together with standard values and indicator values
47
3.1 Analysis of Anions in Wastewater - Ion Chromatograph
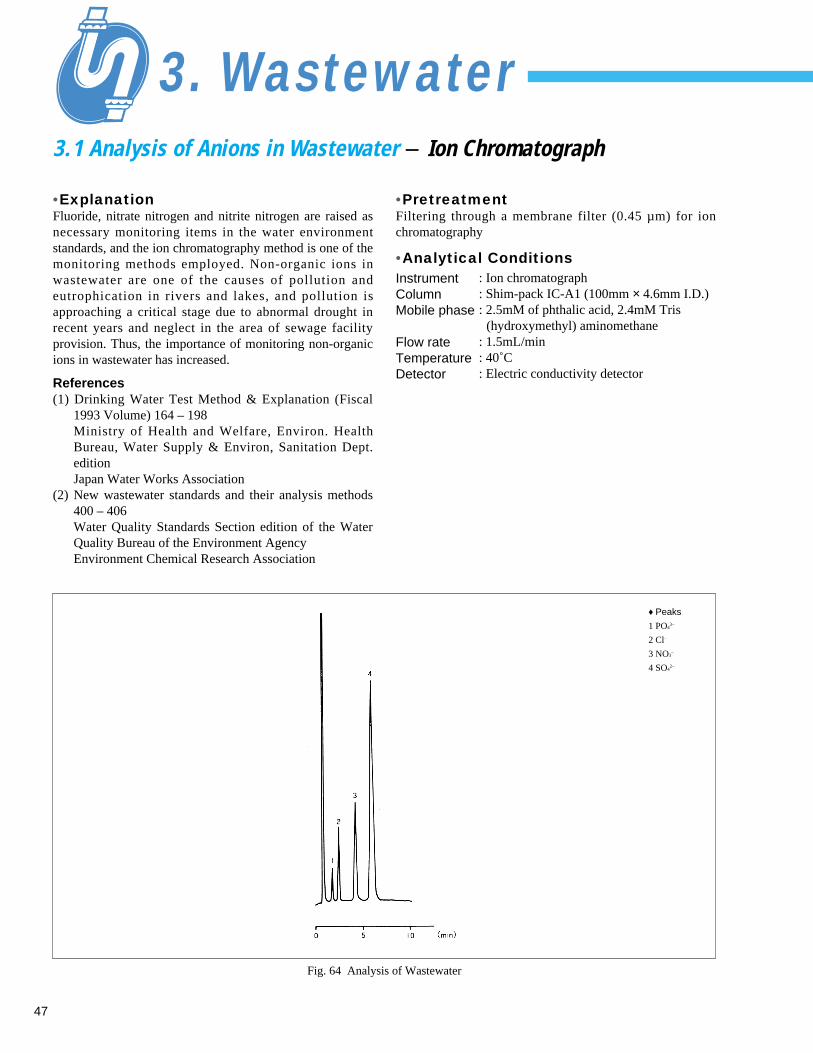
•ExplanationFluoride, nitrate nitrogen and nitrite nitrogen are raised asnecessary monitoring items in the water environmentstandards, and the ion chromatography method is one of themonitoring methods employed. Non-organic ions inwastewater are one of the causes of pollution andeutrophication in rivers and lakes, and pollution isapproaching a critical stage due to abnormal drought inrecent years and neglect in the area of sewage facilityprovision. Thus, the importance of monitoring non-organicions in wastewater has increased.
References(1) Drinking Water Test Method & Explanation (Fiscal
1993 Volume) 164 – 198Ministry of Health and Welfare, Environ. HealthBureau, Water Supply & Environ, Sanitation Dept.editionJapan Water Works Association
(2) New wastewater standards and their analysis methods400 – 406Water Quality Standards Section edition of the WaterQuality Bureau of the Environment AgencyEnvironment Chemical Research Association
•PretreatmentFiltering through a membrane filter (0.45 µm) for ionchromatography
•Analytical Conditions
Fig. 64 Analysis of Wastewater
♦ Peaks
1 PO43–
2 Cl–
3 NO3–
4 SO42–
3. Wastewater
InstrumentColumnMobile phase
Flow rateTemperatureDetector
: Ion chromatograph : Shim-pack IC-A1 (100mm × 4.6mm I.D.): 2.5mM of phthalic acid, 2.4mM Tris
(hydroxymethyl) aminomethane: 1.5mL/min: 40˚C: Electric conductivity detector

48
3.2 Analysis of Cations in Wastewater - Ion Chromatograph
•PretreatmentFiltering through a membrane filter (0.45 µm) for ionchromatography
•Analytical Conditions
Fig. 65 Analysis of wastewater
♦ Peaks
1 Na+
2 NH4+
3 K+
InstrumentColumnMobile phaseFlow rateTemperatureDetector
: Ion chromatograph : Shim-pack IC-C1 (100mm × 4.6mm I.D.): 5mM of nitric acid: 1.5mL /min: 40˚C: Electric conductivity detector

49
3.3 Analysis of Anions in Wastewater - PIA-1000
•ExplanationThis is an analysis example where the personal ion analyzerPIA-1000 was used to analyze anions contained inprocessed water at a sewage works.
•PretreatmentFiltering through a membrane filter (0.45 µm) for ionchromatography
Fig. 66 Analysis of wastewater (PIA-1000)
♦ Peaks
1 HCO3–(31.01mg/L)
2 PO43–(3.245mg/L)
3 F–(0.169mg/L)
4 Cl–(60.59mg/L)
5 NO3–(47.47mg/L)
6 SO42–(56.54mg/L)
Wastewater
•Analytical ConditionsInstrumentColumnMobile phase
Flow rateTemperature
: PIA-1000: Shim-pack IC-A3(S): PIA-1000 dedicated anion analysis mobile
phase, IC-MA3-1: 0.2mL/min: 35˚C

50
3.4 Analysis of Cations in Wastewater - PIA-1000
•ExplanationThis is an analysis example where the personal ion analyzerPIA-1000 was used to analyze cations contained inprocessed water at a sewage works.
•PretreatmentFiltering through a membrane filter (0.45 µm) for ionchromatography
Fig. 67 Analysis of wastewater (PIA-1000)
♦ Peaks
1 Na+(58.20mg/L)
2 NH4+(0.558mg/L)
3 K+(10.55mg/L)
4 Mg2+(5.814mg/L)
5 Ca2+(29.29mg/L)
•Analytical ConditionsInstrumentColumnMobile phase
Flow rateTemperature
: PIA-1000: Shim-pack IC-C3(S): PIA-1000 dedicated cation analysis
mobile phase, IC-MC3-1: 0.2mL/min: 35˚C

51
3.5 Analysis of Volatile Organic Compound (VOC) in Wastewater - GC
0.0
8.0
10
.0
12
.0
30
.0
32
.0
14
.0
2.0
4.0
6.0
8.0
10
.0
12
.0
14
.0
16
.0
18
.0
20
.0
22
.0
24
.0
26
.0
28
.0
30
.0
32
.0
1,1
-dic
hlo
roe
thy
len
e
1,1
Dic
hlo
roe
thy
len
e
Dic
hlo
rom
eth
an
e
Dic
hlo
rom
eth
an
e
Tra
ns
-1,
2 D
ich
loro
eth
yle
ne
Cis
-1,
2 D
ich
loro
eth
yle
ne
Ch
loro
form
1,
2-d
ich
loro
eth
an
e1
, 1
, 1
-tri
ch
loro
eth
an
e
Ca
rbo
n t
etr
ac
hlo
rid
e
Dib
rom
oc
hlo
rom
eth
an
e
Te
tra
ch
loro
eth
yle
ne
Bro
mo
form
p-D
ich
loro
be
nz
en
e
Tri
ch
loro
eth
yle
ne
*1
,2-d
ich
loro
bro
Bro
mo
dic
hlo
rom
eth
an
e
Cis
-1,
3 -
dic
hlo
rop
rop
en
e
Tra
na
-1,
3 -
dic
hlo
rop
rop
en
e
1,
1,
2-t
ric
hlo
roe
tha
ne
Fig. 68 Analysis example of VOC in environment water using head space GC-ECD (* signifies regulated item of wastewater standard)
Wastewater
•ExplanationIn 1993, the environment standard for environment waterwas greatly amended, and the wastewater standard itemsbecame 24 items. And among these, VOC occupies 11items. Environment water analysis is mostly conductedusing GC/MS, but GC can be used for analyzing just thosesamples that have small amounts of impurities in them.This data is an example of analysis for water with VOCcomponent using head space GC. This method can be usedto analyze 10 of the items in the items of the wastewaterstandard.Benzene needs to be analyzed using FID as itcannot be detected by ECD.
Quantifying Lower Limit Value (target): This greatlydiffers depending on the element.
•Analytical ConditionsInstrumentColumn
Column temperatureInjection inlet temperatureDetectorCarrier gasHead space heat-reserving conditionsHead space injection volume
: HSS-4A + GC-17AAE: DB-VRX 75m × 0.45mm
I.D., 2.55µm(df): 35˚C(5min)-180˚C(5˚C/min): 200˚C: ECD 210˚C: He 6.0mL/min: 50˚C, 60min: 0.2mL (inject total volume)
52
4.1 Analysis of Acidic Substances in Exhaust Gas - Ion Chromatograph
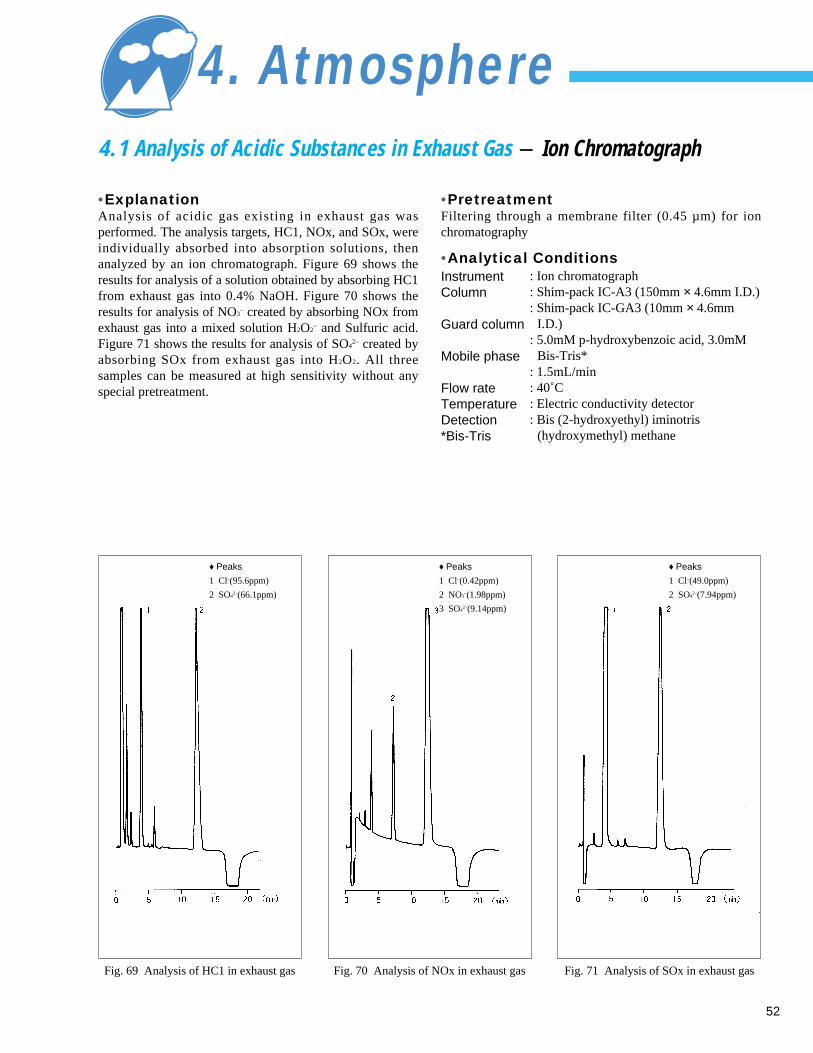
•ExplanationAnalysis of acidic gas existing in exhaust gas wasperformed. The analysis targets, HC1, NOx, and SOx, wereindividually absorbed into absorption solutions, thenanalyzed by an ion chromatograph. Figure 69 shows theresults for analysis of a solution obtained by absorbing HC1from exhaust gas into 0.4% NaOH. Figure 70 shows theresults for analysis of NO3
– created by absorbing NOx fromexhaust gas into a mixed solution H2O2
– and Sulfuric acid.Figure 71 shows the results for analysis of SO4
2– created byabsorbing SOx from exhaust gas into H2O2. All threesamples can be measured at high sensitivity without anyspecial pretreatment.
Fig. 69 Analysis of HC1 in exhaust gas Fig. 70 Analysis of NOx in exhaust gas Fig. 71 Analysis of SOx in exhaust gas
4. Atmosphere
•PretreatmentFiltering through a membrane filter (0.45 µm) for ionchromatography
•Analytical ConditionsInstrumentColumn
Guard column
Mobile phase
Flow rateTemperatureDetection*Bis-Tris
: Ion chromatograph: Shim-pack IC-A3 (150mm × 4.6mm I.D.): Shim-pack IC-GA3 (10mm × 4.6mm
I.D.): 5.0mM p-hydroxybenzoic acid, 3.0mM
Bis-Tris*: 1.5mL/min: 40˚C: Electric conductivity detector: Bis (2-hydroxyethyl) iminotris
(hydroxymethyl) methane
♦ Peaks
1 Cl–(95.6ppm)
2 SO42–(66.1ppm)
♦ Peaks
1 Cl–(0.42ppm)
2 NO3–(1.98ppm)
3 SO42–(9.14ppm)
♦ Peaks
1 Cl–(49.0ppm)
2 SO42–(7.94ppm)

53
4.2 Analysis of Exhaust Gas Absorption Solution - PIA-1000
•ExplanationAnalysis examples using the personal ion analyzer PIA-1000 are shown in figure 72 with absorption solution forexhaust gas of supply water boiler (vacuum flask method)and figure 73 with absorption solution for exhaust gas of agarbage and sewage plant (vacuum flask method). The PIA-1000 enables highly sensitive analysis.
•PretreatmentFiltering through a membrane filter (0.45 µm) for ionchromatography
•Analytical Conditions
Fig. 72 Analysis of supply water boiler exhaust gas absorption solution
♦ Peaks
1 Cl–(0.263mg/L)
2 NO3–(1.969mg/L)
3 SO42–(4.172mg/L)
Fig. 73 Analysis of garbage and sewage plant exhaust gas absorption solution
♦ Peaks
1 Cl(6.332mg/L)
2 NO3–(2.394mg/L)
3 SO42–(1.029mg/L)
InstrumentColumnMobile phaseFlow rateTemperature
: PIA-1000: Shim-pack IC-A3(S): PIA-1000 designated ion analysis mobile
phase, IC-MA3-1: 0.2mL/min: 35˚C
Atmosphere
54
4.3 Analysis of Tolylenediisocyanate (TDI) in Work Environment Monitoring (1) - HPLC
2,6-TDI
0
0
0.5
mAbs
2 4 (min)6 8
2,4-TDI
Reagent decomposition matter
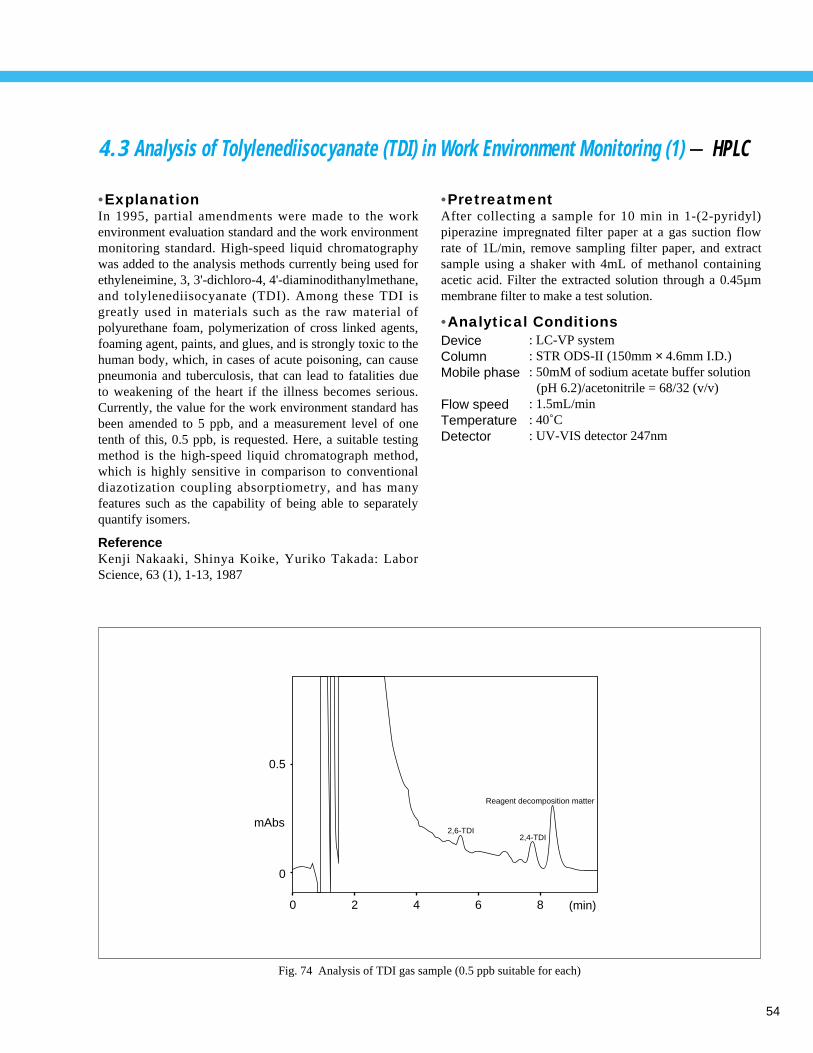
Fig. 74 Analysis of TDI gas sample (0.5 ppb suitable for each)
•ExplanationIn 1995, partial amendments were made to the workenvironment evaluation standard and the work environmentmonitoring standard. High-speed liquid chromatographywas added to the analysis methods currently being used forethyleneimine, 3, 3'-dichloro-4, 4'-diaminodithanylmethane,and tolylenediisocyanate (TDI). Among these TDI isgreatly used in materials such as the raw material ofpolyurethane foam, polymerization of cross linked agents,foaming agent, paints, and glues, and is strongly toxic to thehuman body, which, in cases of acute poisoning, can causepneumonia and tuberculosis, that can lead to fatalities dueto weakening of the heart if the illness becomes serious.Currently, the value for the work environment standard hasbeen amended to 5 ppb, and a measurement level of onetenth of this, 0.5 ppb, is requested. Here, a suitable testingmethod is the high-speed liquid chromatograph method,which is highly sensitive in comparison to conventionaldiazotization coupling absorptiometry, and has manyfeatures such as the capability of being able to separatelyquantify isomers.
ReferenceKenji Nakaaki, Shinya Koike, Yuriko Takada: LaborScience, 63 (1), 1-13, 1987
•PretreatmentAfter collecting a sample for 10 min in 1-(2-pyridyl)piperazine impregnated filter paper at a gas suction flowrate of 1L/min, remove sampling filter paper, and extractsample using a shaker with 4mL of methanol containingacetic acid. Filter the extracted solution through a 0.45µmmembrane filter to make a test solution.
•Analytical ConditionsDeviceColumnMobile phase
Flow speedTemperatureDetector
: LC-VP system: STR ODS-II (150mm × 4.6mm I.D.): 50mM of sodium acetate buffer solution
(pH 6.2)/acetonitrile = 68/32 (v/v): 1.5mL/min: 40˚C: UV-VIS detector 247nm

55
4.3 Analysis of Tolylenediisocyanate (TDI) in Work Environment Monitoring (2) - HPLC
Atmosphere
Reference Example 1 Sampling and Pretreatment Method
Sample 10L
Sampling
Collect sample for 10 min in 1-(2-pyridyl) piperazine
impregnated filter paper at a gas suction flow rate
of 1L/min.
Add 4mL of methanol (containing acetic acid of 0.05v/v%)
and shake for 30 min.
Extraction
Filtration
Use a 0.45 µm membrane filter.
HPLC 20 µL Injection
Nitrogen cylinder
Nitrogen cylinder Standard gas generator
Glass board for sampling
Solid-phase collecting
Humidity sensor
Exhaust
Trap
Humidification device
Sample provided by Japan Work Environment Monitoring Association.
Reference Example 2 Flow Diagram for TDI Generation Device

56
4.4 Analysis of Aldehyde/Ketonic products in Exhaust Gas - HPLC
•ExplanationThis shows an example of analysis performed onaldehyde/ketonic products found in vehicle exhaust gas.In cases where exhaust gas is set as the sample, andnegative-phase chromatography is used to separate anddetect absorbance, the type of impurities and the amountof content often lead to difficulties in analysis. Inparticular, impurity peaks are sometimes observed aspeak overlay and warping for formaldehyde peaks thatsolve out quickly. In such cases, these affects can beavoided by adding methanol to mobile phase A solution.
•PretreatmentConforming to JIS Law (K0303)Sample kindly lent by Traffic Safety and NuisanceResearch Institute of the Ministry of Transport.
Peaks: 1. Formaldehyde 2. Acetone 3. 2-Butanone
3.00.0 9.06.0 15.012.0 21.018.0 27.024.0
(min)
1
23
Fig. 75 Analysis of aldehyde/ketonic products in exhaust gas
•Analytical ConditionsDeviceColumnMobile phase
Flow rateTemperatureDetector
: LC-VP system: STR ODS-II (150mm × 6.0mm I.D.): A → B gradient elution method
A: Water/THF/methanol = 70/10/20 (v/v/v)
B: Water/acetonitrile, = 30/70 (v/v): 1.0mL/min: 45˚C: UV-VIS detector 365nm
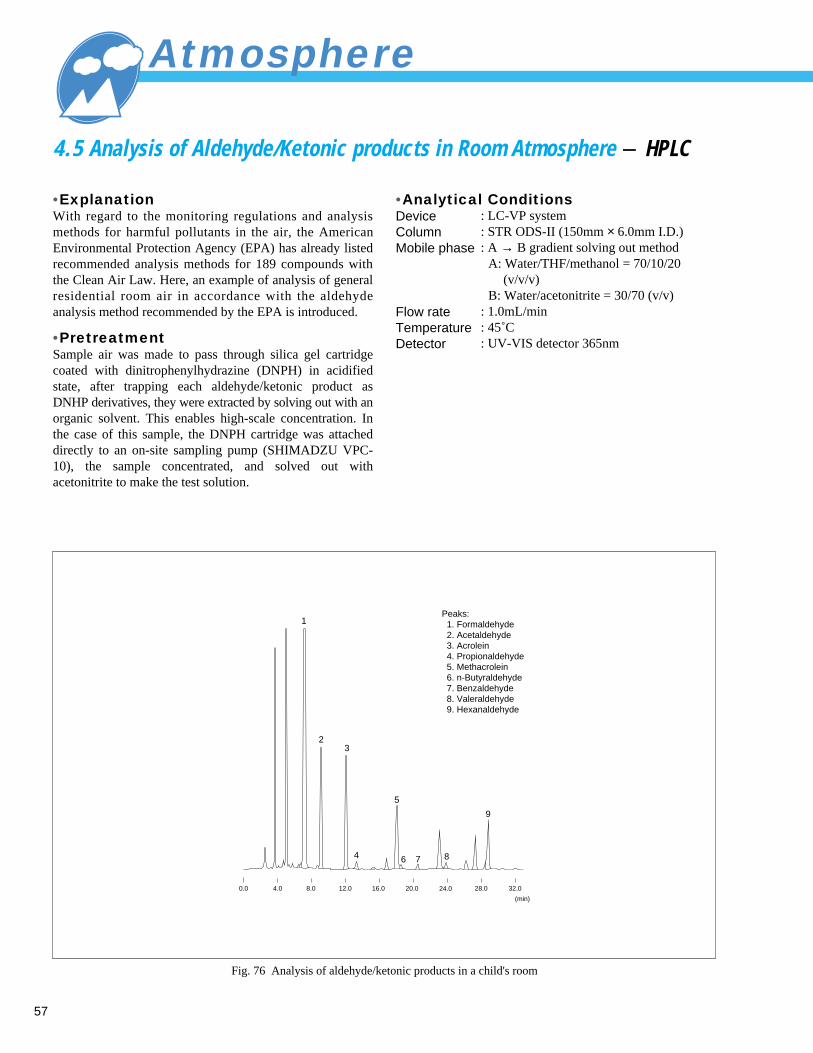
57
4.5 Analysis of Aldehyde/Ketonic products in Room Atmosphere - HPLC
Atmosphere
•ExplanationWith regard to the monitoring regulations and analysismethods for harmful pollutants in the air, the AmericanEnvironmental Protection Agency (EPA) has already listedrecommended analysis methods for 189 compounds withthe Clean Air Law. Here, an example of analysis of generalresidential room air in accordance with the aldehydeanalysis method recommended by the EPA is introduced.
•PretreatmentSample air was made to pass through silica gel cartridgecoated with dinitrophenylhydrazine (DNPH) in acidifiedstate, after trapping each aldehyde/ketonic product asDNHP derivatives, they were extracted by solving out with anorganic solvent. This enables high-scale concentration. Inthe case of this sample, the DNPH cartridge was attacheddirectly to an on-site sampling pump (SHIMADZU VPC-10), the sample concentrated, and solved out withacetonitrite to make the test solution.
•Analytical ConditionsDeviceColumnMobile phase
Flow rateTemperatureDetector
: LC-VP system: STR ODS-II (150mm × 6.0mm I.D.): A → B gradient solving out method
A: Water/THF/methanol = 70/10/20 (v/v/v)
B: Water/acetonitrite = 30/70 (v/v): 1.0mL/min: 45˚C: UV-VIS detector 365nm
Peaks: 1. Formaldehyde 2. Acetaldehyde 3. Acrolein 4. Propionaldehyde 5. Methacrolein 6. n-Butyraldehyde 7. Benzaldehyde 8. Valeraldehyde 9. Hexanaldehyde
(min)
0.0 4.0 8.0 12.0 16.0 20.0 24.0 28.0 32.0
1
32
4
5
6 7 8
9
Fig. 76 Analysis of aldehyde/ketonic products in a child's room

58
4.6 Analysis of Aldehyde Types in Atmosphere (1) - GC
•ExplanationThere are 13 kinds of harmful air pollutants (substances thatcan be harmful to human health if in imbibed on a regularbasis and cause actual air pollution), and this sectionintroduces the air-borne aldehyde type. Under the OffensiveOdor Control Law, factories are obligated to monitoraldehydes at their site perimeters.
ReferencesActual Monitoring of Harmful Air Pollutants 157 – 200(1997) Environment Agency, Air Quality Bureau, AirRegulation Section Edition
Quantitative Lower Limit Value (target quantitativelower limit value according to above referencematerial)Formaldehyde 0.8µg/µm3 (provisional value)Acetaldehyde 0.5µg/m3
DPA
(IS
)
Fo
rm
Ace
t
Ace
ton
eP
rop
ion
i-B
uty
lM
EK n
-Bu
tyl
i-V
aler
n-V
aler
MIB
K
0.0 2.0 4.0 6.0 8.0 10.0 12.0 14.0 16.0 18.0 (min)
Fig. 77 Analysis example of aldehyde DNPH types
DPA
(IS
)
Fo
rm
Ace
t
Ace
ton
eP
rop
ion
i-B
uty
l
ME
Kn
-Bu
tyl
i-V
aler
n-V
aler
MIB
K
0.0 2.0 4.0 6.0 8.0 10.0 12.0 14.0 16.0 18.0 (min)
Fig. 78 Analysis example of aldehyde types in the environment
This is an example of analysis of formaldehyde,acetaldehyde together with elements(propionaldehyde, butylaldehyde, andvaleraldehyde) targeted by the Offensive OdorControl Law, as well as ketonic substances thatreacts with DNPH. Diphenylamine (DPA) wasused as the internal standard substance (Fig. 77).
This shows an example of actual air collectedand analyzed (Fig. 78).
•PretreatmentAir-borne aldehyde is changed to a derivative (aldehydeDNPH) using 2, 4-dinitrophenylhydrazine whenconcentrated and collected, and is measured against anitrogen compound using a highly sensitive and selectiveFTD (thermal ionization detector).
•Analytical ConditionsDeviceColumn
Column temperatureInjector inlet temperature
Detector temperatureCarrier gasInjection method
: GC-17AAFwFt: DB-1 30m × 0.25mm I.D.,
0.25µm(df): 80˚C(2min)-20˚C/min-90˚C-
3˚C/min-230˚C: 250˚C: 280˚C(w-FTD): He 2.9mL/min: Splitless (1min)

59
4.6 Analysis of Aldehyde Types in Atmosphere (2) - GC
Reference Example 1 Pretreatment Method
•Sample Collection MethodTwo marketed cartridges impregnated with 2, 4-dinitrohydrazine are used in tandem. Pump flow rate is setto be about 0.1 L per minute, and collection is performedcontinuously for 24 hours. The used air volume is measuredwith a flowmeter. To prevent the breakup of aldehydeDNPH by air-borne ozone, an ozone scrubber cartridge isattached to the front of the collection cartridge system (Fig.79).
•Cartridge Solving Out MethodAldehydes react in the cartridges to form aldehyde-DNPHs,and are solved out using acetonitrile. DNPH is also solvedout at this time using a positive ion replacement resin as itcan interfere with analysis. As the solving out solventacetonitrile is sensitive to FTD, it is solved into ethylacetate to make a sample solution (Fig. 80).
Atmosphere
Main unitDetectorColumnAuto injectorData processing deviceSolid-phase extraction cartridge
: GC-17AAFwFt or GC-14BPFFt+SPL-14: FTD: DB-1 30m × 0.25mm I.D., 0.25µm(df): AOC-20i/s: CLASS-GC10 or Chromatopac C-R7A plus: 1 set
Fig. 79 Sample collection method Fig. 80 Solving out method from cartridge
Reference Example 2 Recommended Instrument Configuration

60
4.7 Analysis of Formaldehyde in Room Atmosphere - UV
•ExplanationFormaldehyde residue sometimes exists in wall materialsand flooring of homes, and this residue is dispersed as avapor in house air. Consequently, monitoring theconcentration of such formaldehyde has become animportant task. Here, experimental monitoring wasperformed in the rooms of a new house using a combinationof a solution collection method with water and anacetylacetone colorimetric method.
Reference MaterialJIS K0303 Monitoring of HCHO in exhaust gas
Quantitative lower Limit (target): several 10ppb
•Monitoring DeviceConcentrated collection deviceSpectrophotometer
: VPC-10: UV-1600 standard
glass cell
Heat for 30min in heating solution (40+2;)
Keep at room temperature for 30min
5mL of purifying water for creation of calibration curve
5mL of formaldehyde STD
5mL of test solution for concentration measuring
5mL of test solution
Sample BLMeasured sampleSTDReagent BL
Wavelength : 412.0Slit amplitude: 2.0
Multi-point calibration curveConc=K1 A+K0K1=3.762 k0=0.00526
Chi-Square : -0.00118Data points : 6
ID Concentration Absorbance1 0.08126 0.0201 0.08051 0.020Average : 0.08088 0.020 Room 1 results (in absorption solution)Standard deflection : 2 0.1452 0.0372 0.1459 0.037Average : 0.1456 0.037 Room 2 results (in absorption solution)Standard deflection :3 0.06170 0.0153 0.05793 0.014Average : 0.05981 0.014 Room 3 results (in absorption solution)Standard deflection :
Measurement results for formaldehyde in air
Room 1: 0.302ppm(20min)Room 2: 0.272ppm(40min)Room 3: 0.223ppm(20min)
Put 40mL volumes of absorption solution (distilled water) into absorption beakers 1 & 2.
Sampling (flow rate 1 L/min, collection time 20 or 40min)
Retrieve absorption solution, and measure up to 100mL with distilled water.
Add 5mL of acetylacetone reagent add 5mL of purified water
/mL
1.0001.100
0.000
0.500
1.000 2.000 3.000 4.500
Absorbance
Standard sample
—
Fig. 81 Measuring flowchart for formaldehyde in air
Fig. 82 Measuring example of formaldehyde in air
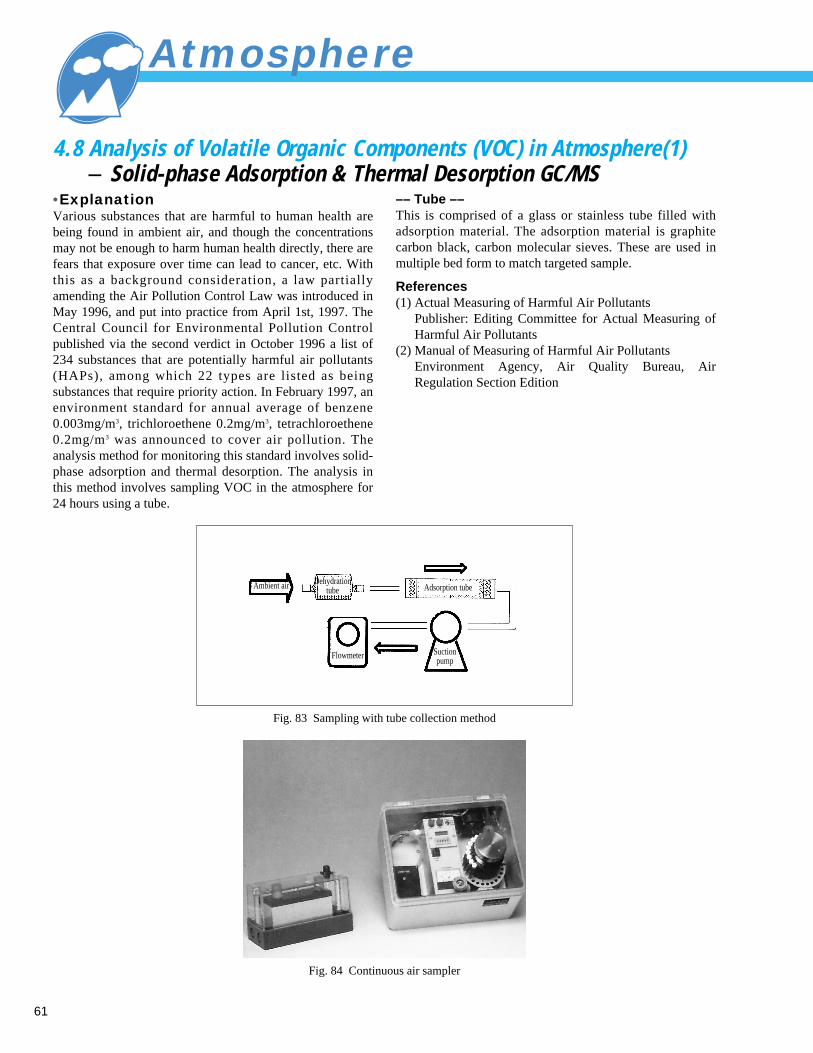
61
4.8 Analysis of Volatile Organic Components (VOC) in Atmosphere(1)- Solid-phase Adsorption & Thermal Desorption GC/MS
Atmosphere
•ExplanationVarious substances that are harmful to human health arebeing found in ambient air, and though the concentrationsmay not be enough to harm human health directly, there arefears that exposure over time can lead to cancer, etc. Withthis as a background consideration, a law partiallyamending the Air Pollution Control Law was introduced inMay 1996, and put into practice from April 1st, 1997. TheCentral Council for Environmental Pollution Controlpublished via the second verdict in October 1996 a list of234 substances that are potentially harmful air pollutants(HAPs), among which 22 types are listed as beingsubstances that require priority action. In February 1997, anenvironment standard for annual average of benzene0.003mg/m3, trichloroethene 0.2mg/m3, tetrachloroethene0.2mg/m3 was announced to cover air pollution. Theanalysis method for monitoring this standard involves solid-phase adsorption and thermal desorption. The analysis inthis method involves sampling VOC in the atmosphere for24 hours using a tube.
–– Tube ––This is comprised of a glass or stainless tube filled withadsorption material. The adsorption material is graphitecarbon black, carbon molecular sieves. These are used inmultiple bed form to match targeted sample.
References(1) Actual Measuring of Harmful Air Pollutants
Publisher: Editing Committee for Actual Measuring ofHarmful Air Pollutants
(2) Manual of Measuring of Harmful Air PollutantsEnvironment Agency, Air Quality Bureau, AirRegulation Section Edition
Fig. 83 Sampling with tube collection method
Fig. 84 Continuous air sampler
Dehydration tube
Flowmeter Suctionpump
Adsorption tubeAmbient air

62
4.8 Analysis of Volatile Organic Components (VOC) in Atmosphere (2) - Solid-phase Adsorption & Thermal Desorption GC/MS
•Analytical ConditionsThermal desorption ATD-400
Collection tube separationSeparation flow speedSecond trap separationOutlet split
: 280˚C(5miin): 50mL/min: 280˚C(2min): 8mL/min
Shimadzu GCMS-QP5050AColumn
Column temperature
Carrier gas
: DB-1 60m × 0.32mm I.D.,5µm(df)
: 40˚C(5min)-5˚C/min-150˚C -10˚C/min-250˚C(5min)
: He 100kPa
5 10 15 20 25 30 35 (min)
MIC 2000000
Freo
n 12
Eth
anol
Dich
loro
met
hane
n-H
exan
e
Chl
orof
orm
Ben
zene
Tolu
ene
Eth
yl b
enze
nem
, p-X
ylen
e
Sty
rene
6 8 10 12 14 16 18 20 22 24 26 (min)
2
13
4
5
6
7
8
9
TIC 127756ID
1
2
3
4
5
6
7
8
9
Name
Chloroethene
1,3-butadiene
Acrylonitrile
Dichloromethane
Chloroform
1,2-dichloroethane
Benzene
Trichloroethene
Tetrachloroethene
Fig. 85 ATD-400 system principle
Fig. 86 Analysis example (SIM method) of Nine HAPs elements (1ppm × 10mL)
Fig. 87 Measuring example (SCAN method) of lab air
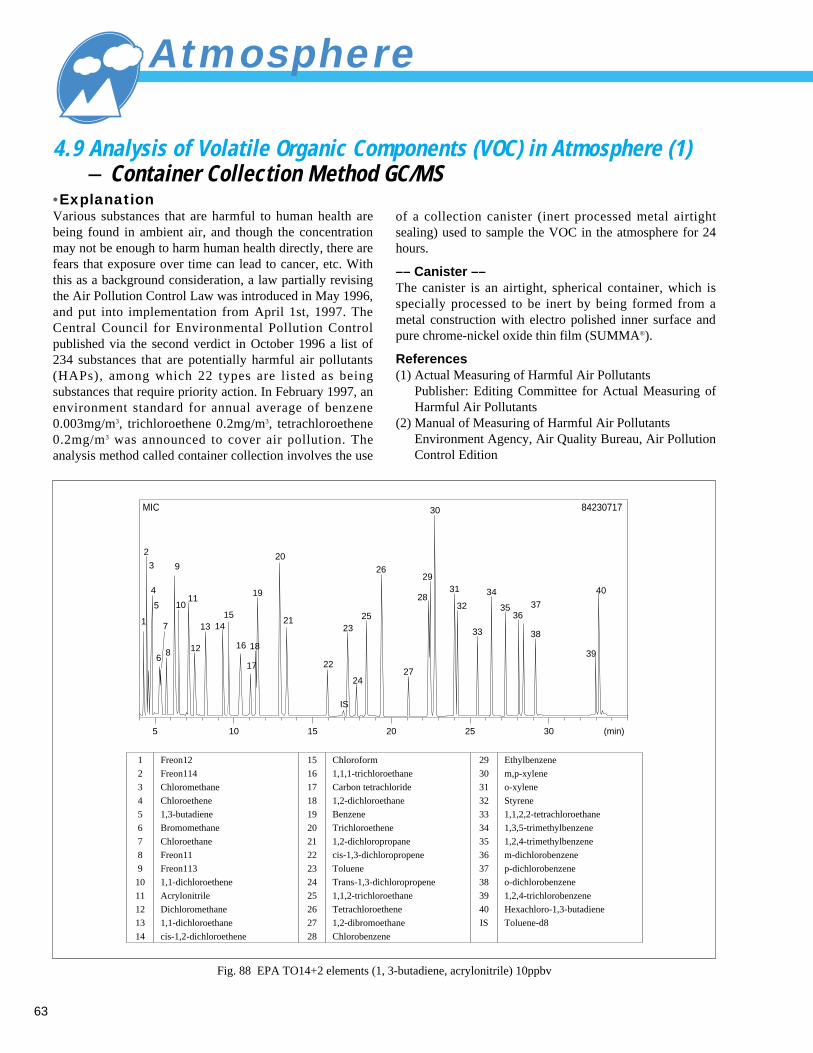
63
4.9 Analysis of Volatile Organic Components (VOC) in Atmosphere (1) - Container Collection Method GC/MS
•ExplanationVarious substances that are harmful to human health arebeing found in ambient air, and though the concentrationmay not be enough to harm human health directly, there arefears that exposure over time can lead to cancer, etc. Withthis as a background consideration, a law partially revisingthe Air Pollution Control Law was introduced in May 1996,and put into implementation from April 1st, 1997. TheCentral Council for Environmental Pollution Controlpublished via the second verdict in October 1996 a list of234 substances that are potentially harmful air pollutants(HAPs), among which 22 types are listed as beingsubstances that require priority action. In February 1997, anenvironment standard for annual average of benzene0.003mg/m3, trichloroethene 0.2mg/m3, tetrachloroethene0.2mg/m3 was announced to cover air pollution. Theanalysis method called container collection involves the use
5 10 15 20 25 30 (min)
1
2
3
4
5
6
7
8
9
1011
12
13 1415
16
17
18
19
20
21
22
IS
23
24
25
26
30
29
28
27
31
32
33
34
3536
37
38
39
40
MIC 84230717
Fig. 88 EPA TO14+2 elements (1, 3-butadiene, acrylonitrile) 10ppbv
Atmosphere
1
2
3
4
5
6
7
8
9
10
11
12
13
14
Freon12
Freon114
Chloromethane
Chloroethene
1,3-butadiene
Bromomethane
Chloroethane
Freon11
Freon113
1,1-dichloroethene
Acrylonitrile
Dichloromethane
1,1-dichloroethane
cis-1,2-dichloroethene
15
16
17
18
19
20
21
22
23
24
25
26
27
28
Chloroform
1,1,1-trichloroethane
Carbon tetrachloride
1,2-dichloroethane
Benzene
Trichloroethene
1,2-dichloropropane
cis-1,3-dichloropropene
Toluene
Trans-1,3-dichloropropene
1,1,2-trichloroethane
Tetrachloroethene
1,2-dibromoethane
Chlorobenzene
29
30
31
32
33
34
35
36
37
38
39
40
IS
Ethylbenzene
m,p-xylene
o-xylene
Styrene
1,1,2,2-tetrachloroethane
1,3,5-trimethylbenzene
1,2,4-trimethylbenzene
m-dichlorobenzene
p-dichlorobenzene
o-dichlorobenzene
1,2,4-trichlorobenzene
Hexachloro-1,3-butadiene
Toluene-d8
of a collection canister (inert processed metal airtightsealing) used to sample the VOC in the atmosphere for 24hours.
–– Canister ––The canister is an airtight, spherical container, which isspecially processed to be inert by being formed from ametal construction with electro polished inner surface andpure chrome-nickel oxide thin film (SUMMA®).
References(1) Actual Measuring of Harmful Air Pollutants
Publisher: Editing Committee for Actual Measuring ofHarmful Air Pollutants
(2) Manual of Measuring of Harmful Air PollutantsEnvironment Agency, Air Quality Bureau, Air PollutionControl Edition

64
4.9 Analysis of Volatile Organic Components (VOC) in Atmosphere (2)- Container Collection Method GC/MS
Standby
Sample pressure check
Trap baking
Sample ready
Trap cooling
Internal standard sample concentration
Sample concentration
Dry barge
Cryofocusing
Trap preparation heating
Trap desorption
Cryo trapAnalysis time wait
Trap, MCS baking
Sample pressure checkYes
None
Cryo inject
Trap, MCS baking
Standby
Next sample
Fig. 90 AUTOCanTM analysis flowchart
Reference Example 1
Ambient Air Collection Method using CanisterThe canister is cleaned before being used for sampling, andset to vacuum state ready for sampling. The following twomethods are used for long-period collection of ambient air.♦ Passive sampling method
The difference in pressure between the atmosphere andcanister are used, and the passive sampler adjusted to takesamples.
♦ Pressurization collection methodAmbient air is sent in by metal bellows pump, and thepassive sampler adjusted to take samples.
•Analytical ConditionsTekmar-Dohrmann AUTOCanTM
Concentration temperatureSample volumeDesorption temperatureDesorption timeCryofocus
: -100˚C: 400mL: 220˚C: 2min: -185˚C: 2min
Shimadzu GCMS-QP5050ACarrier gasColumn
Column temperature
: He 110kPa: AQUATIC 60m × 0.25mm I.D.,
1µm(df): 40˚C-3.5˚C/min-120˚C-6˚C/min
-180˚C-20˚C/min-220˚C(6min)
Control valve
Passive sampling methodFlow controller
Pressurizedcollection method
Fig. 89 Ambient air collection method using canister
6 8 10 12 14 16 18 20 22 (min)
1
2
3
4
5
68
7
IS
9
MIC 184363
Fig. 91 Nine HAPs elements (elements from the 22 priority substances that can be simultaneously analyzed) 0.1ppbv
ID12345678IS9
NAMEChloroethene1,3-ButadieneDichloromethaneAcryonitrileChloroform1,2-DichloroethaneBenzeneTrichloroetheneToluene-d8Tetrachloroethene
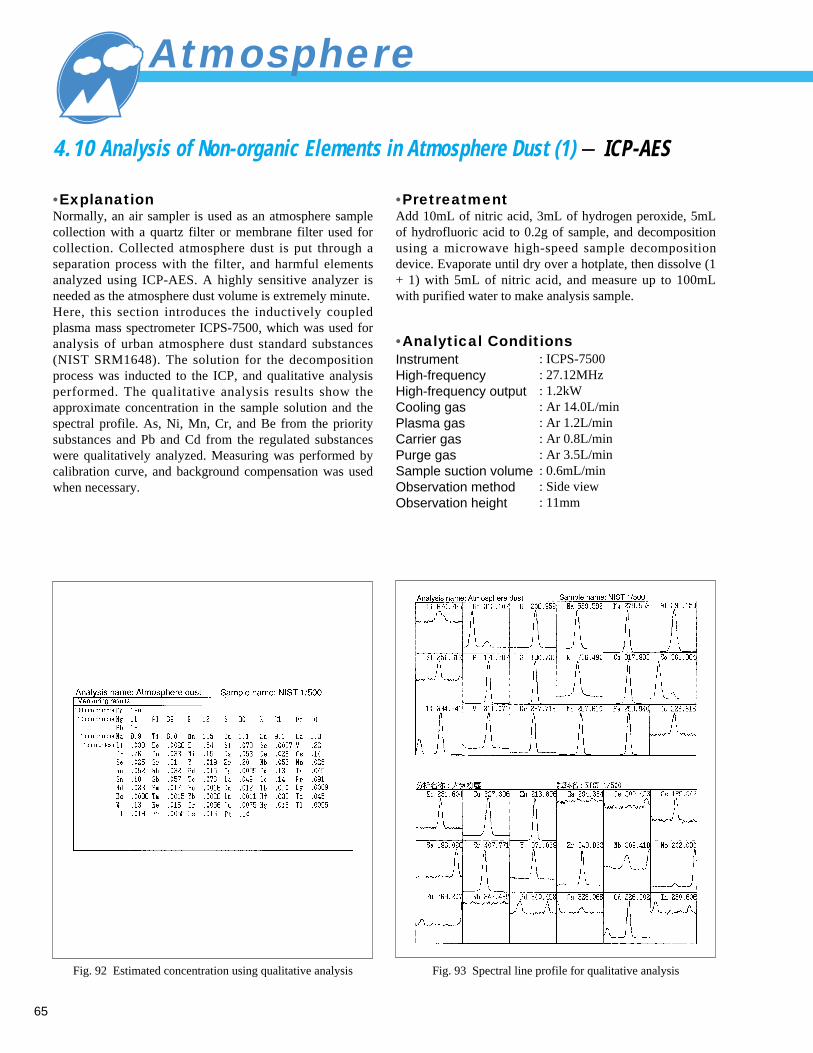
65
4.10 Analysis of Non-organic Elements in Atmosphere Dust (1) - ICP-AES
Fig. 92 Estimated concentration using qualitative analysis
Atmosphere
•PretreatmentAdd 10mL of nitric acid, 3mL of hydrogen peroxide, 5mLof hydrofluoric acid to 0.2g of sample, and decompositionusing a microwave high-speed sample decompositiondevice. Evaporate until dry over a hotplate, then dissolve (1+ 1) with 5mL of nitric acid, and measure up to 100mLwith purified water to make analysis sample.
•Analytical ConditionsInstrumentHigh-frequencyHigh-frequency outputCooling gasPlasma gasCarrier gasPurge gasSample suction volumeObservation methodObservation height
: ICPS-7500: 27.12MHz: 1.2kW: Ar 14.0L/min: Ar 1.2L/min: Ar 0.8L/min: Ar 3.5L/min: 0.6mL/min: Side view: 11mm
•ExplanationNormally, an air sampler is used as an atmosphere samplecollection with a quartz filter or membrane filter used forcollection. Collected atmosphere dust is put through aseparation process with the filter, and harmful elementsanalyzed using ICP-AES. A highly sensitive analyzer isneeded as the atmosphere dust volume is extremely minute. Here, this section introduces the inductively coupledplasma mass spectrometer ICPS-7500, which was used foranalysis of urban atmosphere dust standard substances(NIST SRM1648). The solution for the decompositionprocess was inducted to the ICP, and qualitative analysisperformed. The qualitative analysis results show theapproximate concentration in the sample solution and thespectral profile. As, Ni, Mn, Cr, and Be from the prioritysubstances and Pb and Cd from the regulated substanceswere qualitatively analyzed. Measuring was performed bycalibration curve, and background compensation was usedwhen necessary.
Fig. 93 Spectral line profile for qualitative analysis

66
4.10 Analysis of Non-organic Elements in Atmosphere Dust (2) - ICP-AES
Element
Ni
As
Be
Mn
Cr
Pb
Cd
Measuring Wavelength (nm)
231.604
189.042
313.107
257.610
267.716
220.351
226.502
Analytical Value (µg/g)
85.0
123
2.45
815
402
6500
77.0
Guaranteed Performance (µg/g)
82 3
115 10
(860)
403 12
6550 80
75 7
Parenthesis ( ) denote reference value.
+–
+–
+–
+–
+–
Fig. 94 Ni calibration curve Fig. 95 As calibration curve
Fig. 96 Ni Spectral line profile Fig. 97 As Spectral line profile Fig. 98 Pb Spectral line profile
Chart 12 Analysis results of atmosphere dust

67
5.1 Screening of Waste Plastic Material using Horizontal ATR (1) - FTIR
•ExplanationA wide range of plastic materials is used in automobiles,household appliances and different kinds of containers tothe extent that we have arrived at an era where recyclingshould become compulsory. The first important step inrecycling plastics is the task of screening for separationpurposes of the different types of plastics that have beencollected. Here, the requirements are (1) instantaneousdistinction, (2) measuring regardless of shape, and (3)measuring online. At the moment, the FTIR has troublefulfilling all three requirements, however this sectionintroduces a horizontal ATR method using diamond prismwith which the FTIR measures objects regardless of shapecomparatively well – especially solid objects.
•Device OutlineFigure 99 shows a diagram of the Instrument. On the topsection of the Instrument there is a stainless steel platesecured with a diamond prism implanted its central section.There are two types of plate available, one with a single-reflector (diameter of 1mm) prism and the other with amulti-reflector (diameter of 3mm) prism, and sampleholding by pressure adjustment can also be installed.Furthermore, on the left and right sides of the Instrumentthere are purge pipe fittings that can be fitted into thesample chamber wall, so that even if the sample chamberlid is open, measuring can still be performed without anyaffect on the atmosphere in the chamber.
•Measuring Conditions
Fig. 99 External view of instrument
5. Industrial Waste
DecompositionEstimationApodaizu function
: 8cm-1
: 100: Happ-Genzel: DLATGS

68
5.1 Screening of Waste Plastic Material using Horizontal ATR (2) - FTIR
•Measuring ExamplesFigures 100 to 103 show the spectral profiles of polystyrene(PS), polyethylene (PE), polyproplyene (PP), andacrylonitrile butadiene styrene resin. All of these figures
show results for plate-shaped samples, but the FTIR can beused to measure quite hard objects like pellets and powdersamples.
Fig. 100 PS spectra (1/cm)
0.2
ABS
PS
0.0
2500 1000 7004000
Fig. 101 PE spectra (1/cm)
PE
2500 1000 7004000
0.1
ABS
0.0
Fig. 102 PP spectra (1/cm)
PP
0.1
2500 1000 7004000
ABS
0.0
Fig. 103 ABS spectra (1/cm)
2500 1000 7004000
0.05
ABS
ABS
0.0

69
5.2 Analysis of Non-organic Elements in eluate of incineration ash (1) - ICP-AES
•ExplanationIndustrial waste is usually buried after being incinerated orcompacted. The amount of elution from this type of wasteis governed by law, with elements like Cd, Hg, Pb, Cr6+, As,Cu and Zn. Unlike tap water, wastewater and industrialwaste have high concentrations of coexisting elements,which makes analysis difficult. Here, the ICP spectrometryanalysis method can measure samples with minimal affectfrom coexisting elements at higher sensitivity with the aidof an ultrasound nebulizer.
References(1) Verification method for metals, etc., contained in
industrial waste(2) Japanese Industrial Standard (JIS) K0102
•PretreatmentUnder the conditions of the verification method for metals,etc., contained in industrial waste, an elution operation wasperformed. Next, 100mL of sample was taken from the testsolution, 5mL of nitric acid added, boiled over a hotplatefor approximately 10 minutes, cooled, measured up to100mL with purified water, and stirred sufficiently.
Element
Cd
Pb
Cr
As
Cu
Zn
Fe
Mn
Mo
Sb
Analytical Value (mg/L)
<0.0005
0.38
<0.0005
0.010
0.025
0.22
0.085
0.005
0.015
0.21
*
*
*
*
*
*: Use of ultrasonic nebulizer UAG-1
Chart 13 Incinerated ash analysis results (mg/L)
•Analtytical ConditionsDevice
High frequencyNebulizerHigh-frequency outputCooling gasPlasma gasCarrier gasPurge gasSample suction volumeObservation methodObservation height
: ICPS-7500: Ultrasonic nebulizer UAG-1: 27.12MHz: Coaxial type UAG-1: 1.2kW 0.8kW: Ar 14.0L/min 14.0L/min: Ar 1.2L/min 1.2L/min: Ar 1.0L/min 0.9L/min: Ar 3.5L/min 3.5L/min: 2.0mL/min 2.0mL/min: Side view Side view: 15mm 15mm
Industrial Waste
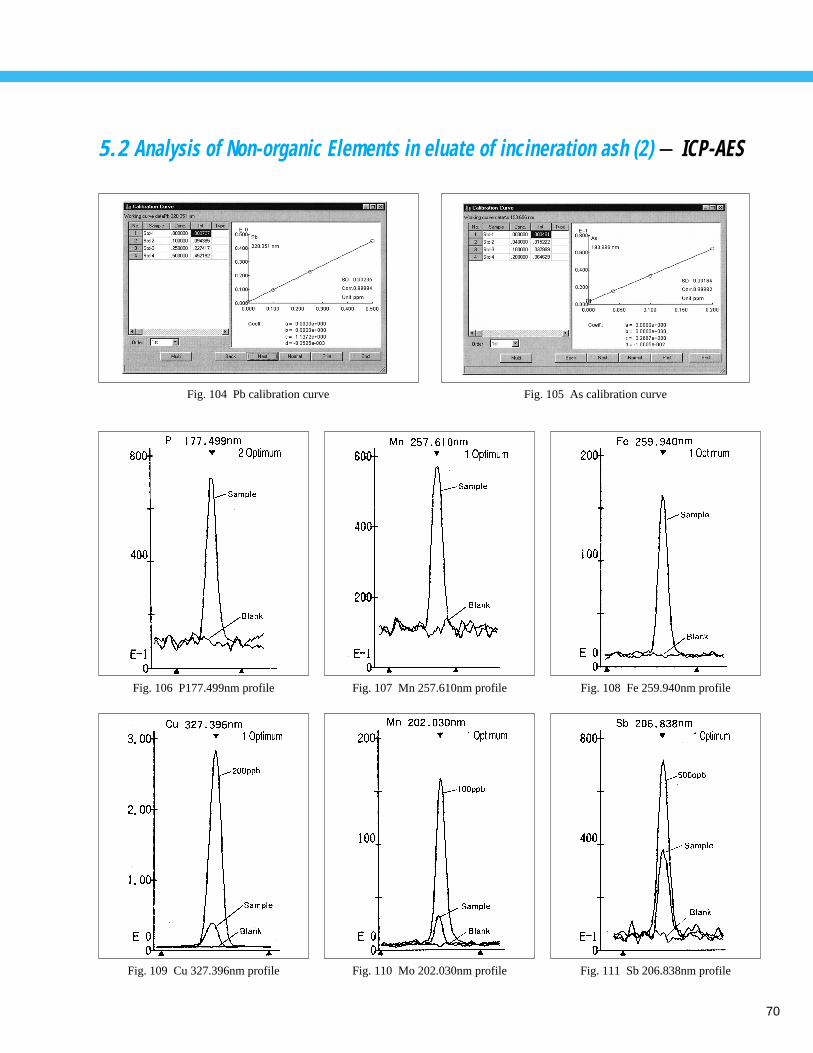
70
5.2 Analysis of Non-organic Elements in eluate of incineration ash (2) - ICP-AES
Fig. 104 Pb calibration curve Fig. 105 As calibration curve
Fig. 106 P177.499nm profile Fig. 107 Mn 257.610nm profile Fig. 108 Fe 259.940nm profile
Fig. 109 Cu 327.396nm profile Fig. 110 Mo 202.030nm profile Fig. 111 Sb 206.838nm profile

71
5.3 X-ray Fluorescence Spectrometric Analysis of Industrial Waste (Sludge) - XRF
Fig. 112 Qualitative analysis of sludge
Chart 14 Qualitative analysis value (%) of sludge
•ExplanationIndustrial wastes like sludge and mud have their elementsanalyzed so that they can be classified for burial,management or reuse. Easy, fast and thorough fluorescentx-raying is the optimum form of analysis for this work. Themeasuring method employed is qualitative and quantitativeanalysis. With this method, qualitative analysis isconducted, followed by quantitative analysis of the detectedelements or the intensity of that fluorescent x-ray with FPmethod. Standard samples are not necessary, so this methodis extremely useful when the types of analysis samples arenumerous and the marketed standard samples are few. Thefollowing figure and chart show qualitative and quantitativeanalysis results as analysis examples of industrial waste.
Quantitative Lower Limit Value (target)1 to 5ppm (this differs according to element)
•PretreatmentGrinding Conditions
InstrumentContainerTime
: Shaker mill T1-100: Tungsten carbide : 3min
DevicePressureTimeRing
: Briquet machine MP-35: 30t: 30 sec: Vinyl chloride
•Analtytical ConditionsDevice
X-ray tubeTube voltageTube ampereSpectrometer crystals
Scanning speed
: Sequential x-ray fluorescencespectrometer XRF-1700
: 4kW, Be thin window, Rh target: 40kV: 95mA: LiF, Ge, PET, TAP, SX-48, -58N,
-76, -14: 8 degree, 4 degree, 2 degree/min
Pressurized Design Conditions
CO2
60.73
N2O5
9.99
Na2O
0.17
MgO
0.85
Al2O3
6.97
SiO2
8.89
P2O5
5.72
SO3
2.12
Cl
0.064
K2O
0.31
CaO
2.81
TiO2
0.16
Cr2O3
0.012
MnO
0.038
Fe2O3
0.90
NiO
0.004
CuO
0.018
ZnO
0.055
Br
0.002
Rb2O
0.001
SrO
0.019
Y2O3
0.000
BaO
0.18
PbO
0.002
Industrial Waste

72
6.1 Analysis of Non-agitated Soil Core Sample using Microscopic FTIR (1) - FTIR
6. Others
•ExplanationTo understand the existing form and distribution status ofnon-organic compounds and organic compounds contained insoil, important information - such as knowledge of thefeatures attributable to the quality and formation of the soil inquestion - is needed. There are almost no examples of directsoil sampling using FTIR, but sampling of soil hardenedwith resin is possible. As a soil analysis method, the resinhardening method(1) is actively used to observe andanalyze micro structures and surface analysis, because soilsamples can be taken by core sampler and kept in a non-agitated state. Here, this section introduces a measuringexample of a sample prepared using this method.
Reference(1) Kenji Tamura, Sadao Nagatsuka, Hiroshi Ohba
Japan Soil Nutrient Society Magazine: 166-176 (1993)
•PretreatmentThe sample used consisted of the A layer of black soil takenfrom an eulalia plain, and the pretreatment consisted of themethod depicted in reference material (1), which was
performed in the following way. The sample provided bycore sampler was wind dried, then hardened byimpregnation of a polyester-based resin. The sample wasthen cut to a suitable size, the surface polished, and used formeasuring. The prepared sample was set on the stage of aninfrared microscope, and measured by mapping employing areflective method for 5×5 mm range with aperture size 200 µmsquare.
•ResultsFigures 113 and 114 show the silicic acid compound from thespectra obtained in the measuring results. Both figuresshow absorption peculiarities for silicic acid compound inthe vicinity of 1100 cm-1.
•Measuring Conditions
0.2
Abs
0.15
0.1
0.05
0.0
4000.0 2000.0 1000.0
Fig. 113 Non-organic compound spectrum (1)
ModeDecompositionEstimateApodaizu functionDetectorData processing device
: Reflection: 8cm-1
: 40: Happ-Genzel: MCT: Kramers-Kronig conv.
0.25
Abs
0.2
0.15
0.05
0.1
0.0
4000.0 2000.0 1000.0
Fig. 114 Non-organic compound spectrum (2)

73
6.1 Analysis of Non-agitated Soil Core Sample using Microscopic FTIR (2) - FTIR
If the peak is targeted, and a three-dimensional measuringsurface is created from vertical axis values for the peakheight in a range of 800 to 1250 cm-1, the diagram in figure
115 can be achieved. The protruding sections show thedistribution of silicic acid compound.
Value (compensated height) range: 800 – 1250 1/cm
Others
Fig. 115 Mapping diagram of soil core sample
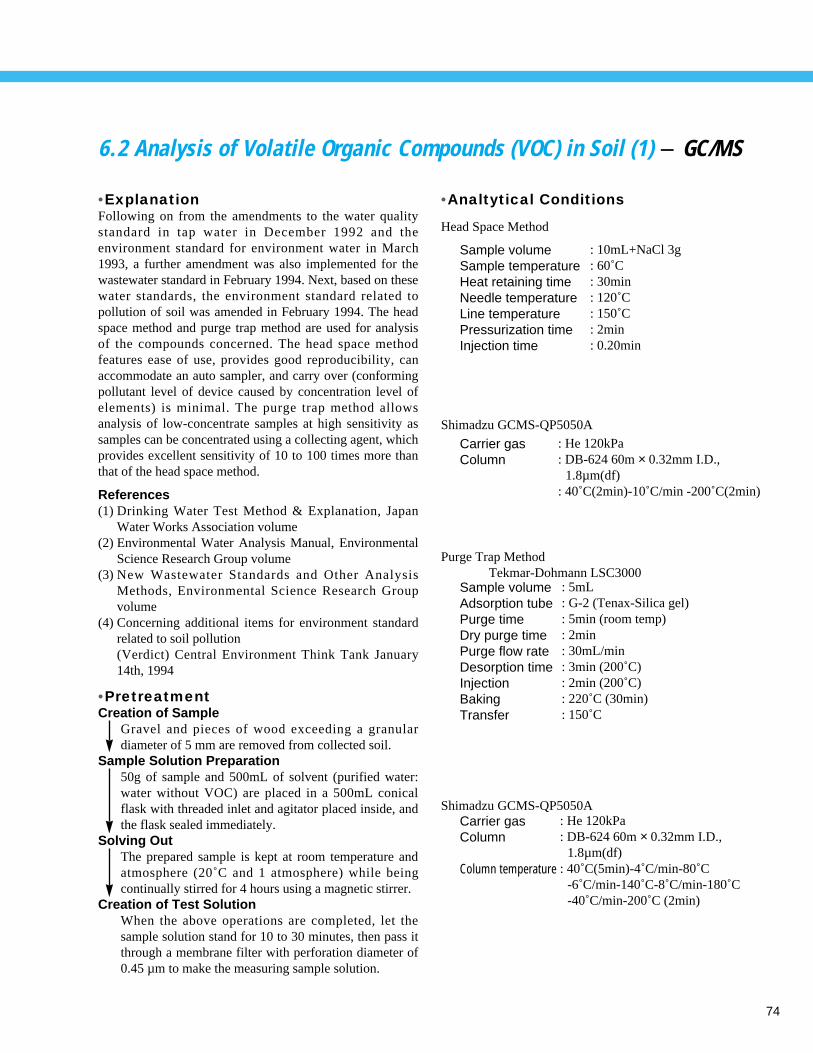
74
6.2 Analysis of Volatile Organic Compounds (VOC) in Soil (1) - GC/MS
•ExplanationFollowing on from the amendments to the water qualitystandard in tap water in December 1992 and theenvironment standard for environment water in March1993, a further amendment was also implemented for thewastewater standard in February 1994. Next, based on thesewater standards, the environment standard related topollution of soil was amended in February 1994. The headspace method and purge trap method are used for analysisof the compounds concerned. The head space methodfeatures ease of use, provides good reproducibility, canaccommodate an auto sampler, and carry over (conformingpollutant level of device caused by concentration level ofelements) is minimal. The purge trap method allowsanalysis of low-concentrate samples at high sensitivity assamples can be concentrated using a collecting agent, whichprovides excellent sensitivity of 10 to 100 times more thanthat of the head space method.
References(1) Drinking Water Test Method & Explanation, Japan
Water Works Association volume(2) Environmental Water Analysis Manual, Environmental
Science Research Group volume(3) New Wastewater Standards and Other Analysis
Methods, Environmental Science Research Groupvolume
(4) Concerning additional items for environment standardrelated to soil pollution(Verdict) Central Environment Think Tank January14th, 1994
•PretreatmentCreation of Sample
Gravel and pieces of wood exceeding a granulardiameter of 5 mm are removed from collected soil.
Sample Solution Preparation50g of sample and 500mL of solvent (purified water:water without VOC) are placed in a 500mL conicalflask with threaded inlet and agitator placed inside, andthe flask sealed immediately.
Solving OutThe prepared sample is kept at room temperature andatmosphere (20˚C and 1 atmosphere) while beingcontinually stirred for 4 hours using a magnetic stirrer.
Creation of Test SolutionWhen the above operations are completed, let thesample solution stand for 10 to 30 minutes, then pass itthrough a membrane filter with perforation diameter of0.45 µm to make the measuring sample solution.
•Analtytical Conditions
Head Space Method
Sample volumeSample temperatureHeat retaining timeNeedle temperatureLine temperaturePressurization timeInjection time
: 10mL+NaCl 3g: 60˚C: 30min: 120˚C: 150˚C: 2min: 0.20min
Shimadzu GCMS-QP5050A
Carrier gasColumn
: He 120kPa: DB-624 60m × 0.32mm I.D.,
1.8µm(df): 40˚C(2min)-10˚C/min -200˚C(2min)
Purge Trap MethodTekmar-Dohmann LSC3000
Sample volumeAdsorption tubePurge timeDry purge timePurge flow rateDesorption timeInjectionBakingTransfer
: 5mL: G-2 (Tenax-Silica gel): 5min (room temp): 2min: 30mL/min: 3min (200˚C): 2min (200˚C): 220˚C (30min): 150˚C
Shimadzu GCMS-QP5050ACarrier gasColumn
Column temperature
: He 120kPa: DB-624 60m × 0.32mm I.D.,
1.8µm(df): 40˚C(5min)-4˚C/min-80˚C
-6˚C/min-140˚C-8˚C/min-180˚C-40˚C/min-200˚C (2min)
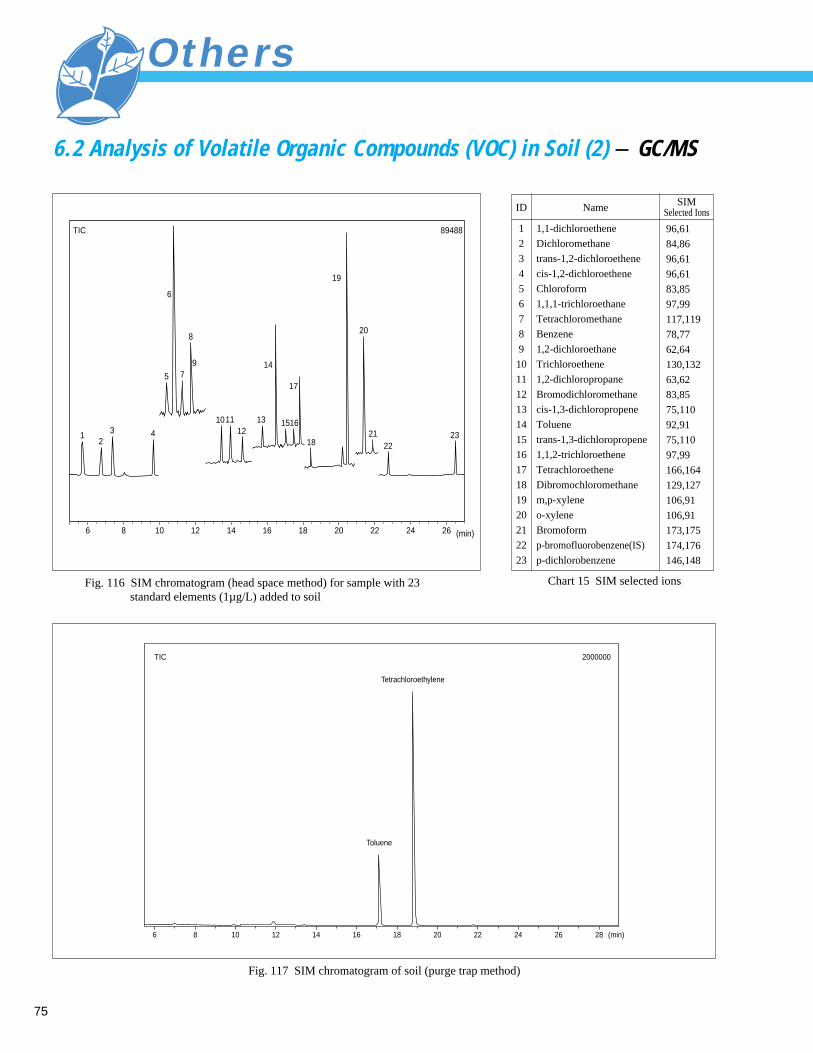
75
6.2 Analysis of Volatile Organic Compounds (VOC) in Soil (2) - GC/MS
Others
6 8 10 12 14 16 18 20 22 24 26
12
3 4
5
6
TIC 89488
7
8
9
101112
13
14
15
17
16
18
19
20
2122
23
(min)
Fig. 116 SIM chromatogram (head space method) for sample with 23standard elements (1µg/L) added to soil
TIC
Toluene
Tetrachloroethylene
2000000
6 8 10 12 14 16 18 20 22 24 26 28 (min)
Fig. 117 SIM chromatogram of soil (purge trap method)
1
2
3
4
5
6
7
8
9
10
11
12
13
14
15
16
17
18
19
20
21
22
23
ID
1,1-dichloroethene
Dichloromethane
trans-1,2-dichloroethene
cis-1,2-dichloroethene
Chloroform
1,1,1-trichloroethane
Tetrachloromethane
Benzene
1,2-dichloroethane
Trichloroethene
1,2-dichloropropane
Bromodichloromethane
cis-1,3-dichloropropene
Toluene
trans-1,3-dichloropropene
1,1,2-trichloroethene
Tetrachloroethene
Dibromochloromethane
m,p-xylene
o-xylene
Bromoform
p-bromofluorobenzene(IS)
p-dichlorobenzene
Name
96,61
84,86
96,61
96,61
83,85
97,99
117,119
78,77
62,64
130,132
63,62
83,85
75,110
92,91
75,110
97,99
166,164
129,127
106,91
106,91
173,175
174,176
146,148
SIMSelected Ions
Chart 15 SIM selected ions

SHIMADZU CORPORATION. International Marketing Division3. Kanda-Nishikicho 1-chome, Chiyoda-ku, Tokyo 101-8448, Japan Phone: 81(3)3219-5641 Fax. 81(3)3219-5710Cable Add.:SHIMADZU TOKYO
SHIMADZU SCIENTIFIC INSTRUMENTS, INC.7102 Riverwood Drive, Columbia, Maryland 21046, U.S.A.Phone: 1(410)381-1227 Fax. 1(410)381-1222 Toll Free: 1(800)477-1227
SHIMADZU DEUTSCHLAND GmbHAlbert-Hahn-Strasse 6-10, D-47269 Duisburg, F.R. Germany Phone: 49(203)7687-0 Fax. 49(203)766625
SHIMADZU (ASIA PACIFIC) PTE LTD.16 Science Park Drive #01-01 Singapore Science Park, Singapore 118227, Republic of SingaporePhone: 65-778 6280 Fax. 65-779 2935
SHIMADZU SCIENTIFIC INSTRUMENTS (OCEANIA) PTY. LTD.Rydalmere Business Park, Unit T, 10-16 South Street, Rydalmere N.S.W. 2116, AustraliaPhone: 61(2)9684-4200 Fax. 61(2)9684-4055
SHIMADZU DO BRASIL COMMERCIO LTDA.Rua Cenno Sbrighi, 25 CEP 05036-010 Agua Branca, Sao Paulo, BRAZILPhone: (55)11-861-1688 Fax. (55)11-861-2209
SHIMADZU (HONG KONG) LIMITEDSuite 1028 Ocean Center, Harbour City, Tsim Sha Tsui, Kowloon HONG KONGPhone: (852)2375-4979 Fax. (852)2199-7438
Overseas OfficesIstanbul, Beijing, Shanghai, Guangzhou, Shenyang, Chengdu, Moscow
URL http://www.shimadzu.comPrinted in Japan 3295-01002-10A-ADI
Copyright © 2022 FDOKUMEN