ENVIRONMENT WORKING PAPER No. 171 - OECD
70
Organisation for Economic Co-operation and Development ENV/WKP(2021)3 Unclassified English - Or. English 23 March 2021 ENVIRONMENT DIRECTORATE FINANCING WATER SECURITY FOR SUSTAINABLE GROWTH IN THE ASIA-PACIFIC REGION - ENVIRONMENT WORKING PAPER No. 171 By Hannah Leckie (1), Harry Smythe (1), Xavier Leflaive (1) (1) OECD Environment Directorate. OECD Working Papers should not be reported as representing the official views of the OECD or if its member countries. The opinions expressed and arguments employed are those of the authors. Authorised for publication by Rodolfo Lacy, Director, Environment Directorate. Keywords: water security, water supply, sanitation, wastewater, flood protection, irrigation, infrastructure finance, Asia, Pacific JEL Classification: H23, H41, H54, L95, L98, Q25, Q53, Q54, Q58. OECD Environment Working Papers are available at www.oecd.org/environment/workingpapers.htm JT03473347 OFDE This document, as well as any data and map included herein, are without prejudice to the status of or sovereignty over any territory, to the delimitation of international frontiers and boundaries and to the name of any territory, city or area.
-
Upload
khangminh22 -
Category
Documents
-
view
0 -
download
0
Transcript of ENVIRONMENT WORKING PAPER No. 171 - OECD

Organisation for Economic Co-operation and Development
ENV/WKP(2021)3
Unclassified English - Or. English
23 March 2021
ENVIRONMENT DIRECTORATE
FINANCING WATER SECURITY FOR SUSTAINABLE GROWTH IN THE ASIA-PACIFIC REGION - ENVIRONMENT WORKING PAPER No. 171
By Hannah Leckie (1), Harry Smythe (1), Xavier Leflaive (1)
(1) OECD Environment Directorate. OECD Working Papers should not be reported as representing the official views of the OECD or if its member countries. The opinions expressed and arguments employed are those of the authors. Authorised for publication by Rodolfo Lacy, Director, Environment Directorate. Keywords: water security, water supply, sanitation, wastewater, flood protection, irrigation, infrastructure finance, Asia, Pacific JEL Classification: H23, H41, H54, L95, L98, Q25, Q53, Q54, Q58.
OECD Environment Working Papers are available at www.oecd.org/environment/workingpapers.htm
JT03473347 OFDE
This document, as well as any data and map included herein, are without prejudice to the status of or sovereignty over any territory, to the
delimitation of international frontiers and boundaries and to the name of any territory, city or area.

2 ENV/WKP(2021)3
Unclassified
OECD ENVIRONMENT WORKING PAPERS OECD Working Papers should not be reported as representing the official views of the OECD or of its member countries. The opinions expressed and arguments employed are those of the author(s). Working Papers describe preliminary results or research in progress by the author(s) and are published to stimulate discussion on a broad range of issues on which the OECD works. This series is designed to make available to a wider readership selected studies on environmental issues prepared for use within the OECD. Authorship is usually collective, but principal author(s) are named. The papers are generally available only in their original language –English or French- with a summary in the other language.
Comments on Working Papers are welcomed, and may be sent to:
OECD Environment Directorate
2 rue André-Pascal, 75775 Paris Cedex 16, France
or by e-mail: [email protected] ------------------------------------------------------------------------------------------
OECD Environment Working Papers are published on
www.oecd.org/environment/workingpapers.htm ------------------------------------------------------------------------------------------
This document and any map included herein are without prejudice to the status of or sovereignty over any territory, to the delimitation of international frontiers and boundaries and to the name of any territory, city or area. The statistical data for Israel are supplied by and under the responsibility of the relevant Israeli authorities. The use of such data by the OECD is without prejudice to the status of the Golan Heights, East Jerusalem and Israeli settlements in the West Bank under the terms of international law. © OECD (2021) You can copy, download or print OECD content for your own use, and you can include excerpts from OECD publications, databases and multimedia products in your own documents, presentations, blogs, websites and teaching materials, provided that suitable acknowledgment of OECD as source and copyright owner is given.
All requests for commercial use and translation rights should be submitted to [email protected] .

ENV/WKP(2021)3 3
Unclassified
Abstract
The Asia Water Development Outlook – a flagship publication by the Asian Development Bank - monitors
progress in water security in the Asia Pacific region. For the first time, the 2020 edition documents financing
flows that contribute to – or that are needed to enhance – water security in the region.
Working in close collaboration with the Asian Development Bank and partners, the OECD endeavoured to
characterise funding needs and financing flows for water security in the region. The approach and
methodology derive from a similar endeavour covering the European region, but were adjusted to reflect
the distinctive features of the region, in terms of the state of play, policy, and data availability.
This paper compiles available data and analyses, and derives policy messages, for countries in the region
and their partners (including development finance institutions). It characterises an enabling environment
that can facilitate and expedite financing for water security commensurate with the challenges and
distinctive opportunities in the region.
Keywords: water security, water supply, sanitation, wastewater, flood protection, irrigation, infrastructure
finance, Asia, Pacific
JEL Classification: H23, H41, H54, L95, L98, Q25, Q53, Q54, Q58
Résumé
Le rapport Perspectives pour le développement de l’eau en Asie - une publication phare de la Banque
Asiatique de Développement - mesure les progrès réalisés dans la région Asie Pacifique dans le domaine
de la gestion des risques liés à l’eau. Pour la première fois, l’édition de 2020 rend compte des flux financiers
qui contribuent à – ou qui sont nécessaires pour – la gestion de ces risques.
Travaillant en étroite collaboration avec la Banque Asiatique de Développement et ses partenaires, l’OCDE
a essayé de caractériser les flux et les besoins de financement pour la gestion des risques liés à l’eau
dans la région. La méthode s’inspire d’une initiative similaire mise en œuvre en Europe, qui a été adaptée
pour tenir compte des caractéristiques de la région Asie Pacifique relatives à l’état des lieux, aux politiques
publiques et aux données disponibles.
Ce document présente les données, les analyses et les recommandations en matière de politiques
publiques, destinées aux gouvernements des pays de la région et à leurs partenaires (notamment les
institutions d’aide publique au développement). Il esquisse les éléments d’un environnement politique et
institutionnel qui peut encourager et accélérer les financements dans le domaine de l’eau, à la mesure des
défis et des opportunités qui existent dans la région.
Mots clé : risques liés à l’eau, approvisionnement en eau, eaux usées, collecte et traitement, protection contre les inondations, irrigation, financement des infrastructures, Asie, Pacifique
Classification JEL : H23, H41, H54, L95, L98, Q25, Q53, Q54, Q58

4 ENV/WKP(2021)3
Unclassified
Acknowledgements
The paper was drafted by Hannah Leckie (policy analyst) and Harry Smythe (data and research analyst),
under the supervision of Xavier Leflaive (Team leader, Resilience – Adaptation – Water), OECD
Environment Directorate, Climate, Biodiversity and Water Division. Earlier drafts benefitted from
contributions and comments from Kathleen Dominique and Stephanie Lyons (policy analysts, OECD
Environment Directorate). Policy messages benefitted from discussions at the regional meeting of the
Roundtable on Financing Water, co-convened by the Asian Development Bank (ADB) in November 2019
(more information is available at here). Ines Reale managed the process seamlessly.
The authors are most grateful to the ADB for invaluable support throughout the process, most notably
Silvia Cardascia, Coral P. Fernandez Illescas, and Pia Corrina Romero Reyes. Thomas Panella, Chief of
Water Sector Group, ADB, has been a most supportive and patient partner from the outset. Other ADB
colleagues provided valuable comments on method, data and policy messages at dedicated technical
workshops. Eelco van Beek facilitated coordination and alignment with the various dimensions of the Asia
Water Development Outlook.
The OECD is grateful to the ADB for its financial support, which made these analyses possible. The OECD
is also grateful to the Ministry of Environment of Korea, for financial support of related research.

ENV/WKP(2021)3 5
Unclassified
Table of contents
Abstract 3
Acknowledgements 4
Executive summary 7
1 Introduction 10
1.1. Background 10
1.2. Scope 10
2 Investment needs 12
2.1. Water supply and sanitation 12
2.2. Flood protection 15
2.3. Irrigation 19
2.4. Emerging issues 21
3 Financing capacities to reach investment needs 24
3.1. Public taxes are the main source of finance for water-related infrastructure 25
3.2. Official development assistance remains a low share of investment in water infrastructure
and may not be targeting those countries who need it most 29
3.3. Water supply and sanitation tariffs are under-utilised, although affordability acts as a barrier 30
4 Policy recommendations to bridge the investment gap 34
4.1. Make the best use of available assets and financial resources 35
4.2. Minimise future investment needs 40
4.3. Harness additional sources of finance 50
5 Concluding remarks 59
References 60
Annex A. Methodological note: Estimating water-related investment needs and financing capacities in the Asia-Pacific 64
Context 64
Method 64
References (methodology only) 69
Annex B. Annual ODA for water-related infrastructure in Asia-Pacific countries 70

6 ENV/WKP(2021)3
Unclassified
Tables
Table 2.1. Comparison of total expenditure needs in WSS infrastructure in the Asia-Pacific region 13 Table 2.2. Average Annual investment in irrigation and additional investments - developing countries, 2015-30 20 Table 3.1. Top ten countries for annual investments costs in water infrastructure in the Asia-Pacific region 24 Table 3.2. Sovereign credit ratings for Asia-Pacific countries 27 Table 4.1. Hybrid water security strategies: combining NbS with grey infrastructure 49 Table A A.1. Summary of data sources: Investment needs 65 Table A A.2. Summary of data sources: Financing capacity 67 Table A A.3. Count of Cities in the GWI Survey 68 Table A B.1. Annual ODA for water-related infrastructure in Asia-Pacific countries 70
Figures
Figure 2.1. Projected annual expenditure needs for WSS 2015-30 13 Figure 2.2. Comparative expenditure gap of water supply and sanitation infrastructure required by 2030 to
achieve SDGs 6.1 and 6.2 14 Figure 2.3. Projected share of the population exposed to flood risk, 2030 16 Figure 2.4. Increase in population exposed to flood risk: 2010-2030 (millions) 17 Figure 2.5. Projected flood risk exposure to GDP, 2030 18 Figure 2.6. Projected flood risk exposure to GDP, 2030 19 Figure 2.7. Annual irrigation investment needs 2015-2030 21 Figure 3.1. Potential sources of funding and financing for water-related investments 25 Figure 3.2. Public and private expenditure for water supply and sanitation, select economies, select years 26 Figure 3.3. Annual WASH expenditure by funding type, select economies 28 Figure 3.4. Annual WASH expenditure by subsector, select economies 28 Figure 3.5. Financing sources for water management, Viet Nam 29 Figure 3.6. Annual ODA for water-related infrastructure in Asia-Pacific countries 30 Figure 3.7. Percentage of countries reporting >80% cost recovery of O&M costs from water supply and
sanitation tariffs 31 Figure 3.8. Average city water supply and sanitation tariffs as a share of annual disposable middle-quintile
household income 32 Figure 3.9. Average city water supply and sanitation tariffs as a share of household income of the middle
quintile 33 Figure 4.1. Non-revenue water in select Asia-Pacific countries 37 Figure 4.2. One-in-100-year flood exposure in Asian mega-cities: 2005 and 2050 46 Figure 4.3. Blended finance instruments and mechanisms 54
Boxes
Box 2.1. Prioritisation of pharmaceuticals via suspect and non-target screening, Korea 22 Box 3.1. Water management investment profile: Viet Nam 29 Box 4.1. Reforming the Dhaka Water Supply and Sewerage Authority 38 Box 4.2. Strategies to reverse groundwater depletion: examples from India and Japan 45 Box 4.3. The case for boosting investments in nature-based solutions 49 Box 4.4. Cost-Recovery Policy Catalyses Utility Turnaround in Viet Nam 51 Box 4.5. Land value capture: a suite of tools to finance water-related investments. Experience from
Casablanca, Morocco 53 Box 4.6. Blended finance, defined 54 Box 4.7. Blended Finance to Reduce Rural Sanitation Costs in Bangladesh 55 Box 4.8. Green bonds: financing nature-based solutions for flood protection in the Netherlands 56 Box 4.9. The ADB Green Finance Catalyzing Facility 57
ENV/WKP(2021)3 7
Unclassified
Executive summary
The Asia Water Development Outlook, spearheaded by the Asian Development Bank, monitors progress
in - and issues affecting - water security in Asia. Its recurrent publication helps increasingly to fine-tune
assessments and develop monitoring capacity. For the first time, the 2020 edition attempts to document
financing flows that contribute to – or that are needed to enhance – water security in the Asia Pacific region.
Working in close collaboration with the Asian Development Bank and experts involved in drafting the Asia
Water Development Outlook, the OECD endeavoured to characterise funding needs and financing flows
for water security in the region. The approach and methodology derive from a similar endeavour covering
the European region, but were adjusted to reflect the distinctive features of the region, in terms of the state
of play, policy, and data availability. This paper compiles available data, information and analyses, and
derives policy messages, for countries in the region and their partners.
Consistency with other Key Dimensions of the Asia Water Development Outlook has been checked, and
no major discrepancy was identified. However, full consistency was difficult to assess, as coverage and
definitions can differ, essentially driven by (lack of) data availability.
Two difficulties that relate to policy and data
Tracking and projecting financing flows for water security in Asia is compounded by two difficulties.
First, countries in the region lack a common ambition for water security or water management more
generally. The SDGs – in particular SDG 6 – set a 2030 horizon for action at national level. However, they
remain generic, and do not contribute to coordination of national responses to water-related risks. In
comparison, European countries benefit from common objectives, tailored to the situation in the region,
captured by a set of regulations and supported by cooperation at regional level. While such a level of
coordination may be challenging in the vast and diverse Asia Pacific region, further coordination could be
considered through the thematic regional platforms in place (the Asia Pacific Water Forum, the Asia Water
Council) or regional political fora (e.g. APEC, already active on related issues, such as food security); sub-
regional coordination also seems most appropriate.
Second, data on water-related financing flows and needs is essentially lacking. Of particular significance,
financing flows for agricultural water (irrigation extension and efficiency) are not documented. Additional
coordinated efforts to monitor financing flows at (sub-)regional level would provide invaluable support to
policy making and to the design of financial mechanism that are up to the challenge and tailored to regional
and country needs. Regional financial institutions have a role to play, at least to compile information on the
projects and financing mechanisms they contribute to.
With these caveats, the paper delivers data and analyses that countries and partners can build upon to
finance water security in Asia and the Pacific. It should be read in combination with other Key Dimensions
of the Asia Water Development Outlook (in particular KD2), which confirm that the economic case for
investment in water security is solid and well documented in the region.

8 ENV/WKP(2021)3
Unclassified
Known and unknown drivers for financing needs for water security in Asia
Many drivers of water-related expenditures are well known. These include: demographics and urbanisation
(1 billion additional city dwellers will need to be connected to water services in the next 30 years); operation,
maintenance and renewal of (expanding) assets; compliance with international commitments and national
regulations; people, assets and GDP exposed to flood risks (30 million more people will be exposed to
flood risks between 2010 and 2030); food security and global markets for agriculture (the area under
irrigation in Asia is projected to expand by 22% between 2010 and 2050; by 30% in South Asia); and
adaptation to a changing climate (which generates uncertainty on future water demand and availability).
In addition, the region is facing a number of emerging issues, which will drive expenditure needs further.
These include: the improvement of individual and other appropriate sanitation systems (IAS), which should
deliver water policy objectives; the need to address problems associated with combined water drainage
and sewerage systems and risks of overflows (CSOs); urbanisation, the extension of impervious surfaces
and changes in precipitation patterns; contaminants of emerging concern (CECs); and sludge
management, as more wastewater is collected and treated.
What we know about financing needs and capacities for water security in Asia
Projections indicate that most countries in the region will need to allocate between 1 and 2% of GDP on
water supply and sanitation infrastructure over the period 2015-2030. Irrigation investment needs could
vary between 0.05 to 0.25% of annual GDP between 2015 and 2030, depending on scenarios and the sub-
regions.
In the few countries where data is available, governments - and in places international donors - are the
main sources of funding for water supply and sanitation. Households only contribute significantly in a few
countries in Central Asia (Azerbaijan, Kyrgyz Republic), South Asia (Bangladesh, Nepal, Pakistan) and
some small states (Solomon Islands). This reflects either an effort to cover costs through revenue from
water bills (in Bangladesh) or the paucity of public budgets allocated to water supply and sanitation (WSS).
Affordability of water bills is an issue in several countries, including in urban environments. Based on
(sparse) available data, Bangladesh, Indonesia, Mongolia, Myanmar, the Philippines, or Viet Nam face
high affordability constraints, with annual tariffs in select cities representing more than 10% of the annual
income of the middle quintile household. Conversely, there may be room for manoeuvre to increase water
supply and sanitation tariffs in a number of countries, such as Armenia, Bhutan, Kazakhstan, Malaysia or
Tajikistan.
Policy options to bridge financing gap for water security in Asia
The magnitude of capital investment needs and operating and maintenance costs for WSS services, flood
protection and irrigation infrastructure calls for a shift in the way the sector is currently operated, regulated
and financed. Countries in the region would benefit from more systematically exploring a combination of
policy options, tailored to national and local circumstances.
First, there is room to make better use of existing assets. Improving the operational efficiency and
effectiveness of existing infrastructure and service providers contributes to better services for the
population, the economy and the environment. This can enhance the willingness to pay of beneficiaries
and postpone the need for additional investments to rebuild decaying assets. Operational efficiency can
take different forms. In the case of water supply and sanitation, it may combine appropriate – potentially
non-conventional - technical choices, agglomerating utilities at the right scale, or considering other
appropriate sanitation systems (IAS) in the context of national strategies for water supply and sanitation

ENV/WKP(2021)3 9
Unclassified
services. Economic regulation has a central role to play, in monitoring and incentivising operational
efficiency.
Second, the efficiency of public expenditure programmes is a major driver of financing needs and
capacities, now and in the future. Planning is critical. Robust planning can increase the coherence of water
development with changes in related sectors (most importantly urban development; land use and forestry;
agriculture expansion and modernisation). It builds on robust projections for demographics and
urbanisation; food security and diets; climate change. It considers optimal sequencing of individual projects
along investment pathways, preferably at basin, landscape or catchment levels, to exploit synergies across
projects.
Plans that drive decisions should be backed by realistic financing strategies. And financing strategies can
benefit from output-based budgeting, or performance-based contracts, to promote investments that
contribute to policy objectives. (Regional) international financing institutions and public institutions can
promote such mechanisms.
Prevention of (or at a minimal planning and mitigating) future liabilities can significantly minimise future
financing needs. For instance, managing water demand and strengthening water allocation regimes can
go a long way in mitigating scarcity risks, postponing the need to augment water supply through costly
investments. Similarly, flood risk mapping and land-use planning can be cost-effective ways to reduce
exposure to flooding. Nature-based solutions can be more systematically explored in the region, as they
may be able to adjust to shifting circumstances and generate multiple co-benefits.
Third, the capacity to harness private sources of finance is essential, an area where few emerging
economies and developing countries in the region have experience. Private investment is concentrated in
only a few of Asia’s lower-risk economies (China, India, Malaysia, the Philippines), as a result of efforts to
encourage private investment in infrastructures and financiers’ appetite to invest in more established
economies.
Most countries in the region have the capacity to leverage existing public funding, including through
increased user and beneficiary contributions. For instance, land value capture mechanisms can be
designed so that property developers finance water security investments that add value to their properties.
Similarly, greater user contributions towards the cost of irrigation infrastructure and the value of water can
generate revenue and incentivise water use efficiency.
Data from the OECD Creditor Reporting System signals that official development assistance remains a
low share of investment in water infrastructure and may not be targeting those countries most in need:
India and Indonesia received considerable amounts of ODA for the water sector in comparison to other
countries in the region, which may be less able to rely on domestic sources of finance. There is room to
improve the allocation of ODA across countries – with a focus on poor, risky countries where private capital
will not go – and sectors or projects – with a priority for the ones that have no associated revenue stream.
There is room to use ODA strategically to crowd in domestic commercial capital. The region already
witnesses pioneer developments in the combination of development and other sources of finance. Lessons
wil be learned, to replicate and scale up what works well.

10 ENV/WKP(2021)3
Unclassified
1.1. Background
In 2020, the OECD and the ADB signed a knowledge partnership agreement for the purpose of supporting
the 2020 edition of the Asia Water Development Outlook. Both institutions agreed to jointly work on two
dedicated chapters of the Asia Water Development Outlook, one on governance, and one on financing.
The AWDO is a flagship publication of ADB aimed at highlighting important water management issues in
the Asia-Pacific region. The first edition was published in 2007, which underlined the need to address
water security with a broader perspective than traditional sector-focused approaches. It highlighted
governance as a major factor that has constrained efforts to increase water security in Asia and the Pacific.
The second edition released in 2013 provided the first quantitative comprehensive assessment of water
security in the countries of Asia and the Pacific. It developed a water security framework based on five
key dimensions (KD). The third edition released in 2016 further refined the KD indicators and associated
methodologies for assessing water security. The fourth edition is planned for release in 2020. It will refine
the analytical framework and associated indicators to provide more detailed analysis and greater
confidence in water security assessments. This edition will also introduce dedicated chapters on water
governance and water financing, both being important factors for achieving water security.
This paper reflects the analyses and recommendations developed by the OECD in the context of the
partnership agreement. It will inform the 4th edition of the AWDO, in particular the dedicated chapter on
financing water security. The paper is intended to be released as a Working Paper.
1.2. Scope
Financing water security is rising on the political agenda as population growth and climate change intensify
scarcity, floods, shocks and access inequalities. Meeting the water-related sustainable development goals
will require institutional and technological innovations to supply, allocate, and manage water, as well as a
substantial and sustained financial commitment to address those who may be left behind. This reinforces
the need to rethink typical water financing approaches.
For the first time, the 2020 AWDO includes a specific chapter on financing water. This paper assesses
challenges and opportunities related to financing investments that contribute to water security and
sustainable growth in the Asia-Pacific region. The analysis covers the following three water-related sub-
sectors:
Access to water supply and sanitation
Flood protection (riverine and coastal)
Irrigation infrastructure (for both efficiency upgrades and expansion).
The Asia Water Development Outlook (in particular Key Dimension 2, on economic water security)
demonstrates that there is a compelling economic case for investment in water. Water risks affect not only
livelihoods and ecosystems, but also the economy. When water risks are not adequately managed,
1 Introduction

ENV/WKP(2021)3 11
Unclassified
economic impacts are significant. In terms of monetary costs, weather-related disasters have amounted to
USD 750 billion losses from 2003 to 2013 in the region, with Myanmar, the Philippines, Bangladesh, Viet
Nam, and Thailand among the most affected (UNEP, 2015). Water management and related infrastructure
have been crucial for economic growth, food and energy security, resilience to climate change, and social
wellbeing. Harnessing water’s productive potential and mitigating water-related risks remain key priorities
to achieve and maintain sustainable and inclusive growth in the Asia-Pacific.
This paper analyses investment needs and financing capacities to the extent possible in light of available
data. It outlines policy options and institutional arrangements that can scale-up the effective and efficient
financing of water-related investments that contribute to sustainable growth. A full explanation of the
methodologies used in this paper is presented as Annex A.

12 ENV/WKP(2021)3
Unclassified
2.1. Water supply and sanitation
According to recent assessments by the WHO and UNICEF Joint Monitoring Programme (JMP 2019),
access levels to safely managed water supply and sanitation services vary considerably in the Asia-Pacific
region. This is reflected in investment needs for water supply and sanitation infrastructure.
Drivers of investment needs in water supply and sanitation include:
Maintaining current, and achieving universal access to, safe water supply and sanitation services
for a growing and urbanising population. Sixty percent of the world’s population lives in Asia (4.5
billion), which is projected to grow to more than 5 billion by 2050 (UN DESA, 2017). Of that
population, 50% currently reside in urban areas. By 2050, the share of the population living in urban
areas is projected to reach 66% (UN DESA, 2018). This translates into the need to connect 1,050
million additional city dwellers in 30 years.
Maintaining and replacing ageing infrastructure assets, including additional investments required
to reach an acceptable standard of operational efficiency (e.g. minimising non-revenue water).
Achieving compliance with increasingly stringent national and local regulations related to urban
wastewater treatment, ambient water quality and wastewater reuse.
Adapting to climate change, including the potential need for additional water supply augmentation
and storage (e.g. wastewater reuse, desalination, dams, managed aquifer recharge), and
increased capacity to collect and treat stormwater, as well as the need to protect or strengthen
existing water infrastructure to increase resilience to climate-related disasters.
The total annual estimated investment needs required over the period 2015-30 to achieve universal access
to safely managed water supply and sanitation services in the Asia Pacific region amount to USD 198 bn/yr.
This includes capital, maintenance and operation costs. The estimate, based on World Bank figures, is
derived from the gap in access to services as of 2015 (and the cost of connecting those without access),
as well as improving the level of service for those with access to reach SDG 6.1 and 6.2 targets1. The
estimate of investment needs is higher than that of other similar studies (Table 1), which do not make this
SDG 6 assumption of first connecting populations to a basic water supply and sanitation connection, before
then giving populations a high quality, more safely managed connection. For more details on the
methodology, please refer to Annex A.
1 Sustainable Development Goal (SDG) 6.1: By 2030, achieve universal and equitable access to safe and affordable
drinking water for all. SDG 6.2: By 2030, achieve access to adequate and equitable sanitation [and hygiene] for all and
end open defecation, paying special attention to the needs of women and girls and those in vulnerable situations.
2 Investment needs

ENV/WKP(2021)3 13
Unclassified
Table 2.1. Comparison of total expenditure needs in WSS infrastructure in the Asia-Pacific region
Annual average total expenditure need, 2015-2030, USD billions (2015 prices)
AWDO 2020 (this study) UNESCAP 2019 ADB 2019 Hutton and Varughese 2016
198 70 53 51
Note: The AWDO 2020 projection is based on the World Bank Paper written by Rozenberg and Fay et al. (2019) using the scenario in which
countries first connect citizens using to SDG 6 quality connection, and then go back and install a higher quality safely managed connections.
The other projections do not make this SDG 6 assumption. The Hutton and Varughese 2016 paper is a projection of capital costs only.
Figure 2.1 presents the total estimated annual expenditure needs (investment gap) required over the
period 2015-30 to achieve universal access to safely managed water supply and sanitation services for
countries in the Asia Pacific region. The drivers of cost to delivery services are based on World Bank
calculations at national level and include: labour costs, cost of materials and public spending efficiency,
and the prevalence of corruption. China (USD 60bn/yr) and India (USD 22bn/yr) have the highest annual
investment needs in water supply and sanitation due to the sheer size of their populations. Achieving
universal access to safe water supply and sanitation services will require much more than a one-off
injection of capital; operations and maintenance of existing and new-built assets represent a significant
share of total expenditure needs.
Figure 2.1 illustrates that with the exception of a few notable outliers (Timor Leste, Afghanistan, Nepal,
Pakistan), most countries will need to allocate between 1 and 2% of GDP to invest in water supply and
sanitation infrastructure over the period 2015-2030 (based on extrapolations of growth forecasts).
Figure 2.1. Projected annual expenditure needs for WSS 2015-30
% of GDP - Billions USD / year
Note: No data for Australia, Singapore, New Zealand, Brunei, South Korea, Japan, Hong Kong (SAR China), Niue, Cook Islands. Scenarios:
indirect pathway of basic connection first, and then safe managed connection; SSP2. Calculation for GDP over the period derived from actual
GDP in 2015-18, forecast of GDP over the period 2019-24 and extrapolation of average growth rate until 2030.
Source: OECD calculations based on cost of service delivery from Rozenberg and Fay (2019), 2015 dollars. GDP data from IMF.

14 ENV/WKP(2021)3
Unclassified
Figure 2.2 compares countries in the region in terms of the total investment needs to achieve SDGs 6.1
and 6.2 by 2030 as both a share of GDP and per capita. This figure provides insights into the macro-
economic affordability of investments in water supply and sanitation. Timor Leste, Afghanistan, Nepal,
Pakistan, Cambodia, Myanmar, Viet Nam, the Philippines and Bangladesh all have water supply and
sanitation investment needs of greater than USD20 per capita per year. Countries with investment needs
constituting a larger share of total GDP can expect to face greater challenges to meet investment needs.
Timor Leste, Afghanistan, Nepal and Pakistan all have investment needs of >2% of GDP.
Figure 2.2. Comparative expenditure gap of water supply and sanitation infrastructure required by 2030 to achieve SDGs 6.1 and 6.2
Cost per capita (USD) and as a percentage of GDP
Pakistan
NepalAfghanistan
Timor-Leste,
0
200
400
600
800
1000
1200
0.00% 1.00% 2.00% 3.00% 4.00% 5.00% 6.00%
Tot
ex (
2015
-203
0) p
er C
apita
(20
15 p
opul
atio
n) (U
SD
)
Totex as a % of GDP

ENV/WKP(2021)3 15
Unclassified
Notes: Please note the different scale of the two graphs. Calculation of GDP same as for Figure 2. Calculation for per capital expenditure
required based on 2015 population data. No data for Australia, Singapore, New Zealand, Brunei, South Korea, Japan, Hong Kong (SAR China),
Niue, Cook Islands.
Source: OECD calculations based on Rozenberg and Fay (2019).
2.2. Flood protection
Flood damages are expected to increase significantly over the 21st century as sea-level rise, more intense
precipitation, extreme weather events, and socioeconomic developments (population and economic
growth and urbanisation) result in an increasing number of people, and value of assets at risk, in coastal
and riverine floodplains.
The analysis from the World Resources Institute’s Flood Analyser allows the determination of exposed
assets, and the current and future projected level of flood risk. Flood projections cover riverine floods and
coastal floods, and account for the compounding risk of land subsidence. The key drivers of increasing
flood risk are climate change and socio-economic development, namely economic and demographic
growth. The impact of these drivers is projected on three variables: the value of assets at risk of flooding,
the number of people affected by floods, and the value of GDP affected by floods. This approach results
from the paucity of data on baseline expenditures for flood protection.
Population exposure and the need to protect people and economic growth (GDP) are strong drivers of
investment in flood protection. Investment costs for protection against flood risks will depend primarily on
the level of risk that is acceptable to local populations and the uncertainty pertaining to construction costs.
Like water supply and sanitation, the impacts on people and the scale of investment needs in flood

16 ENV/WKP(2021)3
Unclassified
protection are, for the most part, concentrated in low- and middle-income countries. Bangladesh, Myanmar,
Viet Nam and Cambodia have the greatest percentage of the population exposed to flood risks;
Bangladesh in particular is a hotspot for flood risk in the Asia-Pacific region with over 11% of the population
projected to be exposed in 2030 (Figure 2.3).
Figure 2.3. Projected share of the population exposed to flood risk, 2030
Flood risk as a percentage of the population in 2030
Note: Subsidence included in coastal flooding.
Source: WRI (2020).
Figure 2.4 shows the increase in absolute numbers of people exposed to flood risks between 2010-2030.
The greatest increases are in India (over 20 million additional people), Bangladesh (approximately 8 million
additional people), and in Indonesia, Pakistan and Viet Nam (each over 3 million additional people).

ENV/WKP(2021)3 17
Unclassified
Figure 2.4. Increase in population exposed to flood risk: 2010-2030 (millions)
Source: OECD calculations based on WRI (2020).
Figure 2.5 shows the projected flood risk exposure to GDP in 2030, which represents the increase in the
value of assets and the number of people exposed, under a business as usual scenario, and includes the
effects of land subsidence. The exposure is substantial in some countries, most notably in India (over USD
280 billion), China (USD 220 billion) and Indonesia (over USD 100 billion). Riverine flood risks are a greater
risk to the Asian economy than coastal flood risks.

18 ENV/WKP(2021)3
Unclassified
Figure 2.5. Projected flood risk exposure to GDP, 2030
USD billions
Source: WRI (2020).
This flood risk exposure expressed as a percentage of GDP shows that Bangladesh, Cambodia,
Afghanistan, Kyrgyz Republic, Tajikistan and Viet Nam all have flood risks exceeding 6% of GDP in 2030
under a business-as-usual scenario, with land subsidence (Figure 2.6). Coastal flood risks are projected
to strongly affect the GDP of the Solomon Islands, Bangladesh, Vanuatu and Viet Nam.

ENV/WKP(2021)3 19
Unclassified
Figure 2.6. Projected flood risk exposure to GDP, 2030
Percentage of GDP
Source: WRI (2020).
2.3. Irrigation
Irrigation plays a key role in Asia’s agricultural economy. As food demand increases from a growing
population, dietary preferences change and the effects of climate change intensify, so too will the need for
irrigation, both in terms of irrigation expansion, and efficiency improvements of existing irrigation
infrastructure (ADB, 2017).
The largest expansion in irrigated area globally is projected to be in Asia. Approximately 2.6 million km2 of
agricultural land in Asia is irrigated (about 70% of the world’s total irrigated land) (Meier et al., 2018). The
largest share of irrigated land is found in South Asia (India and Pakistan) and Eastern Asia (China). Existing
projections suggest that the area under irrigation in Asia is set to expand by an additional 570,000 km2 by
2050, a 22% expansion from 2010 levels (Rosegrant et al., 2017). Irrigation expansion is projected to be
particularly high in South Asia (up to 30% increase from 2010 to 2050)2.
Expansion of irrigation requires investments in water infrastructure such as irrigation technologies, dams,
canals, and other conveyance systems. Country-level data is not available on investment needs or current
2 Of note: this paper does not discuss the potential impacts of irrigation extension on groundwater resources and risks
of stranded assets in water tables are depleted.

20 ENV/WKP(2021)3
Unclassified
expenditure on irrigation; the data availability of irrigation costs is exceedingly sparse and makes for a
challenge when estimating investment needs for the sector. A more useful exercise is to project costs at
the sub-regional level. Two recent attempts to model investment costs in irrigation at the sub-regional level
provide insight: one by IFPRI (Rosegrant, 2017), and one by the World Bank (Rozenberg and Fay, 2019).
Across developing countries in the sub-regions of East Asia and Pacific, and South Asia, the investments
required to achieve projected irrigation expansion are estimated to cost on average a total of USD 3.1
billion per year, over the period 2015-2030 (Rosegrant et al., 2017) (Table 2.2).
However, irrigation expansion alone will not be enough. Water scarcity will lead to declining average yields
in the face of irrigation expansion (particularly in South Asia). Most of the gains from expanding irrigation
area will only be realised if they are accompanied by investments to modernise systems and increase the
water use efficiency of existing irrigation assets (Rosegrant et al., 2017).
Projected investments in improved water use efficiency across developing countries in the East Asia and
Pacific, and South Asia sub-regions are a significant (USD 1.7 bn/yr) share of the cost, given the large
share of land under irrigation. Baseline investments in soil-water management technologies (e.g.
technologies such as no-till agriculture and water harvesting that increase the water holding capacity of
soil) are estimated at USD 500 mn/year across the two sub-regions.
An alternative scenario is proposed by Rosegrant et al. (2017), whereby accelerating irrigation expansion,
and further improving irrigation efficiency and soil-water management can increase agricultural output
while conserving more water. Under this scenario, the total annual investment in irrigation for East Asia
and Pacific, and South Asia, are USD 6.8 bn/yr and USD 5.1 bn/yr respectively (Table 2).
Table 2.2. Average Annual investment in irrigation and additional investments - developing countries, 2015-30
USD billions per year (2005 prices)
Sub-region Reference investment scenarios Alternative investment scenarios (additional
investment relative to reference scenario)
Total
Irrigation
expansion
Water use
efficiency (WUE)
Soil-water
management (ISW)
Accelerated irrigation
expansion (IX)
IX + WUE ISW
East Asia
and Pacific
1.29 0.94 0.34 0.66 2.86 0.68 6.77
South Asia 1.82 0.76 0.17 0.45 0.95 0.95 5.1
Note: Figures are average annual investments over 2015-2050. Regions include developing countries only.
Reference scenarios are based on historical trends (from literature) combined with expert opinion about future pathways, and using SSP2/ RCP
8.5 to model socioeconomic and climate change. Alternative scenarios focus on investments and improvements in agricultural water resource
management, developed by IFPRI in consultation with IWMI.
Scenarios: WUE- Water Use Efficiency; ISW- Investments in Soil-Water Management (e.g. no-till agriculture and water harvesting); IX-
accelerated investments in irrigation expansion; IX+WUE- combination of accelerated investments in irrigation expansion with improved water
use efficiency; ISW- improvements in rainwater harvesting and soil water holding capacity.
Source: Rosegrant et al. (2017).
Figure 2.2 presents regional estimates of annual irrigation investment needs from 2015-2030 as a
percentage of GDP. The estimates, modelled by Rozenberg and Fay (2019), account for irrigation
expansion and irrigation efficiency, socioeconomic and climate change (SSP2/RCP8.5), moderate public
investment support for capital costs, and assume farmers will cover the costs of parts and materials for
farm irrigation equipment and a water price which reflects the relative scarcity of water due to increasing
demand from other sectors.

ENV/WKP(2021)3 21
Unclassified
Irrigation investment needs vary by sub-region, with South Asia bearing the highest annual investment
costs of 0.27% of GDP. In terms of absolute costs, East Asia and the Pacific face the greatest investment
costs of approximately USD 20 bn / year (Figure 2.7).
Figure 2.7. Annual irrigation investment needs 2015-2030
Percentage of GDP / year
Note: EECA region includes 13 ADB countries, as well as 10 non-ADB countries.
Source: Rozenberg and Fay (2019).
2.4. Emerging issues
The paper does not cover emerging issues, which are likely to substantially increase the costs of water
management, in particular in urban environments. These include improvement of individual and other
appropriate sanitation systems (IAS), combined sewers and risks of overflows (CSOs), contaminants of
emerging concern (CECs), or sludge management.
In selected areas, such as mountainous and isolated territories, and also in some peri-urban areas, cost-
effective decentralised wastewater collection and treatment can be considered. However, these should not
be considered as a cheap option or a licence for complacency. Compliance monitoring and enforcement
will be crucial to ensure environmental protection (i.e. to prevent freshwater and groundwater
contamination from leaking septic tanks, and inappropriate wastewater disposal without treatment to
rivers). IAS should be considered in the context of national strategies, with mechanisms to ensure reliable
performance of services. This is likely to increase the costs of IAS, in places making connection to existing
pipes competitive. Policy guidance and institutional strengthening are likely to be required to accompany
transaction towards sustainable and effective IAS.
Combined sewers are common practice, but they risk discharging untreated wastewater, including priority
hazardous substances and other substances, into the environment in cases of heavy rains. The issue is
likely to intensify, as cities and assets are built, and climate change exacerbates the intensity of rain
episodes. Cities that are not yet equipped with sewers have the opportunity to build resilient infrastructure
from the start and avoid the difficult transition more advanced countries face. When combined sewers are
being built, regulation should ensure that appropriate storage and flow constraints are put in place to at
least moderate the potential impacts at proportionate costs.
Where combined sewers are in place, traditional ways of managing CSOs include increasing capacity for
storm water storage (including underground storage chambers) to reduce the frequency and amount of
22 ENV/WKP(2021)3
Unclassified
overflows. Another option is to separate existing combined sewers into a sanitary network and a storm
water network, combined with downstream treatment using wetlands, ponds, filtration or other suitable
systems (in particular to control substances washed from pavements by rainwater).
An alternative approach is to prevent storm water from entering the sewer network by using green
infrastructure. This is invariably cheaper, more adaptable and more resilient than the traditional
subterranean storage approach. Certain green infrastructures are better able to handle pollutants.
Countries in the region would benefit from exploring these options more systematically, which requires
appropriate institutional and other arrangements.
More work is needed to characterise additional pressures from contaminants of emerging concern (e.g.
pharmaceutical residues and microplastics in freshwater) and to understand the financial implications.
Extremely high pharmaceutical concentrations, in the order of mg/L have been detected in some industrial
effluents and recipient streams, for example in China, India, or Korea (Larsson, 2014). A range of
antibiotics, analgesics, anti-inflammatories, anticonvulsants, beta-blockers and blood lipid modifying
agents have been detected in various concentrations in both WWTP effluent and receiving surface waters
in Australia and Asia.
Advances in analytical methods and risk assessment provide opportunities to build a policy-relevant
knowledge base. The Box 2.1 below illustrates prioritisation of pharmaceuticals via suspect and non-target
screening in Korea.
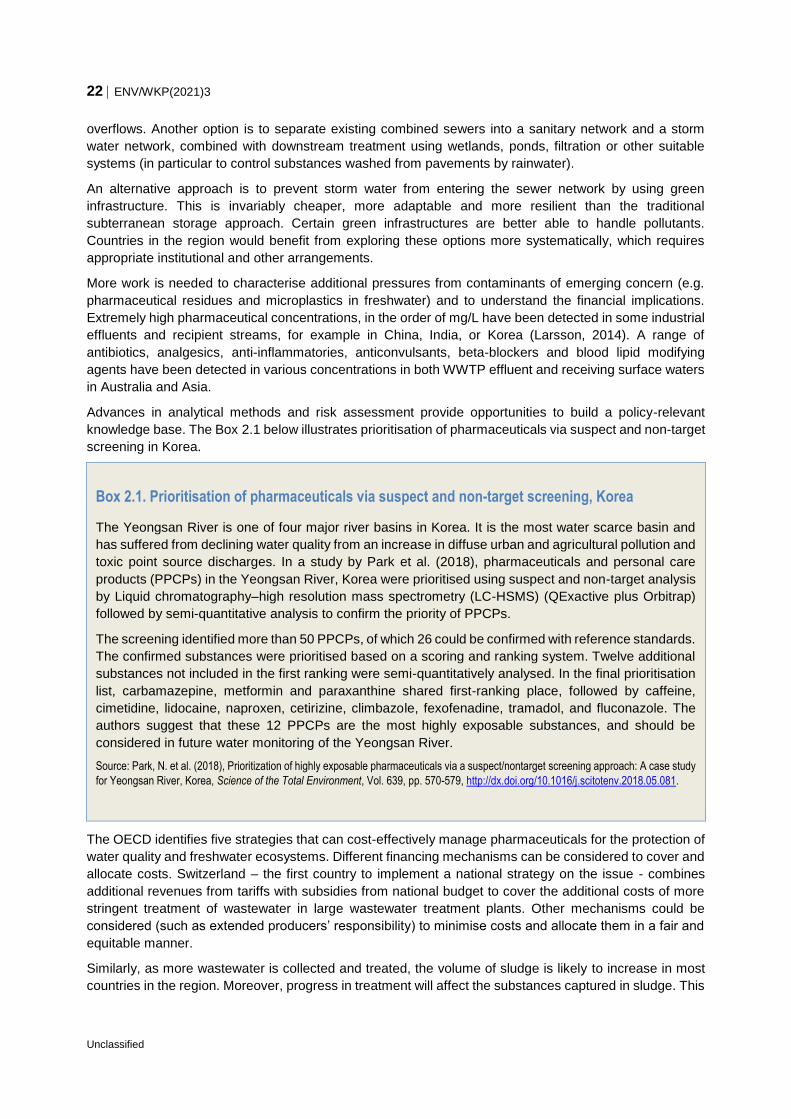
Box 2.1. Prioritisation of pharmaceuticals via suspect and non-target screening, Korea
The Yeongsan River is one of four major river basins in Korea. It is the most water scarce basin and
has suffered from declining water quality from an increase in diffuse urban and agricultural pollution and
toxic point source discharges. In a study by Park et al. (2018), pharmaceuticals and personal care
products (PPCPs) in the Yeongsan River, Korea were prioritised using suspect and non-target analysis
by Liquid chromatography–high resolution mass spectrometry (LC-HSMS) (QExactive plus Orbitrap)
followed by semi-quantitative analysis to confirm the priority of PPCPs.
The screening identified more than 50 PPCPs, of which 26 could be confirmed with reference standards.
The confirmed substances were prioritised based on a scoring and ranking system. Twelve additional
substances not included in the first ranking were semi-quantitatively analysed. In the final prioritisation
list, carbamazepine, metformin and paraxanthine shared first-ranking place, followed by caffeine,
cimetidine, lidocaine, naproxen, cetirizine, climbazole, fexofenadine, tramadol, and fluconazole. The
authors suggest that these 12 PPCPs are the most highly exposable substances, and should be
considered in future water monitoring of the Yeongsan River.
Source: Park, N. et al. (2018), Prioritization of highly exposable pharmaceuticals via a suspect/nontarget screening approach: A case study
for Yeongsan River, Korea, Science of the Total Environment, Vol. 639, pp. 570-579, http://dx.doi.org/10.1016/j.scitotenv.2018.05.081.
The OECD identifies five strategies that can cost-effectively manage pharmaceuticals for the protection of
water quality and freshwater ecosystems. Different financing mechanisms can be considered to cover and
allocate costs. Switzerland – the first country to implement a national strategy on the issue - combines
additional revenues from tariffs with subsidies from national budget to cover the additional costs of more
stringent treatment of wastewater in large wastewater treatment plants. Other mechanisms could be
considered (such as extended producers’ responsibility) to minimise costs and allocate them in a fair and
equitable manner.
Similarly, as more wastewater is collected and treated, the volume of sludge is likely to increase in most
countries in the region. Moreover, progress in treatment will affect the substances captured in sludge. This

ENV/WKP(2021)3 23
Unclassified
can be an issue, when sludge is essentially spread on agriculture land, as farmers or the food industry
they supply may be less inclined to accept these substances. This is likely to increase the cost of sludge
handling and management, a growing concern in developed countries.
While these issues may seem secondary until significant progress is achieved for wastewater collection
and treatment in most countries in Asia-Pacific, they may already be significant in selected countries or
urban environments. Awareness raising and anticipating may incentivise action before these issues
become more pressing and possibly more costly to address. Developing countries in the region have the
opportunity to leapfrog and build resilient water infrastructure from the start.

24 ENV/WKP(2021)3
Unclassified
The previous sections have highlighted the significant investment needed in infrastructure to manage
water-related risks in the Asia-Pacific. Table 3.1 summarises the top ten countries in the region where the
annual investment costs required in water supply and sanitation services and flood protection are greatest.
Much of the financial burden in terms of cost to GDP falls upon those countries that can least afford it (i.e.
low and low-middle income countries).
Table 3.1. Top ten countries for annual investments costs in water infrastructure in the Asia-Pacific region
Water supply and sanitation Riverine flood protection Coastal flood protection
% GDP USD billions % GDP USD billions % GDP USD billions
Timor-Leste (5.5) China (60.79) Bangladesh (8.2) India (275.24) Bangladesh (2.8) China (34.10)
Afghanistan (2.9) India (23.02) Myanmar (5.8) China (188.75) Solomon Islands (2.1) Bangladesh (20.93)
Nepal (2.7) Indonesia (6.76) Cambodia (5.3) Indonesia (84.76) Viet Nam (1.7) Indonesia (17.53)
Pakistan (2.3) Thailand (5.74) Afghanistan (4.4) Bangladesh (62.06) Vanuatu (1.5) India (13.73)
Papua New Guinea
(1.8) Malaysia (3.85) Kyrgyz Republic (4.1) Thailand (26.94) Myanmar (0.6) Viet Nam (13.31)
Azerbaijan (1.7) Pakistan (3.59) Tajikistan (3.7) Viet Nam (26.70) Indonesia (0.6) Japan (5.18)
Fiji (1.6) Viet Nam (2.90) Viet Nam (3.4) Pakistan (21.52) Fiji (0.5) Malaysia (3.29)
Kiribati (1.6) Philippines (2.69) Laos (3.1) Myanmar (10.98) Malaysia (0.4) Philippines (1.96)
Marshall Islands (1.6) Japan (2.47)* Indonesia (2.8) Japan (10.89) Philippines (0.2) Myanmar (1.09)
Micronesia (1.5) Bangladesh (1.64) Timor-Leste (2.7) Philippines (9.33) Papua New Guinea
(0.2) South Korea (0.67)
Low-Income Economies
Lower-Middle Income Economies
Upper-Middle Income Economies
High-Income Economies
Source: OECD using data from Rozenberg and Fay (2019) and WRI (2020). *Japan water supply and sanitation estimate from UNESCAP
(2019). World Bank Income Groups.
An increased and sustained effort will be required to finance the investment gap. The OECD makes a
distinction between the three ultimate sources of finance for water-related investments (revenues from
tariffs, taxes and transfers from the international community; the so-called “3Ts”) and other sources of
repayable finance (loans, bonds, etc.) (Figure 9). Taxes and tariffs are very important for not only raising
revenue, but also for demand management and signalling the value of water, water services and water
security.
3 Financing capacities to reach
investment needs

ENV/WKP(2021)3 25
Unclassified
Figure 3.1. Potential sources of funding and financing for water-related investments
Source: Adapted from OECD (2010) Innovative Financing Mechanisms for the Water Sector. https://doi.org/10.1787/9789264083660-en.
Repayable sources of finance require a creditworthy borrower, which can provide a financial return.
Notably, there is a growing consensus that mobilising commercial finance (through blended finance or
other means, such as a combination of equity and debt) will be instrumental to achieve the SDGs and
provide the incentives to put the water sectors’ financing on a more sustainable footing. Co-ordination
among development finance providers will be essential to making this happen, and to avoid concessional
finance crowding out commercial capital (OECD, 2019a). It is also worth noting that any concessional or
commercial finance will have to be repaid, largely through public budgets or taxes, and water tariffs and
charges.
Data availability to characterise current expenditure and sources of finance for water-related investments
at country level is limited, which prohibits the possibility to construct a robust and comparable baseline of
expenditure and an assessment of room for manoeuvre to mobilise additional finance. However, some
elements of funding sources for water supply and sanitation services are available. The following sub-
sections provide elements of this overall picture.
3.1. Public taxes are the main source of finance for water-related infrastructure
Figure 10 depicts levels of water supply and sanitation infrastructure expenditure (as a share of GDP) over
a limited time period for select countries. Countries for which data are available reflect different shares of
public and private sources of finance in water supply and sanitation infrastructure. Public budgets are the
dominant funding source in countries for which data is available. Significant levels of public expenditure
(> 5% GDP) have occurred in several economies, notably China, Bhutan, Viet Nam, India and the
Maldives.

26 ENV/WKP(2021)3
Unclassified
Figure 3.2. Public and private expenditure for water supply and sanitation, select economies, select years
Percentage of GDP
Note: Actual budget expenditure except Armenia, Bhutan, Georgia, Maldives, Myanmar, and Thailand, which are planned or estimated budget
expenditure. Periods covered are 2010–2013 average for Indonesia; 2010–2014 average for the PRC, Fiji, and Malaysia; 2010, 2011, and 2014
average for Hong Kong (China); 2011 for Armenia, Bangladesh and Georgia; 2011–2012 average for Nepal; 2012–2013 average for India;
2011–2013 average for Maldives; 2011, 2012, and 2014 average for Singapore; 2011–2014 average for the Philippines, Sri Lanka, and Thailand
and 2014 for Myanmar.
Source: OECD calculations based on ADB data (2017). Original sources of country-level data: World Bank Private Sector Participation in
Infrastructure (PPI) database, World Development Indicators, ADB estimates.
Many emerging economies and developing countries have little or no experience with private investment
in the water sector; private investment is concentrated in only a few of Asia’s lower-risk economies. The
Maldives and India have attracted a significant share of private investment in water supply and sanitation
infrastructure, representing 4% and 2% of GDP, respectively (Figure 10). China has attracted the major
share (49%) of private investment in water infrastructure in emerging economies/developing economies in
the Asia-Pacific region since 2000, followed by Malaysia (8%), Philippines (6%) and India (6%) (AIIB,
2019). This partly reflects efforts in these countries to expedite and facilitate infrastructure investments, as
well as investor appetite to invest in more established economies. China, in particular, took several steps
to encourage private investment in public services and infrastructure, including for foreign-based private
operators, through guidelines3 and the creation of dedicated institutions (e.g. the China Public Private
Partnership Center). Little or no private investment is taking place in Asia’s smaller economies, where the
financing needs are higher and opportunities to raise funds are lower (AIIB, 2019).
Table 4 lists the current sovereign credit rating of countries in the Asia-Pacific region. Sovereign credit
ratings can give investors insights into the level of risk associated with investing in the debt of a particular
country, including political risk. Obtaining a good sovereign credit rating is usually essential for developing
countries that want access to funding in international bond markets. However, a number of developing
ADB member countries have not been assigned a credit rating, signalling that the economic and/or political
environment is not stable.
3 World Bank (2018), Procuring infrastructure public-private partnerships 2018 in China.
https://bpp.worldbank.org/content/dam/documents/bpp/china.pdf.
0 1 2 3 4 5 6 7
China, People's Republic of
Bhutan
Viet Nam
India
Maldives
Fiji
Hong Kong, China
Georgia
Sri Lanka
Indonesia
Myanmar
Singapore
Korea, Rep. of
Philippines
Pakistan
Mongolia
Papua New Guinea
Bangladesh
% of GDP
Private Public

ENV/WKP(2021)3 27
Unclassified
Table 3.2. Sovereign credit ratings for Asia-Pacific countries
Rating Description ADB Member States
AAA Highest rating assigned by S&P. The obligor's capacity to meet its financial commitments on the
obligation is extremely strong. Australia, Singapore
AA Only differs from the highest-rated obligations to a small degree. The obligor's capacity to meet its
financial commitments on the obligation is very strong. Hong Kong, Korea, New Zealand
A Somewhat more susceptible to the adverse effects of changes in circumstances and economic conditions than obligations in higher-rated categories. The obligor's capacity to meet its financial
commitments on the obligation remains strong.
China, Japan, Malaysia
BBB Adequate protection parameters. However, adverse economic conditions or changing circumstances
are more likely to weaken the obligor's capacity to meet its financial commitments.
India, Indonesia, Kazakhstan,
Philippines, Thailand
BB Faces major ongoing uncertainties or exposure to adverse business, financial, or economic conditions
that could lead to the obligor's inadequate capacity to meet its financial commitments.
Azerbaijan, Bangladesh, Fiji, Georgia, Viet Nam, Uzbekistan
B
More vulnerable to non-payment than 'BB', but the obligor currently has the capacity to meet its financial commitments. Adverse business, financial, or economic conditions will likely impair the
obligor's capacity or willingness to meet its financial commitments.
Mongolia, Pakistan, Papua New Guinea, Sri Lanka, Tajikistan
Note: No rating: Afghanistan, Armenia, Bhutan, Brunei Darussalam, Cambodia, Cook Islands, Kiribati, Kyrgyz Republic, Lao People's
Democratic Republic, Maldives, Marshall Islands, Micronesia, Myanmar, Nauru, Palau Nepal, Niue, Samoa, Solomon Islands, Taipei, Timor-
Leste, Tonga, Turkmenistan, Tuvalu, Vanuatu.
Source: Standards and Poor’s (2019).
A similar trend is shown in Figure 3.3 where public/government budget is the main funding type for annual
water supply, sanitation and hygiene (WASH) expenditure, as reported by a limited number of countries in
the latest GLAAS report. Figure 3.4 illustrates that the majority (on average 79%) of reported expenditure
is directed towards drinking water services, as opposed to sanitation and hygiene services. Of the three
countries that reported on the funding gap to reach national WASH targets in the Asia-Pacific region, all
reported a high funding gap: Afghanistan 83%, Bangladesh 39% and Viet Nam 67% (UN Water and WHO,
2019). Box 3.1 presents the water infrastructure investment profile in Viet Nam, the majority of which comes
from the public budget (from central and local government), as well as concessional finance and overseas
development assistance.

28 ENV/WKP(2021)3
Unclassified
Figure 3.3. Annual WASH expenditure by funding type, select economies
USD millions (constant 2017 USD)
Note: 2017 data for Kyrgyz Republic, Maldives, Georgia, Azerbaijan, Philippines, Bangladesh, Thailand, Pakistan, Indonesia; 2018 data for
Solomon Islands, Bhutan, Afghanistan, Sri Lanka, China; 2019 data for Nepal.
Source: UN Water and WHO (2019).
Figure 3.4. Annual WASH expenditure by subsector, select economies
USD millions (constant 2017 USD)
Note: 2017 data for Kyrgyz Republic, Tajikistan, Georgia, Philippines, Indonesia, Bangladesh; 2018 data for Bhutan, Solomon Islands; 2019
data for Nepal.
Source: UN Water and WHO (2019).

ENV/WKP(2021)3 29
Unclassified
Box 3.1. Water management investment profile: Viet Nam
As reported by the government of Viet Nam in a recent 2019 OECD survey of select Asian countries,
almost one-third (30%) of finance for water management comes from the public budget (central and
local). Viet Nam also relies heavily on concessional finance (32%) and ODA (22%) to finance water
management. Water supply and sanitation tariffs (10%) and other water charges (6%) represent a
relatively small proportion of financing sources. Viet Nam reported zero experience with commercial
finance.
In the recent GLAAS survey (UN Water and WHO, 2019), Viet Nam reported a funding gap for water
supply and sanitation of 67%.
Figure 3.5. Financing sources for water management, Viet Nam
Source: OECD data collected by questionnaire sent to select ASEAN countries as part of a project on facilitating water security in Asia with
the Korean government and the Asia Water Council.
3.2. Official development assistance remains a low share of investment in water
infrastructure and may not be targeting those countries who need it most
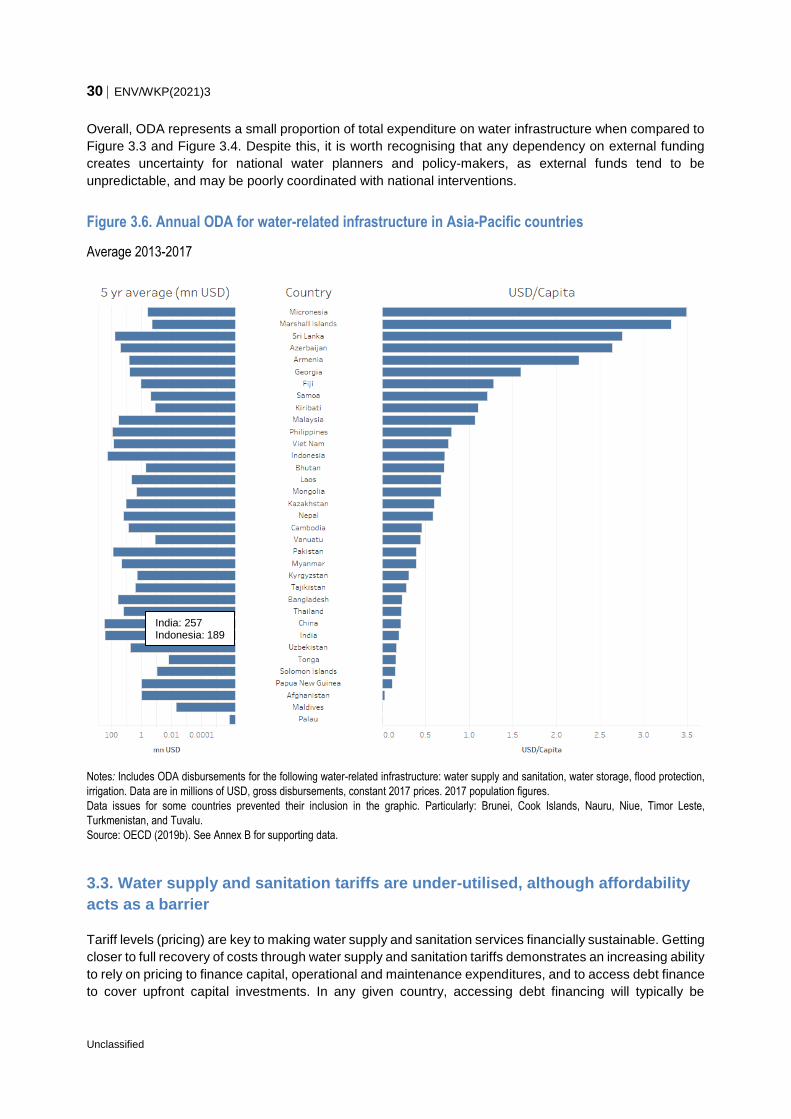
Figure 3.6 and Figure 3.7 illustrate the extent to which countries have been reliant on official development
assistance (ODA) for water-related infrastructure over the period 2013-2017, based on data from the
OECD Creditor Reporting System. These figures aggregate ODA categorised as expenditure contributing
to water supply and sanitation, water storage, flood protection and irrigation. Since 2011, the amount of
the ODA has largely plateaued. The data indicate that India and Indonesia received considerable amounts
of ODA for the water sector (on average 257 and 189 million USD/year) in comparison to other countries
in the region. Figure 14 shows that ODA may not be reaching some of the countries that most need it, such
as Timor-Leste, Bangladesh, Myanmar, Afghanistan and Papua New Guinea.
Public budget (central govt), 17%
Public budget (local govt), 13.4%
WSS tariffs, 9.5%
Revenues from other water
charges, 6.4%
External transfers (e.g. ODA), 21.5%
Concessional finance, 32.2%
30 ENV/WKP(2021)3
Unclassified
Overall, ODA represents a small proportion of total expenditure on water infrastructure when compared to
Figure 3.3 and Figure 3.4. Despite this, it is worth recognising that any dependency on external funding
creates uncertainty for national water planners and policy-makers, as external funds tend to be
unpredictable, and may be poorly coordinated with national interventions.
Figure 3.6. Annual ODA for water-related infrastructure in Asia-Pacific countries
Average 2013-2017
Notes: Includes ODA disbursements for the following water-related infrastructure: water supply and sanitation, water storage, flood protection,
irrigation. Data are in millions of USD, gross disbursements, constant 2017 prices. 2017 population figures.
Data issues for some countries prevented their inclusion in the graphic. Particularly: Brunei, Cook Islands, Nauru, Niue, Timor Leste,
Turkmenistan, and Tuvalu.
Source: OECD (2019b). See Annex B for supporting data.
3.3. Water supply and sanitation tariffs are under-utilised, although affordability
acts as a barrier
Tariff levels (pricing) are key to making water supply and sanitation services financially sustainable. Getting
closer to full recovery of costs through water supply and sanitation tariffs demonstrates an increasing ability
to rely on pricing to finance capital, operational and maintenance expenditures, and to access debt finance
to cover upfront capital investments. In any given country, accessing debt financing will typically be
India: 257 Indonesia: 189

ENV/WKP(2021)3 31
Unclassified
restricted to entities and projects that are able to demonstrate a reliable ability to pay back. For water
supply and sanitation service providers, such ability is first and foremost dependent on the extent to which
costs are recovered through revenues from tariffs or other charges paid by users. In contrast, a reliance
on public budgets illustrates an absence or under-utilisation of pricing mechanisms, poorer borrowing
conditions and lost opportunity to manage demand.
In practice, pricing is often too low to fully recover operational and maintenance costs (including
externalities related to water use) and rarely covers capital expenditure. Figure 3.7 shows that over half of
responding countries in the latest GLAAS survey indicated that water supply and sanitation tariffs are
insufficient to recover 80% of operation and maintenance costs, let alone capital (refurbishment and
replacement) costs. Cost recovery is particularly low in rural areas, although tariffs can vary considerably
within countries, and between drinking and sanitation services. For example, in Cambodia, urban drinking-
water supply systems are predominantly built and operated by private individuals with full cost recovery,
but urban sanitation systems consist of wastewater treatment plants, constructed with external support
and with no clear strategy for cost recovery (UN-Water and WHO, 2019).
Figure 3.7. Percentage of countries reporting >80% cost recovery of O&M costs from water supply and sanitation tariffs
Percentage of countries reporting >80% cost recovery, Select Asia-Pacific countries, 2018
Note: Number of countries reporting on cost recovery for: urban drinking water (24); urban sanitation (23); rural drinking water (21); rural
sanitation (17).
Source: OECD, using data from UN Water and WHO (2019).
Affordability constraints (perceived or real) affect the capacity of service providers, municipalities and
communities to raise additional finance through water supply and sanitation tariffs, additional public finance
to cover water-related expenditure needs, and experience with, and opportunities for, mobilising
commercial debt. Estimates of affordability of water bills are discussed in more details in the Asia Water
Development Outlook (see KD3). The discussion suggests that, aggregated at national level, affordability
is only an issue for a small group of small island countries.
The picture is much more contrasted when affordability is analysed for selected categories of the
population. Figure 3.8 and Figure 3.9 provide some indication of affordability at the micro-level (urban
households) where data is available. They compare the middle household income4 with the annual water
bill in select cities (108 cities in 20 countries) to provide an assessment of potential affordability constraints.
4 The middle quintile is chosen here because in many developing economies, it is likely to be the quintile residing in
cities with access to water supply and sanitation services; the poorest quintile in many situations may not have access
to public water supply and sanitation services, such as those living in informal settlements.
0.0
10.0
20.0
30.0
40.0
50.0
60.0
Urban drinking water Urban sanitation Rural drinking water Rural sanitation

32 ENV/WKP(2021)3
Unclassified
For many countries, the water bill is greater than the 3% threshold heuristically recommended as the
maximum level of disposable income, which signals limited ability to raise water supply and sanitation
tariffs. In particular, Indonesia, Kyrgyz Republic, Myanmar, Mongolia, the Philippines, Thailand, Viet Nam,
and Bangladesh face high affordability constraints, with annual tariffs in select cities currently representing
more than 10% of the annual income of the middle quintile household.
It is worth noting that affordability constraints will be even direr for the poorest 10% of households, many
of which may not be connected to a formal water supply and sanitation service provider, and may be forced
to buy from private vendors, some of which operate illegally and charge exorbitant rates for sub-optimal
services (Goksu et al. 2017).
Conversely, there may also be opportunities, or room for manoeuvre, to increase water supply and
sanitation tariffs in a number of countries, such as Tajikistan, Armenia, Kazakhstan and others.
Figure 3.8. Average city water supply and sanitation tariffs as a share of annual disposable middle-
quintile household income
Note: Average city tariff represents year 2017, and based on available data for select cities from GWI. Annual disposable income of households
is based on the middle quintile of income.
Data for tariffs from 108 cities, in 20 countries. See methodology in Annex for further details.
Source: OECD calculations based on GWI (2019) and World Bank (2019c).
Armenia
Bangladesh
Bhutan
China
GeorgiaIndia
Indonesia
Kazakhstan
Kyrgyz Republic
Malaysia
Mongolia
Myanmar
Pakistan
Philippines
Sri Lanka
Tajikistan
Thailand
Viet Nam
$0
$10
$20
$30
$40
$50
$60
$70
$0 $200 $400 $600 $800 $1,000 $1,200 $1,400
Ave
rage
Ann
ual C
ity W
SS
Bill
(U
SD
)
Income of Middle quintile (USD)
3% of Income of middle quintile
Australia: $142, $6,680 South Korea: $117, $4,205

ENV/WKP(2021)3 33
Unclassified
Figure 3.9. Average city water supply and sanitation tariffs as a share of household income of the middle quintile
Percentage of GDP
Note: Average city tariff represents year 2017, and based on available data for select cities from GWI. Annual disposable income of households
is based on the middle quintile of income.
Data for tariffs from 108 cities, in 20 countries. See methodology in Annex for further details.
Source: OECD calculations based on GWI (2019) and World Bank (2019c).
0% 5% 10% 15% 20% 25% 30% 35% 40%
Tajikistan
Armenia
Kazakhstan
Bhutan
Malaysia
Australia
Georgia
Sri Lanka
South Korea
Pakistan
China
India
Thailand
Kyrgyz Republic
Bangladesh
Indonesia
Philippines
Viet Nam
Mongolia
Myanmar

34 ENV/WKP(2021)3
Unclassified
Based on the analyses of this paper, many countries in the Asia-Pacific region are facing severe financing
challenges to achieve SDG 6. The gap between current financing and future needs results from a number
of barriers (OECD, 2018a):
Water infrastructure is typically capital intensive, and long-lived with high sunk costs. It calls for a
high initial investment followed by a very long pay-back period.
Prevalent business models often fail to support operation and maintenance efficiency, a condition
to sustain service at least cost over time.
Water services are often under-priced, resulting in a poor record of cost recovery for water
investments.
Water is generally an under-valued resource, not properly accounted for by investors that depend
upon or affect its availability, such as land use planners, urban developers, farmers, or energy
suppliers.
Water management generates a mix of public and private benefits in terms of valued goods and
services as well as reduced water-related risks. Many of these benefits cannot be easily monetised,
undermining potential revenue flows.
A lack of appropriate data and analytical tools to assess complex water-related investments, and
a track record of such investments, can deter financiers.
Across the water sector in general, projects are often small and context-specific. This raises
transaction costs and makes emerging innovative financing models difficult to scale up.
Financial flows may benefit projects which are bankable, but may not maximise benefits for
communities and the environment. This raises the question of how to ensure that the most
beneficial investments from a social welfare perspective attract finance at scale.
Silo-ed approach across sub-sector uses (domestic, industry and irrigation) and poor planning. The
result is lack of policy coherence and poor implementation of existing regulations and economic
incentives.
The magnitude of capital investment needs and operating and maintenance costs calls for a shift in the
way the sector is currently operated, regulated and financed. To reap the economic benefits, water supply
and sanitation services, flood protection and irrigation infrastructure require a substantial increase in
investment from a range of sources, including households, national and local governments, and external
funds from donors and the private sector. Public finance (from governments and donors) for water
infrastructure should not only increase but also leverage alternative sources of financing, including
commercial finance. However, tapping into more extended sources of funding calls for increased efficiency
in the water and agriculture sectors, as well as improvements in the creditworthiness of water and
sanitation utilities.
4 Policy recommendations to bridge
the investment gap

ENV/WKP(2021)3 35
Unclassified
Strategies and recommendations to address the financing challenge are discussed in the following
sections:
Make the best use of existing assets and financial resources;
Minimise future investment needs;
Harness additional sources of finance.
4.1. Make the best use of available assets and financial resources
Improving the operational efficiency and effectiveness of existing infrastructure and service providers can
postpone investment needs and is a prerequisite to further investment in water security. There will be
opportunities to make the best use of available assets, to enhance the operation and maintenance of
existing assets delaying the need for investment, and to improve the efficiency of service providers by
capturing economies of scale. This can be enhanced through better operation and maintenance of existing
infrastructure, economic regulation, and engagement with stakeholders (to set acceptable levels of service,
enhance willingness to pay and drive water-wise behaviour). An additional challenge is to operate, maintain
and renew existing assets, to guarantee service quality over time.
The ensuing sections present policy insights and guidance for the following recommendations to make the
best use of existing assets and financial resources:
Enhance the operational efficiency of water and sanitation service providers
Build capacity for economic regulation
Encourage connections, where central assets are available
Strengthen capacity to use available funds.
While this section largely focuses on water supply and sanitation infrastructure and service provision,
increased agricultural production must also come from getting more from existing irrigation infrastructure
assets. This means that investments in irrigation and drainage infrastructure will need to focus on
modernisation (both technical and institutional), basin wide efficiency, and improvements to drainage. In
particular, under-investment in drainage has meant that large swaths of agricultural land in Asia,
particularly in the semi-arid regions of Central Asia (World Bank, 2003) and South Asia (Rasul, 2016), have
become unproductive or have low productivity as a result of waterlogging and salinity. Modelling suggests
that increased investments in water use efficiency will bring the most productivity gains (Rosegrant et al.,
2017).
4.1.1. Enhance the operational efficiency of service providers
Low sustainability of capital investments is an issue in many countries; infrastructure is provided, but lack
of funds for operating costs undermines the continuous supply of services, leading in many cases to
facilities and systems failing to function (or underperforming). This ultimately results in large investments
being lost.
More emphasis should be placed on improving service providers’ efficiency in administrative and delivery
functions, with the provision of appropriate incentives for performance, a role for independent economic
regulation of service provision. Operational efficiency of water service providers is a condition to make the
best use of existing assets and financial resources. It is also a requisite to attract other sources of finance,
be they public or private. It is essential to establish, maintain or increase water users’ willingness to pay
for tariffs that reflect the cost of service provision, and to enhance the legitimacy of a government policy to
increase tariffs. Efficiency gains, in turn, reduce operating costs and, consequently, the amount of subsidy

36 ENV/WKP(2021)3
Unclassified
needed. Thus, addressing such inefficiencies can ease the burden of a tight fiscal space and can free up
resources to support disadvantaged communities or other sub-sectors.
Enhancing operational efficiency of service providers can take different forms depending on the national
contexts. Building on international good practices (see OECD, 2018c for a discussion), performance
indicators for water supply and sanitation services can focus on the following items. The relevance and
relative weight of indicators would reflect local conditions:
Technical performance indicators
o Leakage performance and targets for reducing leakage and other unbilled losses, such as
illegal connections
o Mains bursts (as a proxy for distribution network condition)
o Sewer collapses (as a proxy for sewer asset condition)
o Number of wastewater pollution incidents, such as from operation of combined sewer
overflows, or major failures at wastewater treatment works
o Unplanned outages (loss of supply because of bursts, contamination etc.)
o Energy costs
Compliance with existing regulation
o Drinking water quality compliance (integrating with and reinforcing the role of the drinking water
regulator, where this is separate)
o Level of compliance with environmental permits and standards (integrating with and reinforcing
the role of the environmental regulator, where this is separate). This can also be an indicator
of the quality and state of drinking water and wastewater treatment infrastructure assets
Customers’ experience
o Reducing per capita consumption for households and demand in other sectors on mains
supplies
o Risk of demand restrictions in a drought
o Indicators of user populations’ environmental health, particularly in hard-to-reach areas and
informal settlements (as a proxy for the usage rates, quality, effectiveness of local water supply
and sanitation services)
o Accessibility of payment options for customers, how well billing queries are dealt with,
information about planned outages and supply interruptions.
Countries would benefit from a proactive approach to maintain and renew existing networks (instead of
reacting to incidents such as bursts) to improve operational efficiency of water and sanitation operators,
reduce non-revenue water (Figure 4.1) and address the backlog of under-investment in maintenance of
water supply and sanitation infrastructure. This includes improving the operation of the existing assets to
reduce operational costs (e.g. energy, drinking water chemicals and other material costs) and avoid
additional capital investments. It also includes active leakage control in the water supply system and
regular maintenance of pipes of the collection systems.

ENV/WKP(2021)3 37
Unclassified
Figure 4.1. Non-revenue water in select Asia-Pacific countries
NRW (%), 2019
Source: UN Water and WHO (2019).
Performance-based contracts may be considered to strengthen incentives for investing in efficiency
improvements, including for identifying and investing in appropriate technical solutions for hard-to-reach
populations. Technical assistance for service operators could include capacity building for financial and
technical dimensions of operations. Targeted maintenance, on a risk-based approach, can help optimise
spending, if data on the state of infrastructure is available. When investments depend on official
development assistance, performance-based loans provide the right incentives to spend wisely on projects
that deliver concrete performance on the ground.
In water-scarce countries and areas, reduction of non-revenue water can minimise pressure on the
resource and avoid (or postpone) investments in costly alternative water sources such as desalination.
This requires reducing leakage and increasing collection of water bills. Reducing non-revenue water due
to illegal connections (often associated with irrigation water use) and under-metering5 should be prioritised
in the short term.
Operational efficiency can benefit from systematic assessment and reference to international good
practices. Such assessments can be supported by benchmarking and public reporting of operators of water
supply and sanitation services to increase accountability, transparency and incentives for efficiency and
financial sustainability. The appropriate level of efficiency would reflect local conditions (for instance, the
economic level of leakage will depend on water abundance in a country or catchment; it may also depend
on such factors as density of users along the supply network and technical capacity in the country).
Countries may also benefit from exploring mechanisms to enable consolidation/amalgamation of municipal
and local services to improve operational efficiency and financial sustainability by reaching economies of
scale. Experience from Europe shows that planning, stakeholder engagement and sequencing reforms are
essential to avoid capacity bottlenecks and overcome resistance to consolidation of utilities (OECD,
2020a). The Box 4.1 below provides a success story of the reform of water supply and sanitation operations
in Dhaka, Bangladesh, and serves as a role model for other water utilities in the region.
5 Rolling out metering programmes at household level can be costly, with only minimal gains in terms of water
conservation. District metering is most often appropriate to manage leakage.
0% 10% 20% 30% 40% 50% 60%
Bangladesh
China
Sri Lanka
Fiji
Thailand
Azerbaijan
Lao People's Democratic Republic
Indonesia
Mongolia
Nepal
Tajikistan
Papua New Guinea
Myanmar
Pakistan

38 ENV/WKP(2021)3
Unclassified
Box 4.1. Reforming the Dhaka Water Supply and Sewerage Authority
The Dhaka Water Supply and Sewerage Authority (DWASA) was established in 1963 with a mandate
to manage water supply and sewerage in the Bangladesh capital. The WASA Act of 1996 began a
corporatisation process that ultimately professionalised DWASA and made it profitable.
DWASA had substantial water losses and poor service delivery until about 2008. Physical losses due
to leakage from pipes were over 50% and collection efficiency (percentage of water bills collected) was
just 62%. A Turnaround Program in 2009–2010 was supported by an ADB project. When completed in
2016, about 5.44 million people had continuous potable water supply from taps without requiring further
treatment, with pressure sufficient for two-story houses.
The turnaround was anchored in infrastructure investments and policy reforms combined with visionary
leadership, technical innovation, social inclusion (by supplying potable water to informal settlements),
and a strong focus on public education programs and civil society involvement. In 2018, overall non-
revenue water in Dhaka had fallen to 20%, with levels of less than 10% in established District Metering
Areas in project areas. Collection efficiency reached 97.5%, with continuous pressurised water supplied
to all customers.
Source: ADB (2016), Dhaka Water Supply Network Improvement Project. Manila; and DWASA. 2019. https://dwasa.org.bd/. ADB (2020)
Asia’s Journey to Prosperity: Policy, Market, and Technology Over 50 Years). http://dx.doi.org/10.22617/TCS190290.
4.1.2. Build capacity for economic regulation
Independent economic regulation, including improved operational performance and tariff reforms, can
support the transition towards sustainable financing strategies. Key features of well-defined independent
regulation are to separate functions and powers of policy from operations, and to incentivise greater
performance and accountability from local authorities, operators of water services and water users. Such
oversight could provide technical support to local authorities, strengthen the transition to full cost recovery
tariffs, and ensure consistency of tariffs across regions and communities (OECD, 2018c; 2015b).
Experience in England and Wales can inspire other countries where independent regulation is missing;
the economic regulator in England and Wales, Ofwat, is a non-ministerial government department,
accountable to Parliament rather than a minister. It makes independent decisions, guided by government
policy objectives, to ensure that the delivery of water supply and sanitation is efficient, the level of charges
fairly reflect and fund the quality of service delivered, and that there are equitable, transparent grievance
and remedy mechanisms that allow individuals to complain (OECD, 2018c).
While this model may remain a distant objective in most countries in Asia-Pacific region, other options can
be explored. Typically, independent regulation can be achieved by any one, or a combination of, the
following four models (OECD, 2015b):
Regulation by government. The public sector is responsible for the management of the water
services and owns the assets. Service provision is delegated to public water operators while
regulatory functions are carried out directly by the State at different levels: central, regional or
municipal. This is the model adopted in the Netherlands, and to a lesser extent, in Germany. The
challenge for this regulatory model is that one public body is regulating another.
Regulation by contract. The regulatory regimes are specified in legal instruments, and although
public authorities are responsible for regulation, water service delivery can be delegated to private
operators through contract agreements. These set the rights and obligations for each contracting

ENV/WKP(2021)3 39
Unclassified
entity, and service provision is awarded to private companies following public tender. This model
is used in France.
Regulation by one or multiple independent regulators, where independence has three dimensions:
independence of decision making, of management and of financing. This is the model used in the
United Kingdom, where the regulatory framework is organised around three dedicated agencies
with statutory functions relating to pricing and customer service (Ofwat), drinking water quality
(Department for Environment, Food and Rural Affairs), and environmental regulation and security
of water supply planning (UK Environment Agency).
Outsourcing regulatory functions to third parties. This model makes use of external contractors to
perform activities such as tariff reviews or benchmarking.
The chapter on governance in the Asia Water Development Outlook sheds some light on prevailing
arrangements in the Asia Pacific region. Arrangements at national level need to reflect the fact that in
developing countries – especially those with sizable informal sectors – governments and/or utilities may
currently oversee and provide water services in coexistence with informal (private) providers, as well as
with unregulated direct user access to e.g. surface water or groundwater sources. This makes economic
regulation more complex and will affect the appropriate combination of the 4 options listed above.
Where national regulators do exist, they may need to be strengthened. Water supply and sanitation utilities
will progressively need to finance larger portions of their investment through revenue collection. This will
require enhanced monitoring of operational efficiency, strengthened revenue-raising capacities and the
introduction of proper incentives. An important consideration will be how to include depreciation of existing
assets in the calculation of allowable tariff levels – an issue for many OECD countries (OECD 2020a).
4.1.3. Encourage connections, where central assets are available
A significant share of the population in the Asia-Pacific region does not have access to adequate, safe
water supply and sanitation services. Connection to central supply and water treatment systems, where
possible and sustainable, should be encouraged, possibly through regulation, for example with a direct
subsidy to households to cover (parts of) connection fees or by allowing one-time connection fees to be
paid in smaller increments over time. Increased connection rates provide multiple benefits, not only for
health, well-being and productive societies, but also as a source of new revenue for utilities and reduced
costs of water pollution.
Of course, in remote or sparsely populated areas, individual and other appropriate sanitation systems (IAS)
have comparative strengths. Discussions can be complex about the design of appropriate infrastructures
that reflect local conditions (geography and typography, density of settlements, sensitivity of receiving
environments, etc.; for a discussion in a European context, see OECD, 2020a).
IAS face limitations as well. Risks of inappropriate management of wastewater streams emerge, where
IAS are poorly designed and operated, leading to suboptimal service to the population and potential
harmful consequences on human and ecosystems health. The challenge is to ensure IAS contribute to
national water policy objectives, which requires proper monitoring of their performance. Lessons can be
learned to support the development of national strategies for IAS.

40 ENV/WKP(2021)3
Unclassified
Options to encourage connection to central water supply and sanitation services, where possible, include:
direct government subsidies for connection fees;
incorporating the cost of connection into the overall capital cost (and making it eligible for ODA,
where available);
increased monitoring, enforcement and issuance of financial penalties for mismanagement of
individual and other off-grid sanitation systems (noting that such policies require thorough
assessment and inclusive stakeholder engagement to avoid unduly penalising or marginalising
disadvantaged or vulnerable groups);
public education and awareness on the health and environmental impacts of absent or inadequate
water and sanitation services, and the consequences of inaction.
4.1.4. Strengthen capacity and monitoring to use available funds effectively
Financial disbursement and the capacity to use funds effectively play a critical role in allocating funding
when and where it creates most value. Many countries face difficulties in utilising all available funding, and
to invest available funds in an effective and efficient way. Half of the countries reporting on the absorption
of external and domestic funds in the latest GLAAS survey utilised less than 75% of official donor capital
commitments and/or domestic funds. These countries were China, India, Kyrgyzstan, Lao, Micronesia,
Nepal, Papua New Guinea, Solomon Island, Thailand, Uzbekistan, Vanuatu and Viet Nam (UN-Water and
WHO, 2019).
Delays in the disbursement and utilization of funding can affect the robustness of project selection and
implementation, or generate tensions with donors and ministries of finance, which may be tempted to
redirect available finance to sectors where funding can be used effectively. In such contexts, the capacity
to use funds effectively should be strengthened. Along with general capacity building and institutional
support, this could be done through developing a strong project pipeline and measures to ensure the
sustainability of investments. Other issues will need to be addressed, which go beyond the water sector
and the ambition of this report; for instance, political instability, constraints on service providers’ authority
or accountability for serving certain communities or populations, cumbersome public procurement
procedures, or labour shortages in the civil works and construction industries.
4.2. Minimise future investment needs
Options discussed in the previous section contribute to making the best use of existing assets and financial
resources. They also minimise investment needs in the future, for instance by postponing the need to
renew existing infrastructures. There will also be other opportunities to minimise future investment needs
through policies that sustainably manage water resources, through policy coherence, planning and setting
priorities, and by avoiding building future liabilities. Sequencing investments within a catchment can enable
the costs and benefits to be shared, innovative technological solutions can lower costs, and nature-based
solutions can be a cost-effective option with multiple benefits.

ENV/WKP(2021)3 41
Unclassified
The ensuing sections present policy insights and guidance on the following measures to minimise future
financing needs:
Develop plans to future-proof the water sector. This requires plans that set priorities and drive
decision-making, manage uncertainties and increase resilience;
Support plans with realistic financing strategies;
Encourage policy coherence across water policies and other policy domains;
Manage water demand, and strengthen water resource allocation;
Develop flood risk mitigation strategies;
Exploit innovation in line with adaptive capacities.
4.2.1. Develop climate-resilient plans to future-proof the water sector
To make the best use of existing assets and financial resources, many countries would benefit from
improved planning and priority setting. Developing national and local plans to future-proof the water sector
of Asia-Pacific countries requires plans that set priorities and drive decision-making, manage uncertainties
and increase resilience to future climate and socio-economic change.
Climate change poses new challenges for water-related investment: it requires flexibility in a domain
characterised by long-lived, capital-intensive infrastructure, and foresight where projections of future
rainfall variability and other climate conditions remain uncertain. Further, investments outside of the water
sector – such as urban design or the construction of physical assets in flood plains – influence the exposure
and vulnerability of people and assets to water risks. This is especially the case in contexts with informal
settlements and urbanising populations that include poor or vulnerable groups. These challenges call for
placing resilience at the core of water investment, financing and planning. Resilience metrics can support
the design of plans that adjust to shifting circumstances.
Investment planning should also factor in demographic trends. This includes, for example, the depopulation
of rural areas and smaller towns6 to avoid over-investment in oversized infrastructure that will be costly to
operate and maintain in the future, and conversely, increased demand triggered by urbanisation,
population growth and drought.
Effective planning and sustainable water security require undertaking cost-benefit analysis on sequences
(or portfolios) of projects and carefully consider how pursuing a specific project may foreclose future
options or inadvertently increase vulnerability to water risks. For example, investment in irrigation systems
usually reduces the adverse effects of rainfall variability on agriculture, but may also amplify the impacts
of drought by encouraging cultivation of water-intensive crops, which cannot be sustained under extreme
conditions (Damania et al., 2017). Setting priorities can also contribute to cost-effective flood protection.
Identified flood hazard areas should be reviewed to assess populations and areas at highest risk and to
prioritise investments accordingly.
Going beyond the compilation of individual projects, plans should consider how investments can be
sequenced over time to improve resilience. This requires a shift from cost benefit analysis at project level
to an assessment of the value created by investment pathways that combine and sequence a series of
investments.
Effective plans must be consistent with initiatives in other sectors. For instance, water management plans
should be accompanied by a viable strategy for irrigated agriculture in line with sustainable aquifer
management and water quality objectives. Urban planning, land use control and flood mitigation must also
be consistent. For example, Korea’s rapid urbanisation has led to the area of urbanised and paved areas
6 The rural population in Asia is projected to reduce by 16% by 2050 (UN DESA, 2018), which has implications for
current infrastructure development.

42 ENV/WKP(2021)3
Unclassified
doubling between 1989 and 2009. Over the same period the area of grasslands decreased by 24% and
wetlands by 61%. New factories and other developments are often constructed in flood risk areas,
compounding runoff problems rather than seeking a runoff-neutral or positive impact. At both a basin and
a local scale, these changes all increase flood risk (OECD, 2018c).
Water plans should embed clear objectives, with a detailed and costed strategy to achieve these objectives
and which demonstrate consideration for cost-efficient and socially inclusive measures. Countries should
consider three main issues when identifying sustainable financing strategies for the sector:
planning water supply and sanitation services, flood protection and irrigation expansion and
efficiency in line with overall national objectives;
identifying the costs of reaching national objectives beyond investments; and
designing a financing strategy based on a sound knowledge of financial flows, leveraging efficiency
gains and different sources of funding.
However, one barrier to analytical work and effective planning for the water sector is the lack of data and
patchy information on water expenditure, financial flows and financing needs in Asia-Pacific countries –
this needs to be addressed as a priority. The appropriate level of effort can only be known with accuracy
when member states compile robust knowledge on the state of the assets. Data is fundamental to
understanding where the risks are highest, what is driving these risks, and what investment and finance
approaches are required in order to mitigate these risks. Data is necessary to inform project preparation
and selection by governments, development finance institutions and other partners. More fine-grained
analyses can also support exploration of options to minimise financing needs and harness additional
sources of finance.
4.2.2. Support plans with realistic financing strategies
Plans and priorities should be accompanied by robust and realistic financing strategies. In reality,
governments’ reflections on optimal management models for water and sanitation services can only go
hand in hand with a reflection on financing options and a realistic financing strategy. It is crucial to
understand existing financial flows in the sector when designing a financing strategy. In particular, the
water supply and sanitation sector should seek to assess how much is currently allocated from all financing
sources (tariffs, taxes and transfers) and who is financing the sector. In this assessment, a critical question
for governments is whether public funds are being allocated in the most effective and equitable manner,
which is most often not the case. For example, public funds and subsidised tariffs often benefit high-income
households and those already connected, or are directed towards urban areas (rural areas often receive
less funding than urban areas).
When designing a financing strategy, the following should be considered:
allocating national funds in priority sub-sectors (i.e. rural settings, informal settlements in urban
and peri-urban areas, or for vulnerable groups, etc.), for which other sources of funds (e.g. from
users) are difficult to leverage;
identifying strategies to leverage and increase other financial contributions, particularly from users;
and
identifying mechanisms to increase public funds from national governments and external donors.
Financing strategies should clearly set priorities and drive investment decisions, and be developed in
cooperation with national and local authorities. They should include provisions for improved operation and
maintenance of water infrastructure, accounting for the backlog of under-investment in maintenance over
the past decades. Strategies should also include targeted social measures to address affordability
constraints and solidarity mechanisms to help cover investment costs in communities where financing
capacities are especially limited.

ENV/WKP(2021)3 43
Unclassified
Prioritising the use of public funds is not only a matter of equity, but also a matter of developing the right
incentives for service providers and delivering more value for money. Targeting subsidies to the right scale
and type of service can generate more value for money. For example, many governments tend to subsidise
sewers and associated wastewater treatment in urban areas while maintaining explicit policies not to
subsidise on-site sanitation in peri-urban or rural areas (Goksu et al. 2017). Bangladesh has used the 2005
Pro-Poor Strategy for Water and Sanitation to identify extremely disadvantaged households whose basic
minimum need for sanitation is unmet and to establish strategies to allocate resources to those households
(UN-Water and WHO, 2019).
The prioritisation of investments should systematically explore opportunities to combine funding to serve
multiple objectives (water supply, flood risk management, pollution abatement, improving ecological status,
etc.) to improve cost-effectiveness. Prioritisation should be considered in terms of policy objectives as well
as geographies. Priorities should reflect cost-benefit analyses and similar metrics.
4.2.3. Encourage policy coherence across water policies and other policy domains
Policy coherence can contribute to minimising future financing needs. Coherence between water supply,
sanitation and flood protection with agriculture policy and urban planning is a case in point, as it could
deliver a number of significant co-benefits. An assessment of policy alignment between sectors can reflect
how much water contributes to – and benefits from – broader economic development. It can also reflect
how investments in other sectors contribute to water; this is potentially the case for land use and urban
development; energy supply and climate change mitigation; and adaptation to climate change. In particular,
the way water is valued in society and the economy can drive investment decisions and motivate
willingness to pay by stakeholders who benefit from improved access to water supply and sanitation, flood
protection and water security.
Alignment is also required between finance sectors, for example between climate and water finance.
Climate finance will remain an important category of aid. National and multilateral institutions are beginning
recognise that all water-intensive investments should be assessed for the special risks associated with the
water cycle. The transition to converting water finance into water-climate finance is challenging and uneven
in application. The broader investment community has been even slower. However, in a time of rapid
climate change, investment instruments should be aligned to build climate change resilience (Matthews,
2019). The new Global Commission on Adaptation has addressed some of these issues with the following
finance recommendations (Smith et al. 2019):
Align “climate finance” and “water finance” by using complementary investment criteria to expand
the pool of finance available to accelerate mainstreaming of climate-resilient water management.
Evaluate how to reduce financial risks related to transboundary water cooperation at the project
development stage, given the potential for conflict as water regimes shift.
Expand access to insurance products to manage residual risks of water-related disaster losses,
and to broaden the pool of investors sharing shifting risks.
Treat climate change impacts on water availability, quality and risks as a critical factor in economic
analyses, as well as for social and environmental responsibility assessments, giving consideration
to the uncertainties of these impacts over both the financing term and the operational lifespan of
the investments.
Water efficiency is often an important consideration in finance and in economic evaluation, but
efficiency should more often be seen as one part of a larger suite of adaptation actions, and not all
forms of water efficiency result in robust and flexible adaptation. Moreover, efficiency can also
promote a net increase in water consumption or the loss of co-benefits that may derive from some
less efficient approaches to water management.

44 ENV/WKP(2021)3
Unclassified
4.2.4. Manage water demand, and strengthen water resource allocation
Increasingly, planning for water security (water shortages, floods and coastal erosion) needs to consider
resilience to external shocks. Exposure to climate change is growing. Changing patterns of water
resources, together with rising demand for water services in urban agglomerations and irrigation in rural
areas, are exerting pressure on service providers to diversify sources of water and to manage demand.
Illegal or uncontrolled abstractions - from households and farmers - compound the problem of water
demand management (see Carrard et al., 2019).
Water demand management can go a long way to minimising future needs to invest in supply
augmentation. Options may include tariff reform, abstraction charges and awareness raising campaigns to
reduce the need for costly supply augmentation. A water tariff structure can contribute to driving water use
efficiency, with a higher proportion of volumetric charges (and a lower proportion of fixed charges).
Abstraction charges in most countries are typically low or non-existent. However, freshwater abstraction
charges to all users can signal the value of water and limit the pressure on water resources, particularly
groundwater. Groundwater and surface water abstraction charges should be set in a manner coherent with
each other, to account for potential substitution effects. When water abstraction is metered, a volumetric
charge should be applied. If abstraction is unmetered, a flat abstraction charge or one based on a proxy,
such as area of irrigated land (preferably in conjunction with the type of crop), can be used as a more
rudimentary alternative in the interim (Ambec et al., 2016).
The price should reflect the trade-off between abstracting water now or in the future, particularly for non-
renewable groundwater resources (OECD, 2017a). The revenue raised could be earmarked to fund water
restoration activities. In addition, collection of water bills, particularly for unregistered abstractions and
dealing with illegal abstractions should be a priority in countries where this is an issue, to manage demand
and ensure sustainable water abstractions. Such interventions should consider how penalties for illegal
abstraction might affect certain populations’ access to and use of safe, sustainable water supply and
sanitation services (for example, for vulnerable populations or residents of hard-to-reach areas such as
remote regions and informal settlements).
Many countries which face severe financing challenges could benefit from well-designed water allocation
regimes. Water is frequently allocated to low-value agriculture uses, driving costly investments in supply
augmentation and depleting the resource. A reform of water allocation regimes would contribute to water
use efficiency, discourage wastage and low-value uses and secure water for the health of ecosystems
(OECD, 2017a; 2015c).
In Australia, inadequate water allocation regimes have led to costly reforms to buy back entitlements to
contribute to environmental flows and to allocate water towards higher value uses (e.g. Wheeler and
Grafton, 2018). Unsustainable water allocation regimes can also lead to costly investments in supply
augmentation via desalination.
Uncontrolled expansion of groundwater irrigation is not sustainable for many Asian countries. Cheap and
subsidised electricity has made groundwater pumping a feasible irrigation option for millions of farmers
across Asia (Shah, 2010). Although this has had positive implications for food security and poverty
reduction, it has also led to widespread groundwater depletion. The Indian subcontinent has some of the
highest levels of groundwater depletion in the world, with at least half of the subcontinent’s groundwater
being extracted faster than it is being replenished (Wada, 2014). Responding to Asia’s groundwater crisis
is key to ensure the sustainability of irrigation and agricultural production in the region. This will include,
among others, reducing perverse subsidies for groundwater pumping and developing institutional
incentives for sustainable and conjunctive use of surface and groundwater resources (AIIB, 2019). The
Box 4.2 below illustrates two strategies to reverse groundwater depletion, in India and Japan.

ENV/WKP(2021)3 45
Unclassified
Box 4.2. Strategies to reverse groundwater depletion: examples from India and Japan
In several states in India, integrated policies for electricity and groundwater allocation have shown
mutual benefits for the conservation of both resources. In a context where metered tariffs for electricity
were difficult to enforce because of strong opposition, transaction costs and corruption, the combination
of a bifurcated power supply system, flat tariffs and rationing appears to be a practical solution. The
scheme has created enhanced predictability in terms of quantity and quality of electricity access for
both farmers and non-farmers, resulting in a significant decline in the power consumed by the
agricultural sector and cost of related subsidies. At the same time, the scheme has resulted in
decreased groundwater consumption, allowing for depletion to slow down. Moreover, water well owners
have experienced declined risk in terms of pump maintenance costs and power shortages.
In response to declining groundwater levels, the city of Kumamoto, Japan have utilised a payment for
ecosystem services scheme to reverse the groundwater depletion. It also illustrates the importance of
policy coherence across agricultural, urban and water policies. Initially launched by the private sector
in partnership with farmers, the scheme later expanded to include local government. The integration of
the payment for ecosystem services scheme into the local government’s broader groundwater
management policies has allowed for a more sustained response as well as broader collaboration with
an increased number of stakeholders from the public and private sectors as well as civil society. The
stakeholders demonstrated a solid understanding of the availability of groundwater resources in the
area, the challenges associated with depletion and the possibility to augment supplies through
recharge. The programme has facilitated the restoration of groundwater levels and demonstrates how
such schemes can provide effective incentives for groundwater recharge while providing greater
security of supply for groundwater users.
Source: OECD, 2017a.
Water pricing, typically in the form of abstraction charges, is a key element of a well-designed water
allocation regime. Pricing can contribute to cost recovery, internalise negative externalities associated with
water abstractions, and send a price signal to users to discourage inefficient and low-value water uses.
Scarcity pricing could help to signal the scarcity value of the resource, but has proven difficult to implement
to date.
Public support for irrigation can induce a shift towards more water-intensive crops (Damania et al., 2017).
Whilst investments in irrigation can increase the productivity of land and reduce the impacts of climate
(particularly in areas of rain-fed agriculture, and therefore improve livelihoods, food security and nutrition),
the economic and political justifications for future irrigation investments depends on three key factors,
which should be carefully considered (Rozenberg and Fay, 2019):
Local water availability, which is dependent on demand and competition for limited freshwater
resources (e.g. for domestic, industry and energy use, and environmental flows), and increased
rainfall variability associated with climate change;
Competition and demand for suitable land for irrigation expansion; and
Global food markets and the ability to reliably import food from other regions with more reliable,
plentiful water resources.
A periodic “health check” of current allocation arrangements can help to assess the achievement of reforms
and areas for further improvement. The OECD “Health Check” for Water Resources Allocation can provide
useful guidance for such a review (see OECD 2017a; 2015c). It is a tool designed to review current
allocation arrangements to check whether the elements of a well-designed allocation regime are in place

46 ENV/WKP(2021)3
Unclassified
and to identify areas for potential improvement. In general, as the risk of shortage increases, the benefits
of a more elaborate allocation regime increases.
4.2.5. Develop flood risk mitigation strategies
In Asia, a number of mega-cities are located in coastal areas and are expected to face substantial growth
in potential losses as a share of city GDP as a result of population growth and economic development,
sea-level rise and subsidence (OECD, 2016a) (Figure 18).
Figure 4.2. One-in-100-year flood exposure in Asian mega-cities: 2005 and 2050
Source: OECD (2016a).
The probability of major flood events is projected to increase due to climate change-induced impacts on
river discharges, sea level rise and extreme weather events. At the same time, economic and population
growth – alongside other changes, such as rapid and sometimes uncontrolled urban development – are
increasing the risk exposure to, and the cost of damages from, flood events. As illustrated in section 2.2,
this means that more investments in flood risk prevention and protection will be required to maintain current
flood protection levels in the future.
There are two key areas of investment for flood risk management (OECD, 2016a):
Investments in lowering flood risk, and thus minimising the need for investments in flood protection
infrastructures; and
Provision of financial protection in case of flood events, thus compensating flood losses and
damages.
Strategies to lower flood risks include:
reducing exposure to flooding and minimising investment needs, through flood risk maps and land-
use planning (such as restricting areas to build, or designating water catchment areas in high risk
areas);
investing in structural protection, such as building and maintaining dams and dykes; and
investing in nature-based solutions, such as wetlands and sustainable drainage systems, which
can reduce flood risk and provide additional benefits for biodiversity, recreation, carbon
sequestration and water quality.

ENV/WKP(2021)3 47
Unclassified
Financial protection is required in case of flood events. This is typically provided through flood insurance
and disaster assistance. Awareness of the link between risk prevention and risk financing is important.
Flood events provide a window of opportunity for policy change and demand for government to invest in
managing flood risk. At the same time, governments should not wait for a major flood event or a crisis
before justifying action.
Flood protection strategies vary with wealth and location. Future investment costs depend on construction
costs and risk aversion (tolerance of risk and choice of protection level). To date, flood protection is largely
financed through public grants, aid or concessional finance. This can create significant costs for
governments in terms of both investments in risk reduction and emergency responses and reconstruction
(OECD, 2016a). This can be especially burdensome in times of growing public budget constraints. Given
the often limited budgets for flood protection and maintenance, cities will likely have to use a combination
of structural approaches and nature-based solutions, as well as residual risk communication and early-
warning systems. In rapidly urbanising countries, land-use management to prevent urban expansion in
new flood-prone areas is likely to be more cost-effective than hard protection.
Rapidly urbanising contexts and informal settlements represent a particularly complex policy challenge,
and require consideration of flood risk in tandem with other socio-economic conditions that can also affect
populations’ risk exposure. Land tenure policies have a critical role to play.
Countries should explore alternative sources of finance to leverage existing funding including (Koehler et
al., 2014):
Economic instruments, to provide a monetary/economic incentive promoting efficient flood risk
management and risk reduction; they can be either administered by the government or by private
entities. This includes natural resource pricing, taxes (e.g. property taxes in high-risk areas),
subsidies (e.g. tax reduction on land in safe areas), marketable permits, payments for ecosystem
services, licenses, property rights, habitat banking and trust funds; and
Risk financing instruments, comprising all instruments that promote the sharing and transfer of
risks and losses. These are pre-disaster arrangements coming into play in a post-disaster phase.
They include insurance, weather derivatives and catastrophe bonds.
In the context of an integrated flood risk mitigation strategy, both economic instruments and risk financing
instruments can contribute to reducing exposure to flood risks. Economic instruments can often raise new
revenues to be invested in flood protection and reduce pressure on public budgets. In addition, some
economic instruments can influence behaviour, further reducing exposure levels, for example, by providing
incentives for building and buying properties outside of at-risk areas.
Insurance schemes (including micro-insurance schemes), if properly designed, can steer behaviour
towards reduced exposure levels, serving as a risk-sharing and risk-communication instrument. For
example, mandatory insurance with premiums that reflect flood risk can be required for new buildings in
at-risk areas, making it less convenient to develop land in such areas. If risks are correctly priced in
premiums, insurance allows location in hazard-prone areas for those who are ready to bear the risk, without
increasing a burden on taxpayers (Filatova, 2014). Countries with higher levels of insurance penetration
face reduced negative impacts on economic output (OECD, 2016a).
4.2.6. Exploit innovation in line with adaptive capacities
Innovative technologies and management systems are being developed, which provide opportunities to
reduce investment needs in water supply and sanitation, flood protection and irrigation. Countries where
additional infrastructure is required (e.g. where the gap to compliance with SDG 6 targets is greatest) may
find greater opportunity to adopt alternative systems and techniques, and ultimately perform better with
less capital costs. Countries already equipped with infrastructure may face challenges to transition towards

48 ENV/WKP(2021)3
Unclassified
alternative systems; technical path-dependency and risks of stranded assets can limit the appetite for and
the feasibility of alternative systems, at least in the short term.
Water-related innovation is multifaceted (Leflaive, Krieble, Smythe, 2020):
In agriculture, innovation is associated with the development of water-efficient irrigation
technologies, the design of less water-intensive and more resilient crop cultivars, and the adoption
of practices that reduce nutrient flows back to water bodies.
In manufacturing, it deals with more water-efficient and cleaner production practices, appliances,
and more effective treatment techniques. Similar opportunities are associated with water supply
and sanitation.
There are opportunities to transition to a circular economy, for example, to reuse wastewater
(particularly in water scarce regions), to provide water quality fit-for-purpose (and therefore reduce
water treatment costs), and to convert biogas to energy at wastewater treatment plants. Where
economies of scale cannot be reached for large central water and sewerage networks,
decentralised infrastructure provides an alternative option.
Innovation applies to water storage management techniques, monitoring of river flows and pollution
loads, and the operation of infrastructure. Smart water technologies cut across these boundaries:
they allow the users to monitor, manage and act on data relating to the part of the water cycle that
is pertinent to their interests.
Advancements in data management, associated with optimisation of monitoring systems, can
lower costs of monitoring and demonstrating compliance with regulations, and operating water
service systems. Online and real time data will become more readily available for flows, pollutants
and quality of water at source and at the tap.
Nature-based solutions, such as restored or constructed wetlands, reclaimed floodplains and
sustainable urban drainage systems, can provide multiple benefits and often be less costly to
operate and maintain than their engineered alternatives (Box 4.3).
Innovation does not come in isolation; innovation delivers best when combined with financial and
governance measures, and when the interface between urban and rural environments is properly
addressed. For example, sustainable urban planning, water-sensitive urban design, innovative business
models and dedicated policies to drive innovation can all minimise future financing needs (Leflaive, Krieble,
Smythe, 2020).

ENV/WKP(2021)3 49
Unclassified
Box 4.3. The case for boosting investments in nature-based solutions
Nature-based solutions (NbS) involve the use of natural or semi-natural systems that utilise nature’s
ecosystem services in the management of water resources and associated risks. NbS are increasingly
part of the response to water-related risks. For example, conservation or expansion of floodplains can
increase water infiltration and reduce flooding risks to cities, while simultaneously supporting
agricultural production and wildlife, and providing recreational and tourism benefits. Likewise,
permeable pavements and the creation of green spaces can enable surface water to infiltrate the soil,
replenish aquifers, and reduce polluted stormwater runoff. The equivalent traditional engineered (‘grey’)
infrastructure solutions include dams, dykes, artificial groundwater recharge, and wastewater treatment
plants.
The multiple potential benefits of NbS should be factored into investment decisions. For instance,
countries could consider the introduction of stormwater taxes to property developers for impermeable
surfaces to raise revenue for flood protection measures and incentivise nature-based solutions, such
as sustainable urban drainage systems. France has experience with the introduction of a tax on
impervious surfaces to finance urban drainage. Restrictions on land development in flood plains,
including wetlands, could also be introduced. For example, Canada has a “no-net-loss” wetland policy,
meaning if a wetland is lost due to development, if must be off-set by investing in a wetland elsewhere.
In certain cases, it has been shown to be cost-effective for cities to combine investments in both NbS
and grey infrastructure (see table below). Apart from having a lower environmental impact, investments
in NbS are generally: less capital intensive; have lower operation, maintenance and replacement costs;
avoid lock-in associated with grey infrastructure; and appreciate in value over time with the regeneration
of nature and its associated ecosystem services (as opposed to the high depreciation associated with
grey infrastructure). NbS can also avoid or postpone the costs of building new, or extending existing,
grey infrastructure. They can therefore help communities stretch their infrastructure investments further
by providing multiple environmental, economic and social benefits.
Table 4.1. Hybrid water security strategies: combining NbS with grey infrastructure
Service Gray Infrastructure Components Examples of Green Infrastructure Components and
their function
Water supply and sanitation Reservoirs, treatment plants, pipe network Watersheds: Improve source water quality and thereby
reduce treatment requirements
Wetlands: Filter wastewater effluent and thereby
reduce wastewater treatment requirements
Hydropower Reservoirs and power plants Watersheds: Reduce sediment inflows and extend life
of reservoirs and power plants
Coastal flood protection Embankments, groynes, sluice gates Mangrove forests: Decrease wave energy and storm surges and thereby reduce drain and pump
requirements
Urban flood management Storm drains, pumps, outfalls Urban flood retention areas: Store stormwater and
thereby reduce drain and pump requirements
River flood management Embankments, sluice gates, pump stations River floodplains: Store flood waters and thereby
reduce embankment requirements
Agriculture irrigation and drainage Barrages/dams, irrigation and drainage
canals
Agricultural soils: Increase soil water storage capacity
and reduce irrigation requirements
Source: Browder, et al. (2019); OECD (2020b; 2016b; 2015a; 2015d).

50 ENV/WKP(2021)3
Unclassified
4.3. Harness additional sources of finance
Most Asia-Pacific countries would benefit from exploring options discussed in previous sections, to make
the best use of existing assets and financial resources, and to minimise future financing needs. These
options can contribute significantly to closing the financing gap, in particular in countries where this gap is
widest. Still, additional finance will be required to close the gap.
A diversity of financing approaches will be needed to respond to the diverse risk-return profiles of water-
related investments. Asia’s investment deficit in water supply and sanitation, flood protection and irrigation
infrastructure will require leveraging financial resources from all potential sources. Governments need to
increase contributions from domestic funds, in addition to seeking funding from external agencies.
Governments also need to put in place measures to increase user and beneficiary contributions, and to
attract private investment; making the transition from concessional financing to crowding in commercial
capital will be crucial.
The ensuing sections present policy insights and guidance on the following options to harness additional
sources of finance:
Ensure tariffs for water services reflect the costs of service provision
Consider new sources of finance from users and beneficiaries
Leverage funds to crowd-in commercial finance.
4.3.1. Ensure tariffs for water services reflect the costs of service provision
The discussion on tariffs usually focuses on tariff levels. Other dimensions of tariffs as policy and financing
instruments are also valuable: the tariff setting process, the tariff structure and the collection of water bills;
accompanying measures, to address social (affordability) issues matter as well. They are considered
below.
Tariff setting remains a highly complex and politically charged issue. If tariff levels are set too high, then
consumers may face affordability issues, reduce water use, or change their water access behaviours (e.g.
seek water from informal/private and potentially unsafe sources), leading to reduced revenues for the
service provider and possible public health implications. Conversely, if tariff levels are set too low then
tariffs do not cover the operational and/or capital costs leading to a reduction in the quality of services and
premature aging and replacement of costly infrastructure. These tariff challenges have a direct influence
on the credit-worthiness of a utility and water agencies (AIIB, 2019).
In a number of countries (such as Tajikistan, Armenia, Kazakhstan and others) there is room for manoeuvre
to increase water supply and sanitation tariffs, to better reflect the costs of service provision, without
adversely affecting affordability. Increases of water supply and sanitation tariffs can ensure adequate
funding for service providers and control water consumption.
In some countries (such as Mongolia, Viet Nam, the Philippines, Indonesia and Bangladesh) affordability
concerns may act as a constraint on tariff increases. However, instead of acting as a barrier to tariff
increases, affordability concerns can be (and are best) addressed outside of the water bill, through well-
designed and targeted social measures (Leflaive, Hjort, 2020). These may take the form of cross-subsidies
across water users or territories (from urban to rural areas). Aggregation of service providers or organising
authorities can facilitate such transfers. Another option is to introduce seasonal tariffs in touristic areas,
matching peak demand. Experience with sophisticated tariff structures, such as increasing block tariffs,
has been less successful. They require a lot of information, which may not be available, and can end up
being regressive, often benefitting higher income households that can afford water-efficient appliances and
to pay more for water services, while disadvantaging the poor or vulnerable groups that may reside in
crowded households (Leflaive, Hjort, 2020).
ENV/WKP(2021)3 51
Unclassified
Income from water bills should be ring-fenced and earmarked to finance expenditures directly related to
the service. At a minimum, it should cover operational and maintenance expenditure, and ideally (part of)
the capital to improve resilience and levels of service. Economic regulation (see section 4.1) should ensure
that the utilities are funded to deliver efficiently the breadth of its services to the required standard. For
example, governments need to authorise service providers to collect bills and give them the autonomy to
restrict service to non-paying customers (without breaching the human right to water). Such reforms in the
early 2000s greatly improved the performance of service providers across Viet Nam, including in the city
of Da Nang.
Box 4.4. Cost-Recovery Policy Catalyses Utility Turnaround in Viet Nam
At the start of the 21st century, service providers in Viet Nam, as state-owned enterprises, received
financial support from the government that inadvertently promoted inefficiencies. DAWACO, one such
state-owned enterprise serving the city of Da Nang (population 1 million), struggled with high levels of
non-revenue water and was providing service to only half of the population. In 2005, the government
started a reform process to commercialise the water sector and eliminated operating subsidies to state-
owned enterprises. A government decree required full cost recovery to be achieved by 2015, and
allowed service providers to propose tariff adjustments to cover costs.
These changes required a reform of DAWACO’s operating plans and policies, and to raise its own
private capital. The plan was supported by the ADB and a EUR 1.9 million grant for a Utility Support
Partnership with Dutch firm Vitens Evides International. Vitens Evides International provided technical
and operational training to DAWACO employees to increase managerial efficiency, lower operating
costs and expand services, especially to the urban poor.
Today, DAWACO is a joint stock company with a mix of employee, government and private ownership.
Between 2005 and 2014, the company more than tripled its connections (14,000 of which were to the
urban poor), reduced non-revenue water to 17%, and lowered energy costs by 23%. DAWACO’s
strategy is now detailed in a business plan and a Water Master Plan, both conducted every three years.
Success factors included DAWACO staff ownership of the turnaround process and cultural prioritisation
of continuous learning and improvement.
Source: AIIB (2019); World Bank (2017).
The primary driver of future investment costs for irrigation is the extent of public support. Charges for
irrigation water are commonly absent, despite the negative externalities (e.g. over-abstraction and water
pollution) and opportunity costs often associated with irrigation. Subsidies for capital costs from
government agencies or basin authorities are common even in high-income countries, such as Australia
and New Zealand. In many LMICs, including China, India and Pakistan, all capital costs and part of O&M
costs are subsidised by state agencies and water user organisations (Toan, 2016). Countries should
transition to greater user contributions towards the cost of irrigation infrastructure and the value of water in
order to generate revenue and incentivise water efficiency.
4.3.2. Consider new sources of finance from users and beneficiaries
For other infrastructure that does not easily generate cash flows (e.g. flood protection and irrigation), other
sources will be needed to ensure that enough funds are allocated for operation, maintenance and
replacement costs. Other sources may include self-financing from water users (e.g. decentralised
management of local infrastructure to community user groups), various taxes (e.g. land, pollution) and
property developers (e.g. through innovative land value capture techniques) (AIIB, 2019).
52 ENV/WKP(2021)3
Unclassified
The potential of taxes and surcharges to increase public funds allocated to the water sector remains
generally underexplored. Most countries would benefit from considering new economic instruments to raise
additional revenue for water management and internalise pressures on water bodies (that result from
abstraction or pollution). Better reflecting the value of water can act as a driver for improved water
management and stimulate further investment. Converting the benefits of investments into revenue
streams can increase the risk-return profile of investments to attract financiers.
This may include the introduction of fertiliser and pesticide taxes to reflect the costs of water pollution (and
reduce drinking water treatment costs), stormwater taxes on property developers for impermeable surfaces
that increase the risk of urban flooding, and payment for ecosystem services from utilities to farmers in
exchange for the protection of catchments and drinking water sources. Stormwater taxes on property
developers can raise revenue for flood protection measures and incentivise nature-based solutions, such
as sustainable urban drainage systems. Other economic instruments are discussed in section 4.2. Box 4.5
describes the successful example of a land value capture instrument to raise revenue for water
infrastructure in Casablanca, Morocco.
Revenue collected by way of such economic instruments could be earmarked for water and sanitation or
flood protection, feeding into a dedicated water fund, or used by the relevant utility or authority. As with
any taxation system, the setting up of environmental taxes requires not only legislation, but also the
processes, human resources and finances to enforce them effectively.
Countries could also exploit synergies and combined investment opportunities with other sectors (e.g.
urban development, food security, energy security, tourism) that reduce water-related risks (see
section 4.2).

ENV/WKP(2021)3 53
Unclassified
Box 4.5. Land value capture: a suite of tools to finance water-related investments. Experience from Casablanca, Morocco
According to the “beneficiary pays” principle, expressed in the Vancouver Declaration during Habitat I
(UN, 1976), the beneficiaries of public investments that valorise their land should partly cover such
costs or return their benefit to the public. The means by which beneficiaries can pay back include taxes,
such as land taxes and betterment charges; development charges or permit fees; pricing and
compensation policies; adequate assessment of land values; and leasing publicly owned land (UN,
1976).
Land value capture techniques can foster local urban development. Because public investments and
planning decisions on urban development concern land in a very specific, localised manner, land value
capture tools are a matter for local governments. Local governments may influence the direction of
these projects to ensure the alignment with urban development and spatial planning goals.
Land value capture tools can fund a wide range of urban development projects. Even though they are
not associated with any particular type of investment, some projects could particularly benefit from the
adoption of such tools, such as urban renewal projects and Transit Oriented Development (TOD)
projects, given the great potential to trigger land valorisation.
Experience in water-related projects is limited so far. Casablanca, Morocco, paved the way. Casablanca
is characterised by rapid urbanisation; its population is expected to grow from 3.5 million to 5 million
inhabitants by 2030. Extending the water network, securing access to the resource and protecting it
against frequent floods are serious concerns for the local authority, which needs to finance these
projects.
The city defined a new investment programme in 2007. Revenues from user tariffs cover operational
and maintenance costs and the renewal of existing assets (accounting for 70% of total cost over the
last decade). A dedicated account (fonds de travaux) covers the remaining costs (essentially land
acquisition, network extension and social connections). Financed mainly by contributions from property
developers, it has financed a growing share of total investment, from 7% in 2004 to 54% in 2014.
Property developers also cover the costs of connecting to the network and in-house equipment. Their
contribution varies depending on the type of housing (social housing, villas, hotels and industrial zones),
and they pay additional costs for developments that do not feature in the master plan. Contributions are
waived when the developments take place in underprivileged neighbourhoods and slums.
Source: OECD (2019c); OECD (2015a).
4.3.3. Leverage funds to crowd-in commercial finance
Blended finance can play a critical role in mobilising commercial finance as well as strengthening the
financing systems upon which water–related investments rely (Box 4.6). Domestic commercial finance is
available across Asia-Pacific countries. However, to date few countries have gained experience in
mobilising it for water-related expenditures. A few transactions have been supported by international
donors, but these have mostly been in middle-income countries, and they have so far failed to be replicated
at scale (AIIB, 2019).
There is room of manoeuvre to attract commercial capital for creditworthy borrowers to finance water-
related investments. This may require exploring how public budgets, including cohesion policy funds, and
risk-mitigation instruments (e.g. guarantees, credit enhancement instruments) can be used strategically to
improve the risk-return profile of investments that can attract commercial finance.

54 ENV/WKP(2021)3
Unclassified
Box 4.6. Blended finance, defined
The OECD defines blended finance as the strategic use of development finance (such as ODA and
funds provided by philanthropic foundations) for the mobilisation of additional commercial finance
towards sustainable development in developing countries. Blended finance is not an asset class, rather
it uses a range of instruments to calibrate the risk-return profile of projects and to address other barriers
to private investment.
Blended approaches have a dual aim to: i) mobilise additional capital for investments, and ii) serve a
market building role, to help strengthen the financing systems upon which investments rely through
greater accountability.
Commercial investors, whether banks, investors, businesses or project developers, respond to, and are
constrained by, returns and risks associated with investments. As a result, investments with important
public good dimensions may be backed by a sound business case but cannot necessarily be financed
by commercial investors due to high risks associated with projects or uncertainty related to returns. In
these cases, public support can be used strategically through blended finance to improve the ‘risk-
return’ profile of investments, effectively de-risking investments to borrowers to access commercial
finance.
Figure 4.3. Blended finance instruments and mechanisms
Note: PPP = Public-Private Partnership.
Source: OECD (2019a; 2018d; 2017d).
A range of instruments are being used for blending, going beyond the more traditional loans and grants,
to the use of guarantees, securitisation, currency hedging and political risk insurance. In this context,
greater diversification of instruments could support better targeting of different risks and result in more
commercial resources being targeted towards sustainable development outcomes. For instance,
guarantees can cover loans from bank and other investors against risks of war and civil disturbance,
expropriation, breach of contract, transfer restriction and inconvertibility. Amongst the different models,
collective vehicles, such as funds, bring investors together to pool financing and offer opportunities for
scaling up blended finance. In particular, structured funds allow donor governments to use concessional

ENV/WKP(2021)3 55
Unclassified
finance in a first loss position to provide a risk cushion for commercial investors. Blending can also occur
through equity or debt investments in projects and companies in developing countries.
Beyond guarantees, technical assistance at the transaction level plays a major role in water and sanitation.
Technical assistance can have different entry points in blended finance transactions, including for project
development, investees such as utilities, or financiers such as banks to set up new lending programmes
for the water and sanitation sector. Technical assistance has a particularly crucial role to play in tailoring
existing blended finance structures to local contexts.
Examples of the use of blended finance range from facilitating access to microfinance for households to
invest in water supply and sanitation in Bangladesh (see Box 4.7 below), to the set-up of a revolving fund
for providers in the Philippines (World Bank, 2016).
Box 4.7. Blended Finance to Reduce Rural Sanitation Costs in Bangladesh
Rural populations worldwide generally invest their own financial resources to purchase or build latrines
or toilets. But the costs can be prohibitive, especially for poorer households or where there is a lack of
competition between providers.
This is the case in rural Bangladesh, where despite high demand for sanitation facilities, households
cannot afford to purchase them without paying in instalments. To address the issue, the country has
embarked on a project to blend output-based aid and microfinance loans to lower the cost of a latrine
and spread repayment out in weekly instalments over one year. The subsidy consists of about $15 per
household and will reduce the weekly payment by 11%. A second benefit of the subsidy is that it reduces
the risk of the microfinance institutions in their lending.
On the supply side, the financiers are also extending loans to microbusinesses that sell latrines and
latrine construction. This work is augmented by World Bank technical assistance grants to train
entrepreneurs for construction and help the financiers identify and reach poor households. The blending
is expected to leverage USD 22 million in household contributions.
Source: World Bank (2017).
Green bonds have a significant revenue-raising capacity, and offer the opportunity to inject substantial
private investment into the water sector. An example of green bonds used to finance nature-based
solutions for flood protection in the Netherlands is described in below. In 2016, China launched its own
domestic green and climate bond market, which is now the second largest globally. Japan and Korea are
also large issuers of green bonds, and expansion of the market is spreading to South Asia (CBI, 2019;
Matthews, 2019). Countries have become increasingly active in promoting green finance with national
policy packages and localised initiatives. For example, China, Viet Nam, Indonesia and Bangladesh have
all adopted their own green finance definitions and introduced sustainable guidelines and regulations
(Volz, 2018).

56 ENV/WKP(2021)3
Unclassified
Box 4.8. Green bonds: financing nature-based solutions for flood protection in the Netherlands
Innovative financing models such as green bonds are increasingly explored to attract additional finance.
‘Green bonds’ is the term that is often applied to environmentally related impact investing. Typical
investors in green bonds are large institutional investors such as pension funds, which are interested in
long-term, steady returns, and seek “green” credentials for their investments – typically low-impact
infrastructure projects and/or climate mitigation and adaptation projects (Matthews, 2019). Repayment
of the bonds can come either from public funding or from private funding, in the form of private
organisations created to share benefits among members/funders.
In May 2019, the Government of the Netherlands issued a certified climate bond for EUR 5.98 bn to
finance projects addressing current and future climate change impacts and an advanced low carbon
economy. This is the largest certified green bond to date and the first certified nature-based solution.
Much of the bond focuses on using coastal and river ecosystems as a safeguard for negative climate
change impacts such as high flood risk, further supporting the Netherlands’s “room for river” flood
management approach.
The issuance came from the Dutch State Treasury Agency and was certified by Climate Bonds Initiative
(CBI)1. The bond raised capital for water and flood defence infrastructure projects, as well as renewable
energy facilities and low-carbon transportation systems. Projects being financed by the bond include
traditional engineered “grey” water infrastructure as well as nature-based solutions, all of which are
certified under the Water Infrastructure Criteria of the Climate Bonds Standard by CBI.
The Dutch bond offering has demonstrated a robust market for certified climate bonds. Within 90
minutes of the bond’s issuance, investors had placed over EUR 21.2 bn worth of orders for the EUR
5.98 bn of certificates, making the bond oversubscribed by over three times. Investor interest, combined
with the need to raise funds for climate resilience projects, means that more certified climate bonds are
on the horizon.
Note: 1. The Climate Bonds Initiative (CBI) is an investor-focused not-for-profit, launched to increase investments contributing to the
transition to a low-carbon and climate resilient economy. CBI have created a set of principles, verification standards, and sectoral criteria to
ensure that investors can trust the climate promises made by issuers, and that the projects being financed have thoroughly accounted for
climate risks.
Source: Matthews (2019).
Innovative green finance initiatives have been recently launched in Asia to bridge the finance gap,
especially in high priority infrastructure subsectors, such as water supply and sanitation, which traditionally
lack investment diversification. Among these is the ADB’s pioneering Green Finance Catalyzing Facility
(see Box 4.9 below).

ENV/WKP(2021)3 57
Unclassified
Box 4.9. The ADB Green Finance Catalyzing Facility
The Green Finance Catalyzing Facility (GFCF) was designed by the ADB as a tool to create localised
green finance solutions and vehicles to drive green growth leveraging public-private sectoral funds. The
GFCF explicitly leverages catalytic funds through mixed finance including public funds from
development partners, central and local governments, as well as private, institutional and commercial
(PIC) finance. The GFCF is founded on the two main pillars of financial bankability and environmental
sustainability. It focuses on proactively generating a bankable green project pipeline to attract PIC
finance at the project level, rather than raising finance based on the financial strength of the project
sponsors. Water-related initiatives eligible under the facility include: (i) water and sanitation to decrease
the pollution of natural water bodies; (ii) climate change and disaster resilience; and (iii) land use with
the aim of protecting the natural environment and biodiversity. This approach is being piloted in PRC
through the Shandong Green Development Fund Project (see https://www.adb.org/projects/51194-
001/main).
Another facility with similar characteristics – the ASEAN Catalytic Green Finance Facility – was recently
launched (April 2019) to catalyse private capital by mitigating risks through blended instruments. The
facility will mobilise USD 1 billion, pooling funds from different actors, including the ADB. The ACGF
explicitly aims to derisk projects by using a two-step loan and other supports designed to enhance
bankability and hence catalyze in commercial and private capital thus multiplying the impact of the
public funds. The fact that ACGF has attracted 13 partners already shows the value of such derisking
facilities in the world of blending and catalysing finance to sectors such as water and sanitation.
Source: Cardascia (2019); for more information see https://www.adb.org/publications/green-finance-catalyzing-facility.
The success of blended finance is dependent on the ability to mobilise local commercial investment.
Blended finance for water-related investments reinforces the need for, and benefits from, tailoring blended
finance to the local context. Water and sanitation services are, by definition, locally sourced and provided,
and flood risks and irrigation are best managed at the basin scale. At the same time, the sector requires
strong public regulation due to the public good dimension of water and sanitation services and the common
pool nature of water resources. These characteristics emphasise the need to work closely with local actors
and align with local development needs.
Pooling projects could be an effective way forward to address selected unfavourable project attributes.
Providing commercial investors with access to a variety of different transactions in the water and sanitation
sector can mitigate concerns around small ticket size, risk exposure, limited sector or regional knowledge,
as well as high transaction costs. Pooling mechanisms such as blended finance funds tailor different risk
and return profiles for individual investors, with development financiers often taking first loss and junior
tranches buffering the risk for commercial investors in the senior tranches. Guarantees, moreover, can
strategically mitigate portfolio risk.

58 ENV/WKP(2021)3
Unclassified
Policy recommendations that aim to facilitate an uptake of blended solutions for sustainable development
in the water sector include (OECD, 2019a):
Design blended finance in conjunction with efforts to improve the enabling environment. Blended
finance cannot compensate for an unfavourable enabling environment, but rather needs to be
accompanied by efforts to promote a stable and conducive policy environment. A weak enabling
environment characterised by poorly designed or absent regulation, policy settings (e.g. water
prices and tariffs) or institutional arrangements, compounded by political interference in the
management of (often public) utilities, constrains commercial investment.
Increase transparency to make a valid business case for commercial investment. Commercial
investors are cautious about uncertainty regarding any of the risks related to an investment
opportunity. With adequate contractual arrangements or blended instruments and mechanisms, it
is possible to mitigate a variety of risks, share the remainder with the public sector or commercial
co-investors, or take a certain level of risk on the financier’s own book. However, in order to make
such an assessment, risks associated with an investment should be transparent and quantifiable.
Establish policy-level co-ordination and co-operation processes for blended finance. An excessive
reliance on concessional finance can inadvertently crowd out commercial finance, creating market
distortions that impede greater accountability and financial sustainability of the sector. Co-
ordination and co-operation among development finance actors on their blended finance
engagements is a key for the market building aspect of blended finance, particularly when a
concessional element is involved. Development financiers should co-ordinate more structurally
beyond single transactions. While there is general agreement about the need for improved
cooperation, actions on the ground may remain fragmented.
Challenges related to blending include the need for a good enabling investment environment, ensuring
that development finance does not crowd out private finance and that the desired development outcomes
are realised. Blended finance, starting with concessional elements, should phase out over time and
ultimately exit in order to prevent market distortion. An analysis of the exit strategy should be integrated in
any programme design (OECD, 2019a).

ENV/WKP(2021)3 59
Unclassified
For the first time, the Asia Water Development Outlook explores the financing challenges and options
countries in the Asia Pacific region face when it comes to water security. As mentioned above, data
limitations are significant and affect the capacity to track existing financing flows (how much is being spent
and by whom) and project future needs. In turn, data limitations hinder regional comparison, assessment
and discussion of the robustness of existing financing strategies and mechanisms, and the relevance of
alternative approaches.
This is a missed opportunity, because the region – building on its sheer diversity - has a lot to offer and
gain from sharing experience, deciphering what works and what could be replicated and scaled. It has the
capacity to inspire robust financing strategies and appropriate financing mechanisms, in other countries.
Financing water security will remain a multifaceted and major issue for countries in the Asia Pacific region.
While we hope it provides a valuable contribution, this AWDO could only scratch the surface of the
challenges and the opportunities available to national and local authorities and their partners. More work
is required to build robust sets of policy-relevant data. Regional cooperation can contribute to a knowledge
base that can inspire policy and institutional reforms that are conducive to enhanced water security at the
least cost for the communities in Asia and the Pacific and beyond.
5 Concluding remarks

60 ENV/WKP(2021)3
Unclassified
References
Ambec, S. et al. (2016), “Review of international best practices for charges for water management”,
Toulouse School of Economics, Background paper for OECD, 10 October 2016.
ADB (2020) Asia’s Journey to Prosperity: Policy, Market, and Technology Over 50 Years).
http://dx.doi.org/10.22617/TCS190290.
ADB (2017), Financing Asian Irrigation: Choices before us. Asian Development Bank, Manila.
ADB (2016), Dhaka Water Supply Network Improvement Project. Manila; and DWASA. 2019.
https://dwasa.org.bd/.
AIIB (2019), Asian Infrastructure Investment Bank Water Strategy: Water Sector Analysis, October 2019.
Browder G., et al. (2019), Integrating Green and Gray: Creating Next Generation Infrastructure, World
Bank and World Resources Institute, Washington, DC.
https://openknowledge.worldbank.org/handle/10986/31430.
Cardascia, S. (2019), Financing Water Infrastructure and Landscape Approaches in Asia and the Pacific,
Background paper provided for the OECD Roundtable on Financing Water 5th meeting, 26-27
November 2019, ADB HQ Manila.
https://www.oecd.org/water/Session4.Financing_Water_Infrastructure_and_Landscape_Approaches_
in_Asia_and_the_Pacific%20.pdf.
Carrard N., Foster T., Willetts J. (2019), Groundwater as a Source of Drinking Water in Southeast Asia
and the Pacific: A Multi-Country Review of Current Reliance and Resource Concerns, Water, 11(8),
1605; https://doi.org/10.3390/w11081605
Damania, R. et al. (2017), Uncharted Waters : The New Economics of Water Scarcity and Variability,
World Bank, Washington, DC, https://openknowledge.worldbank.org/handle/10986/28096.
Filatova T. (2014), Market-based instruments for flood risk management: A review of theory, practice and
perspectives for climate adaptation policy, Environmental Science and Policy 37, pp 227 -242.
Goksu, A., Trémolet, S., Kolker, J. and B. Kingdom (2017), Easing the Transition to Commercial Finance
for Sustainable Water and Sanitation, World Bank, Washington, DC.
GWI (2019), The Global Water Tariff Survey, Global Water Intelligence
https://www.globalwaterintel.com/global-water-tariff-survey.
JMP (2019), Progress on household drinking water, sanitation and hygiene, 2000-17, Special focus on
inequalities, https://www.washdata.org/sites/default/files/documents/reports/2019-07/jmp-2019-wash-
households.pdf.
JMP (2017), Progress on household drinking water, sanitation and hygiene,
https://www.who.int/mediacentre/news/releases/2017/launch-version-report-jmp-water-sanitation-
hygiene.pdf.
Koehler M. et al. (2014), Review of economic instruments in risk reduction. ENHANCE (Enhancing Risk
Management Partnerships for Catastrophic Natural Disasters in Europe) Research project,
Deliverable 5.1, April 2014.

ENV/WKP(2021)3 61
Unclassified
Larsson, D. (2014), Pollution from drug manufacturing: review and perspectives, Philosophical
transactions of the Royal Society of London. Series B, Biological sciences, Vol. 369/1656,
http://dx.doi.org/10.1098/rstb.2013.0571.
Leflaive, X. and M. Hjort (2020), "Addressing the social consequences of tariffs for water supply and
sanitation", OECD Environment Working Papers, No. 166, OECD Publishing, Paris,
https://doi.org/10.1787/afede7d6-en.
Leflaive, X., B. Krieble and H. Smythe (2020), "Trends in water-related technological innovation: Insights
from patent data", OECD Environment Working Papers, No. 161, OECD Publishing, Paris,
https://doi.org/10.1787/821c01f2-en.
Matthews, J.H. (2019), New financing modalities for climate adaptation: Towards Resilient Finance,
Background paper provided for the OECD Roundtable on Financing Water 5th meeting, 26-27
November 2019, ADB HQ Manila.
https://www.oecd.org/water/Session3a.New_financing_modalities_for_limate_adaptation.pdf.
Meier, J., Zabel, F. and W. Mauser (2018), A global approach to estimate irrigated areas–a comparison
between different data and statistics, Hydrology and Earth System Sciences, 22(2), pp.1119-1133.
Money (2017), Project, Investors, Risks and Returns, Background paper for the 2nd meeting of the
Roundtable on Financing Water.
OECD (2020a), Financing Water Supply, Sanitation and Flood Protection: Challenges in EU Member
States and Policy Options, OECD Studies on Water, OECD Publishing, Paris,
https://doi.org/10.1787/6893cdac-en.
OECD (2020b), "Nature-based solutions for adapting to water-related climate risks", OECD Environment
Policy Papers, No. 21, OECD Publishing, Paris, https://doi.org/10.1787/2257873d-en.
OECD (2019a), Making Blended Finance Work for Water and Sanitation: Unlocking Commercial Finance
for SDG 6, OECD Studies on Water, OECD Publishing, Paris, https://doi.org/10.1787/5efc8950-en.
OECD (2019b), OECD Creditor Reporting System
https://stats.oecd.org/Index.aspx?DataSetCode=CRS1.
OECD (2019c), Land Value Capture: Framework and Instruments, unpublished paper.
OECD (2018a), Financing Water: Investing in sustainable growth, OECD Environment Policy Paper No.
11 http://www.oecd.org/water/Policy-Paper-Financing-Water-Investing-in-Sustainable-Growth.pdf.
OECD (2018b), Making Blended Finance Work for the Sustainable Development Goals, OECD
Publishing, Paris, http://dx.doi.org/10.1787/9789264288768-en.
OECD (2018c), Managing the Water-Energy-Land-Food Nexus in Korea: Policies and Governance
Options, OECD Studies on Water, OECD Publishing, Paris. https://doi.org/10.1787/9789264306523-
en.
OECD (2018d), Making Blended Finance Work for the Sustainable Development Goals, OECD
Publishing, Paris, https://dx.doi.org/10.1787/9789264288768-en.
OECD (2017a), Groundwater Allocation: Managing Growing Pressures on Quantity and Quality, OECD
Studies on Water, OECD Publishing, Paris. http://dx.doi.org/10.1787/9789264281554-en.
OECD (2017b), OECD Economic Outlook, Volume 2017 Issue 2, OECD Publishing, Paris.
http://dx.doi.org/10.1787/eco_outlook-v2017-2-en.
OECD (2017c), “Financing water and sanitation in developing countries: key trends and figures”, OECD
Publishing, Paris.
OECD (2017d), OECD DAC Blended Finance Principles for Unlocking Commercial Finance for the
Sustainable Development Goals, https://www.oecd.org/dac/financing-
sustainabledevelopment/development-finance-topics/OECD-Blended-Finance-Principles.pdf.
OECD (2016a), Financial Management of Flood Risk, OECD Publishing, Paris.
62 ENV/WKP(2021)3
Unclassified
http://dx.doi.org/10.1787/9789264257689-en.
OECD (2016b), Water, Growth and Finance: Policy Perspectives.
https://www.oecd.org/environment/resources/Water-Growth-and-Finance-policy-perspectives.pdf.
OECD (2015a), Water and Cities: Ensuring Sustainable Futures, OECD Studies onWater, OECD
Publishing, Paris. http://dx.doi.org/10.1787/9789264230149-en.
OECD (2015b), The Governance of Water Regulators, OECD Studies on Water, OECD Publishing,
Paris. http://dx.doi.org/10.1787/9789264231092-en.
OECD (2015c), Water Resources Allocation: Sharing Risks and Opportunities, OECD Studies on Water,
OECD Publishing, Paris. http://dx.doi.org/10.1787/9789264229631-en.
OECD (2015d), Policy Perspectives: Water and Innovation for Green Growth.
https://issuu.com/oecd.publishing/docs/water_and_innovation_for_green_grow.
OECD (2015e), Infrastructure Financing Instruments and Incentives..
http://www.oecd.org/finance/private-pensions/Infrastructure-Financing-Instruments-and-Incentives.pdf
OECD (2011), Benefits of Investing in Water and Sanitation: An OECD Perspective, OECD Studies on
Water, OECD Publishing, Paris, https://doi.org/10.1787/9789264100817-en.
OECD (2010), Innovative Financing Mechanisms for the Water Sector, OECD Studies on Water, OECD
Publishing, Paris, https://doi.org/10.1787/22245081.
Park, N. et al. (2018), Prioritization of highly exposable pharmaceuticals via a suspect/nontarget
screening approach: A case study for Yeongsan River, Korea, Science of the Total Environment, Vol.
639, pp. 570-579, http://dx.doi.org/10.1016/j.scitotenv.2018.05.081.
Rasul, G. (2016), Managing the food, water, and energy nexus for achieving the Sustainable
Development Goals in South Asia, Environmental Development, 18, pp.14-25.
Rosegrant, M.W. et al. (2017), Quantitative Foresight Modeling to Inform the CGIAR Research Portfolio,
Project Report, International Food Policy Research Institute (IFPRI), Washington DC, USA.
Rozenberg, J and M. Fay (2019), Beyond the Gap: How Countries Can Afford the Infrastructure They
Need while Protecting the Planet. Sustainable Infrastructure, World Bank, Washington, DC.
https://openknowledge.worldbank.org/handle/10986/31291.
Shah, T. (2010), Taming the anarchy: Groundwater governance in South Asia. Routledge.
Smith, D.M. et al. (2019), Adaptation’s thirst: Accelerating the convergence of water and climate action.
Background Paper prepared for the 2019 report of the Global Commission on Adaptation, Rotterdam,
The Netherlands, and Washington, DC.
Toan, T. D. (2016), “Water Pricing Policy and Subsidies to Irrigation: A Review.” Environmental
Processes 3 (4): 1081–98.
Trémolet S., Mansour G. and G. Muruka (2015), Microfinance for sanitation: What is needed to move to
scale? Waterlines 34(3): 227.
UN (2017), Report of the Special Rapporteur on the Human Rights to safe drinking water and sanitation,
United Nations General Assembly Human Rights Council (September 2017).
UN DESA (2018), World Urbanization Prospects: the 2018 Revision. New York United Nations
Department of Economic & Social Affairs.
UN DESA (2017), World population prospects, the 2017 Revision, Key findings. New York United
Nations Department of Economic & Social Affairs.
UNEP (2015), Aligning the Financial Systems in the Asia Pacific Region to Sustainable Development.
UNEP Inquiry: Design of a Sustainable Financial System. Geneva.
UN Water and WHO (2019), National systems to support drinking-water, sanitation and hygiene: Global
status report 2019. UN-Water global analysis and assessment of sanitation and drinking- water
(GLAAS) 2019 report. World Health Organization, Geneva.

ENV/WKP(2021)3 63
Unclassified
UN Water and WHO (2017), Financing universal water, sanitation and hygiene under the Sustainable
Development Goals. UN-Water Global Analysis and Assessment of Sanitation and Drinking-Water
(GLAAS) 2017 report. World Health Organization, Geneva.
Volz, U. (2018), Fostering Green Finance for Sustainable Development in Asia. ADBI Working Paper
814. Tokyo: Asian Development Bank Institute. https://www.adb.org/publications/fostering-green-
finance-sustainable-development-asia.
Wada, Y. and M.F. Bierkens (2014), Sustainability of global water use: past reconstruction and future
projections. Environmental Research Letters, 9(10), p.104003.
Wheeler, S. and R. Grafton (2018), Economics of water recovery in the Murray-Darling Basin, Australia,
Annual Review of Resource Economics, 2018; 10(1):487-510.
Wiener, J. (1998), “Managing the Iatrogenic Risks of Risk Management.” Risk 9 (1): 39–82.
World Bank (2019), Fiscal Space Database, https://www.worldbank.org/en/research/brief/fiscal-space.
World Bank (2019b), World Development Indicators, http://datatopics.worldbank.org/world-development-
indicators/.
World Bank (2019c), Debt Sustainability database, https://www.worldbank.org/en/topic/debt-
sustainability.
World Bank (2017), Easing the Transition to Commercial Finance for Sustainable Water and Sanitation.
World Bank, Washington, DC.
World Bank (2016), “Case Studies in Blended Finance for Water and Sanitation.” World Bank,
Washington, DC.
World Bank (2003), Irrigation in Central Asia: Social, Economic and Environmental Considerations,
World Bank, Washington, D.C.
World Resource Institute (2020), Flood Analyzer.

64 ENV/WKP(2021)3
Unclassified
Annex A. Methodological note: Estimating water-
related investment needs and financing
capacities in the Asia-Pacific
Context
Rationale
This methodological paper stems from the OECD’s effort assess the investment needs of Asian
Development Bank (ADB) member countries to cover the costs of water supply and sanitation, irrigation,
and flood protection by 2030. This assessment aimed to inform the Water Finance chapter for the ADB’s
Asian Water Development Outlook (AWDO).
The work was mainly driven by desk research into the literature and existing datasets to assess and utilise
models that project costs on investment.
The purpose of this methodological paper is to document the methods used to assess investment and
ADB member country financing needs for water supply and sanitation, irrigation, and flood protection, with
the ambition to replicate or expand the scope in future AWDOs.
Method
The greatest challenge in projecting future costs of water supply and sanitation, irrigation, and flood
protection is the lack of baseline data from which to build models and project forward. There currently
exists no unified, consistent, longitudinal or cross-sectional database that contains cost or investment data
on water supply and sanitation, or on irrigation. Obtaining data from countries on an individual basis by
utilising country statistics websites, or liaising directly with country officials to gather data is fraught with
challenges relating to definitional consistency between countries, excessive time constraints, and the
resulting output would likely not yield a viable data series. To overcome these challenges, we have made
use of data and cost analysis produced by the World Bank Group, the Global Water Intelligence (GWI),
World Resource Institute (WRI), and the OECD’s own datasets.
Drivers and projections of future investment needs
When producing any forward-looking projections, it is necessary to produce and utilise consistent
scenarios across various costing models and projections. To this end, we have elected to use the data
produced by the International Institute for Applied Systems Analysis and their “Shared Socioeconomic
Pathways 2: Middle of the Road” scenario (SSP2), combined with the Intergovernmental Panel on Climate
Change (IPCC) Representative Concentration Pathway 8.5 (RCP 8.5). SSP2 represents what is likely to
be the closest version of what would typically be a “business as usual scenario” in most projections (IIASA,
2019[1]). For flood risk analysis we make use of the RCP 8.5; RCP 8.5 is the high end of CO2-equivalent
parts per million projections, however our time horizon extends to 2030 and there is not a large difference

ENV/WKP(2021)3 65
Unclassified
between Representative Concentration Pathways in 20307. These choices are also convenient because
they are the same scenarios utilised in the data, tools, and analysis in the various costing models from
which our analysis draws upon.
The projections do not cover potential changes in the level of water security and associated costs (for
example, pubic demand for increased level of flood protection), and do not consider the costs of adapting
to climate change.
A summary of the data sources used to assess investment needs in water supply and sanitation, irrigation
and flood protection is provided in Table A A.1 and described in more detail in the ensuring sections.
Table A A.1. Summary of data sources: Investment needs
Description of analysis Unit Country
coverage Data sources
Water and Sanitation
Cost of achieving SDG 6 + Safely
managed connections
Model 2015-2030 annual
average $ and % GDP 39/49
WBG: Rozenberg and Fay
(2019)
Irrigation
Cost of irrigation Model 2015-2030 annual
average % of GDP
Sub-regional
estimates
WBG: Rozenberg and Fay
(2019)
Flood protection
GDP exposure of coastal flood risk
with Subsidence Model projected
exposure in 2030
$ and % GDP/Population
Exposed
44/49 World Resources Institute
WRI (2020)
GDP exposure of riverine flood risk 44/49 WRI (2020)
Water supply and sanitation
To produce the water supply and sanitation costs we primarily examine two papers:
The costs of meeting the 2030 sustainable development goal targets on drinking water, sanitation and
hygiene by Hutton and Varughese (2016) to estimate the capital costs of connecting a unit person to the
appropriate level of water supply and sanitation (Hutton and Varughese, 2016[2]). This examines the broad
literature to produce estimates of connection capital costs in under developed and under connected
countries.
Beyond the Gap: How Countries can Afford the Infrastructure they need while Protecting the Planet (2019)
by the World Bank’s Rozenberg and Fay. This paper builds upon the above paper to produce capital,
maintenance, and operational costs of connecting and maintaining infrastructure to connect people to
safely managed connections of water supply and sanitation. This paper utilises the World Bank’s costing
model to produce total cost estimates for most of our target countries. These cost estimates are driven by
the capital costs estimated by Hutton and Varughese (2016), local spending efficiencies, labour costs,
material costs, and the prevalence of corruption (Rozenberg and Fay, 2019[3]).
The World Bank (2019) paper produces national average annual costs8 for several scenarios by which
countries might go about connecting their populations. For the purposes of this study, a scenario based on
SSP2 was chosen, by which countries first connect their population with a basic water supply and sanitation
connection before then giving their population a high quality, more safely managed connection to comply
with SDG targets 6.1 and 6.2 by 2030.
7 The IPCC Representative Concentration Pathways extend to 2100, which is where you see large differences. Our
analysis extends to 2030 where each RCP is still within approximately 5% of each other, and for the purposes of this
study, is only needed when projecting flood risk.
8 These annual costs are not publicly available data.

66 ENV/WKP(2021)3
Unclassified
Irrigation
The data availability of irrigation costs is exceedingly sparse and makes for a challenge. This lack of
available data on a country level makes individual country estimates an unwieldy exercise, and projecting
individual countries using those estimates a less than fruitful exercise. A more useful exercise is to project
costs at the regional level. To this end we utilise the results published in the World Bank (2019) paper
Beyond the Gap: How Countries can Afford the Infrastructure they need while Protecting the Planet. The
authors produce their results using the GLOBIOM-irrigation module; the GLOBIOM is a recursive dynamic
land-use and agriculture partial equilibrium model that uses geospatial and agricultural variables, such as
crop production, irrigation land use, irrigation expansion, and irrigation efficiency, as its drivers (Rozenberg
and Fay, 2019[3]). Projections of irrigation costs are made over the timeframe 2015 to 2030 and uses the
Shared Socioeconomic Pathway 2 scenario (SSP2). This model produces regional estimates for capital
and maintenance irrigation costs. Compared to capital costs, maintenance costs for irrigation are very
small and are not reported in our report.
The scenario reflects moderate public investment support for capital costs for large scale dams, delivery
systems, and some costs to expand irrigated areas or upgrade existing irrigated areas to more efficient
irrigation systems. And assumes farmers will only expand irrigation or upgrade irrigation infrastructure, if it
is profitable.
The scenario also assumes that farmers cover the costs of the parts and materials for farm irrigation
equipment and that they face a water price that reflects the relative scarcity of water due to increasing
demand from other sectors. So the scenario assumes farmers will only expand irrigation or upgrade
irrigation infrastructure, if it is profitable.
Flood Risks
Flood projections cover riverine floods and coastal floods, and account for the compounding risk of land
subsidence. Flood protection investment need is defined as the financial resources that are required to
maintain actual (existing) flood risk at the same level up to 2030. This includes maintaining protection
standards of existing flood defences. A country’s flood risk is determined by existing flood protection
standards, the corresponding expected economic damage (direct and indirect), and the corresponding
expected number of victims (injuries and casualties).
The analysis from the World Resources Institute’s Flood Analyser is currently the best available tool to
determine exposed assets, and current and future level of flood risk. Their model uses a grid and basin
approach to determine the amount of assets exposed and uses the SSP2/RCP8.5 forecasts to examine
the assets and populations exposed in 2030. The key advantage of the WRI Flood Analyser is that it
models out the increased risk to GDP and populations, and accounts for differences is projected flood
protection.
The key drivers of increasing flood risk are climate change and socio-economic development, namely
economic and demographic growth. These drivers are projected on three variables: the value of assets at
risk of flooding, the number of people affected by floods, and the value of GDP affected by floods. This
approach results from the paucity of data on baseline expenditures for flood protection.
River Flooding is modelled by the Global Flood Risk with IMAGE Scenarios (GLOFRIS) modelling
framework (Winsemius et al., 2013[4])GLOFRIS simulates flooding using information on hazard, exposure,
and vulnerabilities as its drivers, after which the existing level of protection is subtracted out. Similarly,
using SSP2, the model simulates river floods and the assets exposed (in terms of GDP and population)
after accounting for level of protection (World Resource Institute, 2020[5]).
Coastal Flooding is modelled using the Global Tide and Surge Reanalysis (GTSR) dataset (Muis et al.
2016) dataset. GTSR is a global dataset of daily sea levels (due to tide and storm surge) for1979–2014,
based on the hydrodynamic Global Tide and Surge Model (GTSM). Surge is simulated using wind and

ENV/WKP(2021)3 67
Unclassified
pressure fields from the European Centre for Medium-Range Weather Forecasts (ECMWF) Re-analysis-
Interim (ERA-Interim) dataset (Dee et al. 2011). Tide is simulated using a separate model, the Finite
Element Solution 2012 (FES 2012) model (Carrère and Lyard 2003). Using a similar grid approach as river
flooding, changes due to subsidence is added in and projected levels of protection are subtracted out of
exposure (World Resource Institute, 2020[5]).
Additional factors that could not be factored in for flood protection investment needs
Pluvial flooding, also termed surface water flooding, stormwater flooding or flash floods, which are triggered
by intense local precipitation events, are likely to become more frequent throughout the Asia-Pacific region
(and worldwide) due to climate change. This type of flooding has not been considered in this analysis but
can be a significant source of future flood risk, and associated investment needs.
Sources of finance and financing capacities
A summary of the data sources used to identify sources of finance and financing capacities is provided in
Table A A.2 and described in more detail in the ensuring sections.
Table A A.2. Summary of data sources: Financing capacity
Description of analysis Country coverage Data sources
Financing strategies
Respective role of revenue from
tariffs, public finance Anecdotal, GLAAS 2019 report Limited OECD 2019 survey; UN Water
and WHO, 2019
ODA flows WSS, Total ODA flows, 2010-2017 41 ADB countries OECD 2017
Financing options
Experience with commercial finance Anecdotal 25 ADB countries UN Water and WHO, 2019;
ADB 2017
Equity
Micro affordability GWI survey of city tariffs, World Bank Debt
Sustainability database
108 cities in 20 ADB
countries GWI 2019
Public expenditure and private infrastructure investment
For our analysis on public expenditure and experience with commercial finance we utilised data collected
through a survey conducted with K-Water and the Asian Water Council, plus data from limited number of
countries in the most recent GLAAS report (UN Water and WHO, 2019) and ADB report (2017).
ODA as a source of funding
OECD data, 2019, stats.oecd.org
Increasing tariffs for water supply and sanitation
To examine countries ability to raise tariff rates we analysed city water bills in the target countries. Data
was sourced from the latest (2019) Global Water Intelligence (GWI) Global Water Tariff Survey, which
compiles the water bill of representative users and estimates their total water expenditure on water supply
and sanitation services (Global Water Intelligence, 2019[6]). In some cases, the data parses out difference
between water supply and sanitation bills but most often times they are reported together. We report the
total cost of WSS without separating them. Table A A.3 below shows the number of cities in ADB countries
observed in the GWI Survey.

68 ENV/WKP(2021)3
Unclassified
Table A A.3. Count of Cities in the GWI Survey
Country Count of Cities
China, People's Republic of 38
India 21
Malaysia 9
Korea, Republic of 7
Pakistan 7
Australia 5
Indonesia 3
Philippines 3
Kazakhstan 2
Bangladesh 2
Viet Nam 2
Tajikistan 1
Armenia 1
Bhutan 1
Georgia 1
Sri Lanka 1
Thailand 1
Kyrgyz Republic 1
Mongolia 1
Myanmar 1
Source: Authors calculation based on GWI data.
Due to lack of data on WSS bills for rural users, this skews our data towards urban users, who likely face
lower per unit costs of water (e.g. access to groundwater as drinking water), but also lower levels of service
(e.g. inadequate access to safe sanitation services).
In our effort to make an apples to apples comparison, we use the share of income of the middle quintile of
incomes to compare to the GWI water bills to incomes. The rationale is that the middle 20% of income is
likely to reflect income urban populations and allow us to examine the relationship between water bills and
urban users. However, in countries that are predominantly rural, it is likely the case that the income share
may still capture some rural incomes. The share of income of the middle quintile is not collected annually
by all countries, so we selected the most recently reported share for countries with data reported in the
last 5 years (which ranged from 2012 – 2017).

ENV/WKP(2021)3 69
Unclassified
References (methodology only)
Global Water Intelligence (2019), GWI. [6]
Hutton, G. and M. Varughese (2016), “The Costs of Meeting the 2030 Sustainable Development
Goal Targets on Drinking Water, Sanitation, and Hygenie.”, World Bank Group,
https://openknowledge.worldbank.org/handle/10986/23681.
[2]
IIASA (2019), SSP Scenario Database,
https://www.iiasa.ac.at/web/home/research/researchPrograms/Energy/SSP_Scenario_Datab
ase.html.
[1]
OECD (2010), Innovative Financing Mechanisms for the Water Sector, OECD Studies on Water,
https://doi.org/10.1787/9789264083660-en.
[7]
Rozenberg, J. and M. Fay (2019), “Beyond the Gap: How Countries can Afford the Infrastructure
They Need while Protecting the Planet”, World Bank Group, Sustainable Infrastructure;.
Washington, DC: World Bank, https://openknowledge.worldbank.org/handle/10986/31291.
[3]
Winsemius, H. et al. (2013), “Assessing Flood risk at the global scale: model setup, results, and
sensitivity”, Environmental Research Letters 8, http://dx.doi.org/10.1088/1748-
9326/8/4/044019.
[4]
World Resource Institute (2020), Flood Analyzer. [5]

70 ENV/WKP(2021)3
Unclassified
Annex B. Annual ODA for water-related
infrastructure in Asia-Pacific countries The table below features data that support Figure 3.6 above.
Table A B.1. Annual ODA for water-related infrastructure in Asia-Pacific countries
Average 2013-2017
Country USD/Capita Annual Average 2013-2017
Millions of USD
Afghanistan 0.03 0.99
Armenia 2.26 6.65
Azerbaijan 2.64 26.03
Bangladesh 0.23 36.35
Bhutan 0.71 0.53
Cambodia 0.45 7.25
China 0.21 291.69
Fiji 1.27 1.12
Georgia 1.59 5.91
India 0.19 257.24
Indonesia 0.71 189.13
Kazakhstan 0.59 10.70
Kiribati 1.10 0.13
Kyrgyzstan 0.31 1.90
Laos 0.68 4.70
Malaysia 1.06 33.07
Maldives 0.01 0.01
Marshall Islands 3.31 0.19
Micronesia 3.49 0.39
Mongolia 0.68 2.10
Myanmar 0.39 20.81
Nepal 0.58 16.12
Pakistan 0.39 81.42
Palau 0.00 0.00
Papua New Guinea 0.12 0.98
Philippines 0.80 83.94
Samoa 1.21 0.24
Solomon Islands 0.15 0.09
Sri Lanka 2.75 59.07
Tajikistan 0.28 2.48
Thailand 0.22 15.31
Tonga 0.16 0.02
Uzbekistan 0.16 5.28
Vanuatu 0.44 0.13
Viet Nam 0.76 71.91
Notes: Includes ODA disbursements for the following water-related infrastructure: water supply and sanitation, water storage, flood protection,
irrigation. Data are in millions of USD, gross disbursements, constant 2017 prices. 2017 population figures.
Data issues for some countries prevented their inclusion in the graphic. Particularly: Brunei, Cook Islands, Nauru, Niue, Timor Leste,
Turkmenistan, and Tuvalu.
Source: OECD (2019b). See Annex B for supporting data.