ENTERAL ELECTROLYTIC SOLUTIONS ADMINISTERED IN ...
56
UNIVERSIDADE FEDERAL DE VIÇOSA PAULO VINÍCIUS DE MORAIS SANTOS ENTERAL ELECTROLYTIC SOLUTIONS ADMINISTERED IN CONTINUOUS FLOW VIA NASO-RUMINAL ROUTE IN ADULT GOATS VIÇOSA – MINAS GERAIS 2020
-
Upload
khangminh22 -
Category
Documents
-
view
1 -
download
0
Transcript of ENTERAL ELECTROLYTIC SOLUTIONS ADMINISTERED IN ...

UNIVERSIDADE FEDERAL DE VIÇOSA
PAULO VINÍCIUS DE MORAIS SANTOS
ENTERAL ELECTROLYTIC SOLUTIONS ADMINISTERED IN CONTINUOUS FLOW VIA NASO-RUMINAL ROUTE IN ADULT GOATS
VIÇOSA – MINAS GERAIS 2020
PAULO VINÍCIUS DE MORAIS SANTOS
ENTERAL ELECTROLYTIC SOLUTIONS ADMINISTERED IN CONTINUOUS FLOW VIA NASO-RUMINAL ROUTE IN ADULT GOATS
Dissertação apresentada à Universidade Federal de Viçosa, como parte das exigências do Programa de Pós-Graduação em Medicina Veterinária, para obtenção do título de Magister
Scientiae.
Orientador: José Dantas Ribeiro Filho Coorientador: Rinaldo Batista Viana
VIÇOSA – MINAS GERAIS 2020


Dedico à clínica veterinária dos animais de produção.

AGRADECIMENTOS
Agradeço primeiramente a Deus por sempre me conduzir e me guiar durante
toda a minha vida. Sem Ele, nada disso seria possível.
Agradeço eternamente aos meus amados pais, Gorete e Marivaldo, que são os
responsáveis diretos por todos os acontecimentos da minha vida. Por acreditarem em
mim e me agraciarem com todas as oportunidades para concluir meus estudos. Pelo
amor incondicional que é extremamente fundamental em todos os momentos.
Aos meus irmãos, Gabriel e Theodoro, pelo companheirismo, pelas palavras,
pelo exemplo de força e coragem num mundo cheio de maldade.
A minha noiva Sheila, que nunca me deixou desistir, que sempre acreditou que
eu podia, e que é o meu apoio emocional. Obrigado por tornar minha vida mais leve e
me fazer sorrir nos momentos mais difíceis.
Ao meu orientador, Professor Dantas, que me acolheu sem me conhecer, que me
mostrou o caminho da pesquisa, pela confiança, pelas palavras, pelo conhecimento,
por me ensinar o amor a clínica e pelo exemplo de profissionalismo.
Ao Professor Marcel pelo cuidado com o nosso trabalho, pelo acolhimento, pela
amizade, pelas palavras, pela preocupação e por todos os conselhos.
Ao Professor Fabrício por estar sempre presente, acompanhando tudo de perto e
sempre disposto a esclarecer todas as dúvidas.
Ao Professor Rinaldo da Universidade Federal Rural da Amazônia por toda
ajuda no desenvolvimento do trabalho.
A Micheline e Samuel por toda a amizade e palavras de coragem e de incentivo,
por me colocar na vida de vocês e por fazer sentir como se fossem da família.
A Caio, Lorena e Pedro, por desde o primeiro dia de laboratório me mostrarem
o caminho da pesquisa e por toda ajuda durante esse processo.
As queridas Erica, Gabi e Lorraine e ao amigo Felipe, por estarem sempre
presente e pela dedicação e comprometimento com o trabalho. Vocês vão longe!
A Rosi por todo o cuidado e carinho desde o primeiro dia como mestrando.
A Lidiany, por todo apoio, ajuda e pela Maple.
Aos amigos que, mesmo de longe estavam sempre me dando todo o apoio.

Ao setor de Clínica e Cirurgia de Grandes Animais de Departamento de
Veterinária da Universidade Federal de Viçosa e aos funcionários por todo o apoio
durante o experimento.
Ao setor de Caprinocultura do Departamento de Zootecnia da Universidade
Federal de Viçosa por disponibilizar os animais para o estudo e aos funcionários que
sempre nos receberam bem.
A Fapemig, ao Programa de Pós-Graduação em Medicina Veterinária da UFV e
a Bioclin pelo fornecimento da estrutura e material necessário para o desenvolvimento
desse estudo.
O presente trabalho foi realizado com apoio da Coordenação de
Aperfeiçoamento de Pessoas de Nível Superior – Brasil (CAPES) – Código de
Financiamento 001.

“O sofrimento é o intervalo entre duas felicidades.”
(Vinícius de Moraes)

ABSTRACT
SANTOS, Paulo Vinícius de Morais, M.Sc., Universidade Federal de Viçosa, July, 2020. Maintenance enteral electrolytic solutions administered in continuous flow by the naso-ruminal route in adult goats. Advisor: José Dantas Ribeiro Filho. Co-Advisor: Rinaldo Batista Viana. This study aimed to investigate the effects of maintenance enteral electrolytic solutions
administered naso-ruminally in continuous flow in adult goats subjected to water and
food restriction. Six adult non-pregnant and non-lactating female goats, aged between
two and five years old, were used in a crossover (6 × 2) study. Solution 1 (SEE1)
comprised: 4.5 g sodium chloride (NaCl); 1 g potassium chloride (KCl); 0.5 g
magnesium chloride (MgCl); 1 g calcium chloride in 1000 ml of water (measured
osmolarity: 202 mOsmol L-1). Solution 2 (SEE2) comprised: 4.5 g of NaCl; 1 g of
KCl; 0.5 g of MgCl; 2 g of calcium acetate in 1000 mL of water (measured osmolarity:
212 mOsmol L-1). The solutions were administered naso-ruminally at a dose rate of
15 mL kg h, for 12 hours. The animals were evaluated at times T−24, T0, T4, T8, T12,
and T24. Both enteral electrolytic solutions were effective in expanding blood volume.
SEE1 showed a low-intensity acidifying potential, while SEE2 showed behavior of a
neutral enteral electrolytic solution.
Keywords: Acid-base balance. Electrolyte replacement. Enteral route. Fluid therapy.
Hypotonic solutions.

RESUMO
SANTOS, Paulo Vinícius de Morais, M.Sc., Universidade Federal de Viçosa, julho de 2020. Soluções eletrolíticas enterais de manutenção administradas em fluxo contínuo por via naso-ruminal em cabras adultas. Orientador: José Dantas Ribeiro Filho. Coorientador: Rinaldo Batista Viana. Este estudo teve como objetivo investigar os efeitos das soluções eletrolíticas enterais
de manutenção administradas nasorruminalmente em fluxo contínuo em cabras adultas
submetidas a restrição hídrica e alimentar. Seis cabras adultas não gestantes e não
lactantes, com idades entre dois e cinco anos, foram usadas em um estudo cross over
(6 × 2). A solução 1 (SEE1) composta por: 4,5 g de cloreto de sódio (NaCl); 1 g de
cloreto de potássio (KCl); 0,5 g de cloreto de magnésio (MgCl); 1 g de cloreto de
cálcio em 1000 ml de água (osmolaridade mensurada: 202 mOsmol L-1). A solução 2
(SEE2) composta por: 4,5 g de NaCl; 1 g de KCl; 0,5 g de MgCl; 2 g de acetato de
cálcio em 1000 mL de água (osmolaridade mensurada: 212 mOsmol L-1). As soluções
foram administradas por via naso-ruminal na dose de 15 mL kg h, durante 12 horas.
Os animais foram avaliados nos tempos T‐24, T0, T4, T8, T12 e T24. Ambas as
soluções eletrolíticas enterais foram eficazes na expansão do volume sanguíneo. A
SEE1 mostrou um potencial acidificante de baixa intensidade, enquanto a SEE2
apresentou comportamento de uma solução eletrolítica enteral neutra.
Palavras-chave: Equilíbrio ácido-base. Hidratação. Reposição de eletrólitos. Via
enteral. Soluções hipotônicas.
LIST OF TABLES
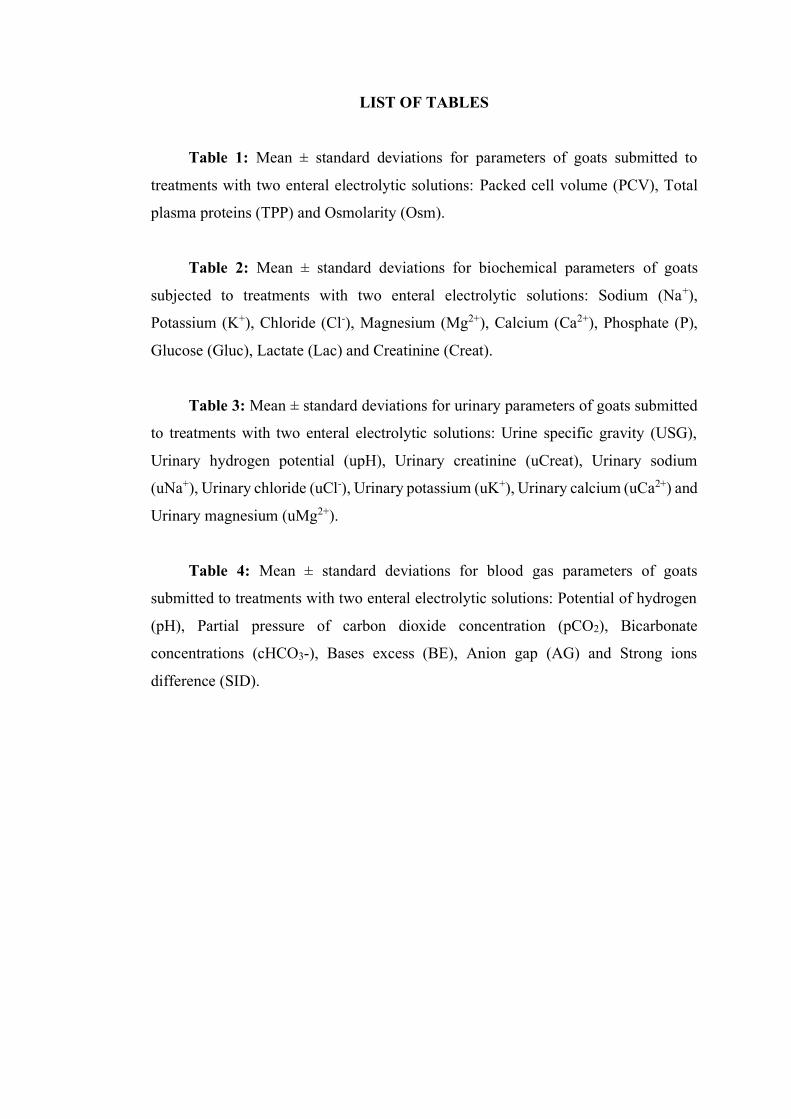
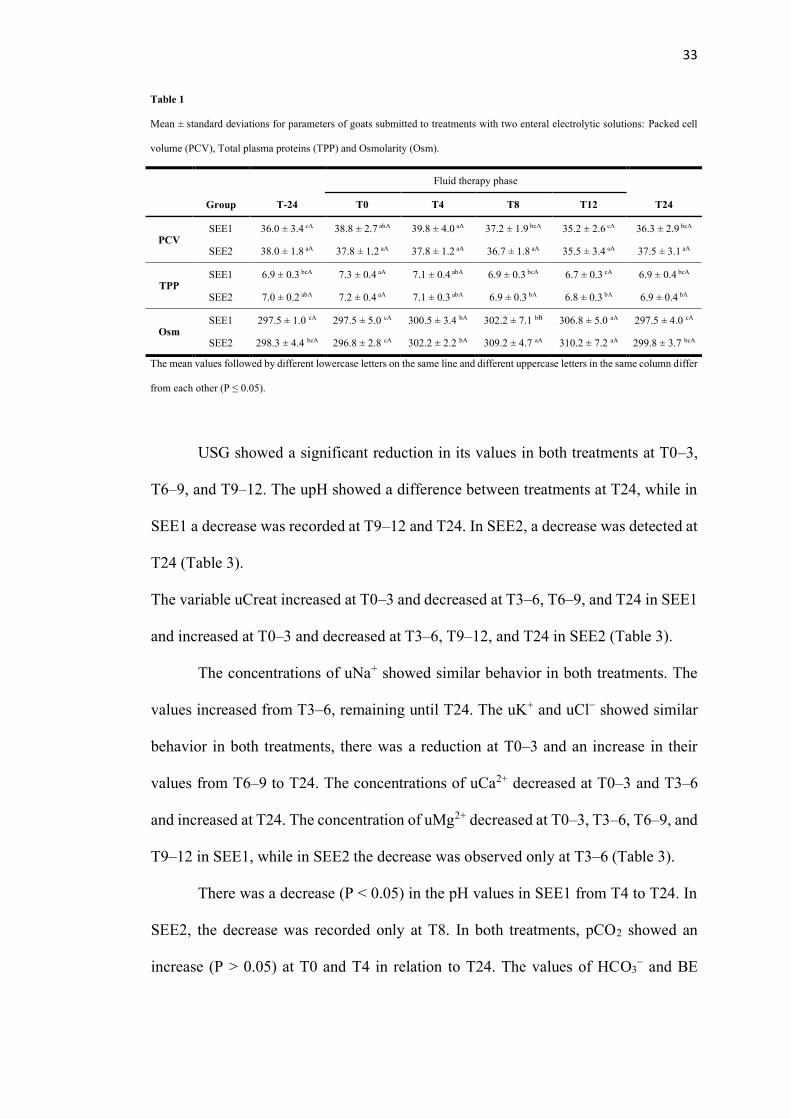
Table 1: Mean ± standard deviations for parameters of goats submitted to
treatments with two enteral electrolytic solutions: Packed cell volume (PCV), Total
plasma proteins (TPP) and Osmolarity (Osm).
Table 2: Mean ± standard deviations for biochemical parameters of goats
subjected to treatments with two enteral electrolytic solutions: Sodium (Na+),
Potassium (K+), Chloride (Cl-), Magnesium (Mg2+), Calcium (Ca2+), Phosphate (P),
Glucose (Gluc), Lactate (Lac) and Creatinine (Creat).
Table 3: Mean ± standard deviations for urinary parameters of goats submitted
to treatments with two enteral electrolytic solutions: Urine specific gravity (USG),
Urinary hydrogen potential (upH), Urinary creatinine (uCreat), Urinary sodium
(uNa+), Urinary chloride (uCl-), Urinary potassium (uK+), Urinary calcium (uCa2+) and
Urinary magnesium (uMg2+).
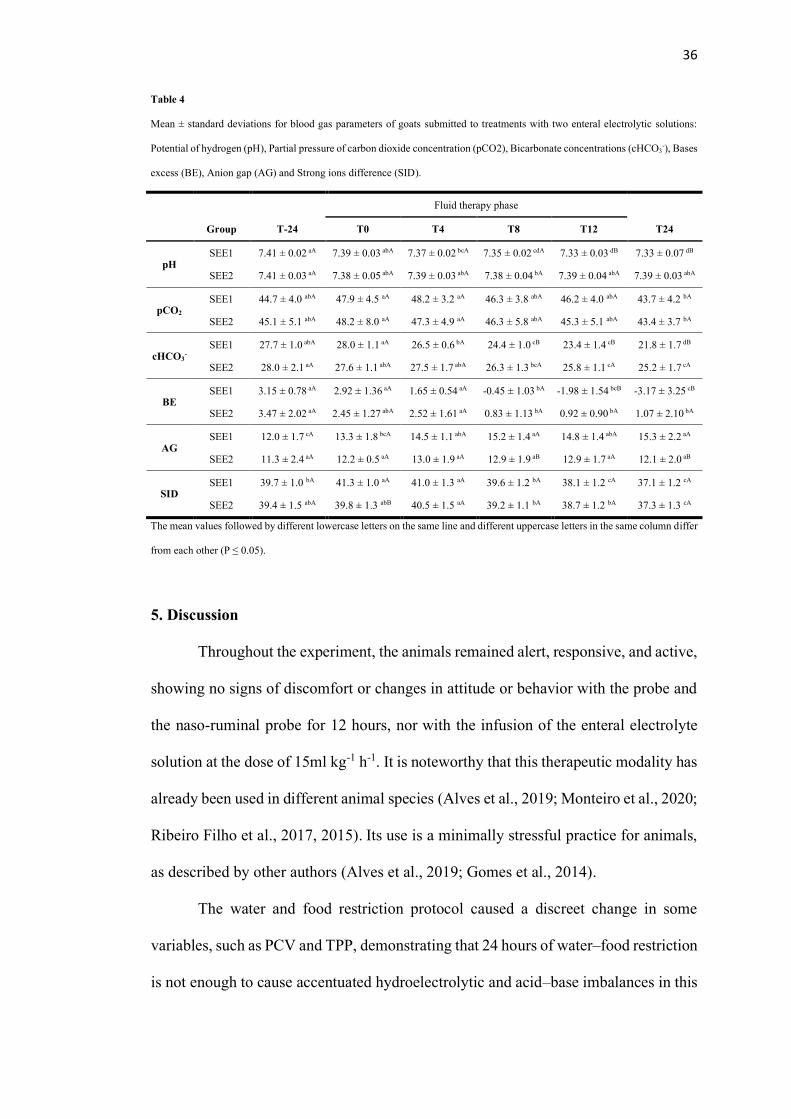
Table 4: Mean ± standard deviations for blood gas parameters of goats
submitted to treatments with two enteral electrolytic solutions: Potential of hydrogen
(pH), Partial pressure of carbon dioxide concentration (pCO2), Bicarbonate
concentrations (cHCO3-), Bases excess (BE), Anion gap (AG) and Strong ions
difference (SID).
LIST OF ABBREVIATIONS
AG – Anion gap
Alb – albumin
BE – Concentration of titratable bases
Ca2+ – Ionic calcium
cHCO3− – Bicarbonate concentration
Cl- – Chloride
Creat – Creatinine
dL – Deciliter
EDTA – Ethylenediamine tetraacetic acid
EFC – Extracellular fluid compartment
FL – Filtered load
G – Gauge
g – Gram
Gluc – Glucose
GT – Grouped in time
H+ – Hydrogen
H2CO3 – Carbonic acid
HCl – Hydrochloric acid
HPO42- – Phosphate ions
IFC – Intracellular fluid compartment
K+ – Potassium
kg – Kilograms
L – Liter
Lac – Lactate
m – Meter
m2 – Square meter
mEq – Milliequivalents
mg – Milligrams
Mg2+ – Magnesium
mL – Milliliter
mm – Millimeter
mmHg – Millimetre of mercury
mmol – Millimole
mOsmol – Milliosmole
Na+ – Sodium
Osm – Osmolarity
P – Phosphorus
pCO2 – partial pressure of carbon dioxide
PCV – Packed cell volume
pH – Potential of hydrogen
PTH – Parathyroid hormone
Ʃ – Summation notation
SEE1 – Solution 1
SEE2 – Solution 2
SID – Strong ion difference
TPP – Total plasma proteins
uCa2+ – Urinary total calcium
uCl− – Urinary chloride
uE – Urinary Electrolyte
uK+ – Urinary potassium
uMg2+ – Urinary magnesium
uNa+ – Urinary sodium
upH – Urinary pH
Ur – urea
USG – Urine specific gravity
V – Volume
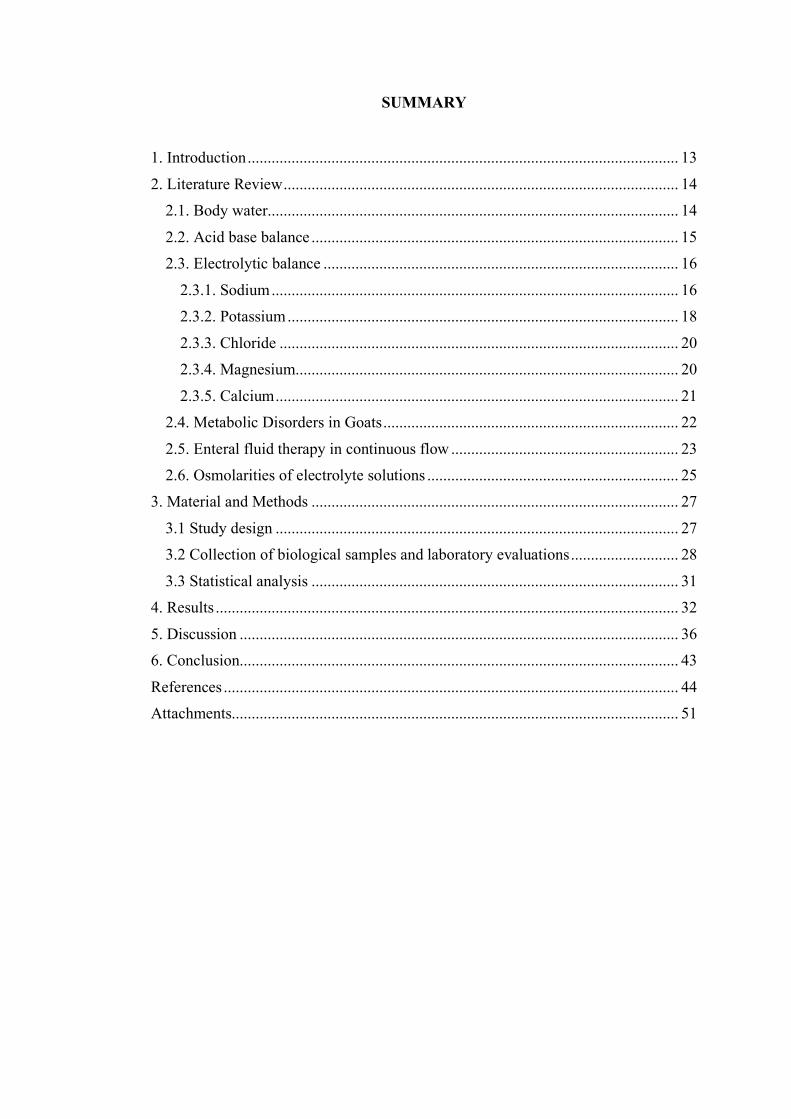
SUMMARY
1. Introduction ............................................................................................................ 13
2. Literature Review ................................................................................................... 14
2.1. Body water....................................................................................................... 14
2.2. Acid base balance ............................................................................................ 15
2.3. Electrolytic balance ......................................................................................... 16
2.3.1. Sodium ...................................................................................................... 16
2.3.2. Potassium .................................................................................................. 18
2.3.3. Chloride .................................................................................................... 20
2.3.4. Magnesium................................................................................................ 20
2.3.5. Calcium ..................................................................................................... 21
2.4. Metabolic Disorders in Goats .......................................................................... 22
2.5. Enteral fluid therapy in continuous flow ......................................................... 23
2.6. Osmolarities of electrolyte solutions ............................................................... 25
3. Material and Methods ............................................................................................ 27
3.1 Study design ..................................................................................................... 27
3.2 Collection of biological samples and laboratory evaluations ........................... 28
3.3 Statistical analysis ............................................................................................ 31
4. Results .................................................................................................................... 32
5. Discussion .............................................................................................................. 36
6. Conclusion.............................................................................................................. 43
References .................................................................................................................. 44
Attachments................................................................................................................ 51
13
1. Introduction
Among the metabolic disorders that affect adult ruminants, metabolic alkalosis
stands out as one of the mains acid base disorders (Roussel, 2014), which can be caused
by prolonged periods of fasting and dehydration. Correction of this disorder can be
achieved by several means, where the choice of the most effective treatment depends
on the intensity of the condition the patient experiences.
Among the possibilities for correcting acid base imbalances, enteral fluid
therapy is an effective option. However, similar to cattle, the administration of enteral
electrolytic solutions in goats is performed via the oro-ruminal route. In order to avoid
stress and lesions in the pharyngeal and esophageal mucosa of the animals, caused by
the use of this technique, enteral fluid therapy via the naso-ruminal route in a
continuous flow can also be used in this kind of animal. This technique has already
been tested in experimental trials with several animal species (Alves et al., 2019;
Ermita et al., 2016; Ribeiro Filho et al., 2017, 2011) and it has been successfully used
in the clinical routine practiced by the authors of this manuscript for a number of years.
The main challenge in correcting hydroelectrolytic and acid base imbalances
in adult ruminants by an enteral modality remains the administration of electrolytic
solutions that are effective and economically viable. Except for the study carried out
by Atoji-Henrique et al. (2012), there are no experimental tests with enteral electrolytic
solutions in adult goats, which makes the present clinical trial relevant, since the
composition of maintenance enteral electrolytic solutions for the species remains
unknown. In addition, clinical trials with hypotonic enteral electrolytic solutions have
not been performed in adult goats to date. However, considering the positive results of
this type of solution in other animal species, it is assumed that they would also be
satisfactory in adult goats.

14
Thus, the aim of this study was to investigate the effects of two maintenance
hypotonic enteral electrolytic solutions administered via the naso-ruminal route in a
continuous flow through a small-gage nasogastric tube for 12 hours in adult goats
subjected to water and food restriction. It was hypothesized that the use of the solution
with a higher concentration of chloride and a strong ion difference (SID) equal to zero
(SEE1), in addition to increasing blood volume, would have a low acidifying effect in
animals.
2. Literature Review
2.1. Body water
The animal organism is composed mainly of water, which corresponds to
approximately 60% of the body weight. This percentage can vary according to some
factors, such as age and breed. The water is divided into two main compartments, the
intracellular fluid compartment (IFC) and the extracellular fluid compartment (EFC).
The IFC is responsible for storing about two-thirds of the body's water, and the rest is
located in the EFC, which is composed of the interstitial, intravascular and
transcellular fluid compartments. In addition, there are differences between the
electrolytic compositions of each compartment (Walz and Taylor, 2012).
The main electrolytes in the EFC are sodium, chloride and bicarbonate, while
in IFC it is possible to find, mainly, potassium, phosphate and proteins. Despite the
different resources and electrolytic compositions, IFC and EFC are in osmotic balance,
where water and electrolytes can diffuse between them through hydrostatic and oncotic
forces. (Walz and Taylor, 2012).

15
This balance is one of the body's mechanisms which, when in harmony, is
called homeostasis.
2.2. Acid base balance
It is necessary to be aware of acid base imbalances, which are present in several
diseases that affect ruminants. These conditions are often caused by the producer
himself to ignore the environmental and nutritional needs of his herd. Ruminants may
exhibit mild and non-specific symptoms, such as reduced food consumption and
apathy. Therefore, constant observation is necessary for early intervention in any
imbalance in these animals. (Peek and Diver, 2018).
Free hydrogen (H+) plays an important role in cell metabolism. The amount of
this element in the IFC and EFC is regulated by a delicate balance between acids and
bases present in the body. Some reactions can release or remove the H+ proton from
the organism, examples of those reactions that release H+ are hydrochloric acid (HCl)
and carbonic acid (H2CO3) when dissociated in water they can form H+ and Cl-
molecules or H+ and bicarbonate (HCO3-) molecules, respectively. The bases can do
the reverse, removing these H+ ions from the organism, for example, the bicarbonate
itself, the phosphate ions (HPO42-) and proteins. (Hall, 2011; Carson and Bruss, 2008).
There are several mechanisms responsible for the concentration of H+ in the
body, among them, we can highlight the buffer systems, which can occur through the
bicarbonate buffer with the aid of the carbonic anhydrase enzyme (Hall, 2011), the
phosphate buffer where the kidney has a fundamental role , since it has a great capacity
to excrete or concentrate phosphate ions depending on the need of the organism (Fry
and Karet, 2007) and the protein buffer for the vast amount, such as hemoglobin and

16
albumin, present in IFC and EFC, however, the latter occurs slowly (Martin-Terezo e
Martens, 2014).
Another important mechanism in regulating the amount of hydrogen ions
present in the body is the respiratory system. The body constantly produces high levels
of CO2 through cellular metabolism, these can be diffused into the interstitial fluid and
then into the blood. CO2 is eliminated together with H+ ions, and this is how, by
increasing the respiratory rate, it can eliminate more sources of H+ or do the opposite
in cases where an increase in the quantity of these ions is necessary through a decrease
in the respiratory frequency (Hall, 2011).
The most efficient and important mechanism of the body to control the acid
base balance is renal system. HCO3- is continuously filtered in the tubules and, if they
are excreted in the urine, this removes the base of the blood. Too much H+ is also
secreted in the tubular lumen, thus removing acid from the blood. If more H+ is
secreted than HCO3- is filtered, there will be a net loss of acid from the extracellular
fluid. On the other hand, if more HCO3- is filtered than H+ is secreted, there will be a
net loss of base (Hall, 2011). The kidneys can control the volume of other electrolytes,
which are excreted through the urine, and can eliminate non-volatile products that the
lungs cannot eliminate. (Madias and Adrogué, 2013).
2.3. Electrolytic balance
2.3.1. Sodium
The main and most abundant EFC cation is sodium (Na+), being the main
responsible for regulating the osmolarity of this same space. It is estimated that
sodium, together with some anions with which it can associate, such as chloride and
17
bicarbonate, represent about 94% of extracellular solutes. Therefore, changes in its
concentration can directly affect the volume and osmolarity of the EFC (Hall, 2011).
Although its concentrations are controlled by multiple gastrointestinal, renal
and endocrine mechanisms, sodium and, consequently, the osmolarity of the EFC, are
regulated by two primary systems. One of them is the feedback system of the ADH
osmoreceptor, where an increase in the EFC osmolarity leads to the secretion of ADH
which, through the bloodstream, reaches the kidneys and increases the water
permeability in the distal tubules, cortical collecting tubules and ducts medullary
collectors. This increase in permeability causes greater reabsorption of H2O, and
consequently of Na+, causing concentrated urine with less volume to be excreted.
(DiBartola et al, 2012a)
The other system of importance for sodium regulation is the thirst mechanism.
Several areas in the brain form the center of the thirst, the place that controls all this
mechanism. There are several ways for this mechanism to be activated, and more than
one of them can happen at the same time. One of the most important is the increased
osmolarity of the EFC, which causes an intracellular dehydration in the center of the
thirst promoting the sensation of thirst. Other forms of activation are the decrease in
EFC volume along with blood pressure and the secretion of Angiotensin II (Hall,
2011).
The animal organism can prevent Na+ losses that are also happening through
the renin-angiotensin-aldosterone system. When there is a decrease in blood pressure,
there is a stimulus for the release of renin, which in turn promotes the release of
angiotensin I and II, angiotensin II acts on the kidneys by decreasing the renal flow
and providing the secretion of aldosterone which increases the reabsorption of Na+,
preventing its elimination by the kidneys (Jerry Kaneko et al., 2008).
18
Serum Na+ levels in dairy goats reared under confinement, according to Atoji-
Henrique et al. (2012) is 140 mEq/L. Changes in these values are of great importance
for the animal's health. In cases where the sodium values are below this value, we may
have a condition called hyponatremia. Generally, hyponatremia is associated with
large losses of fluid by the body and, under these conditions, homeostasis will be
impaired, since large amounts of water are allowed to migrate from the plasma to the
interstitium, which may cause cell edema and irreversible lesions. (Hall, 2011).
Hypernatremia, increased serum or plasma Na+ levels, is often related to the
early stages of diarrhea, vomiting or kidney disease where there is a greater loss of
water than electrolytes. Hypernatremia can occur when salt intoxication in ruminants
is associated with water restriction. As long as water is available, this intoxication will
not occur (Jerry Kaneko et al., 2008).
2.3.2. Potassium
Potassium (K+) is the ion in greater quantity in the IFC, being responsible for
the transmission of stimuli and for the communication between cells, playing the role
in several essential functions. Changes in their concentrations can occur in a wide
variety of clinical circumstances, which can trigger intense neuromuscular effects due
to changes in the potential of the cell membrane (Jerry Kaneko et al., 2008).
One of the protection mechanisms against changes in the concentrations of H+
ions in the EFC is the exchange with the K+ ions present in the IFC. This occurs when
the blood pH value decreases. This same mechanism can also occur, but in reverse, in
cases of metabolic alkalosis. Insulin also acts on the regulation of potassium, it
stimulates its absorption in cells (Hall, 2011).
The kidney plays a key role in regulating potassium. It is filtered through the
glomerulus, where approximately 70% is reabsorbed by the proximal tubules together
19
with water and sodium, 10 to 20% are reabsorbed in the ascending branch of the loop
of Henle and the remaining 10 to 20% are directed to the distal nephrons where they
are adjusted what will be reabsorbed and what will be secreted (DiBartola e De Morais,
2012).
According to Ward (1966), the frequent use of diuretics and a decrease in food
intake are the main causes of hypokalemia. It is also possible that these animals show
losses of K+ in cases of diarrhea or vomiting. Hypokalaemia does not usually show
clinical signs in patients, the animal may rarely have muscle weakness, polyuria or
polydipsia (DiBartola and De Morais et al, 2012).
In cases where the animal has a plasma potassium concentration above the
reference levels, or hyperkalaemia, the damage caused can be more serious and the
signs become noticeable when these patients have a greater or equal increase in the
serum concentration of only 3 to 4 mEq/L can cause cardiac arrhythmias, and higher
concentrations can lead to cardiac arrest or fibrillation. Hyperkalaemia is uncommon
in cases where the kidneys are healthy (Hall, 2011).
The replacement of this ion can be performed parenterally or enterally, and can
be found in some commercial solutions such as Ringer lactate, which has 4 mEq/L of
K+ in its composition, which is sufficient for the maintenance of this electrolyte in
patients, but insufficient in cases where there is a deficit, supplementation is necessary
to correct the values according to the needs of each patient.
An enteral electrolyte solution containing potassium is the safest way to
administer this electrolyte when the dose and speed of the solution are done correctly.
Added to this is the ability of the intestinal mucosa to control the speed of absorption
of electrolytes, thus preventing larger doses from reaching the bloodstream and
causing unwanted effects (Weiner and Wingo, 1997).

20
2.3.3. Chloride
Chloride constitutes approximately two-thirds of the anions in the plasma and
the rest of the EFC. It is also the main anion filtered by the glomeruli and reabsorbed
in the renal tubules. Chloride plays an important role in maintaining osmolarity and
actively participates in the regulation of the acid base balance (De Morais and Biondo,
2012). The average value of chloride in the plasma of goats is 109 mEq/L (Atoji-
Henrique et al., 2012).
Changes in the plasma chloride concentration are directly related to
disturbances in the acid base balance, this is due to its indirect action in the plasma
bicarbonate concentration. Acidosis can be caused by hyperchloremia due to a
decrease in the concentration of bicarbonate in the blood. This is a way of
compensating for negative charges in the EFC, in an attempt to maintain
electroneutrality (Constable, 2003; Alves et al, 2019).
The kidneys act as an electro-neutralizer by expelling or retaining charges to
maintain homeostasis. Thus, in situations where chloride is reduced, the kidney retains
ions with negative charges, such as chloride and bicarbonate, which can generate
metabolic alkalosis (De Morais and Biondo, 2012).
2.3.4. Magnesium
Magnesium (Mg2+), one of the cations with two valences present in the body,
is the second most abundant positive charge electrolyte in IFC after potassium. Even
so, most of it is not found inside cells but in bones (Stewart, 2015). More than half the
concentration of Mg2+ is bound to proteins, mitochondria or substrates (Hall, 2011).
Magnesium is involved in several biochemical processes in the body, which
include the activation of many enzymes, and precisely for this reason, its concentration
must be strictly regulated. Because it is present in the normal diet of the animals and

21
is also dependent on it to maintain its adequate levels, it is estimated that its daily
intake is on average 250 to 300 mg, where only half of this value is absorbed by the
gastrointestinal system. (Hall, 2011).
In situations of lack of appetite and fluid therapy with solutions without a
source of magnesium, the serum values of this electrolyte decrease, leading to
hypomagnesaemia (Avanza et al., 2009). Long-term magnesium deficiency can cause
several unwanted effects on the cardiac and neuromuscular systems, in addition to
electrolyte disturbances (Hall, 2011).
2.3.5. Calcium
With an important role in muscle activity, intracellular signaling and being a
cofactor of the blood coagulation system, calcium (Ca2+) stands out as one of the main
plasma electrolytes (Aguilera-Tejero, 2015). Approximately 99% of the calcium in the
body is deposited in the bones. Of the small value (1%) found in plasma, half of it is
in ionized form, that is, it has biological activity in cell membranes. The rest are linked
to proteins or linked to other anions such as phosphate, bicarbonate, sulfate, citrate and
lactate (Schenck et al, 2012).
In this way, only about 50% of the calcium in the plasma can be filtered in the
glomerulus. Typically, about 99% of the filtered calcium is reabsorbed by the tubules,
with only about 1% of the filtered calcium being excreted. About 65% of the filtered
calcium is reabsorbed in the proximal tubule, 25 to 30% is reabsorbed in the loop of
Henle and 4 to 9% is reabsorbed in the distal tubules (Hall, 2011).
Calcium is mainly acquired through food, and can also be removed from the
bones when necessary through parathyroid hormone (PTH). When the calcium
concentration in the EFC falls below normal, the parathyroid glands are stimulated
leading to an increase in PTH secretion. This hormone acts directly on the bones to

22
increase the resorption of salts from the bone and to release large amounts of calcium
into the extracellular fluid, thus returning calcium levels back to normal. The same
occurs the other way around, and excess calcium is deposited in the bones (Hall, 2011).
Measurement of calcium can be done using serum or plasma samples. Total
calcium and ionized calcium can be measured. Whenever possible, the best method of
evaluation is ionized calcium, as it is the safest variable to demonstrate the amount of
this electrolyte available in the bloodstream (Schenck et al, 2012).
Goats with high milk production can present hypocalcemia, reaching values of
4 to 5 mg/dL soon after parturition. This happen because the body requires a high
demand for calcium, but the body needs one or more days to synthesize all the enzymes
necessary to remove calcium from the bones. This disease is common when a diet rich
in calcium is provided, causing a decrease in PTH synthesis. The low amount of this
hormone results in decreased calcium mobilization of bones and intestines (Rankins
and Pugh, 2012)
2.4. Metabolic Disorders in Goats
Ruminants are commonly affected by diseases that can cause some type of
metabolic disorder. Among the main metabolic disorders found in ruminants, we can
highlight ruminal acidosis, tympanism, urea intoxication, ketosis and several
pathologies that can secondarily cause acidosis or metabolic alkalosis (Neto et al,
2014).
Metabolic alkalosis is the change in the acid base balance most commonly
found in adult cattle that have conditions that alter their normal conditions due to
dehydration, lack of appetite or changes in abomasal emptying (Roussel, 2014).

23
It is believed that due to the increased need of the body for sodium, in order to
control the plasma volume reduction process, this electrolyte can be exchanged more
efficiently for protons to the tubular lumen, and thus generate a metabolic alkalosis of
contraction in the individual (Garella et al., 1975). Other authors claim that contraction
alkalosis may be caused by hypochloremia due to a reduction in plasma volume or
administration of hypochloremic solutions (Luke and Galla, 2012).
The proteins in the cortical collecting ducts of the nephron exchange chloride
ions from the tubular fluid to the intracellular medium for bicarbonate, which generates
protons. When the plasma volume decreases or hypochloremic solutions are
administered, this protein stops eliminating bicarbonate, since chloride is not available
in the tubular light causing the bicarbonate to accumulate, which causes a metabolic
alkalosis (Luke and Galla, 2012). Thus, the presence of metabolic alkalosis may be
associated with subclinical or initial levels of dehydration.
The correction of this disorder can be carried out by several methods, where
the choice of the most effective treatment depends on the intensity of the patient's
condition. In cases where there is no severe dehydration or hypovolemic shock, enteral
hydration has been shown to be as efficient as intravenous hydration. (Dias et al, 2019).
2.5. Enteral fluid therapy in continuous flow
As they are frequent conditions in the clinical routine, the evaluation of
hydroelectrolytic and acid base imbalances are essential components in the
examination of sick animals, the correction of these imbalances being a priority for the
success of the specific therapy to be employed and the reestablishment of homeostasis
(Carlson and Bruss, 2008; Jones and Navarre, 2014).
24
Regardless of the origin, for the correction of dehydration and electrolyte
disturbances and acid base fluid therapy is the therapeutic practice adopted (Constable,
2003; Roussel, 2014). In addition, it assists in maintaining cardiac output and improves
tissue perfusion (Jones and Navarre, 2014). In this way, fluid therapy needs to be
rationally planned so that the specific deficiencies of the patient can be met and
anticipated, which can change throughout the treatment (Speirs and Wrigley, 1997).
In ruminants, the most widely used fluid administration routes are intravenous
and oro-ruminal (Constable, 2003; Ribeiro Filho et al., 2013). The parenteral
(intravenous) route is indispensable in cases of severe dehydration, with the risk of
hypovolemic shock and in cases of sepsis, for example, as it allows rapid infusion of
replacement fluid (Constable, 2003; Ribeiro Filho et al., 2011). This route, however,
requires thorough care with the permanent observation of the patient, the handling of
solutions and placement of the venous catheter, which increases the risk of
contamination of the patient, in addition, it requires sterile solutions, which increases
the cost of treatment (Lopes et al., 2002; Ribeiro Filho et al., 2011).
Enteral fluid therapy is an effective alternative to the parenteral route. It
consists of the administration of electrolytic solutions by means of an oro-ruminal or
naso-ruminal probe (Ribeiro Filho et al., 2009). It is a route widely used in the
ruminant clinic, due to the ease of the technique and the possibility of administering
large amounts of electrolyte solution in the rumen, solutions that do not require
sterilization (Constable, 2003; Ribeiro Filho et al., 2009; Roussel, 2014). The cost of
enteral fluid therapy is a factor that contributes a lot to the dissemination and adoption
of the technique among veterinarians who attend outside the dependencies of a
veterinary hospital (Ribeiro Filho et al., 2011), the value of the liter of solution, for

25
oral use, can be up to 97% lower, when compared to solutions for parenteral use
(Ribeiro Filho, 2011).
The direct deposition of electrolyte solutions in the rumen, allows the
formation of a reserve of water and electrolytes, which supports a continuous
absorption of these elements for a certain time (Constable, 2003). Also, for this reason,
a disadvantage of the oro-ruminal route is abdominal distension, followed by
discomfort, caused by the large amount of fluid deposited in one time in the rumen
(Ribeiro Filho et al., 2011) and the risk of injury to the pharynx and esophagus, in
addition to stress, caused by the successive surveys necessary in this therapeutic
modality (Ribeiro Filho et al., 2013).
An alternative to the classic oral route is enteral fluid therapy via naso-ruminal,
using a small-caliber probe. This route is already widely used, and with success, in
horses (Avanza et al., 2009; Gomes et al., 2012; Ribeiro Filho et al., 2014), cattle
(Ribeiro Filho et al., 2011; Ribeiro Filho et al., 2013), buffalo calves (Ermita et al.,
2016) and has also been tested in goats (Atoji-Henrique et al., 2012). In adult
ruminants this pathway is called naso-ruminal.
In addition to the notable advantages of enteral fluid therapy, this technique
allows the infusion of the electrolyte solution slowly and continuously (Lopes et al.,
2004; Ribeiro Filho, 2011). As the equine urethral probe used is 5 x 7 mm in diameter
and 1.5 m long, this way, probing is facilitated, therefore, the discomfort caused to the
animal by the passage and presence of the probe is minimal, not preventing the access
and food intake by the patient (Atoji-Henrique et al., 2012; Ribeiro Filho et al., 2013).
2.6. Osmolarities of electrolyte solutions
26
According to Wellman et al. (2012), osmolarity is defined as the number of
osmoles, particles that exert a certain osmotic pressure, in a liter of solution and should
be measured in the serum, preferably, because the presence of the anticoagulant can
cause changes in the measurement.
In both human and veterinary medicine, the osmolarity of electrolyte solutions
(ES), whether for parenteral or enteral use, is still the subject of much discussion
among researchers. For the World Health Organization (WHO) one of the most
important advances in human medicine in the 20th century was the development of an
oral rehydration solution (Smith, 2009; Smith and Berchtold, 2014). At first, a
hyperosmolar solution (311 mOsm/L) had been developed, which significantly
contributed to reducing child mortality in countries where cholera was endemic. In the
search for improvements in clinical results, researchers developed a solution that
reduced the need for parenteral hydration by 33% and the incidence of vomiting by
30%, for this, it was only necessary to reduce the osmolarity of the electrolyte solution
to 245 mOsm/L (Mahalanabis et al., 1995; WHO, 2018).
A point that should be called attention is that the changes promoted in the
osmolarities of the rehydration solutions are mainly due to changes in the amount of
sodium and/or sugar, present in the formulation. That is, in hypotonic solutions, the
amount of sodium and glucose available is usually lower. As a concrete example, we
have the standard oral rehydration solution from the WHO, whose first solution
(hypertonic: 311mOsm/L) held 90 mEq/L of sodium and 111 mEq/L of glucose, while
the new solution (hypotonic: 245 mOsm/L) presented an equimolar mixture of 75
mEq/L of sodium and glucose (WHO, 2018).
Despite the benefits that this change in the osmolarity of the solutions can
promote, with regard to the greater absorption of the solution, some authors call

27
attention to the appearance of hyponatremia, promoted by the solutions of less
osmolarity, especially if used in maintenance therapy (Alves et al., 2011; McNab et
al., 2015). Likewise, care must be taken with solutions of high osmolarity, to avoid the
so-called ‘salt intoxication’ or hypernatremia (Kirchner et al., 2013). Even so, there is
still a lack of studies to better assess the conditions under which low osmolarity
solutions can cause hyponatremia (Beck, 2007).
In ruminants, the intrinsic needs of each age group vary greatly, in order to
render the same treatment inappropriate when it is applied to animals of different ages
(Roussel, 2014). In adult animals, the use of low osmolarity electrolytic solutions
(hypotonic) has been predominant and has shown satisfactory results (Constable,
2003; Atoji-Henrique et al., 2012; Ribeiro Filho et al., 2013; Jones and Navarre, 2014;
Roussel, 2014; Alves et al., 2019). We have, therefore, that the osmolarity of ES for
enteral use, will play a decisive role in the absorption of water and electrolytes.
3. Material and Methods
The experimental procedures were approved by the ethics committee in animal
use of Universidade Federal de Viçosa (CEUA/UFV process number 88/2018)
following the guidelines of Brazilian legislation edited by the National Council of
Animal Experimentation Control (CONCEA/MCTI).
3.1 Study design
The study was carried out at the Veterinary Hospital of the Federal University
of Viçosa, Brazil. Six healthy Saanen x Pardo-alpine crossbred female dairy goats aged
between two and five years, with a body weight between 52–72 kg, non-pregnant and
non-lactating, were used. During the study, the goats were kept in individual masonry

28
bays, 2 × 2 m (4m2) with a shavings bed and fed with hay, water, and a mineral
supplement ad libitum, and a concentrate (2% of body weight) mixed with chopped
elephant grass (Pennisetum purpureum), divided into two portions a day before and
after water and food restriction. The animals were submitted to 24 hours of water and
food restriction before the beginning of the fluid therapy period.
The animals were randomly included in the experiment in a crossover design
with six animals × two treatments (6 × 2), where each animal received all treatments
with an interval of seven days between them. The treatments with maintenance
hydroelectrolytic solution were named and composed of solution 1 (SEE1): 4.5 g
sodium chloride; 1 g potassium chloride; 0.5 g magnesium chloride; 1 g calcium
chloride in 1000 mL of water (measured osmolarity: 202 mOsmol L-1; SID = 0);
solution 2 (SEE2): 4.5 g of sodium chloride; 1 g of potassium chloride; 0.5 g of
magnesium chloride; 2 g of calcium acetate in 1000 mL of water (measured
osmolarity: 212 mOsmol L-1; SID = 22.6). The solutions were administered naso-
ruminally at a dose rate of 15 ml kg-1 h-1, for 12 hr.
Immediately before fluid therapy started, the animals were contained in trunks
suitable for small ruminants and were probed naso-ruminally with a silicone, non-toxic
PVC probe, 5 × 7 mm thick and 1.5 m long. The probe was attached to a halter and
connected to the enteral fluid therapy system, a 20L water gallon, with a spiral tube
containing a flow regulator.
3.2 Collection of biological samples and laboratory evaluations
Biochemical, blood gas, and urinary analyses were performed. The evaluations
were carried out in the following moments: T−24: beginning of water and food
restriction (control); T0: end of water and food restriction and the start of the fluid
29
therapy phase; T4: four hours after fluid therapy started; T8: eight hours after fluid
therapy started; T12: twelve hours of fluid therapy and end of the fluid therapy period;
T24: twelve hours after the fluid therapy phase ended.
After antisepsis, blood samples were collected by jugular venipuncture, using
a vacuum system for multiple collections with 25 × 8 mm (21 G 1) needles (BD
Vacutainer®, Becton and Dickinson, São Paulo. Brazil). Blood was collected in vials
(BD Vacutainer®, Becton and Dickinson, São Paulo. Brazil) without anticoagulant to
obtain serum, containing sodium fluoride to obtain plasma, and ethylenediamine
tetraacetic acid (EDTA) to measure the packed cell volume (PCV) using the
microhematocrit technique.
The samples were centrifuged and the serum and plasma aliquots frozen for
further analysis. Serum osmolarity (Osm) was measured in an osmometer (model
3320, Advanced Instruments, USA) by the freezing point depression method. Serum
elements: total plasma proteins (TPP), magnesium (Mg2+), phosphorus (P) and
creatinine (Creat) and plasma elements: glucose (Gluc) and lactate (Lac) were obtained
with an automatic device HumaStar 300 (Human, In Vitro diagnóstica Ltda, Itabira,
MG, Brazil) using a measurement kit (Bioclin – Quibasa Clínica Básica Ltda, Belo
Horizonte, MG, Brazil). In a selective ion analyzer (Humalyte plus 5 – In Vitro
Diagnóstica, Brazil) ionic calcium (Ca2+), chloride (Cl−), sodium (Na+), potassium
(K+) were measured in the serum.
For the blood gas evaluation, 2 mL of blood was collected in syringes
(Vacuette, Centerlab Ltda, Belo Horizonte, MG, Brazil) containing lithium heparin.
The sample was processed using a blood gas analyzer (Radiometer ABL 5,
Copenhagen, Denmark). The values of venous blood potential of hydrogen (pH),
partial pressure of carbon dioxide (pCO2), bicarbonate concentration (cHCO3−),

30
concentration of titratable bases (BE) were determined, and the anion gap (AG) and
strong ions difference (SID) were calculated according to the formulas proposed by
Constable (2000):
AG = (Na+ + K+) – (Cl− + HCO3−) SID = (Na+ + K+) – (Cl−)
In the urine obtained by spontaneous urination at moments: T−24 (samples
collected in an interval of two hours), during the entire fluid therapy period, and at
time T24 (samples collected in an interval of two hours), the total volume of the
produced urine was measured, and biochemical analysis and filtered load (FL)
calculations were made. Urine specific gravity (USG), performed by refractometry
(Master-20T, Atago Brazil Ltda, São Paulo, SP, Brazil), and urinary pH (upH), verified
in a pH meter (DLA – PH, Del Lab, Araraquara, SP, Brazil), were measured
immediately after urine collection, and then an aliquot was taken to measure sodium
(uNa+) and potassium (uK+) by flame photometry (Photometry B462 Micronal,
Brasil), urinary creatinine (uCreat), chloride (uCl−), total calcium (uCa2+), and
magnesium (uMg2+) were made with an automatic device HumaStar 300 (Human, In
Vitro diagnóstica Ltda, Itabira, MG, Brazil) using a measurement kit (Bioclin –
Quibasa Clínica Básica Ltda, Belo Horizonte, MG, Brazil).
The FL calculation was performed per animal using the urinary electrolyte [uE
(mEq/L) or uE (mg/dL)] value and multiplied by the volume of urine [V (L) or V (dL)]
produced in the same sample:
FL(uE) = uE(mEq/L) × V(L)
FL(uE) = uE(mg/dL) × V(dL)
Then, the results were grouped in time (GT) according to the serum collections.
The entire FL (uE) calculation obtained during T−24 and T24 was added and divided
by two (duration in hours of collection) to determine a single result:

31
GTFLuE = [FL(uE)1 + FL(uE)2 + FL(uE)3] ÷ 2
The results obtained during the fluid therapy period (T0 to T12), were grouped
into four stages so that a comparison could be made with the serum samples. For this,
four periods of three hours were used: T0–3 (first three hours of fluid therapy); T3–6
(from the third hour of fluid therapy to the sixth hour of fluid therapy); T6–9 (from the
sixth hour of fluid therapy to the ninth hour of fluid therapy); and T9–12 (from the
ninth hour of fluid therapy to the end of fluid therapy). The FL (uE) obtained during
these times were added in their proper grouping and divided by three (duration in hours
of collection) with a single result being determined:
GTFLuE = [FL(uE)1 + FL(uE)2 + FL(uE)3] ÷ 3
3.3 Statistical analysis
Percentage data were submitted to the arc-sine transformation (𝑌′=𝑎𝑟𝑐𝑠𝑒𝑛√𝑌);
the other variables were subjected to the Kolmogorov–Smirnov and Bartlett tests, to
verify the normality of errors and homogeneity of variances, respectively. When
necessary, the variables were subjected to transformations according to the
relationship between the means and variances (Barbosa, 1983) so that: the variables
GTFL(uNa+), GTFL(uK+), GTFL(uMg2+), GTFL(uCl−), and GTFL(uCreat) were
submitted to logarithmic transformation (𝑌′=log (𝑌+1)); the variables K+, Osm, Gluc,
and Lac were subjected to the root-square transformation (𝑌′=√𝑌+0.5); and the USG
variable was submitted to transformation 𝑌 ′ = 𝑌 – 96.
For analysis of the data, the Mixed Procedure of the Statistical Analysis System
(SAS, version 9.4) was used. The experiment was conducted in a crossover (6 × 2)
design with repeated measures over time, according to the model: 𝑌𝑖𝑗𝑘 = 𝜇 + 𝑆𝑖 + 𝑇𝑗 + (𝑆𝑇)𝑖𝑗 + 𝑒𝑖𝑗𝑘

32
where: 𝑌𝑖𝑗𝑘, observed response; 𝜇, constant; 𝑆𝑖, effect of the solution; 𝑇𝑗, effect of
time; (𝑆𝑇) 𝑖𝑗, interaction; 𝑒𝑖𝑗𝑘, random error.
The factor of repeated measures was the time (animal) for each level of animal
(treatment) (subject) and a covariance matrix with a compound symmetry structure
was used. The data were then submitted to analysis of variance and the means (LS-
means) compared by t test (Littell et al., 2006). The level of significance adopted was
α = 0.05.
4. Results
In the SEE1 animals, there was an increase (P < 0.05) in the PCV values at time
T4 and in the TPP values at T0. In SEE1, Osm increased at T4, T8, and T12, while in
SEE2 there was an increase only at T8 and T12. There was a difference between
treatments at T8 (Table 1).
There was a significant increase in the amount of Na+ in the SEE1 animals at
T12 and in the SEE2 animals at T8 and T12. In turn, an increase in K+ values was
recorded in both treatments at T12. The values of Cl− showed similar behavior in the
treatments, with an increase at T8, T12, and T24, however only in the SEE1 treatment
was there a decrease at T0 (Table 2).
Mg2+ in SEE1 showed a significant decrease at T4 and T−24. In SEE2, the
concentration of Mg2+ increased significantly at T8 and decreased (P < 0.05) at T24
(Table 2). A significant difference was observed between treatments at T−24 and T0.
Ca2+ values decreased at T8 and T12 in SEE1 and at T4, T8, and T12 in SEE2, while
phosphorus values increased at T12 in SEE1 and at T8 in SEE2 (Table 2).
33
USG showed a significant reduction in its values in both treatments at T0–3,
T6–9, and T9–12. The upH showed a difference between treatments at T24, while in
SEE1 a decrease was recorded at T9–12 and T24. In SEE2, a decrease was detected at
T24 (Table 3).
The variable uCreat increased at T0–3 and decreased at T3–6, T6–9, and T24 in SEE1
and increased at T0–3 and decreased at T3–6, T9–12, and T24 in SEE2 (Table 3).
The concentrations of uNa+ showed similar behavior in both treatments. The
values increased from T3–6, remaining until T24. The uK+ and uCl− showed similar
behavior in both treatments, there was a reduction at T0–3 and an increase in their
values from T6–9 to T24. The concentrations of uCa2+ decreased at T0–3 and T3–6
and increased at T24. The concentration of uMg2+ decreased at T0–3, T3–6, T6–9, and
T9–12 in SEE1, while in SEE2 the decrease was observed only at T3–6 (Table 3).
There was a decrease (P < 0.05) in the pH values in SEE1 from T4 to T24. In
SEE2, the decrease was recorded only at T8. In both treatments, pCO2 showed an
increase (P > 0.05) at T0 and T4 in relation to T24. The values of HCO3− and BE
Table 1
Mean ± standard deviations for parameters of goats submitted to treatments with two enteral electrolytic solutions: Packed cell
volume (PCV), Total plasma proteins (TPP) and Osmolarity (Osm).
Fluid therapy phase
Group T-24 T0 T4 T8 T12 T24
PCV SEE1 36.0 ± 3.4 cA 38.8 ± 2.7 abA 39.8 ± 4.0 aA 37.2 ± 1.9 bcA 35.2 ± 2.6 cA 36.3 ± 2.9 bcA
SEE2 38.0 ± 1.8 aA 37.8 ± 1.2 aA 37.8 ± 1.2 aA 36.7 ± 1.8 aA 35.5 ± 3.4 aA 37.5 ± 3.1 aA
TPP SEE1 6.9 ± 0.3 bcA 7.3 ± 0.4 aA 7.1 ± 0.4 abA 6.9 ± 0.3 bcA 6.7 ± 0.3 cA 6.9 ± 0.4 bcA
SEE2 7.0 ± 0.2 abA 7.2 ± 0.4 aA 7.1 ± 0.3 abA 6.9 ± 0.3 bA 6.8 ± 0.3 bA 6.9 ± 0.4 bA
Osm SEE1 297.5 ± 1.0 cA 297.5 ± 5.0 cA 300.5 ± 3.4 bA 302.2 ± 7.1 bB 306.8 ± 5.0 aA 297.5 ± 4.0 cA
SEE2 298.3 ± 4.4 bcA 296.8 ± 2.8 cA 302.2 ± 2.2 bA 309.2 ± 4.7 aA 310.2 ± 7.2 aA 299.8 ± 3.7 bcA
The mean values followed by different lowercase letters on the same line and different uppercase letters in the same column differ
from each other (P ≤ 0.05).

34
showed similar behavior in both treatments. They decreased from T8 to T24. At those
times, there was also a difference between treatments (Table 4).
Table 2
Mean ± standard deviations for biochemical parameters of goats subjected to treatments with two enteral electrolytic solutions:
Sodium (Na+), Potassium (K+), Chloride (Cl-), Magnesium (Mg2+), Calcium (Ca2+), Phosphate (P), Glucose (Gluc), Lactate (Lac),
Urea and Creatinine (Creat).
Fluid therapy phase
Group T-24 T0 T4 T8 T12 T24
Na+ SEE1 141.1 ± 1.5 cA 140.4 ± 1.5 cA 142.5 ± 1.8 bcA 144.4 ± 2.7 bA 147.1 ± 2.5 aA 143.8 ± 1.4 bA
SEE2 141.6 ± 1.5 bcA 140.2 ± 0.9 cA 143.1 ± 1.5 bA 146.9 ± 2.8 aA 148.5 ± 4.0 aA 143.6 ± 2.2 bA
K+ SEE1 4.16 ± 0.35 cA 3.84 ± 0.25 cA 4.19 ± 0.27 bcA 4.55 ± 0.18 abA 4.72 ± 0.23 aA 4.14 ± 0.52 cA
SEE2 4.11 ± 0.40 abA 4.06 ± 0.37 bA 4.23 ± 0.11 abA 4.39 ± 0.12 abA 4.48 ± 0.36 aA 4.28 ± 0.55 abA
Cl- SEE1 105.6 ± 1.6 cA 103.0 ± 1.0 dA 105.7 ± 1.7 cA 109.4 ± 2.0 bB 113.6 ± 2.0 aA 110.8 ± 1.0 bA
SEE2 106.3 ± 1.8 cdA 104.5 ± 2.0 dA 106.8 ± 1.1 cA 112.1 ± 2.2 bA 114.3 ± 4.1 aA 110.5 ± 2.5 bA
Mg2+ SEE1 2.88 ± 0.24 aA 2.68 ± 0.42 abA 2.57 ± 0.28 bA 2.67 ± 0.19 abA 2.70 ± 0.11 abA 2.48 ± 0.34 bA
SEE2 2.45 ± 0.34 abcB 2.25 ± 0.31 cdB 2.30 ± 0.29 bcdA 2.55 ± 0.18 aA 2.50 ± 0.15 abA 2.20 ± 0.37 dA
Ca2+ SEE1 1.27 ± 0.05 aA 1.24 ± 0.07 abA 1.22 ± 0.08 bcA 1.18 ± 0.07 cA 1.20 ± 0.04 cA 1.25 ± 0.05 abA
SEE2 1.23 ± 0.06 aA 1.21 ± 0.07 aA 1.17 ± 0.09 bA 1.14 ± 0.09 bA 1.17 ± 0.08 bA 1.23 ± 0.04 aA
P SEE1 4.82 ± 0.53 dA 5.48 ± 1.13 cdA 5.88 ± 1.58 bcA 6.43 ± 1.29 abA 7.08 ± 0.71 aA 5.63 ± 0.84 bcdA
SEE2 4.70 ± 1.26 dA 5.43 ± 0.99 cdA 5.83 ± 1.63 bcA 6.77 ± 1.70 aA 6.58 ± 1.49 abA 5.40 ± 1.26 cdA
Gluc SEE1 61.8 ± 6.5 aA 58.0 ± 8.7 aA 61.0 ± 7.6 aA 60.7 ± 10.4 aA 62.5 ± 9.5 aA 68.5 ± 20.6 aA
SEE2 58.2 ± 12.5 aA 53.5 ± 11.4 aA 62.2 ± 13.6 aA 64.7 ± 18.9 aA 70.2 ± 37.5 aA 56.2 ± 19.8 aA
Lac SEE1 5.93 ± 2.09 aA 6.77 ± 6.19 aA 6.62 ± 2.20 aA 6.00 ± 1.17 aA 4.75 ± 1.43 aA 6.72 ± 7.26 aA
SEE2 6.97 ± 6.44 aA 4.92 ± 3.11 aA 6.55 ± 3.10 aA 7.10 ± 5.78 aA 7.45 ± 2.94 aA 5.88 ± 3.59 aA
Urea SEE1 28.3 ± 16.4 aA 35.0 ± 21.5 aA 32.1 ± 15.8 aA 30.7 ± 10.9 aA 24.8 ± 13.0 aA 20.5 ± 12.9 aA
SEE2 26.6 ± 11.6 aA 40.7 ± 28.7 aA 40.0 ± 20.6 aA 32.9 ± 14.6 aA 29.9 ± 11.6 aA 22.8 ± 12.5 aA
Creat SEE1 1.14 ± 0.10 aA 1.20 ± 0.26 aA 1.05 ± 0.35 aA 1.10 ± 0.31 aA 1.11 ± 0.17 aA 1.20 ± 0.16 aA
SEE2 0.88 ± 0.27 aA 1.15 ± 0.23 aA 0.89 ± 0.31 aA 0.90 ± 0.18 aA 0.88 ± 0.13 aA 1.14 ± 0.39 aA
The mean values followed by different lowercase letters on the same line and different uppercase letters in the same column differ
from each other (P ≤ 0.05).

35
Table 3
Mean ± standard deviations for urinary parameters of goats submitted to treatments with two enteral electrolytic solutions: Urine
specific gravity (USG), Urinary hydrogen potential (upH), Urinary creatinine (uCreat), Urinary sodium (uNa+), Urinary chloride
(uCl-), Urinary potassium (uK+), Urinary calcium (uCa2+) and Urinary magnesium (uMg2+).
Fluid therapy phase
Group T-24 T0-3 T3-6 T6-9 T9-12 T24
USG SEE1 1022.2 ± 6.9 aA 1019.5± 6.0 abA 1008.0 ± 4.8 cA 1004.4 ± 2.8 dA 1003.6 ± 0.5 dA 1014.4 ± 5.6 bA
SEE2 1024.6 ± 8.8 aA 1018.0± 7.0 abA 1005.4 ± 3.3 cA 1003.2 ± 1.0 cA 1003.5 ± 0.9 cA 1013.8 ± 3.0 bA
upH SEE1 7.5 ± 0.5 aA 7.4 ± 0.4 aA 7.3 ± 0.3 abA 7.0 ± 0.3 abA 6.8 ± 0.6 bA 4.9 ± 0.6 cB
SEE2 7.7 ± 0.4 aA 7.1 ± 0.7 aA 7.3 ± 0.5 aA 7.2 ± 0.3 aA 7.3 ± 0.4 aA 6.2 ± 1.0 bA
uCreat SEE1 75.6 ± 30.6 abA 112.7 ± 64.5 aA 47.9 ± 12.4 bA 58.4 ± 22.5 bA 72.0 ± 22.5 abA 61.6 ± 28.1 bA
SEE2 48.2 ± 22.2 bA 91.9 ± 59.0 aA 46.3 ± 16.1 bA 65.5 ± 21.3 abA 48.7 ± 13.9 bA 49.8 ± 16.8 bA
uNa+ SEE1 1.5 ± 2.1 dA 1.7 ± 1.7 dA 6.2 ± 5.5 cA 20.9 ± 9.1 bA 48.0 ± 17.7 aA 21.2 ± 6.9 bA
SEE2 0.9 ± 0.9 dA 2.0 ± 2.3 dA 8.5 ± 8.1 cA 34.1 ± 11.8 aA 43.2 ± 10.9 aA 16.5 ± 9.5 bA
uCl- SEE1 21.0 ± 7.4 cA 5.8 ± 4.6 eA 11.8 ± 9.0 dA 37.8 ± 22.4 bcA 82.3 ± 31.3 aA 56.3 ± 20.2 abA
SEE2 12.5 ± 9.5 bA 6.4 ± 4.7 cA 14.5 ± 16.9 bA 59.2 ± 29.0 aA 75.6 ± 25.2 aA 51.9 ± 22.7 aA
uK+ SEE1 14.5 ± 7.3 aA 5.0 ± 1.9 cA 3.1 ± 1.8 cA 4.6 ± 1.8 cA 8.3 ± 3.0 bA 9.9 ± 7.1 abA
SEE2 8.8 ± 6.7 abA 3.0 ± 2.2 cA 3.5 ± 3.6 cA 5.1 ± 2.4 bA 6.7 ± 2.7 abA 9.4 ± 5.2 aA
uCa2+ SEE1 39.5 ± 40.8 abA 27.6 ± 30.5 bA 13.1 ± 20.9 bA 40.9 ± 62.7 abA 37.0 ± 47.0 abA 71.8 ± 93.6 aA
SEE2 21.5 ± 26.6 aA 28.2 ± 40.2 aA 23.4 ± 32.5 aA 34.0 ± 32.3 aA 36.1 ± 47.7 aA 56.0 ± 44.1 aA
uMg2+ SEE1 34.9 ± 19.0 aA 13.1 ± 11.8 bcA 5.9 ± 3.4 cA 11.0 ± 3.4 bcA 15.9 ± 4.3 bA 22.8 ± 20.7 abA
SEE2 21.3 ± 12.0 aA 17.4 ± 19.9 abA 8.5 ± 7.5 bA 13.8 ± 4.1 abA 16.3 ± 4.2 abA 19.5 ± 9.3 aA
The mean values followed by different lowercase letters on the same line and different uppercase letters in the same column differ
from each other (P ≤ 0.05).
The AG increased (P < 0.05) in SEE1 at T8 and T24, and showed a difference
between treatments at T8 and T24 (Table 4). SID values increased in SEE1 at T0 and
decreased at T24, while values in SEE2 increased at T4 and decreased at T12 and T24
(Table 4).
36
5. Discussion
Throughout the experiment, the animals remained alert, responsive, and active,
showing no signs of discomfort or changes in attitude or behavior with the probe and
the naso-ruminal probe for 12 hours, nor with the infusion of the enteral electrolyte
solution at the dose of 15ml kg-1 h-1. It is noteworthy that this therapeutic modality has
already been used in different animal species (Alves et al., 2019; Monteiro et al., 2020;
Ribeiro Filho et al., 2017, 2015). Its use is a minimally stressful practice for animals,
as described by other authors (Alves et al., 2019; Gomes et al., 2014).
The water and food restriction protocol caused a discreet change in some
variables, such as PCV and TPP, demonstrating that 24 hours of water–food restriction
is not enough to cause accentuated hydroelectrolytic and acid–base imbalances in this
Table 4
Mean ± standard deviations for blood gas parameters of goats submitted to treatments with two enteral electrolytic solutions:
Potential of hydrogen (pH), Partial pressure of carbon dioxide concentration (pCO2), Bicarbonate concentrations (cHCO3-), Bases
excess (BE), Anion gap (AG) and Strong ions difference (SID).
Fluid therapy phase
Group T-24 T0 T4 T8 T12 T24
pH SEE1 7.41 ± 0.02 aA 7.39 ± 0.03 abA 7.37 ± 0.02 bcA 7.35 ± 0.02 cdA 7.33 ± 0.03 dB 7.33 ± 0.07 dB
SEE2 7.41 ± 0.03 aA 7.38 ± 0.05 abA 7.39 ± 0.03 abA 7.38 ± 0.04 bA 7.39 ± 0.04 abA 7.39 ± 0.03 abA
pCO2 SEE1 44.7 ± 4.0 abA 47.9 ± 4.5 aA 48.2 ± 3.2 aA 46.3 ± 3.8 abA 46.2 ± 4.0 abA 43.7 ± 4.2 bA
SEE2 45.1 ± 5.1 abA 48.2 ± 8.0 aA 47.3 ± 4.9 aA 46.3 ± 5.8 abA 45.3 ± 5.1 abA 43.4 ± 3.7 bA
cHCO3-
SEE1 27.7 ± 1.0 abA 28.0 ± 1.1 aA 26.5 ± 0.6 bA 24.4 ± 1.0 cB 23.4 ± 1.4 cB 21.8 ± 1.7 dB
SEE2 28.0 ± 2.1 aA 27.6 ± 1.1 abA 27.5 ± 1.7 abA 26.3 ± 1.3 bcA 25.8 ± 1.1 cA 25.2 ± 1.7 cA
BE SEE1 3.15 ± 0.78 aA 2.92 ± 1.36 aA 1.65 ± 0.54 aA -0.45 ± 1.03 bA -1.98 ± 1.54 bcB -3.17 ± 3.25 cB
SEE2 3.47 ± 2.02 aA 2.45 ± 1.27 abA 2.52 ± 1.61 aA 0.83 ± 1.13 bA 0.92 ± 0.90 bA 1.07 ± 2.10 bA
AG SEE1 12.0 ± 1.7 cA 13.3 ± 1.8 bcA 14.5 ± 1.1 abA 15.2 ± 1.4 aA 14.8 ± 1.4 abA 15.3 ± 2.2 aA
SEE2 11.3 ± 2.4 aA 12.2 ± 0.5 aA 13.0 ± 1.9 aA 12.9 ± 1.9 aB 12.9 ± 1.7 aA 12.1 ± 2.0 aB
SID SEE1 39.7 ± 1.0 bA 41.3 ± 1.0 aA 41.0 ± 1.3 aA 39.6 ± 1.2 bA 38.1 ± 1.2 cA 37.1 ± 1.2 cA
SEE2 39.4 ± 1.5 abA 39.8 ± 1.3 abB 40.5 ± 1.5 aA 39.2 ± 1.1 bA 38.7 ± 1.2 bA 37.3 ± 1.3 cA
The mean values followed by different lowercase letters on the same line and different uppercase letters in the same column differ
from each other (P ≤ 0.05).
37
animal species, as the rumen functions as an important reservoir of water and goats are
extremely adept at maintaining water balance and using the rumen as a water reserve
for longer periods (Alves et al., 2019; Dahlborn and Karlberg, 1985; Silanikove, 2000).
Serum sodium and osmolarity did not show significant changes at T0, but
increased in both treatments during the fluid therapy phase, reaching the highest values
12 hours after the start of hydration (P < 0.05; Tables 1 and 2). This result demonstrates
that, despite the hypotonicity of the enteral electrolyte solutions, the values of the
variables mentioned above do not decrease, in contrast, there was an increase. Serum
or plasma hyponatremia can occur when electrolyte solutions with low sodium are
administered; this type of solution can also increase its intensity in patients who
already have this type of electrolytic imbalance. However, the electrolytic solutions
tested in the present study, by not having this type of adverse effect proved to be safe,
and may even be used in patients with mild hyponatremia. Similar results to the present
trial have been described in calves (Ribeiro Filho et al., 2017) and cattle (Alves et al.,
2019).
Urinary sodium corroborates this statement, as during the fluid therapy period
there was an increase in its excretion into the urine after three hours post-fluid therapy
(T3–6), reaching the highest rates at 12 hours of fluid therapy (T9–12) (P < 0.05; Table
3) and despite that, the animals did not present serum hyponatremia. It is noteworthy
that this increase, in addition to the composition of the electrolytic solution, also had
the contribution of decreasing aldosterone, because, with the increase in volume
resulting from the action of enteral fluid therapy, there is a decrease in aldosterone,
resulting in an increase in urinary sodium excretion (DiBartola, 2012a). However, as
mentioned by Ribeiro Filho et al. (2017), it should be emphasized that the use of

38
hypotonic enteral electrolytic solutions should be done with caution, especially in
cases of more pronounced hyponatremia, and with constant monitoring of the patient.
Serum potassium showed a slight change during the fluid therapy phase. This
result demonstrates that electrolyte solutions were able to maintain potassium
homeostasis in adult goats, confirming the results obtained by Atoji-Henrique et al.
(2012). However, when evaluating the potassium excreted in the urine, it was noticed
that from T0 there was a decrease in its values in animals in both treatments,
maintaining this characteristic until the end of the fluid therapy phase. Aldosterone is
the main modulator of potassium excretion in urine, increasing sodium absorption and
potassium excretion (DiBartola and De Morais, 2012). With rehydration and increased
blood volume in the animals, there was a decrease in aldosterone, with an increase in
uNa+ excretion and a decrease in uK+ (Table 3). This decrease may also have been
contributed to by the imposed fasting during the experimental phase (T−24 to T12),
because, as mentioned by Ward (1966), the main source of potassium for ruminants is
fodder. That said, in patients who are experiencing serum or plasma hypokalemia, as
in diarrhea and metabolic alkalosis associated with lack of appetite or anorexia, the
enteral electrolyte solution may contain more than 1g of KCl per liter.
The serum chloride showed a small decrease at T0 in the animals of both
treatments. Then, there was a gradual increase over time, reaching the highest values
at T12 in both treatments (P < 0.05; Table 3). The increase during the fluid therapy
phase was similar to Na+, being related to the composition of the enteral electrolyte
solutions. Both electrolytic solutions had salts that contained Cl− in their composition,
thus, providing significant amounts of this electrolyte to the animals.
The animals of both treatments, at T12, presented a low serum chloride value
above the reference range (Jerry Kaneko et al., 2008). Although SEE1 contained more

39
chloride in its composition (111.1 mmol/L) than SEE2 (93.2 mmol/L), unexpectedly,
there was no difference between them at T12 (P > 0.05; Table 3). Despite the absence
of a statistical difference, SEE1 promoted a 10.29% increase in serum chloride at the
end of the hydration phase (T12), while in SEE2, the increase was 9.37%. Perhaps the
decrease in chloride in SEE2 may make it more suitable for use in prolonged treatment
of animals that are not presenting hypochloremia.
As with urinary sodium excretion, urinary chloride excretion also increased.
This increase occurs because most of the filtered chloride in the renal glomeruli is
passively reabsorbed due to the reabsorption of sodium, therefore, because of the
greater excretion of sodium there is also a greater excretion of chloride, justifying the
findings of the present trial. (Waldrop, 2008).
Serum Ca2+ and Mg2+ values showed a small decrease in SEE1 and SEE2
(Table 2). These decreases signal the possibility of an increase in Ca2+ and Mg2+ in the
electrolyte solutions, since the urinary excretion of these two electrolytes also
decreased, especially in animals treated with SEE1. When there is an increase in renal
tubular flow, promoted by plasma expansion, there may be a decrease in the process
of tubular reabsorption of some substances, among them calcium and magnesium
(Riella, 2012), causing greater excretion of these elements. However, what was
observed was a decrease in uCa2+ and uMg2+ concentrations. Therefore, these results
point to the possibility of increasing the amount of Ca2+ and Mg2+ in the electrolytic
solution, especially for patients who have serum or plasma hypocalcemia and
hypomagnesemia.
The concentration of serum phosphorus increased in the fluid therapy phase in
the animals of both treatments. Despite this increase, the values remained within the

40
normal range mentioned by Jerry Kaneko et al. (2008), making them without clinical
significance.
Plasma glucose is not a better energy indicator in ruminants. They keep their
blood concentrations low in relation to other species due to the use of fats and volatile
fatty acids as an energy substrate (Kozloski, 2011). It can be seen that during the whole
experimental phase there were no changes in their values in both treatments (P > 0.05).
Plasma lactate is a good indicator of cellular respiratory activity (Jerry Kaneko, 2008).
However, its behavior was similar to that of glucose; there were no significant changes
(P > 0.05) in the animals of the two treatments during the entire experimental phase
(Table 2).
Serum creatinine did not show significant changes during the entire
experimental phase in animals from both treatments (P > 0.05). The urinary excretion
of creatinine showed a small decrease during the fluid therapy period in both
treatments. This decrease was caused by hemodilution resulting from the expansion of
blood volume (Tables 2 and 3).
Urine specific gravity is considered a good marker of dehydration and volume
expansion in animals. In the goats in the present trial, there was a significant decrease
in USG in both treatments, reaching the lowest values at T9–12 (P < 0.05, Table 3).
The results of the present trial demonstrated the effective and mainly early effect of
enteral fluid therapy in the expansion of blood volume, confirming the results obtained
by Dias et al. (2019), Alves et al. (2019) and Monteiro et al. (2020).
The blood pH of the animals that received SEE1 showed a slight decrease
during the fluid therapy phase, reaching the lowest value at T12, maintaining the
values at T24 (P < 0.05). In those that were infused with SEE2, the pH remained
unchanged during the fluid therapy phase, remaining so until the moment of final

41
evaluation. The decrease in pH from T8 observed in SEE1 animals reveals the presence
of mild acidemia, which was maintained until the final 24 hours of observation.
Bicarbonate and cBase showed similar behavior to blood pH, reaching the lowest
values in SEE1 animals at T12 and T24. The cBase showed negative rates, −3.7
mmol/L at T24, indicating the presence of mild metabolic acidosis (Table 4). The
persistence of these changes at T24 was due to the volume of the electrolyte solution
that remained in the rumen and that was absorbed after the end of the electrolyte
solution administration (T12 to T24).
Solutions with SID less than 25 mEq/L have an acidifying potential (Constable,
2014). The administration of this type of solution causes the appearance of metabolic
acidosis, emphasizing that the intensity of the acidosis will depend on the amount of
chloride, the volume, and the time of infusion of the solution. The composition of
SEE1, presenting the same amount of cations and anions, that is, SID = zero, makes it
acidifying. This characteristic translated into a decrease in the pH, cHCO3−, and cBase
of the animals, confirming low-intensity metabolic acidosis. Electrolyte solutions with
this peculiarity have a specific indication, patients with hypochloremic metabolic
alkalosis. According to Roussel (2014), more than 50% of adult ruminants that arrive
sick to hospitals for treatment have metabolic alkalosis, usually caused by changes in
abomasal emptying causing hypochloremia. Electrolytic solutions such as SEE1 are
indicated for the correction of these imbalances. Regarding SEE2, despite having
caused a small decrease in cBase at T8, T12, and T24, the values remained in the
normal range for goats (Redlberger et al., 2017).
The presence of mild metabolic acidosis caused by SEE1 was confirmed by the
urinary pH of the animals at T9–12 and T24 (P < 0.05, Table 3). Goats feeding with a
higher proportion of roughage have alkaline urinary pH like all herbivores (Jones et

42
al., 2012). The most intense aciduria recorded at T24 occurred 12 hours after the end
of hydration; it came from the effect of the residual volume of the electrolyte solution.
The supply of the diet shortly after the end of fluid therapy may also have contributed
to the decrease in urinary pH observed at T24. In turn, SEE2 did not change the urinary
pH during the administration of the electrolytic solution, which registered a decrease
in urinary pH only at T24, also signaling the contribution of the diet to this clinical
observation.
A small increase in the pressure of carbon dioxide (pCO2) was recorded at T0
and T4 in the animals of both treatments (Table 4). However, despite this increase, the
values remained within the normal range mentioned by Stevens et al. (1994), who
established the reference value for the variable in the caprine species between 34.6 and
48.8 mmHg.
Significant changes were observed in the AG values (Table 4) between treatments and
in the SEE1 treatment over time (P < 0.05). The AG is used primarily to detect
metabolic acidosis. This occurs when the values are above the reference range
(DiBartola, 2012b). In SEE1 animals, the highest values of AG were detected at T8,
T12, and T24, moments in which the lowest values of cHCO3− and cBase were
recorded. In metabolic acidosis, cHCO3− and cBase decrease, as in the formula for
calculating AG the value of cHCO3− is used. This decrease caused by its use to
neutralize H+ ions will be reflected in the increase in the value of AG, expressing the
presence of metabolic acidosis generated by the composition of SEE1. In animals that
received SEE2, there was no variation in the AG over time (P > 0.05). The difference
between treatments occurred at T8 and T24, times when the AG of SEE1 was higher
than SEE2 (P < 0.05), confirming the mild acidifying effect of SEE1.

43
The values for difference of strong ions showed no difference between the
experimental groups (P > 0.05). At T8, T12, and T24, the lowest SID values were
recorded in SEE1 and SEE2 (Table 4). This decrease was caused by chloride, since it
occurred in the respective times that the highest values of the chloride ion were
detected (Table 2). Care should be taken with the amount of chloride, because if the
amount is exacerbated and the patient is not presenting hypochloremia, a type of
acidosis that is common in animals, called hyperchloremic metabolic acidosis, can be
produced iatrogenically (Constable, 2003), which has as a cause solutions with high
chloride content or solutions with low SID.
6. Conclusion
The studied enteral electrolytic solutions are effective in expanding blood
volume. As it contains more chloride and a lower SID, Enteral Electrolytic Solution 1
demonstrated a low-intensity acidifying potential, which makes it a choice for patients
with hypochloremic metabolic alkalosis, while Enteral Electrolytic Solution 2 can be
used as a maintenance electrolytic solution for patients with discrete or no electrolyte
and acid–base imbalances.

44
References
AGUILERA-TEJERO, E. Calcium homeostasis and derangements. In: FIELDING,
C.L. AND MAGDESIAN, K.G. Equine Fluid Therapy. 1st ed. Iwoa: Wiley
Blackwell. 2015. p.55-75.
ALVES, J.T.L.; TROSTER, E.J.; OLIVEIRA, C.A.C. Isotonic saline solution as
maintenance intravenous fluid therapy to prevent acquired hyponatremia in
hospitalized children. Jornal de pediatria, v. 87, p. 478-486, 2011.
ALVES, S.R. et al. Two enteral solutions with different chloride concentrations
administered by naso-ruminal route for fluid therapy in adult cattle. Ciência Rural, v.
49, n. 8, p. 1-6, 2019.
ATOJI-HENRIQUE, K.; RIBEIRO FILHO, J.D.; MALAFAIA, P. Enteral fluid
therapy through nasogastric tube in rumen cannulated goats. Pesquisa Veterinária
Brasileira, v. 32, n. 12, p. 1281-1284, 2012.
AVANZA, M.F.B. et al. Enteral fluid therapy in horses - electrolyte solution
associated or not with glucose, maltodextrine and magnesium sulphate: laboratory
results. Ciência Rural, v.39, p. 1126-1133, 2009.
BARBOSA, J.C.O. Problema de heterocesdasticidade na análise de variância, in:
Seminário Apresentado Ao Censo de Estatística e Experimentação de ESALQ-
USP. ESALQ, Piracicaba, 1983. p. 14.
BECK, C.E. Hypotonic versus isotonic maintenance intravenous fluid therapy in
hospitalized children: a systematic review. Clinical Pediatrics, v. 46, n. 9, p. 764-770,
2007.
CARLSON, G.P.; BRUSS, M. Fluid, electrolyte and acid-base balance. In: KANEKO,
J. Clinical biochemistry of domestic animals. 6th ed. London: Academic Press,
2008. p. 529-559.

45
CONSTABLE, P.D. Acid-base assessment: when and how to apply the Henderson-
Hasselbalch equation and strong ion difference theory. Veterinary Clinics: Food
Animal Practice, v. 30, n. 2, p. 295-316, 2014.
CONSTABLE, P.D. Fluid and electrolyte therapy in ruminants. Veterinary Clinics
of North America: Food Animal Practice, v. 19, n. 3, p. 557-597, 2003.
CONSTABLE, P.D. Clinical Assessment of Acid-Base Status: Comparison of the
Henderson-Hasselbalch and Strong Ion Approaches. Vetereinary Clinical Pathology,
v. 29, p. 115-128. 2000.
DAHLBORN, K.; KARLBERG, B.E. Fluid Balance During Food Deprivation and
After Intraruminal Loads of Water or Isotonic Saline in Lactating and Anoestral Goats.
Quarterly Journal of Experimental Physiology, v. 71, p. 223-233. 1985.
DARRELL L.; RANKINS, J.R.; PUGH, D.G. Feeding and Nutrition. In: PUGH, D.
G.; BAIRD, A.N. Sheep and Goat Medicine, 2th ed. Maryland Heights: Elsevier
Saunders, 2012. p. 18-49.
DE MORAIS, H.A.; BIONDO, A.W. Disorders of Chloride: Hyperchloremia and
Hypochloremia. In: DIBARTOLA, S.P. Fluid, Electrolyte, and Acid-Base
Disorders in Small Animal Practice, 4th ed. St Louis: Elsevier Saunders, 2012. pp.
80-91.
DIAS, D.C.R. et al. Comparative evaluation between different kinds of
hydroeletrolitic reposition in horses experimentally dehydrated by the use of physical
examination parameters and hematological markers. Revista Brasileira de Ciência
Veterinária, v. 26, p. 34-41, 2019.
DIBARTOLA, S.P. Disorders of Sodium and Water: Hypernatremia and
Hyponatremia. In: DIBARTOLA, S.P. Fluid, Electrolyte, and Acid-Base Disorders
in Small Animal Practice, 4th ed. St Louis: Elsevier Saunders, 2012a. p. 45-79.

46
DIBARTOLA, S.P.; DE MORAIS, H.A. Disorders of Potassium: Hypokalemia and
Hyperkalemia. In: DIBARTOLA, S. P. Fluid, Electrolyte, and Acid-Base Disorders
in Small Animal Practice, 4th ed. St Louis: Elsevier Saunders, 2012. p. 92-119.
DIVERS, T.J.; PEEK, S.F. Rebhun's Diseases of Dairy Cattle. 4th ed. St. Louis:
Elsevier Saunders, 2018. p. 704.
ERMITA, P.A.N. et al. Effects of Enteral Fluid Therapy in Continuous Flow
Administered by Nasogastric Tube in Buffalo Calves. Journal of Buffalo Science, v.
5, n. 3, p. 60-69, 2016.
FRY, A.C.; KARET, F.E. Inherited renal acidoses. Physiology, v. 22, n. 3, p. 202-211,
2007.
GARELLA, S.; CHANG, B.S.; KAHN, S.I. Dilution acidosis and contraction
alkalosis: review of a concept. Kidney international, v. 8, n. 5, p. 279-283, 1975.
GOMES, C.L.; RIBEIRO FILHO, J.D.; GUIMARÃES, J.D.; MENESES, R.M.
Efeitos do polietilenoglicol 3350 e de soluções acidificantes e alcalinizantes sobre o
perfil bioquímico de éguas hígidas. Arquivo Brasileiro de Medicina Veterinária e
Zootecnia, v. 64, n. 4, p. 817-826, 2012.
HALL, J.E. Guyton and Hall textbook of medical physiology. 12th ed. St. Louis:
Elsevier Saunders, 2011. pp. 1120.
JERRY KANEKO, J. Carbohydrate Metabolism and Its Diseases. In: JERRY
KANEKO, J.; HARVEY, J.W.; BRUSS, M.L. Clinical biochemistry of domestics
animals. 6th ed. San Diego: Academics Press, 2008.
JERRY KANEKO, J.; HARVEY, J.W.; BRUSS, M.L. Appendix VIII Blood Analyte
Reference Values in Large Animals, In: JERRY KANEKO, J.; HARVEY, J.W.;
BRUSS, M.L. Clinical biochemistry of domestics animals. 6th ed. San Diego:
Academics Press, 2008. p. 882–888.

47
JERRY KANEKO, J.; HARVEY, J.W.; BRUSS, M.L. Clinical biochemistry of
domestics animals. 6th ed. San Diego: Academics Press, 2008.
Jones, M.; Miesner, M.D.; Baird, A.N.; Pugh, D.G. Diseases of the Urinary System,
In: PUGH, D.G.; BAIRD, A.N. Sheep and Goat Medicine, 2th ed. Maryland Heights:
Elsevier Saunders, 2012. pp. 325-360.
JONES, M.; NAVARRE, C. Fluid Therapy in Small Ruminants and Camelids.
Veterinary Clinics of North America: Food Animal Practice, v. 30, n. 2, p. 441-
453, 2014.
KIRCHNER, D.; SCHWEDHELM, L.; COENEN, M.; BACHMANN, L. Dietary
influences on the hydration and acid–base status of experimentally dehydrated dairy
calves. The Veterinary Journal, v. 199, n. 2, p. 251-257, 2013.
Kozloski, G.V. Bioquímica dos Ruminantes, 3rd ed. Santa Maria: Editora da UFSM.
2011. p. 212.
LITTELL, R.C. et al. SAS® for mixed models, 2nd ed. Cary: SAS Institute Inc. 2006.
p. 96.
LOPES, M.A.F. et al. Fluidoterapia enteral em cavalos: relato de casos clínicos e
cirúrgicos. Brazilian Journal of Veterinary Research and Animal Science, v. 41,
supl., p. 270-271, 2004.
LOPES, M.A.F.; WALKER, B.L.; WHITE II, N.A; WARD, D.L. Treatments to
promote colonic hydration: enteral fluid therapy versus intravenous fluid therapy and
magnesium sulphate. Equine veterinary journal, v. 34, n. 5, p. 505-509, 2002.
LUKE, R.G.; GALLA, J.H. It is chloride depletion alkalosis, not contraction alkalosis.
Journal of the American Society of Nephrology, v. 23, n. 2, p. 204-207, 2012.
MADIAS, N.E.; ADROGUÉ, H.J. Respiratory Acid–Base Disorders. In: Seldin and
Giebisch's The Kidney. Academic Press, 2013. p. 2113-2138.

48
MAHALANABIS, D.; FARUQUE, A.S.G.; HOQUE, S.S.; FARUQUE, S.M.
Hypotonic oral rehydration solution in acute diarrhoea: a controlled clinical trial. Acta
Paediatrica, v. 84, n. 3, p. 289-293, 1995.
MARTÍN-TERESO, J.; MARTENS, H. Calcium and magnesium physiology and
nutrition in relation to the prevention of milk fever and tetany (dietary management of
macrominerals in preventing disease). Veterinary Clinics: Food Animal Practice, v.
30, n. 3, p. 643-670, 2014.
MCNAB, S. et al. 140 mmol/L of sodium versus 77 mmol/L of sodium in maintenance
intravenous fluid therapy for children in hospital (PIMS): a randomised controlled
double-blind trial. The Lancet, v. 385, n. 9974, p. 1190-1197, 2015.
MONTEIRO, L.C. et al. Effects of hypotonic and isotonic enteral electrolyte solutions
administered in continuous flow in weaned foals. Frontiers Veterinary Science, 7, p.
1-10. 2020.
NETO, J.A.S. et al. Distúrbios metabólicos em ruminantes – Uma Revisão. Revista
Brasileira de Higiene e Sanidade Animal, v. 8, n. 4, p. 157-186, 2014.
REDLBERGER, S. et al. Age-dependent physiological dynamics in acid–base
balance, electrolytes, and blood metabolites in growing goats. The Veterinary
Journal, v. 229, p. 45-52, 2017.
RIBEIRO FILHO, J.D. et al. Hidratação enteral em bovinos via sonda nasogástrica
por fluxo contínuo. Ciência Animal Brasileira, v. 11, Supl, p. 24-28, 2009.
RIBEIRO FILHO, J.D. et al. Avaliação de soluções eletrolíticas isotônicas
administradas por sonda nasogástrica em bovinos adultos hígidos ou desidratados
experimentalmente. Veterinária e Zootecnia, v. 20, n. 3, p. 09-16, 2013.

49
RIBEIRO FILHO, J.D. et al. Enteral electrolyte solutions with different osmolarities
administered in a continuous flow in newborn calves. Ciência Rural, v. 47, p. 1-6,
2017.
RIBEIRO FILHO, J.D. et al. Enteral Electrolyte Solutions With Different
Osmolarities: Clinical and Laboratory Assessment in Equines. Journal of Equine
Veterinary Science, v. 35, p. 673-678, 2015.
RIBEIRO FILHO, J.D. et al. Enteral Fluid Therapy: Biochemical Profile of Horses
Treated with Hypotonic Enteral Electrolyte Solutions Associated with Energy
Sources. Journal of Equine Veterinary Science, v. 34, n. 6, p. 759-764, 2014.
RIBEIRO FILHO, J.D. et al. Hidratação enteral em bovinos: avaliação de soluções
eletrolíticas isotônicas administradas por sonda nasogástrica em fluxo contínuo.
Ciência Rural, v. 41, n. 2, p. 285-290, 2011.
RIBEIRO FILHO, J.D. Soluções eletrolíticas com baixa osmolaridade são eficazes na
hidratação enteral. Veterinária e Zootecnia, v. 18, supl, p. 47-50, 2011.
RIELLA, M.C. Princípios de nefrologia e distúrbios hidroeletrolíticos, 5th ed. Rio
de Janeiro: Guanabara Koogan, 2012, p. 212.
ROUSSEL, A.J. Fluid therapy in mature cattle. Veterinary Clinics: Food Animal
Practice, v. 30, n. 2, p. 429-439, 2014.
SCHENCK P.A. et al. Disorders of Calcium: Hypercalcemia and Hypocalcemia. In:
DIBARTOLA, S. P. Fluid, Electrolyte, and Acid-Base Disorders in Small Animal
Practice, 4th ed. St Louis: Elsevier Saunders, 2012, p. 120-194.
SILANIKOVE, N. The physiological basis of adaptation in goats to harsh
environments. Small Ruminant Research, v. 35, p. 181-193, 2000.
SMITH, G.W. Treatment of calf diarrhea: Oral fluid therapy. Veterinary Clinics of
North America: Food Animal Practice, v. 25, n. 1, p. 55-72, 2009.

50
SMITH, G.W.; BERCHTOLD, J. Fluid therapy in calves. Veterinary Clinics of
North America: Food Animal Practice, v. 30, n. 2, p. 409-427, 2014.
SPEIRS, V.C.; WRIGLEY, R.H. Clinical examination. In: SPEIRS, V.C. Clinical
examination of horses. Philadelphia: Saunders, 1997. p. 9-27.
STEVENS, J.B. et al. Hematologic, Blood Gas, Blood Chemistry, and Serum Mineral
Values for a Sample of Clinically Healthy Adult Goats. Veterinary Clinical
Pathology, v. 23, p. 19-24. 1994.
STEWARD, A.J. Magnesium homeostasis and derangements. In: FIELDING, C.L.;
MAGDESIAN, K.G. Equine Fluid Therapy. 1st ed. Iwoa: Wiley Blackwell, 2015, p.
76-87.
WALDROP, J.E. Urinary Electrolytes, Solutes, and Osmolality. Veterinary Clininal
of Small Animal Practice, v. 38, p. 503-512, 2008.
WALZ, P.H.; TAYLOR, D. Fluid Therapy and Nutritional Support. In: PUGH, D.G.;
BAIRD, A.N. Sheep and Goat Medicine, 2th ed. Maryland Heights: Elsevier
Saunders, 2012, p. 50-59.
WARD, G.M. Potassium Metabolism of Domestic Ruminants - A Review. Journal of
Dairy Science, v. 49, p. 268-276, 1966.
WEINER, I.D.; WINGO, C.S. Hypokalemia--consequences, causes, and correction.
Journal of the American Society of Nephrology, v. 8, n. 7, p. 1179-1188, 1997.
WELLMAN, M.L.; DiBARTOLA, S.P.; KOHN, C.W. Applied physiology of body
fluids in dogs and cats. In: DiBARTOLA, S.P. Fluid, electrolytes, and acid-base
disorders in small animal practice. 4.ed. USA: Elsevier Sunders, 2012. p. 02-26.
WHO. World Health Organization. Oral rehydration salts: A new reduced
osmolarity formulation. 2014. Disponível em: http://rehydrate.org/ors/expert-
consultation.html. Acesso em: 06 de novembro de 2018.

51
Attachments
Annex 1 - Reference values for packed cell volume, biochemical and blood gas analysis in goats.
JERRY KANEKO, J.; HARVEY, J.W.; BRUSS, M.L. Appendix VIII Blood Analyte
Reference Values in Large Animals. In: JERRY KANEKO, J.; HARVEY, J.W.;
BRUSS, M.L. (Eds.), Clinical Biochemistry of Domestic Animals. Academics Press,
San Diego, 2008. pp. 882-888.
Parameter Reference value Source
Blood count
Packed cell volume % 22-38 Pugh et al, 2012
Biochemical analysis
Sodium mMol/L 142-155 Pugh et al, 2012
Potassium mMol/L 3.5-6.7 Pugh et al, 2012
Chloride mMol/L 99-110,3 Kaneko et al, 2008
Ionic calcium mMol/L 2.23-2.93 Kaneko et al, 2008
Magnesium mg/dL 2.8-3.6 Pugh et al, 2012
Phophorum mg/dL 4.2-9.1 Pugh et al, 2012
Creatinine mg/dL 1.0-1.82 Pugh et al, 2012
Glucose mg/dL 50-75 Pugh et al, 2012
Lactate mg/dL
Proteínas plasmáticas g/dL 6.4-7.0 Pugh et al, 2012
Osmolarity mOsm/L
Blood gas analysis
pH 7.45±0.073 Nunes et al, 2014
Base excess mEq/L 0-5 Redlberger et al, 2017
Bicarbonate mEq/L 28.7±4.1 Nunes et al, 2014
pCO2 mmHg 34.6-48.8 Stevens et al, 1994
Anion GAP mEq/L 11-20 Redlberger et al, 2017
SID mEq/L 41-46 Redlberger et al, 2017
52
NUNES T.L.; OLIVEIRA M.G.C.; PAIVA A.L.C.; BEZERRA T.C.G.; BARRÊTO
JÚNIOR R.A.; PAULA V.V. Valores hemogasométricos de caprinos (Capra hircus)
da raça Canindé criados no semiárido nordestino. Revista Brasileira de Medicina
Veterinária, v. 36, n. 3, p. 255-260, 2014.
PUGH, D.G.; BAIRD, A.; NICKIE. Sheep and Goat Medicine. Elsevier Saunders,
Maryland Heights, 2012. pp. 598.
REDLBERGER, S.; FISCHER, S.; KÖHLER, H.; DILLER, R.; REINHOLD, P. Age-
dependent physiological dynamics in acid–base balance, electrolytes, and blood
metabolites in growing goats. Veterinary Journal, v. 229, p. 45-52, 2017.
STEVENS, J.B.; ANDERSON, K.L.; CORREA, M.T.; STEWART, T.;
BRASELTON, W.E. Hematologic, Blood Gas, Blood Chemistry, and Serum Mineral
Values for a Sample of Clinically Healthy Adult Goats. Veterinary Clinical
Pathology, v. 23, p. 19-24, 1994.

53
Annex 2 – Pictures

54