
Enhancing Climate Resilience of National Highways ... - TERI
156
Reducing Carbon Footprint and Enhancing Climate Resilience of National Highways in India The Energy and Resources Institute Component II: Enhancing Climate Resilience of National Highways Ministry of Road Transport and Highways World Bank Technical Assistance Program
-
Upload
khangminh22 -
Category
Documents
-
view
0 -
download
0
Transcript of Enhancing Climate Resilience of National Highways ... - TERI

Reducing Carbon Footprint and Enhancing Climate Resilience of
National Highways in India
The Energy and Resources Institute
Component II: Enhancing Climate Resilience of National Highways
Ministry of Road Transport and Highways
World Bank Technical Assistance Program

Prepared for Ministry of Road Transport and Highways
Reducing Carbon Footprint and Enhancing Climate Resilience of
National Highways in India
The Energy and Resources Institute
Component II: Enhancing Climate Resilience of National Highways
Ministry of Road Transport and Highways
World Bank Technical Assistance Program

© The Energy and Resources Institute (TERI), 2017
T E R I. 2017
Final Report – Component II: Enhancing Climate Resilience of National Highways
New Delhi: The Energy and Resources Institute.
For more information
Project Monitoring Cell
T E R I Tel. 2468 2100 or 2468 2111
Darbari Seth Block E-mail [email protected]
IHC Complex, Lodhi Road Fax 2468 2144 or 2468 2145
New Delhi – 110 003 Web www.teriin.org
India India +91 • Delhi (0)11

iii
Table of Contents
List of Tables v
List of Figures vii
List of Graphs ix
List of Maps xi
Acknowledgements xiii
Project Team xv
Abbreviations and Acronyms xvii
Glossary of Terms xix
Introduction to the Study xxiii
1. Introduction 1
2. Impact of Climate Change on Highways 11
3. Climate Vulnerability Assessment of Highways 15
4. Applying the Proposed Methodology for Vulnerability Assessment of Highways 33
5. Recommendations for Building Resilience of Highways Sector in India 81
6. References 97
7. Annexures 101

iv
Reducing Carbon Footprint and Enhancing Climate Resilience of National Highways in IndiaTABLE OF CONTENTS

v
List of Tables
Table 1: Impact matrix of climate events and vulnerable transport infrastructure 6
Table 2: Key design parameters to be considered for climate proofing transport infrastructure 7
Table 3: Impact of past extreme weather events on road and highway infrastructure in India 9
Table 4: Impact of climate change on highways 14
Table 5: Reviewed VA methodologies 18
Table 6: Vulnerability assessment task/stages 21
Table 7: Criticality criteria for highways 22
Table 8: Indicative checklist of criticality assessment parameters 32
Table 9: Risk assessment assumptions for highway elements and infrastructure 32
Table 10 Parameters for country level vulnerability assessment of NH 41
Table 11: Vulnerable National Highway stretches 42
Table 12 : Meteorological Data for study stretch of NH 5 52
Table 13: Vulnerability parameters for study stretch of NH 55
Table 14: Loss and damage of past events for study stretch of NH 5 57
Table 15: Risk assessment matrix for study stretch of NH 5 58
Table 16: Meteorological Data for study stretch of NH 216 67
Table 17 Vulnerability Parameters for study stretch of NH 216 74
Table 18: Risk Assessment Matrix for study stretch of NH 216 75
Table 19: Region-wise engineering interventions 84
Table 20: Indicative data checklist for facilitating resilience planning efforts for the NHs sector in India 91
Table 21: Parameters for classifying adaptation interventions 93
Table 22: Classification of interventions 93

vi
Reducing Carbon Footprint and Enhancing Climate Resilience of National Highways in India

vii
List of Figures
Figure 1 Methodology of Study 4
Figure 2 Activities and steps involved in climate proofing transport investment 21
Figure 3 Five-step protocol adopted by the study 22
Figure 4 Factors considered for the vulnerability assessment of roads 23
Figure 5 : Climate Change and Extreme Weather Vulnerability Assessment Framework 24
Figure 6 Risk Rating Matrix 24
Figure 7 Assessment framework; Dorset County Council, UK 25
Figure 8: Risk Assessment Framework for urban infrastructure and communities 26
Figure 9: Methodology for Climate Vulnerability Assessment of Highways 28
Figure 10: Extreme wet days contribution to the total rainfall in the near future (2020–2050) 53
Figure 11: Proposed institutional framework for climate change unit in MoRTH 89

viii
Reducing Carbon Footprint and Enhancing Climate Resilience of National Highways in IndiaLIST OF GRAPHS

ix
List of Graphs
Graph 1: Shimla annual mean of total monthly rainfall 104
Graph 2: Shimla annual rainfall anomaly 104
Graph 3: Shimla summer rainfall 104
Graph 4: Shimla monsoon rainfall 104
Graph 5: Shimla winter rainfall 105
Graph 6: Shimla maximum rainfall 105
Graph 7: Shimla seasonal thunderstorm days 105
Graph 8: Shimla seasonal thunderstorm days 105
Graph 9: Shimla total thunderstorm days in a year 105
Graph 10: Rampur total rainfall 106
Graph 11: Rampur total yearly rainfall anomaly 106
Graph 12: Rampur summer rainfall (total) 106
Graph 13: Rampur monsoon rainfall (total) 106
Graph 14: Rampur winter rainfall (total) 106
Graph 15: Rampur maximum rainfall event 107
Graph 16: Kalpa annual mean of total monthly rainfall 107
Graph 17: Kalpa annual rainfall anomaly 107
Graph 18: Kalpa seasonal total rainfall 107
Graph 19: Kalpa summer rainfall (total) 107
Graph 20: Kalpa monsoon rainfall (total) 108
Graph 21: Kalpa winter rainfall (total) 108
Graph 22: Kalpa maximum rainfall 108
Graph 23: Kalpa seasonal thunderstorm days 108
Graph 24: Kalpa thunderstorm days (seasonal) 108
Graph 25: Kakinada annual mean of total monthly rainfall 109

x
Graph 26: Kakinada annual rainfall anomaly 109
Graph 27: Kakinada seasonal total rainfall 109
Graph 28: Kakinada Annual Maximum Rainfall 109
Graph 29: Kakinada monthly climatology of average winds 109
Graph 30: Kakinada seasonal average wind speeds 110
Graph 31: Machilipatnam annual mean of total monthly rainfall 110
Graph 32: Machilipatnam annual rainfall anomaly 110
Graph 33: Machilipatnam seasonal total rainfall 110
Graph 34: Machilipatnam annual maximum rainfall 110
Graph 35: Machilipatnam monthly climatology of average winds 111
Graph 36: Machilipatnam seasonal average wind speeds 111
Graph 37: Narsapur annual mean of total monthly rainfall 111
Graph 38: Narsapur annual rainfall anomaly 111
Graph 39: Narsapur seasonal total rainfall 111
Graph 40: Narsapur annual maximum rainfall 112
Graph 41: Narsapur monthly climatology of average winds 112
Graph 42: Narsapur seasonal average wind speeds 112
Graph 43: Tuni annual mean of total monthly rainfall 112
Graph 44: Tuni annual rainfall anomaly 112
Graph 45: Tuni seasonal total rainfall 113
Graph 46: Tuni annual maximum rainfall 113
Graph 47: Bapatla annual mean of total monthly rainfall 113
Graph 48: Bapatla annual rainfall anomaly 113
Graph 49: Bapatla seasonal total rainfall 114
Graph 50: Bapatla annual maximum rainfall 114
Graph 51: Bapatla monthly climatology of average winds 114
Graph 52: Bapatla seasonal average wind speeds 114
Graph 53: Ongole annual mean of total monthly rainfall 115
Graph 54: Ongole annual rainfall anomaly 115
Graph 55: Ongole seasonal total rainfall 115
Graph 56: Ongole annual maximum rainfall 115
Graph 57: Ongole monthly climatology of average winds 115
Graph 58: Ongole seasonal average wind speed 115
List of Graphs

xi
List of Maps
Map 1: Geographical delineation - National Highways at the country level in India 36
Map 2: Percentage change in extreme rainfall events -future scenario 39
Map 3: Cyclone and wind hazard map of India 40
Map 4: Earthquake hazard map of India 48
Map 5: Vulnerability mapping for National Highways 49
Map 6: Study area: NH 5 Shimla-Kinnaur (up to Moorang) 51
Map 7: Maximum rainfall received in a day during 1986–2015 54
Map 8: Extreme wet days contribution to the total rainfall in the near future 56
Map 9: Slope Analysis 59
Map 10: Past events — landslides 60
Map 11: Past events —Avalanches, Flash floods 1973–2016 61
Map 12: Vulnerability Map 62
Map 13: Most vulnerable section of the study stretch 63
Map 14: Study area map 66
Map 15: Maximum rainfall received in a day for the time period 1980–2009 69
Map 16: Areas effected by high cyclonic event in the past (1980–2009) 70
Map 17: Change in rainfall over very wet days in future (2070–2100) 71
Map 18: Future Climate Scenario with 4 m storm surge 72
Map 19: Future Climate Scenario with 6 m storm surge 73
Map 20: Inundation prone area based on past events 76
Map 21: Overall vulnerability mapping for NH 216 77
Map 22: Highly vulnerable section A for NH 216 - Narsapur to Bapatla 78
Map 23: Highly vulnerable section B for NH 216 - Kakinada to Amalapuram 79

xii
Reducing Carbon Footprint and Enhancing Climate Resilience of National Highways in India

xiii
We are grateful to the Ministry of Road Transport and Highways (MoRTH), Government of India, for awarding
this study to TERI as part of the World Bank Technical Assistance Program. We are particularly thankful to
Ms Debjani Chakrabarti, Director (Highways), MoRTH, for her constant involvement and support during the
course of this study.
TERI acknowledges the support of Mr Sanjay Mitra, Defence Secretary; Mr Yudvir S Malik, Secretary RTH; Ms
Leena Nandan, AS & FA, MoRTH; Mr Rohit Kumar Singh, Member (Finance), NHAI; Mr Manoj Kumar, DG
(RD) & SS, MoRTH; and Mr Kamlesh Chaturvedi, Joint Secretary, MoRTH, for providing policy direction to
the study.
TERI would like to thank Mr Rajesh Rohtagi Senior Transport Specialist, World Bank; Mr Arnab Bandyopadhyay,
Lead Transport Specialist, World Bank; Mr Gaurav D Joshi, Senior Environmental Specialist, Environment and
Natural Resources Global Practice, World Bank; and Mr S Vaideeswaran, Environmental Specialist – Consultant,
World Bank, for providing constructive inputs throughout the study.
TERI would particularly like to express its deep gratitude to Mr R K Pandey, Member (Projects) NHAI;
Mr Anand Kumar Singh, Member (Projects), NHAI; Mr S P Sharma, GM (Environment), NHAI; Mr D
Roychowdhury Director (System & Development), Central Public Works Department; Mr S K Nirmal,
Secretary General, Indian Roads Congress; Mr K Sitaramanjaneyulu, Senior Principal Scientist & Head,
Pavement Evaluation Division; Mr Sunil Jain, Senior Principal Scientist; and Dr Devesh Tiwari, Senior
Principal Scientist of Central Road Research Institute; Ms Mini Korulla, Vice President and Ms Anunsha
Nandavaram, Engineer, Maccaferri Environmental Solutions Pvt. Ltd; Mr V C Verma, Director (Marketing)
and Mr Gishnu Karthik Sridharan, General Manager (Marketing) from Oriental Structural Engineers Pvt. Ltd;
Dr Sreejith Narayanan, AVP, IL&FS; and Mr M B Bajulge, Managing Director, Elsamex, for sparing their valuable
time and contributing to the study.
TERI is also grateful to various officials from National Highways Authority of India (NHAI) headquarters,
NHAI PIUs in Patna, Lucknow, Kanpur, Jodhpur, Bhubaneswar, and Visakhapatnam, Transport Research
Wing, MoRTH, MoRTH PIU in Kakinada, public works departments of Himachal Pradesh and Uttarakhand,
Indian Highways Management Company Ltd, Maharashtra State Road Development Corporation, State
Disaster Management Authority, Himachal Pradesh and Andhra Pradesh, and National Remote Sensing Centre,
Hyderabad.
Acknowledgements

xiv
TERI would particularly like to thank Mr Yeshwanth Reddy, MoRTH, for his constant help and support
throughout the study. TERI also extends its gratitude to all the participants who participated in the stakeholder
workshops for their time, inputs, and expert advice that helped in shaping this study.
The project team would like to thank Mr S Sundar, Mr Shri Prakash, and Mr S Vijay Kumar, Distinguished
Fellows, TERI, for their constant guidance throughout the study.
The project team would also like to thank TERI’s Programme Cell for all the support extended in conducting the
stakeholder workshops and the TERI Press team for their support towards publication of the report.
Acknowledgements

xv
Advisors
Mr S Sundar
Mr Shri Prakash
Principal Investigator
Ms Akshima T Ghate
Co-principal Investigator
Ms Riya Rahiman
Team Members
Mr Sharif Qamar
Ms Saloni Gupta
Ms Raina Singh
Mr Yashwanth Kumar Puduchari
Mr Saurabh Bhardhwaj
Ms Seema Kundu
Ms Megha Kumar
Mr Sarbojit Pal
Ms Sangeetha Ann Wilson
Mr Abhinav Bakre
Secretarial Assistance
Ms Sonia Khanduri
Editing and Designing (TERI Press)
Ms Anushree Tiwari Sharma
Ms Naina Mukerji
Mr Rajiv Sharma
Mr Raman Jha
Project Team

xvi
Reducing Carbon Footprint and Enhancing Climate Resilience of National Highways in India

xvii
AADT Annual average daily traffic
ADB Asian Development Bank
BIS Bureau of Indian Standards
BRO Border Roads Organisation
DDMA District Disaster Management Authority
EIA Environment Impact Assessment
GFDRR Global Facility for Disaster Reduction
and Recovery
HDM-4 Highway Development and Management
Version 4
HFL High Flood Level
HSDMA Himachal State Disaster Management
Authority
FEHRL Forum of European Highway Research
FHA Federal Highway Administration
GIS Geographical Information System
GHG Greenhouse Gas
IPCC Intergovernmental Panel on Climate
Change
IMD Indian Meteorological Department
INCCA Indian Network for Climate Change
Assessment
IRC Indian Roads Congress
ISRO Indian Space Research Organisation
IRI International Roughness Index
LCLIP Local Climate Impacts Profile
MDR Major District Road
MoD Ministry of Defence
MoEFCC Ministry of Environment, Forest and
Climate Change
MoRTH Ministry of Road Transport and Highways
NDMA National Disaster Management Authority
NH National Highway
NHAI National Highways Authority of India
NRSC National Remote Sensing Centre
PCU Passenger Car Unit
PLCC Pavement Life Cycle Costing
PSMSL Permanent Service to Mean Sea Level
PWD Public Works Department
ROW Right of Way
SDMA State Disaster Management Authority
TERI The Energy and Resources Institute
UNDP United Nations Development Programme
UNFCCC United Nations Framework Convention
on Climate Change
ULB Urban Local Body
USAID United States Agency for International
Development
U.S. DOT The United States Department of
Transportation
USGS United States Geological Survey
VA vulnerability assessment
Abbreviations and Acronyms

xviii
Reducing Carbon Footprint and Enhancing Climate Resilience of National Highways in India

xix
Adaptation
“In human systems, the process of adjustment to actual
or expected climate and its effects, in order to moderate
harm or exploit beneficial opportunities. In natural
systems, the process of adjustment to actual climate
and its effects; human intervention may facilitate
adjustment to expected climate.” (IPCC, 2012)
Climate Change
“A change in the state of the climate that can be
identified (e.g., by using statistical tests) by changes in
the mean and/or the variability of its properties and
that persists for an extended period, typically decades
or longer. Climate change may be due to natural
internal processes or external forcings, or to persistent
anthropogenic changes in the composition of the
atmosphere or in land use.” (IPCC, 2012)
Climate Extreme (extreme weather or climate event)
“The occurrence of a value of a weather or climate
variable above (or below) a threshold value near the
upper (or lower) ends of the range of observed values
of the variable. For simplicity, both extreme weather
events and extreme climate events are referred to
collectively as ‘climate extremes.” (IPCC, 2012)
Climate Impacts
“Consequences of climate change on natural and
human systems. Depending on the consideration of
adaptation, one can distinguish between potential
impacts and residual impacts.
Potential Impacts—All impacts that may occur given
a projected change in climate, without considering
adaptation.
Residual Impacts—The impacts of climate
change that would occur after adaptation.”
(IPCC, 2012)
Climate Model
“A numerical representation of the climate system
that is based on the physical, chemical, and biological
properties of its components, their interactions, and
feedback processes, and that accounts for all or some
of its known properties. The climate system can be
represented by models of varying complexity, that is,
for any one component or combination of components
a spectrum or hierarchy of models can be identified,
differing in such aspects as the number of spatial
dimensions, the extent to which physical, chemical, or
biological processes are explicitly represented, or the
level at which empirical parameterizations are involved.”
(IPCC, 2012)
Climate Resilient Development
“Climate resilient development is about adding
considerations of climate variability and climate
change to development decision-making in order
to ensure that progress towards development goals
includes consideration of climate impacts.” (USAID,
2014)
Glossary of Terms

xx
Climate Proofing
“Refers to actions that make infrastructure more
resilient and resistant to anticipated scenarios of long-
term climate change, as well as the risks associated
with geological hazards and climate variability and
extremes. It includes internalization of the risks and
opportunities that alternative climate change scenarios
are likely to imply for the design, operation and
maintenance of infrastructure.” (UNDP, 2011)
Climate Projection
“A projection of the response of the climate system to
emissions or concentration scenarios of greenhouse
gases and aerosols, or radiative forcing scenarios,
often based upon simulations by climate models.
Climate projections are distinguished from climate
predictions in order to emphasize that climate
projections depend upon the emission/ concentration/
radiative-forcing scenario used, which are based on
assumptions concerning, e.g., future socioeconomic
and technological developments that may or may not
be realized and are therefore subject to substantial
uncertainty.” (IPCC, 2012)
Climate Scenario
“A plausible and often simplified representation of the
future climate, based on an internally consistent set of
climatological relationships that has been constructed
for explicit use in investigating the potential
consequences of anthropogenic climate change, often
serving as input to impact models. Climate projections
often serve as the raw material for constructing climate
scenarios, but climate scenarios usually require
additional information such as about the observed
current climate.” (IPCC, 2012)
Critical Infrastructure
“The physical structures, facilities, networks and other
assets which provide services that are essential to the
social and economic functioning of a community or
society.” (UNISDR, 2017).
Disaster
“A serious disruption of the functioning of a community
or a society at any scale due to hazardous events
interacting with conditions of exposure, vulnerability
and capacity, leading to one or more of the following:
human, material, economic and environmental losses
and impacts.” (UNISDR, 2017)
Disaster Management
“The organization planning and application of
measures preparing for, responding to and recovering
from disasters.” (UNISDR, 2017)
Disaster Risk
“The potential loss of life, injury, or destroyed or
damaged assets which could occur to a system,
society or a community in a specific period of time,
determined probabilistically as a function of hazard,
exposure, vulnerability and capacity.”(UNISDR, 2017)
Economic Loss
“Total economic impact that consists of direct economic
loss and indirect economic loss. Direct economic loss:
the monetary value of total or partial destruction of
physical assets existing in the affected area. Direct
economic loss is nearly equivalent to physical damage.
Indirect economic loss: a decline in economic value
added as a consequence of direct economic loss and/or
human and environmental impacts.” (UNISDR, 2017)
Evacuation
“Moving people and assets temporarily to safer places
before, during or after the occurrence of a hazardous
event in order to protect them.” (UNISDR, 2017)
Exposure
“The situation of people, infrastructure, housing,
production capacities and other tangible human assets
located in hazard-prone areas.” (UNISDR, 2017)
Hazard
A process, phenomenon or human activity that may
cause loss of life, injury or other health impacts,
property damage, social and economic disruption or
environmental degradation .” (UNISDR, 2017)
Landslide
“A mass of material that has moved downhill by
gravity, often assisted by water when the material is
saturated. The movement of soil, rock, or debris down
a slope can occur rapidly, or may involve slow, gradual
failure.” (IPCC, 2012)
Glossary of Terms

xxi
Likelihood
“A probabilistic estimate of the occurrence of a
single event or of an outcome, for example, a climate
parameter, observed trend, or projected change lying
in a given range. Likelihood may be based on statistical
or modeling analyses, elicitation of expert views, or
other quantitative analyses.” (IPCC, 2012)
Mainstreaming
Mainstreaming can be defined as the “integration
of climate change related policies and measures
into developmental planning process and decision-
making.” (Eriksen S E H, 2005)
Mitigation
“The lessening or minimizing of the adverse impacts
of a hazardous event.” (UNISDR, 2017)
Precipitation
“Precipitation whether it is rain or snow is expressed
as the depth to which it would cover a horizontal
projection of the earth’s surface, if there is no loss by
evaporation, run–off or infiltration and if any part of
the precipitation falling as snow or ice were melted.
It is expressed in the units of mm or cm.” (Indian
Meteorological Department)
Resilience
“The ability of a system, community or society exposed
to hazards to resist, absorb, accommodate, adapt to,
transform and recover from the effects of a hazard
in a timely and efficient manner, including through
the preservation and restoration of its essential basic
structures and functions through risk management,”
(UNISDR, 2017)
Retrofitting
“Reinforcement or upgrading of existing structures to
become more resistant and resilient to the damaging
effects of hazards,” (UNISDR, 2017)
Severe Cyclonic Storm
“Intense low pressure system represented on a synoptic
chart by more than four closed isobars at 2 hPa
interval and in which the wind speed on surface level
is in between 48 – 63 Kts,” (Indian Meteorological
Department)
Risk Assessment
“A qualitative or quantitative approach to determine
the nature and extent of disaster risk by analysing
potential hazards and evaluating existing conditions
of exposure and vulnerability that together could
harm people, property, services, livelihoods and the
environment on which they depend.” (UNISDR, 2017)
Storm Surge
“The temporary increase, at a particular locality, in
the height of the sea due to extreme meteorological
conditions (low atmospheric pressure and/or strong
winds). The storm surge is defined as being the excess
above the level expected from the tidal variation
alone at that time and place.” (Indian Meteorological
Department).
Super Cyclonic Storm
“Intense low pressure system represented on a synoptic
chart by more than four closed isobars at 2 hPa interval
and in which the wind speed on surface level is 120
Kts. and above,” (Indian Meteorological Department)
Uncertainty
“An expression of the degree to which a value or
relationship is unknown. Uncertainty can result from
lack of information or from disagreement about
what is known or even knowable. Uncertainty may
originate from many sources, such as quantifiable
errors in the data, ambiguously defined concepts
or terminology, or uncertain projections of human
behaviour. Uncertainty can therefore be represented
by quantitative measures, for example, a range of
values calculated by various models, or by qualitative
statements, for example, reflecting the judgment of a
team of experts,”(UNISDR, 2017)
Very Severe Cyclonic Storm
“Intense low pressure system represented on a
synoptic chart by more than four closed isobars at 2
hPa interval and in which 7 the wind speed on surface
level is in between 64–119 Kts,” (Indian Meteorological
Department)
Vulnerability
“The conditions determined by physical, social,
economic and environmental factors or processes
which increase the susceptibility of an individual,
a community, assets or systems to the impacts of
hazards.” (UNISDR, 2017)
Glossary of Terms

xxii
Reducing Carbon Footprint and Enhancing Climate Resilience of National Highways in India

xxiii
Road transport, especially highways, plays a pivotal
role in the development of a country. The development
of highways fosters movement of passenger and freight
across the country leading to increased national
productivity and socio-economic growth. Though
constituting only 2% (103,933 km, as on March 31,
2017) of the total road length in the country, National
Highways (NHs) form the backbone of the road
transport sector, moving almost 40% of the total road
traffic (MoRTH, 2015-16).
India has long realized the importance of highways
and has been giving the necessary impetus for its
development in the country. The Government of India
(GoI) has launched various programmes to build
new highways and improve and upgrade the existing
highways in order to meet the ever-growing transport
demand. The government plans to build about
50,000 km of NHs in the next five years (Lok Sabha,
2016). The construction and subsequent use of
highways, however, has implications in terms of
increased use of energy and generation of CO2
emissions.
Amidst growing concerns of energy security and
climate change, there is a realization that the transport
sector, especially the road sector, should lower its
dependence on fossil energy and reduce its carbon
footprint. Overall, India’s transport sector contributed
about 14% of total energy-related CO2 emissions
in 2010, of which, road transport is estimated to
contribute about 88% (BUR, 2015).
Given the increasing length/capacity of the highway
network, and the increasing volumes of traffic on
highways, CO2
emissions from highways (on account
of construction, maintenance, and operation activities)
are expected to continue increasing in a business-
as-usual scenario, if interventions are not made to
mitigate the same. With India’s Nationally Determined
Contributions (NDCs) commitment to reduce carbon
emissions, it has become imperative that the country’s
highway sector be made low carbon.
Additionally, the sector is also required to build
resilience to climate change impacts in order to reduce
risks and protect the highway infrastructure from
impacts of climate change, such as sea-level rise, extreme
precipitation, rising temperature, and climate-induced
extreme events. This requires an understanding of
carbon emissions emitted from the highway sector
in India and an assessment of vulnerability of NHs to
extreme weather events induced by climate change.
Both the components—(a) carbon footprint exercise
for the National Highway network of India and
recommended interventions to reduce the same and
(b) developing vulnerability assessment methodology
and recommended interventions for enhancing the
climate resilience of the NH network—are interlinked,
as carbon emissions, in general from all anthropogenic
activities have been cited as a key reason for climate
change and the associated extreme events (IPCC,
2012, 2014).
Introduction to the Study
xxiv
While studies have been undertaken to understand
project-level carbon footprint of specific NH stretches,
there are no studies to our knowledge that have been
undertaken to estimate the carbon footprint of the
entire NH sector in India. Also, there are no known
studies that have aimed at understanding the climate
vulnerability of the NHs in the country.
The Ministry of Road Transport and Highways
(MoRTH), Government of India, supported by
the World Bank, therefore, has commissioned this
particular study to The Energy and Resources Institute
(TERI), New Delhi, to estimate the carbon emissions
from NHs sector (emissions from construction,
operation, and maintenance activities) and to suggest
methodologies and interventions to assess and reduce
the vulnerability of the highway sector to climate
change-induced extreme weather events. The study is
divided into the following two components:
P Component I of the study focusses on estimating
and suggesting measures to reduce the carbon
footprint of the NH sector
P Component II of the study focusses on suggesting a
methodology for assessing and enhancing climate
resilience of the NH sector
The report is divided into two parts and states the work
carried out under the two components separately.
Introduction to the Study

COMPONENT II
Enhancing Climate Resilience of
National Highways in India


Introduction1

Reducing Carbon Footprint and Enhancing Climate Resilience of National Highways in India
2

3
1 Introduction
Climate change affects us in numerous ways,
economically, socially, and environmentally.
It is important to note that climate risks
are embedded in our developmental goals and this
includes planning and maintenance of highways. A
detailed discussion on the impacts of climate change
and the need to build resilience of highways has been
incorporated in Chapter 2 ‘Impact of Climate Change
on Highways’. Taking into account the changing
climate and the associated extreme events, there is
need for a comprehensive policy that foresees the
long-term challenges of the increasing intensity of
climate risks and provides a direction for building
resilience of existing and new highways in the country.
The current study is aligned to assist the Ministry of
Road Transport and Highways, Government of India,
in this direction and aims to guide policymakers and
practitioners on enhancing the climate resilience of
National Highways (NHs) sector in India. The study
will provide recommendations on the development
approach and interventions needed to incorporate
climate resilience in the NH network and mainstream
climate resilience in the framework of highway
infrastructure management in India. The main
objectives of the study are to:
P Establish the need to enhance climate resilience
for the NHs in India.
P Understand and document the impacts of climate
change on the NHs in India.
P Develop and demonstrate a methodology for
vulnerability assessment of the highway network.
P Identify engineering and non-engineering
interventions for building climate resilient NHs in
India with specific recommendations.
Figure 1 illustrates the methodology adopted for
this study, indicating the objectives and associated
tasks and the approaches followed for the same. The
study looks exclusively at the vulnerability of the NHs
to climate change impacts (both gradual as well as
climate-induced extreme events). The scope of the
study however, does not include the vulnerability of
highways to other natural hazards.
1.1 Background and Need
Climate change and the need for building climate resilience
Identified as an emerging global challenge, climate
change, today, manifests itself through weather
anomalies and extreme weather events. The impacts of
climate change, such as rising temperatures, sea level
rise, increase in heavy precipitation events, and increase
in frequency and intensity of cyclones, all pose direct
physical risks to people, assets, and infrastructure.
Countries across the globe are experiencing the
growing intensity and frequency of floods, extreme
weather events, and rise in extreme heat events that
are often associated with catastrophic impacts on
transport infrastructure, such as roads, railways, and
airports. The impacts of climate change go way beyond
these direct physical risks. Increased incidences

Reducing Carbon Footprint and Enhancing Climate Resilience of National Highways in India
4
of flooding lead to the damage and destruction of
infrastructure and property which impacts economic
growth. Sea level rise and associated coastal flooding
harms vital coastal ecosystems. Climate change
impacts a broad spectrum of functions, infrastructure,
and services and is responsible for compounding
and aggravating the existing non-climatic stresses,
such as urbanization, population growth, migration,
water demand, sanitation, etc. Hence, climate change
poses a challenge of managing risks that affect people,
infrastructure, and ecosystems. To successfully tackle
Figure 1 Methodology of Study
these risks, it becomes imperative to shift from reactive
responses to proactive, systematic, and integrated risk
management (World Bank, 2013).
In developing countries, climate change impacts
usually exacerbate existing vulnerabilities and India is
no exception. The evidence of climate change in India
has generally been consistent with the analyses and
future scenarios developed in the Intergovernmental
Panel on Climate Change (IPCC) Assessment Reports
(IPCC, 2014). These impacts of climate change include
rising maximum and minimum temperatures, higher

Introduction
5
mean temperatures, increasing frequency of extreme
temperature events, marked rainfall variability, and
increase in incidences of extreme precipitation events
(Indian Network for Climate Change Assessment
[INCCA], 2010). It has also been estimated that the
Indian coasts will experience a sea level rise of 1.3 mm per
year (Indian Network for Climate Change Assessment
[INCCA], 2010). In India, the incidences of disasters
and extreme weather events with increased intensities
have become more frequent due to climate change
(Give2Asia, 2016). Approximately 85% of India’s area
is vulnerable to natural hazards, with 68% vulnerable
to droughts, 57% to earthquakes, and 12% to floods
(Give2Asia, 2016). The country is constantly affected
by floods which are identified as the most recurring
hazard, leading to maximum economic losses. This is
followed by cyclones and storms and nearly 5,700 km
of India’s coastline, out of 7,500 km, is prone to cyclones
and other storms (NDMA, GoI, 2016). India, like any
other developing country, is coping to deal with climate
variability and extreme weather events.
The country’s economic exposure to extreme climate-
related events is highlighted by the extent of economic
losses caused by the cyclone Hudhud and the Jammu
and Kashmir floods. As per a UN report, Hudhud
was the second costliest disaster of 2014 in the Asia-
Pacific region, causing losses worth USD 11 billion
(The Economic Times, 2015). The floods in Jammu and
Kashmir that occurred in September 2014 caused an
immediate loss of around `570 billion to the state’s
economy (Down To Earth, 2014). India’s vulnerability
to climate change and associated extreme events
unquestionably undermine the development goals
of the country. As per IPCC’s Fifth Assessment
Report, it is projected that there will be an increase
in intensity and frequency of extreme weather events
due to climate change (IPCC, 2012), thereby clearly
indicating India’s future condition of increased
vulnerability to extreme weather events. Taking this
vulnerability into account, there has been a significant
focus on climate change adaptation and resilience
building in India’s Intended Nationally Determined
Contributions (INDCs) in the Paris Agreement
(Ernst & Young, 2016). Presently, India spends 3%
of its GDP on climate change adaptation and the
INDCs suggest the need for enhanced investment in
this domain.
This calls for clear action and efforts to minimize the
risks posed by climate change and incorporate climate
change considerations in the development goals of the
country. To achieve this, climate-resilient development
should be at the forefront of any development (Box 1).
The agenda for climate-resilient development should
be multisectoral and should include strategies that
integrate both the management of risk and the ability
to respond to climate change and its impacts. Climate
resilient-development should look at addressing
vulnerabilities, implementing climate change
adaptation measures, and facilitating governance and
financial mechanisms that enable an environment for
climate-resilient development.
The need for climate-resilient infrastructure
Infrastructure is undoubtedly an integral element
required for sustaining the development needs of a
country. Public infrastructure is multifunctional and
caters to a range of diverse stakeholders spread over a
wide geographic area. It directly or indirectly provides
critical social and economic services required towards
meeting the development needs of people and the
economy. Interruptions in infrastructure services have
significant implications as it leads to severe negative
economic impacts. In most developing countries,
infrastructure is vulnerable to the destruction that
occurs due to climate-induced extreme events and
disasters. Given that infrastructure investments have
an economic life expectancy of 30 years or more, it
should be realized that it is sensitive to both climatic
conditions prevailing at the time of its construction as
well as to the climate variations over the decades of use
(UNDP, 2011).
“Climate resilient development is about adding
considerations of climate variability and climate
change to development decision-making in order
to ensure that progress towards development goals
includes consideration of climate impacts” (USAID,
2014)
BOX 1: CLIMATE-RESILIENT DEVELOPMENT

Reducing Carbon Footprint and Enhancing Climate Resilience of National Highways in India
6
Table 1: Impact matrix of climate events and vulnerable transport infrastructure
Vulnerable
Infra-
structure
Pave-
ments
Bridges Drains Rail
Tracks
Cul-
vert
Side
Slopes
Costal
Roads/
Rails
Ports /
Harbour
Air-
port
Water
Trans-
port
Road
Sign-
age
Rising
Temperature
x x x x x x
Precipitation
(Rainfall/
Snowfall)
x x x x x x x x x x x
Wind x x x x
Storm/
Cyclone
x x x x x x x x x x x
Sea Level Rise x x x x x
Source: Regmi and Hanaoka, 2009
Climate-induced extreme events threaten vital
infrastructure, such as roads, bridges, rails, drains,
airports, ports and harbours, etc. Rising temperatures
can lead to deterioration of pavements due to melting
of bitumen, thermal expansion of bridges and rail
tracks, and buckling of joints. Increase in the intensity
and frequency of extreme precipitation events can
affect drainage capacities, road pavements, bridges,
airports, and ports and harbours. Cyclone-associated
winds and rainfall can inundate roads and also impact
rails, airports, ports and harbours, road signage, and
disruption of evacuation operations. Sea level rise
affects coastal roads, rails, airports, and ports and
harbours situated in coastal areas.
A significant proportion of the economic costs of an
extreme weather event are attributed to its impacts
on public and private infrastructure, including public
works, bridges, dams, roads, schools, hospitals, etc.
Considering the heavy cost implications associated
with the damage of infrastructural services, it is
important to establish infrastructure that not only work
effectively in the present, but are also equipped to deal
with the future challenges of climate change which in
turn calls for the need to climate proof infrastructure.
Table 1 shows the impact matrix between transport
infrastructure and climate stressors, and thereby
depicting such (transport) infrastructures that are
vulnerable and need to be climate proofed (marked
with an ‘x’).
Table 1 clearly indicates that precipitation, storms, and
cyclones are the most prominent climate parameters
“ ‘Climate proofing’ refers to actions that make
infrastructure more resilient and resistant to
anticipated scenarios of long-term climate change, as
well as the risks associated with geological hazards
and climate variability and extremes. It includes
internalization of the risks and opportunities that
alternative climate change scenarios are likely to
imply for the design, operation and maintenance of
infrastructure.” (UNDP, 2011)
BOX 2: CLIMATE PROOFING
impacting all types of infrastructure and rendering
it vulnerable. Taking into account the vulnerability
of infrastructure to climate change impacts, it is
imperative that climate change concerns are a
key consideration while designing infrastructure.
Typically, infrastructure is designed to withstand
the most extreme or close-to-the-most extreme
events. However, in light of the changing climate and
increasing frequency and intensity of climate-induced
extreme events, the existing design considerations fall
short. Studies indicate that the current infrastructure
design standards do not meet the demands of climate
change and emphasize the need to introduce new
design standards to accommodate future climate
scenarios and construct infrastructure in vulnerable
locations with higher standards (Regmi and Hanaoka,
2009). Climate proofing infrastructure (Box 2) adds a
new layer to sustainable development as it safeguards
human lives and assets in the context of climate
change.

Introduction
7
Table 2: Key design parameters to be considered
for climate proofing transport infrastructure
Infrastructure
and elements
Design parameters
Road and
pavement
• Camber to facilitate water flow
• Stiff bitumen to withstand heat
• Soil moisture and maintenance
planning
Bridge • Flood estimation, design period,
design discharge
• High Flood Level (HFL)
• Free board (clearance above HFL)
• Length of waterway
• Design load, wind load
• Foundation, river and bank
protection
• Corrosion protection
Drains • Discharge estimation (return
period)
• Size and shape of drain
• Drain slope
Rail track • Heat resistance material
• Rail line joints
• Expansion joints
Culverts • Discharge estimation (flood return
period)
• Size and discharge capacity
• Cross slope
• Free board (clearance)
Side slope • Slope protection work
• Subsurface drains
• Catch drains
Coastal roads/
rails
• Protection wall
• Warning signs
• Realignment
• Edge strengthening
Ports/Harbour • Height of platform
• Protection work
• Design for storm and surge actions
Airports • Wind direction
• Runway alignment
• Snow and ice removal plan
• Pavement material
• Drainage capacity
Water
transport
• Bridge clearance
• Dredging
• Flood protection at sea entrance
Road signage • Wind load
• Structural design
• Foundation
• Corrosion protection
Source: Regmi and Hanaoka, 2009
Climate proofing infrastructure is not a new concept,
but there are several challenges that need to be
addressed. For developed countries, the challenge
mostly lies in retrofitting existing infrastructure and
siting and protecting new developments along coasts
and rivers. For developing countries, the challenge
lies in planning for infrastructure taking climate
change adaptation into account (Rosenzweig, 2014).
Civil engineering inherently requires the design
of infrastructure to be in coalescence with the
environment. However, the current challenge lies in
upholding this practice while accounting for climate
change. The key design parameters that need to be
considered in order to factor in climate change and
develop climate-resilient infrastructure is indicated
in Table 2.
Therefore, the development of climate-resilient
infrastructure calls for the need to revisit standards
and incorporate design parameters that consider
extreme climatic factors for roads and highways,
railways, and other transport infrastructure. The
modified design parameters and standards should be
such that the current and future challenges of climate
change are addressed. For instance, flash floods are
now a recurring phenomenon, but in the current
design considerations for infrastructure, flash floods
are not taken into account. Hence while designing
bridges, culverts, and drains, design parameters,
such as frequency and intensity of rains and high
flood level (HFL) of bridges needs to be increased.
While designing coastal roads, predicted sea level
rise should be considered and while designing roads
in flood plains, adequate slope stabilization, river
bank protection works should be provided and
embankment heights raised.
Need for climate-resilient highways
Roads and highways are designed based on historic
climate data; however, during their design life they
could be subjected to a varying climate which may
be different from past climate trends. The climate is
projected to change at an increasingly rapid pace over
the coming decades and is likely to alter long-term
climatic averages and the frequency and severity
of extreme weather events, all of which play an
important role in the planning, design, operations,

Reducing Carbon Footprint and Enhancing Climate Resilience of National Highways in India
8
maintenance, and management of highways (Meyer
et al. 2012 cited in Meyer et al. 2014).
In India, the design of highways and other
road networks are guided by the Indian Roads
Congress (IRC) codes. As per the IRC codes, it is
recommended that national and state highways
be designed for a life of 15 years. The IRC codes
very aptly prescribe the drainage measures that
need to be adhered to, considering the fact that
the performance of pavements can be seriously
affected due to moisture accumulation. Some
measures taken towards facilitating good drainage
conditions include maintenance of transverse
section to facilitate a quick run off of surface water
and provision of appropriate surface and sub-surface
drains wherever required. Drainage measures are
given particular importance if the road is built on a
solid base with low permeability and if it is situated
in a heavy rainfall or snowfall precipitation area. The
IRC codes also specify that the difference between
the bottom of the subgrade level and the level of
water table/ high flood level should be at least 0.6 m
to 1 m. However, there is a need to relook at these
standards and codes in the light of emerging climate
uncertainties. As far as highways are concerned,
the impacts of climate change effect can be seen on
highway elements, such as pavement, embankment
and shoulder, drainage and traffic control and safety
infrastructure, namely, crash barriers, road signs,
lighting, kilometre stones, etc. Moreover, the impacts
of climate change on highways vary depending on the
type of pavements. For instance, asphalt (bitumen)
pavements are vulnerable to surface damage due to
increased temperature while concrete pavements are
less susceptible to damage due to infiltration of water
but are exposed to the risk of expansion of joints in
high temperatures. Prevailing climatic conditions
also often interact with other factors which further
influence deterioration. For example, a combination
of heavy traffic and extreme temperatures can lead
to more severe rutting. Often, highway drainage is
found to be incapable of coping with prolonged and
heavy rainfall, resulting in increased flooding and
deterioration of the pavement structure (Willway
et al. 2008). A detailed discussion of the impacts of
climate change on highways has been included in
Chapter 2 ‘ Impact of Climate Change on Highways’.
Though NHs constitute only about 2% of the road
network in the country, they carry about 40% of the
total road traffic (NHAI, 2014). They provide transit
to freight, cargo, tourists and locals, and serve as
exodus routes when citizens need to evacuate during
an extreme event threat, such as cyclone threats and
mandatory evacuations. Typically, in hilly regions, a
single road serves as the only connectivity route and
the blockage of this road, due to landslides, severely
hampers economic activity and obstructs the passage
of relief and (re)construction material from reaching
the destination (Roychowdhury, 2015). Taking into
account the significance of roads and highways, it is
important that these remain functional throughout
the year. In order to minimize the disruptions and
economic cost implications due to climate impacts
and associated extreme events, it is imperative
that highways be planned to adapt to the changing
climate. Several studies conducted all over the world
highlight the need to adapt highways to the changing
climate. Climate change adaptation interventions
will help to reduce operations and maintenance
costs, improve safety for travellers, and safeguard the
large investments made in the transportation system
infrastructure. India regularly witnesses damage to
its roads and highway infrastructure during extreme
weather events. The extreme weather events in the past
clearly indicate the vulnerability of Indian highways
and roads to the risks posed by climate change (Table
3). This illustrates the climate vulnerability of Indian
highways and emphatically stresses on the need to
enhance the resilience of highways to the changing
climate.
Through Table 3 and the literature review conducted
for this study, with respect to extreme climate events,
it is evident that the coastal and hilly regions are
the most vulnerable regions in India. Both hilly and
coastal regions are susceptible to hydro-meteorological
extreme events and its associated impacts. Hence, it is
recommended that the highway network situated in
the hilly and coastal areas be made climate resilient.
In the NH network, around 4%–5% of the highways
are located in hilly regions, and so, are vulnerable to
climate change impacts (MoRTH).
At present, in India, there is no specific, comprehensive
climate-resilience policy for the highways or road sector
in India. However, there are a few guidelines which

Introduction
9
Table 3: Impact of past extreme weather events on road and highway infrastructure in India
Sl. No. Climate Induced Event Region
1 Cyclone ‘Vardha’ that hit Chennai in Dec 2016 uprooted several trees and electric poles,
thereby blocking connectivity. A section of NH 45 was blocked by fallen trees and 8 toll
plazas sustained severe damage. Lack of storm water drains also lead to water logging
and stagnation on roads affecting traffic and connectivity.
Coastal
2 The floods in Chennai in 2015 caused severe damage to NH 16 between Chennai and
Nellore leaving a cut for over 20 metres causing major traffic disruptions on both sides
(The Hindu, 2015).
Coastal
3 The Cyclone Hudhud in 2014 left a trail of destruction; loss to roads, horticulture,
agriculture, and water works is to the tune of `2,000 crore (Business Standard, 2014).
Uprooted trees blocked highway connectivity (The Economic Times, 2014).
Coastal
4 Uttarakhand floods in June 2013 destroyed over 1,000 kilometres of Uttarakhand’s one-
way-in, one-way-out highways (Circle of Blue, 2014).
Hilly
5 Heavy rainfall in Uttarkashi in August 2012 washed away a number of stretches of
the Rishikesh–Gangotri National Highway. Connectivity to as many as 85 villages was
disrupted. The National Highways of Uttarkashi, Gangotri, and Yamunotri also remained
closed during July–August.
Hilly
6 Assam witnessed massive floods in June and September 2012. The floods along with
landslides damaged several National Highways (NIDM, GoI, 2012).
Hilly
7 The 2008 Kosi floods in Bihar reported significant damage to road infrastructure. All
categories of roads ranging from National Highways to village roads were affected;
31.7 km of National Highway was fully damaged and 30 km was partly damaged.
(GFDRR, 2010).
Plains
(River
Basin
Zone)
Source: (U.S. Department of Transportation, Federal Highway Administration, 2016), (Scott Wilson, 2008), (Forum of European
Highway Research Laboratories (FEHRL), 2013), (National Cooperative Highway Research Program), (Jonathan Dowds, 2015),
(World Bank, 2010), (Deccan Chronicle, 2016) TERI stakeholder interactions (2015–17)
have attempted to factor in climate parameters. There
are specific IRC codes which provide guidelines and
standards for constructing roads, taking into account
rainfall intensity and flooding. IRC 034-2011 provides
recommendations for road construction in areas
affected by water logging and flooding for prolonged
periods. IRC 28-1967 provides specifications for the
construction of roads in areas of moderate rainfall
(not exceeding 150 cm per annum) in areas of high
rainfall (exceeding 150 cm per annum). Both IRC
and the Bureau of Indian Standards have come out
with guidelines that look at addressing landslides and
rock-fall risks. The Landslide Control Guidelines (IS.
14680:1999), Recommended Practices for Treatment
of Embankment and Roadside Slopes for Erosion
Control (IRC: 56 - 2011), State of The Art: Design and
Construction of Rock fall Mitigation Systems (IRC
Highway Research Board–Special Report 23-2014),
State of The Art: Landslide Correction Techniques
(IRC Highway Research Board–Special Report 15 -
1995), and the Hill Road Manual (IRC: SP-48-1998),
all provide guidelines on planning and designing and
recommended interventions that address both climatic
and non-climatic vulnerabilities of roads in hilly terrain.
Addressing the perils of flooding, the National Disaster
Management Plan 2016 recommends investing in
structural measures, such as waterways and drainage
systems for roads, highways, and expressways. The plan
also clearly states the responsibilities of both Central
and State agencies for implementing these structural
measures. The central agencies, such as MoRTH,
NHAI, Ministry of Defence (MoD), and Border Roads
Organisation (BRO), are responsible for the proper
alignment and design of roads for implementing
these measures. The state agencies, such as States/UTs,
SDMA, CoR, Revenue Department, PWD, DDMA,
Panchayats, and ULBs are responsible for coordination
with the central agencies for implementing the projects
and also ensuring proper alignment and design of roads
for the state projects. The Green Highways (Plantation,

Reducing Carbon Footprint and Enhancing Climate Resilience of National Highways in India
10
Transplantation, and Beautification & Maintenance)
Policy, 2015, looks at arresting soil erosion at the
embankment slopes. Even though the main focus of the
policy is beautification and maintenance of highways, it
can contribute to enhancing the resilience of highways.
Considering climate change is a critical concern, it is
imperative to strengthen the inter-linkage of improved
planning and management of roads and climate-
resilience measures at a policy level. It is important
that climate change concerns be integrated in the
planning, designing, construction, and maintenance
of roads and highways. This calls for a comprehensive
policy to steer the current and future course of highway
management, that will ensure the mainstreaming of
climate change concerns into the highways sector.

Impact of Climate Change on
Highways2

12
Reducing Carbon Footprint and Enhancing Climate Resilience of National Highways in India

13
2 Impact of Climate Change on Highways
Typically, highways and other transportation
infrastructure are designed keeping in mind
the local weather and past climatic trends.
Given that the lifespan of highways is 30 years on an
average, it becomes necessary that the future impacts
of climate change are also considered while planning
and designing highway networks (UNDP, 2011). In
order to incorporate climate change considerations
into the highway network planning and management,
it is important to understand climate stressors and
the potential risks they pose to highways.
For roads and highways, the climate variables that
typically pose risks on pavements are temperature
(average and extreme), precipitation, and soil
moisture. However, the type and scale of impacts will
vary depending on the topography, geology, drainage,
pavement condition, and traffic flow. These climatic
and non-climatic stressors can cause significant
damage and disruption of services. For instance,
in areas where prolonged flooding takes place, the
subgrade gets saturated due to water percolation,
thereby reducing its bearing capacity. In the case of
flexible pavements, prolonged contact with water
strips the binder of the pavement and in concrete
pavements, the percolation of water in subgrades
leads to pumping and cracking of the pavement. In
case of concrete roads, high temperatures can lead
to buckling of roads. Occurrences of buckling in
the USA show that there is no specific temperature
that causes a road to buckle, but it is usually seen to
occur at temperatures ranging from 70°–90° F, which
are considered as high temperatures in the North
American context.
In order to incorporate climate change considerations
in the Indian highways sector, it is important to
understand impacts specific to the Indian scenario.
However, studies that explore the impacts of climate
change on Indian roads and highways are practically
non-existent. Therefore, in order to document the
impacts of climate change on Indian highways,
information collected from the field, through
interactions with stakeholders, and international
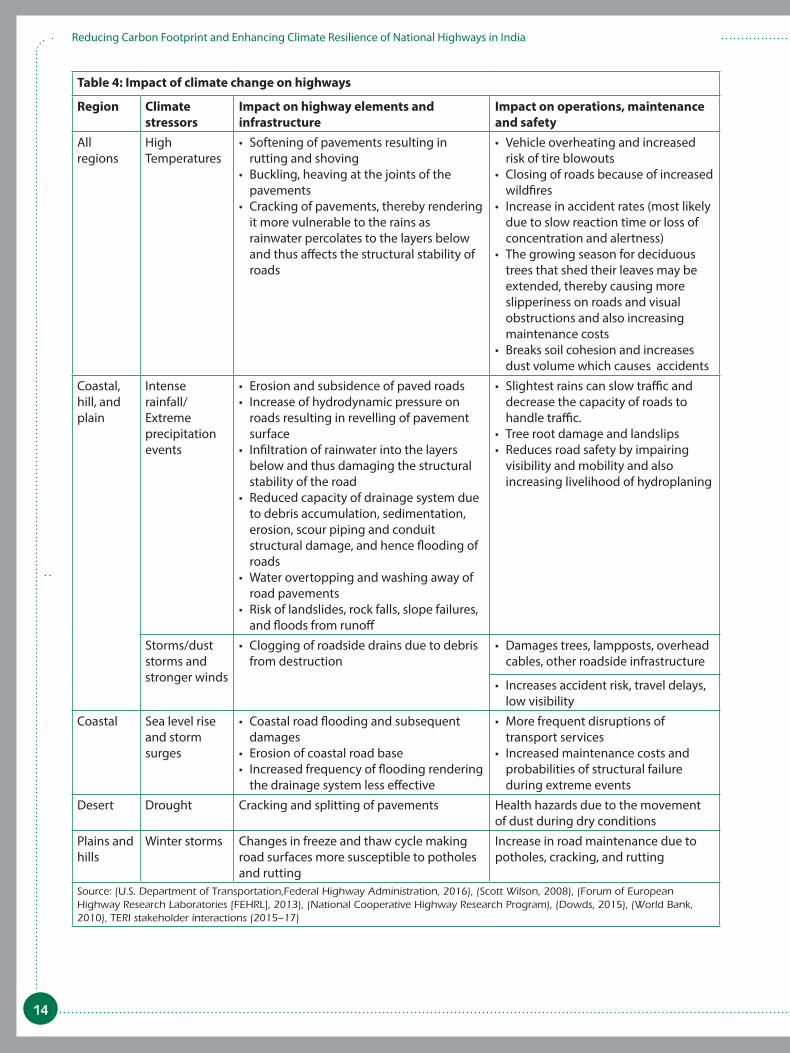
literature has been utilized (Table 4).
It is important to note here that international literature
indicates temperature as the key climate stressor
for rigid pavements; while in the case of flexible
pavements, precipitation has been found to be the
primary stressor. Also, stakeholder discussions with
respect to hilly and coastal regions indicated that
extreme rainfall has been observed to be the primary
climate stressor for highways in these regions of India.
14
Reducing Carbon Footprint and Enhancing Climate Resilience of National Highways in India
Table 4: Impact of climate change on highways
Region Climate
stressors
Impact on highway elements and
infrastructure
Impact on operations, maintenance
and safety
All
regions
High
Temperatures
• Softening of pavements resulting in
rutting and shoving
• Buckling, heaving at the joints of the
pavements
• Cracking of pavements, thereby rendering
it more vulnerable to the rains as
rainwater percolates to the layers below
and thus affects the structural stability of
roads
• Vehicle overheating and increased
risk of tire blowouts
• Closing of roads because of increased
wildfires
• Increase in accident rates (most likely
due to slow reaction time or loss of
concentration and alertness)
• The growing season for deciduous
trees that shed their leaves may be
extended, thereby causing more
slipperiness on roads and visual
obstructions and also increasing
maintenance costs
• Breaks soil cohesion and increases
dust volume which causes accidents
Coastal,
hill, and
plain
Intense
rainfall/
Extreme
precipitation
events
• Erosion and subsidence of paved roads
• Increase of hydrodynamic pressure on
roads resulting in revelling of pavement
surface
• Infiltration of rainwater into the layers
below and thus damaging the structural
stability of the road
• Reduced capacity of drainage system due
to debris accumulation, sedimentation,
erosion, scour piping and conduit
structural damage, and hence flooding of
roads
• Water overtopping and washing away of
road pavements
• Risk of landslides, rock falls, slope failures,
and floods from runoff
• Slightest rains can slow traffic and
decrease the capacity of roads to
handle traffic.
• Tree root damage and landslips
• Reduces road safety by impairing
visibility and mobility and also
increasing livelihood of hydroplaning
Storms/dust
storms and
stronger winds
• Clogging of roadside drains due to debris
from destruction
• Damages trees, lampposts, overhead
cables, other roadside infrastructure
• Increases accident risk, travel delays,
low visibility
Coastal Sea level rise
and storm
surges
• Coastal road flooding and subsequent
damages
• Erosion of coastal road base
• Increased frequency of flooding rendering
the drainage system less effective
• More frequent disruptions of
transport services
• Increased maintenance costs and
probabilities of structural failure
during extreme events
Desert Drought Cracking and splitting of pavements Health hazards due to the movement
of dust during dry conditions
Plains and
hills
Winter storms Changes in freeze and thaw cycle making
road surfaces more susceptible to potholes
and rutting
Increase in road maintenance due to
potholes, cracking, and rutting
Source: (U.S. Department of Transportation,Federal Highway Administration, 2016), (Scott Wilson, 2008), (Forum of European
Highway Research Laboratories [FEHRL], 2013), (National Cooperative Highway Research Program), (Dowds, 2015), (World Bank,
2010), TERI stakeholder interactions (2015–17)

Climate Vulnerability Assessment
of Highways3

16
Reducing Carbon Footprint and Enhancing Climate Resilience of National Highways in India

17
3 Climate Vulnerability Assessment
of Highways
This chapter presents the methodology
developed by TERI for vulnerability
assessment (VA) of NHs in India, also one
of the key objectives of this study. To this end, an
international review of methodologies used for
conducting climate vulnerability and risk assessment
of infrastructure assets has been carried out. The
methodologies have been reviewed to identify and
understand the essential elements and approach
steps for assessing the vulnerability of highway
infrastructure to climate change.
3.1 Review of globally accepted climate vulnerability assessment approaches
This section presents a discussion on the key
components and takeaways from the reviewed
methodologies. The authors would like to note
here that, mostly, only international studies and
methodologies for vulnerability assessment (VA) of
highways and infrastructures was found during the
review process and the same have been discussed
here. It was found that similar approaches or studies
for highways or regional roads are practically non-
existent in India. As the next best alternative, to study
the Indian context, TERI’s own methodology for
VA of urban infrastructure (including urban roads)
was considered.
It may also be noted that the discussion presented here
does not include methodologies which were found to
be very data intensive and involved a lot of modelling-
based studies. For instance, the ‘Impact of Climate
Change on Road Infrastructure’ (Harvey et al., 2004), a
study conducted in Australia, utilized modelling tools
(Pavement Life Cycle Costing (PLCC) model and the
Highway Development and Management Version 4
(HDM-4) model) for drawing the connection between
climate projections and road system component. It
utilized data, such as road inventory, traffic information
(e.g., annual average daily traffic), pavement type (e.g.,
materials, strength, and thickness), and pavement
condition (e.g., age, initial pavement roughness) in
order to undertake the detailed VA. Another study,
‘Evaluating Climate Change Impacts on Low Volume
Roads in Southern Canada’ (Tighe et al., 2008), analyses
pavement performance over a 20-year period using
the Mechanistic-Empirical Pavement Design Guide
(M-E PDG) to determine how climate changes in
precipitation and temperature will affect the pavement
performance indicators of international roughness
index (IRI), longitudinal cracking, transverse cracking,
alligator cracking, asphalt concrete (AC) deformation,
and total deformation. This analysis requires traffic,
structural, and material property datasets to represent
current stressors and pavement conditions. Such
data- and time- intensive methodologies were not
considered for review, to develop VA methodology
for this study. This is mainly attributed to the fact that
the proposed VA methodology is intended as a quick
decision-making tool for planners and practitioners in
the field of highway development in India who may

18
Reducing Carbon Footprint and Enhancing Climate Resilience of National Highways in India
not typically have access to such detailed data and
technical assessment models and the capacity to utilize
them. Therefore, the scope of this study focussed on
the review of methodologies and approaches that do
not need very detailed data or complex software for
conducting the VA and are user friendly and easy to
adopt/ adapt for the highways sector in India.
The following methodologies were found to be most
relevant for this study and have been discussed
in detail.
P ADB Guidelines for Climate Proofing Investment
in the Transport Sector—Road Infrastructure
Projects (ADB, 2011)
P Impacts of Climate Change and Variability on
Transportation Systems and Infrastructure:
Gulf Coast Study, Phase II (U.S. Department
of Transportation, Federal Highway
Administration, 2015)
P Adapting to Climate Change: Canada’s First
National Engineering Vulnerability Assessment
of Public Infrastructure (Canadian Council of
Professional Engineers, 2008)
P The Federal Highway Administration’s (FHA’s)
Climate Change and Extreme Weather
Vulnerability Assessment Framework (U.S.
Department of Transportation, 2012)
P Dorset County Council’s approach for building
resilience in local highways (UK) (Climate UK,
2013)
P TERI’s Methodology and Framework for urban
risk assessment, developed for Guwahati city
(TERI, 2013)
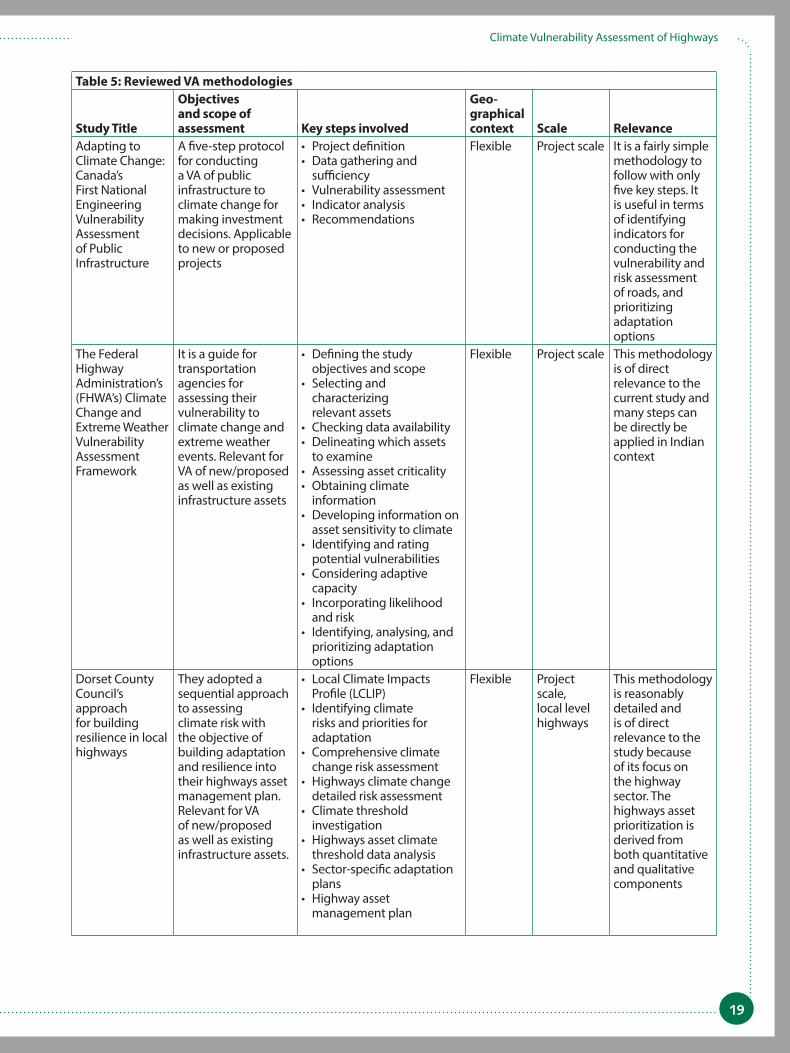
Table 5 summarizes these methodologies in terms
of the objectives and scope of assessment, key steps
involved, and the geographical context and scale. The
column titled ‘Relevance’ comments on the strengths
and gaps of the methodologies in terms of their
application for VA of highways in India. A detailed
Table 5: Reviewed VA methodologies
Study Title
Objectives and scope of assessment Key steps involved
Geo-graphical context Scale Relevance
Guidelines for Climate Proofing Investment in the Transport Sector—Road Infrastructure Projects, ADB
Guidance tool for climate proofing investment in the transport sector. Applicable to new or proposed projects
• Constructing climate change scenarios: Identifying the relevant climate variables needed for the impact assessment
• Learning from the past: Establishing the climate baseline; using climate projections from general circulation models
• Downscaling: From global to local climate projections
Flexible Project scale The ADB guidelines specify the steps involved in impact assessment and climate vulnerability assessment and aim to identify and evaluate, in qualitative terms, the effects of climate change on the road infrastructure
Impacts of Climate Change and Variability on Transportation Systems and Infrastructure: Gulf Coast Study, Phase II
To understand the impacts of climate change on transportation infrastructure in Gulf coast region and identify appropriate adaptation strategies. Relevant for VA of new/proposed as well as existing infrastructure assets
• Criticality assessment• Gather and process climate
information• Screen for vulnerability• Conduct detailed
engineering assessments
Coastal region
Regional assessment
This methodology is of direct relevance to the current study because it studies the impacts of climate change on various transportation networks including highways
19
Climate Vulnerability Assessment of Highways
Table 5: Reviewed VA methodologies
Study Title
Objectives and scope of assessment Key steps involved
Geo-graphical context Scale Relevance
Adapting to Climate Change: Canada’s First National Engineering Vulnerability Assessment of Public Infrastructure
A five-step protocol for conducting a VA of public infrastructure to climate change for making investment decisions. Applicable to new or proposed projects
• Project definition• Data gathering and
sufficiency• Vulnerability assessment• Indicator analysis• Recommendations
Flexible Project scale It is a fairly simple methodology to follow with only five key steps. It is useful in terms of identifying indicators for conducting the vulnerability and risk assessment of roads, and prioritizing adaptation options
The Federal Highway Administration’s (FHWA’s) Climate Change and Extreme Weather Vulnerability Assessment Framework
It is a guide for transportation agencies for assessing their vulnerability to climate change and extreme weather events. Relevant for VA of new/proposed as well as existing infrastructure assets
• Defining the study objectives and scope
• Selecting and characterizing relevant assets
• Checking data availability• Delineating which assets
to examine• Assessing asset criticality• Obtaining climate
information• Developing information on
asset sensitivity to climate• Identifying and rating
potential vulnerabilities• Considering adaptive
capacity• Incorporating likelihood
and risk• Identifying, analysing, and
prioritizing adaptation options
Flexible Project scale This methodology is of direct relevance to the current study and many steps can be directly be applied in Indian context
Dorset County Council’s approach for building resilience in local highways
They adopted a sequential approach to assessing climate risk with the objective of building adaptation and resilience into their highways asset management plan. Relevant for VA of new/proposed as well as existing infrastructure assets.
• Local Climate Impacts Profile (LCLIP)
• Identifying climate risks and priorities for adaptation
• Comprehensive climate change risk assessment
• Highways climate change detailed risk assessment
• Climate threshold investigation
• Highways asset climate threshold data analysis
• Sector-specific adaptation plans
• Highway asset management plan
Flexible Project scale, local level highways
This methodology is reasonably detailed and is of direct relevance to the study because of its focus on the highway sector. The highways asset prioritization is derived from both quantitative and qualitative components

20
Reducing Carbon Footprint and Enhancing Climate Resilience of National Highways in India
discussion on the individual methodologies are
as follows:
Guidelines for Climate Proofing Investment in the Transport Sector— Road Infrastructure Projects (ADB, 2011)
The guidelines by ADB have been developed with
an objective to outline a methodological approach
for investments on climate change adaptation in
the transport sector. The methodology is divided
into six different sets of activities which include
climate vulnerability assessment as one of the core
activities (Figure 2). The ADB guidelines focus on
the identification and evaluation of climate change
impacts on road infrastructure at a project scale in
qualitative terms (ADB, 2011). The guidelines were of
particular interest for the current study with respect to
the approach adopted for VA of roads.
Key Takeaways
The methodology highlights the importance of
climate analysis and projections for the region as
a key to understand the present and future climate
vulnerability of a road stretch. The study recommends
adopting or downscaling of the available climate
Table 5: Reviewed VA methodologies
Study Title
Objectives and scope of assessment Key steps involved
Geo-graphical context Scale Relevance
TERI’s Methodology and Framework for urban risk assessment
Development of methodology and its application (Case Study). Relevant for VA of new/proposed as well as existing infrastructure assets in a city.
• Identification of hazards and challenges
• Vulnerability Analysis• Identification of hotspots• Future climate and socio-
economic projections• Current and future risk
profile of the city• Identification of adaptation
and resilience options to address the risks
• Review of existing policies and legislations to identify gaps in addressing to risks
• Identification of means of integrating and mainstreaming policies for risk reduction in the existing policy framework
Hilly region
City-level assessment for Guwahati city, Assam
It is a city- level assessment framework but can be useful for understanding the basic steps involved for climate vulnerability assessment of infrastructure assets
change scenarios developed as part of existing
national and regional climate change initiatives, such
as the national communications to the UNFCCC, as
developing such projections at the regional level can
be costly and time consuming. Also, in some cases, it is
observed that even the most up-to-date climate models
would not be able to provide the desired precision
or accuracy at the project level due to topographical
variability and uncertainty related to climate change
projections. However, in all cases, understanding the
history of climate (temperature, rainfall, storm surges,
and extreme weather events) is always a necessary first
step. Another key step is to assess the likely impacts of
various probable climatic events on the infrastructure.
Impacts of Climate Change and Variability on Transportation Systems and Infrastructure: Gulf Coast Study, Phase II (U.S. Department of Transportation, Federal Highway Administration, 2015)The U.S. Department of Transportation (U.S. DOT)
conducted a comprehensive study on the impacts of
climate change on the transportation infrastructure
in the Gulf coast region for the identification of

21
Climate Vulnerability Assessment of Highways
Figure 2 Activities and steps involved in climate proofing transport investment
Source: Guidelines for Climate Proofing Investment in the Transport Sector—Road Infrastructure Projects, August 2011, ADB, Philippines
appropriate adaptation strategies. As part of this study,
the climate change impacts on various transportation
networks, including highways, were evaluated based
on the projected changes in precipitation, temperature,
sea level rise, storm surge, and intensity and frequency
of storms (U.S. Department of Transportation, Federal
Highway Administration, 2015). Table 6 outlines the
key tasks undertaken for VA under this study.
Table 6: Vulnerability assessment task/stages
Tasks Objectives
Criticality assessment Identification of the most critical assets from a socio-economic, operational, and
health and safety viewpoint
Gathering and processing
climate information
Projection of key climate stressors—temperature, precipitation, sea level rise, storm
surge, and wind over a time period; Identification of relevant climate data formats
Screening for vulnerability Identification of the most vulnerable critical assets to climate change;
Identification of system-level vulnerabilities, such as regions that are particularly
vulnerable, climate stressors, timeframes of particular concern
Conducting detailed
engineering assessments
Development and testing of a detailed climate impact assessment process to evaluate
the climate vulnerabilities and possible adaptation strategies;
Documentation of specific findings relevant to engineering practices
Key Takeaways
This methodology highlights the importance
of conducting a criticality assessment of the
transportation systems for vulnerability and risk
assessment of infrastructural assets. In order to
determine the criticality, the evaluation criteria were
developed for three broad categories (Table 7).

22
Reducing Carbon Footprint and Enhancing Climate Resilience of National Highways in India
P Socio economic importance
P Use and operational characteristics
P Health and safety role in community
The criticality was then evaluated based on the scoring
of each criterion. The scoring was based on the volume
of traffic, traffic modelling, expert judgments, and
other allied parameters. An overall criticality score of
high, medium, and low was given to the assets.
On similar lines of the ADB methodology, U.S. DOT’s
methodology also recommends analysing multiple
climate change scenarios in order to minimize the
uncertainty in climate change impacts projected for
the future. All the information gathered on criticality
of assets, projections of climate stressors, and asset
sensitivity to climate change is then compiled based
on a scoring approach to come up with a vulnerability
index in order to identify assets which will be most
vulnerable to climate change. The technical assessment
and vulnerability indices for various assets are further
refined and finalized after validating the results with
experts and various stakeholders (U.S. Department
of Transportation, Federal Highway Administration,
2015).
While the vulnerability assessment methodology
developed by ADB limits to a broad assessment at the
project scale for identifying resilience options, this
methodology goes a step further to conduct detailed
engineering assessments of the vulnerable assets for
a detailed evaluation of the structural integrity and
effectiveness of adaptation measures. Overall, this
methodology is of direct relevance to the current study
because it studies the impacts of climate change on
various transportation networks, including highways.
Table 7: Criticality criteria for highways
Socio-economic Use/Operational Health/Safety
Highways Locally identified priority corridors
Serves areas and economic centres
Functional classification
(Interstate, etc.)
Usage (Average Daily Traffic)
Evacuation route
Component of disaster
relief and recovery plan
Adapting to Climate Change: Canada’s First National Engineering Vulnerability Assessment of Public Infrastructure (Canadian Council of Professional Engineers, 2008)
Under this Canadian study, the vulnerability assessment
of four categories of infrastructure, namely, water
resources, storm water and waste water, roads and
associated infrastructure, and buildings was conducted.
As a result of the study, ‘The Engineering Vulnerability
Assessment Protocol’ was developed. This five-step
protocol (Figure 3) provides the methodology to be
adopted while conducting an assessment of vulnerability
of infrastructure to climate change. The methodology
is of relevance to the current study as it provides an
approach for vulnerability assessment, particularly for
roads among other infrastructure.
Figure 3 Five-step protocol adopted by the study
Source: Adapting to Climate Change: Canada’s First National
Engineering Vulnerability Assessment of Public Infrastructure.
Canadian Council of Professional Engineers, 2008

23
Climate Vulnerability Assessment of Highways
Key Takeaways
One of the key components and takeaways from this
methodology is the project definition or scoping
exercise that is conducted as the first step prior to any
climate or non-climate data analysis. This step helps
in defining the boundaries and geographical scale of
assessment based on the location of infrastructure,
load, age, and historic climatic data. This step also
involves identifying relevant information, documents,
and data formats (Canadian Council of Professional
Engineers, 2008). Another key feature of this
methodology is an indicator-based risk assessment
of road infrastructure assets. This involves an
evaluation of the impacts of relevant climate events
and factors on the key infrastructure elements and
performance of road assets in terms of ‘high’ and
‘medium’ vulnerability based on the number of cases/
incidence of past events (Figure 4) (Canadian Council
of Professional Engineers, 2008). Remedial actions
for the upgradation of infrastructure, management
Figure 4 Factors considered for the vulnerability assessment of roads
Source: Adapting to Climate Change: Canada’s First National
Engineering Vulnerability Assessment of Public Infrastructure.
Canadian Council of Professional Engineers, 2008
actions, and monitoring of performance are identified
based on this assessment.
The Federal Highway Administration’s (FHA’s) Climate Change and Extreme Weather Vulnerability Assessment Framework (U.S. Department of Transportation, 2012)
The Federal Highway Administration’s (FHA’s)
Climate Change and Extreme Weather Vulnerability
Assessment Framework is a guide for transportation
agencies for assessing their vulnerability to climate
change and extreme weather events. The framework is
of relevance to this study as it outlines a step-by-step
methodology for vulnerability and risk assessment of
highways in any geographical context. The framework
broadly comprises of three key steps—defining study
objectives and scope, assessing vulnerability, and
incorporating results into decision-making (Figure 5).
Key Takeaways
A key learning from this methodology is its first step
which focuses on defining the objectives and scope of
the assessment study. The methodology argues that this
step is a pre-requisite for VA of highway infrastructure
as it helps in determining the data and level of detail
required in the analysis. This will also be important
from the perspective of monitoring and assessing the
impacts/success of identified adaptation measures.
This step also includes identifying the relevant
infrastructure assets and delineating the geographical
scale for which the assessment is to be conducted
based on objective of the assessment. The framework
recommends delineation of the geographical scope
based on administrative jurisdiction or geographic
vulnerability. It may also be done such that it includes
the relevant infrastructure for assessment, for instance,
old, stressed or most critical infrastructure (U.S.
Department of Transportation, 2012).
The methodology also highlights the importance of a
combined approach for establishing the criticality of
the infrastructure assets prior to VA, wherein a desk
review identifies an initial list of critical assets based
on commonly available data, such as average daily
traffic or economic information for the region (e.g.,

24
Reducing Carbon Footprint and Enhancing Climate Resilience of National Highways in India
Figure 5 : Climate Change and Extreme Weather Vulnerability Assessment Framework
Source: U.S. Department of Transportation, 2012
data on imports/exports from a particular port). The
project team then utilizes the results of the desk review
to inform and structure feedback from stakeholders
and local experts. The methodology recommends
consideration of the exposure,1 sensitivity,2 and
adaptive capacity3 to develop a risk rating matrix
(Figure 6). This helps in identifying the likelihood and
extent of impacts of climate change factors and events
on vulnerable assets as well as prioritizing adaptation
options. It is suggested that the sensitivity to climate
change may be assessed based on identification of
climate thresholds in terms of the kind and level of
climate factors and events which may affect an asset.
This particular step is relevant for the current study
due to the absence of such thresholds for the highways
sector in the Indian context. The FHA methodology
recommends a detailed analysis of design standards
and the extent of loss and damage caused in the past
by climate events to identify these climate thresholds.
In order to develop climate information, the
1 Exposure refers to whether the asset or system is located in an area
experiencing direct impacts of climate change, such as temperature and
precipitation changes, or indirect impacts, such as sea level rise.
2 Sensitivity refers to how the asset or system fares when exposed to an
impact.
3 Adaptive capacity refers to the system’s ability to adjust to cope with the
existing climate variability or future climate impacts.
methodology recommends referring to the existing
climate knowledge developed by others or working
with climate modellers to develop projections tailored
to the project’s need, however, it notes that the latter
is a resource-intensive approach (U.S. Department
of Transportation, 2012). The climate and asset
information is combined by overlaying the climate
projections in a GIS-based format. Adaptation
strategies are evaluated based on their feasibility,
efficacy, and the ability to withstand a range of climate
hazards, costs, and co-benefits (U.S. Department of
Transportation, 2012).
Dorset County Council’s Approach for Building Resilience in Local Highways (Climate UK, 2013)
A sequential approach to assess climate risks was
adopted by Dorset County Council in UK with
an objective of making investment decisions for
building climate-resilient highways and formulating a
highways asset management plan. The study followed
a broad approach of assessing comprehensive climate
risks at the county, district, and borough level and
then conducting a detailed risk assessment for
highways at the local level to come up with a sector-
specific adaptation plan and asset management plan
(Figure 7). The detailed risk assessment included the
likely impacts of climate change factors and events on
Figure 6 Risk Rating Matrix
Source: Adapting to Rising Tides: Transportation Vulnerability and
Risk Assessment Pilot Project, November 2011

25
Climate Vulnerability Assessment of Highways
physical assets, such as road surfaces as well as impacts
on end user and operations due to failures of the asset
(Climate UK, 2013).
Key Takeaways
The methodology highlights the importance of
prioritizing highways assets in terms of their critical
role in supporting communities and the economy and
the impact of its failure on the delivery of all other local
government services. This was carried out with two
objectives. First, to scope the relevant highway assets
for VA and second, prioritizing adaptation actions
and formulating the asset management plan. Another
key learning from this methodology was the approach
adopted for identifying climate thresholds. Thresholds
were chosen based on their relevance to highway
assets and operations based on first, the identification
Figure 7 Assessment framework; Dorset County Council, UK
Source: Climate UK, 2013
of specific climate factors that are likely to impact
highways and second, the extent of likely impact.
For instance, projected information on high and low
temperatures, precipitation, and drought for each
decade up to the 2080s was combined with highway
information in a GIS-based format to build scenarios
of the likely extent of risk. Moreover, the methodology
recommended the use of previous climate change risk
assessments and local insights in addition to future
climate projections to understand the vulnerability
and likely risks, and thereby developing a management
plan for each highway assets group.
TERI’s Methodology and Framework for Urban Risk Assessment (TERI, 2013)
The methodology was developed with an objective to
understand the existing and future risk profile of an
urban area—infrastructure, assets, and communities—
based on a city-scale vulnerability assessment to
climatic and non-climatic hazards and stressors. The
methodology is intended as a quick, easy-to-use, step-
by-step guide for city-level practitioners and decision-
makers and primarily relies on local secondary data
and consultations with relevant stakeholders (Figure
8). Though a detailed climate analysis, based on
globally accepted scientific climate models, is a key
step in understanding the present and future risks and
vulnerabilities of the case study city, the methodology
notes that such capacity may not be available at the
city level. Therefore, it suggests using the available
climate knowledge at the state or national level as an
alternative. Identification of vulnerable hotspots and
communities is done by overlaying the future climate
and socio-economic projections on the existing risk
profile of the city (TERI, 2013). This leads to the
identification of structural and non-structural (policy)
resilience options to address the vulnerabilities of
different infrastructure assets and communities.
Key Takeaways
As stated earlier, there are no specific studies
conducted in respect of climate vulnerability
assessment of the road sector in India. Since TERI has
successfully developed and applied this methodology
of vulnerability assessment of urban infrastructure,
including roads, it has been considered for discussion

26
Reducing Carbon Footprint and Enhancing Climate Resilience of National Highways in India
here. The methodology is simple to use and can
be easily customized to help in the vulnerability
assessment of NHs.
3.2 Conceptualizing the proposed methodology for vulnerability assessment of highways in India
A review of the aforementioned methodologies
provides an understanding of the type of approaches
used in assessing vulnerability in the context of road
and highway infrastructure. The key takeaways from
the review of relevant methodologies have been
contextualized and adopted for developing new and
customized methodology for climate vulnerability
Figure 8: Risk Assessment Framework for urban infrastructure and communities
Source: Risk Assessment and Review of Prevailing Laws,
Standards, Policies and Programmes to Climate Proof Cities-
Synthesis Report for Guwahati, TERI, 2013.
assessment of NHs in India. These key takeaways have
been discussed as follows:
P Need for VA and resilience building of
highways—All reviewed methodologies iterate the
importance of VA and resilience building of roads
and highways for making investment decisions
and identifying adaptation options in view of
the climate change impacts, extreme events, and
resulting likely risks to highway infrastructure
assets. This has also been highlighted by the loss
and damage caused by multiple recent climate
events in India as discussed in Chapter 2 ‘Impact
of Climate Change on Highways’. At the network
level, VAs will help in prioritizing investment
decisions. At the stretch level, detailed risk
assessments will help in identifying appropriate
engineering interventions for retrofitting.
P Importance of identifying objectives and scope
of the VA methodology—Four methodologies
(ADB, U.S. DOT, Canadian Council of Professional
Engineers, FHA) out of the six, discussed in the
preceding section, highlight the importance of
defining objectives and boundaries or scope of the
study. It is observed that this exercise is important
for delineating the relevant geographical extent
and assets and services that may be impacted by
climate change. The objectives and scope of the
study, and whether the VA is being carried out to
develop a new highway or retrofit an existing one,
will also help in determining the relevant data
and level of details required for the assessment.
P Developing climate scenarios—Development
of multiple climate scenarios is recommended
based on analysis of past/existing trends of climate
parameters and events as well as future projections.
However, most methodologies recommend that
regional climate change information should be
adopted from the existing national and regional
climate change initiatives or studies, as developing
such projections at the regional level can be costly
and time consuming.
P Criticality assessment—A criticality assessment
of the highway networks and infrastructure is
highlighted by multiple methodologies reviewed
above as a key step (U.S. DOT, FHA, and Dorset
County Council). This is considered important by

27
Climate Vulnerability Assessment of Highways
the authors, especially at the l network level, for
prioritizing investment decisions for resilience
building of highways. Criticality may be defined
in the context of the socio-economic and regional
importance of the highway, operations, etc.
P Risk assessment—The methodology adopted by
the Canadian Council of Professional Engineers,
FHA, and Dorset County Council recommend a
risk assessment for ranking the vulnerability of
specific highway elements and infrastructure. This
has typically been done using qualitative matrices
or systems of scoring and weightages. This step
is also considered important by the authors for
the current study for identifying appropriate
engineering interventions for the vulnerable
stretches/sections.
Besides, identification of low and high thresholds for
climate parameters, such as temperature, precipitation,
drought, storm surges, etc., has been done in the case
of methodologies recommended by the FHA and
Dorset County Council. This step is also considered
important by the authors for a detailed vulnerability
and risk assessment of NHs and prioritizing
areas of investments and interventions. However,
identification of such thresholds will require further
detailed studies and is recommended as a way forward
for mainstreaming climate change concerns in the
highway and road development policy and guidelines,
such as IRC Codes.
3.3 Proposed methodology for carrying out climate vulnerability assessment of NHs sector in India
Based on the key takeaways from the review of VA
methodologies, a broad framework for VA of highways
in India has been developed by TERI which has been
discussed in the subsequent section. The proposed
approach adopts the good practices from the reviewed
methodologies to develop a new and customized
methodology for vulnerability assessment of NHs in
India. The proposed methodology may be applied
for vulnerability assessment of both new and existing
highways, including highway alignment, expansion,
and upgradation.
It is also observed that vulnerability assessment for
resilience building of highways, both at network
and stretch levels, is a good practice. Accordingly,
the proposed methodology suggests the approach
and key steps for ensuring VA of highways at both
levels. It is recommended that climate VA should
be an integral part of investment planning and
development of any highway network, especially
in areas with higher likelihood of climate change
impacts and hydro-meteorological extreme events.
This will include the Himalayan terrain, coastal and
desert regions, and high flood-risk areas.
Though the proposed methodology is intended as
a step-by-step guide that can be applied across the
country, it is to be noted that the methodology will
need to be contextualized based on the topographical
and climatic/hydro-meteorological factors. Local
insights from experts and stakeholder consultations
will play a key role in this exercise.
Moreover, as discussed earlier, the proposed VA
methodology is intended as an easy and quick
decision-making tool for planners and practitioners
in the field of highway development in India and,
therefore, does not recommend primary data
collection or the use of complex analytical tools for
climate assessments.
Given the fact that NHs account for only about 2%
of the total roads network in India, it is suggested
that the Ministry of Road Transport and Highways
(MoRTH), Government of India, may recommend
this methodology for vulnerability assessment and
resilience building of roads and highways sector in
India to other relevant agencies at national, state,
and city level, apart from the National Highways
Authority of India (NHAI). Figure 9 presents the VA
methodology that has been developed by TERI—both
for network and stretch/local levels—and the step-by-
step approach is discussed below.
Step 1: Defining objectives
The first step of a VA exercise for the highways
sector would be to identify the objectives, and some
examples of study objectives for VA of highways
sector could be:
P Vulnerability assessments at the network level for:

28
Reducing Carbon Footprint and Enhancing Climate Resilience of National Highways in India
• Planning a new highway network in a region
• Identifying stretches at risk to climate change
impacts on the existing highway network for
prioritizing investments
• Identifying effective adaptation strategies for
existing or new highways
P Local vulnerability assessment at stretch level for:
• Prioritizing retrofitting measures on the
existing risk-prone highway stretches
• Identifying evacuation routes and formulating
plans for disaster risk management
Therefore, the first step is proposed both for network
level and stretch/local level assessments. It is important
Figure 9: Methodology for Climate Vulnerability Assessment of Highways
to define the objectives at this stage as this will facilitate
delineation of the geographical limits and determine
the data and level of details required in the study. For
instance, planning a regional-level highway network
will be more of a strategic decision-making exercise
requiring planning scale analysis and data, such as
land use, regional importance and traffic demand
analysis, etc. On the other hand, identification of
retrofitting measures for existing highway assets would
require more detailed information at the design and
engineering scale, for instance, construction materials,
detailed contours and slopes, etc. Identification of the
specific objectives will help in relevant and seamless
implementation of the methodology at subsequent
stages.
Step 2: Scoping
The scoping exercise would define the scope of the
study and boundaries for VA; which in turn would help
in focussing the assessment to significant and relevant
climate parameters and geographical extent. This step
is proposed both for network level and stretch/local
level assessments. The project proponent can carry
out the scoping exercise with inputs from technical
experts, public representatives, local communities,
and other stakeholders. This step should result in the
following:
P Delineation of geographical limits—The
geographical limit of the study will be contingent
on the highway stretch in consideration and
objective of the study. For instance, for planning
and finalizing alignment of a new highway stretch,
the study area will need to be defined in such a
way to include all the key settlements/ nodes to
be connected. On the other hand, for identifying
stretches or assets at risk to climate change impacts
on existing highways, the study area will need to
include all the key infrastructure assets for which
the outcomes of vulnerability assessment are
relevant, such as transport terminals, economic
hubs, settlements, etc. Similarly, low-lying areas
in case of coastal stretches are more vulnerable
to flooding from sea-level rise or river flooding.
The study might focus on these areas to quickly
limit the analysis to the highway elements and
infrastructure most likely to be affected by climate
changes (U.S. DOT, 2012). The delineation of the

29
Climate Vulnerability Assessment of Highways
geographical limits will thus differ for each study
or stretch based on the objective and context of
the VA and jurisdiction of the proponent of the
study. However, to start with, the proponent may
consider including the right of way (ROW) as
well as the areas falling within a minimum of 500
m on both sides of the ROW. This is in line with
the existing approaches for transport corridor
assessment studies in India, such as Environment
Impact Assessment (EIA).
P Identification of key issues and parameters
(climate and non-climatic) to be considered—
For the purpose of assessing the vulnerability of the
highway stretch, it is suggested that both climatic
and non-climatic parameters/stressors should be
identified at this stage. Inputs from local experts
and stakeholders may be used for identifying the
most relevant issues/ parameters to be considered.
• Climate stressors
In order to analyse climate stressors for any
region, it is important to understand the past
and future climate variability over the region
by looking at historical trends of key climate
parameters, such as temperature, rainfall, past
history of extreme events, etc. For instance, in
case of coastal areas, inundation caused by sea
level rise will be an important consideration.
For this purpose, tide gauge data to understand
the historical sea level rise, and cyclone
frequency and intensity data along with
surge data provides useful information. Also,
precipitation variability and wind speed are
other key climate parameters to be considered.
For hilly areas, it would be relevant to study the
past incidences of extreme precipitation and
flooding events resulting in landslides. Even
though landslide events are a result of multiple
factors, it is important to consider them as
extreme climate events have been observed to
aggravate their occurrence.
• Non-climatic stressors
Non-climatic stressors for the highways may
include but not be limited to the terrain,
drainage, and material and construction
technique of the highway stretch in
consideration.
P Identification of the sources of data and local
knowledge—Identification of data sources at
this stage will enable easy and quick collection
of data at the next stage. Sources of information
can be identified on the basis of key issues and
parameters identified in the previous stage. For
instance, all climate data can be sourced from
the meteorological department, data on sea level
rise is usually available with port authorities and
Survey of India as a tide gauge dataset. It can also
be accessed via the open source database available
online (e.g. PSMSL website4) It is also observed
that some of the data needed for vulnerability
assessment is typically not recorded. In such cases,
discussion with local experts can provide a lot of
insights. These sources of local knowledge should
also be identified at this stage. It is recommended
to rely on secondary data sources rather than
primary surveys. It may also be noted here that
resilience building of highways would require
multi-sectoral data and coordination with other
national and state line departments such as
meteorological department, environment and
climate change department, disaster management
agencies, etc., multi-stakeholder consultations are
therefore recommended.
P Identification of relevant analytical tools
and techniques–Relevant analytical tools and
techniques may be identified at this stage based
on the timeline of study and details of outcomes
required. For instance, a detailed climate and SLR
projection modelling exercise typically takes 6-8
months and therefore, should be used in case of an
extended study timeframe (of more than 1 year)
or in the of requirement of detailed assessments.
However, for a rapid vulnerability assessment, it
is more suitable to use available regional climate
change information from existing national or
regional climate change initiatives or studies.
Similarly, in case spatial assessments are needed,
GIS-based vulnerability mapping techniques
are recommended for identification of specific
vulnerable hotspots.
4 PSMSL: Permanent Service to Mean Sea Level http://www.psmsl.org/,
last accessed on September 5, 2017.

30
Reducing Carbon Footprint and Enhancing Climate Resilience of National Highways in India
Step 3: Collection & Integration of Data
This step is proposed both for network level and
stretch/local level assessments. It would involve
collection and integration of the data required for the
vulnerability assessment as identified in Step 2. This
would include the data related to climatic and non-
climatic parameters. It will include:
P Climate data on parameters including temperature,
rainfall, past history of extreme events, etc.
P Material and construction techniques
P Highway elements, drainage, traffic control and
safety infrastructure
P Criticality parameters – socio-economic
importance, use and operational characteristics,
and health and safety role
This data will help to create the exposure profile
pertaining to climate impacts over the study area. A
detailed data checklist for vulnerability assessment of
a highway stretch may be referred from Annexure 1.
Step 4: Developing climate scenarios
This step relies on the available climate information
for the future time periods over the selected highway
stretch. As discussed under the ‘Scoping’ section
above, the past climate information can be developed
by using the historical observational datasets available
either from the Indian Meteorological Department
(IMD) or via the open source datasets available online
(reanalyses datasets). The historical dataset analysis
forms an important part of the methodology as it
helps to understand the existing climate profile and
vulnerability of the study area and also to choose the
relevant climate variables to be analysed for the future
time periods (for e.g. SLR values for coastal and extreme
precipitation for hilly areas). In case the relevant
datasets are not available, it is recommended to use
the datasets from the nearest meteorological station
as first approximation. In case of non-availability of
relevant datasets, gridded dataset5 over the region can
be utilized as next level of approximation. The gridded
datasets are available from IMD on payment basis.
The climate profile publications from IMD for that
area also forms a useful information source in case of
5 IMD gridded dataset: IMD provides gridded datasets at two horizontal
resolutions. It’s advised to take 0.25 degree rainfall datasets for the
analyses. http://www.imd.gov.in/advertisements/20160219_advt_12.pdf
data unavailability. For analysis of future climate and
its impacts, datasets from high resolution (smaller
grid size i.e. of the order of 50 kms or less) regional
climate model becomes essential. Future projections of
relevant climate variables and their probable changes
provide the necessary information for analysing an
impact or vulnerability over the study area. Since
climate modelling requires special infrastructure that
includes high performance computers and storage, it
is recommended to emphasize on these capabilities
before initiating the study. In case the required
infrastructure to develop the primary dataset (future
climate data) is not available, the next best option is
to approach the Indian Ministry of Earth Sciences
to request for availability of high resolution climate
projection data for future time periods over the
study area. Alternately, relevant datasets may also
be retrieved from open source modelling databases.
However, availability of such datasets over the study
area and at higher resolution may be a challenge.
Hence, it is imperative to utilise primary dataset via
modelling exercise or information from an existing
study, which can be either from the government (for
example: INCCA report of 2010) or from a research
institute (TERI studies on coastlines and future
projections over various states). It should be noted
here that any high resolution modelling study for
assessing future (say 30 years from present) climate
impacts ideally requires more than 1 year of total time
including computational time (considering an average
level fast super computer) and post processing of
model data with analysis.
This step is proposed both for network level and
stretch/local level assessments. Based on this approach,
the outcomes of this step will entail:
P Past and future climate profile over the highway
stretches
P Past and future profile for extreme climate events
P Sea level rise and storm surge assessment (over
coastal stretches)
Step 5: Identification of vulnerable hotspots
This step is proposed both for network-level and
stretch/local-level assessments. It would result in
identification of vulnerable hotspots, that is, vulnerable
sections of the highway stretch based on the climate

31
Climate Vulnerability Assessment of Highways
scenarios developed in Step 4. An exposure profile of
the study area will be created outlining how known
climatic conditions are affecting the system and
highway functioning based on an understanding of
the impacts, loss and damage caused by past climate
and extreme events. This would involve overlaying
of past climate profile and the information related to
the existing baseline (condition of pavements, traffic
control and safety infrastructure, vegetation, capacity
of drainage, topography, etc.) on a GIS platform. The
future climate scenarios developed in Step 4 will then
be overlaid onto the exposure profile for assessing the
vulnerability of the highway to future climate impacts.
The vulnerability mapping exercise will result in
identification of vulnerable hotspots, that is, vulnerable
stretches at the network level and vulnerable sections
on the stretch level. Besides, consultations with local
experts and stakeholders will be an integral part of this
step. This will help in validating the outcomes of the
technical assessment and in prioritizing adaptation
options at a later stage.
Step 6: Prioritizing areas for investment and
interventions
Assessments conducted in this step will help in
identifying areas for investments and interventions.
In case of a network level assessment, a criticality
assessment of highway network will be conducted to
prioritize the ‘critical’ highway stretches for investments
in resilience building. In the context of a stretch level
assessment, a detailed risk assessment exercise will be
conducted to prioritize highway elements requiring
engineering interventions or retrofit measures.
Criticality Assessment
Criticality assessment would be particularly relevant
for the network level vulnerability assessment of
National Highways. Critical highway stretches will be
identified with respect to the three main broad sets of
parameters (U.S. DOT, 2012) in the vulnerable areas
mapped in Step 5:
a) Economic importance
b) Operations
c) Health and Safety
Table 8 presents an indicative checklist of these
parameters for the Indian scenario. However, these
parameters maybe further qualified and refined
based on the context. Criticality assessment will help
in prioritizing investment decisions for resilience
building in regions vulnerable to climate change.
Risk Assessment
A risk assessment of highway elements and
infrastructure is recommended at the stretch level to
prioritize highway elements requiring engineering
interventions or retrofit measures. This step would
result in identification of most risk prone highway
elements to climate impacts due to high temperature,
precipitation, storm surges, etc. This will be based on
the sensitivity (the likely extent of impact of the specific
climate risks) of the vulnerable stretches identified in
Step 5. The existing exposure profile developed in Step
5 can provide an understanding of the kind and extent
of climate impacts to which highway elements are
sensitive to. For instance, a storm surge threshold could
be a surge value (in metres) that causes inundation of
10 per cent of the highway stretch thereby causing loss
and damage to pavements or highway elements such
as drains, lighting, etc. Based on this, a risk assessment
matrix can be developed that classifies risks into three
categories (low, moderate, high). This classification
may be done based on the following considerations
(U.S. DOT, 2012, Table 9):
P Low risk—Highway elements and infrastructure
that have a low likelihood of being impacted by a
future climate condition with a low consequence
of the impact may be classified as ‘low risk’.
P Moderate risk—Highway elements and
infrastructure that have a low likelihood of being
impacted by a future climate condition with a high
consequence of the impact may be classified as
‘moderate risk’
OR
P Highway elements and infrastructure that have
a high likelihood of being impacted by a future
climate condition with a low consequence of the
impact may be classified as ‘moderate risk’.
P High risk - Highway elements and infrastructure
that have a high likelihood of being impacted by a
future climate condition with a high consequence
of the impact may be classified as ‘high risk’.

32
Reducing Carbon Footprint and Enhancing Climate Resilience of National Highways in India
Table 9: Risk assessment assumptions for highway
elements and infrastructure
Risk Consequence
Low High
Likelihood Low Low Moderate
High Moderate High
Table 8: Indicative checklist of criticality assessment
parameters
Parameters
Economic Importance
Intermodal connectivity –provides access to airport,
port or rail
Connects Industries/Power Plants
Serves economic centres- SEZ/ route for a primary
economic activity
Connects major settlements, for instance, million plus
cities, state capitals, popular tourist cities, pilgrimage
cities etc
Operational Characteristics
Functional classification 6
Usage- Annual Average daily traffic
Health and Safety
Provides access to regional health facilities such as
Super Speciality Hospitals, Regional Speciality Health
Centres/ Medical Colleges, etc.
Part of Disaster relief and recovery plan, for instance,
Identified Evacuation route or key connection during
emergency situations
Component of the National Defence System, for
instance, National Highways connecting border roads
and critical national defence areas
The risk assessment matrix will help in identifying
appropriate resilient building strategies required
towards step 8 and prioritize them accordingly.
Step 7: Identifying interventions for resilience
building
This step would involve identification of the most
relevant measures/solutions for resilience building of
highway stretches. These would include engineering
interventions (such as ‘resilient’ new assets, retrofitting
existing assets, more intensive maintenance schedules,
improved operations plans, etc.) at the stretch level and
non-engineering interventions (viz. policy, institutions,
capacity building, etc.) at the network level.
Moreover, it is desirable that the proposed interventions
should be classified into short and long-term in the
context of the identified highway stretches based on
their feasibility, efficacy, ability to withstand a range of
climate hazards, and co-benefits.
This methodology for VA as discussed above may be
used as a step-by-step guide for understanding climate
change risks and identifying adaptation options for
the roads sector, both at the network and stretch
level in India. However, as observed earlier, it may
be contextualized to suit the specific requirements
based on the objectives and expected outcomes, and
topographical/ hydro-meteorological regions and
settings.
As part of this study, the proposed methodology will
be demonstrated at the country level on the entire
National Highway network and for two NH stretches
in the local context—hilly (Shimla–Moorang on NH 5
in Himachal Pradesh) and coastal (Kathipudi–Ongole
on NH 216 in Andhra Pradesh). The next chapter gives
a detailed discussion on the approach and outcomes of
the VA exercise conducted.
6 For the purpose of this study since the scope is limited to National
Highways this parameter will not be applicable. However, when being
used for other roads, stretches with greater functional importance such
as National highways or State Highways will have a higher functional
importance as compared to other roads (MDRs, PWD roads, urban
roads, etc)

Applying the Proposed Methodology
for Vulnerability Assessment of
Highways4

34
Reducing Carbon Footprint and Enhancing Climate Resilience of National Highways in India

35
4 Applying the Proposed Methodology for
Vulnerability Assessment of Highways
This chapter gives a detailed discussion
of the approaches and outcomes of the
demonstrative vulnerability assessment (VA)
exercise conducted both at the network and stretch
level. In the network context, the methodology has
been applied for the country-level NH network and
in the local context it has been demonstrated over
two NH stretches- hilly (Shimla–Moorang on NH
5 in Himachal Pradesh) and coastal (Kathipudi–
Ongole on NH 216 in Andhra Pradesh). Section 5.1
focusses on the country-level assessment; section 5.2
and 5.3 discuss the outcome of VA of the hilly stretch
– Shimla-Moorang on NH 5 in Himachal Pradesh
and the coastal stretch of Kathipudi–Ongole on NH
216 in Andhra Pradesh, respectively.
4.1 Vulnerability Assessment of National Highways at the Country Level in India
Step 1: Defining Objectives
Based on the overall scope of the study, the objective
and outcomes of the VA include:
P Identifying NH stretches that are at risk to climate
change impacts at the country level.
P Recommending non-engineering interventions
for building climate resilience of the NH network.
.
Step 2: Scoping
A scoping exercise has been conducted at this step to
define the geographical boundaries as well as the study
parameters, data sources, and tools and techniques of
assessment for the purpose of this study.
P Delineation of geographical limit—Since the
exercise is being conducted at the country level the
geographical scope aligns with national boundaries
and includes all the NHs in the country (Map 1).
P Identification of key issues and parameters
(climatic and non-climatic)—Existing literature
suggests that the key parameters relevant for
understanding climate change impacts in the
Indian context include temperature, precipitation,
and pattern of extreme events (MoEF, 2010).
In terms of the non-climate parameters, slope
instability is one of the key stresses on highways
and roads. This has been understood in terms
of topography (elevation) and seismic activity
as it decreases stability by tectonic movements
and decomposition of the geologic materials
(CPWD Engineers Association, 2012). Besides,
built parameters, including settlements and
infrastructure, will play a key role in deciding the
vulnerability and extent of risk of the highways.
P Identification of sources of data and local
knowledge—Identification of sources of
secondary data and expert stakeholders was
done at this stage. These include MoRTH and
NHAI who will also be the primary users of
the outcomes of this study. Other relevant data
sources at the national level include Indian

36
Reducing Carbon Footprint and Enhancing Climate Resilience of National Highways in India
Map 1: Geographical delineation - National Highways at the country level in India
Source: NHAI

37
Applying the Proposed Methodology for Vulnerability Assessment of Highways
Meteorological Department (IMD) and National
Disaster Management Authority (NDMA). For
future climate information, data has been derived
from the existing literature on future climate
scenarios from India. This includes scientific
papers and 4X4 Assessment Report of the Indian
Network for Climate Change Assessment (MoEF,
2010). Apart from this, certain open data sources,
such as BHUVAN hosted by ISRO/ NRSC, and
Aster Global Digital Elevation Model which
is freely available through UGCS7 have been
used for sourcing physiological information. A
detailed discussion on data collection and sources
is presented in Step 3.
P Identification of Analytical Tools and Techniques
for Vulnerability Assessment—The overall spatial
vulnerability mapping exercise has been conducted
using an Arc GIS platform. The input layers to
the mapping exercise have been developed based
on secondary information received from various
agencies and open data sources as mentioned
in the preceding paragraph. Detailed technical
methodology and considerations for each step of
mapping and assessments have been discussed
through Steps 4–6.
Step 3: Collection and Integration of Data
One of the key steps to conduct the VA is to identify
the kind of data that needs to be collected. The data
collection was primarily aligned towards developing
an exposure profile of the entire NH network to
various climate and non-climate parameters identified
in Step 2. For this purpose, the NH network map was
obtained from the NHAI. In order to develop the
exposure profile for the NH network, and identify
vulnerable highways stretches in different regions
and critical highways that need to be prioritized for
building climate resilience, the following datasets were
available and have been collated:
P Climate parameters:
• Projected changes in mean and extreme
precipitation over very wet days sourced
from a study titled ‘Projected Changes in
Mean and Extreme Precipitation Indices over
India’ (Rao et al. 2013). The findings of this
7 United States Geological Survey
paper have also been found to be consistent
with other relevant literature, such as Krishna
Kumar et al. (2011) and the 4X4 Assessment
Report (MoEF, 2010) .
• Hydro-meteorological extreme events—Wind
and Cyclone Hazard map sourced from the
National Disaster Management Authority.
P Non-climate parameters:
• Seismic Zonation sourced from the National
Disaster Management Authority
• Physiographic map of India sourced from
Survey of India
• Settlement Pattern—Cities with population
more than one million have been mapped,
based on the data obtained from Census 2011
• Key infrastructure—Locations of ports and
airports have been mapped based on the
information taken from Google Earth8
• Operations—The Indian Highways
Management Company Limited has been
approached for collecting the data related
to traffic on the entire highway network.
However, the data is awaited
Step 4: Developing Climate Scenarios
For understanding and spatial mapping of future
climate scenarios for the country, existing literature,
such as scientific papers and study reports, have been
referred. These include the 4X4 Assessment Report of
the Indian Network for Climate Change Assessment
(MOEF, 2010), and other pioneering research such
as (Rao et al. 2013) and (Krishna Kumar et al. 2011).
These literatures indicate projected climate change
information for the Indian subcontinent, based on
an ensemble mean approach obtained from PRECIS
driven by IPCC A1B (business-as-usual) scenario for
mid and end 21st century.
PRECIS simulations indicate an all-round warming
over the Indian subcontinent associated with
increasing GHG concentrations with a high likelihood
of daily maximum and daily minimum temperatures
intensifying over the century. The region shows a small
increase in annual precipitation with respect to the
8 Google Earth displays satellite images of varying resolution of the Earth’s
surface, allowing users to see cities, houses, infrastructure, etc.

38
Reducing Carbon Footprint and Enhancing Climate Resilience of National Highways in India
baseline, that is 1970s. Although the frequency of rainy
days may decrease, the intensity of rainfall on a rainy
day may increase in the future. Moreover, as per IPCC
(2013) and MoEF (2010), there is a high likelihood of
increase in extreme hydro-meteorological events, such
as cyclones, and their intensity on the eastern coast of
India in the future.
For the purpose of this exercise, it is imperative to
understand exposure of NHs to the future climate
scenarios as discussed earlier. To this end, a spatial
assessment of changes in rainfall (Map 2) and hydro-
meteorological extreme events, that is, cyclone and
wind hazard (Map 3) has been conducted. Additional
climate information/parameters, including past trends
of temperature and precipitation, may further be
considered to refine the results of this climate VA.
Map 2 shows the projected changes in mean and
extreme precipitation indices over India using
PRECIS (Rao et al., 2013). It depicts the ensemble
mean of percentage change in rainfall over very wet
days9 of monsoon season for the future scenario
(2071–2098) with respect to baseline simulations for
1960–1990.10 Thus, towards the end of the century,
rainfall on very wet days may increase substantially
over the majority of the Indian landmass. This result
is consistent with the findings of Krishna Kumar et
al. (2011) that the intensity of rainfall on a rainy day
may increase in the future.
Map 3 is derived from cyclone and wind hazard
profile mapping of the National Disaster Management
Authority (NDMA).11 It depicts 5 categories of risk
zones which are vulnerable to combined effect of
cyclone and wind hazards in India. Coastal areas,
especially those located on the eastern coast, show high
vulnerability as a result of cyclonic and super cyclonic
events combined with high wind speeds. Vulnerability
of NHs in these regions is likely to aggravate in the
future in light of the findings of IPCC, 2013 and MoEF
(2010) which indicates an increase in the frequency
and intensity of cyclonic events on the eastern coast
of India.
9 As per Rao (2013), extreme précis, 95th percentile of precipitation on
wet days (R95p) is defined as the total rainfall on very wet days. Hence
very wet days are the days on which the rainfall exceeds the 95th
percentile.
10 (Rao et al. 2013).
11 Map derived from (NDMA,GoI, 2016)
Step 5: Identification of Vulnerable Hotspots
A VA mapping of the NH network in the country has
been conducted based on climate and non-climate
stresses/ parameters identified in Step 2, which
provides an overview of the vulnerability criteria
considered for these parameters.
To begin with, an exposure profile for NHs network in
India has been created by mapping the climate and non-
climate stressors/parameters as enumerated in Table 10.
A detailed discussion on the outcomes and an exposure
analysis of NHs with respect to earthquakes, wind and
cyclones and future rainfall anomalies is given below.
P Exposure of NHs to earthquake hazard: The
exposure profile (Map 4) has been created by
superimposing the earthquake zonation sourced
from earthquake hazard maps of NDMA over
the NH network in Arc GIS. Based on frequency
and intensity of seismic activities in the past, the
country is divided into 4 seismic zones wherein
very high seismic activity is found in very high
damage risk zone - V and viz. high, moderate, and
low seismic activity is found in high damage risk
zone – IV, Moderate damage risk zone – III, and
Low damage risk zone – II, respectively.
P Exposure of NHs to cyclone and wind hazard:
The exposure profile (Map 3) has been created
by superimposing the cyclone and wind hazard
profile mapping sourced from NDMA over the
NH network in Arc GIS. It depicts 5 categories
of risk zones which are vulnerable to combined
effect of cyclone and wind hazard in India. Based
on the frequency and intensity of cyclonic events
and wind speeds, the country has been spatially
classified into 5 categories—Very high damage
risk zone –B, High damage risk zone, Moderate
damage risk zone –A, Moderate damage risk zone
–B, and Low damage risk zone.
P Exposure of NHs to change in rainfall over very
wet days in future: The exposure profile (Map 2)
has been created by superimposing the projected
ensemble mean of percentage change in rainfall
over very wet days in future (2071–2098) over the
NH network in Arc GIS. In the future scenario,
the rainfall map shows there may be increase in
amount of rainfall received on very wet days over
major parts of India.

39
Applying the Proposed Methodology for Vulnerability Assessment of Highways
Map 2: Percentage change in extreme rainfall events -future scenario
Source: TERI, 2014

40
Reducing Carbon Footprint and Enhancing Climate Resilience of National Highways in India
Map 3: Cyclone and wind hazard map of India
Source: (NDMA,GoI, 2016)

41
Applying the Proposed Methodology for Vulnerability Assessment of Highways
Table 10 Parameters for country level vulnerability assessment of NH
Vulnerability
Ranking
Sl.No Parameters Criteria Classification Score Classification Score
Non-climate stressors/ parameters
1 Earthquake
hazard
Seismic Zonation
based on frequency
and intensity
Low damage risk
zone - II1
High damage risk zone
- IV2
Moderate damage
risk zone -III
Very high damage risk
zone - V
Climate stresses/ parameters
2 Wind and
Cyclone
hazard
Wind speeds;
frequency and
intensity of cyclones
Low damage risk
zone
1 High damage risk zone 2
Moderate damage
risk zone -B
Very high damage risk
zone -B
Moderate damage
risk zone -A
Very high damage risk
zone - A
3 Change
in rainfall
over very
wet days in
future
Percentage change -50 to -40 1 0 to 10 2
-40 to -30 10 to 20
-30 to -20 20 to 30
-20 to -10 30 to 40
-10 to 0 40 to 50
As an outcome of this step, the three exposure profiles
were overlaid to understand the overall vulnerability
of NHs (Map 5). The final vulnerability map depicts
the most vulnerable NH stretches based on scoring.
The vulnerability scoring has been derived based on
the following pointers:
P Equal weightage have been accorded to all the
vulnerability parameters (Table 10).
P A score of 1 and 2 has been assigned to the
vulnerability rankings of low, moderate, high,
and very high risk zones, respectively for each
parameter (Table 10).
P The total scores have been classified in the ranges
of 2–3, 3–4, 4–5, and 5–6 and have been assigned
a ranking of low, moderate, high, and extremely
high vulnerability, respectively.
Based on this assessment, it may be observed that the
NHs falling in the Himalayan region, north eastern
states, eastern coast of India, and the coastline of
Gujarat, Maharashtra, and Goa on the west coast are
found to be highly vulnerable, that is around 37% of
NHs are vulnerable. These vulnerable highways have
been enlisted in Table 11.
Step 6: Prioritizing areas for investment and
Interventions—Criticality Assessment
Step 5 aided in identification of the vulnerable NHs
for the study. However, in order to prioritize for
investment and interventions for resilience building,
a criticality assessment of the NHs should be carried
out, based on the indicative checklist presented in
Table 8. It may be noted that criticality parameters
to be considered for this exercise are not restricted to
these enlisted parameters and may be further refined
and expanded based on the context and objective of
assessment.
Step 7: Identifying interventions for resilience
building
Being a network-level assessment, the interventions
for building resilience of NHs sector in India are
primarily non-engineering in nature. Building
resilient roads and highways is a multi-step process

42
Reducing Carbon Footprint and Enhancing Climate Resilience of National Highways in India
Table 11: Vulnerable National Highway stretches
Highway
region
New National
Highways
Stretch
Eastern Coast
NH 85 Tiruvadanai and terminating at Tondi Port town - Muthupatti
NH 532 Salem road
NH 48 Chennai–Santhvellae
NH 18 Bharagora–Baripada–Betonti–Baleshwar
NH 16 Kharagpur–Kolkata
NH 132 Villupuram–Tindivanam
NH 16 Baleshwar–Bhubaneshwar–Vishakhapatnam–Vijaywada–Nellore–Chennai
NH 49 Baharagora–Kharagpur
NH 65 Machilipatnam–Vuyyuru
NH 116 Junction with old National Highway No. 6 near Kolaghat-Haldia Port
NH 38 Tiruchirapalli–Villupuram(NH38)
NH 332 Villupuram–Pondicherry
NH 38 Trichy–Melur
NH 36 Junction with old NH 132 near Vikravandi–Panruti–Vadulur–Neyveli–Township-
Sethiathop–Kumbakonam–Thanjavur
NH 87 Dhanushkodi–Manamadurai
NH 16 Baleshwar–Nikursini
NH 77 Pondy–Tindivanam–Gingee–Thiruvanamalai-Krishinagir
NH 81 Tiruchchirappalli–Mayanur
NH 316 Bhubaneshwar–Puri–Konark
NH 316 Junction with old NH 203 at Puri, connecting Bramhagiri and terminating at
Satpada
NH 716 Chennai–Thiruvallur
NH 336 Trichy–Pudukottai
NH 216 Kathipudi–Kakinada–Pamarru
NH 216 Junction of old NH 214 near Digamarru connecting Narasapur–
Machilipatnam–Challapalle–Avanigadda–Repalle Bapatla–Chirala and
terminating at its junction with NH 5 near Ongole
NH 57 Junction with old NH 5 near Khorada and connecting Nayagarh
NH 36 Thanjavur–Pudukottai–Sivaganga–Manamadurai
NH 136 The highways starting from Perambalur connecting Perali, Keelapalur, Ariyalur,
Kunnam, Thiruvaiyaru, Kandiyur and joining with old NH 226 at Thanjavur
NH 81 Thiruchirapalli–Lalgudi–Chidambaram road
NH 32 Tindivanam–Chennai
NH 32 Pondicherry–Chidambaram–Nagapattinam
NH 536 Pudukottai–Devakottai
NH 26 Natavalasa –Ramabhadrapuram
NH 83 Manapparai–Tiruchirapalli
Western Coast
NH 48 Pune–Kagal highway junction
NH 53 Haridaspur–Paradip Port
NH 44 Commorin (Kanyakumari)–Levinjupuram

43
Applying the Proposed Methodology for Vulnerability Assessment of Highways
Table 11: Vulnerable National Highway stretches
Highway
region
New National
Highways
Stretch
NH 66 Hedge–Honnavar and Ankola–Betkuli and Manoor– Katapady and Karivelha–
Thalipavambn and Kozikode–Vellimukku and Gurvayoor–Talikulam and North
Pavvor–Junction with old NH 47 near Edapally
NH 566 Ponda–Verna
NH 66 Junction with old NH 17 and NH 47–Allepy
NH 220 Kottayam to Chagnassery
NH 66 Junction with old NH 7 near Cortalim–Murmugao
Hilly
NH 44 Madhopur–Jammu–Banihal
NH 244 Batote–Doda–Kistwar–Symthan pass –Khanabal
NH 144 Domel–Katra
NH 1 Srinagar–Kargil–Leh
NH 10 Sivok–Gangtok
NH 17 North Salmara–Junction with old NH 37 near Jogighopa
NH 27 Nowgong–Daboka
NH 17 Goalpara–Guwahati
NH 127 Guwahati–Kaliabor
NH 715 Kaliabor–Jorhat
NH 715 Kuarital–Junction with old NH 52 near Tezpur
NH 315 Mukum–Ledo–Lekhapani
NH 129 Numaligarh–Dimapur
NH 6 Nongstoin and connecting Shillong–Passi Badarpur
NH 108 Aizawl–Manu
NH 217 Paikan–Mundal
NH 15 Baihata–Charali–Tezpur-Bander Dewa–North Lakhimpur–Kulajan
NH 515 Kulajan–Pasighat
NH 415 Banderdeva–Itanagar–Gohpur
NH 15 Kulajan–Dibrugarh
NH 27 Dabaka–Lumding
NH 302 Theriat–Lunglie
NH 7 Haridwar–Badrinath–Mana
NH 2 Kohima–Wokha–Mukokchung–Jhanji
NH 217 Rongjwng–Dudhnai
NH 102B Churachandpur–Singhat–Singhat–Sinzawl–Tuivai Road–upto Mayanmar Road
NH 127B Srimrampur–Dhuburi–Phulbari–Tura–Rongram–Ronjeng–Nongston
NH 2 Aizawl–Churachandpur
NH 127A Patacharkuchi–Bhutan border
NH 315 Ledo–Lekhapani–Indo / Myanmar–Border
NH 202 Junction of old NH 61 near Mokokchung and connecting Tuensang–
Sampurre–Meluri
NH 315A Tinsukia on old NH15 – Naharkatia – Hukanjuri – Khonsa
NH 154 Pathankot – Mandi

44
Reducing Carbon Footprint and Enhancing Climate Resilience of National Highways in India
Table 11: Vulnerable National Highway stretches
Highway
region
New National
Highways
Stretch
NH 303 The highways starting from Nagrota at the junction of NH 20 connecting
Ranital
NH 105 Pinjore–Nalagarh–Swarghat
NH 5 Kalka–Shimla–Narkanda–Rampur–Indo-China Border near Shipkila
NH 3 Dharampur –Mandi
NH 707 The highways starting from Paonta at the junction of old NH 72 connecting
Rajban, Shillai and passing through Minus, Tuini in
Uttarakhand and terminating at Hatkoti in Himachal Pradesh
NH 34/NH 934 Kanpur–Chhatarpur–Hirapur
NH 934 Hirapur–Sagar
NH 34 Rishikesh–Ampata –Tehri–Dharasu
NH 34 Dharasu–Uttarkashi–Gangotri Dham
NH 507 Junction with old NH 72 connecting Vikasnagar- Kalsi-Barkot and terminating
at junction with old NH 94 near Barkot bend
NH 8 Dhaleshwar–Uptakhali
NH 1 Baramula–Uri
NH 29 Daboka–Dimapur
NH 715 Jorhat–Jhanji
NH 2 Jhanji–Dibrughar
NH 15 Dibrughar–Makum–Wakro
NH 29 Dimapur–Kohima
NH 8 Passi Badarpur–Agartala–Sabroom
NH 13 Pasighat-Tezu-Sitapani Junction with old NH 37 near Saikhoaghat
NH 2 Kawanpuri–Aizawl–Tuipang
NH 503 Ranital, Dehra and terminating at Mubarikpur at the junction of NH 70
NH 146 Sagar-Bhopal
NH 134 Dharasu–Kuthnaur –Yamnotri
NH 2 Junction with old NH 306A Kanpui
NH 10 Junction with new NH 27 near Siliguri Junction with new NH 17 –Chalsa
NH 17 Chalsa–Nagarkata–Goyerkata–Dalgaon–Birpara
NH 317 Birpara–Hasimara–Salsabari junction with New NH 27
NH 13 Wakro–Roing
Plains
NH 44 Delhi–Ambala–Jalandhar
NH 44 Delhi–Mathura–Agra
NH 519 Sikandra–Bhognipur
NH 31 Bhaktiarpur–Mokameh–Kora
NH 27 The highway starting from old NH 31 near Siliguri and joining NH 31C near
Salsalabari via Fulbari, Mainaguri, Dhupguri, Falakata and Sonapur
NH 12 Junction with old NH 31 near Dalkola- Farakka and Kolkata–Chakdana

45
Applying the Proposed Methodology for Vulnerability Assessment of Highways
Table 11: Vulnerable National Highway stretches
Highway
region
New National
Highways
Stretch
NH 112 Barasat–Bangaon–Indo–Bangladesh Border
NH 27 Muzaffarpur–Darbhanga–Forbesganj–Purnia
NH 527 Junction of old NH 57 near Forbesganj and terminating at Jogbani
NH 9 Delhi–Ghaziabad
NH 34 Ghaziabad–Meerut
NH 14 Kharagpur–Bishnupur
NH 22 Hajipur–Sitamarhi–Sonbarsa
NH 33 Mokamah–Rajmahal–Farakka
NH 31 Kora–Katihar–Malda
NH 120 Gaya–Biharsharif
NH 22 Patna–Jehanabad
NH 531 Chhapra–Siwan–Gopalganj
NH 722 Chhapra–Rewaghat–Muzaffarpur
NH 322 Hajipur–Mushrigharari
NH 227 Chakia–Sitamarhi–Jaynagar–Narharia
NH 131 Birpur–Madhepura–Bihpur
NH 116B Nandakumar–Contai–Digha
NH 12 Junction with old NH 6 connecting Kona Expressway–Vidyasagar Setu–
Kolkata–Diamond Harbour–Kulpi–Namkhana and terminating at Bokkhali
NH 730 Pilibhit on old NH 74–Puranpur–Kutar–Gola Gokharnath–Lakhimpur–Isanagar
–Nanpara (on NH 28C) Bahraich on NH 28C Balrampur –Maharajgang–
Pandaruna on NH 28
NH 730A Puanpur–Pawayan–Maikalganj (NH 24)
NH 48 Delhi–Bawal
NH 10 Delhi–Bahadurgarh
NH 54 Pathankot–Amritsar– junction with SH 15
NH 31 Patna–Chappra
NH 152 Ambala–Panchkula
NH 9 Delhi–Rampur
NH 122 Junction with old NH 31 near Barauni Muzaffarpur
NH 527D Junction with old NH 28 near Pipra Kothi–SagauliRaxaul-Indo/Nepal Border
NH 727 Junction with old NH 28 A from Chhapwa connecting Bettiah,
Lauriya, Bagaha, Chhitauni Rail cum road bridge and terminating
at its junction with old NH 28 near Kushinagar
NH 24 Barhalganj–Gorakhpur–Pharenda and terminating at Sunali
NH 319 Junction with NH 2 near Mohania–Arrah
NH 431 Phatuha–Chandi–Harnaut–Barh
NH 7 Chandigarh–Rajpura–Patiala
NH 152 Ambala–Ismailabad
NH 3 Jalandar–Hoshiarpur–Hamirpur
NH 703 Jalandar–Moga

46
Reducing Carbon Footprint and Enhancing Climate Resilience of National Highways in India
Table 11: Vulnerable National Highway stretches
Highway
region
New National
Highways
Stretch
NH 919 The highway starting from the junction of old NH 71 near Rewari in
the state of Haryana and connecting Dharuhera and passing
through Rajasthan and connecting Taoru -Sohna and
terminating at its junction with old NH 2 near Palwa
NH 7 Ambala - Punjab border-Nahan-Paonta Sahib-Dehradun
NH 307 Chhutmalpur-Biharigarh-Dehradun
NH 344 Roorkee-Saharanpur-Yamuna Nagar-Saha-Dhanana
NH 907 The highway starting from the junction of old NH 73 near Yamuna Nagar in
the state of Haryana and connecting Jagadhri – Mustafabad – Ledi – Darpur
and terminating at its junction with old NH 72 near Paontasahib in the State of
Himachal Pradesh
NH 30 Bareilly–Pilibhit–Sitarganj
NH 9 Sitarganj–Kichcha–Rudrapur
NH 34 Ghaziabad–Aligarh–Eta
NH 509 Agra–Aligarh–Babrala–Chandausi–Moradabad
NH 5 Kharar (Chandigarh)–Ludhiana–Jagaron–Ferozepur
NH 331 Chhapra–Baniapur–Mohamadpur
NH 34 Junction with old NH 58 near Meerut and connecting Bijnor–Najibabad
NH 9 Junction with old NH 74 near Sitarganj and connecting Khatima–Tanakpur and
terminating at Pithoragarh
NH 28 The highway starting from India/Nepal border (connecting to Lumbani) via
Naugarh, Sidarthnagar, Bansi, Basti,
NH 334 The highway starting from Meerut connecting Hapur, Gulawthi and
terminating at Bulandshahr
NH 3 Jalandhar–Amritsar–Indo-Pak Border
NH 231 Kora–Purnia
NH 334 Meerut–Haridwar
NH 33 Biharsarif–Mokama
NH 5 Panchkula–Kalka
NH 530 Rampur–Bareilly–Lucknow
NH 27 Muzaffarpur–Pipra Kothi–Gorakhpur–Lucknow
NH 922 Arrah–Bihta–Patna
NH 7 Dhanana–Panchkula
NH 309 Rudrapur–Kashipur
NH 734 Kashipur–Najibabad
NH 34 Najibabad–Haridwar
NH 534 Najibabad–Kotdwara–Bubakhal
NH 309 Bubakhal–Pauri and terminating at its junction with old NH 58 near Srinagar
NH 231 Kora–Purnia
NH 27 Purnia–Dalkola–Siliguri–amingaon
NH 20 Nawada–Bhaktiarpur

47
Applying the Proposed Methodology for Vulnerability Assessment of Highways
Table 11: Vulnerable National Highway stretches
Highway
region
New National
Highways
Stretch
Plateau
NH 55 Angul Junction with old NH 5 near Cuttack
NH 83 Dindigul
NH 81 Karur–Coimbatore
NH 79 Salem–Vadachennaimalai
NH 149 Talcher–Pal Lahar
NH 83 Oddanchatram–Dindigul
NH 20 Panikoli–Keonjhar
NH 532 Cuddalore–Vridhachalam–Vadechennaimalai
NH 49 Pal Lahar–Chandikhol
that requires interventions and inter-departmental
coordination, both at national and sub-national levels
and during all the phases of a road project—planning,
construction, and operations. As stated in Chapter 2
‘Impact of Climate Change on Highways’, although
climate parameters, such as rainfall intensity, have been
acknowledged and addressed in specific IRC Codes,
they are out dated and do not include new state-of-
the-art technology options that are globally available.
Moreover, in the absence of a specific, comprehensive
policy on climate resilience of the roads and highways
sector, there are no mandates and implementation
mechanisms to ensure the integration of climate
resilience in the roads sector. Mainstreaming climate
resilience in the roads and highways sector will need
a multi-pronged approach through the following
measures.
P Mainstreaming in the planning and approval
processes.
P Formulation of construction and maintenance
guidelines for building climate resilience of
highways.
P Updating and enforcement of the existing IRC
Codes.
P Inter-departmental coordination at the national
and sub-national levels, including various
committees of IRC, for information sharing and
policy making.
P Data management—Collection and integration of
data for resilience building of the highways sector
was found to be a challenging process during the
course of this study. Therefore, it is recommended
that specific data for the purpose may be recorded
and updated regularly.
P Research and capacity development.
A detailed discussion on these non-engineering
measures is provided in Chapter 5 ‘Recommendations
for Building Resilience of the Highways Sector in
India’.
4.2 Vulnerability assessment for Shimla–Moorang stretch on NH 5
Step 1: Defining objectives
Based on the overall scope of the study, the objective
and outcomes of the VA include the following:
P Identifying sections or highway elements and
infrastructure at risk to climate change impacts on
the highway stretch
P Identifying effective engineering interventions for
adaptation to address the climate vulnerability of
the highway stretch
Step 2: Scoping
A scoping exercise has been conducted at this step to
define the geographical boundaries as well as the study
parameters, data sources, and tools and techniques of
assessment for the purpose of this study.
P Delineation of geographical limit—The
geographical delineation of the study stretch has
been conducted based on inputs from NHAI, HP
PWD, HP Disaster Management Department,

48
Reducing Carbon Footprint and Enhancing Climate Resilience of National Highways in India
Map 4: Earthquake hazard map of India
Source: (NDMA,GoI, 2016)

49
Applying the Proposed Methodology for Vulnerability Assessment of Highways
Map 5: Vulnerability mapping for National Highways
Source: TERI Analysis, 2016

50
Reducing Carbon Footprint and Enhancing Climate Resilience of National Highways in India
and sector experts and practitioners. Based on
interactions with relevant stakeholders, a stretch
of 253 km (from Shimla to Moorang in Kinnaur
district) has experienced maximum loss and
damage from extreme hydro-meteorological
events in the past and is, therefore, selected as the
case study stretch in light of its vulnerability (Map
6). An area, approximately within 2 km distance
on both sides of the highway ROW has been
delineated. A key consideration has been to include
the important social and physical infrastructure
(viz. large-scale industries, hydropower projects,
schools and health facilities) and settlements
abutting the highway for which it plays a critical
role in connectivity. These settlements include
Shimla, Theog, Rampur, Kumharsain in Shimla
district, and Nichar, Kalpa, Oling and Morag in
Kinnaur district. Moreover, from the point of
view of hazard risk, the mountain ridge and flood
plain of River Sutlej has also been included at the
points adjoining the study area boundary.
P Identification of key issues and parameters
(climate and non-climatic) to be considered—
During the stakeholder interactions (refer
Annexure 3) it was observed that, this hilly stretch,
located in the Himalayan belt, is prone to extreme
precipitation events, landslides, and avalanches.
The inherent unstable geology coupled with
extreme rainfall and snowfall makes it extremely
vulnerable to landslides. It would, therefore,
be relevant to study the past trend of rainfall
variability, incidences of extreme precipitation
events viz. rainfall and snowfall, occurrence
of thunderstorms, wind speeds, avalanches
and flooding events resulting in landslides. To
assess the future vulnerability of the highway
stretch, assessment of future climate information
would also be imperative. In terms of the non-
climatic parameters, the physiological and built
parameters including topography, settlements,
and infrastructure will play a key role in deciding
the vulnerability and extent of risk of the highway
stretch. A study of past incidents of climate-
related disaster events and their impacts would
also indicate towards understanding the highway’s
vulnerability to climate change impacts. At the
engineering level, highway characteristics such
as materials, nature and condition of highway
elements and infrastructure will also play a key
role in the level of vulnerability of the highway
stretch. Based on this preliminary understanding
of parameters to be considered for assessment,
data collection and analysis of the same has been
conducted in the subsequent steps.
P Identification of sources of data and local
knowledge—Identification of sources of secondary
data and expert stakeholder insights was done at
this stage. These include national and state line
departments, such as the Indian Meteorological
Department, HP state environment and climate
change department and disaster management
department, and HP PWD, among others. For
future climate information, data has been derived
from TERI’s earlier study on Climate Resilient
Green Growth Strategies for Himachal Pradesh
(TERI, 2015). Apart from this, certain open data
sources, such as Aster Global Digital Elevation
Model, freely available through UGCS12 have been
used for sourcing physiological information. A
detailed discussion on data collection and sources
is presented in Step 3.
P Identification of analytical tools and techniques
for vulnerability assessment—The overall spatial
vulnerability mapping exercise has been conducted
using an Arc GIS platform. The input layers to
the mapping exercise have been developed based
on secondary information received from various
government departments and agencies at the
national and state levels as mentioned above,
open data sources, such as Aster Global Digital
Elevation Model, and future climate information
derived from IPCC regional data sets referred
from TERI’s study (TERI, 2015). Detailed technical
methodology and considerations for each step
of mapping and assessments has been discussed
through Steps 4–6.
Step 3: Collection and Integration of Data
A key element of the study was to identify the data
required for conducting a typical vulnerability analysis.
The data collection was primarily aligned towards
developing an exposure profile of the highway to
12 United States Geological Survey

51
Applying the Proposed Methodology for Vulnerability Assessment of Highways
Ma
p 6
: Stu
dy
are
a: N
H 5
Sh
imla
-Kin
na
ur
(up
to
Mo
ora
ng
)
Sou
rce
: T
ER
I A
na
lysi
s, 2
01
6

52
Reducing Carbon Footprint and Enhancing Climate Resilience of National Highways in India
extreme events, understanding the impacts and extent
of damage of the past extreme events on highways,
and determining past and future climate profile over
the highway stretch.
Two weather stations—Shimla and Kalpa—and a rain
gauge station at Rampur were identified along the
selected stretch for the purpose of collecting climate
data. Table 12 enumerates the climate parameters that
were identified and the data that was received from the
Regional Meteorological Centre, Shimla, towards the
exercise of VA.
Table 12 : Meteorological Data for study stretch of
NH 5
Sl. No. Climate
Variables
Time
period
Stations
1 Daily rainfall 1986–2015 Shimla,
Rampur,
Kalpa
2 Maximum
daily
temperature
1986–2015 Shimla, Kalpa
3 Minimum daily
temperature
1986–2015 Shimla, Kalpa
4 Daily snowfall 2009–2015 Shimla, Kalpa
5 No. of days of
occurrence of
thunderstorms
1986–2010 Shimla, Kalpa
6 Monthly
average wind
speed
1986–2007 Shimla, Kalpa
Due to the time constraint in generating primary
modelling dataset for this study, the future climate
information for the demonstration stretch has been
drawn from TERI’s study on Climate Resilient Green
Growth Strategies for Himachal Pradesh,13 conducted
in collaboration with Global Green Growth Institute,
wherein IPCC regional data sets and models were
used. The future climate information for the relevant
stretch has been extracted from TERI’s block-level
future climate dataset and has been plotted on the
demonstration stretch for the time period 2020–50.
13 CRGGS (2015). Climate Resilient Green Growth Strategies for Himachal
Pradesh. Implemented by The Energy and Resources Institute in
collaboration with the Global Green Growth Institute and nodal support
from Department of Environment, Science & Technology, Government
of Himachal Pradesh.
Data related to past extreme events and disasters,
such as disruptions and damages on the highways due
to landslides, flash floods, and avalanches has been
collated along with highway locations experiencing
the impacts. This data was sourced from the Himachal
State Disaster Management Authority (HSDMA),
disaster management plans, and other similar
literature.
To understand the terrain of the selected stretch, an
Aster Global Digital Elevation Model of 30 metre
contour interval, freely available through UGCS,14
was used for generating the contours. Data received
from the revenue department15 of the State provided
information on physical features, such as road
network, amenities, government buildings, large-scale
industries, hydro power plants, forest cover, along
with major settlements.
The NH division of the Public Works Department of
the state was approached for collecting the data related
to traffic and operation, and material characteristics,
inventory of highway elements and infrastructure.
However, no data was received.
Step 4: Developing climate scenarios
Past climate profile
As discussed in Chapter 3 ‘Climate Vulnerability
Assessment of Highways’, to analyse climate variability
over a region, it is important to understand the
past and future climate profile of the region. The
past climate profile of the highway stretch has been
prepared, based on an analysis of the available past
climate data received from the three IMD stations on
the stretch—Shimla, Rampur, and Kalpa. A study of
the past extreme events and disasters indicates that the
region is prone to landslides and flash floods. It may be
noted here that although landslide events are a result
of multiple factors, extreme climate events have been
observed to aggravate their occurrence. Hence, past
data on rainfall parameters has been analysed in detail
in this study (refer to Annexure 2). Although snowfall
is also one of the significant precipitation parameters
that should be studied for hilly areas, a detailed analysis
on the same could not be conducted for the selected
stretch due to an insufficient record and maintenance
14 United States Geological Survey
15 Himachal Pradesh government website, URL: http://www.himachal.nic.
in/ accessed on August 26, 2016.

53
Applying the Proposed Methodology for Vulnerability Assessment of Highways
of data by RMC. Considering the relevance of
snowfall as a climate parameter for hilly regions,
it is recommended that the Indian Meteorological
Department or the Regional Meteorological Centres
regularly maintain this data for holistic understanding
of climate variability.
Seasonal rainfall trends—summer (March–May),
monsoon (June–September), and winter (December–
February) were analysed over the region. It is observed
that the annual mean of the total monthly rainfall for
the 29 year (1986–2015) period shows a slight increase
over the region which may not be significant. The
rainfall pattern is also observed to be highly variable
,especially during the recent past 10 years, with more
than 85% of the daily maximum rainfall events and
thunderstorm days occurring in the monsoon season.
It may be noted here that although Kalpa shows
a decreasing overall trend in maximum 24-hour
daily rainfall, the individual events occurring over
the station have a higher intensity than Shimla and
Rampur. For Kalpa, the data shows two Extremely
Heavy Rain (EHR) events. The EHR events are not
seen over Shimla and Rampur datasets. Also, the
summer season shows a relatively larger number of
maximum 24-hourly rain events and thunderstorm
days in case of Kalpa as compared to Rampur and
Shimla. A detailed analysis on the past climate trends
over the three stations may be found in Annexure 2. To
spatially plot the past climate profile over the highway
stretch, the maximum rainfall received in a day has
been mapped for the period 1986–2015 (Map 7).
Future climate profile
Once the past climate profiling over the region has
been understood well, it is imperative to understand
the future climate variability over the region as well.
The future climate information for the demonstration
stretch has been extracted from TERI’s study on Climate
Resilient Green Growth Strategies for Himachal
Pradesh (TERI, 2015), conducted in collaboration
with Global Green Growth Institute. The objective of
the cited study was to analyse the state’s future climate
using the regional model simulations at 25 km × 25
km resolution, for which Providing Regional Climates
for Impacts Studies (PRECIS) model, developed
at UK Met Office Hadley Centre, was used. It is an
atmospheric and land surface model of limited area
and high resolution and is applicable to a typical
horizontal grid size of 50 km, which can be lowered
as per the requirement of the study. It has been tuned
to simulate the baseline runs from 1970 to 2000 and
future runs of the 2030s (2020–2040) under the A1B
SRES4 scenario.16 This scenario assumed a business-
as-usual state in the near future and hence has been
taken as the optimum climate scenario for simulation.
PRECIS is highly relevant for scientists involved in
vulnerability and adaptation studies, particularly for
national communication documents and have been
extensively used throughout the world in numerous
regional modelling experiments.
The climate modelling exercise conducted for the state
as part of the cited study shows a large spatial variation
for future seasonal precipitation. The regional climate
model projects a precipitation change in the range
of -8% to 12% for the monsoon months, (<-10% to
over 30%) for winter months, <-15% to over 30%
during post monsoon months, and between 5% to
30% for summer months in the future time period
of 2020–2050. Also, the model projections show an
increase in the extreme rainfall in future over the state
(Figure 10).
16 A1B scenario assumed a balance emphasis on all energy sources under
the A1 emission scenario characterized by rapid economic growth
with quick spread of new and efficient technology. In other words, this
scenario assumed a business-as-usual state in the near future and hence
has been taken as the optimum climate scenario for simulation.
Figure 10: Extreme wet days contribution to the total rainfall in the near future (2020–2050)
Source: (TERI, 2015)

54
Reducing Carbon Footprint and Enhancing Climate Resilience of National Highways in India
Ma
p 7
: Ma
xim
um
ra
infa
ll re
ceiv
ed
in a
da
y d
uri
ng
19
86
–2
01
5
Sou
rce
: T
ER
I A
na
lysi
s 2
01
6 b
ase
d o
n I
MD
da
ta

55
Applying the Proposed Methodology for Vulnerability Assessment of Highways
To assess the future climate vulnerability of the
selected stretch for the purpose of this study, the future
extreme rainfall scenario in terms of the contribution
of extremely wet days to the total rainfall in the near
future time period 2020–50 has been plotted on the
selected stretch (Map 8). An increase of 15% to 30%
is observed in the extreme wet days contribution to
the total rainfall for the overall stretch. The stretch
between Rampur to Oling is likely to receive an even
higher increase of 25%–30% in the contribution of
extreme wet days in a year.
Based on the analysis of past climate trends and
future climate scenario, there is a high likelihood of
an increase in extreme rainfall events on the selected
stretch in the future, in particular, the Rampur to
Oling section. This information, along with other non-
climate parameters, will be utilized for identifying the
most vulnerable sections of the selected stretch in the
subsequent steps.
Step 5: Identification of Vulnerable Hotspots
To identify vulnerable hotspots, a VA mapping of the
study area has been conducted based on climatic and
non-climatic parameters discussed in Step 2. Table
13 gives an overview of the vulnerability criteria
considered for the parameters
To begin with, an exposure profile of the selected
stretch has been developed with respect to topography,
Table 13: Vulnerability parameters for study stretch of NH
Vulnerability Ranking
Sl.No. Parameters Criteria Low Score Moderate Score High Score
1 Slope Analysis Degree of slope 0°–30°
0
30°–45°
1
45° and
above
2
2 Past landslides Spatial location
of landslides
No
history
Outside the 1
km radius
A radius of
1 km from
the point
location
3 Past events-
Avalanches and
flash floods
Spatial location
events occurred
No
history
Outside the 1
km radius
A radius of
1 km from
the point
location
4 Extreme wet day
contribution to
the total rainfall
2020–2050
Percentage
increase of
extreme wet
days
15–20 20–25 25–30
past landslide events, and past extreme events, such
as avalanches and flash floods. A detailed discussion
on the outcomes of the exposure analysis based on
the these three parameters topography, past landslide
events, and past extreme events is given below:
P Topography—An analysis of the slope variation
has been considered for developing the exposure
profile with respect to topographical features.
The slope variation in the selected stretch has
been classified into four categories, viz., 0–15,
15–30, 30–45 (Map 9). A vulnerability ranking of
low, moderate, and high has been assigned to the
slope ranges 0°–30°, 30°–45°, and 45° and above,
respectively. Typically, construction on slopes
more than 30 degrees is risky. It is observed that a
major section of the stretch Rampur and Moorang
has a slope of more than 30 °. This undesirable
slope when combined with extreme rainfall events
and loose soil aggravates the risk of landslides, and
thereby the vulnerability of the road.
P Past landslide events—Highways in the
mountainous and hilly terrains are typically
vulnerable to landslides due to a combination
of factors, such as extreme rainfall events, non-
compliance of safety standards of road construction,
and geological characteristics. For developing
the exposure profile with respect to landslides,
locations of the past events have been plotted on

56
Reducing Carbon Footprint and Enhancing Climate Resilience of National Highways in India
Ma
p 8
: Ext
rem
e w
et
da
ys c
on
trib
uti
on
to
th
e t
ota
l ra
infa
ll in
th
e n
ea
r fu
ture
Sou
rce
: T
ER
I, 2
01
5

57
Applying the Proposed Methodology for Vulnerability Assessment of Highways
the selected stretch in Arc GIS platform (Map 10).
A vulnerability ranking of high, moderate, and low
has been assigned to the areas falling within 1 km
radius of past landslide locations, areas outside
the 1 km radius and if there has been no history
of landslides respectively. It is observed that the
section from Rampur to Nichar and Kalpa to
Moorang is most risk prone to landslides
P Past extreme events— Point locations of past
extreme events, such as avalanches and flash
floods which have caused major damage have been
plotted to understand the exposure of the selected
stretch to these extreme events based on their
Table 14: Loss and damage of past events for study stretch of NH 5
Past event Year Location Remarks/ loss and damage
Landslide 1993 Jhakari NH 22 was washed away due to flash floods and could be
restored only after two months
Landslide 1995 Chirgaon Road Rohroo to Chirgaon was washed away due to flash
floods and could be temporarily restored only after 15 days
Flash floods 1973 Nathapa rock fall Data not available
Flash floods 1993 Jhakari 1 km of NH 5 and forest land public property destroyed.
Flash floods 2000 Rampur 140 human deaths, 1673 cattle death (60 feet above normal level)
Flash floods 1973 Sanjay power
house`45 million estimated loss due to Nahpa rock fall on Sanjay Power
House
Flash floods 1975 Sumdo and
Kaurik fault line.
60 m height and 150 m length blockage due to landslide after
earthquake
Flash floods 1988 Soldan Village 2 km of NH 22 damaged
Flash floods 1991 Soldan Khad 32 killed, 15 houses and 35 bigha agricultural area destroyed,
20 m bridge collapsed
Flash floods 2005 Pareechhu Lake
outburst
10 bridges and several section of NH 22 destroyed incurring a
loss of `610 crores
Flash floods 1995,1991 Tapri Damaging NH 22. Tow erosion to NH 22
Flash floods 1995 Baspa river NHs damaged at numerous places, loss to government and
private property, roads, and bridges estimated US$ 182 million
Flash floods 2000 Panwi Khad 19 houses, 3 buses, HRTC workshop and damaged HP PWD rest
house
Flash floods 2000 Khab Extensive damage to 200 km of NH 22, washed away 20 bridges,
22 Jhulas and badly damaged 12 bridges. 135 people and 1,673
cattle lost their lives. The total estimated loss was to the tune of
`1,466.26 crore
Avalanches Different
years
Pyala Nalla
(Jangi) and Ralli
Accidents and human deaths
Source: (District Disaster Management Authority, Kinnaur, 2012)
occurrences during 1973-2016 (Map 11). Table 14
gives an overview of the losses and damages caused
on the roads due to these past extreme events.
A vulnerability ranking of high, moderate, and
low has been assigned to the areas falling within
1 km radius of past extreme event’s point locations,
areas outside the 1 km radius and if there has been
no history of extreme events respectively.
In order to assess the future climate vulnerability of the
selected stretch, the future extreme rainfall scenario in
terms of extreme wet days’ contribution to the total
rainfall in near future has been plotted on the stretch

58
Reducing Carbon Footprint and Enhancing Climate Resilience of National Highways in India
(Map 8). It is observed that an increase of 15% to 30%
is observed in the extreme wet days’ contribution to
the total rainfall for the overall stretch. The stretch
between Rampur to Oling is likely to receive an even
higher increase of 25%–30% in the contribution of
extreme wet days in a year. For extreme wet days’
contribution, a vulnerability ranking of low, moderate,
and high has been assigned to the ranges 15%–20%,
20%–25%, and 25%–30%, respectively.
As an outcome of this step, three exposure maps with
respect to topography, past landslide events, and past
extreme events were overlaid with the future climate
information (Map 12). The final vulnerability map
depicts the most vulnerable sections of the selected
stretch, based on a total vulnerability scoring. The
vulnerability scoring has been derived based on
the following:
P Equal weightage has been accorded to all the
vulnerability parameters
P A score of 0, 1, and 2 has been assigned to the
vulnerability rankings of low, moderate, and high,
respectively, for each parameter (refer the Table 13
vulnerability parameters).
P The total scores have been classified in the range of
0–4, 4–7, and 7–11 and assigned a ranking of low,
moderate, and high vulnerability, respectively.
Based on the score, it may be observed that,
although the overall stretch is vulnerable to climate
change, the section from Rampur (31°23’20.66”N
77°36’53.37” E) Oling (31°29’49.36”N 78°12’41.53E)
is found to be the most vulnerable.
Step 6: Prioritizing areas for investment and
interventions—Risk assessment
Based on the vulnerability mapping conducted in Step
5, the most vulnerable section of the selected stretch
has been identified (Map 13). This step provides a
discussion on the outcomes of the risk assessment
of the most vulnerable section for prioritizing areas/
highway elements for investment and interventions. As
stated in Chapter 3, ‘Climate Vulnerability Assessment
of the Highways’ the objective of this risk assessment
is to identify highway elements and infrastructure that
are most risk prone and this step is recommended
when detailed retrofit measures are needed for an
existing stretch with high climate vulnerability. To
this end, in line with the proposed methodology, the
recommended approach would be to collect detailed
data of the highway elements and infrastructure along
the vulnerable section. Data should also be collected
on the extent of loss and damage borne by the highway
elements and infrastructure during past extreme
events. This will provide an understanding of the
extent of climate impacts the highway elements and
infrastructure are sensitive to and assist in developing
the risk assessment matrix as an outcome of this
step. The highway elements and infrastructure to be
considered for risk assessment may include, but not
limited to, are:
P Pavements
P Shoulder
P Embankments
P Protection works
P Retaining walls/engineering stabilization works
P Drainage
P Lighting
P Crash barriers
P Road Signs
P Kerbs
P Kilometre stones
The data received for the risk assessment exercise for
this stretch was inadequate and could not be utilized.
Hence, only a broad risk assessment of highway
elements and infrastructure could be conducted for
the most vulnerable section. To this end, national level
stakeholders and sector experts have been consulted,
based on the assumptions presented in Table 9, to
broadly identify the risks of the highway elements
and infrastructure. Table 15 presents a broad risk
assessment which is based on the consultations.
Extreme rainfall and landslides triggered by rainfall
are the most prominent risks to which this stretch
is prone. Therefore, the highway elements and
infrastructure, such as drainage, protection works,
retaining walls, pavements, and shoulders, which have
high probability of impact and are directly affected
by extreme rainfall due to inundation and damages
caused by landslides fall under high risk. The assets,

59
Applying the Proposed Methodology for Vulnerability Assessment of Highways
Ma
p 9
: Slo
pe
An
aly
sis
Sou
rce
: T
ER
I A
na
lysi
s, 2
01
6

60
Reducing Carbon Footprint and Enhancing Climate Resilience of National Highways in India
Ma
p 1
0: P
ast
eve
nts
— la
nd
slid
es
Sou
rce
: (
Dis
tric
t D
isa
ste
r M
an
ag
em
en
t A
uth
ori
ty,
Kin
na
ur,
20
12
)

61
Applying the Proposed Methodology for Vulnerability Assessment of Highways
Ma
p 1
1: P
ast
eve
nts
—A
vala
nch
es,
Fla
sh f
loo
ds
19
73
–2
01
6
Sou
rce
: K
inn
au
r, 2
01
2;
Re
ven
ue
& D
isa
ste
r M
an
ag
em
en
t D
ep
art
me
nt,
Go
vern
me
nt
of
Him
ach
al
Pra
de
sh,
20
16

62
Reducing Carbon Footprint and Enhancing Climate Resilience of National Highways in India
Ma
p 1
2: V
uln
era
bili
ty M
ap
Sou
rce
: T
ER
I A
na
lysi
s, 2
01
6

63
Applying the Proposed Methodology for Vulnerability Assessment of Highways
Ma
p 1
3: M
ost
vu
lne
rab
le s
ect
ion
of
the
stu
dy
stre
tch
Sou
rce
: T
ER
I A
na
lysi
s 2
01
6

64
Reducing Carbon Footprint and Enhancing Climate Resilience of National Highways in India
such as lighting and road signs which have less
probability of being impacted and are not directly
affected, fall under low risk.
Step 7: Identifying interventions for resilience
building
This last step identifies interventions for enhancing
climate resilience of the selected highway stretch. From
Step 5, the most vulnerable section within the selected
highway stretch is identified. Accordingly, this highway
section is accorded top priority for implementing
the recommended engineering interventions during
construction, upgradation, and maintenance stages.
Similarly, implementation of interventions may be
time-phased over the highway stretch, based on the
vulnerability ranking.
The risk assessment (Step 6) conducted for the most
vulnerable section shows drainage, protection works,
retaining walls, pavements, and shoulders as high-risk
elements; the recommended engineering interventions
can focus on these elements. The engineering
interventions primarily include structural measures
that focus on increasing the slope stability to address
landslides. The slope stability can be increased by
reducing or eliminating the effects of any contributing
factor causing sliding and reducing the contact of
rainfall with soil. There are several engineering
interventions that can be implemented in landslide-
prone areas. However, whether specific interventions
are optimal and feasible for this stretch/section can be
determined only through a further detailed analysis
which could not be conducted in the available time
for this study. However, considering the drainage,
protection works, pavements, and shoulders of this
stretch are at a high risk, the engineering interventions
that are recommended to be adopted are:
P Treatment for slope stabilization and erosion
control by:
• Construction of restraining structures, such
as retaining walls of concrete and masonry,
gabion walls, and piling to prevent landslides.
For instance, retaining walls, when erected,
ensure greater stability to dangerous slopes
or also support existing landslides (Bureau of
Indian Standards, 1999).
• Interval slope reinforcement with rock bolts,
soil nailing, anchors, and grouting
• Modification of slope geometry by removal
of material from the upper areas, reduction
of slope angle, and trimming of loose surface
material
• Use of erosion control mats/blankets and
other bio-engineering measures, such as hydro
seeding methods, mulching, etc.
P Control of water percolation by providing
appropriate surface and subsurface drainage. The
drainage capacity can be improved through the
following (Roychowdhury, 2015):
• Geo-composite drainage systems for both
drainage under pavements and drainage
behind retaining walls
• Improve slope stability through installation of
drainage systems, mostly horizontal weep
• Annual and periodic maintenance of drainage,
particularly in pre-monsoon and monsoon
period
P Rock fall mitigation measures which prevent the
rocks from falling directly onto the road, either by
containing them or directing the rocks to a ditch
or other catching structures (Bobrowsky, 2008),
such as:
Table 15: Risk assessment matrix for study stretch
of NH 5
Highways assets and
components
Low Moderate High
Pavements
Shoulder
Embankments
Protection works
Retaining wall/engineer-
ing stabilization works
Drainage
Lighting
Crash barriers
Road signs
Kerbs
Kilometre stones

65
Applying the Proposed Methodology for Vulnerability Assessment of Highways
• Geo-nets /drapery systems
• Falling rock protection barriers including
catchment shoulder
• Rock bolts
• Rock sheds, barriers, and tunnels
• Wire mesh
• Use of erosion control mats/blankets and
other bio engineering measures, such as hydro
seeding methods, mulching, etc.
4.3 Vulnerability assessment for Kathipudi to Ongole stretch on NH 216
Step 1: Defining objectives
Considering the overall scope of the Study, the objectives
of conducting VA on the highway stretch are:
P To identify sections or highway elements and
infrastructures on these highway stretches that is
at risk to the impacts of climate change.
P To identify and recommend effective engineering
interventions for climate change adaptation, and
thereby address the climate vulnerability of the
highway stretch.
Step 2: Scoping
A scoping exercise has been conducted at this step to
define the geographical boundaries as well as the study
parameters, data sources, and tools and techniques of
assessment for the purpose of this study.
P Delineation of geographical limit—The
geographical delineation of the study stretch has
been conducted based on inputs from NHAI, AP
PWD, AP Disaster Management Department,
National Remote Sensing Centre, Hyderabad, and
other sector experts and practitioners. Based on
interactions with relevant stakeholders, a stretch of
397 km (Kathipudi to Ongole in Andhra Pradesh)
has experienced maximum loss and damage from
extreme hydro-meteorological events in the past
and is, therefore, selected as the case study stretch
in light of its vulnerability (Map 14). For delineating
the study area on both sides of the highway
ROW, locations of important social and physical
infrastructure (viz. large-scale industries, power
projects, schools and health facilities, etc.) and
settlements abutting the highway for which it plays
a critical role in connectivity have been taken into
consideration. These settlements include Kakinada,
Amalapuram, Kalipatnam, Machilipatnam, and
Bapatla. Moreover, locations of inundation-
prone areas17 based on the past trend of hydro-
meteorological extreme events (2012–2016) have
also been one of the key criteria. On the seaward
side, all the areas up to the coastline have been
included in the geographical scope of the study.
P Identification of key issues and parameters
(climate and non-climatic) to be considered—
During the stakeholder interactions (refer to
Annexure 3) it was observed that, located in the
coastal areas, this stretch is prone to coastal flooding
as a result of multiple hydro-meteorological
events, including extreme precipitation events and
cyclones and storm surges. It would, therefore,
be relevant to study the past trends of rainfall
variability, incidences of extreme precipitation
events, and occurrence of cyclones and storm
surges. To assess the future vulnerability of the
highway stretch, assessment of future climate
information would also be imperative. In terms
of the non-climatic parameters, locations of
settlements and infrastructure will play a key role
in deciding the vulnerability and extent of risk of
the highway stretch. A study of past incidents of
climate-related disaster events and their impacts
would also indicate towards understanding the
highway’s vulnerability to climate change impacts.
At the engineering level, highway characteristics,
such as materials, nature and condition of highway
elements, and infrastructure, will also play a key
role in the level of vulnerability of the highway
stretch. Based on this preliminary understanding
of parameters to be considered for assessment,
data collection, and analysis of the same has been
conducted in the subsequent steps.
P Identification of analytical tools and
techniques for vulnerability assessment —The
overall spatial vulnerability mapping exercise
has been conducted using an Arc GIS platform.
The input layers to the mapping exercise have
17 Source: NRSC, Hyderabad

66
Reducing Carbon Footprint and Enhancing Climate Resilience of National Highways in India
Ma
p 1
4: S
tud
y a
rea
ma
p
Sou
rce
s: T
ER
I A
na
lysi
s, 2
01
6

67
Applying the Proposed Methodology for Vulnerability Assessment of Highways
been developed based on secondary information
received from various government departments
and agencies at the national and state levels as
mentioned above, open data sources, such as
Aster Global Digital Elevation Model/ BHUVAN,
and future climate information referred from 4X4
Assessment Report of the Indian Network for
Climate Change Assessment (MoEF, 2010) and
TERI’s study (TERI, 2014). A detailed technical
methodology and considerations for each step of
mapping and assessments have been discussed
through Steps 4–6.
Step 3: Collection and Integration of Data
Data collection was conducted in line with the
requirements towards developing an exposure profile
of highways to extreme climate events, the impacts of
these events on the highway, extent of damage, and
loss caused due to these extreme events, and past and
future climate profile over the highway stretch.
Six weather stations—Bapatla, Kakinada,
Machilipatanam, Narsapur, Ongole, and Tuni were
identified along the selected stretch for collecting past
climate data. Table 16 lists the climate parameters that
were collected from IMD, Pune, for the purpose of
conducting VA.
Data related to past extreme events, such as high-
intensity cyclonic events and the areas affected by them,
Table 16: Meteorological Data for study stretch of NH 216
Sl. No Climate Variables Tuni Machilipatnam
and Kakinada
Narsapur, Bapatla, Ongole
1 Daily rainfall
1996–2009
1980–20092 Maximum daily temperature
3 Minimum daily temperature
4 Daily average wind speed
5 Monthly mean/highest maximum
temperature
1901–2009 1988–2009 1980–2009
6 Monthly mean/lowest minimum
temperature
7 Total monthly rainfall ( month
wise)
8 Monthly heaviest rainfall in 24
hours
has been collected for the time period, 1980–2015.
This data was sourced from the Regional Specialized
Meteorological Centre for tropical cyclones in the
northern part of the Indian Ocean, IMD.
Spatial location of areas inundated in the delineated
study area due to past events (2012–2016) was
obtained from the National Database for Emergency
Management under ‘Bhuvan’, the Indian Geo-Platform
of ISRO.
The future climate information for this stretch has
been drawn from the existing studies and literature.
Future rainfall variability has been referred from the
study titled ‘Projected Changes in Mean and Extreme
Precipitation Indices over India using PRECIS’ (Rao
et al., 2013). The information extracted from the
above-mentioned study has been plotted on the
demonstration stretch for the time period 2070–2100.
TERI’s study titled ‘Climate Resilient Infrastructure
Services’ (TERI, 2014) has been referred to for building
future storm surge and consequent inundation
scenarios for the time period 2070–2100.
To understand the terrain of the selected highway
stretch, an Aster Global Digital Elevation Model of a
30 metre contour interval was used for generating the
contours, which is freely available through USGS.18
Data drawn from Google Earth was utilized for
identifying administrative boundaries, physical
features, such as road network, amenities, government
buildings, large-scale industries, hydropower plants,
18 United States Geological Survey

68
Reducing Carbon Footprint and Enhancing Climate Resilience of National Highways in India
forest cover along with major settlements in the
delineated study area.
Also, data related to the highway stretches, such
as traffic, operations, highway materials and
characteristics, inventory of highway elements, etc.,
was collected. Project Implementation Units of NHAI
for NH 216 in the state of Andhra Pradesh were
approached for collecting these data.
Step 4: Developing climate scenarios
Past climate profile
This step presents the climate variability profile of the
highway stretch in terms of past and future climate
profiles. The past climate profile of the highway
stretch has been prepared based on an analysis of
the available past climate data (1980–2009) received
from the six IMD stations on the stretch—Kakinada,
Machilipatanam, Narsapur, Bapatla, Tuni, and
Ongole. A study of the past extreme events and
disasters indicates that the region is prone to coastal
flooding as a result of multiple hydro-meteorological
events including extreme precipitation events and
cyclones and storm surges. Hence past data on rainfall
parameters, cyclones, and wind speeds has been
analysed in detail in this study (refer to Annexure 2).
Rainfall and wind speed pattern
The analysis of the past climate data on rainfall and
wind speeds indicates a slight decreasing trend of the
total annual rainfall for the 29-year rainfall dataset
analysed (1980–2009) during the monsoon and post-
monsoon seasons showing a larger contribution
towards the total rainfall over the stations. Despite the
decreasing rainfall trend over the region, the maximum
rainfall is seen to increase in the time period with
most of the events seen under very heavy and heavy
rainfall event category of IMD.19 Also, most of the high
rainfall events in a day are seen in monsoon and post
monsoon seasons. Relatively high wind speeds are
found to occur in the monsoon months of June, July,
and August and also in the months of November and
December. Average seasonal wind speeds have slightly
decreased over the region in the observed time period
although the variability is quite high. The monsoon
months show relatively higher wind speeds than other
months over the six stations. A detailed analysis on
19 http://www.imdpune.gov.in/weather_forecasting/glossary.pdf
the past climate trends over the six stations may be
found in Annexure 2. To spatially plot the past climate
profile over the highway stretch, the maximum rainfall
received in a day has been mapped for the time period
1980–2009 in Arc GIS platform (Map 15).
Cyclones and storm surges
Data related to past cyclonic events and the areas affected
by them was collected for the time period (1980–
2015) from the Regional Specialized Meteorological
Centre for tropical cyclones in northern part of the
Indian Ocean, IMD. As per IMD and NDMA, the
eastern coast of India is relatively more risk prone to
cyclones and storm surges as compared to the western
coast. To map high intensity cyclonic events, the areas
affected by severe cyclones, extremely severe cyclones
and super cyclones during 1980–2015, were plotted
over the study area in Arc GIS platform. The affected
areas were identified based on the path and land fall
points of the cyclones (Map 16). A detailed list of all
cyclonic events may be found in Annexure 2. Existing
literature20 suggests average storm surge heights, as
a result of high intensity cyclonic events and high
wind speeds, in the range on 2.5 m–6 m over Andhra
Pradesh stretch of the eastern coast of India.
Future climate profile
Once the past climate profiling over the region has
been well understood, it is imperative to understand
the future climate variability over the region as
well. To this end, a spatial assessment of changes in
future rainfall (Map 17) and hydro-meteorological
extreme events, that is, storm surges resulting from
high intensity cyclones (Maps 18 and Map 19) has
been conducted. The future climate information for
building these scenarios has been drawn from existing
studies and literature.
Rainfall variability
Information on future rainfall variability has been
referred from the study titled ‘Projected changes
in mean and extreme precipitation indices over
India using PRECIS’ (Rao et al. 2013). It depicts
the ensemble mean of percentage change in rainfall
over very wet days of monsoon season for the
future scenario (2070–2100) with respect to baseline
simulations for 1960–1990. The information extracted
20 Andhra Pradesh State Action Plan on Climate Change; Revenue
(Disaster Management) Department, GoAP

69
Applying the Proposed Methodology for Vulnerability Assessment of Highways
Ma
p 1
5: M
axi
mu
m r
ain
fall
rece
ive
d in
a d
ay
for
the
tim
e p
eri
od
19
80
–2
00
9
Sou
rce
: T
ER
I A
na
lysi
s 2
01
6 b
ase
d o
n I
MD
da
ta

70
Reducing Carbon Footprint and Enhancing Climate Resilience of National Highways in India
Ma
p 1
6: A
rea
s e
ffe
cte
d b
y h
igh
cyc
lon
ic e
ven
t in
th
e p
ast
(1
98
0–
20
09
)
Sou
rce
: T
ER
I A
na
lysi
s 2
01
6 b
ase
d o
n I
MD
da
ta

71
Applying the Proposed Methodology for Vulnerability Assessment of Highways
Ma
p 1
7: C
ha
ng
e in
ra
infa
ll o
ver
very
we
t d
ays
in f
utu
re (
20
70
–2
10
0)
Sou
rce
: T
ER
I A
na
lysi
s 2
01
6 b
ase
d o
n (
Ra
o e
t a
l.,
20
13
)

72
Reducing Carbon Footprint and Enhancing Climate Resilience of National Highways in India
Ma
p 1
8: F
utu
re C
lima
te S
cen
ari
o w
ith
4 m
sto
rm s
urg
e
Sou
rce
: T
ER
I A
na
lysi
s (2
01
7)
20
16

73
Applying the Proposed Methodology for Vulnerability Assessment of Highways
Ma
p 1
9: F
utu
re C
lima
te S
cen
ari
o w
ith
6 m
sto
rm s
urg
e
Sou
rce
: T
ER
I A
na
lysi
s (2
01
7)
20
16

74
Reducing Carbon Footprint and Enhancing Climate Resilience of National Highways in India
from the above mentioned study has been plotted on
the demonstration stretch for the time period 2070-
2100 (Map 17). It is observed that an increase of upto
50% is observed in the extreme wet day’s contribution
to the total rainfall for the overall stretch in the future,
especially the stretch between Kakinada to Bapatla.
Thus towards the end of the century, the rainfall on
very wet days may increase substantially over the
study stretch. This result is consistent with the findings
of Krishna Kumar et al. (2011) that the intensity of
rainfall on a rainy day may increase in the future over
most of the Indian sub-continent.
Cyclones and storm surges
TERI’s study titled ‘Climate Resilient Infrastructure
Services’ (TERI, 2014) has been referred for building
future storm surge and consequent inundation
scenarios for the time period 2070–2100 (Maps 18 and
Map 19). Vulnerability of roads and highways in the
study area is likely to aggravate in the future in light of
the findings of IPCC, 2013 and MoEF (2010) which
indicate an increase in the frequency and intensity of
cyclonic events on the eastern coast of India. It is also
understood that a Category 5 cyclone can cause a surge
height of 4 m and above, depending on the wind speed
(MoEF, 2010). Based on these considerations, two
storm surge scenarios of 4 m and 6 m were taken into
account for mapping the future exposure profile of the
study stretch to cyclones and resulting storm surges.
The storm surge scenarios were plotted on the USGS
DEM dataset in Arc GIS 10 platform. Maps 18 and 19
depict the areas that are likely to be inundated in the
storm surge scenarios for 4 m and 6 m surge above
mean sea level over the study stretch as demarcated
through this mapping exercise.
Step 5: Identification of vulnerable hotspots
A VA mapping of the study area has been conducted
based on climatic and non-climatic parameters
discussed in Step 2 to identify vulnerable hotspots.
Table 17 gives an overview of the vulnerability criteria
considered for the parameters
To begin with, an exposure profile of the selected
stretch has been developed with respect to inundation
and past hydro-meteorological extreme events
(cyclones). A detailed discussion on the outcomes
exposure analysis based on these two parameters is
detailed as follows:
P Inundation-prone areas—Highways in the coastal
areas are typically vulnerable to inundation/
flooding due to a combination of factors, such
as topography (low-lying areas), extreme rainfall
events, and storm surges as a result of cyclones
and high wind speeds. In order to develop the
exposure profile with respect to inundation/
flooding, the locations have been plotted based on
historical data (2012–2016) sourced from NRSC,
Table 17 Vulnerability Parameters for study stretch of NH 216
Sl.No Parameters Criteria
Vulnerability Scoring
Low Score Moderate Score High Score
1 Inundation prone
area based on past
events (2012–
2016)
Inundated
areas in the
past
Other areas
(non-affect-
ed areas)
0 - 1 Affected
areas
2
2 Areas effected
by high cyclonic
event in the past
(1980–2015)
Frequency and
intensity of
the cyclones
Low risk Moderate
risk
High risk
3 Future Climate
Scenario with a
6 m storm surge,
(2070–2100)
Elevation from
Mean Sea
Level
Above 6 m - Below 6 m
4 Change in
rainfall over very
wet days in the
future (2070–2100)
Percentage
change
Up to 0 % 0–20% 20%–50%

75
Applying the Proposed Methodology for Vulnerability Assessment of Highways
Hyderabad, over the selected stretch in Arc GIS
platform (Map 20). A vulnerability ranking of high
and low has been assigned to the affected and non-
affected areas, respectively, based on past data. It is
observed that the section from Machilipatnam to
Ongole is most risk prone to inundation.
P Past extreme events (cyclones)—To map the
areas at risk to high intensity cyclonic events,
the areas affected by severe cyclones, extremely
severe cyclones, and super cyclones during 1980–
2015 were plotted over the study area in Arc GIS
platform. The affected areas were identified based
on the path and land fall points of the cyclones
(Map 16). It is understood from the discussion
in Chapter 2, ‘Impact of Climate Change on
Highways’, that such high-intensity cyclones have
caused major damage to roads and highways in the
past. A vulnerability ranking of high, moderate,
and low has been assigned to the areas effected by
high cyclonic events in the past (1980–2015) based
on the frequency and intensity of cyclonic events.
In order to assess the overall climate vulnerability of
the selected stretch, the two exposure profiles were
overlaid with the future extreme rainfall scenario in
terms of the contribution of extreme wet days to the
total rainfall in the near future (Map 17) and the future
storm surge scenario with 6 m surge height (Map 19)
have been plotted on the stretch. For Map 17, change
in rainfall over wet days a vulnerability ranking of low,
moderate, and high has been assigned to the ranges of
up to 0%, 0%–20%, 20%–50%, respectively. For Map
19, a vulnerability ranking of high and low has been
assigned to the areas above 6 m elevation and below
6 m elevation from mean sea level, respectively based
on past data.
As an outcome of this step, the overall vulnerability of
the highway stretch has been plotted in Map 21. This
final vulnerability map depicts the most vulnerable
sections of the selected stretch based on a total
vulnerability scoring. The vulnerability scoring has
been derived based on the following:
P Equal weightage has been given to all the
vulnerability parameters
P A score of 0, 1, and 2 has been assigned to the
vulnerability rankings of low, moderate, and high,
respectively for each parameter (refer to Table 17).
P The total scores have been classified in the
ranges—0–3, 3–5, and 5–7 and have been assigned
a ranking of low, moderate, and high vulnerability,
respectively.
Based on the score, it may be observed that although
the overall stretch is vulnerable to climate change, the
sections from Narsapur (15°49’33.92”N 80°22’48.93”E)
to Bapatla (16°27’45.29”N 81°49’39.19”E) and
Kakinada (16°36’7.72”N 82°2’55.00”E) to Amalapuram
(16°55’17.19”N 82°14’15.04”E) are found to be the
most vulnerable.
Step 6: Prioritizing areas for investment and
interventions: Risk assessment
Based on the vulnerability mapping conducted in Step
5, the most vulnerable sections of the selected stretch
have been identified (Maps 22 and 23). As stated in
Chapter 3, ‘Climate Vulnerability Assessment of
Highways’, the objective of this risk assessment is to
identify highway elements and infrastructure that are
most risk prone.
As the data that was received for the risk assessment
exercise for this stretch was not adequate and could not
be utilized, only a broad risk assessment of highway
elements and infrastructure could be conducted for
the most vulnerable sections. To this end, national level
stakeholders and sector experts have been consulted
based on the assumptions presented in Table 9, to
broadly identify the level of risk the highway elements
and infrastructure are prone to. Table 18 presents a broad
risk assessment which is based on the consultations.
Table 18: Risk Assessment Matrix for study stretch
of NH 216
Highways assets and
components
Low Moderate High
Pavements
Shoulder
Embankments
Drainage
Lighting
Road signs
Kilometre stones
Flooding due to extreme rainfall and storm surges
due to cyclones are the most prominent risks to which
this stretch is prone. Therefore, the highway elements
and infrastructure, such as drainage, pavements, and

76
Reducing Carbon Footprint and Enhancing Climate Resilience of National Highways in India
Ma
p 2
0: I
nu
nd
ati
on
pro
ne
are
a b
ase
d o
n p
ast
eve
nts
Sou
rce
: T
ER
I A
na
lysi
s 2
01
6 b
ase
d o
n B
hu
van
Na
tio
na
l R
em
ote
Se
nsi
ng
Ce
ntr
e (
20
16
)

77
Applying the Proposed Methodology for Vulnerability Assessment of Highways
Ma
p 2
1: O
vera
ll vu
lne
rab
ility
ma
pp
ing
fo
r N
H 2
16
Sou
rce
: T
ER
I A
na
lysi
s 2
01
6

78
Reducing Carbon Footprint and Enhancing Climate Resilience of National Highways in India
Ma
p 2
2: H
igh
ly v
uln
era
ble
se
ctio
n A
fo
r N
H 2
16
- N
ars
ap
ur
to B
ap
atl
a
Sou
rce
: T
ER
I A
na
lysi
s 2
01
6

79
Applying the Proposed Methodology for Vulnerability Assessment of Highways
Ma
p 2
3: H
igh
ly v
uln
era
ble
se
ctio
n B
fo
r N
H 2
16
- K
aki
na
da
to
Am
ala
pu
ram
Sou
rce
: T
ER
I A
na
lysi
s 2
01
6

80
Reducing Carbon Footprint and Enhancing Climate Resilience of National Highways in India
shoulders, which have a high probability of being
directly affected by flooding, fall under high risk.
Assets, such as lighting and road signs which have
less probability of being impacted and are not directly
affected, fall under low risk.
Step 7: Identifying interventions for resilience
building
Based on the outcomes of VA (Step 5), the most
vulnerable section within this demonstration stretch
has been identified. This particular section, which
qualifies as the most vulnerable stretch must be
prioritized when implementing the recommended
engineering adaptation solutions during upgradation
and maintenance stages. Similarly, based on the
vulnerability ranking, implementation of interventions
on the remaining sections may be time-phased over
the highway stretch.
The outcomes of the risk assessment conducted (Step
6) for the most vulnerable section indicates drainage,
pavements, and shoulders as high-risk elements. Hence,
the recommended engineering interventions can focus
on these elements. The engineering interventions
primarily include structural measures that focus on
reducing impacts of climate hazards or protecting the
highway from flooding/inundation and erosion as a
consequence of extreme rainfall, storm surges, and sea
level rise. There are several engineering interventions
that can be recommended to address coastal hazards
affecting roads. However, it is important to note that
even though coastal adaptation measures can reduce
vulnerability to coastal hazards, total protection from
coastal flooding and erosion is not achievable.
In this study, however, specific interventions that are
optimal and feasible for this stretch/ section have not
been recommended. This is possible only through a
further detailed analysis which could not be conducted
in the time available for this study. The interventions
that can be adopted in this stretch should focus on
drainage, pavements, and shoulders, considering
they are at high risk. Therefore, the recommended
engineering interventions for the coastal stretch to
prevent coastal road base erosion, and coastal road
flooding are:
P Embankment slope vegetation to protect and
minimize damages on highways due to coastal
flooding and erosion.
P Greening of coastal belt which acts as a buffer
and provides protection/ reduces damages due to
cyclone related flooding and winds.
P Use of spun concrete electric poles instead of the
normal electric poles in order to better withstand
extreme winds
P Improve redundancy of the highway by the
construction of a by-pass route—On field, highway
experts recommended that retrofitting to enhance
the resilience of the existing roads is generally not
a financially viable option; hence, the construction
of an alternative route taking into consideration
appropriate height and alignment in the context of
flooding is recommended.
Apart from the above, there are other interventions
which serve the purpose of minimizing climate
risks and also have added social, environmental and
economic benefits. However they are generally very
costly to implement and may require a cost benefit
analysis. A few have been listed below:
P Coastal armouring, such as building sea walls,
breakwater, storm surge barriers, etc.
• Seawalls are structures which function as
coastal defences. Besides, they also prevent
erosion of the shoreline and are built parallel
to the shore and aim to hold or prevent sliding
of the soil while providing protection from
wave action.
• Sea dykes are hard-engineering structures
built to protect low-lying, coastal areas
from inundation by the sea under extreme
conditions.
• Breakwaters—Artificial offshore structure
protecting infrastructure from the action of
waves.
• Surge barriers are movable or fixed barriers or
gates which are closed when an extreme water
level is forecast in order to prevent flooding.
P Use of geo tubes and geo containers for storm
surge protection, also for breakwaters
P Underground cabling of electricity and other
communication lines.

Recommendations for Building
Resilience of Highways Sector in India5

82
Reducing Carbon Footprint and Enhancing Climate Resilience of National Highways in India

83
5 Recommendations for Building Resilience
of Highways Sector in India
Based on the findings of the literature review,
stakeholder consultations, and VA of the
demonstration stretches, this chapter
documents the engineering and non-engineering
interventions for resilience building of the NH in
India. The chapter also classifies these interventions
based on the impacts of climate change on NHs in
various regions across India, namely, hilly, coastal,
desert, plains, etc. These are further classified into
no-regret, low-regret, and win-win solutions for
prioritizing resilience-building options.
5.1 Engineering interventions
Specific interventions for the two demonstration
stretches—hilly and coastal—have been suggested in
this chapter. However, given the fact that NHs carry
about 40% of the total road traffic (NHAI, 2014),
it is important that appropriate resilience-building
interventions are identified for NHs in other regions
of the country as well. To this end, engineering
interventions have been recommended to address
climate change impacts in different regions across
India. Table 19 indicates the suggested region-wise
engineering interventions that can be adopted in
these regions in line with the impacts of climate
change on NHs as tabulated in Chapter 2, ‘Impact
of Climate Change of Highways’ (Table 4). Table 19
also provides a list of guidelines, codes, and standards
and manuals, wherein the engineering interventions,
recommended as part of the study, already exist. This
provides an overview of the potential entry points for
mainstreaming climate resilience in NHs, also stressing
on the need to enforce and revise IRC guidelines and
codes to take the resilience agenda forward.
5.2 Non-engineering interventions for mainstreaming climate resilience in the National Highways sectorBuilding resilient roads and highways is a multi-
step process that requires interventions and inter-
departmental coordination at both national and sub-
national levels and during all the phases of a road
project—planning, construction, and operations. At
present, in the absence of a specific, comprehensive
policy on climate resilience of roads and highways
sector, there are no mandates and implementation
mechanisms to ensure the integration of climate
resilience in the roads sector. There are only a few
guidelines which have attempted to factor in climate
parameters. As stated in Chapter 1, ‘Introduction’, the
Indian Roads Congress (IRC) has come out with codes
that provide guidelines to address climate parameters
and associated climate risks. However, IRC is only
an advisory body for the planning and designing,
transportation, legislation, and research associated
with the development and maintenance of roads and
does not mandate the use of the codes. Also, the codes
are out dated with no inclusion of new state-of-art
technology options available globally.

84
Reducing Carbon Footprint and Enhancing Climate Resilience of National Highways in India
Ta
ble
19
: Re
gio
n-w
ise
en
gin
ee
rin
g i
nte
rve
nti
on
s
Re
gio
n
Cli
ma
te
stre
sso
rs
Imp
act
on
hig
hw
ay
ele
me
nts
an
d
infr
ast
ruct
ure
E
ng
ine
eri
ng
in
terv
en
tio
n
Re
fere
nce
s in
th
e e
xis
tin
g c
od
es
an
d g
uid
eli
ne
sP
roo
f o
f co
nce
pt
De
sert
,
pla
ins,
coa
sta
l
Hig
h
tem
pe
ratu
res
• S
oft
en
ing
of
pa
ve
me
nt
resu
ltin
g in
ru
ttin
g a
nd
sho
vin
g
• B
uck
ling
, he
av
ing
at
join
ts o
f th
e p
av
em
en
ts
• C
rack
ing
of
pa
ve
me
nts
ren
de
rin
g it
mo
re
susc
ep
tib
le t
o r
ain
s
an
d p
oth
ole
s, a
nd
als
o
aff
ect
ing
str
uct
ura
l
sta
bili
ty
• U
se o
f ro
ad
su
rfa
ce g
rid
s, s
uch
as
gla
ss g
rid
s, c
om
po
site
ge
o
gri
ds,
ste
el m
esh
es,
etc
., fo
r
stru
ctu
ral r
ein
forc
em
en
t o
f
asp
ha
lt p
av
em
en
ts t
o p
rov
ide
late
ral r
est
rain
t to
asp
ha
lt, h
en
ce
imp
rov
ing
re
sist
an
ce t
o r
utt
ing
an
d s
ho
vin
g
• U
se o
f p
av
ing
fa
bri
cs a
s a
mo
istu
re b
arr
ier
to r
ed
uce
cra
ckin
g
• U
se o
f a
pp
rop
ria
te a
sph
alt
s
an
d a
sph
alt
bin
de
rs t
o p
rev
en
t
cra
ckin
g o
f p
av
em
en
ts
• M
oR
TH
sp
eci
fica
tio
n f
or
roa
ds
an
d b
rid
ge
wo
rks;
Se
ctio
n
70
0-G
eo
syn
the
tics
an
d
Re
info
rce
d w
ork
• IR
C: S
P: 5
9-2
00
2 (
curr
en
tly
un
de
r re
vis
ion
) to
co
ve
r a
ll
ge
o s
ynth
eti
cs a
nd
no
t ju
st
ge
ote
xti
les
• L
ay
ing
of
ge
o g
rid
at
Gh
arn
i–N
itu
r–N
ilan
ga
Ro
ad
SH
-16
7, L
atu
r,
Ma
ha
rash
tra
i *
• U
se o
f g
lass
gri
ds
in
Luck
no
w–
Sit
ap
ur
NH
24
an
d C
och
in In
tern
ati
on
al
Air
po
rt, K
era
laii,
iii
• M
icro
surf
aci
ng
te
chn
olo
gy
(co
ld
mix
asp
ha
lt, d
efi
ne
d a
gg
reg
ate
,
an
d b
itu
me
n e
mu
lsio
n),
he
lps
in
pre
serv
ing
pa
ve
me
nt
stre
ng
th
an
d p
reve
nti
ng
cra
cks
• IR
C: S
P:8
1-2
00
8 T
en
tati
ve
Sp
eci
fica
tio
n f
or
Slu
rry
Se
al a
nd
Mic
ro s
urf
aci
ng
• B
elg
au
m–
Ma
ha
rash
tra
Bo
rde
r ro
ad
pro
ject
NH
4 (
Ma
inta
ine
d b
y N
ort
h
Ka
rna
tak
a E
xpre
ss L
td)
• U
se o
f cr
ack
se
alin
g m
ate
ria
ls,
such
as
asp
ha
lt e
mu
lsio
n s
lurr
y
sea
l, a
sph
alt
ce
me
nts
an
d
fib
eri
zed
asp
ha
lt, s
elf
-le
vell
ing
silic
on
e, e
tc. t
o p
rev
en
t th
e
intr
usi
on
of
wa
ter
thro
ug
h t
he
cra
ck
• IR
C 5
7-2
00
6 R
eco
mm
en
de
d
Pra
ctic
e f
or
Se
alin
g o
f Jo
ints
in
Co
ncr
ete
Pa
ve
me
nts
• U
sag
e o
f a
sph
alt
em
uls
ion
slu
rry
se
al f
or
cra
ck s
ea
ling
an
d p
eri
od
ic m
ain
ten
an
ce
of
Ne
w D
elh
i Mu
nic
ipa
l
Co
rpo
rati
on
ro
ad
siv
• P
atc
hin
g-
Pro
cess
of
rep
air
ing
po
tho
les
to p
rev
en
t w
ate
r
see
pa
ge
.21 M
ate
ria
ls f
or
pa
tch
ing
incl
ud
e h
ot
mix
asp
ha
lt, a
sph
alt
em
uls
ion
mix
es,
sto
ckp
ile
pa
tch
ing
mix
es,
an
d p
rop
rie
tary
pa
tch
ing
mix
es
• IR
C 1
16
: Sp
eci
fica
tio
ns
for
Re
ad
yma
de
Bit
um
ino
us
Po
tho
le
Pa
tch
ing
Mix
Usi
ng
Cu
t-B
ack
Bit
um
en
• P
ot
ho
les
are
re
pa
ire
d b
y
pa
tch
ing
mix
, use
d f
or
NH
2, S
uk
hd
ev
Vih
ar,
De
lhiv
21
Bas
ical
ly P
atch
ing
is d
on
e in
tw
o w
ays-
Fu
ll-d
epth
pat
chin
g w
her
e en
tire
pav
emen
t su
rfac
e la
yer
ove
r th
e p
atch
ing
area
is
rem
ove
d a
nd
dee
p p
atch
ing
wh
ere
fou
r o
r m
ore
in
ches
of
the
pav
emen
t su
rfac
e
cou
rse
is r
emo
ved
. Fo
r as
ph
alt
pav
emen
ts b
oth
fu
ll-d
epth
an
d d
eep
pat
chin
g ar
e ap
pli
cab
le b
ut
for
con
cret
e ro
ads
on
ly f
ull
dep
th p
atch
ing
is a
pp
lica
ble
.

85
Recommendations for Building Resilience of Highways Sector in India
Ta
ble
19
: Re
gio
n-w
ise
en
gin
ee
rin
g i
nte
rve
nti
on
s
Re
gio
n
Cli
ma
te
stre
sso
rs
Imp
act
on
hig
hw
ay
ele
me
nts
an
d
infr
ast
ruct
ure
E
ng
ine
eri
ng
in
terv
en
tio
n
Re
fere
nce
s in
th
e e
xis
tin
g c
od
es
an
d g
uid
eli
ne
sP
roo
f o
f co
nce
pt
Co
ast
al,
hill
an
d
pla
in
Inte
nse
ra
infa
ll/
Ex
tre
me
Pre
cip
ita
tio
n
ev
en
ts
• In
cre
ase
of
po
re
pre
ssu
re in
pa
ve
me
nt
laye
rs o
f ro
ad
s
resu
ltin
g in
re
ve
llin
g o
f
pa
ve
me
nt
surf
ace
• U
se o
f w
ate
r so
lub
le, U
V a
nd
he
at-
sta
ble
ch
em
ica
l so
il
mo
difi
er
to r
ed
uce
sw
ell
ing
.
Th
ese
so
il m
od
ifie
rs w
ate
rpro
ofs
com
pa
cte
d s
oil
an
d p
rev
en
ts
rev
ell
ing
of
pa
ve
me
nts
su
rfa
ce.
Ho
we
ve
r, t
he
lon
ge
vit
y o
f
this
tre
atm
en
t is
ye
t to
be
est
ab
lish
ed
Re
fere
nce
of
che
mic
al s
tab
ilize
rs
in IR
C: 3
7-2
01
3–
20
15
- D
esi
gn
of
Fle
xib
le P
av
em
en
t
Ku
lesr
a–
Su
rajp
ur
roa
d
sect
ion
of
the
DS
C r
oa
d o
f
Gre
ate
r N
oid
a
• E
rosi
on
an
d s
ub
sid
en
ce
of
pa
ve
d r
oa
ds.
• In
cre
ase
d s
oil
sta
bili
zati
on
thro
ug
h c
om
pa
ctio
n, d
rain
ag
e,
me
cha
nic
al s
tab
iliza
tio
n,
an
d c
he
mic
al s
tab
iliza
tio
n t
o
incr
ea
se s
oil
stre
ng
th a
nd
th
e
resi
sta
nce
of
soil
to s
oft
en
ing
by
wa
ter
IRC
28
-19
67
: Te
nta
tive
spe
cifi
cati
on
s fo
r th
e c
on
stru
ctio
n
of
sta
bili
zed
so
il ro
ad
s w
ith
so
ft
ag
gre
ga
te in
are
as
of
mo
de
rate
an
d h
igh
ra
infa
ll
IRC
88
-19
84
: Re
com
me
nd
ed
Pra
ctic
e f
or
Lim
e F
ly a
sh S
tab
ilize
d
So
il b
ase
/Su
b-b
ase
in P
av
em
en
t
con
stru
ctio
n
IRC
SP
-89
-20
10
: Gu
ide
line
s fo
r S
oil
an
d G
ran
ula
r M
ate
ria
l Sta
bili
zati
on
usi
ng
Ce
me
nt
Lim
e a
nd
Fly
Ash
IRC
56
-20
11
: Tre
atm
en
t o
f
em
ba
nk
me
nt
slo
pe
fo
r e
rosi
on
con
tro
l
Usa
ge
of
lime
fly
ash
to
sta
bili
ze s
oil
ba
se/s
ub
-ba
se in
pa
ve
me
nt
con
stru
ctio
n o
f N
H
4 S
ata
ra t
o K
olh
ap
ur
stre
tch
(Mu
kh
erj
ee
an
d G
au
ran
g,
20
13
).
Usi
ng
na
tura
l or
syn
the
tic
ero
sio
n
con
tro
l ma
t fo
r th
e p
rev
en
tio
n
of
ero
sio
n o
f si
de
slo
pe
s o
f th
e
pa
ve
me
nt
sect
ion
Tre
atm
en
t o
f th
e
em
ba
nk
me
nt
slo
pe
at
NH
7
Ka
rur–
Ma
du
rai,
Tam
il N
ad
u

86
Reducing Carbon Footprint and Enhancing Climate Resilience of National Highways in India
Ta
ble
19
: Re
gio
n-w
ise
en
gin
ee
rin
g i
nte
rve
nti
on
s
Re
gio
n
Cli
ma
te
stre
sso
rs
Imp
act
on
hig
hw
ay
ele
me
nts
an
d
infr
ast
ruct
ure
E
ng
ine
eri
ng
in
terv
en
tio
n
Re
fere
nce
s in
th
e e
xis
tin
g c
od
es
an
d g
uid
eli
ne
sP
roo
f o
f co
nce
pt
Infi
ltra
tio
n o
f ra
inw
ate
r
into
th
e la
yers
be
low
an
d t
hu
s d
am
ag
ing
th
e
stru
ctu
ral s
tab
ility
of
the
roa
d
Ge
o-c
om
po
site
dra
ina
ge
syst
em
s fo
r b
oth
dra
ina
ge
un
de
r
pa
ve
me
nts
an
d d
rain
ag
e b
eh
ind
reta
inin
g w
all
s i.e
. fin
dra
ins.
To
imp
rov
e d
rain
ag
e c
ap
aci
ty
Pro
vis
ion
of
imp
erm
ea
ble
inte
rla
yer,
i.e
., P
av
ing
fa
bri
cs w
hic
h
wo
rks
as
a m
ois
ture
ba
rrie
r to
pre
ve
nt
cra
ckin
g
IRC
34
-19
70
: Ro
ad
Co
nst
ruct
ion
in
wa
ter
log
ge
d a
rea
IRC
SP
: 42
- 2
01
4: G
uid
elin
es
for
urb
an
dra
ina
ge
IRC
SP
59
-20
02
: Gu
ide
line
s fo
r u
se
of
ge
ote
xti
les
in r
oa
d p
av
em
en
ts
an
d a
sso
cia
ted
wo
rks
Ge
ote
xti
le f
or
sub
gra
de
Sta
bili
zati
on
at
Jeju
ri -
Mo
rgo
n R
oa
d M
DR
-65
vi
Ge
ote
xti
le f
or
sep
ara
tio
n,
filt
rati
on
an
d d
rain
ag
e a
t L
ink
Ro
ad
be
twe
en
Pa
ith
an
Ro
ad
to N
ag
ar
Ro
ad
, Au
ran
ga
ba
d,
Ma
ha
rash
tra
vii
Wa
ter
ov
ert
op
pin
g
an
d w
ash
aw
ay
of
roa
d
pa
ve
me
nt
Pro
pe
r g
eo
me
tric
de
sig
n (
slo
pe
,
cam
be
r) a
nd
pro
vis
ion
of
sid
e
dra
ins
of
req
uir
ed
ca
pa
city
.
Ma
nu
als
fo
r S
pe
cifi
cati
on
s a
nd
&
Sta
nd
ard
s fo
r 2
, 4 a
nd
6 la
ne
s
4 L
an
ing
of
Pa
tha
nko
t–
Am
rits
ar
sect
ion
of
NH
15
Re
du
ced
ca
pa
city
of
dra
ina
ge
sys
tem
du
e t
o
de
bri
s a
ccu
mu
lati
on
,
sed
ime
nta
tio
n, e
rosi
on
,
sco
ur
pip
ing
, an
d c
on
du
it
stru
ctu
ral d
am
ag
e,
the
reb
y re
sult
ing
in
flo
od
ing
of
roa
ds
An
nu
al a
nd
pe
rio
dic
ma
inte
na
nce
of
dra
ina
ge
, pa
rtic
ula
rly
in p
re
mo
nso
on
an
d m
on
soo
n p
eri
od
.
Pro
vis
ion
of
cau
sew
ays
an
d v
en
ted
cau
sew
ays
to
ca
ter
to H
FL
s a
nd
fla
sh fl
oo
ds
IRC
34
-20
11
: Re
com
me
nd
ati
on
s fo
r
roa
d c
on
stru
ctio
n in
wa
terl
og
ge
d
are
as.
IRC
SP
: 42
-20
14
Gu
ide
line
s o
f ro
ad
dra
ina
ge
IRC
: SP
:83
-20
08
gu
ide
line
s
for
ma
inte
na
nce
, re
pa
ir a
nd
reh
ab
ilita
tio
n o
f ce
me
nt
con
cre
te
pa
ve
me
nts
IRC
: SP
: 73
-20
15
, IR
C: S
P-8
4-2
01
4,
IRC
: SP
-8
7-2
01
3, M
an
ua
ls f
or
Sp
eci
fica
tio
ns
an
d S
tan
da
rds
for
2,
4, a
nd
6 la
ne
s, r
esp
ect
ive
ly
Sto
rms/
du
st
sto
rms
an
d
stro
ng
er
win
ds
Clo
gg
ing
of
roa
dsi
de
dra
ins
du
e t
o d
eb
ris
fro
m
sto
rm
An
nu
al a
nd
pe
rio
dic
ma
inte
na
nce
of
dra
ina
ge
IRC
SP
: 42
-20
14
Gu
ide
line
s o
f R
oa
d
Dra
ina
ge
IRC
SP
: 83
-20
08
Gu
ide
line
s
for
ma
inte
na
nce
, re
pa
ir a
nd
reh
ab
ilita
tio
n o
f ce
me
nt
con
cre
te
pa
ve
me
nts

87
Recommendations for Building Resilience of Highways Sector in India
Ta
ble
19
: Re
gio
n-w
ise
en
gin
ee
rin
g i
nte
rve
nti
on
s
Re
gio
n
Cli
ma
te
stre
sso
rs
Imp
act
on
hig
hw
ay
ele
me
nts
an
d
infr
ast
ruct
ure
E
ng
ine
eri
ng
in
terv
en
tio
n
Re
fere
nce
s in
th
e e
xis
tin
g c
od
es
an
d g
uid
eli
ne
sP
roo
f o
f co
nce
pt
Hill
s In
ten
se r
ain
fall
/
Ex
tre
me
Pre
cip
ita
tio
n
ev
en
ts
Ris
k o
f la
nd
slid
es,
ro
ck
fall
s, a
nd
flo
od
s fr
om
ru
n
off
Slo
pe
fa
ilure
s
Pro
tect
ion
me
asu
res–
Co
nta
inin
g
or
dir
ect
ing
th
e r
ock
s to
dit
ch o
r
oth
er
catc
hin
g s
tru
ctu
res,
su
ch a
s
Ge
o-n
ets
/ D
rap
ery
sys
tem
s, w
ire
me
she
s, r
ock
bo
lts,
be
rms
an
d
be
nch
ing
, ro
ckfa
ll d
itch
es
an
d
tre
nch
es,
ro
ck s
he
ds
an
d t
un
ne
ls,
rock
fall
ba
rrie
rs, a
nd
em
ba
nk
me
nts
(ga
bio
n w
all
s, s
tru
ctu
ral w
all
s, e
tc.)
Pro
tect
ion
me
asu
res–
Use
of
ero
sio
n-c
on
tro
l ma
ts/b
lan
kets
an
d
oth
er
bio
-en
gin
ee
rin
g m
ea
sure
s,
such
as
hyd
ro s
ee
din
g m
eth
od
s,
mu
lch
ing
, etc
.
Re
ten
tio
n M
ea
sure
s–U
se o
f sl
op
e
rein
forc
em
en
t w
ith
ro
ck b
olt
s, s
oil
na
ilin
g, m
esh
wit
h a
nch
ors
an
d
gro
uti
ng
, etc
.
Pre
ve
nti
on
me
asu
res–
Mo
difi
cati
on
of
slo
pe
ge
om
etr
y b
y re
mo
va
l of
ma
teri
al f
rom
th
e u
pp
er
are
as,
red
uct
ion
of
slo
pe
an
gle
an
d
trim
min
g o
f lo
ose
su
rfa
ce m
ate
ria
l,
rein
forc
ing
slo
pe
fa
ce, b
en
chin
g
etc
.
Pre
ve
nti
on
Me
asu
re–
Imp
rov
ing
slo
pe
sta
bili
ty t
hro
ug
h t
he
inst
all
ati
on
of
dra
ina
ge
sys
tem
s,
tha
t m
ost
oft
en
co
nsi
st o
f
ho
rizo
nta
l we
ep
IRC
HR
B S
pe
cia
l Re
po
rt 2
3 B
23
Sta
te o
f th
e A
rt-D
esi
gn
an
d
Co
nst
ruct
ion
of
Ro
ck f
all
Mit
iga
tio
n
Sys
tem
s
IRC
: SR
:15
Sta
te o
f th
e A
rt:
La
nd
slid
e c
orr
ect
ion
Te
chn
iqu
es
IRC
SR
:21
Sta
te o
f th
e A
rt: U
se
of
Just
Ge
ote
xti
les
in R
oa
d
Co
nst
ruct
ion
an
d P
rev
en
tio
n o
f
So
il E
rosi
on
/La
nd
slid
es
IRC
:SP
: 10
6-2
01
5-
En
gin
ee
rin
g
Gu
ide
line
s o
n L
an
dsl
ide
Mit
iga
tio
n
Me
asu
res
for
Ind
ian
Ro
ad
s
IRC
56
-20
11
: Tre
atm
en
t o
f
em
ba
nk
me
nt
slo
pe
fo
r e
rosi
on
con
tro
l
IRC
SP
: 48
19
98
Hill
Ro
ad
Ma
nu
al
IRC
SP
: 10
2-
20
14
Gu
ide
line
s
for
De
sig
n a
nd
Co
nst
ruct
ion
of
Re
info
rce
d R
eta
inin
g w
all
s
Ro
ck f
all
mit
iga
tio
n w
ork
s
alo
ng
Mu
mb
ai –
Pu
ne
exp
ress
wa
y u
sag
e o
f (M
on
o
ori
en
ted
Re
info
rce
d S
tee
l
Wir
e M
esh
, Rh
om
bo
ida
l
Ca
ble
Wir
e R
op
e P
an
els
,
Dy
na
mic
Ro
ck f
all
Ba
rrie
r:v
iii
La
nd
slip
Re
pa
ir a
t
Ma
ha
ba
lesw
ar–
Tap
ola
Ro
ad
an
d W
ide
nin
g o
f H
ill
Ro
ad
at
Ke
lgh
ar
Gh
at
un
de
r
Ma
ha
rash
tra
Pu
blic
Wo
rks
De
pa
rtm
en
t
Pro
tect
ion
me
asu
res
by
pla
nti
ng
of
shru
bs
an
d
tre
es
in a
ph
ase
d m
an
ne
r fo
r
ero
sio
n c
on
tro
l in
inte
nse
lan
dsl
ide
s zo
ne
be
twe
en
Ko
tdw
ara
–D
ug
ad
da
ro
ad
,
Pa
uri
of
Utt
ara
kh
an
d ix

88
Reducing Carbon Footprint and Enhancing Climate Resilience of National Highways in India
Ta
ble
19
: Re
gio
n-w
ise
en
gin
ee
rin
g i
nte
rve
nti
on
s
Re
gio
n
Cli
ma
te
stre
sso
rs
Imp
act
on
hig
hw
ay
ele
me
nts
an
d
infr
ast
ruct
ure
E
ng
ine
eri
ng
in
terv
en
tio
n
Re
fere
nce
s in
th
e e
xis
tin
g c
od
es
an
d g
uid
eli
ne
sP
roo
f o
f co
nce
pt
Co
ast
al
Se
a-l
eve
l ris
e,
cycl
on
es,
an
d
sto
rm s
urg
es
Co
ast
al r
oa
d fl
oo
din
g a
nd
sub
seq
ue
nt
da
ma
ge
s
Ero
sio
n o
f co
ast
al r
oa
d
ba
se
Em
ba
nk
me
nt
slo
pe
ve
ge
tati
on
to
pro
tect
an
d m
inim
ize
da
ma
ge
s o
n
hig
hw
ay
du
e t
o c
oa
sta
l flo
od
ing
an
d e
rosi
on
.
Gre
en
ing
of
coa
sta
l be
lt w
hic
h
act
as
a b
uff
er
an
d p
rov
ide
s
pro
tect
ion
/ re
du
ces
da
ma
ge
s d
ue
to c
yclo
ne
re
late
d fl
oo
din
g a
nd
win
ds.
Co
ast
al a
rmo
uri
ng
, su
ch a
s
bu
ildin
g s
ea
wa
lls,
bre
ak
wa
ter,
gro
yne
s, s
torm
su
rge
ba
rrie
rs, e
tc.
Use
of
ge
o t
ub
es
an
d g
eo
con
tain
ers
fo
r st
orm
su
rge
pro
tect
ion
, als
o f
or
bre
ak
wa
ters
Ga
ng
a F
loo
d C
on
tro
l Co
mm
issi
on
Gu
ide
line
s fo
r U
se o
f G
eo
tex
tile
s/
Ge
ote
xti
le b
ag
/ G
eo
tex
tile
tub
es
in C
on
stru
ctio
n o
f Fl
oo
d
Ma
na
ge
me
nt
Wo
rks
Ce
ntr
al W
ate
r C
om
mis
sio
n
gu
ide
line
s–H
an
db
oo
k fo
r Fl
oo
d
Pro
tect
ion
, An
ti E
rosi
on
an
d R
ive
r
Tra
inin
g W
ork
s
CR
RI R
ep
ort
20
13
-G
uid
elin
es
for
Pla
nn
ing
an
d C
on
stru
ctio
n o
f
Ro
ad
s in
Cyc
lon
e P
ron
e A
rea
s
Co
nst
ruct
ion
of
be
ach
pro
tect
ion
bu
nd
an
d g
roy
ne
usi
ng
ge
ote
xti
le t
ub
es
at
Pe
tro
ne
t L
NG
Ltd
, Ko
chi,
Ke
rala
, In
dia
x
Ele
ctri
c p
ole
s, a
nd
tre
es
fall
ing
on
ro
ad
s
Un
de
rgro
un
d c
ab
ling
of
ele
ctri
city
an
d o
the
r co
mm
un
ica
tio
n li
ne
s
Use
of
spu
n c
on
cre
te e
lect
ric
po
les
inst
ea
d o
f th
e n
orm
al e
lect
ric
po
les
in o
rde
r to
be
tte
r w
ith
sta
nd
ex
tre
me
win
ds
Ma
nu
als
fo
r S
pe
cifi
cati
on
s a
nd
& S
tan
da
rds
for
2, 4
an
d 6
lan
es
reco
mm
en
ds
to
fo
llo
w p
rov
isio
ns
as
pe
r IR
C9
8-2
01
1 G
uid
elin
es
on
Acc
om
mo
da
tio
n o
f U
tilit
y S
erv
ice
s
on
Ro
ad
s in
Urb
an
Are
as,
fo
r
acc
om
mo
da
tin
g u
nd
erg
rou
nd
uti
litie
s
Pla
ins,
hill
s
Ex
tre
me
Tem
pe
ratu
res
an
d P
erm
afr
ost
Ch
an
ge
s in
fre
eze
an
d
tha
w c
ycle
ma
kin
g r
oa
d
surf
ace
s m
ore
su
sce
pti
ble
to p
oth
ole
s a
nd
ru
ttin
g.
Ex
tre
me
hig
h
tem
pe
ratu
res
resu
ltin
g in
cra
ckin
g o
f p
av
em
en
ts
Use
of
pre
cau
tio
na
ry m
ea
sure
s a
s
pe
r IS
78
61
- P
art
1(h
ot
we
ath
er)
an
d P
art
2 (
cold
we
ath
er)
fo
r
ex
tre
me
we
ath
er
con
cre
tin
g
IS 7
86
1-
Pa
rt 1
(ho
t w
ea
the
r) a
nd
Pa
rt 2
(co
ld w
ea
the
r) f
or
ex
tre
me
we
ath
er
con
cre
tin
g
* F
oo
tno
tes
i–x
ha
ve b
ee
n r
efe
rre
d i
n A
nn
exu
re 4
of
this
Re
po
rt.
Sou
rce
s: (
Na
no
tech
no
log
y fo
r w
ate
r re
sist
an
t so
il b
ase
s, 2
01
7),
(N
ew
te
chn
olo
gy
for
du
st c
on
tro
l, e
rosi
on
re
sist
an
ce a
nd
wa
ter
resi
sta
nce
, 2
01
7),
(Z
yde
x R
oa
d S
olu
tio
ns,
20
01
7),
Ra
jesh
S. G
uja
r, e
t a
l. (2
01
3),
(B
ob
row
sky,
20
08
), (
Ro
ych
ow
dh
ury
, 2
01
5),
(B
ure
au
of
Ind
ian
Sta
nd
ard
s, 1
99
9),
(n
dia
n R
oa
ds
Co
ng
ress
, 1
99
8),
(T
he
In
dia
n R
oa
d C
on
gre
ss,
20
11
), (
TE
RI’s
sta
keh
old
er
inte
ract
ion
s 2
01
7),
(I
nd
ian
Ro
ad
Co
ng
ress
, 2
01
7)

89
Recommendations for Building Resilience of Highways Sector in India
Considering that climate change is of critical concern,
it is important that these concerns be integrated in the
planning and management of roads and highways.
There is a need to strengthen the interlinkage of
planning, design, construction, and maintenance
of roads and climate-resilience measures at the
policy level. This calls for a comprehensive climate
mainstreaming plan to steer the current and future
course of highways management.
Mainstreaming climate resilience (Box 3) in the
roads and highways sector will need a multi-pronged
approach.
Institutionalizing a dedicated climate change unit
in the Ministry of Road Transport and Highways
(MoRTH), Government of India; the primary
objective of this will be reducing carbon footprint and
enhancing resilience of NHs. The unit will be the nodal
point for coordinating research and development
activities, data management and information sharing,
formulation, and enforcement of codes and guidelines
for resilience building of NHs in the country. The unit
will also coordinate with other government agencies
and stakeholders, including the NHAI, IMD, NIDM,
NDMA, ISRO/ NRSC, and state-level departments,
such as disaster management/ revenue departments,
PWD, environment and forest departments, and
state transport department, to name a few. The unit
will become an interface for the state PWDs on issues
pertaining to climate adaptation and resilience. The unit
will also play a key role wherein studies and actions on
climate resilience will be conducted and streamlining
and financing of the same will be facilitated. It is
recommended to empanel a set of consultants /expert
agencies that can support the unit in conducting
these VA studies. The unit will also act as an interface
between external aid agencies and technical agencies,
such as research and academic institutes that aid in
developing knowledge and technical capacities to
Mainstreaming can be defined as the “integration
of climate change related policies and measures
into developmental planning process and decision-
making.” (Eriksen, 2005)
BOX 3: MAINSTREAMING
build resilience. Figure 11 presents the proposed
interlinkages for institutionalization of the unit .
P Mainstreaming planning and approval
processes—Climate change considerations
should be included as one of the key parameters
during the planning and design stage of the
highway network and projects. Identification and
mapping of vulnerable areas at the regional scale
and detailed risk assessment studies for high
vulnerability stretches should be made mandatory
by MoRTH as part of the planning and approval
process for expansion and upgradation of roads
and highways. It is advised that stretch-level VA
should be conducted for all highway stretches.
However, to start with, it is recommended that
stretch level VA should be made mandatory for all
highway stretches falling in the vulnerable regions
identified under the network level VA conducted
for this study. To this end, it is recommended that
Vulnerability Assessment should be included in
the ToR prepared by the project proponents for the
DPR consultants and also be incorporated in IRC-
SP: 19-2001: Manual for survey, investigation and
preparation of road projects. This will ensure that
the Vulnerability assessment will be conducted
as part of the feasibility study. Then based on
the recommendations that emerged from the VA
Figure 11: Mainstreaming of proposed institutional changes

90
Reducing Carbon Footprint and Enhancing Climate Resilience of National Highways in India
carried out as part of the feasibility study, the
Detailed Project Report (DPR) should include the
cost of the engineering interventions that need
to be implemented for enhancing the climate
resilience of the highways.
P Formulation of region-wise construction and
maintenance guidelines—The stakeholder
consultations conducted as part of this study
indicate that the current construction and
maintenance practices for NHs are not sensitive
to the changing climate. The study also indicates
that climate change impacts on roads and
highways vary across different regions in the
country. Moreover, it is observed that appropriate
maintenance practices and schedules will play an
integral role in resilience building of roads and
highways. Therefore, it is suggested that region-
wise construction and maintenance guidelines be
formulated by the MoRTH, with support from the
proposed climate change unit and Indian Roads
Congress (IRC) and be implemented and enforced
by National Highways Authority of India (NHAI)
and State PWDs depending on their jurisdiction.
P Facilitating updating and enforcement of
existing Codes—IRC codes are a set of guidelines
for road development in India. However, these
codes are outdated and do not include new
technology options (Roychowdhury, 2015). They
also do not address emerging concerns such as
climate change. It is recommended that relevant
codes and guidelines be updated by the IRC with
assistance from the proposed climate change unit
and its provisions be made mandatory by the
MoRTH to address construction and maintenance
practices in the light of climate change impacts.
For instance, IRC Codes: SP-48-1998, IRC 56, IRC
104, IRC 034-2011, IRC 28-1967, etc., pertaining
to the development of roads in hilly regions may
be updated and enforced to build climate resilience
of hilly highways. Other relevant codes that need
to be enforced include IS Codes, such as 7861-
Part 1 (hot weather) and Part 2 (cold weather).
These updated codes and regulations shall be
implemented and enforced by the NHAI and State
PWDs depending on their jurisdiction.
P Interdepartmental coordination at national
and subnational levels—Resilience building
of the highways sector requires coordination
amongst multiple departments at the national
and subnational levels, especially with respect to
information sharing and policymaking. These will
include IMD, MoRTH, NHAI, State PWD, disaster
management department, etc. The proposed
climate change unit will play a key role in this
process. Similarly, coordination between various
committees of the IRC will also be imperative to
ensure climate resilient road development in India.
P Data management—Collection and integration of
data for resilience building of the highways sector
was found to be a challenging process during the
course of this study. In most cases, the required
data was not available, for instance, data on risk-
prone locations based on past events, measures
adopted for the same, operational data, etc., and
if it was available, it was not in an appropriate
format. Therefore, it is recommended that specific
data for the purpose may be recorded and updated
regularly by relevant highway authority. To start
with, a broad data checklist has been developed
based on the learning and experience from this
study and presented in Table 20 with an objective
of facilitating resilience planning efforts for the
NH sector in India.
Moreover, existing data efforts on climate and
non-climate parameters related to NHs by other
departments and agencies also need to be collated
by the proposed unit. For example, the IMD
maintains a data set on daily weather forecast
specific to highways, which when combined with
other vulnerability parameters, has the potential
to be developed into an early warning system for
contingency planning for highways.
P Research and capacity development—It is
recommended that research and capacity
development is required to explore alternative
construction materials and technologies and also
bridge knowledge and capacity gaps of highways
engineers, practitioners, and consultants.
International literature review and interactions
with relevant stakeholders indicate numerous
capacity gaps, identified as follows, at various

91
Recommendations for Building Resilience of Highways Sector in India
Table 20: Indicative data checklist for facilitating resilience planning efforts for the NHs sector in India
Parameters Data required
Climate Data • Temperature (maximum and minimum ): daily (for the past 20–30 years), Temperature
extremes: last 20–30 years
• Rainfall/precipitation: Daily (past 20–30 years), Highest 24-hourly rainfall: last 20–30 years
• Other precipitation: snow
• Wind speed daily: last 5 years
Extreme events and
disasters
• Past history of extreme events and natural disasters: last 20–30 years
• Damage caused during extreme events
• Cost incurred to rebuild and renovate post the extreme event/disaster
Future Climate
projections
• Data to be extracted from previous national and international studies for future climate
projections
Physiography • Physical terrain: topography, slopes, and geological and geo-hydrological characteristics
Land use • Surrounding settlements, forest cover, eco-sensitive areas agricultural land, water bodies,
industrial areas, services, and infrastructure
Highways elements
and infrastructure
• Drainage, embankment, pavement thickness, crash barriers, sign boards, etc.
Highways materials
and construction
techniques
• Material used for road construction, details of the construction technology used for
constructing the road.
Traffic data • Annual Average daily traffic (AADT) in PCUs differentiated by vehicle categories for the last
5 years
• Peak traffic period of the year (monthly data)
• Peak traffic recorded (in PCUs) during the peak period (specify in terms of Average Daily
Traffic)
Highway
infrastructure assets
• Location and condition of the various elements of infrastructure that comprise the
highway network:
• Street lights – numbers and distance
• Storm water drainage system – type
• Safety barriers and their types
• Trees/ vegetation – type and numbers
Location of cities
and infrastructure
• Million plus cities, other important cities with respect to tourism, trade, pilgrimage, etc.
• Airports, ports, railway stations, etc.
levels for the resilience building of the highways
sector in India.
• Lack of updated climate thresholds for extreme
rainfall
• Flood levels impacting roads
• Factors for defining the criticality of roads
• Climate VA at national or subnational level for
the roads/ highways sector
• Viable technology options for highway
resilience in India
As a way forward, it is recommended that the MoRTH
addresses these gaps for capacity development in the
highways sector. This will also help in identifying
specific entry points for mainstreaming climate
change considerations in the IRC codes. Training and
capacity building of highway engineers, practitioners,
and consultants is also required to address resilience
building of highways.

92
Reducing Carbon Footprint and Enhancing Climate Resilience of National Highways in India
It may be noted that these recommendations are
based on stakeholder consultations, discussions with
sector experts, international literature review, and the
outcomes of VA of the two demonstration stretches
(hilly and coastal). Although this study only focusses
on the NH sector, it is suggested that the MoRTH may
recommend these interventions for resilience building
of roads and highways sector in India to other relevant
agencies at the national, state, and city levels, apart
from the NHAI.
5.3 Identifying no-regret, low-regret, and win-win options for building the resilience of the highways sector in India
The existing literature suggests that climate proofing
infrastructure to make it resilient to future climate risks
and uncertainties will require additional financial costs.
A World Bank study estimates that the price tag between
2010 and 2050 for adapting to an approximately 2 °C
warmer world by 2050 will be in the range of $70 billion
to $100 billion a year (World Bank, 2010a). Out of this,
infrastructure sector, including roads and highways, has
accounted for the largest share of adaptation costs based
on past studies (World Bank, 2010a). At the same time,
it is generally accepted that $1 of preventive measures
equals to $5 of repairs (Pacific Region Infrastructure
Facility, 2013). Therefore, in order to prioritize
investment decisions, it is imperative to quantify and
understand the economics of adaptation—the costs
and co-benefits. As per the IPCC, adaptation cost is
‘the cost of planning, preparing and facilitating and
implementing climate change adaptation measures
including transition costs” and benefits as ‘the avoided
damage costs or the accrued benefits following the
adoption and implementation of adaptation measures’
(United Nations Framework Convention on Climate
Change, 2011). Specific tools and methodologies for
quantifying these costs and benefits are still emerging
(World Bank, 2015).
In the Indian scenario, such cost-benefit assessments
for climate adaptation in the infrastructure sector are
practically non-existent. Moreover, this study revealed
that post-disaster assessments of loss and damage are
typically limited to direct physical impacts and repair
costs only. For instance, the data collected for hilly
stretches reveal that the repair cost for addressing
the direct physical loss and damage due to extreme
rainfall in June 2013 was to the tune of `13.9 lakh/ km
(Public Works Department, Himachal Pradesh, 2013).
However, no data was recorded for the overall accrued
economic losses as a result of the damage to the highway.
This presents a challenge in quantification of the
benefits of adaptation interventions, and subsequent
classification of the proposed interventions into no-
regret, low-regret, and win-win options. Therefore,
a review of the existing literature on classification
approaches adopted globally and inputs from national
sector experts have been utilized for the same.
What are no-regret, low-regret, and win-win adaptation options?
When it comes to identifying appropriate adaptation
measures, it must be understood that out of the several
adaptation options, the most viable options are the ones
that result in effective adaptation and are cost-effective
(UK Climate Impacts Program, 2007). Moreover,
given the uncertainities surrounding climate change
outcomes and long-term projections of social and
economic development, policies that typically give
priority or co-benefits towards development goals
or focus on preventing or minimizing risks should
be targetted (UK Climate Impacts Program, 2007) .
These options are generally referred to as no-regret,
low-regret, and win-win adaptation options.
No-regret adaptation options
No-regret adaptation options deliver socio-economic
benefits irrespective of future climate change outcomes
(United Nations Framework Convention on Climate
Change, 2011). These type of options include measures
that are cost-effective in the current context of climate
variability and risks. No-regret adaptation options
focus on near-term projections and objectives and
their implementation can provide immediate benefits.
Such no-regret adaptations options include actions
focussing on building overall adaptive capacities and
minimizing risks, for instance avoiding building in high
risk areas, improving efficiency and better management
of infrastructure systems, such as drainage, etc. Such
measures/strategies will require investments but
are most cost effective when the immediacy of the
targetted risks and realized benefits are considered
(UK Climate Impacts Program).

93
Recommendations for Building Resilience of Highways Sector in India
Low-regret adaptation options
Adaptive measures for which the associated costs are
relatively low and for which the benefits, although
primarily realised under projected future climate change,
may be relatively large (UK Climate Impacts Program,
2007). Such options target at maximizing the return
on investments by focusing on building the resilience
of most vulnerable sectors, assets and communities
(World Bank, 2010a). Measures will include options,
such as restricting the type and extent of development
in flood-prone areas, implementing improved technical
standards and use of climate-appropriate technologies
in risk-prone areas, developing partnerships and
financial/insurance mechanisms for offsetting risks and
incentivizing adaptation, etc.
Win-win adaptation options
Win-win adaptation options include measures that
have the desired result in terms of minimizing the
climate risks but also have other social, environmental,
or economic benefits. These types of measures include
those that are introduced primarily for reasons other
than addressing climate risks but also deliver the desired
adaptation benefits (UK Climate Impacts Programme,
2007). Examples include awareness generation and
capacity building programmes, flood management and
disaster planning, development of data management
systems, promoting resource efficiency, climate-
proofing new infrastructure, etc. It may be noted here
that some of the options would qualify both under
categories, that is, no-regret and win-win solutions as
they are cost-effective and will have both immediate
and long-term impacts and co-benefits.
Table 21 summarizes the parameters that determine
the classification of the interventions into the
three categories.
No-regret, low-regret and win-win options for building resilience of highways sector in India
Based on the parameters that differentiate no- regret,
low-regret, and win-win solutions, both engineering
and non-engineering interventions recommended in
the study have been classified. Table 22 indicates the
different categories under which the recommended
interventions have been classified. This classification
is primarily based on qualitative assessment (through
consultations and discussions with experts/contractors/
construction companies) and literature review.
Table 21: Parameters for classifying adaptation interventions
Classification Time frame Cost Benefits
No regret Immediate benefit; relevant in
current climate variability and
risk irrespective of the future
climate change scenario
Most cost effective for
addressing immediate
risks
Minimizing risk, building overall
capacities, and delivering socio-
economic benefits
Low regret Benefits realized under the
projected future climate change
scenarios
Additional cost with
maximum returns by
focussing investments on
most vulnerable sectors,
areas, and communities
Potentially large benefits under
the projected climate change
scenarios by offsetting climate
risks of the most vulnerable
Win-win Benefits realized under the
projected future climate change
scenarios
Additional cost Desired results for minimizing
future climate risks along
with social, economic, and
environmental co-benefits

94
Reducing Carbon Footprint and Enhancing Climate Resilience of National Highways in India
Table 22: Classification of interventions
Interventions No regret Low regret Win-Win
Engineering
Use of road surface grids for the structural reinforcement of asphalt
pavements to provide lateral restraint to asphalt, hence improve resistance
to rutting and shoving
Use of appropriate asphalts and asphalt binders, depending on the
weather conditions to prevent cracking of roads
Use of Micro-surfacing technology to preserve the pavement strength and
preventing cracking of pavements
Use of crack-sealing materials to prevent the intrusion of water through the
crack into the underlying pavement structure
Patching for repairing potholes and hence preventing water from seeping
into the subgrade
Use of water soluble, UV, and heat-stable soil chemical modifier to
waterproof compacted soil surface up to 10 mm depth and to reduce
swelling and thus prevent revelling of the pavement surface
Increased soil stabilization to help improve the soil strength and increase
the resistance of soil to softening by water
Proper geometric design ( slope, camber) and provision of side drains of
required capacity to prevent water overtopping of pavement and wash
away of pavements
Provision of causeways and vented causeways to cater to HFLs and flash
floods
Improving drainage capacity through the use of geo-composite drainage
systems for both drainage under pavements and drainage behind retaining
walls, i.e. fin walls
Annual and periodic maintenance of drainage, particularly in pre-monsoon
and monsoon period
Containing or directing the rocks to ditch or other catching structures, such
as Geo-nets/ Drapery systems, wire meshs, rock bolts, Rock sheds, barriers
and tunnels, and half tunnels
Use of slope reinforcement with rock bolts, soil nailing, anchors and
grouting, etc
Modification of slope geometry by removing material from the upper areas,
reduction of slope angle and trimming of loose surface material, benching,
etc
Coastal armouring, such as building sea walls, breakwater, storm surge
barriers, etc
Use of geotubes and geo containers for storm-surge protection
Greening of coastal belt for cyclone protection
Embankment slope vegetation to protect the highway from coastal
flooding and erosion
Underground cabling of electricity and other communication lines
Use of spun concrete electric poles instead of the regular electric poles in
order to better withstand extreme winds.
Non-Engineering

95
Recommendations for Building Resilience of Highways Sector in India
Table 22: Classification of interventions
Interventions No regret Low regret Win-Win
Constitution of a dedicated unit in the MoRTH with an objective of
enhancing resilience of NHs
Planning and approval—Climate change considerations should be
included as one of the key parameters during the planning and design
stage of highway networks and project. Identification and mapping of
vulnerable areas at the regional scale and detailed risk assessment studies
for high vulnerability stretches for expansion and upgradation of roads and
highways.
Formulation of region-wise construction and maintenance guidelines
Updation and enforcement of the existing IRC and IS codes to address
and modify construction and maintenance practices in the light of climate
change impacts
Interdepartmental coordination at the national and subnational levels with
respect to information sharing and policymaking
Data management—Collection and integration of data for resilience
building of highways sector. Specific data for the purpose may be recorded
and updated regularly by the NHAI
Conducting research and capacity development in the sector


97
6References
American Association of State Highway and
Transportation Officials. 2016. Understanding
Transportation Resilience: A 2016–2018
Roadmap. American Association of State
Highway and Transportation Officials.
Anil P, Rakesh K, and Kiran. 2001. The Disaster
Management. Himalayan Environment Studies
and Conservation Organisation. Uttarakhand.
Asian Development Bank (ADB). 2011. Guidelines
for Climate Proofing Investment in the Transport
Sector: Road Infrastructure Projects. Metro
Manila, Philippines: ADB.
Bhuvan National Remote Sensing Centre. 2016.
Retrieved December 2016, from Disaster
Services(NDEM Public): http://bhuvan-noeda.
nrsc.gov.in/disaster/disaster/disaster.php
Bobrowsky, L M. 2008. The Landslide Handbook:
A Guide to Understanding Landslides. US
Geological Survey.
Bureau of Indian Standards. 1999. Indian Standard:
Landslide Control Guidelines.
Business Standard. 2014. Cyclone Hudhud damage
in AP estimated at `8,000 cr; death toll rises
to 24.
Canadian Council of Professional Engineers. 2008.
Adapting to Climate Change: Canada’s First
National’s Engineering Vulnerability Assessments
of Public Infrastructure.
Central Road Research Institute. (2009–2010). Annual
Report on Flexible Pavements. New Delhi:
Central Road Research Institute.
Circle of Blue. 2014, May 8. Uttarakhand Flood
Disaster Made Worse By Existing Hydropower
Projects, Expert Commission Says. Retrieved
from Circle of Blue: http://www.circleofblue.
org/2014/world/uttarakhand-flood-disaster-
made-worse-existing-hydropower-projects-
expert-commission-says/
Climate UK. 2013. Creating and Managing Resilient
Local Highways. Climate Change Northwest.
Cynthia Rosenzweig, W D. 2014. Climate Change
and Cities: First Assessment Report of the Urban
Climate Change Research Network.
D Meyer, M. n.d. Design Standards for U.S.
Transportation Infrastructure: The Implications
of Climate Change.
Deccan Chronicle. 2016, December 13. Cyclone Vardah
leaves trail of damage across Chennai.
Department of Environment, Science & Technology,
Government of Himachal Pradesh. 2012. State
Strategy & Action Plan on Climate Change,
Himachal Pradesh. Shimla: Department
of Environment, Science & Technology,
Government of Himachal Pradesh.
Down to Earth. 2014. Floods in 4 states lead to economic
loss of `19,000 crore in past one year. Retrieved

98
Reducing Carbon Footprint and Enhancing Climate Resilience of National Highways in India
from Down to Earth: http://www.downtoearth.
org. in/news/f loods-in-4-states-lead-to-
economic-loss-of-rs-19000-crore-in-past-one-
year-46847.
Dowds, Jonathan and L. A.-H. 2015. Challenges
and Opportunities for integrating climate
adaptation efforts across state, regional and local
transportation agencies. U.S. Department of
Transportation.
Environment Protection Training and Research
Institute (EPTRI). 2012. State Action Plan on
Climate Change for Andhra Pradesh. Hyderabad:
EPTRI.
Eriksen S E H, N L. 2005. Portfolio Screening for
Mainstreaming Adaptation to Climate Change.
International Conference on Climate and
Development. Hamburg: Hamburg Institute of
International Economics.
Ernst & Young LLP. 2016. The Paris Agreement; A
Universal Call to Action for Governments and
Businesses;What it means for India. Kolkata:
Ernst & Young LLP.
Federal Highway Administration, U.S. Department of
Transportation. 2017. Synthesis of Approaches
for Addressing Resilience in Project Development.
Washington D.C.: U.S. Department of
Transportation.
Federal Highway Administration, U.S. Department
of Transportation. 2017. Transportation
Infrastructure Resiliency: A review of practices
in Denmark, the Netherlands and Norway.
Washington DC: U.S. Department of
Transportation.
Forum of European Highway Research Laboratories
(FEHRL). 2013. The Resilient Road: A Roadmap
for Research; An Element of the Forever Open
Road. Belgium: FEHRL Secretariat.
Geofabrics. 2015. Rockfall Protection. Retrieved from
Geofabrics: http://www.geofabrics.co.nz/civil/
rockfall-protection/.
Global Fund for Disaster Risk Reduction (GFDRR).
2010. Bihar Kosi Floods (2008), Needs Assessment
Report. Retrieved from Global Fund for
Disaster Risk Reduction: https://www.gfdrr.org/
sites/gfdrr/files/publication/GFDRR_India_
PDNA_2010_EN.pdf
Give2Asia. 2016. Disaster Preparedness and Resiliency:
India. Retrieved from Give2Asia: http://www.
give2asia.org/disaster-preparedness-and-
resilience-india/
Harvey, M, Whetton P, McInnes K L, Cechet B,
McGregor J L, Nguyen K, Houghton N, Lester
C, Styles E, and Michael N. 2004. “Impact
of climate change on road infrastructure.
Austroads, Report no. AP-R243/04.” Austroads
and the Bureau of Transport and Regional
Economics, Sydney.Impacts of Climate Change
on Transport and Adaptation in Asia (PDF
Download Available). Available from: https://
www.researchgate.net/publication/228888356_
Impacts_of_Climate_Change_on_Transport_
and_Adaptation_in_Asia (accessed September
11, 2017).
INCKAH Infrastructure technologies for road
operation and maintenance. n.d. Slurry
Seal. Retrieved July 21, 2017, from Inckah
Maintenance. Conservation. Innovation: http://
inckah.com/our-services/slurry-seal-2/
Indian Network for Climate Change Assessment
(INCCA). (2010). Climate Change and India: A
4×4 Assessment: A Sectoral and Regional Analysis
for 2030s. New Delhi: Government of India.
Indian Roads Congress (IRC). 2017. Annual Report
2015-16. New Delhi: IRC.
Intergovernmental Panel on Climate Change (IPCC).
2012. Managing the Risks of Extreme Events and
Disasters to Advance Climate Change Adaptation.
Intergovernmental Panel on Climate Change. 2014.
Climate Change 2014: Synthesis Report.
Kinnaur, D D. 2012. District Disaster Management
Plan Kinnaur.
Krishna Kumar, K, Patwardhan, S K, Kulkarni, A,
Kamala, K, and Koteswara Rao. 2011. Simulated
projections for summer monsoon climate over
India. Current Science, 312–326.
National Cooperative Highway Research Program.
n.d. Climate Change, Extreme Weather Events
and the Highway System: A Practitioner’s Guide.

99
References
NDMA,GoI. 2016. Hazard, Risk and Vulnerability.
Retrieved January 2017, from National Disaster
Management Authority, Government of India:
http://www.ndma.gov.in/en/vulnerability-
profile.html
NIDM, GoI. 2012. Retrieved from National Institute
of Disaster Managment: http://nidm.gov.in/
PDF/pubs/India%20Disaster%20Report%20
2012.pdf.
Maccaferri India. 2015. CH-CP-IN-Extension of
existing Breakwater, Construction of Beach
protection bund and Groyne using Geotextile
Tubes, Petronet, Kochi. Retrieved July 2017,
from Maccaferri India: https://www.maccaferri.
com/in/download/ch-cp-extension-existing-
breakwater-construction-beach-protection-
bund-groyne-using-geotextile-tubes-petronet-
kochi-rev01-july15/.
Mukherjee, S, and Gaurang, V. 2013. Exploring Fly
Ash Utilization in Construction of Highways
in India. IOSR Journal of Mechanical and Civil
Engineering 8(4): 23–32.
Koteswara Rao K, Patwardhan, S K, Kulkarni, A,
Kamala, K, Sabade, S S, Krishna Kumar, K
2013. Projected changes in mean and extreme
precipitation indices over India. Global and
Planetary Change 113: 77–90.
Pacific Region Infrastructure Facility. 2013.
Infrastructure Maintenance in the Pacific.
Public Works Department, Himachal Pradesh. 2013.
Loss and Damages on Highways in Monsoons.
Regmi, Madan B and Hanaoka, Shinya. 2009. Impacts
of Climate Change on Transport and Adaptation
in Asia. Proceedings of the Eastern Asia Society
for Transportation Studies.
Revenue & Disaster Management Department,
Government of Himachal Pradesh. 2016.
Hazard, Vulnerability and Risk Assessment
(HVRA) Himachal Pradesh.
Roychowdhury, D. 2015. Construction of disaster
resilient roads in land slide prone areas.
Singh, N T. 2016. Rock fall mitigation measures for hill
roads. IIT Bombay.
Techfab India. n.d. Subsurface Drainage With
Geosynthetic For Separation, Filtration &
Drainage. Retrieved July 21, 2017, from
Techfab India: https://www.techfabindia.com/
case_studies/Subsurface-Drainage-With-
Geosynthetic-For-Separation-Filtration-&-
Drainage.php
TERI. 2013. Risk Assessment and Review of Prevailing
Laws, Standards, Policies and Programmes
to Climate Proof Cities: Synthesis Report for
Guwahati. New Delhi: TERI.
TERI. 2014. Planning Climate Resilient Coastal Cities:
Learnings from Panaji and Visakhapatnam,
India. New Delhi: TERI.
TERI. 2015. Climate Resilient Green Growth Strategies
for Himachal Pradesh. New Delhi: TERI.
The Economic Times. 2014. Hudhud effect: Road link
between Koraput and Andhra Pradesh restored.
The Economic Times. 2015. Cyclone Hudhud caused
$ 11 billion worth of losses: UN. Retrieved
from The Economic Times: http://articles.
economictimes.indiatimes.com/2015-02-26/
news/59541541_1_natural-disasters-asia-
pacific-region-cyclone-hudhud
The Indian Roads Congress. 1998, July. IRC:SP-48-
1998-Hill Road Manual.
The Indian Roads Congress. 2011. IRC
56-2011-Recommended Practices for Treatment
of Embankment and Roadside Slopes for
Erosion Control.
The United Nations Office for Disaster Risk Reduction
(UNISDR). 2015. Climate Change Adaptation.
Retrieved February 5, 2016, from The United
Nations Office for Disaster Risk Reduction
(UNISDR): https://www.unisdr.org/we/
advocate/climate-change.
Tighe, Susan, Smith, James, Mills, Brian, and Andrey,
Jean. 2008. Evaluating Climate Change Impacts
on Low-Volume Roads in Southern Canada.
Transportation Research Record: Journal of the
Transportation Research Board. Vol. 2053.
UK Climate Impacts Program. 2007. Identifying
adaptation options.

100
Reducing Carbon Footprint and Enhancing Climate Resilience of National Highways in India
U.S. Department of Transportation. 2012. Climate
Change and Extreme Weather Vulnerability
Assessment Framework.
U.S. Department of Transportation, Federal Highway
Administration. 2016, February 17. Virtual
Framework for Vulnerability Assessment.
Retrieved February 2016, from Climate
Adaptation: https://www.fhwa.dot.gov/
environment/climate_change/adaptation/
adaptat ion_framework/modules/ index.
cfm?moduleid=2
U.S. Department of Transportation,Federal
Highway Administration. 2015. U.S. DOT
Gulf Coast Study, Phase 2. Retrieved from
U.S. Department of Transportation, Federal
Highway Administration: http://www.fhwa.dot.
gov/environment/climate_change/adaptation/
case_studies/gulf_coast_study/engineering_
and_tasks/case12.cfm
United Nations Development Programme (UNDP).
2011. Paving the way for climate resilient
infrastructure.
United Nations Framework Convention on Climate
Change. 2011. Assessing the Costs and Benefits of
Adaptation Options: An Overview of Approaches.
UNISDR. 2017, February. Terminology. Retrieved July
2017, from United Nations Office for Disaster
Risk Reduction: https://www.unisdr.org/we/
inform/terminology
USAID. 2014. Climate-Resilient Development: A
framework for understanding and addressing
climate change .
Wilson, Scott. 2008. The 3 Countries Alliance
Partnership (3CAP):The Effect of Climate
Change on 3CAP’s Highway Network Policies
and Standards. London, United Kingdom: Scott
Wilson.
World Bank. 2010a. Economics of Adaptation to Climate
Change. Washington D.C.: The World Bank.
World Bank. 2010b. Making Transport Climate Resilient:
Country Report Mozambique. Washington D.C.:
The World Bank.
World Bank. 2013. Integrating Climate and Disaster
Risk into Development. Washington D.C.: The
World Bank.
World Bank. 2015. Moving Towards Climate Resilient
Transport . Washington D.C.: The World Bank.
World Bank. 2017. Prioritizing Climate Resilient
Transport Investments in a Data-Scarce
Environment: A Practitioners’ Guide. Washington
D.C.: The World Bank.

101
7Annexures
Annexure 1 – Data Checklist
General
Number of districts (with population) which the
highway passes through
District Total Population and density
Climate Information
Data Source
Temperature (Maximum and
minimum ): Daily (for the past 20-30
years)
Indian
Meteorological
Centre (IMD),
Regional
Meteorological
Centre (RMC)
Rainfall/precipitation: Daily (past
20-30 years)
Other Precipitation-Snow
Wind speed Daily: last 5 years
Highest 24-hourly rainfall: last 20-30
years
Temperature extremes: last 20-30
years
Past Flood incidences : last 20-30
years
National
Disaster
Management
Authority /
State Disaster
Management
Authority/ NHAI
Past history of extreme events and
natural disasters: last 20-30 years
Damage caused during extreme
events
Cost incurred to rebuild and
renovate post the extreme event/
disaster
MoRTH, NHAI
Traffic Operations and volume
Data Source
Annual Average daily traffic (AADT) in
PCUs- differentiated by vehicle categories.
For the last 5 years
Peak traffic period of the year (monthly
data)
Peak traffic recorded (in PCUs) during the
peak period (specify in terms of Average
Daily Traffic)
Number of accidents - For the last 5 years
Fatalities due to accidents - For the last 5
years
Highway Characteristics
Data Source
Highway infrastructure assets - Location
and condition of the various elements of
infrastructure that comprise the highway
network
1. Street lights – numbers and distance
2. Storm water drainage system – type
3. Safety barriers and their types
4. Trees/ Vegetation – type and numbers

102
Reducing Carbon Footprint and Enhancing Climate Resilience of National Highways in India
Questionnaire:
1. Locational attributes
Does this highway connect any of the below option (tick appropriate)
Ports Industries Power Plants
Airports High density settlements
Does this highway pass through any protected or ecologically sensitive areas? ( tick appropriate)
Biodiversity Parks Wildlife Sanctuary National Parks
Wetlands Mangroves Backwaters
Beaches Forest Others ( Specify)………….
Does this highway pass through any hazardous areas/ industries? (tick appropriate)
Thermal Power Plants Nuclear Plants Other Hazardous Industries
Others ( Specify)………….
Are any vulnerable settlements or groups located along the Highway? (tick appropriate)
Slums Unauthorized settlements Housing colonies
Hospitals Other Vulnerable population
P Is this stretch a part of any evacuation route or part of the disaster relief and recovery plan?
P In case of traffic disruption of this highway, which alternative route is used?
II. Climate vulnerability
P What is the history of past extreme events/disasters and disruptions ( for past 5 years)?
Year Events (Flood
Incidences,
landslides,
extreme events,
etc.)
Duration of
Disruption
Damage to highway Accidents Remarks
From To Type of
damage
Monetary
terms (Rs)
Number of
accidents
Fatalities
in these
accidents
What are the impacts this highway faces due to high temperature? ( tick appropriate)
Rutting and shoving of
pavements
Heaving at joints of the
pavements
Cracking of pavements
Safety and health impacts Heat stress affecting traffic
operation
Rapid growth of the
Roadside vegetation, hence increased maintenance
Others (Specify)………….

103
Annexures
P Does the highway segment face any specific impacts such as rutting and shoving of pavements, heaving
at joints of the pavements, cracking of pavements, etc., with increase in temperature? If yes, specify the
temperature and the kind of impacts faced?
What are the impacts this highway faces due to heavy rainfall/ precipitation/ flooding? ( tick appropriate)
Erosion and subsidence
of paved roads.
Leaking of rain-water under the
pavement and damaging the pavement.
Flooding due to lack of maintenance
and capacity of drainage system
Landslides/Landslips Accidents Tree damage
Others (Specify)………….
P Does the highway segment face any specific impacts such as erosion and subsidence of paved roads, leaking
of rain-water under the pavement and damaging of pavements, flooding due to lack of capacity of drainage
system, etc. due to extreme rainfall? If yes, specify the rainfall range and the kind of impacts faced?
What are the impacts this highway faces face due to high winds? ( tick appropriate)
Debris from destruction clogs drainage. Trees damage, Accidents due to low visibility
Buildings and other roadside infrastructure
P Any other issues the highway encounters due to climate related events.
P Is the highway performance as expected under current climatic conditions and design assumptions?
P If no, what are the shortfalls?
P What should be the adaption options in order to counter the shortfalls?
P Is there a plan in place to deal with in the occurrence of extreme events e.g.: alternative route, evacuation
routes, etc.?
III. Design Characteristics and Others
P Are any temperature thresholds considered while designing the pavement? If yes the rationale behind using
the threshold?
P Are any rainfall/precipitation thresholds considered while designing the pavement? If yes the rationale
behind using the threshold?
P What other climatic parameters are considered while designing the pavement and what is the rationale
behind using these parameters?
P What are the climatic parameters taken into consideration while designing the storm water drainages?
P What materials are used for constructing the highways/pavements? ( impervious/pervious)
P What are the measures in place that look at the maintenance of the highway assets
• Storm water Drainage
• Street lights
• Roadside vegetation
• Safety barriers
• Others

104
Reducing Carbon Footprint and Enhancing Climate Resilience of National Highways in India
Annexure 2 – Past climate analysis for demonstration stretches
Shimla-Moorang
Shimla Station
Total rainfall
The annual mean of total monthly rainfall for the
29 year (1986-2015) period shows a slight increase
over station of Shimla which may not be significant.
However, as seen from the Graph 1 the rainfall over
the station is highly variable especially during the
recent 10 years in the past.
Graph 1: Shimla annual mean of total monthly rainfall
Graph 3: Shimla summer rainfall
Graph 4: Shimla monsoon rainfall
Seasonal Rainfall Trends
The seasonal rainfall trends over Shimla shows
that the summer (March, April & May) rainfall
over the station has decreased in the last 29 years
of analysed dataset. However, the monsoonal
(June, July, Aug & Sept) rainfall over the station
shows an increase with winter (December, Jan &
Feb) not showing any trend. Hence for Shimla,
monsoon rainfall is contributing the most
towards the increasing trend of annual mean
rainfall. It may be noted that the seasonal rainfall
for a particular year is defined as the sum total
rainfall amount received for those months in that
year. For calculating seasonal amount for winter
months of a particular year, the January and
Feb contributions from the next year have been
considered.
Annual rainfall anomaly
The annual rainfall anomaly over Shimla also shows
a highly variable rainfall with alternate negative and
positive anomalies during the entire dataset. No clear
trends can be seen over the rainfall in recent years.
Graph 2: Shimla annual rainfall anomaly
Rainfall Extreme
The maximum rainfall received in a day over Shimla
also shows an increase trend in the past 29 yrs (1986-
2015). Over 80% of all maximum daily rainfall
recorded over Shimla falls in the Heavy Rainfall (HR)

105
Annexures
category with one event in Sept 2008 falling in the Very
Heavy Rainfall (VHR) event category22 It may be also
be noted that in the past 30 years, more than 85% of
these daily maximum rainfall events have occurred in
monsoon season.
Thunderstorms
Summer and monsoon seasons experiences relatively
higher thunderstorm days as compared to other
seasons. Hence, further analysis was carried out for
these two seasons which shows an increasing trend
22 (IMD definition: http://www.imdpune.gov.in/weather_forecasting/
glossary.pdf).
Graph 5: Shimla winter rainfall
Graph 6: Shimla maximum rainfall
Graph 7: Shimla seasonal thunderstorm days
of growing thunderstorm days during the monsoon
season as compared to the summer season for the
Shimla station.
The total thunderstorm days in a year for Shimla also
show an increasing trend for the 30 year data analysed.
Hence, from the analysis above, it can be deduced
that monsoon season in Shimla has seen not only
an increase in rainfall amounts but also increase in
extreme events and thunderstorm days as compared
to other seasons.
Graph 8: Shimla seasonal thunderstorm days
Rampur Station
Total rainfall
The total rainfall over Rampur from 1986–2015 shows
a slight increase in the past 29 year climate period.
Although the increase may not be significant but the
past 10 years have shown an increase relative to the
late 90s to early 2000s period.
Rainfall (total) anomaly
The yearly total rainfall anomaly over Rampur shows
positive anomalies from long term mean for the recent
Graph 9: Shimla total thunderstorm days in a year

106
Reducing Carbon Footprint and Enhancing Climate Resilience of National Highways in India
years relative to the 1999–2005 period. This may be
responsible for an increasing trend seen in the rainfall
over the past 29 year data period.
Seasonal Rainfall Trends
The seasonal rainfall trends over Rampur show that
although the summer (March, April, and May)
rainfall seems to be decreasing in the past 29 years,
the monsoon (June, July, August, and September)
and winter (December, January & February) rainfall
shows an increase for the same period with monsoon
rainfall showing a relatively higher increase. It may be
noted that the seasonal rainfall for a particular year
is defined as the sum total rainfall amount received
for those months in that year. For winter months, the
contribution for the months of January and February
in the next year are considered in the winter months
of the previous year.
Rainfall Extreme
The maximum rainfall received in a day over Rampur
also shows an increase based on the analysis of the
data for the past 29 years. It is also seen that approx.
Graph 10: Rampur total rainfall
Graph 12: Rampur summer rainfall (total)
Graph 13: Rampur monsoon rainfall (total)
Graph 14: Rampur winter rainfall (total)
Graph 11: Rampur total yearly rainfall anomaly
48% (14 out of 29) of these maximum rainfall events
lie under the Heavy Rainfall (HR) events.23 Also, two
events are seen to be Very Heavy Rainfall (VHR)
events. It may be noted here that out of the past 29
years, the recent 10 years show higher number of VHR
events. Most of the events (22 out of 29 analysed) have
occurred in the monsoon.
23 (IMD definition: http://www.imdpune.gov.in/weather_forecasting/
glossary.pdf).

107
Annexures
Graph 15: Rampur maximum rainfall event
Kalpa Station
Total rainfall
The annual mean of total monthly rainfall over Kalpa
station shows a high variability in the 1986–2015 time
period. As seen from Graph 16, the annual rainfall
does not follow any clear trend for the time period
analysed.
Graph 16: Kalpa annual mean of total monthly rainfall
The rainfall anomaly show more negative anomalies as
compared to the positive ones. However, the positive
anomalies are larger in comparison to the negative
anomalies which shows that although the annual
rainfall has been lesser than the long-term mean for
the 1986–2015 period, the cases where the rainfall
have exceeded the long-term normal, have been a
large deviation.
Seasonal Rainfall Trends
Unlike the case of Shimla and Rampur where monsoon
rainfall seems to have the largest contribution towards
the annual rainfall component, Kalpa’s seasonal
rainfall does not show any similar dominance from
any of the individual seasons (Graph 18). Although
the trends in the summer rainfall shows a decrease in
Graph 17: Kalpa annual rainfall anomaly
contrast to the other two seasons, viz. monsoon and
winter that shows an increasing trend, the summer
rainfall has a relatively higher contribution towards
the annual total rainfall as compared to the other two
seasons (Graph 18).
Rainfall Extreme
Although the overall trend in maximum 24-hourly
daily rainfall over Kalpa shows a decreasing trend
Graph 18: Kalpa seasonal total rainfall
Graph 19: Kalpa summer rainfall (total)

108
Reducing Carbon Footprint and Enhancing Climate Resilience of National Highways in India
Graph 21: Kalpa winter rainfall (total)
Graph 20: Kalpa monsoon rainfall (total)
over the 1986–2015 time period, the individual events
occurring over the station have higher intensity than
Shimla and Rampur. For Kalpa, the data shows 8
HR events, 3 VHR events, and 2 Extremely Heavy
Rain (EHR) events. The EHR24 events are not seen
over Shimla and Rampur datasets. Also, the summer
season shows a relatively higher number of maximum
24-hourly rain events in case of Kalpa, as compared to
the stations of Rampur and Shimla.
Thunderstorms
As seen in Graph 24 summer and monsoon seasons
experience relatively higher thunderstorm days as
compared to other seasons. Hence, further analysis
was carried out for these two seasons which shows a
slight decreasing trend of thunderstorm days in the
past 30 years. Also, it is seen that unlike Shimla station,
the summer season at Kalpa shows higher number of
thunderstorm days as compared to monsoon season.
24 IMD definition: http://www.imdpune.gov.in/weather_forecasting/
glossary.pdf)
Graph 22: Kalpa maximum rainfall
Kathipudi–Ongole
Kakinada Station
Total Annual Rainfall
The total rainfall over Kakinada shows a slight
decreasing trend for the 29-year rainfall dataset
analysed (1980–2009). The annual rainfall variability
is also seen over the station with a very high value
seen for the year 1990 which is also the year of cyclone
activity over the coast. Barring the high value seen
for 1990, most of the years show a lower than normal
rainfall over the station.
Graph 23: Kalpa seasonal thunderstorm days
Graph 24: Kalpa thunderstorm days (seasonal)

109
Annexures
Seasonal Total Rainfall
Monsoon and post monsoon seasons show a larger
contribution towards the total rainfall over the station.
The high value in 1990 corresponds to the cyclonic
activity seen in the month of May.
Annual Maximum Rainfall
Despite the decreasing rainfall trend over the station,
Graph 25: Kakinada annual mean of total monthly rainfall
Graph 26: Kakinada annual rainfall anomaly
Graph 27: Kakinada seasonal total rainfall
the maximum rainfall is seen to increase in the 29 year
data of the station. Also, most of the high rainfall events
in a day are seen in monsoon and post monsoon seasons
over the station, barring the highest maximum rainfall
in a day event in 1990 which was seen in summer season.
The station also witnessed in total, four events in EHR
event category of IMD which is the largest amongst all
the station data analysed for this study.
Wind speeds
The winter season witnesses relatively higher wind
speeds, followed by monsoon season for Kakinada
station. Post-monsoon and winter seasons have seen
higher wind speeds for most of the years in the 29 year
time period. However, the latter part of the analysed
dataset, especially 2000 onwards have witnessed
monsoon season having higher wind speeds over the
station.
Machilipatnam station
Total Annual Rainfall
The annual mean of total monthly rainfall over
Graph 28: Kakinada Annual Maximum Rainfall
Graph 29: Kakinada monthly climatology of average winds

110
Reducing Carbon Footprint and Enhancing Climate Resilience of National Highways in India
Machilipatnam station show a high variability over
the entire 1980–2009 time period of available data.
As seen from Graph 31, the annual rainfall shows a
very slight increasing trend over the entire time period
analysed.
The rainfall anomaly also shows a large variability of
rainfall over the station. Although the total rainfall
over the entire 29 year time period shows a slight
increasing trend, the initial and the latter part of the
data shows more negative anomalies, i.e. years having
lower than normal rainfall.
Graph 30: Kakinada seasonal average wind speeds
Graph 31: Machilipatnam annual mean of total monthly rainfall
Graph 32: Machilipatnam annual rainfall anomaly
Seasonal Total Rainfall
Monsoon and post-monsoon total rainfall together
contribute the largest towards the annual rainfall
component with post monsoon providing the highest
contribution over the Machilipatnam station.
Annual Maximum Rainfall
The heaviest 24 hourly rainfall over the station shows
an increasing trend with most of the events seen under
VH and HR event category of IMD (see - http://www.
imdpune.gov.in/weather_forecasting/glossary.pdf).
Most of these heavy and VH rainfall events are seen
during the monsoon and post-monsoon seasons.
Wind speeds
As seen in Graph 35, relatively high wind speeds over
Machilipatnam occur during summer and monsoon
months of April, May, and June. In the past 30 years, it
is seen that the average seasonal wind speeds over the
station have slightly decreased, although the variability
is quite high. The summer and monsoon months have
Graph 33: Machilipatnam seasonal total rainfall
Graph 34: Machilipatnam annual maximum rainfall

111
Annexures
Graph 35: Machilipatnam monthly climatology of average winds
Graph 36: Machilipatnam seasonal average wind speeds
also shown relatively higher wind speeds than other
months in the past 30 years.
Narsapur station
Total Annual Rainfall
The annual mean of total monthly rainfall over
Narsapur analysed using the dataset available for the
1988–2009 time period shows a decreasing rainfall
trend over the 21 year time period.
Most of the decreasing trend on total rainfall seen over
the station is primarily due to the negative anomalies,
i.e. lower than normal rainfall seen over the later years
from 1999 onwards till 2009. This is clearly seen in
the anomaly plot above where red shows the negative
anomalies and blue shows the positive anomalies.
Seasonal Total Rainfall
During monsoon and post-monsoon, total rainfall
together contributes the largest towards the annual
Graph 37: Narsapur annual mean of total monthly rainfall
Graph 38: Narsapur annual rainfall anomaly
rainfall component over the Narsapur station. All the
seasons show a decreasing trend similar to the annual
total rainfall trends over the station.
Annual Maximum Rainfall
The maximum 24-hourly daily rainfall over Narsapur
also shows a decreasing trend for the available data
of 1988–2009. Most of the individual maximum
24-hourly rain events occurring over the station have
high intensity and fall within the heavy rainfall event
category as per IMD definition.25 Although two events
in the given data time period had recorded extremely
heavy rain events (for 1989 and 1992) and one event of
1994 recording under VHR event, most of the heaviest
25 http://www.imdpune.gov.in/weather_forecasting/glossary.pdf
Graph 39: Narsapur seasonal total rainfall

112
Reducing Carbon Footprint and Enhancing Climate Resilience of National Highways in India
rain 24 hourly events fall within the heavy rainfall
category of IMD. Also, most of the heavy rainfall
events for the station are seen for monsoon and post-
monsoon seasons over the station.
Wind speeds
As seen below, relatively high wind speeds over
Narsapur occur in the monsoon months of June, July,
and August as well as in November and December. In
the past 21 years of analysed data, it is seen that the
average seasonal wind speeds over the station have
slightly decreased although the variability is quite
high. The monsoon months show relatively higher
wind speeds than other months over the station.
Tuni Station
Only 13 years of data (1996–2009) was available for
the station which also had few data gaps, hence the
time length of the dataset is not sufficient to draw
conclusive information on climate information for the
station.
Graph 40: Narsapur annual maximum rainfall
Graph 41: Narsapur monthly climatology of average winds
Graph 42: Narsapur seasonal average wind speeds
Total Rainfall
The rainfall for the 13-years of analysed dataset shows
a decreasing trend over the station, although the
variability is seen to be high.
Data over the past few years shows a higher than
normal rainfall over the station but most of the years
in the available data depicts negative anomalies, i.e.
lower than normal rainfall for the station.
Graph 43: Tuni annual mean of total monthly rainfall
Graph 44: Tuni annual rainfall anomaly

113
Annexures
Seasonal Total Rainfall
Monsoon and post-monsoon have the largest share
towards the total rainfall component over the station.
Annual Maximum Rainfall
The maximum 24-hourly rainfall also shows a
decreasing trend over the station but the 13 year
data is insufficient to clearly depict this as climate
information over the station.
Bapatla station
Graph 45: Tuni seasonal total rainfall
Graph 46: Tuni annual maximum rainfall
rainfall variability. It is also seen that barring few
years, viz. 1980, 1982, 2009 where the negative
anomalies have been large, i.e. larger deviation from
long-term normal rainfall that signified poor annual
rainfall, the magnitude of the negative anomalies have
been smaller than the positive ones. This shows that
although the rainfall does not follow any long-term
trend, the magnitude of good rainfall years have been
larger than those of bad monsoon years.
Graph 47: Bapatla annual mean of total monthly rainfall
Total Annual Rainfall
The annual mean of total monthly rainfall over
Bapatla station show a high variability over the entire
1980–2009 time period of available data. As seen from
Graph 47, the annual rainfall shows a slight increasing
trend over the entire time period analysed.
The rainfall anomaly shows relatively higher number
of positive anomalies as compared to negative ones
for the stations although the share of both is nearly
equal. This signifies that the station depicts high
Graph 48: Bapatla annual rainfall anomaly
Seasonal Total Rainfall
Monsoon and post-monsoon total rainfall together
contributes the largest towards the annual rainfall
component over the Bapatla station. Barring winter
season, all the other seasons show an increasing trend
in rainfall similar to the annual increasing trend. The
rainfall variability is seen to be high for all the seasons.
Annual Maximum Rainfall
The maximum 24-hourly daily rainfall over Bapatla
shows an increasing trend for the available data
of 1980–2009. Most of the individual maximum
24-hourly rain events occurring over the station have

114
Reducing Carbon Footprint and Enhancing Climate Resilience of National Highways in India
high intensity. The data shows 20 HR events and 8
VHR events as per IMD definition of rainfall events.26
Also, most of the heavy rainfall events are seen for
monsoon and post-monsoon seasons over the station.
Wind speeds
As seen in Graph 51, relatively high wind speeds over
Bapatla occur in the summer and monsoon months
of April, May, and June. In the past 30 years, it is seen
that the average seasonal wind speeds over the station
have slightly decreased although the variability is
quite high. The summer and monsoon months have
also shown relatively higher wind speeds than other
months in the past 30 years.
Ongole Station
Total Annual Rainfall
The annual mean of total monthly rainfall over Ongole
station shows a high variability over the entire 1980–
2009 time period of available data. As seen from Graph
53, the annual rainfall shows a very slight decreasing
trend over the entire time period analysed.
The rainfall anomaly shows relatively higher number
of negative anomalies as compared to positive
anomalies, thereby signifying that lower than normal
rainfall years have exceeded in number over the higher
than normal rainfall years for the Ongole station.
However, the rainfall during the years 1990 and 1997
have had very high positive anomalies, which neither
of the negative anomalies has witnessed in the entire
analysed dataset. Of the entire 29 years of analysed
dataset, the trend of occurrence of negative anomalies
has been seen during the latter part of the dataset.
26 http://www.imdpune.gov.in/weather_forecasting/glossary.pdf
Graph 49: Bapatla seasonal total rainfallGraph 50: Bapatla annual maximum rainfall
Graph 51: Bapatla monthly climatology of average winds
Graph 52: Bapatla seasonal average wind speeds
Seasonal Total Rainfall
Monsoon and post-monsoon total rainfall together
contributes the largest towards the annual rainfall
component as well as towards the negative trends of
annual rainfall over the Ongole station. The summer
and winter seasonal rainfall does not exhibit any
significant trend in total rainfall.

115
Annexures
Graph 53: Ongole annual mean of total monthly rainfall
Graph 54: Ongole annual rainfall anomaly
Annual Maximum Rainfall
Although similar to total rainfall and seasonal rainfall
trend, the heaviest rainfall in 24 hours also exhibit
negative trend for the Ongole station, but the station
shows many events under the VHR event category
apart from the two events in the year 1990 and 1997
falling under the EHR category of IMD. Also, most of
the heavy rainfall events are seen for post-monsoon
season over the station.
Wind speeds
As seen below, relatively high wind speeds over
Graph 55: Ongole seasonal total rainfall
Ongole occur in the monsoon months of June, July,
and August. In the past 30 years, it is seen that the
average seasonal wind speeds over the station have
slightly decreased although the variability is quite
high with monsoon showing the highest value of wind
speeds followed by summer season.
Graph 56: Ongole annual maximum rainfall
Graph 57: Ongole monthly climatology of average winds
Graph 58: Ongole seasonal average wind speed

Pa
st c
ycl
on
ic e
ve
nts
aff
ect
ing
NH
21
6 (
19
90
–2
01
5)
Se
ria
l Nu
mb
er
of
syst
em
du
rin
g
yea
r
Ba
sin
of
ori
gin
Na
me
Da
te(D
D/M
M/
YY
YY
)
Tim
e
(UTC
)
La
titu
de
(la
t)
Lon
gi-
tud
e
(Lo
ng
)
CI N
o [
or
“T. N
o”]
Est
ima
ted
Ce
ntr
al P
res-
sure
(h
Pa
) [o
r
“E.C
.P”]
Ma
xim
um
Su
sta
ine
d
Su
rfa
ce W
ind
(kt)
G
rad
e
1B
OB
LA
ILA
17
/05
/20
10
06
00
10
.50
88
.50
1.5
10
04
25
D
1B
OB
LA
ILA
17
/05
/20
10
12
00
11
88
2.0
10
00
30
DD
1B
OB
LA
ILA
17
/05
/20
10
18
00
11
.50
87
.50
2.0
99
83
0D
D
1B
OB
LA
ILA
18
/05
/20
10
00
00
11
.50
86
.50
2.5
99
83
5C
S
1B
OB
LA
ILA
18
/05
/20
10
03
00
12
85
.50
2.5
99
64
0C
S
1B
OB
LA
ILA
18
/05
/20
10
06
00
12
.50
84
.50
3.0
99
24
5C
S
1B
OB
LA
ILA
18
/05
/20
10
09
00
13
84
3.0
99
24
5C
S
1B
OB
LA
ILA
18
/05
/20
10
12
00
13
83
.50
3.0
99
04
5C
S
1B
OB
LA
ILA
18
/05
/20
10
15
00
13
83
3.0
99
04
5C
S
1B
OB
LA
ILA
18
/05
/20
10
18
00
13
82
.50
3.0
99
04
5C
S
1B
OB
LA
ILA
18
/05
/20
10
21
00
13
82
3.0
99
04
5C
S
1B
OB
LA
ILA
19
/05
/20
10
00
00
13
.50
82
3.0
99
04
5C
S
1B
OB
LA
ILA
19
/05
/20
10
03
00
13
.50
82
3.0
99
04
5C
S
1B
OB
LA
ILA
19
/05
/20
10
06
00
13
.50
81
.50
3.5
98
65
5S
CS
1B
OB
LA
ILA
19
/05
/20
10
09
00
14
81
.50
3.5
98
65
5S
CS
1B
OB
LA
ILA
19
/05
/20
10
12
00
14
81
.50
3.5
98
65
5S
CS
1B
OB
LA
ILA
19
/05
/20
10
15
00
14
81
.50
3.5
98
65
5S
CS
1B
OB
LA
ILA
19
/05
/20
10
18
00
14
.50
81
3.5
98
65
5S
CS
1B
OB
LA
ILA
19
/05
/20
10
21
00
14
.50
81
3.5
98
65
5S
CS
1B
OB
LA
ILA
20
/05
/20
10
00
00
15
81
3.5
98
65
5S
CS
1B
OB
LA
ILA
20
/05
/20
10
03
00
15
.50
80
.50
3.5
98
65
5S
CS
1B
OB
LA
ILA
20
/05
/20
10
06
00
15
.70
80
.50
3.5
98
65
5S
CS
1B
OB
LA
ILA
20
/05
/20
10
09
00
15
.80
80
.50
3.5
98
65
5S
CS
1B
OB
LA
ILA
20
/05
/20
10
12
00
16
80
.50
-9
90
45
CS
1B
OB
LA
ILA
20
/05
/20
10
15
00
16
80
.50
-9
90
45
CS

1B
OB
LA
ILA
20
/05
/20
10
18
00
16
80
.50
-9
90
45
CS
1B
OB
LA
ILA
20
/05
/20
10
21
00
16
80
.70
-9
90
40
CS
1B
OB
LA
ILA
21
/05
/20
10
00
00
16
.20
80
.80
-9
90
35
CS
1B
OB
LA
ILA
21
/05
/20
10
03
00
16
.50
81
-9
95
30
DD
1B
OB
LA
ILA
21
/05
/20
10
06
00
17
81
.50
-9
99
20
D
04
BO
B--
07
/10
/20
10
03
00
16
.50
84
.50
1.5
99
82
5D
04
BO
B--
07
/10
/20
10
06
00
17
.50
84
.50
1.5
99
82
5D
04
BO
B--
07
/10
/20
10
12
00
18
.50
85
1.5
99
62
5D
04
BO
B--
07
/10
/20
10
18
00
19
85
.50
1.5
99
62
5D
04
BO
B--
08
/10
/20
10
00
00
20
86
.50
1.5
99
82
5D
04
BO
B--
08
/10
/20
10
03
00
21
87
.50
1.5
99
82
5D
04
BO
B--
08
/10
/20
10
06
00
22
89
1.5
99
82
5D
04
BO
B--
08
/10
/20
10
12
00
23
.50
90
.50
--1
00
02
5D
04
BO
B--
08
/10
/20
10
18
00
24
.50
91
--1
00
22
5D
05
BO
B--
13
/10
/20
10
06
00
17
.50
90
1.5
10
02
25
D
05
BO
B--
13
/10
/20
10
12
00
17
.50
89
1.5
99
82
5D
05
BO
B--
13
/10
/20
10
18
00
18
88
.50
1.5
99
82
5D
05
BO
B--
14
/10
/20
10
00
00
18
88
.50
1.5
99
82
5D
05
BO
B--
14
/10
/20
10
03
00
18
88
.50
1.5
99
82
5D
05
BO
B--
14
/10
/20
10
06
00
18
88
.50
1.5
99
82
5D
05
BO
B--
14
/10
/20
10
12
00
18
88
1.5
99
62
5D
05
BO
B--
14
/10
/20
10
18
00
18
88
1.5
99
62
5D
05
BO
B--
15
/10
/20
10
00
00
18
.50
87
.50
1.5
99
62
5D
05
BO
B--
15
/10
/20
10
03
00
19
87
2.0
99
63
0D
D
05
BO
B--
15
/10
/20
10
06
00
19
.50
86
2.0
99
63
0D
D
05
BO
B--
15
/10
/20
10
12
00
19
.50
85
.50
2.0
99
53
0D
D
05
BO
B--
15
/10
/20
10
18
00
19
84
.50
--9
96
30
DD
05
BO
B--
16
/10
/20
10
00
00
19
84
--9
98
25
D
06
BO
BG
IRI
20
/10
/20
10
12
00
17
.50
91
.50
1.5
10
02
25
D
06
BO
BG
IRI
20
/10
/20
10
18
00
17
.50
91
.50
1.5
10
02
25
D

118
Reducing Carbon Footprint and Enhancing Climate Resilience of National Highways in India
06
BO
BG
IRI
21
/10
/20
10
00
00
17
.50
91
.50
1.5
10
02
25
D
06
BO
BG
IRI
21
/10
/20
10
03
00
17
.50
91
.50
21
00
03
0D
D
06
BO
BG
IRI
21
/10
/20
10
06
00
17
.50
91
.50
2.5
99
83
5C
S
06
BO
BG
IRI
21
/10
/20
10
09
00
17
.50
91
.50
2.5
99
64
0C
S
06
BO
BG
IRI
21
/10
/20
10
12
00
18
92
.00
39
90
45
CS
06
BO
BG
IRI
21
/10
/20
10
15
00
18
92
.00
39
90
45
CS
06
BO
BG
IRI
21
/10
/20
10
18
00
18
92
.00
39
88
50
CS
06
BO
BG
IRI
21
/10
/20
10
21
00
18
.50
92
.50
39
84
55
CS
06
BO
BG
IRI
22
/10
/20
10
00
00
18
.50
92
.50
3.5
98
06
0S
CS
06
BO
BG
IRI
22
/10
/20
10
03
00
19
93
.00
4.5
97
48
0V
SC
S
06
BO
BG
IRI
22
/10
/20
10
06
00
19
93
.00
59
64
90
ES
CS
06
BO
BG
IRI
22
/10
/20
10
09
00
19
.50
93
.50
5.5
95
01
05
ES
CS
06
BO
BG
IRI
22
/10
/20
10
12
00
19
.80
93
.50
5.5
95
01
05
ES
CS
06
BO
BG
IRI
22
/10
/20
10
15
00
20
93
.50
--9
66
80
VS
CS
06
BO
BG
IRI
22
/10
/20
10
18
00
20
.50
94
.00
--9
76
70
VS
CS
06
BO
BG
IRI
22
/10
/20
10
21
00
20
.50
94
.00
--9
86
55
SC
S
06
BO
BG
IRI
23
/10
/20
10
00
00
21
94
.50
--9
92
45
CS
06
BO
BG
IRI
23
/10
/20
10
03
00
21
.50
95
.00
--9
96
35
CS
06
BO
BG
IRI
23
/10
/20
10
06
00
22
95
.50
--9
98
25
D
07
BO
BJA
L0
4/1
1/2
01
00
00
08
92
1.5
10
02
25
D
07
BO
BJA
L0
4/1
1/2
01
00
30
08
.50
91
1.5
10
02
25
D
07
BO
BJA
L0
4/1
1/2
01
00
60
08
.50
90
.50
1.5
10
02
25
D
07
BO
BJA
L0
4/1
1/2
01
01
20
08
.50
90
1.5
10
02
25
D
07
BO
BJA
L0
4/1
1/2
01
01
80
08
.50
89
.50
1.5
10
02
25
D
07
BO
BJA
L0
5/1
1/2
01
00
00
09
88
.50
2.0
10
00
30
DD
07
BO
BJA
L0
5/1
1/2
01
00
30
09
88
2.0
10
00
30
DD
07
BO
BJA
L0
5/1
1/2
01
00
60
09
87
.50
2.5
99
83
5C
S
07
BO
BJA
L0
5/1
1/2
01
00
90
09
87
.50
2.5
99
64
0C
S
07
BO
BJA
L0
5/1
1/2
01
01
20
09
.50
87
2.5
99
44
5C
S
07
BO
BJA
L0
5/1
1/2
01
01
50
09
.50
87
3.0
99
44
5C
S
07
BO
BJA
L0
5/1
1/2
01
01
80
01
08
6.5
03
.09
92
50
CS

119
Annexures
07
BO
BJA
L0
5/1
1/2
01
02
10
01
08
63
.59
90
55
SC
S
07
BO
BJA
L0
6/1
1/2
01
00
00
01
08
5.5
03
.59
90
55
SC
S
07
BO
BJA
L0
6/1
1/2
01
00
30
01
08
5.5
03
.59
90
55
SC
S
07
BO
BJA
L0
6/1
1/2
01
00
60
01
08
53
.59
90
55
SC
S
07
BO
BJA
L0
6/1
1/2
01
00
90
01
08
53
.59
90
55
SC
S
07
BO
BJA
L0
6/1
1/2
01
01
20
01
18
4.5
03
.59
88
60
SC
S
07
BO
BJA
L0
6/1
1/2
01
01
50
01
18
4.5
03
.59
88
60
SC
S
07
BO
BJA
L0
6/1
1/2
01
01
80
01
18
43
.59
88
60
SC
S
07
BO
BJA
L0
6/1
1/2
01
02
10
01
18
43
.59
88
60
SC
S
07
BO
BJA
L0
7/1
1/2
01
00
00
01
18
3.5
03
.59
88
60
SC
S
07
BO
BJA
L0
7/1
1/2
01
00
30
01
28
33
.59
90
55
SC
S
07
BO
BJA
L0
7/1
1/2
01
00
60
01
28
2.5
03
.09
92
45
CS
07
BO
BJA
L0
7/1
1/2
01
00
90
01
28
1.5
02
.59
94
40
CS
07
BO
BJA
L0
7/1
1/2
01
01
20
01
38
12
.09
96
30
DD
07
BO
BJA
L0
7/1
1/2
01
01
50
01
38
0.5
02
.09
98
30
DD
07
BO
BJA
L0
7/1
1/2
01
01
80
01
38
0--
10
00
30
DD
07
BO
BJA
L0
8/1
1/2
01
00
00
01
47
9--
10
02
25
D
07
BO
BJA
L0
8/1
1/2
01
00
30
01
57
8--
10
04
25
D
08
BO
B0
7/1
2/2
01
00
30
01
48
21
.51
00
02
5D
08
BO
B0
7/1
2/2
01
00
60
01
4.5
08
21
.51
00
02
5D
08
BO
B0
7/1
2/2
01
01
20
01
58
1.5
01
.51
00
02
5D
08
BO
B0
7/1
2/2
01
01
80
01
5.5
08
11
.51
00
02
5D
08
BO
B0
8/1
2/2
01
00
00
01
68
01
.51
00
02
0D

120
Reducing Carbon Footprint and Enhancing Climate Resilience of National Highways in India
Annexure 3—Stakeholder Consultations
Prior to the stakeholder interactions/interviews, a questionnaire was prepared which has been included in
Annexure 1. Based on this questionnaire, the comments were received from the different stakeholders. These
comments have been tabulated as follows.
Sl.
No. Name Designation Key comments
1 Mr Prasad Negi Executive
Engineer
Public Works
Department
(NH Division),
Himachal
Pradesh
• Discussions were held with Mr Negi regarding National Highways.
Key points are summarized below:
• National Highway 5 is the only route that links Shimla to the Indo-
Tibet border.
• The Ministry has initiated work on constructing a by-pass road to
address the issue of traffic disruption.
• In the year 2011–12, as per the figures from MoRTH, the monetary
losses due to floods were to the tune of `1,30,12,000.
• The impacts the Highway faces due to high temperature included
rutting and shoving of pavements, heaving at joints of pavements,
and cracking of pavements.
• The most prominent impact the Highway faces due to heavy
rainfall is erosion and subsidence of paved road. Three such events
were reported in July 2016 (the same month as this interaction
happened).
• The other impacts include infiltration of rainwater into the layers
below and thus, damaging the structural stability of the road, tree
damage, landslides and
landslips.
• Flooding of Highways due to lack of maintenance and insufficient
drainage capacity. It was also pointed out that the Highway
currently has kaccha and pakka drains.
• The impact the Highway faces mainly due to high winds is tree
damage.
• He opined that the performance of the Highway was not as
expected under the prevailing climatic conditions and design
assumptions.
• The functioning of the Highway is affected due to the limited
availability of funds for repair and maintenance, lack of machinery
suited for hilly terrain and common IRC being used for highway
construction on different terrains.
• He stated that the Ministry has proposed construction of a by-pass
road as an alternative route, as a measure to deal with extreme
events.
• In hilly regions, cloudbursts are a common occurrence. Also
landslides, especially during monsoons are common.
2 Mr Manas
Dwivedi
State Project
Officer, Himachal
Pradesh
State Disaster
Management
Authority
• Discussions were held with Mr Dwivedi regarding risks and hazards
related to National Highways. Key highlights of discussions are
summarized as follows:
• Landslides, flash floods, and cloudbursts are key climate risks in hilly
regions. Disaster risks due to these are likely to increase in future
with increasing rainfall variability.
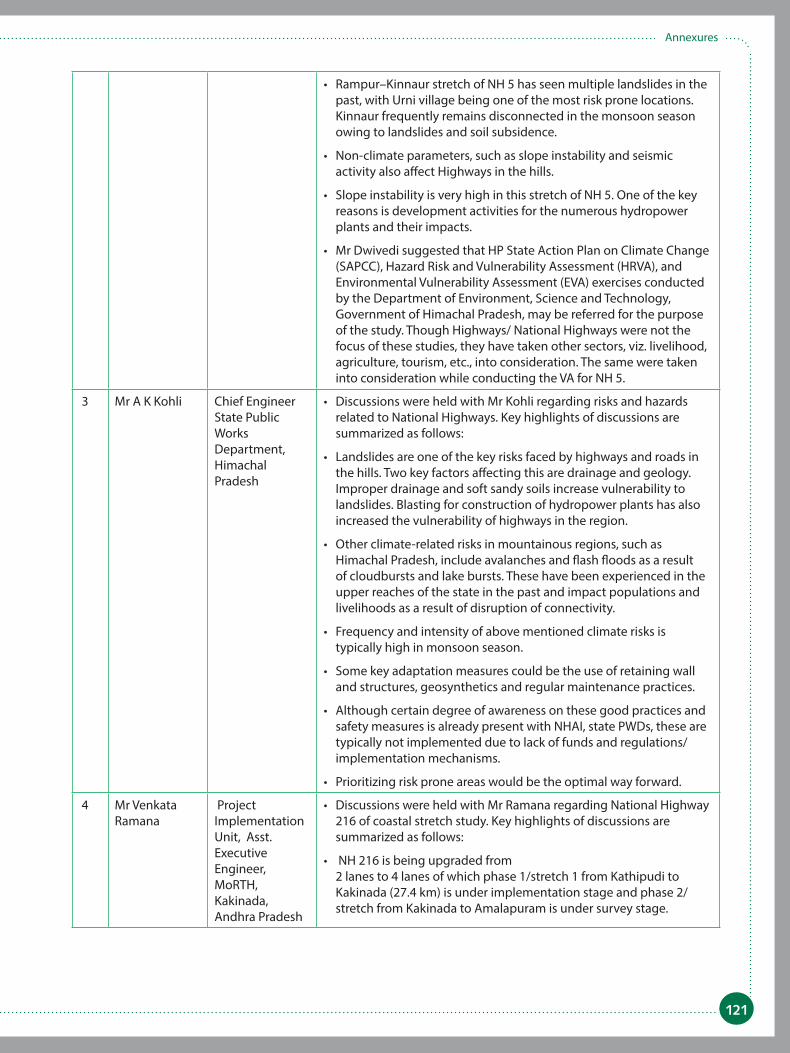
121
Annexures
• Rampur–Kinnaur stretch of NH 5 has seen multiple landslides in the
past, with Urni village being one of the most risk prone locations.
Kinnaur frequently remains disconnected in the monsoon season
owing to landslides and soil subsidence.
• Non-climate parameters, such as slope instability and seismic
activity also affect Highways in the hills.
• Slope instability is very high in this stretch of NH 5. One of the key
reasons is development activities for the numerous hydropower
plants and their impacts.
• Mr Dwivedi suggested that HP State Action Plan on Climate Change
(SAPCC), Hazard Risk and Vulnerability Assessment (HRVA), and
Environmental Vulnerability Assessment (EVA) exercises conducted
by the Department of Environment, Science and Technology,
Government of Himachal Pradesh, may be referred for the purpose
of the study. Though Highways/ National Highways were not the
focus of these studies, they have taken other sectors, viz. livelihood,
agriculture, tourism, etc., into consideration. The same were taken
into consideration while conducting the VA for NH 5.
3 Mr A K Kohli Chief Engineer
State Public
Works
Department,
Himachal
Pradesh
• Discussions were held with Mr Kohli regarding risks and hazards
related to National Highways. Key highlights of discussions are
summarized as follows:
• Landslides are one of the key risks faced by highways and roads in
the hills. Two key factors affecting this are drainage and geology.
Improper drainage and soft sandy soils increase vulnerability to
landslides. Blasting for construction of hydropower plants has also
increased the vulnerability of highways in the region.
• Other climate-related risks in mountainous regions, such as
Himachal Pradesh, include avalanches and flash floods as a result
of cloudbursts and lake bursts. These have been experienced in the
upper reaches of the state in the past and impact populations and
livelihoods as a result of disruption of connectivity.
• Frequency and intensity of above mentioned climate risks is
typically high in monsoon season.
• Some key adaptation measures could be the use of retaining wall
and structures, geosynthetics and regular maintenance practices.
• Although certain degree of awareness on these good practices and
safety measures is already present with NHAI, state PWDs, these are
typically not implemented due to lack of funds and regulations/
implementation mechanisms.
• Prioritizing risk prone areas would be the optimal way forward.
4 Mr Venkata
Ramana
Project
Implementation
Unit, Asst.
Executive
Engineer,
MoRTH,
Kakinada,
Andhra Pradesh
• Discussions were held with Mr Ramana regarding National Highway
216 of coastal stretch study. Key highlights of discussions are
summarized as follows:
• NH 216 is being upgraded from
2 lanes to 4 lanes of which phase 1/stretch 1 from Kathipudi to
Kakinada (27.4 km) is under implementation stage and phase 2/
stretch from Kakinada to Amalapuram is under survey stage.

122
Reducing Carbon Footprint and Enhancing Climate Resilience of National Highways in India
• During the upgradation from 2 lanes to 4 lanes, wherever widening
of roads was not possible due to the location of dense settlements,
by pass roads were constructed.
• Retaining walls have been used at locations where River Godavari is
in proximity to the Highway.
• 7,000 trees are to be replanted for stretch 1 and 3,000 trees for
stretch 2.
• In Kakinada, infrastructure, such as trunk water supply lines,
sewerage lines are maintained by the Municipality and not by
MoRTH/NHAI.
• The highway stretch closest to the coast is located about 2 km from
the coast.
• Spun concrete electric poles are used instead of the normal electric
poles in order to better withstand extreme winds.
5 Dr T R Kiran
Chand
SE forestry and
ecology group,
National Remote
Sensing Centre,
Hyderabad
• Dr Kiran Chand highlighted the influence of highways on forest
vice versa, which are:
• There is a higher probability of forest fires when there is a highway
nearby due to increased anthropogenic activities.
• Highways act as quick escape routes during forest fires.
• Forests and tree cover along the roadside of hilly terrain help in
reducing the risk of landslides.
6 Mr G V Rao Project
Implementation
Unit, Team leader
for Kathipudi to
Kakinada stretch,
NH 216, Andhra
Pradesh
• In response to Questionnaire (Annexure 1) he responded with the
following answers:
• There exists no evacuation route or disaster relief and recovery plan
for the NH 216 stretch.
• During high temperatures, i.e. an average of 50° C in summer,
highways are subject to cracking, rutting, and shoving of
pavements.
• Heat stress also affects the traffic operation.
• The Highway faces erosion and subsidence during heavy rainfall/
precipitation/ flooding due to lack of maintenance and capacity of
drainage system.
• Temperature thresholds are considered for designing the pavement
but rainfall thresholds are usually not considered in pavement
design.
• IRC 50 and IRC 42 are used as guidelines for the design of
stormwater drainage. Both these codes have climatic parameters
taken into consideration. In the case of rainfall data, it is taken from
flood estimation report.
• The materials used for highway construction are granular sub-base
(GSB), wet mix macdam (WMM), stone aggregate, cement, bitumen
and concrete, and steel.
• Measures for maintenance of the highway assets include:
• Regular cleaning of storm water drainage
• Monthly maintenance and attending to repair of street lights
• Cleaning and watering of roadside vegetation
• Daily checking, cleaning of safety barriers

123
Annexures
7 Mr G V P S
Reddy
Project
Implementation
Unit, Team leader
for Kakinada to
Amalapuram,
NH 216, Andhra
Pradesh
• In response to the questionnaire (Annexure 1), he responded with
the following answers:
• This stretch, (part of NH 216) falls under four districts, East Godavari
being one of them with a population of 51,51,549 (2011 Census) and
density of 477 per sq. km. This stretch is currently being upgraded to
4 lanes in East Godavari.
• Annual Average Daily Traffic (AADT) in Passenger Car Unit (PCUs) is
875 and May is the peak traffic period of the year.
• There are 1,339 trees along the NH in the Kakinada to Amalapuram
stretch (Stretch 2).
• Stretch 2 is a part of disaster relief and recovery plan.
• NH16 is used as the alternative when there is a traffic disruption on
NH 216
• It is observed stretch 2 of the Highway segment faces erosion and
subsidence, damage of pavement due to percolation of rainwater
under the pavement, flooding due to lack of maintenance and
capacity of drainage system and accidents and tree damage.
• Temperature in the stretch usually rises up to an average of 46° C
during summers.
• IS codes and IRC, which consider temperature thresholds, rainfall/
precipitation thresholds are used while designing the pavement and
storm water drainage.
• The highway stretch from Kakinada to Amalapuram stretch receives
monthly rainfall of upto 267.5 mm.
8 Mr Ashutosh
Pathak
Expertise:
Member
of Central
Engineering
Services Group
“A”, served
CPWD & Ministry
of Transport,
Government
of India (1968–
2008)
• Discussions with Mr Pathak centred on soil stability and its relation
to National Highways.
• He gave insights on the different soil types, such as types of soil-
clayey, clay-skeletal, loamy and sandy and their relevance on soil
stability.
• From his experiences, he stated that loamy soil and sandy soil when
combined with water are most vulnerable to landslides.
• Clay soil is mostly stable when compared to other types of soil.
• Landslides are caused depending not only on the soil type, but also
on the combined parameters of water action, slope, degradation of
soil, and sometimes human interventions.
9 Mr K Srineevas Soil expert
National Remote
Sensing Centre,
Hyderabad
• Discussions were held with Mr K Srineevas regarding NH 216 of
coastal stretch study. Key highlights of discussions are summarized
as follows:
• NRSC developed the soil erosion map based on a combination
of various parameters such as soil deformation, soil type, soil of
the terrain, natural vegetation, mass landslide movements, water
erosion, temporal satellite data for recording the changes in soil
cover, gully and ravines deformation.

124
Reducing Carbon Footprint and Enhancing Climate Resilience of National Highways in India
• Each of the above said parameters are classified into different
vulnerability ranges, for example soil deformation is classified into
four classes on the basis of soil tonnes per ha per year, i.e.
• <10 tonnes/ha/year as slight deformation.
• 10 to 20 tonnes/ha/year as moderate deformation.
• 20 to 50 tonnes/ha/year as high deformation.
• >50 tonnes/ha/year as very severe deformation.
• He suggested that the map prepared by NRSC through satellite
imagery does not solely depict landslides or soil stability but also
soil erosion as a whole. Hence, it will not be appropriate to analyse
the vulnerability zones for Highways using this map, as Highways
are more vulnerable to extreme events and not to slow onset of
change.
• He also mentioned that NRSC is now presently working on
landslides and the prediction of their occurrence, in India .
10 Mr D.
Roychowdhury
Superintending
Engineer, Central
Public Works
Department,
New Delhi
• Discussions were held with Mr D Roychowdhury regarding cost
implications for resilient National Highways. Key highlights of
discussions are summarized as follows:
• He mentioned that incorporating disaster resilient features in any
infrastructure project would incur significant costs. For instance, the
resilience considerations for greenfield and brownfield projects will
be different, hence its cost implications.
• He recommended engineering measures and preventive
technologies, which included erosion protection, soil nailing, rock
anchors, etc. He also mentioned they are costly alternatives and thus
are rarely used.
• He proposed that the DPRs must clearly indicate the cost
implications for building resilient roads. The documents should be
prepared based on available benchmarking documents, such as IRC
codes, MoRTH specifications, MoRTH Databook, etc.
• He suggested technology vendor registration for important
technologies on the same lines as empanelment of manufacturers
of bearings for bridges should be considered.
11. Mr K V V
Satyanarayan
Retd. Structural
Engineer, (Road
and Building
division, National
Highway
Authority
of India)
• Discussions were held with Mr Satyanarayan regarding NH 216. Key
highlights of discussions are summarized as follows:
• NH 216 is subject to waterlogging due to blockage of natural drains
during the rainy seasons.
• Local panchayat and municipal authorities are responsible for
operation and maintenance of drains.
• Annual and periodic maintenance are the responsibility of the road
and buildings division of NHAI.
• No research studies have been conducted related to vulnerability
assessment of roads.
• The inundation of Highways is mainly due to choking of drains, as a
result of urbanization of the adjacent settlements.

125
Annexures
12 Ms Mini Korulla
(VP) and Ms
Anunsha
Nandavaram
(Engineer)
Maccaferri
Environmental
Solutions Pvt.
Ltd
• Discussions were held with Ms Mini and Ms Anusha regarding the
engineering interventions that have been recommended as part
of the Study. Key highlights of the interaction are summarized as
follows:
• The list of region-wise engineering interventions was vetted by
them.
• Proof of concepts for the several engineering interventions were
provided by Maceferri
• A list of the IRC codes which already talk about the engineering
interventions recommended as part of the study was made with
assistance from Maccaferri.
13 Rahul Gupta,
Executive
Director and
Adil Singh,
General
Manager
(Tech.)
National
Highways and
Infrastructure
Development
Corporation
Limited
Discussions were held with Mr Rahul Gupta and Mr Adil Singh
to understand if any good practices are being implemented in
North East region of India, while constructing NHs to enhance the
climate resilience of the highways. In this regard they indicated the
engineering interventions that are implemented are in line with the
IRC guidelines and manuals. As the projects undertaken by NHIDCL
are largely through EPC contracts, the contractors generally do not
deploy new technologies for highway construction as the contractors
have to bear the risk.

126
Reducing Carbon Footprint and Enhancing Climate Resilience of National Highways in India
v. Pot hole, after its repair at Sukhdev Vihar road,New Delhi
Source (Central Road Research Institute, 2009-2010)
Annexure 4 –Proof of concept for Engineering Interventions
i. Laying of geo-grid for subgrade stabilization, Gharni-Nitur-Nilanga Road SH-167, Taluka-Nilanga, District- Latur, Maharashtra.
Source (Techfab India)
iii. Use of glass grids on NH24 Lucknow–Sitapur , Uttar Pradesh
Source (Techfab India)
ii. Use of glass grids in Cochin International Airport, Kerala
Source (Techfab India)
iv. NDMC roads are maintained for crack sealing and maintenance
Source (INCKAH Infrastructure technologies for road operation
and maintenance)

127
Annexures
vi. Geotextiles in Road Construction and Prevention of Soil Erosion for Sub grade Stabilization at Jejuri - Morgon Road MDR-65, Taluka-Purandhar, District-Pune, Maharashtra
Source (Techfab India)
vii. Geotextile for separation, filtration and drainage (as per IRC: SP: 59-2002 & MORTH Clause-700) at Link Road between Paithan Road to Nagar Road (CH 0/000 to 4/041 including Bridge at CH 3/270 to 3/340) Taluka/District-Aurangabad, Maharashtra
Source (Techfab India)
viii. Usage of mono oriented reinforced steel wire mesh, rhomboidal cable wire rope panels, dynamic rock fall barriers, anchors , Mumbai –Pune Expressway
Source (Singh, 2016)
ix. Planting of shrubs and trees in a phased manner for erosion control
Source Anil, Rakesh, and Kiran, 2001

128
Reducing Carbon Footprint and Enhancing Climate Resilience of National Highways in India
x. Construction of beach protection bund and groyne using geotextile tubes Kochi, Kerala, India
Source (Maccaferri India, 2015)

The Energy and Resources Institute