Enhanced interpretation of magnetic survey data using artificial neural networks: a case study from...
13
Archaeological Prospection Archaeol. Prospect. 11, 189–199 (2004) Published online 4 November 2004 in Wiley InterScience (www.interscience.wiley.com). DOI: 10.1002/arp.236 Enhanced Interpretation of Magnetic Survey Data using Artificial Neural Networks: a Case Study from Butrint, Southern Albania DAVID J. BESCOBY, 1 * GAVIN C. CAWLEY 2 AND P. NEIL CHROSTON 1 1 School of Environmental Sciences, University of East Anglia, Norwich, UK 2 School of Information Systems, University of East Anglia, Norwich, UK ABSTRACT The classical city of Butrint in southern Albania embodies over three millennia of settlement history. A Roman colony was established sometime after 31 BC , which led to the expansion of the city southwards onto a low-lying floodplain where settlement continued well into the late antique period. In this paper we describe the results of a detailed magnetometry survey undertaken to investigate Roman settlement upon the floodplain.The study included the use of multilayer perceptron neural net- works to further process the magnetic data and derive estimates of feature burial depths, allowing a three-dimensional reconstruction of buried subsurface remains to be made. The neural network approach potentially offers several advantages in terms of efficiency and flexibility over more con- ventional data inversion techniques.The paper demonstrates how this can lead to an enhanced inter- pretation of magnetic survey data, which when combined with other geoarchaeological data can provide a clearer picture of settlement evolution within the context of landscape change.The value of this processing technique is also evident within the context of cultural resource management strate- gies, which potentially restrict more intrusive methods of investigation. Copyright ȣ 2004 John Wiley & Sons,Ltd. Key words: Butrint; Albania; artificial neural network; multilayer perceptron; magnetic prospection; three-dimensionalmodelling; depth estimation Introduction The classical city of Butrint, Southern Albania, occupies a coastal location upon the eastern shore of the Straits of Corfu. Settlement dates back to the Archaic period (ca. eighth century BC) and Butrint had become a fortified trading post by the sixth century BC (Ugolini, 1937). By the first century BC the city had grown into an important urban centre and soon after the defeat of Mark Antony at Actium, ca. 31 BC, Emperor Augustus succeeded in establishing a colony at Butrint. The archaeological record shows exten- sive construction in and around the existing city at this time and the settlement of the adjacent floodplain, which is the focus of the current geophysical investigation. Butrint is located upon a small limestone promontory (Figure 1) jutting out into a lagoonal lake; the remnants of a former coastal embay- ment. Like many coastal sites in the Mediterra- nean, valley infilling in the late Holocene has led to the formation of a large deltaic floodplain surrounding the southern and western flanks of the settlement, which is today over 2 km inland. A number of topographical and geophysical surveys conducted over the past few years have shown that the reorganization of the settlement Copyright # 2004 John Wiley & Sons, Ltd. Received 7 March 2003 Accepted 15 July 2004 * Correspondence to: D. J. Bescoby, Institute of World Archaeology, Garsett House Street, Andrews Hall Plain, Norwich NR3 1AU, UK. E-mail [email protected]
-
Upload
eastanglia -
Category
Documents
-
view
2 -
download
0
Transcript of Enhanced interpretation of magnetic survey data using artificial neural networks: a case study from...
Archaeological ProspectionArchaeol. Prospect. 11, 189–199 (2004)Published online 4 November 2004 in Wiley InterScience (www.interscience.wiley.com). DOI: 10.1002/arp.236
Enhanced InterpretationofMagneticSurveyDatausingArtificialNeuralNetworks: aCaseStudy fromButrint,SouthernAlbania
DAVID J.BESCOBY,1* GAVINC.CAWLEY2 ANDP.NEILCHROSTON1
1 Schoolof EnvironmentalSciences, Universityof EastAnglia, Norwich, UK2 Schoolof InformationSystems, Universityof EastAnglia, Norwich, UK
ABSTRACT The classicalcityof Butrint insouthernAlbaniaembodiesover threemillenniaof settlement history.ARomancolonywasestablishedsometimeafter 31BC,whichled to theexpansionofthecitysouthwardsontoalow-lying floodplainwheresettlement continuedwellinto the lateantiqueperiod.
In thispaper we describe the results of a detailedmagnetometry surveyundertaken to investigateRomansettlementuponthe floodplain.Thestudy included theuseofmultilayerperceptronneuralnet-works to further process themagnetic data and derive estimates of feature burial depths, allowing athree-dimensional reconstruction of buried subsurface remains to be made. The neural networkapproach potentially offers several advantages in terms of efficiency and flexibility over more con-ventionaldata inversion techniques.Thepaperdemonstrateshow this can lead to anenhanced inter-pretation of magnetic survey data, which when combined with other geoarchaeological data canprovide a clearer picture of settlement evolutionwithin the context of landscape change.The value ofthis processing technique is also evident within the context of cultural resourcemanagement strate-gies, which potentially restrict more intrusivemethods of investigation.Copyright � 2004 JohnWiley&Sons,Ltd.
Key words: Butrint; Albania; artificial neural network; multilayer perceptron; magnetic prospection;three-dimensionalmodelling; depthestimation
Introduction
The classical city of Butrint, Southern Albania,occupies a coastal location upon the easternshore of the Straits of Corfu. Settlement datesback to the Archaic period (ca. eighth century BC)and Butrint had become a fortified trading postby the sixth century BC (Ugolini, 1937). By thefirst century BC the city had grown into animportant urban centre and soon after the defeatof Mark Antony at Actium, ca. 31 BC, EmperorAugustus succeeded in establishing a colony at
Butrint. The archaeological record shows exten-sive construction in and around the existing cityat this time and the settlement of the adjacentfloodplain, which is the focus of the currentgeophysical investigation.
Butrint is located upon a small limestonepromontory (Figure 1) jutting out into a lagoonallake; the remnants of a former coastal embay-ment. Like many coastal sites in the Mediterra-nean, valley infilling in the late Holocene has ledto the formation of a large deltaic floodplainsurrounding the southern and western flanks ofthe settlement, which is today over 2 km inland.
A number of topographical and geophysicalsurveys conducted over the past few years haveshown that the reorganization of the settlement
Copyright # 2004 John Wiley & Sons, Ltd. Received 7 March 2003Accepted 15 July 2004
* Correspondence to: D. J. Bescoby, Institute of WorldArchaeology, Garsett House Street, Andrews Hall Plain,Norwich NR3 1AU, UK. E-mail [email protected]

during the establishment of the colony led to theexpansion of the city southeastwards on to thefloodplain, adding over 2.5 ha to its overall size(Stevens, 2001; Hounslow and Chroston, 2002;Chroston and Hounslow, forthcoming). Thisphase of settlement was later abandoned some-time after the sixth century AD and continuedaccretion of the floodplain has led to the burialof surviving remains by over 1m of alluvialdeposits.
The current study presents a detailed investi-gation of the main concentration of settlementupon the floodplain. Data processing techniquesutilizing artificial neural networks are used tofurther process the magnetic data in order toderive estimates of burial depth and target geo-metry of detected features. The archaeologicalsite at Butrint was inscribed as a World Heritagesite in 1992, and the area of protection enlargedin 2000 to encompass much of the alluvial plainupon which the current study is focused. Theprotected nature of the site and limited potentialfor excavation as a result of hydrological condi-tions has highlighted the importance of geophy-sical remote sensing techniques. One of themotivations for numerically extracting a higherlevel of information from geophysical data is,
therefore, to maximize the amount of knowledgerelating to the site as a cultural resource withinthe landscape. This information not only hasintrinsic archaeological value, but is also vitallyimportant to the ongoing management strategyof the cultural landscape in terms of current andfuture land-use.
The geophysical survey
The current geophysical survey covers an areaof ca. 3.7 ha encompassing a dense concentra-tion of magnetic anomalies located by previoussurveys upon the plain (e.g. Stevens, 2001;Hounslow and Chroston, 2002; Chroston andHounslow, forthcoming). The location of thesurvey in relation to the wider cityscape isshown in Figure 1. The survey was conductedusing a Geometrics G-858 magnetometer mea-suring vertical gradient, with a sensor separa-tion of 1m. The magnetometer was mountedupon a wheeled cart, which provided addedpositional accuracy of the sensors and provedideal for the terrain. The survey was under-taken within the constraints of a grid of 20 by20m squares, with measurements being taken
Figure 1. Aerial view of the classical city of Butrint showing the location of the current geophysical survey. Satellite image�DigitalGlobe.
190 D. J. Bescoby et al.
Copyright # 2004 John Wiley & Sons, Ltd. Archaeol. Prospect. 11, 189–199 (2004)
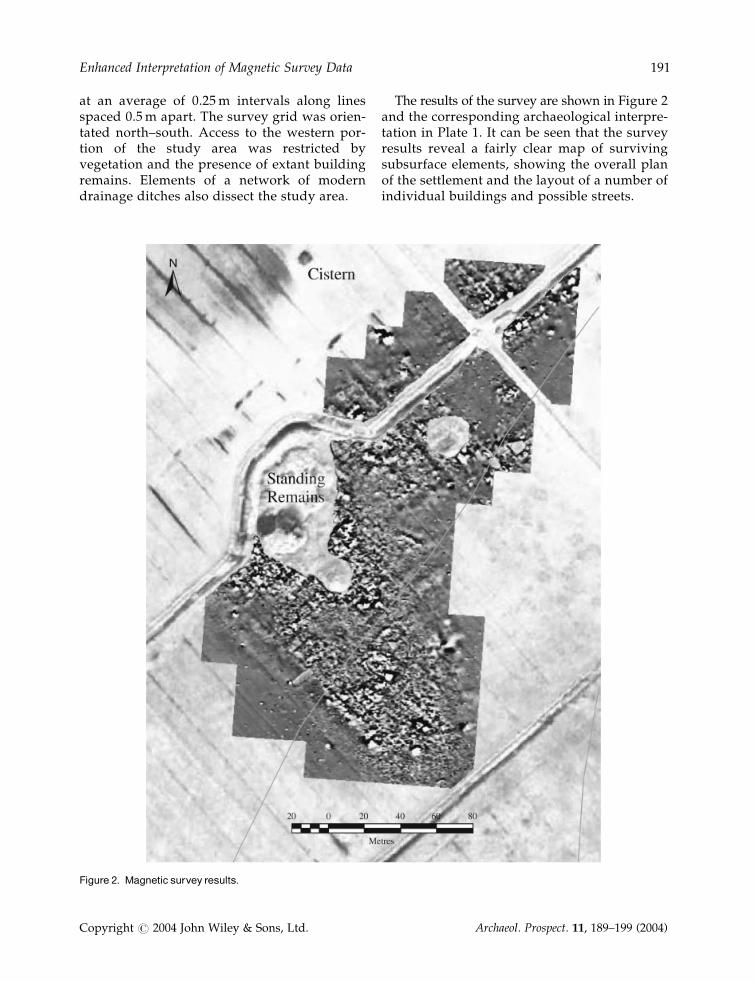
at an average of 0.25m intervals along linesspaced 0.5m apart. The survey grid was orien-tated north–south. Access to the western por-tion of the study area was restricted byvegetation and the presence of extant buildingremains. Elements of a network of moderndrainage ditches also dissect the study area.
The results of the survey are shown in Figure 2and the corresponding archaeological interpre-tation in Plate 1. It can be seen that the surveyresults reveal a fairly clear map of survivingsubsurface elements, showing the overall planof the settlement and the layout of a number ofindividual buildings and possible streets.
Figure 2. Magnetic survey results.
Enhanced Interpretation of Magnetic Survey Data 191
Copyright # 2004 John Wiley & Sons, Ltd. Archaeol. Prospect. 11, 189–199 (2004)
Building outlines are generally recorded as linearnegative anomalies (shown black in the greyscaleplot), often strongly contrasted by larger, morediffuse positive anomalous responses. The nega-tive linear responses result from surviving wallelements of predominantly limestone construc-tion (i.e. non-magnetic structures), and the asso-ciated positive anomalies are due to magneticmaterial such as fired clay brick and tiles fillingadjoining spaces (see below). Similar magneticresponses from Roman building remains havebeen recorded at Wroxeter (Gaffney et al., 2000)and at Falerii Novi in the Tiber Valley (Keay et al.,2000).
The detected settlement remains appear to fol-low a northwest–southeast alignment, respectingthat of the aqueduct remains, which cross the plainfrom a source ca. 10 km higher up the valley,running through the main area of settlement asindicated in Plate 1. This orientation is likely toreflect the original alignment of the colony,although the earlier settlement layout of griddedinsulae is likely to become increasingly obscuredby later phases of construction. The southwesternedge of the settlement was apparently bounded bya channel, no longer visible upon the surface, butwhich possibly provided the opportunity for someform of quayside. The broad linear feature run-ning northwest–southeast, parallel to the line ofthe aqueduct is thought to have been a canal, theremains of which were examined within the sec-tion of the modern drainage ditch which cutsthough the site.
A number of fairly coherent building plans canbe seen in the southwest portion of the settle-ment, one of which is dominated by a largesquare open-space or peristyle measuring ca. 27by 27m. Immediately northeast of the peristyle,there appears to be a centrally located rectangu-lar building, defined by a strong set of negativemagnetic anomalies, which could be interpretedas a triclinium. The extensive range of buildingsto the southeast are also well defined within thesurvey. Together, the overall plan of these build-ings might well be interpreted as a large late-Roman town house or domus, of which there arenumerous examples, such as the ‘Governor’sPalace’ at Aphrodisias and the ‘Palace of theDux’ at Apollonia (Ellis, 1994), that follow asimilar layout.
Ground-truth data
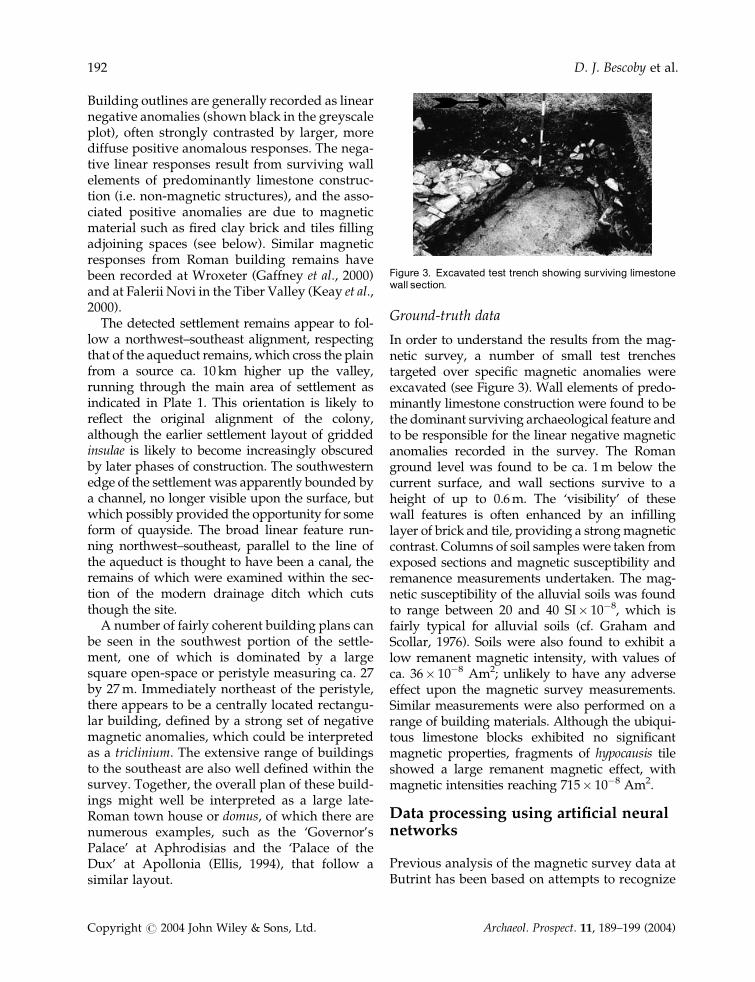
In order to understand the results from the mag-netic survey, a number of small test trenchestargeted over specific magnetic anomalies wereexcavated (see Figure 3). Wall elements of predo-minantly limestone construction were found to bethe dominant surviving archaeological feature andto be responsible for the linear negative magneticanomalies recorded in the survey. The Romanground level was found to be ca. 1m below thecurrent surface, and wall sections survive to aheight of up to 0.6m. The ‘visibility’ of thesewall features is often enhanced by an infillinglayer of brick and tile, providing a strongmagneticcontrast. Columns of soil samples were taken fromexposed sections and magnetic susceptibility andremanence measurements undertaken. The mag-netic susceptibility of the alluvial soils was foundto range between 20 and 40 SI� 10�8, which isfairly typical for alluvial soils (cf. Graham andScollar, 1976). Soils were also found to exhibit alow remanent magnetic intensity, with values ofca. 36� 10�8 Am2; unlikely to have any adverseeffect upon the magnetic survey measurements.Similar measurements were also performed on arange of building materials. Although the ubiqui-tous limestone blocks exhibited no significantmagnetic properties, fragments of hypocausis tileshowed a large remanent magnetic effect, withmagnetic intensities reaching 715� 10�8 Am2.
Data processing using artificial neuralnetworks
Previous analysis of the magnetic survey data atButrint has been based on attempts to recognize
Figure 3. Excavated test trench showing surviving limestonewall section.
192 D. J. Bescoby et al.
Copyright # 2004 John Wiley & Sons, Ltd. Archaeol. Prospect. 11, 189–199 (2004)
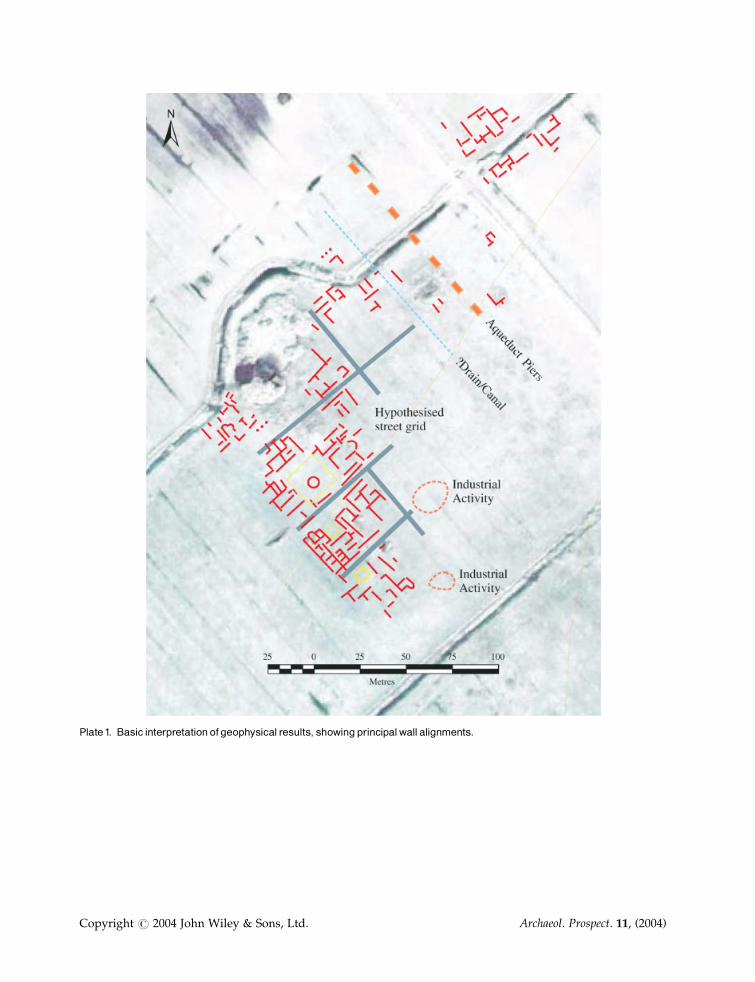
Plate1. Basic interpretation ofgeophysical results, showingprincipalwall alignments.
Copyright # 2004 John Wiley & Sons, Ltd. Archaeol. Prospect. 11, (2004)
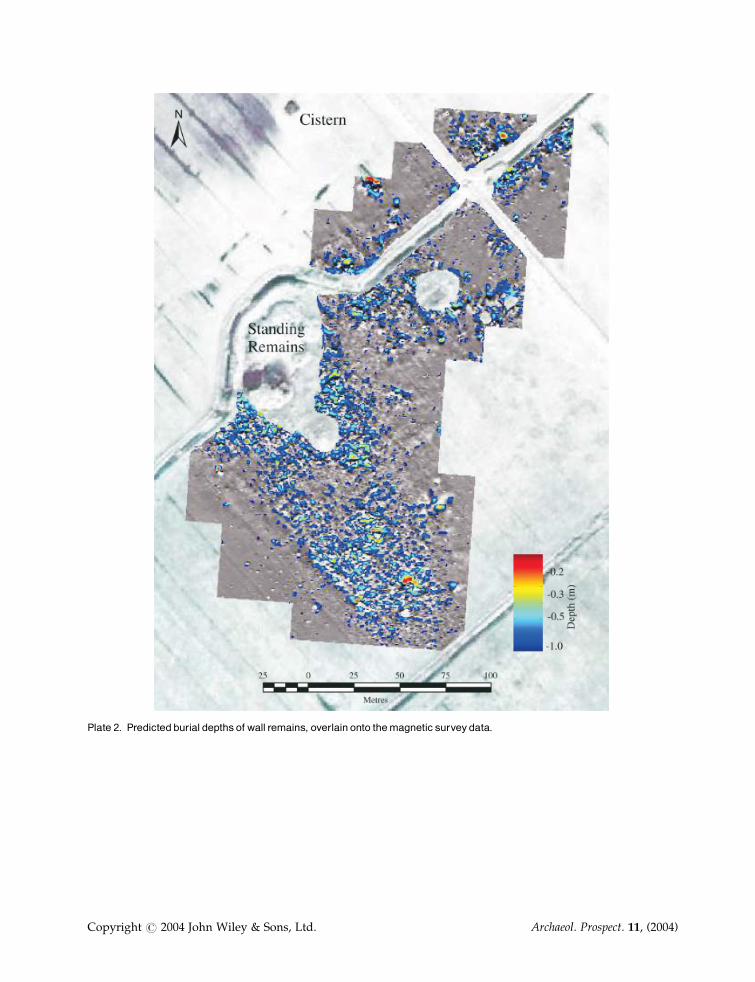
Plate 2. Predicted burial depthsof wall remains, overlain onto themagnetic surveydata.
Copyright # 2004 John Wiley & Sons, Ltd. Archaeol. Prospect. 11, (2004)

and interpret anomaly alignments (seeHounslow and Chroston, 2002). The aim of thecurrent study is to provide an enhanced inter-pretation of the magnetic survey data by creatingan easily interpretable subsurface representationof detected archaeological remains of interest.The problem is, therefore, one of inversion,which traditionally is achieved by calculating amagnetic model of causal source structures. Thisusually consists of a regular array of homoge-neous dipole sources or blocks having specifiedvalues of magnetization, simulating archaeologi-cal features (e.g. Scollar, 1969; Li and Oldenburg,1996). The determination of a final subsurfacemodel for a given set of magnetic survey mea-surements is then achieved by adjusting themagnetization and/or distribution of the dipolesources until a satisfactory approximation of themeasured data is achieved (Doneus et al., 2001).The reconstruction problem is therefore one ofoptimization, which can be solved by a widevariety of iterative optimization algorithms andglobal search methods (Eder-Hinterleitner et al.,1996; Herwanger et al., 2000). Plausible modelsare achieved by imposing a number of a prioriconstraints, often derived from ground-truthdata, thus getting around the problem of non-uniqueness. In practice, achieving a suitablyrealistic model can be extremely dificult, espe-cially where a number closely spaced, magneticsources give rise to complex anomalousresponses. Significant levels of noise within thedata caused by smaller magnetic bodies withinthe overlying layers, such as scatters of buildingmaterial debris within the plough-zone, furthercomplicate the modelling procedure. Addition-ally, when the survey area to be modelled islarge, the computational costs of the inversionbecome extremely high and impractical in themajority of cases.
The work presented within the current studytakes a fundamentally different approach to themodelling problem by utilizing artificial neuralnetworks to learn the non-linearmapping betweenthe measured survey data and the required sub-surface parameters. Artificial neural networkshave been successfully applied to a number ofgeophysical problems in this way, including para-meter estimation, classification, filtering and opti-mization (Poulton et al., 1992; Sheen, 1997; Van der
Baan and Jutten, 2000; Calderon-Macias et al., 2000;El-Qady and Ushijima, 2001). The adoption of theneural network approach holds several advan-tages over more conventional modelling techni-ques, allowing the effective solution of non-linearproblems from complex, incomplete and noisydata. The computational expense of the inversionusing neural networks, being dependent upon thedimension of the space of unknown parametersrather than the physical dimensions of the modelspace, is also comparatively low (Spichak andPopova, 2000).
The multilayer-perception (MLP) network
For this study, we adopt the multi-layer percep-tion network architecture, which has become apopular choice for solving many non-linear pro-blems (Bishop, 1995). Data processing using thistype of network can be viewed as mapping froma set of input variables x1, . . . , xd, which in thiscase represents a vector of magnetic fieldstrengths x, to a number of output variables, yk,where k is the number of required source para-meters. This is achieved through adopting amassively parallel connectionist architecture(Jang et al., 1997) of simple processing units; thebasic functioning of which was originallyinspired by the biological neuron. The strengthor weight of the interconnections between proces-sing units within the network determines theoverall flow of data and these can be adjustedto optimize the mapping. The problem of deter-mining optimal connection weights is solved byusing a data set of training data (Bishop, 1995).
The mapping performed by the neural net-work can be illustrated in terms of a mathema-tical function that contains a number ofadjustable parameters, with values that aredetermined through the use of the training data(Bishop, 1995). Such representative functionscould be written in the form
y ¼ ykðx; wÞ
where x is the vector of input variables and wdenotes the vector of adjustable parameters, orweights within the network. A training process isthen applied to determine the values of theweight parameters on the basis of the training
Enhanced Interpretation of Magnetic Survey Data 193
Copyright # 2004 John Wiley & Sons, Ltd. Archaeol. Prospect. 11, 189–199 (2004)
data set (Bishop, 1995). For a training set with nelements, each data pair consists of a vector ofinputs x, denoted by xn and the correspondingdesired value for the output y, which can bedenoted by tn, where n is the number of patternsin the training set. These desired outputs areknown as target values in the neural networkcontext (Bishop, 1995). The training procedurecan be seen as a process of minimizing the error,E, between the desired output tn for a particularinput xn and the corresponding value predictedby the network, through choosing suitable valuesof w. This process is often referred to as supervizedlearning (Bishop, 1995). The error, E, is basedupon a sum-of-squares error function with aminima that is determined by a form of gradientdescent optimization. The process of adjustmentis repeated until the network output and thetraining data targets are similar for all the train-ing pairs in the training data. The network is thensaid to be trained and can be used to map orinvert magnetic data for which the correspond-ing source parameters are not known.
Choice of parameters
The distinctive negative magnetic responsescaused by buried limestone wall features makesthem an obvious choice for further data proces-sing or inversion. In terms of deriving sourceparameters, from an archaeological perspectivedepth of burial below the surface is potentiallyone of the most useful, giving information thatcan be linked to settlement phases, depositionalenvironments and soil erosion. It was thereforedecided to focus upon using the neural networkroutines to predict the burial depths of wallfeatures detected within the magnetic survey.
To be able to accurately resolve wall positionsand depths from the survey data, it is necessaryto consider a number of magnetic field strengthvalues simultaneously. This can be achieved bysequentially parsing an input grid or ‘window’over the input data, where the magnetic fieldstrength values derived from the input windowform a matrix of values input into the neuralnetwork as a vector. The corresponding networkoutput represents a depth value below the centreof the input window. A sequence or grid of depthpredictions, made as the input window is parsed
over the input data, allows a three-dimensionalsubsurface representation of detected wallelements to be made.
Network training and data processing
Suitable training data for the neural networkwere generated through the three-dimensionalforward modelling of magnetic responses for anumber of models representing buried wall sec-tions of a variety of types and burial depths.These training models were based upon knownarchaeological examples recorded within the testtrenches and included wall elements with gaps,abutting sections and stepped sections. Modelparameters were based upon the magnetic sus-ceptibility measurements of samples taken dur-ing the test excavations, allowing a realisticlayered earth model to be produced withinwhich the wall elements were modelled. Theresulting anomalous magnetic field was calcu-lated over a grid at 0.5m intervals over the modelsurface, and at observation heights of 0.3 and1.3m, allowing the vertical gradient to be calcu-lated. Noise sampled from the magnetic surveydata was also added to the training data to createa more realistic response, following the methodoutlined by Scollar (1970). In addition, a range oftraining data representing unwanted magneticresponses, such as those caused by modern landdrains, were added to the training data set, withcorresponding null target data. This effectivelyencourages a filtering function by the network, inwhich only magnetic responses represented inthe training data are considered.
Data were input into the network as a vector of25 magnetic field values, representing measure-ments over a 2 by 2m horizontal area, i.e. at aresolution of 0.5m. This was found to be anoptimal trade-off between input window size,the number of input values (which dictates thecomplexity of the network) and the horizontalresolution of the input data. The input windowwas then parsed sequentially over the area ofinput data at 0.5m steps to generate a sequenceof input vectors xn. For network training, thecorresponding target data consisted of a singlevalue representing the depth below the surface tothe modelled wall features. The network archi-tecture therefore consisted of 25 inputs, an initial
194 D. J. Bescoby et al.
Copyright # 2004 John Wiley & Sons, Ltd. Archaeol. Prospect. 11, 189–199 (2004)
hidden layer of 16 neurons (capable of beingpruned during training to reduce network com-plexity) and one output. A second auxiliary out-put was added to the network giving thevariance of the predicted output, providing errorbars to indicate the uncertainty of network pre-dictions (Nix and Weigend, 1994).
Pre-processing of the network input data wasalso undertaken to make it invariant under rota-tion. This was necessary to avoid an excessivelylarge training data set, which would be requiredto represent all possible wall orientations. Bytransforming the magnetic input data into arotationally invariant form, only one orientationof wall essentially needs to be modelled. Areduction-to-pole operator was first applied tothe data, adding overall symmetry to the mag-netic anomalies represented, following Gunn
(1975). Rotational invariance was then achievedby calculating the corresponding ninth-orderZernike moments of each input window ofdata, following Prismall et al. (2002). Zernikemoments are constructed using a set of complexpolynomials, which form a complete orthogonalbasis set and possess very little informationredundancy but having a high robustness tonoise (Teh and Chin, 1988; Kim and Kim, 2000).
Results
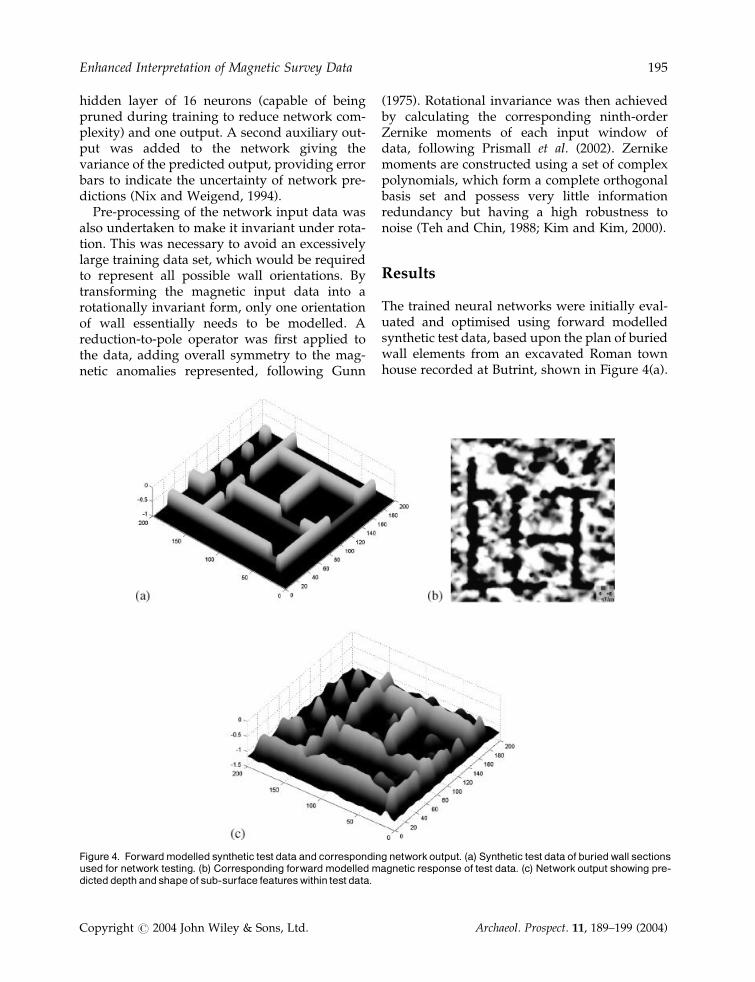
The trained neural networks were initially eval-uated and optimised using forward modelledsynthetic test data, based upon the plan of buriedwall elements from an excavated Roman townhouse recorded at Butrint, shown in Figure 4(a).
Figure 4. Forwardmodelled synthetic test data and corresponding networkoutput. (a) Synthetic test data of buriedwall sectionsused for network testing. (b) Corresponding forward modelled magnetic response of test data. (c) Network output showing pre-dicted depth and shape of sub-surface featureswithin test data.
Enhanced Interpretation of Magnetic Survey Data 195
Copyright # 2004 John Wiley & Sons, Ltd. Archaeol. Prospect. 11, 189–199 (2004)
Noise sampled from the magnetic survey datawas again added to the forward modelled resultsfor realism. The resulting synthetic magneticdata are shown in Figure 4(b) and the outputfrom the network is shown in Figure 4(c). Theroot mean square (RMS) error for the networkoutput, calculated by comparing the differencebetween the predicted results and the modeldata, was found to be 0.25m, which compareswell with the associated level of error predictedby the network.
Instead of using just one neural network topredict the burial depths of detected wall fea-tures, distinctly better results were achieved bycombining the outputs of a number of identicallytrained networks. The use of what is known as acommittee of networks has been found to offerimproved overall generalization characteristicsover a single network when processing newdata, because networks generally converge to alocal minima in error space during training andnot a global error (see Bishop, 1995). Magneticdata were therefore processed using five net-works, and their outputs combined by aweighted mean dependent upon the predic-tion errors associated with each network in thecommittee.
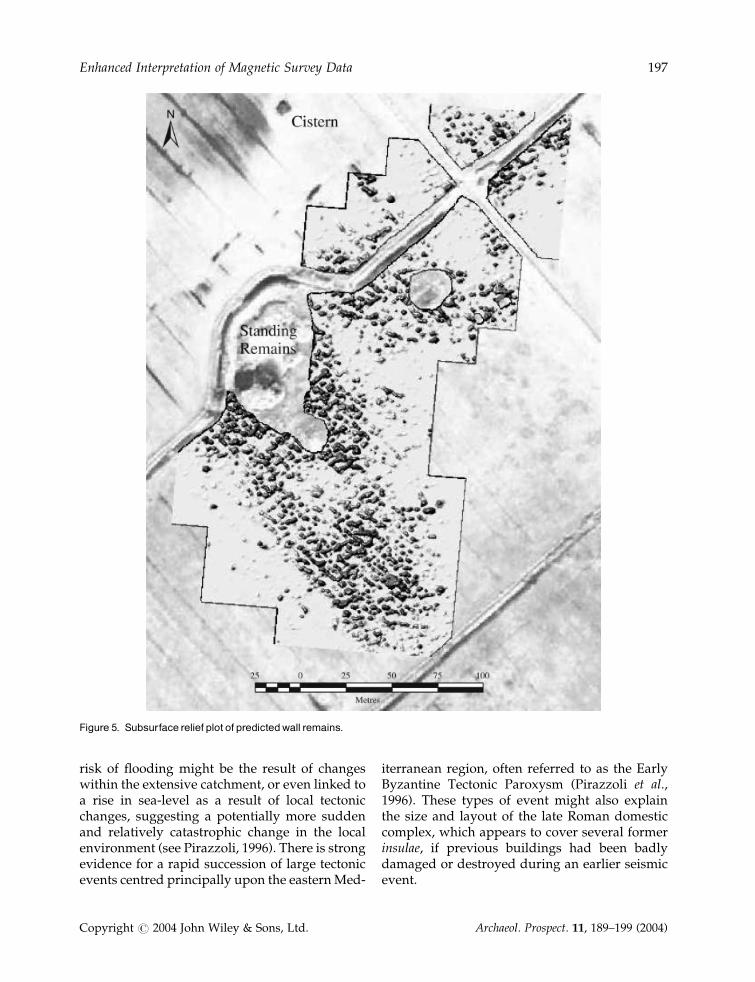
Once optimized using the synthetic test data,the committee of networks was applied to themagnetic survey data shown in Figure 2. Plate 2shows the predicted depths of wall featuresoverlaid onto the original magnetic data, whileFigure 5 shows the same data displayed as ashaded relief plot, giving the three-dimensional,subsurface representation of predicted wallremains. It can be seen from the results that thecommittee is able to make realistic predictionsfor a number of limestone wall elements detectedwithin the magnetic survey data. The majority ofthe predicted walls appear to be buried quitedeeply at below �0.5m, although there are alsoclusters of building remains with more shallowburial depths, i.e. within �0.25m of the currentsurface. The relief plot of predicted subsurfaceremains in particular (Figure 5) shows an overallclarity over the original magnetic survey datagiving a much less cluttered picture of the gen-eral settlement layout. The in-built discrimina-tory ability of the network to respond toanomalies representing predominantly lime-
stone wall features, while being insensitive toother anomalous responses, seems effectivewhen processing data at this spatial scale. It canbe seen that in some cases the committee hasmade predictions for small discrete anomaliesnot likely to be associated with wall features,such as those recorded within the magneticallyquiet area forming the southwest portion of thesurvey beyond the limits of the settlement. Theanomalies interpreted as industrial activityabove have also confused the committee. Thelimited amount of ground-truth data availablewithin the excavated test trenches indicated anRMS error of 0.23m between the predicted andexcavated wall features.
Settlement burial depth and environmentalchange
It can be seen from the predicted results that theburial depth of remains in the western portionof the survey area, interpreted archaeologicallyas representing the remains of a large, lateRoman townhouse or domus complex, are oftensignificantly more shallow, many elementsbeing within 0.5m of the current ground sur-face. For a multiphase urban settlement, it gen-erally would be expected stratigraphically thatlater phases would have a shallower burialdepth, although this does not necessarily pre-clude the shallow survival of earlier phases ofbuild. In particular, the rectangular buildingplan northeast of the peristyle, interpreted asa large hall or triclinium, has a consistentlyshallow burial depth, perhaps indicating thatthese seemingly later phases of settlement werepreferentially sited at this location within thesettlement.
A subsequent geoarchaeological investigationin the form of a transect of boreholes along thenorthwestern edge of the survey area indicatedthat the bulk of the settlement within this portionof the survey was constructed upon a gravelridge, forming a topographically elevated head-land. One of the most likely explanations for theobserved clustering of later settlement remainsmight be that surrounding, lower lying areasbecame susceptible to flooding as a result ofeither overbank floods or rising groundwaterlevels (see Brown, 1997, Chapter 8). An increased
196 D. J. Bescoby et al.
Copyright # 2004 John Wiley & Sons, Ltd. Archaeol. Prospect. 11, 189–199 (2004)
risk of flooding might be the result of changeswithin the extensive catchment, or even linked toa rise in sea-level as a result of local tectonicchanges, suggesting a potentially more suddenand relatively catastrophic change in the localenvironment (see Pirazzoli, 1996). There is strongevidence for a rapid succession of large tectonicevents centred principally upon the easternMed-
iterranean region, often referred to as the EarlyByzantine Tectonic Paroxysm (Pirazzoli et al.,1996). These types of event might also explainthe size and layout of the late Roman domesticcomplex, which appears to cover several formerinsulae, if previous buildings had been badlydamaged or destroyed during an earlier seismicevent.
Figure 5. Subsurface relief plot of predictedwall remains.
Enhanced Interpretation of Magnetic Survey Data 197
Copyright # 2004 John Wiley & Sons, Ltd. Archaeol. Prospect. 11, 189–199 (2004)
Conclusions
The processing of magnetic survey data usingneural networks, leading to a subsurface recon-struction of surviving wall elements can be seento have provided an enhanced interpretation ofthe survey data, useful both archaeologically andfrom the perspective of cultural resource man-agement. Many of the hypotheses arising fromthe results obtained have been valuable in sti-mulating and formulating further research ques-tions. The study has also shown how the datagenerated can be easily assessed in combinationwith geoarchaeological evidence to provide amore complete interpretation of settlement evo-lution.
The use of neural network techniques offersmany interesting possibilities to the processingof geophysical data from archaeological sites,particularly in the field of inversion and signalprocessing, with many potential advantages interms of speed and noise tolerance over existingtechniques.
Acknowledgements
The authors work like to acknowledge the In-stitute of World Archaeology and the ButrintFoundation for their help and support through-out the duration of this project. The work wasfunded by the Natural Environment ResearchCouncil, grant number NER/S/A/2000/03321A. A significant level of support was alsoprovided by the Packard Humanities Institute(PHI).
References
Bishop CM. 1995. Neural Networks for Pattern Recog-nition. Oxford University Press: Oxford.
Brown AG. 1997. Alluvial Geoarchaeology.Cambridge Manuals in Archaeology, CambridgeUniversity Press: Cambridge.
Calderon-Macıas C, Sen MK, Stoffa PL. 2000. Arti-ficial neural networks for parameter extimationin geophysics. Geophysical Prospecting 48: 21–47.
Chroston PN, Hounslow M. In press. The geophy-sical survey: the extent and structural layout ofthe suburbs of Butrint on the Vrina Plain. InByzantine Butrint: Excavations and Surveys 1994–
1999, Hodges R, Bowden W, Lako K (eds).Oxbow: Oxford.
Doneus M, Eder-Hinterleitner A, Neubauer W.2001. Archaeological Prospection in Austria.Austrian Academy of Sciences: Vienna; 11–33.
Eder-Hinterleitner A, Neubauer W, Melichar P.1996. Restoring magnetic anomalies. Archaeologi-cal Prospection 3: 185–197.
El-Qady G, Ushijima K. 2001. Inversion of dc resis-tivity data using neural networks. GeophysicalProspecting 49: 417–430.
Ellis SP. 1994. Power, architecture and decor: howthe late Roman aristocrat appeared to his guests.In Roman Art in the Private Sphere: New Perspectiveson the Architecture and Decor of the Domus, Villa andInsula, Gazda EK (ed.). Ann Arbor Publishers: MI;117–148.
Gaffney CF, Gater JA, Linford P, Gaffney VL, WhiteR. 2000. Large-scale systematic fluxgate gradio-metry at the Roman city of Wroxeter. Archaeolo-gical Prospection 7: 81–99.
Graham IDG, Scollar I. 1976. Limitations on mag-netic prospection in archaeology imposed by soilproperties. Archaeo-Physika 6: 1–24.
Gunn PJ. 1975. Linear transforms of gravity andmagnetic fields. Geophysical Prospection 23: 300–321.
Herwanger J, Maurer H, Green AG, Leckebusch J.2000. 3-D inversion of magnetic gradiometer datain archaeological prospecting: possibilities andlimitations. Geophysics 65(3): 849–860.
Hounslow MW, Chroston PN. 2002. Structural lay-out of the suburbs of Roman Butrint, southernAlbania: results from a gradiometer and resistiv-ity survey. Archaeological Prospection 9(4): 229–242.
Jang JSR, Sun CT, Mizutani E. 1997. Neuro-fuzzy andSoft Computing: A Computational Approach toLearning and Machine Intelligence. Matlab Curricu-lum Series, Prentice Hall: New Jersey.
Keay S, Millett M, Poppy S, Robinson J, Taylor J,Terrenato N. 2000. Falerii Novi: a new survey ofthe walled area. Papers of the British School at Rome68: 1–93.
Kim WY, Kim YS. 2000. A region-based shapedescriptor using Zernike moments. Signal Proces-sing-image Communication 16(1): 95–102.
Li Y, Oldenburg DW. 1996. 3-D inversion of mag-netic data. Geophysics 61(2): 394–408.
Nix DA, Weigend AS. 1994. Estimating the meanand variance of the target probability distribu-tions. In Proceedings of the IEEE International Con-ference on Neural Networks, Vol. 1, Orlando,Florida, 26 June–2 July 1994; 55–60.
Pirazzoli PA. 1996. Sea-level Changes. The Last 20 000Years. Wiley: Chichester.
Pirazzoli PA, Laborel J, Stiros SC. 1996. Earthquakeclustering in the eastern Mediterranean duringhistorical times. Journal of Geophysical Research—Solid Earth 101: 6083–6097.
198 D. J. Bescoby et al.
Copyright # 2004 John Wiley & Sons, Ltd. Archaeol. Prospect. 11, 189–199 (2004)
PoultonMM, Sternberg BK, Glass CE. 1992. Locationof subsurface targets in geophysical data usingneural networks. Geophysics 57(12): 1534–1544.
Prismall SP, Nixon MS, Carter JN. 2002. On movingobject reconstruction by moments. In 13th Pro-ceedings of the British Machine Vision Conference,Cardiff, 2–5 September, 2002; 73–82.
Scollar IG. 1969. A program for the simulation ofmagnetic anomalies of archaeological origin in acomputer. Prospezioni Archeologiche 4: 59–83.
Scollar IG. 1970. Fourier transform methods for theevaluation of magnetic maps. Prospezioni Arche-ologiche 5: 9–41.
Sheen N. 1997. Automatic interpretation of archaeolo-gical gradiometer data using a hybrid neural network.PhD thesis, University of Bradford.
Spichak V, Popova I. 2000. Artificial neural networkinversion of magnetotelluric data in termsof three-dimensional earth macroparameters.Geophysical Journal International 142: 15–26.
Stevens C. 2001. Butrint Environs: Geophysical SurveyReport. Technical Report 2001/113, GSB Prospec-tion Ltd., Bradford, West Yorkshire.
Teh C-H, Chin RT. 1988. On image analysis bymethods of moments. IEEE Transactions on Pat-tern Analysis and Machine Intelligence 10(4): 496–513.
Ugolini LM. 1937. Butrinto: il mito d’enea. Gli scavi.Istituto Poligrafico dello Stato: Rome.
Van der Baan M, Jutten C. 2000. Neural networks ingeophysical applications. Geophysics 65(4): 1032–1047.
Enhanced Interpretation of Magnetic Survey Data 199
Copyright # 2004 John Wiley & Sons, Ltd. Archaeol. Prospect. 11, 189–199 (2004)