Shank 2 expression coincides with neuronal differentiation in the developing retina
Upload
independentCategory
view
2download
0
Research Articles
Enhanced Athletic Performance on Multisite AAV-IGF1Gene Transfer Coincides with Massive Modification
of the Muscle Proteome
Antero Macedo,1,* Manuela Moriggi,2,* Michele Vasso,2,3 Sara De Palma,2 Mauro Sturnega,1
Giorgio Friso,4 Cecilia Gelfi,2,3 Mauro Giacca,1 and Serena Zacchigna1
Abstract
Progress in gene therapy has hinted at the potential misuse of gene transfer in sports to achieve better athleticperformance, while escaping from traditional doping detection methods. Suitable animal models are thereforerequired in order to better define the potential effects and risks of gene doping. Here we describe a mouse modelof gene doping based on adeno-associated virus (AAV)-mediated delivery of the insulin-like growth factor-I(IGF-I) cDNA to multiple muscles. This treatment determined marked muscle hypertrophy, neovascularization,and fast-to-slow fiber type transition, similar to endurance exercise. In functional terms, treated mice showedimpressive endurance gain, as determined by an exhaustive swimming test. The proteomic profile of thetransduced muscles at 15 and 30 days after gene delivery revealed induction of key proteins controlling energymetabolism. At the earlier time point, enzymes controlling glycogen mobilization and anaerobic glycolysis wereinduced, whereas they were later replaced by proteins required for aerobic metabolism, including enzymesrelated to the Krebs cycle and oxidative phosphorylation. These modifications coincided with the induction ofseveral structural and contractile proteins, in agreement with the observed histological and functional changes.Collectively, these results give important insights into the biological response of muscles to continuous IGF-Iexpression in vivo and warn against the potential misuse of AAV-IGF1 as a doping agent.
Introduction
The successful development of gene therapy has pro-vided the concepts, tools, opportunities, and, arguably,
justifications for genetic modification of functions that affectnormal human traits, including athletic performance. As aconsequence, gene doping, which is defined by the WorldAnti-Doping Agency (WADA) as ‘‘the nontherapeutic use ofcells, genes, genetic elements, or of the modulation of geneexpression, having the capacity to improve athletic perfor-mance’’ (http://www.wada-ama.org/en/Science-Medicine/Prohibited-List/), is perceived as a coming threat and a primeconcern to the antidoping community.
Several genes, when overexpressed, have the capacity toinduce muscle hypertrophy and improve muscle function;among these gene are those encoding insulin-like growthfactor-I (IGF-I) (Barton-Davis et al., 1998), growth hormone
(GH), erythropoietin (Epo; Zhou et al., 1998), vascular en-dothelial growth factor (VEGF), fibroblast growth factor(FGF), and endorphins or enkephalins (Lee et al., 2004; Kotaet al., 2009) or myostatin blockers, such as follistatin (Lee andMcPherron, 2001). A few studies have also specifically in-vestigated the potential of genetic modification to enhanceathletic performance, including the generation of peroxisomeproliferator-activated receptor-d (PPARd; Wang et al., 2004)and phosphoenolpyruvate carboxykinase (PEPCK; Hakimiet al., 2007) transgenic mice and the delivery of the IGF-I geneto the anterior muscle mass of the hind limb (Lee et al., 2004).In particular, IGF-I promotes the proliferation and differen-tiation of satellite cells into myoblasts ( Jennische et al., 1987).Consistent with this function, this factor is known to playkey roles in normal muscle development in the embryo(Benito et al., 1996), to be important for muscle regenerationand reinnervation after injury in adult muscles (Keller et al.,
1Molecular Medicine Laboratory, International Centre for Genetic Engineering and Biotechnology (ICGEB), 34149, Trieste, Italy.2Dipartimento di Scienze e Tecnologie Biomediche, Universita degli Studi di Milano, 20090 Milan, Italy.3Istituto di Bioimmagini e Fisiologia Molecolare, CNR Milano, 20090 Milan, Italy.4Istituto di Biofisica-CNR Area della Ricerca di Pisa, 56124 Pisa, Italy.*These authors contributed equally to this work.
HUMAN GENE THERAPY 23:146–157 (February 2012)ª Mary Ann Liebert, Inc.DOI: 10.1089/hum.2011.157
146

1999; Musaro et al., 1999, 2004; Takahashi et al., 2003), and tobe critical for the maintenance of the muscle mass duringaging (Goldspink and Yang, 2004). Once overexpressed inthe skeletal muscle, IGF-I increases muscle mass and medi-ates adaptation to strength training (White and Esser, 1989).
Although a large body of information is available on theeffects of IGF-I at the cellular level, assessment of the per-formance of animals treated with the factor, as well as themolecular and biochemical modifications induced by IGF-Iover time in vivo, are poorly elucidated. To fill this gap, herewe exploited the property of adeno-associated viral (AAV)vectors to transduce muscle fibers in vivo at high efficiencyand to express their transgenes for prolonged periods of timein the absence of detectable inflammation or major immuneresponse (Kessler et al., 1996; Fisher et al., 1997; Mueller andFlotte, 2008). Although all these characteristics are appealingin the gene therapy arena, nevertheless they also appear toencourage the use of these vectors to enhance muscle per-formance for doping purposes.
By delivering the IGF-I cDNA to the major muscle mass ofthe four limbs, using an AAV serotype 2 (AAV2) vector, herewe describe a mouse model of gene doping in which weassessed the molecular modifications induced by IGF- Ioverexpression over time by quantitative differential in-gelelectrophoresis (2D-DIGE) and mass spectrometry (MS)(Alban et al., 2003) and correlated the detected changes withstructural and functional modifications.
Materials and Methods
Production, purification, and characterizationof rAAV vectors
The human hepatic IGF1-IA (ref. seq. NM_000618.3) wasamplified by PCR and cloned into the pZac recombinantAAV expression vector, generating the pAAV-IGF1 vector.Viral particles were produced by the AAV Vector Unit at theInternational Centre for Genetic Engineering and Bio-technology (ICGEB, Trieste, Italy; http://www.icgeb.org/avu-core-facility.html). Methods for production and purifi-cation were previously described (Arsic et al., 2003). AAVtiters were in the range of 1 · 1012 genome copies permilliliter.
Animals and experimental protocols
Animal care and treatment were conducted in conformitywith institutional guidelines in compliance with national andinternational laws and policies (EEC Council Directive 86/609, OJL 358, December 12, 1987). All experiments wereperformed in male CD1 mice, 4–6 weeks of age.
For biochemical and histological analyses, tibialis anteriorand gastrocnemius muscles were injected with 50 ll of eitherphosphate-buffered saline (PBS) or a viral suspension con-taining 1011 viral particles of AAV2-IGF1, and harvestedafter the indicated periods of time.
For the evaluation of swimming performance, mice wereinjected via their tibialis anterior, gastrocnemius, quadricepsfemoris, biceps brachii, and triceps brachii muscles with ei-ther a control AAV vector or AAV-IGF1 in order to trans-duce the major muscle groups of the body (50 ll/injection,corresponding to 1 · 1011 viral particles). To assess swim-ming performance, a swimming apparatus was developed,
particularly suited for both exercise training and execution ofexhaustive stress tests to analyze and quantify physical en-durance in mice. The system is composed of a 200-liter waterplastic tank, equipped with a mobile shovel to produce ar-tificial waves, in order to prevent the animals from floatingduring swimming sessions. The water temperature was keptbetween 30 and 32�C during each entire swimming session.Thirty days after AAV delivery, each mouse (n = 8 per group)was trained to swim for 15 min, every second day for 2weeks. This training period helped the mice to becomeadapted to the swimming sessions before challenging themto an exhaustive test. By the end of that period, mice wereoverloaded with metallic wires attached to their tails, cor-responding to 10% of their body weight, and then subjectedto a swimming session until exhaustion. The maximalswimming time before submersion was determined for eachmouse, after which mice were rapidly rescued, warmed, andreturned back to their cages.
Real-time PCR
Viral genome quantification was performed by extractingtotal DNA from transduced muscles, using a DNeasy blood& tissue kit (Qiagen, Hilden, Germany), according to themanufacturer’s instructions. Viral genome was detected byquantitative real-time PCR (Q-PCR), using a cytomegalovi-rus (CMV) promoter-specific TaqMan probe (Applied Bio-systems/Invitrogen, Foster City, CA). The number of viralDNA molecules was calculated on the basis of a standardcurve, obtained from serial dilutions of the pAAV-IGF1plasmid, and further normalized to muscle tissue weight.mRNA levels of endogenously and ectopically expressedgenes were also assessed by Q-PCR. Briefly, total RNA wasextracted from transduced muscles on days 7, 15, 30, and 60postinjection, using TRIzol reagent (Invitrogen, Carlsbad,CA). After reverse transcription, specific transcripts werequantified with the following commercial TaqMan probes:human IGF-I (hIGF-I; Hs00153126_m1), murine IGF-I (mIGF-I; Mm01233960_m1), and glyceraldehyde-3-phosphate de-hydrogenase (GAPDH; 4352339E). The levels of murine andhuman IGF-I were normalized by the levels of GAPDH.PCRs were carried out in a CFX96 real-time system (Bio-Rad,Hercules, CA).
Histological evaluation and immunostaining
For histological analysis, muscles were collected after 15 or30 days of IGF-I gene transfer, fixed in 2% formaldehyde,and embedded in paraffin. After hematoxylin–eosin staining,5-lm muscle histological sections were analyzed with anOlympus CX40 microscope (Olympus, Tokyo, Japan). Fibercross-sectional area was quantified with ImageJ software. Forimmunofluorescence staining, muscles were frozen in liquidnitrogen-cooled isopentane and kept at - 80�C. Sections werefixed in 4% paraformaldehyde and permeabilized in 1%Triton X. For assessing new blood vessels formation andfast fiber content, anti-CD31 antibodies (550274; BD Bios-ciences, San Jose, CA) and anti-fast myosin heavy chain(clone F18 from the Developmental Studies Hybridoma Bank[DSHB], Iowa City, IA), were used followed by fluorescentlylabeled secondary antibodies (Molecular Probes/Invitrogen,Eugene, OR). Images were acquired with a DMLC uprightfluorescence microscope (Leica Microsystems, Wetzlar,
ENHANCED ATHLETIC PERFORMANCE ON MULTISITE AAV-IGF1 GENE TRANSFER 147

Germany) equipped with a charge-coupled device camera(CoolSNAP CF; Roper Scientific, Tucson, AZ) using Meta-View 4.6 quantitative analysis software (MDS AnalyticalTechnologies, Sunnyvale, CA).
Western blotting and ELISA
To quantify the levels of IGF-I overexpression in vivo,transduced muscles were harvested, snap frozen in liquidnitrogen, and stored at - 80�C before lysis in radio-immunoprecipitation assay (RIPA) buffer (20 mM Tris-HCl[pH 7.4], 150 mM NaCl, 5 mM EDTA, 1% sodium deox-ycholate [NaDOC], 1% Triton X-100, and 0.1% sodium do-decyl sulfate [SDS]) containing protease inhibitor cocktailtablets (Roche Applied Science, Indianapolis, IN) and 100 lMNaVO4. Protein concentration was determined by the bi-cinchoninic acid method (BCA protein assay reagent; Ther-mo Fisher Scientific, Waltham, MA). Fifty micrograms oftotal protein extract was resolved by SDS–polyacrylamidegel electrophoresis (PAGE) and transferred to nitrocellulosemembranes (GE Healthcare, Piscataway, NJ), which wereincubated overnight with the following antibodies: anti-hIGF-I (AF-291-NA; R&D Systems, Minneapolis, MN) andanti-a-tubulin (B-5-1-2; Sigma-Aldrich, St. Louis, MO). Bothmurine and human IGF-I were also quantified by ELISA,according to the manufacturer’s recommendations (mouse/rat IGF-I immunoassay [MG100] and human IGF-I immu-noassay [DG100] from R&D Systems). For this purpose,muscles were homogenized in PBS and subjected to fivefreeze–thaw cycles: After centrifugation at 5000 · g, clarifiedprotein supernatants were quantified as described previ-ously and used for the immunoassays.
Muscle differential proteome profile
Gastrocnemius muscle biopsies from three sets of mice(control, AAV-IGF1 15 days, and AAV-IGF1 30 days) wereanalyzed according to a quantitative 2D-DIGE protocol. 2D-DIGE results were obtained and inserted in an MIAPE–GE(minimal information about a proteomics experiment–gelelectrophoresis) compliant form (Taylor et al., 2007), as de-tailed in Supplementary Table S3 (supplementary data areavailable online at www.liebertonline.com/hum).
For protein extraction, frozen muscles were ground in afrozen mortar, suspended in lysis buffer (7 M urea, 2 Mthiourea, 4% 3-[(3-cholamidopropyl)-dimethyl-ammonio]-1-propanesulfonate [CHAPS], 30 mM Tris, 1 mM phe-nylmethylsulfonyl fluoride [PMSF]), and solubilized bysonication on ice. Proteins were selectively precipitated witha PlusOne 2-D clean-up kit (GE Healthcare) in order to re-move nonprotein impurities, and resuspended in lysis buffer.The pH of the protein extracts were adjusted to pH 8.5 byaddition of 1 M NaOH. Protein concentrations of three dif-ferent pools were determined with a PlusOne 2-D quant kit(GE Healthcare).
Protein minimal labeling with cyanine dyes (Cy3 and Cy5)was performed according to the manufacturer’s recommen-dations (CyDye DIGE fluor minimal dye; GE Healthcare).Proteins extracted from each group of mice were labeled withCy5, whereas an internal standard, generated by pooling analiquot of all muscle samples, was labeled with Cy3. The in-clusion of an internal standard improves the matching of in-tra- and intergel images and allows normalization across all
gels (Alban et al., 2003), using a double laser beam scanner(Tonge et al., 2001; Karp et al., 2004; Karp and Lilley, 2005).
Before isoelectric focusing, labeled samples were dilutedin an equal volume of 2 · sample buffer containing 130 mMdithiothreitol (DTT) and 2% (v/v) IPG buffer (GE Health-care). Samples from each group (40 lg) were combined withan equal amount of internal standard, and 80 lg of totalprotein was loaded on the gel; rehydration buffer (7 M urea,2 M thiourea, 2% CHAPS, 65 mM DTT, 0.5% IPG buffer [pH3.5–9.5], and bromophenol blue [BBF] in traces) was addedto a final volume of 450 ll. Samples were separated on 24-cm,3–10 nonlinear pH gradient IPG strips, with a voltage gra-dient ranging from 200 to 8000 V, for a total of 70,000 VhT(VhT, total volt hours accumulated during the entire run atthe current time), using an Ettan IPGphor electrophoresisunit (GE Healthcare). Each sample type was run in triplicateto minimize the intergel variability and to increase the reli-ability of the results. After focusing, IPG strips were equili-brated in an SDS reducing buffer (6 M urea, 2% SDS, 20%glycerol, 375 mM Tris-HCl [pH 8.8], 65 mM DTT) for 15 min,and then alkylated for 8 min in the same buffer containing135 mM iodoacetamide instead of DTT. The second dimen-sion was carried out in 20 · 25 cm2, 12% T, 2.5% C constantconcentration polyacrylamide gels at 20�C and 15 mA pergel, using an Ettan DALT II system (GE Healthcare).
CyDye-labeled gels were visualized and acquired with aTyphoon 9200 imager (GE Healthcare). Excitation andemission wavelengths were chosen according to the manu-facturer’s recommendations (Cy3: excitation, 532 nm; emis-sion, 580 nm; bandpass filter [BP], 30; Cy5: excitation, 633 nm,emission, 670 nm; BP, 30). Resolution was at 100 lm and thephotomultiplier voltage was set to a level at which the mostabundant spots in the gels were slightly beneath saturation.Image analysis was performed with DeCyder version 6.5software (GE Healthcare). All gel images were imported intoindividual Differential In-gel Analysis (DIA) workspaces.Using the Batch Processor tool, automated detection of pro-tein spots was performed with the following filter settings:estimated number of spots, 10,000; exclusion slope, > 1.2;minimal area cutoff, < 200; and peak height, < 14 or > 100,000(proteins with a value of peak height < 14 or > 100000 wereexcluded from the analysis). DIA workspaces were thenmanually edited to eliminate gel artifacts (e.g., plate scratches,dust specks) and to reinclude any incorrectly excluded spots.The resulting spot maps (containing the spot identifiers, lo-cations, and normalized volumes for all protein spots in eachchannel of each gel) were further processed in the BiologicalVariation Analysis (BVA) module. Individual DIA work-spaces for all analytical gels were imported into the BVAmodule. The BVA workspace was used for intergel proteinspot matching. Statistical analysis was performed withDeCyder EDA module version 1.0 (Extended Data Analysis).Protein filters were set to select only those protein spots thatmatched at least on 90% of the gel images; these protein spotswere included in data analysis. Proteins of interest wereidentified by matrix-assisted laser desorption/ionization-timeof flight peptide mass fingerprinting (MALDI-ToF PMF).
Protein identification by MALDI-ToF/ToF
To provide a proper amount of peptides for mass spec-trometry analysis, semipreparative gels, containing 400 lg of
148 MACEDO ET AL.

total protein extract per strip, were loaded; electrophoreticconditions were the same as for 2D-DIGE, except that gelswere stained with a protein fluorescent stain, as re-commended by the manufacturer (deep purple total proteinstain, 5 ml/liter; GE Healthcare). Image acquisition wasperformed with a Typhoon 9200 laser scanner. Proteinidentification methods are described below and in anMIAPE-MS compliant form in Supplementary Table S3(Taylor et al., 2007). Spots of interest were excised from eachgel, using an Ettan spot picker robotic system (GE Health-care), destained in 50% methanol–50 mM ammonium bicar-bonate (AMBIC), and incubated with 30 ll of trypsin (4 ng/ll) (Promega, Madison, WI) dissolved in 10 mM AMBIC for16 hr at 37�C. Released peptides were subjected to reversed-phase chromatography (Zip-Tip C18 micro; Millipore, Bed-ford, MA), eluted with 50% acetonitrile–1% formic acid. Onemicroliter of peptide mixture was spotted onto the sampleplate of an Ultraflex III MALDI-ToF/ToF (Bruker Daltonics,Billerica, MA) mass spectrometer; an equal volume of 10-mg/ml a-cyano-4-hydroxycinnamic acid (CHCA) matrixdissolved in 70% acetonitrile–30% 50 mM citric acid wasapplied and spots were air dried at room temperature. MSproceeded at an accelerating voltage of 25 kV and spectrawere externally calibrated with a peptide calibration stan-dard mixture (Bruker Daltonics); 1000 laser shots were takenper spectrum. Proteins were identified by comparing thedigest peaks with a computer-generated database of trypticpeptides from known proteins, using MASCOT, which usesa robust probabilistic scoring algorithm. Search was carriedout by correlation of uninterpreted spectra to Rodentia en-tries in the National Center for Biotechnology Information(NCBI) nonredundant (nr) database. With regard to MAS-COT parameters, one missed cleavage per peptide was al-lowed and carbamidomethylation, as fixed modification, andmethionine oxidation, as variable modification, were set.Peptide mass tolerance was set at 30 ppm.
Myosin heavy chain isoform composition
SDS electrophoresis was performed on muscle extracts,using a discontinuous buffer system with a 4% stacking gel(pH 6.8) and 37% glycerol, 6% T constant concentrationrunning gel (pH 8.8) (Danieli Betto et al., 1986). Samples wereseparated at 100 V, overnight. Gels were stained with SYPROorange (Molecular Probes/Invitrogen) and scanned with a570 nm emission filter on Typhoon 9200 imager (GEHealthcare). Protein band quantification was achieved withImageQuant software (Molecular Dynamics/GE Healthcare,Sunnyvale, CA); for each lane, myosin heavy chain (MyHC)bands were normalized against the total MyHC content.Individual samples (1 lg) were run in triplicate. Molecularweight markers containing MyHC from rabbit (212 kDa) andbovine a2-macroglobulin (170 kDa) were run in a separatelane. The significance of differences between control/AAV-IGF1 15 days and control/AAV-IGF1 30 days was computedby Student t test, the significance level being set at p < 0.01. Atwo-tailed F test was applied in order to verify the homo-scedasticity of variances.
Statistical analysis
One-way analysis of variance (ANOVA) and Bonferroni/Dunn’s post hoc test were used to compare multiple groups.
Pairwise comparison between groups was performed byStudent t test.
For proteomic experiments, statistically significant differ-ences were computed by independent one-way ANOVAcoupled to Turkey’s multiple group comparison test; thesignificance level was set at p < 0.01. To minimize inclusion offalse-positive protein spot changes, protein expression datawere filtered according to the following criteria: independentone-way ANOVA coupled to Turkey’s multiple groupcomparison test ( p < 0.01), 1.15-fold difference in abundanceand false discovery rate (FDR). A change of 1.15-fold andabove in protein abundance was considered for the presentanalysis, taking into account the power of the DIGE methodto detect reliable difference in protein abundance down to15% (Marouga et al., 2005; Viswanathan et al., 2006). FDRcorrection was applied as the multiple testing correctionmethod to keep the overall error rate as low as possible.
Results
IGF1 overexpression by AAV vectors induces skeletalmuscle hypertrophy and angiogenesis
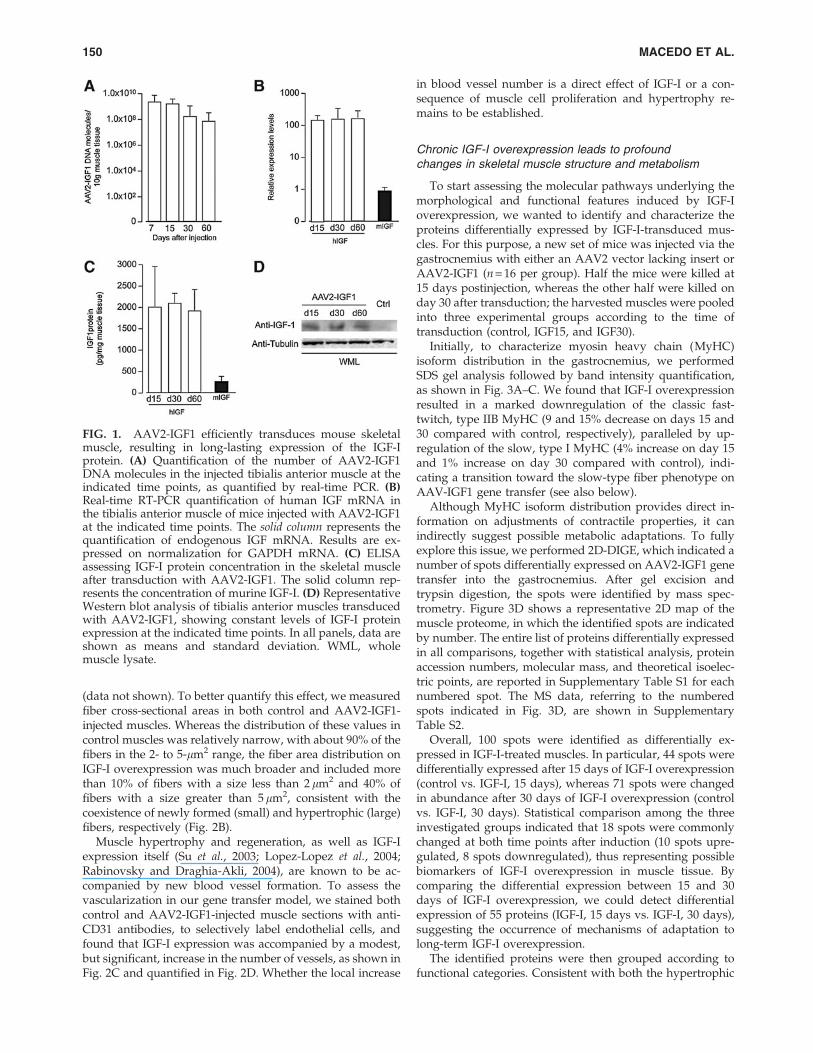
We generated an AAV2 vector carrying the human IGF-IcDNA under the control of the constitutive cytomegalovirus(CMV) promoter. To evaluate vector persistence and trans-gene expression in vivo, we injected 1 · 1011 viral genomes(VG) into the tibialis anterior muscle of mice (n = 10). Ondays 7, 15, 30, and 60 postinjection, we harvested both theAAV-injected and contralateral PBS-injected muscles andextracted DNA, RNA, and proteins. Viral DNA was found topersist in the injected muscles up to 60 days after transduc-tion, yet with a net tendency to decrease over time (Fig. 1A),most likely as a consequence of the loss of nonnuclear DNAin the transduced cells, in accordance with previous obser-vations (Tafuro et al., 2009). However, transgene expressionremained stable from day 15 to day 60, as determined bymeasuring human IGF-I mRNA levels by quantitative real-time PCR (Fig. 1B), as well as by detecting the human IGF-Iprotein by both ELISA (Fig. 1C) and Western blotting (Fig.1D), in whole muscle lysates. By these measurements, thelevels of expression of transduced IGF-I exceeded by morethan 100- and 10-fold those of the endogenous mouse mRNAand protein, respectively.
To start assessing the biological effect of IGF-I on musclefibers, morphometric analysis was performed on sectionsfrom AAV2-IGF1-injected tibialis anterior, as well as fromthree control groups, including (1) the contralateral, PBS-injected muscle from AAV2-IGF1-treated mice, (2) the tibialisanterior muscle from mice injected with an AAV vectorlacking an insert, and (3) the same muscle from untreatedmice. No differences were ever observed for any of the an-alyzed parameters between the three control groups (datanot shown); for this reason, only controls from the contra-lateral muscles, injected with PBS, are included in the figures.
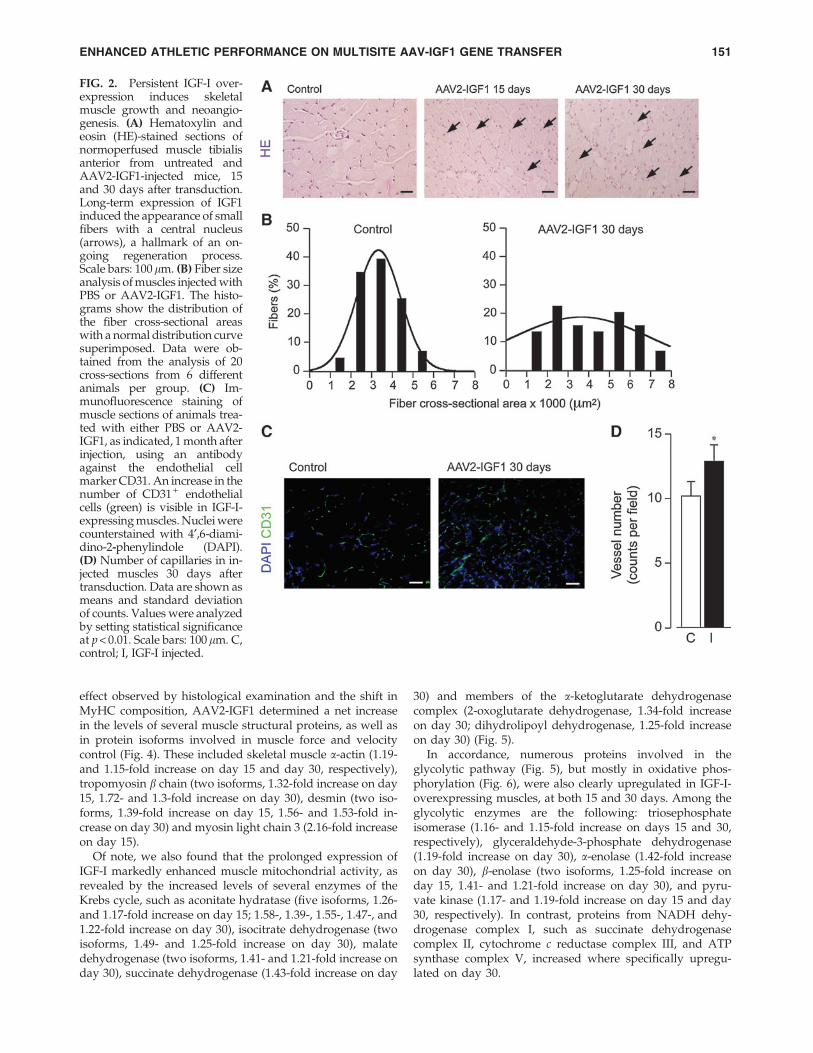
By hematoxylin staining, several fibers with a central nu-cleus, a known hallmark of muscle regeneration, were spe-cifically detected in IGF-I-expressing muscles at both 15 and30 days after vector injection (Fig. 2A), suggesting that IGF-Istimulated the growth of skeletal muscle cells. This effect,which persisted for at least 3 months after transduction, wasnot present in any of the controls and was never elicited byany of the several control vectors used in our laboratory
ENHANCED ATHLETIC PERFORMANCE ON MULTISITE AAV-IGF1 GENE TRANSFER 149
(data not shown). To better quantify this effect, we measuredfiber cross-sectional areas in both control and AAV2-IGF1-injected muscles. Whereas the distribution of these values incontrol muscles was relatively narrow, with about 90% of thefibers in the 2- to 5-lm2 range, the fiber area distribution onIGF-I overexpression was much broader and included morethan 10% of fibers with a size less than 2 lm2 and 40% offibers with a size greater than 5 lm2, consistent with thecoexistence of newly formed (small) and hypertrophic (large)fibers, respectively (Fig. 2B).
Muscle hypertrophy and regeneration, as well as IGF-Iexpression itself (Su et al., 2003; Lopez-Lopez et al., 2004;Rabinovsky and Draghia-Akli, 2004), are known to be ac-companied by new blood vessel formation. To assess thevascularization in our gene transfer model, we stained bothcontrol and AAV2-IGF1-injected muscle sections with anti-CD31 antibodies, to selectively label endothelial cells, andfound that IGF-I expression was accompanied by a modest,but significant, increase in the number of vessels, as shown inFig. 2C and quantified in Fig. 2D. Whether the local increase
in blood vessel number is a direct effect of IGF-I or a con-sequence of muscle cell proliferation and hypertrophy re-mains to be established.
Chronic IGF-I overexpression leads to profoundchanges in skeletal muscle structure and metabolism
To start assessing the molecular pathways underlying themorphological and functional features induced by IGF-Ioverexpression, we wanted to identify and characterize theproteins differentially expressed by IGF-I-transduced mus-cles. For this purpose, a new set of mice was injected via thegastrocnemius with either an AAV2 vector lacking insert orAAV2-IGF1 (n = 16 per group). Half the mice were killed at15 days postinjection, whereas the other half were killed onday 30 after transduction; the harvested muscles were pooledinto three experimental groups according to the time oftransduction (control, IGF15, and IGF30).
Initially, to characterize myosin heavy chain (MyHC)isoform distribution in the gastrocnemius, we performedSDS gel analysis followed by band intensity quantification,as shown in Fig. 3A–C. We found that IGF-I overexpressionresulted in a marked downregulation of the classic fast-twitch, type IIB MyHC (9 and 15% decrease on days 15 and30 compared with control, respectively), paralleled by up-regulation of the slow, type I MyHC (4% increase on day 15and 1% increase on day 30 compared with control), indi-cating a transition toward the slow-type fiber phenotype onAAV-IGF1 gene transfer (see also below).
Although MyHC isoform distribution provides direct in-formation on adjustments of contractile properties, it canindirectly suggest possible metabolic adaptations. To fullyexplore this issue, we performed 2D-DIGE, which indicated anumber of spots differentially expressed on AAV2-IGF1 genetransfer into the gastrocnemius. After gel excision andtrypsin digestion, the spots were identified by mass spec-trometry. Figure 3D shows a representative 2D map of themuscle proteome, in which the identified spots are indicatedby number. The entire list of proteins differentially expressedin all comparisons, together with statistical analysis, proteinaccession numbers, molecular mass, and theoretical isoelec-tric points, are reported in Supplementary Table S1 for eachnumbered spot. The MS data, referring to the numberedspots indicated in Fig. 3D, are shown in SupplementaryTable S2.
Overall, 100 spots were identified as differentially ex-pressed in IGF-I-treated muscles. In particular, 44 spots weredifferentially expressed after 15 days of IGF-I overexpression(control vs. IGF-I, 15 days), whereas 71 spots were changedin abundance after 30 days of IGF-I overexpression (controlvs. IGF-I, 30 days). Statistical comparison among the threeinvestigated groups indicated that 18 spots were commonlychanged at both time points after induction (10 spots upre-gulated, 8 spots downregulated), thus representing possiblebiomarkers of IGF-I overexpression in muscle tissue. Bycomparing the differential expression between 15 and 30days of IGF-I overexpression, we could detect differentialexpression of 55 proteins (IGF-I, 15 days vs. IGF-I, 30 days),suggesting the occurrence of mechanisms of adaptation tolong-term IGF-I overexpression.
The identified proteins were then grouped according tofunctional categories. Consistent with both the hypertrophic
FIG. 1. AAV2-IGF1 efficiently transduces mouse skeletalmuscle, resulting in long-lasting expression of the IGF-Iprotein. (A) Quantification of the number of AAV2-IGF1DNA molecules in the injected tibialis anterior muscle at theindicated time points, as quantified by real-time PCR. (B)Real-time RT-PCR quantification of human IGF mRNA inthe tibialis anterior muscle of mice injected with AAV2-IGF1at the indicated time points. The solid column represents thequantification of endogenous IGF mRNA. Results are ex-pressed on normalization for GAPDH mRNA. (C) ELISAassessing IGF-I protein concentration in the skeletal muscleafter transduction with AAV2-IGF1. The solid column rep-resents the concentration of murine IGF-I. (D) RepresentativeWestern blot analysis of tibialis anterior muscles transducedwith AAV2-IGF1, showing constant levels of IGF-I proteinexpression at the indicated time points. In all panels, data areshown as means and standard deviation. WML, wholemuscle lysate.
150 MACEDO ET AL.
effect observed by histological examination and the shift inMyHC composition, AAV2-IGF1 determined a net increasein the levels of several muscle structural proteins, as well asin protein isoforms involved in muscle force and velocitycontrol (Fig. 4). These included skeletal muscle a-actin (1.19-and 1.15-fold increase on day 15 and day 30, respectively),tropomyosin b chain (two isoforms, 1.32-fold increase on day15, 1.72- and 1.3-fold increase on day 30), desmin (two iso-forms, 1.39-fold increase on day 15, 1.56- and 1.53-fold in-crease on day 30) and myosin light chain 3 (2.16-fold increaseon day 15).
Of note, we also found that the prolonged expression ofIGF-I markedly enhanced muscle mitochondrial activity, asrevealed by the increased levels of several enzymes of theKrebs cycle, such as aconitate hydratase (five isoforms, 1.26-and 1.17-fold increase on day 15; 1.58-, 1.39-, 1.55-, 1.47-, and1.22-fold increase on day 30), isocitrate dehydrogenase (twoisoforms, 1.49- and 1.25-fold increase on day 30), malatedehydrogenase (two isoforms, 1.41- and 1.21-fold increase onday 30), succinate dehydrogenase (1.43-fold increase on day
30) and members of the a-ketoglutarate dehydrogenasecomplex (2-oxoglutarate dehydrogenase, 1.34-fold increaseon day 30; dihydrolipoyl dehydrogenase, 1.25-fold increaseon day 30) (Fig. 5).
In accordance, numerous proteins involved in theglycolytic pathway (Fig. 5), but mostly in oxidative phos-phorylation (Fig. 6), were also clearly upregulated in IGF-I-overexpressing muscles, at both 15 and 30 days. Among theglycolytic enzymes are the following: triosephosphateisomerase (1.16- and 1.15-fold increase on days 15 and 30,respectively), glyceraldehyde-3-phosphate dehydrogenase(1.19-fold increase on day 30), a-enolase (1.42-fold increaseon day 30), b-enolase (two isoforms, 1.25-fold increase onday 15, 1.41- and 1.21-fold increase on day 30), and pyru-vate kinase (1.17- and 1.19-fold increase on day 15 and day30, respectively). In contrast, proteins from NADH dehy-drogenase complex I, such as succinate dehydrogenasecomplex II, cytochrome c reductase complex III, and ATPsynthase complex V, increased where specifically upregu-lated on day 30.
FIG. 2. Persistent IGF-I over-expression induces skeletalmuscle growth and neoangio-genesis. (A) Hematoxylin andeosin (HE)-stained sections ofnormoperfused muscle tibialisanterior from untreated andAAV2-IGF1-injected mice, 15and 30 days after transduction.Long-term expression of IGF1induced the appearance of smallfibers with a central nucleus(arrows), a hallmark of an on-going regeneration process.Scale bars: 100lm. (B) Fiber sizeanalysis of muscles injected withPBS or AAV2-IGF1. The histo-grams show the distribution ofthe fiber cross-sectional areaswith a normal distribution curvesuperimposed. Data were ob-tained from the analysis of 20cross-sections from 6 differentanimals per group. (C) Im-munofluorescence staining ofmuscle sections of animals trea-ted with either PBS or AAV2-IGF1, as indicated, 1 month afterinjection, using an antibodyagainst the endothelial cellmarker CD31. An increase in thenumber of CD31 + endothelialcells (green) is visible in IGF-I-expressing muscles. Nuclei werecounterstained with 4¢,6-diami-dino-2-phenylindole (DAPI).(D) Number of capillaries in in-jected muscles 30 days aftertransduction. Data are shown asmeans and standard deviationof counts. Values were analyzedby setting statistical significanceat p < 0.01. Scale bars: 100 lm. C,control; I, IGF-I injected.
ENHANCED ATHLETIC PERFORMANCE ON MULTISITE AAV-IGF1 GENE TRANSFER 151

On the other hand, transport proteins, such as serumalbumin and serotransferrin, which in skeletal muscle areassociated mainly with reactive oxygen species (ROS) pro-duction, appeared clearly decreased in IGF-I-expressingmuscle, indicating a lower level of oxidative stress in thesemuscles (two isoforms, 1.33- and 1.27-fold decrease on day15, 1.36- and 1.31-fold decrease on day 30 for serum albumin;two isoforms, 1.38- and 1.28-fold decrease on day 15, 1.36-and 1.21-fold decrease on day 30 for serotransferrin).
Last, and also in keeping with the induced muscle hy-pertrophy, a significant increment was also observed forenzymes involved in muscle energy production and transfer,such as adenylate kinase isoenzyme 1 (two isoforms, 1.33-and 1.15-fold increase on day 15, 1.36-fold increase on day30) and M-type creatine kinase (two isoforms, 1.33- and1.18-fold increase on day 15, 1.27-fold increase on day 30)(Supplementary Table S1).
AAV-IGF1 remarkably improves muscle performance
To investigate whether the profound changes observed inthe proteome of AAV2-IGF1-injected muscles eventually af-fected muscle performance, we applied an exhaustive stresstest to analyze and quantify physical endurance in mice. Forthis purpose, we used a swimming apparatus, consisting of a200-liter water plastic tank, equipped with a mobile shovel toproduce artificial waves, in order to prevent the animalsfrom floating during the swimming sessions. Mice were in-jected either with an AAV2 vector lacking insert or withAAV2-IGF1 (n = 12 per group), via muscles of all four limbs(tibialis anterior, gastrocnemius, quadriceps femoris, bicepsbrachii, and triceps brachii), in order to transduce the majormuscle groups of the body.
FIG. 3. Proteomic profiling reveals pro-found changes in the expression levels ofseveral proteins in IGF-I-overexpressingmuscles. (A) Representative SDS–PAGEimages of MyHC fiber type compositionof mouse muscle proteins extracts: pooledcontrol (Ctrl), AAV2-IGF1 after 15 days(d15), and AAV2-IGF1 after 30 days(d30). (B) Graphical representation of fi-ber type IIB composition (%) in the vari-ous muscle pools, as indicated. Proteinband quantification was performed withImageQuant (Molecular Dynamics/GEHealthcare) software. Data are shown asmeans and standard deviation; asterisksdenote statistical significance ( p < 0.01).(C) Graphical representation of fiber typeI composition (%) in the various musclepools, as indicated. Protein band quanti-fication was performed by Image Quant(Molecular Dynamics) software. Data areshown as means and standard deviation;asterisks denote statistical significance( p < 0.01). (D) Gastrocnemius muscleprotein profiling by 2D-DIGE. Typical 2-D image of gastrocnemius muscle proteinextract separated in a pH 3–10 nonlinear
IPG strip in the first dimension and SDS gel (12% T, 2.5% C) as the second dimension. The image was acquired with a 532-nmlaser beam and 580-nm emission filter. Automated image analysis by DeCyder software detected and matched. Spots founddifferentially changed by in-gel differential analysis are indicated by spot number and listed in Supplementary Table S1.
FIG. 4. Proteomic profiling of IGF-I-overexpressing mus-cles reveals profound changes in the levels of structural andcontractile proteins. Schematic representation showing themajor compartments of the sarcomere; proteins known foreach compartment are listed. Numbers in parentheses referto spot numbers, whereas arrows indicate significantly( p < 0.05) up- or downregulated spots between the three ex-perimental groups (controls and muscles overexpressingIGF-I for either 15 or 30 days).
152 MACEDO ET AL.
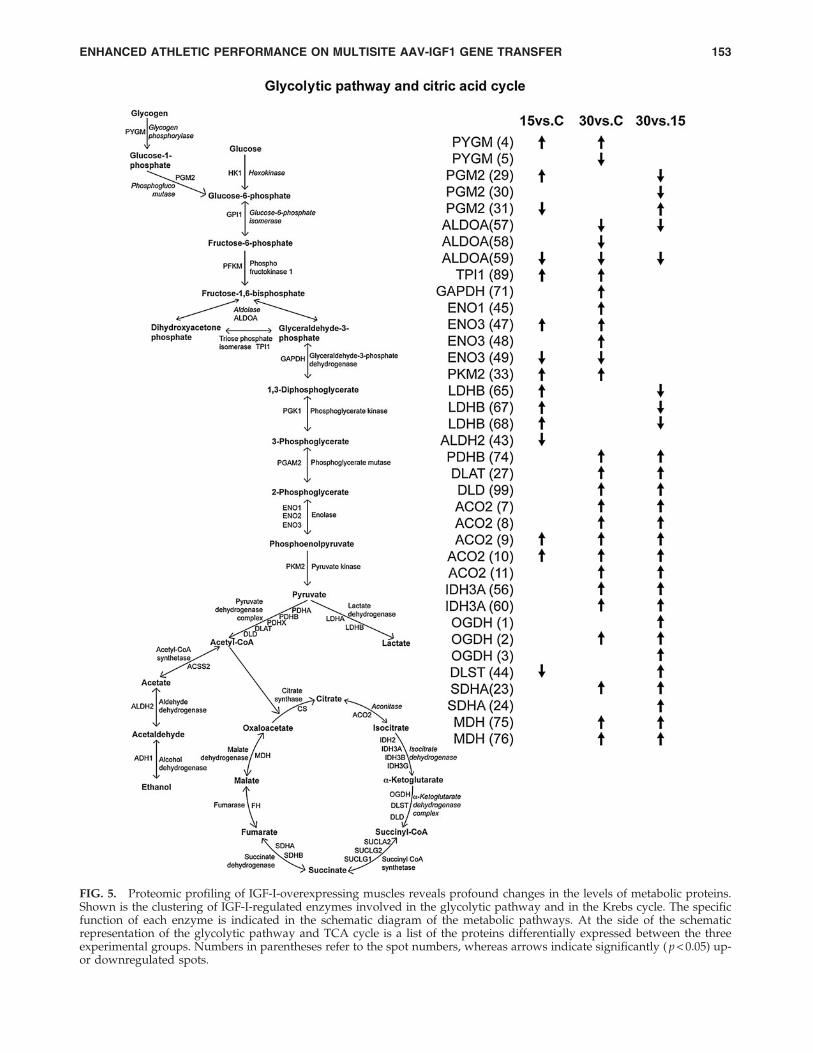
FIG. 5. Proteomic profiling of IGF-I-overexpressing muscles reveals profound changes in the levels of metabolic proteins.Shown is the clustering of IGF-I-regulated enzymes involved in the glycolytic pathway and in the Krebs cycle. The specificfunction of each enzyme is indicated in the schematic diagram of the metabolic pathways. At the side of the schematicrepresentation of the glycolytic pathway and TCA cycle is a list of the proteins differentially expressed between the threeexperimental groups. Numbers in parentheses refer to the spot numbers, whereas arrows indicate significantly ( p < 0.05) up-or downregulated spots.
ENHANCED ATHLETIC PERFORMANCE ON MULTISITE AAV-IGF1 GENE TRANSFER 153
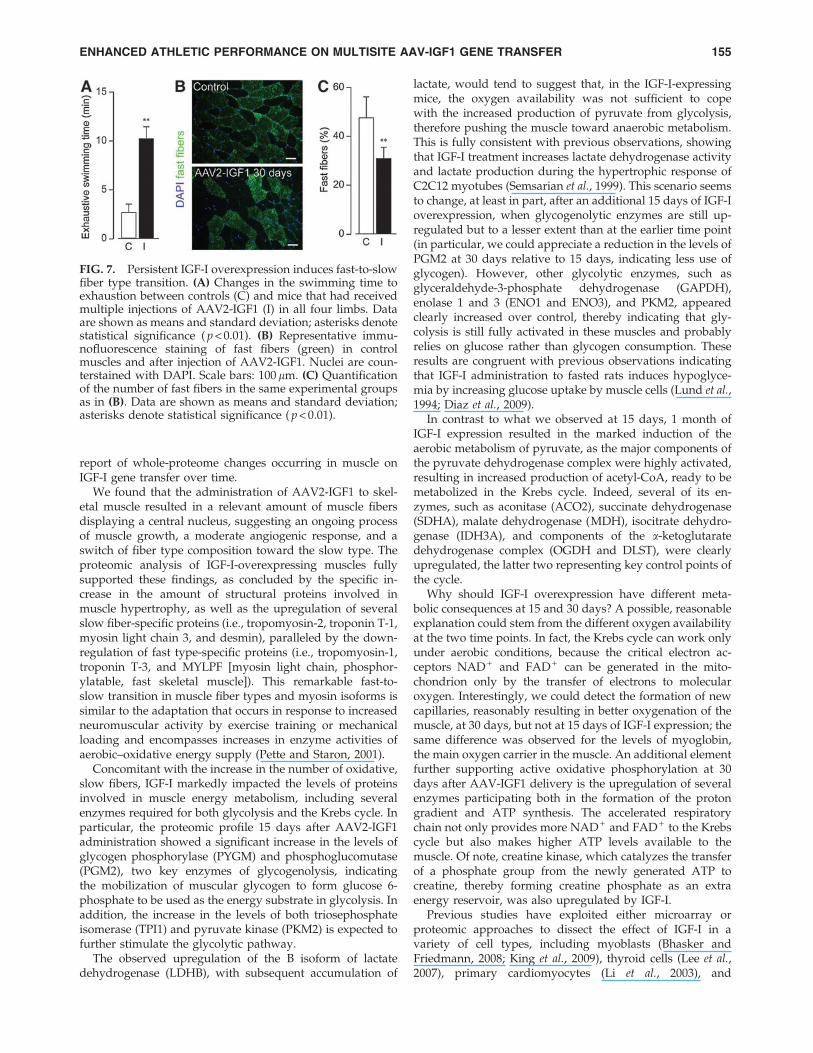
Thirty days after AAV delivery, each mouse wasallowed to swim for 15 min, every second day for 2 weeks,in the presence of artificial waves. At the end of thistraining period, physical endurance was determined byletting the animals swim until exhaustion. As shown inFig. 7A, the injection of AAV2-IGF1 into the whole limbmuscle mass accounted for a > 3-fold increase in enduranceperformance.
Parallel to this functional test, we also analyzed whetherAAV2-IGF1 gene transfer modified the composition of theinjected muscles. At the end of the swimming experiment,one tibialis anterior muscle for each animal was snap frozento histologically analyze fiber type composition, by using anantibody specifically recognizing fast fiber myosin. Incomplete agreement with the different pattern of myosinheavy chain composition, AAV2-IGF1 transduction resultedin a lower number of fast fibers (1.8-fold; shown in Fig. 7B
and C), confirming the capacity of AAV2-IGF1 to induce aswitch toward the slow phenotype.
Discussion
In this work we describe the functional and structural ef-fects of IGF-I gene delivery into multiple muscles of adultanimals, using AAV vectors. At least three novel featuresrender this mouse model relevant for both gene therapy andgene doping. First, unlike in previous models, we transducedall the major muscle masses of the four limbs, therefore beingable to assess not only the strength of a single muscle but theoverall performance of the mouse in a novel endurance test.Second, in the same animals we analyzed biochemical,functional, and structural parameters, thereby providing acomplete scenario of the muscle response to IGF-I genetransfer over time. Third, to our knowledge, this is the first
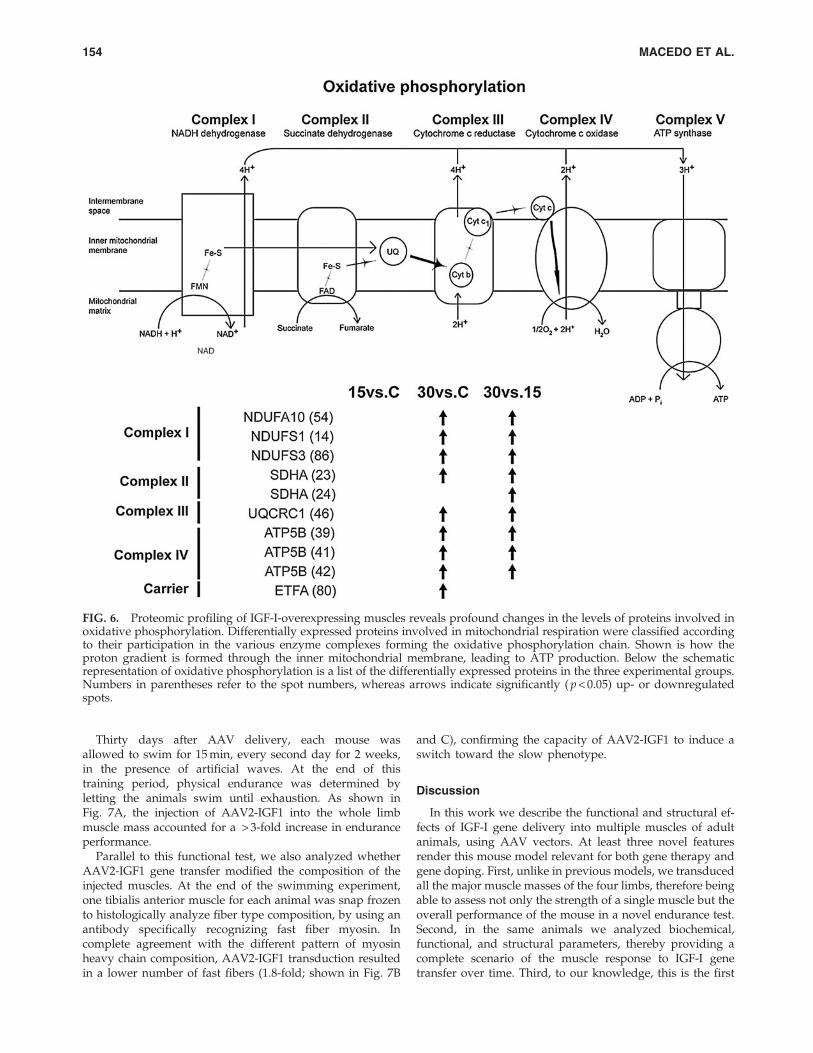
FIG. 6. Proteomic profiling of IGF-I-overexpressing muscles reveals profound changes in the levels of proteins involved inoxidative phosphorylation. Differentially expressed proteins involved in mitochondrial respiration were classified accordingto their participation in the various enzyme complexes forming the oxidative phosphorylation chain. Shown is how theproton gradient is formed through the inner mitochondrial membrane, leading to ATP production. Below the schematicrepresentation of oxidative phosphorylation is a list of the differentially expressed proteins in the three experimental groups.Numbers in parentheses refer to the spot numbers, whereas arrows indicate significantly ( p < 0.05) up- or downregulatedspots.
154 MACEDO ET AL.
report of whole-proteome changes occurring in muscle onIGF-I gene transfer over time.
We found that the administration of AAV2-IGF1 to skel-etal muscle resulted in a relevant amount of muscle fibersdisplaying a central nucleus, suggesting an ongoing processof muscle growth, a moderate angiogenic response, and aswitch of fiber type composition toward the slow type. Theproteomic analysis of IGF-I-overexpressing muscles fullysupported these findings, as concluded by the specific in-crease in the amount of structural proteins involved inmuscle hypertrophy, as well as the upregulation of severalslow fiber-specific proteins (i.e., tropomyosin-2, troponin T-1,myosin light chain 3, and desmin), paralleled by the down-regulation of fast type-specific proteins (i.e., tropomyosin-1,troponin T-3, and MYLPF [myosin light chain, phosphor-ylatable, fast skeletal muscle]). This remarkable fast-to-slow transition in muscle fiber types and myosin isoforms issimilar to the adaptation that occurs in response to increasedneuromuscular activity by exercise training or mechanicalloading and encompasses increases in enzyme activities ofaerobic–oxidative energy supply (Pette and Staron, 2001).
Concomitant with the increase in the number of oxidative,slow fibers, IGF-I markedly impacted the levels of proteinsinvolved in muscle energy metabolism, including severalenzymes required for both glycolysis and the Krebs cycle. Inparticular, the proteomic profile 15 days after AAV2-IGF1administration showed a significant increase in the levels ofglycogen phosphorylase (PYGM) and phosphoglucomutase(PGM2), two key enzymes of glycogenolysis, indicatingthe mobilization of muscular glycogen to form glucose 6-phosphate to be used as the energy substrate in glycolysis. Inaddition, the increase in the levels of both triosephosphateisomerase (TPI1) and pyruvate kinase (PKM2) is expected tofurther stimulate the glycolytic pathway.
The observed upregulation of the B isoform of lactatedehydrogenase (LDHB), with subsequent accumulation of
lactate, would tend to suggest that, in the IGF-I-expressingmice, the oxygen availability was not sufficient to copewith the increased production of pyruvate from glycolysis,therefore pushing the muscle toward anaerobic metabolism.This is fully consistent with previous observations, showingthat IGF-I treatment increases lactate dehydrogenase activityand lactate production during the hypertrophic response ofC2C12 myotubes (Semsarian et al., 1999). This scenario seemsto change, at least in part, after an additional 15 days of IGF-Ioverexpression, when glycogenolytic enzymes are still up-regulated but to a lesser extent than at the earlier time point(in particular, we could appreciate a reduction in the levels ofPGM2 at 30 days relative to 15 days, indicating less use ofglycogen). However, other glycolytic enzymes, such asglyceraldehyde-3-phosphate dehydrogenase (GAPDH),enolase 1 and 3 (ENO1 and ENO3), and PKM2, appearedclearly increased over control, thereby indicating that gly-colysis is still fully activated in these muscles and probablyrelies on glucose rather than glycogen consumption. Theseresults are congruent with previous observations indicatingthat IGF-I administration to fasted rats induces hypoglyce-mia by increasing glucose uptake by muscle cells (Lund et al.,1994; Diaz et al., 2009).
In contrast to what we observed at 15 days, 1 month ofIGF-I expression resulted in the marked induction of theaerobic metabolism of pyruvate, as the major components ofthe pyruvate dehydrogenase complex were highly activated,resulting in increased production of acetyl-CoA, ready to bemetabolized in the Krebs cycle. Indeed, several of its en-zymes, such as aconitase (ACO2), succinate dehydrogenase(SDHA), malate dehydrogenase (MDH), isocitrate dehydro-genase (IDH3A), and components of the a-ketoglutaratedehydrogenase complex (OGDH and DLST), were clearlyupregulated, the latter two representing key control points ofthe cycle.
Why should IGF-I overexpression have different meta-bolic consequences at 15 and 30 days? A possible, reasonableexplanation could stem from the different oxygen availabilityat the two time points. In fact, the Krebs cycle can work onlyunder aerobic conditions, because the critical electron ac-ceptors NAD + and FAD + can be generated in the mito-chondrion only by the transfer of electrons to molecularoxygen. Interestingly, we could detect the formation of newcapillaries, reasonably resulting in better oxygenation of themuscle, at 30 days, but not at 15 days of IGF-I expression; thesame difference was observed for the levels of myoglobin,the main oxygen carrier in the muscle. An additional elementfurther supporting active oxidative phosphorylation at 30days after AAV-IGF1 delivery is the upregulation of severalenzymes participating both in the formation of the protongradient and ATP synthesis. The accelerated respiratorychain not only provides more NAD + and FAD + to the Krebscycle but also makes higher ATP levels available to themuscle. Of note, creatine kinase, which catalyzes the transferof a phosphate group from the newly generated ATP tocreatine, thereby forming creatine phosphate as an extraenergy reservoir, was also upregulated by IGF-I.
Previous studies have exploited either microarray orproteomic approaches to dissect the effect of IGF-I in avariety of cell types, including myoblasts (Bhasker andFriedmann, 2008; King et al., 2009), thyroid cells (Lee et al.,2007), primary cardiomyocytes (Li et al., 2003), and
FIG. 7. Persistent IGF-I overexpression induces fast-to-slowfiber type transition. (A) Changes in the swimming time toexhaustion between controls (C) and mice that had receivedmultiple injections of AAV2-IGF1 (I) in all four limbs. Dataare shown as means and standard deviation; asterisks denotestatistical significance ( p < 0.01). (B) Representative immu-nofluorescence staining of fast fibers (green) in controlmuscles and after injection of AAV2-IGF1. Nuclei are coun-terstained with DAPI. Scale bars: 100 lm. (C) Quantificationof the number of fast fibers in the same experimental groupsas in (B). Data are shown as means and standard deviation;asterisks denote statistical significance ( p < 0.01).
ENHANCED ATHLETIC PERFORMANCE ON MULTISITE AAV-IGF1 GENE TRANSFER 155
fibroblasts (Toyoshima et al., 2004). Most of these studiesconcluded that IGF-I regulates the expression of genes re-lated to mitogenesis and differentiation, cell cycle, tran-scriptional and translational processes, cellular respiration,and mitochondrial function and cell survival. However, afew overlaps exist between these results and ours, and in-clude GAPDH (Dont and Holzenberger, 2003), triosepho-sphate isomerase and enolase 1 (King et al., 2009), and ATPsynthase and aldolase A (ALDOA) (Liu and Yi, 2001) (thelatter being induced in cardiomyocytes, while reduced in ourmodel). This wide discrepancy again underlines the rele-vance of performing genomic and proteomic studies in livinganimal models, including postmitotic cells.
When the IGF-I-dosed mice were challenged by subjectingthem to an exhaustive swimming test, the observed histo-logical and metabolic events were found to eventually resultin markedly improved endurance, allowing the mice to swimfor a 3-fold longer time than controls. Consistent with pre-vious results showing that IGF-I transgenic mice displayed anenhanced tetanic force (Musaro et al., 2001), this findingclearly shows that diffuse AAV2-IGF1 delivery to both fore-limbs and hind limbs confers not only a specific gain inmuscle power, but also higher endurance in a complexphysical activity such as swimming. Thus, our model fullysupports the concept that IGF-I gene delivery can be consid-ered a realistic way to achieve greater athletic performance.
Acknowledgments
This work was supported by grant 06B6MG from theWorld Anti-Doping Agency (WADA) to M.G., and from theItalian Ministry of University and Scientific Research (grantFIRB RBRN07BMCT to C.G.).
Author Disclosure Statement
No competing financial interests exist.
References
Alban, A., David, S.O., Bjorkesten, L., et al., (2003). A novelexperimental design for comparative two-dimensional gelanalysis: Two-dimensional difference gel electrophoresis in-corporating a pooled internal standard. Proteomics 3, 36–44.
Arsic, N., Zentilin, L., Zacchigna, S., et al., (2003). Induction offunctional neovascularization by combined VEGF and angio-poietin-1 gene transfer using AAV vectors. Mol. Ther. 7, 450–459.
Barton-Davis, E.R., Shoturma, D.I., Musaro, A., et al., (1998).Viral mediated expression of insulin-like growth factor Iblocks the aging-related loss of skeletal muscle function. Proc.Natl. Acad. Sci. U.S.A. 95, 15603–15607.
Benito, M., Valverde, A.M., and Lorenzo, M. (1996). IGF-I: Amitogen also involved in differentiation processes in mam-malian cells. Int. J. Biochem. Cell Biol. 28, 499–510.
Bhasker, C.R., and Friedmann, T. (2008). Insulin-like growthfactor-1 coordinately induces the expression of fatty acid andcholesterol biosynthetic genes in murine C2C12 myoblasts.BMC Genomics 9, 535.
Danieli Betto, D., Zerbato, E., and Betto, R. (1986). Type 1, 2A,and 2B myosin heavy chain electrophoretic analysis ofrat muscle fibers. Biochem. Biophys. Res. Commun. 138, 981–987.
Diaz, M., Vraskou, Y., Gutierrez, J., and Planas, J.V. (2009). Ex-pression of rainbow trout glucose transporters GLUT1 andGLUT4 during in vitro muscle cell differentiation and regula-tion by insulin and IGF-I. Am. J. Physiol. Regul. Integr. Comp.Physiol. 296, R794–R800.
Dont, J., and Holzenberger, M. (2003). IGF type 1 receptor: A cellcycle progression factor that regulates aging. Cell Cycle 2,270–272.
Fisher, K.J., Jooss, K., Alston, J., et al., (1997). Recombinantadeno-associated virus for muscle directed gene therapy. Nat.Med. 3, 306–312.
Goldspink, G., and Yang, S.Y. (2004). The splicing of the IGF-Igene to yield different muscle growth factors. Adv. Genet. 52,23–49.
Hakimi, P., Yang, J., Casadesus, G., et al., (2007). Overexpressionof the cytosolic form of phosphoenolpyruvate carboxykinase(GTP) in skeletal muscle repatterns energy metabolism in themouse. J. Biol. Chem. 282, 32844–32855.
Jennische, E., Skottner, A., and Hansson, H.A. (1987). Satellitecells express the trophic factor IGF-I in regenerating skeletalmuscle. Acta Physiol. Scand. 129, 9–15.
Karp, N.A., and Lilley, K.S. (2005). Maximising sensitivity fordetecting changes in protein expression: Experimental designusing minimal CyDyes. Proteomics 5, 3105–3115.
Karp, N.A., Kreil, D.P., and Lilley, K.S. (2004). Determining asignificant change in protein expression with DeCyder duringa pair-wise comparison using two-dimensional difference gelelectrophoresis. Proteomics 4, 1421–1432.
Keller, H.L., St. Pierre Schneider, B., Eppihimer, L.A., and Can-non, J.G. (1999). Association of IGF-I and IGF-II with myofiberregeneration in vivo. Muscle Nerve 22, 347–354.
Kessler, P.D., Podsakoff, G.M., Chen, X., et al. (1996). Gene de-livery to skeletal muscle results in sustained expression andsystemic delivery of a therapeutic protein. Proc. Natl. Acad.Sci. U.S.A. 93, 14082–14087.
King, C.C., Bouic, K., and Friedmann, T. (2009). A fractionationmethod to identify qauntitative changes in protein expressionmediated by IGF-1 on the proteome of murine C2C12 myo-blasts. Proteome Sci. 7, 28.
Kota, J., Handy, C.R., Haidet, A.M., et al., (2009). Follistatin genedelivery enhances muscle growth and strength in nonhumanprimates. Sci. Transl. Med. 1, 6ra15.
Lee, S., Barton, E.R., Sweeney, H.L., and Farrar, R.P. (2004). Viralexpression of insulin-like growth factor-I enhances musclehypertrophy in resistance-trained rats. J. Appl. Physiol. 96,1097–1104.
Lee, S.J., and McPherron, A.C. (2001). Regulation of myostatinactivity and muscle growth. Proc. Natl. Acad. Sci. U.S.A. 98,9306–9311.
Lee, Y.J., Park, D.O.J., Shin, C.S., et al., (2007). Microarray anal-ysis of thyroid stimulating hormone, insulin-like growthfactor-1, and insulin-induced gene expression in FRTL-5 thy-roid cells. J. Korean Med. Sci. 22, 883–890.
Li, T., Chen, Y.H., Liu, T.J., et al., (2003). Using DNA microarrayto identify Sp1 as a transcriptional regulatory element ofinsulin-like growth factor 1 in cardiac muscle cells. Circ. Res.93, 1202–1209.
Liu, J.H., and Yi, Z.W. (2001). [Relationship between serumthyroid hormone and GH–IGF axis, growth failure in ne-phrotic rats]. Hunan Yi Ke Da Xue Xue Bao 26, 263–266.
Lopez-Lopez, C., Leroith, D., and Torres-Aleman, I. (2004).Insulin-like growth factor I is required for vessel remodelingin the adult brain. Proc. Natl. Acad. Sci. U.S.A. 101, 9833–9838.
156 MACEDO ET AL.

Lund, S., Flyvbjerg, A., Holman, G.D., et al., (1994). Comparativeeffects of IGF-I and insulin on the glucose transporter systemin rat muscle. Am. J. Physiol. 267, E461–E466.
Marouga, R., David, S., and Hawkins, E. (2005). The develop-ment of the DIGE system: 2D fluorescence difference gelanalysis technology. Anal. Bioanal. Chem. 382, 669–678.
Mueller, C., and Flotte, T.R. (2008). Clinical gene therapy usingrecombinant adeno-associated virus vectors. Gene Ther. 15,858–863.
Musaro, A., McCullagh, K.J., Naya, F.J., et al., (1999). IGF-1 in-duces skeletal myocyte hypertrophy through calcineurin inassociation with GATA-2 and NF-ATc1. Nature 400, 581–585.
Musaro, A., McCullagh, K., Paul, A., et al., (2001). Localized Igf-1transgene expression sustains hypertrophy and regenerationin senescent skeletal muscle. Nat. Genet. 27, 195–200.
Musaro, A., Giacinti, C., Borsellino, G., et al., (2004). Stem cell-mediated muscle regeneration is enhanced by local isoform ofinsulin-like growth factor 1. Proc. Natl. Acad. Sci. U.S.A. 101,1206–1210.
Pette, D., and Staron, R.S. (2001). Transitions of muscle fiberphenotypic profiles. Histochem. Cell Biol. 115, 359–372.
Rabinovsky, E.D., and Draghia-Akli, R. (2004). Insulin-likegrowth factor I plasmid therapy promotes in vivo angiogene-sis. Mol. Ther. 9, 46–55.
Semsarian, C., Sutrave, P., Richmond, D.R., and Graham, R.M.(1999). Insulin-like growth factor (IGF-I) induces myotube hy-pertrophy associated with an increase in anaerobic glycolysisin a clonal skeletal-muscle cell model. Biochem. J. 339, 443–451.
Su, E.J., Cioffi, C.L., Stefansson, S., et al., (2003). Gene therapyvector-mediated expression of insulin-like growth factors pro-tects cardiomyocytes from apoptosis and enhances neovascu-larization. Am. J. Physiol. Heart Circ. Physiol. 284, H1429–H1440.
Tafuro, S., Ayuso, E., Zacchigna, S., et al., (2009). Inducibleadeno-associated virus vectors promote functional angiogen-esis in adult organisms via regulated vascular endothelialgrowth factor expression. Cardiovasc. Res. 83, 663–671.
Takahashi, T., Ishida, K., Itoh, K., et al., (2003). IGF-I genetransfer by electroporation promotes regeneration in a muscleinjury model. Gene Ther. 10, 612–620.
Taylor, C.F., Paton, N.W., Lilley, K.S., et al., (2007). The mini-mum information about a proteomics experiment (MIAPE).Nat. Biotechnol. 25, 887–893.
Tonge, R., Shaw, J., Middleton, B., et al., (2001). Validationand development of fluorescence two-dimensional differen-tial gel electrophoresis proteomics technology. Proteomics 1,377–396.
Toyoshima, Y., Karas, M., Yakar, S., et al., (2004). TDAG51 me-diates the effects of insulin-like growth factor I (IGF-I) on cellsurvival. J. Biol. Chem. 279, 25898–25904.
Viswanathan, S., Unlu, M., and Minden, J.S. (2006). Two-dimensional difference gel electrophoresis. Nat. Protoc. 1,1351–1358.
Wang, Y.X., Zhang, C.L., Yu, R.T., et al., (2004). Regulation ofmuscle fiber type and running endurance by PPARd. PLoSBiol. 2, e294.
White, T.P., and Esser, K.A. (1989). Satellite cell and growthfactor involvement in skeletal muscle growth. Med. Sci. SportsExerc. 21, S158–S163.
Zhou, S., Murphy, J.E., Escobedo, J.A., and Dwarki, V.J. (1998).Adeno-associated virus-mediated delivery of erythropoietinleads to sustained elevation of hematocrit in nonhuman pri-mates. Gene Ther. 5, 665–670.
Address correspondence to:Dr. Mauro Giacca
Molecular Medicine LaboratoryInternational Centre for Genetic Engineering
and Biotechnology (ICGEB)34149, Trieste
Italy
E-mail: [email protected]
Received for publication August 29, 2011;accepted after revision October 15, 2011.
Published online: October 21, 2011.
ENHANCED ATHLETIC PERFORMANCE ON MULTISITE AAV-IGF1 GENE TRANSFER 157
Copyright © 2022 FDOKUMEN