Engineering geological characteristics of the 1998 Adana-Ceyhan earthquake, with particular emphasis...
20
Bull Eng Geol Env (2000) 59 : 99–118 7 Q Springer-Verlag 99 Engineering geological characteristics of the 1998 Adana-Ceyhan earthquake, with particular emphasis on liquefaction phenomena and the role of soil behaviour R. Ulusay 7 Ö. Aydan 7 H. Kumsar 7 H. Sönmez Received: 4 January 2000 7 Accepted: 28 March 2000 R. Ulusay (Y) 7 H. Sönmez Hacettepe University, Department of Geological Engineering, 06532 Ankara, Turkey e-mail: resat6hacettepe.edu.tr Fax: c90-312-2352542 Ö. Aydan Tokai University, Department of Marine Civil Engineering, Orido, 3–20–1, Shimizu, Shizuoka-Ken, 424, Japan H. Kumsar Pamukkale University, Department of Geological Engineering, Denizli, Turkey Abstract The Adana-Ceyhan earthquake (M s p6.2) occurred in the southern part of Turkey on 27 June 1998 and resulted in the loss of 145 lives and exten- sive damage to buildings in Ceyhan town and the settlement areas in its vicinity. Soil liquefaction, ground failure due to lateral spreading and rock falls occurred. The area of Adana is characterised by a large alluvial basin with a delta shape. Most of the basin is filled with Quaternary recent Holocene deposits. The recent rapid deposition of sediments and the very shallow groundwater table throughout the basin create conditions conducive to liquefac- tion. The results of a preliminary investigation of soil liquefaction caused by the earthquake and lique- faction assessments based on field performance data are presented together with evaluations concerning the likely contribution of the soils to the damage sustained by buildings. The results of the liquefac- tion susceptibility analysis indicated that the data from the liquefied sites were within the empirical bounds suggested by the field-performance evalua- tion method. It was also shown that shallow sand layers should have liquefied and the surface disrup- tion observed on the site could be predicted by the bounds used for the relationships between the thick- ness of liquefiable sediments and the overlying non- liquefiable soil. Site-response analyses based on acceleration response spectra from the actual earth- quake’s strong motion records revealed that soil behaviour was one of the most significant factors in the damage to buildings caused by the earthquake. Résumé Le tremblement de terre de Adana-Ceyhan survenu au sud de la Turquie le 27 juin 1998 á cause la perte de 145 vies humaines, des dommages éten- dus aux édifices dans la district de Ceyhan et la subsidence des alentours. La liquéfaction du sol, des mouvements latéraux de terrain et des choutes rocheuse sont aussi survenus dans la district. Dans cet article, les resultats d’une étude préliminaire de la liquéfaction du sol causée par le tremblement de terre, l’évaluation des liquéfaction basées sur les données terrain expérimentale ainsi que la contribu- tion possible du sol sur les dommages causées aux édifices sont présentés. La region de Çukurova est un delta caracterisé par une grande plaine alluviale. Le pluspart de la region á été remblayée par des depots récent d’Holocène de l’aire Quaternaire. L’accumula- tion rapide des sédiments récents ainsi que la faible profoundeur de la nappe superfacielle dans le bassin
-
Upload
independent -
Category
Documents
-
view
0 -
download
0
Transcript of Engineering geological characteristics of the 1998 Adana-Ceyhan earthquake, with particular emphasis...

Bull Eng Geol Env (2000) 59 : 99–118 7 Q Springer-Verlag 99
Engineering geologicalcharacteristics of the 1998Adana-Ceyhan earthquake,with particular emphasis onliquefaction phenomenaand the role of soilbehaviourR. Ulusay 7 Ö. Aydan 7 H. Kumsar 7 H. Sönmez
Received: 4 January 2000 7 Accepted: 28 March 2000
R. Ulusay (Y) 7 H. SönmezHacettepe University, Department of Geological Engineering,06532 Ankara, Turkeye-mail: resat6hacettepe.edu.trFax: c90-312-2352542
Ö. AydanTokai University, Department of Marine Civil Engineering,Orido, 3–20–1, Shimizu, Shizuoka-Ken, 424, Japan
H. KumsarPamukkale University, Department of Geological Engineering,Denizli, Turkey
Abstract The Adana-Ceyhan earthquake (Msp6.2)occurred in the southern part of Turkey on 27 June1998 and resulted in the loss of 145 lives and exten-sive damage to buildings in Ceyhan town and thesettlement areas in its vicinity. Soil liquefaction,ground failure due to lateral spreading and rock fallsoccurred. The area of Adana is characterised by alarge alluvial basin with a delta shape. Most of thebasin is filled with Quaternary recent Holocenedeposits. The recent rapid deposition of sedimentsand the very shallow groundwater table throughoutthe basin create conditions conducive to liquefac-tion. The results of a preliminary investigation ofsoil liquefaction caused by the earthquake and lique-faction assessments based on field performance dataare presented together with evaluations concerningthe likely contribution of the soils to the damagesustained by buildings. The results of the liquefac-
tion susceptibility analysis indicated that the datafrom the liquefied sites were within the empiricalbounds suggested by the field-performance evalua-tion method. It was also shown that shallow sandlayers should have liquefied and the surface disrup-tion observed on the site could be predicted by thebounds used for the relationships between the thick-ness of liquefiable sediments and the overlying non-liquefiable soil. Site-response analyses based onacceleration response spectra from the actual earth-quake’s strong motion records revealed that soilbehaviour was one of the most significant factors inthe damage to buildings caused by the earthquake.
Résumé Le tremblement de terre de Adana-Ceyhansurvenu au sud de la Turquie le 27 juin 1998 á causela perte de 145 vies humaines, des dommages éten-dus aux édifices dans la district de Ceyhan et lasubsidence des alentours. La liquéfaction du sol, desmouvements latéraux de terrain et des choutesrocheuse sont aussi survenus dans la district. Danscet article, les resultats d’une étude préliminaire dela liquéfaction du sol causée par le tremblement deterre, l’évaluation des liquéfaction basées sur lesdonnées terrain expérimentale ainsi que la contribu-tion possible du sol sur les dommages causées auxédifices sont présentés. La region de Çukurova est undelta caracterisé par une grande plaine alluviale. Lepluspart de la region á été remblayée par des depotsrécent d’Holocène de l’aire Quaternaire. L’accumula-tion rapide des sédiments récents ainsi que la faibleprofoundeur de la nappe superfacielle dans le bassin

R. Ulusay et al.
100 Bull Eng Geol Env (2000) 59 : 99–118 7 Q Springer-Verlag
a conduit à des conditions favorables à l’apparitionde liquéfaction du sol. Les resultats des analyses desusceptibilité de liquéfaction ont montré que lesdonnées provenant des sites du sol liquéfiés sontdans les limites empiriques de la methode d’évalua-tion des performances de terrain. Il a aussi étémontré que des couches de sable peu profondes ontpu étre liquéfiées et que les données provenant dessites avec ruptures de surface ont été predités dansles limités utilisées par les relations entre épaisseurdes sediments liquéfiables et l’épaisseur du sol non-liquéfiable des couches supéreures. Les analyses de laresponse des sites basées ou les spectres de responsedes accelérations provenant des enregirstements desactuels tremblement de terre, ont revelé que lecomportement du sol a été un au des facteursmajeurs sur les dommages des édifices causés par letremblement de terre.
Key words Çukurova basin 7 Earthquake 7 Lateralspreading 7 Liquefaction 7 Site effects
Mots clés Bassin de Çukurova 7 Tremblement deterre 7 Etendre lateralement 7 Liquéfaction 7 Leseffects d’emplacement
Introduction
The province of Adana is the fourth largest in Turkey witha population of about 2.3 million. It includes 13 townships,notably Adana, Ceyhan and Yüregir. At 16 : 55 : 53 (localtime) on 27 June 1998, a major earthquake of magnitudeMsp6.2 (USGS) and Msp6.3 (Kandilli Observatory,Turkey) struck the Adana Province. Instrumentation indi-cated epicentre coordinates of 36.945 N and 35.305 E andmacroseismic coordinates of 36.94 and 35.55 E (Fig. 1). Itwas reported that the earthquake was felt in the city ofAnkara – 400 km away from the epicentral area of theearthquake – and as far south as Cyprus, Syria, Israel andJordan. Its duration was about 20 s.Official estimates place the death toll at about 145 and thenumber of injured at about 1500. The areas severelyshaken by the earthquake covered an area of approxi-mately 150 km radius, but the damage occurred within a30-km radius of the epicentre. Inventory studies by theGeneral Directorate of Disaster Affairs of Turkey showedthat 1388 buildings suffered heavy damage, 18,612sustained moderate damage and 43,644 buildings escapedthe earthquake with only slight damage. A total of sevenapartment buildings collapsed in Ceyhan town centrealone, with the loss of 76 lives. As it was day time, a largeproportion of the residents were not in the towns andvillages or the death toll could have been much higher. Theestimated economic loss due to structural damage alone isabout 870 million US dollars.
Fig. 1Geographical location of the Adana province, epicentre of theearthquake and locations of boreholes selected for liquefactionassessments
The Earthquake Research Department (ERD) estimatedthat the epicentre of the main shock was located about30 km south-east of Adana and 32 km away from thecentre of Ceyhan town, as shown in Fig. 1. The focal depthfor this event is reported by the ERD as 23 km. While noforeshock was felt, 220 aftershocks with magnitudesvarying between 2.2 and 5.1 had been recorded by July1998.Clear liquefaction traces along the banks of the CeyhanRiver were observed west of Ceyhan town, extending todistances of up to 50 km from the epicentre. Several struc-tures of liquefied subsoil, such as isolated sand volcanoesor boils, grouped sand boils, vent-fractures or cracks andlateral spreading were evident, while lateral spreadingground failures developed on the banks of the CeyhanRiver. On the steep slopes along the fault zone activated bythe earthquake, major phenomena associated with theintensity of this dynamic event were also manifested. The

1998 earthquake, Adana-Ceyhan, Turkey
Bull Eng Geol Env (2000) 59 : 99–118 7 Q Springer-Verlag 101
secondary effects of particular importance were the rockfalls observed on some hills in the southern part of theprovince, while in the developed areas, fissures and grounddisplacements disrupted fields, roadways, canals, buildingsand other constructed works. It is also noted that the soil-structure interaction of the rather stiff buildings may havecontributed to lengthening of the buildings’ periods tocoincide with the dominant periods of the site.Soil liquefaction and the effect of the geology on thedamage caused by the 1998 Adana-Ceyhan earthquakewere investigated by the authors. In this paper, the engi-neering geological characteristics of the earthquake, itsgeological and seismological aspects, observations of thesoil liquefaction phenomena, the distribution of the areasof liquefaction, the nature of the liquefaction and the engi-neering properties of the soils are discussed. The liquefac-tion characteristics and the behaviour of the soils are thenexamined in respect of their influence on the damagesustained by buildings. Geotechnical data, including bore-hole records, laboratory test results from the liquefied soilsamples taken from both sand boils and boreholes weretaken into account in the liquefaction analyses. The lique-faction assessments were performed by using the fieldperformance data obtained from standard penetrationtests (SPT). In addition, in order to assess the influence ofthe soil behaviour on the damage to buildings caused bythe earthquake, the natural periods of soil columnsselected at particular areas were computed and comparedwith those of buildings. For the purpose, a short-cut proce-dure based on the shear wave distribution of soil layers,soil thickness and the number of stories of the buildingswas employed.The field studies were conducted during June 1998, 2 weeksafter the earthquake, and related additional informationwas collected during August 1998.
Geological context
The south-east Mediterranean region where the areasaffected by the recent earthquake are located consists ofthree basins separated by two main tectonic zones strikingNE–SW (Fig. 2a). The basement rocks of Pre-Miocene agevary between the three basins as they are located indifferent tectonic zones (Kozlu 1987): the Iskenderun Basinbeing situated in the Amanos Mountains and in thevicinity of Iskenderun Bay, the Adana Miocene Basin in thesouthern part of the East Taurus Belt, and between these,the Misis-Andırın Basin (Fig. 2a).
Geological setting
The area between the Adana and Misis-Andırın Basins,where the recent earthquake was severely felt, is geographi-cally known as the Çukurova Basin and is characterised by
a very large alluvial basin with a delta shape which extendsmore than 100 km east–west and approximately 70 kmnorth–south. Most of this basin is filled with Quaternaryrecent (Holocene) deposits (Fig. 2b). According to Kozlu(1987), the geological units of the Çukurova Basin belongto the Upper Cretaceous, Oligo-Miocene, Miocene, Plio-cene and Quaternary periods. The rock units of the UpperCretaceous are found in the south-east of the basin andshow a volcano-sedimentary stratigraphy consisting oftuffs, sandstones, marls, agglomerates and huge blocks oflimestones.The Oligo-Miocene series trend NE–SW, almost parallel tothe Mediterranean Sea coast (Fig. 2b), and are character-ised by olistostromes. Conglomerates and sandstones fromthe Miocene outcrop in the southern and northern parts ofthe basin and are known as the Güvenç Formation (Yetis1988). The rock units are generally moderately bedded andrarely cross-bedded. The Handere Formation described bySchmidt (1961) represents the Pliocene period and coverslarge areas in the northern part of Adana city. This ismainly composed of sandstone, siltstone, marl andmudstone and has a thickness of about 700 m (Yetis1988).In the Çukurova Basin the Quaternary deposits includealluvial soils and travertines (caliche). Outcrops of thetravertine are visible in the northern part of the basinbetween Adana and Ceyhan and also around the UpperCretaceous aged blocks in the Cebelinur mountain in thesouth-east (Fig. 2b). The travertine and terrace deposits inthe basin have an inclination ranging between 2 and 47
towards south. Their thickness increases towards thesouth, to a maximum of 30 m. This unit can be dividedinto two layers: a hard caliche with a thickness rangingbetween 2 and 6 m at the top and a weak and soft calichelayer with carbonate gravels at the bottom.The Çukurova Basin is a broad, flat, fault-bounded plaintraversed by two main rivers, the Ceyhan River in the eastand Seyhan River in the west (Figs. 1 and 2b). When theCeyhan River enters the east margin of the basin, thegradient decreases from a rather steep descent in themountains to the almost flat surface of the basin floor. Thissudden change of gradient causes rapid deposition of sedi-ment. The deposition and redistribution of the Quaternarysediments carried into the basin by these rivers has led tothe accumulation of thick unconsolidated alluvial plaindeposits composed of intercalated gravel, sand, silt andclay layers. The recent alluvium is restricted to the beds ofthe Ceyhan and Seyhan Rivers. Because of the rapid anddynamic sedimentation processes, the deposits vary fromwell to poorly graded and are generally loosely compacted.Boreholes undertaken by the General Directorate of StateHydraulic Works of Turkey (DSI) and private companiesindicate that the thickness of unconsolidated materialsunderlying the plain ranges from 100 to 300 m. Figure 3shows a N–S geological cross section between Ceyhan andMercimekköy along which liquefaction fissures and sandboils were observed.The alluvial sequence thickens towards the northern partof the basin, reaching up to 320 m at Mercimekköy and

R. Ulusay et al.
102 Bull Eng Geol Env (2000) 59 : 99–118 7 Q Springer-Verlag
Fig. 2a Tectonic map of the Adana-Misis-Andırın-Iskenderunregion showing the maingeological basins. (AfterKozlu 1987). b Simplifiedgeological map of ÇukurovaBasin. (Adapted from Kozlu1987, General Directorate ofMineral Research and Explo-ration of Turkey’s 1 : 100,000scale map and Nurlu 1998)
then gradually becoming thinner. The thickness is about170 m beneath the town of Ceyhan (DSI 1984). The depthof the clayey surface varies between 1 and 6 m. In Adana,for example, it is reported to be approximately 1 to 3 m.Below the clay, the alluvium is generally loose and gravellyor dense and hard with pockets of sand/clayey sand. Alonga N–S direction the alluvial deposits mainly consist ofclayey and silty material, although sandy and gravellylayers are found at shallow depths. Towards the east,
between Ceyhan and Osmaniye (Fig. 1), the unconsolidatedmaterials are coarser grained compared to those on theCeyhan plain. The liquefied sandy layers are well seen nearthe Ceyhan River. On the basis of the authors’ observationsalong the banks of the Ceyhan River and trench studiesundertaken by the ERD (Demirtas 1998) in Yakapınar andCeyhan, it is considered that beneath the silty and clayeyhorizons, the depth of the mainly fine-grained liquefiedsand layers ranges from 4 to 7 m.

1998 earthquake, Adana-Ceyhan, Turkey
Bull Eng Geol Env (2000) 59 : 99–118 7 Q Springer-Verlag 103
Fig. 3N–S geological cross sectionbetween Ceyhan and Merci-mekköy (adopted from DSI1984)
Tectonics
The area of the Çukurova Basin and its immediatesurrounds has suffered and is still undergoing compressionin a N–S direction and extension in an E–W direction, dueto internal deformation of the Anatolian Block which isbeing compressed by the African and Arabian plates to thesouth moving northwards against the stationary Euro-Asian plate in the north (Fig. 4). The Anatolian plate,bounded by the North Anatolian Fault (NAF) and the EastAnatolian Fault (EAF), is pushed westward against theAgean plate as a result of the relative movement of theArabian plate with respect to the African plate. As a conse-quence, the Çukurova Basin is bounded by the Ecemis faultin the west and Yumurtalık-Karatas fault in the east(Fig. 2a).The Ecemis fault is a lateral strike-slip fault, the strikebeing in a NE–SW direction. Although this is consideredan active fault, there are no written records of a large eventalong it . The strike of the Yumurtalık-Karatas fault is oneof the southern splays of the East Anatolian Fault zoneextending towards Cyprus and has a strike almost parallelto the Ecemis fault. Between these two faults is the Çiçekli-Göksu fault zone. The left-lateral fault which caused the1998 earthquake is known as the Misis-Ceyhan fault andpresumed to be a segment of the Çiçekli-Göksu fault.Kozlu (1987) suggests that this fault was initially the frontof the Yumurtalık thrust and developed during the LowerMiocene. It was subsequently transformed into a left-
lateral strike-slip fault in the Upper Eocene and LowerOligocene. All these fault segments are known to be left-lateral strike slip faults.
Hydrogeological conditions
The longest river in the region is the Ceyhan River (seeFig. 1) which originates from the mountains in the north-east of the basin and carries substantial flows of water andsediments into the basin throughout the year. Some of theriverine water infiltrates into the basin through the distri-butary channel systems, the remainder flowing overlandtowards its delta located on the coast of Iskenderun Bay.From the available records of the boreholes drilled atdifferent times and in different locations throughout thebasin, it is evident that the groundwater table is generallyvery shallow. Figure 5 shows the monthly average ground-water level and average precipitation at a well in the north-east of the basin (Osmaniye, east of Ceyhan) between 1970and 1972 (DSI 1975). Although this location is not onewhere extensive liquefaction was observed, it is a typicalexample indicating the variation in groundwater level inthe Çukurova Basin. The groundwater level is closely asso-ciated with the amount of precipitation and may be quitehigh when the monthly precipitation is high. The recordsindicate that in years with high precipitation, the highestgroundwater level was observed in June. The groundwaterlevel generally fluctuates by between 2 and 6 m near the

R. Ulusay et al.
104 Bull Eng Geol Env (2000) 59 : 99–118 7 Q Springer-Verlag
Fig. 4Major tectonic elements ofTurkey. (After Barka andKadinsky-Cade 1988)
Fig. 5Monthly averages of groundwater level and average precipitationat a well in Mamure-Osmaniye, to the east of the Çukurova Basin(data from DSI 1975)
Ceyhan River, but because of the El Nino phenomenon, theprecipitation in 1998 was quite high and, particularly in theepicentral area, was likely to have been within 1 to 3 m ofthe surface at the time of the June 1998 earthquake.On the basis of the latest evaluation of the basin by the DSI(1984), the depth of static water level generally ranges frombetween 2 and 5 m below the surface (Fig. 6). These figureswere also confirmed by the records of the boreholes drilledfor different purposes in different parts of the basin. Bothnorth of Mercimekköy in a large NW–SW trending areawith an elliptical shape and in another small area (Fig. 6),artesian conditions were reported by the DSI (1984).Shallow groundwater levels and artesian conditions werealso confirmed by boreholes drilled more recently by theTurkish Highway General Directorate (TCK) (Çetin 1995).The direction of groundwater flow through the aquifer inthe alluvium is towards the Ceyhan River. In general,impervious clayey and silty layers underlie the sandy-grav-elly layers and/or semipermeable silty clay at shallow
depths. Both the recent rapid deposition of the sedimentsand the high groundwater levels contributed to the crea-tion of conditions favourable to the occurrence of liquefac-tion.
Faulting and seismiccharacteristics of the earthquake
FaultingThe earthquake parameters of the main shock on 27 June1998 provided by the ERD indicated a location slightly tothe south of Abdioglu village, halfway between Adana andCeyhan (Fig. 1). The fault plane postulated by the ERD isconsistent with a strike slip earthquake along a SE-dippingleft-lateral slip fault with a NE–SW strike direction and anormal component (Fig. 7a). The geometrical position ofthe fault plane established by the authors using the hypo-centre data of the main shock and aftershocks is verysimilar to the fault planes postulated by various workers(Fig. 7b). On the basis of the distribution pattern of theground ruptures, aftershocks and fault planes associatedwith the main shock, it is concluded that this earthquakemay have originated from the reactivation of a fault planerelated to the known Misis-Ceyhan fault line
SeismicityAdana and Ceyhan are in the second seismic zone,according to the seismic zoning map of Turkey preparedby the ERD. The plot of earthquake epicentres in the basinfrom 1900 to 1998 (Fig. 7c) indicates that earthquakes aregenerally associated with known active faults existing inthe area. Although the region is known to be seismicallyactive, because of the short length of the faults in the area,large earthquakes (M17) are not historically known orexpected. Using these data of earthquakes in the region fora period between 1881 and 1986, Gençoglu et al. (1990)suggested the following relation for the provincial earth-quake occurrence for a period 133 years:
log Np3.42P0.51 M (1)

1998 earthquake, Adana-Ceyhan, Turkey
Bull Eng Geol Env (2000) 59 : 99–118 7 Q Springer-Verlag 105
Fig. 6Static groundwater level mapof Ceyhan and its vicinity.(DSI 1984)
Fig. 7a Fault plane associated withthe earthquake as postulatedby the ERD. b Spatial view offault plane predicted by theauthors from distribution ofaftershocks. c Distribution ofepicentres of earthquakes(Ms64.0) in the ÇukurovaBasin and its immediatevicinity. (After Demirtas1998)
An earthquake with a magnitude of 5.7 occurred at Misis(see Fig. 7c) on 20 March 1945. Using the above formulafor an earthquake with a Richter magnitude of 6, the recur-rence interval for a similar earthquake would be 57.9 years.Considering the earthquakes of 20 March 1945 and 27 June
1998, it would appear that the above formula holds for theearthquake recurrence in the Adana-Ceyhan province.The Çukurova Basin has been well instrumented withseveral seismic networks set up independent of each other.Two magnitude Mp6 earthquakes have been recorded,

R. Ulusay et al.
106 Bull Eng Geol Env (2000) 59 : 99–118 7 Q Springer-Verlag
Fig. 8NS, EW and UD accelerations of the main shock recorded by thestrong motion station located in the local branch building of theAgricultural Ministry in Ceyhan. (Earthquake Research Depart-ment 1998)
one in the year 1908 and the other in 1945, almost in thesame location as that of the 27 June 1998 earthquake. Thehypocentre location appears to be a seismic gap in theregion, with almost no seismic activity recorded since 1947and there was no foreshock to warn people. The mainearthquake shock was recorded by the ERD in the localbranch building of the Agricultural Ministry in Ceyhantown. According to the data released by the ERD, 104 after-shocks occurred during the first 2 days following the mainearthquake and 224 aftershocks with magnitudes varyingbetween 2.2 and 5.0 had been recorded by 17 July 1998.
Assessment of ground motions
The strength of the accelerations recorded at the CeyhanStation, 32 km away from the epicentre, were 0.223, 0.273and 0.086 g in the SN, EW and vertical (UD) directions,respectively (Fig. 8). The UD component of this earthquakewas also quite high compared with other earthquakes inTurkey and it is likely that this is characteristic of inlandearthquakes. Aydan et al. (1996) developed a databasesystem for the seismic characteristics of Turkish earth-quakes and postulated several empirical relations betweendifferent seismic parameters. The peak ground accelera-tions measured at other stations during the main shockenabled the authors to determine the attenuation charac-teristics of the ground motion. The peak ground accelera-tion values of the June 1998 earthquake are plotted inFig. 9 together with empirical relations proposed by Aydanet al. (1996), Joyner and Boore (1981), Fukushima et al.(1988) and the ERD. It can be seen that the attenuationdata are in good agreement only with the empirical rela-tions developed for Turkish earthquakes by Aydan et al.(1996). This strong relationship indicates the validity ofusing the solid attenuation curve shown in Fig. 9 whenconsidering Turkish earthquakes.
Engineering geologicalcharacteristics of the earthquake
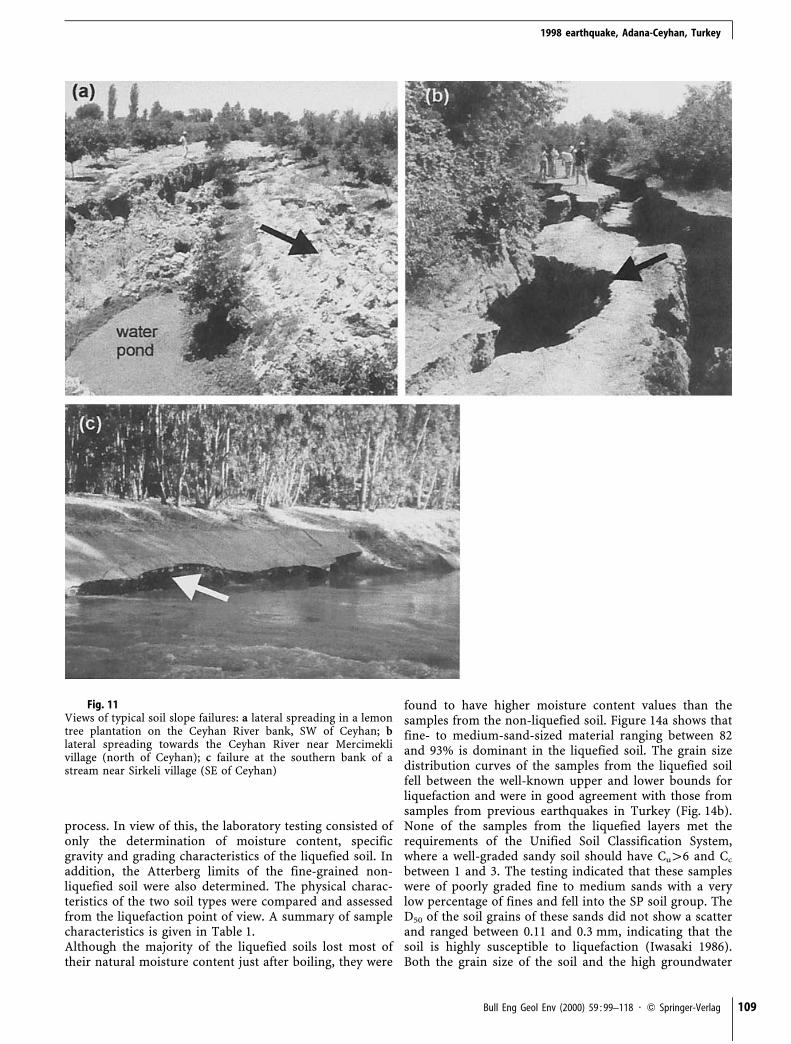
Lateral spreading and rock fallsLiquefaction-induced lateral spreading of ground failureswas observed along the banks of the Ceyhan River, particu-larly in Mercimekköy, Abdioglu and Sirkeli on the westbank of the Ceyhan River. Here the ground is relatively flat(0.5–1.5%) and movement appears to have been in a north-easterly direction (Fig. 10).Close examination of the soil slope failures implied thatthey were likely to be a consequence of ground failure dueto liquefaction. For example, a part of a lemon tree planta-tion, located on the riverbank near Abdioglu village, slidtowards the river and a small pond behind the failed masswas still visible even 2 weeks after the earthquake(Fig. 11a). The cracks shown in Fig. 11a were about 10 mlong, through which very thin sandy grains of the alluvium

1998 earthquake, Adana-Ceyhan, Turkey
Bull Eng Geol Env (2000) 59 : 99–118 7 Q Springer-Verlag 107
Fig. 9Comparison of attenuation data of the Adana-Ceyhan earthquakewith empirical relations proposed by different investigators
were pushed up in the plantation. A vertical subsidence of2 to 3 m and a horizontal displacement of about 1 to 2 mtowards the river were observed in this vicinity. Anothertypical example of lateral spreading, near Mercimekköy,resulted in a total vertical subsidence of 2.5 m and verylong cracks parallel to the river bank (Fig. 11b). The widthand depth of these cracks ranged from 0.1 to 1 m and 0.5to 2 m respectively.Other slope failures were observed on the side of a linedcanal between Misis and Abdioglu, and on the southernlined bank of a stream near Sirkeli, very close to Ceyhan(Fig. 11c). The failure direction at both locations wasN20 E, similar to that of the lateral spreads mentionedabove. These ground failures occurred in recent soft allu-vial deposits and confirm the general experience that avery specific soil behaviour can be expected particularly infine-grained recent alluvial deposits, such as river banks.Fortunately, as there were no structures of great impor-tance in the area, the lateral spreading did not cause anymajor damage. Indeed, with the exception of the aboveexamples, no severe damage to structures due to lateralspreading was observed.Minor rock falls (maximum 3 to 4 ton) took place on thesouth-eastern side of the basin, behind Nacarlı villagewhere the terrain is mountainous. The location of the rockfalls is shown in Fig. 10. These small-scale falls were asso-ciated with limestone blocks separating at existing joints inthe rock mass.
Soil liquefactionClear traces of liquefaction were observed along the banksof the Ceyhan River west of Ceyhan town. This phenom-enon is due to the presence of fine-grained sandy layers in
the alluvial sequence which became liquefied during themain shock. Several structures typical of liquefied subsoilwere observed, including vent fractures or fissures as muchas several metres wide and isolated sand volcanoes or boilswhich ejected water and sediment over areas of up to tensof square metres.During the site investigation, the general distribution ofground fissures and sand boils in the basin was surveyed(Fig. 10). The longest and widest fissures and the largestsand boils were concentrated along a 50-km-long north-east-trending segment of the Ceyhan River. The fissuresand sand boils shown in Fig. 12a,b are typical examples ofthe larger liquefaction features which were still clearlyvisible 2 weeks after the earthquake. The height and diam-eter of the sand volcanoes ranged from 100 to 300 mm and150 to 60 mm respectively. According to local people,liquefied soil and water rose up to 7 to 8 m above thesurface during the main shock.No distinct fault scarp was observed, although many en-echelon-type ground fractures with and without sand boilswere seen near Abdioglu village and Asmalı bridge(Fig. 12b). All were stepped to the left. In general, thedirection of the eruption fissures and fractures wasN50–70 E and N60–70 W in the southern and northernparts of Ceyhan town, respectively (Fig. 10). As the courseof the Ceyhan River is parallel to the Misis-Ceyhan fault,the orientation of eruption fissures generated by liquefac-tion is generally similar to the course of the Ceyhan Riverand the fault seen in Fig. 10.Observations at the various liquefaction sites indicatedthat the soil that erupted from the ground surface was adark-grey fine sand with a negligible amount of fines. Itwas not possible to determine the depth of the liquefiedlayer from the surface observations, but from evidence at alocation near Mercimekköy in the north of Ceyhan, it islikely this layer lies some 4 to 5 m below the groundsurface, generally at the level of the Ceyhan River. At thatsite, traces of the liquefied sand could be seen on the frac-ture crevasse where ground failure had occurred due to thelateral spreading (Fig. 10b). This vent fracture was filled byfine sand. The liquefied sand was generally overlain by alight-brown non-liquefied stiff alluvial soil layer consistingof silt and clay (Fig. 12c). However, observations on thewalls of trenches undertaken by the ERD near Abdiogluvillage and in Ceyhan town to investigate the shallow stra-tigraphy beneath the ground failure zone indicated that thedepth of the liquefied sandy layers ranged from 3 to 7 mfrom the surface. Demirtas (1998) reported that while thewidth of the liquefied sand dykes was 10 to 20 mm imme-diately below the ground surface, they could reach some100 mm at 4 m deep.Although it was anticipated that soil liquefaction would bewidespread along the Ceyhan River, sand boils and otherliquefaction-induced surface features were not evident onthe ground in Ceyhan town. This was supported by thepresence of subvertical sand dykes which did not reach thesurface but terminated at a depth of 3 m below groundlevel. This would suggest that the liquefied sand layers areshallow seated, probably due to the thick, partially satu-

R. Ulusay et al.
108 Bull Eng Geol Env (2000) 59 : 99–118 7 Q Springer-Verlag
Fig. 10Location of liquefaction sites,rock falls and slope move-ment (lateral spreading)
rated, plastic silt and clay layer which capped the silty sandlayer. These less permeable materials would have contrib-uted to the liquefaction conditions by preventing rapidupward drainage, except through fissures which may havedeveloped along the margins of the ground failure zone.The evidence of foundation disruption or distress beneaththe structures was very limited. However, the effects ofliquefaction on small structures were observed to thesouth-west of Ceyhan, in the vicinity of Abdioglu villagewhere extensive liquefaction occurred. The most specta-cular examples of damage to structures in the village andits vicinity were the differential settlement of a water-storage tower by about 50 mm (Fig. 13a), the uplifting of aconcrete water tank beneath this tower and the tilting of afountain in the garden of a primary school (Fig. 13b).
Engineering characteristics of theliquefied and non-liquefied soils
During field investigations, sampling of “typical” soil wascarried out at a number of locations, including Abdiogluvillage, Mercimekköy and Büyükmangıt, which are veryclose to the town of Ceyhan. Laboratory testing was under-taken to determine the physical properties of the liquefiedand non-liquefied soils from the uppermost two zones inthe alluvial sequence. Only disturbed sampling of theliquefied soil was possible during the site investigations,the material being taken from the sand boils. Althoughoriginating from the liquefied layer, these materials arepartially filtered and segregated during the eruption
1998 earthquake, Adana-Ceyhan, Turkey
Bull Eng Geol Env (2000) 59 : 99–118 7 Q Springer-Verlag 109
Fig. 11Views of typical soil slope failures: a lateral spreading in a lemontree plantation on the Ceyhan River bank, SW of Ceyhan; blateral spreading towards the Ceyhan River near Mercimeklivillage (north of Ceyhan); c failure at the southern bank of astream near Sirkeli village (SE of Ceyhan)
process. In view of this, the laboratory testing consisted ofonly the determination of moisture content, specificgravity and grading characteristics of the liquefied soil. Inaddition, the Atterberg limits of the fine-grained non-liquefied soil were also determined. The physical charac-teristics of the two soil types were compared and assessedfrom the liquefaction point of view. A summary of samplecharacteristics is given in Table 1.Although the majority of the liquefied soils lost most oftheir natural moisture content just after boiling, they were
found to have higher moisture content values than thesamples from the non-liquefied soil. Figure 14a shows thatfine- to medium-sand-sized material ranging between 82and 93% is dominant in the liquefied soil. The grain sizedistribution curves of the samples from the liquefied soilfell between the well-known upper and lower bounds forliquefaction and were in good agreement with those fromsamples from previous earthquakes in Turkey (Fig. 14b).None of the samples from the liquefied layers met therequirements of the Unified Soil Classification System,where a well-graded sandy soil should have Cu 16 and Cc
between 1 and 3. The testing indicated that these sampleswere of poorly graded fine to medium sands with a verylow percentage of fines and fell into the SP soil group. TheD50 of the soil grains of these sands did not show a scatterand ranged between 0.11 and 0.3 mm, indicating that thesoil is highly susceptible to liquefaction (Iwasaki 1986).Both the grain size of the soil and the high groundwater

R. Ulusay et al.
110 Bull Eng Geol Env (2000) 59 : 99–118 7 Q Springer-Verlag
Table 1Characteristics of the liquefied and non-liquefied soil layers investigateda
Grain size Atterberg limits (%)
Sand Silt ClayLocation Gs F M C w
(%)LL PL PI D50
(mm)Cu Cg Soil
class
Liquefied sands1 Abdioglu 2.70 26 63 5 5 1 9.5 N.A. 0.3 4.12 1.51 SP2a Mercimekköy 2.64 61 25 0 13 1 2.8 N.A. 0.15 4.85 2.04 SP3a Büyükmangıt 2.68 82 11 0 6 1 16.0 N.A. 0.28 3.88 1.6 SP4a Bank of Ceyhan River
(near Abdioglu)2.70 72 10 0 15 3 4.0 N.A. 0.11 3.2 1.8 SP
Non-liquefied cap soil2b Mercimekköy 2.57 59 1 0 35 5 3.6 N.D. 0.07 - - -3d Büyükmangıt 2.44 14 2 0 64 20 10.2 35.7 27 8.7 0.02 - - ML4b Bank of Ceyhan River
(near Abdioglu)2.39 27 3 0 58 12 N.D. 27.4 21 6.4 0.04 - - ML
a Gs, Specific gravity; F, fine; M, medium; C, coarse; w, water content; LL, PL, PI, liquid limit, plastic limit, and plastic index, respec-tively; D50, mean grain size; Cu, coefficient of gradation; N.A., not applicable; N.D., not determined
Fig. 12a Vent fracture and sand boil near Asmalı bridge. b Liquefactionin a school yard in Abdioglu village (south of Ceyhan). c Trace ofliquefied soil on a fracture crevasse of a soil slope failure alongthe Ceyhan River near Mercimekköy
level in conjunction with the active seismic features of theregion result in conditions favourable to the occurrence ofliquefaction.Based on the laboratory test results obtained from threespecimens, the uppermost soil overlying the liquefiable
layer is a fine-grained soil and from its grain size wouldnot be expected to liquefy (Fig. 14c). All the samples hadliquid limits of less than 50%, indicating low plasticity.These soils classified in the ML group and were defined assilty clay. The reason that liquefaction did not take place inthis layer could be due to the fine-grained composition ofthe soil, its mean grain size, its position with respect to thegroundwater table and the amplitude of the acceleration ofthe waves (Aydan et al. 1998).

1998 earthquake, Adana-Ceyhan, Turkey
Bull Eng Geol Env (2000) 59 : 99–118 7 Q Springer-Verlag 111
Fig. 13a Differential settlement of 50 mm beneath a water-storage tower.b Tilted fountain in Abdioglu village
Evaluation of liquefactionsusceptibility and ground surfacedisruption
Although liquefaction is a major cause of earthquakedamage, little harm occurs unless the liquefied conditionleads to some form of ground surface disturbance orground failure. As a consequence, the ability to accuratelypredict the potential for ground surface disruption is amajor concern for geotechnologists responsible for the safesiting of construction works.Ishihara (1985) published preliminary empirical criteria toassess the potential for ground surface disruption at lique-faction sites. These are based on relationships between thethickness of liquefiable layers beneath a site and the corre-sponding thickness of the overlying non-liquefiable soillayer (Fig. 15a). The criteria were also evaluated andsupported by Youd and Garris (1995) using borehole datafrom field investigations following several earthquakes. Totest Ishihara’s (1985) proposals, liquefaction assessmentswere also carried out in this study using the data availablefrom the records of selected boreholes drilled at differentlocations within the basin. Due to the extent of the alluvialsoils in the basin, only a limited number of boreholesprovided satisfactory input data for the assessment. Primeconsideration was paid to selecting boreholes located asclose as possible to the sites where liquefaction phenomenawere observed. Two of the six boreholes selected weredrilled in Ceyhan town after the earthquake for thepurposes of selecting sites for the construction of newbuildings. The locations of the boreholes are shown in
Fig. 1 and the soil and groundwater conditions through theboreholes are summarised in Fig. 16. The laboratory-deter-mined unit weight of the soils ranged between 17 and19 kN/m3. The sand and gravelly sand layers had finescontents of 0 to 33% and from the depth of the ground-water level measured in the boreholes were assumed to befully saturated.The procedure based on field performance data putforward by Seed and DeAlba (1986) is that most widelyused both in Turkey and in most countries to evaluateliquefaction susceptibility and was employed in this study.For the Turkish earthquakes (Fig. 9), the attenuation rela-tionship
amaxp2.8 (e0.9 M, eP0.025 RP1) (2)
was employed for the estimation of peak ground accelera-tion (amax), where Ms and R are the magnitude of theearthquake and distance from the hypocentre respectively.Depending on the distance of the selected borehole fromthe hypocentre, amax values ranging from 0.18 to 0.3 g wereestimated.On the basis of the information from the borehole recordsemployed in the assessment of liquefaction susceptibility,standard penetration tests were also carried out accordingto ASTM D-1586 (American Society for Testing Materials1990) test specifications at 1.5-m intervals in the founda-tion soils. A standard SPT split-spoon sampler with linerwas used, the sampler being driven into the foundationsoils using the drill rods and the donut-type hammerraised and dropped by two turns of rope. In this study, theSPT-N (the number of blows provided from the standardpenetration test) values were corrected for striking energyduring the test, and for the length of rods used and bore-hole diameter in order to obtain N60 values for each soillayer. These were then normalised, (N1)60 to provide areference confining pressure using the overburden correc-tion factor (CN) proposed by Tokimatsu and Yoshimi(1983).

R. Ulusay et al.
112 Bull Eng Geol Env (2000) 59 : 99–118 7 Q Springer-Verlag
Fig. 14Grain size distribution curves for soil samples from liquefiedlayers in the Çukurova Basin (a), from other earthquakes inTurkey (b), and from the non-liquefied layer near Ceyhan (c)
In order to investigate the liquefaction susceptibility,geotechnical data and seismic parameters were used in acomputer model “LIQUEFAC” developed by the authors.The program employs well-known assessment methodsbased on both field performance data and laboratory cyclicshear testing. The output consists of a table of input dataand factors of safety against liquefaction for each layer.The layers with factors of safety greater than 1.2 andbetween 1.0 and 1.2 were predicted to be non-liquefiableand marginally liquefiable respectively. The program waswritten in Visual Basic and can run on any type of IBMPC-compatible computer.The results of the liquefaction analysis of the layersthroughout the boreholes are summarised in terms offactor of safety against liquefaction in Fig. 16. Figure 17shows the relationship between modified SPT value andcyclic stress ratio (CSR) together with bounds for liquefac-tion/non-liquefaction proposed by Seed and DeAlba(1986). The data for Adana-Ceyhan in Fig. 17 are takenfrom the work of Ülker et al. (1998) and the authors’ inves-tigations. It can be seen that the data for the liquefied soilsgenerally fall within the range of predicted liquefiablesoils.It is evident from Fig. 16 that with the exception of a bandin BH 5, most of the sand layers yielded factors of safetylower than unity and/or between 1 and 1.1, indicatingconditions of liquefaction or marginal liquefaction respec-tively. Due to the very shallow groundwater levels at theselocations, the relatively short distances from the samplinglocations to the epicentre of the earthquake of 27 June 1998(generally 30 to 40 km), the low fines content of sandlayers and the very low SPT-N values, it is clear theselayers would be susceptible to liquefaction. This is incontrast to the sand layer encountered in BH 5, nearOsmaniye city (east of Ceyhan) which would not liquefy,probably due to both its gravelly nature and its distancefrom the epicentre (60 km) compared to other boreholes.In BH 6, close to BH 5, the gravelly sand layer between 0and 3.2 m yielded very low factors of safety against lique-faction. Bearing in mind the very low SPT-N values (Np3and 4; Fig. 16) obtained from this layer, these results seemquestionable when compared to those in BH5 whichpossess similar conditions. It is considered that this issimply an anomaly, as may be expected in any data setbased on field tests.During the field investigations, the surface effects weredivided into three categories: (1) no observed surfaceeffects; (2) sand boils and small ground fissures; and (3)surface effects generated by lateral spreading. Based onthese observations, the results of liquefaction assessmentanalysis through the selected boreholes and the trenchstudies by the ERD in the town of Ceyhan and its vicinity,the bounds published by Ishihara (1985) were tested.Combinations of different thicknesses of liquefiable andnon-liquefiable surface layers from the analyses are plottedin Fig. 15b,c.Figure 15b shows the thickness data from the location ofBH 1 and BH 2 in Ceyhan town with a value of amaxp0.3 g.Trench studies by the ERD indicated that sand dykes and

1998 earthquake, Adana-Ceyhan, Turkey
Bull Eng Geol Env (2000) 59 : 99–118 7 Q Springer-Verlag 113
Fig. 15a Boundary curves proposed by Ishihara (1985) for discrimi-nating between occurrence and non-occurrence of surface effectsof liquefaction, and thickness of liquefied and non-liquefied soillayers for various types of surface effects of liquefaction inCeyhan and its vicinity for 300-gal bound (b) and for 200-galbound (c)
sand boils exist at this location where surface disruptionwould be correctly predicted by Ishihara’s (1985) bounds.Figure 15c shows thickness data from BHs 3 to 6 where nosurface disruption was observed. Data on this plot arefrom sites with an estimated amax between 0.18 and 0.23 g.All but one of the data plots shown on this figure agreewell with the bounds proposed by Ishihara (1985). Thedata from a gravelly sand layer between 0 and 3.2 m in BH6 satisfy the conditions of liquefaction and fall above Ishi-hara’s (1985) bound although no liquefaction-inducedground surface disruption was observed or reported inOsmaniye and its vicinity. The anomalous results from BH6 have been referred to above and it is considered thatsuch an occasional inconsistency may be expected in anydata set based on field tests.The ground disturbance phenomena suggested by Ishihara(1985) are not related only to the layer thickness however.Other factors influencing ground disturbance include theinclination of the layer, the load acting on the soil and thevariations in the thickness of the layer . The absence ofdata representing these factors should be kept in mind asthey may to some extent limit the validity of the assess-ments given here. Nevertheless, the comparison of theliquefiable zones from the study site indicates that theliquefaction potential of some of the thin sand layersdiminishes where there is a thickness of some 5 m of lique-faction-resistant soil thickness.
Assessment of role of soilbehaviour on damage to buildings
The influence of the soil behaviour on the damage tobuildings caused by this earthquake was assessed by usingboth a short-cut procedure and the strong motion records.The procedure for calculating the natural period of a soilcolumn and then comparing it with the natural period ofbuildings requires that the shear wave distribution of soillayers be examined. After the earthquake a preliminarygeophysical study was carried out by the ERD, includingshear wave velocity measurements in Ceyhan and in othersmall settlement areas, particularly those located along thecourse of the Ceyhan River where the effects of the lique-faction had been clearly observed. Based on the data fromthe unpublished records of the ERD, the shear wave veloci-ties of the soil columns generally range between 150 and450 m/s.

R. Ulusay et al.
114 Bull Eng Geol Env (2000) 59 : 99–118 7 Q Springer-Verlag
Fig. 16Ground conditions in boreholes evaluated for liquefaction assess-ments and results of liquefaction analysis
For practical computations of the natural period for ahomogeneous soil column, the following equation (Dobryet al. 1976) is commonly used:
Tsp4 H/Vs (3)
where Ts is the natural period (in seconds), H is the thick-ness (in metres) and Vs is the shear wave velocity of a soil

1998 earthquake, Adana-Ceyhan, Turkey
Bull Eng Geol Env (2000) 59 : 99–118 7 Q Springer-Verlag 115
Fig. 17Relationship between modified SPT value N60 and cyclic stressratio (CSR) together with bounds for liquefaction/non-liquefac-tion proposed by Seed and DeAlba (1986) for soils from theAdana-Ceyhan region. FC Fines content
Fig. 18Curves of soil periods estimated for thicknesses of two differentsoils
Fig. 19NS, EW and UD acceleration response spectra of the main shock(h damping values)
column. Considering both the thickness of the unconsoli-dated deposits underlying the town of Ceyhan and in theÇukurova Basin and the measured shear wave velocities,natural soil periods were calculated for these ranges usingEq. (3). The plot shown in Fig. 18 indicates soil periodsbetween 0.9 and 8 s for the range of soil thicknessesconsidered. From the information in Fig. 18, assuminghomogeneous soil conditions, the natural period of the soilunderlying a large part of Ceyhan and its immediatevicinity is between 2.0 and 2.5 s.The response spectra of accelerations measured at Ceyhanstation during the main shock of 27 June 1998 are given inFig. 19 for EW, NS and vertical (UD) components. As canbe seen, the NS spectra indicate peaks at periods of 0.33,0.45 and 0.67 s. The EW spectra analysis shows peaks atperiods of 0.15, 0.25, 0.35, 0.47, 0.68 and 1.10 s, while the

R. Ulusay et al.
116 Bull Eng Geol Env (2000) 59 : 99–118 7 Q Springer-Verlag
UD spectra yields peaks at periods of 0.06, 0.15, 0.35, 0.47,0.68 and 1.10 s.Based on the experimental data reported by Bayülke(1978), the following relations between the natural period,Tb, and the number, N, of storeys are realistic for buildingsin Turkey:
Tbp0.05 N (non-damaged) (4)
Tbp0.10 N (damaged) (5)
For a proper earthquake design, the number of storeys tobe built should be such that the natural period of thebuilding does not match that of the soil column. In thisregard, the most undesirable number of storeys for build-ings in the study area would be 20 to 25, based on soilperiods of 2.0 to 2.5 s computed using the short-cut proce-dure [Eq. (3)] and Eq. (5). However, the buildings thatsuffered the most severe damage in Ceyhan generally were4 to 8 storeys high. Based on the soil periods obtainedfrom response spectra (Fig. 19) and Eq. (5), it would beanticipated that buildings with between 5 and 11 storeyswould be more severely damaged. The fact that most of thecollapsed or heavily damaged apartment blocks in Ceyhanwere between 4 and 8 storeys high supports the conclu-sions drawn from response spectra analysis. However,predictions based on Eq. (3), which uses homogenous soilconditions, are not consistent with field observations. Thisis considered to be due to the fact that shear wave veloci-ties were probably measured for a soil column of 5 to 10 mthick near the surface rather than the thickness of 300 memployed in the short-cut procedure.Bayülke (1999) reported that following the earthquake, theERD measured the natural periods of five damaged build-ings in Adana, between 9 and 11 storeys high. The resultsindicated natural periods of between 0.55 and 0.93 s, corre-sponding with that of the soil column estimated from theresponse spectra analysis. Such a coincidence of predomi-nant periods of ground motion within the range of Tp0.5to 0.7 s may explain the fact that the most severe damagewas concentrated in the 5- to 8-storey buildings. As aconsequence, it was concluded that there is a good consist-ency between the results of the experimental study by theERD and those from this study.The acceleration records taken at various stations in thearea where the 27 June 1998 earthquake occurred alsoenabled the authors to perform a preliminary assessmenton soil amplification. The peak ground accelerationsmeasured at eight stations during the main shock and theepicentral distance of each station provided by the ERD arepresented here in Table 2. Peak accelerations from theCeyhan and Mersin stations are considerably higher thanthose from other stations and indicate a clear and signifi-cant soil amplification. It is also noted that althoughCeyhan and Karatas are at approximately equal distancesfrom the epicentre, the peak ground acceleration measuredat Ceyhan was about eight times greater than thatmeasured in Karatas. A ratio of about 9 between the peakground accelerations from Mersin and Hatay indicates asimilar condition. This preliminary assessment indicates
Table 2Peak ground accelerations recorded at different stations in Çuku-rova Basin and around. (Earthquake Research Department1998)
ERDa station Distance fromepicentre (km)
Peak acceleration(cm/s2)
Ceyhan 32 273Karatas 36 33Iskenderun 68 15Mersin 78 132Hatay 97 27Islahiye 108 18K. Maras 149 8.5Elbistan 210 5
a ERD, Earthquake Research Department
Fig. 20View of collapsed and collided 5- and 6-storey residential apart-ment blocks in Ceyhan with shops at ground floor
that the very soft soil conditions at Ceyhan resulted insignificant soil amplification.The above assessments suggest that soil behaviour mightbe considered as one of the most significant factors in thedamage to buildings caused by the earthquake. The othermain causes of damage were almost the same as thoseidentified in previous earthquake events in Turkey, such aspoor workmanship, granulometry of the sand and gravelsof concrete, resonance, design errors, weak floors and thecollision of structures (for details, see Aydan et al. 1998).Figure 20 provides a typical example of the poor construc-tion conditions in the town of Ceyhan, showing collapsed,collided and damaged 5- to 6-storey residential buildingsconstructed in close proximity and with shops at groundfloor level. Two of the buildings survived the earthquakewith minor to moderate damage while the third wascompletely destroyed. The completely different seismicresponse of the buildings may be explained either by thedirectional effects of the ground motion or by different

1998 earthquake, Adana-Ceyhan, Turkey
Bull Eng Geol Env (2000) 59 : 99–118 7 Q Springer-Verlag 117
configurations of the masonry-infilled walls in the firststorey.
Conclusions
A moderate earthquake (Msp6.2) struck the Adana-Ceyhan province in the south of Turkey on 27 June 1998,causing much more damage than would be expected for anevent of this magnitude. Based on an investigation of theliquefaction phenomena, an assessment of the damage tostructures which could be related to soil behaviour and anevaluation of seismic data, the following main conclusionsare drawn.1. The seismic characteristics of this earthquake were
generally consistent with empirical relations developedfor Turkish earthquakes. The main fault plane at the sitewas predicted to have a strike in the direction ofNE–SW, which corresponds with the Misis-Ceyhanfault. Based on the postulated fault plane and the distri-bution pattern of the ground ruptures, liquefactionfeatures and aftershocks, it can be concluded that theearthquake is likely to have originated from the reacti-vation of this fault.
2. Although the shallow liquefied sand layers are notcontinuous throughout the Çukurova Basin, the recentrapid deposition of sediments and very shallow ground-water table indicate conditions conducive to liquefac-tion during even moderate earthquakes. Widespreadliquefaction and lateral spreading of the ground wereobserved for a distance of 50 km, particularly along thebanks of the Ceyhan River. The damage in Ceyhan wasconcentrated in structures built on alluvial deposits,particularly when parallel to the meandering CeyhanRiver. Soil slope and embankment failures were asso-ciated with lateral spreading of ground as a result ofliquefaction. The grain size distribution curves of theliquefied soil from the side fall between the well-knownupper and lower bounds for liquefaction and are in verygood agreement with those of the previous earthquakesin Turkey. The results of a liquefaction susceptibilityanalysis based on data from six boreholes drilled inCeyhan and its surrounds indicated that most of thesand layers were highly susceptible to liquefaction withfactors of safety lower than unity. The data from lique-fied sites sampled following the earthquake are withinthe empirical bounds suggested by Seed and DeAlba(1986). Comparison of predicted liquefiable zones andobserved liquefaction-induced ground surface disrup-tions using the criteria suggested by Ishihara (1985)revealed that the field data were in good agreement withthe bounds of the criteria and that at depths of about5 m, the liquefaction potential of thin sand layersdiminished.
3. The assessments based on response spectra analysis andpeak ground accelerations from various stationsrevealed that the soil behaviour was one of the mostsignificant factors in the damage sustained by buildings.
The concurrence of the fundamental frequencies of the4- to 8-storey buildings and the subsoil resulted insignificant amplification of the building excitation fromresonance. The other likely contributory causes ofdamage were similar to those in previous earthquakesin Turkey, including bad design, lack of reinforcement,poor workmanship and an inappropriate mix of sandand gravels in the concrete used in the buildings.
4. One important aspect of the Adana-Ceyhan earthquakeis its relatively long duration of about 20 s. Further-more, the epicentre was close to Ceyhan town which isfounded on thick alluvial soils prone to liquefaction.These factors are also considered to have contributed tothe damage suffered.
The main lessons learned from this earthquake are theimportant influence of local soil conditions on the damageto buildings and the necessity for both a proper design andadequate reinforcement of buildings constructed in earth-quake-prone areas. Bearing this in mind, the policyconcerning urban-regional planning and developmentmust be reconsidered, based on the best evaluation of theengineering, geological and seismic risk parameters of thegeological environment. Buildings must meet the designrequirements of the Codes and be constructed to be earth-quake resistant. A good design and understanding ofground conditions may result in reducing the extent ofstructural damage.
References
American Society for Testing Materials (1990) Standardmethod for penetration test and split-barrel sampling of soils(D1586–84). In: Annual book of ASTM standards, sect 4, vol04,09. ASTM, Philadelphia, 1092 pp
Aydan Ö, Sezaki M, Yarar R (1996) The seismic characteristicsof Turkish earthquakes. Proc 11th World Conference on Earth-quake Engineering, Acapulco, Mexico, pp 1–8
Aydan Ö, Ulusay R, Kumsar H, Sönmez H, Tuncay E (1998)A site investigation of Adana-Ceyhan earthquake of 27 June,1998. Report TDV/DR 006–30. Turkish Earthquake Foundation,Istanbul, 132 pp
Barka AA, Kadinsky-Cade K (1988) Strike-slip fault geometryin Turkey and its influence on earthquake activity. Tectonics7 : 663–684
Bayülke N (1978) Tugla yigma yapıların depremdeki davranısı.Deprem Arastırma Enstitüsü Bülteni 6(22) : 26–41
Bayülke N (1999) Yapı periyodu nedir, tasarımda yapının hangianındaki periyot kullanılmalıdır? Insaat Mühendisleri OdasıAdana subesi Bülteni 19 : 24–26
Çetin H (1995) Kozan-Ceyhan ayrımı Kadirli yolu ve Kadirli-Osmaniye yolu köprü temel sondajlari raporu. TCK Raporu, 6pp
Demirtas R (1998) 27 Haziran 1998 Ceyhan-Misis depremi; sıvı-lasma ve hendek çalısması. Jeoloji Mühendisligi 53 : 40–57
DSI (1975) Osmaniye Ovasi hidrojeolojik etüt raporu, 39 ppDSI (1984) Kadirli-Kozan-Ceyhan Ovası hidrojeolojik etüt
raporu, 20 ppDobry R, Oweis L, Urzua A (1976) Simplified procedures for
estimating the fundamental period of a soil profile. Bull SeisSoc Am 66(4) : 1293–1321

R. Ulusay et al.
118 Bull Eng Geol Env (2000) 59 : 99–118 7 Q Springer-Verlag
Fukushima Y, Tanaka T, Kataoka S (1988) A new attenuationrelationship for peak ground accelerations. In: Proc 9th WCEE,Tokyo
Gençoglu S, Inan I, Güler H (1990) Türkiye’nin deprem tehli-kesi. Türkiye Jeofizik Mühendisleri Odası Yayinı.
Ishihara K (1985) Stability of natural deposits during earth-quakes. In: Proc 11th Int Conf on Soil Mech and Found Eng,vol 1. AA Balkema, Rotterdam, pp 321–376
Inan E, Colakoglu Z, Koc N, Bayulke N, Coruh E (1996)Catalogue of earthquakes between 1976–1996 with accelerationrecords. Earthquake Research Department, General Directorateof Disaster Affairs of Public Works and Settlement, Ankara,150 pp
Iwasaki T (1986) Liquefaction and flow during earthquakes.Geotechnique 43(3) : 351–415
Joyner WB, Boore DM (1981) Peak horizontal acceleration andvelocity from strong-motion records including records fromthe 1979 Imperial Valley, California Earthquake. Bull Seis SocAm 71(6) : 2011–2038
Kozlu H (1987) Misis-Andırın dolayının stratigrafisi ve yapısalevrimi. Proc 7th Turkish Petroleum Congress, Ankara, Bildir-iler Kitabı, pp 104–116
Nurlu M (1998) 27 Haziran 1998 Adana Ceyhan depremi. AfetIsleri Genel Müdürlügü, Deprem Arastırma Dairesi, 21 pp
Schmidt GC (1961) Stratigraphic nomenclature for the Adanaregion petroleum district. Proc 7th Petroleum AdministrationPubl Bull 6 : 47–63
Seed H, DeAlba P (1986) Use of SPT and CPT tests for evalu-ating the liquefaction resistance of sands. In: Use of in-situtests in geotechnical engineering. ASCE Geotech Spec Publ6 : 281–302
Tokimatsu K, Yoshimi Y (1983) Empirical correlation of soilliquefaction based on SPT-N value and fines content. SoilsFound 23(4) : 56–74
Ülker R, Celep Z, Hasgür Z, Eyidogan H, Kaynak B (1998)27 Haziran (1998) Adana-Ceyhan Depremi hakkında. ITÜ Yapıve Deprem Uygulama Arastırma Merkezi, Istanbul
Yetis C (1988) Reorganization of the Tertiary stratigraphy in theAdana basin. Newsl Stratig 20(1) : 43–58
Youd TL, Garris CT (1995) Liquefaction-induced ground-surface disruption. J Geotech Eng 121(11) : 805–809