Engineering Appendix, part 2
477
Appendix A Engineering Appendix ANNEX B-1 GEOTECHNICAL DATA LOWRP Revised Draft PIR and EIS
-
Upload
khangminh22 -
Category
Documents
-
view
1 -
download
0
Transcript of Engineering Appendix, part 2
Appendix A Engineering Appendix
ANNEX B-1
GEOTECHNICAL DATA
LOWRP Revised Draft PIR and EIS

ANNEX B (Geotechnical)

Challenge Engineering & Testing, Inc. Borings/Test Pits
DRILLING TEST LOCATIONS
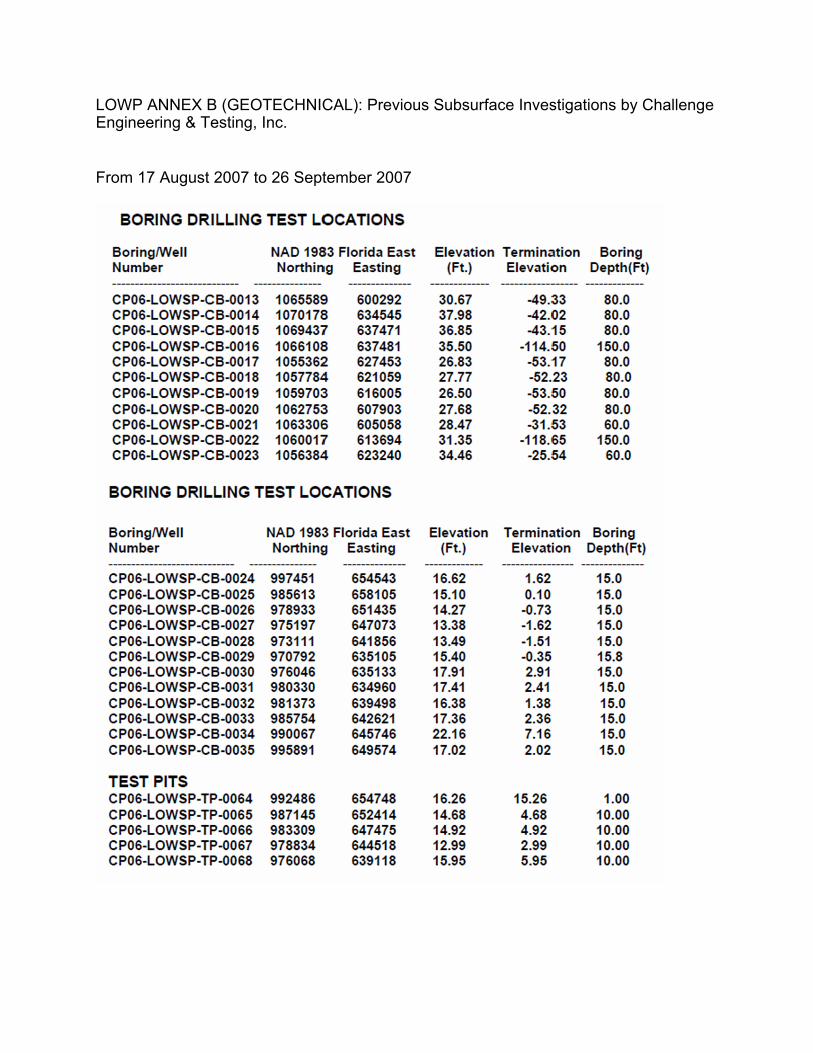
Boring/Well NAD 1983 Florida East Elevation Termination Boring Number Northing Easting (Ft.) Elevation Depth(Ft) -·-----·---·-·-·--·-----------·---·- -·-------·---·-·-·- -·-·---------·-- --·-·-·--·-·------CP06-LOWSP-CB-0013 1065589 600292 30.67 -49.33 80.0 CP06-LOWSP-CB-0014 1070178 634545 37.98 -42.02 80.0 CP06-LOWSP-CB-0015 1069437 637471 36.85 -43.1 5 80.0 CP06-LOWSP-CB-0016 1066108 637481 35.50 -114.50 150.0 CP06-LOWSP-CB-0017 1055362 627453 26.83 -53.1 7 80.0 CP06-LOWSP-CB-0018 1057784 621059 27.77 -52.23 80.0 CP06-LOWSP-CB-0019 1059703 616005 26.50 -53.50 80.0 CP06-LOWSP-CB-0020 1062753 607903 27.68 -52.32 80.0 CP06-LOWSP-CB-0021 1063306 605058 28.47 -31.53 60.0 CP06-LOWSP-CB-0022 1060017 613694 31.35 -118.65 150.0 CP06-LOWSP-CB-0023 1056384 623240 34.46 -25.54 60.0
BORING DRILLING TEST LOCATIONS
Boring/Well NAD 1983 Florida East Elevation Termination Boring Number Northing Easting (Ft.) Elevation Depth(Ft) ----------·-·-·-·- -----·--·-·--- --------·-·--·-CP06-LOWSP-CB-0024 997451 654543 16.62 1.62 15.0 CP06-LOWSP-CB-0025 985613 658105 15.10 0.10 15.0 CP06-LOWSP-CB-0026 978933 651435 14.27 -0.73 15.0 CP06-LOWSP-CB-0027 975197 647073 13.38 -1.62 15.0 CP06-LOWSP-CB-0028 973111 641856 13.49 -1.51 15.0 CP06-LOWSP-CB-0029 970792 635105 15.40 -0.35 15.8 CP06-LOWSP-CB-0030 976046 635133 17.91 2.91 15.0 CP06-LOWSP-CB-0031 980330 634960 17.41 2.41 15.0 CP06-LOWSP-CB-0032 981373 639498 16.38 1.38 15.0 CP06-LOWSP-CB-0033 985754 642621 17.36 2.36 15.0 CP06-LOWSP-CB-0034 990067 645746 22.16 7.16 15.0 CP06-LOWSP-CB-0035 995891 649574 17.02 2.02 15.0
TEST PITS CP06-LOWSP-TP-0064 992486 654748 16.26 15.26 1.00 CP06-LOWSP-TP-0065 987145 652414 14.68 4.68 10.00 CP06-LOWSP-TP-0066 983309 647475 14.92 4.92 10.00 CP06-LOWSP-TP-0067 978834 644518 12.99 2.99 10.00 CP06-LOWSP-TP-0068 976068 639118 15.95 5.95 10.00
LOWP ANNEX B (GEOTECHNICAL): Previous Subsurface Investigations by ChallengeEngineering & Testing, Inc.
From 17 August 2007 to 26 September 2007
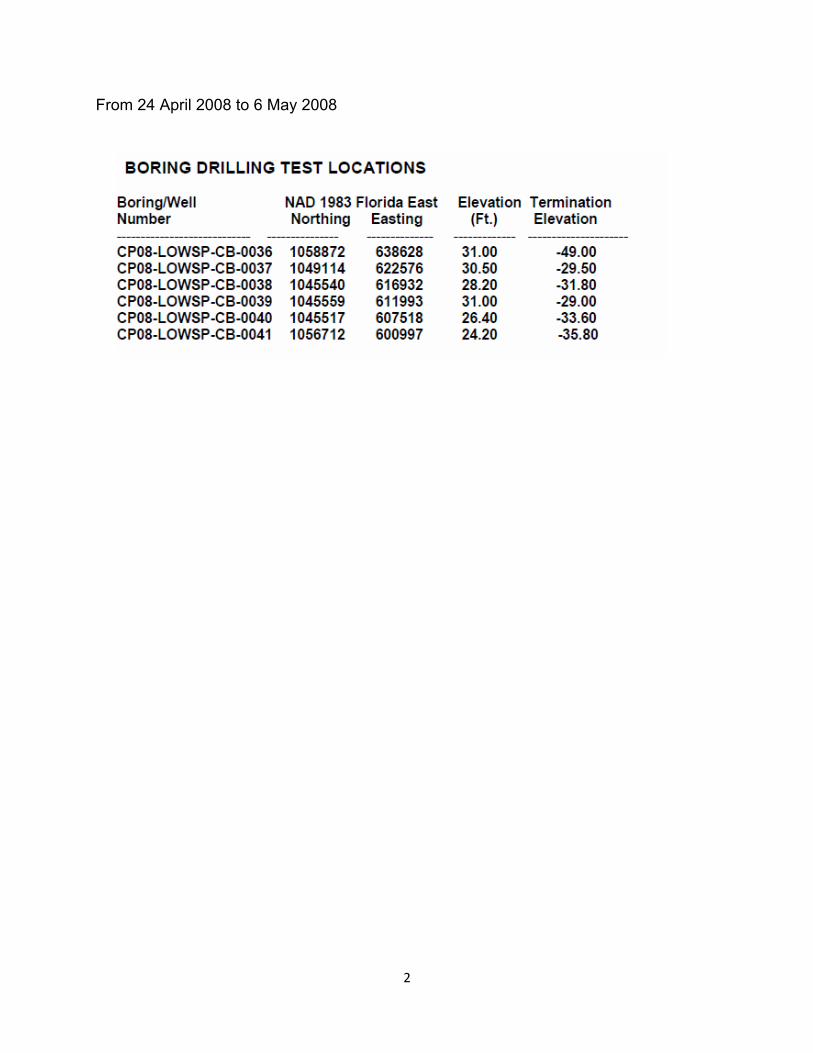
ORING DRILLING TEST LOCATIONS
Boring/Well Number
NAO 1983 Florida East Elevation Termination Northing Easting (Ft.) Elevation
CP08-LOWSP-CB-0036 1058872 CP08-LOWSP-CB-0037 1049114 CP08-LOWSP-CB-0038 1045540 CP08-LOWSP-CB-0039 1045559 CP08-LOWSP-CB-0040 1045517 CP08-LOWSP-CB-0041 1056712
638628 622576 616932 611993 607518 600997
31.00 30.50 28.20 31.00 26.40 24.20
-49.00 -29.50 -31.80 -29.00 -33.60 -35.80
From 24 April 2008 to 6 May 2008
2
Constant Head Gravity Test Data
I
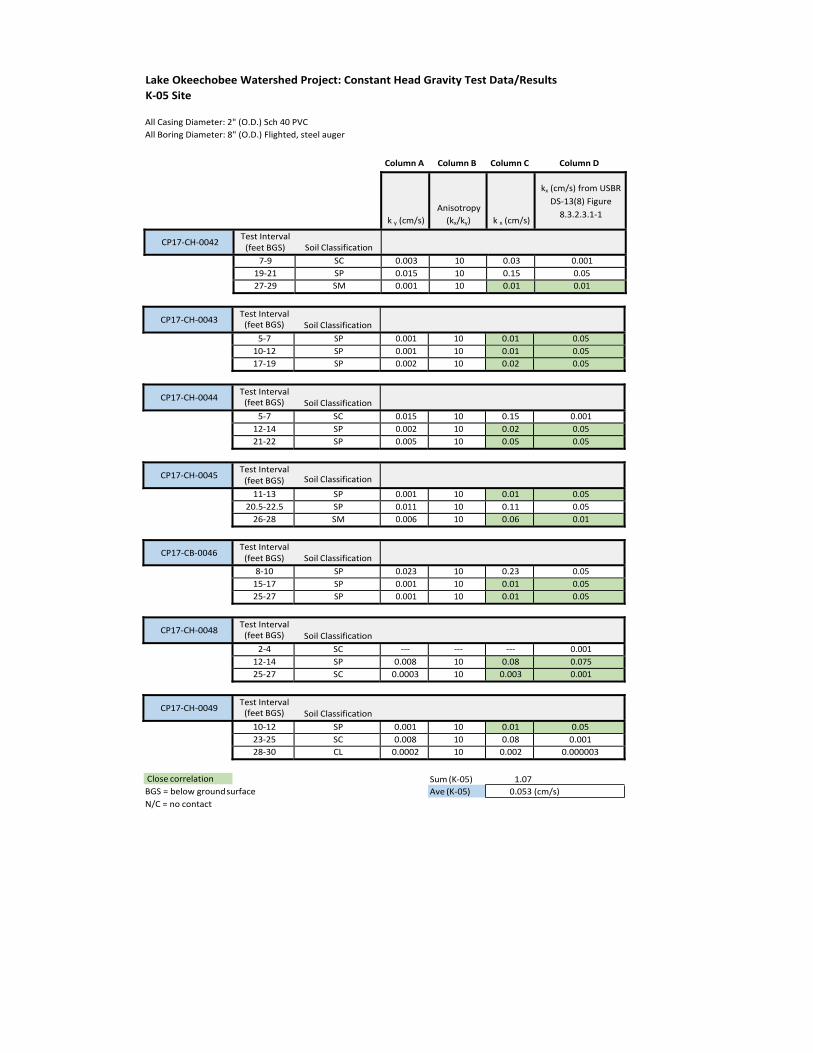
Lake Okeechobee Watershed Project: Constant Head Gravity Test Data/Results K‐05 Site
All Casing Diameter: 2" (O.D.) Sch 40 PVC All Boring Diameter: 8" (O.D.) Flighted, steel auger
Column A Column B Column C Column D
Test Interval CP17‐CH‐0042
(feet BGS)
7‐9 19‐21 27‐29
Test Interval CP17‐CH‐0043
(feet BGS)
5‐7 10‐12 17‐19
Test Interval CP17‐CH‐0044
(feet BGS)
5‐7 12‐14 21‐22
Test Interval CP17‐CH‐0045
(feet BGS)
11‐13 20.5‐22.5 26‐28
Test Interval CP17‐CB‐0046
(feet BGS)
8‐10 15‐17 25‐27
Test Interval CP17‐CH‐0048
(feet BGS)
2‐4 12‐14 25‐27
Test Interval CP17‐CH‐0049
(feet BGS)
10‐12 23‐25 28‐30
Close correlation BGS = below groundsurface
Soil Classification
SC SP SM
Soil Classification
SP SP SP
Soil Classification
SC SP SP
Soil Classification
SP SP SM
Soil Classification
SP SP SP
Soil Classification
SC SP SC
Soil Classification
SP SC CL
Anisotropy k y (cm/s) (kx/ky)
0.003 10 0.015 10 0.001 10
0.001 10 0.001 10 0.002 10
0.015 10 0.002 10 0.005 10
0.001 10 0.011 10 0.006 10
0.023 10 0.001 10 0.001 10
‐‐‐ ‐‐‐
0.008 10 0.0003 10
0.001 10 0.008 10 0.0002 10
Sum (K‐05) Ave (K‐05)
kx (cm/s) from USBR
DS‐13(8) Figure
8.3.2.3.1‐1k x (cm/s)
0.03 0.001 0.15 0.05 0.01 0.01
0.01 0.05 0.01 0.05 0.02 0.05
0.15 0.001 0.02 0.05 0.05 0.05
0.01 0.05 0.11 0.05 0.06 0.01
0.23 0.05 0.01 0.05 0.01 0.05
‐‐‐ 0.001 0.08 0.075 0.003 0.001
0.01 0.05 0.08 0.001 0.002 0.000003
1.07 0.053 (cm/s)
N/C = no contact
Double Ring Infiltrometer Data
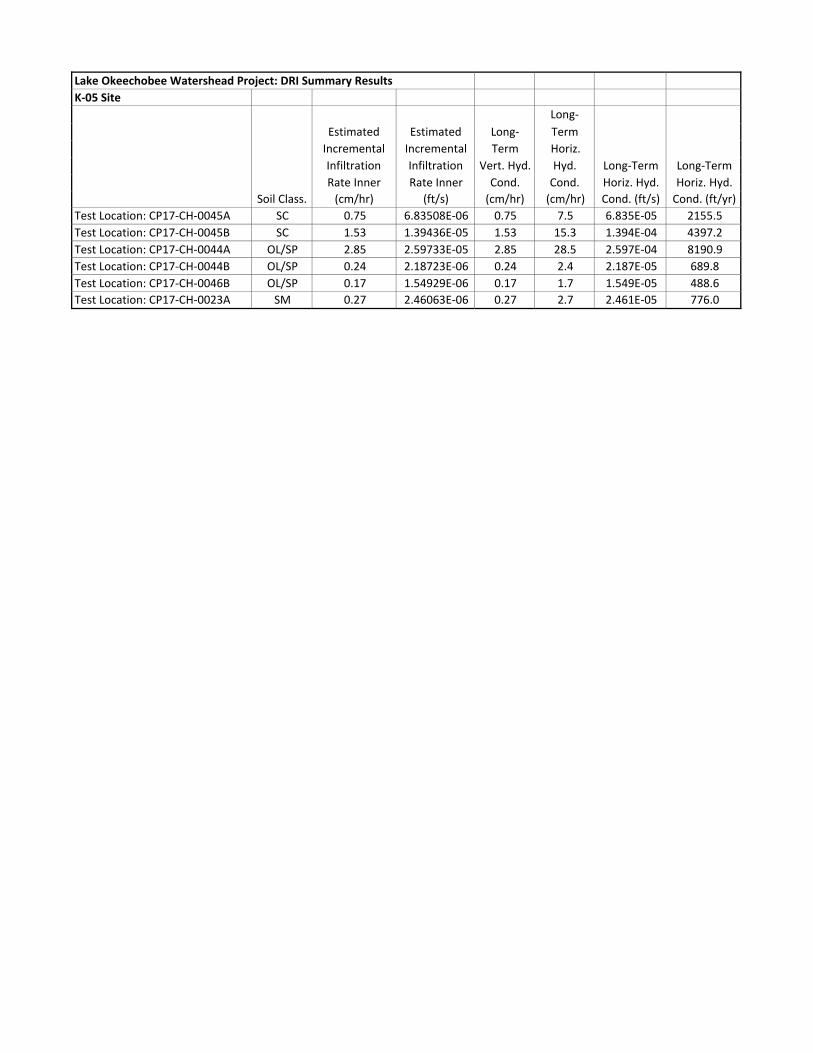
Lake Okeechobee Watershead Project: DRI Summary Results K‐05 Site
Soil Class.
Estimated Incremental Infiltration Rate Inner (cm/hr)
Estimated Incremental Infiltration Rate Inner
(ft/s)
Long‐
Term Vert. Hyd. Cond. (cm/hr)
Long‐
Term Horiz. Hyd. Cond. (cm/hr)
Long‐Term Horiz. Hyd. Cond. (ft/s)
Long‐Term Horiz. Hyd. Cond. (ft/yr)
Test Location: CP17‐CH‐0045A SC 0.75 6.83508E‐06 0.75 7.5 6.835E‐05 2155.5 Test Location: CP17‐CH‐0045B SC 1.53 1.39436E‐05 1.53 15.3 1.394E‐04 4397.2 Test Location: CP17‐CH‐0044A OL/SP 2.85 2.59733E‐05 2.85 28.5 2.597E‐04 8190.9 Test Location: CP17‐CH‐0044B OL/SP 0.24 2.18723E‐06 0.24 2.4 2.187E‐05 689.8 Test Location: CP17‐CH‐0046B OL/SP 0.17 1.54929E‐06 0.17 1.7 1.549E‐05 488.6 Test Location: CP17‐CH‐0023A SM 0.27 2.46063E‐06 0.27 2.7 2.461E‐05 776.0
SEEP/W Figures and Results
Road Seepage Canal
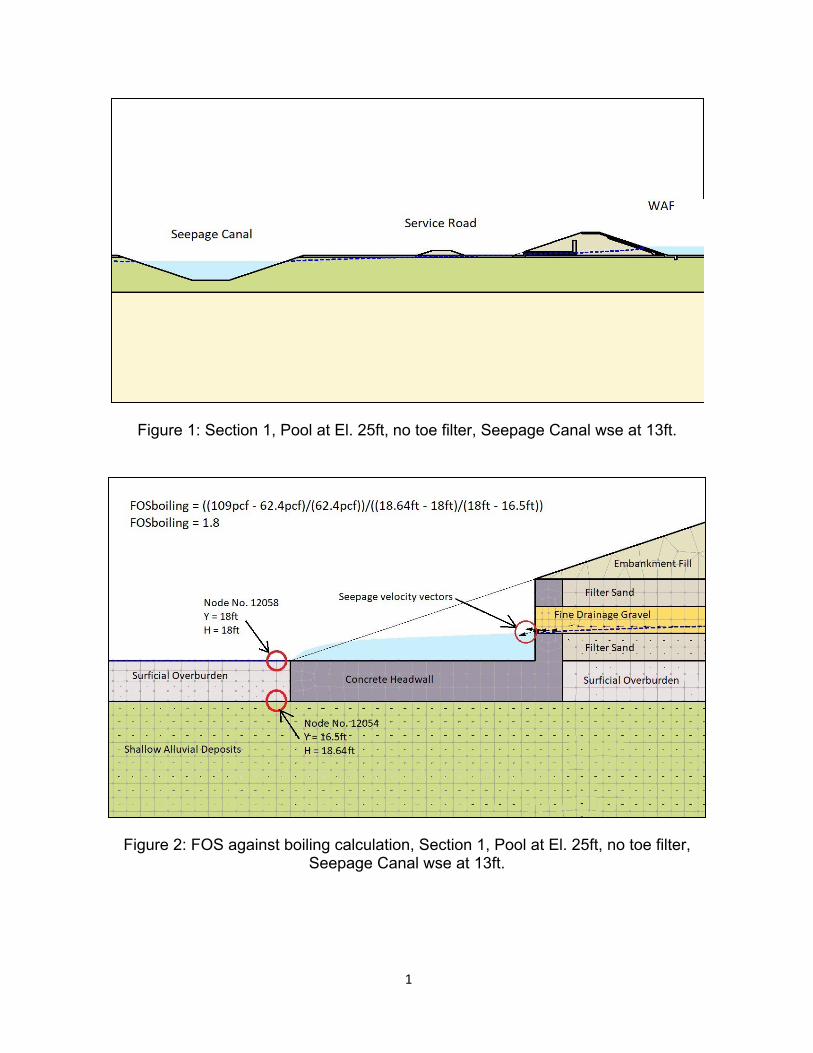
FOSboi ling = {{109pcf - 62.4pcf)/{62.4pcf))/({18.64ft - 18ft)/{18ft - 16.Sft))
FOSboi ling = 1.8
Node No. 12058 Y = 18ft H = 18ft
Sl!!ficia l Overbu~n
- Shalfow Alluvia l -Deposits- -
Seepage velocity vectors
Concrete Headwall
H = 18.64ft
WAF
Fine Dra inage Gravel
Filter Sand
s_.urficia10verburden
Figure 1: Section 1, Pool at El. 25ft, no toe filter, Seepage Canal wse at 13ft.
Figure 2: FOS against boiling calculation, Section 1, Pool at El. 25ft, no toe filter, Seepage Canal wse at 13ft.
1
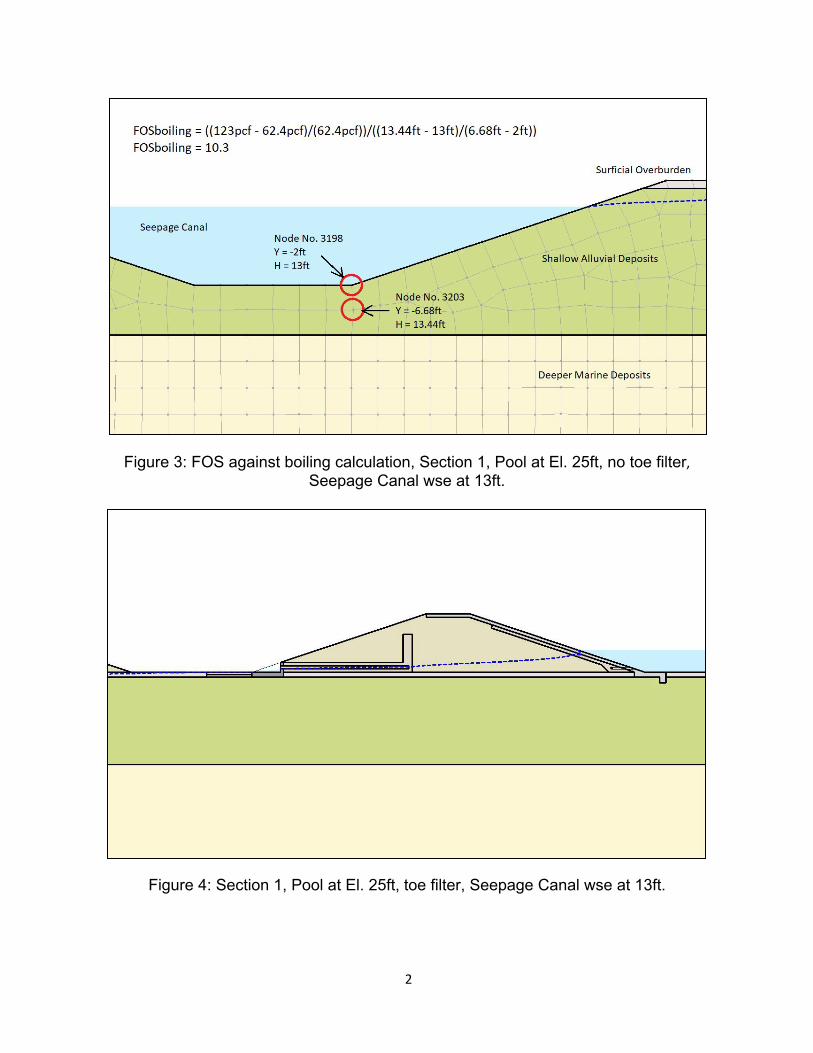
= ((123pcf - 62.4pcf)/(62.4pcf))/((13 .44ft - 13ft)/(6.68ft - 2ft)) FOSboiling = 10.3
Surficia l Overburden
------------------Seepage Canal
Node No. 3198 Y = -2ft
Shallow Alluvial Deposits r------- H = 13ft
"&- Node No. 3203 Y = -6.68ft H = 13.44ft
Deer l . l J er Manne 1Depos,1t s
Figure 3: FOS against boiling calculation, Section 1, Pool at El. 25ft, no toe filter, Seepage Canal wse at 13ft.
Figure 4: Section 1, Pool at El. 25ft, toe filter, Seepage Canal wse at 13ft.
2
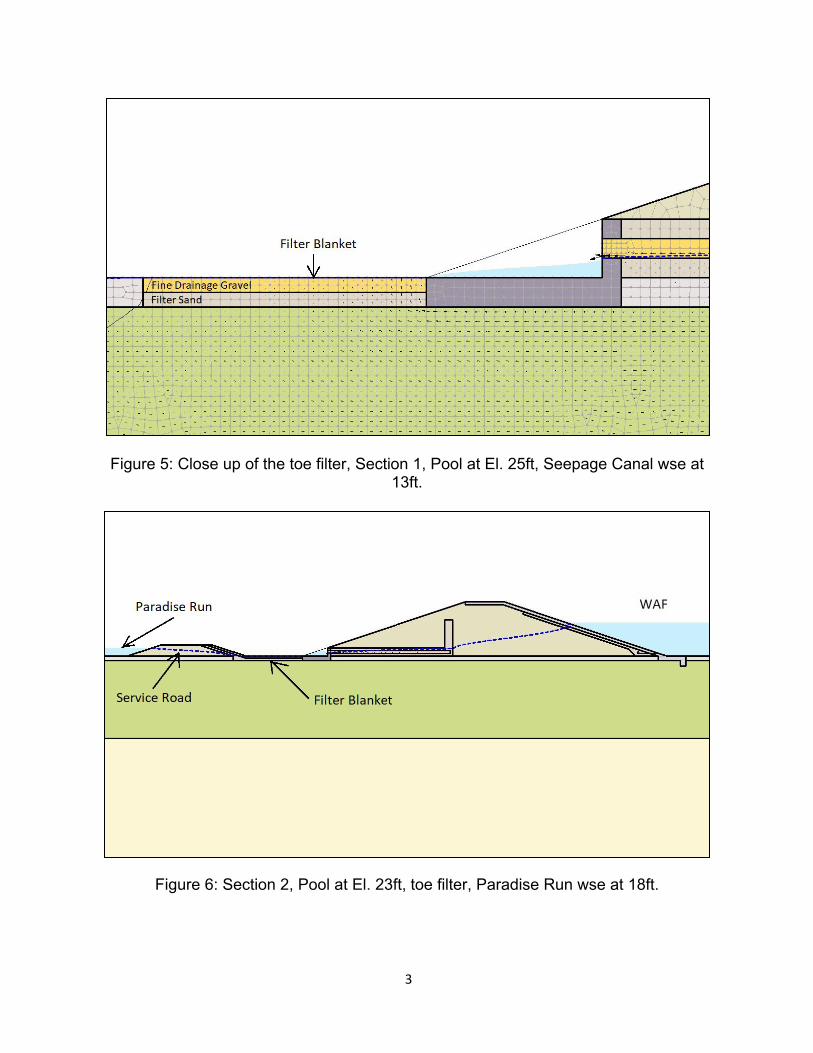
i lter Blanket
Fine Drainage Gravel \ I
Filter Sand ' \
Paradise Run
Filter Blanket
Figure 5: Close up of the toe filter, Section 1, Pool at El. 25ft, Seepage Canal wse at 13ft.
Figure 6: Section 2, Pool at El. 23ft, toe filter, Paradise Run wse at 18ft.
3
-
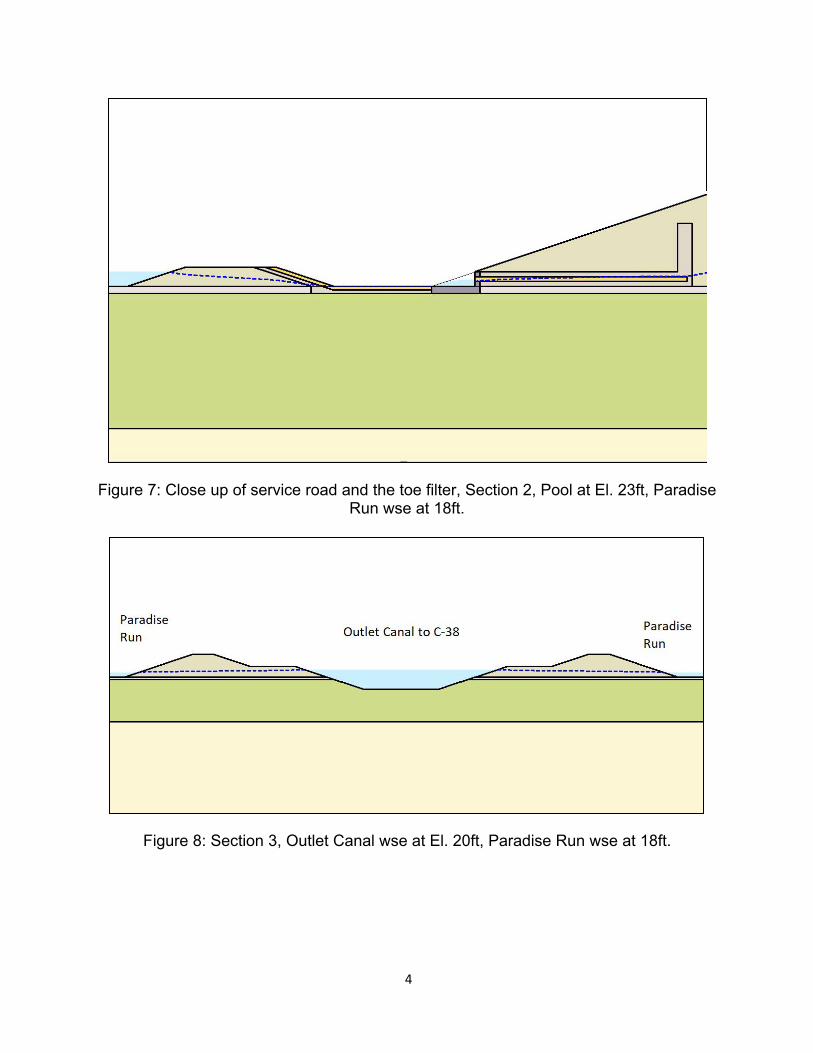
Parad ise
Run Outlet Cana l to C-38 Pa rad ise
Run -
~ --------------------~ -----------------------~ - -
Figure 7: Close up of service road and the toe filter, Section 2, Pool at El. 23ft, Paradise Run wse at 18ft.
Figure 8: Section 3, Outlet Canal wse at El. 20ft, Paradise Run wse at 18ft.
4
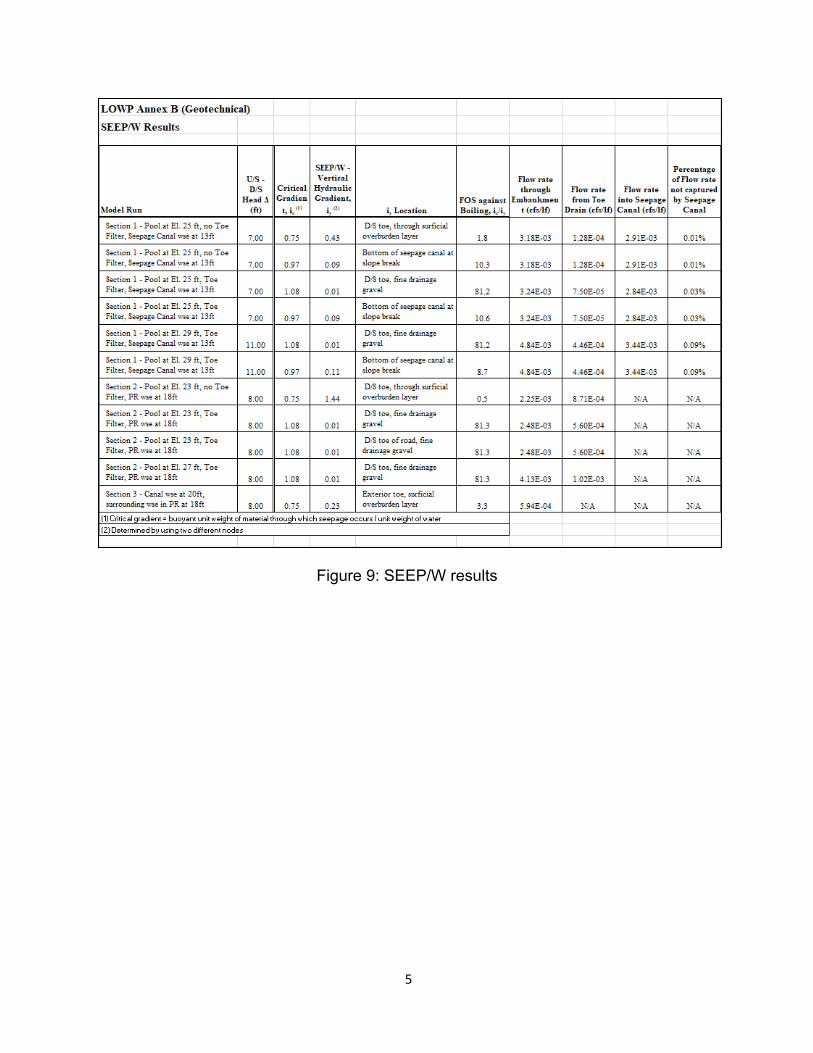
OWP Allllex B (Geotechnical) t t SEEP/\¥ R esults
SIIPIW- Perc-ent3ge UIS - Ve.rtic-a.l Flow r::1 te of Flow rate DIS Crili<al Hydn11li< through Flow r:1te Flow ra te not t':t.p tured
Head & Cr:ulien Cr:1d.ient, FOS ,g,uut Lmba.nkme.n from Toe in to S e-ep:.t ge by Seepage ModelR110 ( f t) t, ~ CU ~ ., i, Loc-a tion Boiling, ij~ t (<Wlf) Dnin (<Wlf) c,ul (<Wlf) Ca.o.a.l
Secti011 1 - Pool at El. 25 fl , no Toe DIS toe, through surficial Filter, Se.page Canal =e at 13 ft 7.00 0 .75 0.43 overburden layer 1.8 3 . l SE-03 l .2-SE-04 2 .9 1E -03 0 .0 1%
Secti011 1 - Pool at El. 25 fl , no Toe Bottom o f secpa.ga c.ana1 a.t Filter, Se~ag~ Canal wse at 13 ft 7.00 0 .97 0 .09 slope hreak 10.3 3. l SE-03 l .2-SE-04 2 .. 9 1E -03 0 .0 1%
5-"Ction 1 - Pool at El. 2.5 ft, Toe D/S toe, fin.a dra.ina.ga Filt<!<, Seepage Canal wse at 13 fl 7.00 1.03 0 .0 1 g:ra:ve.l. 81.2- 3 .24E -03 7.50E-05 2 .84E -03 0 .03%
5-"Ction 1 - Pool at El. 2.5 ft, Toe Bo ttom o f s.-:aepa.ga canal a.t Filt<!<, Seepage Canal wse at 13 fl 7.00 0 .9 7 0 .09 slope hreak 10.6 3 .24E -03 7.50E-05 2 .84E -03 0 .03%
5-"Ction 1 - Pool at El. 29 ft, Toe D/S toe, firu! dra.ina.ga Filt<!<, Seepage Canal wsa at 13 fl 11.00 1.03 0 .0 1 g:ra:ve.l. 81.2- 4 .84E -03 4 .4 6E-04 3.44E -03 0 .09%
5-"Cti011 1 - Pool at El. 29 ft, Toe Bo ttom o f s._:aepa.ga canal a.t Filt<!<, Seepage Canal wsa at 13 fl 11.00 0 .9 7 0 .11 slope hreak S.7 4 .84E -03 4 .4 6E-04 3.44E -03 0 .09%
5-"Cti011 2 - Pool at El. 23 ft, no Toe DIS toe, through ,uriicial Filt"', PR wsa at ! Sil 8.00 0 .75 1.44 overburden 1.a.ya:r 0 .5 2 .25E -03 8.71E-04 NIA NIA
5-"Ction 2 - Pool at El. 23 ft, Toe DIS toe, fine dra.ina.ga Filt"', PR wsa at ! Sil 8.00 1.03 0 .0 1 g:r:a:ve.1 81.3 2 .4SE-03 5.60E-04 NIA NIA
s_..,ti011 2 - Pool at El. 23 ft, Toa DIS toe of road, fine Filt"', PR wsa at ! Sil 8.00 1.03 0 .0 1 d:rainageyav e.l. 81.3 2 .4SE-03 5.60E-04 NIA NIA
s_..,ti011 2 - Pool at El. 27 ft, Toa DIS toe, fin.a dra.ina.ge Filt"', PR wsa at ! Sil 8.00 1.03 0 .0 1 g:r:a:ve.l 81.3 4 .13E -03 I 02.E-03 NIA NIA
5-"Ction 3 - Canal wsa at 20ft, Ext.erior toe, s:u:rfi.cia.1 su.rro1J.11din_g wsa in PR at 18ft 8.00 0 .75 0 .2.3 overbu:rd.ea.1.a.yc:r 3.3 5.94E -04 NIA NIA NIA
(1) Critical gradient= buoyant unit weight of material through which seepage occurs I unit weight of water
(2 ) Determined by using tw o different nodes t
L
Figure 9: SEEP/W results
5
SEEP/W Program Files
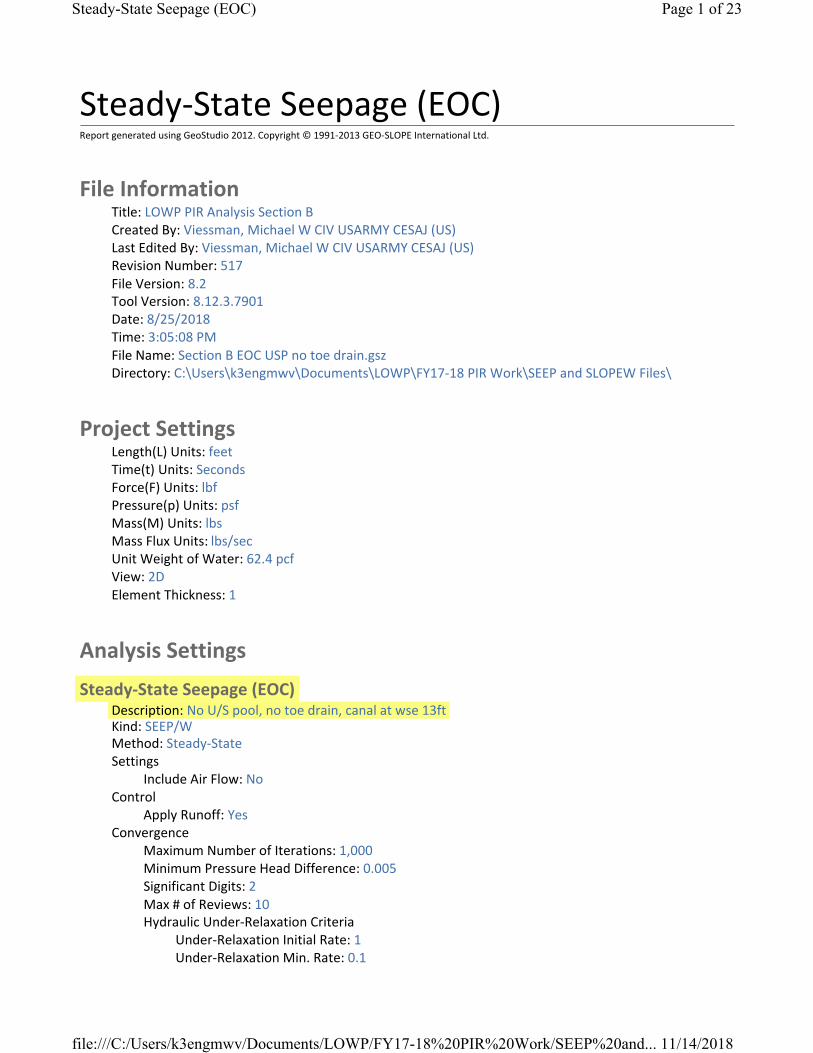
Steady-State Seepage (EOC) Page 1 of 23
Steady‐State Seepage (EOC) Report generated using GeoStudio 2012. Copyright © 1991‐2013 GEO‐SLOPE International Ltd.
File Information Title: LOWP PIR Analysis Section B Created By: Viessman, Michael W CIV USARMY CESAJ (US) Last Edited By: Viessman, Michael W CIV USARMY CESAJ (US) Revision Number: 517 File Version: 8.2 Tool Version: 8.12.3.7901 Date: 8/25/2018 Time: 3:05:08 PM File Name: Section B EOC USP no toe drain.gsz Directory: C:\Users\k3engmwv\Documents\LOWP\FY17‐18 PIR Work\SEEP and SLOPEW Files\
Project Settings Length(L) Units: feet Time(t) Units: Seconds Force(F) Units: lbf Pressure(p) Units: psf Mass(M) Units: lbs Mass Flux Units: lbs/sec Unit Weight of Water: 62.4 pcf View: 2D Element Thickness: 1
Analysis Settings
Steady‐State Seepage (EOC) Description: No U/S pool, no toe drain, canal at wse 13ft Kind: SEEP/W Method: Steady‐State Settings
Include Air Flow: No Control
Apply Runoff: Yes Convergence
Maximum Number of Iterations: 1,000 Minimum Pressure Head Difference: 0.005 Significant Digits: 2 Max # of Reviews: 10 Hydraulic Under‐Relaxation Criteria
Under‐Relaxation Initial Rate: 1 Under‐Relaxation Min. Rate: 0.1
file:///C:/Users/k3engmwv/Documents/LOWP/FY17-18%20PIR%20Work/SEEP%20and... 11/14/2018

Steady-State Seepage (EOC) Page 2 of 23
Under‐Relaxation Reduction Rate: 0.65 Under‐Relaxation Iterations: 10
Equation Solver: Parallel Direct Time
Starting Time: 0 sec Duration: 0 sec Ending Time: 0 sec
Materials
Matl. 1 ‐ Embankment Material Model: Saturated / Unsaturated Hydraulic
K‐Function: Matl. 1 Embankment Material Ky'/Kx' Ratio: 0.25 Rotation: 0 ° Vol. WC. Function: Matl. 1 Embankment Fill from Borrow Areas
Matl. 2 ‐ Surficial Overburden Layer Model: Saturated / Unsaturated Hydraulic
K‐Function: Matl. 2 Surficial Overburden Layer Ky'/Kx' Ratio: 0.1 Rotation: 0 ° Vol. WC. Function: Matl. 2 Surficial Overburden Layer
Matl. 3 ‐ Shallow Alluvial Deposits Model: Saturated / Unsaturated Hydraulic
K‐Function: Matl. 3 Shallow Alluvial Deposits Ky'/Kx' Ratio: 0.1 Rotation: 0 ° Vol. WC. Function: Matl. 3 Shallow Alluvial Deposits
Matl. 4 ‐ Deeper Marine Deposits Model: Saturated / Unsaturated Hydraulic
K‐Function: Matl. 4 Deeper Marine Deposits Ky'/Kx' Ratio: 0.1 Rotation: 0 ° Vol. WC. Function: Matl. 4 Deeper Marine Deposits
Matl. 5 ‐ Soil Cement Armoring Model: Saturated / Unsaturated Hydraulic
K‐Function: Matl. 5 Soil Cement Armoring Ky'/Kx' Ratio: 1 Rotation: 0 ° Vol. WC. Function: Matl. 5 Soil Cement Armoring
file:///C:/Users/k3engmwv/Documents/LOWP/FY17-18%20PIR%20Work/SEEP%20and... 11/14/2018

Steady-State Seepage (EOC) Page 3 of 23
Matl. 6 ‐ Fine Drainage Gravel Model: Saturated / Unsaturated Hydraulic
K‐Function: Matl. 6 Fine Drainage Gravel Ky'/Kx' Ratio: 1 Rotation: 0 ° Vol. WC. Function: Mat. 6 Fine Drainage Gravel (No 89)
Matl. 8 ‐ Filter Sand Model: Saturated / Unsaturated Hydraulic
K‐Function: Matl. 8 Filter Sand Ky'/Kx' Ratio: 1 Rotation: 0 ° Vol. WC. Function: Matl. 8 Filter Sand (C33)
Matl. 9 Concrete Outfall Works Model: Saturated Only Hydraulic
K‐Sat: 3.28e‐010 ft/sec Ky'/Kx' Ratio: 1 Rotation: 0 ° Volumetric Water Content: 0.3 ft³/ft³ Mv: 1e‐008 /psf
Boundary Conditions
Drainage Type: Total Flux (Q) 0 Review: Yes
Seepage Canal at Elev. 13ft Type: Head (H) 13 Review: No
Flux Sections
Flux Section 1 Coordinates
Coordinate: (‐53.387097, 20.026507) ft Coordinate: (‐53.387097, 18.965214) ft
Flux Section 2 Coordinates
Coordinate: (‐77.145669, 18.00689) ft Coordinate: (‐77.130906, 16.397638) ft Coordinate: (‐62.322835, 16.373031) ft
file:///C:/Users/k3engmwv/Documents/LOWP/FY17-18%20PIR%20Work/SEEP%20and... 11/14/2018
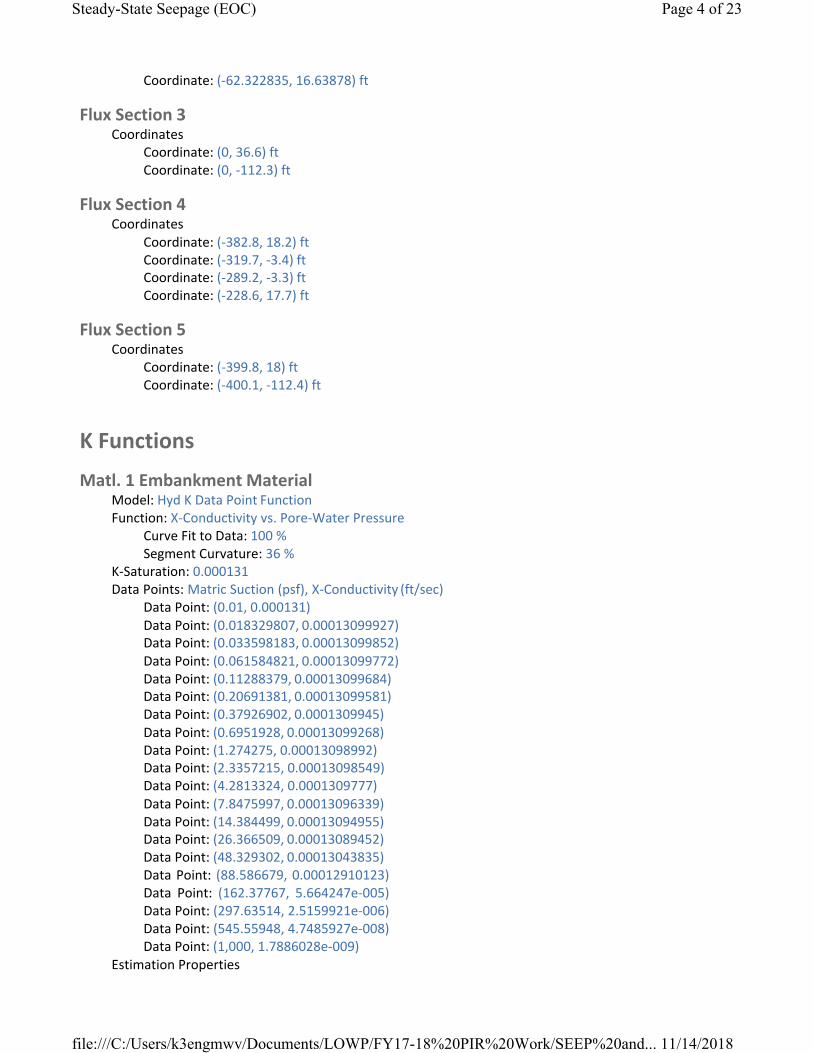
Steady-State Seepage (EOC) Page 4 of 23
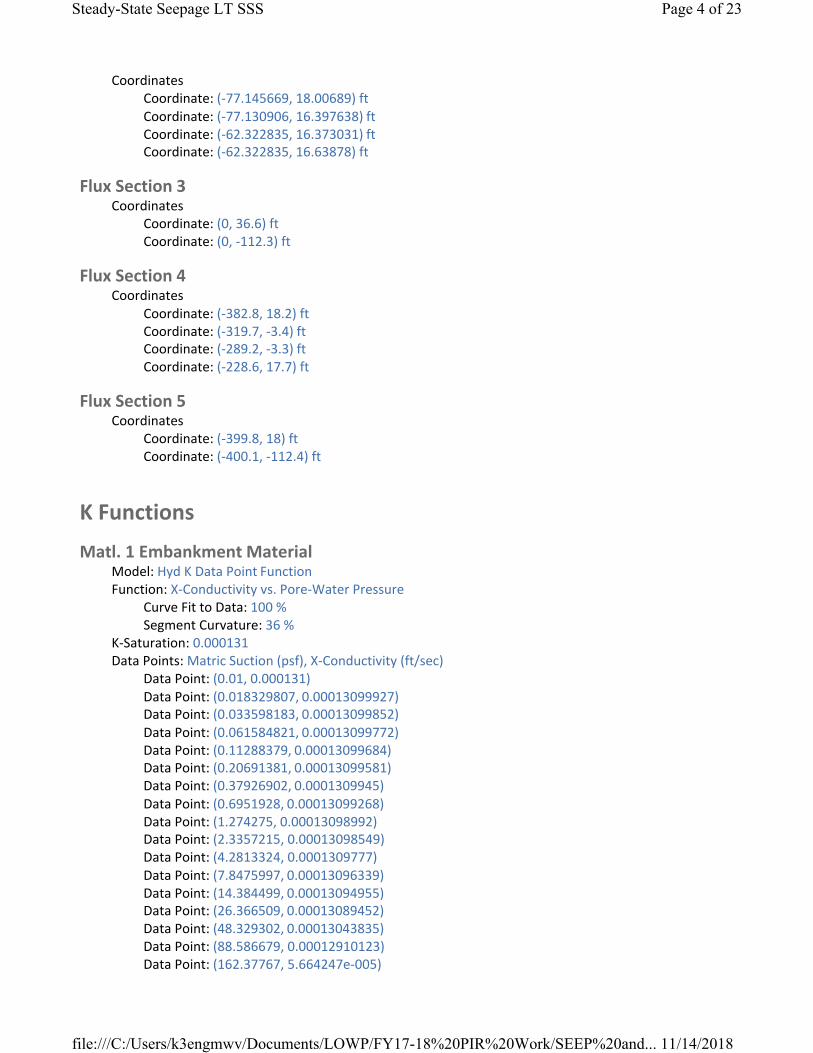
Coordinate: (‐62.322835, 16.63878) ft
Flux Section 3 Coordinates
Coordinate: (0, 36.6) ft Coordinate: (0, ‐112.3) ft
Flux Section 4 Coordinates
Coordinate: (‐382.8, 18.2) ft Coordinate: (‐319.7, ‐3.4) ft Coordinate: (‐289.2, ‐3.3) ft Coordinate: (‐228.6, 17.7) ft
Flux Section 5 Coordinates
Coordinate: (‐399.8, 18) ft Coordinate: (‐400.1, ‐112.4) ft
K Functions
Matl. 1 Embankment Material Model: Hyd K Data Point Function Function: X‐Conductivity vs. Pore‐Water Pressure
Curve Fit to Data: 100 % Segment Curvature: 36 %
K‐Saturation: 0.000131 Data Points: Matric Suction (psf), X‐Conductivity (ft/sec)
Data Point: (0.01, 0.000131) Data Point: (0.018329807, 0.00013099927) Data Point: (0.033598183, 0.00013099852) Data Point: (0.061584821, 0.00013099772) Data Point: (0.11288379, 0.00013099684) Data Point: (0.20691381, 0.00013099581) Data Point: (0.37926902, 0.0001309945) Data Point: (0.6951928, 0.00013099268) Data Point: (1.274275, 0.00013098992) Data Point: (2.3357215, 0.00013098549) Data Point: (4.2813324, 0.0001309777) Data Point: (7.8475997, 0.00013096339) Data Point: (14.384499, 0.00013094955) Data Point: (26.366509, 0.00013089452) Data Point: (48.329302, 0.00013043835) Data Point: (88.586679, 0.00012910123) Data Point: (162.37767, 5.664247e‐005) Data Point: (297.63514, 2.5159921e‐006) Data Point: (545.55948, 4.7485927e‐008) Data Point: (1,000, 1.7886028e‐009)
Estimation Properties
file:///C:/Users/k3engmwv/Documents/LOWP/FY17-18%20PIR%20Work/SEEP%20and... 11/14/2018

Steady-State Seepage (EOC) Page 5 of 23
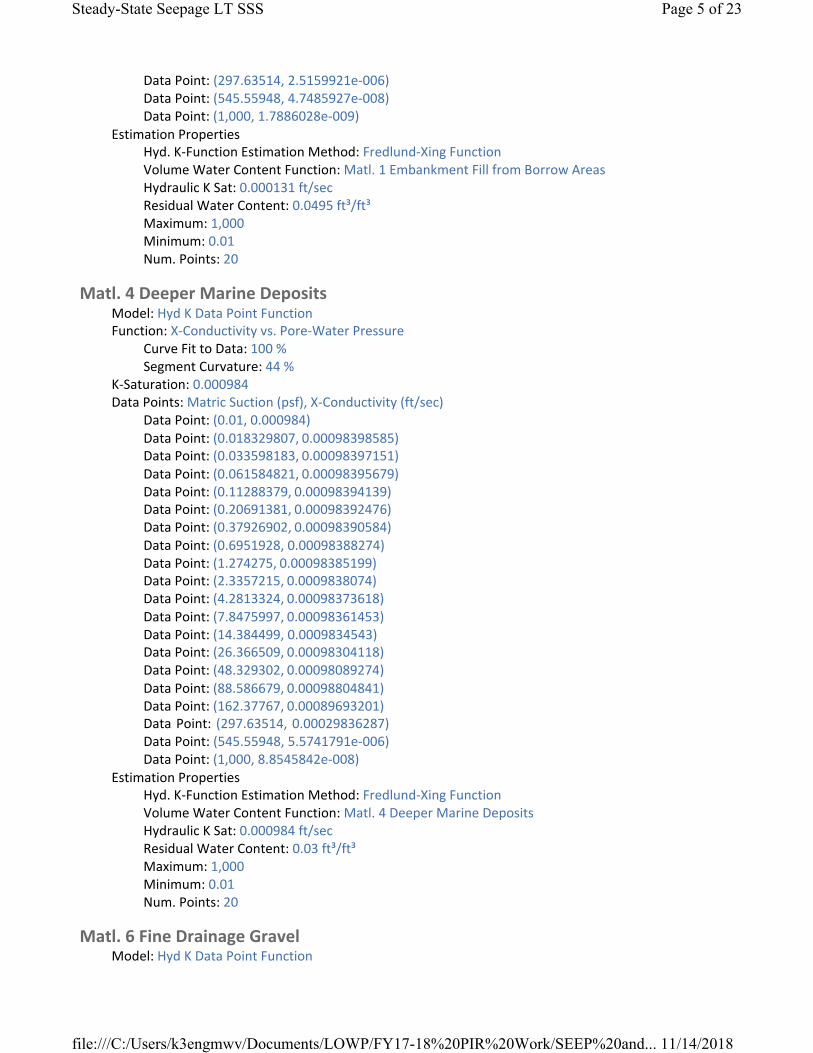
Hyd. K‐Function Estimation Method: Fredlund‐Xing Function Volume Water Content Function: Matl. 1 Embankment Fill from Borrow Areas Hydraulic K Sat: 0.000131 ft/sec Residual Water Content: 0.0495 ft³/ft³ Maximum: 1,000 Minimum: 0.01 Num. Points: 20
Matl. 4 Deeper Marine Deposits Model: Hyd K Data Point Function Function: X‐Conductivity vs. Pore‐Water Pressure
Curve Fit to Data: 100 % Segment Curvature: 44 %
K‐Saturation: 0.000984 Data Points: Matric Suction (psf), X‐Conductivity (ft/sec)
Data Point: (0.01, 0.000984) Data Point: (0.018329807, 0.00098398585) Data Point: (0.033598183, 0.00098397151) Data Point: (0.061584821, 0.00098395679) Data Point: (0.11288379, 0.00098394139) Data Point: (0.20691381, 0.00098392476) Data Point: (0.37926902, 0.00098390584) Data Point: (0.6951928, 0.00098388274) Data Point: (1.274275, 0.00098385199) Data Point: (2.3357215, 0.0009838074) Data Point: (4.2813324, 0.00098373618) Data Point: (7.8475997, 0.00098361453) Data Point: (14.384499, 0.0009834543) Data Point: (26.366509, 0.00098304118) Data Point: (48.329302, 0.00098089274) Data Point: (88.586679, 0.00098804841) Data Point: (162.37767, 0.00089693201) Data Point: (297.63514, 0.00029836287) Data Point: (545.55948, 5.5741791e‐006) Data Point: (1,000, 8.8545842e‐008)
Estimation Properties Hyd. K‐Function Estimation Method: Fredlund‐Xing Function Volume Water Content Function: Matl. 4 Deeper Marine Deposits Hydraulic K Sat: 0.000984 ft/sec Residual Water Content: 0.03 ft³/ft³ Maximum: 1,000 Minimum: 0.01 Num. Points: 20
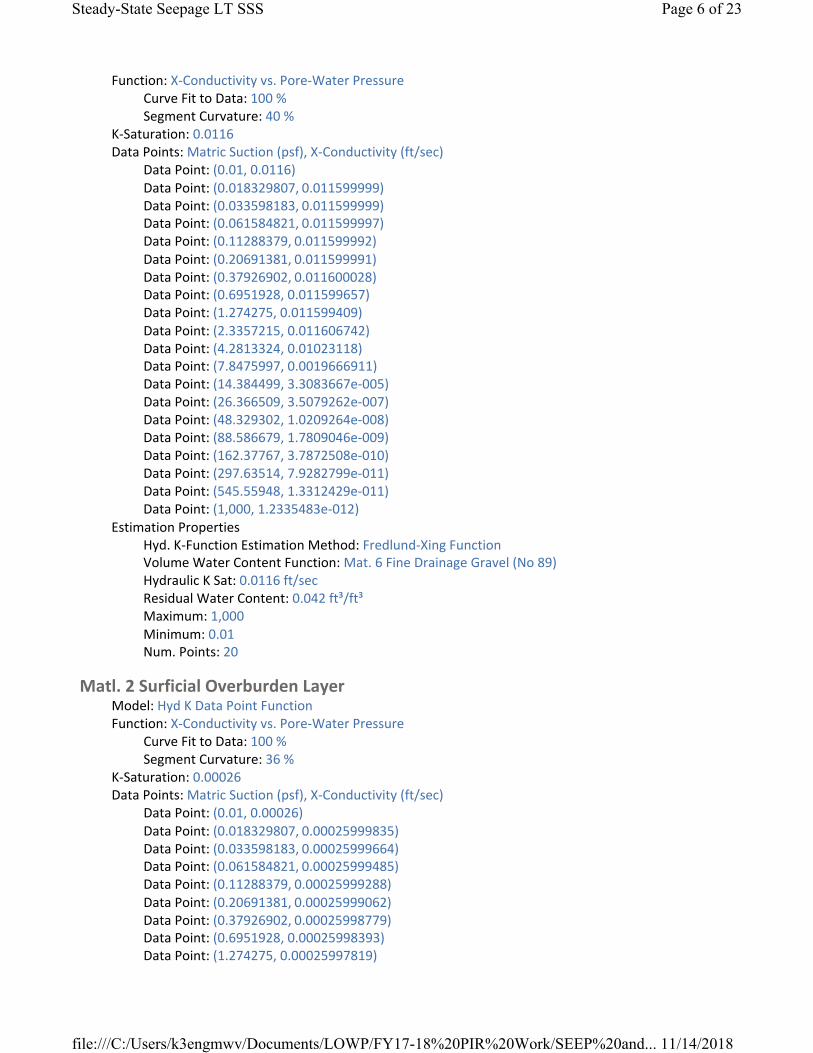
Matl. 6 Fine Drainage Gravel Model: Hyd K Data Point Function Function: X‐Conductivity vs. Pore‐Water Pressure
Curve Fit to Data: 100 % Segment Curvature: 40 %
K‐Saturation: 0.0116
file:///C:/Users/k3engmwv/Documents/LOWP/FY17-18%20PIR%20Work/SEEP%20and... 11/14/2018
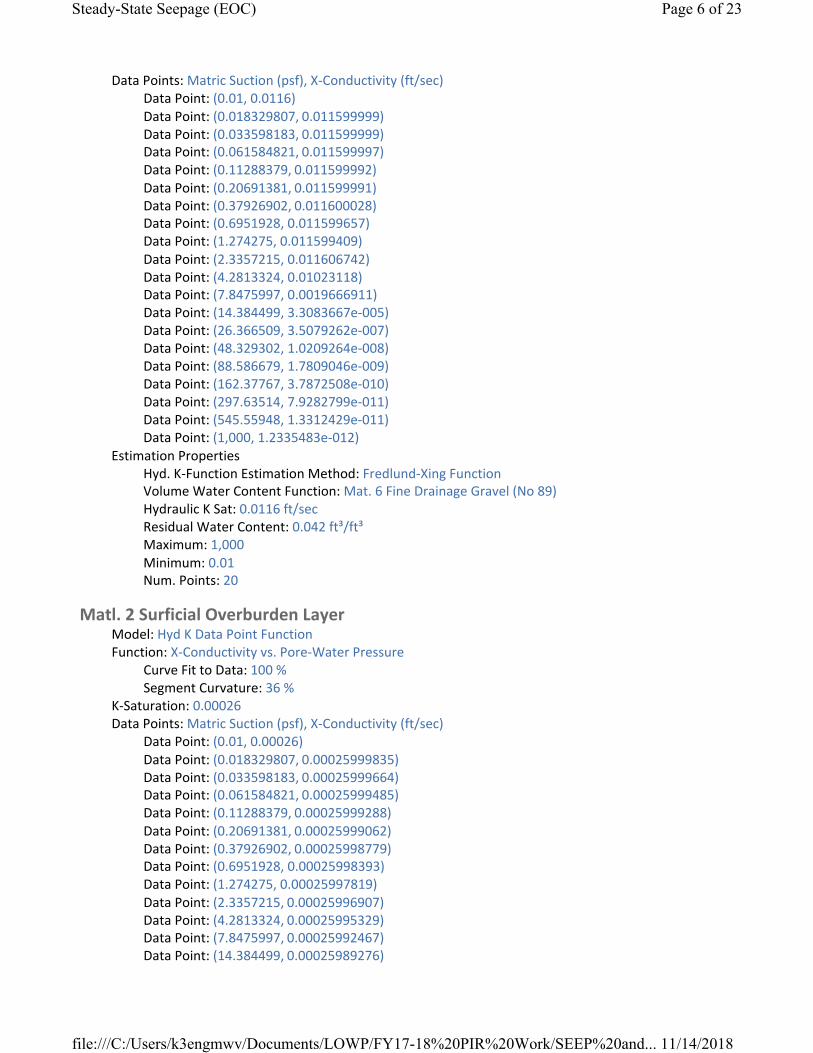
Steady-State Seepage (EOC) Page 6 of 23
Data Points: Matric Suction (psf), X‐Conductivity (ft/sec) Data Point: (0.01, 0.0116) Data Point: (0.018329807, 0.011599999) Data Point: (0.033598183, 0.011599999) Data Point: (0.061584821, 0.011599997) Data Point: (0.11288379, 0.011599992) Data Point: (0.20691381, 0.011599991) Data Point: (0.37926902, 0.011600028) Data Point: (0.6951928, 0.011599657) Data Point: (1.274275, 0.011599409) Data Point: (2.3357215, 0.011606742) Data Point: (4.2813324, 0.01023118) Data Point: (7.8475997, 0.0019666911) Data Point: (14.384499, 3.3083667e‐005) Data Point: (26.366509, 3.5079262e‐007) Data Point: (48.329302, 1.0209264e‐008) Data Point: (88.586679, 1.7809046e‐009) Data Point: (162.37767, 3.7872508e‐010) Data Point: (297.63514, 7.9282799e‐011) Data Point: (545.55948, 1.3312429e‐011) Data Point: (1,000, 1.2335483e‐012)
Estimation Properties Hyd. K‐Function Estimation Method: Fredlund‐Xing Function Volume Water Content Function: Mat. 6 Fine Drainage Gravel (No 89) Hydraulic K Sat: 0.0116 ft/sec Residual Water Content: 0.042 ft³/ft³ Maximum: 1,000 Minimum: 0.01 Num. Points: 20
Matl. 2 Surficial Overburden Layer Model: Hyd K Data Point Function Function: X‐Conductivity vs. Pore‐Water Pressure
Curve Fit to Data: 100 % Segment Curvature: 36 %
K‐Saturation: 0.00026 Data Points: Matric Suction (psf), X‐Conductivity (ft/sec)
Data Point: (0.01, 0.00026) Data Point: (0.018329807, 0.00025999835) Data Point: (0.033598183, 0.00025999664) Data Point: (0.061584821, 0.00025999485) Data Point: (0.11288379, 0.00025999288) Data Point: (0.20691381, 0.00025999062) Data Point: (0.37926902, 0.00025998779) Data Point: (0.6951928, 0.00025998393) Data Point: (1.274275, 0.00025997819) Data Point: (2.3357215, 0.00025996907) Data Point: (4.2813324, 0.00025995329) Data Point: (7.8475997, 0.00025992467) Data Point: (14.384499, 0.00025989276)
file:///C:/Users/k3engmwv/Documents/LOWP/FY17-18%20PIR%20Work/SEEP%20and... 11/14/2018

Steady-State Seepage (EOC) Page 7 of 23
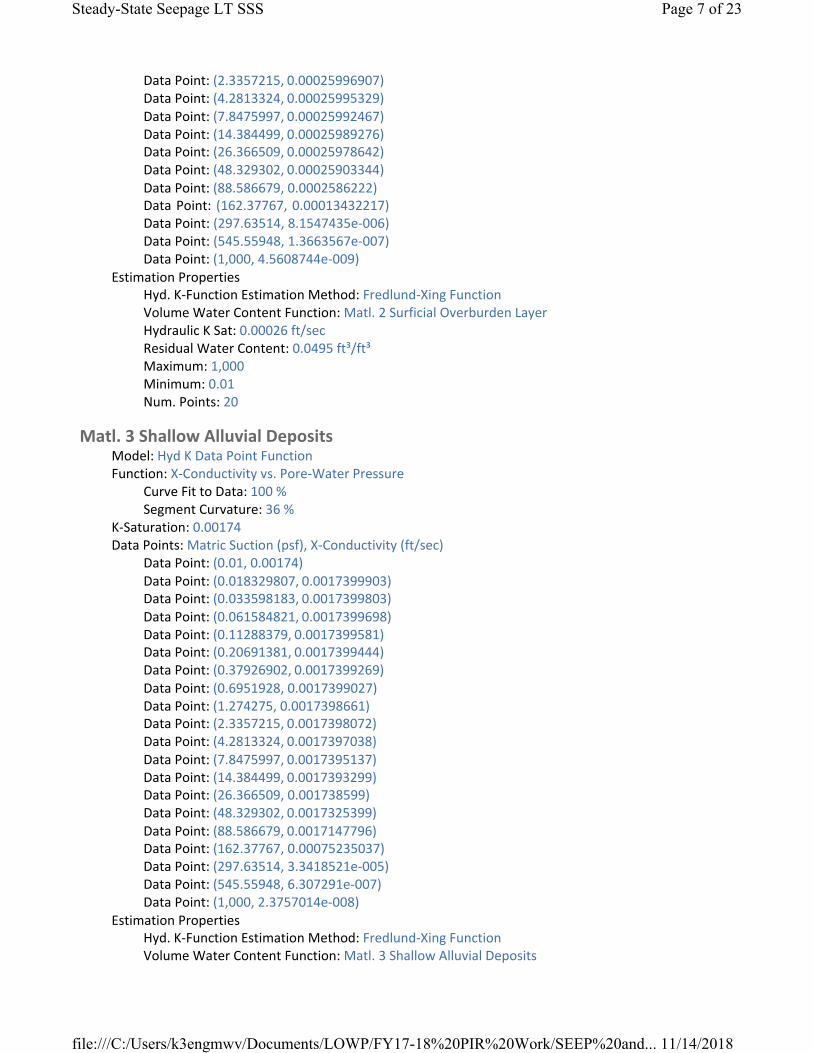
Data Point: (26.366509, 0.00025978642) Data Point: (48.329302, 0.00025903344) Data Point: (88.586679, 0.0002586222) Data Point: (162.37767, 0.00013432217) Data Point: (297.63514, 8.1547435e‐006) Data Point: (545.55948, 1.3663567e‐007) Data Point: (1,000, 4.5608744e‐009)
Estimation Properties Hyd. K‐Function Estimation Method: Fredlund‐Xing Function Volume Water Content Function: Matl. 2 Surficial Overburden Layer Hydraulic K Sat: 0.00026 ft/sec Residual Water Content: 0.0495 ft³/ft³ Maximum: 1,000 Minimum: 0.01 Num. Points: 20
Matl. 3 Shallow Alluvial Deposits Model: Hyd K Data Point Function Function: X‐Conductivity vs. Pore‐Water Pressure
Curve Fit to Data: 100 % Segment Curvature: 36 %
K‐Saturation: 0.00174 Data Points: Matric Suction (psf), X‐Conductivity (ft/sec)
Data Point: (0.01, 0.00174) Data Point: (0.018329807, 0.0017399903) Data Point: (0.033598183, 0.0017399803) Data Point: (0.061584821, 0.0017399698) Data Point: (0.11288379, 0.0017399581) Data Point: (0.20691381, 0.0017399444) Data Point: (0.37926902, 0.0017399269) Data Point: (0.6951928, 0.0017399027) Data Point: (1.274275, 0.0017398661) Data Point: (2.3357215, 0.0017398072) Data Point: (4.2813324, 0.0017397038) Data Point: (7.8475997, 0.0017395137) Data Point: (14.384499, 0.0017393299) Data Point: (26.366509, 0.001738599) Data Point: (48.329302, 0.0017325399) Data Point: (88.586679, 0.0017147796) Data Point: (162.37767, 0.00075235037) Data Point: (297.63514, 3.3418521e‐005) Data Point: (545.55948, 6.307291e‐007) Data Point: (1,000, 2.3757014e‐008)
Estimation Properties Hyd. K‐Function Estimation Method: Fredlund‐Xing Function Volume Water Content Function: Matl. 3 Shallow Alluvial Deposits Hydraulic K Sat: 0.00174 ft/sec Residual Water Content: 0.0495 ft³/ft³ Maximum: 1,000 Minimum: 0.01
file:///C:/Users/k3engmwv/Documents/LOWP/FY17-18%20PIR%20Work/SEEP%20and... 11/14/2018

Steady-State Seepage (EOC) Page 8 of 23
Num. Points: 20
Matl. 5 Soil Cement Armoring Model: Hyd K Data Point Function Function: X‐Conductivity vs. Pore‐Water Pressure
Curve Fit to Data: 100 % Segment Curvature: 44 %
K‐Saturation: 1.31e‐005 Data Points: Matric Suction (psf), X‐Conductivity (ft/sec)
Data Point: (0.01, 1.31e‐005) Data Point: (0.018329807, 1.3099927e‐005) Data Point: (0.033598183, 1.3099852e‐005) Data Point: (0.061584821, 1.3099772e‐005) Data Point: (0.11288379, 1.3099684e‐005) Data Point: (0.20691381, 1.3099581e‐005) Data Point: (0.37926902, 1.309945e‐005) Data Point: (0.6951928, 1.3099268e‐005) Data Point: (1.274275, 1.3098992e‐005) Data Point: (2.3357215, 1.3098549e‐005) Data Point: (4.2813324, 1.309777e‐005) Data Point: (7.8475997, 1.3096339e‐005) Data Point: (14.384499, 1.3094955e‐005) Data Point: (26.366509, 1.3089452e‐005) Data Point: (48.329302, 1.3043835e‐005) Data Point: (88.586679, 1.2910123e‐005) Data Point: (162.37767, 5.664247e‐006) Data Point: (297.63514, 2.5159921e‐007) Data Point: (545.55948, 4.7485927e‐009) Data Point: (1,000, 1.7886028e‐010)
Estimation Properties Hyd. K‐Function Estimation Method: Fredlund‐Xing Function Volume Water Content Function: Matl. 5 Soil Cement Armoring Hydraulic K Sat: 1.31e‐005 ft/sec Residual Water Content: 0.03 ft³/ft³ Maximum: 1,000 Minimum: 0.01 Num. Points: 20
Matl. 8 Filter Sand Model: Hyd K Data Point Function Function: X‐Conductivity vs. Pore‐Water Pressure
Curve Fit to Data: 100 % Segment Curvature: 44 %
K‐Saturation: 0.000925 Data Points: Matric Suction (psf), X‐Conductivity (ft/sec)
Data Point: (0.01, 0.000925) Data Point: (0.018329807, 0.00092499993) Data Point: (0.033598183, 0.00092499981) Data Point: (0.061584821, 0.0009249996) Data Point: (0.11288379, 0.00092499919)
file:///C:/Users/k3engmwv/Documents/LOWP/FY17-18%20PIR%20Work/SEEP%20and... 11/14/2018
Steady-State Seepage (EOC) Page 9 of 23
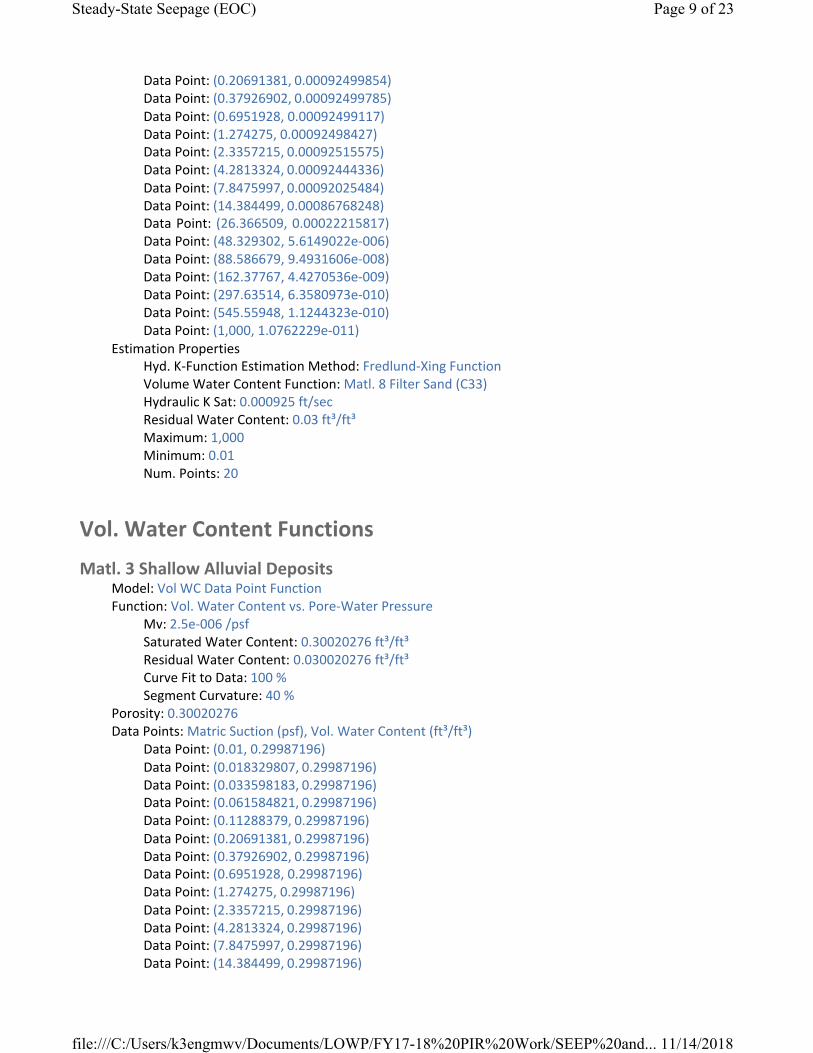
Data Point: (0.20691381, 0.00092499854) Data Point: (0.37926902, 0.00092499785) Data Point: (0.6951928, 0.00092499117) Data Point: (1.274275, 0.00092498427) Data Point: (2.3357215, 0.00092515575) Data Point: (4.2813324, 0.00092444336) Data Point: (7.8475997, 0.00092025484) Data Point: (14.384499, 0.00086768248) Data Point: (26.366509, 0.00022215817) Data Point: (48.329302, 5.6149022e‐006) Data Point: (88.586679, 9.4931606e‐008) Data Point: (162.37767, 4.4270536e‐009) Data Point: (297.63514, 6.3580973e‐010) Data Point: (545.55948, 1.1244323e‐010) Data Point: (1,000, 1.0762229e‐011)
Estimation Properties Hyd. K‐Function Estimation Method: Fredlund‐Xing Function Volume Water Content Function: Matl. 8 Filter Sand (C33) Hydraulic K Sat: 0.000925 ft/sec Residual Water Content: 0.03 ft³/ft³ Maximum: 1,000 Minimum: 0.01 Num. Points: 20
Vol. Water Content Functions
Matl. 3 Shallow Alluvial Deposits Model: Vol WC Data Point Function Function: Vol. Water Content vs. Pore‐Water Pressure
Mv: 2.5e‐006 /psf Saturated Water Content: 0.30020276 ft³/ft³ Residual Water Content: 0.030020276 ft³/ft³ Curve Fit to Data: 100 % Segment Curvature: 40 %
Porosity: 0.30020276 Data Points: Matric Suction (psf), Vol. Water Content (ft³/ft³)
Data Point: (0.01, 0.29987196) Data Point: (0.018329807, 0.29987196) Data Point: (0.033598183, 0.29987196) Data Point: (0.061584821, 0.29987196) Data Point: (0.11288379, 0.29987196) Data Point: (0.20691381, 0.29987196) Data Point: (0.37926902, 0.29987196) Data Point: (0.6951928, 0.29987196) Data Point: (1.274275, 0.29987196) Data Point: (2.3357215, 0.29987196) Data Point: (4.2813324, 0.29987196) Data Point: (7.8475997, 0.29987196) Data Point: (14.384499, 0.29987196)
file:///C:/Users/k3engmwv/Documents/LOWP/FY17-18%20PIR%20Work/SEEP%20and... 11/14/2018

Steady-State Seepage (EOC) Page 10 of 23
Data Point: (26.366509, 0.29987196) Data Point: (48.329302, 0.29987196) Data Point: (88.586679, 0.29667682) Data Point: (162.37767, 0.20150036) Data Point: (297.63514, 0.085811521) Data Point: (545.55948, 0.049379583) Data Point: (1,000, 0.039446735)
Estimation Properties Vol. WC Estimation Method: Grain Size Function Saturated Water Content: 0.3 ft³/ft³ Sample Material: Clay Liquid Limit: 0 % Diameter at 10% passing: 0.07000000000000001 Diameter at 60% passing: 0.2 Maximum: 1,000 Minimum: 0.01 Num. Points: 20
Matl. 1 Embankment Fill from Borrow Areas Model: Vol WC Data Point Function Function: Vol. Water Content vs. Pore‐Water Pressure
Mv: 2.5e‐006 /psf Saturated Water Content: 0.30020276 ft³/ft³ Residual Water Content: 0.030020276 ft³/ft³ Curve Fit to Data: 100 % Segment Curvature: 40 %
Porosity: 0.30020276 Data Points: Matric Suction (psf), Vol. Water Content (ft³/ft³)
Data Point: (0.01, 0.29987196) Data Point: (0.018329807, 0.29987196) Data Point: (0.033598183, 0.29987196) Data Point: (0.061584821, 0.29987196) Data Point: (0.11288379, 0.29987196) Data Point: (0.20691381, 0.29987196) Data Point: (0.37926902, 0.29987196) Data Point: (0.6951928, 0.29987196) Data Point: (1.274275, 0.29987196) Data Point: (2.3357215, 0.29987196) Data Point: (4.2813324, 0.29987196) Data Point: (7.8475997, 0.29987196) Data Point: (14.384499, 0.29987196) Data Point: (26.366509, 0.29987196) Data Point: (48.329302, 0.29987196) Data Point: (88.586679, 0.29667682) Data Point: (162.37767, 0.20150036) Data Point: (297.63514, 0.085811521) Data Point: (545.55948, 0.049379583) Data Point: (1,000, 0.039446735)
Estimation Properties Vol. WC Estimation Method: Grain Size Function
file:///C:/Users/k3engmwv/Documents/LOWP/FY17-18%20PIR%20Work/SEEP%20and... 11/14/2018

Steady-State Seepage (EOC) Page 11 of 23
Saturated Water Content: 0.3 ft³/ft³ Sample Material: Clay Liquid Limit: 0 % Diameter at 10% passing: 0.07000000000000001 Diameter at 60% passing: 0.2 Maximum: 1,000 Minimum: 0.01 Num. Points: 20
Matl. 2 Surficial Overburden Layer Model: Vol WC Data Point Function Function: Vol. Water Content vs. Pore‐Water Pressure
Mv: 2.5e‐006 /psf Saturated Water Content: 0.30132774 ft³/ft³ Residual Water Content: 0.030132774 ft³/ft³ Curve Fit to Data: 100 % Segment Curvature: 40 %
Porosity: 0.30132774 Data Points: Matric Suction (psf), Vol. Water Content (ft³/ft³)
Data Point: (0.01, 0.30110223) Data Point: (0.018329807, 0.30110223) Data Point: (0.033598183, 0.30110223) Data Point: (0.061584821, 0.30110223) Data Point: (0.11288379, 0.30110223) Data Point: (0.20691381, 0.30110223) Data Point: (0.37926902, 0.30110223) Data Point: (0.6951928, 0.30110223) Data Point: (1.274275, 0.30110223) Data Point: (2.3357215, 0.30110223) Data Point: (4.2813324, 0.30110223) Data Point: (7.8475997, 0.30110223) Data Point: (14.384499, 0.30110223) Data Point: (26.366509, 0.30110223) Data Point: (48.329302, 0.30110223) Data Point: (88.586679, 0.29938489) Data Point: (162.37767, 0.21986255) Data Point: (297.63514, 0.094851578) Data Point: (545.55948, 0.051777012) Data Point: (1,000, 0.040605935)
Estimation Properties Vol. WC Estimation Method: Grain Size Function Saturated Water Content: 0.3 ft³/ft³ Sample Material: Clay Liquid Limit: 0 % Diameter at 10% passing: 0.07000000000000001 Diameter at 60% passing: 0.18 Maximum: 1,000 Minimum: 0.01 Num. Points: 20
file:///C:/Users/k3engmwv/Documents/LOWP/FY17-18%20PIR%20Work/SEEP%20and... 11/14/2018
Steady-State Seepage (EOC) Page 12 of 23
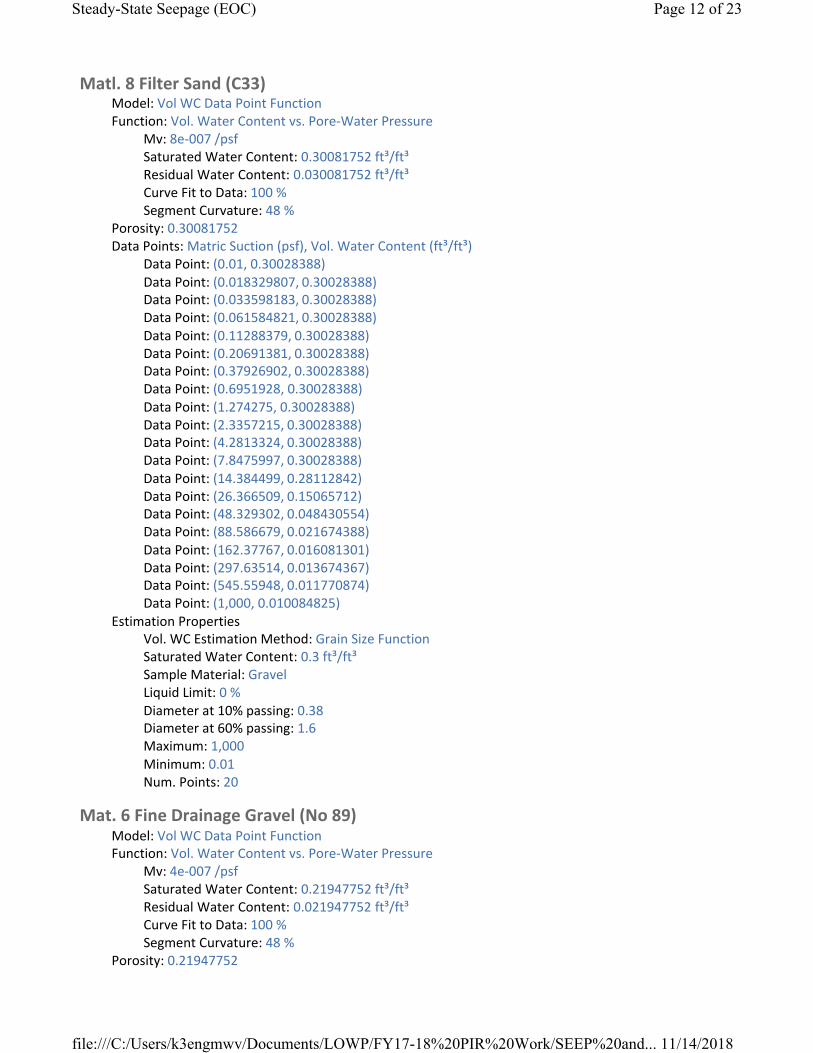
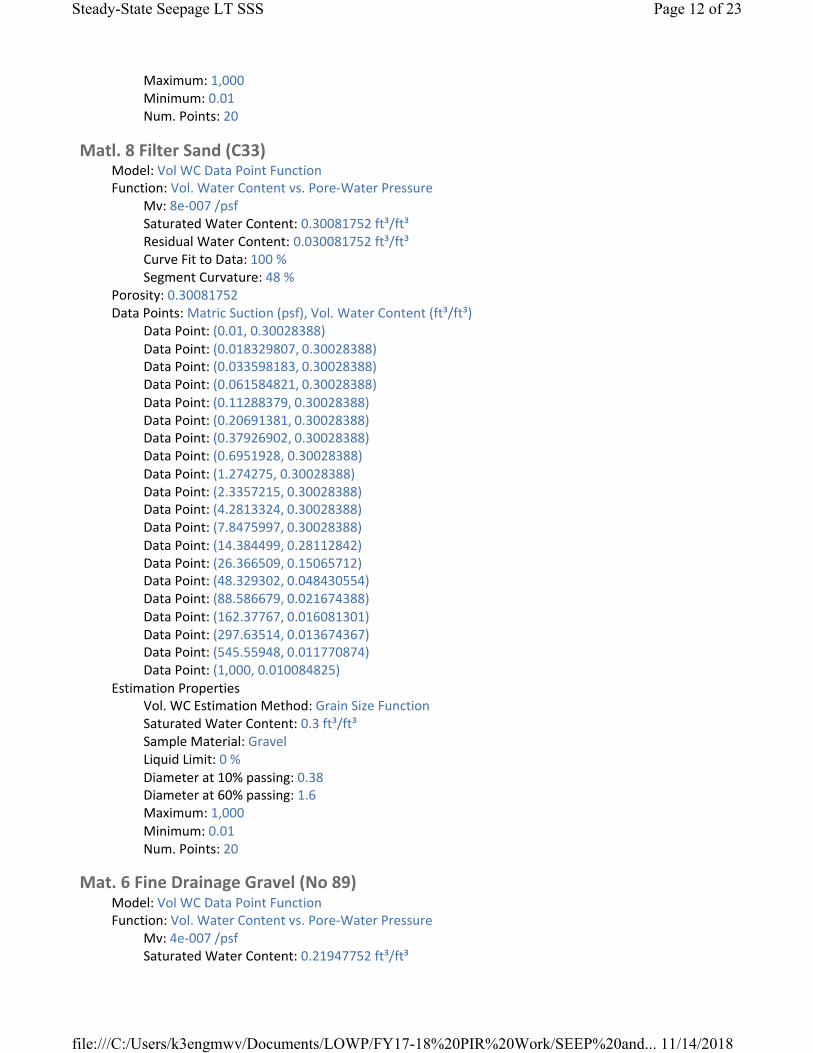
Matl. 8 Filter Sand (C33) Model: Vol WC Data Point Function Function: Vol. Water Content vs. Pore‐Water Pressure
Mv: 8e‐007 /psf Saturated Water Content: 0.30081752 ft³/ft³ Residual Water Content: 0.030081752 ft³/ft³ Curve Fit to Data: 100 % Segment Curvature: 48 %
Porosity: 0.30081752 Data Points: Matric Suction (psf), Vol. Water Content (ft³/ft³)
Data Point: (0.01, 0.30028388) Data Point: (0.018329807, 0.30028388) Data Point: (0.033598183, 0.30028388) Data Point: (0.061584821, 0.30028388) Data Point: (0.11288379, 0.30028388) Data Point: (0.20691381, 0.30028388) Data Point: (0.37926902, 0.30028388) Data Point: (0.6951928, 0.30028388) Data Point: (1.274275, 0.30028388) Data Point: (2.3357215, 0.30028388) Data Point: (4.2813324, 0.30028388) Data Point: (7.8475997, 0.30028388) Data Point: (14.384499, 0.28112842) Data Point: (26.366509, 0.15065712) Data Point: (48.329302, 0.048430554) Data Point: (88.586679, 0.021674388) Data Point: (162.37767, 0.016081301) Data Point: (297.63514, 0.013674367) Data Point: (545.55948, 0.011770874) Data Point: (1,000, 0.010084825)
Estimation Properties Vol. WC Estimation Method: Grain Size Function Saturated Water Content: 0.3 ft³/ft³ Sample Material: Gravel Liquid Limit: 0 % Diameter at 10% passing: 0.38 Diameter at 60% passing: 1.6 Maximum: 1,000 Minimum: 0.01 Num. Points: 20
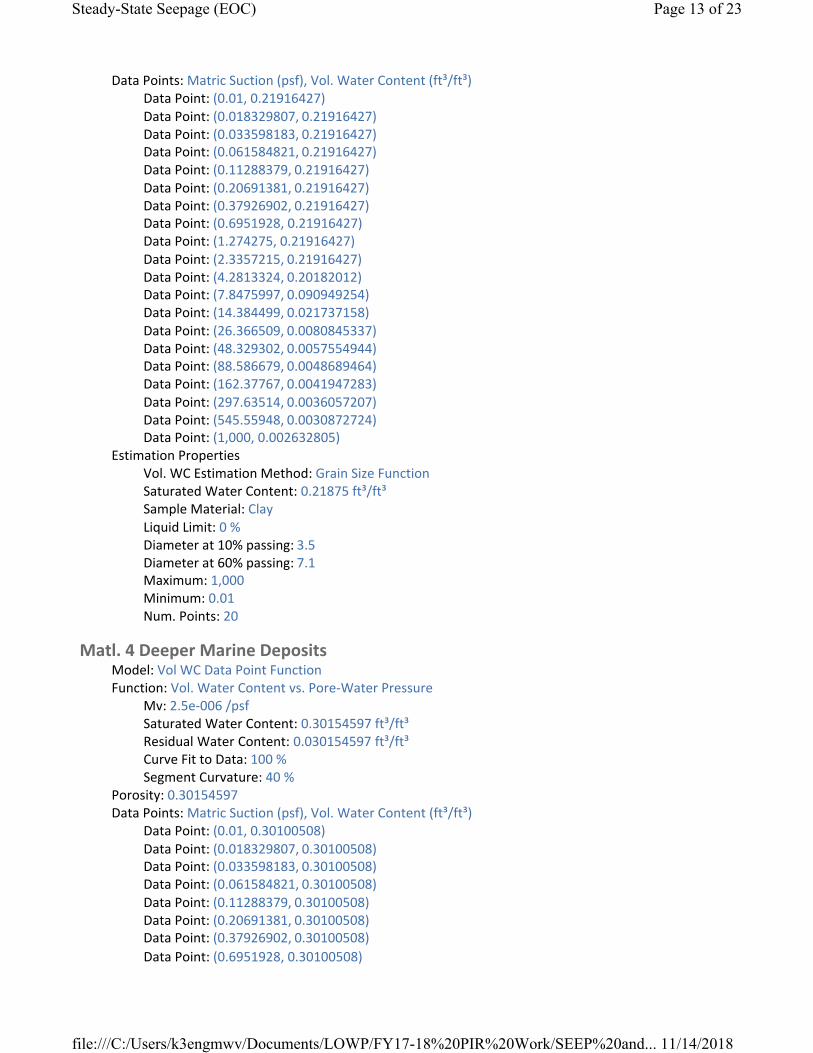
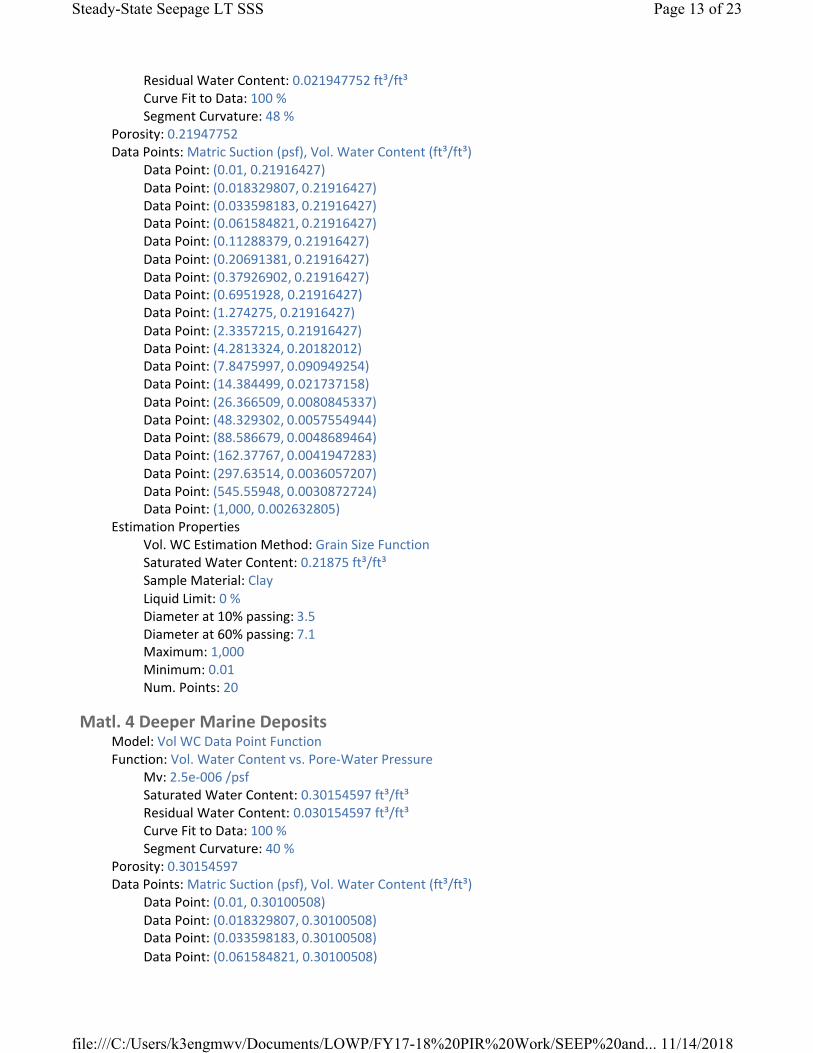
Mat. 6 Fine Drainage Gravel (No 89) Model: Vol WC Data Point Function Function: Vol. Water Content vs. Pore‐Water Pressure
Mv: 4e‐007 /psf Saturated Water Content: 0.21947752 ft³/ft³ Residual Water Content: 0.021947752 ft³/ft³ Curve Fit to Data: 100 % Segment Curvature: 48 %
Porosity: 0.21947752
file:///C:/Users/k3engmwv/Documents/LOWP/FY17-18%20PIR%20Work/SEEP%20and... 11/14/2018
Steady-State Seepage (EOC) Page 13 of 23
Data Points: Matric Suction (psf), Vol. Water Content (ft³/ft³) Data Point: (0.01, 0.21916427) Data Point: (0.018329807, 0.21916427) Data Point: (0.033598183, 0.21916427) Data Point: (0.061584821, 0.21916427) Data Point: (0.11288379, 0.21916427) Data Point: (0.20691381, 0.21916427) Data Point: (0.37926902, 0.21916427) Data Point: (0.6951928, 0.21916427) Data Point: (1.274275, 0.21916427) Data Point: (2.3357215, 0.21916427) Data Point: (4.2813324, 0.20182012) Data Point: (7.8475997, 0.090949254) Data Point: (14.384499, 0.021737158) Data Point: (26.366509, 0.0080845337) Data Point: (48.329302, 0.0057554944) Data Point: (88.586679, 0.0048689464) Data Point: (162.37767, 0.0041947283) Data Point: (297.63514, 0.0036057207) Data Point: (545.55948, 0.0030872724) Data Point: (1,000, 0.002632805)
Estimation Properties Vol. WC Estimation Method: Grain Size Function Saturated Water Content: 0.21875 ft³/ft³ Sample Material: Clay Liquid Limit: 0 % Diameter at 10% passing: 3.5 Diameter at 60% passing: 7.1 Maximum: 1,000 Minimum: 0.01 Num. Points: 20
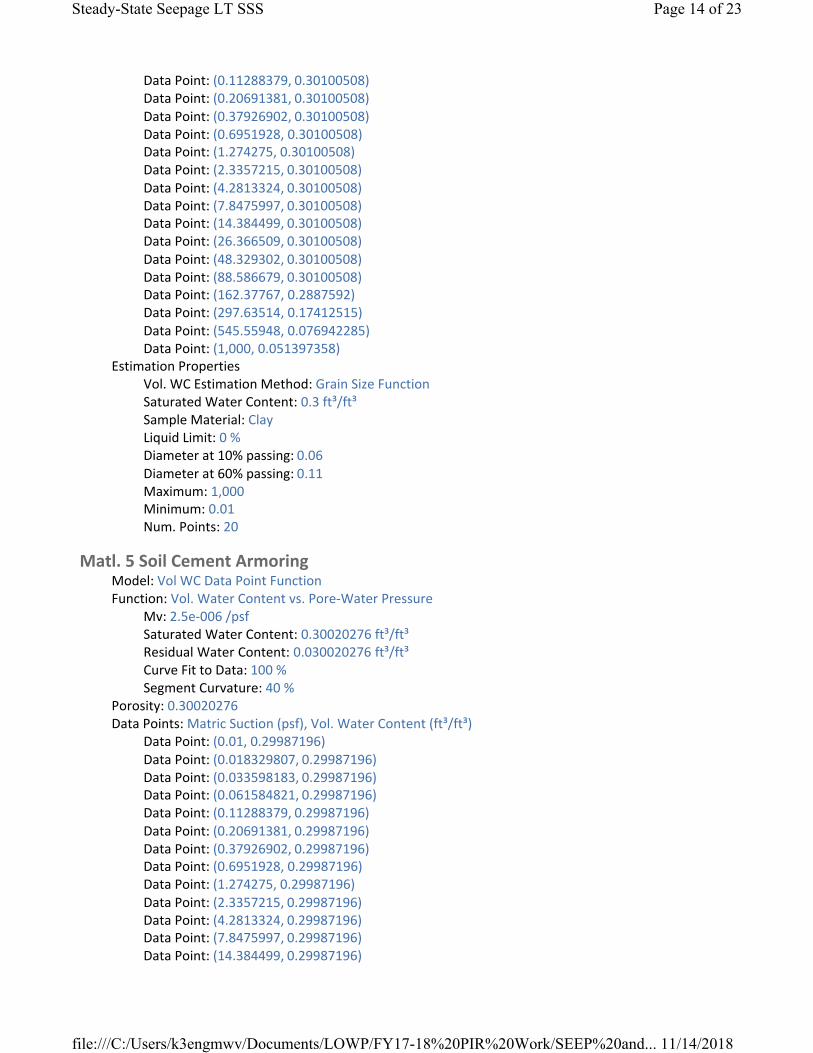
Matl. 4 Deeper Marine Deposits Model: Vol WC Data Point Function Function: Vol. Water Content vs. Pore‐Water Pressure
Mv: 2.5e‐006 /psf Saturated Water Content: 0.30154597 ft³/ft³ Residual Water Content: 0.030154597 ft³/ft³ Curve Fit to Data: 100 % Segment Curvature: 40 %
Porosity: 0.30154597 Data Points: Matric Suction (psf), Vol. Water Content (ft³/ft³)
Data Point: (0.01, 0.30100508) Data Point: (0.018329807, 0.30100508) Data Point: (0.033598183, 0.30100508) Data Point: (0.061584821, 0.30100508) Data Point: (0.11288379, 0.30100508) Data Point: (0.20691381, 0.30100508) Data Point: (0.37926902, 0.30100508) Data Point: (0.6951928, 0.30100508)
file:///C:/Users/k3engmwv/Documents/LOWP/FY17-18%20PIR%20Work/SEEP%20and... 11/14/2018

Steady-State Seepage (EOC) Page 14 of 23
Data Point: (1.274275, 0.30100508) Data Point: (2.3357215, 0.30100508) Data Point: (4.2813324, 0.30100508) Data Point: (7.8475997, 0.30100508) Data Point: (14.384499, 0.30100508) Data Point: (26.366509, 0.30100508) Data Point: (48.329302, 0.30100508) Data Point: (88.586679, 0.30100508) Data Point: (162.37767, 0.2887592) Data Point: (297.63514, 0.17412515) Data Point: (545.55948, 0.076942285) Data Point: (1,000, 0.051397358)
Estimation Properties Vol. WC Estimation Method: Grain Size Function Saturated Water Content: 0.3 ft³/ft³ Sample Material: Clay Liquid Limit: 0 % Diameter at 10% passing: 0.06 Diameter at 60% passing: 0.11 Maximum: 1,000 Minimum: 0.01 Num. Points: 20
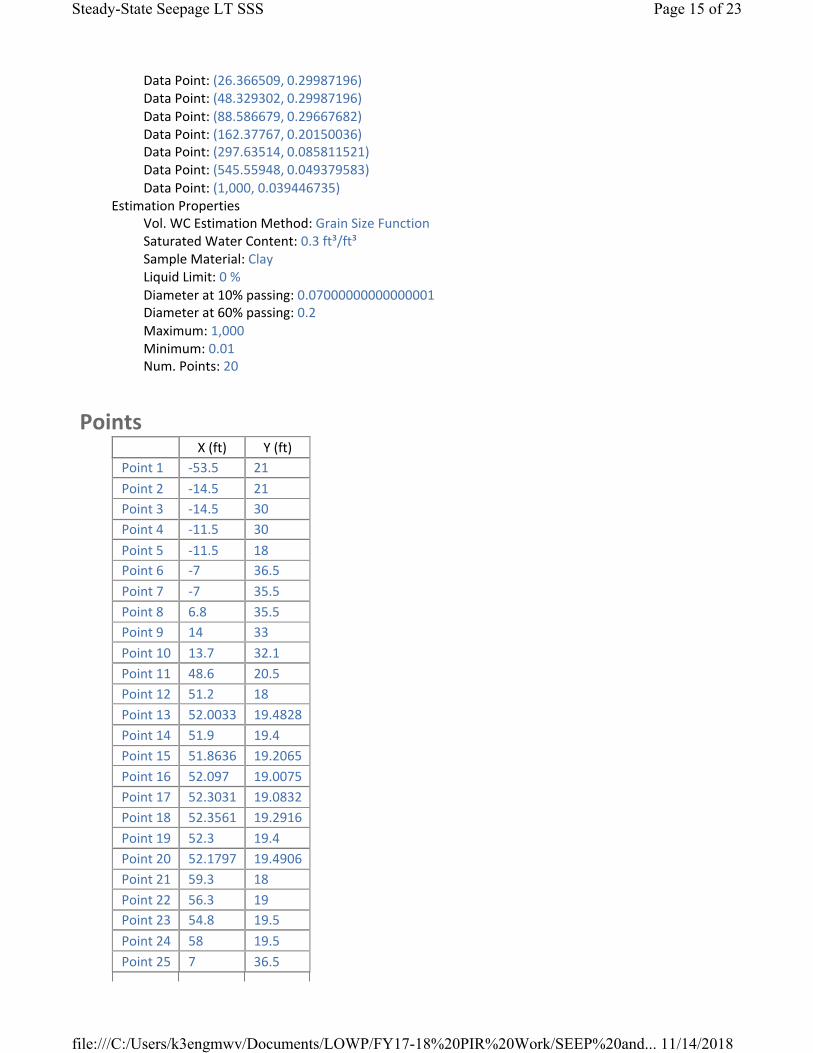
Matl. 5 Soil Cement Armoring Model: Vol WC Data Point Function Function: Vol. Water Content vs. Pore‐Water Pressure
Mv: 2.5e‐006 /psf Saturated Water Content: 0.30020276 ft³/ft³ Residual Water Content: 0.030020276 ft³/ft³ Curve Fit to Data: 100 % Segment Curvature: 40 %
Porosity: 0.30020276 Data Points: Matric Suction (psf), Vol. Water Content (ft³/ft³)
Data Point: (0.01, 0.29987196) Data Point: (0.018329807, 0.29987196) Data Point: (0.033598183, 0.29987196) Data Point: (0.061584821, 0.29987196) Data Point: (0.11288379, 0.29987196) Data Point: (0.20691381, 0.29987196) Data Point: (0.37926902, 0.29987196) Data Point: (0.6951928, 0.29987196) Data Point: (1.274275, 0.29987196) Data Point: (2.3357215, 0.29987196) Data Point: (4.2813324, 0.29987196) Data Point: (7.8475997, 0.29987196) Data Point: (14.384499, 0.29987196) Data Point: (26.366509, 0.29987196) Data Point: (48.329302, 0.29987196) Data Point: (88.586679, 0.29667682) Data Point: (162.37767, 0.20150036)
file:///C:/Users/k3engmwv/Documents/LOWP/FY17-18%20PIR%20Work/SEEP%20and... 11/14/2018
Steady-State Seepage (EOC) Page 15 of 23
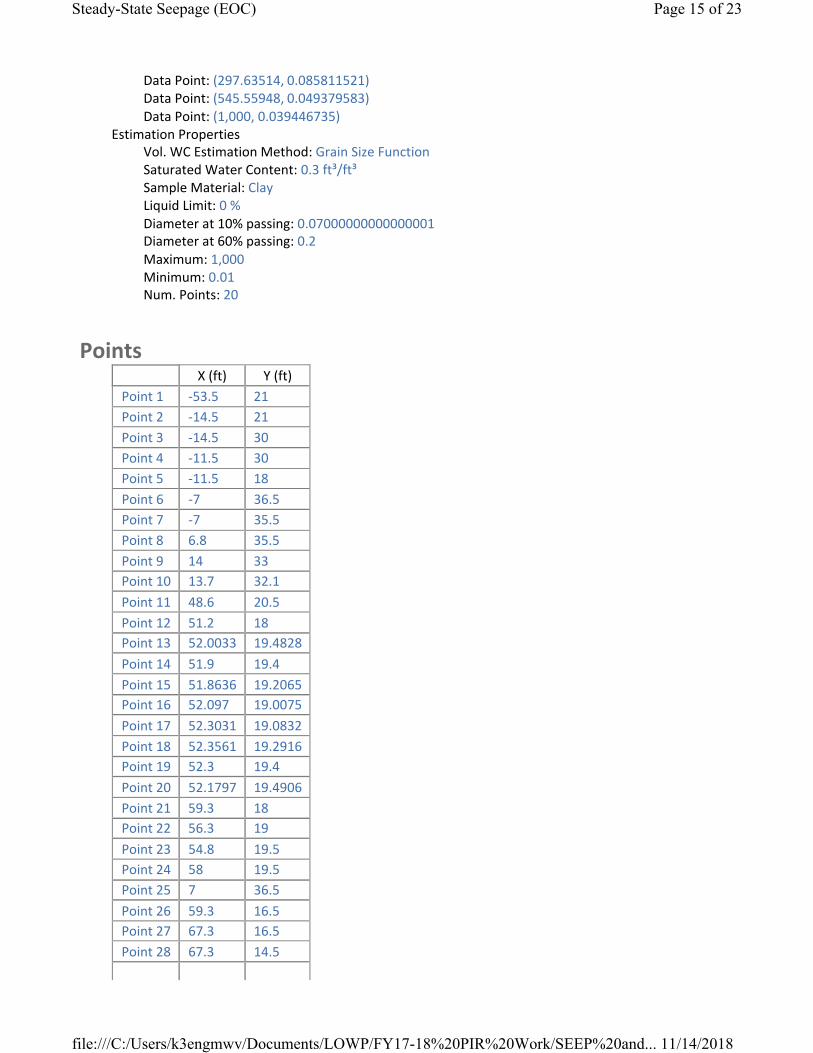
Data Point: (297.63514, 0.085811521) Data Point: (545.55948, 0.049379583) Data Point: (1,000, 0.039446735)
Estimation Properties Vol. WC Estimation Method: Grain Size Function Saturated Water Content: 0.3 ft³/ft³ Sample Material: Clay Liquid Limit: 0 % Diameter at 10% passing: 0.07000000000000001 Diameter at 60% passing: 0.2 Maximum: 1,000 Minimum: 0.01 Num. Points: 20
Points
file:///C:/Users/k3engmwv/Documents/LOWP/FY17-18%20PIR%20Work/SEEP%20and... 11/14/2018
X (ft) Y (ft)
Point 1 ‐53.5 21
Point 2 ‐14.5 21
Point 3 ‐14.5 30
Point 4 ‐11.5 30
Point 5 ‐11.5 18
Point 6 ‐7 36.5
Point 7 ‐7 35.5
Point 8 6.8 35.5
Point 9 14 33 Point 10 13.7 32.1
Point 11 48.6 20.5
Point 12 51.2 18 Point 13 52.0033 19.4828
Point 14 51.9 19.4
Point 15 51.8636 19.2065 Point 16 52.097 19.0075
Point 17 52.3031 19.0832
Point 18 52.3561 19.2916 Point 19 52.3 19.4
Point 20 52.1797 19.4906
Point 21 59.3 18 Point 22 56.3 19
Point 23 54.8 19.5 Point 24 58 19.5
Point 25 7 36.5
Point 26 59.3 16.5 Point 27 67.3 16.5
Point 28 67.3 14.5

29
30
31
32
33
34
35
36
37
38
39
40
41
42
43
44
45
46
47
48
49
50
51
52
Steady-State Seepage (EOC) Page 16 of 23
file:///C:/Users/k3engmwv/Documents/LOWP/FY17-18%20PIR%20Work/SEEP%20and... 11/14/2018
Point 69.3 14.5
Point 69.3 16.5
Point 69.3 18
Point 62.5 18
Point 59.5 19
Point ‐90 18
Point ‐90 16.5
Point 100 18
Point 100 16.5
Point 100 ‐11.4
Point ‐90 ‐11.4
Point 100 ‐111.5
Point ‐90 ‐111.5
Point ‐139 18
Point ‐127 22
Point ‐113 22
Point ‐101 18
Point ‐180 18
Point ‐180 16.5
Point ‐180 ‐11.5
Point ‐180 ‐111.5
Point 1,100 18
Point 1,100 16.5
Point 1,100 ‐11.5
53
54
55
56
57
58
59
60
61
62
63
64
65
66
67
68
69
70
71
72
73
74
75
76
Steady-State Seepage (EOC) Page 17 of 23
file:///C:/Users/k3engmwv/Documents/LOWP/FY17-18%20PIR%20Work/SEEP%20and... 11/14/2018
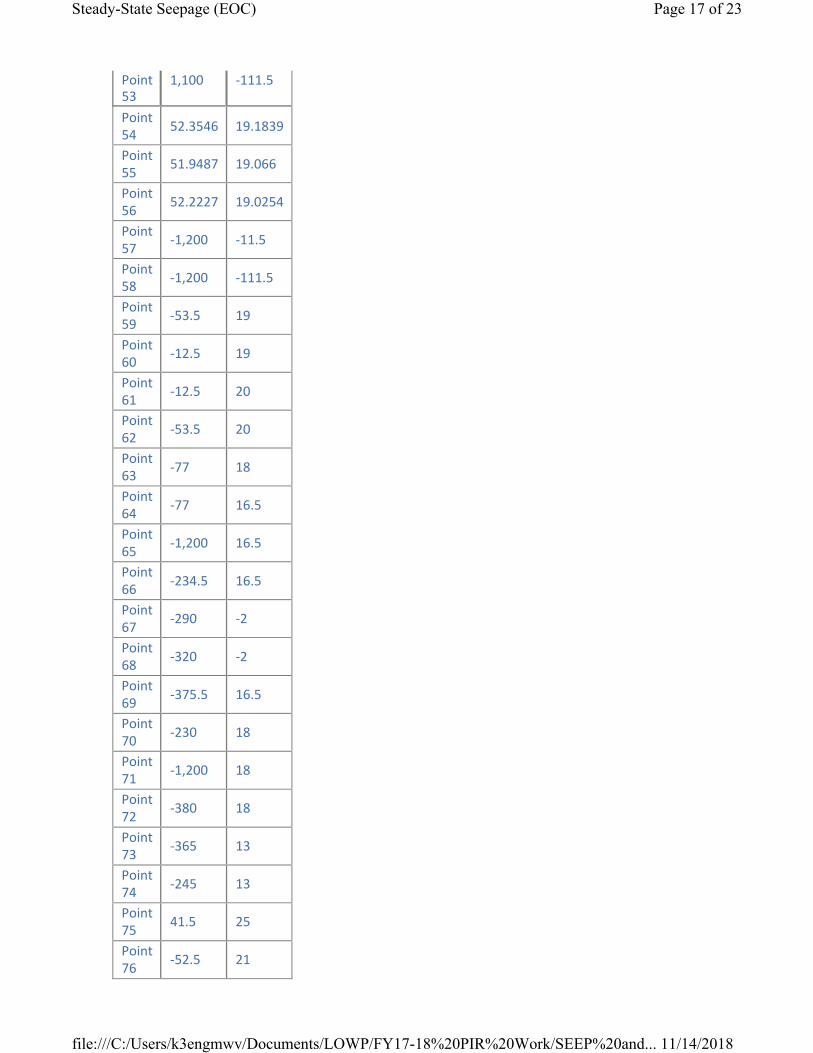
Point 1,100 ‐111.5
Point 52.3546 19.1839
Point 51.9487 19.066
Point 52.2227 19.0254
Point ‐1,200 ‐11.5
Point ‐1,200 ‐111.5
Point ‐53.5 19
Point ‐12.5 19
Point ‐12.5 20
Point ‐53.5 20
Point ‐77 18
Point ‐77 16.5
Point ‐1,200 16.5
Point ‐234.5 16.5
Point ‐290 ‐2
Point ‐320 ‐2
Point ‐375.5 16.5
Point ‐230 18
Point ‐1,200 18
Point ‐380 18
Point ‐365 13
Point ‐245 13
Point 41.5 25
Point ‐52.5 21
Steady-State Seepage (EOC) Page 18 of 23
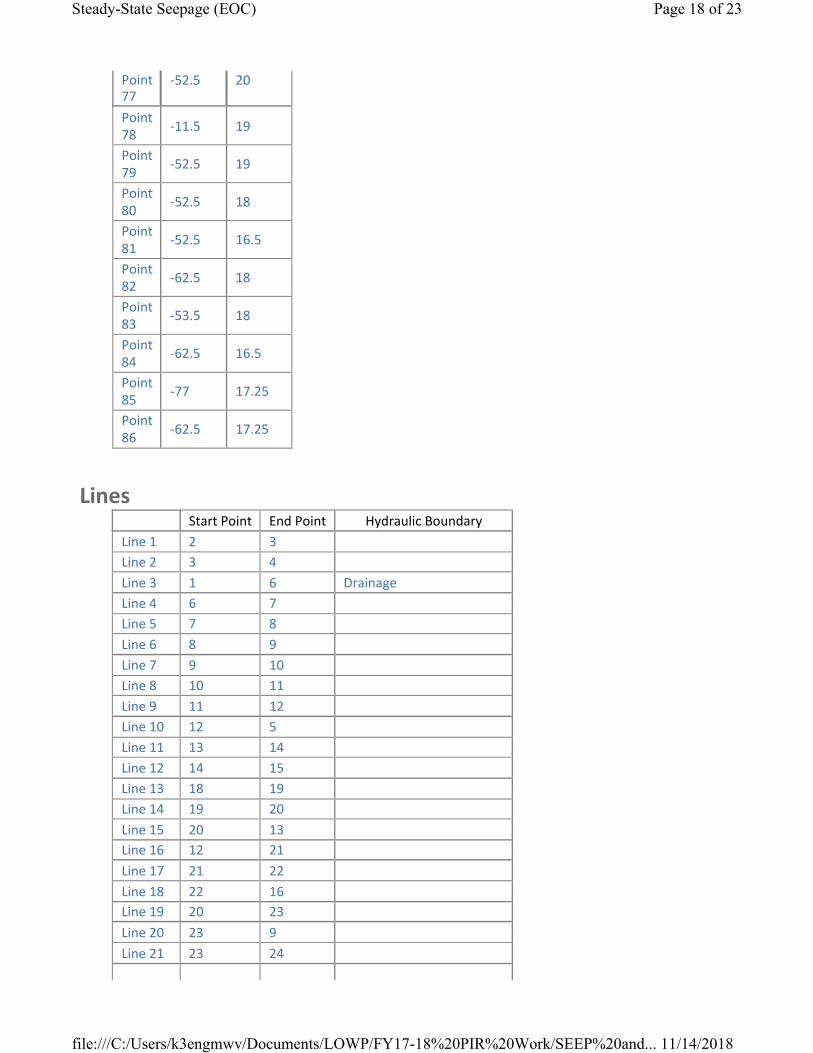
Point 77
‐52.5 20
Point 78
‐11.5 19
Point 79
‐52.5 19
Point 80
‐52.5 18
Point 81
‐52.5 16.5
Point 82
‐62.5 18
Point 83
‐53.5 18
Point 84
‐62.5 16.5
Point 85
‐77 17.25
Point 86
‐62.5 17.25
Lines
file:///C:/Users/k3engmwv/Documents/LOWP/FY17-18%20PIR%20Work/SEEP%20and... 11/14/2018
Start Point End Point Hydraulic Boundary
Line 1 2 3
Line 2 3 4
Line 3 1 6 Drainage
Line 4 6 7
Line 5 7 8
Line 6 8 9
Line 7 9 10
Line 8 10 11
Line 9 11 12
Line 10 12 5
Line 11 13 14
Line 12 14 15
Line 13 18 19
Line 14 19 20
Line 15 20 13 Line 16 12 21
Line 17 21 22
Line 18 22 16 Line 19 20 23
Line 20 23 9
Line 21 23 24
22
23
24
25
26
27
28
29
30
31
32
33
34
35
36
37
38
39
40
41
42
43
44
45
46
47
48
49
50
51
52
53
54
55
56
57
58
59
60
61
62
Steady-State Seepage (EOC) Page 19 of 23
file:///C:/Users/k3engmwv/Documents/LOWP/FY17-18%20PIR%20Work/SEEP%20and... 11/14/2018
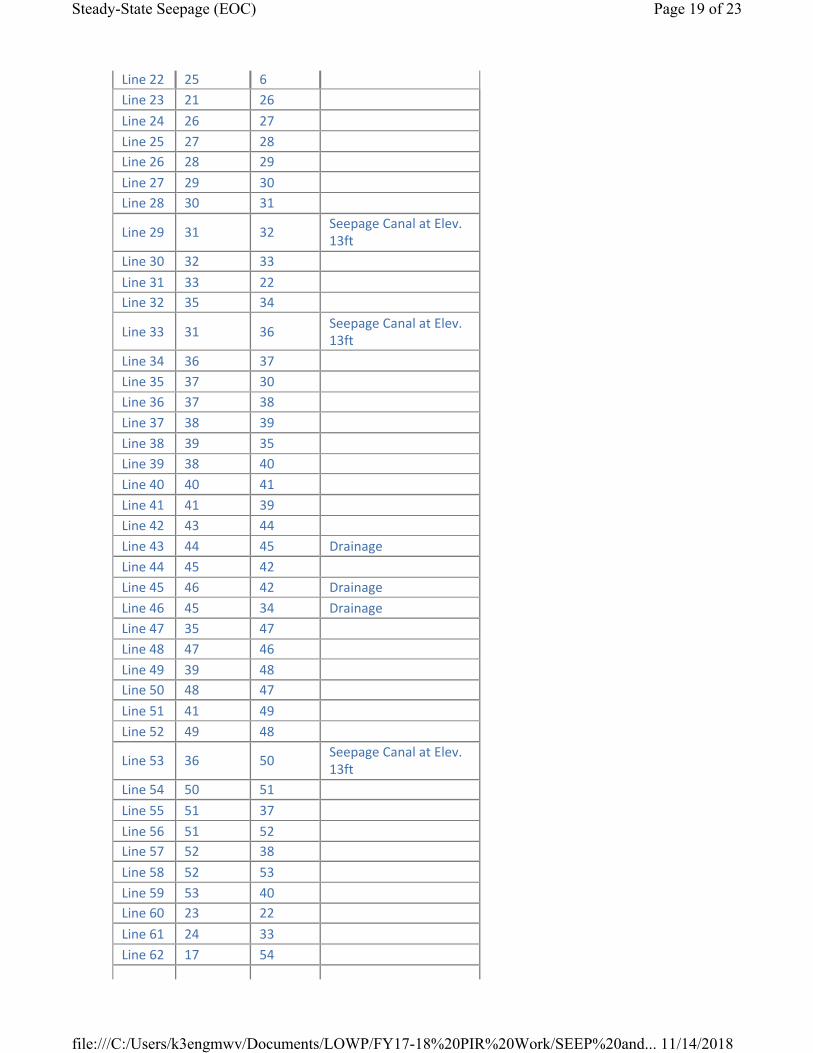
Line 25 6
Line 21 26
Line 26 27
Line 27 28 Line 28 29
Line 29 30 Line 30 31
Line 31 32 Seepage Canal at Elev. 13ft
Line 32 33
Line 33 22 Line 35 34
Line 31 36 Seepage Canal at Elev. 13ft
Line 36 37
Line 37 30
Line 37 38
Line 38 39
Line 39 35
Line 38 40
Line 40 41
Line 41 39
Line 43 44
Line 44 45 Drainage
Line 45 42
Line 46 42 Drainage
Line 45 34 Drainage
Line 35 47
Line 47 46
Line 39 48 Line 48 47
Line 41 49
Line 49 48
Line 36 50 Seepage Canal at Elev. 13ft
Line 50 51
Line 51 37
Line 51 52 Line 52 38
Line 52 53
Line 53 40 Line 23 22
Line 24 33
Line 17 54

63
64
65
66
67
68
69
70
71
72
73
74
75
76
77
78
79
80
81
82
83
84
85
86
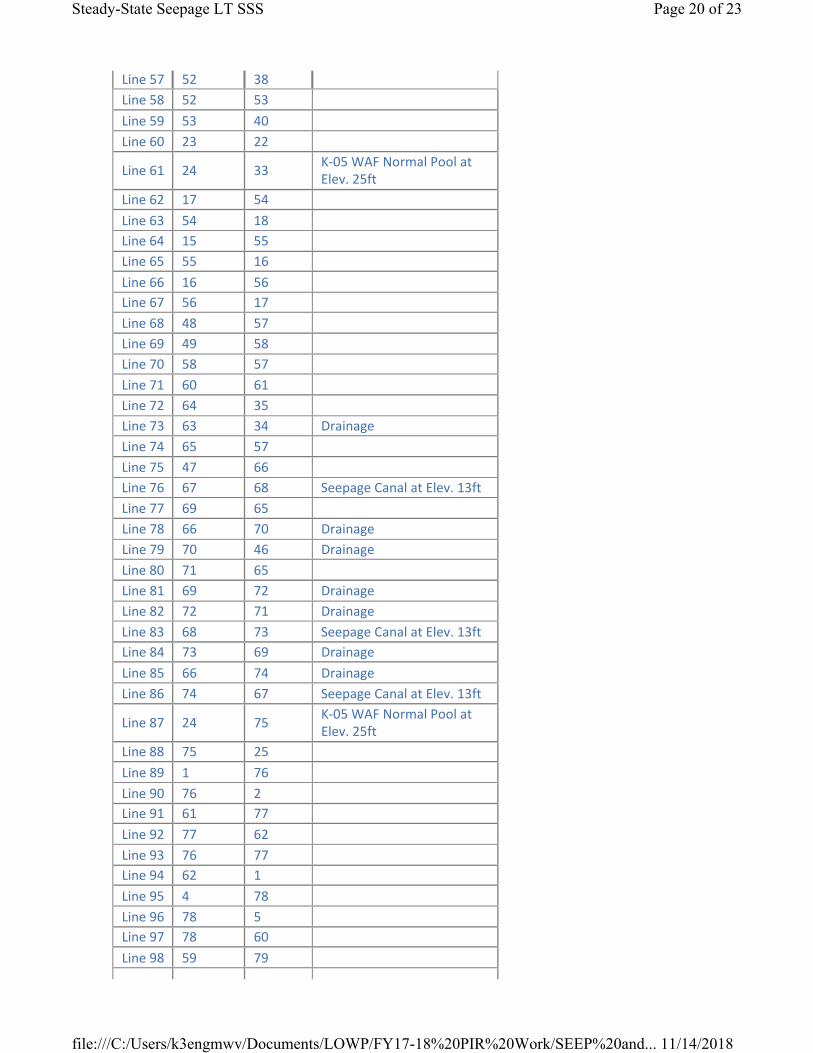
Steady-State Seepage (EOC) Page 20 of 23
file:///C:/Users/k3engmwv/Documents/LOWP/FY17-18%20PIR%20Work/SEEP%20and... 11/14/2018
Line 54 18
Line 15 55
Line 55 16
Line 16 56
Line 56 17
Line 48 57
Line 49 58
Line 58 57
Line 60 61
Line 64 35
Line 63 34 Drainage
Line 65 57
Line 47 66
Line 67 68
Seepage Canal at Elev. 13ft
Line 69 65
Line 66 70 Drainage
Line 70 46 Drainage
Line 71 65
Line 69 72 Drainage
Line 72 71 Drainage
Line 68 73
Seepage Canal at Elev. 13ft
Line 73 69 Drainage
Line 66 74 Drainage
Line 74 67
Seepage Canal at Elev. 13ft
87
88
89
90
91
92
93
94
95
96
97
98
99
100
101
102
103
104
105
106
107
108
109
110
Steady-State Seepage (EOC) Page 21 of 23
file:///C:/Users/k3engmwv/Documents/LOWP/FY17-18%20PIR%20Work/SEEP%20and... 11/14/2018
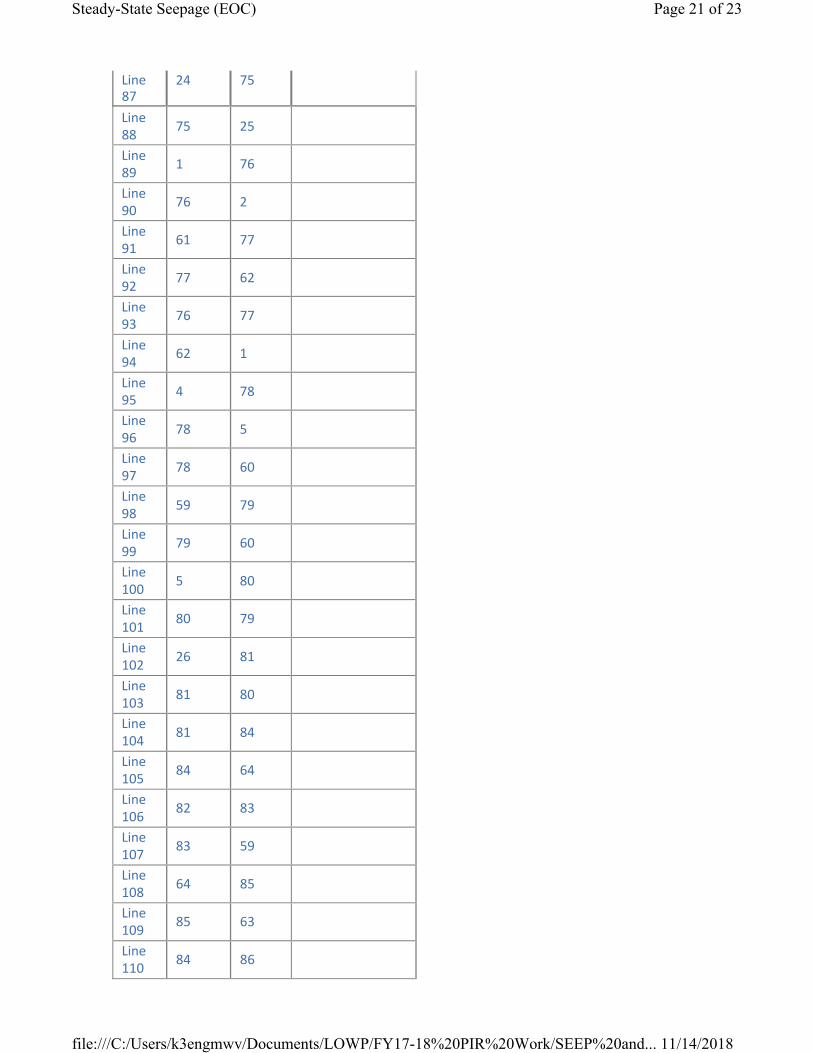
Line 24 75
Line 75 25
Line 1 76
Line 76 2
Line 61 77
Line 77 62
Line 76 77
Line 62 1
Line 4 78
Line 78 5
Line 78 60
Line 59 79
Line 79 60
Line 5 80
Line 80 79
Line 26 81
Line 81 80
Line 81 84
Line 84 64
Line 82 83
Line 83 59
Line 64 85
Line 85 63
Line 84 86
Steady-State Seepage (EOC) Page 22 of 23
Line 111
86 82
Line 112
86 85
Line 113
82 63 Drainage
Line 114
79 77
Line 115
59 62 Drainage
Line 116
42 43
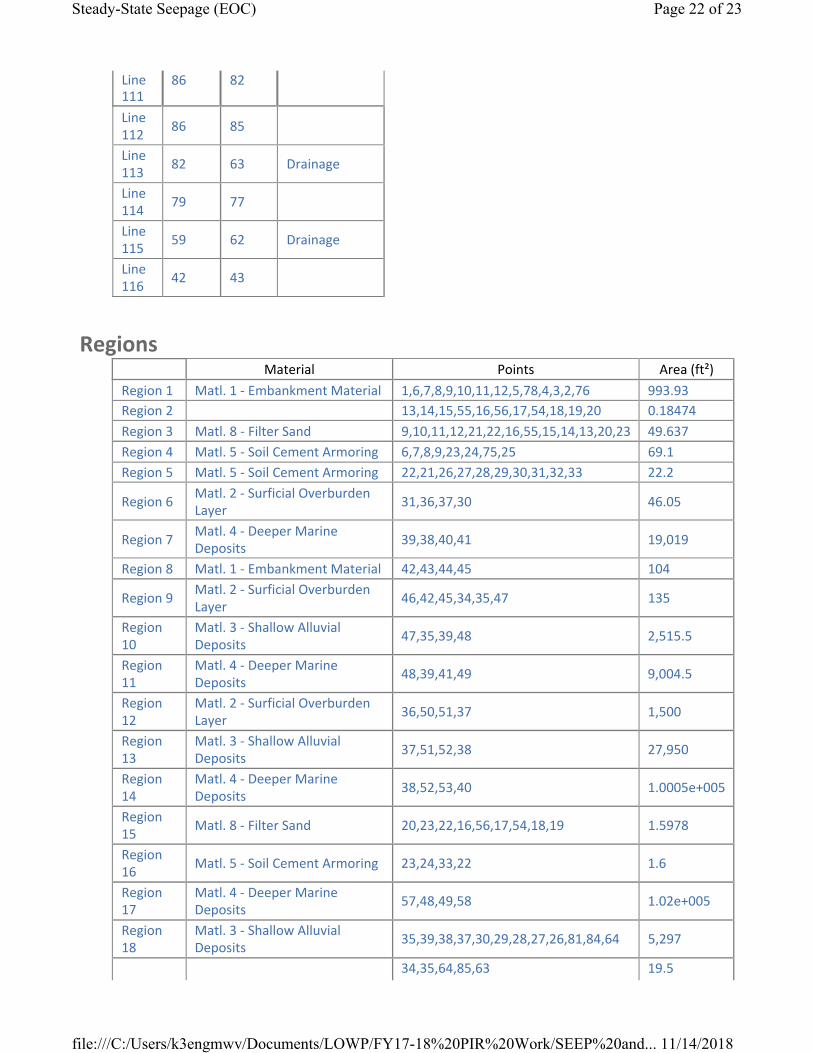
Regions
file:///C:/Users/k3engmwv/Documents/LOWP/FY17-18%20PIR%20Work/SEEP%20and... 11/14/2018
Material Points Area (ft²)
Region 1 Matl. 1 ‐ Embankment Material 1,6,7,8,9,10,11,12,5,78,4,3,2,76 993.93 Region 2 13,14,15,55,16,56,17,54,18,19,20 0.18474
Region 3 Matl. 8 ‐ Filter Sand 9,10,11,12,21,22,16,55,15,14,13,20,23 49.637
Region 4 Matl. 5 ‐ Soil Cement Armoring 6,7,8,9,23,24,75,25 69.1
Region 5 Matl. 5 ‐ Soil Cement Armoring 22,21,26,27,28,29,30,31,32,33 22.2
Region 6 Matl. 2 ‐ Surficial Overburden Layer
31,36,37,30 46.05
Region 7 Matl. 4 ‐ Deeper Marine Deposits
39,38,40,41 19,019
Region 8 Matl. 1 ‐ Embankment Material 42,43,44,45 104
Region 9 Matl. 2 ‐ Surficial Overburden Layer
46,42,45,34,35,47 135
Region 10
Matl. 3 ‐ Shallow Alluvial Deposits
47,35,39,48 2,515.5
Region 11
Matl. 4 ‐ Deeper Marine Deposits
48,39,41,49 9,004.5
Region 12
Matl. 2 ‐ Surficial Overburden Layer
36,50,51,37 1,500
Region 13
Matl. 3 ‐ Shallow Alluvial Deposits
37,51,52,38 27,950
Region 14
Matl. 4 ‐ Deeper Marine Deposits
38,52,53,40 1.0005e+005
Region 15
Matl. 8 ‐ Filter Sand 20,23,22,16,56,17,54,18,19 1.5978
Region 16
Matl. 5 ‐ Soil Cement Armoring 23,24,33,22 1.6
Region 17
Matl. 4 ‐ Deeper Marine Deposits
57,48,49,58 1.02e+005
Region 18
Matl. 3 ‐ Shallow Alluvial Deposits
35,39,38,37,30,29,28,27,26,81,84,64 5,297
34,35,64,85,63 19.5
19
20
21
22
23
24
25
26
27
28
29
30
31
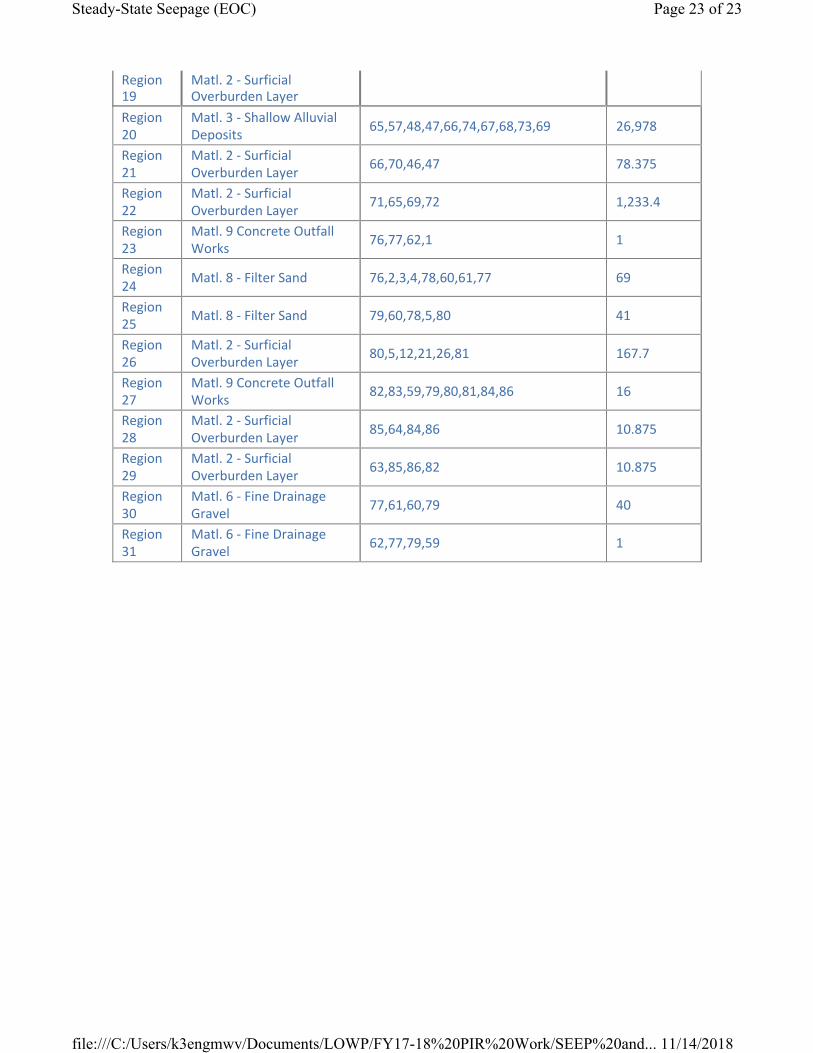
Steady-State Seepage (EOC) Page 23 of 23
file:///C:/Users/k3engmwv/Documents/LOWP/FY17-18%20PIR%20Work/SEEP%20and... 11/14/2018
Region Matl. 2 ‐ Surficial Overburden Layer
Region Matl. 3 ‐ Shallow Alluvial Deposits
65,57,48,47,66,74,67,68,73,69 26,978
Region Matl. 2 ‐ Surficial Overburden Layer
66,70,46,47 78.375
Region Matl. 2 ‐ Surficial Overburden Layer
71,65,69,72 1,233.4
Region Matl. 9 Concrete Outfall Works
76,77,62,1 1
Region Matl. 8 ‐ Filter Sand 76,2,3,4,78,60,61,77 69
Region Matl. 8 ‐ Filter Sand 79,60,78,5,80 41
Region Matl. 2 ‐ Surficial Overburden Layer
80,5,12,21,26,81 167.7
Region Matl. 9 Concrete Outfall Works
82,83,59,79,80,81,84,86 16
Region Matl. 2 ‐ Surficial Overburden Layer
85,64,84,86 10.875
Region Matl. 2 ‐ Surficial Overburden Layer
63,85,86,82 10.875
Region Matl. 6 ‐ Fine Drainage Gravel
77,61,60,79 40
Region Matl. 6 ‐ Fine Drainage Gravel
62,77,79,59 1
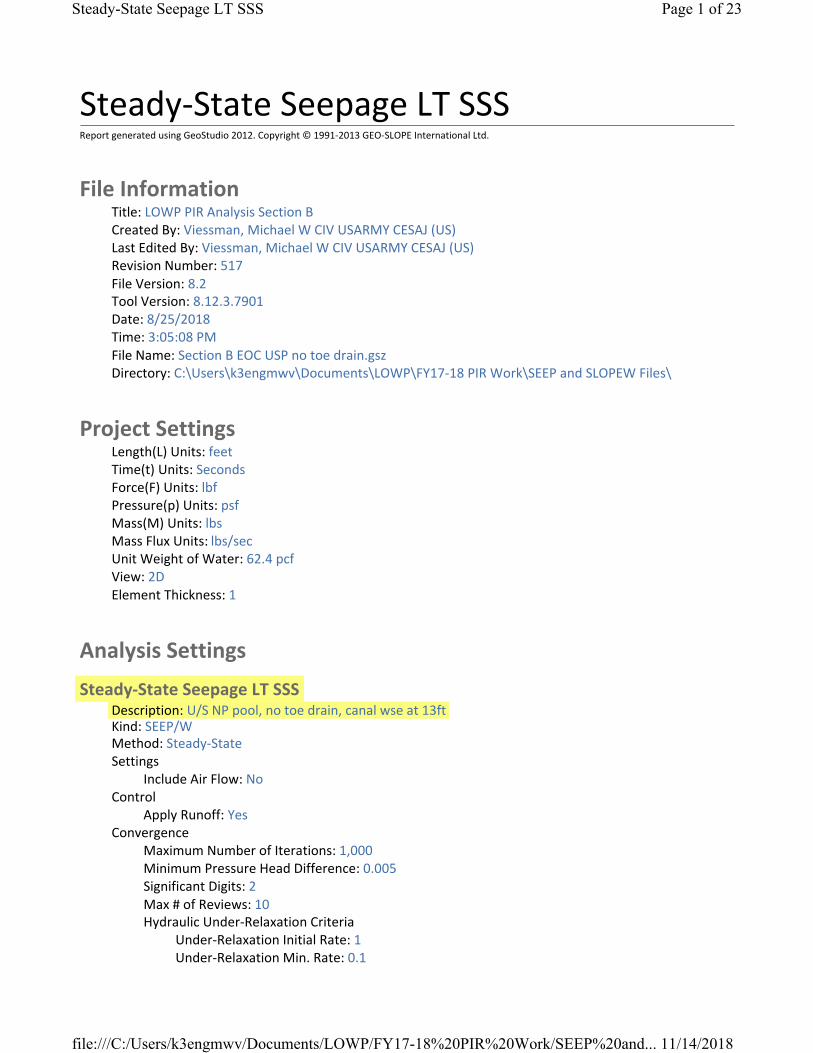
Steady-State Seepage LT SSS Page 1 of 23
Steady‐State Seepage LT SSS Report generated using GeoStudio 2012. Copyright © 1991‐2013 GEO‐SLOPE International Ltd.
File Information Title: LOWP PIR Analysis Section B Created By: Viessman, Michael W CIV USARMY CESAJ (US) Last Edited By: Viessman, Michael W CIV USARMY CESAJ (US) Revision Number: 517 File Version: 8.2 Tool Version: 8.12.3.7901 Date: 8/25/2018 Time: 3:05:08 PM File Name: Section B EOC USP no toe drain.gsz Directory: C:\Users\k3engmwv\Documents\LOWP\FY17‐18 PIR Work\SEEP and SLOPEW Files\
Project Settings Length(L) Units: feet Time(t) Units: Seconds Force(F) Units: lbf Pressure(p) Units: psf Mass(M) Units: lbs Mass Flux Units: lbs/sec Unit Weight of Water: 62.4 pcf View: 2D Element Thickness: 1
Analysis Settings
Steady‐State Seepage LT SSS Description: U/S NP pool, no toe drain, canal wse at 13ft Kind: SEEP/W Method: Steady‐State Settings
Include Air Flow: No Control
Apply Runoff: Yes Convergence
Maximum Number of Iterations: 1,000 Minimum Pressure Head Difference: 0.005 Significant Digits: 2 Max # of Reviews: 10 Hydraulic Under‐Relaxation Criteria
Under‐Relaxation Initial Rate: 1 Under‐Relaxation Min. Rate: 0.1
file:///C:/Users/k3engmwv/Documents/LOWP/FY17-18%20PIR%20Work/SEEP%20and... 11/14/2018

Steady-State Seepage LT SSS Page 2 of 23
Under‐Relaxation Reduction Rate: 0.65 Under‐Relaxation Iterations: 10
Equation Solver: Parallel Direct Time
Starting Time: 0 sec Duration: 0 sec Ending Time: 0 sec
Materials
Matl. 1 ‐ Embankment Material Model: Saturated / Unsaturated Hydraulic
K‐Function: Matl. 1 Embankment Material Ky'/Kx' Ratio: 0.25 Rotation: 0 ° Vol. WC. Function: Matl. 1 Embankment Fill from Borrow Areas
Matl. 2 ‐ Surficial Overburden Layer Model: Saturated / Unsaturated Hydraulic
K‐Function: Matl. 2 Surficial Overburden Layer Ky'/Kx' Ratio: 0.1 Rotation: 0 ° Vol. WC. Function: Matl. 2 Surficial Overburden Layer
Matl. 3 ‐ Shallow Alluvial Deposits Model: Saturated / Unsaturated Hydraulic
K‐Function: Matl. 3 Shallow Alluvial Deposits Ky'/Kx' Ratio: 0.1 Rotation: 0 ° Vol. WC. Function: Matl. 3 Shallow Alluvial Deposits
Matl. 4 ‐ Deeper Marine Deposits Model: Saturated / Unsaturated Hydraulic
K‐Function: Matl. 4 Deeper Marine Deposits Ky'/Kx' Ratio: 0.1 Rotation: 0 ° Vol. WC. Function: Matl. 4 Deeper Marine Deposits
Matl. 5 ‐ Soil Cement Armoring Model: Saturated / Unsaturated Hydraulic
K‐Function: Matl. 5 Soil Cement Armoring Ky'/Kx' Ratio: 1 Rotation: 0 ° Vol. WC. Function: Matl. 5 Soil Cement Armoring
file:///C:/Users/k3engmwv/Documents/LOWP/FY17-18%20PIR%20Work/SEEP%20and... 11/14/2018
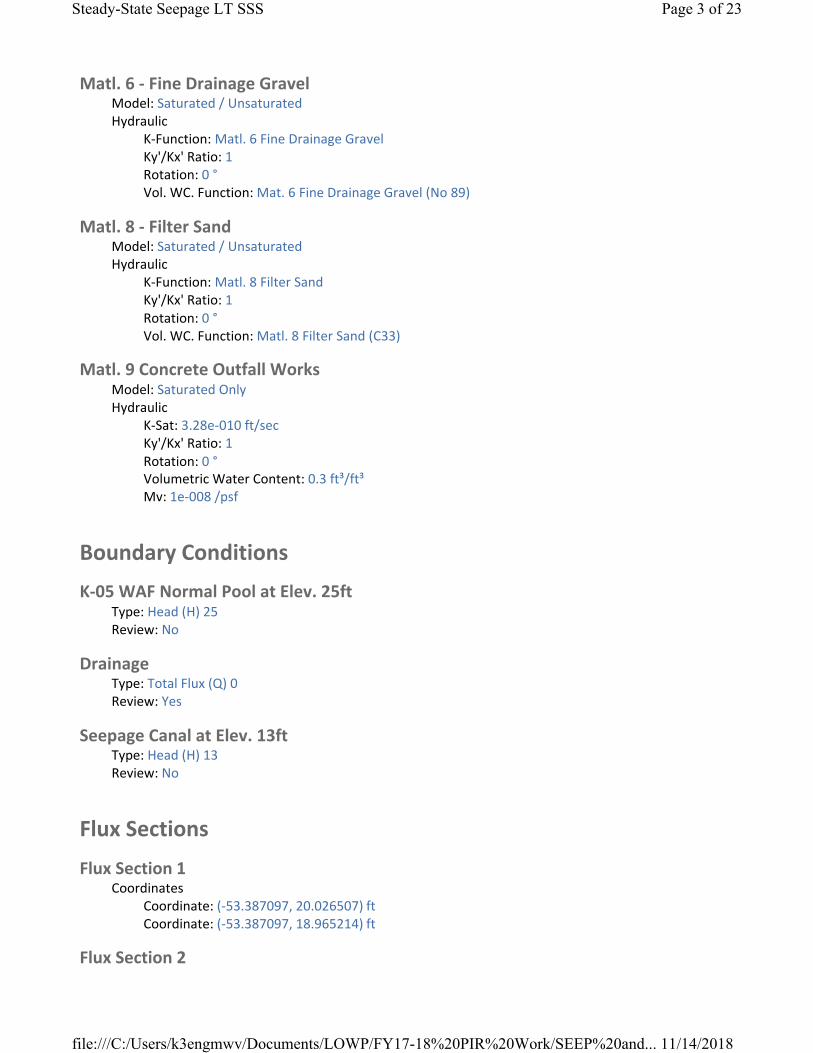
Steady-State Seepage LT SSS Page 3 of 23
Matl. 6 ‐ Fine Drainage Gravel Model: Saturated / Unsaturated Hydraulic
K‐Function: Matl. 6 Fine Drainage Gravel Ky'/Kx' Ratio: 1 Rotation: 0 ° Vol. WC. Function: Mat. 6 Fine Drainage Gravel (No 89)
Matl. 8 ‐ Filter Sand Model: Saturated / Unsaturated Hydraulic
K‐Function: Matl. 8 Filter Sand Ky'/Kx' Ratio: 1 Rotation: 0 ° Vol. WC. Function: Matl. 8 Filter Sand (C33)
Matl. 9 Concrete Outfall Works Model: Saturated Only Hydraulic
K‐Sat: 3.28e‐010 ft/sec Ky'/Kx' Ratio: 1 Rotation: 0 ° Volumetric Water Content: 0.3 ft³/ft³ Mv: 1e‐008 /psf
Boundary Conditions
K‐05 WAF Normal Pool at Elev. 25ft Type: Head (H) 25 Review: No
Drainage Type: Total Flux (Q) 0 Review: Yes
Seepage Canal at Elev. 13ft Type: Head (H) 13 Review: No
Flux Sections
Flux Section 1 Coordinates
Coordinate: (‐53.387097, 20.026507) ft Coordinate: (‐53.387097, 18.965214) ft
Flux Section 2
file:///C:/Users/k3engmwv/Documents/LOWP/FY17-18%20PIR%20Work/SEEP%20and... 11/14/2018
Steady-State Seepage LT SSS Page 4 of 23
Coordinates Coordinate: (‐77.145669, 18.00689) ft Coordinate: (‐77.130906, 16.397638) ft Coordinate: (‐62.322835, 16.373031) ft Coordinate: (‐62.322835, 16.63878) ft
Flux Section 3 Coordinates
Coordinate: (0, 36.6) ft Coordinate: (0, ‐112.3) ft
Flux Section 4 Coordinates
Coordinate: (‐382.8, 18.2) ft Coordinate: (‐319.7, ‐3.4) ft Coordinate: (‐289.2, ‐3.3) ft Coordinate: (‐228.6, 17.7) ft
Flux Section 5 Coordinates
Coordinate: (‐399.8, 18) ft Coordinate: (‐400.1, ‐112.4) ft
K Functions
Matl. 1 Embankment Material Model: Hyd K Data Point Function Function: X‐Conductivity vs. Pore‐Water Pressure
Curve Fit to Data: 100 % Segment Curvature: 36 %
K‐Saturation: 0.000131 Data Points: Matric Suction (psf), X‐Conductivity (ft/sec)
Data Point: (0.01, 0.000131) Data Point: (0.018329807, 0.00013099927) Data Point: (0.033598183, 0.00013099852) Data Point: (0.061584821, 0.00013099772) Data Point: (0.11288379, 0.00013099684) Data Point: (0.20691381, 0.00013099581) Data Point: (0.37926902, 0.0001309945) Data Point: (0.6951928, 0.00013099268) Data Point: (1.274275, 0.00013098992) Data Point: (2.3357215, 0.00013098549) Data Point: (4.2813324, 0.0001309777) Data Point: (7.8475997, 0.00013096339) Data Point: (14.384499, 0.00013094955) Data Point: (26.366509, 0.00013089452) Data Point: (48.329302, 0.00013043835) Data Point: (88.586679, 0.00012910123) Data Point: (162.37767, 5.664247e‐005)
file:///C:/Users/k3engmwv/Documents/LOWP/FY17-18%20PIR%20Work/SEEP%20and... 11/14/2018
Steady-State Seepage LT SSS Page 5 of 23
Data Point: (297.63514, 2.5159921e‐006) Data Point: (545.55948, 4.7485927e‐008) Data Point: (1,000, 1.7886028e‐009)
Estimation Properties Hyd. K‐Function Estimation Method: Fredlund‐Xing Function Volume Water Content Function: Matl. 1 Embankment Fill from Borrow Areas Hydraulic K Sat: 0.000131 ft/sec Residual Water Content: 0.0495 ft³/ft³ Maximum: 1,000 Minimum: 0.01 Num. Points: 20
Matl. 4 Deeper Marine Deposits Model: Hyd K Data Point Function Function: X‐Conductivity vs. Pore‐Water Pressure
Curve Fit to Data: 100 % Segment Curvature: 44 %
K‐Saturation: 0.000984 Data Points: Matric Suction (psf), X‐Conductivity (ft/sec)
Data Point: (0.01, 0.000984) Data Point: (0.018329807, 0.00098398585) Data Point: (0.033598183, 0.00098397151) Data Point: (0.061584821, 0.00098395679) Data Point: (0.11288379, 0.00098394139) Data Point: (0.20691381, 0.00098392476) Data Point: (0.37926902, 0.00098390584) Data Point: (0.6951928, 0.00098388274) Data Point: (1.274275, 0.00098385199) Data Point: (2.3357215, 0.0009838074) Data Point: (4.2813324, 0.00098373618) Data Point: (7.8475997, 0.00098361453) Data Point: (14.384499, 0.0009834543) Data Point: (26.366509, 0.00098304118) Data Point: (48.329302, 0.00098089274) Data Point: (88.586679, 0.00098804841) Data Point: (162.37767, 0.00089693201) Data Point: (297.63514, 0.00029836287) Data Point: (545.55948, 5.5741791e‐006) Data Point: (1,000, 8.8545842e‐008)
Estimation Properties Hyd. K‐Function Estimation Method: Fredlund‐Xing Function Volume Water Content Function: Matl. 4 Deeper Marine Deposits Hydraulic K Sat: 0.000984 ft/sec Residual Water Content: 0.03 ft³/ft³ Maximum: 1,000 Minimum: 0.01 Num. Points: 20
Matl. 6 Fine Drainage Gravel Model: Hyd K Data Point Function
file:///C:/Users/k3engmwv/Documents/LOWP/FY17-18%20PIR%20Work/SEEP%20and... 11/14/2018
Steady-State Seepage LT SSS Page 6 of 23
Function: X‐Conductivity vs. Pore‐Water Pressure Curve Fit to Data: 100 % Segment Curvature: 40 %
K‐Saturation: 0.0116 Data Points: Matric Suction (psf), X‐Conductivity (ft/sec)
Data Point: (0.01, 0.0116) Data Point: (0.018329807, 0.011599999) Data Point: (0.033598183, 0.011599999) Data Point: (0.061584821, 0.011599997) Data Point: (0.11288379, 0.011599992) Data Point: (0.20691381, 0.011599991) Data Point: (0.37926902, 0.011600028) Data Point: (0.6951928, 0.011599657) Data Point: (1.274275, 0.011599409) Data Point: (2.3357215, 0.011606742) Data Point: (4.2813324, 0.01023118) Data Point: (7.8475997, 0.0019666911) Data Point: (14.384499, 3.3083667e‐005) Data Point: (26.366509, 3.5079262e‐007) Data Point: (48.329302, 1.0209264e‐008) Data Point: (88.586679, 1.7809046e‐009) Data Point: (162.37767, 3.7872508e‐010) Data Point: (297.63514, 7.9282799e‐011) Data Point: (545.55948, 1.3312429e‐011) Data Point: (1,000, 1.2335483e‐012)
Estimation Properties Hyd. K‐Function Estimation Method: Fredlund‐Xing Function Volume Water Content Function: Mat. 6 Fine Drainage Gravel (No 89) Hydraulic K Sat: 0.0116 ft/sec Residual Water Content: 0.042 ft³/ft³ Maximum: 1,000 Minimum: 0.01 Num. Points: 20
Matl. 2 Surficial Overburden Layer Model: Hyd K Data Point Function Function: X‐Conductivity vs. Pore‐Water Pressure
Curve Fit to Data: 100 % Segment Curvature: 36 %
K‐Saturation: 0.00026 Data Points: Matric Suction (psf), X‐Conductivity (ft/sec)
Data Point: (0.01, 0.00026) Data Point: (0.018329807, 0.00025999835) Data Point: (0.033598183, 0.00025999664) Data Point: (0.061584821, 0.00025999485) Data Point: (0.11288379, 0.00025999288) Data Point: (0.20691381, 0.00025999062) Data Point: (0.37926902, 0.00025998779) Data Point: (0.6951928, 0.00025998393) Data Point: (1.274275, 0.00025997819)
file:///C:/Users/k3engmwv/Documents/LOWP/FY17-18%20PIR%20Work/SEEP%20and... 11/14/2018
Steady-State Seepage LT SSS Page 7 of 23
Data Point: (2.3357215, 0.00025996907) Data Point: (4.2813324, 0.00025995329) Data Point: (7.8475997, 0.00025992467) Data Point: (14.384499, 0.00025989276) Data Point: (26.366509, 0.00025978642) Data Point: (48.329302, 0.00025903344) Data Point: (88.586679, 0.0002586222) Data Point: (162.37767, 0.00013432217) Data Point: (297.63514, 8.1547435e‐006) Data Point: (545.55948, 1.3663567e‐007) Data Point: (1,000, 4.5608744e‐009)
Estimation Properties Hyd. K‐Function Estimation Method: Fredlund‐Xing Function Volume Water Content Function: Matl. 2 Surficial Overburden Layer Hydraulic K Sat: 0.00026 ft/sec Residual Water Content: 0.0495 ft³/ft³ Maximum: 1,000 Minimum: 0.01 Num. Points: 20
Matl. 3 Shallow Alluvial Deposits Model: Hyd K Data Point Function Function: X‐Conductivity vs. Pore‐Water Pressure
Curve Fit to Data: 100 % Segment Curvature: 36 %
K‐Saturation: 0.00174 Data Points: Matric Suction (psf), X‐Conductivity (ft/sec)
Data Point: (0.01, 0.00174) Data Point: (0.018329807, 0.0017399903) Data Point: (0.033598183, 0.0017399803) Data Point: (0.061584821, 0.0017399698) Data Point: (0.11288379, 0.0017399581) Data Point: (0.20691381, 0.0017399444) Data Point: (0.37926902, 0.0017399269) Data Point: (0.6951928, 0.0017399027) Data Point: (1.274275, 0.0017398661) Data Point: (2.3357215, 0.0017398072) Data Point: (4.2813324, 0.0017397038) Data Point: (7.8475997, 0.0017395137) Data Point: (14.384499, 0.0017393299) Data Point: (26.366509, 0.001738599) Data Point: (48.329302, 0.0017325399) Data Point: (88.586679, 0.0017147796) Data Point: (162.37767, 0.00075235037) Data Point: (297.63514, 3.3418521e‐005) Data Point: (545.55948, 6.307291e‐007) Data Point: (1,000, 2.3757014e‐008)
Estimation Properties Hyd. K‐Function Estimation Method: Fredlund‐Xing Function Volume Water Content Function: Matl. 3 Shallow Alluvial Deposits
file:///C:/Users/k3engmwv/Documents/LOWP/FY17-18%20PIR%20Work/SEEP%20and... 11/14/2018
Steady-State Seepage LT SSS Page 8 of 23
Hydraulic K Sat: 0.00174 ft/sec Residual Water Content: 0.0495 ft³/ft³ Maximum: 1,000 Minimum: 0.01 Num. Points: 20
Matl. 5 Soil Cement Armoring Model: Hyd K Data Point Function Function: X‐Conductivity vs. Pore‐Water Pressure
Curve Fit to Data: 100 % Segment Curvature: 44 %
K‐Saturation: 1.31e‐005 Data Points: Matric Suction (psf), X‐Conductivity (ft/sec)
Data Point: (0.01, 1.31e‐005) Data Point: (0.018329807, 1.3099927e‐005) Data Point: (0.033598183, 1.3099852e‐005) Data Point: (0.061584821, 1.3099772e‐005) Data Point: (0.11288379, 1.3099684e‐005) Data Point: (0.20691381, 1.3099581e‐005) Data Point: (0.37926902, 1.309945e‐005) Data Point: (0.6951928, 1.3099268e‐005) Data Point: (1.274275, 1.3098992e‐005) Data Point: (2.3357215, 1.3098549e‐005) Data Point: (4.2813324, 1.309777e‐005) Data Point: (7.8475997, 1.3096339e‐005) Data Point: (14.384499, 1.3094955e‐005) Data Point: (26.366509, 1.3089452e‐005) Data Point: (48.329302, 1.3043835e‐005) Data Point: (88.586679, 1.2910123e‐005) Data Point: (162.37767, 5.664247e‐006) Data Point: (297.63514, 2.5159921e‐007) Data Point: (545.55948, 4.7485927e‐009) Data Point: (1,000, 1.7886028e‐010)
Estimation Properties Hyd. K‐Function Estimation Method: Fredlund‐Xing Function Volume Water Content Function: Matl. 5 Soil Cement Armoring Hydraulic K Sat: 1.31e‐005 ft/sec Residual Water Content: 0.03 ft³/ft³ Maximum: 1,000 Minimum: 0.01 Num. Points: 20
Matl. 8 Filter Sand Model: Hyd K Data Point Function Function: X‐Conductivity vs. Pore‐Water Pressure
Curve Fit to Data: 100 % Segment Curvature: 44 %
K‐Saturation: 0.000925 Data Points: Matric Suction (psf), X‐Conductivity (ft/sec)
Data Point: (0.01, 0.000925)
file:///C:/Users/k3engmwv/Documents/LOWP/FY17-18%20PIR%20Work/SEEP%20and... 11/14/2018
Steady-State Seepage LT SSS Page 9 of 23
Data Point: (0.018329807, 0.00092499993) Data Point: (0.033598183, 0.00092499981) Data Point: (0.061584821, 0.0009249996) Data Point: (0.11288379, 0.00092499919) Data Point: (0.20691381, 0.00092499854) Data Point: (0.37926902, 0.00092499785) Data Point: (0.6951928, 0.00092499117) Data Point: (1.274275, 0.00092498427) Data Point: (2.3357215, 0.00092515575) Data Point: (4.2813324, 0.00092444336) Data Point: (7.8475997, 0.00092025484) Data Point: (14.384499, 0.00086768248) Data Point: (26.366509, 0.00022215817) Data Point: (48.329302, 5.6149022e‐006) Data Point: (88.586679, 9.4931606e‐008) Data Point: (162.37767, 4.4270536e‐009) Data Point: (297.63514, 6.3580973e‐010) Data Point: (545.55948, 1.1244323e‐010) Data Point: (1,000, 1.0762229e‐011)
Estimation Properties Hyd. K‐Function Estimation Method: Fredlund‐Xing Function Volume Water Content Function: Matl. 8 Filter Sand (C33) Hydraulic K Sat: 0.000925 ft/sec Residual Water Content: 0.03 ft³/ft³ Maximum: 1,000 Minimum: 0.01 Num. Points: 20
Vol. Water Content Functions
Matl. 3 Shallow Alluvial Deposits Model: Vol WC Data Point Function Function: Vol. Water Content vs. Pore‐Water Pressure
Mv: 2.5e‐006 /psf Saturated Water Content: 0.30020276 ft³/ft³ Residual Water Content: 0.030020276 ft³/ft³ Curve Fit to Data: 100 % Segment Curvature: 40 %
Porosity: 0.30020276 Data Points: Matric Suction (psf), Vol. Water Content (ft³/ft³)
Data Point: (0.01, 0.29987196) Data Point: (0.018329807, 0.29987196) Data Point: (0.033598183, 0.29987196) Data Point: (0.061584821, 0.29987196) Data Point: (0.11288379, 0.29987196) Data Point: (0.20691381, 0.29987196) Data Point: (0.37926902, 0.29987196) Data Point: (0.6951928, 0.29987196) Data Point: (1.274275, 0.29987196)
file:///C:/Users/k3engmwv/Documents/LOWP/FY17-18%20PIR%20Work/SEEP%20and... 11/14/2018
Steady-State Seepage LT SSS Page 10 of 23
Data Point: (2.3357215, 0.29987196) Data Point: (4.2813324, 0.29987196) Data Point: (7.8475997, 0.29987196) Data Point: (14.384499, 0.29987196) Data Point: (26.366509, 0.29987196) Data Point: (48.329302, 0.29987196) Data Point: (88.586679, 0.29667682) Data Point: (162.37767, 0.20150036) Data Point: (297.63514, 0.085811521) Data Point: (545.55948, 0.049379583) Data Point: (1,000, 0.039446735)
Estimation Properties Vol. WC Estimation Method: Grain Size Function Saturated Water Content: 0.3 ft³/ft³ Sample Material: Clay Liquid Limit: 0 % Diameter at 10% passing: 0.07000000000000001 Diameter at 60% passing: 0.2 Maximum: 1,000 Minimum: 0.01 Num. Points: 20
Matl. 1 Embankment Fill from Borrow Areas Model: Vol WC Data Point Function Function: Vol. Water Content vs. Pore‐Water Pressure
Mv: 2.5e‐006 /psf Saturated Water Content: 0.30020276 ft³/ft³ Residual Water Content: 0.030020276 ft³/ft³ Curve Fit to Data: 100 % Segment Curvature: 40 %
Porosity: 0.30020276 Data Points: Matric Suction (psf), Vol. Water Content (ft³/ft³)
Data Point: (0.01, 0.29987196) Data Point: (0.018329807, 0.29987196) Data Point: (0.033598183, 0.29987196) Data Point: (0.061584821, 0.29987196) Data Point: (0.11288379, 0.29987196) Data Point: (0.20691381, 0.29987196) Data Point: (0.37926902, 0.29987196) Data Point: (0.6951928, 0.29987196) Data Point: (1.274275, 0.29987196) Data Point: (2.3357215, 0.29987196) Data Point: (4.2813324, 0.29987196) Data Point: (7.8475997, 0.29987196) Data Point: (14.384499, 0.29987196) Data Point: (26.366509, 0.29987196) Data Point: (48.329302, 0.29987196) Data Point: (88.586679, 0.29667682) Data Point: (162.37767, 0.20150036) Data Point: (297.63514, 0.085811521)
file:///C:/Users/k3engmwv/Documents/LOWP/FY17-18%20PIR%20Work/SEEP%20and... 11/14/2018
Steady-State Seepage LT SSS Page 11 of 23
Data Point: (545.55948, 0.049379583) Data Point: (1,000, 0.039446735)
Estimation Properties Vol. WC Estimation Method: Grain Size Function Saturated Water Content: 0.3 ft³/ft³ Sample Material: Clay Liquid Limit: 0 % Diameter at 10% passing: 0.07000000000000001 Diameter at 60% passing: 0.2 Maximum: 1,000 Minimum: 0.01 Num. Points: 20
Matl. 2 Surficial Overburden Layer Model: Vol WC Data Point Function Function: Vol. Water Content vs. Pore‐Water Pressure
Mv: 2.5e‐006 /psf Saturated Water Content: 0.30132774 ft³/ft³ Residual Water Content: 0.030132774 ft³/ft³ Curve Fit to Data: 100 % Segment Curvature: 40 %
Porosity: 0.30132774 Data Points: Matric Suction (psf), Vol. Water Content (ft³/ft³)
Data Point: (0.01, 0.30110223) Data Point: (0.018329807, 0.30110223) Data Point: (0.033598183, 0.30110223) Data Point: (0.061584821, 0.30110223) Data Point: (0.11288379, 0.30110223) Data Point: (0.20691381, 0.30110223) Data Point: (0.37926902, 0.30110223) Data Point: (0.6951928, 0.30110223) Data Point: (1.274275, 0.30110223) Data Point: (2.3357215, 0.30110223) Data Point: (4.2813324, 0.30110223) Data Point: (7.8475997, 0.30110223) Data Point: (14.384499, 0.30110223) Data Point: (26.366509, 0.30110223) Data Point: (48.329302, 0.30110223) Data Point: (88.586679, 0.29938489) Data Point: (162.37767, 0.21986255) Data Point: (297.63514, 0.094851578) Data Point: (545.55948, 0.051777012) Data Point: (1,000, 0.040605935)
Estimation Properties Vol. WC Estimation Method: Grain Size Function Saturated Water Content: 0.3 ft³/ft³ Sample Material: Clay Liquid Limit: 0 % Diameter at 10% passing: 0.07000000000000001 Diameter at 60% passing: 0.18
file:///C:/Users/k3engmwv/Documents/LOWP/FY17-18%20PIR%20Work/SEEP%20and... 11/14/2018
Steady-State Seepage LT SSS Page 12 of 23
Maximum: 1,000 Minimum: 0.01 Num. Points: 20
Matl. 8 Filter Sand (C33) Model: Vol WC Data Point Function Function: Vol. Water Content vs. Pore‐Water Pressure
Mv: 8e‐007 /psf Saturated Water Content: 0.30081752 ft³/ft³ Residual Water Content: 0.030081752 ft³/ft³ Curve Fit to Data: 100 % Segment Curvature: 48 %
Porosity: 0.30081752 Data Points: Matric Suction (psf), Vol. Water Content (ft³/ft³)
Data Point: (0.01, 0.30028388) Data Point: (0.018329807, 0.30028388) Data Point: (0.033598183, 0.30028388) Data Point: (0.061584821, 0.30028388) Data Point: (0.11288379, 0.30028388) Data Point: (0.20691381, 0.30028388) Data Point: (0.37926902, 0.30028388) Data Point: (0.6951928, 0.30028388) Data Point: (1.274275, 0.30028388) Data Point: (2.3357215, 0.30028388) Data Point: (4.2813324, 0.30028388) Data Point: (7.8475997, 0.30028388) Data Point: (14.384499, 0.28112842) Data Point: (26.366509, 0.15065712) Data Point: (48.329302, 0.048430554) Data Point: (88.586679, 0.021674388) Data Point: (162.37767, 0.016081301) Data Point: (297.63514, 0.013674367) Data Point: (545.55948, 0.011770874) Data Point: (1,000, 0.010084825)
Estimation Properties Vol. WC Estimation Method: Grain Size Function Saturated Water Content: 0.3 ft³/ft³ Sample Material: Gravel Liquid Limit: 0 % Diameter at 10% passing: 0.38 Diameter at 60% passing: 1.6 Maximum: 1,000 Minimum: 0.01 Num. Points: 20
Mat. 6 Fine Drainage Gravel (No 89) Model: Vol WC Data Point Function Function: Vol. Water Content vs. Pore‐Water Pressure
Mv: 4e‐007 /psf Saturated Water Content: 0.21947752 ft³/ft³
file:///C:/Users/k3engmwv/Documents/LOWP/FY17-18%20PIR%20Work/SEEP%20and... 11/14/2018
Steady-State Seepage LT SSS Page 13 of 23
Residual Water Content: 0.021947752 ft³/ft³ Curve Fit to Data: 100 % Segment Curvature: 48 %
Porosity: 0.21947752 Data Points: Matric Suction (psf), Vol. Water Content (ft³/ft³)
Data Point: (0.01, 0.21916427) Data Point: (0.018329807, 0.21916427) Data Point: (0.033598183, 0.21916427) Data Point: (0.061584821, 0.21916427) Data Point: (0.11288379, 0.21916427) Data Point: (0.20691381, 0.21916427) Data Point: (0.37926902, 0.21916427) Data Point: (0.6951928, 0.21916427) Data Point: (1.274275, 0.21916427) Data Point: (2.3357215, 0.21916427) Data Point: (4.2813324, 0.20182012) Data Point: (7.8475997, 0.090949254) Data Point: (14.384499, 0.021737158) Data Point: (26.366509, 0.0080845337) Data Point: (48.329302, 0.0057554944) Data Point: (88.586679, 0.0048689464) Data Point: (162.37767, 0.0041947283) Data Point: (297.63514, 0.0036057207) Data Point: (545.55948, 0.0030872724) Data Point: (1,000, 0.002632805)
Estimation Properties Vol. WC Estimation Method: Grain Size Function Saturated Water Content: 0.21875 ft³/ft³ Sample Material: Clay Liquid Limit: 0 % Diameter at 10% passing: 3.5 Diameter at 60% passing: 7.1 Maximum: 1,000 Minimum: 0.01 Num. Points: 20
Matl. 4 Deeper Marine Deposits Model: Vol WC Data Point Function Function: Vol. Water Content vs. Pore‐Water Pressure
Mv: 2.5e‐006 /psf Saturated Water Content: 0.30154597 ft³/ft³ Residual Water Content: 0.030154597 ft³/ft³ Curve Fit to Data: 100 % Segment Curvature: 40 %
Porosity: 0.30154597 Data Points: Matric Suction (psf), Vol. Water Content (ft³/ft³)
Data Point: (0.01, 0.30100508) Data Point: (0.018329807, 0.30100508) Data Point: (0.033598183, 0.30100508) Data Point: (0.061584821, 0.30100508)
file:///C:/Users/k3engmwv/Documents/LOWP/FY17-18%20PIR%20Work/SEEP%20and... 11/14/2018
Steady-State Seepage LT SSS Page 14 of 23
Data Point: (0.11288379, 0.30100508) Data Point: (0.20691381, 0.30100508) Data Point: (0.37926902, 0.30100508) Data Point: (0.6951928, 0.30100508) Data Point: (1.274275, 0.30100508) Data Point: (2.3357215, 0.30100508) Data Point: (4.2813324, 0.30100508) Data Point: (7.8475997, 0.30100508) Data Point: (14.384499, 0.30100508) Data Point: (26.366509, 0.30100508) Data Point: (48.329302, 0.30100508) Data Point: (88.586679, 0.30100508) Data Point: (162.37767, 0.2887592) Data Point: (297.63514, 0.17412515) Data Point: (545.55948, 0.076942285) Data Point: (1,000, 0.051397358)
Estimation Properties Vol. WC Estimation Method: Grain Size Function Saturated Water Content: 0.3 ft³/ft³ Sample Material: Clay Liquid Limit: 0 % Diameter at 10% passing: 0.06 Diameter at 60% passing: 0.11 Maximum: 1,000 Minimum: 0.01 Num. Points: 20
Matl. 5 Soil Cement Armoring Model: Vol WC Data Point Function Function: Vol. Water Content vs. Pore‐Water Pressure
Mv: 2.5e‐006 /psf Saturated Water Content: 0.30020276 ft³/ft³ Residual Water Content: 0.030020276 ft³/ft³ Curve Fit to Data: 100 % Segment Curvature: 40 %
Porosity: 0.30020276 Data Points: Matric Suction (psf), Vol. Water Content (ft³/ft³)
Data Point: (0.01, 0.29987196) Data Point: (0.018329807, 0.29987196) Data Point: (0.033598183, 0.29987196) Data Point: (0.061584821, 0.29987196) Data Point: (0.11288379, 0.29987196) Data Point: (0.20691381, 0.29987196) Data Point: (0.37926902, 0.29987196) Data Point: (0.6951928, 0.29987196) Data Point: (1.274275, 0.29987196) Data Point: (2.3357215, 0.29987196) Data Point: (4.2813324, 0.29987196) Data Point: (7.8475997, 0.29987196) Data Point: (14.384499, 0.29987196)
file:///C:/Users/k3engmwv/Documents/LOWP/FY17-18%20PIR%20Work/SEEP%20and... 11/14/2018
Steady-State Seepage LT SSS Page 15 of 23
Data Point: (26.366509, 0.29987196) Data Point: (48.329302, 0.29987196) Data Point: (88.586679, 0.29667682) Data Point: (162.37767, 0.20150036) Data Point: (297.63514, 0.085811521) Data Point: (545.55948, 0.049379583) Data Point: (1,000, 0.039446735)
Estimation Properties Vol. WC Estimation Method: Grain Size Function Saturated Water Content: 0.3 ft³/ft³ Sample Material: Clay Liquid Limit: 0 % Diameter at 10% passing: 0.07000000000000001 Diameter at 60% passing: 0.2 Maximum: 1,000 Minimum: 0.01 Num. Points: 20
Points X (ft) Y (ft)
Point 1 ‐53.5 21
Point 2 ‐14.5 21 Point 3 ‐14.5 30
Point 4 ‐11.5 30
Point 5 ‐11.5 18 Point 6 ‐7 36.5
Point 7 ‐7 35.5
Point 8 6.8 35.5 Point 9 14 33
Point 10 13.7 32.1
Point 11 48.6 20.5
Point 12 51.2 18
Point 13 52.0033 19.4828
Point 14 51.9 19.4
Point 15 51.8636 19.2065
Point 16 52.097 19.0075
Point 17 52.3031 19.0832
Point 18 52.3561 19.2916
Point 19 52.3 19.4
Point 20 52.1797 19.4906
Point 21 59.3 18
Point 22 56.3 19 Point 23 54.8 19.5
Point 24 58 19.5
Point 25 7 36.5
file:///C:/Users/k3engmwv/Documents/LOWP/FY17-18%20PIR%20Work/SEEP%20and... 11/14/2018
26
27
28
29
30
31
32
33
34
35
36
37
38
39
40
41
42
43
44
45
46
47
48
49
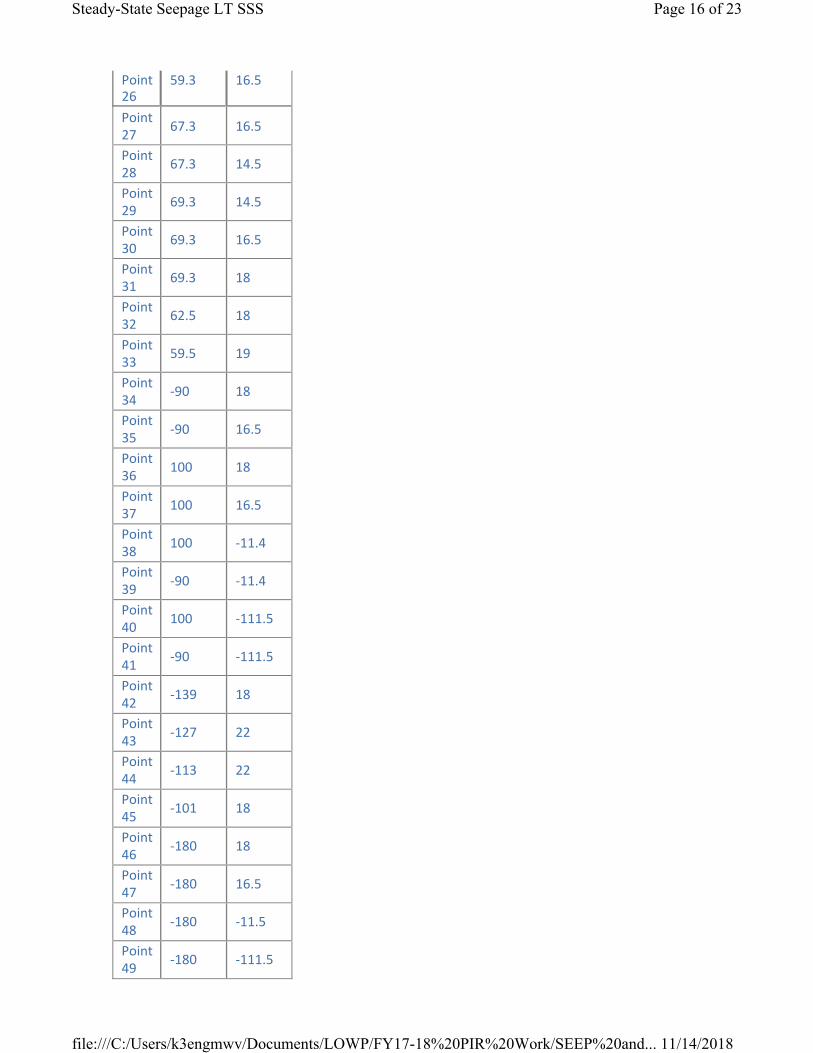
Steady-State Seepage LT SSS Page 16 of 23
file:///C:/Users/k3engmwv/Documents/LOWP/FY17-18%20PIR%20Work/SEEP%20and... 11/14/2018
Point 59.3 16.5
Point 67.3 16.5
Point 67.3 14.5
Point 69.3 14.5
Point 69.3 16.5
Point 69.3 18
Point 62.5 18
Point 59.5 19
Point ‐90 18
Point ‐90 16.5
Point 100 18
Point 100 16.5
Point 100 ‐11.4
Point ‐90 ‐11.4
Point 100 ‐111.5
Point ‐90 ‐111.5
Point ‐139 18
Point ‐127 22
Point ‐113 22
Point ‐101 18
Point ‐180 18
Point ‐180 16.5
Point ‐180 ‐11.5
Point ‐180 ‐111.5
50
51
52
53
54
55
56
57
58
59
60
61
62
63
64
65
66
67
68
69
70
71
72
73
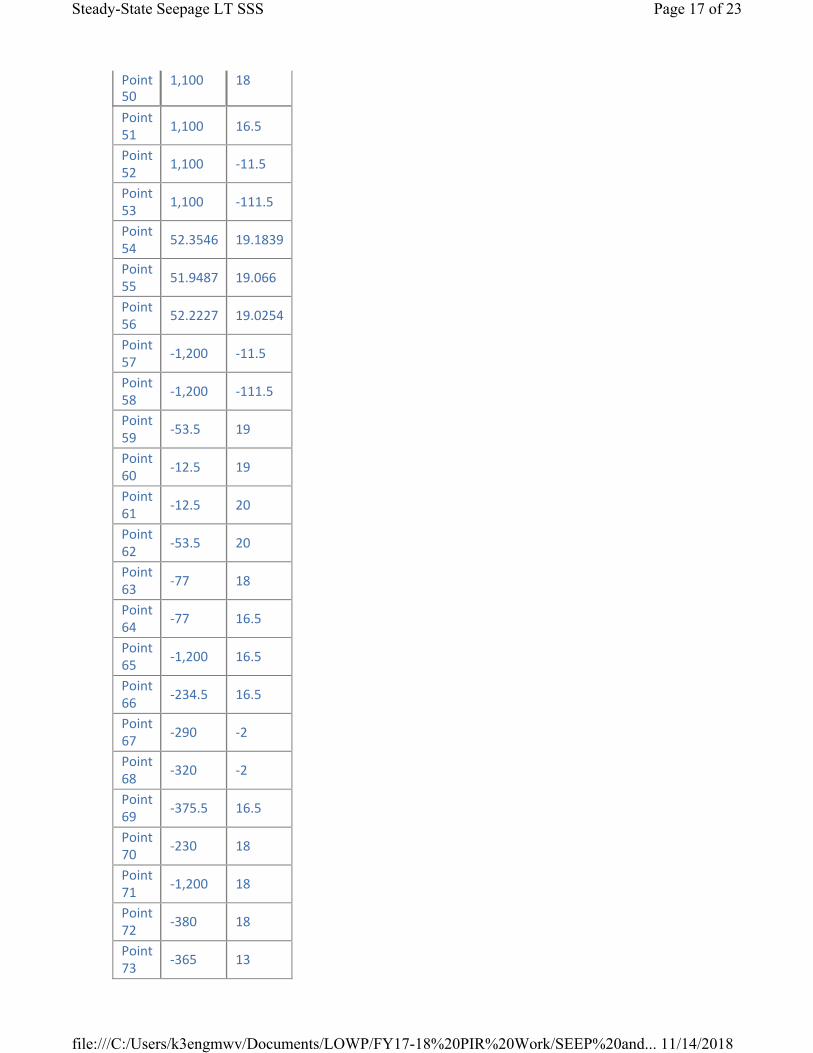
Steady-State Seepage LT SSS Page 17 of 23
file:///C:/Users/k3engmwv/Documents/LOWP/FY17-18%20PIR%20Work/SEEP%20and... 11/14/2018
Point 1,100 18
Point 1,100 16.5
Point 1,100 ‐11.5
Point 1,100 ‐111.5
Point 52.3546 19.1839
Point 51.9487 19.066
Point 52.2227 19.0254
Point ‐1,200 ‐11.5
Point ‐1,200 ‐111.5
Point ‐53.5 19
Point ‐12.5 19
Point ‐12.5 20
Point ‐53.5 20
Point ‐77 18
Point ‐77 16.5
Point ‐1,200 16.5
Point ‐234.5 16.5
Point ‐290 ‐2
Point ‐320 ‐2
Point ‐375.5 16.5
Point ‐230 18
Point ‐1,200 18
Point ‐380 18
Point ‐365 13
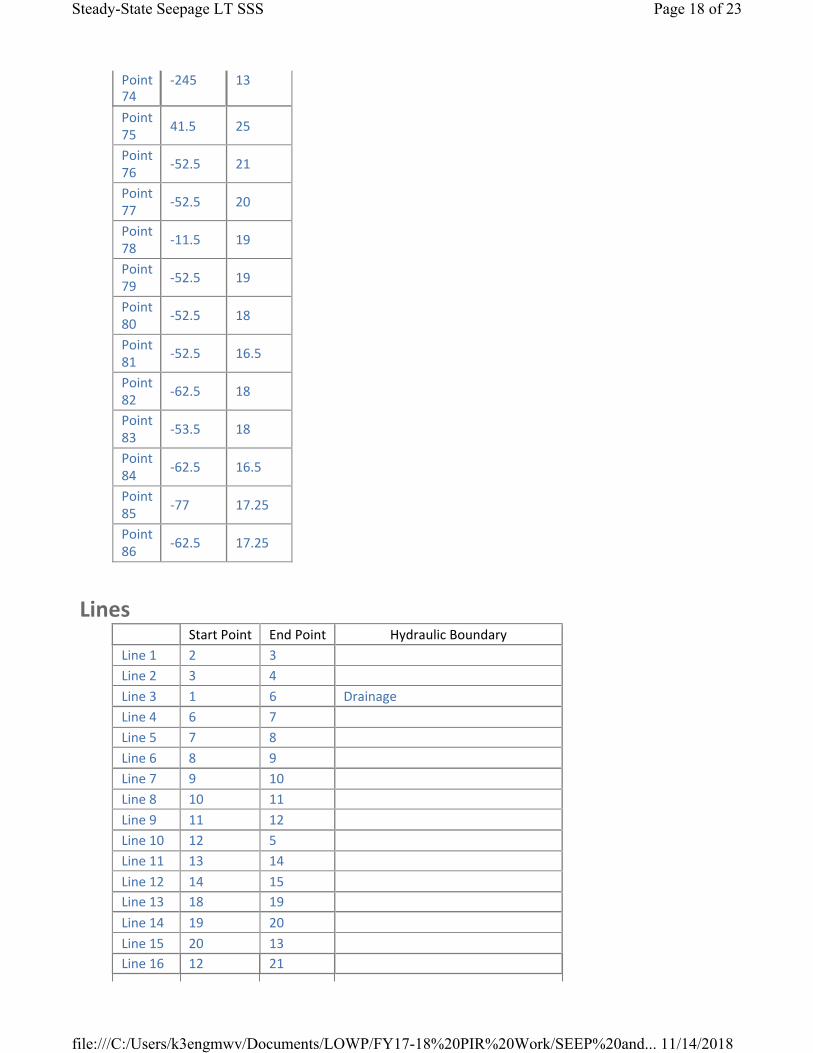
Steady-State Seepage LT SSS Page 18 of 23
Point 74
‐245 13
Point 75
41.5 25
Point 76
‐52.5 21
Point 77
‐52.5 20
Point 78
‐11.5 19
Point 79
‐52.5 19
Point 80
‐52.5 18
Point 81
‐52.5 16.5
Point 82
‐62.5 18
Point 83
‐53.5 18
Point 84
‐62.5 16.5
Point 85
‐77 17.25
Point 86
‐62.5 17.25
Lines Start Point End Point Hydraulic Boundary
Line 1 2 3
Line 2 3 4
Line 3 1 6 Drainage
Line 4 6 7
Line 5 7 8
Line 6 8 9
Line 7 9 10
Line 8 10 11
Line 9 11 12
Line 10 12 5
Line 11 13 14
Line 12 14 15 Line 13 18 19
Line 14 19 20
Line 15 20 13 Line 16 12 21
file:///C:/Users/k3engmwv/Documents/LOWP/FY17-18%20PIR%20Work/SEEP%20and... 11/14/2018
20
25
30
35
40
45
50
55
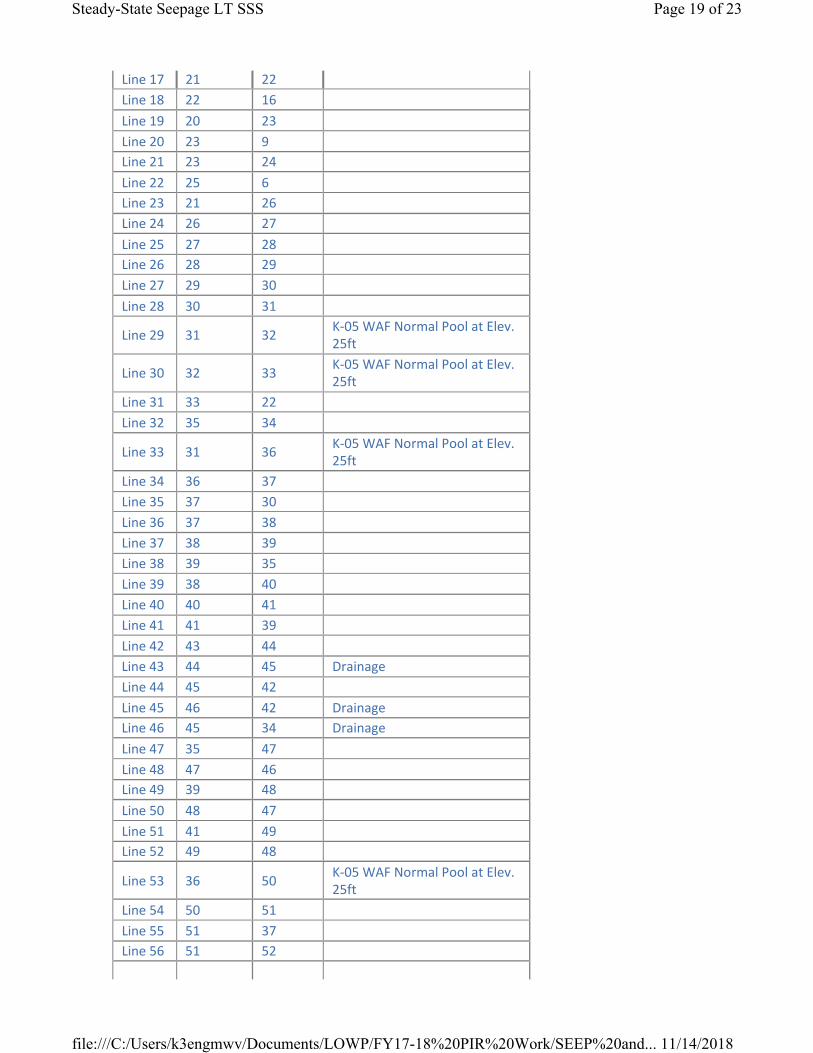
Steady-State Seepage LT SSS Page 19 of 23
file:///C:/Users/k3engmwv/Documents/LOWP/FY17-18%20PIR%20Work/SEEP%20and... 11/14/2018
Line 17 21 22
Line 18 22 16
Line 19 20 23
Line 23 9 Line 21 23 24
Line 22 25 6 Line 23 21 26
Line 24 26 27
Line 27 28 Line 26 28 29
Line 27 29 30
Line 28 30 31
Line 29 31 32 K‐05 WAF Normal Pool at Elev. 25ft
Line 32 33 K‐05 WAF Normal Pool at Elev. 25ft
Line 31 33 22
Line 32 35 34
Line 33 31 36 K‐05 WAF Normal Pool at Elev. 25ft
Line 34 36 37
Line 37 30
Line 36 37 38
Line 37 38 39
Line 38 39 35
Line 39 38 40
Line 40 41
Line 41 41 39
Line 42 43 44
Line 43 44 45 Drainage
Line 44 45 42
Line 46 42 Drainage Line 46 45 34 Drainage
Line 47 35 47
Line 48 47 46 Line 49 39 48
Line 48 47
Line 51 41 49 Line 52 49 48
Line 53 36 50 K‐05 WAF Normal Pool at Elev. 25ft
Line 54 50 51
Line 51 37 Line 56 51 52
57
58
59
60
61
62
63
64
65
66
67
68
69
70
71
72
73
74
75
76
77
78
79
80
81
82
83
84
85
86
87
88
89
90
91
92
93
94
95
96
97
98
Steady-State Seepage LT SSS Page 20 of 23
Line 52 38
Line 52 53
Line 53 40
Line 23 22
Line 24 33 K‐05 WAF Normal Pool at Elev. 25ft
Line 17 54
Line 54 18 Line 15 55
Line 55 16
Line 16 56 Line 56 17
Line 48 57
Line 49 58
Line 58 57
Line 60 61
Line 64 35
Line 63 34 Drainage
Line 65 57
Line 47 66
Line 67 68 Seepage Canal at Elev. 13ft
Line 69 65
Line 66 70 Drainage
Line 70 46 Drainage
Line 71 65
Line 69 72 Drainage
Line 72 71 Drainage
Line 68 73 Seepage Canal at Elev. 13ft Line 73 69 Drainage
Line 66 74 Drainage
Line 74 67 Seepage Canal at Elev. 13ft
Line 24 75 K‐05 WAF Normal Pool at Elev. 25ft
Line 75 25
Line 1 76
Line 76 2 Line 61 77
Line 77 62
Line 76 77 Line 62 1
Line 4 78
Line 78 5 Line 78 60
Line 59 79
file:///C:/Users/k3engmwv/Documents/LOWP/FY17-18%20PIR%20Work/SEEP%20and... 11/14/2018
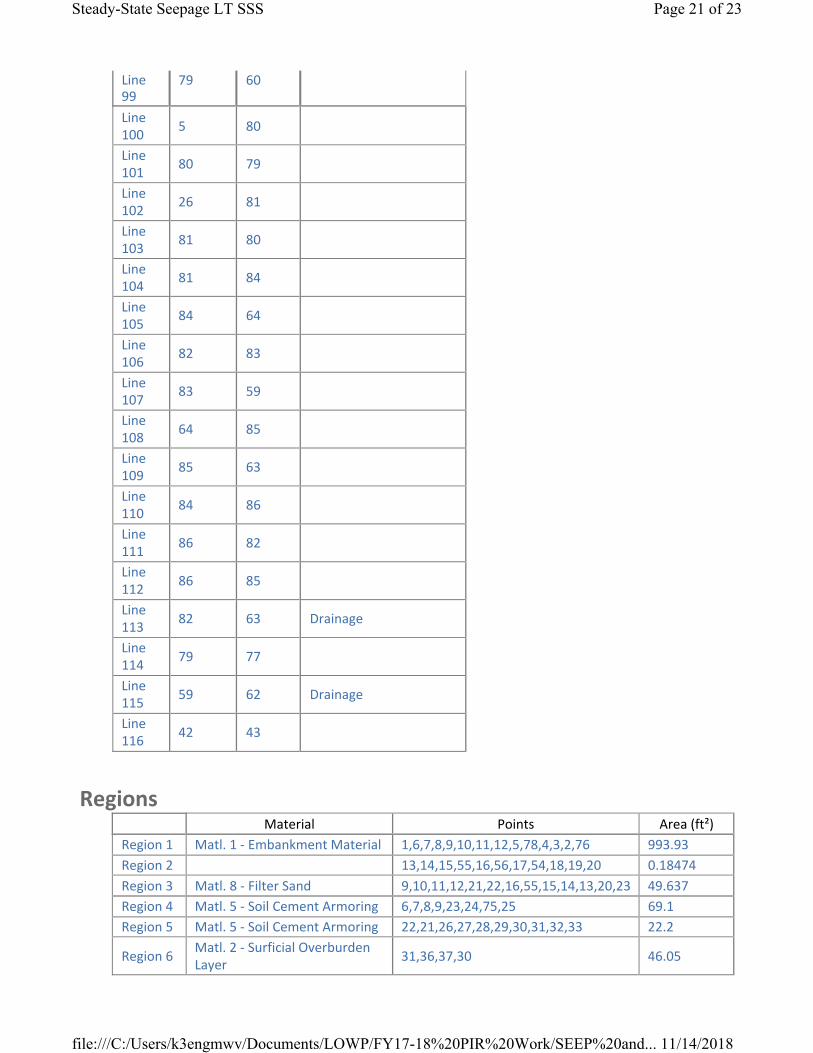
Steady-State Seepage LT SSS Page 21 of 23
Line 99
79 60
Line 100
5 80
Line 101
80 79
Line 102
26 81
Line 103
81 80
Line 104
81 84
Line 105
84 64
Line 106
82 83
Line 107
83 59
Line 108
64 85
Line 109
85 63
Line 110
84 86
Line 111
86 82
Line 112
86 85
Line 113
82 63 Drainage
Line 114
79 77
Line 115
59 62 Drainage
Line 116
42 43
Regions
file:///C:/Users/k3engmwv/Documents/LOWP/FY17-18%20PIR%20Work/SEEP%20and... 11/14/2018
Material Points Area (ft²)
Region 1 Matl. 1 ‐ Embankment Material 1,6,7,8,9,10,11,12,5,78,4,3,2,76 993.93
Region 2 13,14,15,55,16,56,17,54,18,19,20 0.18474
Region 3 Matl. 8 ‐ Filter Sand 9,10,11,12,21,22,16,55,15,14,13,20,23 49.637
Region 4 Matl. 5 ‐ Soil Cement Armoring 6,7,8,9,23,24,75,25 69.1
Region 5 Matl. 5 ‐ Soil Cement Armoring 22,21,26,27,28,29,30,31,32,33 22.2
Region 6 Matl. 2 ‐ Surficial Overburden Layer
31,36,37,30 46.05
10
15
20
25
30
Steady-State Seepage LT SSS Page 22 of 23
file:///C:/Users/k3engmwv/Documents/LOWP/FY17-18%20PIR%20Work/SEEP%20and... 11/14/2018
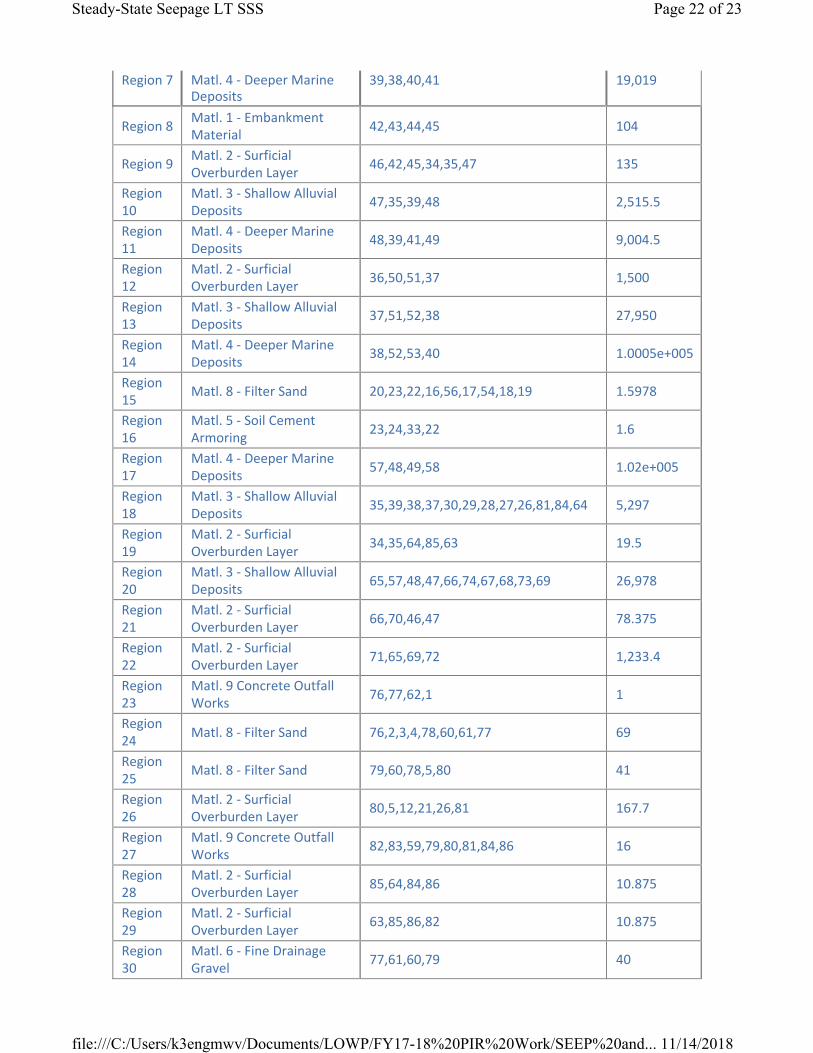
Region 7 Matl. 4 ‐ Deeper Marine Deposits
39,38,40,41 19,019
Region 8 Matl. 1 ‐ Embankment Material
42,43,44,45 104
Region 9 Matl. 2 ‐ Surficial Overburden Layer
46,42,45,34,35,47 135
Region Matl. 3 ‐ Shallow Alluvial Deposits
47,35,39,48 2,515.5
Region 11
Matl. 4 ‐ Deeper Marine Deposits
48,39,41,49 9,004.5
Region 12
Matl. 2 ‐ Surficial Overburden Layer
36,50,51,37 1,500
Region 13
Matl. 3 ‐ Shallow Alluvial Deposits
37,51,52,38 27,950
Region 14
Matl. 4 ‐ Deeper Marine Deposits
38,52,53,40 1.0005e+005
Region Matl. 8 ‐ Filter Sand 20,23,22,16,56,17,54,18,19 1.5978
Region 16
Matl. 5 ‐ Soil Cement Armoring
23,24,33,22 1.6
Region 17
Matl. 4 ‐ Deeper Marine Deposits
57,48,49,58 1.02e+005
Region 18
Matl. 3 ‐ Shallow Alluvial Deposits
35,39,38,37,30,29,28,27,26,81,84,64 5,297
Region 19
Matl. 2 ‐ Surficial Overburden Layer
34,35,64,85,63 19.5
Region Matl. 3 ‐ Shallow Alluvial Deposits
65,57,48,47,66,74,67,68,73,69 26,978
Region 21
Matl. 2 ‐ Surficial Overburden Layer
66,70,46,47 78.375
Region 22
Matl. 2 ‐ Surficial Overburden Layer
71,65,69,72 1,233.4
Region 23
Matl. 9 Concrete Outfall Works
76,77,62,1 1
Region 24
Matl. 8 ‐ Filter Sand 76,2,3,4,78,60,61,77 69
Region Matl. 8 ‐ Filter Sand 79,60,78,5,80 41
Region 26
Matl. 2 ‐ Surficial Overburden Layer
80,5,12,21,26,81 167.7
Region 27
Matl. 9 Concrete Outfall Works
82,83,59,79,80,81,84,86 16
Region 28
Matl. 2 ‐ Surficial Overburden Layer
85,64,84,86 10.875
Region 29
Matl. 2 ‐ Surficial Overburden Layer
63,85,86,82 10.875
Region Matl. 6 ‐ Fine Drainage Gravel
77,61,60,79 40
Steady-State Seepage LT SSS Page 23 of 23
file:///C:/Users/k3engmwv/Documents/LOWP/FY17-18%20PIR%20Work/SEEP%20and... 11/14/2018
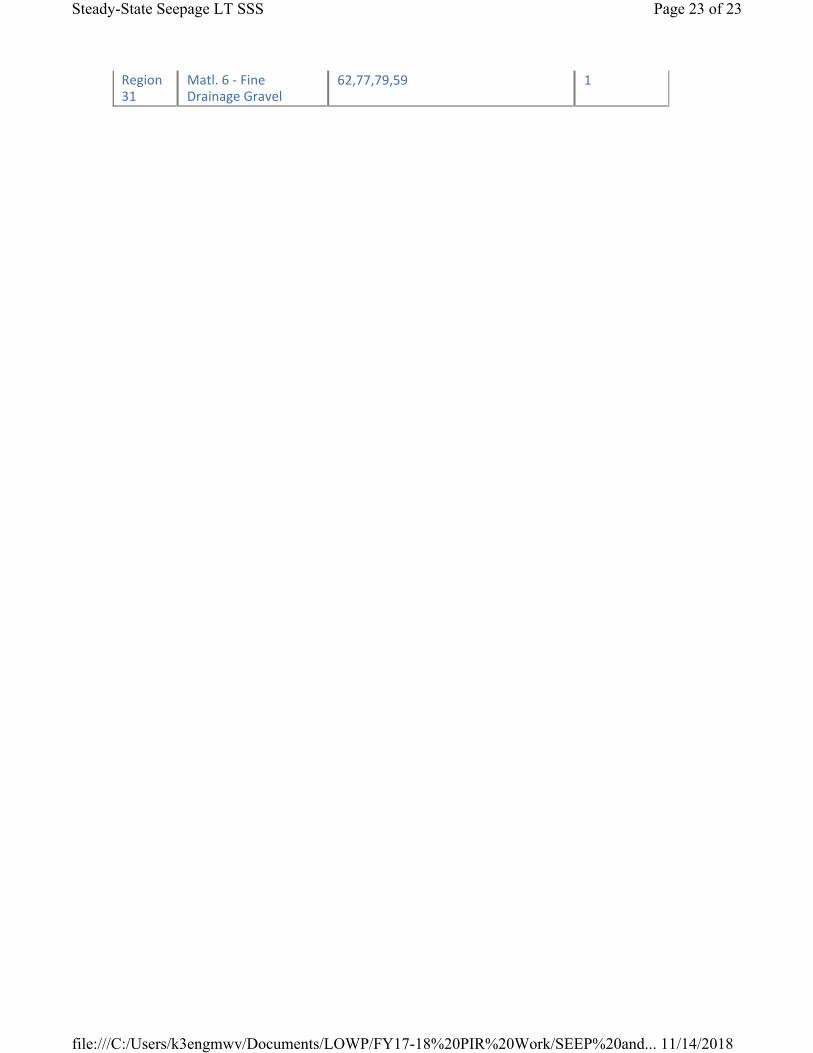
Region 31
Matl. 6 ‐ Fine Drainage Gravel
62,77,79,59 1

Steady-State Seepage (EOC) Page 1 of 23
Steady‐State Seepage (EOC) Report generated using GeoStudio 2012. Copyright © 1991‐2013 GEO‐SLOPE International Ltd.
File Information Title: LOWP PIR Analysis Section B Created By: Viessman, Michael W CIV USARMY CESAJ (US) Last Edited By: Viessman, Michael W CIV USARMY CESAJ (US) Revision Number: 594 File Version: 8.2 Tool Version: 8.12.3.7901 Date: 8/27/2018 Time: 10:31:26 AM File Name: Section B EOC USP w toe drain.gsz Directory: C:\Users\k3engmwv\Documents\LOWP\FY17‐18 PIR Work\SEEP and SLOPEW Files\
Project Settings Length(L) Units: feet Time(t) Units: Seconds Force(F) Units: lbf Pressure(p) Units: psf Mass(M) Units: lbs Mass Flux Units: lbs/sec Unit Weight of Water: 62.4 pcf View: 2D Element Thickness: 1
Analysis Settings
Steady‐State Seepage (EOC) Description: No U/S pool, toe drain, canal at wse 13ft Kind: SEEP/W Method: Steady‐State Settings
Include Air Flow: No Control
Apply Runoff: Yes Convergence
Maximum Number of Iterations: 1,000 Minimum Pressure Head Difference: 0.005 Significant Digits: 2 Max # of Reviews: 10 Hydraulic Under‐Relaxation Criteria
Under‐Relaxation Initial Rate: 1 Under‐Relaxation Min. Rate: 0.1
file:///C:/Users/k3engmwv/Documents/LOWP/FY17-18%20PIR%20Work/SEEP%20and... 11/14/2018
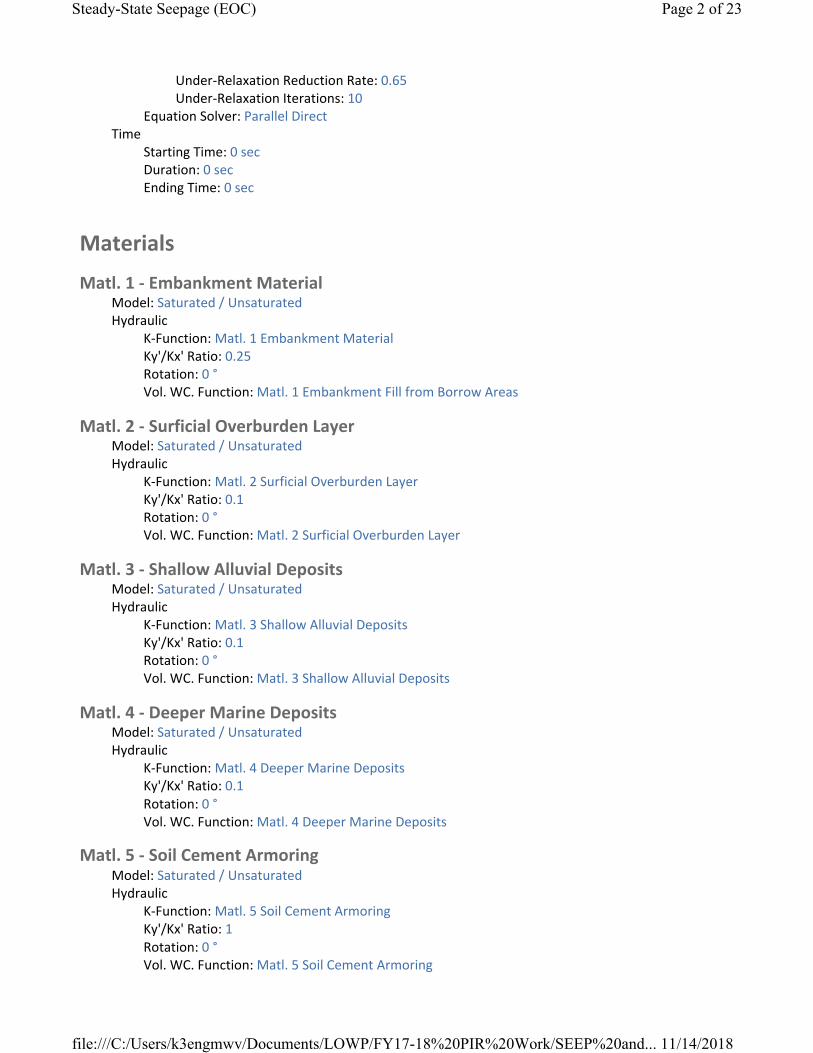
Steady-State Seepage (EOC) Page 2 of 23
Under‐Relaxation Reduction Rate: 0.65 Under‐Relaxation Iterations: 10
Equation Solver: Parallel Direct Time
Starting Time: 0 sec Duration: 0 sec Ending Time: 0 sec
Materials
Matl. 1 ‐ Embankment Material Model: Saturated / Unsaturated Hydraulic
K‐Function: Matl. 1 Embankment Material Ky'/Kx' Ratio: 0.25 Rotation: 0 ° Vol. WC. Function: Matl. 1 Embankment Fill from Borrow Areas
Matl. 2 ‐ Surficial Overburden Layer Model: Saturated / Unsaturated Hydraulic
K‐Function: Matl. 2 Surficial Overburden Layer Ky'/Kx' Ratio: 0.1 Rotation: 0 ° Vol. WC. Function: Matl. 2 Surficial Overburden Layer
Matl. 3 ‐ Shallow Alluvial Deposits Model: Saturated / Unsaturated Hydraulic
K‐Function: Matl. 3 Shallow Alluvial Deposits Ky'/Kx' Ratio: 0.1 Rotation: 0 ° Vol. WC. Function: Matl. 3 Shallow Alluvial Deposits
Matl. 4 ‐ Deeper Marine Deposits Model: Saturated / Unsaturated Hydraulic
K‐Function: Matl. 4 Deeper Marine Deposits Ky'/Kx' Ratio: 0.1 Rotation: 0 ° Vol. WC. Function: Matl. 4 Deeper Marine Deposits
Matl. 5 ‐ Soil Cement Armoring Model: Saturated / Unsaturated Hydraulic
K‐Function: Matl. 5 Soil Cement Armoring Ky'/Kx' Ratio: 1 Rotation: 0 ° Vol. WC. Function: Matl. 5 Soil Cement Armoring
file:///C:/Users/k3engmwv/Documents/LOWP/FY17-18%20PIR%20Work/SEEP%20and... 11/14/2018
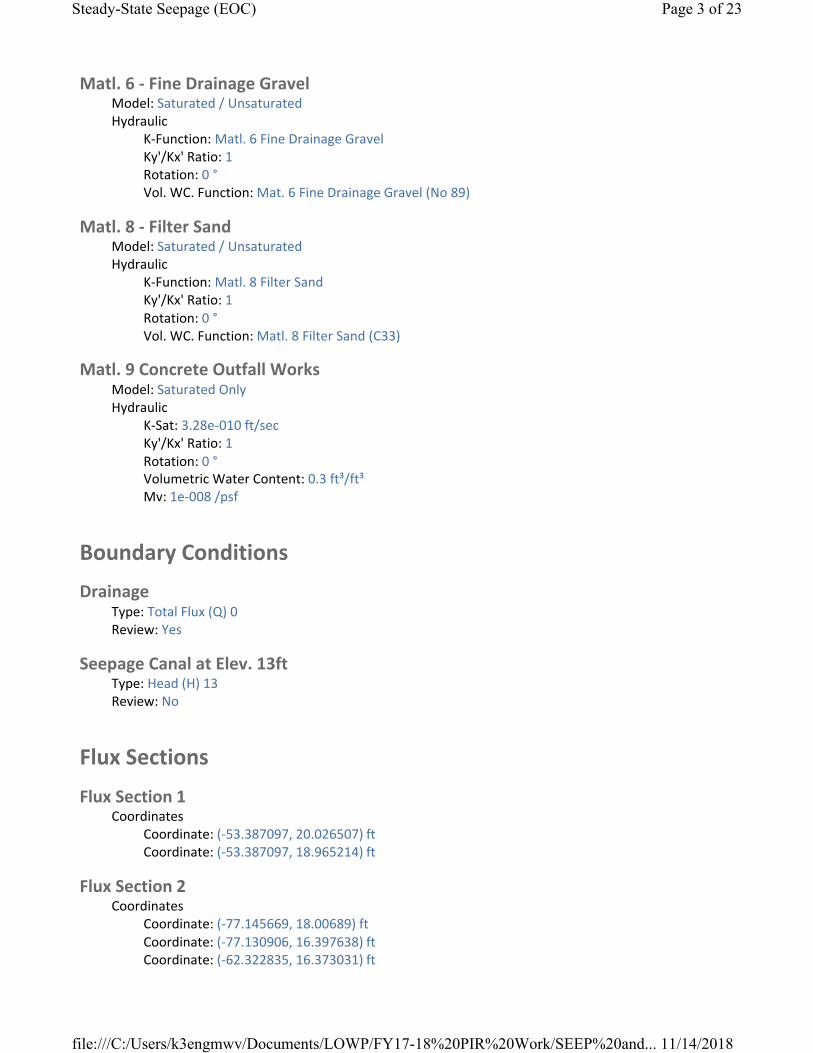
Steady-State Seepage (EOC) Page 3 of 23
Matl. 6 ‐ Fine Drainage Gravel Model: Saturated / Unsaturated Hydraulic
K‐Function: Matl. 6 Fine Drainage Gravel Ky'/Kx' Ratio: 1 Rotation: 0 ° Vol. WC. Function: Mat. 6 Fine Drainage Gravel (No 89)
Matl. 8 ‐ Filter Sand Model: Saturated / Unsaturated Hydraulic
K‐Function: Matl. 8 Filter Sand Ky'/Kx' Ratio: 1 Rotation: 0 ° Vol. WC. Function: Matl. 8 Filter Sand (C33)
Matl. 9 Concrete Outfall Works Model: Saturated Only Hydraulic
K‐Sat: 3.28e‐010 ft/sec Ky'/Kx' Ratio: 1 Rotation: 0 ° Volumetric Water Content: 0.3 ft³/ft³ Mv: 1e‐008 /psf
Boundary Conditions
Drainage Type: Total Flux (Q) 0 Review: Yes
Seepage Canal at Elev. 13ft Type: Head (H) 13 Review: No
Flux Sections
Flux Section 1 Coordinates
Coordinate: (‐53.387097, 20.026507) ft Coordinate: (‐53.387097, 18.965214) ft
Flux Section 2 Coordinates
Coordinate: (‐77.145669, 18.00689) ft Coordinate: (‐77.130906, 16.397638) ft Coordinate: (‐62.322835, 16.373031) ft
file:///C:/Users/k3engmwv/Documents/LOWP/FY17-18%20PIR%20Work/SEEP%20and... 11/14/2018

Steady-State Seepage (EOC) Page 4 of 23
Coordinate: (‐62.322835, 16.63878) ft
Flux Section 3 Coordinates
Coordinate: (0, 36.6) ft Coordinate: (0, ‐112.3) ft
Flux Section 4 Coordinates
Coordinate: (‐382.8, 18.2) ft Coordinate: (‐319.7, ‐3.4) ft Coordinate: (‐289.2, ‐3.3) ft Coordinate: (‐228.6, 17.7) ft
Flux Section 5 Coordinates
Coordinate: (‐399.8, 18) ft Coordinate: (‐400.1, ‐112.4) ft
K Functions
Matl. 1 Embankment Material Model: Hyd K Data Point Function Function: X‐Conductivity vs. Pore‐Water Pressure
Curve Fit to Data: 100 % Segment Curvature: 36 %
K‐Saturation: 0.000131 Data Points: Matric Suction (psf), X‐Conductivity (ft/sec)
Data Point: (0.01, 0.000131) Data Point: (0.018329807, 0.00013099927) Data Point: (0.033598183, 0.00013099852) Data Point: (0.061584821, 0.00013099772) Data Point: (0.11288379, 0.00013099684) Data Point: (0.20691381, 0.00013099581) Data Point: (0.37926902, 0.0001309945) Data Point: (0.6951928, 0.00013099268) Data Point: (1.274275, 0.00013098992) Data Point: (2.3357215, 0.00013098549) Data Point: (4.2813324, 0.0001309777) Data Point: (7.8475997, 0.00013096339) Data Point: (14.384499, 0.00013094955) Data Point: (26.366509, 0.00013089452) Data Point: (48.329302, 0.00013043835) Data Point: (88.586679, 0.00012910123) Data Point: (162.37767, 5.664247e‐005) Data Point: (297.63514, 2.5159921e‐006) Data Point: (545.55948, 4.7485927e‐008) Data Point: (1,000, 1.7886028e‐009)
Estimation Properties
file:///C:/Users/k3engmwv/Documents/LOWP/FY17-18%20PIR%20Work/SEEP%20and... 11/14/2018
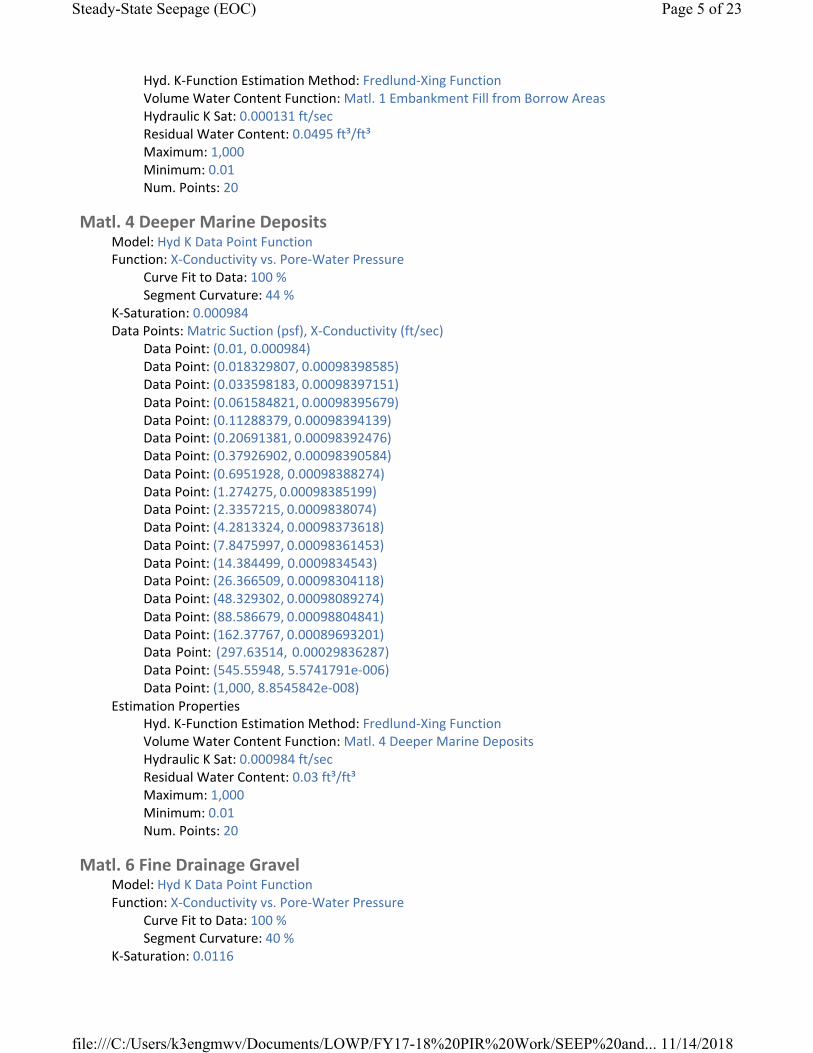
Steady-State Seepage (EOC) Page 5 of 23
Hyd. K‐Function Estimation Method: Fredlund‐Xing Function Volume Water Content Function: Matl. 1 Embankment Fill from Borrow Areas Hydraulic K Sat: 0.000131 ft/sec Residual Water Content: 0.0495 ft³/ft³ Maximum: 1,000 Minimum: 0.01 Num. Points: 20
Matl. 4 Deeper Marine Deposits Model: Hyd K Data Point Function Function: X‐Conductivity vs. Pore‐Water Pressure
Curve Fit to Data: 100 % Segment Curvature: 44 %
K‐Saturation: 0.000984 Data Points: Matric Suction (psf), X‐Conductivity (ft/sec)
Data Point: (0.01, 0.000984) Data Point: (0.018329807, 0.00098398585) Data Point: (0.033598183, 0.00098397151) Data Point: (0.061584821, 0.00098395679) Data Point: (0.11288379, 0.00098394139) Data Point: (0.20691381, 0.00098392476) Data Point: (0.37926902, 0.00098390584) Data Point: (0.6951928, 0.00098388274) Data Point: (1.274275, 0.00098385199) Data Point: (2.3357215, 0.0009838074) Data Point: (4.2813324, 0.00098373618) Data Point: (7.8475997, 0.00098361453) Data Point: (14.384499, 0.0009834543) Data Point: (26.366509, 0.00098304118) Data Point: (48.329302, 0.00098089274) Data Point: (88.586679, 0.00098804841) Data Point: (162.37767, 0.00089693201) Data Point: (297.63514, 0.00029836287) Data Point: (545.55948, 5.5741791e‐006) Data Point: (1,000, 8.8545842e‐008)
Estimation Properties Hyd. K‐Function Estimation Method: Fredlund‐Xing Function Volume Water Content Function: Matl. 4 Deeper Marine Deposits Hydraulic K Sat: 0.000984 ft/sec Residual Water Content: 0.03 ft³/ft³ Maximum: 1,000 Minimum: 0.01 Num. Points: 20
Matl. 6 Fine Drainage Gravel Model: Hyd K Data Point Function Function: X‐Conductivity vs. Pore‐Water Pressure
Curve Fit to Data: 100 % Segment Curvature: 40 %
K‐Saturation: 0.0116
file:///C:/Users/k3engmwv/Documents/LOWP/FY17-18%20PIR%20Work/SEEP%20and... 11/14/2018

Steady-State Seepage (EOC) Page 6 of 23
Data Points: Matric Suction (psf), X‐Conductivity (ft/sec) Data Point: (0.01, 0.0116) Data Point: (0.018329807, 0.011599999) Data Point: (0.033598183, 0.011599999) Data Point: (0.061584821, 0.011599997) Data Point: (0.11288379, 0.011599992) Data Point: (0.20691381, 0.011599991) Data Point: (0.37926902, 0.011600028) Data Point: (0.6951928, 0.011599657) Data Point: (1.274275, 0.011599409) Data Point: (2.3357215, 0.011606742) Data Point: (4.2813324, 0.01023118) Data Point: (7.8475997, 0.0019666911) Data Point: (14.384499, 3.3083667e‐005) Data Point: (26.366509, 3.5079262e‐007) Data Point: (48.329302, 1.0209264e‐008) Data Point: (88.586679, 1.7809046e‐009) Data Point: (162.37767, 3.7872508e‐010) Data Point: (297.63514, 7.9282799e‐011) Data Point: (545.55948, 1.3312429e‐011) Data Point: (1,000, 1.2335483e‐012)
Estimation Properties Hyd. K‐Function Estimation Method: Fredlund‐Xing Function Volume Water Content Function: Mat. 6 Fine Drainage Gravel (No 89) Hydraulic K Sat: 0.0116 ft/sec Residual Water Content: 0.042 ft³/ft³ Maximum: 1,000 Minimum: 0.01 Num. Points: 20
Matl. 2 Surficial Overburden Layer Model: Hyd K Data Point Function Function: X‐Conductivity vs. Pore‐Water Pressure
Curve Fit to Data: 100 % Segment Curvature: 36 %
K‐Saturation: 0.00026 Data Points: Matric Suction (psf), X‐Conductivity (ft/sec)
Data Point: (0.01, 0.00026) Data Point: (0.018329807, 0.00025999835) Data Point: (0.033598183, 0.00025999664) Data Point: (0.061584821, 0.00025999485) Data Point: (0.11288379, 0.00025999288) Data Point: (0.20691381, 0.00025999062) Data Point: (0.37926902, 0.00025998779) Data Point: (0.6951928, 0.00025998393) Data Point: (1.274275, 0.00025997819) Data Point: (2.3357215, 0.00025996907) Data Point: (4.2813324, 0.00025995329) Data Point: (7.8475997, 0.00025992467) Data Point: (14.384499, 0.00025989276)
file:///C:/Users/k3engmwv/Documents/LOWP/FY17-18%20PIR%20Work/SEEP%20and... 11/14/2018
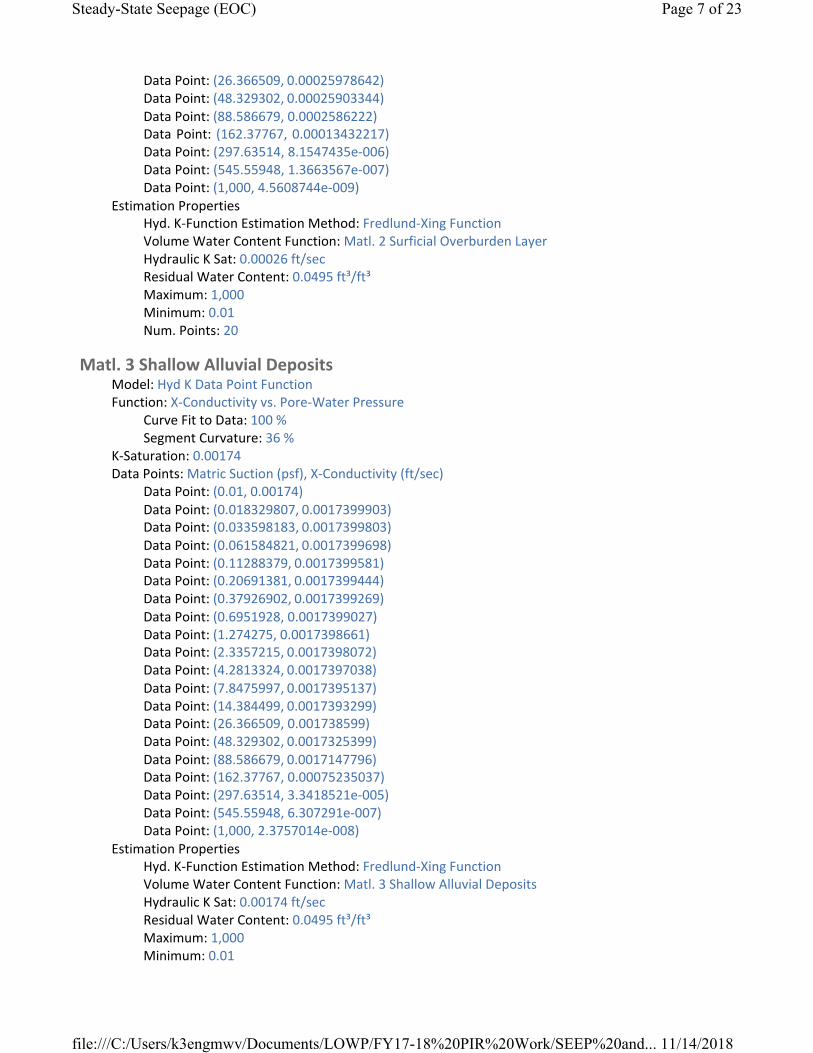
Steady-State Seepage (EOC) Page 7 of 23
Data Point: (26.366509, 0.00025978642) Data Point: (48.329302, 0.00025903344) Data Point: (88.586679, 0.0002586222) Data Point: (162.37767, 0.00013432217) Data Point: (297.63514, 8.1547435e‐006) Data Point: (545.55948, 1.3663567e‐007) Data Point: (1,000, 4.5608744e‐009)
Estimation Properties Hyd. K‐Function Estimation Method: Fredlund‐Xing Function Volume Water Content Function: Matl. 2 Surficial Overburden Layer Hydraulic K Sat: 0.00026 ft/sec Residual Water Content: 0.0495 ft³/ft³ Maximum: 1,000 Minimum: 0.01 Num. Points: 20
Matl. 3 Shallow Alluvial Deposits Model: Hyd K Data Point Function Function: X‐Conductivity vs. Pore‐Water Pressure
Curve Fit to Data: 100 % Segment Curvature: 36 %
K‐Saturation: 0.00174 Data Points: Matric Suction (psf), X‐Conductivity (ft/sec)
Data Point: (0.01, 0.00174) Data Point: (0.018329807, 0.0017399903) Data Point: (0.033598183, 0.0017399803) Data Point: (0.061584821, 0.0017399698) Data Point: (0.11288379, 0.0017399581) Data Point: (0.20691381, 0.0017399444) Data Point: (0.37926902, 0.0017399269) Data Point: (0.6951928, 0.0017399027) Data Point: (1.274275, 0.0017398661) Data Point: (2.3357215, 0.0017398072) Data Point: (4.2813324, 0.0017397038) Data Point: (7.8475997, 0.0017395137) Data Point: (14.384499, 0.0017393299) Data Point: (26.366509, 0.001738599) Data Point: (48.329302, 0.0017325399) Data Point: (88.586679, 0.0017147796) Data Point: (162.37767, 0.00075235037) Data Point: (297.63514, 3.3418521e‐005) Data Point: (545.55948, 6.307291e‐007) Data Point: (1,000, 2.3757014e‐008)
Estimation Properties Hyd. K‐Function Estimation Method: Fredlund‐Xing Function Volume Water Content Function: Matl. 3 Shallow Alluvial Deposits Hydraulic K Sat: 0.00174 ft/sec Residual Water Content: 0.0495 ft³/ft³ Maximum: 1,000 Minimum: 0.01
file:///C:/Users/k3engmwv/Documents/LOWP/FY17-18%20PIR%20Work/SEEP%20and... 11/14/2018
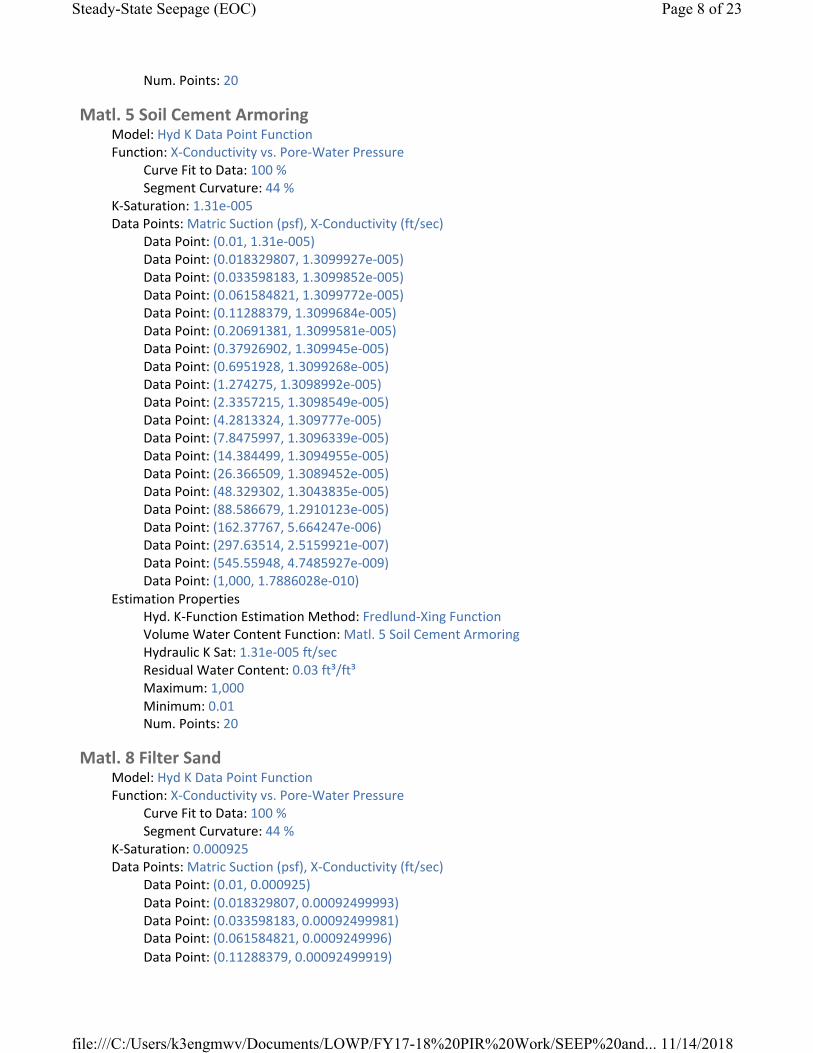
Steady-State Seepage (EOC) Page 8 of 23
Num. Points: 20
Matl. 5 Soil Cement Armoring Model: Hyd K Data Point Function Function: X‐Conductivity vs. Pore‐Water Pressure
Curve Fit to Data: 100 % Segment Curvature: 44 %
K‐Saturation: 1.31e‐005 Data Points: Matric Suction (psf), X‐Conductivity (ft/sec)
Data Point: (0.01, 1.31e‐005) Data Point: (0.018329807, 1.3099927e‐005) Data Point: (0.033598183, 1.3099852e‐005) Data Point: (0.061584821, 1.3099772e‐005) Data Point: (0.11288379, 1.3099684e‐005) Data Point: (0.20691381, 1.3099581e‐005) Data Point: (0.37926902, 1.309945e‐005) Data Point: (0.6951928, 1.3099268e‐005) Data Point: (1.274275, 1.3098992e‐005) Data Point: (2.3357215, 1.3098549e‐005) Data Point: (4.2813324, 1.309777e‐005) Data Point: (7.8475997, 1.3096339e‐005) Data Point: (14.384499, 1.3094955e‐005) Data Point: (26.366509, 1.3089452e‐005) Data Point: (48.329302, 1.3043835e‐005) Data Point: (88.586679, 1.2910123e‐005) Data Point: (162.37767, 5.664247e‐006) Data Point: (297.63514, 2.5159921e‐007) Data Point: (545.55948, 4.7485927e‐009) Data Point: (1,000, 1.7886028e‐010)
Estimation Properties Hyd. K‐Function Estimation Method: Fredlund‐Xing Function Volume Water Content Function: Matl. 5 Soil Cement Armoring Hydraulic K Sat: 1.31e‐005 ft/sec Residual Water Content: 0.03 ft³/ft³ Maximum: 1,000 Minimum: 0.01 Num. Points: 20
Matl. 8 Filter Sand Model: Hyd K Data Point Function Function: X‐Conductivity vs. Pore‐Water Pressure
Curve Fit to Data: 100 % Segment Curvature: 44 %
K‐Saturation: 0.000925 Data Points: Matric Suction (psf), X‐Conductivity (ft/sec)
Data Point: (0.01, 0.000925) Data Point: (0.018329807, 0.00092499993) Data Point: (0.033598183, 0.00092499981) Data Point: (0.061584821, 0.0009249996) Data Point: (0.11288379, 0.00092499919)
file:///C:/Users/k3engmwv/Documents/LOWP/FY17-18%20PIR%20Work/SEEP%20and... 11/14/2018

Steady-State Seepage (EOC) Page 9 of 23
Data Point: (0.20691381, 0.00092499854) Data Point: (0.37926902, 0.00092499785) Data Point: (0.6951928, 0.00092499117) Data Point: (1.274275, 0.00092498427) Data Point: (2.3357215, 0.00092515575) Data Point: (4.2813324, 0.00092444336) Data Point: (7.8475997, 0.00092025484) Data Point: (14.384499, 0.00086768248) Data Point: (26.366509, 0.00022215817) Data Point: (48.329302, 5.6149022e‐006) Data Point: (88.586679, 9.4931606e‐008) Data Point: (162.37767, 4.4270536e‐009) Data Point: (297.63514, 6.3580973e‐010) Data Point: (545.55948, 1.1244323e‐010) Data Point: (1,000, 1.0762229e‐011)
Estimation Properties Hyd. K‐Function Estimation Method: Fredlund‐Xing Function Volume Water Content Function: Matl. 8 Filter Sand (C33) Hydraulic K Sat: 0.000925 ft/sec Residual Water Content: 0.03 ft³/ft³ Maximum: 1,000 Minimum: 0.01 Num. Points: 20
Vol. Water Content Functions
Matl. 3 Shallow Alluvial Deposits Model: Vol WC Data Point Function Function: Vol. Water Content vs. Pore‐Water Pressure
Mv: 2.5e‐006 /psf Saturated Water Content: 0.30020276 ft³/ft³ Residual Water Content: 0.030020276 ft³/ft³ Curve Fit to Data: 100 % Segment Curvature: 40 %
Porosity: 0.30020276 Data Points: Matric Suction (psf), Vol. Water Content (ft³/ft³)
Data Point: (0.01, 0.29987196) Data Point: (0.018329807, 0.29987196) Data Point: (0.033598183, 0.29987196) Data Point: (0.061584821, 0.29987196) Data Point: (0.11288379, 0.29987196) Data Point: (0.20691381, 0.29987196) Data Point: (0.37926902, 0.29987196) Data Point: (0.6951928, 0.29987196) Data Point: (1.274275, 0.29987196) Data Point: (2.3357215, 0.29987196) Data Point: (4.2813324, 0.29987196) Data Point: (7.8475997, 0.29987196) Data Point: (14.384499, 0.29987196)
file:///C:/Users/k3engmwv/Documents/LOWP/FY17-18%20PIR%20Work/SEEP%20and... 11/14/2018
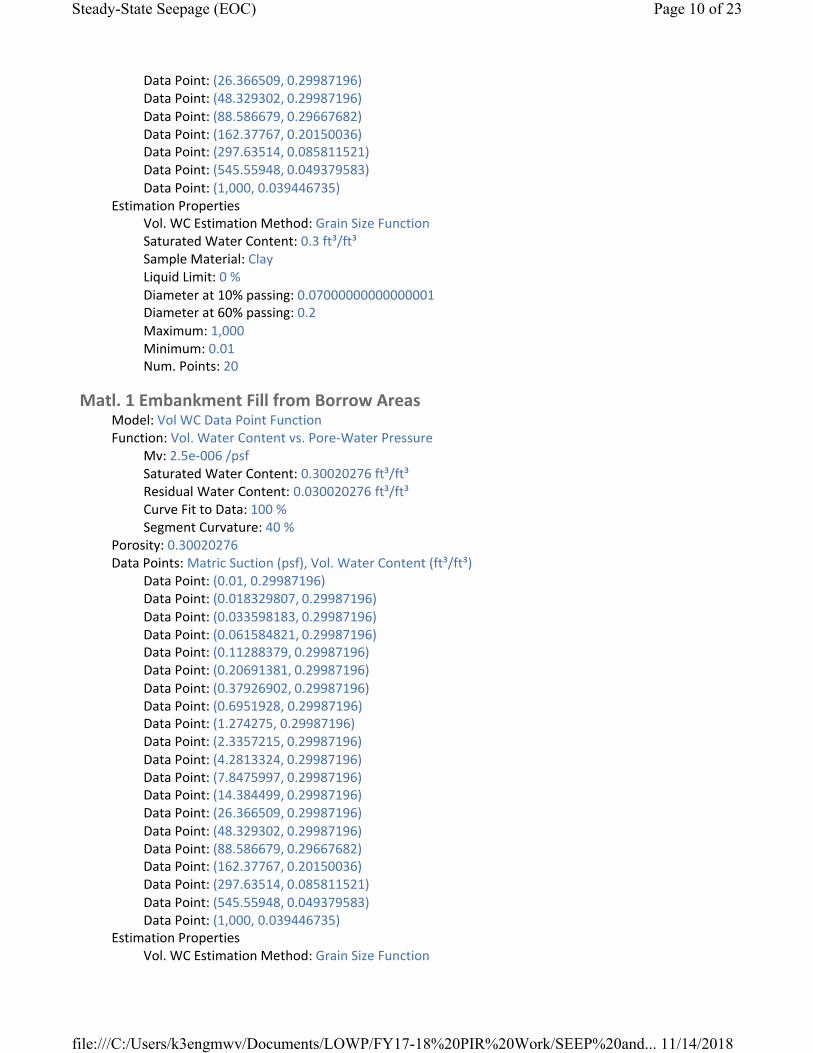
Steady-State Seepage (EOC) Page 10 of 23
Data Point: (26.366509, 0.29987196) Data Point: (48.329302, 0.29987196) Data Point: (88.586679, 0.29667682) Data Point: (162.37767, 0.20150036) Data Point: (297.63514, 0.085811521) Data Point: (545.55948, 0.049379583) Data Point: (1,000, 0.039446735)
Estimation Properties Vol. WC Estimation Method: Grain Size Function Saturated Water Content: 0.3 ft³/ft³ Sample Material: Clay Liquid Limit: 0 % Diameter at 10% passing: 0.07000000000000001 Diameter at 60% passing: 0.2 Maximum: 1,000 Minimum: 0.01 Num. Points: 20
Matl. 1 Embankment Fill from Borrow Areas Model: Vol WC Data Point Function Function: Vol. Water Content vs. Pore‐Water Pressure
Mv: 2.5e‐006 /psf Saturated Water Content: 0.30020276 ft³/ft³ Residual Water Content: 0.030020276 ft³/ft³ Curve Fit to Data: 100 % Segment Curvature: 40 %
Porosity: 0.30020276 Data Points: Matric Suction (psf), Vol. Water Content (ft³/ft³)
Data Point: (0.01, 0.29987196) Data Point: (0.018329807, 0.29987196) Data Point: (0.033598183, 0.29987196) Data Point: (0.061584821, 0.29987196) Data Point: (0.11288379, 0.29987196) Data Point: (0.20691381, 0.29987196) Data Point: (0.37926902, 0.29987196) Data Point: (0.6951928, 0.29987196) Data Point: (1.274275, 0.29987196) Data Point: (2.3357215, 0.29987196) Data Point: (4.2813324, 0.29987196) Data Point: (7.8475997, 0.29987196) Data Point: (14.384499, 0.29987196) Data Point: (26.366509, 0.29987196) Data Point: (48.329302, 0.29987196) Data Point: (88.586679, 0.29667682) Data Point: (162.37767, 0.20150036) Data Point: (297.63514, 0.085811521) Data Point: (545.55948, 0.049379583) Data Point: (1,000, 0.039446735)
Estimation Properties Vol. WC Estimation Method: Grain Size Function
file:///C:/Users/k3engmwv/Documents/LOWP/FY17-18%20PIR%20Work/SEEP%20and... 11/14/2018
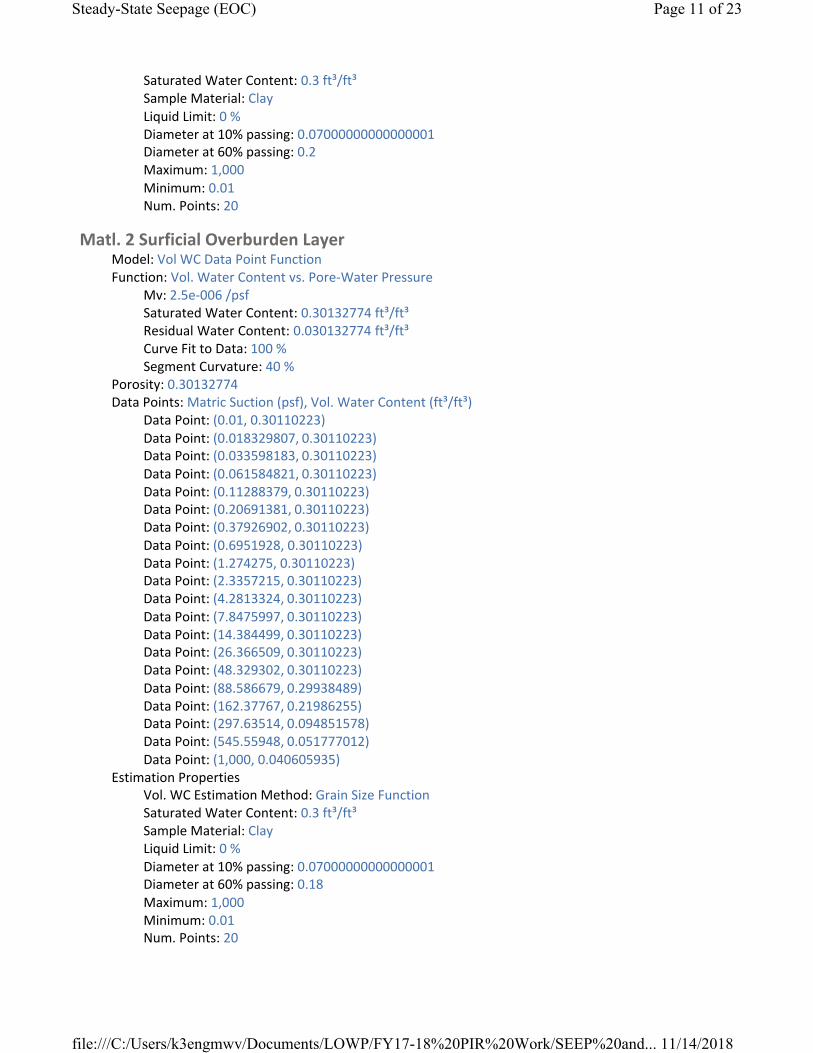
Steady-State Seepage (EOC) Page 11 of 23
Saturated Water Content: 0.3 ft³/ft³ Sample Material: Clay Liquid Limit: 0 % Diameter at 10% passing: 0.07000000000000001 Diameter at 60% passing: 0.2 Maximum: 1,000 Minimum: 0.01 Num. Points: 20
Matl. 2 Surficial Overburden Layer Model: Vol WC Data Point Function Function: Vol. Water Content vs. Pore‐Water Pressure
Mv: 2.5e‐006 /psf Saturated Water Content: 0.30132774 ft³/ft³ Residual Water Content: 0.030132774 ft³/ft³ Curve Fit to Data: 100 % Segment Curvature: 40 %
Porosity: 0.30132774 Data Points: Matric Suction (psf), Vol. Water Content (ft³/ft³)
Data Point: (0.01, 0.30110223) Data Point: (0.018329807, 0.30110223) Data Point: (0.033598183, 0.30110223) Data Point: (0.061584821, 0.30110223) Data Point: (0.11288379, 0.30110223) Data Point: (0.20691381, 0.30110223) Data Point: (0.37926902, 0.30110223) Data Point: (0.6951928, 0.30110223) Data Point: (1.274275, 0.30110223) Data Point: (2.3357215, 0.30110223) Data Point: (4.2813324, 0.30110223) Data Point: (7.8475997, 0.30110223) Data Point: (14.384499, 0.30110223) Data Point: (26.366509, 0.30110223) Data Point: (48.329302, 0.30110223) Data Point: (88.586679, 0.29938489) Data Point: (162.37767, 0.21986255) Data Point: (297.63514, 0.094851578) Data Point: (545.55948, 0.051777012) Data Point: (1,000, 0.040605935)
Estimation Properties Vol. WC Estimation Method: Grain Size Function Saturated Water Content: 0.3 ft³/ft³ Sample Material: Clay Liquid Limit: 0 % Diameter at 10% passing: 0.07000000000000001 Diameter at 60% passing: 0.18 Maximum: 1,000 Minimum: 0.01 Num. Points: 20
file:///C:/Users/k3engmwv/Documents/LOWP/FY17-18%20PIR%20Work/SEEP%20and... 11/14/2018

Steady-State Seepage (EOC) Page 12 of 23
Matl. 8 Filter Sand (C33) Model: Vol WC Data Point Function Function: Vol. Water Content vs. Pore‐Water Pressure
Mv: 8e‐007 /psf Saturated Water Content: 0.30081752 ft³/ft³ Residual Water Content: 0.030081752 ft³/ft³ Curve Fit to Data: 100 % Segment Curvature: 48 %
Porosity: 0.30081752 Data Points: Matric Suction (psf), Vol. Water Content (ft³/ft³)
Data Point: (0.01, 0.30028388) Data Point: (0.018329807, 0.30028388) Data Point: (0.033598183, 0.30028388) Data Point: (0.061584821, 0.30028388) Data Point: (0.11288379, 0.30028388) Data Point: (0.20691381, 0.30028388) Data Point: (0.37926902, 0.30028388) Data Point: (0.6951928, 0.30028388) Data Point: (1.274275, 0.30028388) Data Point: (2.3357215, 0.30028388) Data Point: (4.2813324, 0.30028388) Data Point: (7.8475997, 0.30028388) Data Point: (14.384499, 0.28112842) Data Point: (26.366509, 0.15065712) Data Point: (48.329302, 0.048430554) Data Point: (88.586679, 0.021674388) Data Point: (162.37767, 0.016081301) Data Point: (297.63514, 0.013674367) Data Point: (545.55948, 0.011770874) Data Point: (1,000, 0.010084825)
Estimation Properties Vol. WC Estimation Method: Grain Size Function Saturated Water Content: 0.3 ft³/ft³ Sample Material: Gravel Liquid Limit: 0 % Diameter at 10% passing: 0.38 Diameter at 60% passing: 1.6 Maximum: 1,000 Minimum: 0.01 Num. Points: 20
Mat. 6 Fine Drainage Gravel (No 89) Model: Vol WC Data Point Function Function: Vol. Water Content vs. Pore‐Water Pressure
Mv: 4e‐007 /psf Saturated Water Content: 0.21947752 ft³/ft³ Residual Water Content: 0.021947752 ft³/ft³ Curve Fit to Data: 100 % Segment Curvature: 48 %
Porosity: 0.21947752
file:///C:/Users/k3engmwv/Documents/LOWP/FY17-18%20PIR%20Work/SEEP%20and... 11/14/2018

Steady-State Seepage (EOC) Page 13 of 23
Data Points: Matric Suction (psf), Vol. Water Content (ft³/ft³) Data Point: (0.01, 0.21916427) Data Point: (0.018329807, 0.21916427) Data Point: (0.033598183, 0.21916427) Data Point: (0.061584821, 0.21916427) Data Point: (0.11288379, 0.21916427) Data Point: (0.20691381, 0.21916427) Data Point: (0.37926902, 0.21916427) Data Point: (0.6951928, 0.21916427) Data Point: (1.274275, 0.21916427) Data Point: (2.3357215, 0.21916427) Data Point: (4.2813324, 0.20182012) Data Point: (7.8475997, 0.090949254) Data Point: (14.384499, 0.021737158) Data Point: (26.366509, 0.0080845337) Data Point: (48.329302, 0.0057554944) Data Point: (88.586679, 0.0048689464) Data Point: (162.37767, 0.0041947283) Data Point: (297.63514, 0.0036057207) Data Point: (545.55948, 0.0030872724) Data Point: (1,000, 0.002632805)
Estimation Properties Vol. WC Estimation Method: Grain Size Function Saturated Water Content: 0.21875 ft³/ft³ Sample Material: Clay Liquid Limit: 0 % Diameter at 10% passing: 3.5 Diameter at 60% passing: 7.1 Maximum: 1,000 Minimum: 0.01 Num. Points: 20
Matl. 4 Deeper Marine Deposits Model: Vol WC Data Point Function Function: Vol. Water Content vs. Pore‐Water Pressure
Mv: 2.5e‐006 /psf Saturated Water Content: 0.30154597 ft³/ft³ Residual Water Content: 0.030154597 ft³/ft³ Curve Fit to Data: 100 % Segment Curvature: 40 %
Porosity: 0.30154597 Data Points: Matric Suction (psf), Vol. Water Content (ft³/ft³)
Data Point: (0.01, 0.30100508) Data Point: (0.018329807, 0.30100508) Data Point: (0.033598183, 0.30100508) Data Point: (0.061584821, 0.30100508) Data Point: (0.11288379, 0.30100508) Data Point: (0.20691381, 0.30100508) Data Point: (0.37926902, 0.30100508) Data Point: (0.6951928, 0.30100508)
file:///C:/Users/k3engmwv/Documents/LOWP/FY17-18%20PIR%20Work/SEEP%20and... 11/14/2018
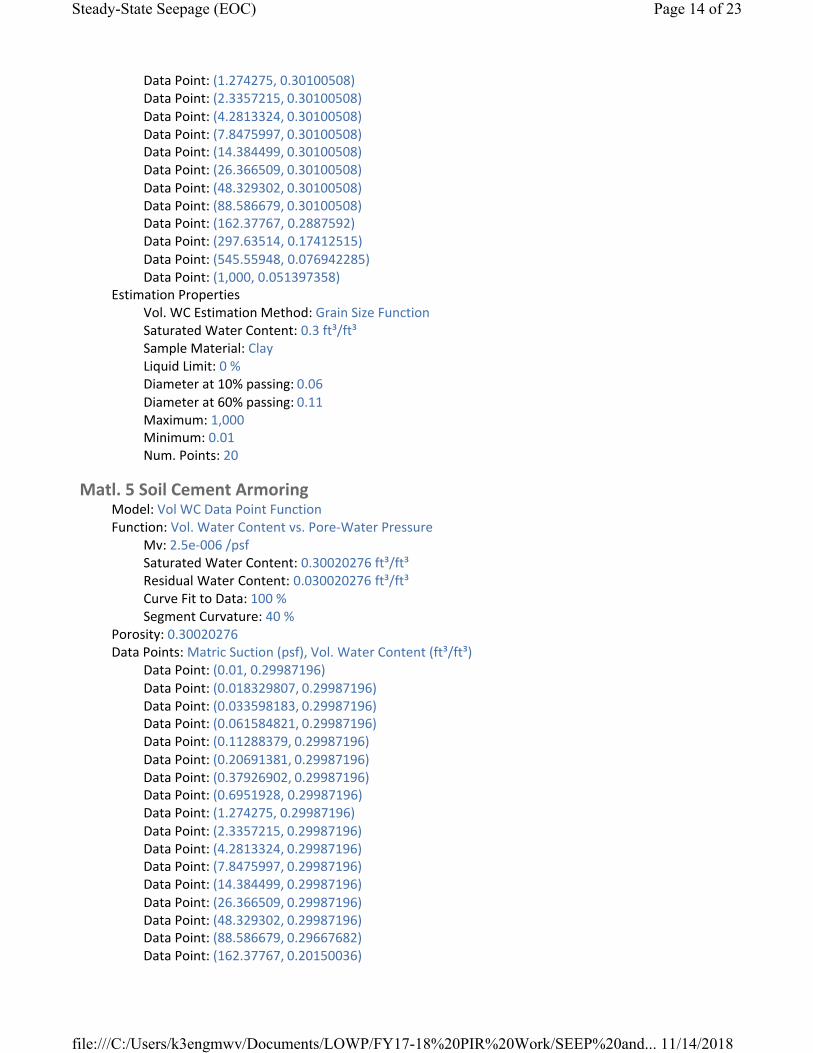
Steady-State Seepage (EOC) Page 14 of 23
Data Point: (1.274275, 0.30100508) Data Point: (2.3357215, 0.30100508) Data Point: (4.2813324, 0.30100508) Data Point: (7.8475997, 0.30100508) Data Point: (14.384499, 0.30100508) Data Point: (26.366509, 0.30100508) Data Point: (48.329302, 0.30100508) Data Point: (88.586679, 0.30100508) Data Point: (162.37767, 0.2887592) Data Point: (297.63514, 0.17412515) Data Point: (545.55948, 0.076942285) Data Point: (1,000, 0.051397358)
Estimation Properties Vol. WC Estimation Method: Grain Size Function Saturated Water Content: 0.3 ft³/ft³ Sample Material: Clay Liquid Limit: 0 % Diameter at 10% passing: 0.06 Diameter at 60% passing: 0.11 Maximum: 1,000 Minimum: 0.01 Num. Points: 20
Matl. 5 Soil Cement Armoring Model: Vol WC Data Point Function Function: Vol. Water Content vs. Pore‐Water Pressure
Mv: 2.5e‐006 /psf Saturated Water Content: 0.30020276 ft³/ft³ Residual Water Content: 0.030020276 ft³/ft³ Curve Fit to Data: 100 % Segment Curvature: 40 %
Porosity: 0.30020276 Data Points: Matric Suction (psf), Vol. Water Content (ft³/ft³)
Data Point: (0.01, 0.29987196) Data Point: (0.018329807, 0.29987196) Data Point: (0.033598183, 0.29987196) Data Point: (0.061584821, 0.29987196) Data Point: (0.11288379, 0.29987196) Data Point: (0.20691381, 0.29987196) Data Point: (0.37926902, 0.29987196) Data Point: (0.6951928, 0.29987196) Data Point: (1.274275, 0.29987196) Data Point: (2.3357215, 0.29987196) Data Point: (4.2813324, 0.29987196) Data Point: (7.8475997, 0.29987196) Data Point: (14.384499, 0.29987196) Data Point: (26.366509, 0.29987196) Data Point: (48.329302, 0.29987196) Data Point: (88.586679, 0.29667682) Data Point: (162.37767, 0.20150036)
file:///C:/Users/k3engmwv/Documents/LOWP/FY17-18%20PIR%20Work/SEEP%20and... 11/14/2018

Steady-State Seepage (EOC) Page 15 of 23
Data Point: (297.63514, 0.085811521) Data Point: (545.55948, 0.049379583) Data Point: (1,000, 0.039446735)
Estimation Properties Vol. WC Estimation Method: Grain Size Function Saturated Water Content: 0.3 ft³/ft³ Sample Material: Clay Liquid Limit: 0 % Diameter at 10% passing: 0.07000000000000001 Diameter at 60% passing: 0.2 Maximum: 1,000 Minimum: 0.01 Num. Points: 20
Points
file:///C:/Users/k3engmwv/Documents/LOWP/FY17-18%20PIR%20Work/SEEP%20and... 11/14/2018
X (ft) Y (ft)
Point 1 ‐53.5 21
Point 2 ‐14.5 21
Point 3 ‐14.5 30
Point 4 ‐11.5 30
Point 5 ‐11.5 18
Point 6 ‐7 36.5
Point 7 ‐7 35.5
Point 8 6.8 35.5
Point 9 14 33 Point 10 13.7 32.1
Point 11 48.6 20.5
Point 12 51.2 18 Point 13 52.0033 19.4828
Point 14 51.9 19.4
Point 15 51.8636 19.2065 Point 16 52.097 19.0075
Point 17 52.3031 19.0832
Point 18 52.3561 19.2916 Point 19 52.3 19.4
Point 20 52.1797 19.4906
Point 21 59.3 18 Point 22 56.3 19
Point 23 54.8 19.5 Point 24 58 19.5
Point 25 7 36.5
Point 26 59.3 16.5 Point 27 67.3 16.5
Point 28 67.3 14.5
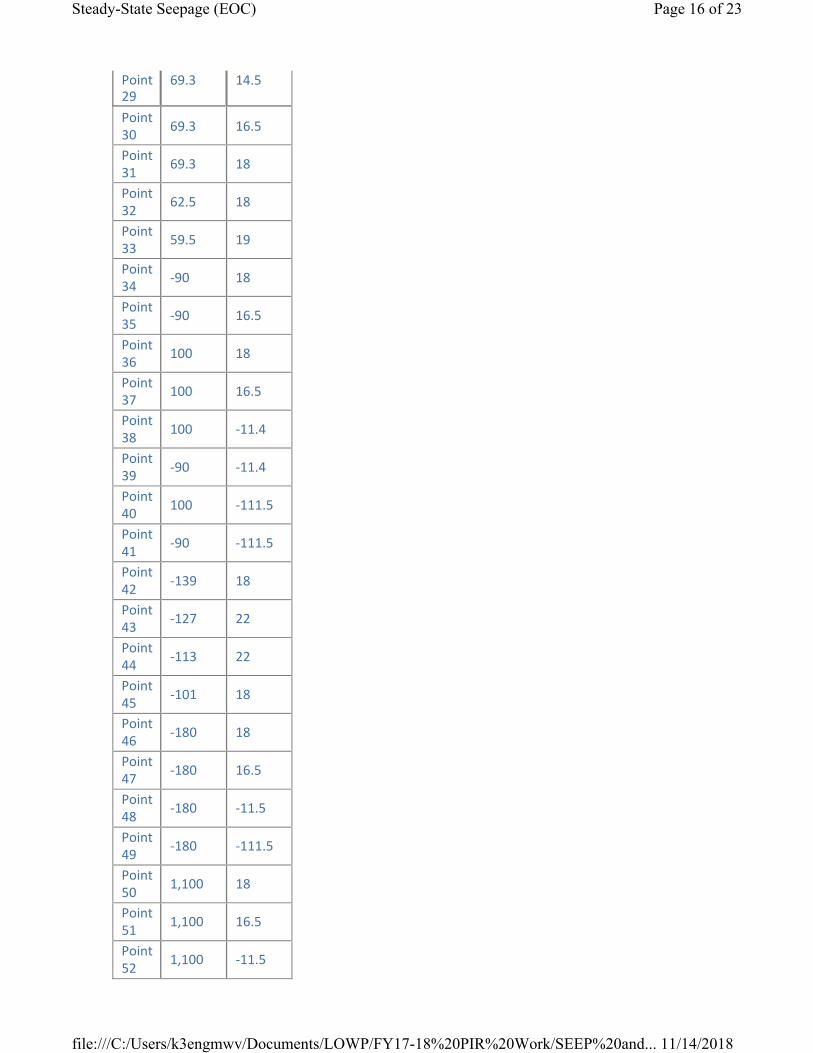
29
30
31
32
33
34
35
36
37
38
39
40
41
42
43
44
45
46
47
48
49
50
51
52
Steady-State Seepage (EOC) Page 16 of 23
file:///C:/Users/k3engmwv/Documents/LOWP/FY17-18%20PIR%20Work/SEEP%20and... 11/14/2018
Point 69.3 14.5
Point 69.3 16.5
Point 69.3 18
Point 62.5 18
Point 59.5 19
Point ‐90 18
Point ‐90 16.5
Point 100 18
Point 100 16.5
Point 100 ‐11.4
Point ‐90 ‐11.4
Point 100 ‐111.5
Point ‐90 ‐111.5
Point ‐139 18
Point ‐127 22
Point ‐113 22
Point ‐101 18
Point ‐180 18
Point ‐180 16.5
Point ‐180 ‐11.5
Point ‐180 ‐111.5
Point 1,100 18
Point 1,100 16.5
Point 1,100 ‐11.5

53
54
55
56
57
58
59
60
61
62
63
64
65
66
67
68
69
70
71
72
73
74
75
76
Steady-State Seepage (EOC) Page 17 of 23
file:///C:/Users/k3engmwv/Documents/LOWP/FY17-18%20PIR%20Work/SEEP%20and... 11/14/2018
Point 1,100 ‐111.5
Point 52.3546 19.1839
Point 51.9487 19.066
Point 52.2227 19.0254
Point ‐1,200 ‐11.5
Point ‐1,200 ‐111.5
Point ‐53.5 19
Point ‐12.5 19
Point ‐12.5 20
Point ‐53.5 20
Point ‐77 18
Point ‐77 16.5
Point ‐1,200 16.5
Point ‐234.5 16.5
Point ‐290 ‐2
Point ‐320 ‐2
Point ‐375.5 16.5
Point ‐230 18
Point ‐1,200 18
Point ‐380 18
Point ‐365 13
Point ‐245 13
Point 41.5 25
Point ‐52.5 21
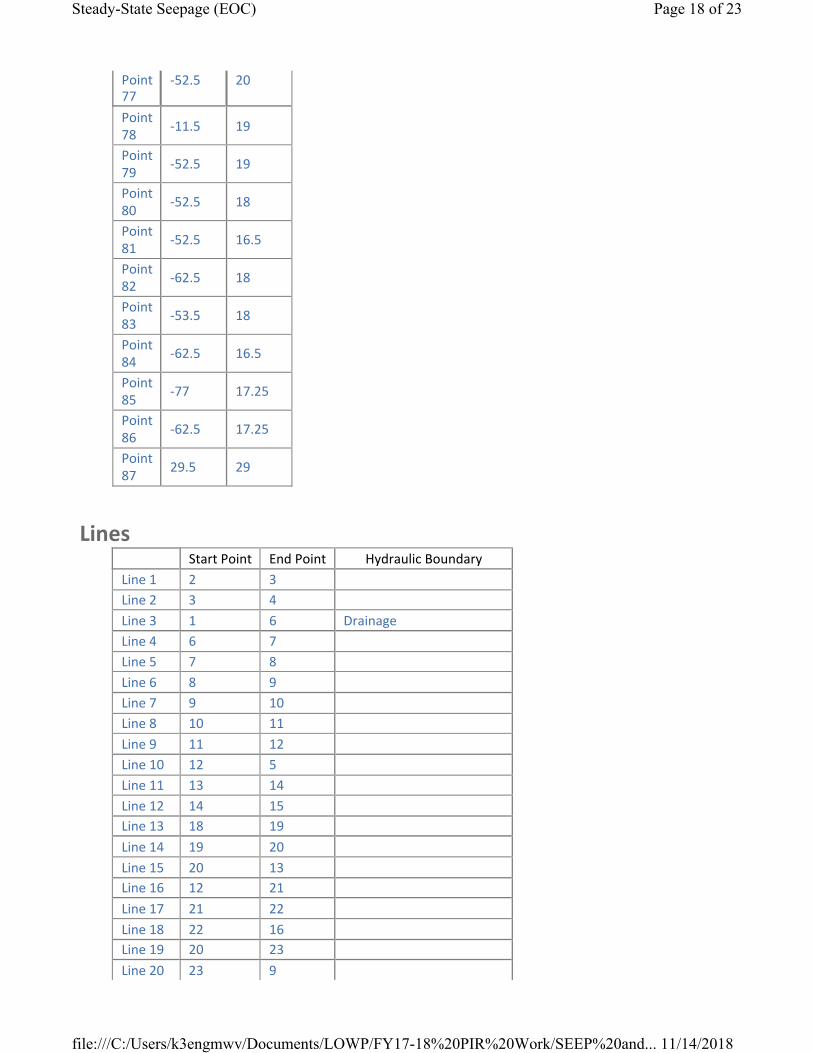
Steady-State Seepage (EOC) Page 18 of 23
Point 77
‐52.5 20
Point 78
‐11.5 19
Point 79
‐52.5 19
Point 80
‐52.5 18
Point 81
‐52.5 16.5
Point 82
‐62.5 18
Point 83
‐53.5 18
Point 84
‐62.5 16.5
Point 85
‐77 17.25
Point 86
‐62.5 17.25
Point 87
29.5 29
Lines
file:///C:/Users/k3engmwv/Documents/LOWP/FY17-18%20PIR%20Work/SEEP%20and... 11/14/2018
Start Point End Point Hydraulic Boundary
Line 1 2 3
Line 2 3 4
Line 3 1 6 Drainage
Line 4 6 7
Line 5 7 8
Line 6 8 9
Line 7 9 10
Line 8 10 11
Line 9 11 12
Line 10 12 5
Line 11 13 14
Line 12 14 15 Line 13 18 19
Line 14 19 20
Line 15 20 13 Line 16 12 21
Line 17 21 22
Line 18 22 16 Line 19 20 23
Line 20 23 9
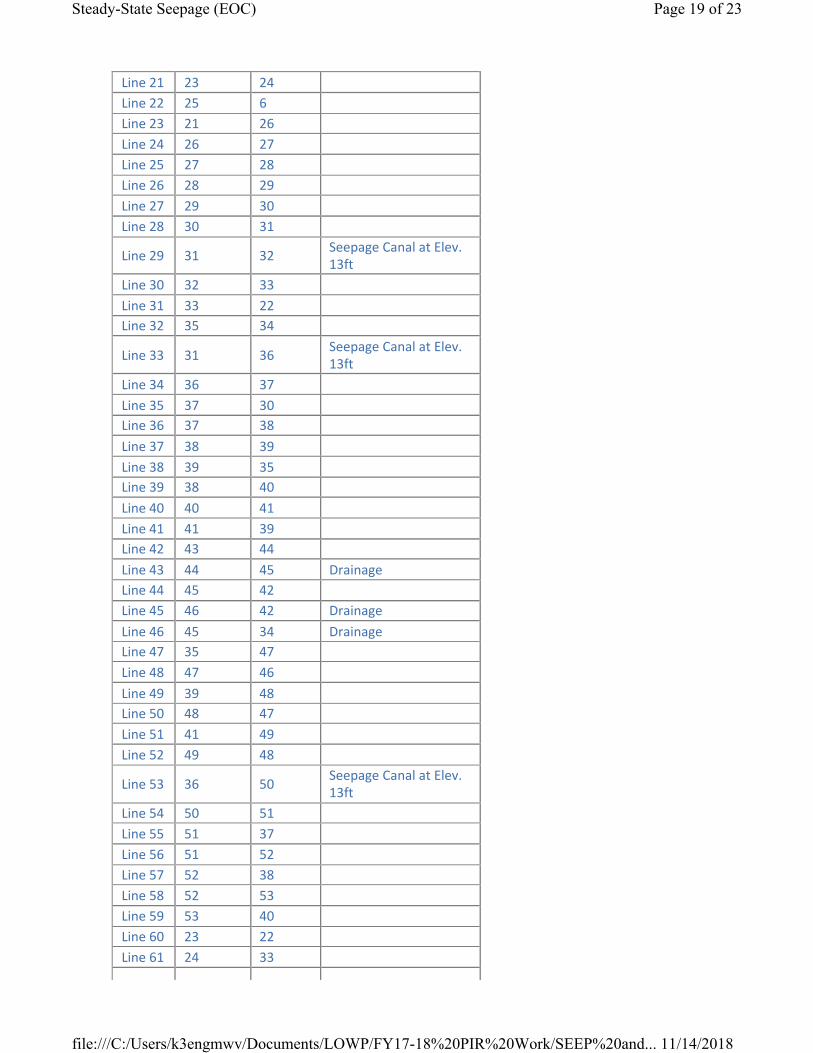
21
22
23
24
25
26
27
28
29
30
31
32
33
34
35
36
37
38
39
40
41
42
43
44
45
46
47
48
49
50
51
52
53
54
55
56
57
58
59
60
61
Steady-State Seepage (EOC) Page 19 of 23
Line 23 24
Line 25 6
Line 21 26
Line 26 27
Line 27 28
Line 28 29
Line 29 30
Line 30 31
Line 31 32 Seepage Canal at Elev. 13ft
Line 32 33
Line 33 22 Line 35 34
Line 31 36 Seepage Canal at Elev. 13ft
Line 36 37
Line 37 30 Line 37 38
Line 38 39
Line 39 35 Line 38 40
Line 40 41
Line 41 39 Line 43 44
Line 44 45 Drainage Line 45 42
Line 46 42 Drainage
Line 45 34 Drainage Line 35 47
Line 47 46
Line 39 48 Line 48 47
Line 41 49
Line 49 48
Line 36 50 Seepage Canal at Elev. 13ft
Line 50 51
Line 51 37
Line 51 52
Line 52 38
Line 52 53
Line 53 40
Line 23 22
Line 24 33
file:///C:/Users/k3engmwv/Documents/LOWP/FY17-18%20PIR%20Work/SEEP%20and... 11/14/2018
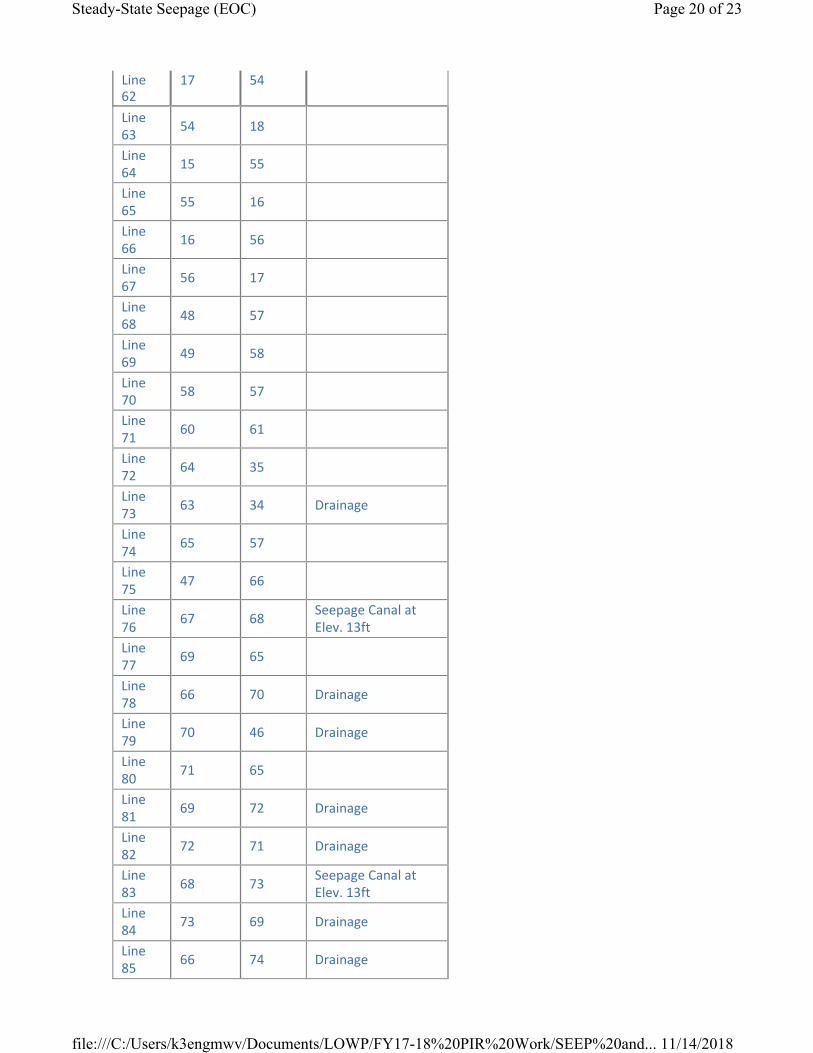
62
63
64
65
66
67
68
69
70
71
72
73
74
75
76
77
78
79
80
81
82
83
84
85
Steady-State Seepage (EOC) Page 20 of 23
file:///C:/Users/k3engmwv/Documents/LOWP/FY17-18%20PIR%20Work/SEEP%20and... 11/14/2018
Line 17 54
Line 54 18
Line 15 55
Line 55 16
Line 16 56
Line 56 17
Line 48 57
Line 49 58
Line 58 57
Line 60 61
Line 64 35
Line 63 34 Drainage
Line 65 57
Line 47 66
Line 67 68
Seepage Canal at Elev. 13ft
Line 69 65
Line 66 70 Drainage
Line 70 46 Drainage
Line 71 65
Line 69 72 Drainage
Line 72 71 Drainage
Line 68 73
Seepage Canal at Elev. 13ft
Line 73 69 Drainage
Line 66 74 Drainage
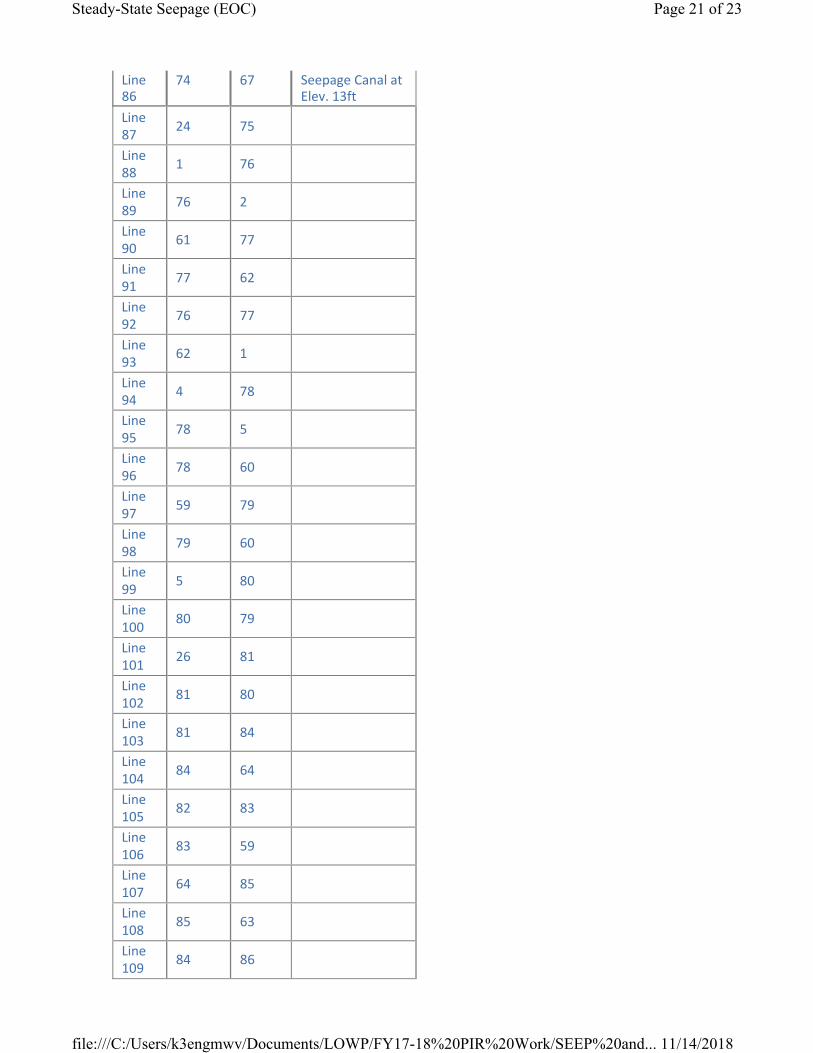
86
87
88
89
90
91
92
93
94
95
96
97
98
99
100
101
102
103
104
105
106
107
108
109
Steady-State Seepage (EOC) Page 21 of 23
file:///C:/Users/k3engmwv/Documents/LOWP/FY17-18%20PIR%20Work/SEEP%20and... 11/14/2018
Line 74 67 Seepage Canal at Elev. 13ft
Line 24 75
Line 1 76
Line 76 2
Line 61 77
Line 77 62
Line 76 77
Line 62 1
Line 4 78
Line 78 5
Line 78 60
Line 59 79
Line 79 60
Line 5 80
Line 80 79
Line 26 81
Line 81 80
Line 81 84
Line 84 64
Line 82 83
Line 83 59
Line 64 85
Line 85 63
Line 84 86
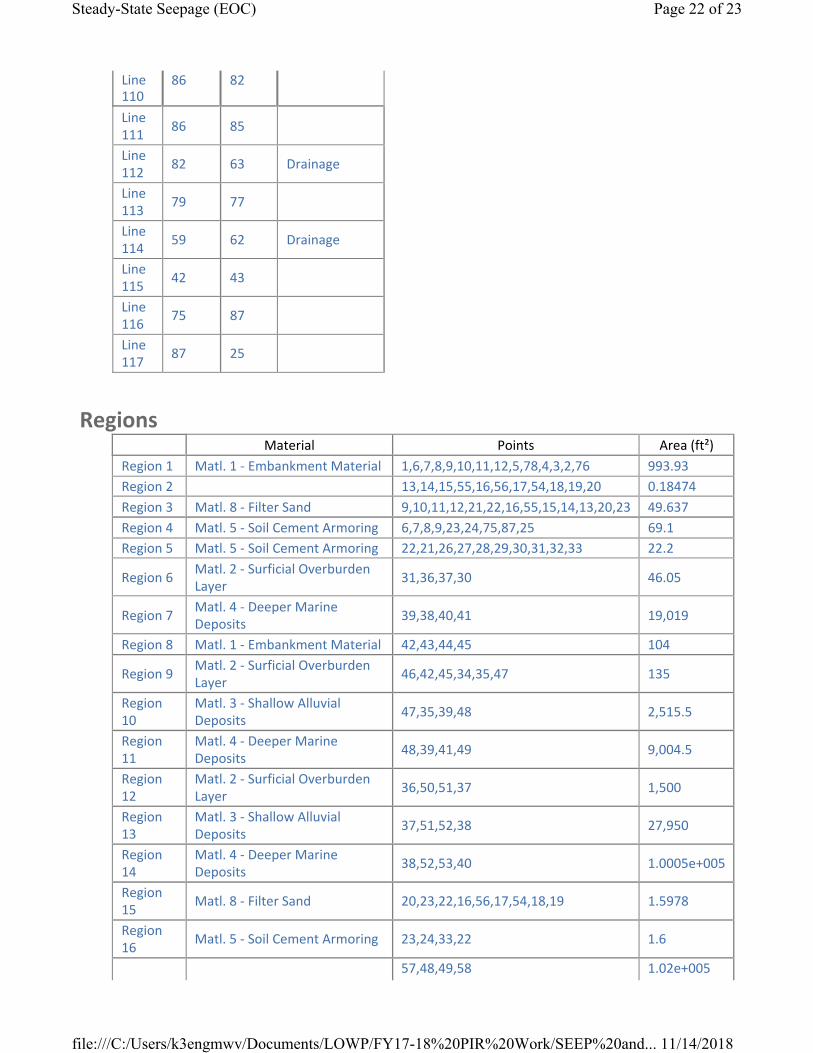
Steady-State Seepage (EOC) Page 22 of 23
Line 110
86 82
Line 111
86 85
Line 112
82 63 Drainage
Line 113
79 77
Line 114
59 62 Drainage
Line 115
42 43
Line 116
75 87
Line 117
87 25
Regions
file:///C:/Users/k3engmwv/Documents/LOWP/FY17-18%20PIR%20Work/SEEP%20and... 11/14/2018
Material Points Area (ft²)
Region 1 Matl. 1 ‐ Embankment Material 1,6,7,8,9,10,11,12,5,78,4,3,2,76 993.93
Region 2 13,14,15,55,16,56,17,54,18,19,20 0.18474
Region 3 Matl. 8 ‐ Filter Sand 9,10,11,12,21,22,16,55,15,14,13,20,23 49.637
Region 4 Matl. 5 ‐ Soil Cement Armoring 6,7,8,9,23,24,75,87,25 69.1
Region 5 Matl. 5 ‐ Soil Cement Armoring 22,21,26,27,28,29,30,31,32,33 22.2
Region 6 Matl. 2 ‐ Surficial Overburden Layer
31,36,37,30 46.05
Region 7 Matl. 4 ‐ Deeper Marine Deposits
39,38,40,41 19,019
Region 8 Matl. 1 ‐ Embankment Material 42,43,44,45 104
Region 9 Matl. 2 ‐ Surficial Overburden Layer
46,42,45,34,35,47 135
Region 10
Matl. 3 ‐ Shallow Alluvial Deposits
47,35,39,48 2,515.5
Region 11
Matl. 4 ‐ Deeper Marine Deposits
48,39,41,49 9,004.5
Region 12
Matl. 2 ‐ Surficial Overburden Layer
36,50,51,37 1,500
Region 13
Matl. 3 ‐ Shallow Alluvial Deposits
37,51,52,38 27,950
Region 14
Matl. 4 ‐ Deeper Marine Deposits
38,52,53,40 1.0005e+005
Region 15
Matl. 8 ‐ Filter Sand 20,23,22,16,56,17,54,18,19 1.5978
Region 16
Matl. 5 ‐ Soil Cement Armoring 23,24,33,22 1.6
57,48,49,58 1.02e+005
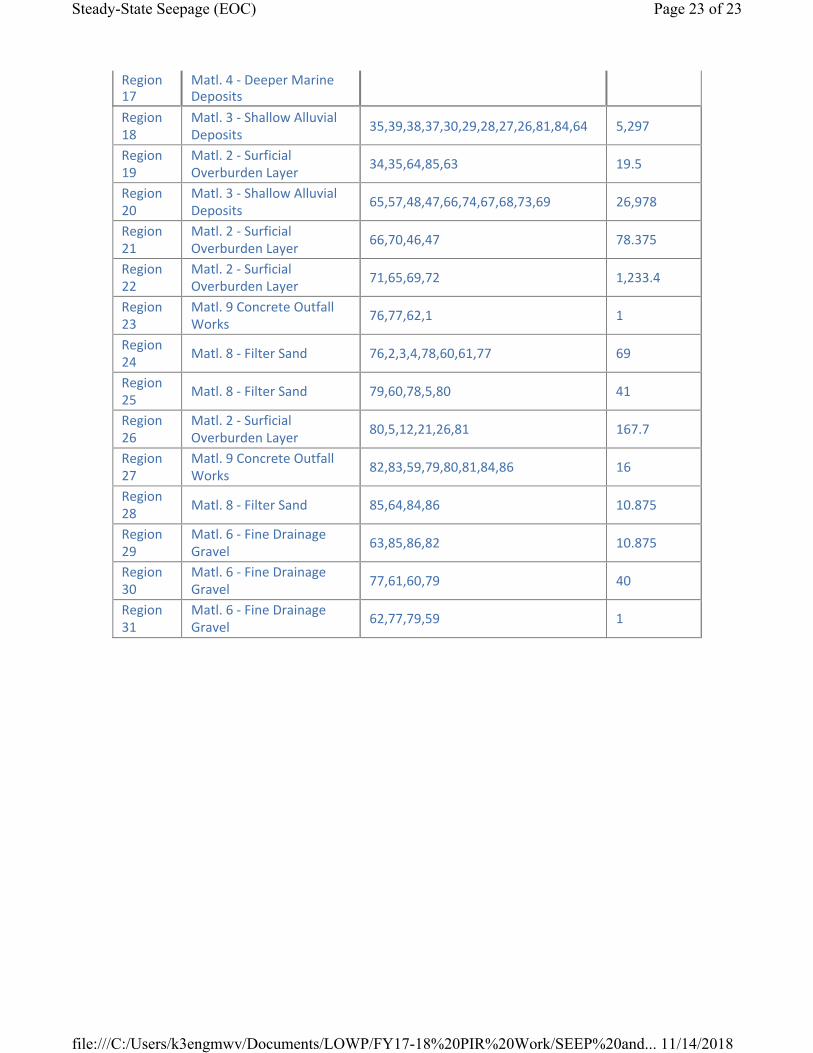
17
18
19
20
21
22
23
24
25
26
27
28
29
30
31
Steady-State Seepage (EOC) Page 23 of 23
file:///C:/Users/k3engmwv/Documents/LOWP/FY17-18%20PIR%20Work/SEEP%20and... 11/14/2018
Region Matl. 4 ‐ Deeper Marine Deposits
Region Matl. 3 ‐ Shallow Alluvial Deposits
35,39,38,37,30,29,28,27,26,81,84,64 5,297
Region Matl. 2 ‐ Surficial Overburden Layer
34,35,64,85,63 19.5
Region Matl. 3 ‐ Shallow Alluvial Deposits
65,57,48,47,66,74,67,68,73,69 26,978
Region Matl. 2 ‐ Surficial Overburden Layer
66,70,46,47 78.375
Region Matl. 2 ‐ Surficial Overburden Layer
71,65,69,72 1,233.4
Region Matl. 9 Concrete Outfall Works
76,77,62,1 1
Region Matl. 8 ‐ Filter Sand 76,2,3,4,78,60,61,77 69
Region Matl. 8 ‐ Filter Sand 79,60,78,5,80 41
Region Matl. 2 ‐ Surficial Overburden Layer
80,5,12,21,26,81 167.7
Region Matl. 9 Concrete Outfall Works
82,83,59,79,80,81,84,86 16
Region Matl. 8 ‐ Filter Sand 85,64,84,86 10.875
Region Matl. 6 ‐ Fine Drainage Gravel
63,85,86,82 10.875
Region Matl. 6 ‐ Fine Drainage Gravel
77,61,60,79 40
Region Matl. 6 ‐ Fine Drainage Gravel
62,77,79,59 1
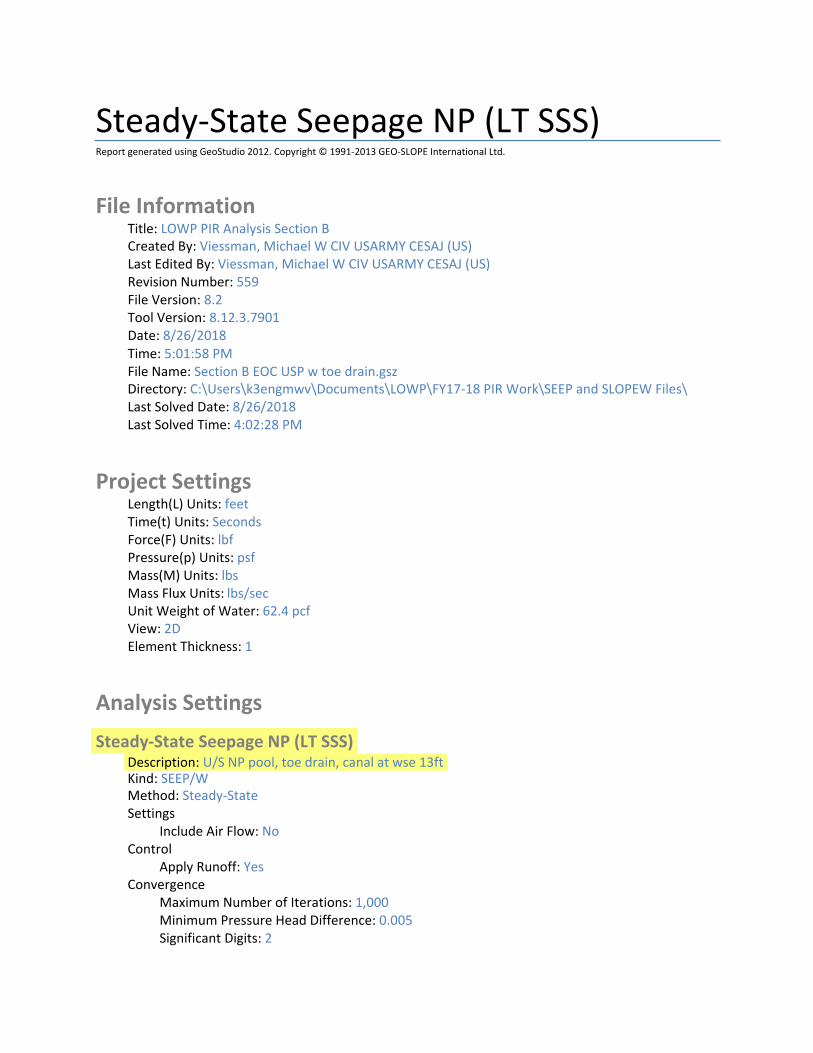
Steady‐State Seepage NP (LT SSS) Report generated using GeoStudio 2012. Copyright © 1991‐2013 GEO‐SLOPE International Ltd.
File Information Title: LOWP PIR Analysis Section B Created By: Viessman, Michael W CIV USARMY CESAJ (US) Last Edited By: Viessman, Michael W CIV USARMY CESAJ (US) Revision Number: 559 File Version: 8.2 Tool Version: 8.12.3.7901 Date: 8/26/2018 Time: 5:01:58 PM File Name: Section B EOC USP w toe drain.gsz Directory: C:\Users\k3engmwv\Documents\LOWP\FY17‐18 PIR Work\SEEP and SLOPEW Files\ Last Solved Date: 8/26/2018 Last Solved Time: 4:02:28 PM
Project Settings Length(L) Units: feet Time(t) Units: Seconds Force(F) Units: lbf Pressure(p) Units: psf Mass(M) Units: lbs Mass Flux Units: lbs/sec Unit Weight of Water: 62.4 pcf View: 2D Element Thickness: 1
Analysis Settings
Steady‐State Seepage NP (LT SSS) Description: U/S NP pool, toe drain, canal at wse 13ft Kind: SEEP/W Method: Steady‐State Settings
Include Air Flow: No Control
Apply Runoff: Yes Convergence
Maximum Number of Iterations: 1,000 Minimum Pressure Head Difference: 0.005 Significant Digits: 2

Max # of Reviews: 10 Hydraulic Under‐Relaxation Criteria
Under‐Relaxation Initial Rate: 1 Under‐Relaxation Min. Rate: 0.1 Under‐Relaxation Reduction Rate: 0.65 Under‐Relaxation Iterations: 10
Equation Solver: Parallel Direct Time
Starting Time: 0 sec Duration: 0 sec Ending Time: 0 sec
Materials
Matl. 1 ‐ Embankment Material Model: Saturated / Unsaturated Hydraulic
K‐Function: Matl. 1 Embankment Material Ky'/Kx' Ratio: 0.25 Rotation: 0 ° Vol. WC. Function: Matl. 1 Embankment Fill from Borrow Areas
Matl. 2 ‐ Surficial Overburden Layer Model: Saturated / Unsaturated Hydraulic
K‐Function: Matl. 2 Surficial Overburden Layer Ky'/Kx' Ratio: 0.1 Rotation: 0 ° Vol. WC. Function: Matl. 2 Surficial Overburden Layer
Matl. 3 ‐ Shallow Alluvial Deposits Model: Saturated / Unsaturated Hydraulic
K‐Function: Matl. 3 Shallow Alluvial Deposits Ky'/Kx' Ratio: 0.1 Rotation: 0 ° Vol. WC. Function: Matl. 3 Shallow Alluvial Deposits
Matl. 4 ‐ Deeper Marine Deposits Model: Saturated / Unsaturated Hydraulic
K‐Function: Matl. 4 Deeper Marine Deposits Ky'/Kx' Ratio: 0.1 Rotation: 0 ° Vol. WC. Function: Matl. 4 Deeper Marine Deposits
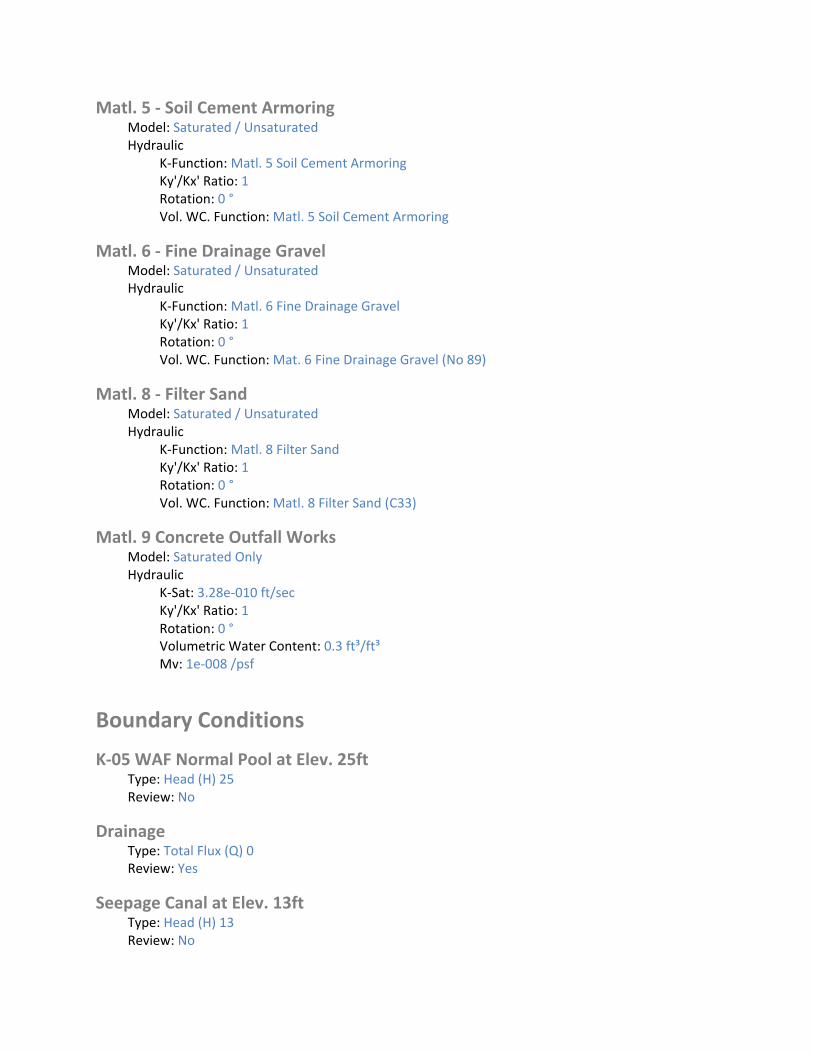
Matl. 5 ‐ Soil Cement Armoring Model: Saturated / Unsaturated Hydraulic
K‐Function: Matl. 5 Soil Cement Armoring Ky'/Kx' Ratio: 1 Rotation: 0 ° Vol. WC. Function: Matl. 5 Soil Cement Armoring
Matl. 6 ‐ Fine Drainage Gravel Model: Saturated / Unsaturated Hydraulic
K‐Function: Matl. 6 Fine Drainage Gravel Ky'/Kx' Ratio: 1 Rotation: 0 ° Vol. WC. Function: Mat. 6 Fine Drainage Gravel (No 89)
Matl. 8 ‐ Filter Sand Model: Saturated / Unsaturated Hydraulic
K‐Function: Matl. 8 Filter Sand Ky'/Kx' Ratio: 1 Rotation: 0 ° Vol. WC. Function: Matl. 8 Filter Sand (C33)
Matl. 9 Concrete Outfall Works Model: Saturated Only Hydraulic
K‐Sat: 3.28e‐010 ft/sec Ky'/Kx' Ratio: 1 Rotation: 0 ° Volumetric Water Content: 0.3 ft³/ft³ Mv: 1e‐008 /psf
Boundary Conditions
K‐05 WAF Normal Pool at Elev. 25ft Type: Head (H) 25 Review: No
Drainage Type: Total Flux (Q) 0 Review: Yes
Seepage Canal at Elev. 13ft Type: Head (H) 13 Review: No
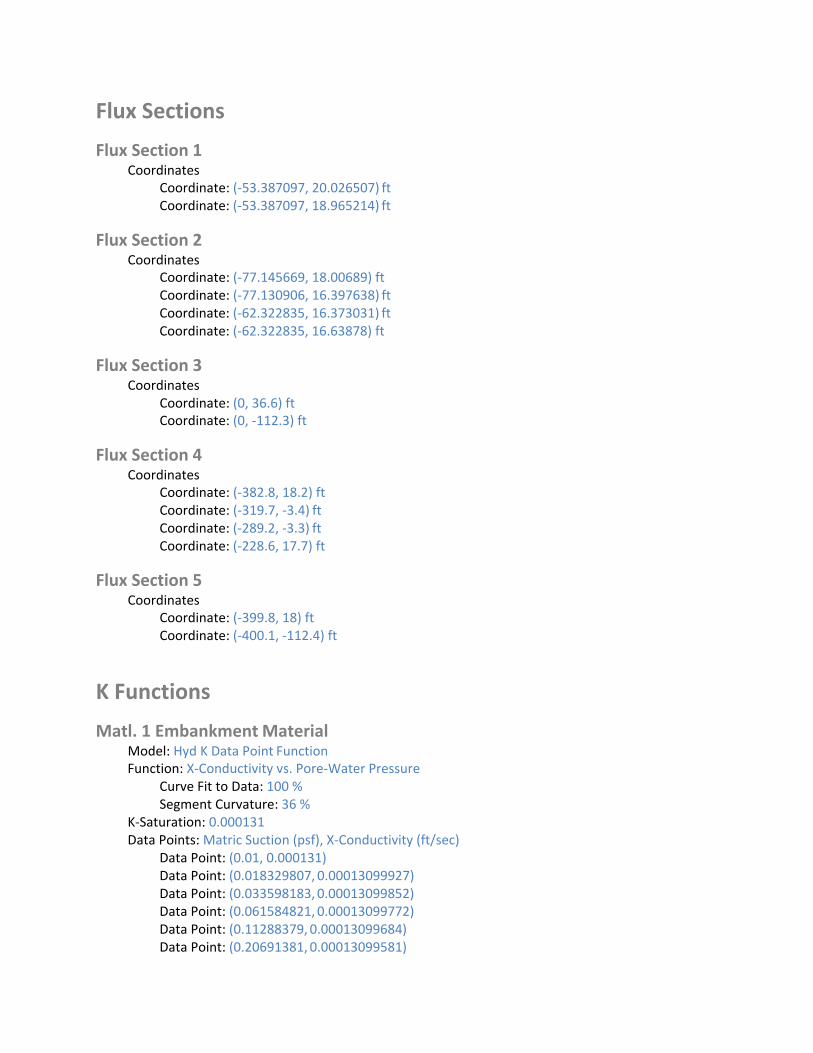
Flux Sections
Flux Section 1 Coordinates
Coordinate: (‐53.387097, 20.026507) ft Coordinate: (‐53.387097, 18.965214) ft
Flux Section 2 Coordinates
Coordinate: (‐77.145669, 18.00689) ft Coordinate: (‐77.130906, 16.397638) ft Coordinate: (‐62.322835, 16.373031) ft Coordinate: (‐62.322835, 16.63878) ft
Flux Section 3 Coordinates
Coordinate: (0, 36.6) ft Coordinate: (0, ‐112.3) ft
Flux Section 4 Coordinates
Coordinate: (‐382.8, 18.2) ft Coordinate: (‐319.7, ‐3.4) ft Coordinate: (‐289.2, ‐3.3) ft Coordinate: (‐228.6, 17.7) ft
Flux Section 5 Coordinates
Coordinate: (‐399.8, 18) ft Coordinate: (‐400.1, ‐112.4) ft
K Functions
Matl. 1 Embankment Material Model: Hyd K Data Point Function Function: X‐Conductivity vs. Pore‐Water Pressure
Curve Fit to Data: 100 % Segment Curvature: 36 %
K‐Saturation: 0.000131 Data Points: Matric Suction (psf), X‐Conductivity (ft/sec)
Data Point: (0.01, 0.000131) Data Point: (0.018329807, 0.00013099927) Data Point: (0.033598183, 0.00013099852) Data Point: (0.061584821, 0.00013099772) Data Point: (0.11288379, 0.00013099684) Data Point: (0.20691381, 0.00013099581)

Data Point: (0.37926902,0.0001309945) Data Point: (0.6951928,0.00013099268) Data Point: (1.274275, 0.00013098992) Data Point: (2.3357215, 0.00013098549) Data Point: (4.2813324, 0.0001309777) Data Point: (7.8475997, 0.00013096339) Data Point: (14.384499,0.00013094955) Data Point: (26.366509,0.00013089452) Data Point: (48.329302,0.00013043835) Data Point: (88.586679, 0.00012910123) Data Point: (162.37767, 5.664247e‐005) Data Point: (297.63514, 2.5159921e‐006) Data Point: (545.55948, 4.7485927e‐008) Data Point: (1,000, 1.7886028e‐009)
Estimation Properties Hyd. K‐Function Estimation Method: Fredlund‐Xing Function Volume Water Content Function: Matl. 1 Embankment Fill from Borrow Areas Hydraulic K Sat: 0.000131 ft/sec Residual Water Content: 0.0495 ft³/ft³ Maximum: 1,000 Minimum: 0.01 Num. Points: 20
Matl. 4 Deeper Marine Deposits Model: Hyd K Data Point Function Function: X‐Conductivity vs. Pore‐Water Pressure
Curve Fit to Data: 100 % Segment Curvature: 44 %
K‐Saturation: 0.000984 Data Points: Matric Suction (psf), X‐Conductivity (ft/sec)
Data Point: (0.01, 0.000984) Data Point: (0.018329807, 0.00098398585) Data Point: (0.033598183, 0.00098397151) Data Point: (0.061584821, 0.00098395679) Data Point: (0.11288379, 0.00098394139) Data Point: (0.20691381, 0.00098392476) Data Point: (0.37926902, 0.00098390584) Data Point: (0.6951928, 0.00098388274) Data Point: (1.274275, 0.00098385199) Data Point: (2.3357215, 0.0009838074) Data Point: (4.2813324,0.00098373618) Data Point: (7.8475997,0.00098361453) Data Point: (14.384499, 0.0009834543) Data Point: (26.366509,0.00098304118) Data Point: (48.329302,0.00098089274) Data Point: (88.586679,0.00098804841) Data Point: (162.37767,0.00089693201) Data Point: (297.63514,0.00029836287)
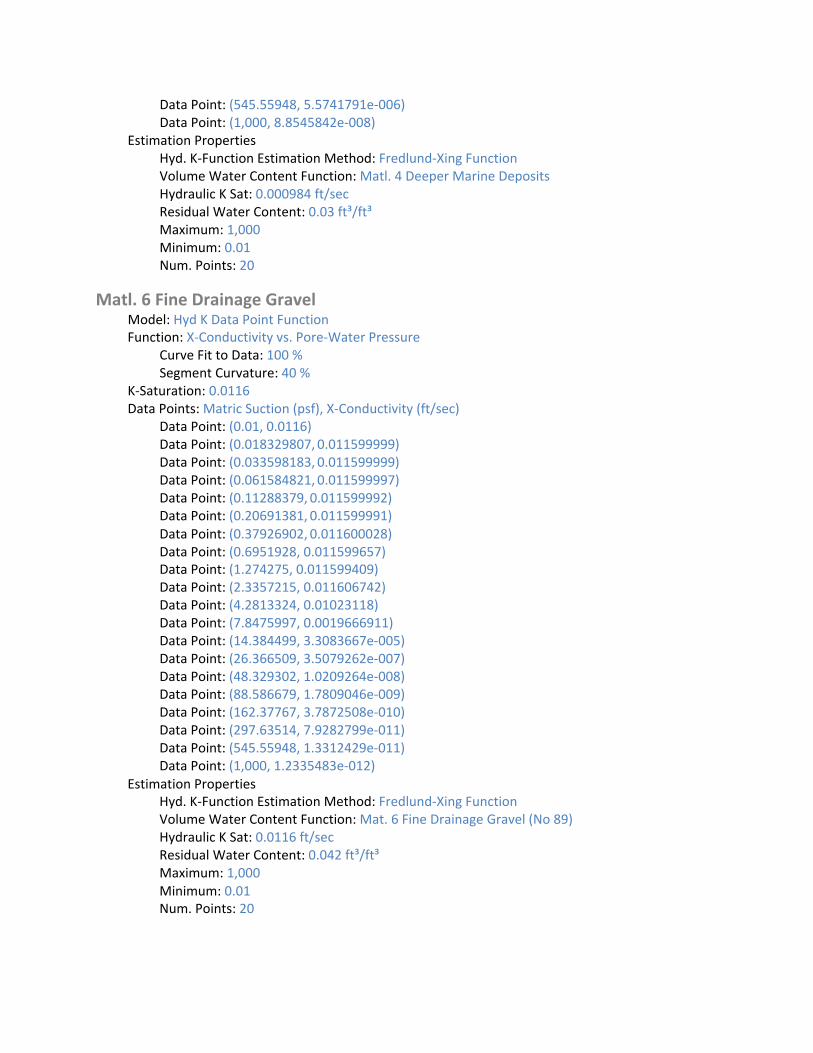
Data Point: (545.55948, 5.5741791e‐006) Data Point: (1,000, 8.8545842e‐008)
Estimation Properties Hyd. K‐Function Estimation Method: Fredlund‐Xing Function Volume Water Content Function: Matl. 4 Deeper Marine Deposits Hydraulic K Sat: 0.000984 ft/sec Residual Water Content: 0.03 ft³/ft³ Maximum: 1,000 Minimum: 0.01 Num. Points: 20
Matl. 6 Fine Drainage Gravel Model: Hyd K Data Point Function Function: X‐Conductivity vs. Pore‐Water Pressure
Curve Fit to Data: 100 % Segment Curvature: 40 %
K‐Saturation: 0.0116 Data Points: Matric Suction (psf), X‐Conductivity (ft/sec)
Data Point: (0.01, 0.0116) Data Point: (0.018329807, 0.011599999) Data Point: (0.033598183, 0.011599999) Data Point: (0.061584821, 0.011599997) Data Point: (0.11288379, 0.011599992) Data Point: (0.20691381, 0.011599991) Data Point: (0.37926902, 0.011600028) Data Point: (0.6951928, 0.011599657) Data Point: (1.274275, 0.011599409) Data Point: (2.3357215, 0.011606742) Data Point: (4.2813324, 0.01023118) Data Point: (7.8475997, 0.0019666911) Data Point: (14.384499, 3.3083667e‐005) Data Point: (26.366509, 3.5079262e‐007) Data Point: (48.329302, 1.0209264e‐008) Data Point: (88.586679, 1.7809046e‐009) Data Point: (162.37767, 3.7872508e‐010) Data Point: (297.63514, 7.9282799e‐011) Data Point: (545.55948, 1.3312429e‐011) Data Point: (1,000, 1.2335483e‐012)
Estimation Properties Hyd. K‐Function Estimation Method: Fredlund‐Xing Function Volume Water Content Function: Mat. 6 Fine Drainage Gravel (No 89) Hydraulic K Sat: 0.0116 ft/sec Residual Water Content: 0.042 ft³/ft³ Maximum: 1,000 Minimum: 0.01 Num. Points: 20

Matl. 2 Surficial Overburden Layer Model: Hyd K Data Point Function Function: X‐Conductivity vs. Pore‐Water Pressure
Curve Fit to Data: 100 % Segment Curvature: 36 %
K‐Saturation: 0.00026 Data Points: Matric Suction (psf), X‐Conductivity (ft/sec)
Data Point: (0.01, 0.00026) Data Point: (0.018329807, 0.00025999835) Data Point: (0.033598183, 0.00025999664) Data Point: (0.061584821, 0.00025999485) Data Point: (0.11288379, 0.00025999288) Data Point: (0.20691381, 0.00025999062) Data Point: (0.37926902, 0.00025998779) Data Point: (0.6951928, 0.00025998393) Data Point: (1.274275, 0.00025997819) Data Point: (2.3357215,0.00025996907) Data Point: (4.2813324,0.00025995329) Data Point: (7.8475997,0.00025992467) Data Point: (14.384499,0.00025989276) Data Point: (26.366509,0.00025978642) Data Point: (48.329302,0.00025903344) Data Point: (88.586679, 0.0002586222) Data Point: (162.37767, 0.00013432217) Data Point: (297.63514, 8.1547435e‐006) Data Point: (545.55948, 1.3663567e‐007) Data Point: (1,000, 4.5608744e‐009)
Estimation Properties Hyd. K‐Function Estimation Method: Fredlund‐Xing Function Volume Water Content Function: Matl. 2 Surficial Overburden Layer Hydraulic K Sat: 0.00026 ft/sec Residual Water Content: 0.0495 ft³/ft³ Maximum: 1,000 Minimum: 0.01 Num. Points: 20
Matl. 3 Shallow Alluvial Deposits Model: Hyd K Data Point Function Function: X‐Conductivity vs. Pore‐Water Pressure
Curve Fit to Data: 100 % Segment Curvature: 36 %
K‐Saturation: 0.00174 Data Points: Matric Suction (psf), X‐Conductivity (ft/sec)
Data Point: (0.01, 0.00174) Data Point: (0.018329807, 0.0017399903) Data Point: (0.033598183, 0.0017399803) Data Point: (0.061584821, 0.0017399698)

Data Point: (0.11288379,0.0017399581) Data Point: (0.20691381,0.0017399444) Data Point: (0.37926902,0.0017399269) Data Point: (0.6951928, 0.0017399027) Data Point: (1.274275, 0.0017398661) Data Point: (2.3357215, 0.0017398072) Data Point: (4.2813324, 0.0017397038) Data Point: (7.8475997, 0.0017395137) Data Point: (14.384499, 0.0017393299) Data Point: (26.366509, 0.001738599) Data Point: (48.329302, 0.0017325399) Data Point: (88.586679, 0.0017147796) Data Point: (162.37767, 0.00075235037) Data Point: (297.63514, 3.3418521e‐005) Data Point: (545.55948, 6.307291e‐007) Data Point: (1,000, 2.3757014e‐008)
Estimation Properties Hyd. K‐Function Estimation Method: Fredlund‐Xing Function Volume Water Content Function: Matl. 3 Shallow Alluvial Deposits Hydraulic K Sat: 0.00174 ft/sec Residual Water Content: 0.0495 ft³/ft³ Maximum: 1,000 Minimum: 0.01 Num. Points: 20
Matl. 5 Soil Cement Armoring Model: Hyd K Data Point Function Function: X‐Conductivity vs. Pore‐Water Pressure
Curve Fit to Data: 100 % Segment Curvature: 44 %
K‐Saturation: 1.31e‐005 Data Points: Matric Suction (psf), X‐Conductivity (ft/sec)
Data Point: (0.01, 1.31e‐005) Data Point: (0.018329807, 1.3099927e‐005) Data Point: (0.033598183, 1.3099852e‐005) Data Point: (0.061584821, 1.3099772e‐005) Data Point: (0.11288379, 1.3099684e‐005) Data Point: (0.20691381, 1.3099581e‐005) Data Point: (0.37926902, 1.309945e‐005) Data Point: (0.6951928, 1.3099268e‐005) Data Point: (1.274275, 1.3098992e‐005) Data Point: (2.3357215, 1.3098549e‐005) Data Point: (4.2813324, 1.309777e‐005) Data Point: (7.8475997, 1.3096339e‐005) Data Point: (14.384499, 1.3094955e‐005) Data Point: (26.366509, 1.3089452e‐005) Data Point: (48.329302, 1.3043835e‐005) Data Point: (88.586679, 1.2910123e‐005)

Data Point: (162.37767, 5.664247e‐006) Data Point: (297.63514, 2.5159921e‐007) Data Point: (545.55948, 4.7485927e‐009) Data Point: (1,000, 1.7886028e‐010)
Estimation Properties Hyd. K‐Function Estimation Method: Fredlund‐Xing Function Volume Water Content Function: Matl. 5 Soil Cement Armoring Hydraulic K Sat: 1.31e‐005 ft/sec Residual Water Content: 0.03 ft³/ft³ Maximum: 1,000 Minimum: 0.01 Num. Points: 20
Matl. 8 Filter Sand Model: Hyd K Data Point Function Function: X‐Conductivity vs. Pore‐Water Pressure
Curve Fit to Data: 100 % Segment Curvature: 44 %
K‐Saturation: 0.000925 Data Points: Matric Suction (psf), X‐Conductivity (ft/sec)
Data Point: (0.01, 0.000925) Data Point: (0.018329807, 0.00092499993) Data Point: (0.033598183, 0.00092499981) Data Point: (0.061584821, 0.0009249996) Data Point: (0.11288379, 0.00092499919) Data Point: (0.20691381, 0.00092499854) Data Point: (0.37926902, 0.00092499785) Data Point: (0.6951928, 0.00092499117) Data Point: (1.274275, 0.00092498427) Data Point: (2.3357215,0.00092515575) Data Point: (4.2813324,0.00092444336) Data Point: (7.8475997,0.00092025484) Data Point: (14.384499,0.00086768248) Data Point: (26.366509, 0.00022215817) Data Point: (48.329302, 5.6149022e‐006) Data Point: (88.586679, 9.4931606e‐008) Data Point: (162.37767, 4.4270536e‐009) Data Point: (297.63514, 6.3580973e‐010) Data Point: (545.55948, 1.1244323e‐010) Data Point: (1,000, 1.0762229e‐011)
Estimation Properties Hyd. K‐Function Estimation Method: Fredlund‐Xing Function Volume Water Content Function: Matl. 8 Filter Sand (C33) Hydraulic K Sat: 0.000925 ft/sec Residual Water Content: 0.03 ft³/ft³ Maximum: 1,000 Minimum: 0.01 Num. Points: 20

Vol. Water Content Functions
Matl. 3 Shallow Alluvial Deposits Model: Vol WC Data Point Function Function: Vol. Water Content vs. Pore‐Water Pressure
Mv: 2.5e‐006 /psf Saturated Water Content: 0.30020276 ft³/ft³ Residual Water Content: 0.030020276 ft³/ft³ Curve Fit to Data: 100 % Segment Curvature: 40 %
Porosity: 0.30020276 Data Points: Matric Suction (psf), Vol. Water Content (ft³/ft³)
Data Point: (0.01, 0.29987196) Data Point: (0.018329807, 0.29987196) Data Point: (0.033598183, 0.29987196) Data Point: (0.061584821, 0.29987196) Data Point: (0.11288379, 0.29987196) Data Point: (0.20691381, 0.29987196) Data Point: (0.37926902, 0.29987196) Data Point: (0.6951928, 0.29987196) Data Point: (1.274275, 0.29987196) Data Point: (2.3357215, 0.29987196) Data Point: (4.2813324, 0.29987196) Data Point: (7.8475997, 0.29987196) Data Point: (14.384499, 0.29987196) Data Point: (26.366509, 0.29987196) Data Point: (48.329302, 0.29987196) Data Point: (88.586679, 0.29667682) Data Point: (162.37767, 0.20150036) Data Point: (297.63514, 0.085811521) Data Point: (545.55948, 0.049379583) Data Point: (1,000, 0.039446735)
Estimation Properties Vol. WC Estimation Method: Grain Size Function Saturated Water Content: 0.3 ft³/ft³ Sample Material: Clay Liquid Limit: 0 % Diameter at 10% passing: 0.07000000000000001 Diameter at 60% passing: 0.2 Maximum: 1,000 Minimum: 0.01 Num. Points: 20
Matl. 1 Embankment Fill from Borrow Areas Model: Vol WC Data Point Function Function: Vol. Water Content vs. Pore‐Water Pressure
Mv: 2.5e‐006 /psf

Saturated Water Content: 0.30020276 ft³/ft³ Residual Water Content: 0.030020276 ft³/ft³ Curve Fit to Data: 100 % Segment Curvature: 40 %
Porosity: 0.30020276 Data Points: Matric Suction (psf), Vol. Water Content (ft³/ft³)
Data Point: (0.01, 0.29987196) Data Point: (0.018329807, 0.29987196) Data Point: (0.033598183, 0.29987196) Data Point: (0.061584821, 0.29987196) Data Point: (0.11288379, 0.29987196) Data Point: (0.20691381, 0.29987196) Data Point: (0.37926902, 0.29987196) Data Point: (0.6951928, 0.29987196) Data Point: (1.274275, 0.29987196) Data Point: (2.3357215, 0.29987196) Data Point: (4.2813324, 0.29987196) Data Point: (7.8475997, 0.29987196) Data Point: (14.384499, 0.29987196) Data Point: (26.366509, 0.29987196) Data Point: (48.329302, 0.29987196) Data Point: (88.586679, 0.29667682) Data Point: (162.37767, 0.20150036) Data Point: (297.63514, 0.085811521) Data Point: (545.55948, 0.049379583) Data Point: (1,000, 0.039446735)
Estimation Properties Vol. WC Estimation Method: Grain Size Function Saturated Water Content: 0.3 ft³/ft³ Sample Material: Clay Liquid Limit: 0 % Diameter at 10% passing: 0.07000000000000001 Diameter at 60% passing: 0.2 Maximum: 1,000 Minimum: 0.01 Num. Points: 20
Matl. 2 Surficial Overburden Layer Model: Vol WC Data Point Function Function: Vol. Water Content vs. Pore‐Water Pressure
Mv: 2.5e‐006 /psf Saturated Water Content: 0.30132774 ft³/ft³ Residual Water Content: 0.030132774 ft³/ft³ Curve Fit to Data: 100 % Segment Curvature: 40 %
Porosity: 0.30132774 Data Points: Matric Suction (psf), Vol. Water Content (ft³/ft³)
Data Point: (0.01, 0.30110223)

Data Point: (0.018329807, 0.30110223) Data Point: (0.033598183, 0.30110223) Data Point: (0.061584821, 0.30110223) Data Point: (0.11288379, 0.30110223) Data Point: (0.20691381, 0.30110223) Data Point: (0.37926902, 0.30110223) Data Point: (0.6951928, 0.30110223) Data Point: (1.274275, 0.30110223) Data Point: (2.3357215, 0.30110223) Data Point: (4.2813324, 0.30110223) Data Point: (7.8475997, 0.30110223) Data Point: (14.384499, 0.30110223) Data Point: (26.366509, 0.30110223) Data Point: (48.329302, 0.30110223) Data Point: (88.586679, 0.29938489) Data Point: (162.37767, 0.21986255) Data Point: (297.63514, 0.094851578) Data Point: (545.55948, 0.051777012) Data Point: (1,000, 0.040605935)
Estimation Properties Vol. WC Estimation Method: Grain Size Function Saturated Water Content: 0.3 ft³/ft³ Sample Material: Clay Liquid Limit: 0 % Diameter at 10% passing: 0.07000000000000001 Diameter at 60% passing: 0.18 Maximum: 1,000 Minimum: 0.01 Num. Points: 20
Matl. 8 Filter Sand (C33) Model: Vol WC Data Point Function Function: Vol. Water Content vs. Pore‐Water Pressure
Mv: 8e‐007 /psf Saturated Water Content: 0.30081752 ft³/ft³ Residual Water Content: 0.030081752 ft³/ft³ Curve Fit to Data: 100 % Segment Curvature: 48 %
Porosity: 0.30081752 Data Points: Matric Suction (psf), Vol. Water Content (ft³/ft³)
Data Point: (0.01, 0.30028388) Data Point: (0.018329807, 0.30028388) Data Point: (0.033598183, 0.30028388) Data Point: (0.061584821, 0.30028388) Data Point: (0.11288379, 0.30028388) Data Point: (0.20691381, 0.30028388) Data Point: (0.37926902, 0.30028388) Data Point: (0.6951928, 0.30028388)

Data Point: (1.274275, 0.30028388) Data Point: (2.3357215, 0.30028388) Data Point: (4.2813324, 0.30028388) Data Point: (7.8475997, 0.30028388) Data Point: (14.384499, 0.28112842) Data Point: (26.366509, 0.15065712) Data Point: (48.329302, 0.048430554) Data Point: (88.586679, 0.021674388) Data Point: (162.37767, 0.016081301) Data Point: (297.63514, 0.013674367) Data Point: (545.55948, 0.011770874) Data Point: (1,000, 0.010084825)
Estimation Properties Vol. WC Estimation Method: Grain Size Function Saturated Water Content: 0.3 ft³/ft³ Sample Material: Gravel Liquid Limit: 0 % Diameter at 10% passing: 0.38 Diameter at 60% passing: 1.6 Maximum: 1,000 Minimum: 0.01 Num. Points: 20
Mat. 6 Fine Drainage Gravel (No 89) Model: Vol WC Data Point Function Function: Vol. Water Content vs. Pore‐Water Pressure
Mv: 4e‐007 /psf Saturated Water Content: 0.21947752 ft³/ft³ Residual Water Content: 0.021947752 ft³/ft³ Curve Fit to Data: 100 % Segment Curvature: 48 %
Porosity: 0.21947752 Data Points: Matric Suction (psf), Vol. Water Content (ft³/ft³)
Data Point: (0.01, 0.21916427) Data Point: (0.018329807, 0.21916427) Data Point: (0.033598183, 0.21916427) Data Point: (0.061584821, 0.21916427) Data Point: (0.11288379, 0.21916427) Data Point: (0.20691381, 0.21916427) Data Point: (0.37926902, 0.21916427) Data Point: (0.6951928, 0.21916427) Data Point: (1.274275, 0.21916427) Data Point: (2.3357215, 0.21916427) Data Point: (4.2813324, 0.20182012) Data Point: (7.8475997, 0.090949254) Data Point: (14.384499, 0.021737158) Data Point: (26.366509, 0.0080845337) Data Point: (48.329302, 0.0057554944)

Data Point: (88.586679, 0.0048689464) Data Point: (162.37767, 0.0041947283) Data Point: (297.63514, 0.0036057207) Data Point: (545.55948, 0.0030872724) Data Point: (1,000, 0.002632805)
Estimation Properties Vol. WC Estimation Method: Grain Size Function Saturated Water Content: 0.21875 ft³/ft³ Sample Material: Clay Liquid Limit: 0 % Diameter at 10% passing: 3.5 Diameter at 60% passing: 7.1 Maximum: 1,000 Minimum: 0.01 Num. Points: 20
Matl. 4 Deeper Marine Deposits Model: Vol WC Data Point Function Function: Vol. Water Content vs. Pore‐Water Pressure
Mv: 2.5e‐006 /psf Saturated Water Content: 0.30154597 ft³/ft³ Residual Water Content: 0.030154597 ft³/ft³ Curve Fit to Data: 100 % Segment Curvature: 40 %
Porosity: 0.30154597 Data Points: Matric Suction (psf), Vol. Water Content (ft³/ft³)
Data Point: (0.01, 0.30100508) Data Point: (0.018329807, 0.30100508) Data Point: (0.033598183, 0.30100508) Data Point: (0.061584821, 0.30100508) Data Point: (0.11288379, 0.30100508) Data Point: (0.20691381, 0.30100508) Data Point: (0.37926902, 0.30100508) Data Point: (0.6951928, 0.30100508) Data Point: (1.274275, 0.30100508) Data Point: (2.3357215, 0.30100508) Data Point: (4.2813324, 0.30100508) Data Point: (7.8475997, 0.30100508) Data Point: (14.384499, 0.30100508) Data Point: (26.366509, 0.30100508) Data Point: (48.329302, 0.30100508) Data Point: (88.586679, 0.30100508) Data Point: (162.37767, 0.2887592) Data Point: (297.63514, 0.17412515) Data Point: (545.55948, 0.076942285) Data Point: (1,000, 0.051397358)
Estimation Properties Vol. WC Estimation Method: Grain Size Function

Saturated Water Content: 0.3 ft³/ft³ Sample Material: Clay Liquid Limit: 0 % Diameter at 10% passing: 0.06 Diameter at 60% passing: 0.11 Maximum: 1,000 Minimum: 0.01 Num. Points: 20
Matl. 5 Soil Cement Armoring Model: Vol WC Data Point Function Function: Vol. Water Content vs. Pore‐Water Pressure
Mv: 2.5e‐006 /psf Saturated Water Content: 0.30020276 ft³/ft³ Residual Water Content: 0.030020276 ft³/ft³ Curve Fit to Data: 100 % Segment Curvature: 40 %
Porosity: 0.30020276 Data Points: Matric Suction (psf), Vol. Water Content (ft³/ft³)
Data Point: (0.01, 0.29987196) Data Point: (0.018329807, 0.29987196) Data Point: (0.033598183, 0.29987196) Data Point: (0.061584821, 0.29987196) Data Point: (0.11288379, 0.29987196) Data Point: (0.20691381, 0.29987196) Data Point: (0.37926902, 0.29987196) Data Point: (0.6951928, 0.29987196) Data Point: (1.274275, 0.29987196) Data Point: (2.3357215, 0.29987196) Data Point: (4.2813324, 0.29987196) Data Point: (7.8475997, 0.29987196) Data Point: (14.384499, 0.29987196) Data Point: (26.366509, 0.29987196) Data Point: (48.329302, 0.29987196) Data Point: (88.586679, 0.29667682) Data Point: (162.37767, 0.20150036) Data Point: (297.63514, 0.085811521) Data Point: (545.55948, 0.049379583) Data Point: (1,000, 0.039446735)
Estimation Properties Vol. WC Estimation Method: Grain Size Function Saturated Water Content: 0.3 ft³/ft³ Sample Material: Clay Liquid Limit: 0 % Diameter at 10% passing: 0.07000000000000001 Diameter at 60% passing: 0.2 Maximum: 1,000 Minimum: 0.01
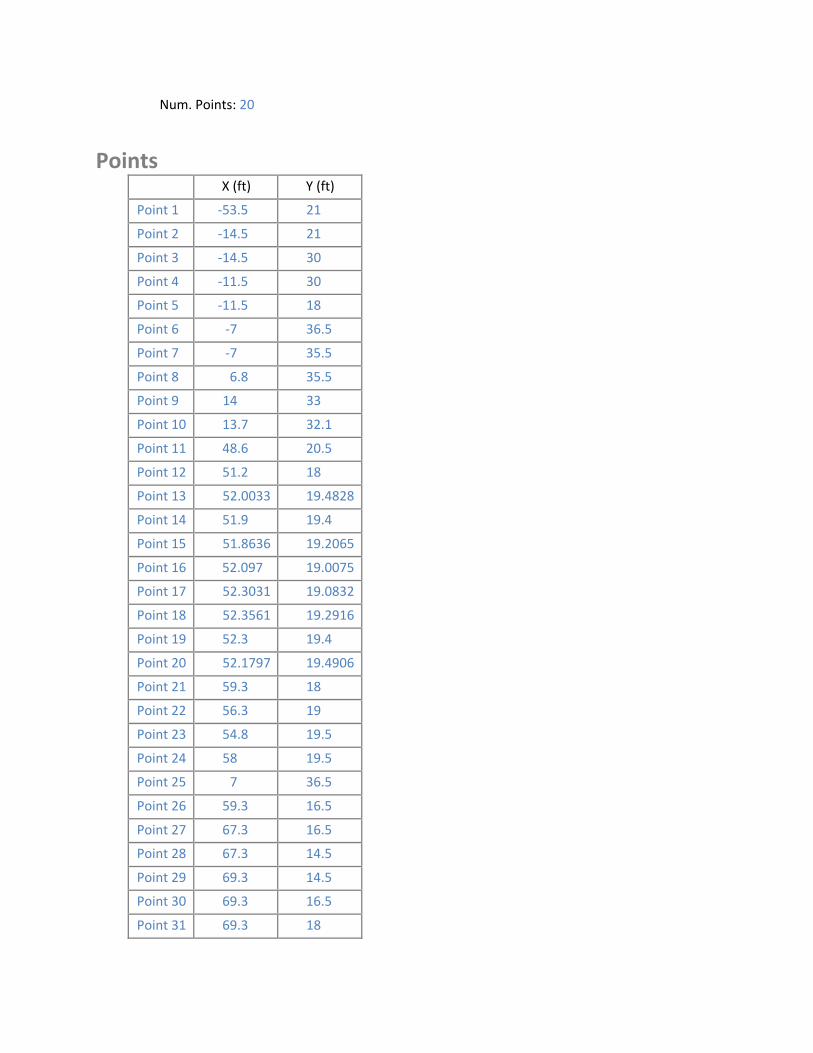
5
10
15
20
25
30
Num. Points: 20
Points X (ft) Y (ft)
Point 1 ‐53.5 21
Point 2 ‐14.5 21
Point 3 ‐14.5 30
Point 4 ‐11.5 30
Point ‐11.5 18
Point 6 ‐7 36.5
Point 7 ‐7 35.5
Point 8 6.8 35.5
Point 9 14 33
Point 13.7 32.1
Point 11 48.6 20.5
Point 12 51.2 18
Point 13 52.0033 19.4828
Point 14 51.9 19.4
Point 51.8636 19.2065
Point 16 52.097 19.0075
Point 17 52.3031 19.0832
Point 18 52.3561 19.2916
Point 19 52.3 19.4
Point 52.1797 19.4906
Point 21 59.3 18
Point 22 56.3 19
Point 23 54.8 19.5
Point 24 58 19.5
Point 7 36.5
Point 26 59.3 16.5
Point 27 67.3 16.5
Point 28 67.3 14.5
Point 29 69.3 14.5
Point 69.3 16.5
Point 31 69.3 18
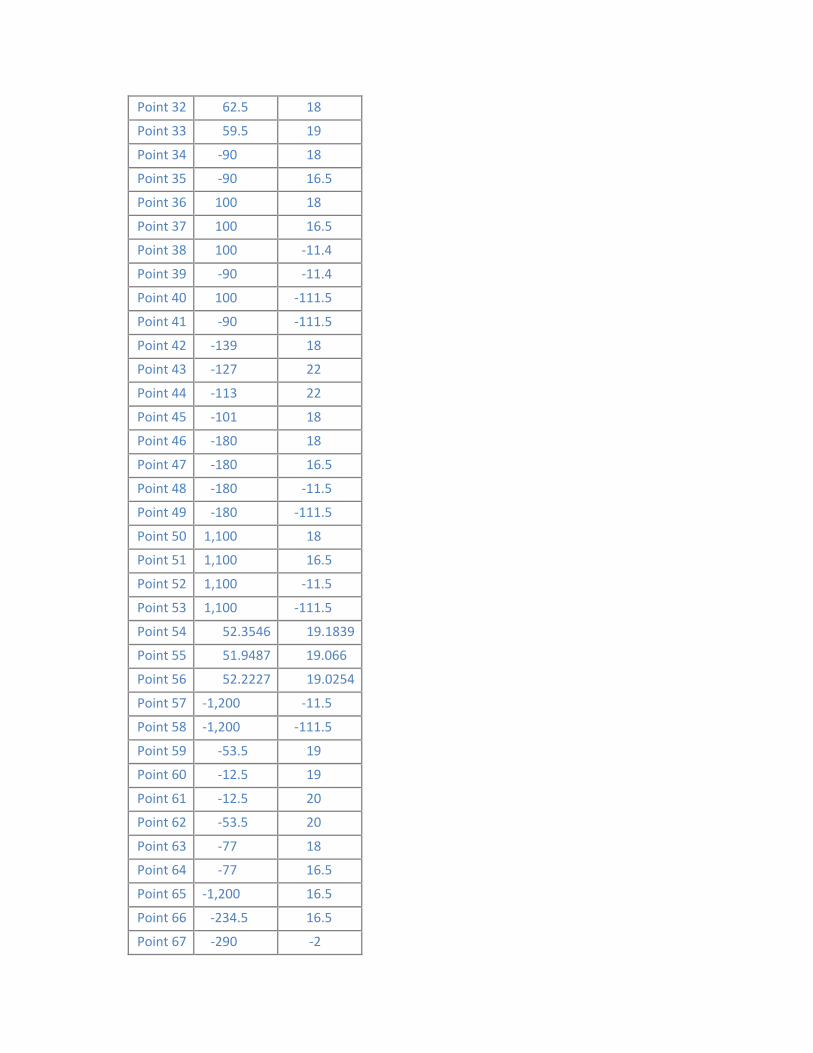
32
33
34
35
36
37
38
39
40
41
42
43
44
45
46
47
48
49
50
51
52
53
54
55
56
57
58
59
60
61
62
63
64
65
66
67
Point 62.5 18
Point 59.5 19
Point ‐90 18
Point ‐90 16.5
Point 100 18
Point 100 16.5
Point 100 ‐11.4
Point ‐90 ‐11.4
Point 100 ‐111.5
Point ‐90 ‐111.5
Point ‐139 18
Point ‐127 22
Point ‐113 22
Point ‐101 18
Point ‐180 18
Point ‐180 16.5
Point ‐180 ‐11.5
Point ‐180 ‐111.5
Point 1,100 18
Point 1,100 16.5
Point 1,100 ‐11.5
Point 1,100 ‐111.5
Point 52.3546 19.1839
Point 51.9487 19.066
Point 52.2227 19.0254
Point ‐1,200 ‐11.5
Point ‐1,200 ‐111.5
Point ‐53.5 19
Point ‐12.5 19
Point ‐12.5 20
Point ‐53.5 20
Point ‐77 18
Point ‐77 16.5
Point ‐1,200 16.5
Point ‐234.5 16.5
Point ‐290 ‐2

Point 68 ‐320 ‐2
Point 69 ‐375.5 16.5
Point 70 ‐230 18
Point 71 ‐1,200 18
Point 72 ‐380 18
Point 73 ‐365 13
Point 74 ‐245 13
Point 75 41.5 25
Point 76 ‐52.5 21
Point 77 ‐52.5 20
Point 78 ‐11.5 19
Point 79 ‐52.5 19
Point 80 ‐52.5 18
Point 81 ‐52.5 16.5
Point 82 ‐62.5 18
Point 83 ‐53.5 18
Point 84 ‐62.5 16.5
Point 85 ‐77 17.25
Point 86 ‐62.5 17.25
Point 87 29.5 29
Lines Start Point End Point Hydraulic Boundary
Line 1 2 3
Line 2 3 4
Line 3 1 6 Drainage
Line 4 6 7
Line 5 7 8
Line 6 8 9
Line 7 9 10
Line 8 10 11
Line 9 11 12
Line 10 12 5
Line 11 13 14
Line 12 14 15
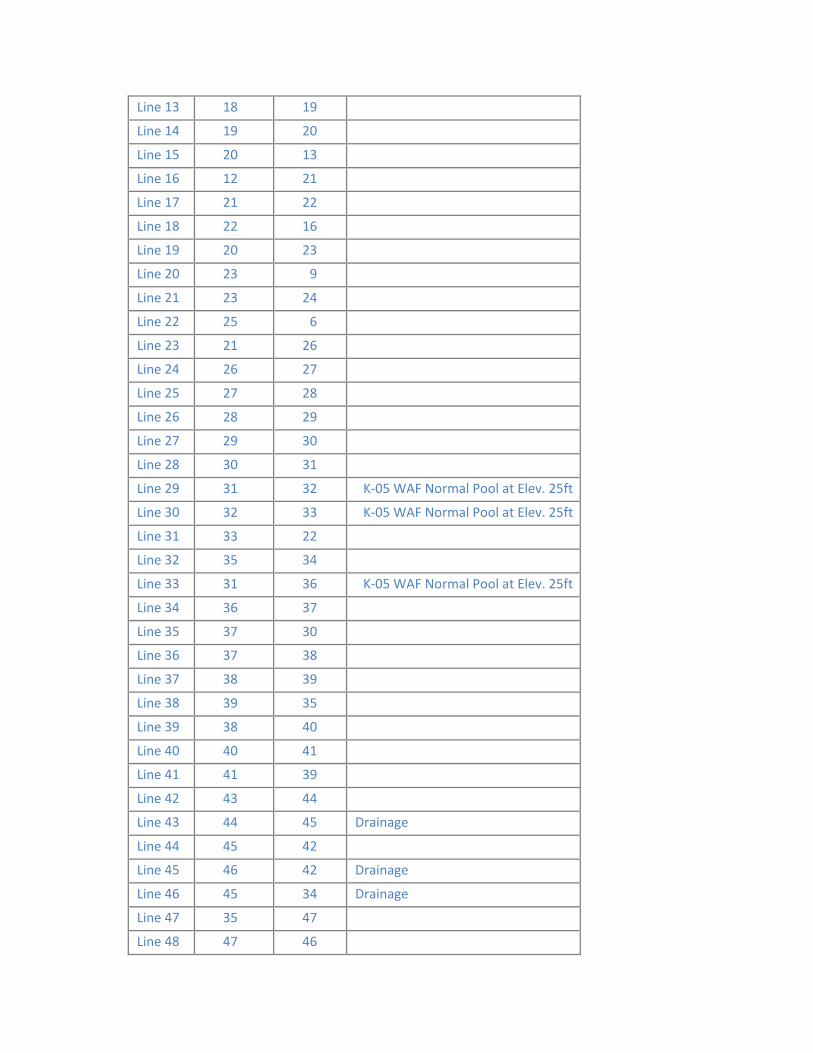
13
14
15
16
17
18
19
20
21
22
23
24
25
26
27
28
29
30
31
32
33
34
35
36
37
38
39
40
41
42
43
44
45
46
47
48
Line 18 19
Line 19 20
Line 20 13
Line 12 21
Line 21 22
Line 22 16
Line 20 23
Line 23 9
Line 23 24
Line 25 6
Line 21 26
Line 26 27
Line 27 28
Line 28 29
Line 29 30
Line 30 31
Line 31 32 K‐05 WAF Normal Pool at Elev. 25ft
Line 32 33 K‐05 WAF Normal Pool at Elev. 25ft
Line 33 22
Line 35 34
Line 31 36 K‐05 WAF Normal Pool at Elev. 25ft
Line 36 37
Line 37 30
Line 37 38
Line 38 39
Line 39 35
Line 38 40
Line 40 41
Line 41 39
Line 43 44
Line 44 45 Drainage
Line 45 42
Line 46 42 Drainage
Line 45 34 Drainage
Line 35 47
Line 47 46
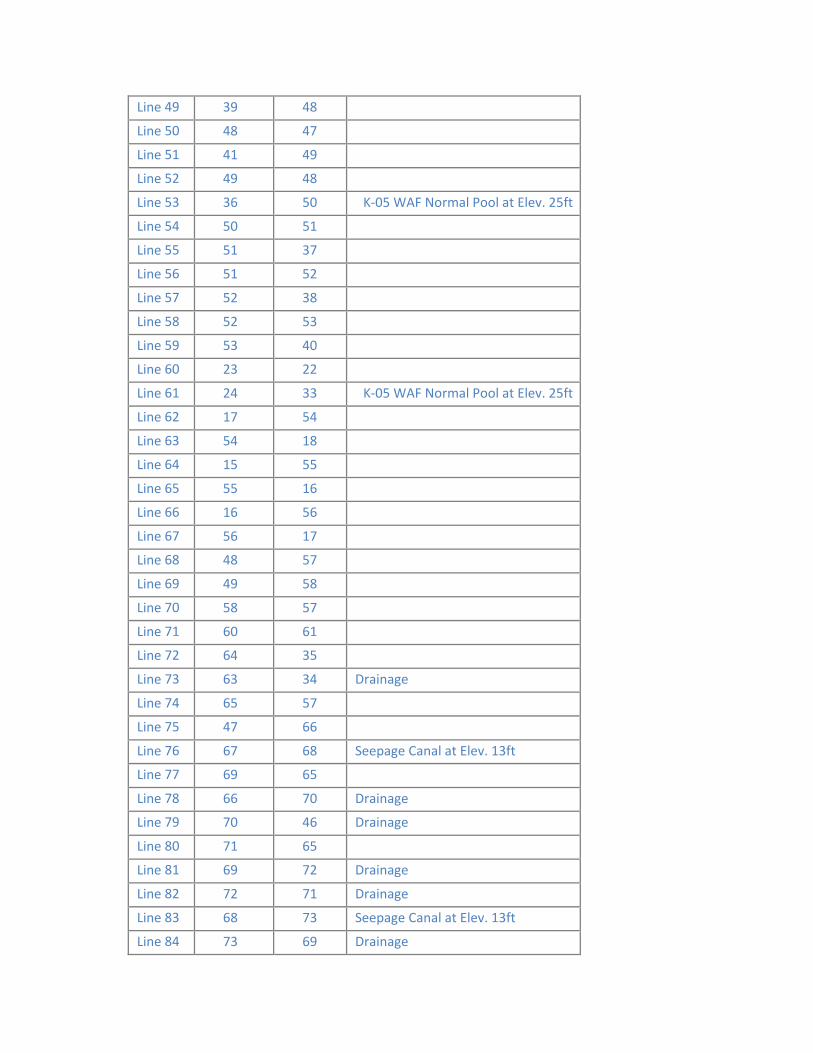
49
50
51
52
53
54
55
56
57
58
59
60
61
62
63
64
65
66
67
68
69
70
71
72
73
74
75
76
77
78
79
80
81
82
83
84
Line 39 48
Line 48 47
Line 41 49
Line 49 48
Line 36 50 K‐05 WAF Normal Pool at Elev. 25ft
Line 50 51
Line 51 37
Line 51 52
Line 52 38
Line 52 53
Line 53 40
Line 23 22
Line 24 33 K‐05 WAF Normal Pool at Elev. 25ft
Line 17 54
Line 54 18
Line 15 55
Line 55 16
Line 16 56
Line 56 17
Line 48 57
Line 49 58
Line 58 57
Line 60 61
Line 64 35
Line 63 34 Drainage
Line 65 57
Line 47 66
Line 67 68 Seepage Canal at Elev. 13ft
Line 69 65
Line 66 70 Drainage
Line 70 46 Drainage
Line 71 65
Line 69 72 Drainage
Line 72 71 Drainage
Line 68 73 Seepage Canal at Elev. 13ft
Line 73 69 Drainage
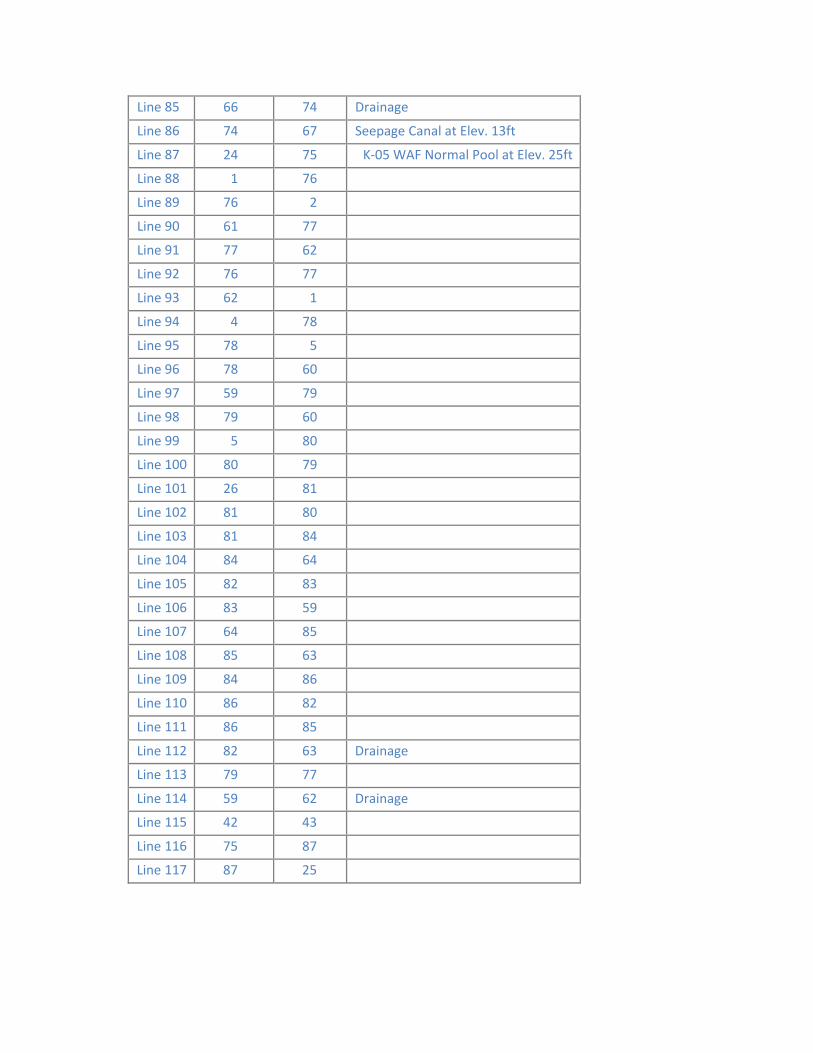
85
86
87
88
89
90
91
92
93
94
95
96
97
98
99
100
101
102
103
104
105
106
107
108
109
110
111
112
113
114
115
116
117
Line 66 74 Drainage
Line 74 67 Seepage Canal at Elev. 13ft
Line 24 75 K‐05 WAF Normal Pool at Elev. 25ft
Line 1 76
Line 76 2
Line 61 77
Line 77 62
Line 76 77
Line 62 1
Line 4 78
Line 78 5
Line 78 60
Line 59 79
Line 79 60
Line 5 80
Line 80 79
Line 26 81
Line 81 80
Line 81 84
Line 84 64
Line 82 83
Line 83 59
Line 64 85
Line 85 63
Line 84 86
Line 86 82
Line 86 85
Line 82 63 Drainage
Line 79 77
Line 59 62 Drainage
Line 42 43
Line 75 87
Line 87 25

1
2
3
4
5
6
7
8
9
10
11
12
13
14
15
16
17
18
Regions Material Points Area (ft²)
Region Matl. 1 ‐ Embankment
Material 1,6,7,8,9,10,11,12,5,78,4,3,2,76 993.93
Region 13,14,15,55,16,56,17,54,18,19,20 0.18474
Region Matl. 8 ‐ Filter Sand 9,10,11,12,21,22,16,55,15,14,13,20,23 49.637
Region Matl. 5 ‐ Soil Cement Armoring
6,7,8,9,23,24,75,87,25 69.1
Region Matl. 5 ‐ Soil Cement
Armoring 22,21,26,27,28,29,30,31,32,33 22.2
Region Matl. 2 ‐ Surficial
Overburden Layer 31,36,37,30 46.05
Region Matl. 4 ‐ Deeper
Marine Deposits 39,38,40,41 19,019
Region Matl. 1 ‐ Embankment Material
42,43,44,45 104
Region Matl. 2 ‐ Surficial Overburden Layer
46,42,45,34,35,47 135
Region Matl. 3 ‐ Shallow
Alluvial Deposits 47,35,39,48 2,515.5
Region Matl. 4 ‐ Deeper
Marine Deposits 48,39,41,49 9,004.5
Region Matl. 2 ‐ Surficial
Overburden Layer 36,50,51,37 1,500
Region Matl. 3 ‐ Shallow Alluvial Deposits
37,51,52,38 27,950
Region Matl. 4 ‐ Deeper Marine Deposits
38,52,53,40 1.0005e+005
Region Matl. 8 ‐ Filter Sand 20,23,22,16,56,17,54,18,19 1.5978
Region Matl. 5 ‐ Soil Cement
Armoring 23,24,33,22 1.6
Region Matl. 4 ‐ Deeper
Marine Deposits 57,48,49,58 1.02e+005
Region Matl. 3 ‐ Shallow Alluvial Deposits
35,39,38,37,30,29,28,27,26,81,84,64 5,297
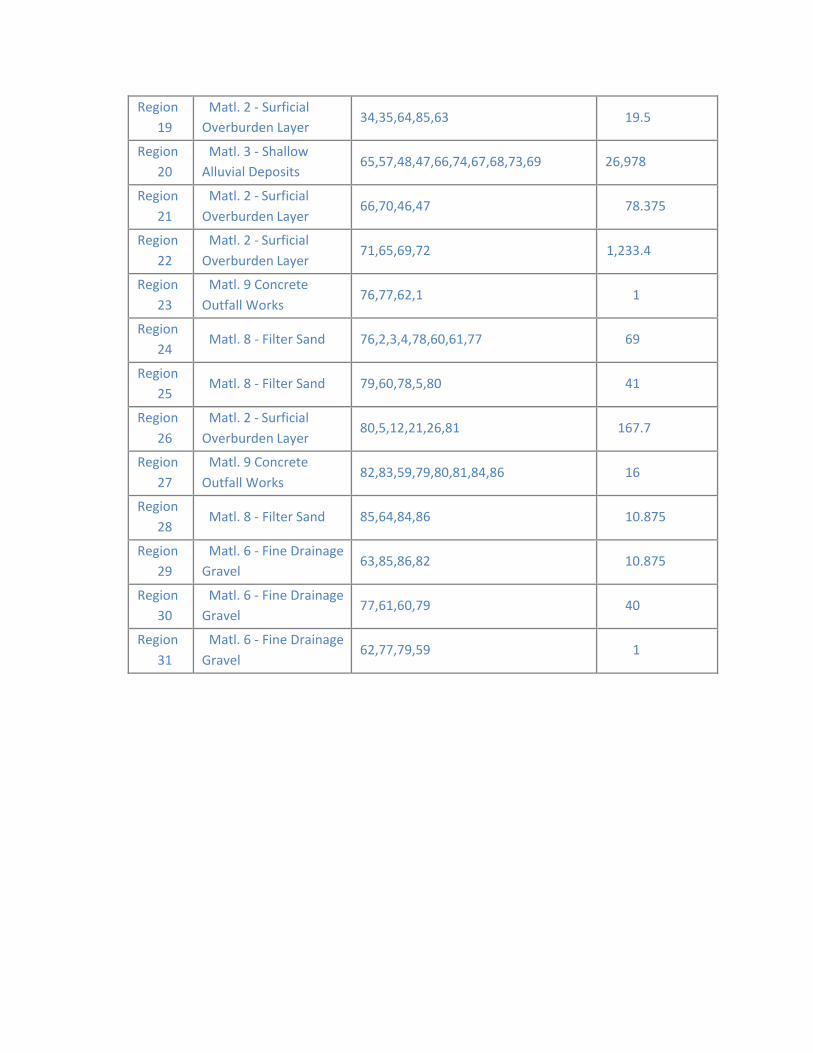
19
20
21
22
23
24
25
26
27
28
29
30
31
Region Matl. 2 ‐ Surficial Overburden Layer
34,35,64,85,63 19.5
Region Matl. 3 ‐ Shallow Alluvial Deposits
65,57,48,47,66,74,67,68,73,69 26,978
Region Matl. 2 ‐ Surficial
Overburden Layer 66,70,46,47 78.375
Region Matl. 2 ‐ Surficial
Overburden Layer 71,65,69,72 1,233.4
Region Matl. 9 Concrete
Outfall Works 76,77,62,1 1
Region Matl. 8 ‐ Filter Sand 76,2,3,4,78,60,61,77 69
Region Matl. 8 ‐ Filter Sand 79,60,78,5,80 41
Region Matl. 2 ‐ Surficial
Overburden Layer 80,5,12,21,26,81 167.7
Region Matl. 9 Concrete
Outfall Works 82,83,59,79,80,81,84,86 16
Region Matl. 8 ‐ Filter Sand 85,64,84,86 10.875
Region Matl. 6 ‐ Fine Drainage Gravel
63,85,86,82 10.875
Region Matl. 6 ‐ Fine Drainage Gravel
77,61,60,79 40
Region Matl. 6 ‐ Fine Drainage
Gravel 62,77,79,59 1
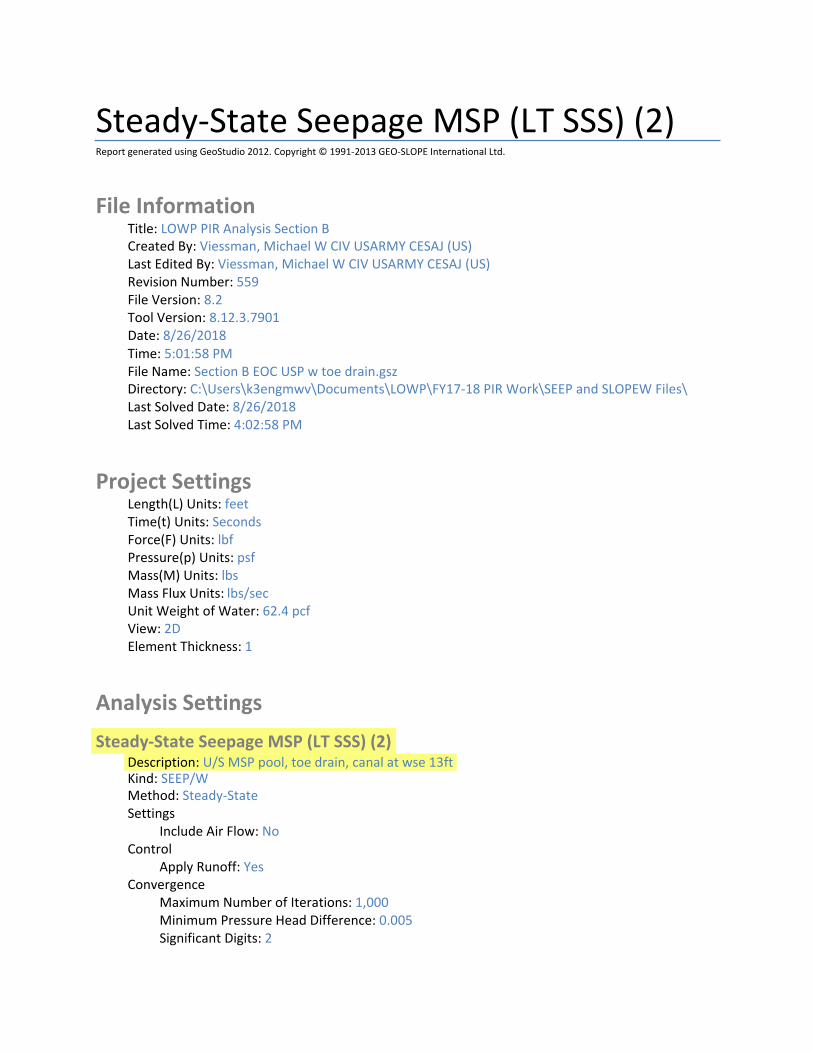
Steady‐State Seepage MSP (LT SSS) (2) Report generated using GeoStudio 2012. Copyright © 1991‐2013 GEO‐SLOPE International Ltd.
File Information Title: LOWP PIR Analysis Section B Created By: Viessman, Michael W CIV USARMY CESAJ (US) Last Edited By: Viessman, Michael W CIV USARMY CESAJ (US) Revision Number: 559 File Version: 8.2 Tool Version: 8.12.3.7901 Date: 8/26/2018 Time: 5:01:58 PM File Name: Section B EOC USP w toe drain.gsz Directory: C:\Users\k3engmwv\Documents\LOWP\FY17‐18 PIR Work\SEEP and SLOPEW Files\ Last Solved Date: 8/26/2018 Last Solved Time: 4:02:58 PM
Project Settings Length(L) Units: feet Time(t) Units: Seconds Force(F) Units: lbf Pressure(p) Units: psf Mass(M) Units: lbs Mass Flux Units: lbs/sec Unit Weight of Water: 62.4 pcf View: 2D Element Thickness: 1
Analysis Settings
Steady‐State Seepage MSP (LT SSS) (2) Description: U/S MSP pool, toe drain, canal at wse 13ft Kind: SEEP/W Method: Steady‐State Settings
Include Air Flow: No Control
Apply Runoff: Yes Convergence
Maximum Number of Iterations: 1,000 Minimum Pressure Head Difference: 0.005 Significant Digits: 2

Max # of Reviews: 10 Hydraulic Under‐Relaxation Criteria
Under‐Relaxation Initial Rate: 1 Under‐Relaxation Min. Rate: 0.1 Under‐Relaxation Reduction Rate: 0.65 Under‐Relaxation Iterations: 10
Equation Solver: Parallel Direct Time
Starting Time: 0 sec Duration: 0 sec Ending Time: 0 sec
Materials
Matl. 1 ‐ Embankment Material Model: Saturated / Unsaturated Hydraulic
K‐Function: Matl. 1 Embankment Material Ky'/Kx' Ratio: 0.25 Rotation: 0 ° Vol. WC. Function: Matl. 1 Embankment Fill from Borrow Areas
Matl. 2 ‐ Surficial Overburden Layer Model: Saturated / Unsaturated Hydraulic
K‐Function: Matl. 2 Surficial Overburden Layer Ky'/Kx' Ratio: 0.1 Rotation: 0 ° Vol. WC. Function: Matl. 2 Surficial Overburden Layer
Matl. 3 ‐ Shallow Alluvial Deposits Model: Saturated / Unsaturated Hydraulic
K‐Function: Matl. 3 Shallow Alluvial Deposits Ky'/Kx' Ratio: 0.1 Rotation: 0 ° Vol. WC. Function: Matl. 3 Shallow Alluvial Deposits
Matl. 4 ‐ Deeper Marine Deposits Model: Saturated / Unsaturated Hydraulic
K‐Function: Matl. 4 Deeper Marine Deposits Ky'/Kx' Ratio: 0.1 Rotation: 0 ° Vol. WC. Function: Matl. 4 Deeper Marine Deposits
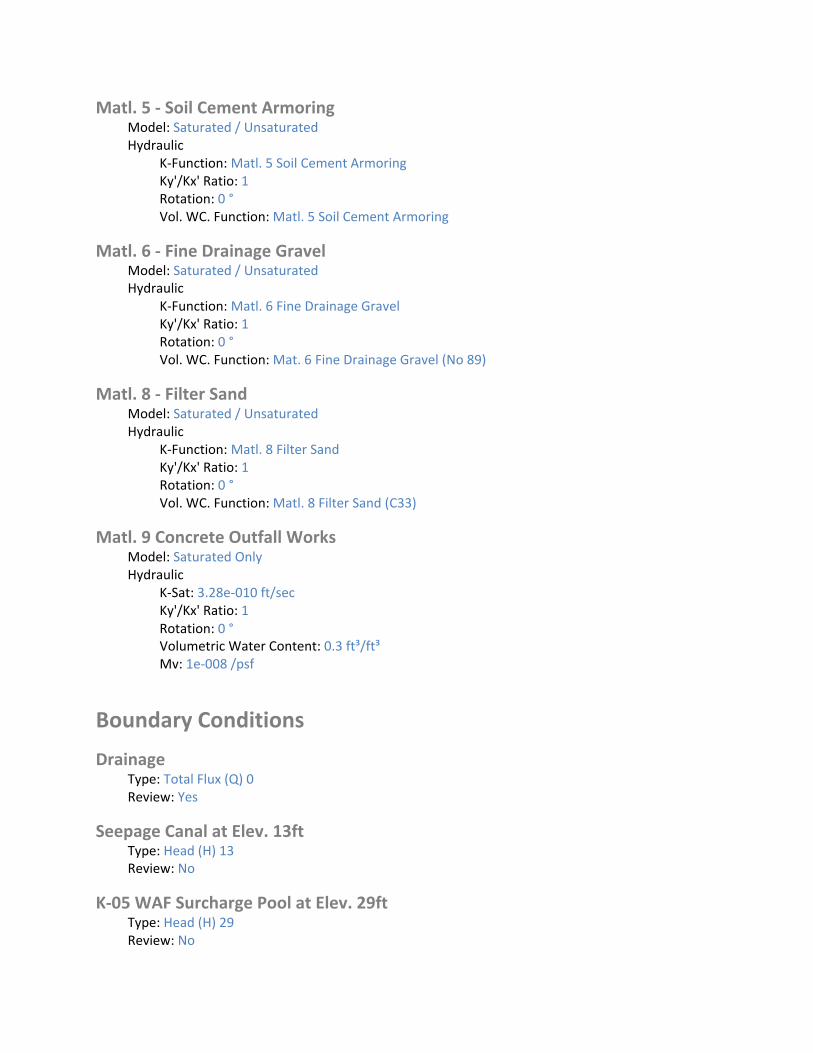
Matl. 5 ‐ Soil Cement Armoring Model: Saturated / Unsaturated Hydraulic
K‐Function: Matl. 5 Soil Cement Armoring Ky'/Kx' Ratio: 1 Rotation: 0 ° Vol. WC. Function: Matl. 5 Soil Cement Armoring
Matl. 6 ‐ Fine Drainage Gravel Model: Saturated / Unsaturated Hydraulic
K‐Function: Matl. 6 Fine Drainage Gravel Ky'/Kx' Ratio: 1 Rotation: 0 ° Vol. WC. Function: Mat. 6 Fine Drainage Gravel (No 89)
Matl. 8 ‐ Filter Sand Model: Saturated / Unsaturated Hydraulic
K‐Function: Matl. 8 Filter Sand Ky'/Kx' Ratio: 1 Rotation: 0 ° Vol. WC. Function: Matl. 8 Filter Sand (C33)
Matl. 9 Concrete Outfall Works Model: Saturated Only Hydraulic
K‐Sat: 3.28e‐010 ft/sec Ky'/Kx' Ratio: 1 Rotation: 0 ° Volumetric Water Content: 0.3 ft³/ft³ Mv: 1e‐008 /psf
Boundary Conditions
Drainage Type: Total Flux (Q) 0 Review: Yes
Seepage Canal at Elev. 13ft Type: Head (H) 13 Review: No
K‐05 WAF Surcharge Pool at Elev. 29ft Type: Head (H) 29 Review: No

Flux Sections
Flux Section 1 Coordinates
Coordinate: (‐53.387097, 20.026507) ft Coordinate: (‐53.387097, 18.965214) ft
Flux Section 2 Coordinates
Coordinate: (‐77.145669, 18.00689) ft Coordinate: (‐77.130906, 16.397638) ft Coordinate: (‐62.322835, 16.373031) ft Coordinate: (‐62.322835, 16.63878) ft
Flux Section 3 Coordinates
Coordinate: (0, 36.6) ft Coordinate: (0, ‐112.3) ft
Flux Section 4 Coordinates
Coordinate: (‐382.8, 18.2) ft Coordinate: (‐319.7, ‐3.4) ft Coordinate: (‐289.2, ‐3.3) ft Coordinate: (‐228.6, 17.7) ft
Flux Section 5 Coordinates
Coordinate: (‐399.8, 18) ft Coordinate: (‐400.1, ‐112.4) ft
K Functions
Matl. 1 Embankment Material Model: Hyd K Data Point Function Function: X‐Conductivity vs. Pore‐Water Pressure
Curve Fit to Data: 100 % Segment Curvature: 36 %
K‐Saturation: 0.000131 Data Points: Matric Suction (psf), X‐Conductivity (ft/sec)
Data Point: (0.01, 0.000131) Data Point: (0.018329807, 0.00013099927) Data Point: (0.033598183, 0.00013099852) Data Point: (0.061584821, 0.00013099772) Data Point: (0.11288379, 0.00013099684) Data Point: (0.20691381, 0.00013099581)
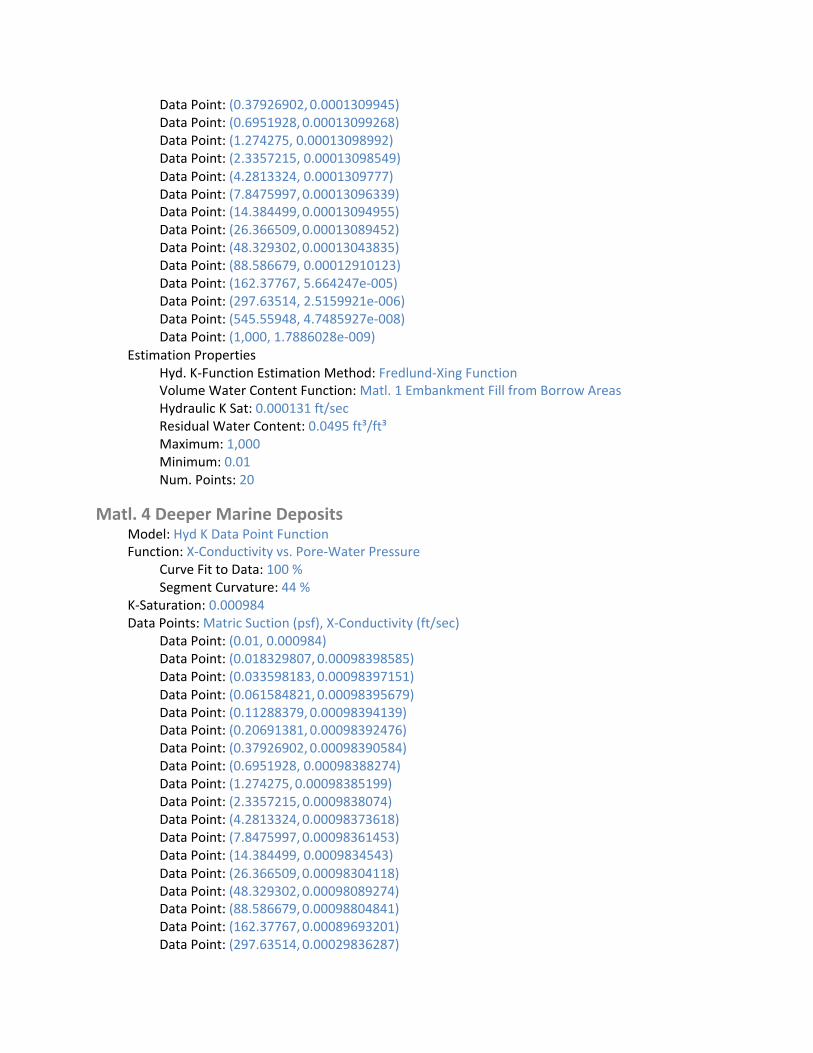
Data Point: (0.37926902,0.0001309945) Data Point: (0.6951928,0.00013099268) Data Point: (1.274275, 0.00013098992) Data Point: (2.3357215, 0.00013098549) Data Point: (4.2813324, 0.0001309777) Data Point: (7.8475997, 0.00013096339) Data Point: (14.384499,0.00013094955) Data Point: (26.366509,0.00013089452) Data Point: (48.329302,0.00013043835) Data Point: (88.586679, 0.00012910123) Data Point: (162.37767, 5.664247e‐005) Data Point: (297.63514, 2.5159921e‐006) Data Point: (545.55948, 4.7485927e‐008) Data Point: (1,000, 1.7886028e‐009)
Estimation Properties Hyd. K‐Function Estimation Method: Fredlund‐Xing Function Volume Water Content Function: Matl. 1 Embankment Fill from Borrow Areas Hydraulic K Sat: 0.000131 ft/sec Residual Water Content: 0.0495 ft³/ft³ Maximum: 1,000 Minimum: 0.01 Num. Points: 20
Matl. 4 Deeper Marine Deposits Model: Hyd K Data Point Function Function: X‐Conductivity vs. Pore‐Water Pressure
Curve Fit to Data: 100 % Segment Curvature: 44 %
K‐Saturation: 0.000984 Data Points: Matric Suction (psf), X‐Conductivity (ft/sec)
Data Point: (0.01, 0.000984) Data Point: (0.018329807, 0.00098398585) Data Point: (0.033598183, 0.00098397151) Data Point: (0.061584821, 0.00098395679) Data Point: (0.11288379, 0.00098394139) Data Point: (0.20691381, 0.00098392476) Data Point: (0.37926902, 0.00098390584) Data Point: (0.6951928, 0.00098388274) Data Point: (1.274275, 0.00098385199) Data Point: (2.3357215, 0.0009838074) Data Point: (4.2813324,0.00098373618) Data Point: (7.8475997,0.00098361453) Data Point: (14.384499, 0.0009834543) Data Point: (26.366509,0.00098304118) Data Point: (48.329302,0.00098089274) Data Point: (88.586679,0.00098804841) Data Point: (162.37767,0.00089693201) Data Point: (297.63514,0.00029836287)

Data Point: (545.55948, 5.5741791e‐006) Data Point: (1,000, 8.8545842e‐008)
Estimation Properties Hyd. K‐Function Estimation Method: Fredlund‐Xing Function Volume Water Content Function: Matl. 4 Deeper Marine Deposits Hydraulic K Sat: 0.000984 ft/sec Residual Water Content: 0.03 ft³/ft³ Maximum: 1,000 Minimum: 0.01 Num. Points: 20
Matl. 6 Fine Drainage Gravel Model: Hyd K Data Point Function Function: X‐Conductivity vs. Pore‐Water Pressure
Curve Fit to Data: 100 % Segment Curvature: 40 %
K‐Saturation: 0.0116 Data Points: Matric Suction (psf), X‐Conductivity (ft/sec)
Data Point: (0.01, 0.0116) Data Point: (0.018329807, 0.011599999) Data Point: (0.033598183, 0.011599999) Data Point: (0.061584821, 0.011599997) Data Point: (0.11288379, 0.011599992) Data Point: (0.20691381, 0.011599991) Data Point: (0.37926902, 0.011600028) Data Point: (0.6951928, 0.011599657) Data Point: (1.274275, 0.011599409) Data Point: (2.3357215, 0.011606742) Data Point: (4.2813324, 0.01023118) Data Point: (7.8475997, 0.0019666911) Data Point: (14.384499, 3.3083667e‐005) Data Point: (26.366509, 3.5079262e‐007) Data Point: (48.329302, 1.0209264e‐008) Data Point: (88.586679, 1.7809046e‐009) Data Point: (162.37767, 3.7872508e‐010) Data Point: (297.63514, 7.9282799e‐011) Data Point: (545.55948, 1.3312429e‐011) Data Point: (1,000, 1.2335483e‐012)
Estimation Properties Hyd. K‐Function Estimation Method: Fredlund‐Xing Function Volume Water Content Function: Mat. 6 Fine Drainage Gravel (No 89) Hydraulic K Sat: 0.0116 ft/sec Residual Water Content: 0.042 ft³/ft³ Maximum: 1,000 Minimum: 0.01 Num. Points: 20

Matl. 2 Surficial Overburden Layer Model: Hyd K Data Point Function Function: X‐Conductivity vs. Pore‐Water Pressure
Curve Fit to Data: 100 % Segment Curvature: 36 %
K‐Saturation: 0.00026 Data Points: Matric Suction (psf), X‐Conductivity (ft/sec)
Data Point: (0.01, 0.00026) Data Point: (0.018329807, 0.00025999835) Data Point: (0.033598183, 0.00025999664) Data Point: (0.061584821, 0.00025999485) Data Point: (0.11288379, 0.00025999288) Data Point: (0.20691381, 0.00025999062) Data Point: (0.37926902, 0.00025998779) Data Point: (0.6951928, 0.00025998393) Data Point: (1.274275, 0.00025997819) Data Point: (2.3357215,0.00025996907) Data Point: (4.2813324,0.00025995329) Data Point: (7.8475997,0.00025992467) Data Point: (14.384499,0.00025989276) Data Point: (26.366509,0.00025978642) Data Point: (48.329302,0.00025903344) Data Point: (88.586679, 0.0002586222) Data Point: (162.37767, 0.00013432217) Data Point: (297.63514, 8.1547435e‐006) Data Point: (545.55948, 1.3663567e‐007) Data Point: (1,000, 4.5608744e‐009)
Estimation Properties Hyd. K‐Function Estimation Method: Fredlund‐Xing Function Volume Water Content Function: Matl. 2 Surficial Overburden Layer Hydraulic K Sat: 0.00026 ft/sec Residual Water Content: 0.0495 ft³/ft³ Maximum: 1,000 Minimum: 0.01 Num. Points: 20
Matl. 3 Shallow Alluvial Deposits Model: Hyd K Data Point Function Function: X‐Conductivity vs. Pore‐Water Pressure
Curve Fit to Data: 100 % Segment Curvature: 36 %
K‐Saturation: 0.00174 Data Points: Matric Suction (psf), X‐Conductivity (ft/sec)
Data Point: (0.01, 0.00174) Data Point: (0.018329807, 0.0017399903) Data Point: (0.033598183, 0.0017399803) Data Point: (0.061584821, 0.0017399698)

Data Point: (0.11288379,0.0017399581) Data Point: (0.20691381,0.0017399444) Data Point: (0.37926902,0.0017399269) Data Point: (0.6951928, 0.0017399027) Data Point: (1.274275, 0.0017398661) Data Point: (2.3357215, 0.0017398072) Data Point: (4.2813324, 0.0017397038) Data Point: (7.8475997, 0.0017395137) Data Point: (14.384499, 0.0017393299) Data Point: (26.366509, 0.001738599) Data Point: (48.329302, 0.0017325399) Data Point: (88.586679, 0.0017147796) Data Point: (162.37767, 0.00075235037) Data Point: (297.63514, 3.3418521e‐005) Data Point: (545.55948, 6.307291e‐007) Data Point: (1,000, 2.3757014e‐008)
Estimation Properties Hyd. K‐Function Estimation Method: Fredlund‐Xing Function Volume Water Content Function: Matl. 3 Shallow Alluvial Deposits Hydraulic K Sat: 0.00174 ft/sec Residual Water Content: 0.0495 ft³/ft³ Maximum: 1,000 Minimum: 0.01 Num. Points: 20
Matl. 5 Soil Cement Armoring Model: Hyd K Data Point Function Function: X‐Conductivity vs. Pore‐Water Pressure
Curve Fit to Data: 100 % Segment Curvature: 44 %
K‐Saturation: 1.31e‐005 Data Points: Matric Suction (psf), X‐Conductivity (ft/sec)
Data Point: (0.01, 1.31e‐005) Data Point: (0.018329807, 1.3099927e‐005) Data Point: (0.033598183, 1.3099852e‐005) Data Point: (0.061584821, 1.3099772e‐005) Data Point: (0.11288379, 1.3099684e‐005) Data Point: (0.20691381, 1.3099581e‐005) Data Point: (0.37926902, 1.309945e‐005) Data Point: (0.6951928, 1.3099268e‐005) Data Point: (1.274275, 1.3098992e‐005) Data Point: (2.3357215, 1.3098549e‐005) Data Point: (4.2813324, 1.309777e‐005) Data Point: (7.8475997, 1.3096339e‐005) Data Point: (14.384499, 1.3094955e‐005) Data Point: (26.366509, 1.3089452e‐005) Data Point: (48.329302, 1.3043835e‐005) Data Point: (88.586679, 1.2910123e‐005)

Data Point: (162.37767, 5.664247e‐006) Data Point: (297.63514, 2.5159921e‐007) Data Point: (545.55948, 4.7485927e‐009) Data Point: (1,000, 1.7886028e‐010)
Estimation Properties Hyd. K‐Function Estimation Method: Fredlund‐Xing Function Volume Water Content Function: Matl. 5 Soil Cement Armoring Hydraulic K Sat: 1.31e‐005 ft/sec Residual Water Content: 0.03 ft³/ft³ Maximum: 1,000 Minimum: 0.01 Num. Points: 20
Matl. 8 Filter Sand Model: Hyd K Data Point Function Function: X‐Conductivity vs. Pore‐Water Pressure
Curve Fit to Data: 100 % Segment Curvature: 44 %
K‐Saturation: 0.000925 Data Points: Matric Suction (psf), X‐Conductivity (ft/sec)
Data Point: (0.01, 0.000925) Data Point: (0.018329807, 0.00092499993) Data Point: (0.033598183, 0.00092499981) Data Point: (0.061584821, 0.0009249996) Data Point: (0.11288379, 0.00092499919) Data Point: (0.20691381, 0.00092499854) Data Point: (0.37926902, 0.00092499785) Data Point: (0.6951928, 0.00092499117) Data Point: (1.274275, 0.00092498427) Data Point: (2.3357215,0.00092515575) Data Point: (4.2813324,0.00092444336) Data Point: (7.8475997,0.00092025484) Data Point: (14.384499,0.00086768248) Data Point: (26.366509, 0.00022215817) Data Point: (48.329302, 5.6149022e‐006) Data Point: (88.586679, 9.4931606e‐008) Data Point: (162.37767, 4.4270536e‐009) Data Point: (297.63514, 6.3580973e‐010) Data Point: (545.55948, 1.1244323e‐010) Data Point: (1,000, 1.0762229e‐011)
Estimation Properties Hyd. K‐Function Estimation Method: Fredlund‐Xing Function Volume Water Content Function: Matl. 8 Filter Sand (C33) Hydraulic K Sat: 0.000925 ft/sec Residual Water Content: 0.03 ft³/ft³ Maximum: 1,000 Minimum: 0.01 Num. Points: 20

Vol. Water Content Functions
Matl. 3 Shallow Alluvial Deposits Model: Vol WC Data Point Function Function: Vol. Water Content vs. Pore‐Water Pressure
Mv: 2.5e‐006 /psf Saturated Water Content: 0.30020276 ft³/ft³ Residual Water Content: 0.030020276 ft³/ft³ Curve Fit to Data: 100 % Segment Curvature: 40 %
Porosity: 0.30020276 Data Points: Matric Suction (psf), Vol. Water Content (ft³/ft³)
Data Point: (0.01, 0.29987196) Data Point: (0.018329807, 0.29987196) Data Point: (0.033598183, 0.29987196) Data Point: (0.061584821, 0.29987196) Data Point: (0.11288379, 0.29987196) Data Point: (0.20691381, 0.29987196) Data Point: (0.37926902, 0.29987196) Data Point: (0.6951928, 0.29987196) Data Point: (1.274275, 0.29987196) Data Point: (2.3357215, 0.29987196) Data Point: (4.2813324, 0.29987196) Data Point: (7.8475997, 0.29987196) Data Point: (14.384499, 0.29987196) Data Point: (26.366509, 0.29987196) Data Point: (48.329302, 0.29987196) Data Point: (88.586679, 0.29667682) Data Point: (162.37767, 0.20150036) Data Point: (297.63514, 0.085811521) Data Point: (545.55948, 0.049379583) Data Point: (1,000, 0.039446735)
Estimation Properties Vol. WC Estimation Method: Grain Size Function Saturated Water Content: 0.3 ft³/ft³ Sample Material: Clay Liquid Limit: 0 % Diameter at 10% passing: 0.07000000000000001 Diameter at 60% passing: 0.2 Maximum: 1,000 Minimum: 0.01 Num. Points: 20
Matl. 1 Embankment Fill from Borrow Areas Model: Vol WC Data Point Function Function: Vol. Water Content vs. Pore‐Water Pressure
Mv: 2.5e‐006 /psf

Saturated Water Content: 0.30020276 ft³/ft³ Residual Water Content: 0.030020276 ft³/ft³ Curve Fit to Data: 100 % Segment Curvature: 40 %
Porosity: 0.30020276 Data Points: Matric Suction (psf), Vol. Water Content (ft³/ft³)
Data Point: (0.01, 0.29987196) Data Point: (0.018329807, 0.29987196) Data Point: (0.033598183, 0.29987196) Data Point: (0.061584821, 0.29987196) Data Point: (0.11288379, 0.29987196) Data Point: (0.20691381, 0.29987196) Data Point: (0.37926902, 0.29987196) Data Point: (0.6951928, 0.29987196) Data Point: (1.274275, 0.29987196) Data Point: (2.3357215, 0.29987196) Data Point: (4.2813324, 0.29987196) Data Point: (7.8475997, 0.29987196) Data Point: (14.384499, 0.29987196) Data Point: (26.366509, 0.29987196) Data Point: (48.329302, 0.29987196) Data Point: (88.586679, 0.29667682) Data Point: (162.37767, 0.20150036) Data Point: (297.63514, 0.085811521) Data Point: (545.55948, 0.049379583) Data Point: (1,000, 0.039446735)
Estimation Properties Vol. WC Estimation Method: Grain Size Function Saturated Water Content: 0.3 ft³/ft³ Sample Material: Clay Liquid Limit: 0 % Diameter at 10% passing: 0.07000000000000001 Diameter at 60% passing: 0.2 Maximum: 1,000 Minimum: 0.01 Num. Points: 20
Matl. 2 Surficial Overburden Layer Model: Vol WC Data Point Function Function: Vol. Water Content vs. Pore‐Water Pressure
Mv: 2.5e‐006 /psf Saturated Water Content: 0.30132774 ft³/ft³ Residual Water Content: 0.030132774 ft³/ft³ Curve Fit to Data: 100 % Segment Curvature: 40 %
Porosity: 0.30132774 Data Points: Matric Suction (psf), Vol. Water Content (ft³/ft³)
Data Point: (0.01, 0.30110223)

Data Point: (0.018329807, 0.30110223) Data Point: (0.033598183, 0.30110223) Data Point: (0.061584821, 0.30110223) Data Point: (0.11288379, 0.30110223) Data Point: (0.20691381, 0.30110223) Data Point: (0.37926902, 0.30110223) Data Point: (0.6951928, 0.30110223) Data Point: (1.274275, 0.30110223) Data Point: (2.3357215, 0.30110223) Data Point: (4.2813324, 0.30110223) Data Point: (7.8475997, 0.30110223) Data Point: (14.384499, 0.30110223) Data Point: (26.366509, 0.30110223) Data Point: (48.329302, 0.30110223) Data Point: (88.586679, 0.29938489) Data Point: (162.37767, 0.21986255) Data Point: (297.63514, 0.094851578) Data Point: (545.55948, 0.051777012) Data Point: (1,000, 0.040605935)
Estimation Properties Vol. WC Estimation Method: Grain Size Function Saturated Water Content: 0.3 ft³/ft³ Sample Material: Clay Liquid Limit: 0 % Diameter at 10% passing: 0.07000000000000001 Diameter at 60% passing: 0.18 Maximum: 1,000 Minimum: 0.01 Num. Points: 20
Matl. 8 Filter Sand (C33) Model: Vol WC Data Point Function Function: Vol. Water Content vs. Pore‐Water Pressure
Mv: 8e‐007 /psf Saturated Water Content: 0.30081752 ft³/ft³ Residual Water Content: 0.030081752 ft³/ft³ Curve Fit to Data: 100 % Segment Curvature: 48 %
Porosity: 0.30081752 Data Points: Matric Suction (psf), Vol. Water Content (ft³/ft³)
Data Point: (0.01, 0.30028388) Data Point: (0.018329807, 0.30028388) Data Point: (0.033598183, 0.30028388) Data Point: (0.061584821, 0.30028388) Data Point: (0.11288379, 0.30028388) Data Point: (0.20691381, 0.30028388) Data Point: (0.37926902, 0.30028388) Data Point: (0.6951928, 0.30028388)
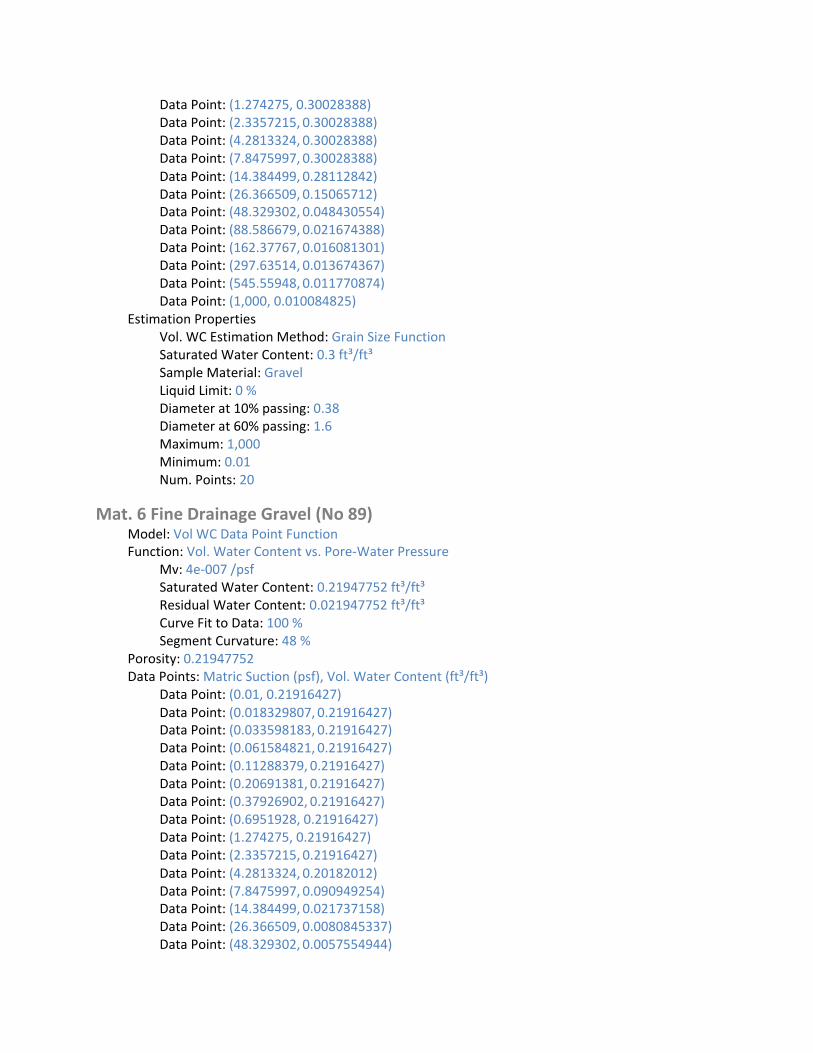
Data Point: (1.274275, 0.30028388) Data Point: (2.3357215, 0.30028388) Data Point: (4.2813324, 0.30028388) Data Point: (7.8475997, 0.30028388) Data Point: (14.384499, 0.28112842) Data Point: (26.366509, 0.15065712) Data Point: (48.329302, 0.048430554) Data Point: (88.586679, 0.021674388) Data Point: (162.37767, 0.016081301) Data Point: (297.63514, 0.013674367) Data Point: (545.55948, 0.011770874) Data Point: (1,000, 0.010084825)
Estimation Properties Vol. WC Estimation Method: Grain Size Function Saturated Water Content: 0.3 ft³/ft³ Sample Material: Gravel Liquid Limit: 0 % Diameter at 10% passing: 0.38 Diameter at 60% passing: 1.6 Maximum: 1,000 Minimum: 0.01 Num. Points: 20
Mat. 6 Fine Drainage Gravel (No 89) Model: Vol WC Data Point Function Function: Vol. Water Content vs. Pore‐Water Pressure
Mv: 4e‐007 /psf Saturated Water Content: 0.21947752 ft³/ft³ Residual Water Content: 0.021947752 ft³/ft³ Curve Fit to Data: 100 % Segment Curvature: 48 %
Porosity: 0.21947752 Data Points: Matric Suction (psf), Vol. Water Content (ft³/ft³)
Data Point: (0.01, 0.21916427) Data Point: (0.018329807, 0.21916427) Data Point: (0.033598183, 0.21916427) Data Point: (0.061584821, 0.21916427) Data Point: (0.11288379, 0.21916427) Data Point: (0.20691381, 0.21916427) Data Point: (0.37926902, 0.21916427) Data Point: (0.6951928, 0.21916427) Data Point: (1.274275, 0.21916427) Data Point: (2.3357215, 0.21916427) Data Point: (4.2813324, 0.20182012) Data Point: (7.8475997, 0.090949254) Data Point: (14.384499, 0.021737158) Data Point: (26.366509, 0.0080845337) Data Point: (48.329302, 0.0057554944)

Data Point: (88.586679, 0.0048689464) Data Point: (162.37767, 0.0041947283) Data Point: (297.63514, 0.0036057207) Data Point: (545.55948, 0.0030872724) Data Point: (1,000, 0.002632805)
Estimation Properties Vol. WC Estimation Method: Grain Size Function Saturated Water Content: 0.21875 ft³/ft³ Sample Material: Clay Liquid Limit: 0 % Diameter at 10% passing: 3.5 Diameter at 60% passing: 7.1 Maximum: 1,000 Minimum: 0.01 Num. Points: 20
Matl. 4 Deeper Marine Deposits Model: Vol WC Data Point Function Function: Vol. Water Content vs. Pore‐Water Pressure
Mv: 2.5e‐006 /psf Saturated Water Content: 0.30154597 ft³/ft³ Residual Water Content: 0.030154597 ft³/ft³ Curve Fit to Data: 100 % Segment Curvature: 40 %
Porosity: 0.30154597 Data Points: Matric Suction (psf), Vol. Water Content (ft³/ft³)
Data Point: (0.01, 0.30100508) Data Point: (0.018329807, 0.30100508) Data Point: (0.033598183, 0.30100508) Data Point: (0.061584821, 0.30100508) Data Point: (0.11288379, 0.30100508) Data Point: (0.20691381, 0.30100508) Data Point: (0.37926902, 0.30100508) Data Point: (0.6951928, 0.30100508) Data Point: (1.274275, 0.30100508) Data Point: (2.3357215, 0.30100508) Data Point: (4.2813324, 0.30100508) Data Point: (7.8475997, 0.30100508) Data Point: (14.384499, 0.30100508) Data Point: (26.366509, 0.30100508) Data Point: (48.329302, 0.30100508) Data Point: (88.586679, 0.30100508) Data Point: (162.37767, 0.2887592) Data Point: (297.63514, 0.17412515) Data Point: (545.55948, 0.076942285) Data Point: (1,000, 0.051397358)
Estimation Properties Vol. WC Estimation Method: Grain Size Function
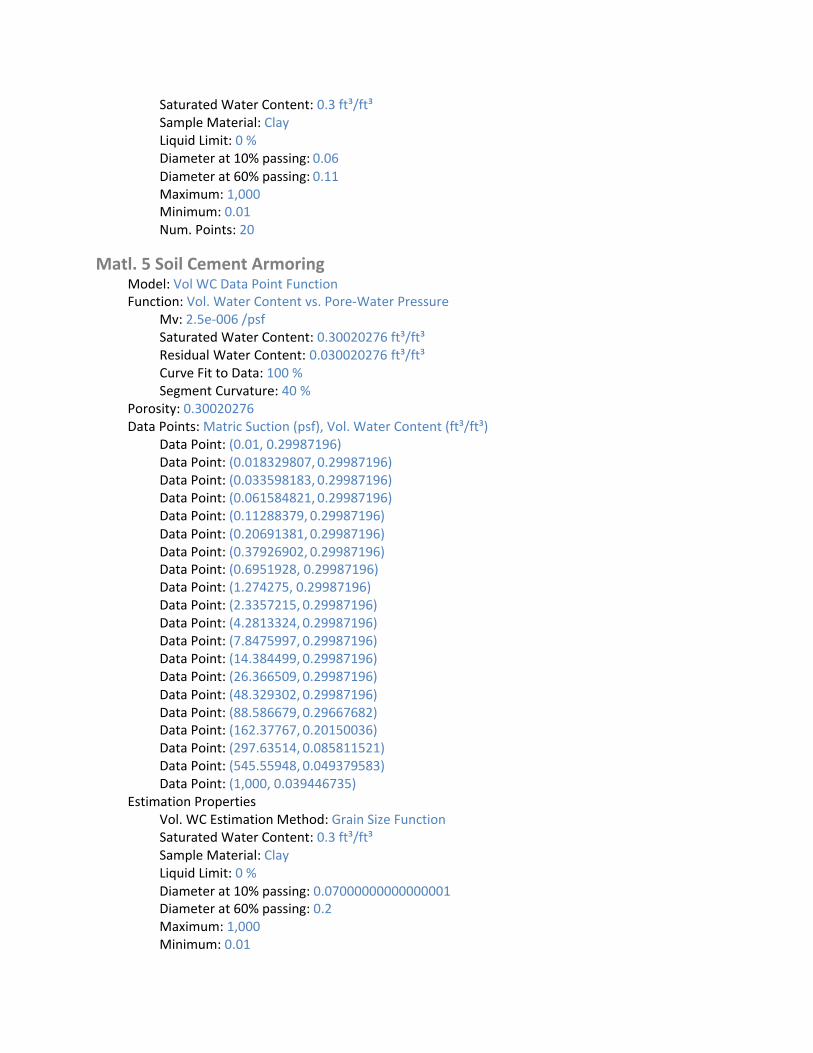
Saturated Water Content: 0.3 ft³/ft³ Sample Material: Clay Liquid Limit: 0 % Diameter at 10% passing: 0.06 Diameter at 60% passing: 0.11 Maximum: 1,000 Minimum: 0.01 Num. Points: 20
Matl. 5 Soil Cement Armoring Model: Vol WC Data Point Function Function: Vol. Water Content vs. Pore‐Water Pressure
Mv: 2.5e‐006 /psf Saturated Water Content: 0.30020276 ft³/ft³ Residual Water Content: 0.030020276 ft³/ft³ Curve Fit to Data: 100 % Segment Curvature: 40 %
Porosity: 0.30020276 Data Points: Matric Suction (psf), Vol. Water Content (ft³/ft³)
Data Point: (0.01, 0.29987196) Data Point: (0.018329807, 0.29987196) Data Point: (0.033598183, 0.29987196) Data Point: (0.061584821, 0.29987196) Data Point: (0.11288379, 0.29987196) Data Point: (0.20691381, 0.29987196) Data Point: (0.37926902, 0.29987196) Data Point: (0.6951928, 0.29987196) Data Point: (1.274275, 0.29987196) Data Point: (2.3357215, 0.29987196) Data Point: (4.2813324, 0.29987196) Data Point: (7.8475997, 0.29987196) Data Point: (14.384499, 0.29987196) Data Point: (26.366509, 0.29987196) Data Point: (48.329302, 0.29987196) Data Point: (88.586679, 0.29667682) Data Point: (162.37767, 0.20150036) Data Point: (297.63514, 0.085811521) Data Point: (545.55948, 0.049379583) Data Point: (1,000, 0.039446735)
Estimation Properties Vol. WC Estimation Method: Grain Size Function Saturated Water Content: 0.3 ft³/ft³ Sample Material: Clay Liquid Limit: 0 % Diameter at 10% passing: 0.07000000000000001 Diameter at 60% passing: 0.2 Maximum: 1,000 Minimum: 0.01

5
10
15
20
25
30
Num. Points: 20
Points X (ft) Y (ft)
Point 1 ‐53.5 21
Point 2 ‐14.5 21
Point 3 ‐14.5 30
Point 4 ‐11.5 30
Point ‐11.5 18
Point 6 ‐7 36.5
Point 7 ‐7 35.5
Point 8 6.8 35.5
Point 9 14 33
Point 13.7 32.1
Point 11 48.6 20.5
Point 12 51.2 18
Point 13 52.0033 19.4828
Point 14 51.9 19.4
Point 51.8636 19.2065
Point 16 52.097 19.0075
Point 17 52.3031 19.0832
Point 18 52.3561 19.2916
Point 19 52.3 19.4
Point 52.1797 19.4906
Point 21 59.3 18
Point 22 56.3 19
Point 23 54.8 19.5
Point 24 58 19.5
Point 7 36.5
Point 26 59.3 16.5
Point 27 67.3 16.5
Point 28 67.3 14.5
Point 29 69.3 14.5
Point 69.3 16.5
Point 31 69.3 18

32
33
34
35
36
37
38
39
40
41
42
43
44
45
46
47
48
49
50
51
52
53
54
55
56
57
58
59
60
61
62
63
64
65
66
67
Point 62.5 18
Point 59.5 19
Point ‐90 18
Point ‐90 16.5
Point 100 18
Point 100 16.5
Point 100 ‐11.4
Point ‐90 ‐11.4
Point 100 ‐111.5
Point ‐90 ‐111.5
Point ‐139 18
Point ‐127 22
Point ‐113 22
Point ‐101 18
Point ‐180 18
Point ‐180 16.5
Point ‐180 ‐11.5
Point ‐180 ‐111.5
Point 1,100 18
Point 1,100 16.5
Point 1,100 ‐11.5
Point 1,100 ‐111.5
Point 52.3546 19.1839
Point 51.9487 19.066
Point 52.2227 19.0254
Point ‐1,200 ‐11.5
Point ‐1,200 ‐111.5
Point ‐53.5 19
Point ‐12.5 19
Point ‐12.5 20
Point ‐53.5 20
Point ‐77 18
Point ‐77 16.5
Point ‐1,200 16.5
Point ‐234.5 16.5
Point ‐290 ‐2
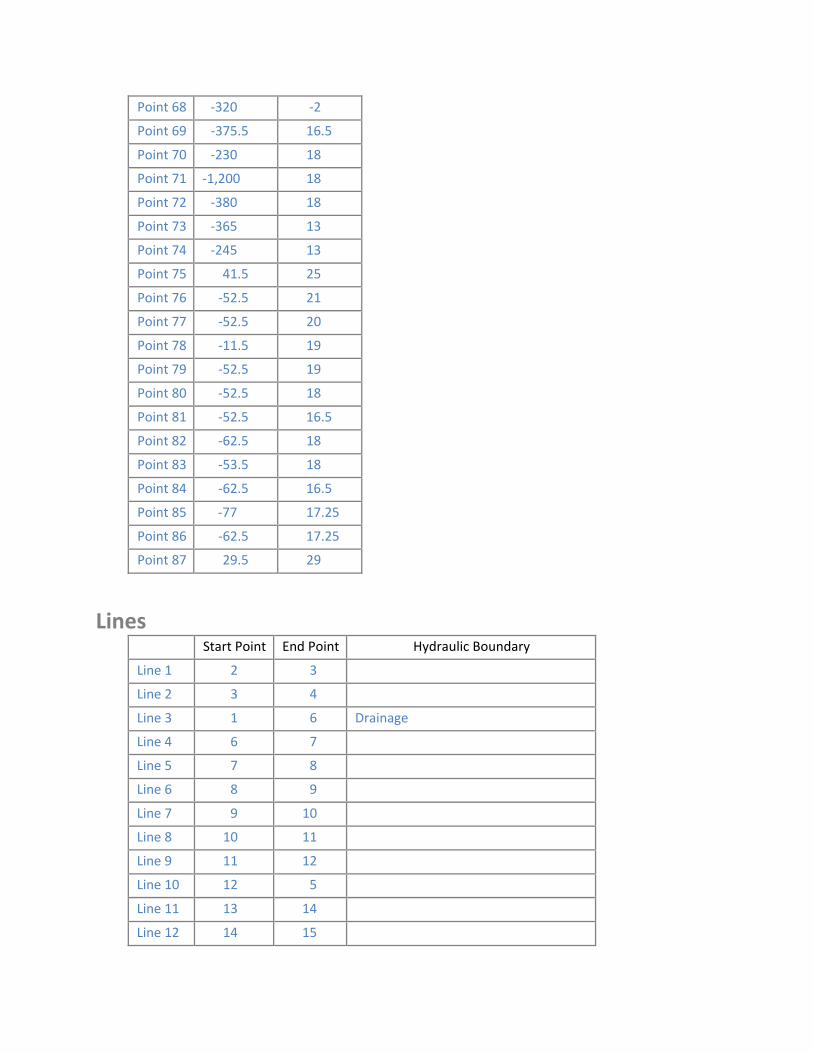
Point 68 ‐320 ‐2
Point 69 ‐375.5 16.5
Point 70 ‐230 18
Point 71 ‐1,200 18
Point 72 ‐380 18
Point 73 ‐365 13
Point 74 ‐245 13
Point 75 41.5 25
Point 76 ‐52.5 21
Point 77 ‐52.5 20
Point 78 ‐11.5 19
Point 79 ‐52.5 19
Point 80 ‐52.5 18
Point 81 ‐52.5 16.5
Point 82 ‐62.5 18
Point 83 ‐53.5 18
Point 84 ‐62.5 16.5
Point 85 ‐77 17.25
Point 86 ‐62.5 17.25
Point 87 29.5 29
Lines Start Point End Point Hydraulic Boundary
Line 1 2 3
Line 2 3 4
Line 3 1 6 Drainage
Line 4 6 7
Line 5 7 8
Line 6 8 9
Line 7 9 10
Line 8 10 11
Line 9 11 12
Line 10 12 5
Line 11 13 14
Line 12 14 15
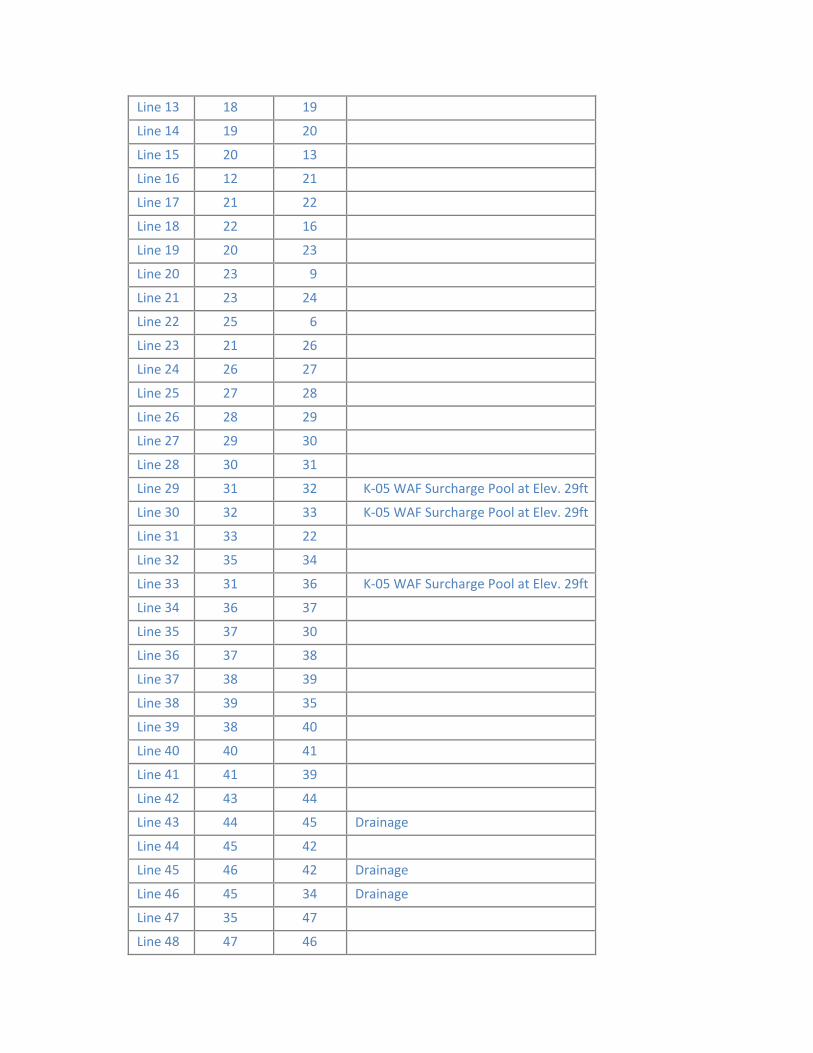
13
14
15
16
17
18
19
20
21
22
23
24
25
26
27
28
29
30
31
32
33
34
35
36
37
38
39
40
41
42
43
44
45
46
47
48
Line 18 19
Line 19 20
Line 20 13
Line 12 21
Line 21 22
Line 22 16
Line 20 23
Line 23 9
Line 23 24
Line 25 6
Line 21 26
Line 26 27
Line 27 28
Line 28 29
Line 29 30
Line 30 31
Line 31 32 K‐05 WAF Surcharge Pool at Elev. 29ft
Line 32 33 K‐05 WAF Surcharge Pool at Elev. 29ft
Line 33 22
Line 35 34
Line 31 36 K‐05 WAF Surcharge Pool at Elev. 29ft
Line 36 37
Line 37 30
Line 37 38
Line 38 39
Line 39 35
Line 38 40
Line 40 41
Line 41 39
Line 43 44
Line 44 45 Drainage
Line 45 42
Line 46 42 Drainage
Line 45 34 Drainage
Line 35 47
Line 47 46
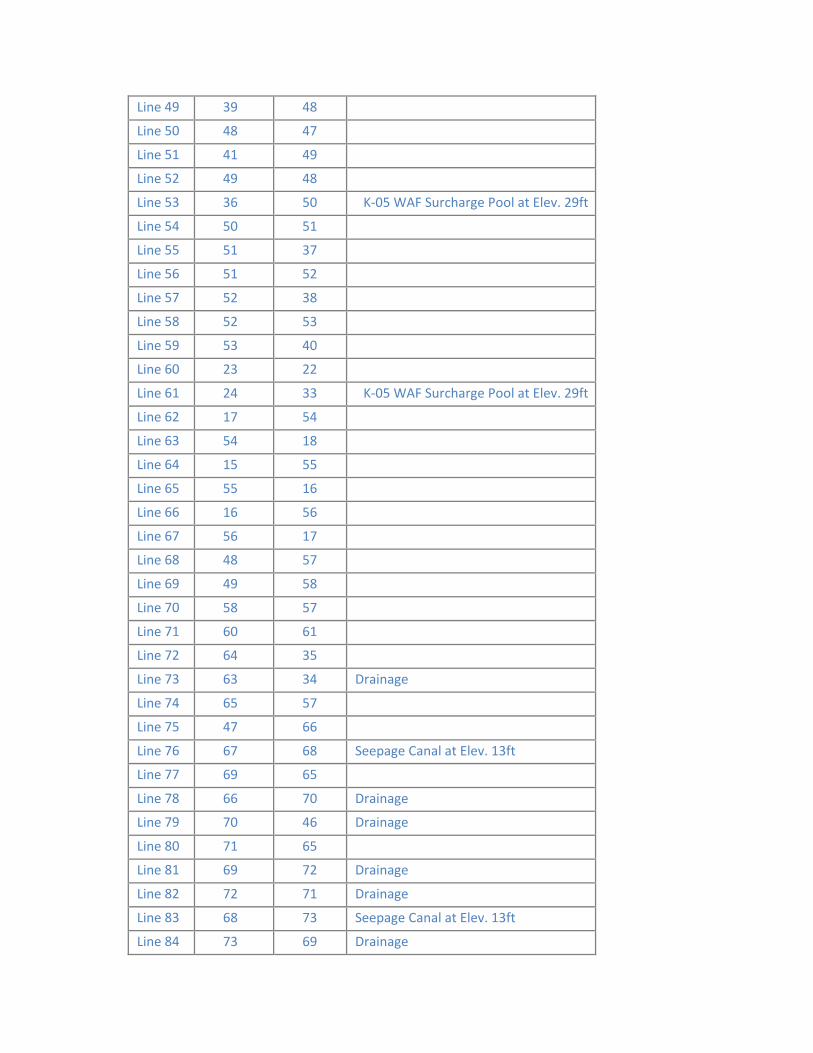
49
50
51
52
53
54
55
56
57
58
59
60
61
62
63
64
65
66
67
68
69
70
71
72
73
74
75
76
77
78
79
80
81
82
83
84
Line 39 48
Line 48 47
Line 41 49
Line 49 48
Line 36 50 K‐05 WAF Surcharge Pool at Elev. 29ft
Line 50 51
Line 51 37
Line 51 52
Line 52 38
Line 52 53
Line 53 40
Line 23 22
Line 24 33 K‐05 WAF Surcharge Pool at Elev. 29ft
Line 17 54
Line 54 18
Line 15 55
Line 55 16
Line 16 56
Line 56 17
Line 48 57
Line 49 58
Line 58 57
Line 60 61
Line 64 35
Line 63 34 Drainage
Line 65 57
Line 47 66
Line 67 68 Seepage Canal at Elev. 13ft
Line 69 65
Line 66 70 Drainage
Line 70 46 Drainage
Line 71 65
Line 69 72 Drainage
Line 72 71 Drainage
Line 68 73 Seepage Canal at Elev. 13ft
Line 73 69 Drainage
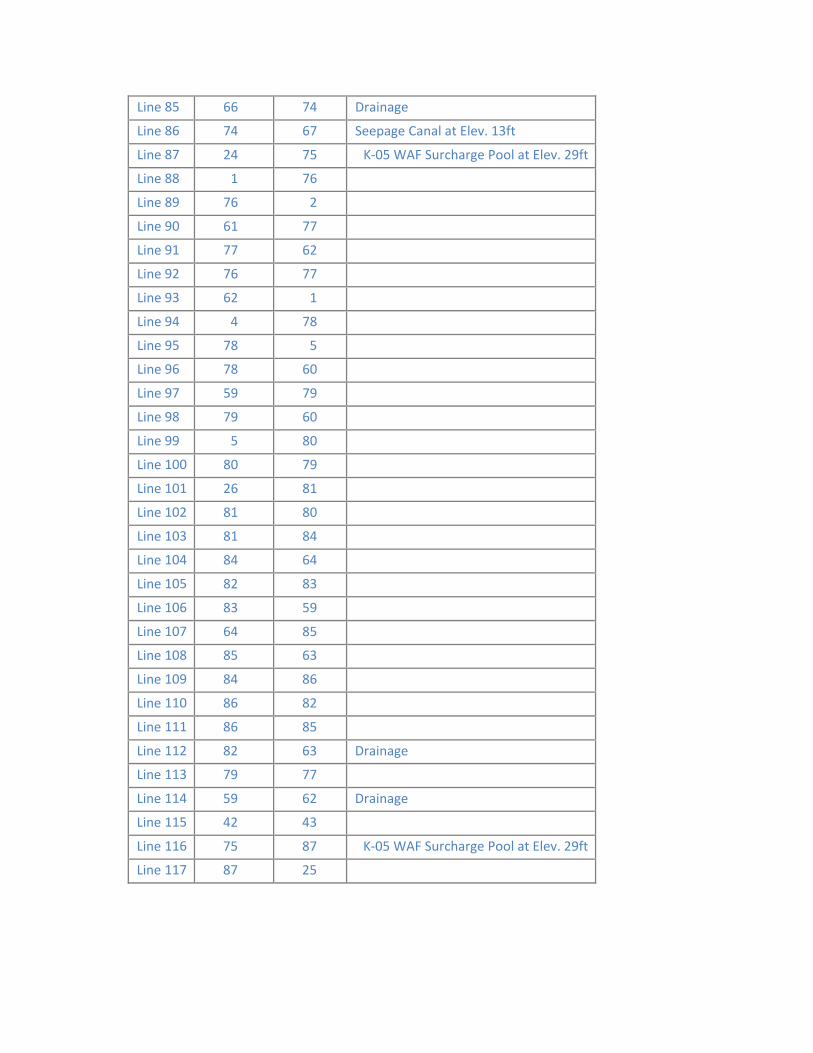
85
86
87
88
89
90
91
92
93
94
95
96
97
98
99
100
101
102
103
104
105
106
107
108
109
110
111
112
113
114
115
116
117
Line 66 74 Drainage
Line 74 67 Seepage Canal at Elev. 13ft
Line 24 75 K‐05 WAF Surcharge Pool at Elev. 29ft
Line 1 76
Line 76 2
Line 61 77
Line 77 62
Line 76 77
Line 62 1
Line 4 78
Line 78 5
Line 78 60
Line 59 79
Line 79 60
Line 5 80
Line 80 79
Line 26 81
Line 81 80
Line 81 84
Line 84 64
Line 82 83
Line 83 59
Line 64 85
Line 85 63
Line 84 86
Line 86 82
Line 86 85
Line 82 63 Drainage
Line 79 77
Line 59 62 Drainage
Line 42 43
Line 75 87 K‐05 WAF Surcharge Pool at Elev. 29ft
Line 87 25
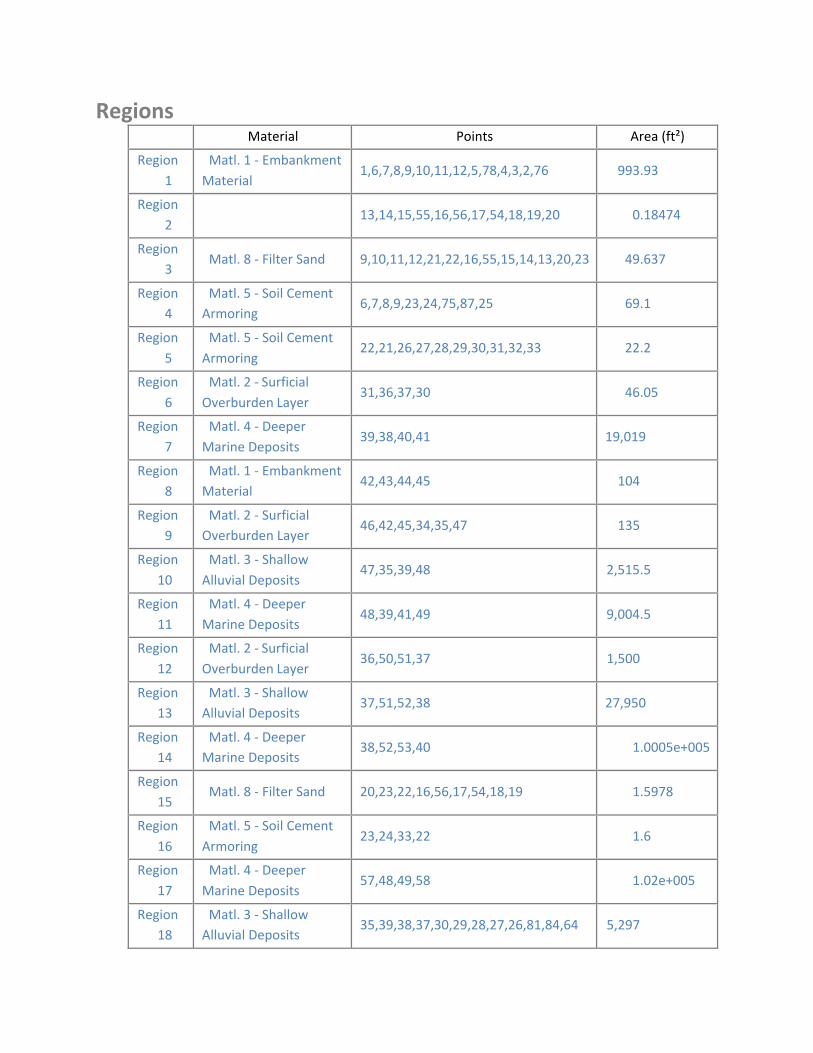
1
2
3
4
5
6
7
8
9
10
11
12
13
14
15
16
17
18
Regions Material Points Area (ft²)
Region Matl. 1 ‐ Embankment
Material 1,6,7,8,9,10,11,12,5,78,4,3,2,76 993.93
Region 13,14,15,55,16,56,17,54,18,19,20 0.18474
Region Matl. 8 ‐ Filter Sand 9,10,11,12,21,22,16,55,15,14,13,20,23 49.637
Region Matl. 5 ‐ Soil Cement Armoring
6,7,8,9,23,24,75,87,25 69.1
Region Matl. 5 ‐ Soil Cement
Armoring 22,21,26,27,28,29,30,31,32,33 22.2
Region Matl. 2 ‐ Surficial
Overburden Layer 31,36,37,30 46.05
Region Matl. 4 ‐ Deeper
Marine Deposits 39,38,40,41 19,019
Region Matl. 1 ‐ Embankment Material
42,43,44,45 104
Region Matl. 2 ‐ Surficial Overburden Layer
46,42,45,34,35,47 135
Region Matl. 3 ‐ Shallow
Alluvial Deposits 47,35,39,48 2,515.5
Region Matl. 4 ‐ Deeper
Marine Deposits 48,39,41,49 9,004.5
Region Matl. 2 ‐ Surficial
Overburden Layer 36,50,51,37 1,500
Region Matl. 3 ‐ Shallow Alluvial Deposits
37,51,52,38 27,950
Region Matl. 4 ‐ Deeper Marine Deposits
38,52,53,40 1.0005e+005
Region Matl. 8 ‐ Filter Sand 20,23,22,16,56,17,54,18,19 1.5978
Region Matl. 5 ‐ Soil Cement
Armoring 23,24,33,22 1.6
Region Matl. 4 ‐ Deeper
Marine Deposits 57,48,49,58 1.02e+005
Region Matl. 3 ‐ Shallow Alluvial Deposits
35,39,38,37,30,29,28,27,26,81,84,64 5,297

19
20
21
22
23
24
25
26
27
28
29
30
31
Region Matl. 2 ‐ Surficial Overburden Layer
34,35,64,85,63 19.5
Region Matl. 3 ‐ Shallow Alluvial Deposits
65,57,48,47,66,74,67,68,73,69 26,978
Region Matl. 2 ‐ Surficial
Overburden Layer 66,70,46,47 78.375
Region Matl. 2 ‐ Surficial
Overburden Layer 71,65,69,72 1,233.4
Region Matl. 9 Concrete
Outfall Works 76,77,62,1 1
Region Matl. 8 ‐ Filter Sand 76,2,3,4,78,60,61,77 69
Region Matl. 8 ‐ Filter Sand 79,60,78,5,80 41
Region Matl. 2 ‐ Surficial
Overburden Layer 80,5,12,21,26,81 167.7
Region Matl. 9 Concrete
Outfall Works 82,83,59,79,80,81,84,86 16
Region Matl. 8 ‐ Filter Sand 85,64,84,86 10.875
Region Matl. 6 ‐ Fine Drainage Gravel
63,85,86,82 10.875
Region Matl. 6 ‐ Fine Drainage Gravel
77,61,60,79 40
Region Matl. 6 ‐ Fine Drainage
Gravel 62,77,79,59 1
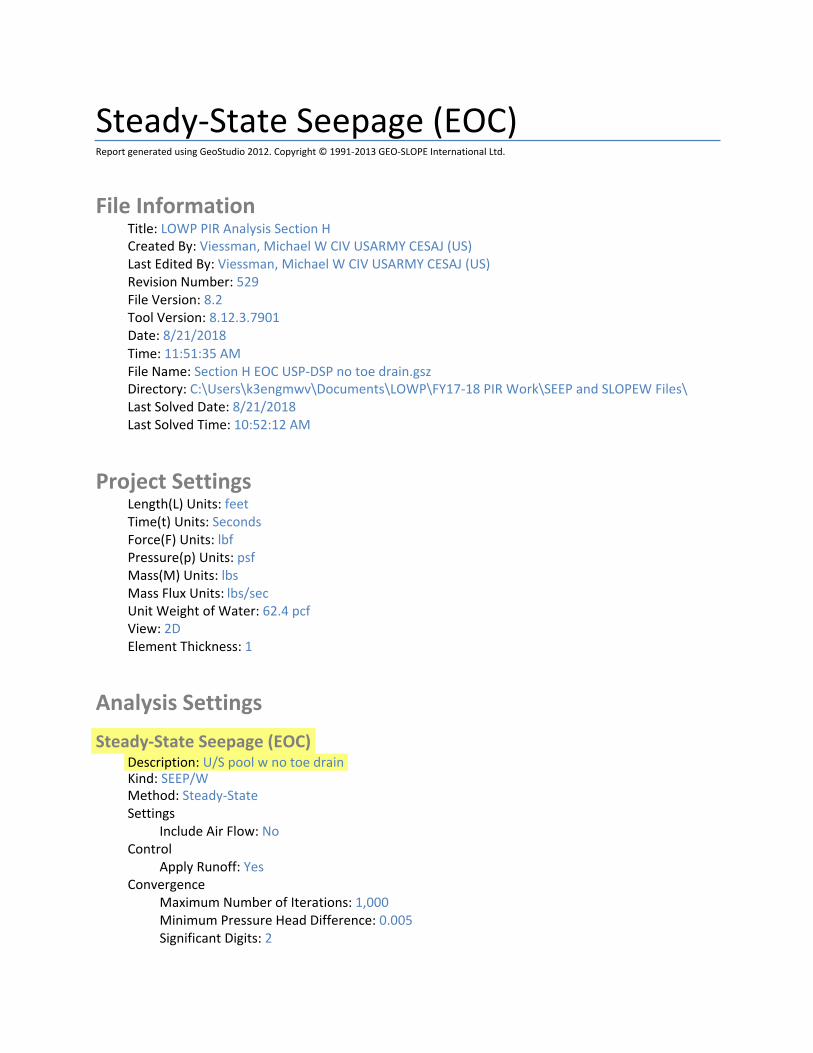
Steady‐State Seepage (EOC) Report generated using GeoStudio 2012. Copyright © 1991‐2013 GEO‐SLOPE International Ltd.
File Information Title: LOWP PIR Analysis Section H Created By: Viessman, Michael W CIV USARMY CESAJ (US) Last Edited By: Viessman, Michael W CIV USARMY CESAJ (US) Revision Number: 529 File Version: 8.2 Tool Version: 8.12.3.7901 Date: 8/21/2018 Time: 11:51:35 AM File Name: Section H EOC USP‐DSP no toe drain.gsz Directory: C:\Users\k3engmwv\Documents\LOWP\FY17‐18 PIR Work\SEEP and SLOPEW Files\ Last Solved Date: 8/21/2018 Last Solved Time: 10:52:12 AM
Project Settings Length(L) Units: feet Time(t) Units: Seconds Force(F) Units: lbf Pressure(p) Units: psf Mass(M) Units: lbs Mass Flux Units: lbs/sec Unit Weight of Water: 62.4 pcf View: 2D Element Thickness: 1
Analysis Settings
Steady‐State Seepage (EOC) Description: U/S pool w no toe drain Kind: SEEP/W Method: Steady‐State Settings
Include Air Flow: No Control
Apply Runoff: Yes Convergence
Maximum Number of Iterations: 1,000 Minimum Pressure Head Difference: 0.005 Significant Digits: 2

Max # of Reviews: 10 Hydraulic Under‐Relaxation Criteria
Under‐Relaxation Initial Rate: 1 Under‐Relaxation Min. Rate: 0.1 Under‐Relaxation Reduction Rate: 0.65 Under‐Relaxation Iterations: 10
Equation Solver: Parallel Direct Time
Starting Time: 0 sec Duration: 0 sec Ending Time: 0 sec
Materials
Matl. 1 ‐ Embankment Material Model: Saturated / Unsaturated Hydraulic
K‐Function: Matl. 1 Embankment Material Ky'/Kx' Ratio: 0.25 Rotation: 0 ° Vol. WC. Function: Matl. 1 Embankment Fill from Borrow Areas
Matl. 2 ‐ Surficial Overburden Layer Model: Saturated / Unsaturated Hydraulic
K‐Function: Matl. 2 Surficial Overburden Layer Ky'/Kx' Ratio: 0.1 Rotation: 0 ° Vol. WC. Function: Matl. 2 Surficial Overburden Layer
Matl. 3 ‐ Shallow Alluvial Deposits Model: Saturated / Unsaturated Hydraulic
K‐Function: Matl. 3 Shallow Alluvial Deposits Ky'/Kx' Ratio: 0.1 Rotation: 0 ° Vol. WC. Function: Matl. 3 Shallow Alluvial Deposits
Matl. 4 ‐ Deeper Marine Deposits Model: Saturated / Unsaturated Hydraulic
K‐Function: Matl. 4 Deeper Marine Deposits Ky'/Kx' Ratio: 0.1 Rotation: 0 ° Vol. WC. Function: Matl. 4 Deeper Marine Deposits
Matl. 5 ‐ Soil Cement Armoring Model: Saturated / Unsaturated Hydraulic
K‐Function: Matl. 5 Soil Cement Armoring Ky'/Kx' Ratio: 1 Rotation: 0 ° Vol. WC. Function: Matl. 5 Soil Cement Armoring
Matl. 6 ‐ Fine Drainage Gravel Model: Saturated / Unsaturated Hydraulic
K‐Function: Matl. 6 Fine Drainage Gravel Ky'/Kx' Ratio: 1 Rotation: 0 ° Vol. WC. Function: Mat. 6 Fine Drainage Gravel (No 89)
Matl. 8 ‐ Filter Sand Model: Saturated / Unsaturated Hydraulic
K‐Function: Matl. 8 Filter Sand Ky'/Kx' Ratio: 1 Rotation: 0 ° Vol. WC. Function: Matl. 8 Filter Sand (C33)
Matl. 9 Concrete Outfall Works Model: Saturated Only Hydraulic
K‐Sat: 3.28e‐010 ft/sec Ky'/Kx' Ratio: 1 Rotation: 0 ° Volumetric Water Content: 0.3 ft³/ft³ Mv: 1e‐008 /psf
Boundary Conditions
K‐05 WAF Normal Pool at Elev. 23ft Type: Head (H) 23 Review: No
PR at Elev. 18ft Type: Head (H) 18 Review: No
Drainage Type: Total Flux (Q) 0 Review: Yes
Flux Sections
Flux Section 1 Coordinates
Coordinate: (‐56.368089, 17.11908) ft Coordinate: (‐56.359991, 15.897243) ft
Flux Section 2 Coordinates
Coordinate: (‐102.27362, 18.818898) ft Coordinate: (‐88.017717, 14.05315) ft Coordinate: (‐67.383858, 14.059055) ft Coordinate: (‐65.3, 14.1) ft
Flux Section 3 Coordinates
Coordinate: (‐11.352061, 28.166901) ft Coordinate: (‐11.307284, 14.896151) ft
Flux Section 4 Coordinates
Coordinate: (‐11.307284, 14.851374) ft Coordinate: (‐55.502072, 14.873763) ft
Flux Section 5 Coordinates
Coordinate: (‐0.349869, 33.216015) ft Coordinate: (‐0.361475, ‐114.73943) ft
Flux Section 6 Coordinates
Coordinate: (‐109.10947, 18.913159) ft Coordinate: (‐109.07273, ‐114.73608) ft
K Functions
Matl. 1 Embankment Material Model: Hyd K Data Point Function Function: X‐Conductivity vs. Pore‐Water Pressure
Curve Fit to Data: 100 % Segment Curvature: 36 %
K‐Saturation: 0.000131 Data Points: Matric Suction (psf), X‐Conductivity (ft/sec)
Data Point: (0.01, 0.000131) Data Point: (0.018329807, 0.00013099927) Data Point: (0.033598183, 0.00013099852)
Data Point: (0.061584821, 0.00013099772) Data Point: (0.11288379, 0.00013099684) Data Point: (0.20691381, 0.00013099581) Data Point: (0.37926902,0.0001309945) Data Point: (0.6951928, 0.00013099268) Data Point: (1.274275, 0.00013098992) Data Point: (2.3357215, 0.00013098549) Data Point: (4.2813324, 0.0001309777) Data Point: (7.8475997, 0.00013096339) Data Point: (14.384499,0.00013094955) Data Point: (26.366509,0.00013089452) Data Point: (48.329302,0.00013043835) Data Point: (88.586679, 0.00012910123) Data Point: (162.37767, 5.664247e‐005) Data Point: (297.63514, 2.5159921e‐006) Data Point: (545.55948, 4.7485927e‐008) Data Point: (1,000, 1.7886028e‐009)
Estimation Properties Hyd. K‐Function Estimation Method: Fredlund‐Xing Function Volume Water Content Function: Matl. 1 Embankment Fill from Borrow Areas Hydraulic K Sat: 0.000131 ft/sec Residual Water Content: 0.0495 ft³/ft³ Maximum: 1,000 Minimum: 0.01 Num. Points: 20
Matl. 4 Deeper Marine Deposits Model: Hyd K Data Point Function Function: X‐Conductivity vs. Pore‐Water Pressure
Curve Fit to Data: 100 % Segment Curvature: 44 %
K‐Saturation: 0.000984 Data Points: Matric Suction (psf), X‐Conductivity (ft/sec)
Data Point: (0.01, 0.000984) Data Point: (0.018329807, 0.00098398585) Data Point: (0.033598183, 0.00098397151) Data Point: (0.061584821, 0.00098395679) Data Point: (0.11288379, 0.00098394139) Data Point: (0.20691381, 0.00098392476) Data Point: (0.37926902, 0.00098390584) Data Point: (0.6951928, 0.00098388274) Data Point: (1.274275, 0.00098385199) Data Point: (2.3357215, 0.0009838074) Data Point: (4.2813324,0.00098373618) Data Point: (7.8475997,0.00098361453) Data Point: (14.384499, 0.0009834543) Data Point: (26.366509,0.00098304118) Data Point: (48.329302,0.00098089274)
Data Point: (88.586679,0.00098804841) Data Point: (162.37767, 0.00089693201) Data Point: (297.63514, 0.00029836287) Data Point: (545.55948, 5.5741791e‐006) Data Point: (1,000, 8.8545842e‐008)
Estimation Properties Hyd. K‐Function Estimation Method: Fredlund‐Xing Function Volume Water Content Function: Matl. 4 Deeper Marine Deposits Hydraulic K Sat: 0.000984 ft/sec Residual Water Content: 0.03 ft³/ft³ Maximum: 1,000 Minimum: 0.01 Num. Points: 20
Matl. 6 Fine Drainage Gravel Model: Hyd K Data Point Function Function: X‐Conductivity vs. Pore‐Water Pressure
Curve Fit to Data: 100 % Segment Curvature: 40 %
K‐Saturation: 0.02315 Data Points: Matric Suction (psf), X‐Conductivity (ft/sec)
Data Point: (0.01, 0.02315) Data Point: (0.018329807, 0.023149999) Data Point: (0.033598183, 0.023149997) Data Point: (0.061584821, 0.023149994) Data Point: (0.11288379, 0.023149984) Data Point: (0.20691381, 0.023149981) Data Point: (0.37926902, 0.023150055) Data Point: (0.6951928, 0.023149315) Data Point: (1.274275, 0.02314882) Data Point: (2.3357215, 0.023163455) Data Point: (4.2813324, 0.02041826) Data Point: (7.8475997, 0.0039249052) Data Point: (14.384499, 6.6024733e‐005) Data Point: (26.366509, 7.000732e‐007) Data Point: (48.329302, 2.0374523e‐008) Data Point: (88.586679, 3.5541328e‐009) Data Point: (162.37767, 7.5581773e‐010) Data Point: (297.63514, 1.5822386e‐010) Data Point: (545.55948, 2.6567478e‐011) Data Point: (1,000, 2.4617797e‐012)
Estimation Properties Hyd. K‐Function Estimation Method: Fredlund‐Xing Function Volume Water Content Function: Mat. 6 Fine Drainage Gravel (No 89) Hydraulic K Sat: 0.02315 ft/sec Residual Water Content: 0.042 ft³/ft³ Maximum: 1,000 Minimum: 0.01
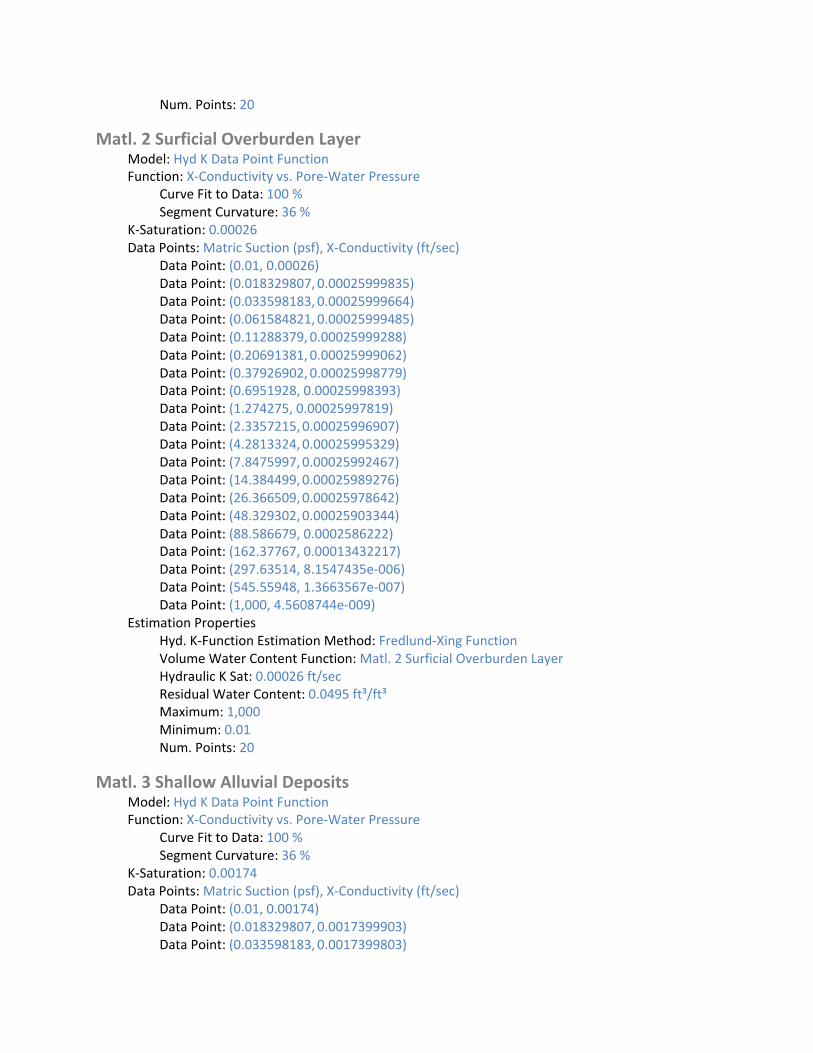
Num. Points: 20
Matl. 2 Surficial Overburden Layer Model: Hyd K Data Point Function Function: X‐Conductivity vs. Pore‐Water Pressure
Curve Fit to Data: 100 % Segment Curvature: 36 %
K‐Saturation: 0.00026 Data Points: Matric Suction (psf), X‐Conductivity (ft/sec)
Data Point: (0.01, 0.00026) Data Point: (0.018329807, 0.00025999835) Data Point: (0.033598183, 0.00025999664) Data Point: (0.061584821, 0.00025999485) Data Point: (0.11288379, 0.00025999288) Data Point: (0.20691381, 0.00025999062) Data Point: (0.37926902, 0.00025998779) Data Point: (0.6951928, 0.00025998393) Data Point: (1.274275, 0.00025997819) Data Point: (2.3357215,0.00025996907) Data Point: (4.2813324,0.00025995329) Data Point: (7.8475997,0.00025992467) Data Point: (14.384499,0.00025989276) Data Point: (26.366509,0.00025978642) Data Point: (48.329302,0.00025903344) Data Point: (88.586679, 0.0002586222) Data Point: (162.37767, 0.00013432217) Data Point: (297.63514, 8.1547435e‐006) Data Point: (545.55948, 1.3663567e‐007) Data Point: (1,000, 4.5608744e‐009)
Estimation Properties Hyd. K‐Function Estimation Method: Fredlund‐Xing Function Volume Water Content Function: Matl. 2 Surficial Overburden Layer Hydraulic K Sat: 0.00026 ft/sec Residual Water Content: 0.0495 ft³/ft³ Maximum: 1,000 Minimum: 0.01 Num. Points: 20
Matl. 3 Shallow Alluvial Deposits Model: Hyd K Data Point Function Function: X‐Conductivity vs. Pore‐Water Pressure
Curve Fit to Data: 100 % Segment Curvature: 36 %
K‐Saturation: 0.00174 Data Points: Matric Suction (psf), X‐Conductivity (ft/sec)
Data Point: (0.01, 0.00174) Data Point: (0.018329807, 0.0017399903) Data Point: (0.033598183, 0.0017399803)
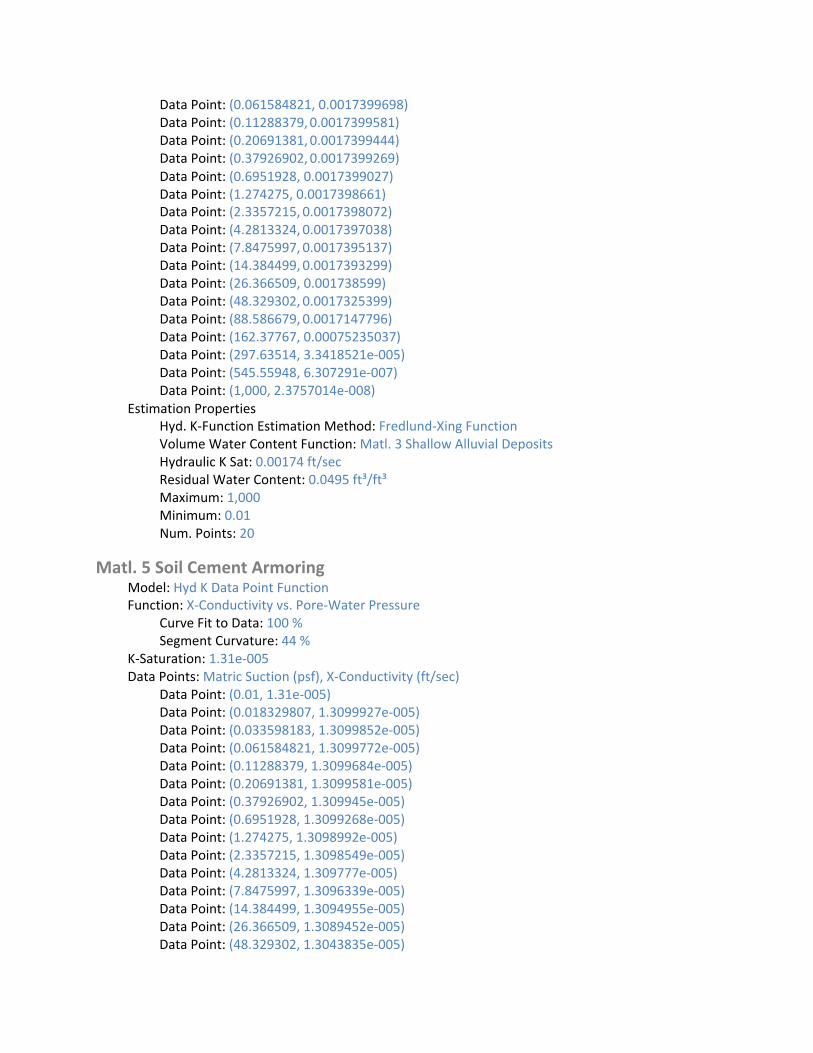
Data Point: (0.061584821, 0.0017399698) Data Point: (0.11288379,0.0017399581) Data Point: (0.20691381,0.0017399444) Data Point: (0.37926902,0.0017399269) Data Point: (0.6951928, 0.0017399027) Data Point: (1.274275, 0.0017398661) Data Point: (2.3357215, 0.0017398072) Data Point: (4.2813324, 0.0017397038) Data Point: (7.8475997, 0.0017395137) Data Point: (14.384499, 0.0017393299) Data Point: (26.366509, 0.001738599) Data Point: (48.329302, 0.0017325399) Data Point: (88.586679, 0.0017147796) Data Point: (162.37767, 0.00075235037) Data Point: (297.63514, 3.3418521e‐005) Data Point: (545.55948, 6.307291e‐007) Data Point: (1,000, 2.3757014e‐008)
Estimation Properties Hyd. K‐Function Estimation Method: Fredlund‐Xing Function Volume Water Content Function: Matl. 3 Shallow Alluvial Deposits Hydraulic K Sat: 0.00174 ft/sec Residual Water Content: 0.0495 ft³/ft³ Maximum: 1,000 Minimum: 0.01 Num. Points: 20
Matl. 5 Soil Cement Armoring Model: Hyd K Data Point Function Function: X‐Conductivity vs. Pore‐Water Pressure
Curve Fit to Data: 100 % Segment Curvature: 44 %
K‐Saturation: 1.31e‐005 Data Points: Matric Suction (psf), X‐Conductivity (ft/sec)
Data Point: (0.01, 1.31e‐005) Data Point: (0.018329807, 1.3099927e‐005) Data Point: (0.033598183, 1.3099852e‐005) Data Point: (0.061584821, 1.3099772e‐005) Data Point: (0.11288379, 1.3099684e‐005) Data Point: (0.20691381, 1.3099581e‐005) Data Point: (0.37926902, 1.309945e‐005) Data Point: (0.6951928, 1.3099268e‐005) Data Point: (1.274275, 1.3098992e‐005) Data Point: (2.3357215, 1.3098549e‐005) Data Point: (4.2813324, 1.309777e‐005) Data Point: (7.8475997, 1.3096339e‐005) Data Point: (14.384499, 1.3094955e‐005) Data Point: (26.366509, 1.3089452e‐005) Data Point: (48.329302, 1.3043835e‐005)
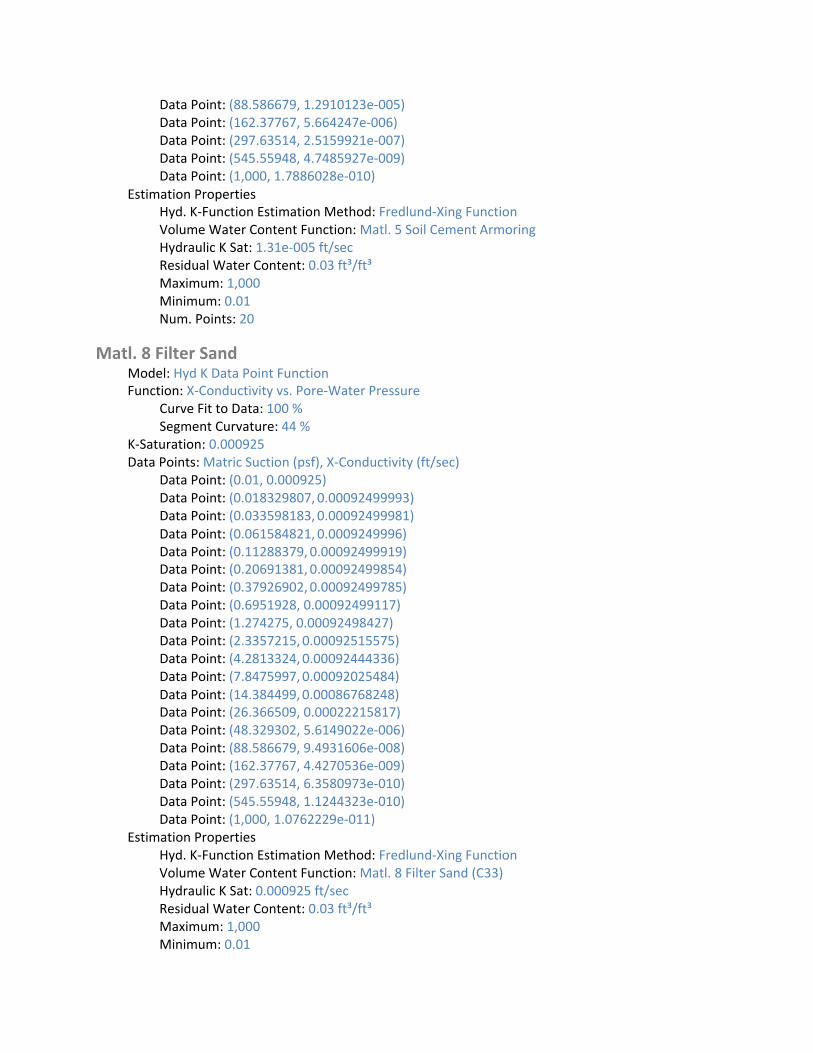
Data Point: (88.586679, 1.2910123e‐005) Data Point: (162.37767, 5.664247e‐006) Data Point: (297.63514, 2.5159921e‐007) Data Point: (545.55948, 4.7485927e‐009) Data Point: (1,000, 1.7886028e‐010)
Estimation Properties Hyd. K‐Function Estimation Method: Fredlund‐Xing Function Volume Water Content Function: Matl. 5 Soil Cement Armoring Hydraulic K Sat: 1.31e‐005 ft/sec Residual Water Content: 0.03 ft³/ft³ Maximum: 1,000 Minimum: 0.01 Num. Points: 20
Matl. 8 Filter Sand Model: Hyd K Data Point Function Function: X‐Conductivity vs. Pore‐Water Pressure
Curve Fit to Data: 100 % Segment Curvature: 44 %
K‐Saturation: 0.000925 Data Points: Matric Suction (psf), X‐Conductivity (ft/sec)
Data Point: (0.01, 0.000925) Data Point: (0.018329807, 0.00092499993) Data Point: (0.033598183, 0.00092499981) Data Point: (0.061584821, 0.0009249996) Data Point: (0.11288379, 0.00092499919) Data Point: (0.20691381, 0.00092499854) Data Point: (0.37926902, 0.00092499785) Data Point: (0.6951928, 0.00092499117) Data Point: (1.274275, 0.00092498427) Data Point: (2.3357215,0.00092515575) Data Point: (4.2813324,0.00092444336) Data Point: (7.8475997,0.00092025484) Data Point: (14.384499,0.00086768248) Data Point: (26.366509, 0.00022215817) Data Point: (48.329302, 5.6149022e‐006) Data Point: (88.586679, 9.4931606e‐008) Data Point: (162.37767, 4.4270536e‐009) Data Point: (297.63514, 6.3580973e‐010) Data Point: (545.55948, 1.1244323e‐010) Data Point: (1,000, 1.0762229e‐011)
Estimation Properties Hyd. K‐Function Estimation Method: Fredlund‐Xing Function Volume Water Content Function: Matl. 8 Filter Sand (C33) Hydraulic K Sat: 0.000925 ft/sec Residual Water Content: 0.03 ft³/ft³ Maximum: 1,000 Minimum: 0.01
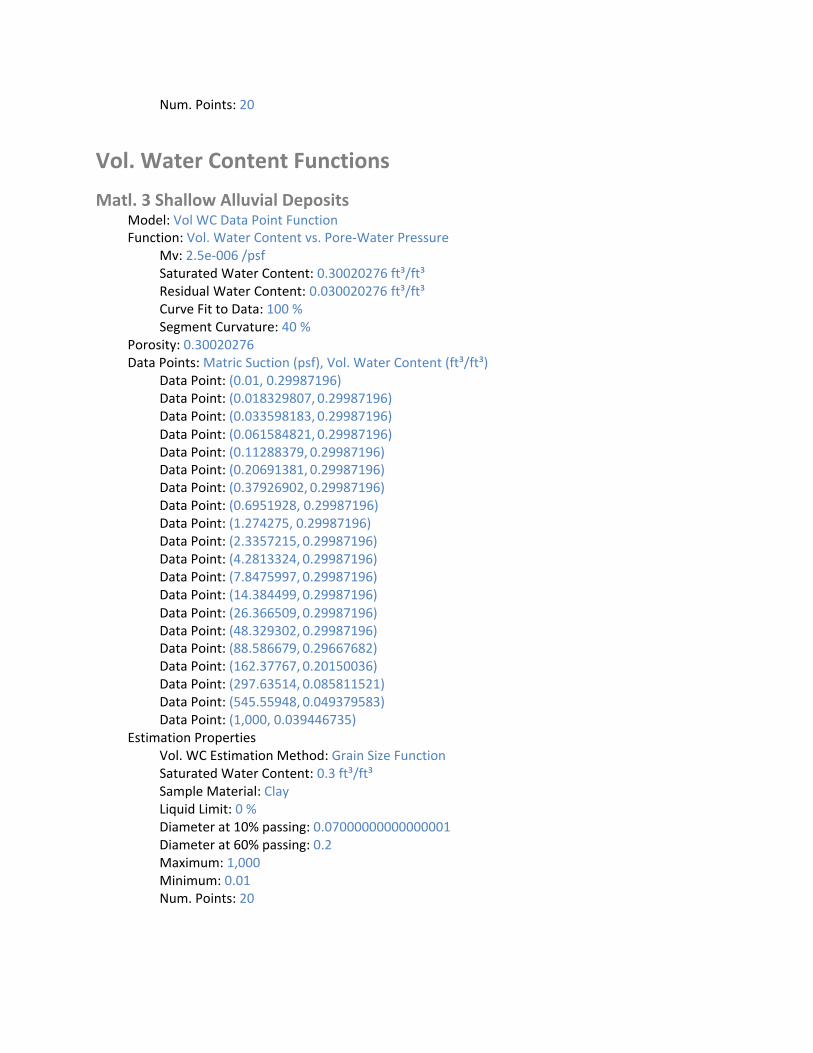
Num. Points: 20
Vol. Water Content Functions
Matl. 3 Shallow Alluvial Deposits Model: Vol WC Data Point Function Function: Vol. Water Content vs. Pore‐Water Pressure
Mv: 2.5e‐006 /psf Saturated Water Content: 0.30020276 ft³/ft³ Residual Water Content: 0.030020276 ft³/ft³ Curve Fit to Data: 100 % Segment Curvature: 40 %
Porosity: 0.30020276 Data Points: Matric Suction (psf), Vol. Water Content (ft³/ft³)
Data Point: (0.01, 0.29987196) Data Point: (0.018329807, 0.29987196) Data Point: (0.033598183, 0.29987196) Data Point: (0.061584821, 0.29987196) Data Point: (0.11288379, 0.29987196) Data Point: (0.20691381, 0.29987196) Data Point: (0.37926902, 0.29987196) Data Point: (0.6951928, 0.29987196) Data Point: (1.274275, 0.29987196) Data Point: (2.3357215, 0.29987196) Data Point: (4.2813324, 0.29987196) Data Point: (7.8475997, 0.29987196) Data Point: (14.384499, 0.29987196) Data Point: (26.366509, 0.29987196) Data Point: (48.329302, 0.29987196) Data Point: (88.586679, 0.29667682) Data Point: (162.37767, 0.20150036) Data Point: (297.63514, 0.085811521) Data Point: (545.55948, 0.049379583) Data Point: (1,000, 0.039446735)
Estimation Properties Vol. WC Estimation Method: Grain Size Function Saturated Water Content: 0.3 ft³/ft³ Sample Material: Clay Liquid Limit: 0 % Diameter at 10% passing: 0.07000000000000001 Diameter at 60% passing: 0.2 Maximum: 1,000 Minimum: 0.01 Num. Points: 20
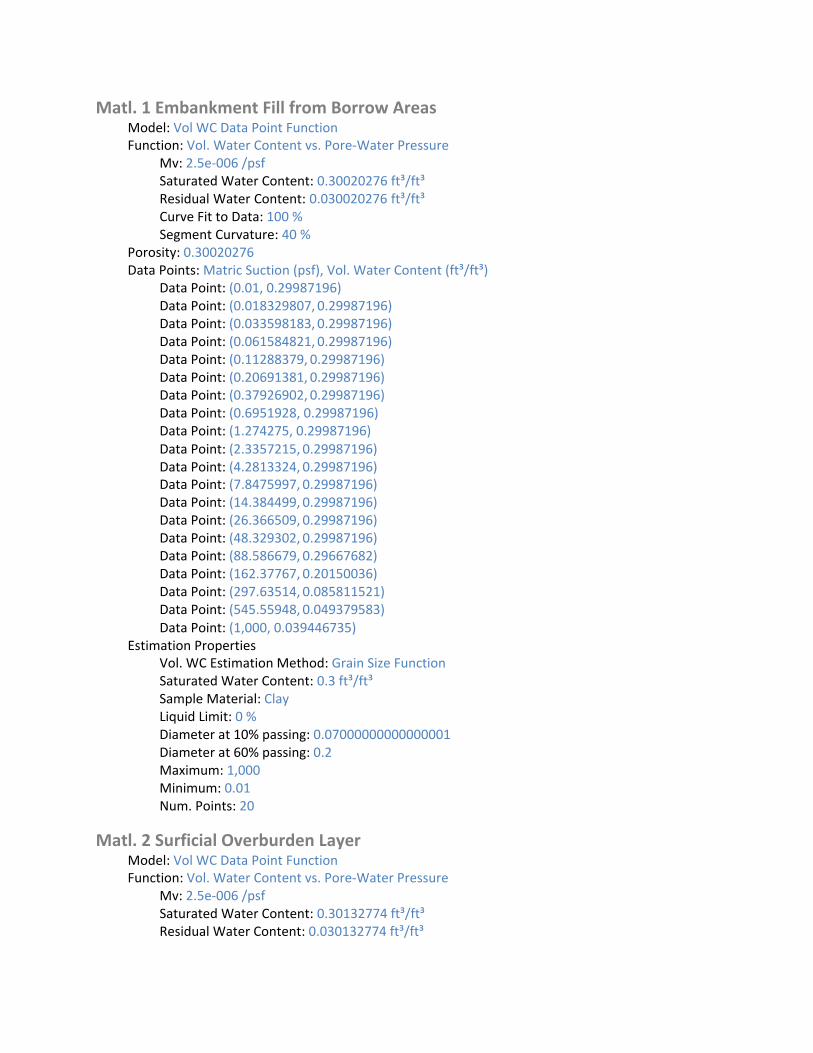
Matl. 1 Embankment Fill from Borrow Areas Model: Vol WC Data Point Function Function: Vol. Water Content vs. Pore‐Water Pressure
Mv: 2.5e‐006 /psf Saturated Water Content: 0.30020276 ft³/ft³ Residual Water Content: 0.030020276 ft³/ft³ Curve Fit to Data: 100 % Segment Curvature: 40 %
Porosity: 0.30020276 Data Points: Matric Suction (psf), Vol. Water Content (ft³/ft³)
Data Point: (0.01, 0.29987196) Data Point: (0.018329807, 0.29987196) Data Point: (0.033598183, 0.29987196) Data Point: (0.061584821, 0.29987196) Data Point: (0.11288379, 0.29987196) Data Point: (0.20691381, 0.29987196) Data Point: (0.37926902, 0.29987196) Data Point: (0.6951928, 0.29987196) Data Point: (1.274275, 0.29987196) Data Point: (2.3357215, 0.29987196) Data Point: (4.2813324, 0.29987196) Data Point: (7.8475997, 0.29987196) Data Point: (14.384499, 0.29987196) Data Point: (26.366509, 0.29987196) Data Point: (48.329302, 0.29987196) Data Point: (88.586679, 0.29667682) Data Point: (162.37767, 0.20150036) Data Point: (297.63514, 0.085811521) Data Point: (545.55948, 0.049379583) Data Point: (1,000, 0.039446735)
Estimation Properties Vol. WC Estimation Method: Grain Size Function Saturated Water Content: 0.3 ft³/ft³ Sample Material: Clay Liquid Limit: 0 % Diameter at 10% passing: 0.07000000000000001 Diameter at 60% passing: 0.2 Maximum: 1,000 Minimum: 0.01 Num. Points: 20
Matl. 2 Surficial Overburden Layer Model: Vol WC Data Point Function Function: Vol. Water Content vs. Pore‐Water Pressure
Mv: 2.5e‐006 /psf Saturated Water Content: 0.30132774 ft³/ft³ Residual Water Content: 0.030132774 ft³/ft³
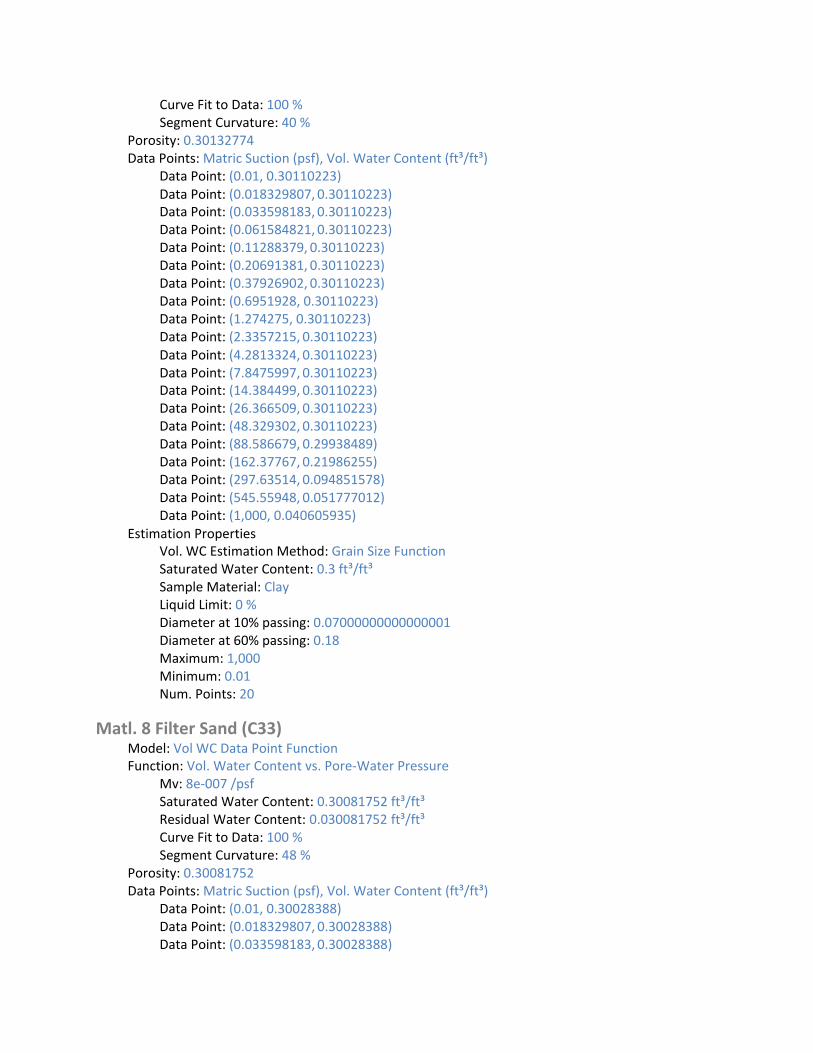
Curve Fit to Data: 100 % Segment Curvature: 40 %
Porosity: 0.30132774 Data Points: Matric Suction (psf), Vol. Water Content (ft³/ft³)
Data Point: (0.01, 0.30110223) Data Point: (0.018329807, 0.30110223) Data Point: (0.033598183, 0.30110223) Data Point: (0.061584821, 0.30110223) Data Point: (0.11288379, 0.30110223) Data Point: (0.20691381, 0.30110223) Data Point: (0.37926902, 0.30110223) Data Point: (0.6951928, 0.30110223) Data Point: (1.274275, 0.30110223) Data Point: (2.3357215, 0.30110223) Data Point: (4.2813324, 0.30110223) Data Point: (7.8475997, 0.30110223) Data Point: (14.384499, 0.30110223) Data Point: (26.366509, 0.30110223) Data Point: (48.329302, 0.30110223) Data Point: (88.586679, 0.29938489) Data Point: (162.37767, 0.21986255) Data Point: (297.63514, 0.094851578) Data Point: (545.55948, 0.051777012) Data Point: (1,000, 0.040605935)
Estimation Properties Vol. WC Estimation Method: Grain Size Function Saturated Water Content: 0.3 ft³/ft³ Sample Material: Clay Liquid Limit: 0 % Diameter at 10% passing: 0.07000000000000001 Diameter at 60% passing: 0.18 Maximum: 1,000 Minimum: 0.01 Num. Points: 20
Matl. 8 Filter Sand (C33) Model: Vol WC Data Point Function Function: Vol. Water Content vs. Pore‐Water Pressure
Mv: 8e‐007 /psf Saturated Water Content: 0.30081752 ft³/ft³ Residual Water Content: 0.030081752 ft³/ft³ Curve Fit to Data: 100 % Segment Curvature: 48 %
Porosity: 0.30081752 Data Points: Matric Suction (psf), Vol. Water Content (ft³/ft³)
Data Point: (0.01, 0.30028388) Data Point: (0.018329807, 0.30028388) Data Point: (0.033598183, 0.30028388)

Data Point: (0.061584821, 0.30028388) Data Point: (0.11288379, 0.30028388) Data Point: (0.20691381, 0.30028388) Data Point: (0.37926902, 0.30028388) Data Point: (0.6951928, 0.30028388) Data Point: (1.274275, 0.30028388) Data Point: (2.3357215, 0.30028388) Data Point: (4.2813324, 0.30028388) Data Point: (7.8475997, 0.30028388) Data Point: (14.384499, 0.28112842) Data Point: (26.366509, 0.15065712) Data Point: (48.329302, 0.048430554) Data Point: (88.586679, 0.021674388) Data Point: (162.37767, 0.016081301) Data Point: (297.63514, 0.013674367) Data Point: (545.55948, 0.011770874) Data Point: (1,000, 0.010084825)
Estimation Properties Vol. WC Estimation Method: Grain Size Function Saturated Water Content: 0.3 ft³/ft³ Sample Material: Gravel Liquid Limit: 0 % Diameter at 10% passing: 0.38 Diameter at 60% passing: 1.6 Maximum: 1,000 Minimum: 0.01 Num. Points: 20
Mat. 6 Fine Drainage Gravel (No 89) Model: Vol WC Data Point Function Function: Vol. Water Content vs. Pore‐Water Pressure
Mv: 4e‐007 /psf Saturated Water Content: 0.21947752 ft³/ft³ Residual Water Content: 0.021947752 ft³/ft³ Curve Fit to Data: 100 % Segment Curvature: 48 %
Porosity: 0.21947752 Data Points: Matric Suction (psf), Vol. Water Content (ft³/ft³)
Data Point: (0.01, 0.21916427) Data Point: (0.018329807, 0.21916427) Data Point: (0.033598183, 0.21916427) Data Point: (0.061584821, 0.21916427) Data Point: (0.11288379, 0.21916427) Data Point: (0.20691381, 0.21916427) Data Point: (0.37926902, 0.21916427) Data Point: (0.6951928, 0.21916427) Data Point: (1.274275, 0.21916427) Data Point: (2.3357215, 0.21916427)
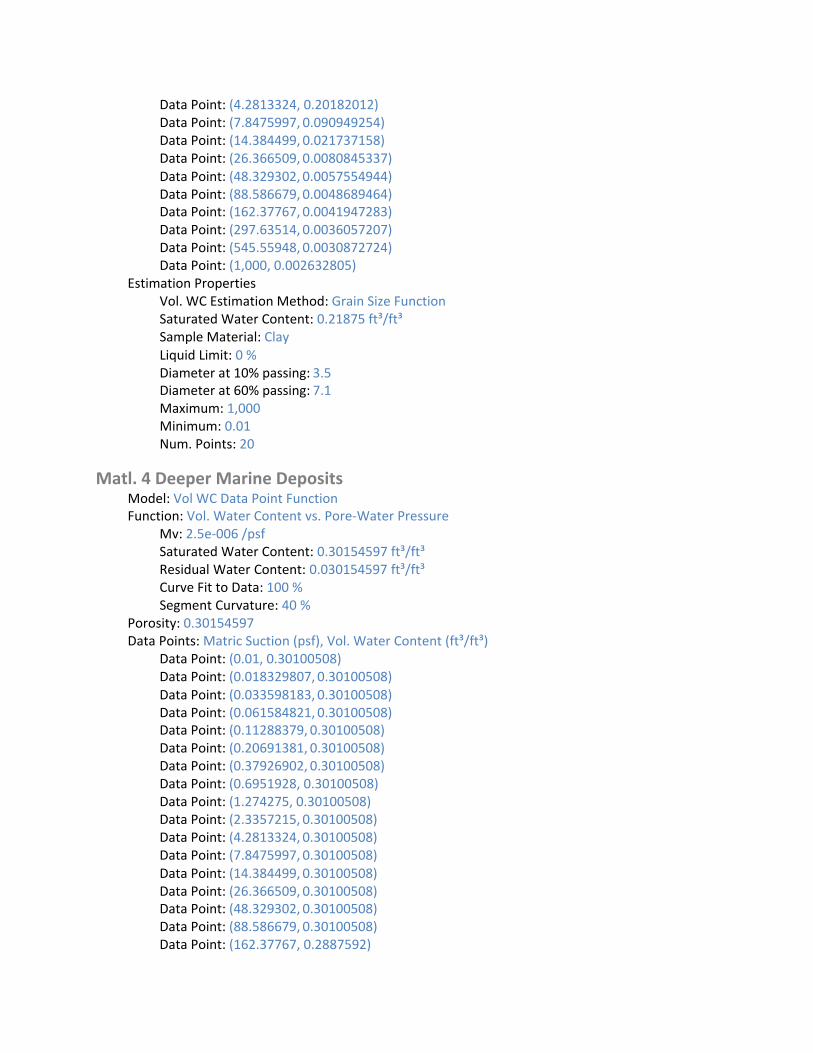
Data Point: (4.2813324, 0.20182012) Data Point: (7.8475997, 0.090949254) Data Point: (14.384499, 0.021737158) Data Point: (26.366509, 0.0080845337) Data Point: (48.329302, 0.0057554944) Data Point: (88.586679, 0.0048689464) Data Point: (162.37767, 0.0041947283) Data Point: (297.63514, 0.0036057207) Data Point: (545.55948, 0.0030872724) Data Point: (1,000, 0.002632805)
Estimation Properties Vol. WC Estimation Method: Grain Size Function Saturated Water Content: 0.21875 ft³/ft³ Sample Material: Clay Liquid Limit: 0 % Diameter at 10% passing: 3.5 Diameter at 60% passing: 7.1 Maximum: 1,000 Minimum: 0.01 Num. Points: 20
Matl. 4 Deeper Marine Deposits Model: Vol WC Data Point Function Function: Vol. Water Content vs. Pore‐Water Pressure
Mv: 2.5e‐006 /psf Saturated Water Content: 0.30154597 ft³/ft³ Residual Water Content: 0.030154597 ft³/ft³ Curve Fit to Data: 100 % Segment Curvature: 40 %
Porosity: 0.30154597 Data Points: Matric Suction (psf), Vol. Water Content (ft³/ft³)
Data Point: (0.01, 0.30100508) Data Point: (0.018329807, 0.30100508) Data Point: (0.033598183, 0.30100508) Data Point: (0.061584821, 0.30100508) Data Point: (0.11288379, 0.30100508) Data Point: (0.20691381, 0.30100508) Data Point: (0.37926902, 0.30100508) Data Point: (0.6951928, 0.30100508) Data Point: (1.274275, 0.30100508) Data Point: (2.3357215, 0.30100508) Data Point: (4.2813324, 0.30100508) Data Point: (7.8475997, 0.30100508) Data Point: (14.384499, 0.30100508) Data Point: (26.366509, 0.30100508) Data Point: (48.329302, 0.30100508) Data Point: (88.586679, 0.30100508) Data Point: (162.37767, 0.2887592)
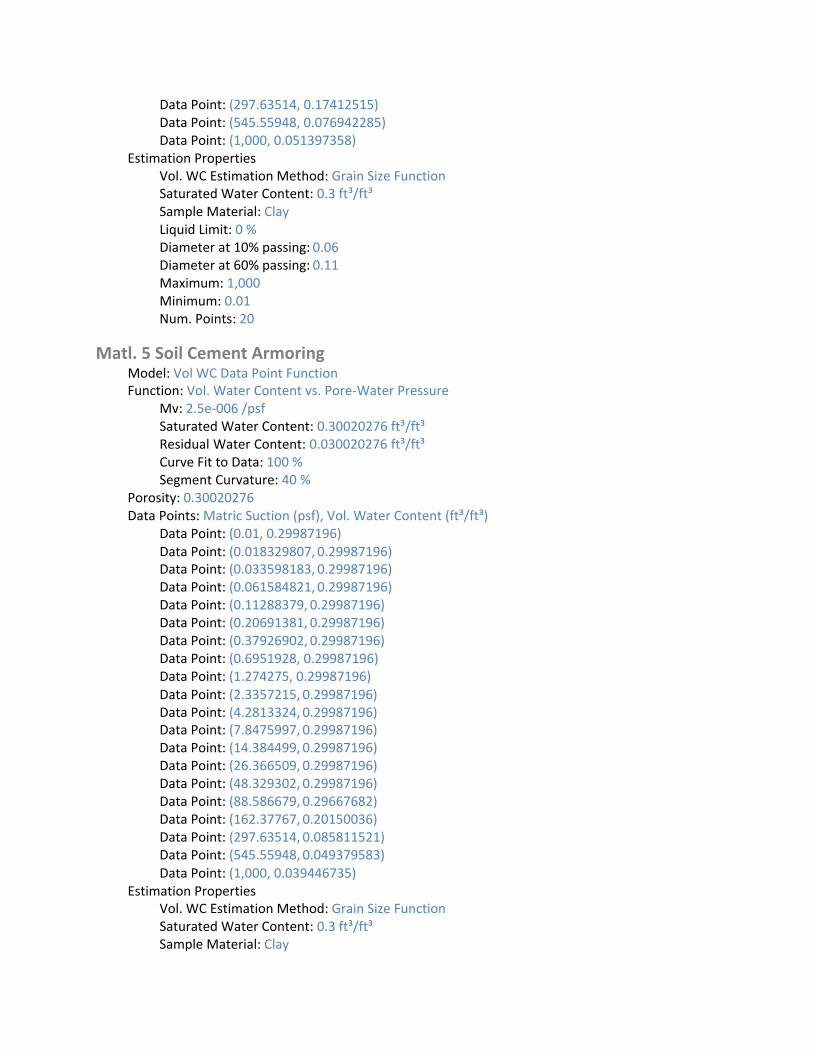
Data Point: (297.63514, 0.17412515) Data Point: (545.55948, 0.076942285) Data Point: (1,000, 0.051397358)
Estimation Properties Vol. WC Estimation Method: Grain Size Function Saturated Water Content: 0.3 ft³/ft³ Sample Material: Clay Liquid Limit: 0 % Diameter at 10% passing: 0.06 Diameter at 60% passing: 0.11 Maximum: 1,000 Minimum: 0.01 Num. Points: 20
Matl. 5 Soil Cement Armoring Model: Vol WC Data Point Function Function: Vol. Water Content vs. Pore‐Water Pressure
Mv: 2.5e‐006 /psf Saturated Water Content: 0.30020276 ft³/ft³ Residual Water Content: 0.030020276 ft³/ft³ Curve Fit to Data: 100 % Segment Curvature: 40 %
Porosity: 0.30020276 Data Points: Matric Suction (psf), Vol. Water Content (ft³/ft³)
Data Point: (0.01, 0.29987196) Data Point: (0.018329807, 0.29987196) Data Point: (0.033598183, 0.29987196) Data Point: (0.061584821, 0.29987196) Data Point: (0.11288379, 0.29987196) Data Point: (0.20691381, 0.29987196) Data Point: (0.37926902, 0.29987196) Data Point: (0.6951928, 0.29987196) Data Point: (1.274275, 0.29987196) Data Point: (2.3357215, 0.29987196) Data Point: (4.2813324, 0.29987196) Data Point: (7.8475997, 0.29987196) Data Point: (14.384499, 0.29987196) Data Point: (26.366509, 0.29987196) Data Point: (48.329302, 0.29987196) Data Point: (88.586679, 0.29667682) Data Point: (162.37767, 0.20150036) Data Point: (297.63514, 0.085811521) Data Point: (545.55948, 0.049379583) Data Point: (1,000, 0.039446735)
Estimation Properties Vol. WC Estimation Method: Grain Size Function Saturated Water Content: 0.3 ft³/ft³ Sample Material: Clay
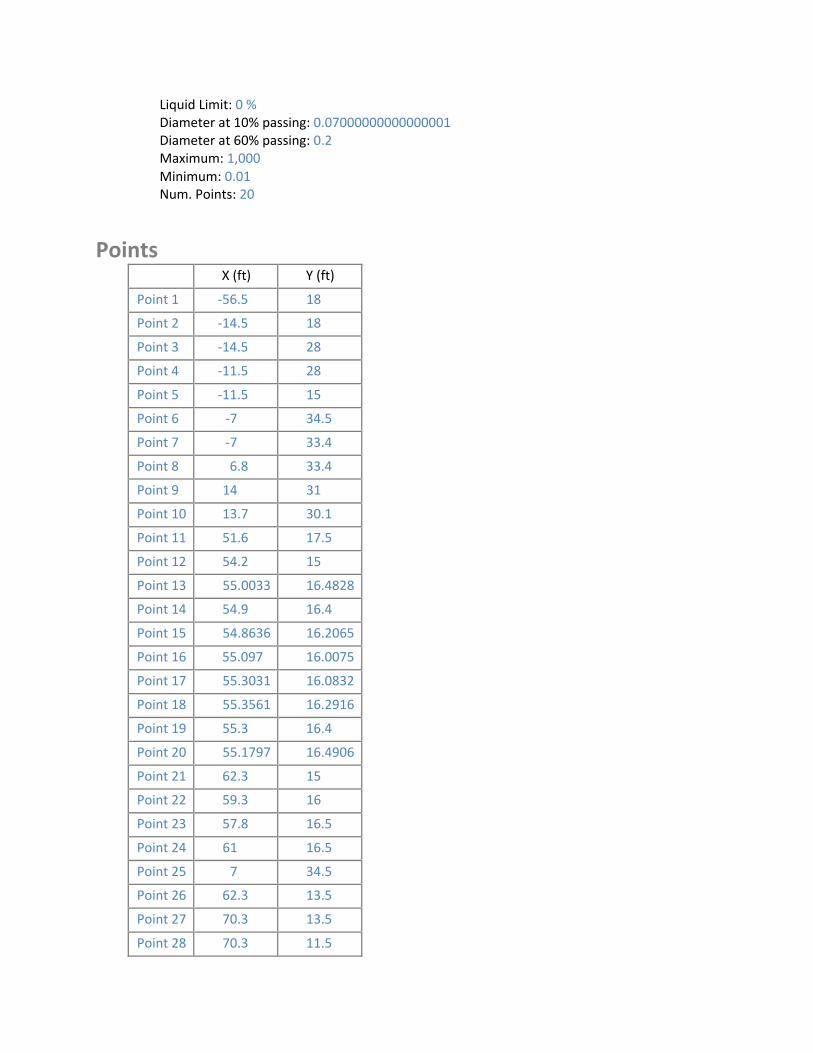
Liquid Limit: 0 % Diameter at 10% passing: 0.07000000000000001 Diameter at 60% passing: 0.2 Maximum: 1,000 Minimum: 0.01 Num. Points: 20
Points X (ft) Y (ft)
Point 1 ‐56.5 18
Point 2 ‐14.5 18
Point 3 ‐14.5 28
Point 4 ‐11.5 28
Point 5 ‐11.5 15
Point 6 ‐7 34.5
Point 7 ‐7 33.4
Point 8 6.8 33.4
Point 9 14 31
Point 10 13.7 30.1
Point 11 51.6 17.5
Point 12 54.2 15
Point 13 55.0033 16.4828
Point 14 54.9 16.4
Point 15 54.8636 16.2065
Point 16 55.097 16.0075
Point 17 55.3031 16.0832
Point 18 55.3561 16.2916
Point 19 55.3 16.4
Point 20 55.1797 16.4906
Point 21 62.3 15
Point 22 59.3 16
Point 23 57.8 16.5
Point 24 61 16.5
Point 25 7 34.5
Point 26 62.3 13.5
Point 27 70.3 13.5
Point 28 70.3 11.5
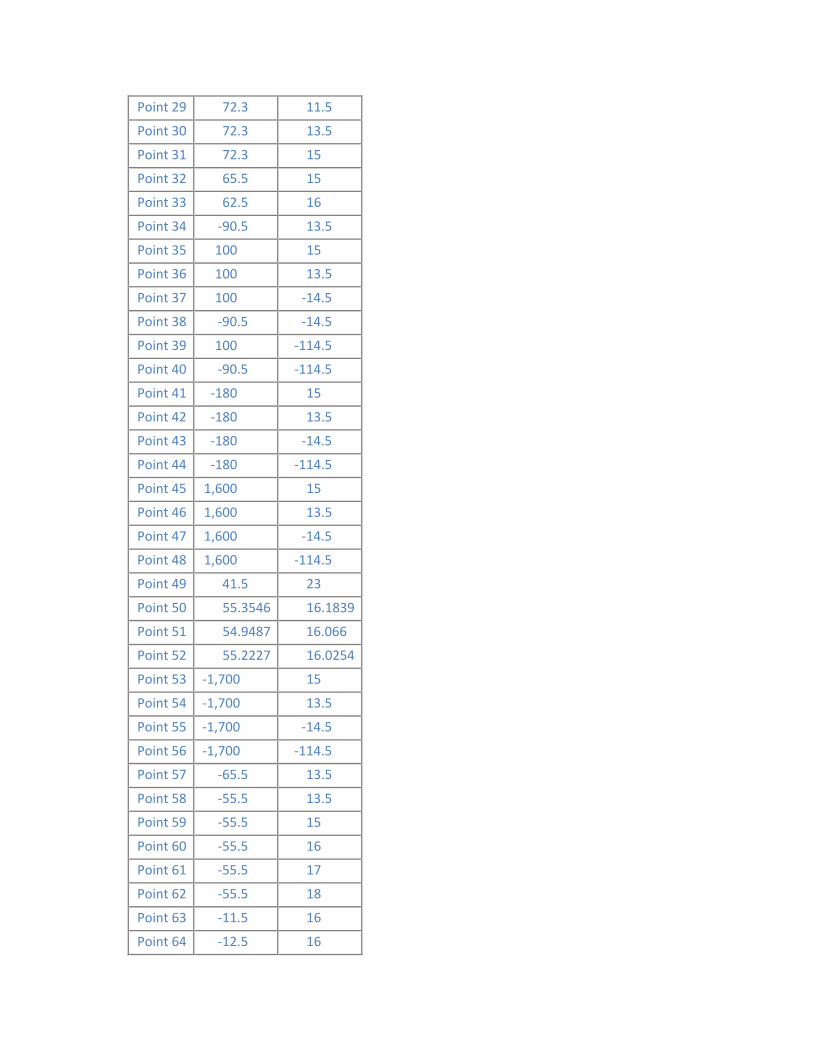
29
30
31
32
33
34
35
36
37
38
39
40
41
42
43
44
45
46
47
48
49
50
51
52
53
54
55
56
57
58
59
60
61
62
63
64
Point 72.3 11.5
Point 72.3 13.5
Point 72.3 15
Point 65.5 15
Point 62.5 16
Point ‐90.5 13.5
Point 100 15
Point 100 13.5
Point 100 ‐14.5
Point ‐90.5 ‐14.5
Point 100 ‐114.5
Point ‐90.5 ‐114.5
Point ‐180 15
Point ‐180 13.5
Point ‐180 ‐14.5
Point ‐180 ‐114.5
Point 1,600 15
Point 1,600 13.5
Point 1,600 ‐14.5
Point 1,600 ‐114.5
Point 41.5 23
Point 55.3546 16.1839
Point 54.9487 16.066
Point 55.2227 16.0254
Point ‐1,700 15
Point ‐1,700 13.5
Point ‐1,700 ‐14.5
Point ‐1,700 ‐114.5
Point ‐65.5 13.5
Point ‐55.5 13.5
Point ‐55.5 15
Point ‐55.5 16
Point ‐55.5 17
Point ‐55.5 18
Point ‐11.5 16
Point ‐12.5 16
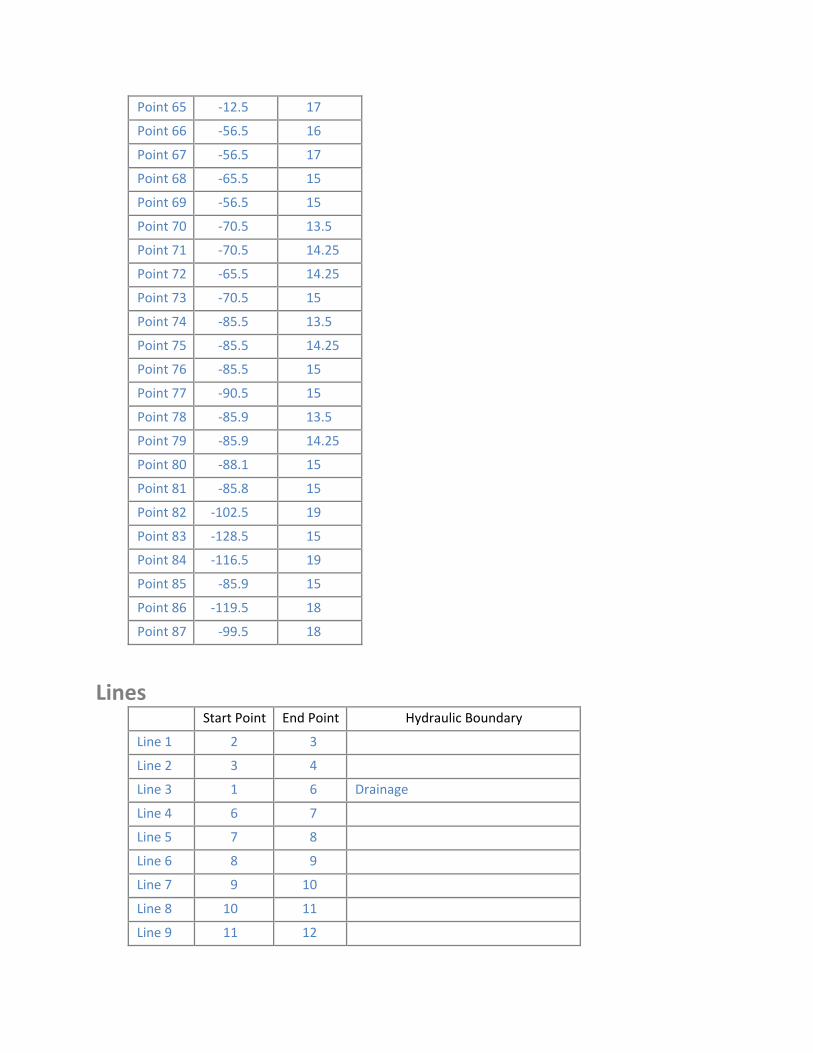
Point 65 ‐12.5 17
Point 66 ‐56.5 16
Point 67 ‐56.5 17
Point 68 ‐65.5 15
Point 69 ‐56.5 15
Point 70 ‐70.5 13.5
Point 71 ‐70.5 14.25
Point 72 ‐65.5 14.25
Point 73 ‐70.5 15
Point 74 ‐85.5 13.5
Point 75 ‐85.5 14.25
Point 76 ‐85.5 15
Point 77 ‐90.5 15
Point 78 ‐85.9 13.5
Point 79 ‐85.9 14.25
Point 80 ‐88.1 15
Point 81 ‐85.8 15
Point 82 ‐102.5 19
Point 83 ‐128.5 15
Point 84 ‐116.5 19
Point 85 ‐85.9 15
Point 86 ‐119.5 18
Point 87 ‐99.5 18
Lines Start Point End Point Hydraulic Boundary
Line 1 2 3
Line 2 3 4
Line 3 1 6 Drainage
Line 4 6 7
Line 5 7 8
Line 6 8 9
Line 7 9 10
Line 8 10 11
Line 9 11 12
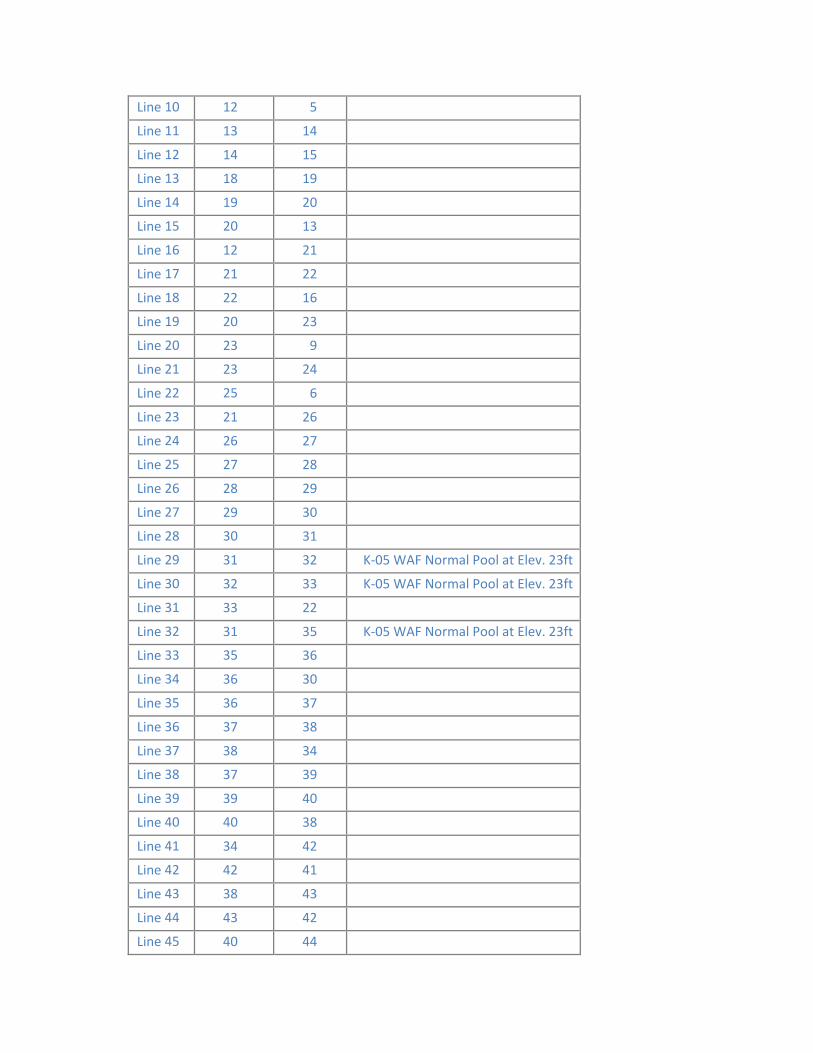
10
11
12
13
14
15
16
17
18
19
20
21
22
23
24
25
26
27
28
29
30
31
32
33
34
35
36
37
38
39
40
41
42
43
44
45
20
25
30
35
40
Line 12 5
Line 13 14
Line 14 15
Line 18 19
Line 19 20
Line 13
Line 12 21
Line 21 22
Line 22 16
Line 20 23
Line 23 9
Line 23 24
Line 6
Line 21 26
Line 26 27
Line 27 28
Line 28 29
Line 29 30
Line 31
Line 31 32 K‐05 WAF Normal Pool at Elev. 23ft
Line 32 33 K‐05 WAF Normal Pool at Elev. 23ft
Line 33 22
Line 31 35 K‐05 WAF Normal Pool at Elev. 23ft
Line 36
Line 36 30
Line 36 37
Line 37 38
Line 38 34
Line 37 39
Line 39 40
Line 38
Line 34 42
Line 42 41
Line 38 43
Line 43 42
Line 40 44
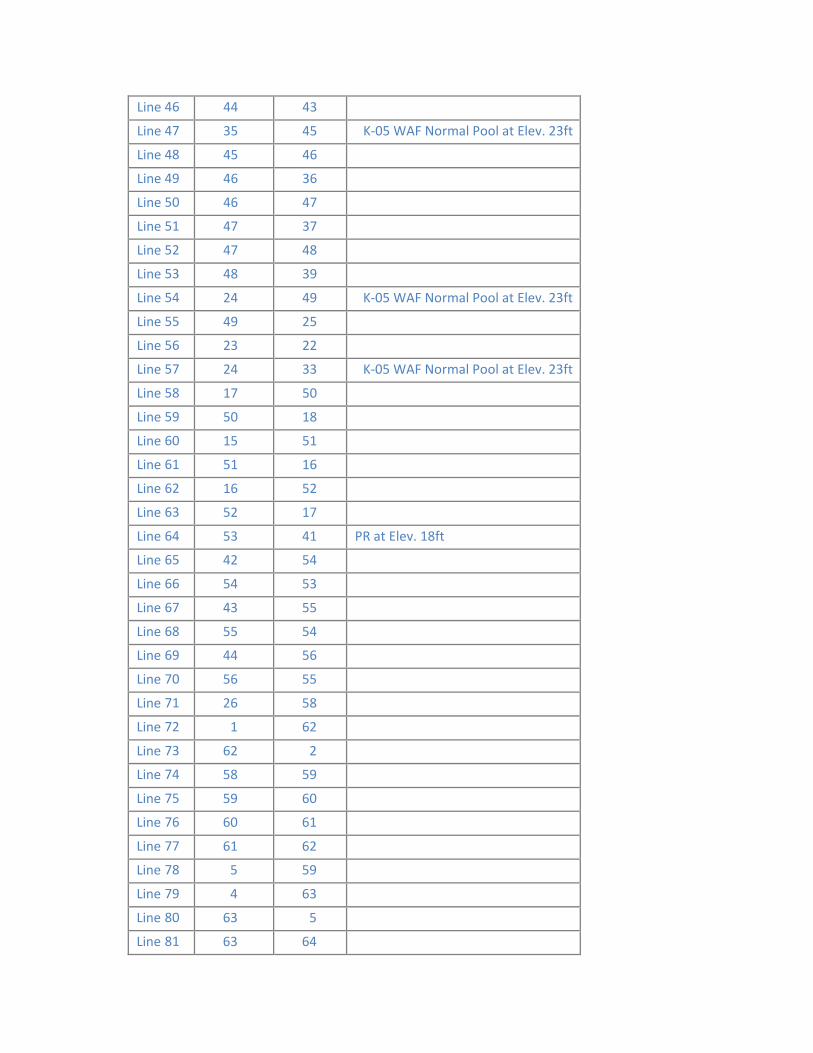
46
47
48
49
50
51
52
53
54
55
56
57
58
59
60
61
62
63
64
65
66
67
68
69
70
71
72
73
74
75
76
77
78
79
80
81
Line 44 43
Line 35 45 K‐05 WAF Normal Pool at Elev. 23ft
Line 45 46
Line 46 36
Line 46 47
Line 47 37
Line 47 48
Line 48 39
Line 24 49 K‐05 WAF Normal Pool at Elev. 23ft
Line 49 25
Line 23 22
Line 24 33 K‐05 WAF Normal Pool at Elev. 23ft
Line 17 50
Line 50 18
Line 15 51
Line 51 16
Line 16 52
Line 52 17
Line 53 41 PR at Elev. 18ft
Line 42 54
Line 54 53
Line 43 55
Line 55 54
Line 44 56
Line 56 55
Line 26 58
Line 1 62
Line 62 2
Line 58 59
Line 59 60
Line 60 61
Line 61 62
Line 5 59
Line 4 63
Line 63 5
Line 63 64
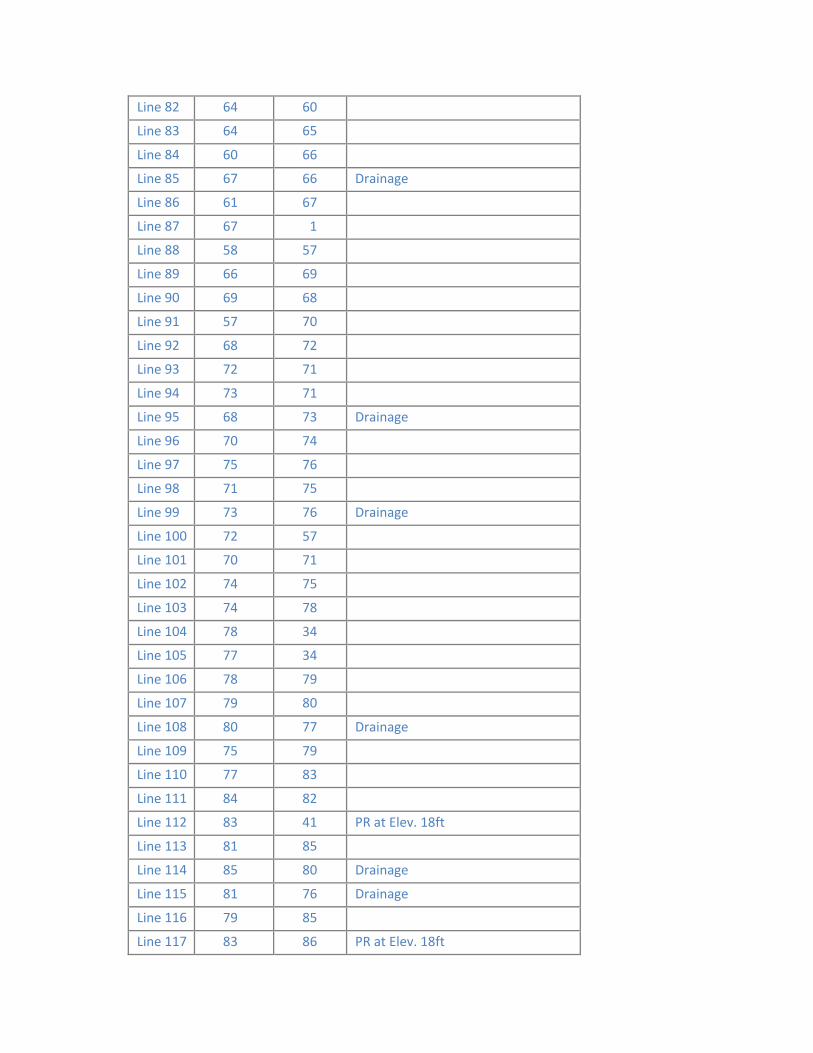
82
83
84
85
86
87
88
89
90
91
92
93
94
95
96
97
98
99
100
101
102
103
104
105
106
107
108
109
110
111
112
113
114
115
116
117
65
70
75
80
85
Line 64 60
Line 64
Line 60 66
Line 67 66 Drainage
Line 61 67
Line 67 1
Line 58 57
Line 66 69
Line 69 68
Line 57
Line 68 72
Line 72 71
Line 73 71
Line 68 73 Drainage
Line 70 74
Line 75 76
Line 71
Line 73 76 Drainage
Line 72 57
Line 70 71
Line 74 75
Line 74 78
Line 78 34
Line 77 34
Line 78 79
Line 79
Line 80 77 Drainage
Line 75 79
Line 77 83
Line 84 82
Line 83 41 PR at Elev. 18ft
Line 81
Line 85 80 Drainage
Line 81 76 Drainage
Line 79 85
Line 83 86 PR at Elev. 18ft
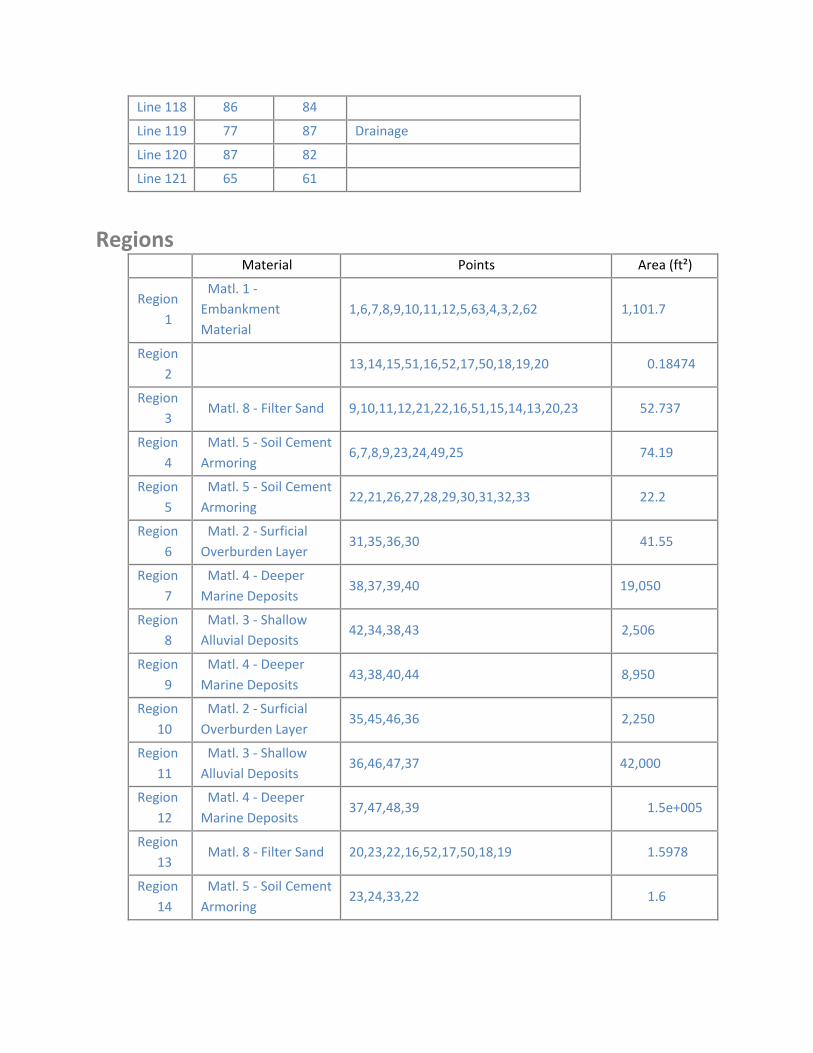
Line 118 86 84
Line 119 77 87 Drainage
Line 120 87 82
Line 121 65 61
Regions Material Points Area (ft²)
Region
1
Matl. 1 ‐Embankment
Material
1,6,7,8,9,10,11,12,5,63,4,3,2,62 1,101.7
Region
2 13,14,15,51,16,52,17,50,18,19,20 0.18474
Region
3 Matl. 8 ‐ Filter Sand 9,10,11,12,21,22,16,51,15,14,13,20,23 52.737
Region
4
Matl. 5 ‐ Soil Cement
Armoring 6,7,8,9,23,24,49,25 74.19
Region
5
Matl. 5 ‐ Soil Cement
Armoring 22,21,26,27,28,29,30,31,32,33 22.2
Region
6
Matl. 2 ‐ Surficial
Overburden Layer 31,35,36,30 41.55
Region
7
Matl. 4 ‐ Deeper
Marine Deposits 38,37,39,40 19,050
Region
8
Matl. 3 ‐ Shallow Alluvial Deposits
42,34,38,43 2,506
Region
9
Matl. 4 ‐ Deeper
Marine Deposits 43,38,40,44 8,950
Region
10
Matl. 2 ‐ Surficial
Overburden Layer 35,45,46,36 2,250
Region
11
Matl. 3 ‐ Shallow
Alluvial Deposits 36,46,47,37 42,000
Region
12
Matl. 4 ‐ Deeper
Marine Deposits 37,47,48,39 1.5e+005
Region
13 Matl. 8 ‐ Filter Sand 20,23,22,16,52,17,50,18,19 1.5978
Region
14
Matl. 5 ‐ Soil Cement
Armoring 23,24,33,22 1.6
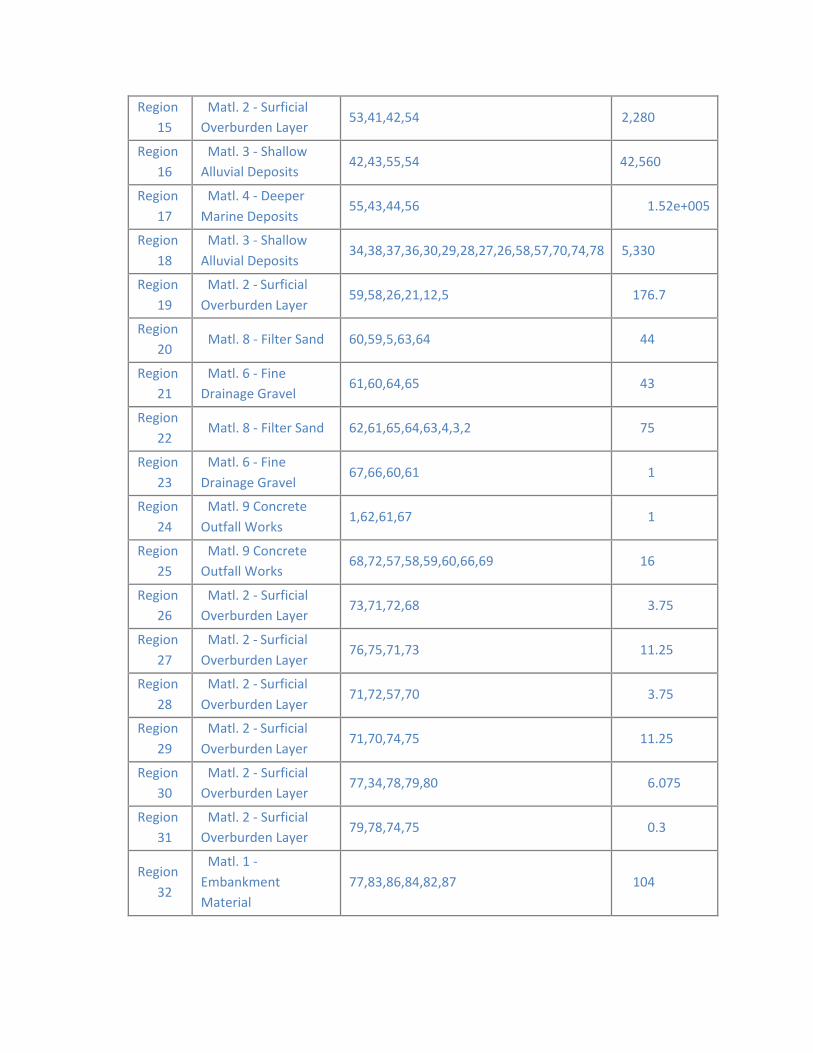
15
16
17
18
19
20
21
22
23
24
25
26
27
28
29
30
31
32
Region Matl. 2 ‐ Surficial Overburden Layer
53,41,42,54 2,280
Region Matl. 3 ‐ Shallow Alluvial Deposits
42,43,55,54 42,560
Region Matl. 4 ‐ Deeper
Marine Deposits 55,43,44,56 1.52e+005
Region Matl. 3 ‐ Shallow
Alluvial Deposits 34,38,37,36,30,29,28,27,26,58,57,70,74,78 5,330
Region Matl. 2 ‐ Surficial
Overburden Layer 59,58,26,21,12,5 176.7
Region Matl. 8 ‐ Filter Sand 60,59,5,63,64 44
Region Matl. 6 ‐ Fine Drainage Gravel
61,60,64,65 43
Region Matl. 8 ‐ Filter Sand 62,61,65,64,63,4,3,2 75
Region Matl. 6 ‐ Fine
Drainage Gravel 67,66,60,61 1
Region Matl. 9 Concrete
Outfall Works 1,62,61,67 1
Region Matl. 9 Concrete Outfall Works
68,72,57,58,59,60,66,69 16
Region Matl. 2 ‐ Surficial Overburden Layer
73,71,72,68 3.75
Region Matl. 2 ‐ Surficial
Overburden Layer 76,75,71,73 11.25
Region Matl. 2 ‐ Surficial
Overburden Layer 71,72,57,70 3.75
Region Matl. 2 ‐ Surficial
Overburden Layer 71,70,74,75 11.25
Region Matl. 2 ‐ Surficial Overburden Layer
77,34,78,79,80 6.075
Region Matl. 2 ‐ Surficial Overburden Layer
79,78,74,75 0.3
Region Matl. 1 ‐
Embankment Material
77,83,86,84,82,87 104

Region
33 Matl. 2 ‐ Surficial Overburden Layer
41,42,34,77,83 134.25
Region
34 Matl. 2 ‐ Surficial Overburden Layer
85,81,76,75,79 0.3
Region
35
Matl. 2 ‐ Surficial
Overburden Layer 80,85,79 0.825
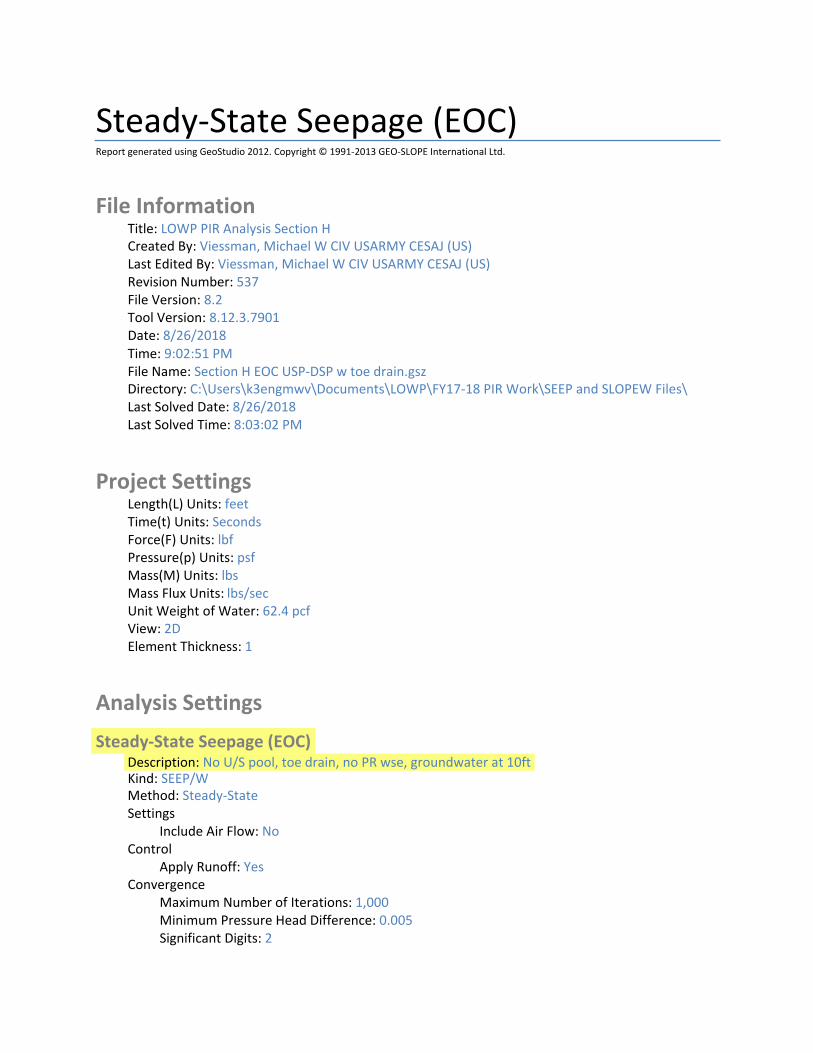
Steady‐State Seepage (EOC) Report generated using GeoStudio 2012. Copyright © 1991‐2013 GEO‐SLOPE International Ltd.
File Information Title: LOWP PIR Analysis Section H Created By: Viessman, Michael W CIV USARMY CESAJ (US) Last Edited By: Viessman, Michael W CIV USARMY CESAJ (US) Revision Number: 537 File Version: 8.2 Tool Version: 8.12.3.7901 Date: 8/26/2018 Time: 9:02:51 PM File Name: Section H EOC USP‐DSP w toe drain.gsz Directory: C:\Users\k3engmwv\Documents\LOWP\FY17‐18 PIR Work\SEEP and SLOPEW Files\ Last Solved Date: 8/26/2018 Last Solved Time: 8:03:02 PM
Project Settings Length(L) Units: feet Time(t) Units: Seconds Force(F) Units: lbf Pressure(p) Units: psf Mass(M) Units: lbs Mass Flux Units: lbs/sec Unit Weight of Water: 62.4 pcf View: 2D Element Thickness: 1
Analysis Settings
Steady‐State Seepage (EOC) Description: No U/S pool, toe drain, no PR wse, groundwater at 10ft Kind: SEEP/W Method: Steady‐State Settings
Include Air Flow: No Control
Apply Runoff: Yes Convergence
Maximum Number of Iterations: 1,000 Minimum Pressure Head Difference: 0.005 Significant Digits: 2

Max # of Reviews: 10 Hydraulic Under‐Relaxation Criteria
Under‐Relaxation Initial Rate: 1 Under‐Relaxation Min. Rate: 0.1 Under‐Relaxation Reduction Rate: 0.65 Under‐Relaxation Iterations: 10
Equation Solver: Parallel Direct Time
Starting Time: 0 sec Duration: 0 sec Ending Time: 0 sec
Materials
Matl. 1 ‐ Embankment Material Model: Saturated / Unsaturated Hydraulic
K‐Function: Matl. 1 Embankment Material Ky'/Kx' Ratio: 0.25 Rotation: 0 ° Vol. WC. Function: Matl. 1 Embankment Fill from Borrow Areas
Matl. 2 ‐ Surficial Overburden Layer Model: Saturated / Unsaturated Hydraulic
K‐Function: Matl. 2 Surficial Overburden Layer Ky'/Kx' Ratio: 0.1 Rotation: 0 ° Vol. WC. Function: Matl. 2 Surficial Overburden Layer
Matl. 3 ‐ Shallow Alluvial Deposits Model: Saturated / Unsaturated Hydraulic
K‐Function: Matl. 3 Shallow Alluvial Deposits Ky'/Kx' Ratio: 0.1 Rotation: 0 ° Vol. WC. Function: Matl. 3 Shallow Alluvial Deposits
Matl. 4 ‐ Deeper Marine Deposits Model: Saturated / Unsaturated Hydraulic
K‐Function: Matl. 4 Deeper Marine Deposits Ky'/Kx' Ratio: 0.1 Rotation: 0 ° Vol. WC. Function: Matl. 4 Deeper Marine Deposits
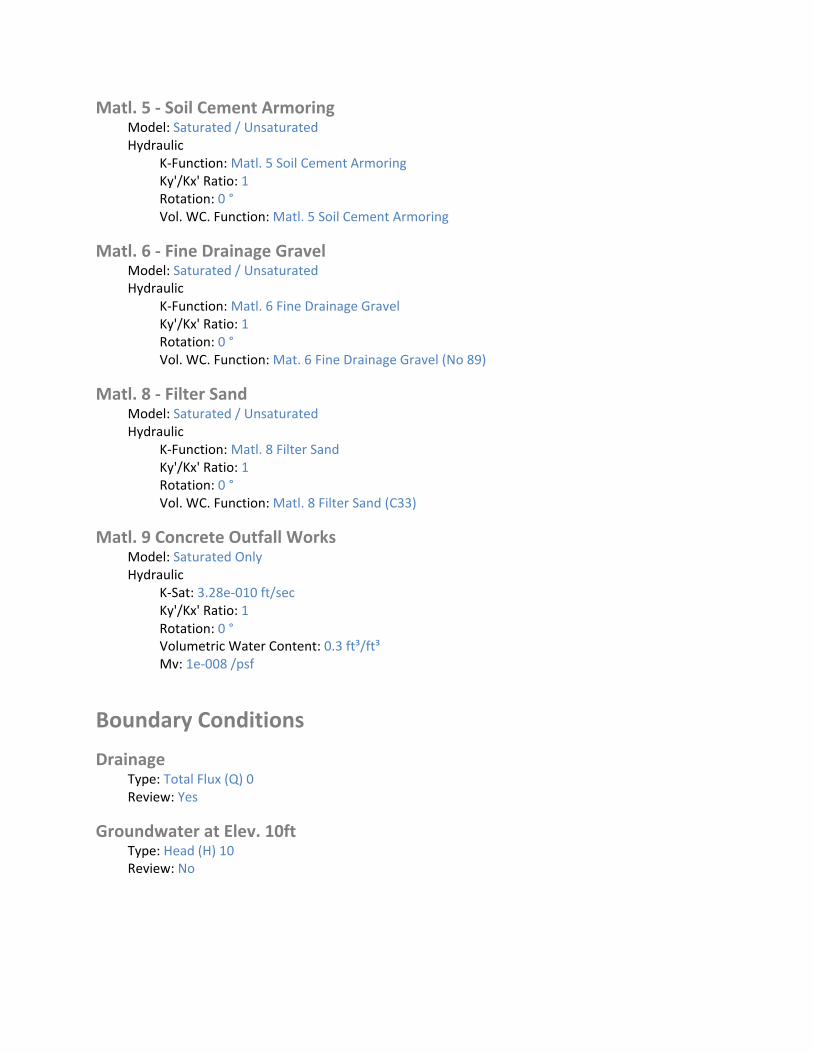
Matl. 5 ‐ Soil Cement Armoring Model: Saturated / Unsaturated Hydraulic
K‐Function: Matl. 5 Soil Cement Armoring Ky'/Kx' Ratio: 1 Rotation: 0 ° Vol. WC. Function: Matl. 5 Soil Cement Armoring
Matl. 6 ‐ Fine Drainage Gravel Model: Saturated / Unsaturated Hydraulic
K‐Function: Matl. 6 Fine Drainage Gravel Ky'/Kx' Ratio: 1 Rotation: 0 ° Vol. WC. Function: Mat. 6 Fine Drainage Gravel (No 89)
Matl. 8 ‐ Filter Sand Model: Saturated / Unsaturated Hydraulic
K‐Function: Matl. 8 Filter Sand Ky'/Kx' Ratio: 1 Rotation: 0 ° Vol. WC. Function: Matl. 8 Filter Sand (C33)
Matl. 9 Concrete Outfall Works Model: Saturated Only Hydraulic
K‐Sat: 3.28e‐010 ft/sec Ky'/Kx' Ratio: 1 Rotation: 0 ° Volumetric Water Content: 0.3 ft³/ft³ Mv: 1e‐008 /psf
Boundary Conditions
Drainage Type: Total Flux (Q) 0 Review: Yes
Groundwater at Elev. 10ft Type: Head (H) 10 Review: No

Flux Sections
Flux Section 1 Coordinates
Coordinate: (‐56.368089, 17.11908) ft Coordinate: (‐56.359991, 15.897243) ft
Flux Section 2 Coordinates
Coordinate: (‐100.27362, 18.818898) ft Coordinate: (‐86.017717, 14.05315) ft Coordinate: (‐65.383858, 14.059055) ft
Flux Section 3 Coordinates
Coordinate: (‐11.352061, 28.166901) ft Coordinate: (‐11.307284, 14.896151) ft
Flux Section 4 Coordinates
Coordinate: (‐11.307284, 14.851374) ft Coordinate: (‐55.502072, 14.873763) ft
Flux Section 5 Coordinates
Coordinate: (‐0.349869, 33.216015) ft Coordinate: (‐0.361475, ‐114.73943) ft
Flux Section 6 Coordinates
Coordinate: (‐109.10947, 18.913159) ft Coordinate: (‐109.07273, ‐114.73608) ft
K Functions
Matl. 1 Embankment Material Model: Hyd K Data Point Function Function: X‐Conductivity vs. Pore‐Water Pressure
Curve Fit to Data: 100 % Segment Curvature: 36 %
K‐Saturation: 0.000131 Data Points: Matric Suction (psf), X‐Conductivity (ft/sec)
Data Point: (0.01, 0.000131) Data Point: (0.018329807, 0.00013099927) Data Point: (0.033598183, 0.00013099852) Data Point: (0.061584821, 0.00013099772)

Data Point: (0.11288379, 0.00013099684) Data Point: (0.20691381, 0.00013099581) Data Point: (0.37926902,0.0001309945) Data Point: (0.6951928, 0.00013099268) Data Point: (1.274275, 0.00013098992) Data Point: (2.3357215, 0.00013098549) Data Point: (4.2813324, 0.0001309777) Data Point: (7.8475997, 0.00013096339) Data Point: (14.384499,0.00013094955) Data Point: (26.366509,0.00013089452) Data Point: (48.329302,0.00013043835) Data Point: (88.586679, 0.00012910123) Data Point: (162.37767, 5.664247e‐005) Data Point: (297.63514, 2.5159921e‐006) Data Point: (545.55948, 4.7485927e‐008) Data Point: (1,000, 1.7886028e‐009)
Estimation Properties Hyd. K‐Function Estimation Method: Fredlund‐Xing Function Volume Water Content Function: Matl. 1 Embankment Fill from Borrow Areas Hydraulic K Sat: 0.000131 ft/sec Residual Water Content: 0.0495 ft³/ft³ Maximum: 1,000 Minimum: 0.01 Num. Points: 20
Matl. 4 Deeper Marine Deposits Model: Hyd K Data Point Function Function: X‐Conductivity vs. Pore‐Water Pressure
Curve Fit to Data: 100 % Segment Curvature: 44 %
K‐Saturation: 0.000984 Data Points: Matric Suction (psf), X‐Conductivity (ft/sec)
Data Point: (0.01, 0.000984) Data Point: (0.018329807, 0.00098398585) Data Point: (0.033598183, 0.00098397151) Data Point: (0.061584821, 0.00098395679) Data Point: (0.11288379, 0.00098394139) Data Point: (0.20691381, 0.00098392476) Data Point: (0.37926902, 0.00098390584) Data Point: (0.6951928, 0.00098388274) Data Point: (1.274275, 0.00098385199) Data Point: (2.3357215, 0.0009838074) Data Point: (4.2813324,0.00098373618) Data Point: (7.8475997,0.00098361453) Data Point: (14.384499, 0.0009834543) Data Point: (26.366509,0.00098304118) Data Point: (48.329302,0.00098089274) Data Point: (88.586679,0.00098804841)

Data Point: (162.37767, 0.00089693201) Data Point: (297.63514, 0.00029836287) Data Point: (545.55948, 5.5741791e‐006) Data Point: (1,000, 8.8545842e‐008)
Estimation Properties Hyd. K‐Function Estimation Method: Fredlund‐Xing Function Volume Water Content Function: Matl. 4 Deeper Marine Deposits Hydraulic K Sat: 0.000984 ft/sec Residual Water Content: 0.03 ft³/ft³ Maximum: 1,000 Minimum: 0.01 Num. Points: 20
Matl. 6 Fine Drainage Gravel Model: Hyd K Data Point Function Function: X‐Conductivity vs. Pore‐Water Pressure
Curve Fit to Data: 100 % Segment Curvature: 40 %
K‐Saturation: 0.02315 Data Points: Matric Suction (psf), X‐Conductivity (ft/sec)
Data Point: (0.01, 0.02315) Data Point: (0.018329807, 0.023149999) Data Point: (0.033598183, 0.023149997) Data Point: (0.061584821, 0.023149994) Data Point: (0.11288379, 0.023149984) Data Point: (0.20691381, 0.023149981) Data Point: (0.37926902, 0.023150055) Data Point: (0.6951928, 0.023149315) Data Point: (1.274275, 0.02314882) Data Point: (2.3357215, 0.023163455) Data Point: (4.2813324, 0.02041826) Data Point: (7.8475997, 0.0039249052) Data Point: (14.384499, 6.6024733e‐005) Data Point: (26.366509, 7.000732e‐007) Data Point: (48.329302, 2.0374523e‐008) Data Point: (88.586679, 3.5541328e‐009) Data Point: (162.37767, 7.5581773e‐010) Data Point: (297.63514, 1.5822386e‐010) Data Point: (545.55948, 2.6567478e‐011) Data Point: (1,000, 2.4617797e‐012)
Estimation Properties Hyd. K‐Function Estimation Method: Fredlund‐Xing Function Volume Water Content Function: Mat. 6 Fine Drainage Gravel (No 89) Hydraulic K Sat: 0.02315 ft/sec Residual Water Content: 0.042 ft³/ft³ Maximum: 1,000 Minimum: 0.01 Num. Points: 20

Matl. 2 Surficial Overburden Layer Model: Hyd K Data Point Function Function: X‐Conductivity vs. Pore‐Water Pressure
Curve Fit to Data: 100 % Segment Curvature: 36 %
K‐Saturation: 0.00026 Data Points: Matric Suction (psf), X‐Conductivity (ft/sec)
Data Point: (0.01, 0.00026) Data Point: (0.018329807, 0.00025999835) Data Point: (0.033598183, 0.00025999664) Data Point: (0.061584821, 0.00025999485) Data Point: (0.11288379, 0.00025999288) Data Point: (0.20691381, 0.00025999062) Data Point: (0.37926902, 0.00025998779) Data Point: (0.6951928, 0.00025998393) Data Point: (1.274275, 0.00025997819) Data Point: (2.3357215,0.00025996907) Data Point: (4.2813324,0.00025995329) Data Point: (7.8475997,0.00025992467) Data Point: (14.384499,0.00025989276) Data Point: (26.366509,0.00025978642) Data Point: (48.329302,0.00025903344) Data Point: (88.586679, 0.0002586222) Data Point: (162.37767, 0.00013432217) Data Point: (297.63514, 8.1547435e‐006) Data Point: (545.55948, 1.3663567e‐007) Data Point: (1,000, 4.5608744e‐009)
Estimation Properties Hyd. K‐Function Estimation Method: Fredlund‐Xing Function Volume Water Content Function: Matl. 2 Surficial Overburden Layer Hydraulic K Sat: 0.00026 ft/sec Residual Water Content: 0.0495 ft³/ft³ Maximum: 1,000 Minimum: 0.01 Num. Points: 20
Matl. 3 Shallow Alluvial Deposits Model: Hyd K Data Point Function Function: X‐Conductivity vs. Pore‐Water Pressure
Curve Fit to Data: 100 % Segment Curvature: 36 %
K‐Saturation: 0.00174 Data Points: Matric Suction (psf), X‐Conductivity (ft/sec)
Data Point: (0.01, 0.00174) Data Point: (0.018329807, 0.0017399903) Data Point: (0.033598183, 0.0017399803) Data Point: (0.061584821, 0.0017399698)

Data Point: (0.11288379,0.0017399581) Data Point: (0.20691381,0.0017399444) Data Point: (0.37926902,0.0017399269) Data Point: (0.6951928, 0.0017399027) Data Point: (1.274275, 0.0017398661) Data Point: (2.3357215, 0.0017398072) Data Point: (4.2813324, 0.0017397038) Data Point: (7.8475997, 0.0017395137) Data Point: (14.384499, 0.0017393299) Data Point: (26.366509, 0.001738599) Data Point: (48.329302, 0.0017325399) Data Point: (88.586679, 0.0017147796) Data Point: (162.37767, 0.00075235037) Data Point: (297.63514, 3.3418521e‐005) Data Point: (545.55948, 6.307291e‐007) Data Point: (1,000, 2.3757014e‐008)
Estimation Properties Hyd. K‐Function Estimation Method: Fredlund‐Xing Function Volume Water Content Function: Matl. 3 Shallow Alluvial Deposits Hydraulic K Sat: 0.00174 ft/sec Residual Water Content: 0.0495 ft³/ft³ Maximum: 1,000 Minimum: 0.01 Num. Points: 20
Matl. 5 Soil Cement Armoring Model: Hyd K Data Point Function Function: X‐Conductivity vs. Pore‐Water Pressure
Curve Fit to Data: 100 % Segment Curvature: 44 %
K‐Saturation: 1.31e‐005 Data Points: Matric Suction (psf), X‐Conductivity (ft/sec)
Data Point: (0.01, 1.31e‐005) Data Point: (0.018329807, 1.3099927e‐005) Data Point: (0.033598183, 1.3099852e‐005) Data Point: (0.061584821, 1.3099772e‐005) Data Point: (0.11288379, 1.3099684e‐005) Data Point: (0.20691381, 1.3099581e‐005) Data Point: (0.37926902, 1.309945e‐005) Data Point: (0.6951928, 1.3099268e‐005) Data Point: (1.274275, 1.3098992e‐005) Data Point: (2.3357215, 1.3098549e‐005) Data Point: (4.2813324, 1.309777e‐005) Data Point: (7.8475997, 1.3096339e‐005) Data Point: (14.384499, 1.3094955e‐005) Data Point: (26.366509, 1.3089452e‐005) Data Point: (48.329302, 1.3043835e‐005) Data Point: (88.586679, 1.2910123e‐005)
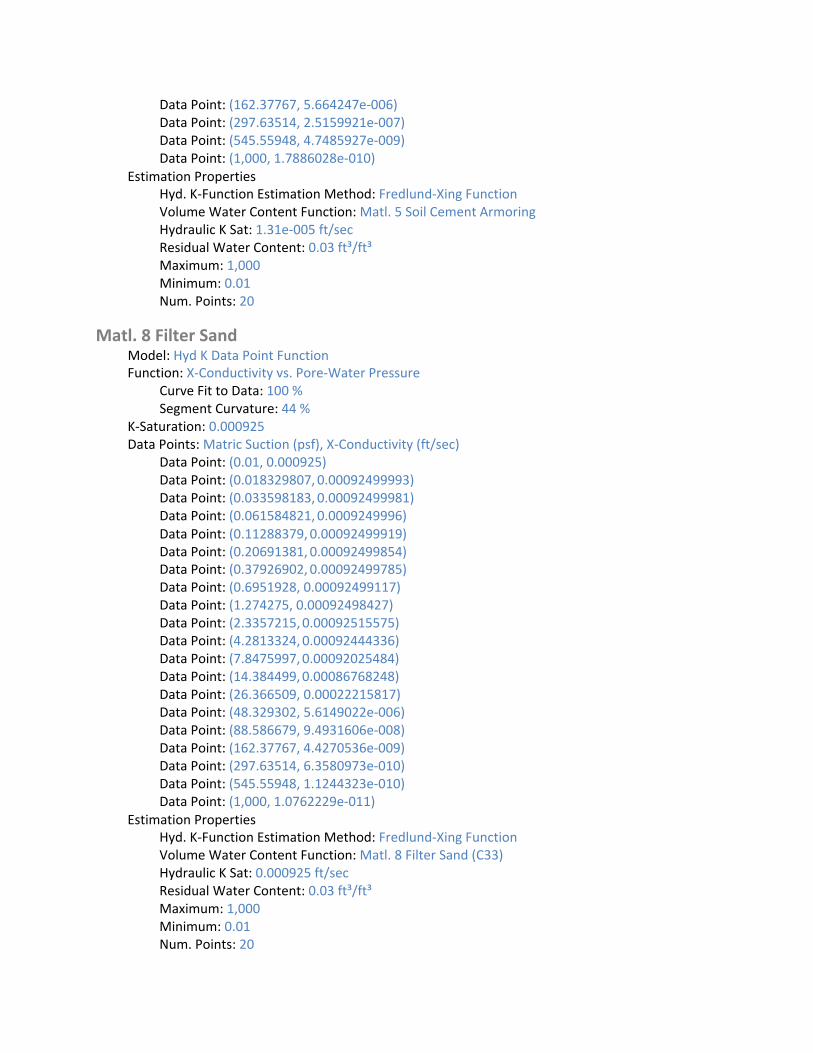
Data Point: (162.37767, 5.664247e‐006) Data Point: (297.63514, 2.5159921e‐007) Data Point: (545.55948, 4.7485927e‐009) Data Point: (1,000, 1.7886028e‐010)
Estimation Properties Hyd. K‐Function Estimation Method: Fredlund‐Xing Function Volume Water Content Function: Matl. 5 Soil Cement Armoring Hydraulic K Sat: 1.31e‐005 ft/sec Residual Water Content: 0.03 ft³/ft³ Maximum: 1,000 Minimum: 0.01 Num. Points: 20
Matl. 8 Filter Sand Model: Hyd K Data Point Function Function: X‐Conductivity vs. Pore‐Water Pressure
Curve Fit to Data: 100 % Segment Curvature: 44 %
K‐Saturation: 0.000925 Data Points: Matric Suction (psf), X‐Conductivity (ft/sec)
Data Point: (0.01, 0.000925) Data Point: (0.018329807, 0.00092499993) Data Point: (0.033598183, 0.00092499981) Data Point: (0.061584821, 0.0009249996) Data Point: (0.11288379, 0.00092499919) Data Point: (0.20691381, 0.00092499854) Data Point: (0.37926902, 0.00092499785) Data Point: (0.6951928, 0.00092499117) Data Point: (1.274275, 0.00092498427) Data Point: (2.3357215,0.00092515575) Data Point: (4.2813324,0.00092444336) Data Point: (7.8475997,0.00092025484) Data Point: (14.384499,0.00086768248) Data Point: (26.366509, 0.00022215817) Data Point: (48.329302, 5.6149022e‐006) Data Point: (88.586679, 9.4931606e‐008) Data Point: (162.37767, 4.4270536e‐009) Data Point: (297.63514, 6.3580973e‐010) Data Point: (545.55948, 1.1244323e‐010) Data Point: (1,000, 1.0762229e‐011)
Estimation Properties Hyd. K‐Function Estimation Method: Fredlund‐Xing Function Volume Water Content Function: Matl. 8 Filter Sand (C33) Hydraulic K Sat: 0.000925 ft/sec Residual Water Content: 0.03 ft³/ft³ Maximum: 1,000 Minimum: 0.01 Num. Points: 20

Vol. Water Content Functions
Matl. 3 Shallow Alluvial Deposits Model: Vol WC Data Point Function Function: Vol. Water Content vs. Pore‐Water Pressure
Mv: 2.5e‐006 /psf Saturated Water Content: 0.30020276 ft³/ft³ Residual Water Content: 0.030020276 ft³/ft³ Curve Fit to Data: 100 % Segment Curvature: 40 %
Porosity: 0.30020276 Data Points: Matric Suction (psf), Vol. Water Content (ft³/ft³)
Data Point: (0.01, 0.29987196) Data Point: (0.018329807, 0.29987196) Data Point: (0.033598183, 0.29987196) Data Point: (0.061584821, 0.29987196) Data Point: (0.11288379, 0.29987196) Data Point: (0.20691381, 0.29987196) Data Point: (0.37926902, 0.29987196) Data Point: (0.6951928, 0.29987196) Data Point: (1.274275, 0.29987196) Data Point: (2.3357215, 0.29987196) Data Point: (4.2813324, 0.29987196) Data Point: (7.8475997, 0.29987196) Data Point: (14.384499, 0.29987196) Data Point: (26.366509, 0.29987196) Data Point: (48.329302, 0.29987196) Data Point: (88.586679, 0.29667682) Data Point: (162.37767, 0.20150036) Data Point: (297.63514, 0.085811521) Data Point: (545.55948, 0.049379583) Data Point: (1,000, 0.039446735)
Estimation Properties Vol. WC Estimation Method: Grain Size Function Saturated Water Content: 0.3 ft³/ft³ Sample Material: Clay Liquid Limit: 0 % Diameter at 10% passing: 0.07000000000000001 Diameter at 60% passing: 0.2 Maximum: 1,000 Minimum: 0.01 Num. Points: 20
Matl. 1 Embankment Fill from Borrow Areas Model: Vol WC Data Point Function Function: Vol. Water Content vs. Pore‐Water Pressure
Mv: 2.5e‐006 /psf

Saturated Water Content: 0.30020276 ft³/ft³ Residual Water Content: 0.030020276 ft³/ft³ Curve Fit to Data: 100 % Segment Curvature: 40 %
Porosity: 0.30020276 Data Points: Matric Suction (psf), Vol. Water Content (ft³/ft³)
Data Point: (0.01, 0.29987196) Data Point: (0.018329807, 0.29987196) Data Point: (0.033598183, 0.29987196) Data Point: (0.061584821, 0.29987196) Data Point: (0.11288379, 0.29987196) Data Point: (0.20691381, 0.29987196) Data Point: (0.37926902, 0.29987196) Data Point: (0.6951928, 0.29987196) Data Point: (1.274275, 0.29987196) Data Point: (2.3357215, 0.29987196) Data Point: (4.2813324, 0.29987196) Data Point: (7.8475997, 0.29987196) Data Point: (14.384499, 0.29987196) Data Point: (26.366509, 0.29987196) Data Point: (48.329302, 0.29987196) Data Point: (88.586679, 0.29667682) Data Point: (162.37767, 0.20150036) Data Point: (297.63514, 0.085811521) Data Point: (545.55948, 0.049379583) Data Point: (1,000, 0.039446735)
Estimation Properties Vol. WC Estimation Method: Grain Size Function Saturated Water Content: 0.3 ft³/ft³ Sample Material: Clay Liquid Limit: 0 % Diameter at 10% passing: 0.07000000000000001 Diameter at 60% passing: 0.2 Maximum: 1,000 Minimum: 0.01 Num. Points: 20
Matl. 2 Surficial Overburden Layer Model: Vol WC Data Point Function Function: Vol. Water Content vs. Pore‐Water Pressure
Mv: 2.5e‐006 /psf Saturated Water Content: 0.30132774 ft³/ft³ Residual Water Content: 0.030132774 ft³/ft³ Curve Fit to Data: 100 % Segment Curvature: 40 %
Porosity: 0.30132774 Data Points: Matric Suction (psf), Vol. Water Content (ft³/ft³)
Data Point: (0.01, 0.30110223)
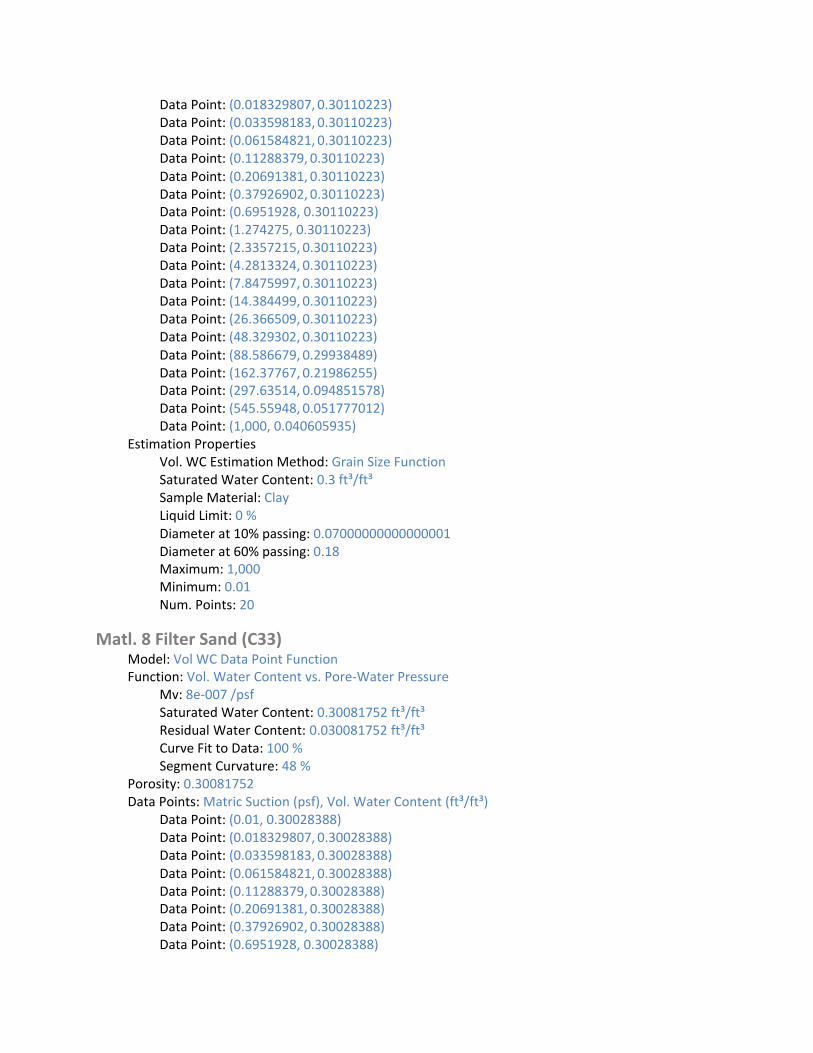
Data Point: (0.018329807, 0.30110223) Data Point: (0.033598183, 0.30110223) Data Point: (0.061584821, 0.30110223) Data Point: (0.11288379, 0.30110223) Data Point: (0.20691381, 0.30110223) Data Point: (0.37926902, 0.30110223) Data Point: (0.6951928, 0.30110223) Data Point: (1.274275, 0.30110223) Data Point: (2.3357215, 0.30110223) Data Point: (4.2813324, 0.30110223) Data Point: (7.8475997, 0.30110223) Data Point: (14.384499, 0.30110223) Data Point: (26.366509, 0.30110223) Data Point: (48.329302, 0.30110223) Data Point: (88.586679, 0.29938489) Data Point: (162.37767, 0.21986255) Data Point: (297.63514, 0.094851578) Data Point: (545.55948, 0.051777012) Data Point: (1,000, 0.040605935)
Estimation Properties Vol. WC Estimation Method: Grain Size Function Saturated Water Content: 0.3 ft³/ft³ Sample Material: Clay Liquid Limit: 0 % Diameter at 10% passing: 0.07000000000000001 Diameter at 60% passing: 0.18 Maximum: 1,000 Minimum: 0.01 Num. Points: 20
Matl. 8 Filter Sand (C33) Model: Vol WC Data Point Function Function: Vol. Water Content vs. Pore‐Water Pressure
Mv: 8e‐007 /psf Saturated Water Content: 0.30081752 ft³/ft³ Residual Water Content: 0.030081752 ft³/ft³ Curve Fit to Data: 100 % Segment Curvature: 48 %
Porosity: 0.30081752 Data Points: Matric Suction (psf), Vol. Water Content (ft³/ft³)
Data Point: (0.01, 0.30028388) Data Point: (0.018329807, 0.30028388) Data Point: (0.033598183, 0.30028388) Data Point: (0.061584821, 0.30028388) Data Point: (0.11288379, 0.30028388) Data Point: (0.20691381, 0.30028388) Data Point: (0.37926902, 0.30028388) Data Point: (0.6951928, 0.30028388)

Data Point: (1.274275, 0.30028388) Data Point: (2.3357215, 0.30028388) Data Point: (4.2813324, 0.30028388) Data Point: (7.8475997, 0.30028388) Data Point: (14.384499, 0.28112842) Data Point: (26.366509, 0.15065712) Data Point: (48.329302, 0.048430554) Data Point: (88.586679, 0.021674388) Data Point: (162.37767, 0.016081301) Data Point: (297.63514, 0.013674367) Data Point: (545.55948, 0.011770874) Data Point: (1,000, 0.010084825)
Estimation Properties Vol. WC Estimation Method: Grain Size Function Saturated Water Content: 0.3 ft³/ft³ Sample Material: Gravel Liquid Limit: 0 % Diameter at 10% passing: 0.38 Diameter at 60% passing: 1.6 Maximum: 1,000 Minimum: 0.01 Num. Points: 20
Mat. 6 Fine Drainage Gravel (No 89) Model: Vol WC Data Point Function Function: Vol. Water Content vs. Pore‐Water Pressure
Mv: 4e‐007 /psf Saturated Water Content: 0.21947752 ft³/ft³ Residual Water Content: 0.021947752 ft³/ft³ Curve Fit to Data: 100 % Segment Curvature: 48 %
Porosity: 0.21947752 Data Points: Matric Suction (psf), Vol. Water Content (ft³/ft³)
Data Point: (0.01, 0.21916427) Data Point: (0.018329807, 0.21916427) Data Point: (0.033598183, 0.21916427) Data Point: (0.061584821, 0.21916427) Data Point: (0.11288379, 0.21916427) Data Point: (0.20691381, 0.21916427) Data Point: (0.37926902, 0.21916427) Data Point: (0.6951928, 0.21916427) Data Point: (1.274275, 0.21916427) Data Point: (2.3357215, 0.21916427) Data Point: (4.2813324, 0.20182012) Data Point: (7.8475997, 0.090949254) Data Point: (14.384499, 0.021737158) Data Point: (26.366509, 0.0080845337) Data Point: (48.329302, 0.0057554944)
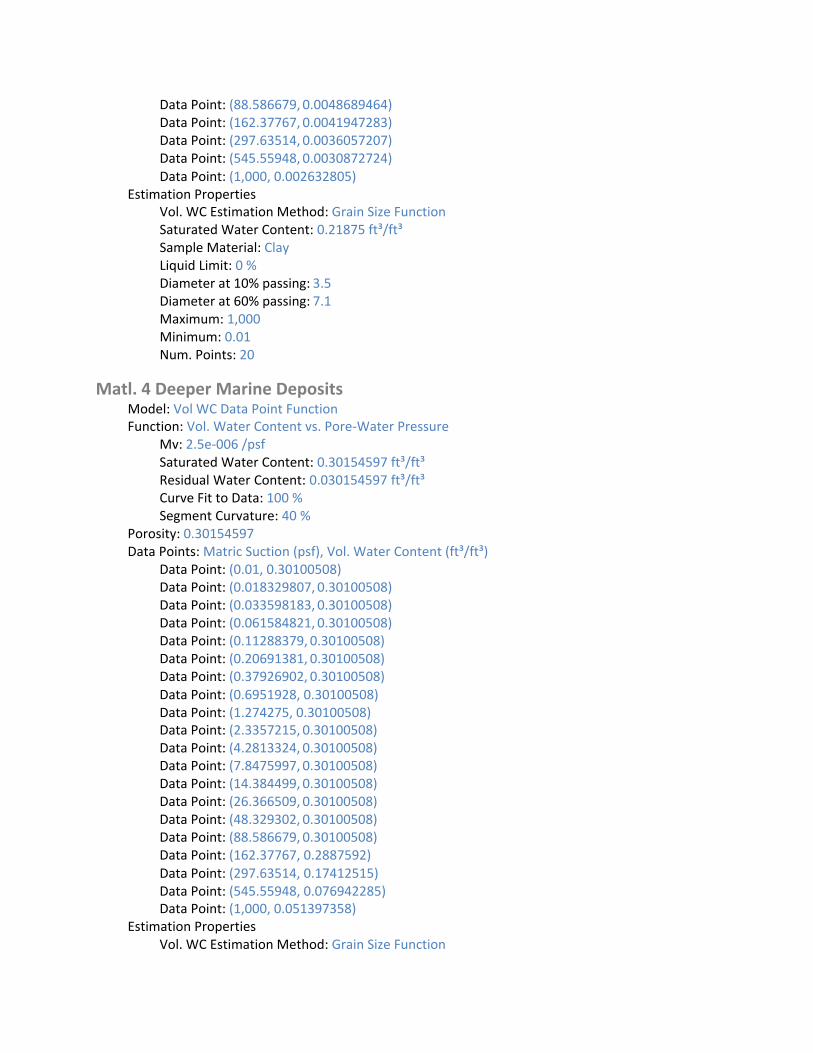
Data Point: (88.586679, 0.0048689464) Data Point: (162.37767, 0.0041947283) Data Point: (297.63514, 0.0036057207) Data Point: (545.55948, 0.0030872724) Data Point: (1,000, 0.002632805)
Estimation Properties Vol. WC Estimation Method: Grain Size Function Saturated Water Content: 0.21875 ft³/ft³ Sample Material: Clay Liquid Limit: 0 % Diameter at 10% passing: 3.5 Diameter at 60% passing: 7.1 Maximum: 1,000 Minimum: 0.01 Num. Points: 20
Matl. 4 Deeper Marine Deposits Model: Vol WC Data Point Function Function: Vol. Water Content vs. Pore‐Water Pressure
Mv: 2.5e‐006 /psf Saturated Water Content: 0.30154597 ft³/ft³ Residual Water Content: 0.030154597 ft³/ft³ Curve Fit to Data: 100 % Segment Curvature: 40 %
Porosity: 0.30154597 Data Points: Matric Suction (psf), Vol. Water Content (ft³/ft³)
Data Point: (0.01, 0.30100508) Data Point: (0.018329807, 0.30100508) Data Point: (0.033598183, 0.30100508) Data Point: (0.061584821, 0.30100508) Data Point: (0.11288379, 0.30100508) Data Point: (0.20691381, 0.30100508) Data Point: (0.37926902, 0.30100508) Data Point: (0.6951928, 0.30100508) Data Point: (1.274275, 0.30100508) Data Point: (2.3357215, 0.30100508) Data Point: (4.2813324, 0.30100508) Data Point: (7.8475997, 0.30100508) Data Point: (14.384499, 0.30100508) Data Point: (26.366509, 0.30100508) Data Point: (48.329302, 0.30100508) Data Point: (88.586679, 0.30100508) Data Point: (162.37767, 0.2887592) Data Point: (297.63514, 0.17412515) Data Point: (545.55948, 0.076942285) Data Point: (1,000, 0.051397358)
Estimation Properties Vol. WC Estimation Method: Grain Size Function

Saturated Water Content: 0.3 ft³/ft³ Sample Material: Clay Liquid Limit: 0 % Diameter at 10% passing: 0.06 Diameter at 60% passing: 0.11 Maximum: 1,000 Minimum: 0.01 Num. Points: 20
Matl. 5 Soil Cement Armoring Model: Vol WC Data Point Function Function: Vol. Water Content vs. Pore‐Water Pressure
Mv: 2.5e‐006 /psf Saturated Water Content: 0.30020276 ft³/ft³ Residual Water Content: 0.030020276 ft³/ft³ Curve Fit to Data: 100 % Segment Curvature: 40 %
Porosity: 0.30020276 Data Points: Matric Suction (psf), Vol. Water Content (ft³/ft³)
Data Point: (0.01, 0.29987196) Data Point: (0.018329807, 0.29987196) Data Point: (0.033598183, 0.29987196) Data Point: (0.061584821, 0.29987196) Data Point: (0.11288379, 0.29987196) Data Point: (0.20691381, 0.29987196) Data Point: (0.37926902, 0.29987196) Data Point: (0.6951928, 0.29987196) Data Point: (1.274275, 0.29987196) Data Point: (2.3357215, 0.29987196) Data Point: (4.2813324, 0.29987196) Data Point: (7.8475997, 0.29987196) Data Point: (14.384499, 0.29987196) Data Point: (26.366509, 0.29987196) Data Point: (48.329302, 0.29987196) Data Point: (88.586679, 0.29667682) Data Point: (162.37767, 0.20150036) Data Point: (297.63514, 0.085811521) Data Point: (545.55948, 0.049379583) Data Point: (1,000, 0.039446735)
Estimation Properties Vol. WC Estimation Method: Grain Size Function Saturated Water Content: 0.3 ft³/ft³ Sample Material: Clay Liquid Limit: 0 % Diameter at 10% passing: 0.07000000000000001 Diameter at 60% passing: 0.2 Maximum: 1,000 Minimum: 0.01

5
10
15
20
25
30
Num. Points: 20
Points X (ft) Y (ft)
Point 1 ‐56.5 18
Point 2 ‐14.5 18
Point 3 ‐14.5 28
Point 4 ‐11.5 28
Point ‐11.5 15
Point 6 ‐7 34.5
Point 7 ‐7 33.4
Point 8 6.8 33.4
Point 9 14 31
Point 13.7 30.1
Point 11 51.6 17.5
Point 12 54.2 15
Point 13 55.0033 16.4828
Point 14 54.9 16.4
Point 54.8636 16.2065
Point 16 55.097 16.0075
Point 17 55.3031 16.0832
Point 18 55.3561 16.2916
Point 19 55.3 16.4
Point 55.1797 16.4906
Point 21 62.3 15
Point 22 59.3 16
Point 23 57.8 16.5
Point 24 61 16.5
Point 7 34.5
Point 26 62.3 13.5
Point 27 70.3 13.5
Point 28 70.3 11.5
Point 29 72.3 11.5
Point 72.3 13.5
Point 31 72.3 15
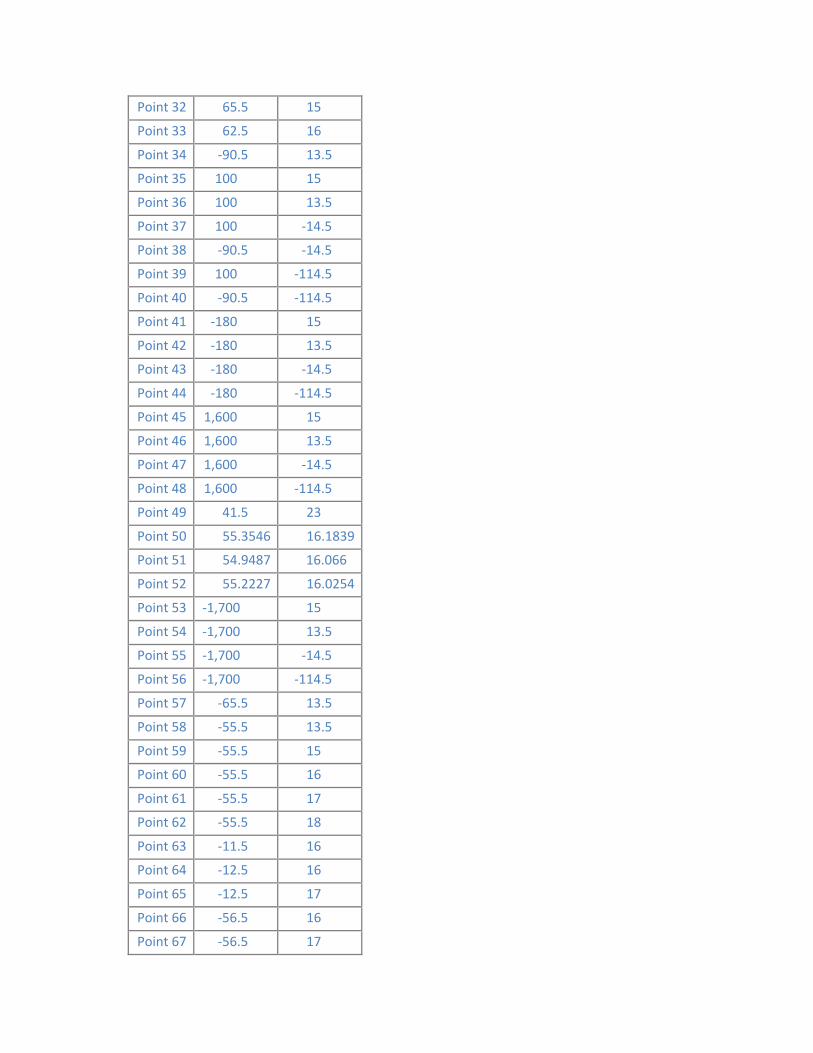
32
33
34
35
36
37
38
39
40
41
42
43
44
45
46
47
48
49
50
51
52
53
54
55
56
57
58
59
60
61
62
63
64
65
66
67
Point 65.5 15
Point 62.5 16
Point ‐90.5 13.5
Point 100 15
Point 100 13.5
Point 100 ‐14.5
Point ‐90.5 ‐14.5
Point 100 ‐114.5
Point ‐90.5 ‐114.5
Point ‐180 15
Point ‐180 13.5
Point ‐180 ‐14.5
Point ‐180 ‐114.5
Point 1,600 15
Point 1,600 13.5
Point 1,600 ‐14.5
Point 1,600 ‐114.5
Point 41.5 23
Point 55.3546 16.1839
Point 54.9487 16.066
Point 55.2227 16.0254
Point ‐1,700 15
Point ‐1,700 13.5
Point ‐1,700 ‐14.5
Point ‐1,700 ‐114.5
Point ‐65.5 13.5
Point ‐55.5 13.5
Point ‐55.5 15
Point ‐55.5 16
Point ‐55.5 17
Point ‐55.5 18
Point ‐11.5 16
Point ‐12.5 16
Point ‐12.5 17
Point ‐56.5 16
Point ‐56.5 17
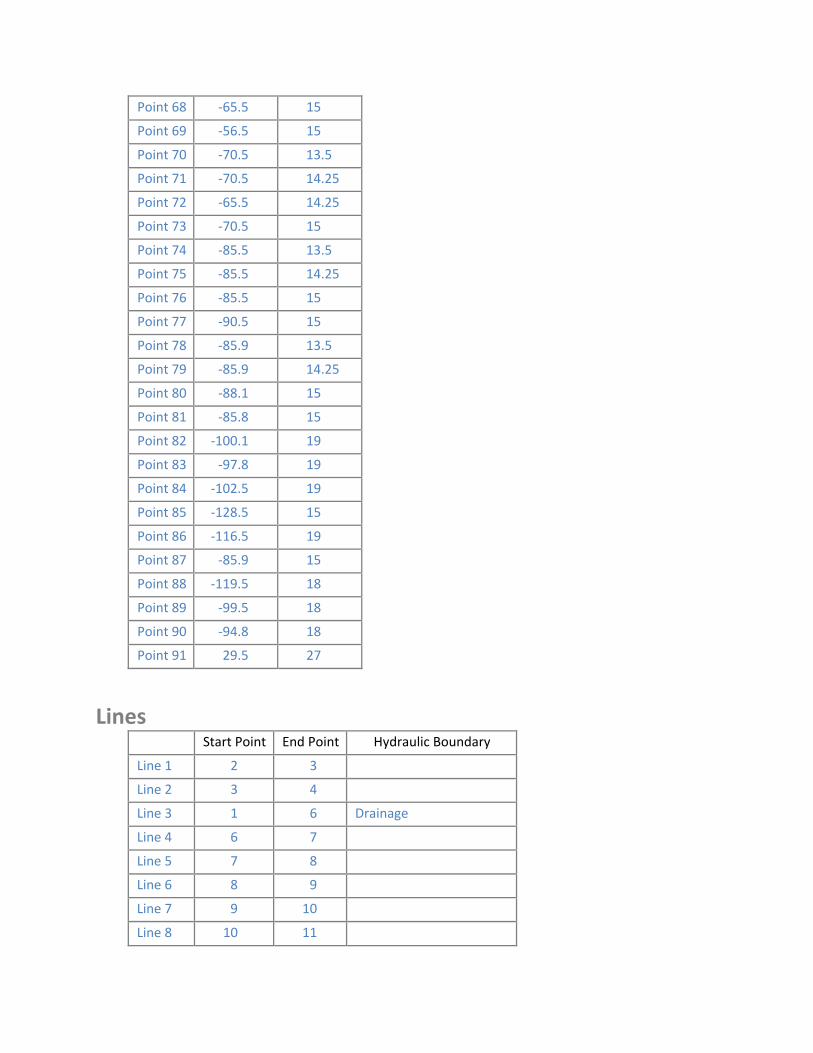
Point 68 ‐65.5 15
Point 69 ‐56.5 15
Point 70 ‐70.5 13.5
Point 71 ‐70.5 14.25
Point 72 ‐65.5 14.25
Point 73 ‐70.5 15
Point 74 ‐85.5 13.5
Point 75 ‐85.5 14.25
Point 76 ‐85.5 15
Point 77 ‐90.5 15
Point 78 ‐85.9 13.5
Point 79 ‐85.9 14.25
Point 80 ‐88.1 15
Point 81 ‐85.8 15
Point 82 ‐100.1 19
Point 83 ‐97.8 19
Point 84 ‐102.5 19
Point 85 ‐128.5 15
Point 86 ‐116.5 19
Point 87 ‐85.9 15
Point 88 ‐119.5 18
Point 89 ‐99.5 18
Point 90 ‐94.8 18
Point 91 29.5 27
Lines Start Point End Point Hydraulic Boundary
Line 1 2 3
Line 2 3 4
Line 3 1 6 Drainage
Line 4 6 7
Line 5 7 8
Line 6 8 9
Line 7 9 10
Line 8 10 11
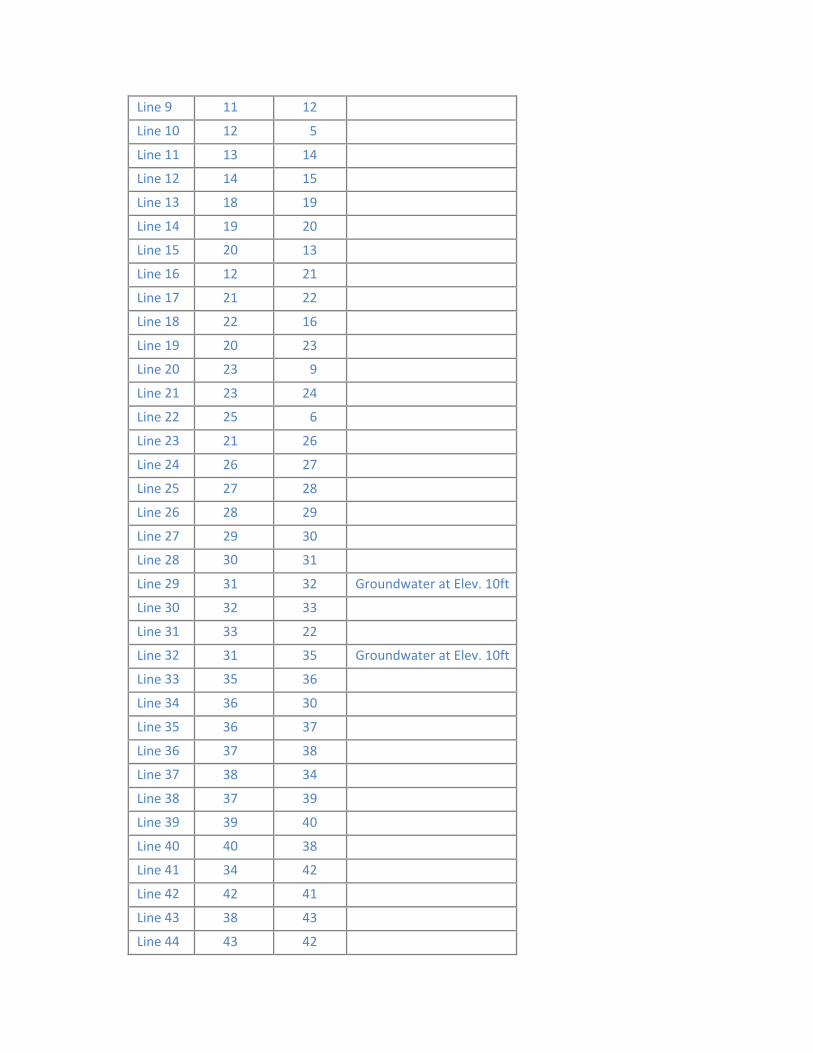
9
10
11
12
13
14
15
16
17
18
19
20
21
22
23
24
25
26
27
28
29
30
31
32
33
34
35
36
37
38
39
40
41
42
43
44
20
25
30
35
40
Line 11 12
Line 12 5
Line 13 14
Line 14 15
Line 18 19
Line 19 20
Line 13
Line 12 21
Line 21 22
Line 22 16
Line 20 23
Line 23 9
Line 23 24
Line 6
Line 21 26
Line 26 27
Line 27 28
Line 28 29
Line 29 30
Line 31
Line 31 32 Groundwater at Elev. 10ft
Line 32 33
Line 33 22
Line 31 35 Groundwater at Elev. 10ft
Line 36
Line 36 30
Line 36 37
Line 37 38
Line 38 34
Line 37 39
Line 39 40
Line 38
Line 34 42
Line 42 41
Line 38 43
Line 43 42
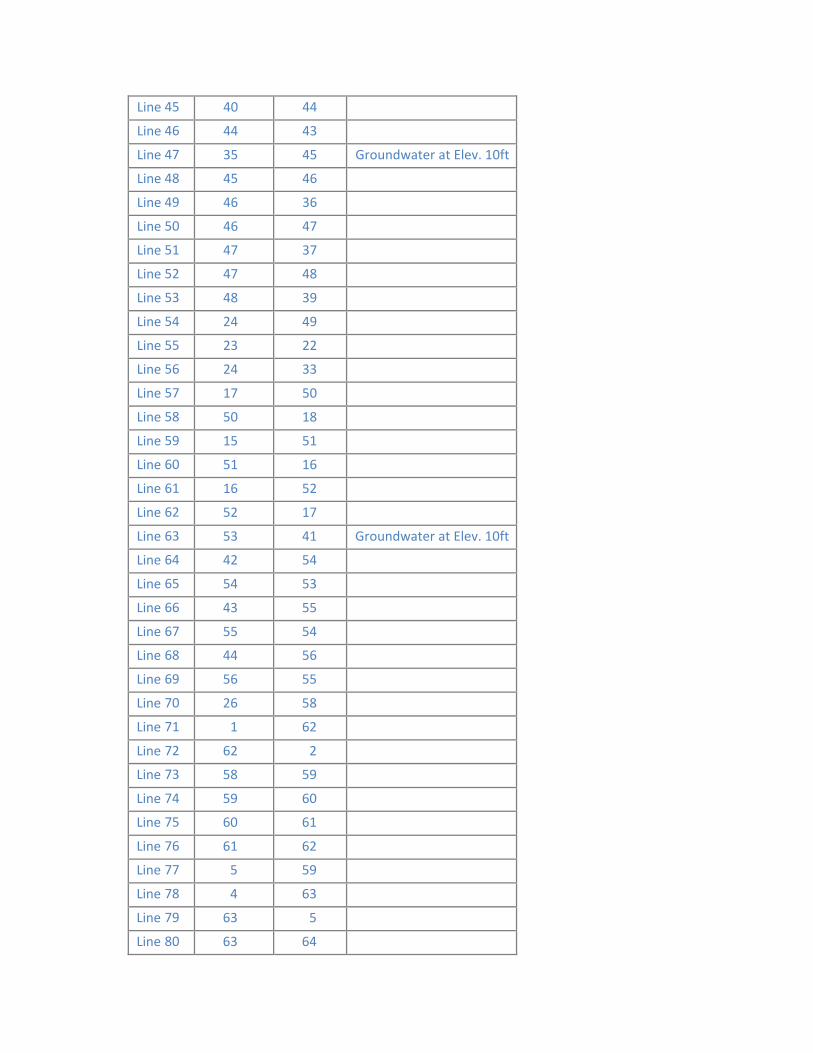
45
46
47
48
49
50
51
52
53
54
55
56
57
58
59
60
61
62
63
64
65
66
67
68
69
70
71
72
73
74
75
76
77
78
79
80
Line 40 44
Line 44 43
Line 35 45 Groundwater at Elev. 10ft
Line 45 46
Line 46 36
Line 46 47
Line 47 37
Line 47 48
Line 48 39
Line 24 49
Line 23 22
Line 24 33
Line 17 50
Line 50 18
Line 15 51
Line 51 16
Line 16 52
Line 52 17
Line 53 41 Groundwater at Elev. 10ft
Line 42 54
Line 54 53
Line 43 55
Line 55 54
Line 44 56
Line 56 55
Line 26 58
Line 1 62
Line 62 2
Line 58 59
Line 59 60
Line 60 61
Line 61 62
Line 5 59
Line 4 63
Line 63 5
Line 63 64
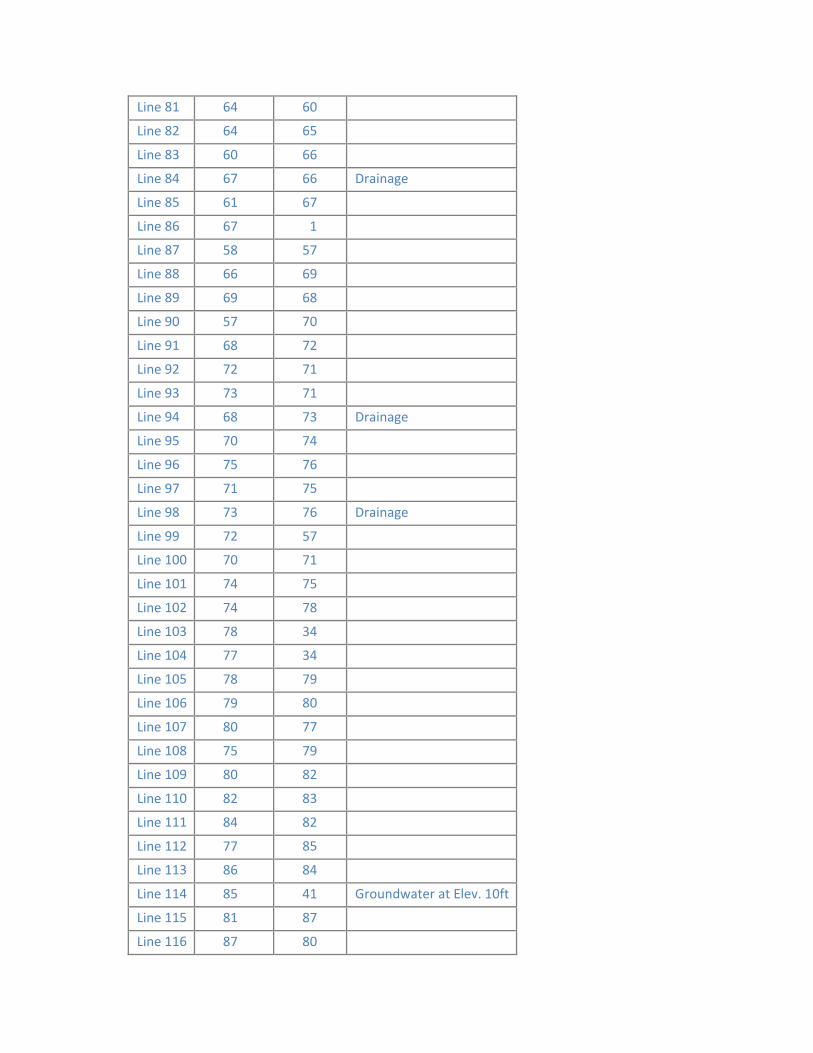
81
82
83
84
85
86
87
88
89
90
91
92
93
94
95
96
97
98
99
100
101
102
103
104
105
106
107
108
109
110
111
112
113
114
115
116
65
70
75
80
85
Line 64 60
Line 64
Line 60 66
Line 67 66 Drainage
Line 61 67
Line 67 1
Line 58 57
Line 66 69
Line 69 68
Line 57
Line 68 72
Line 72 71
Line 73 71
Line 68 73 Drainage
Line 70 74
Line 75 76
Line 71
Line 73 76 Drainage
Line 72 57
Line 70 71
Line 74 75
Line 74 78
Line 78 34
Line 77 34
Line 78 79
Line 79
Line 80 77
Line 75 79
Line 80 82
Line 82 83
Line 84 82
Line 77
Line 86 84
Line 85 41 Groundwater at Elev. 10ft
Line 81 87
Line 87 80
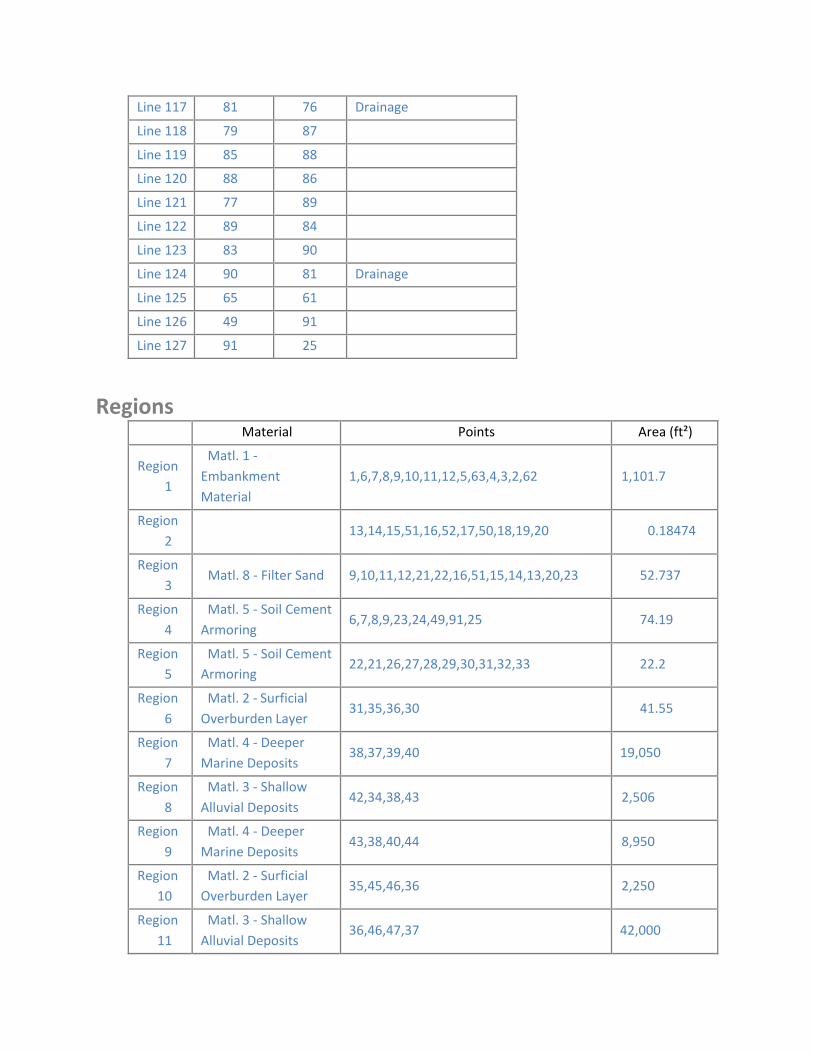
Line 117 81 76 Drainage
Line 118 79 87
Line 119 85 88
Line 120 88 86
Line 121 77 89
Line 122 89 84
Line 123 83 90
Line 124 90 81 Drainage
Line 125 65 61
Line 126 49 91
Line 127 91 25
Regions Material Points Area (ft²)
Region 1
Matl. 1 ‐
Embankment
Material
1,6,7,8,9,10,11,12,5,63,4,3,2,62 1,101.7
Region
2 13,14,15,51,16,52,17,50,18,19,20 0.18474
Region
3 Matl. 8 ‐ Filter Sand 9,10,11,12,21,22,16,51,15,14,13,20,23 52.737
Region
4
Matl. 5 ‐ Soil Cement
Armoring 6,7,8,9,23,24,49,91,25 74.19
Region
5 Matl. 5 ‐ Soil Cement Armoring
22,21,26,27,28,29,30,31,32,33 22.2
Region
6
Matl. 2 ‐ Surficial
Overburden Layer 31,35,36,30 41.55
Region
7
Matl. 4 ‐ Deeper
Marine Deposits 38,37,39,40 19,050
Region
8
Matl. 3 ‐ Shallow
Alluvial Deposits 42,34,38,43 2,506
Region
9
Matl. 4 ‐ Deeper
Marine Deposits 43,38,40,44 8,950
Region
10
Matl. 2 ‐ Surficial Overburden Layer
35,45,46,36 2,250
Region
11
Matl. 3 ‐ Shallow
Alluvial Deposits 36,46,47,37 42,000

12
13
14
15
16
17
18
19
20
21
22
23
24
25
26
27
28
29
30
Region Matl. 4 ‐ Deeper Marine Deposits
37,47,48,39 1.5e+005
Region Matl. 8 ‐ Filter Sand 20,23,22,16,52,17,50,18,19 1.5978
Region Matl. 5 ‐ Soil Cement
Armoring 23,24,33,22 1.6
Region Matl. 2 ‐ Surficial
Overburden Layer 53,41,42,54 2,280
Region Matl. 3 ‐ Shallow
Alluvial Deposits 42,43,55,54 42,560
Region Matl. 4 ‐ Deeper Marine Deposits
55,43,44,56 1.52e+005
Region Matl. 3 ‐ Shallow Alluvial Deposits
34,38,37,36,30,29,28,27,26,58,57,70,74,78 5,330
Region Matl. 2 ‐ Surficial
Overburden Layer 59,58,26,21,12,5 176.7
Region Matl. 8 ‐ Filter Sand 60,59,5,63,64 44
Region Matl. 6 ‐ Fine
Drainage Gravel 61,60,64,65 43
Region Matl. 8 ‐ Filter Sand 62,61,65,64,63,4,3,2 75
Region Matl. 6 ‐ Fine Drainage Gravel
67,66,60,61 1
Region Matl. 9 Concrete
Outfall Works 1,62,61,67 1
Region Matl. 9 Concrete
Outfall Works 68,72,57,58,59,60,66,69 16
Region Matl. 6 ‐ Fine
Drainage Gravel 73,71,72,68 3.75
Region Matl. 6 ‐ Fine Drainage Gravel
76,75,71,73 11.25
Region Matl. 8 ‐ Filter Sand 71,72,57,70 3.75
Region Matl. 8 ‐ Filter Sand 71,70,74,75 11.25
Region Matl. 8 ‐ Filter Sand 77,34,78,79,80 6.075
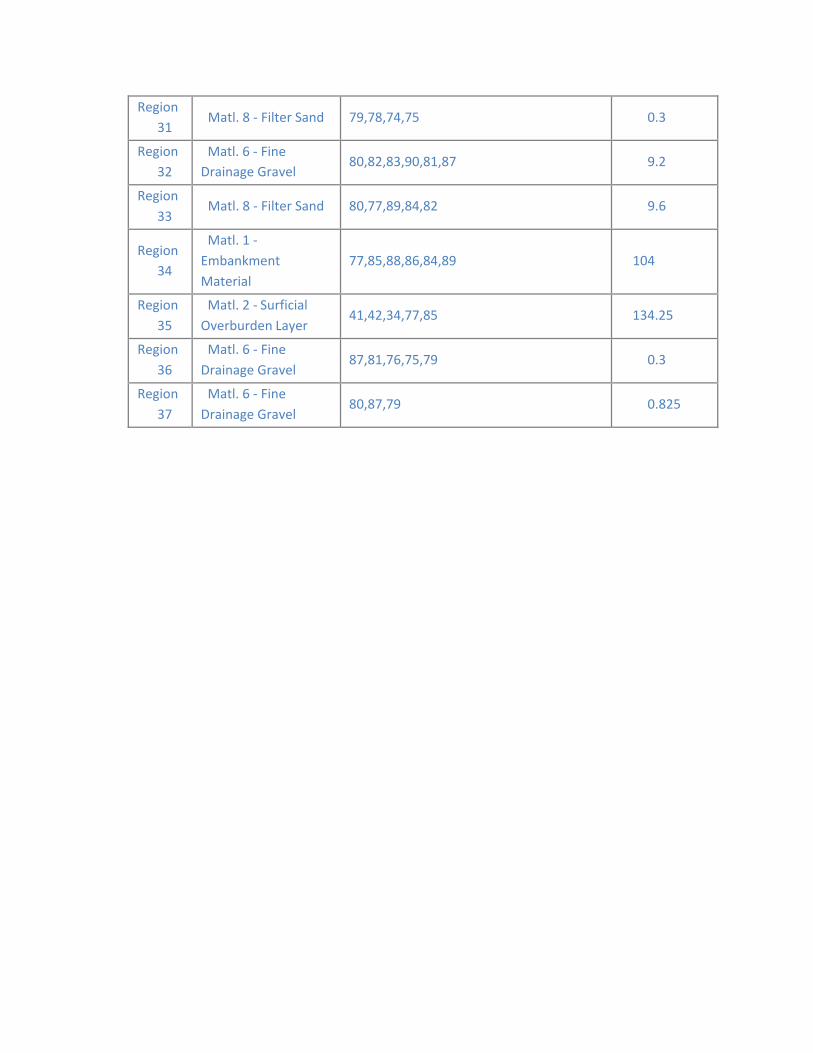
31
32
33
34
35
36
37
Region Matl. 8 ‐ Filter Sand 79,78,74,75 0.3
Region Matl. 6 ‐ Fine Drainage Gravel
80,82,83,90,81,87 9.2
Region Matl. 8 ‐ Filter Sand 80,77,89,84,82 9.6
Region Matl. 1 ‐
Embankment
Material
77,85,88,86,84,89 104
Region Matl. 2 ‐ Surficial
Overburden Layer 41,42,34,77,85 134.25
Region Matl. 6 ‐ Fine
Drainage Gravel 87,81,76,75,79 0.3
Region Matl. 6 ‐ Fine
Drainage Gravel 80,87,79 0.825

Steady‐State Seepage NP (LT SSS) Report generated using GeoStudio 2012. Copyright © 1991‐2013 GEO‐SLOPE International Ltd.
File Information Title: LOWP PIR Analysis Section H Created By: Viessman, Michael W CIV USARMY CESAJ (US) Last Edited By: Viessman, Michael W CIV USARMY CESAJ (US) Revision Number: 552 File Version: 8.2 Tool Version: 8.12.3.7901 Date: 8/26/2018 Time: 9:33:16 PM File Name: Section H EOC USP‐DSP w toe drain.gsz Directory: C:\Users\k3engmwv\Documents\LOWP\FY17‐18 PIR Work\SEEP and SLOPEW Files\ Last Solved Date: 8/26/2018 Last Solved Time: 8:34:04 PM
Project Settings Length(L) Units: feet Time(t) Units: Seconds Force(F) Units: lbf Pressure(p) Units: psf Mass(M) Units: lbs Mass Flux Units: lbs/sec Unit Weight of Water: 62.4 pcf View: 2D Element Thickness: 1
Analysis Settings
Steady‐State Seepage NP (LT SSS) Description: U/S NP pool, toe drain, PR wse at 18ft Kind: SEEP/W Method: Steady‐State Settings
Include Air Flow: No Control
Apply Runoff: Yes Convergence
Maximum Number of Iterations: 1,000 Minimum Pressure Head Difference: 0.005 Significant Digits: 2

Max # of Reviews: 10 Hydraulic Under‐Relaxation Criteria
Under‐Relaxation Initial Rate: 1 Under‐Relaxation Min. Rate: 0.1 Under‐Relaxation Reduction Rate: 0.65 Under‐Relaxation Iterations: 10
Equation Solver: Parallel Direct Time
Starting Time: 0 sec Duration: 0 sec Ending Time: 0 sec
Materials
Matl. 1 ‐ Embankment Material Model: Saturated / Unsaturated Hydraulic
K‐Function: Matl. 1 Embankment Material Ky'/Kx' Ratio: 0.25 Rotation: 0 ° Vol. WC. Function: Matl. 1 Embankment Fill from Borrow Areas
Matl. 2 ‐ Surficial Overburden Layer Model: Saturated / Unsaturated Hydraulic
K‐Function: Matl. 2 Surficial Overburden Layer Ky'/Kx' Ratio: 0.1 Rotation: 0 ° Vol. WC. Function: Matl. 2 Surficial Overburden Layer
Matl. 3 ‐ Shallow Alluvial Deposits Model: Saturated / Unsaturated Hydraulic
K‐Function: Matl. 3 Shallow Alluvial Deposits Ky'/Kx' Ratio: 0.1 Rotation: 0 ° Vol. WC. Function: Matl. 3 Shallow Alluvial Deposits
Matl. 4 ‐ Deeper Marine Deposits Model: Saturated / Unsaturated Hydraulic
K‐Function: Matl. 4 Deeper Marine Deposits Ky'/Kx' Ratio: 0.1 Rotation: 0 ° Vol. WC. Function: Matl. 4 Deeper Marine Deposits

Matl. 5 ‐ Soil Cement Armoring Model: Saturated / Unsaturated Hydraulic
K‐Function: Matl. 5 Soil Cement Armoring Ky'/Kx' Ratio: 1 Rotation: 0 ° Vol. WC. Function: Matl. 5 Soil Cement Armoring
Matl. 6 ‐ Fine Drainage Gravel Model: Saturated / Unsaturated Hydraulic
K‐Function: Matl. 6 Fine Drainage Gravel Ky'/Kx' Ratio: 1 Rotation: 0 ° Vol. WC. Function: Mat. 6 Fine Drainage Gravel (No 89)
Matl. 8 ‐ Filter Sand Model: Saturated / Unsaturated Hydraulic
K‐Function: Matl. 8 Filter Sand Ky'/Kx' Ratio: 1 Rotation: 0 ° Vol. WC. Function: Matl. 8 Filter Sand (C33)
Matl. 9 Concrete Outfall Works Model: Saturated Only Hydraulic
K‐Sat: 3.28e‐010 ft/sec Ky'/Kx' Ratio: 1 Rotation: 0 ° Volumetric Water Content: 0.3 ft³/ft³ Mv: 1e‐008 /psf
Boundary Conditions
K‐05 WAF Normal Pool at Elev. 23ft Type: Head (H) 23 Review: No
PR at Elev. 18ft Type: Head (H) 18 Review: No
Drainage Type: Total Flux (Q) 0 Review: Yes
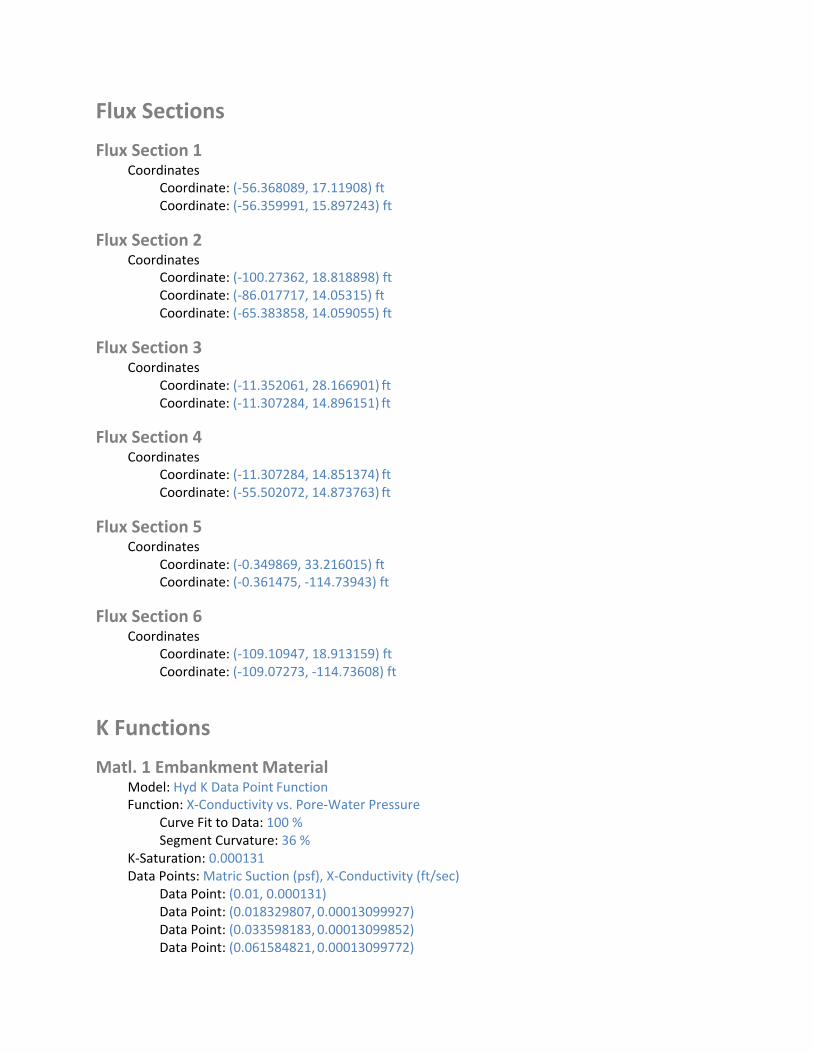
Flux Sections
Flux Section 1 Coordinates
Coordinate: (‐56.368089, 17.11908) ft Coordinate: (‐56.359991, 15.897243) ft
Flux Section 2 Coordinates
Coordinate: (‐100.27362, 18.818898) ft Coordinate: (‐86.017717, 14.05315) ft Coordinate: (‐65.383858, 14.059055) ft
Flux Section 3 Coordinates
Coordinate: (‐11.352061, 28.166901) ft Coordinate: (‐11.307284, 14.896151) ft
Flux Section 4 Coordinates
Coordinate: (‐11.307284, 14.851374) ft Coordinate: (‐55.502072, 14.873763) ft
Flux Section 5 Coordinates
Coordinate: (‐0.349869, 33.216015) ft Coordinate: (‐0.361475, ‐114.73943) ft
Flux Section 6 Coordinates
Coordinate: (‐109.10947, 18.913159) ft Coordinate: (‐109.07273, ‐114.73608) ft
K Functions
Matl. 1 Embankment Material Model: Hyd K Data Point Function Function: X‐Conductivity vs. Pore‐Water Pressure
Curve Fit to Data: 100 % Segment Curvature: 36 %
K‐Saturation: 0.000131 Data Points: Matric Suction (psf), X‐Conductivity (ft/sec)
Data Point: (0.01, 0.000131) Data Point: (0.018329807, 0.00013099927) Data Point: (0.033598183, 0.00013099852) Data Point: (0.061584821, 0.00013099772)
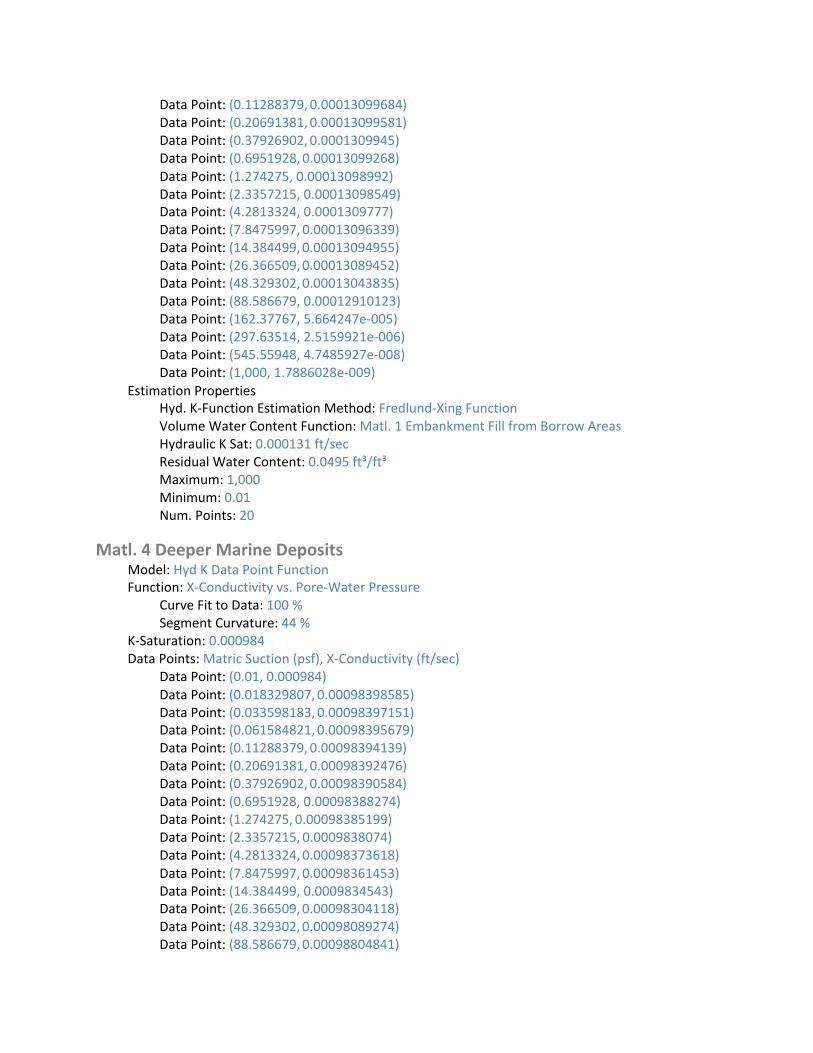
Data Point: (0.11288379, 0.00013099684) Data Point: (0.20691381, 0.00013099581) Data Point: (0.37926902,0.0001309945) Data Point: (0.6951928, 0.00013099268) Data Point: (1.274275, 0.00013098992) Data Point: (2.3357215, 0.00013098549) Data Point: (4.2813324, 0.0001309777) Data Point: (7.8475997, 0.00013096339) Data Point: (14.384499,0.00013094955) Data Point: (26.366509,0.00013089452) Data Point: (48.329302,0.00013043835) Data Point: (88.586679, 0.00012910123) Data Point: (162.37767, 5.664247e‐005) Data Point: (297.63514, 2.5159921e‐006) Data Point: (545.55948, 4.7485927e‐008) Data Point: (1,000, 1.7886028e‐009)
Estimation Properties Hyd. K‐Function Estimation Method: Fredlund‐Xing Function Volume Water Content Function: Matl. 1 Embankment Fill from Borrow Areas Hydraulic K Sat: 0.000131 ft/sec Residual Water Content: 0.0495 ft³/ft³ Maximum: 1,000 Minimum: 0.01 Num. Points: 20
Matl. 4 Deeper Marine Deposits Model: Hyd K Data Point Function Function: X‐Conductivity vs. Pore‐Water Pressure
Curve Fit to Data: 100 % Segment Curvature: 44 %
K‐Saturation: 0.000984 Data Points: Matric Suction (psf), X‐Conductivity (ft/sec)
Data Point: (0.01, 0.000984) Data Point: (0.018329807, 0.00098398585) Data Point: (0.033598183, 0.00098397151) Data Point: (0.061584821, 0.00098395679) Data Point: (0.11288379, 0.00098394139) Data Point: (0.20691381, 0.00098392476) Data Point: (0.37926902, 0.00098390584) Data Point: (0.6951928, 0.00098388274) Data Point: (1.274275, 0.00098385199) Data Point: (2.3357215, 0.0009838074) Data Point: (4.2813324,0.00098373618) Data Point: (7.8475997,0.00098361453) Data Point: (14.384499, 0.0009834543) Data Point: (26.366509,0.00098304118) Data Point: (48.329302,0.00098089274) Data Point: (88.586679,0.00098804841)
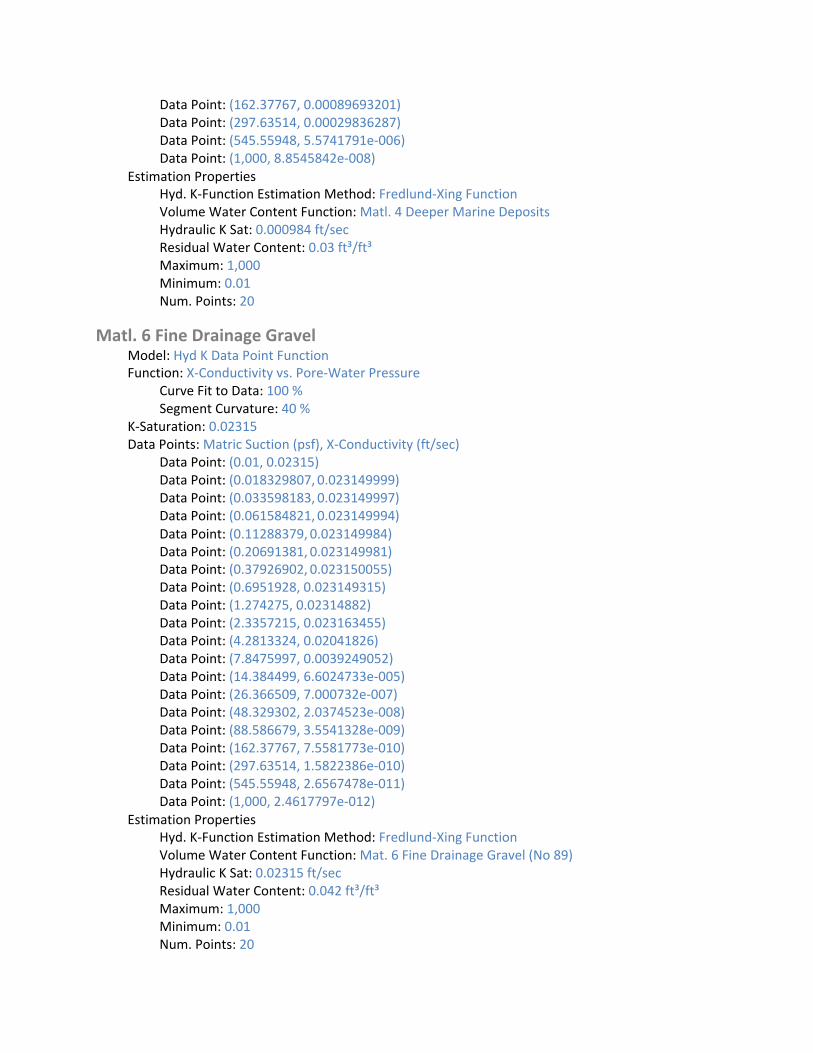
Data Point: (162.37767, 0.00089693201) Data Point: (297.63514, 0.00029836287) Data Point: (545.55948, 5.5741791e‐006) Data Point: (1,000, 8.8545842e‐008)
Estimation Properties Hyd. K‐Function Estimation Method: Fredlund‐Xing Function Volume Water Content Function: Matl. 4 Deeper Marine Deposits Hydraulic K Sat: 0.000984 ft/sec Residual Water Content: 0.03 ft³/ft³ Maximum: 1,000 Minimum: 0.01 Num. Points: 20
Matl. 6 Fine Drainage Gravel Model: Hyd K Data Point Function Function: X‐Conductivity vs. Pore‐Water Pressure
Curve Fit to Data: 100 % Segment Curvature: 40 %
K‐Saturation: 0.02315 Data Points: Matric Suction (psf), X‐Conductivity (ft/sec)
Data Point: (0.01, 0.02315) Data Point: (0.018329807, 0.023149999) Data Point: (0.033598183, 0.023149997) Data Point: (0.061584821, 0.023149994) Data Point: (0.11288379, 0.023149984) Data Point: (0.20691381, 0.023149981) Data Point: (0.37926902, 0.023150055) Data Point: (0.6951928, 0.023149315) Data Point: (1.274275, 0.02314882) Data Point: (2.3357215, 0.023163455) Data Point: (4.2813324, 0.02041826) Data Point: (7.8475997, 0.0039249052) Data Point: (14.384499, 6.6024733e‐005) Data Point: (26.366509, 7.000732e‐007) Data Point: (48.329302, 2.0374523e‐008) Data Point: (88.586679, 3.5541328e‐009) Data Point: (162.37767, 7.5581773e‐010) Data Point: (297.63514, 1.5822386e‐010) Data Point: (545.55948, 2.6567478e‐011) Data Point: (1,000, 2.4617797e‐012)
Estimation Properties Hyd. K‐Function Estimation Method: Fredlund‐Xing Function Volume Water Content Function: Mat. 6 Fine Drainage Gravel (No 89) Hydraulic K Sat: 0.02315 ft/sec Residual Water Content: 0.042 ft³/ft³ Maximum: 1,000 Minimum: 0.01 Num. Points: 20

Matl. 2 Surficial Overburden Layer Model: Hyd K Data Point Function Function: X‐Conductivity vs. Pore‐Water Pressure
Curve Fit to Data: 100 % Segment Curvature: 36 %
K‐Saturation: 0.00026 Data Points: Matric Suction (psf), X‐Conductivity (ft/sec)
Data Point: (0.01, 0.00026) Data Point: (0.018329807, 0.00025999835) Data Point: (0.033598183, 0.00025999664) Data Point: (0.061584821, 0.00025999485) Data Point: (0.11288379, 0.00025999288) Data Point: (0.20691381, 0.00025999062) Data Point: (0.37926902, 0.00025998779) Data Point: (0.6951928, 0.00025998393) Data Point: (1.274275, 0.00025997819) Data Point: (2.3357215,0.00025996907) Data Point: (4.2813324,0.00025995329) Data Point: (7.8475997,0.00025992467) Data Point: (14.384499,0.00025989276) Data Point: (26.366509,0.00025978642) Data Point: (48.329302,0.00025903344) Data Point: (88.586679, 0.0002586222) Data Point: (162.37767, 0.00013432217) Data Point: (297.63514, 8.1547435e‐006) Data Point: (545.55948, 1.3663567e‐007) Data Point: (1,000, 4.5608744e‐009)
Estimation Properties Hyd. K‐Function Estimation Method: Fredlund‐Xing Function Volume Water Content Function: Matl. 2 Surficial Overburden Layer Hydraulic K Sat: 0.00026 ft/sec Residual Water Content: 0.0495 ft³/ft³ Maximum: 1,000 Minimum: 0.01 Num. Points: 20
Matl. 3 Shallow Alluvial Deposits Model: Hyd K Data Point Function Function: X‐Conductivity vs. Pore‐Water Pressure
Curve Fit to Data: 100 % Segment Curvature: 36 %
K‐Saturation: 0.00174 Data Points: Matric Suction (psf), X‐Conductivity (ft/sec)
Data Point: (0.01, 0.00174) Data Point: (0.018329807, 0.0017399903) Data Point: (0.033598183, 0.0017399803) Data Point: (0.061584821, 0.0017399698)
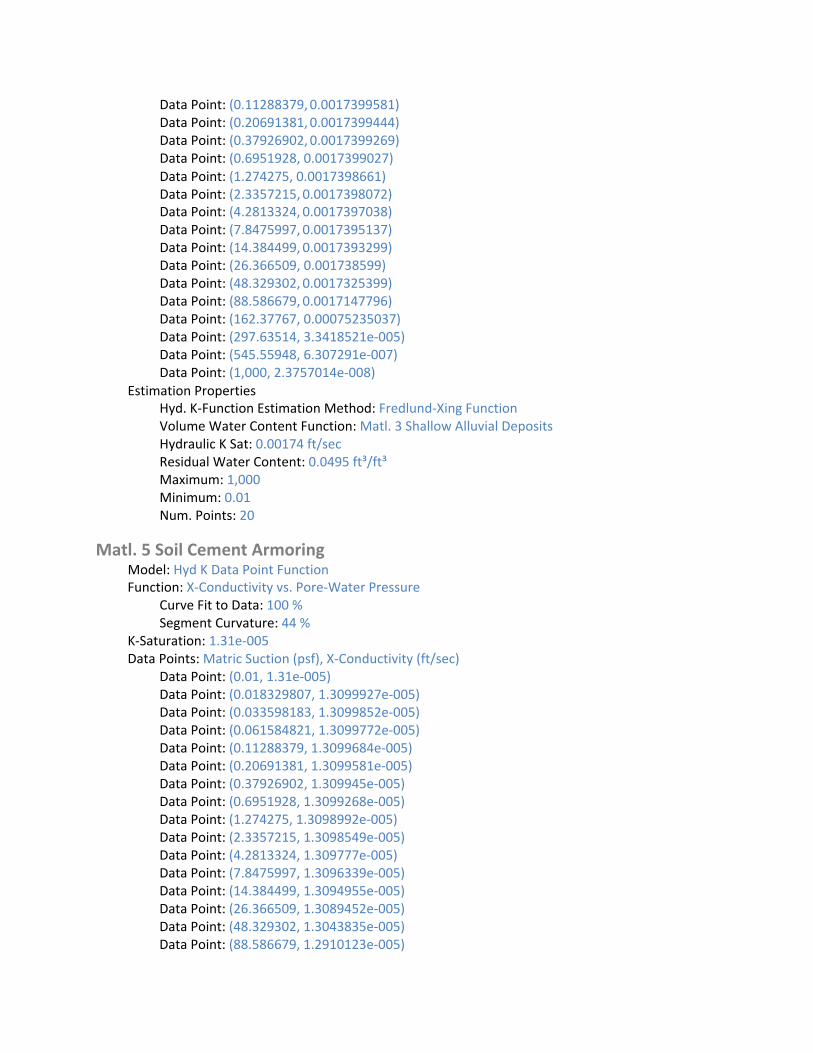
Data Point: (0.11288379,0.0017399581) Data Point: (0.20691381,0.0017399444) Data Point: (0.37926902,0.0017399269) Data Point: (0.6951928, 0.0017399027) Data Point: (1.274275, 0.0017398661) Data Point: (2.3357215, 0.0017398072) Data Point: (4.2813324, 0.0017397038) Data Point: (7.8475997, 0.0017395137) Data Point: (14.384499, 0.0017393299) Data Point: (26.366509, 0.001738599) Data Point: (48.329302, 0.0017325399) Data Point: (88.586679, 0.0017147796) Data Point: (162.37767, 0.00075235037) Data Point: (297.63514, 3.3418521e‐005) Data Point: (545.55948, 6.307291e‐007) Data Point: (1,000, 2.3757014e‐008)
Estimation Properties Hyd. K‐Function Estimation Method: Fredlund‐Xing Function Volume Water Content Function: Matl. 3 Shallow Alluvial Deposits Hydraulic K Sat: 0.00174 ft/sec Residual Water Content: 0.0495 ft³/ft³ Maximum: 1,000 Minimum: 0.01 Num. Points: 20
Matl. 5 Soil Cement Armoring Model: Hyd K Data Point Function Function: X‐Conductivity vs. Pore‐Water Pressure
Curve Fit to Data: 100 % Segment Curvature: 44 %
K‐Saturation: 1.31e‐005 Data Points: Matric Suction (psf), X‐Conductivity (ft/sec)
Data Point: (0.01, 1.31e‐005) Data Point: (0.018329807, 1.3099927e‐005) Data Point: (0.033598183, 1.3099852e‐005) Data Point: (0.061584821, 1.3099772e‐005) Data Point: (0.11288379, 1.3099684e‐005) Data Point: (0.20691381, 1.3099581e‐005) Data Point: (0.37926902, 1.309945e‐005) Data Point: (0.6951928, 1.3099268e‐005) Data Point: (1.274275, 1.3098992e‐005) Data Point: (2.3357215, 1.3098549e‐005) Data Point: (4.2813324, 1.309777e‐005) Data Point: (7.8475997, 1.3096339e‐005) Data Point: (14.384499, 1.3094955e‐005) Data Point: (26.366509, 1.3089452e‐005) Data Point: (48.329302, 1.3043835e‐005) Data Point: (88.586679, 1.2910123e‐005)

Data Point: (162.37767, 5.664247e‐006) Data Point: (297.63514, 2.5159921e‐007) Data Point: (545.55948, 4.7485927e‐009) Data Point: (1,000, 1.7886028e‐010)
Estimation Properties Hyd. K‐Function Estimation Method: Fredlund‐Xing Function Volume Water Content Function: Matl. 5 Soil Cement Armoring Hydraulic K Sat: 1.31e‐005 ft/sec Residual Water Content: 0.03 ft³/ft³ Maximum: 1,000 Minimum: 0.01 Num. Points: 20
Matl. 8 Filter Sand Model: Hyd K Data Point Function Function: X‐Conductivity vs. Pore‐Water Pressure
Curve Fit to Data: 100 % Segment Curvature: 44 %
K‐Saturation: 0.000925 Data Points: Matric Suction (psf), X‐Conductivity (ft/sec)
Data Point: (0.01, 0.000925) Data Point: (0.018329807, 0.00092499993) Data Point: (0.033598183, 0.00092499981) Data Point: (0.061584821, 0.0009249996) Data Point: (0.11288379, 0.00092499919) Data Point: (0.20691381, 0.00092499854) Data Point: (0.37926902, 0.00092499785) Data Point: (0.6951928, 0.00092499117) Data Point: (1.274275, 0.00092498427) Data Point: (2.3357215,0.00092515575) Data Point: (4.2813324,0.00092444336) Data Point: (7.8475997,0.00092025484) Data Point: (14.384499,0.00086768248) Data Point: (26.366509, 0.00022215817) Data Point: (48.329302, 5.6149022e‐006) Data Point: (88.586679, 9.4931606e‐008) Data Point: (162.37767, 4.4270536e‐009) Data Point: (297.63514, 6.3580973e‐010) Data Point: (545.55948, 1.1244323e‐010) Data Point: (1,000, 1.0762229e‐011)
Estimation Properties Hyd. K‐Function Estimation Method: Fredlund‐Xing Function Volume Water Content Function: Matl. 8 Filter Sand (C33) Hydraulic K Sat: 0.000925 ft/sec Residual Water Content: 0.03 ft³/ft³ Maximum: 1,000 Minimum: 0.01 Num. Points: 20
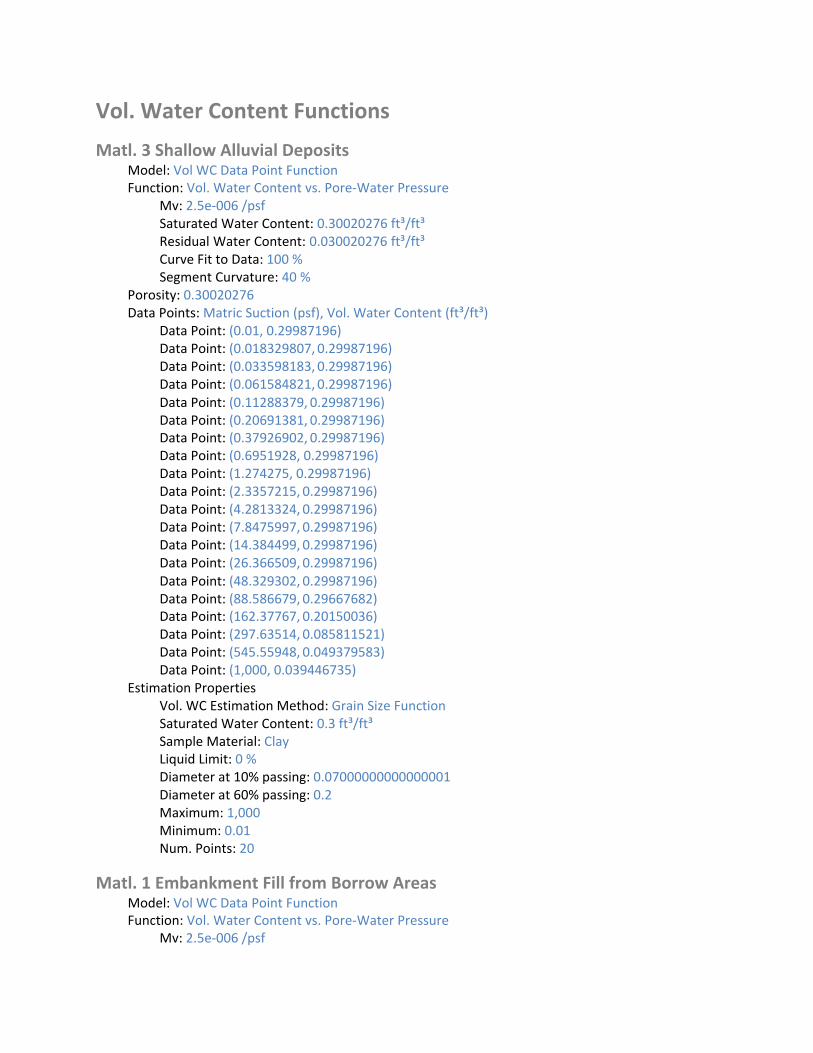
Vol. Water Content Functions
Matl. 3 Shallow Alluvial Deposits Model: Vol WC Data Point Function Function: Vol. Water Content vs. Pore‐Water Pressure
Mv: 2.5e‐006 /psf Saturated Water Content: 0.30020276 ft³/ft³ Residual Water Content: 0.030020276 ft³/ft³ Curve Fit to Data: 100 % Segment Curvature: 40 %
Porosity: 0.30020276 Data Points: Matric Suction (psf), Vol. Water Content (ft³/ft³)
Data Point: (0.01, 0.29987196) Data Point: (0.018329807, 0.29987196) Data Point: (0.033598183, 0.29987196) Data Point: (0.061584821, 0.29987196) Data Point: (0.11288379, 0.29987196) Data Point: (0.20691381, 0.29987196) Data Point: (0.37926902, 0.29987196) Data Point: (0.6951928, 0.29987196) Data Point: (1.274275, 0.29987196) Data Point: (2.3357215, 0.29987196) Data Point: (4.2813324, 0.29987196) Data Point: (7.8475997, 0.29987196) Data Point: (14.384499, 0.29987196) Data Point: (26.366509, 0.29987196) Data Point: (48.329302, 0.29987196) Data Point: (88.586679, 0.29667682) Data Point: (162.37767, 0.20150036) Data Point: (297.63514, 0.085811521) Data Point: (545.55948, 0.049379583) Data Point: (1,000, 0.039446735)
Estimation Properties Vol. WC Estimation Method: Grain Size Function Saturated Water Content: 0.3 ft³/ft³ Sample Material: Clay Liquid Limit: 0 % Diameter at 10% passing: 0.07000000000000001 Diameter at 60% passing: 0.2 Maximum: 1,000 Minimum: 0.01 Num. Points: 20
Matl. 1 Embankment Fill from Borrow Areas Model: Vol WC Data Point Function Function: Vol. Water Content vs. Pore‐Water Pressure
Mv: 2.5e‐006 /psf

Saturated Water Content: 0.30020276 ft³/ft³ Residual Water Content: 0.030020276 ft³/ft³ Curve Fit to Data: 100 % Segment Curvature: 40 %
Porosity: 0.30020276 Data Points: Matric Suction (psf), Vol. Water Content (ft³/ft³)
Data Point: (0.01, 0.29987196) Data Point: (0.018329807, 0.29987196) Data Point: (0.033598183, 0.29987196) Data Point: (0.061584821, 0.29987196) Data Point: (0.11288379, 0.29987196) Data Point: (0.20691381, 0.29987196) Data Point: (0.37926902, 0.29987196) Data Point: (0.6951928, 0.29987196) Data Point: (1.274275, 0.29987196) Data Point: (2.3357215, 0.29987196) Data Point: (4.2813324, 0.29987196) Data Point: (7.8475997, 0.29987196) Data Point: (14.384499, 0.29987196) Data Point: (26.366509, 0.29987196) Data Point: (48.329302, 0.29987196) Data Point: (88.586679, 0.29667682) Data Point: (162.37767, 0.20150036) Data Point: (297.63514, 0.085811521) Data Point: (545.55948, 0.049379583) Data Point: (1,000, 0.039446735)
Estimation Properties Vol. WC Estimation Method: Grain Size Function Saturated Water Content: 0.3 ft³/ft³ Sample Material: Clay Liquid Limit: 0 % Diameter at 10% passing: 0.07000000000000001 Diameter at 60% passing: 0.2 Maximum: 1,000 Minimum: 0.01 Num. Points: 20
Matl. 2 Surficial Overburden Layer Model: Vol WC Data Point Function Function: Vol. Water Content vs. Pore‐Water Pressure
Mv: 2.5e‐006 /psf Saturated Water Content: 0.30132774 ft³/ft³ Residual Water Content: 0.030132774 ft³/ft³ Curve Fit to Data: 100 % Segment Curvature: 40 %
Porosity: 0.30132774 Data Points: Matric Suction (psf), Vol. Water Content (ft³/ft³)
Data Point: (0.01, 0.30110223)

Data Point: (0.018329807, 0.30110223) Data Point: (0.033598183, 0.30110223) Data Point: (0.061584821, 0.30110223) Data Point: (0.11288379, 0.30110223) Data Point: (0.20691381, 0.30110223) Data Point: (0.37926902, 0.30110223) Data Point: (0.6951928, 0.30110223) Data Point: (1.274275, 0.30110223) Data Point: (2.3357215, 0.30110223) Data Point: (4.2813324, 0.30110223) Data Point: (7.8475997, 0.30110223) Data Point: (14.384499, 0.30110223) Data Point: (26.366509, 0.30110223) Data Point: (48.329302, 0.30110223) Data Point: (88.586679, 0.29938489) Data Point: (162.37767, 0.21986255) Data Point: (297.63514, 0.094851578) Data Point: (545.55948, 0.051777012) Data Point: (1,000, 0.040605935)
Estimation Properties Vol. WC Estimation Method: Grain Size Function Saturated Water Content: 0.3 ft³/ft³ Sample Material: Clay Liquid Limit: 0 % Diameter at 10% passing: 0.07000000000000001 Diameter at 60% passing: 0.18 Maximum: 1,000 Minimum: 0.01 Num. Points: 20
Matl. 8 Filter Sand (C33) Model: Vol WC Data Point Function Function: Vol. Water Content vs. Pore‐Water Pressure
Mv: 8e‐007 /psf Saturated Water Content: 0.30081752 ft³/ft³ Residual Water Content: 0.030081752 ft³/ft³ Curve Fit to Data: 100 % Segment Curvature: 48 %
Porosity: 0.30081752 Data Points: Matric Suction (psf), Vol. Water Content (ft³/ft³)
Data Point: (0.01, 0.30028388) Data Point: (0.018329807, 0.30028388) Data Point: (0.033598183, 0.30028388) Data Point: (0.061584821, 0.30028388) Data Point: (0.11288379, 0.30028388) Data Point: (0.20691381, 0.30028388) Data Point: (0.37926902, 0.30028388) Data Point: (0.6951928, 0.30028388)

Data Point: (1.274275, 0.30028388) Data Point: (2.3357215, 0.30028388) Data Point: (4.2813324, 0.30028388) Data Point: (7.8475997, 0.30028388) Data Point: (14.384499, 0.28112842) Data Point: (26.366509, 0.15065712) Data Point: (48.329302, 0.048430554) Data Point: (88.586679, 0.021674388) Data Point: (162.37767, 0.016081301) Data Point: (297.63514, 0.013674367) Data Point: (545.55948, 0.011770874) Data Point: (1,000, 0.010084825)
Estimation Properties Vol. WC Estimation Method: Grain Size Function Saturated Water Content: 0.3 ft³/ft³ Sample Material: Gravel Liquid Limit: 0 % Diameter at 10% passing: 0.38 Diameter at 60% passing: 1.6 Maximum: 1,000 Minimum: 0.01 Num. Points: 20
Mat. 6 Fine Drainage Gravel (No 89) Model: Vol WC Data Point Function Function: Vol. Water Content vs. Pore‐Water Pressure
Mv: 4e‐007 /psf Saturated Water Content: 0.21947752 ft³/ft³ Residual Water Content: 0.021947752 ft³/ft³ Curve Fit to Data: 100 % Segment Curvature: 48 %
Porosity: 0.21947752 Data Points: Matric Suction (psf), Vol. Water Content (ft³/ft³)
Data Point: (0.01, 0.21916427) Data Point: (0.018329807, 0.21916427) Data Point: (0.033598183, 0.21916427) Data Point: (0.061584821, 0.21916427) Data Point: (0.11288379, 0.21916427) Data Point: (0.20691381, 0.21916427) Data Point: (0.37926902, 0.21916427) Data Point: (0.6951928, 0.21916427) Data Point: (1.274275, 0.21916427) Data Point: (2.3357215, 0.21916427) Data Point: (4.2813324, 0.20182012) Data Point: (7.8475997, 0.090949254) Data Point: (14.384499, 0.021737158) Data Point: (26.366509, 0.0080845337) Data Point: (48.329302, 0.0057554944)

Data Point: (88.586679, 0.0048689464) Data Point: (162.37767, 0.0041947283) Data Point: (297.63514, 0.0036057207) Data Point: (545.55948, 0.0030872724) Data Point: (1,000, 0.002632805)
Estimation Properties Vol. WC Estimation Method: Grain Size Function Saturated Water Content: 0.21875 ft³/ft³ Sample Material: Clay Liquid Limit: 0 % Diameter at 10% passing: 3.5 Diameter at 60% passing: 7.1 Maximum: 1,000 Minimum: 0.01 Num. Points: 20
Matl. 4 Deeper Marine Deposits Model: Vol WC Data Point Function Function: Vol. Water Content vs. Pore‐Water Pressure
Mv: 2.5e‐006 /psf Saturated Water Content: 0.30154597 ft³/ft³ Residual Water Content: 0.030154597 ft³/ft³ Curve Fit to Data: 100 % Segment Curvature: 40 %
Porosity: 0.30154597 Data Points: Matric Suction (psf), Vol. Water Content (ft³/ft³)
Data Point: (0.01, 0.30100508) Data Point: (0.018329807, 0.30100508) Data Point: (0.033598183, 0.30100508) Data Point: (0.061584821, 0.30100508) Data Point: (0.11288379, 0.30100508) Data Point: (0.20691381, 0.30100508) Data Point: (0.37926902, 0.30100508) Data Point: (0.6951928, 0.30100508) Data Point: (1.274275, 0.30100508) Data Point: (2.3357215, 0.30100508) Data Point: (4.2813324, 0.30100508) Data Point: (7.8475997, 0.30100508) Data Point: (14.384499, 0.30100508) Data Point: (26.366509, 0.30100508) Data Point: (48.329302, 0.30100508) Data Point: (88.586679, 0.30100508) Data Point: (162.37767, 0.2887592) Data Point: (297.63514, 0.17412515) Data Point: (545.55948, 0.076942285) Data Point: (1,000, 0.051397358)
Estimation Properties Vol. WC Estimation Method: Grain Size Function

Saturated Water Content: 0.3 ft³/ft³ Sample Material: Clay Liquid Limit: 0 % Diameter at 10% passing: 0.06 Diameter at 60% passing: 0.11 Maximum: 1,000 Minimum: 0.01 Num. Points: 20
Matl. 5 Soil Cement Armoring Model: Vol WC Data Point Function Function: Vol. Water Content vs. Pore‐Water Pressure
Mv: 2.5e‐006 /psf Saturated Water Content: 0.30020276 ft³/ft³ Residual Water Content: 0.030020276 ft³/ft³ Curve Fit to Data: 100 % Segment Curvature: 40 %
Porosity: 0.30020276 Data Points: Matric Suction (psf), Vol. Water Content (ft³/ft³)
Data Point: (0.01, 0.29987196) Data Point: (0.018329807, 0.29987196) Data Point: (0.033598183, 0.29987196) Data Point: (0.061584821, 0.29987196) Data Point: (0.11288379, 0.29987196) Data Point: (0.20691381, 0.29987196) Data Point: (0.37926902, 0.29987196) Data Point: (0.6951928, 0.29987196) Data Point: (1.274275, 0.29987196) Data Point: (2.3357215, 0.29987196) Data Point: (4.2813324, 0.29987196) Data Point: (7.8475997, 0.29987196) Data Point: (14.384499, 0.29987196) Data Point: (26.366509, 0.29987196) Data Point: (48.329302, 0.29987196) Data Point: (88.586679, 0.29667682) Data Point: (162.37767, 0.20150036) Data Point: (297.63514, 0.085811521) Data Point: (545.55948, 0.049379583) Data Point: (1,000, 0.039446735)
Estimation Properties Vol. WC Estimation Method: Grain Size Function Saturated Water Content: 0.3 ft³/ft³ Sample Material: Clay Liquid Limit: 0 % Diameter at 10% passing: 0.07000000000000001 Diameter at 60% passing: 0.2 Maximum: 1,000 Minimum: 0.01

5
10
15
20
25
30
Num. Points: 20
Points X (ft) Y (ft)
Point 1 ‐56.5 18
Point 2 ‐14.5 18
Point 3 ‐14.5 28
Point 4 ‐11.5 28
Point ‐11.5 15
Point 6 ‐7 34.5
Point 7 ‐7 33.4
Point 8 6.8 33.4
Point 9 14 31
Point 13.7 30.1
Point 11 51.6 17.5
Point 12 54.2 15
Point 13 55.0033 16.4828
Point 14 54.9 16.4
Point 54.8636 16.2065
Point 16 55.097 16.0075
Point 17 55.3031 16.0832
Point 18 55.3561 16.2916
Point 19 55.3 16.4
Point 55.1797 16.4906
Point 21 62.3 15
Point 22 59.3 16
Point 23 57.8 16.5
Point 24 61 16.5
Point 7 34.5
Point 26 62.3 13.5
Point 27 70.3 13.5
Point 28 70.3 11.5
Point 29 72.3 11.5
Point 72.3 13.5
Point 31 72.3 15

32
33
34
35
36
37
38
39
40
41
42
43
44
45
46
47
48
49
50
51
52
53
54
55
56
57
58
59
60
61
62
63
64
65
66
67
Point 65.5 15
Point 62.5 16
Point ‐90.5 13.5
Point 100 15
Point 100 13.5
Point 100 ‐14.5
Point ‐90.5 ‐14.5
Point 100 ‐114.5
Point ‐90.5 ‐114.5
Point ‐180 15
Point ‐180 13.5
Point ‐180 ‐14.5
Point ‐180 ‐114.5
Point 1,600 15
Point 1,600 13.5
Point 1,600 ‐14.5
Point 1,600 ‐114.5
Point 41.5 23
Point 55.3546 16.1839
Point 54.9487 16.066
Point 55.2227 16.0254
Point ‐1,700 15
Point ‐1,700 13.5
Point ‐1,700 ‐14.5
Point ‐1,700 ‐114.5
Point ‐65.5 13.5
Point ‐55.5 13.5
Point ‐55.5 15
Point ‐55.5 16
Point ‐55.5 17
Point ‐55.5 18
Point ‐11.5 16
Point ‐12.5 16
Point ‐12.5 17
Point ‐56.5 16
Point ‐56.5 17
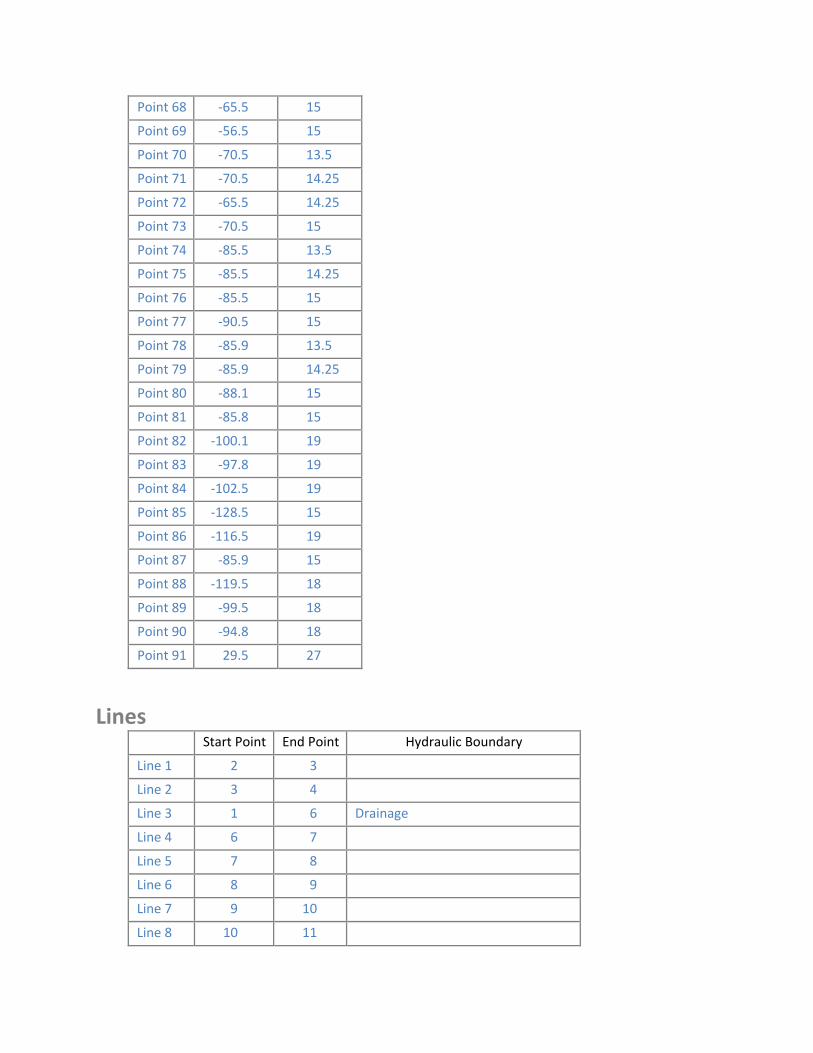
Point 68 ‐65.5 15
Point 69 ‐56.5 15
Point 70 ‐70.5 13.5
Point 71 ‐70.5 14.25
Point 72 ‐65.5 14.25
Point 73 ‐70.5 15
Point 74 ‐85.5 13.5
Point 75 ‐85.5 14.25
Point 76 ‐85.5 15
Point 77 ‐90.5 15
Point 78 ‐85.9 13.5
Point 79 ‐85.9 14.25
Point 80 ‐88.1 15
Point 81 ‐85.8 15
Point 82 ‐100.1 19
Point 83 ‐97.8 19
Point 84 ‐102.5 19
Point 85 ‐128.5 15
Point 86 ‐116.5 19
Point 87 ‐85.9 15
Point 88 ‐119.5 18
Point 89 ‐99.5 18
Point 90 ‐94.8 18
Point 91 29.5 27
Lines Start Point End Point Hydraulic Boundary
Line 1 2 3
Line 2 3 4
Line 3 1 6 Drainage
Line 4 6 7
Line 5 7 8
Line 6 8 9
Line 7 9 10
Line 8 10 11
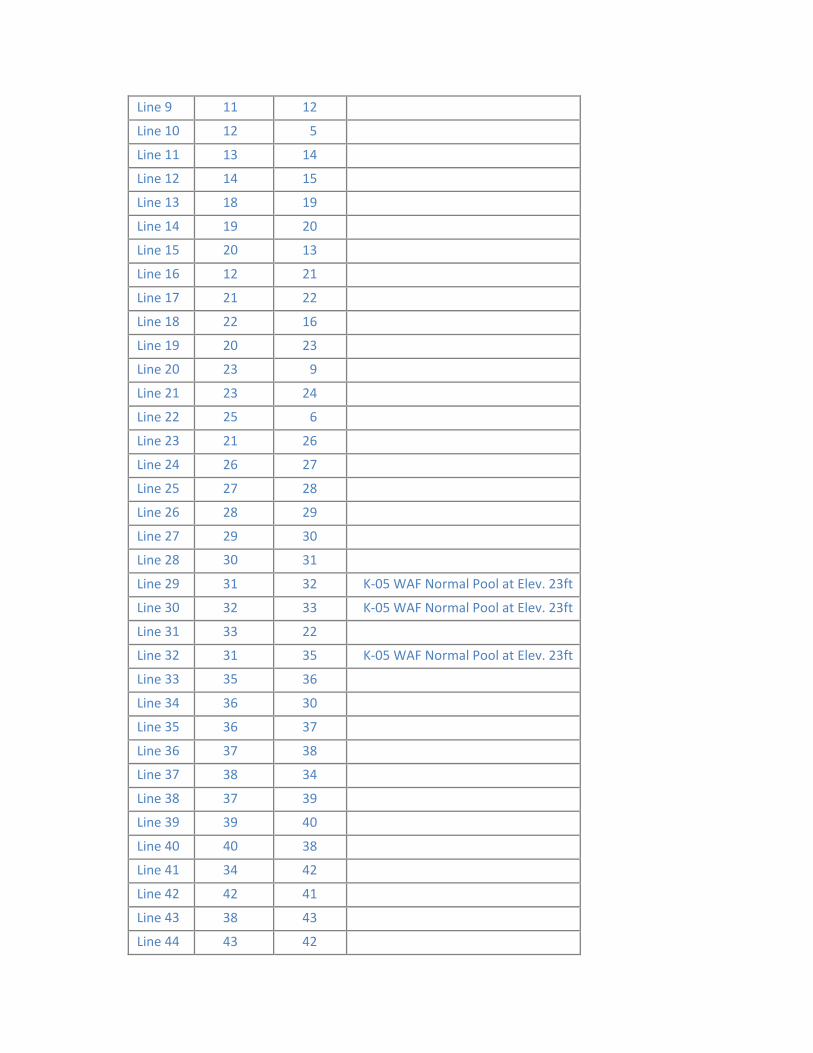
9
10
11
12
13
14
15
16
17
18
19
20
21
22
23
24
25
26
27
28
29
30
31
32
33
34
35
36
37
38
39
40
41
42
43
44
20
25
30
35
40
Line 11 12
Line 12 5
Line 13 14
Line 14 15
Line 18 19
Line 19 20
Line 13
Line 12 21
Line 21 22
Line 22 16
Line 20 23
Line 23 9
Line 23 24
Line 6
Line 21 26
Line 26 27
Line 27 28
Line 28 29
Line 29 30
Line 31
Line 31 32 K‐05 WAF Normal Pool at Elev. 23ft
Line 32 33 K‐05 WAF Normal Pool at Elev. 23ft
Line 33 22
Line 31 35 K‐05 WAF Normal Pool at Elev. 23ft
Line 36
Line 36 30
Line 36 37
Line 37 38
Line 38 34
Line 37 39
Line 39 40
Line 38
Line 34 42
Line 42 41
Line 38 43
Line 43 42
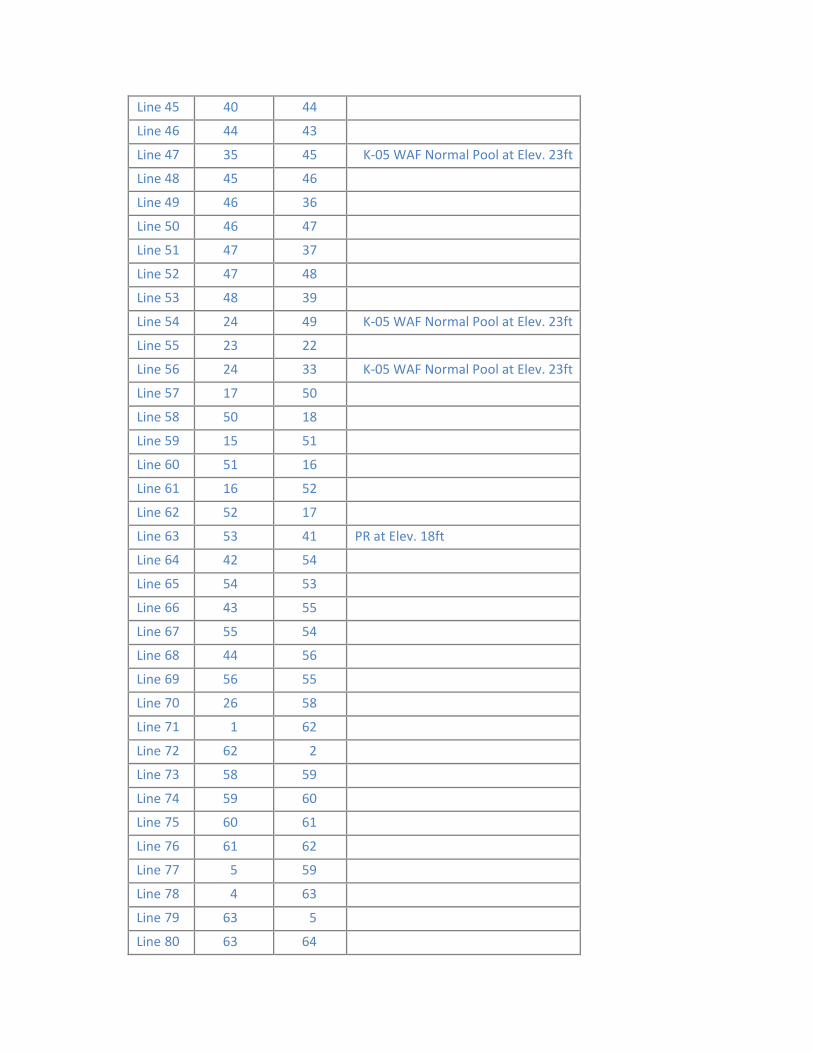
45
46
47
48
49
50
51
52
53
54
55
56
57
58
59
60
61
62
63
64
65
66
67
68
69
70
71
72
73
74
75
76
77
78
79
80
Line 40 44
Line 44 43
Line 35 45 K‐05 WAF Normal Pool at Elev. 23ft
Line 45 46
Line 46 36
Line 46 47
Line 47 37
Line 47 48
Line 48 39
Line 24 49 K‐05 WAF Normal Pool at Elev. 23ft
Line 23 22
Line 24 33 K‐05 WAF Normal Pool at Elev. 23ft
Line 17 50
Line 50 18
Line 15 51
Line 51 16
Line 16 52
Line 52 17
Line 53 41 PR at Elev. 18ft
Line 42 54
Line 54 53
Line 43 55
Line 55 54
Line 44 56
Line 56 55
Line 26 58
Line 1 62
Line 62 2
Line 58 59
Line 59 60
Line 60 61
Line 61 62
Line 5 59
Line 4 63
Line 63 5
Line 63 64

81
82
83
84
85
86
87
88
89
90
91
92
93
94
95
96
97
98
99
100
101
102
103
104
105
106
107
108
109
110
111
112
113
114
115
116
65
70
75
80
85
Line 64 60
Line 64
Line 60 66
Line 67 66 Drainage
Line 61 67
Line 67 1
Line 58 57
Line 66 69
Line 69 68
Line 57
Line 68 72
Line 72 71
Line 73 71
Line 68 73 Drainage
Line 70 74
Line 75 76
Line 71
Line 73 76 Drainage
Line 72 57
Line 70 71
Line 74 75
Line 74 78
Line 78 34
Line 77 34
Line 78 79
Line 79
Line 80 77
Line 75 79
Line 80 82
Line 82 83
Line 84 82
Line 77
Line 86 84
Line 85 41 PR at Elev. 18ft
Line 81 87
Line 87 80
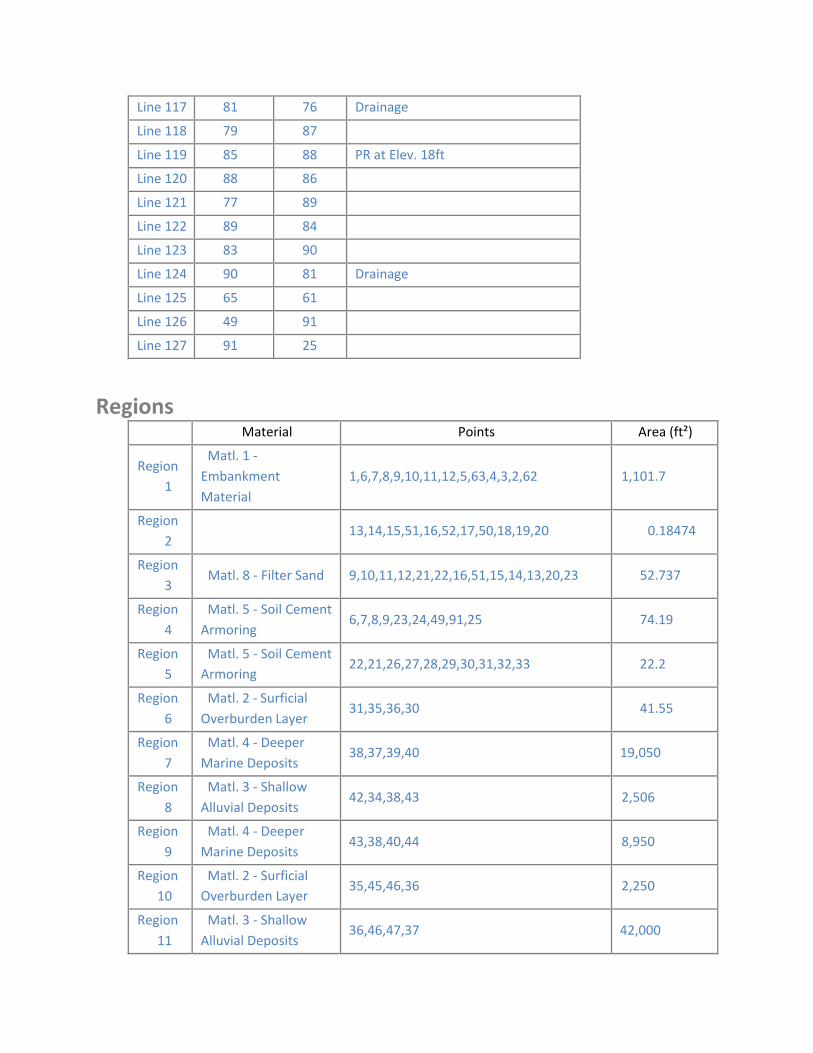
Line 117 81 76 Drainage
Line 118 79 87
Line 119 85 88 PR at Elev. 18ft
Line 120 88 86
Line 121 77 89
Line 122 89 84
Line 123 83 90
Line 124 90 81 Drainage
Line 125 65 61
Line 126 49 91
Line 127 91 25
Regions Material Points Area (ft²)
Region 1
Matl. 1 ‐
Embankment
Material
1,6,7,8,9,10,11,12,5,63,4,3,2,62 1,101.7
Region
2 13,14,15,51,16,52,17,50,18,19,20 0.18474
Region
3 Matl. 8 ‐ Filter Sand 9,10,11,12,21,22,16,51,15,14,13,20,23 52.737
Region
4
Matl. 5 ‐ Soil Cement
Armoring 6,7,8,9,23,24,49,91,25 74.19
Region
5 Matl. 5 ‐ Soil Cement Armoring
22,21,26,27,28,29,30,31,32,33 22.2
Region
6
Matl. 2 ‐ Surficial
Overburden Layer 31,35,36,30 41.55
Region
7
Matl. 4 ‐ Deeper
Marine Deposits 38,37,39,40 19,050
Region
8
Matl. 3 ‐ Shallow
Alluvial Deposits 42,34,38,43 2,506
Region
9
Matl. 4 ‐ Deeper
Marine Deposits 43,38,40,44 8,950
Region
10
Matl. 2 ‐ Surficial Overburden Layer
35,45,46,36 2,250
Region
11
Matl. 3 ‐ Shallow
Alluvial Deposits 36,46,47,37 42,000

12
13
14
15
16
17
18
19
20
21
22
23
24
25
26
27
28
29
30
Region Matl. 4 ‐ Deeper Marine Deposits
37,47,48,39 1.5e+005
Region Matl. 8 ‐ Filter Sand 20,23,22,16,52,17,50,18,19 1.5978
Region Matl. 5 ‐ Soil Cement
Armoring 23,24,33,22 1.6
Region Matl. 2 ‐ Surficial
Overburden Layer 53,41,42,54 2,280
Region Matl. 3 ‐ Shallow
Alluvial Deposits 42,43,55,54 42,560
Region Matl. 4 ‐ Deeper Marine Deposits
55,43,44,56 1.52e+005
Region Matl. 3 ‐ Shallow Alluvial Deposits
34,38,37,36,30,29,28,27,26,58,57,70,74,78 5,330
Region Matl. 2 ‐ Surficial
Overburden Layer 59,58,26,21,12,5 176.7
Region Matl. 8 ‐ Filter Sand 60,59,5,63,64 44
Region Matl. 6 ‐ Fine
Drainage Gravel 61,60,64,65 43
Region Matl. 8 ‐ Filter Sand 62,61,65,64,63,4,3,2 75
Region Matl. 6 ‐ Fine Drainage Gravel
67,66,60,61 1
Region Matl. 9 Concrete
Outfall Works 1,62,61,67 1
Region Matl. 9 Concrete
Outfall Works 68,72,57,58,59,60,66,69 16
Region Matl. 6 ‐ Fine
Drainage Gravel 73,71,72,68 3.75
Region Matl. 6 ‐ Fine Drainage Gravel
76,75,71,73 11.25
Region Matl. 8 ‐ Filter Sand 71,72,57,70 3.75
Region Matl. 8 ‐ Filter Sand 71,70,74,75 11.25
Region Matl. 8 ‐ Filter Sand 77,34,78,79,80 6.075

31
32
33
34
35
36
37
Region Matl. 8 ‐ Filter Sand 79,78,74,75 0.3
Region Matl. 6 ‐ Fine Drainage Gravel
80,82,83,90,81,87 9.2
Region Matl. 8 ‐ Filter Sand 80,77,89,84,82 9.6
Region Matl. 1 ‐
Embankment
Material
77,85,88,86,84,89 104
Region Matl. 2 ‐ Surficial
Overburden Layer 41,42,34,77,85 134.25
Region Matl. 6 ‐ Fine
Drainage Gravel 87,81,76,75,79 0.3
Region Matl. 6 ‐ Fine
Drainage Gravel 80,87,79 0.825
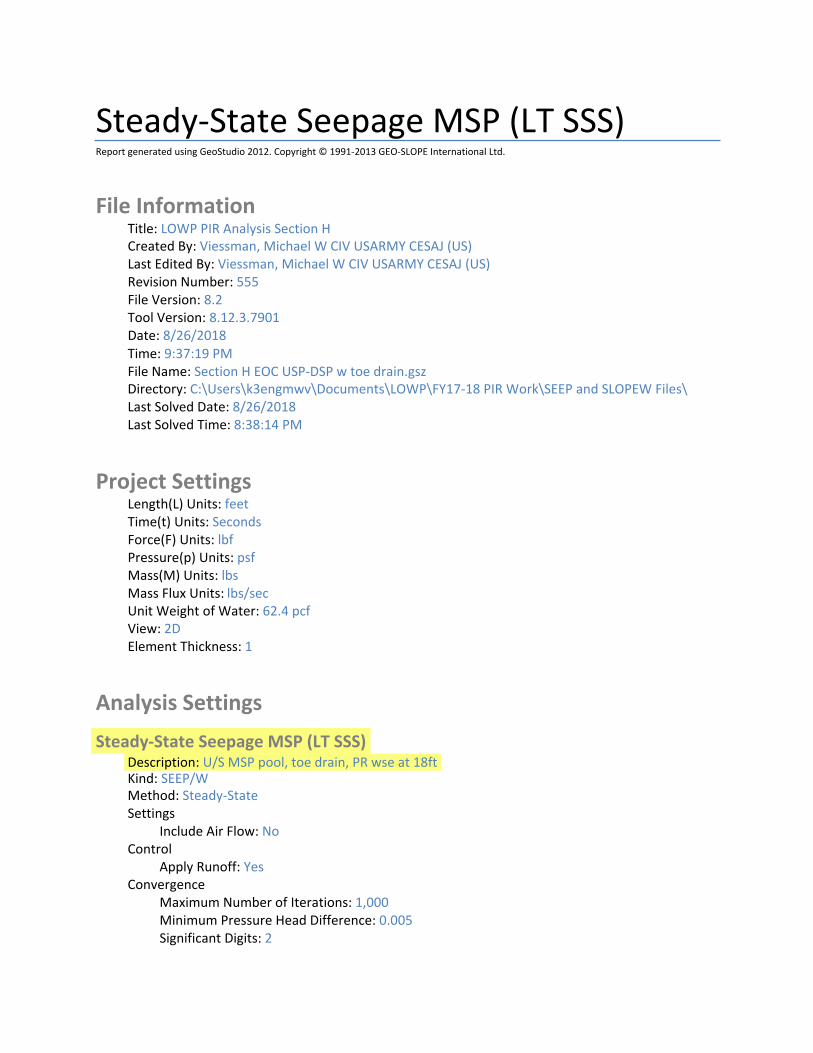
Steady‐State Seepage MSP (LT SSS) Report generated using GeoStudio 2012. Copyright © 1991‐2013 GEO‐SLOPE International Ltd.
File Information Title: LOWP PIR Analysis Section H Created By: Viessman, Michael W CIV USARMY CESAJ (US) Last Edited By: Viessman, Michael W CIV USARMY CESAJ (US) Revision Number: 555 File Version: 8.2 Tool Version: 8.12.3.7901 Date: 8/26/2018 Time: 9:37:19 PM File Name: Section H EOC USP‐DSP w toe drain.gsz Directory: C:\Users\k3engmwv\Documents\LOWP\FY17‐18 PIR Work\SEEP and SLOPEW Files\ Last Solved Date: 8/26/2018 Last Solved Time: 8:38:14 PM
Project Settings Length(L) Units: feet Time(t) Units: Seconds Force(F) Units: lbf Pressure(p) Units: psf Mass(M) Units: lbs Mass Flux Units: lbs/sec Unit Weight of Water: 62.4 pcf View: 2D Element Thickness: 1
Analysis Settings
Steady‐State Seepage MSP (LT SSS) Description: U/S MSP pool, toe drain, PR wse at 18ft Kind: SEEP/W Method: Steady‐State Settings
Include Air Flow: No Control
Apply Runoff: Yes Convergence
Maximum Number of Iterations: 1,000 Minimum Pressure Head Difference: 0.005 Significant Digits: 2

Max # of Reviews: 10 Hydraulic Under‐Relaxation Criteria
Under‐Relaxation Initial Rate: 1 Under‐Relaxation Min. Rate: 0.1 Under‐Relaxation Reduction Rate: 0.65 Under‐Relaxation Iterations: 10
Equation Solver: Parallel Direct Time
Starting Time: 0 sec Duration: 0 sec Ending Time: 0 sec
Materials
Matl. 1 ‐ Embankment Material Model: Saturated / Unsaturated Hydraulic
K‐Function: Matl. 1 Embankment Material Ky'/Kx' Ratio: 0.25 Rotation: 0 ° Vol. WC. Function: Matl. 1 Embankment Fill from Borrow Areas
Matl. 2 ‐ Surficial Overburden Layer Model: Saturated / Unsaturated Hydraulic
K‐Function: Matl. 2 Surficial Overburden Layer Ky'/Kx' Ratio: 0.1 Rotation: 0 ° Vol. WC. Function: Matl. 2 Surficial Overburden Layer
Matl. 3 ‐ Shallow Alluvial Deposits Model: Saturated / Unsaturated Hydraulic
K‐Function: Matl. 3 Shallow Alluvial Deposits Ky'/Kx' Ratio: 0.1 Rotation: 0 ° Vol. WC. Function: Matl. 3 Shallow Alluvial Deposits
Matl. 4 ‐ Deeper Marine Deposits Model: Saturated / Unsaturated Hydraulic
K‐Function: Matl. 4 Deeper Marine Deposits Ky'/Kx' Ratio: 0.1 Rotation: 0 ° Vol. WC. Function: Matl. 4 Deeper Marine Deposits
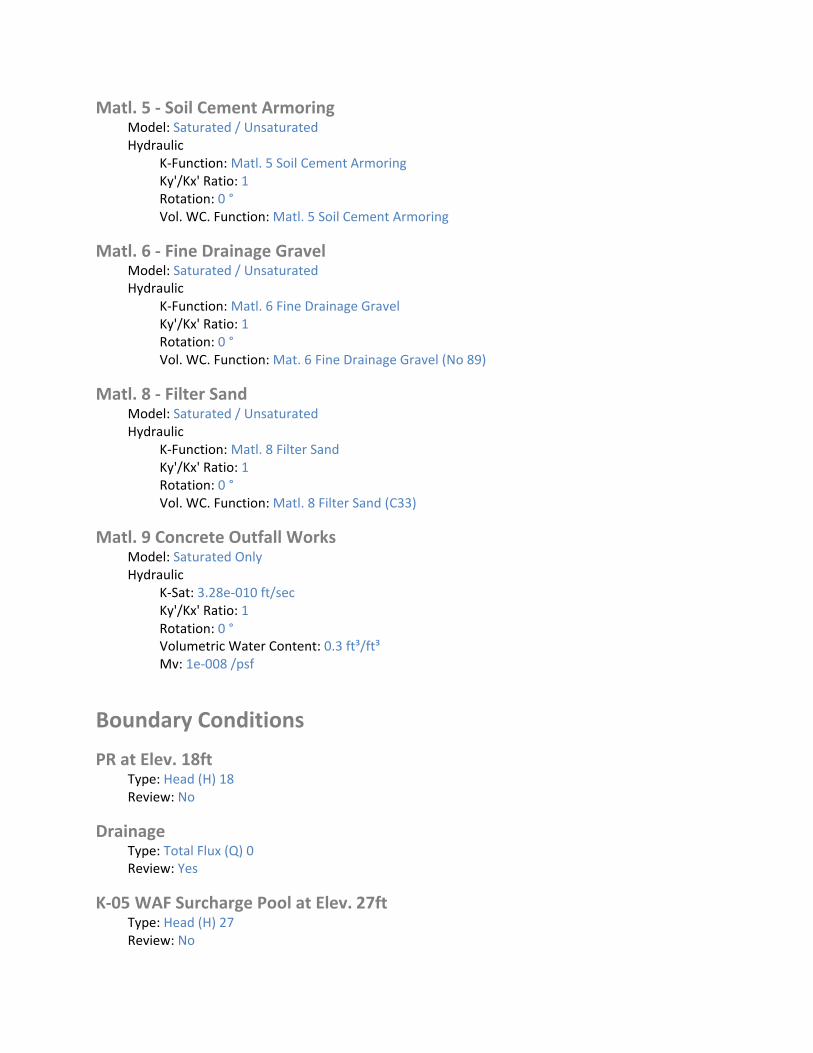
Matl. 5 ‐ Soil Cement Armoring Model: Saturated / Unsaturated Hydraulic
K‐Function: Matl. 5 Soil Cement Armoring Ky'/Kx' Ratio: 1 Rotation: 0 ° Vol. WC. Function: Matl. 5 Soil Cement Armoring
Matl. 6 ‐ Fine Drainage Gravel Model: Saturated / Unsaturated Hydraulic
K‐Function: Matl. 6 Fine Drainage Gravel Ky'/Kx' Ratio: 1 Rotation: 0 ° Vol. WC. Function: Mat. 6 Fine Drainage Gravel (No 89)
Matl. 8 ‐ Filter Sand Model: Saturated / Unsaturated Hydraulic
K‐Function: Matl. 8 Filter Sand Ky'/Kx' Ratio: 1 Rotation: 0 ° Vol. WC. Function: Matl. 8 Filter Sand (C33)
Matl. 9 Concrete Outfall Works Model: Saturated Only Hydraulic
K‐Sat: 3.28e‐010 ft/sec Ky'/Kx' Ratio: 1 Rotation: 0 ° Volumetric Water Content: 0.3 ft³/ft³ Mv: 1e‐008 /psf
Boundary Conditions
PR at Elev. 18ft Type: Head (H) 18 Review: No
Drainage Type: Total Flux (Q) 0 Review: Yes
K‐05 WAF Surcharge Pool at Elev. 27ft Type: Head (H) 27 Review: No

Flux Sections
Flux Section 1 Coordinates
Coordinate: (‐56.368089, 17.11908) ft Coordinate: (‐56.359991, 15.897243) ft
Flux Section 2 Coordinates
Coordinate: (‐100.27362, 18.818898) ft Coordinate: (‐86.017717, 14.05315) ft Coordinate: (‐65.383858, 14.059055) ft
Flux Section 3 Coordinates
Coordinate: (‐11.352061, 28.166901) ft Coordinate: (‐11.307284, 14.896151) ft
Flux Section 4 Coordinates
Coordinate: (‐11.307284, 14.851374) ft Coordinate: (‐55.502072, 14.873763) ft
Flux Section 5 Coordinates
Coordinate: (‐0.349869, 33.216015) ft Coordinate: (‐0.361475, ‐114.73943) ft
Flux Section 6 Coordinates
Coordinate: (‐109.10947, 18.913159) ft Coordinate: (‐109.07273, ‐114.73608) ft
K Functions
Matl. 1 Embankment Material Model: Hyd K Data Point Function Function: X‐Conductivity vs. Pore‐Water Pressure
Curve Fit to Data: 100 % Segment Curvature: 36 %
K‐Saturation: 0.000131 Data Points: Matric Suction (psf), X‐Conductivity (ft/sec)
Data Point: (0.01, 0.000131) Data Point: (0.018329807, 0.00013099927) Data Point: (0.033598183, 0.00013099852) Data Point: (0.061584821, 0.00013099772)

Data Point: (0.11288379, 0.00013099684) Data Point: (0.20691381, 0.00013099581) Data Point: (0.37926902,0.0001309945) Data Point: (0.6951928, 0.00013099268) Data Point: (1.274275, 0.00013098992) Data Point: (2.3357215, 0.00013098549) Data Point: (4.2813324, 0.0001309777) Data Point: (7.8475997, 0.00013096339) Data Point: (14.384499,0.00013094955) Data Point: (26.366509,0.00013089452) Data Point: (48.329302,0.00013043835) Data Point: (88.586679, 0.00012910123) Data Point: (162.37767, 5.664247e‐005) Data Point: (297.63514, 2.5159921e‐006) Data Point: (545.55948, 4.7485927e‐008) Data Point: (1,000, 1.7886028e‐009)
Estimation Properties Hyd. K‐Function Estimation Method: Fredlund‐Xing Function Volume Water Content Function: Matl. 1 Embankment Fill from Borrow Areas Hydraulic K Sat: 0.000131 ft/sec Residual Water Content: 0.0495 ft³/ft³ Maximum: 1,000 Minimum: 0.01 Num. Points: 20
Matl. 4 Deeper Marine Deposits Model: Hyd K Data Point Function Function: X‐Conductivity vs. Pore‐Water Pressure
Curve Fit to Data: 100 % Segment Curvature: 44 %
K‐Saturation: 0.000984 Data Points: Matric Suction (psf), X‐Conductivity (ft/sec)
Data Point: (0.01, 0.000984) Data Point: (0.018329807, 0.00098398585) Data Point: (0.033598183, 0.00098397151) Data Point: (0.061584821, 0.00098395679) Data Point: (0.11288379, 0.00098394139) Data Point: (0.20691381, 0.00098392476) Data Point: (0.37926902, 0.00098390584) Data Point: (0.6951928, 0.00098388274) Data Point: (1.274275, 0.00098385199) Data Point: (2.3357215, 0.0009838074) Data Point: (4.2813324,0.00098373618) Data Point: (7.8475997,0.00098361453) Data Point: (14.384499, 0.0009834543) Data Point: (26.366509,0.00098304118) Data Point: (48.329302,0.00098089274) Data Point: (88.586679,0.00098804841)

Data Point: (162.37767, 0.00089693201) Data Point: (297.63514, 0.00029836287) Data Point: (545.55948, 5.5741791e‐006) Data Point: (1,000, 8.8545842e‐008)
Estimation Properties Hyd. K‐Function Estimation Method: Fredlund‐Xing Function Volume Water Content Function: Matl. 4 Deeper Marine Deposits Hydraulic K Sat: 0.000984 ft/sec Residual Water Content: 0.03 ft³/ft³ Maximum: 1,000 Minimum: 0.01 Num. Points: 20
Matl. 6 Fine Drainage Gravel Model: Hyd K Data Point Function Function: X‐Conductivity vs. Pore‐Water Pressure
Curve Fit to Data: 100 % Segment Curvature: 40 %
K‐Saturation: 0.02315 Data Points: Matric Suction (psf), X‐Conductivity (ft/sec)
Data Point: (0.01, 0.02315) Data Point: (0.018329807, 0.023149999) Data Point: (0.033598183, 0.023149997) Data Point: (0.061584821, 0.023149994) Data Point: (0.11288379, 0.023149984) Data Point: (0.20691381, 0.023149981) Data Point: (0.37926902, 0.023150055) Data Point: (0.6951928, 0.023149315) Data Point: (1.274275, 0.02314882) Data Point: (2.3357215, 0.023163455) Data Point: (4.2813324, 0.02041826) Data Point: (7.8475997, 0.0039249052) Data Point: (14.384499, 6.6024733e‐005) Data Point: (26.366509, 7.000732e‐007) Data Point: (48.329302, 2.0374523e‐008) Data Point: (88.586679, 3.5541328e‐009) Data Point: (162.37767, 7.5581773e‐010) Data Point: (297.63514, 1.5822386e‐010) Data Point: (545.55948, 2.6567478e‐011) Data Point: (1,000, 2.4617797e‐012)
Estimation Properties Hyd. K‐Function Estimation Method: Fredlund‐Xing Function Volume Water Content Function: Mat. 6 Fine Drainage Gravel (No 89) Hydraulic K Sat: 0.02315 ft/sec Residual Water Content: 0.042 ft³/ft³ Maximum: 1,000 Minimum: 0.01 Num. Points: 20
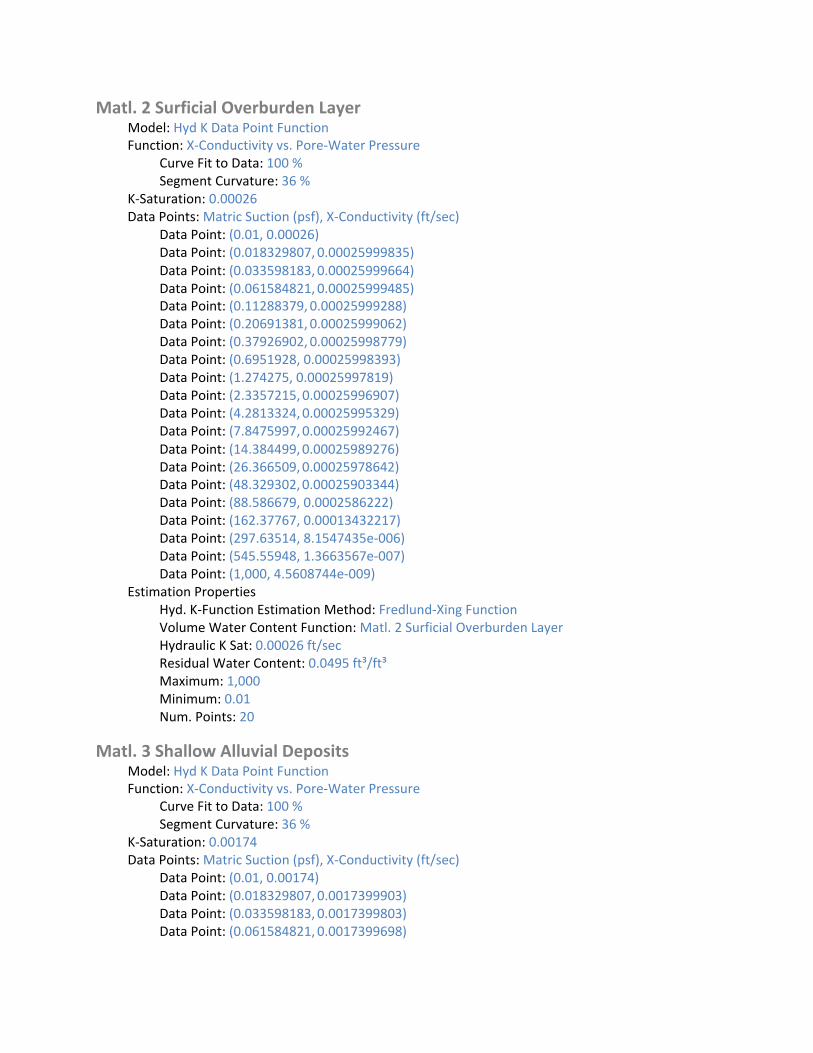
Matl. 2 Surficial Overburden Layer Model: Hyd K Data Point Function Function: X‐Conductivity vs. Pore‐Water Pressure
Curve Fit to Data: 100 % Segment Curvature: 36 %
K‐Saturation: 0.00026 Data Points: Matric Suction (psf), X‐Conductivity (ft/sec)
Data Point: (0.01, 0.00026) Data Point: (0.018329807, 0.00025999835) Data Point: (0.033598183, 0.00025999664) Data Point: (0.061584821, 0.00025999485) Data Point: (0.11288379, 0.00025999288) Data Point: (0.20691381, 0.00025999062) Data Point: (0.37926902, 0.00025998779) Data Point: (0.6951928, 0.00025998393) Data Point: (1.274275, 0.00025997819) Data Point: (2.3357215,0.00025996907) Data Point: (4.2813324,0.00025995329) Data Point: (7.8475997,0.00025992467) Data Point: (14.384499,0.00025989276) Data Point: (26.366509,0.00025978642) Data Point: (48.329302,0.00025903344) Data Point: (88.586679, 0.0002586222) Data Point: (162.37767, 0.00013432217) Data Point: (297.63514, 8.1547435e‐006) Data Point: (545.55948, 1.3663567e‐007) Data Point: (1,000, 4.5608744e‐009)
Estimation Properties Hyd. K‐Function Estimation Method: Fredlund‐Xing Function Volume Water Content Function: Matl. 2 Surficial Overburden Layer Hydraulic K Sat: 0.00026 ft/sec Residual Water Content: 0.0495 ft³/ft³ Maximum: 1,000 Minimum: 0.01 Num. Points: 20
Matl. 3 Shallow Alluvial Deposits Model: Hyd K Data Point Function Function: X‐Conductivity vs. Pore‐Water Pressure
Curve Fit to Data: 100 % Segment Curvature: 36 %
K‐Saturation: 0.00174 Data Points: Matric Suction (psf), X‐Conductivity (ft/sec)
Data Point: (0.01, 0.00174) Data Point: (0.018329807, 0.0017399903) Data Point: (0.033598183, 0.0017399803) Data Point: (0.061584821, 0.0017399698)

Data Point: (0.11288379,0.0017399581) Data Point: (0.20691381,0.0017399444) Data Point: (0.37926902,0.0017399269) Data Point: (0.6951928, 0.0017399027) Data Point: (1.274275, 0.0017398661) Data Point: (2.3357215, 0.0017398072) Data Point: (4.2813324, 0.0017397038) Data Point: (7.8475997, 0.0017395137) Data Point: (14.384499, 0.0017393299) Data Point: (26.366509, 0.001738599) Data Point: (48.329302, 0.0017325399) Data Point: (88.586679, 0.0017147796) Data Point: (162.37767, 0.00075235037) Data Point: (297.63514, 3.3418521e‐005) Data Point: (545.55948, 6.307291e‐007) Data Point: (1,000, 2.3757014e‐008)
Estimation Properties Hyd. K‐Function Estimation Method: Fredlund‐Xing Function Volume Water Content Function: Matl. 3 Shallow Alluvial Deposits Hydraulic K Sat: 0.00174 ft/sec Residual Water Content: 0.0495 ft³/ft³ Maximum: 1,000 Minimum: 0.01 Num. Points: 20
Matl. 5 Soil Cement Armoring Model: Hyd K Data Point Function Function: X‐Conductivity vs. Pore‐Water Pressure
Curve Fit to Data: 100 % Segment Curvature: 44 %
K‐Saturation: 1.31e‐005 Data Points: Matric Suction (psf), X‐Conductivity (ft/sec)
Data Point: (0.01, 1.31e‐005) Data Point: (0.018329807, 1.3099927e‐005) Data Point: (0.033598183, 1.3099852e‐005) Data Point: (0.061584821, 1.3099772e‐005) Data Point: (0.11288379, 1.3099684e‐005) Data Point: (0.20691381, 1.3099581e‐005) Data Point: (0.37926902, 1.309945e‐005) Data Point: (0.6951928, 1.3099268e‐005) Data Point: (1.274275, 1.3098992e‐005) Data Point: (2.3357215, 1.3098549e‐005) Data Point: (4.2813324, 1.309777e‐005) Data Point: (7.8475997, 1.3096339e‐005) Data Point: (14.384499, 1.3094955e‐005) Data Point: (26.366509, 1.3089452e‐005) Data Point: (48.329302, 1.3043835e‐005) Data Point: (88.586679, 1.2910123e‐005)

Data Point: (162.37767, 5.664247e‐006) Data Point: (297.63514, 2.5159921e‐007) Data Point: (545.55948, 4.7485927e‐009) Data Point: (1,000, 1.7886028e‐010)
Estimation Properties Hyd. K‐Function Estimation Method: Fredlund‐Xing Function Volume Water Content Function: Matl. 5 Soil Cement Armoring Hydraulic K Sat: 1.31e‐005 ft/sec Residual Water Content: 0.03 ft³/ft³ Maximum: 1,000 Minimum: 0.01 Num. Points: 20
Matl. 8 Filter Sand Model: Hyd K Data Point Function Function: X‐Conductivity vs. Pore‐Water Pressure
Curve Fit to Data: 100 % Segment Curvature: 44 %
K‐Saturation: 0.000925 Data Points: Matric Suction (psf), X‐Conductivity (ft/sec)
Data Point: (0.01, 0.000925) Data Point: (0.018329807, 0.00092499993) Data Point: (0.033598183, 0.00092499981) Data Point: (0.061584821, 0.0009249996) Data Point: (0.11288379, 0.00092499919) Data Point: (0.20691381, 0.00092499854) Data Point: (0.37926902, 0.00092499785) Data Point: (0.6951928, 0.00092499117) Data Point: (1.274275, 0.00092498427) Data Point: (2.3357215,0.00092515575) Data Point: (4.2813324,0.00092444336) Data Point: (7.8475997,0.00092025484) Data Point: (14.384499,0.00086768248) Data Point: (26.366509, 0.00022215817) Data Point: (48.329302, 5.6149022e‐006) Data Point: (88.586679, 9.4931606e‐008) Data Point: (162.37767, 4.4270536e‐009) Data Point: (297.63514, 6.3580973e‐010) Data Point: (545.55948, 1.1244323e‐010) Data Point: (1,000, 1.0762229e‐011)
Estimation Properties Hyd. K‐Function Estimation Method: Fredlund‐Xing Function Volume Water Content Function: Matl. 8 Filter Sand (C33) Hydraulic K Sat: 0.000925 ft/sec Residual Water Content: 0.03 ft³/ft³ Maximum: 1,000 Minimum: 0.01 Num. Points: 20

Vol. Water Content Functions
Matl. 3 Shallow Alluvial Deposits Model: Vol WC Data Point Function Function: Vol. Water Content vs. Pore‐Water Pressure
Mv: 2.5e‐006 /psf Saturated Water Content: 0.30020276 ft³/ft³ Residual Water Content: 0.030020276 ft³/ft³ Curve Fit to Data: 100 % Segment Curvature: 40 %
Porosity: 0.30020276 Data Points: Matric Suction (psf), Vol. Water Content (ft³/ft³)
Data Point: (0.01, 0.29987196) Data Point: (0.018329807, 0.29987196) Data Point: (0.033598183, 0.29987196) Data Point: (0.061584821, 0.29987196) Data Point: (0.11288379, 0.29987196) Data Point: (0.20691381, 0.29987196) Data Point: (0.37926902, 0.29987196) Data Point: (0.6951928, 0.29987196) Data Point: (1.274275, 0.29987196) Data Point: (2.3357215, 0.29987196) Data Point: (4.2813324, 0.29987196) Data Point: (7.8475997, 0.29987196) Data Point: (14.384499, 0.29987196) Data Point: (26.366509, 0.29987196) Data Point: (48.329302, 0.29987196) Data Point: (88.586679, 0.29667682) Data Point: (162.37767, 0.20150036) Data Point: (297.63514, 0.085811521) Data Point: (545.55948, 0.049379583) Data Point: (1,000, 0.039446735)
Estimation Properties Vol. WC Estimation Method: Grain Size Function Saturated Water Content: 0.3 ft³/ft³ Sample Material: Clay Liquid Limit: 0 % Diameter at 10% passing: 0.07000000000000001 Diameter at 60% passing: 0.2 Maximum: 1,000 Minimum: 0.01 Num. Points: 20
Matl. 1 Embankment Fill from Borrow Areas Model: Vol WC Data Point Function Function: Vol. Water Content vs. Pore‐Water Pressure
Mv: 2.5e‐006 /psf
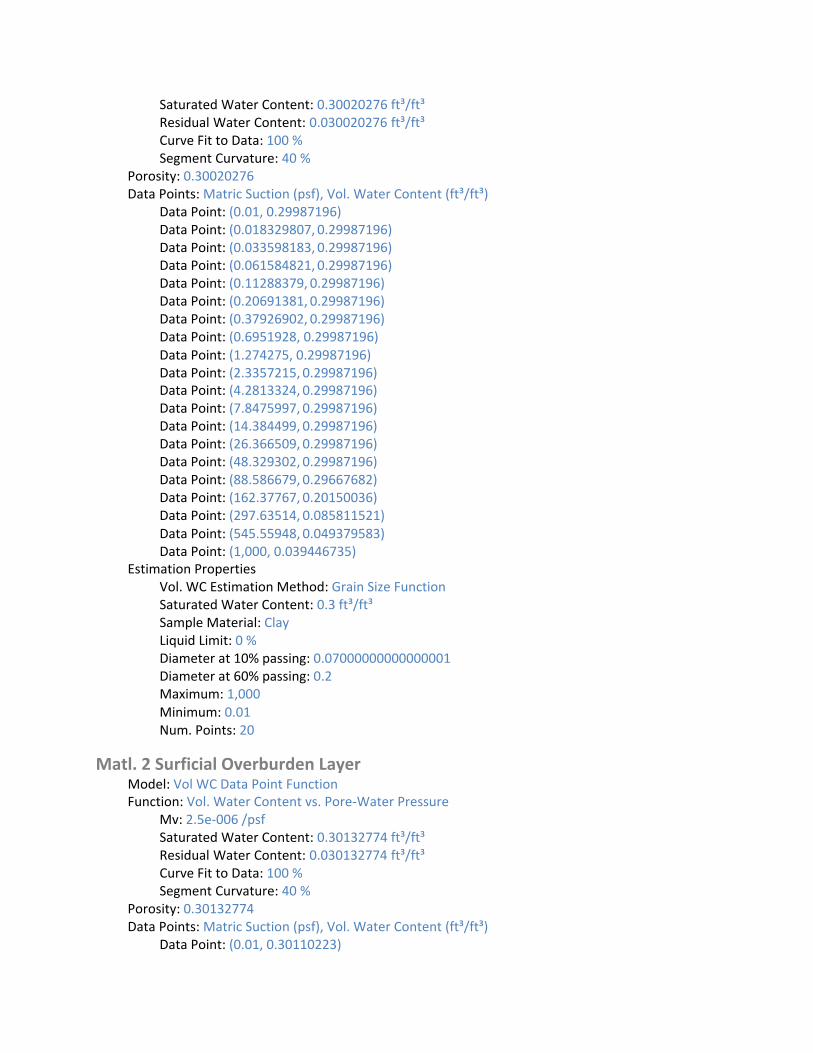
Saturated Water Content: 0.30020276 ft³/ft³ Residual Water Content: 0.030020276 ft³/ft³ Curve Fit to Data: 100 % Segment Curvature: 40 %
Porosity: 0.30020276 Data Points: Matric Suction (psf), Vol. Water Content (ft³/ft³)
Data Point: (0.01, 0.29987196) Data Point: (0.018329807, 0.29987196) Data Point: (0.033598183, 0.29987196) Data Point: (0.061584821, 0.29987196) Data Point: (0.11288379, 0.29987196) Data Point: (0.20691381, 0.29987196) Data Point: (0.37926902, 0.29987196) Data Point: (0.6951928, 0.29987196) Data Point: (1.274275, 0.29987196) Data Point: (2.3357215, 0.29987196) Data Point: (4.2813324, 0.29987196) Data Point: (7.8475997, 0.29987196) Data Point: (14.384499, 0.29987196) Data Point: (26.366509, 0.29987196) Data Point: (48.329302, 0.29987196) Data Point: (88.586679, 0.29667682) Data Point: (162.37767, 0.20150036) Data Point: (297.63514, 0.085811521) Data Point: (545.55948, 0.049379583) Data Point: (1,000, 0.039446735)
Estimation Properties Vol. WC Estimation Method: Grain Size Function Saturated Water Content: 0.3 ft³/ft³ Sample Material: Clay Liquid Limit: 0 % Diameter at 10% passing: 0.07000000000000001 Diameter at 60% passing: 0.2 Maximum: 1,000 Minimum: 0.01 Num. Points: 20
Matl. 2 Surficial Overburden Layer Model: Vol WC Data Point Function Function: Vol. Water Content vs. Pore‐Water Pressure
Mv: 2.5e‐006 /psf Saturated Water Content: 0.30132774 ft³/ft³ Residual Water Content: 0.030132774 ft³/ft³ Curve Fit to Data: 100 % Segment Curvature: 40 %
Porosity: 0.30132774 Data Points: Matric Suction (psf), Vol. Water Content (ft³/ft³)
Data Point: (0.01, 0.30110223)

Data Point: (0.018329807, 0.30110223) Data Point: (0.033598183, 0.30110223) Data Point: (0.061584821, 0.30110223) Data Point: (0.11288379, 0.30110223) Data Point: (0.20691381, 0.30110223) Data Point: (0.37926902, 0.30110223) Data Point: (0.6951928, 0.30110223) Data Point: (1.274275, 0.30110223) Data Point: (2.3357215, 0.30110223) Data Point: (4.2813324, 0.30110223) Data Point: (7.8475997, 0.30110223) Data Point: (14.384499, 0.30110223) Data Point: (26.366509, 0.30110223) Data Point: (48.329302, 0.30110223) Data Point: (88.586679, 0.29938489) Data Point: (162.37767, 0.21986255) Data Point: (297.63514, 0.094851578) Data Point: (545.55948, 0.051777012) Data Point: (1,000, 0.040605935)
Estimation Properties Vol. WC Estimation Method: Grain Size Function Saturated Water Content: 0.3 ft³/ft³ Sample Material: Clay Liquid Limit: 0 % Diameter at 10% passing: 0.07000000000000001 Diameter at 60% passing: 0.18 Maximum: 1,000 Minimum: 0.01 Num. Points: 20
Matl. 8 Filter Sand (C33) Model: Vol WC Data Point Function Function: Vol. Water Content vs. Pore‐Water Pressure
Mv: 8e‐007 /psf Saturated Water Content: 0.30081752 ft³/ft³ Residual Water Content: 0.030081752 ft³/ft³ Curve Fit to Data: 100 % Segment Curvature: 48 %
Porosity: 0.30081752 Data Points: Matric Suction (psf), Vol. Water Content (ft³/ft³)
Data Point: (0.01, 0.30028388) Data Point: (0.018329807, 0.30028388) Data Point: (0.033598183, 0.30028388) Data Point: (0.061584821, 0.30028388) Data Point: (0.11288379, 0.30028388) Data Point: (0.20691381, 0.30028388) Data Point: (0.37926902, 0.30028388) Data Point: (0.6951928, 0.30028388)

Data Point: (1.274275, 0.30028388) Data Point: (2.3357215, 0.30028388) Data Point: (4.2813324, 0.30028388) Data Point: (7.8475997, 0.30028388) Data Point: (14.384499, 0.28112842) Data Point: (26.366509, 0.15065712) Data Point: (48.329302, 0.048430554) Data Point: (88.586679, 0.021674388) Data Point: (162.37767, 0.016081301) Data Point: (297.63514, 0.013674367) Data Point: (545.55948, 0.011770874) Data Point: (1,000, 0.010084825)
Estimation Properties Vol. WC Estimation Method: Grain Size Function Saturated Water Content: 0.3 ft³/ft³ Sample Material: Gravel Liquid Limit: 0 % Diameter at 10% passing: 0.38 Diameter at 60% passing: 1.6 Maximum: 1,000 Minimum: 0.01 Num. Points: 20
Mat. 6 Fine Drainage Gravel (No 89) Model: Vol WC Data Point Function Function: Vol. Water Content vs. Pore‐Water Pressure
Mv: 4e‐007 /psf Saturated Water Content: 0.21947752 ft³/ft³ Residual Water Content: 0.021947752 ft³/ft³ Curve Fit to Data: 100 % Segment Curvature: 48 %
Porosity: 0.21947752 Data Points: Matric Suction (psf), Vol. Water Content (ft³/ft³)
Data Point: (0.01, 0.21916427) Data Point: (0.018329807, 0.21916427) Data Point: (0.033598183, 0.21916427) Data Point: (0.061584821, 0.21916427) Data Point: (0.11288379, 0.21916427) Data Point: (0.20691381, 0.21916427) Data Point: (0.37926902, 0.21916427) Data Point: (0.6951928, 0.21916427) Data Point: (1.274275, 0.21916427) Data Point: (2.3357215, 0.21916427) Data Point: (4.2813324, 0.20182012) Data Point: (7.8475997, 0.090949254) Data Point: (14.384499, 0.021737158) Data Point: (26.366509, 0.0080845337) Data Point: (48.329302, 0.0057554944)

Data Point: (88.586679, 0.0048689464) Data Point: (162.37767, 0.0041947283) Data Point: (297.63514, 0.0036057207) Data Point: (545.55948, 0.0030872724) Data Point: (1,000, 0.002632805)
Estimation Properties Vol. WC Estimation Method: Grain Size Function Saturated Water Content: 0.21875 ft³/ft³ Sample Material: Clay Liquid Limit: 0 % Diameter at 10% passing: 3.5 Diameter at 60% passing: 7.1 Maximum: 1,000 Minimum: 0.01 Num. Points: 20
Matl. 4 Deeper Marine Deposits Model: Vol WC Data Point Function Function: Vol. Water Content vs. Pore‐Water Pressure
Mv: 2.5e‐006 /psf Saturated Water Content: 0.30154597 ft³/ft³ Residual Water Content: 0.030154597 ft³/ft³ Curve Fit to Data: 100 % Segment Curvature: 40 %
Porosity: 0.30154597 Data Points: Matric Suction (psf), Vol. Water Content (ft³/ft³)
Data Point: (0.01, 0.30100508) Data Point: (0.018329807, 0.30100508) Data Point: (0.033598183, 0.30100508) Data Point: (0.061584821, 0.30100508) Data Point: (0.11288379, 0.30100508) Data Point: (0.20691381, 0.30100508) Data Point: (0.37926902, 0.30100508) Data Point: (0.6951928, 0.30100508) Data Point: (1.274275, 0.30100508) Data Point: (2.3357215, 0.30100508) Data Point: (4.2813324, 0.30100508) Data Point: (7.8475997, 0.30100508) Data Point: (14.384499, 0.30100508) Data Point: (26.366509, 0.30100508) Data Point: (48.329302, 0.30100508) Data Point: (88.586679, 0.30100508) Data Point: (162.37767, 0.2887592) Data Point: (297.63514, 0.17412515) Data Point: (545.55948, 0.076942285) Data Point: (1,000, 0.051397358)
Estimation Properties Vol. WC Estimation Method: Grain Size Function

Saturated Water Content: 0.3 ft³/ft³ Sample Material: Clay Liquid Limit: 0 % Diameter at 10% passing: 0.06 Diameter at 60% passing: 0.11 Maximum: 1,000 Minimum: 0.01 Num. Points: 20
Matl. 5 Soil Cement Armoring Model: Vol WC Data Point Function Function: Vol. Water Content vs. Pore‐Water Pressure
Mv: 2.5e‐006 /psf Saturated Water Content: 0.30020276 ft³/ft³ Residual Water Content: 0.030020276 ft³/ft³ Curve Fit to Data: 100 % Segment Curvature: 40 %
Porosity: 0.30020276 Data Points: Matric Suction (psf), Vol. Water Content (ft³/ft³)
Data Point: (0.01, 0.29987196) Data Point: (0.018329807, 0.29987196) Data Point: (0.033598183, 0.29987196) Data Point: (0.061584821, 0.29987196) Data Point: (0.11288379, 0.29987196) Data Point: (0.20691381, 0.29987196) Data Point: (0.37926902, 0.29987196) Data Point: (0.6951928, 0.29987196) Data Point: (1.274275, 0.29987196) Data Point: (2.3357215, 0.29987196) Data Point: (4.2813324, 0.29987196) Data Point: (7.8475997, 0.29987196) Data Point: (14.384499, 0.29987196) Data Point: (26.366509, 0.29987196) Data Point: (48.329302, 0.29987196) Data Point: (88.586679, 0.29667682) Data Point: (162.37767, 0.20150036) Data Point: (297.63514, 0.085811521) Data Point: (545.55948, 0.049379583) Data Point: (1,000, 0.039446735)
Estimation Properties Vol. WC Estimation Method: Grain Size Function Saturated Water Content: 0.3 ft³/ft³ Sample Material: Clay Liquid Limit: 0 % Diameter at 10% passing: 0.07000000000000001 Diameter at 60% passing: 0.2 Maximum: 1,000 Minimum: 0.01
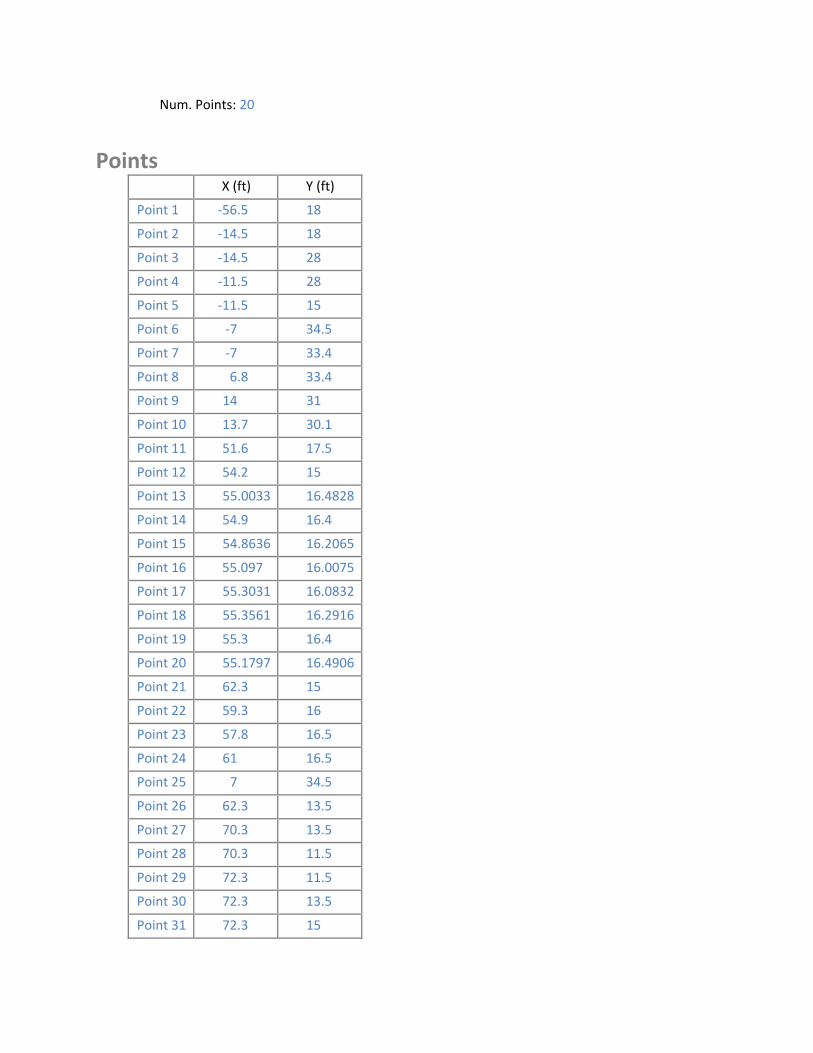
5
10
15
20
25
30
Num. Points: 20
Points X (ft) Y (ft)
Point 1 ‐56.5 18
Point 2 ‐14.5 18
Point 3 ‐14.5 28
Point 4 ‐11.5 28
Point ‐11.5 15
Point 6 ‐7 34.5
Point 7 ‐7 33.4
Point 8 6.8 33.4
Point 9 14 31
Point 13.7 30.1
Point 11 51.6 17.5
Point 12 54.2 15
Point 13 55.0033 16.4828
Point 14 54.9 16.4
Point 54.8636 16.2065
Point 16 55.097 16.0075
Point 17 55.3031 16.0832
Point 18 55.3561 16.2916
Point 19 55.3 16.4
Point 55.1797 16.4906
Point 21 62.3 15
Point 22 59.3 16
Point 23 57.8 16.5
Point 24 61 16.5
Point 7 34.5
Point 26 62.3 13.5
Point 27 70.3 13.5
Point 28 70.3 11.5
Point 29 72.3 11.5
Point 72.3 13.5
Point 31 72.3 15

32
33
34
35
36
37
38
39
40
41
42
43
44
45
46
47
48
49
50
51
52
53
54
55
56
57
58
59
60
61
62
63
64
65
66
67
Point 65.5 15
Point 62.5 16
Point ‐90.5 13.5
Point 100 15
Point 100 13.5
Point 100 ‐14.5
Point ‐90.5 ‐14.5
Point 100 ‐114.5
Point ‐90.5 ‐114.5
Point ‐180 15
Point ‐180 13.5
Point ‐180 ‐14.5
Point ‐180 ‐114.5
Point 1,600 15
Point 1,600 13.5
Point 1,600 ‐14.5
Point 1,600 ‐114.5
Point 41.5 23
Point 55.3546 16.1839
Point 54.9487 16.066
Point 55.2227 16.0254
Point ‐1,700 15
Point ‐1,700 13.5
Point ‐1,700 ‐14.5
Point ‐1,700 ‐114.5
Point ‐65.5 13.5
Point ‐55.5 13.5
Point ‐55.5 15
Point ‐55.5 16
Point ‐55.5 17
Point ‐55.5 18
Point ‐11.5 16
Point ‐12.5 16
Point ‐12.5 17
Point ‐56.5 16
Point ‐56.5 17
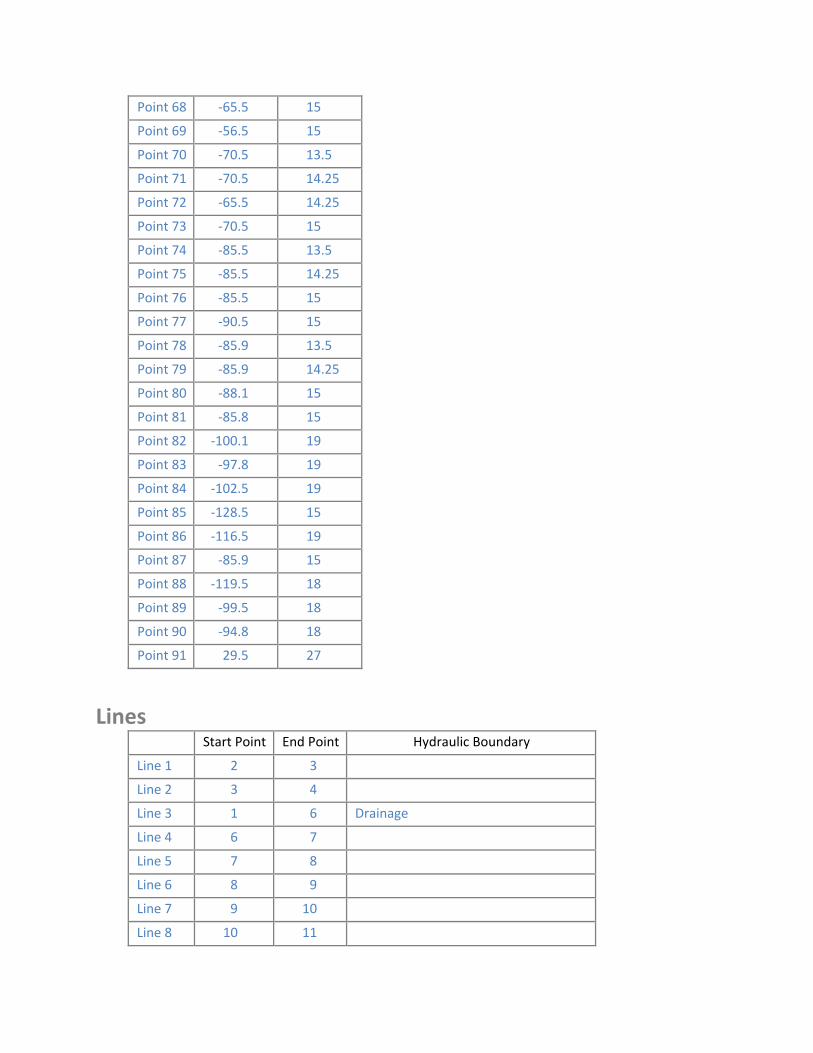
Point 68 ‐65.5 15
Point 69 ‐56.5 15
Point 70 ‐70.5 13.5
Point 71 ‐70.5 14.25
Point 72 ‐65.5 14.25
Point 73 ‐70.5 15
Point 74 ‐85.5 13.5
Point 75 ‐85.5 14.25
Point 76 ‐85.5 15
Point 77 ‐90.5 15
Point 78 ‐85.9 13.5
Point 79 ‐85.9 14.25
Point 80 ‐88.1 15
Point 81 ‐85.8 15
Point 82 ‐100.1 19
Point 83 ‐97.8 19
Point 84 ‐102.5 19
Point 85 ‐128.5 15
Point 86 ‐116.5 19
Point 87 ‐85.9 15
Point 88 ‐119.5 18
Point 89 ‐99.5 18
Point 90 ‐94.8 18
Point 91 29.5 27
Lines Start Point End Point Hydraulic Boundary
Line 1 2 3
Line 2 3 4
Line 3 1 6 Drainage
Line 4 6 7
Line 5 7 8
Line 6 8 9
Line 7 9 10
Line 8 10 11
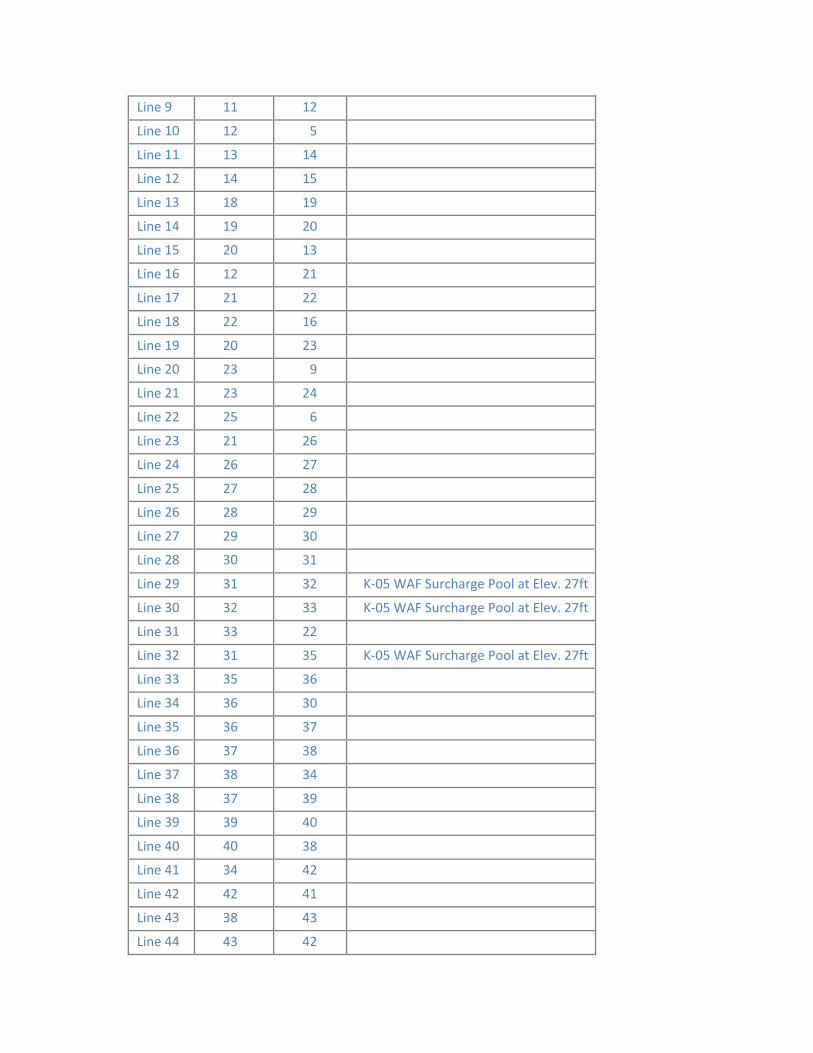
9
10
11
12
13
14
15
16
17
18
19
20
21
22
23
24
25
26
27
28
29
30
31
32
33
34
35
36
37
38
39
40
41
42
43
44
20
25
30
35
40
Line 11 12
Line 12 5
Line 13 14
Line 14 15
Line 18 19
Line 19 20
Line 13
Line 12 21
Line 21 22
Line 22 16
Line 20 23
Line 23 9
Line 23 24
Line 6
Line 21 26
Line 26 27
Line 27 28
Line 28 29
Line 29 30
Line 31
Line 31 32 K‐05 WAF Surcharge Pool at Elev. 27ft
Line 32 33 K‐05 WAF Surcharge Pool at Elev. 27ft
Line 33 22
Line 31 35 K‐05 WAF Surcharge Pool at Elev. 27ft
Line 36
Line 36 30
Line 36 37
Line 37 38
Line 38 34
Line 37 39
Line 39 40
Line 38
Line 34 42
Line 42 41
Line 38 43
Line 43 42
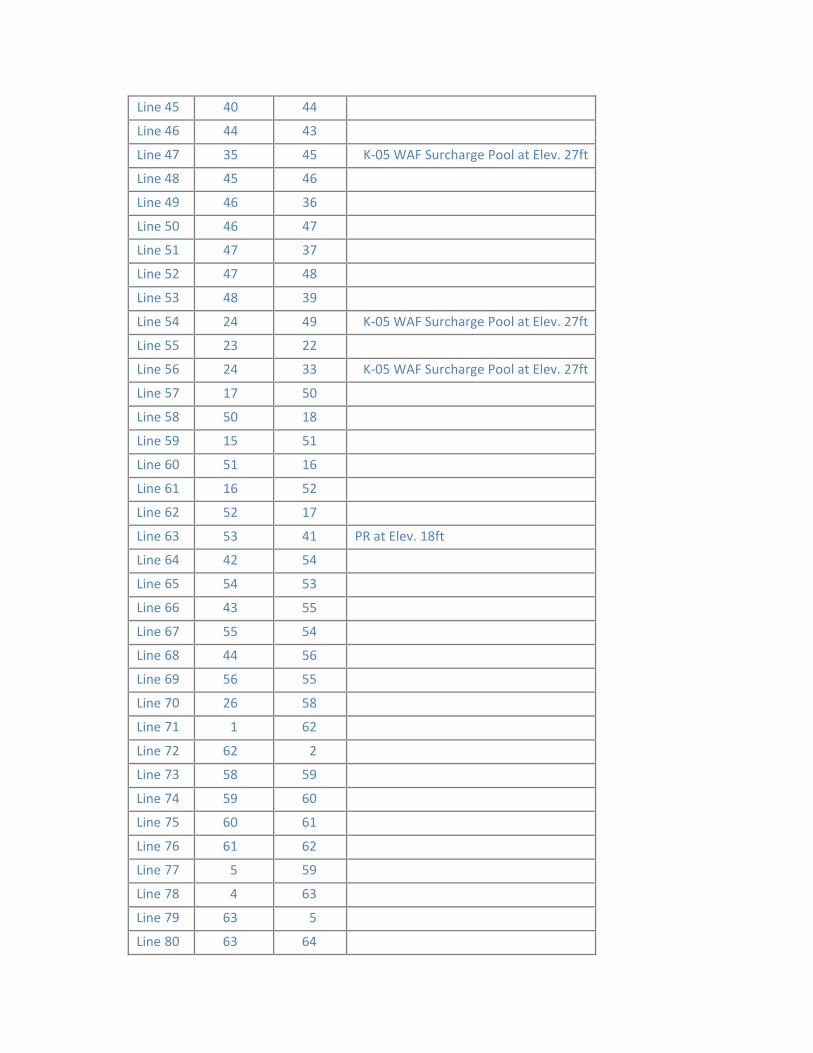
45
46
47
48
49
50
51
52
53
54
55
56
57
58
59
60
61
62
63
64
65
66
67
68
69
70
71
72
73
74
75
76
77
78
79
80
Line 40 44
Line 44 43
Line 35 45 K‐05 WAF Surcharge Pool at Elev. 27ft
Line 45 46
Line 46 36
Line 46 47
Line 47 37
Line 47 48
Line 48 39
Line 24 49 K‐05 WAF Surcharge Pool at Elev. 27ft
Line 23 22
Line 24 33 K‐05 WAF Surcharge Pool at Elev. 27ft
Line 17 50
Line 50 18
Line 15 51
Line 51 16
Line 16 52
Line 52 17
Line 53 41 PR at Elev. 18ft
Line 42 54
Line 54 53
Line 43 55
Line 55 54
Line 44 56
Line 56 55
Line 26 58
Line 1 62
Line 62 2
Line 58 59
Line 59 60
Line 60 61
Line 61 62
Line 5 59
Line 4 63
Line 63 5
Line 63 64
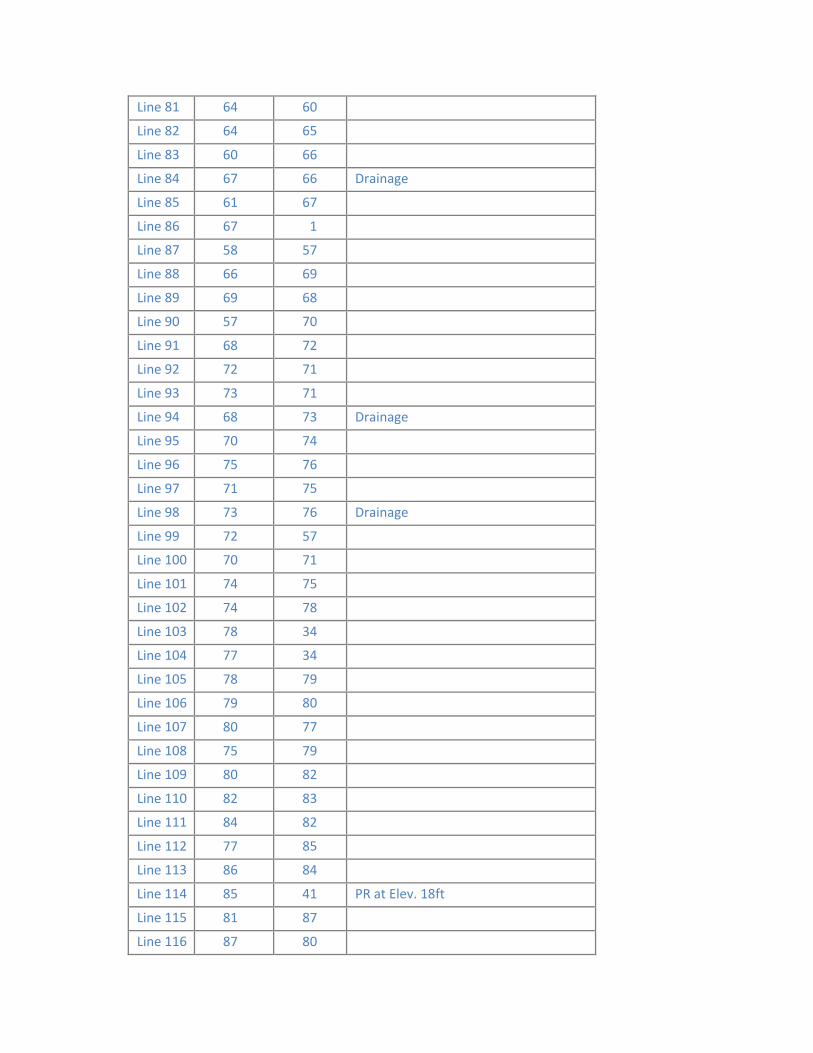
81
82
83
84
85
86
87
88
89
90
91
92
93
94
95
96
97
98
99
100
101
102
103
104
105
106
107
108
109
110
111
112
113
114
115
116
65
70
75
80
85
Line 64 60
Line 64
Line 60 66
Line 67 66 Drainage
Line 61 67
Line 67 1
Line 58 57
Line 66 69
Line 69 68
Line 57
Line 68 72
Line 72 71
Line 73 71
Line 68 73 Drainage
Line 70 74
Line 75 76
Line 71
Line 73 76 Drainage
Line 72 57
Line 70 71
Line 74 75
Line 74 78
Line 78 34
Line 77 34
Line 78 79
Line 79
Line 80 77
Line 75 79
Line 80 82
Line 82 83
Line 84 82
Line 77
Line 86 84
Line 85 41 PR at Elev. 18ft
Line 81 87
Line 87 80
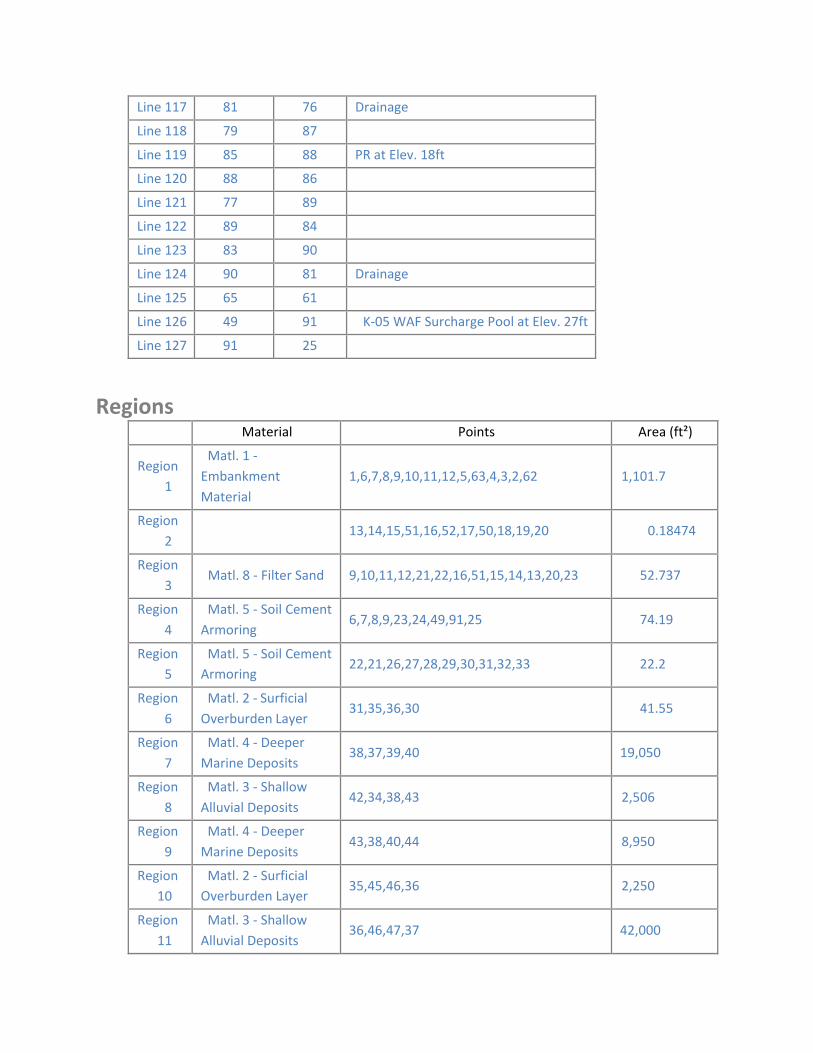
Line 117 81 76 Drainage
Line 118 79 87
Line 119 85 88 PR at Elev. 18ft
Line 120 88 86
Line 121 77 89
Line 122 89 84
Line 123 83 90
Line 124 90 81 Drainage
Line 125 65 61
Line 126 49 91 K‐05 WAF Surcharge Pool at Elev. 27ft
Line 127 91 25
Regions Material Points Area (ft²)
Region 1
Matl. 1 ‐
Embankment
Material
1,6,7,8,9,10,11,12,5,63,4,3,2,62 1,101.7
Region
2 13,14,15,51,16,52,17,50,18,19,20 0.18474
Region
3 Matl. 8 ‐ Filter Sand 9,10,11,12,21,22,16,51,15,14,13,20,23 52.737
Region
4
Matl. 5 ‐ Soil Cement
Armoring 6,7,8,9,23,24,49,91,25 74.19
Region
5 Matl. 5 ‐ Soil Cement Armoring
22,21,26,27,28,29,30,31,32,33 22.2
Region
6
Matl. 2 ‐ Surficial
Overburden Layer 31,35,36,30 41.55
Region
7
Matl. 4 ‐ Deeper
Marine Deposits 38,37,39,40 19,050
Region
8
Matl. 3 ‐ Shallow
Alluvial Deposits 42,34,38,43 2,506
Region
9
Matl. 4 ‐ Deeper
Marine Deposits 43,38,40,44 8,950
Region
10
Matl. 2 ‐ Surficial Overburden Layer
35,45,46,36 2,250
Region
11
Matl. 3 ‐ Shallow
Alluvial Deposits 36,46,47,37 42,000
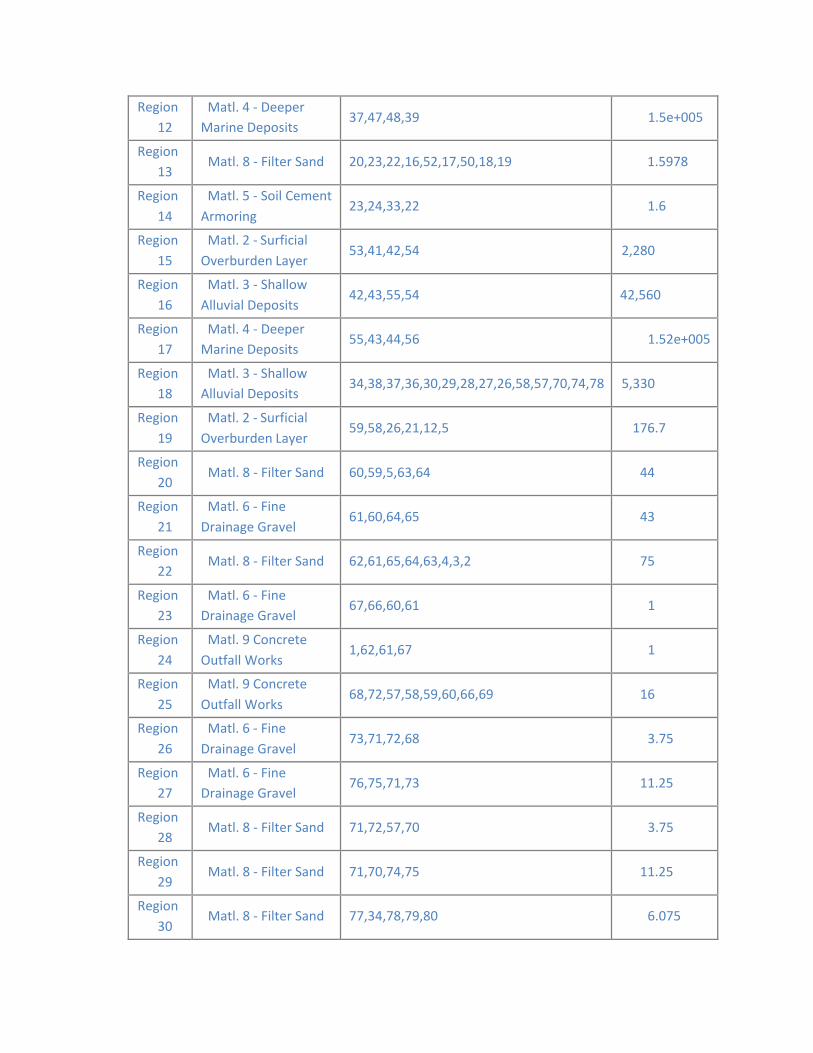
12
13
14
15
16
17
18
19
20
21
22
23
24
25
26
27
28
29
30
Region Matl. 4 ‐ Deeper Marine Deposits
37,47,48,39 1.5e+005
Region Matl. 8 ‐ Filter Sand 20,23,22,16,52,17,50,18,19 1.5978
Region Matl. 5 ‐ Soil Cement
Armoring 23,24,33,22 1.6
Region Matl. 2 ‐ Surficial
Overburden Layer 53,41,42,54 2,280
Region Matl. 3 ‐ Shallow
Alluvial Deposits 42,43,55,54 42,560
Region Matl. 4 ‐ Deeper Marine Deposits
55,43,44,56 1.52e+005
Region Matl. 3 ‐ Shallow Alluvial Deposits
34,38,37,36,30,29,28,27,26,58,57,70,74,78 5,330
Region Matl. 2 ‐ Surficial
Overburden Layer 59,58,26,21,12,5 176.7
Region Matl. 8 ‐ Filter Sand 60,59,5,63,64 44
Region Matl. 6 ‐ Fine
Drainage Gravel 61,60,64,65 43
Region Matl. 8 ‐ Filter Sand 62,61,65,64,63,4,3,2 75
Region Matl. 6 ‐ Fine Drainage Gravel
67,66,60,61 1
Region Matl. 9 Concrete
Outfall Works 1,62,61,67 1
Region Matl. 9 Concrete
Outfall Works 68,72,57,58,59,60,66,69 16
Region Matl. 6 ‐ Fine
Drainage Gravel 73,71,72,68 3.75
Region Matl. 6 ‐ Fine Drainage Gravel
76,75,71,73 11.25
Region Matl. 8 ‐ Filter Sand 71,72,57,70 3.75
Region Matl. 8 ‐ Filter Sand 71,70,74,75 11.25
Region Matl. 8 ‐ Filter Sand 77,34,78,79,80 6.075

31
32
33
34
35
36
37
Region Matl. 8 ‐ Filter Sand 79,78,74,75 0.3
Region Matl. 6 ‐ Fine Drainage Gravel
80,82,83,90,81,87 9.2
Region Matl. 8 ‐ Filter Sand 80,77,89,84,82 9.6
Region Matl. 1 ‐
Embankment
Material
77,85,88,86,84,89 104
Region Matl. 2 ‐ Surficial
Overburden Layer 41,42,34,77,85 134.25
Region Matl. 6 ‐ Fine
Drainage Gravel 87,81,76,75,79 0.3
Region Matl. 6 ‐ Fine
Drainage Gravel 80,87,79 0.825
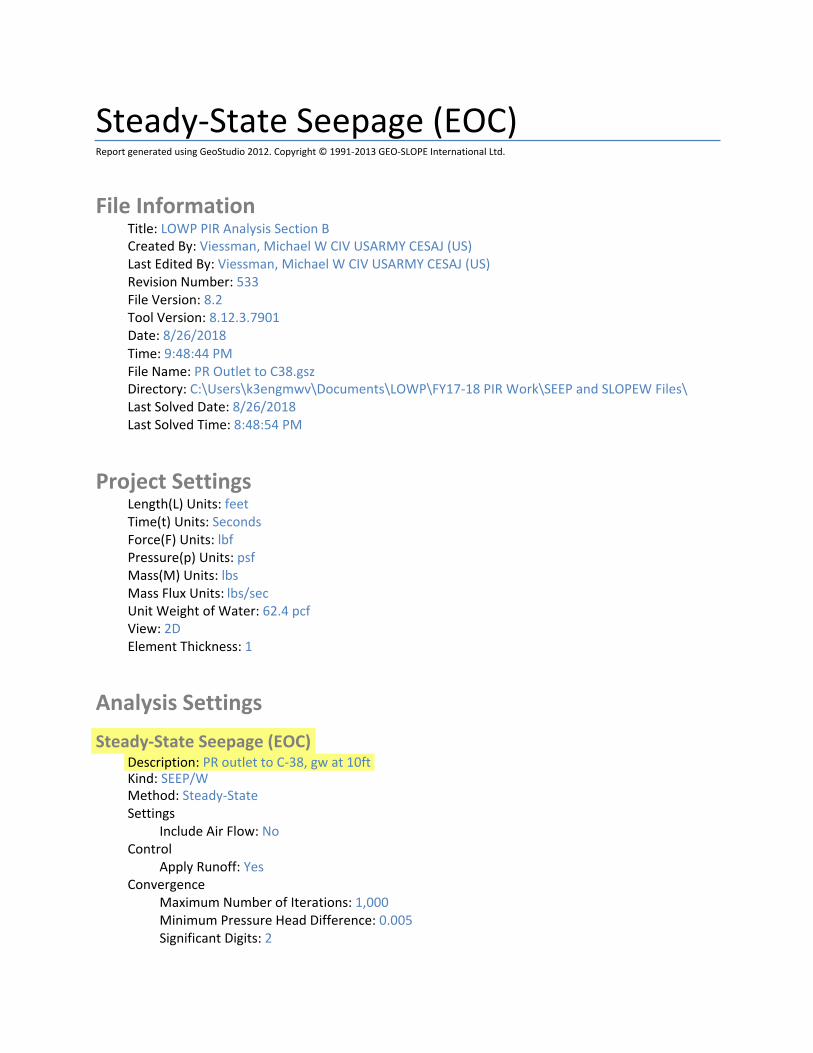
Steady‐State Seepage (EOC) Report generated using GeoStudio 2012. Copyright © 1991‐2013 GEO‐SLOPE International Ltd.
File Information Title: LOWP PIR Analysis Section B Created By: Viessman, Michael W CIV USARMY CESAJ (US) Last Edited By: Viessman, Michael W CIV USARMY CESAJ (US) Revision Number: 533 File Version: 8.2 Tool Version: 8.12.3.7901 Date: 8/26/2018 Time: 9:48:44 PM File Name: PR Outlet to C38.gsz Directory: C:\Users\k3engmwv\Documents\LOWP\FY17‐18 PIR Work\SEEP and SLOPEW Files\ Last Solved Date: 8/26/2018 Last Solved Time: 8:48:54 PM
Project Settings Length(L) Units: feet Time(t) Units: Seconds Force(F) Units: lbf Pressure(p) Units: psf Mass(M) Units: lbs Mass Flux Units: lbs/sec Unit Weight of Water: 62.4 pcf View: 2D Element Thickness: 1
Analysis Settings
Steady‐State Seepage (EOC) Description: PR outlet to C‐38, gw at 10ft Kind: SEEP/W Method: Steady‐State Settings
Include Air Flow: No Control
Apply Runoff: Yes Convergence
Maximum Number of Iterations: 1,000 Minimum Pressure Head Difference: 0.005 Significant Digits: 2
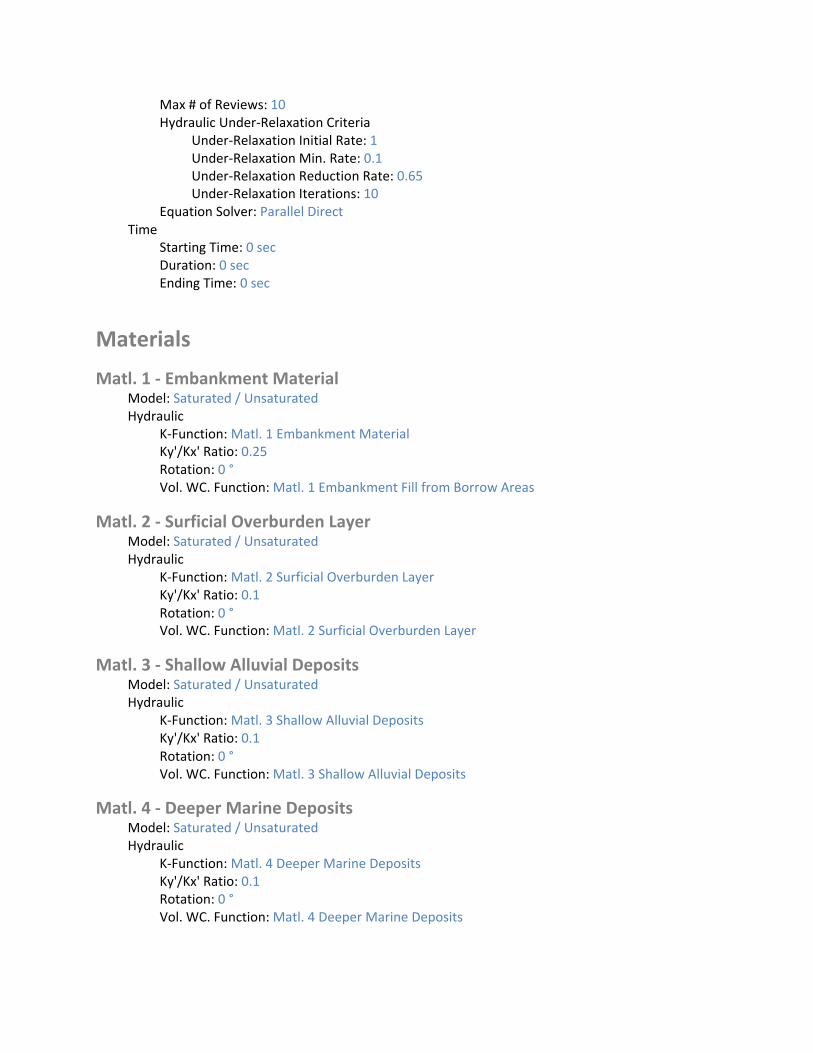
Max # of Reviews: 10 Hydraulic Under‐Relaxation Criteria
Under‐Relaxation Initial Rate: 1 Under‐Relaxation Min. Rate: 0.1 Under‐Relaxation Reduction Rate: 0.65 Under‐Relaxation Iterations: 10
Equation Solver: Parallel Direct Time
Starting Time: 0 sec Duration: 0 sec Ending Time: 0 sec
Materials
Matl. 1 ‐ Embankment Material Model: Saturated / Unsaturated Hydraulic
K‐Function: Matl. 1 Embankment Material Ky'/Kx' Ratio: 0.25 Rotation: 0 ° Vol. WC. Function: Matl. 1 Embankment Fill from Borrow Areas
Matl. 2 ‐ Surficial Overburden Layer Model: Saturated / Unsaturated Hydraulic
K‐Function: Matl. 2 Surficial Overburden Layer Ky'/Kx' Ratio: 0.1 Rotation: 0 ° Vol. WC. Function: Matl. 2 Surficial Overburden Layer
Matl. 3 ‐ Shallow Alluvial Deposits Model: Saturated / Unsaturated Hydraulic
K‐Function: Matl. 3 Shallow Alluvial Deposits Ky'/Kx' Ratio: 0.1 Rotation: 0 ° Vol. WC. Function: Matl. 3 Shallow Alluvial Deposits
Matl. 4 ‐ Deeper Marine Deposits Model: Saturated / Unsaturated Hydraulic
K‐Function: Matl. 4 Deeper Marine Deposits Ky'/Kx' Ratio: 0.1 Rotation: 0 ° Vol. WC. Function: Matl. 4 Deeper Marine Deposits
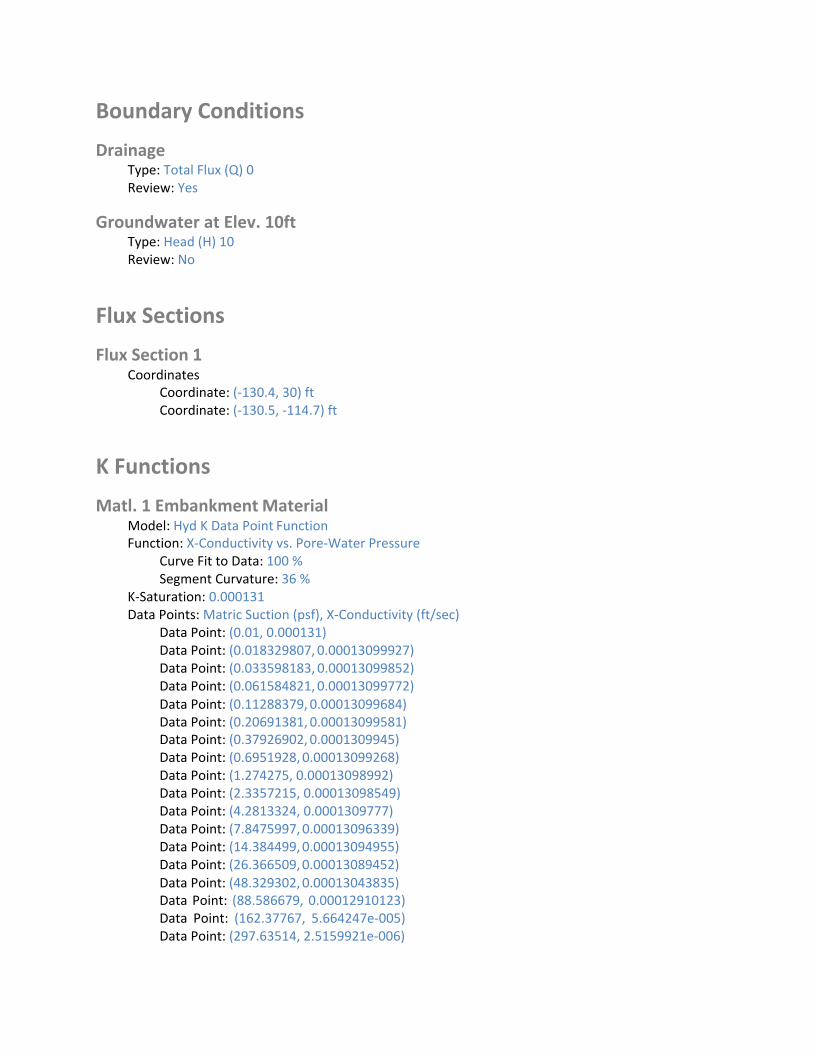
Boundary Conditions
Drainage Type: Total Flux (Q) 0 Review: Yes
Groundwater at Elev. 10ft Type: Head (H) 10 Review: No
Flux Sections
Flux Section 1 Coordinates
Coordinate: (‐130.4, 30) ft Coordinate: (‐130.5, ‐114.7) ft
K Functions
Matl. 1 Embankment Material Model: Hyd K Data Point Function Function: X‐Conductivity vs. Pore‐Water Pressure
Curve Fit to Data: 100 % Segment Curvature: 36 %
K‐Saturation: 0.000131 Data Points: Matric Suction (psf), X‐Conductivity (ft/sec)
Data Point: (0.01, 0.000131) Data Point: (0.018329807, 0.00013099927) Data Point: (0.033598183, 0.00013099852) Data Point: (0.061584821, 0.00013099772) Data Point: (0.11288379, 0.00013099684) Data Point: (0.20691381, 0.00013099581) Data Point: (0.37926902, 0.0001309945) Data Point: (0.6951928,0.00013099268) Data Point: (1.274275, 0.00013098992) Data Point: (2.3357215, 0.00013098549) Data Point: (4.2813324, 0.0001309777) Data Point: (7.8475997,0.00013096339) Data Point: (14.384499,0.00013094955) Data Point: (26.366509,0.00013089452) Data Point: (48.329302,0.00013043835) Data Point: (88.586679, 0.00012910123) Data Point: (162.37767, 5.664247e‐005) Data Point: (297.63514, 2.5159921e‐006)
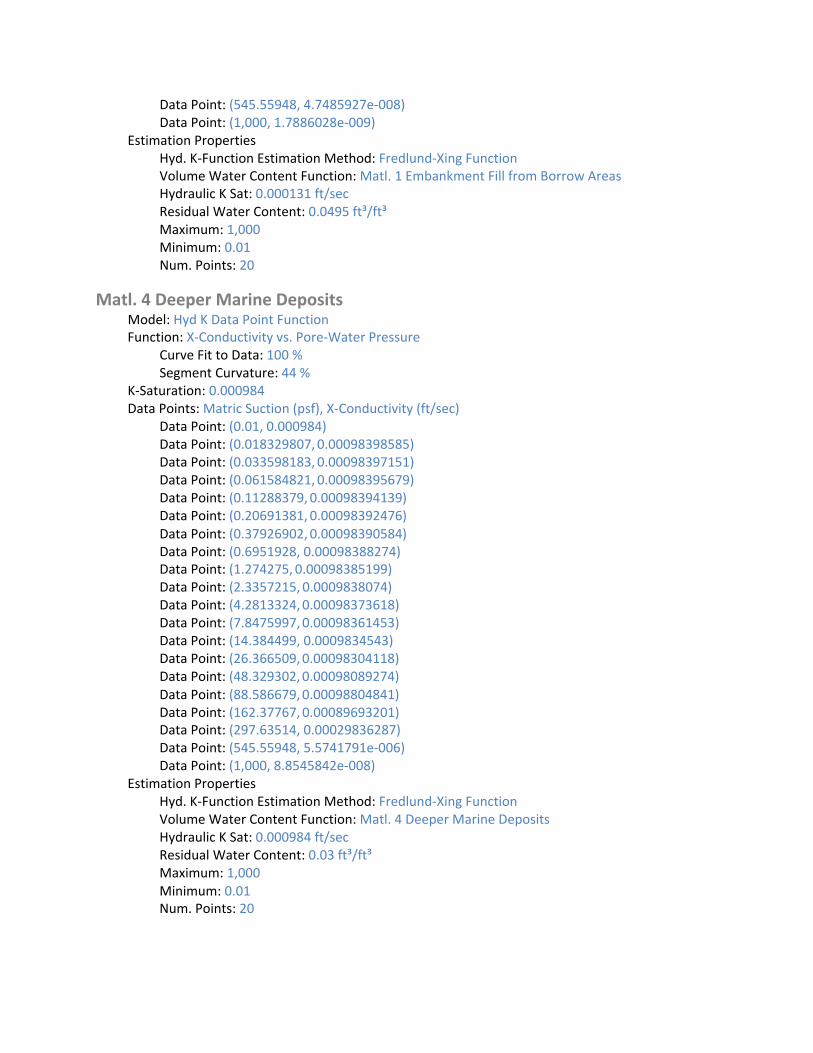
Data Point: (545.55948, 4.7485927e‐008) Data Point: (1,000, 1.7886028e‐009)
Estimation Properties Hyd. K‐Function Estimation Method: Fredlund‐Xing Function Volume Water Content Function: Matl. 1 Embankment Fill from Borrow Areas Hydraulic K Sat: 0.000131 ft/sec Residual Water Content: 0.0495 ft³/ft³ Maximum: 1,000 Minimum: 0.01 Num. Points: 20
Matl. 4 Deeper Marine Deposits Model: Hyd K Data Point Function Function: X‐Conductivity vs. Pore‐Water Pressure
Curve Fit to Data: 100 % Segment Curvature: 44 %
K‐Saturation: 0.000984 Data Points: Matric Suction (psf), X‐Conductivity (ft/sec)
Data Point: (0.01, 0.000984) Data Point: (0.018329807, 0.00098398585) Data Point: (0.033598183, 0.00098397151) Data Point: (0.061584821, 0.00098395679) Data Point: (0.11288379, 0.00098394139) Data Point: (0.20691381, 0.00098392476) Data Point: (0.37926902, 0.00098390584) Data Point: (0.6951928, 0.00098388274) Data Point: (1.274275, 0.00098385199) Data Point: (2.3357215, 0.0009838074) Data Point: (4.2813324,0.00098373618) Data Point: (7.8475997,0.00098361453) Data Point: (14.384499, 0.0009834543) Data Point: (26.366509,0.00098304118) Data Point: (48.329302,0.00098089274) Data Point: (88.586679,0.00098804841) Data Point: (162.37767,0.00089693201) Data Point: (297.63514, 0.00029836287) Data Point: (545.55948, 5.5741791e‐006) Data Point: (1,000, 8.8545842e‐008)
Estimation Properties Hyd. K‐Function Estimation Method: Fredlund‐Xing Function Volume Water Content Function: Matl. 4 Deeper Marine Deposits Hydraulic K Sat: 0.000984 ft/sec Residual Water Content: 0.03 ft³/ft³ Maximum: 1,000 Minimum: 0.01 Num. Points: 20

Matl. 2 Surficial Overburden Layer Model: Hyd K Data Point Function Function: X‐Conductivity vs. Pore‐Water Pressure
Curve Fit to Data: 100 % Segment Curvature: 36 %
K‐Saturation: 0.00026 Data Points: Matric Suction (psf), X‐Conductivity (ft/sec)
Data Point: (0.01, 0.00026) Data Point: (0.018329807, 0.00025999835) Data Point: (0.033598183, 0.00025999664) Data Point: (0.061584821, 0.00025999485) Data Point: (0.11288379, 0.00025999288) Data Point: (0.20691381, 0.00025999062) Data Point: (0.37926902, 0.00025998779) Data Point: (0.6951928, 0.00025998393) Data Point: (1.274275, 0.00025997819) Data Point: (2.3357215,0.00025996907) Data Point: (4.2813324,0.00025995329) Data Point: (7.8475997,0.00025992467) Data Point: (14.384499,0.00025989276) Data Point: (26.366509,0.00025978642) Data Point: (48.329302,0.00025903344) Data Point: (88.586679, 0.0002586222) Data Point: (162.37767, 0.00013432217) Data Point: (297.63514, 8.1547435e‐006) Data Point: (545.55948, 1.3663567e‐007) Data Point: (1,000, 4.5608744e‐009)
Estimation Properties Hyd. K‐Function Estimation Method: Fredlund‐Xing Function Volume Water Content Function: Matl. 2 Surficial Overburden Layer Hydraulic K Sat: 0.00026 ft/sec Residual Water Content: 0.0495 ft³/ft³ Maximum: 1,000 Minimum: 0.01 Num. Points: 20
Matl. 3 Shallow Alluvial Deposits Model: Hyd K Data Point Function Function: X‐Conductivity vs. Pore‐Water Pressure
Curve Fit to Data: 100 % Segment Curvature: 36 %
K‐Saturation: 0.00174 Data Points: Matric Suction (psf), X‐Conductivity (ft/sec)
Data Point: (0.01, 0.00174) Data Point: (0.018329807, 0.0017399903) Data Point: (0.033598183, 0.0017399803) Data Point: (0.061584821, 0.0017399698)
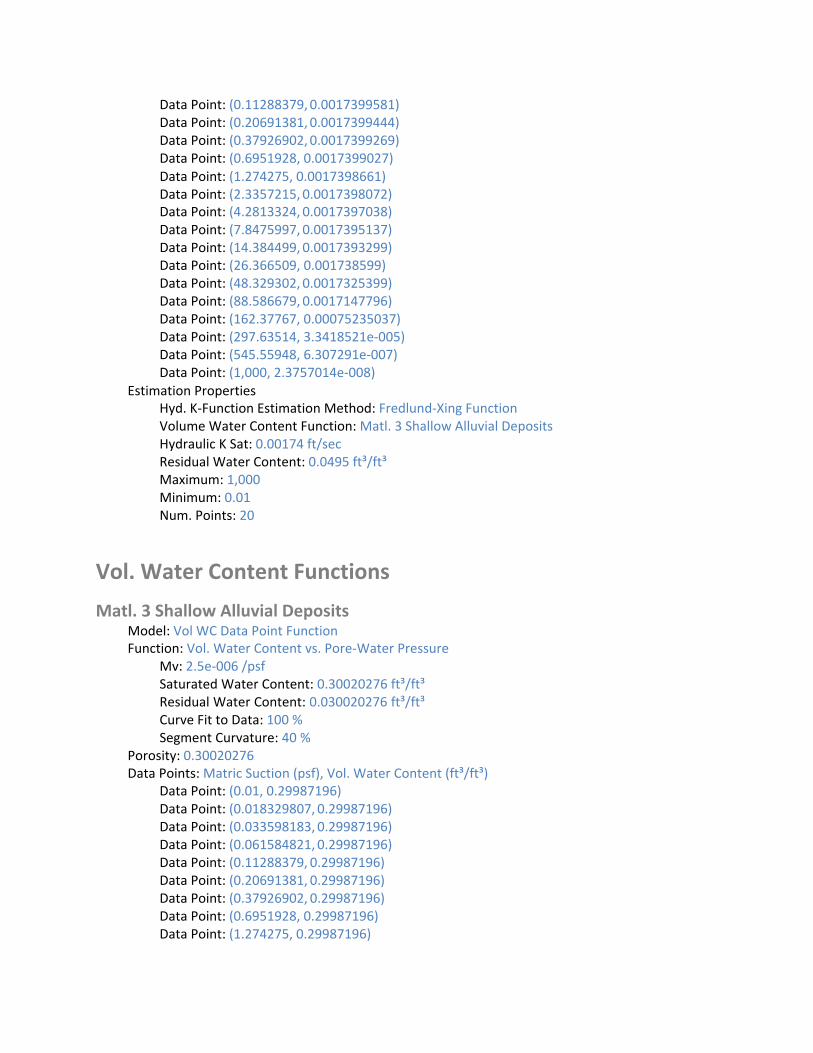
Data Point: (0.11288379,0.0017399581) Data Point: (0.20691381,0.0017399444) Data Point: (0.37926902,0.0017399269) Data Point: (0.6951928, 0.0017399027) Data Point: (1.274275, 0.0017398661) Data Point: (2.3357215, 0.0017398072) Data Point: (4.2813324, 0.0017397038) Data Point: (7.8475997, 0.0017395137) Data Point: (14.384499, 0.0017393299) Data Point: (26.366509, 0.001738599) Data Point: (48.329302, 0.0017325399) Data Point: (88.586679, 0.0017147796) Data Point: (162.37767, 0.00075235037) Data Point: (297.63514, 3.3418521e‐005) Data Point: (545.55948, 6.307291e‐007) Data Point: (1,000, 2.3757014e‐008)
Estimation Properties Hyd. K‐Function Estimation Method: Fredlund‐Xing Function Volume Water Content Function: Matl. 3 Shallow Alluvial Deposits Hydraulic K Sat: 0.00174 ft/sec Residual Water Content: 0.0495 ft³/ft³ Maximum: 1,000 Minimum: 0.01 Num. Points: 20
Vol. Water Content Functions
Matl. 3 Shallow Alluvial Deposits Model: Vol WC Data Point Function Function: Vol. Water Content vs. Pore‐Water Pressure
Mv: 2.5e‐006 /psf Saturated Water Content: 0.30020276 ft³/ft³ Residual Water Content: 0.030020276 ft³/ft³ Curve Fit to Data: 100 % Segment Curvature: 40 %
Porosity: 0.30020276 Data Points: Matric Suction (psf), Vol. Water Content (ft³/ft³)
Data Point: (0.01, 0.29987196) Data Point: (0.018329807, 0.29987196) Data Point: (0.033598183, 0.29987196) Data Point: (0.061584821, 0.29987196) Data Point: (0.11288379, 0.29987196) Data Point: (0.20691381, 0.29987196) Data Point: (0.37926902, 0.29987196) Data Point: (0.6951928, 0.29987196) Data Point: (1.274275, 0.29987196)
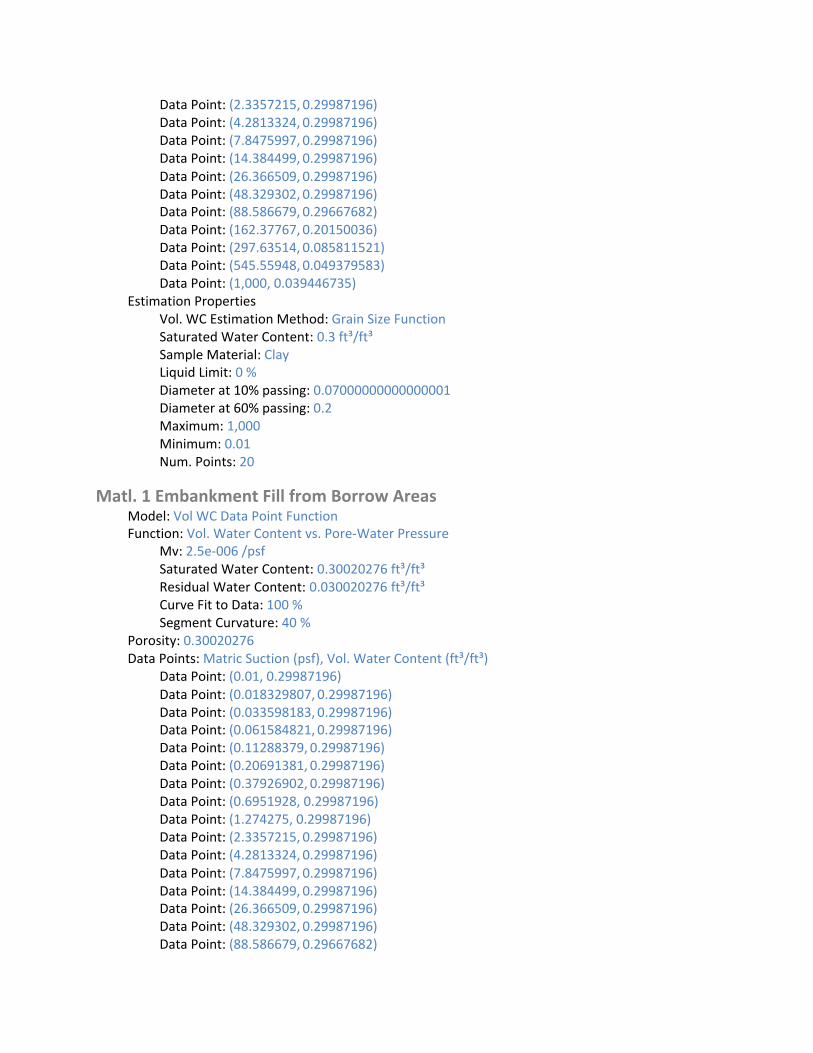
Data Point: (2.3357215, 0.29987196) Data Point: (4.2813324, 0.29987196) Data Point: (7.8475997, 0.29987196) Data Point: (14.384499, 0.29987196) Data Point: (26.366509, 0.29987196) Data Point: (48.329302, 0.29987196) Data Point: (88.586679, 0.29667682) Data Point: (162.37767, 0.20150036) Data Point: (297.63514, 0.085811521) Data Point: (545.55948, 0.049379583) Data Point: (1,000, 0.039446735)
Estimation Properties Vol. WC Estimation Method: Grain Size Function Saturated Water Content: 0.3 ft³/ft³ Sample Material: Clay Liquid Limit: 0 % Diameter at 10% passing: 0.07000000000000001 Diameter at 60% passing: 0.2 Maximum: 1,000 Minimum: 0.01 Num. Points: 20
Matl. 1 Embankment Fill from Borrow Areas Model: Vol WC Data Point Function Function: Vol. Water Content vs. Pore‐Water Pressure
Mv: 2.5e‐006 /psf Saturated Water Content: 0.30020276 ft³/ft³ Residual Water Content: 0.030020276 ft³/ft³ Curve Fit to Data: 100 % Segment Curvature: 40 %
Porosity: 0.30020276 Data Points: Matric Suction (psf), Vol. Water Content (ft³/ft³)
Data Point: (0.01, 0.29987196) Data Point: (0.018329807, 0.29987196) Data Point: (0.033598183, 0.29987196) Data Point: (0.061584821, 0.29987196) Data Point: (0.11288379, 0.29987196) Data Point: (0.20691381, 0.29987196) Data Point: (0.37926902, 0.29987196) Data Point: (0.6951928, 0.29987196) Data Point: (1.274275, 0.29987196) Data Point: (2.3357215, 0.29987196) Data Point: (4.2813324, 0.29987196) Data Point: (7.8475997, 0.29987196) Data Point: (14.384499, 0.29987196) Data Point: (26.366509, 0.29987196) Data Point: (48.329302, 0.29987196) Data Point: (88.586679, 0.29667682)
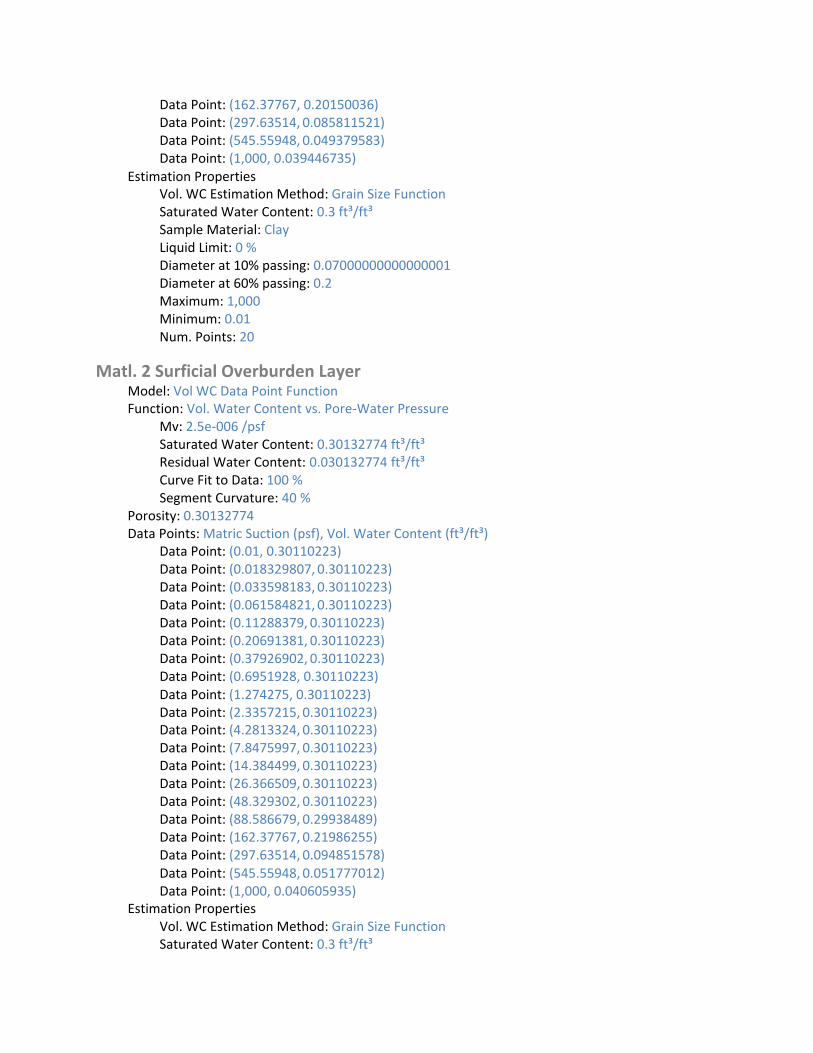
Data Point: (162.37767, 0.20150036) Data Point: (297.63514, 0.085811521) Data Point: (545.55948, 0.049379583) Data Point: (1,000, 0.039446735)
Estimation Properties Vol. WC Estimation Method: Grain Size Function Saturated Water Content: 0.3 ft³/ft³ Sample Material: Clay Liquid Limit: 0 % Diameter at 10% passing: 0.07000000000000001 Diameter at 60% passing: 0.2 Maximum: 1,000 Minimum: 0.01 Num. Points: 20
Matl. 2 Surficial Overburden Layer Model: Vol WC Data Point Function Function: Vol. Water Content vs. Pore‐Water Pressure
Mv: 2.5e‐006 /psf Saturated Water Content: 0.30132774 ft³/ft³ Residual Water Content: 0.030132774 ft³/ft³ Curve Fit to Data: 100 % Segment Curvature: 40 %
Porosity: 0.30132774 Data Points: Matric Suction (psf), Vol. Water Content (ft³/ft³)
Data Point: (0.01, 0.30110223) Data Point: (0.018329807, 0.30110223) Data Point: (0.033598183, 0.30110223) Data Point: (0.061584821, 0.30110223) Data Point: (0.11288379, 0.30110223) Data Point: (0.20691381, 0.30110223) Data Point: (0.37926902, 0.30110223) Data Point: (0.6951928, 0.30110223) Data Point: (1.274275, 0.30110223) Data Point: (2.3357215, 0.30110223) Data Point: (4.2813324, 0.30110223) Data Point: (7.8475997, 0.30110223) Data Point: (14.384499, 0.30110223) Data Point: (26.366509, 0.30110223) Data Point: (48.329302, 0.30110223) Data Point: (88.586679, 0.29938489) Data Point: (162.37767, 0.21986255) Data Point: (297.63514, 0.094851578) Data Point: (545.55948, 0.051777012) Data Point: (1,000, 0.040605935)
Estimation Properties Vol. WC Estimation Method: Grain Size Function Saturated Water Content: 0.3 ft³/ft³
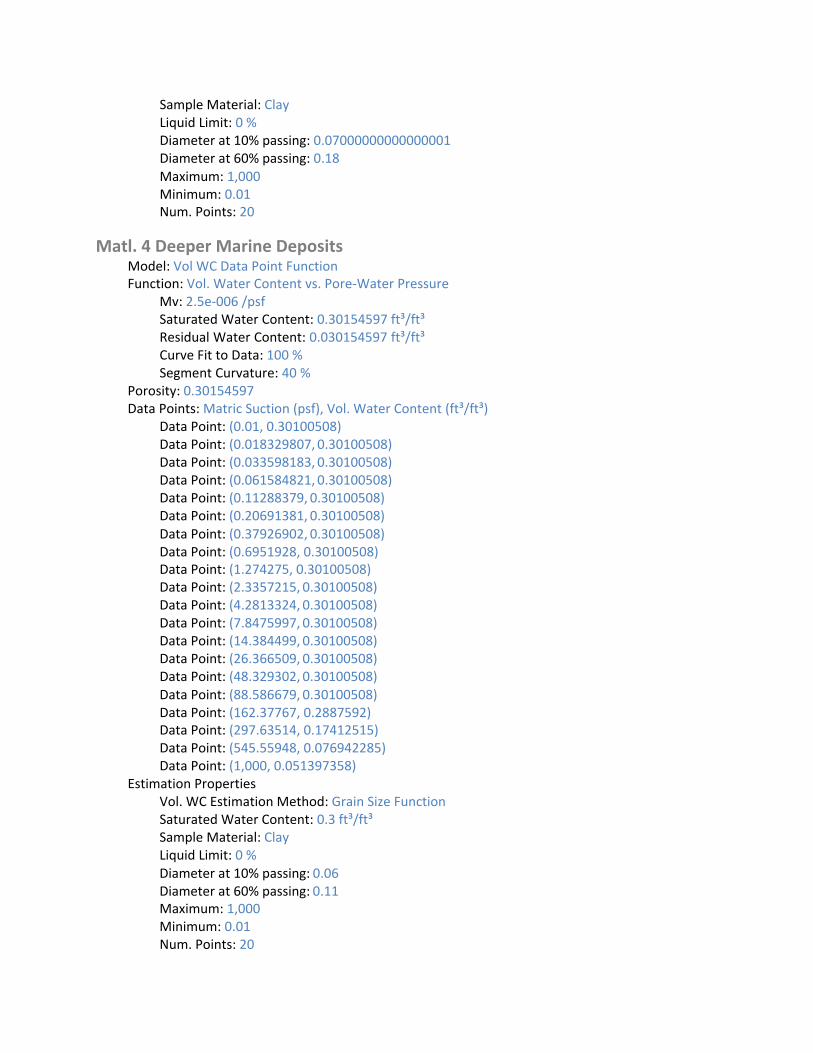
Sample Material: Clay Liquid Limit: 0 % Diameter at 10% passing: 0.07000000000000001 Diameter at 60% passing: 0.18 Maximum: 1,000 Minimum: 0.01 Num. Points: 20
Matl. 4 Deeper Marine Deposits Model: Vol WC Data Point Function Function: Vol. Water Content vs. Pore‐Water Pressure
Mv: 2.5e‐006 /psf Saturated Water Content: 0.30154597 ft³/ft³ Residual Water Content: 0.030154597 ft³/ft³ Curve Fit to Data: 100 % Segment Curvature: 40 %
Porosity: 0.30154597 Data Points: Matric Suction (psf), Vol. Water Content (ft³/ft³)
Data Point: (0.01, 0.30100508) Data Point: (0.018329807, 0.30100508) Data Point: (0.033598183, 0.30100508) Data Point: (0.061584821, 0.30100508) Data Point: (0.11288379, 0.30100508) Data Point: (0.20691381, 0.30100508) Data Point: (0.37926902, 0.30100508) Data Point: (0.6951928, 0.30100508) Data Point: (1.274275, 0.30100508) Data Point: (2.3357215, 0.30100508) Data Point: (4.2813324, 0.30100508) Data Point: (7.8475997, 0.30100508) Data Point: (14.384499, 0.30100508) Data Point: (26.366509, 0.30100508) Data Point: (48.329302, 0.30100508) Data Point: (88.586679, 0.30100508) Data Point: (162.37767, 0.2887592) Data Point: (297.63514, 0.17412515) Data Point: (545.55948, 0.076942285) Data Point: (1,000, 0.051397358)
Estimation Properties Vol. WC Estimation Method: Grain Size Function Saturated Water Content: 0.3 ft³/ft³ Sample Material: Clay Liquid Limit: 0 % Diameter at 10% passing: 0.06 Diameter at 60% passing: 0.11 Maximum: 1,000 Minimum: 0.01 Num. Points: 20
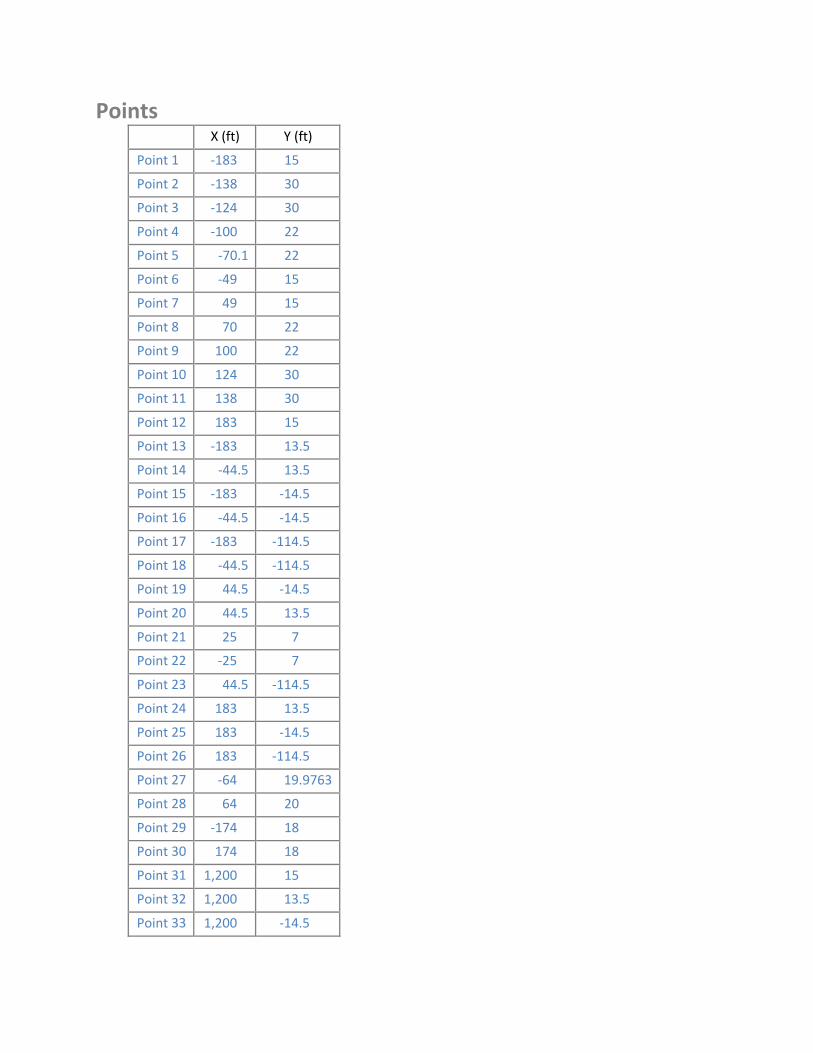
1
2
3
4
5
6
7
8
9
10
11
12
13
14
15
16
17
18
19
20
21
22
23
24
25
26
27
28
29
30
31
32
33
Points X (ft) Y (ft)
Point ‐183 15
Point ‐138 30
Point ‐124 30
Point ‐100 22
Point ‐70.1 22
Point ‐49 15
Point 49 15
Point 70 22
Point 100 22
Point 124 30
Point 138 30
Point 183 15
Point ‐183 13.5
Point ‐44.5 13.5
Point ‐183 ‐14.5
Point ‐44.5 ‐14.5
Point ‐183 ‐114.5
Point ‐44.5 ‐114.5
Point 44.5 ‐14.5
Point 44.5 13.5
Point 25 7
Point ‐25 7
Point 44.5 ‐114.5
Point 183 13.5
Point 183 ‐14.5
Point 183 ‐114.5
Point ‐64 19.9763
Point 64 20
Point ‐174 18
Point 174 18
Point 1,200 15
Point 1,200 13.5
Point 1,200 ‐14.5
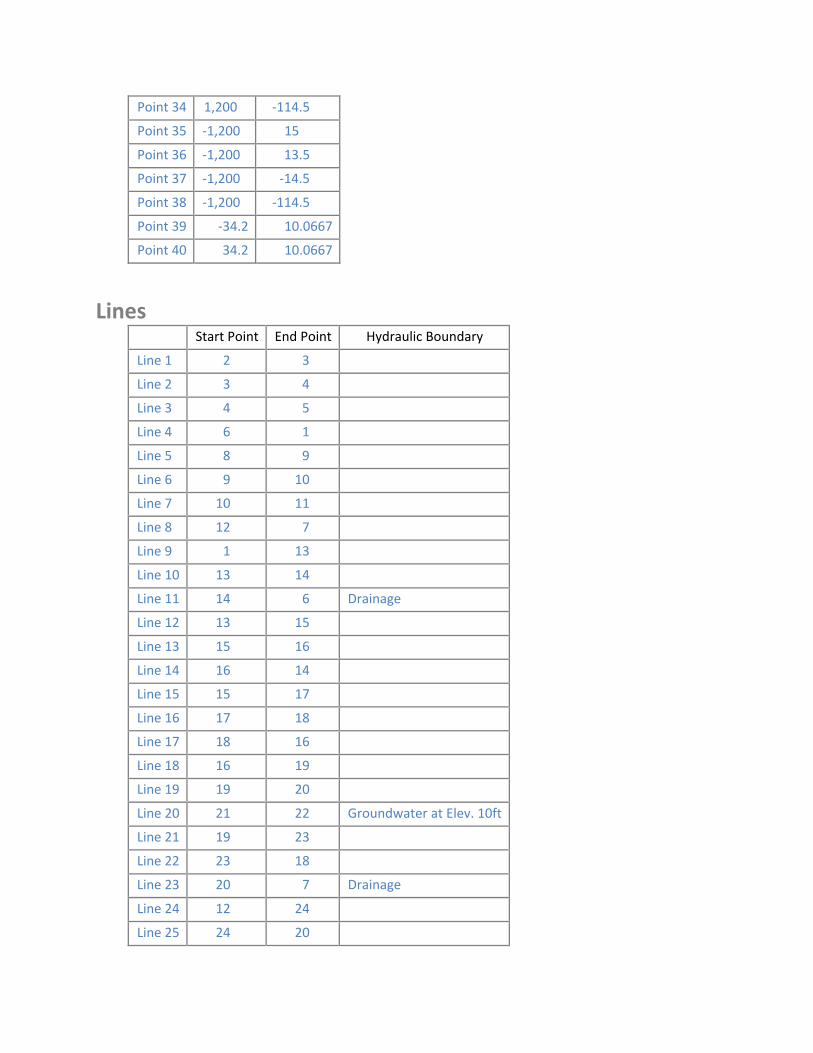
Point 34 1,200 ‐114.5
Point 35 ‐1,200 15
Point 36 ‐1,200 13.5
Point 37 ‐1,200 ‐14.5
Point 38 ‐1,200 ‐114.5
Point 39 ‐34.2 10.0667
Point 40 34.2 10.0667
Lines Start Point End Point Hydraulic Boundary
Line 1 2 3
Line 2 3 4
Line 3 4 5
Line 4 6 1
Line 5 8 9
Line 6 9 10
Line 7 10 11
Line 8 12 7
Line 9 1 13
Line 10 13 14
Line 11 14 6 Drainage
Line 12 13 15
Line 13 15 16
Line 14 16 14
Line 15 15 17
Line 16 17 18
Line 17 18 16
Line 18 16 19
Line 19 19 20
Line 20 21 22 Groundwater at Elev. 10ft
Line 21 19 23
Line 22 23 18
Line 23 20 7 Drainage
Line 24 12 24
Line 25 24 20
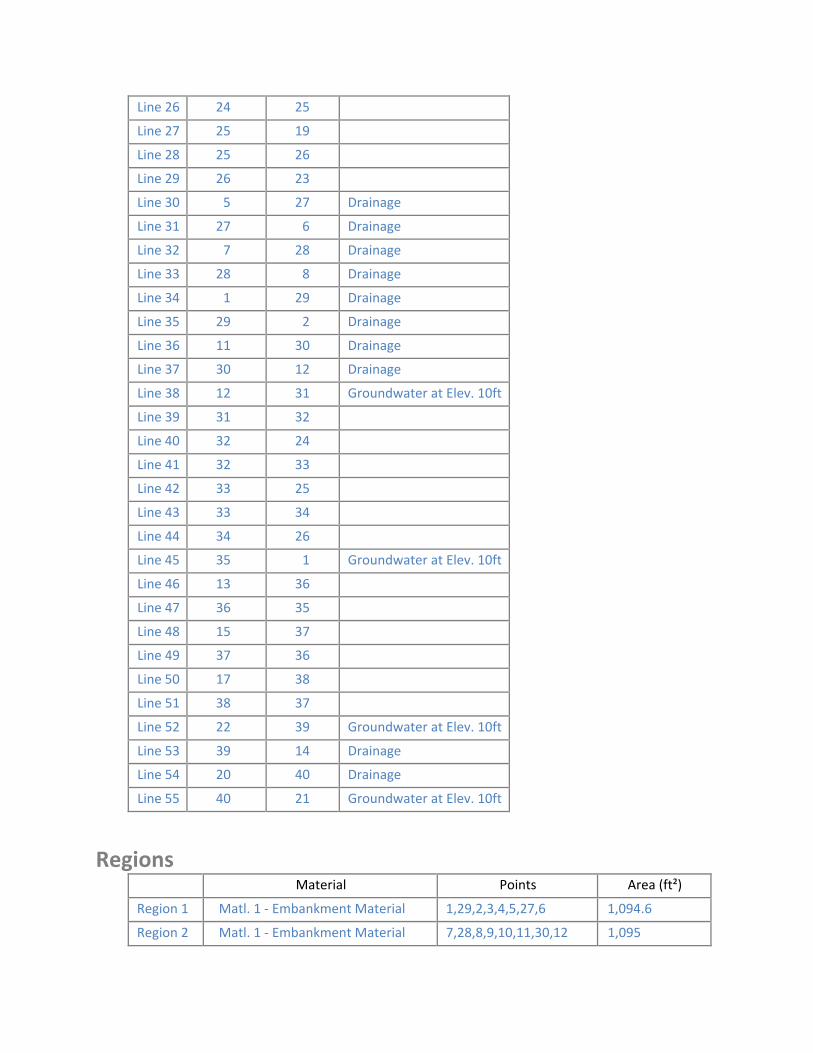
30
35
40
45
50
55
Line 26 24 25
Line 27 25 19
Line 28 25 26
Line 29 26 23
Line 5 27 Drainage
Line 31 27 6 Drainage
Line 32 7 28 Drainage
Line 33 28 8 Drainage
Line 34 1 29 Drainage
Line 29 2 Drainage
Line 36 11 30 Drainage
Line 37 30 12 Drainage
Line 38 12 31 Groundwater at Elev. 10ft
Line 39 31 32
Line 32 24
Line 41 32 33
Line 42 33 25
Line 43 33 34
Line 44 34 26
Line 35 1 Groundwater at Elev. 10ft
Line 46 13 36
Line 47 36 35
Line 48 15 37
Line 49 37 36
Line 17 38
Line 51 38 37
Line 52 22 39 Groundwater at Elev. 10ft
Line 53 39 14 Drainage
Line 54 20 40 Drainage
Line 40 21 Groundwater at Elev. 10ft
Regions Material Points Area (ft²)
Region 1 Matl. 1 ‐ Embankment Material 1,29,2,3,4,5,27,6 1,094.6
Region 2 Matl. 1 ‐ Embankment Material 7,28,8,9,10,11,30,12 1,095
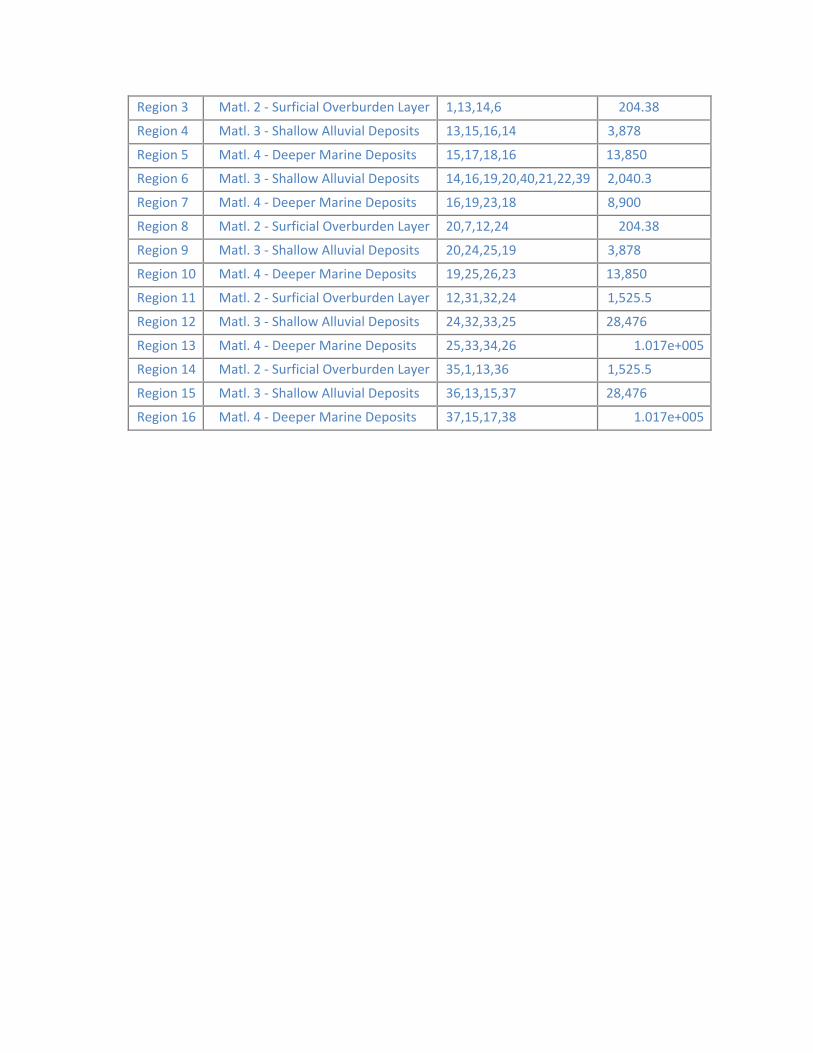
3
4
5
6
7
8
9
10
11
12
13
14
15
16
Region Matl. 2 ‐ Surficial Overburden Layer 1,13,14,6 204.38
Region Matl. 3 ‐ Shallow Alluvial Deposits 13,15,16,14 3,878
Region Matl. 4 ‐ Deeper Marine Deposits 15,17,18,16 13,850
Region Matl. 3 ‐ Shallow Alluvial Deposits 14,16,19,20,40,21,22,39 2,040.3
Region Matl. 4 ‐ Deeper Marine Deposits 16,19,23,18 8,900
Region Matl. 2 ‐ Surficial Overburden Layer 20,7,12,24 204.38
Region Matl. 3 ‐ Shallow Alluvial Deposits 20,24,25,19 3,878
Region Matl. 4 ‐ Deeper Marine Deposits 19,25,26,23 13,850
Region Matl. 2 ‐ Surficial Overburden Layer 12,31,32,24 1,525.5
Region Matl. 3 ‐ Shallow Alluvial Deposits 24,32,33,25 28,476
Region Matl. 4 ‐ Deeper Marine Deposits 25,33,34,26 1.017e+005
Region Matl. 2 ‐ Surficial Overburden Layer 35,1,13,36 1,525.5
Region Matl. 3 ‐ Shallow Alluvial Deposits 36,13,15,37 28,476
Region Matl. 4 ‐ Deeper Marine Deposits 37,15,17,38 1.017e+005
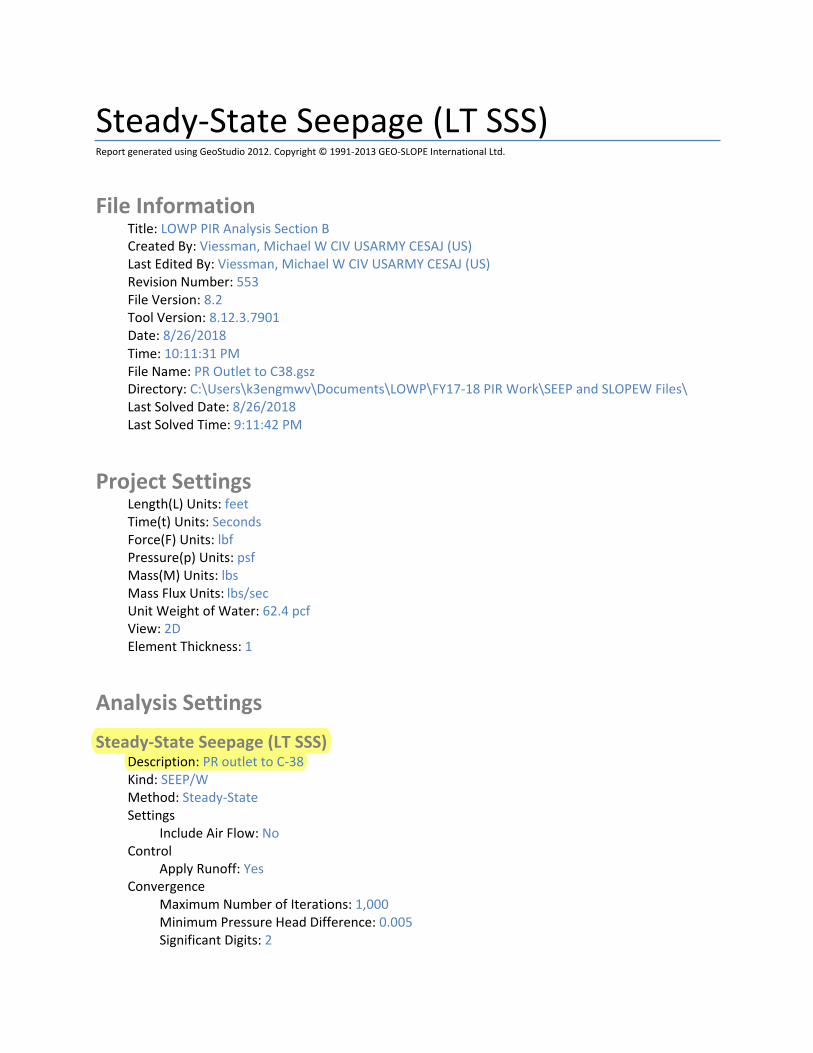
Steady‐State Seepage (LT SSS) Report generated using GeoStudio 2012. Copyright © 1991‐2013 GEO‐SLOPE International Ltd.
File Information Title: LOWP PIR Analysis Section B Created By: Viessman, Michael W CIV USARMY CESAJ (US) Last Edited By: Viessman, Michael W CIV USARMY CESAJ (US) Revision Number: 553 File Version: 8.2 Tool Version: 8.12.3.7901 Date: 8/26/2018 Time: 10:11:31 PM File Name: PR Outlet to C38.gsz Directory: C:\Users\k3engmwv\Documents\LOWP\FY17‐18 PIR Work\SEEP and SLOPEW Files\ Last Solved Date: 8/26/2018 Last Solved Time: 9:11:42 PM
Project Settings Length(L) Units: feet Time(t) Units: Seconds Force(F) Units: lbf Pressure(p) Units: psf Mass(M) Units: lbs Mass Flux Units: lbs/sec Unit Weight of Water: 62.4 pcf View: 2D Element Thickness: 1
Analysis Settings
Steady‐State Seepage (LT SSS) Description: PR outlet to C‐38 Kind: SEEP/W Method: Steady‐State Settings
Include Air Flow: No Control
Apply Runoff: Yes Convergence
Maximum Number of Iterations: 1,000 Minimum Pressure Head Difference: 0.005 Significant Digits: 2

Max # of Reviews: 10 Hydraulic Under‐Relaxation Criteria
Under‐Relaxation Initial Rate: 1 Under‐Relaxation Min. Rate: 0.1 Under‐Relaxation Reduction Rate: 0.65 Under‐Relaxation Iterations: 10
Equation Solver: Parallel Direct Time
Starting Time: 0 sec Duration: 0 sec Ending Time: 0 sec
Materials
Matl. 1 ‐ Embankment Material Model: Saturated / Unsaturated Hydraulic
K‐Function: Matl. 1 Embankment Material Ky'/Kx' Ratio: 0.25 Rotation: 0 ° Vol. WC. Function: Matl. 1 Embankment Fill from Borrow Areas
Matl. 2 ‐ Surficial Overburden Layer Model: Saturated / Unsaturated Hydraulic
K‐Function: Matl. 2 Surficial Overburden Layer Ky'/Kx' Ratio: 0.1 Rotation: 0 ° Vol. WC. Function: Matl. 2 Surficial Overburden Layer
Matl. 3 ‐ Shallow Alluvial Deposits Model: Saturated / Unsaturated Hydraulic
K‐Function: Matl. 3 Shallow Alluvial Deposits Ky'/Kx' Ratio: 0.1 Rotation: 0 ° Vol. WC. Function: Matl. 3 Shallow Alluvial Deposits
Matl. 4 ‐ Deeper Marine Deposits Model: Saturated / Unsaturated Hydraulic
K‐Function: Matl. 4 Deeper Marine Deposits Ky'/Kx' Ratio: 0.1 Rotation: 0 ° Vol. WC. Function: Matl. 4 Deeper Marine Deposits
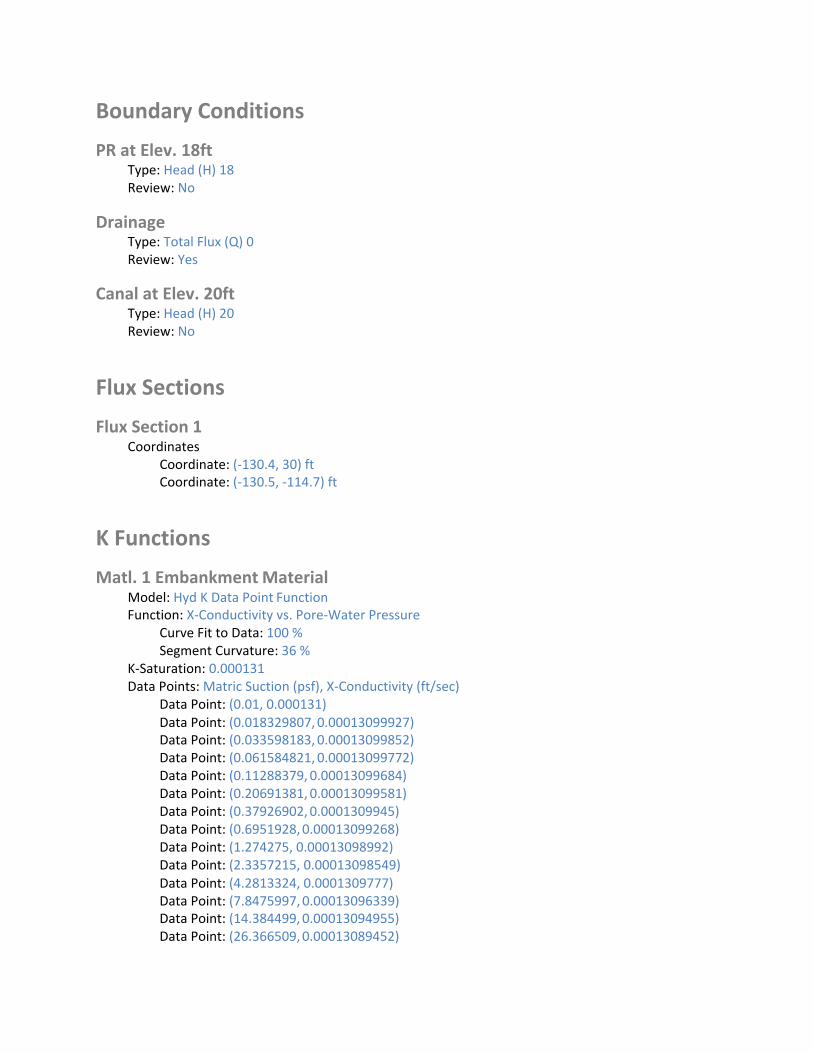
Boundary Conditions
PR at Elev. 18ft Type: Head (H) 18 Review: No
Drainage Type: Total Flux (Q) 0 Review: Yes
Canal at Elev. 20ft Type: Head (H) 20 Review: No
Flux Sections
Flux Section 1 Coordinates
Coordinate: (‐130.4, 30) ft Coordinate: (‐130.5, ‐114.7) ft
K Functions
Matl. 1 Embankment Material Model: Hyd K Data Point Function Function: X‐Conductivity vs. Pore‐Water Pressure
Curve Fit to Data: 100 % Segment Curvature: 36 %
K‐Saturation: 0.000131 Data Points: Matric Suction (psf), X‐Conductivity (ft/sec)
Data Point: (0.01, 0.000131) Data Point: (0.018329807, 0.00013099927) Data Point: (0.033598183, 0.00013099852) Data Point: (0.061584821, 0.00013099772) Data Point: (0.11288379, 0.00013099684) Data Point: (0.20691381, 0.00013099581) Data Point: (0.37926902, 0.0001309945) Data Point: (0.6951928,0.00013099268) Data Point: (1.274275, 0.00013098992) Data Point: (2.3357215, 0.00013098549) Data Point: (4.2813324, 0.0001309777) Data Point: (7.8475997,0.00013096339) Data Point: (14.384499,0.00013094955) Data Point: (26.366509,0.00013089452)
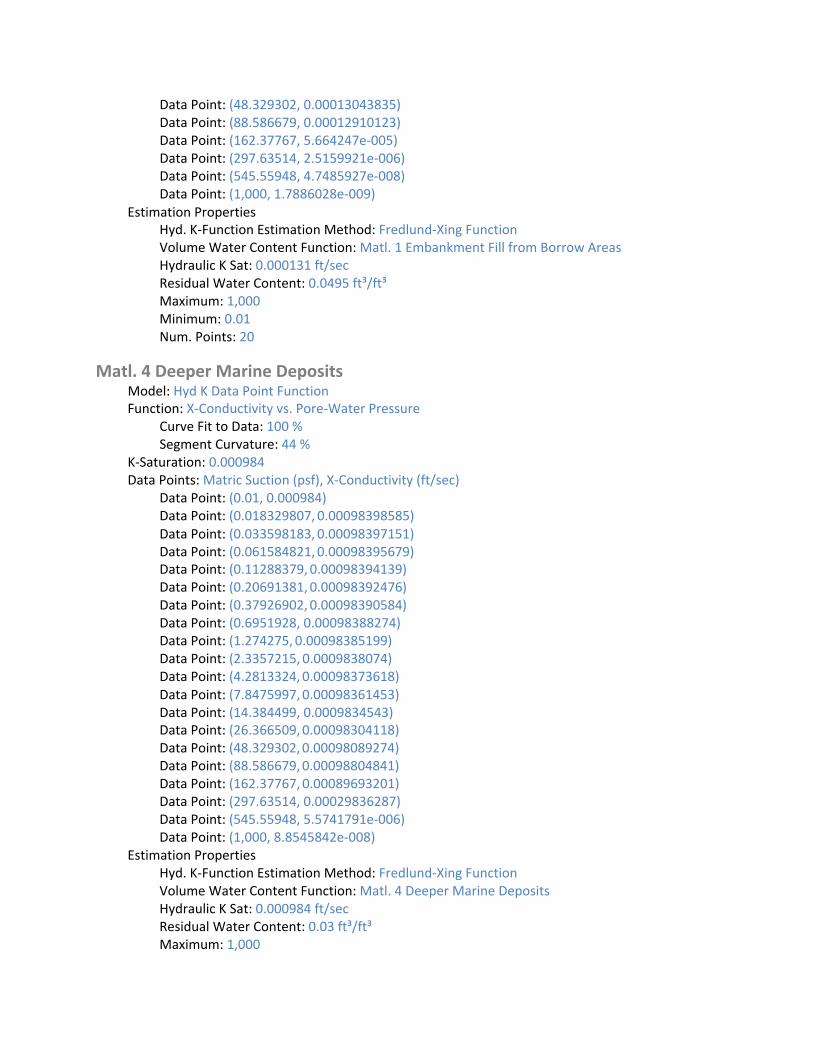
Data Point: (48.329302, 0.00013043835) Data Point: (88.586679, 0.00012910123) Data Point: (162.37767, 5.664247e‐005) Data Point: (297.63514, 2.5159921e‐006) Data Point: (545.55948, 4.7485927e‐008) Data Point: (1,000, 1.7886028e‐009)
Estimation Properties Hyd. K‐Function Estimation Method: Fredlund‐Xing Function Volume Water Content Function: Matl. 1 Embankment Fill from Borrow Areas Hydraulic K Sat: 0.000131 ft/sec Residual Water Content: 0.0495 ft³/ft³ Maximum: 1,000 Minimum: 0.01 Num. Points: 20
Matl. 4 Deeper Marine Deposits Model: Hyd K Data Point Function Function: X‐Conductivity vs. Pore‐Water Pressure
Curve Fit to Data: 100 % Segment Curvature: 44 %
K‐Saturation: 0.000984 Data Points: Matric Suction (psf), X‐Conductivity (ft/sec)
Data Point: (0.01, 0.000984) Data Point: (0.018329807, 0.00098398585) Data Point: (0.033598183, 0.00098397151) Data Point: (0.061584821, 0.00098395679) Data Point: (0.11288379, 0.00098394139) Data Point: (0.20691381, 0.00098392476) Data Point: (0.37926902, 0.00098390584) Data Point: (0.6951928, 0.00098388274) Data Point: (1.274275, 0.00098385199) Data Point: (2.3357215, 0.0009838074) Data Point: (4.2813324,0.00098373618) Data Point: (7.8475997,0.00098361453) Data Point: (14.384499, 0.0009834543) Data Point: (26.366509,0.00098304118) Data Point: (48.329302,0.00098089274) Data Point: (88.586679,0.00098804841) Data Point: (162.37767,0.00089693201) Data Point: (297.63514, 0.00029836287) Data Point: (545.55948, 5.5741791e‐006) Data Point: (1,000, 8.8545842e‐008)
Estimation Properties Hyd. K‐Function Estimation Method: Fredlund‐Xing Function Volume Water Content Function: Matl. 4 Deeper Marine Deposits Hydraulic K Sat: 0.000984 ft/sec Residual Water Content: 0.03 ft³/ft³ Maximum: 1,000
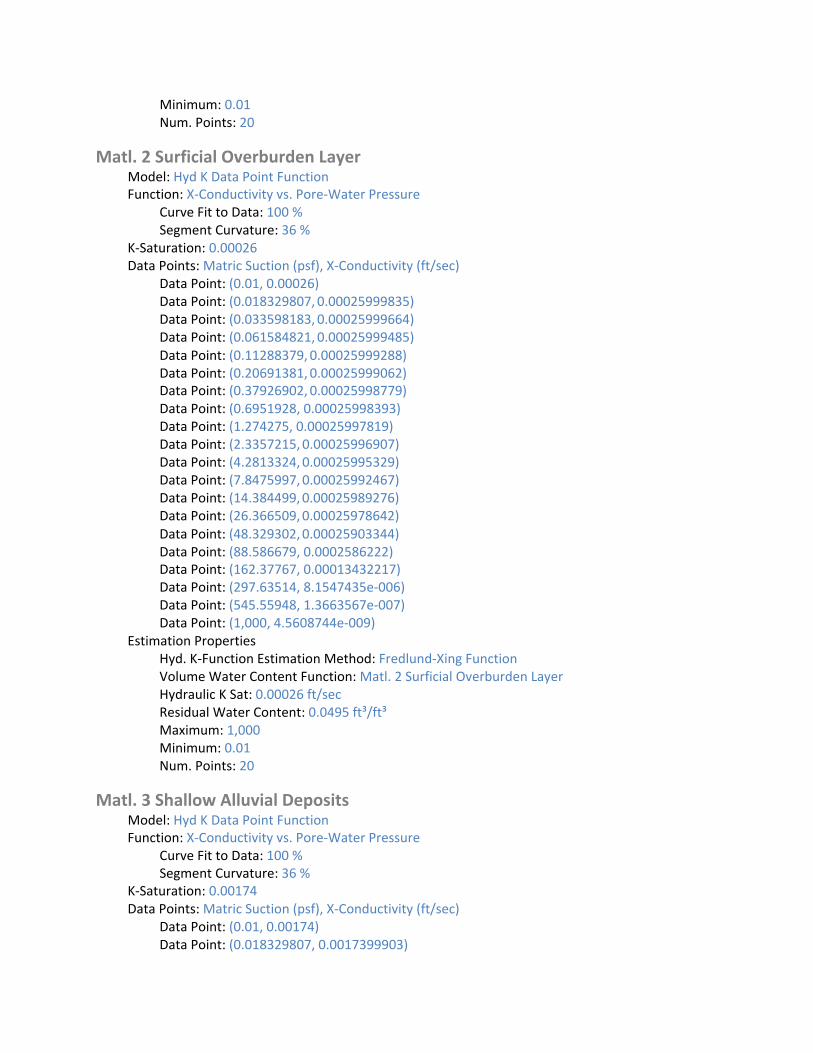
Minimum: 0.01 Num. Points: 20
Matl. 2 Surficial Overburden Layer Model: Hyd K Data Point Function Function: X‐Conductivity vs. Pore‐Water Pressure
Curve Fit to Data: 100 % Segment Curvature: 36 %
K‐Saturation: 0.00026 Data Points: Matric Suction (psf), X‐Conductivity (ft/sec)
Data Point: (0.01, 0.00026) Data Point: (0.018329807, 0.00025999835) Data Point: (0.033598183, 0.00025999664) Data Point: (0.061584821, 0.00025999485) Data Point: (0.11288379, 0.00025999288) Data Point: (0.20691381, 0.00025999062) Data Point: (0.37926902, 0.00025998779) Data Point: (0.6951928, 0.00025998393) Data Point: (1.274275, 0.00025997819) Data Point: (2.3357215,0.00025996907) Data Point: (4.2813324,0.00025995329) Data Point: (7.8475997,0.00025992467) Data Point: (14.384499,0.00025989276) Data Point: (26.366509,0.00025978642) Data Point: (48.329302,0.00025903344) Data Point: (88.586679, 0.0002586222) Data Point: (162.37767, 0.00013432217) Data Point: (297.63514, 8.1547435e‐006) Data Point: (545.55948, 1.3663567e‐007) Data Point: (1,000, 4.5608744e‐009)
Estimation Properties Hyd. K‐Function Estimation Method: Fredlund‐Xing Function Volume Water Content Function: Matl. 2 Surficial Overburden Layer Hydraulic K Sat: 0.00026 ft/sec Residual Water Content: 0.0495 ft³/ft³ Maximum: 1,000 Minimum: 0.01 Num. Points: 20
Matl. 3 Shallow Alluvial Deposits Model: Hyd K Data Point Function Function: X‐Conductivity vs. Pore‐Water Pressure
Curve Fit to Data: 100 % Segment Curvature: 36 %
K‐Saturation: 0.00174 Data Points: Matric Suction (psf), X‐Conductivity (ft/sec)
Data Point: (0.01, 0.00174) Data Point: (0.018329807, 0.0017399903)
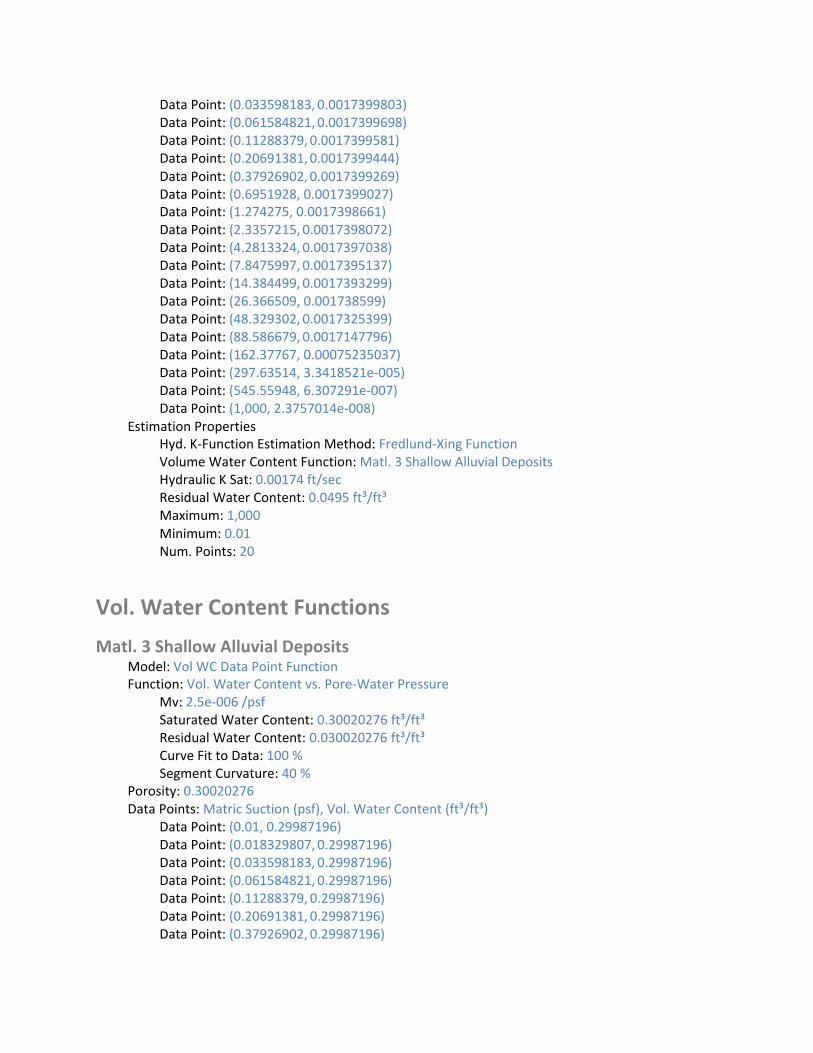
Data Point: (0.033598183, 0.0017399803) Data Point: (0.061584821, 0.0017399698) Data Point: (0.11288379,0.0017399581) Data Point: (0.20691381,0.0017399444) Data Point: (0.37926902,0.0017399269) Data Point: (0.6951928, 0.0017399027) Data Point: (1.274275, 0.0017398661) Data Point: (2.3357215, 0.0017398072) Data Point: (4.2813324, 0.0017397038) Data Point: (7.8475997, 0.0017395137) Data Point: (14.384499, 0.0017393299) Data Point: (26.366509, 0.001738599) Data Point: (48.329302, 0.0017325399) Data Point: (88.586679, 0.0017147796) Data Point: (162.37767, 0.00075235037) Data Point: (297.63514, 3.3418521e‐005) Data Point: (545.55948, 6.307291e‐007) Data Point: (1,000, 2.3757014e‐008)
Estimation Properties Hyd. K‐Function Estimation Method: Fredlund‐Xing Function Volume Water Content Function: Matl. 3 Shallow Alluvial Deposits Hydraulic K Sat: 0.00174 ft/sec Residual Water Content: 0.0495 ft³/ft³ Maximum: 1,000 Minimum: 0.01 Num. Points: 20
Vol. Water Content Functions
Matl. 3 Shallow Alluvial Deposits Model: Vol WC Data Point Function Function: Vol. Water Content vs. Pore‐Water Pressure
Mv: 2.5e‐006 /psf Saturated Water Content: 0.30020276 ft³/ft³ Residual Water Content: 0.030020276 ft³/ft³ Curve Fit to Data: 100 % Segment Curvature: 40 %
Porosity: 0.30020276 Data Points: Matric Suction (psf), Vol. Water Content (ft³/ft³)
Data Point: (0.01, 0.29987196) Data Point: (0.018329807, 0.29987196) Data Point: (0.033598183, 0.29987196) Data Point: (0.061584821, 0.29987196) Data Point: (0.11288379, 0.29987196) Data Point: (0.20691381, 0.29987196) Data Point: (0.37926902, 0.29987196)
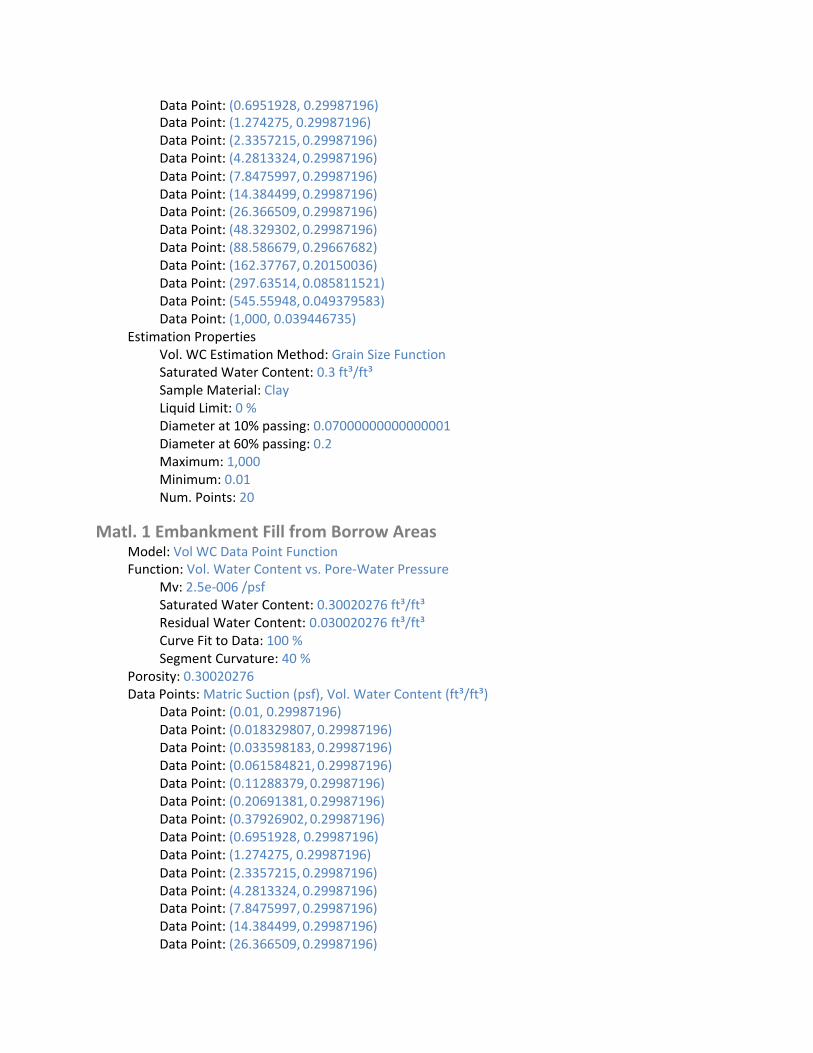
Data Point: (0.6951928, 0.29987196) Data Point: (1.274275, 0.29987196) Data Point: (2.3357215, 0.29987196) Data Point: (4.2813324, 0.29987196) Data Point: (7.8475997, 0.29987196) Data Point: (14.384499, 0.29987196) Data Point: (26.366509, 0.29987196) Data Point: (48.329302, 0.29987196) Data Point: (88.586679, 0.29667682) Data Point: (162.37767, 0.20150036) Data Point: (297.63514, 0.085811521) Data Point: (545.55948, 0.049379583) Data Point: (1,000, 0.039446735)
Estimation Properties Vol. WC Estimation Method: Grain Size Function Saturated Water Content: 0.3 ft³/ft³ Sample Material: Clay Liquid Limit: 0 % Diameter at 10% passing: 0.07000000000000001 Diameter at 60% passing: 0.2 Maximum: 1,000 Minimum: 0.01 Num. Points: 20
Matl. 1 Embankment Fill from Borrow Areas Model: Vol WC Data Point Function Function: Vol. Water Content vs. Pore‐Water Pressure
Mv: 2.5e‐006 /psf Saturated Water Content: 0.30020276 ft³/ft³ Residual Water Content: 0.030020276 ft³/ft³ Curve Fit to Data: 100 % Segment Curvature: 40 %
Porosity: 0.30020276 Data Points: Matric Suction (psf), Vol. Water Content (ft³/ft³)
Data Point: (0.01, 0.29987196) Data Point: (0.018329807, 0.29987196) Data Point: (0.033598183, 0.29987196) Data Point: (0.061584821, 0.29987196) Data Point: (0.11288379, 0.29987196) Data Point: (0.20691381, 0.29987196) Data Point: (0.37926902, 0.29987196) Data Point: (0.6951928, 0.29987196) Data Point: (1.274275, 0.29987196) Data Point: (2.3357215, 0.29987196) Data Point: (4.2813324, 0.29987196) Data Point: (7.8475997, 0.29987196) Data Point: (14.384499, 0.29987196) Data Point: (26.366509, 0.29987196)
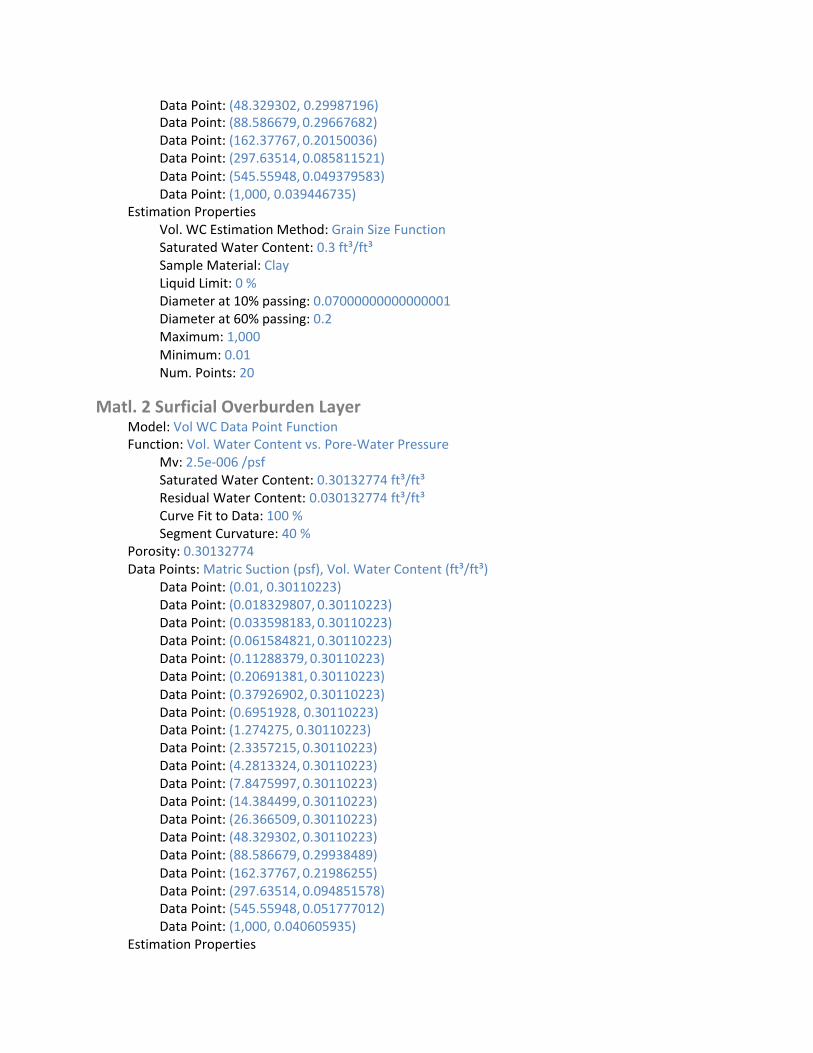
Data Point: (48.329302, 0.29987196) Data Point: (88.586679, 0.29667682) Data Point: (162.37767, 0.20150036) Data Point: (297.63514, 0.085811521) Data Point: (545.55948, 0.049379583) Data Point: (1,000, 0.039446735)
Estimation Properties Vol. WC Estimation Method: Grain Size Function Saturated Water Content: 0.3 ft³/ft³ Sample Material: Clay Liquid Limit: 0 % Diameter at 10% passing: 0.07000000000000001 Diameter at 60% passing: 0.2 Maximum: 1,000 Minimum: 0.01 Num. Points: 20
Matl. 2 Surficial Overburden Layer Model: Vol WC Data Point Function Function: Vol. Water Content vs. Pore‐Water Pressure
Mv: 2.5e‐006 /psf Saturated Water Content: 0.30132774 ft³/ft³ Residual Water Content: 0.030132774 ft³/ft³ Curve Fit to Data: 100 % Segment Curvature: 40 %
Porosity: 0.30132774 Data Points: Matric Suction (psf), Vol. Water Content (ft³/ft³)
Data Point: (0.01, 0.30110223) Data Point: (0.018329807, 0.30110223) Data Point: (0.033598183, 0.30110223) Data Point: (0.061584821, 0.30110223) Data Point: (0.11288379, 0.30110223) Data Point: (0.20691381, 0.30110223) Data Point: (0.37926902, 0.30110223) Data Point: (0.6951928, 0.30110223) Data Point: (1.274275, 0.30110223) Data Point: (2.3357215, 0.30110223) Data Point: (4.2813324, 0.30110223) Data Point: (7.8475997, 0.30110223) Data Point: (14.384499, 0.30110223) Data Point: (26.366509, 0.30110223) Data Point: (48.329302, 0.30110223) Data Point: (88.586679, 0.29938489) Data Point: (162.37767, 0.21986255) Data Point: (297.63514, 0.094851578) Data Point: (545.55948, 0.051777012) Data Point: (1,000, 0.040605935)
Estimation Properties
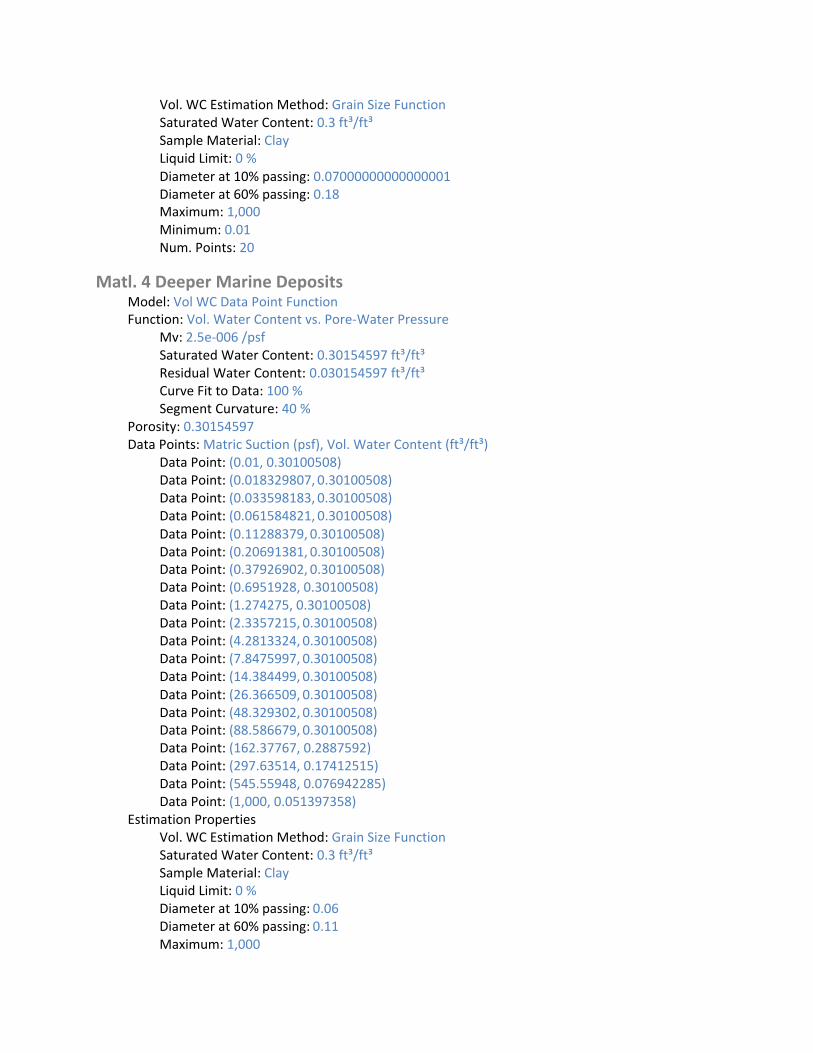
Vol. WC Estimation Method: Grain Size Function Saturated Water Content: 0.3 ft³/ft³ Sample Material: Clay Liquid Limit: 0 % Diameter at 10% passing: 0.07000000000000001 Diameter at 60% passing: 0.18 Maximum: 1,000 Minimum: 0.01 Num. Points: 20
Matl. 4 Deeper Marine Deposits Model: Vol WC Data Point Function Function: Vol. Water Content vs. Pore‐Water Pressure
Mv: 2.5e‐006 /psf Saturated Water Content: 0.30154597 ft³/ft³ Residual Water Content: 0.030154597 ft³/ft³ Curve Fit to Data: 100 % Segment Curvature: 40 %
Porosity: 0.30154597 Data Points: Matric Suction (psf), Vol. Water Content (ft³/ft³)
Data Point: (0.01, 0.30100508) Data Point: (0.018329807, 0.30100508) Data Point: (0.033598183, 0.30100508) Data Point: (0.061584821, 0.30100508) Data Point: (0.11288379, 0.30100508) Data Point: (0.20691381, 0.30100508) Data Point: (0.37926902, 0.30100508) Data Point: (0.6951928, 0.30100508) Data Point: (1.274275, 0.30100508) Data Point: (2.3357215, 0.30100508) Data Point: (4.2813324, 0.30100508) Data Point: (7.8475997, 0.30100508) Data Point: (14.384499, 0.30100508) Data Point: (26.366509, 0.30100508) Data Point: (48.329302, 0.30100508) Data Point: (88.586679, 0.30100508) Data Point: (162.37767, 0.2887592) Data Point: (297.63514, 0.17412515) Data Point: (545.55948, 0.076942285) Data Point: (1,000, 0.051397358)
Estimation Properties Vol. WC Estimation Method: Grain Size Function Saturated Water Content: 0.3 ft³/ft³ Sample Material: Clay Liquid Limit: 0 % Diameter at 10% passing: 0.06 Diameter at 60% passing: 0.11 Maximum: 1,000
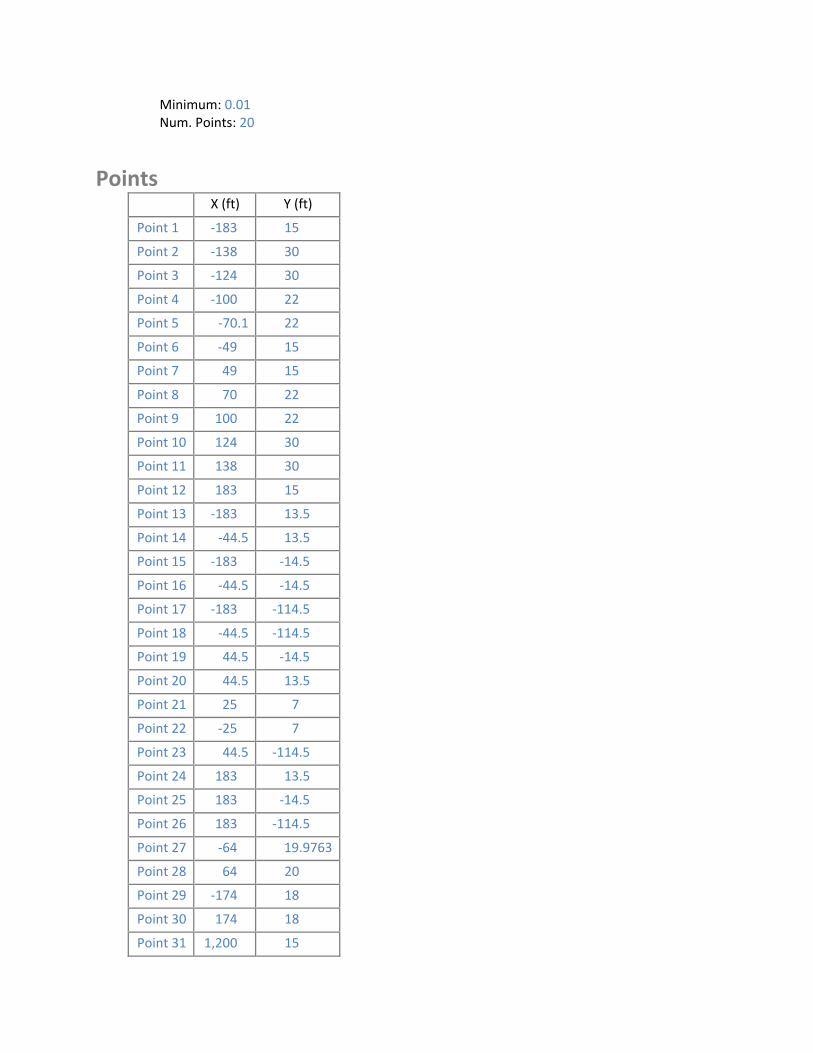
Minimum: 0.01 Num. Points: 20
Points X (ft) Y (ft)
Point 1 ‐183 15
Point 2 ‐138 30
Point 3 ‐124 30
Point 4 ‐100 22
Point 5 ‐70.1 22
Point 6 ‐49 15
Point 7 49 15
Point 8 70 22
Point 9 100 22
Point 10 124 30
Point 11 138 30
Point 12 183 15
Point 13 ‐183 13.5
Point 14 ‐44.5 13.5
Point 15 ‐183 ‐14.5
Point 16 ‐44.5 ‐14.5
Point 17 ‐183 ‐114.5
Point 18 ‐44.5 ‐114.5
Point 19 44.5 ‐14.5
Point 20 44.5 13.5
Point 21 25 7
Point 22 ‐25 7
Point 23 44.5 ‐114.5
Point 24 183 13.5
Point 25 183 ‐14.5
Point 26 183 ‐114.5
Point 27 ‐64 19.9763
Point 28 64 20
Point 29 ‐174 18
Point 30 174 18
Point 31 1,200 15
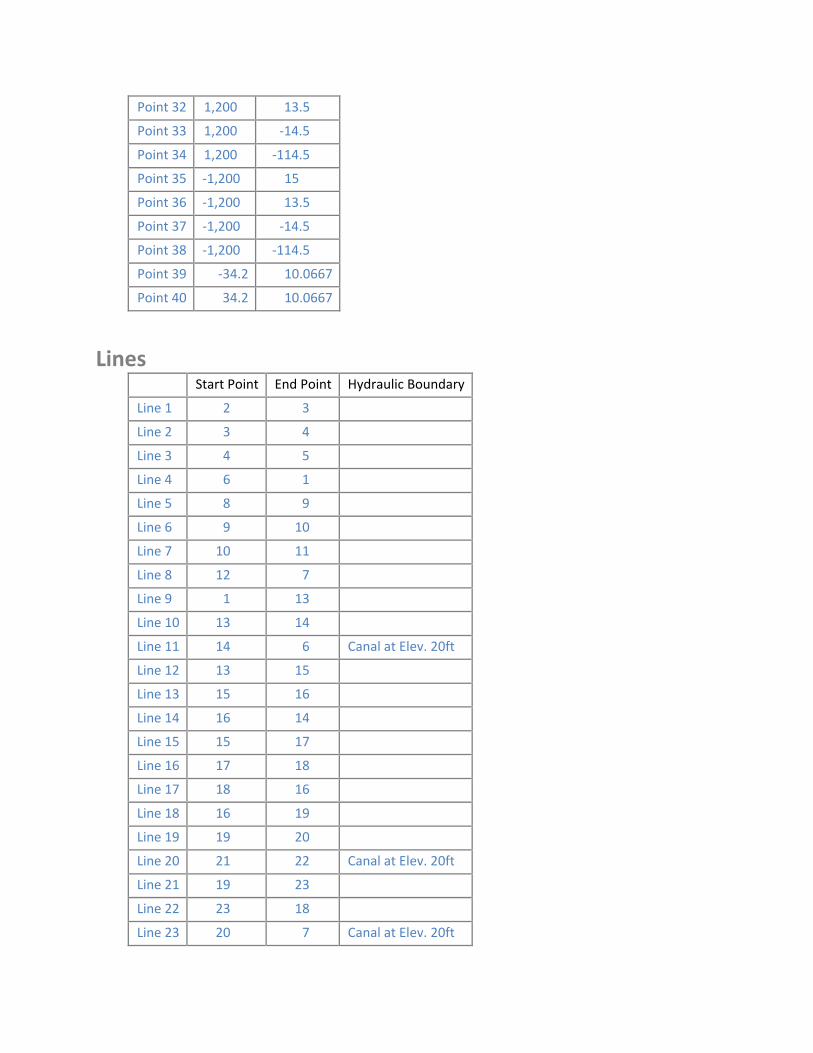
Point 32 1,200 13.5
Point 33 1,200 ‐14.5
Point 34 1,200 ‐114.5
Point 35 ‐1,200 15
Point 36 ‐1,200 13.5
Point 37 ‐1,200 ‐14.5
Point 38 ‐1,200 ‐114.5
Point 39 ‐34.2 10.0667
Point 40 34.2 10.0667
Lines Start Point End Point Hydraulic Boundary
Line 1 2 3
Line 2 3 4
Line 3 4 5
Line 4 6 1
Line 5 8 9
Line 6 9 10
Line 7 10 11
Line 8 12 7
Line 9 1 13
Line 10 13 14
Line 11 14 6 Canal at Elev. 20ft
Line 12 13 15
Line 13 15 16
Line 14 16 14
Line 15 15 17
Line 16 17 18
Line 17 18 16
Line 18 16 19
Line 19 19 20
Line 20 21 22 Canal at Elev. 20ft
Line 21 19 23
Line 22 23 18
Line 23 20 7 Canal at Elev. 20ft
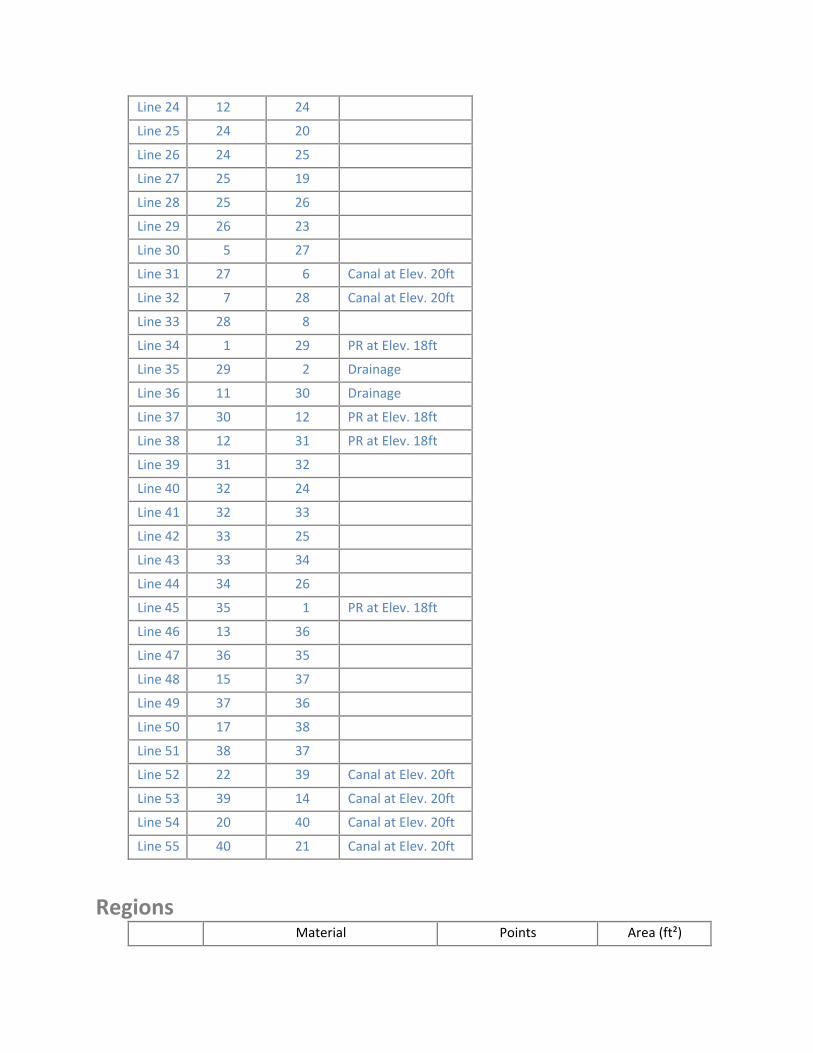
25
30
35
40
45
50
55
Line 24 12 24
Line 24 20
Line 26 24 25
Line 27 25 19
Line 28 25 26
Line 29 26 23
Line 5 27
Line 31 27 6 Canal at Elev. 20ft
Line 32 7 28 Canal at Elev. 20ft
Line 33 28 8
Line 34 1 29 PR at Elev. 18ft
Line 29 2 Drainage
Line 36 11 30 Drainage
Line 37 30 12 PR at Elev. 18ft
Line 38 12 31 PR at Elev. 18ft
Line 39 31 32
Line 32 24
Line 41 32 33
Line 42 33 25
Line 43 33 34
Line 44 34 26
Line 35 1 PR at Elev. 18ft
Line 46 13 36
Line 47 36 35
Line 48 15 37
Line 49 37 36
Line 17 38
Line 51 38 37
Line 52 22 39 Canal at Elev. 20ft
Line 53 39 14 Canal at Elev. 20ft
Line 54 20 40 Canal at Elev. 20ft
Line 40 21 Canal at Elev. 20ft
Regions Material Points Area (ft²)
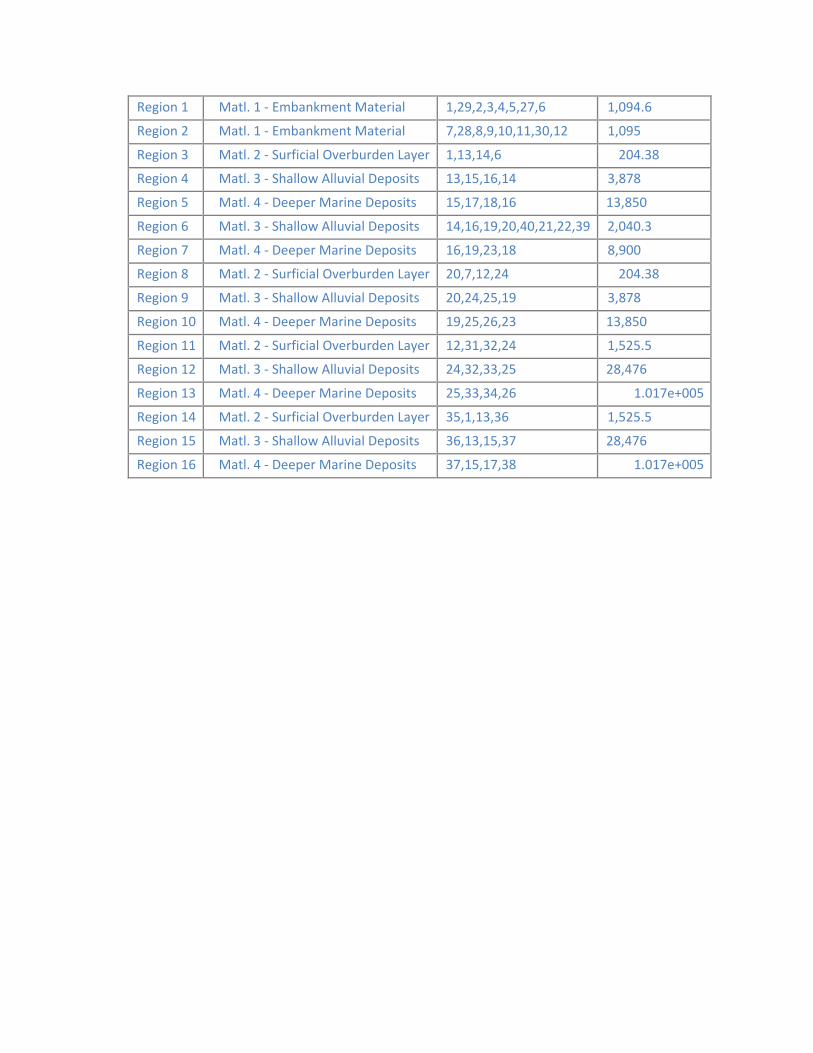
1
2
3
4
5
6
7
8
9
10
11
12
13
14
15
16
Region Matl. 1 ‐ Embankment Material 1,29,2,3,4,5,27,6 1,094.6
Region Matl. 1 ‐ Embankment Material 7,28,8,9,10,11,30,12 1,095
Region Matl. 2 ‐ Surficial Overburden Layer 1,13,14,6 204.38
Region Matl. 3 ‐ Shallow Alluvial Deposits 13,15,16,14 3,878
Region Matl. 4 ‐ Deeper Marine Deposits 15,17,18,16 13,850
Region Matl. 3 ‐ Shallow Alluvial Deposits 14,16,19,20,40,21,22,39 2,040.3
Region Matl. 4 ‐ Deeper Marine Deposits 16,19,23,18 8,900
Region Matl. 2 ‐ Surficial Overburden Layer 20,7,12,24 204.38
Region Matl. 3 ‐ Shallow Alluvial Deposits 20,24,25,19 3,878
Region Matl. 4 ‐ Deeper Marine Deposits 19,25,26,23 13,850
Region Matl. 2 ‐ Surficial Overburden Layer 12,31,32,24 1,525.5
Region Matl. 3 ‐ Shallow Alluvial Deposits 24,32,33,25 28,476
Region Matl. 4 ‐ Deeper Marine Deposits 25,33,34,26 1.017e+005
Region Matl. 2 ‐ Surficial Overburden Layer 35,1,13,36 1,525.5
Region Matl. 3 ‐ Shallow Alluvial Deposits 36,13,15,37 28,476
Region Matl. 4 ‐ Deeper Marine Deposits 37,15,17,38 1.017e+005

SLOPE/W Figures and Results
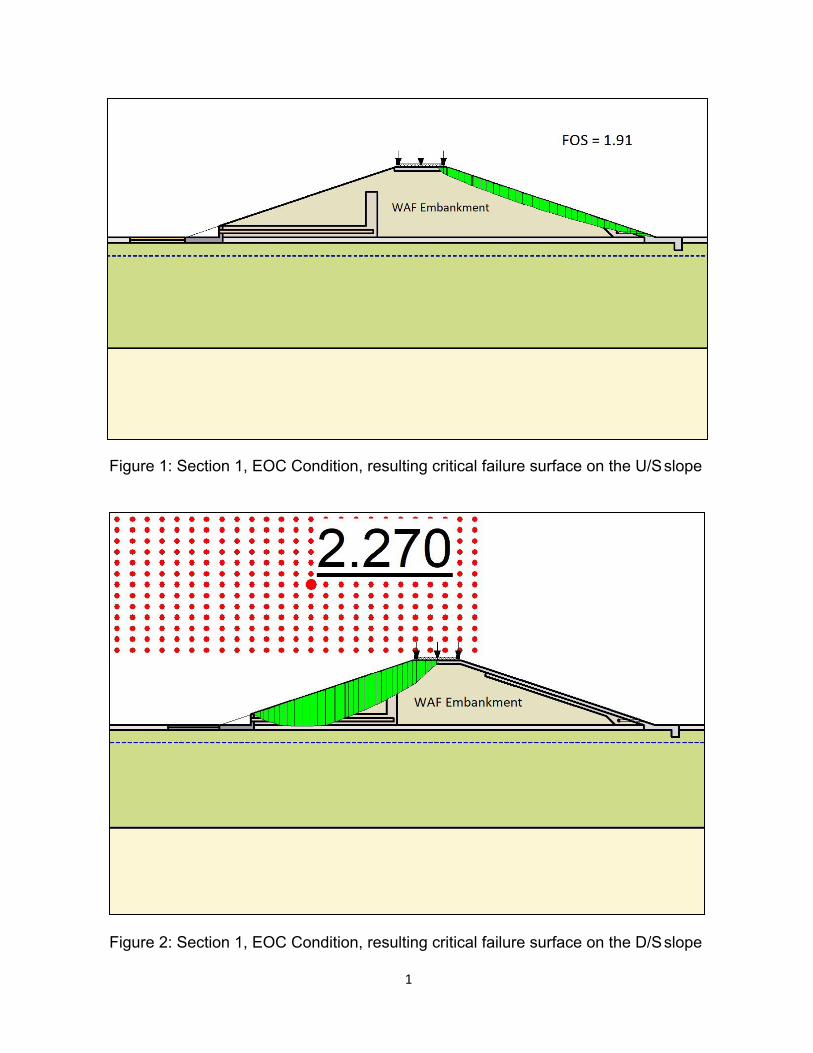
OS = 1 .91
WAF Embankment
• • • • • • • • - - - - - - - - -• • • • • • • ~2 270 • • • • • • • • • • • • • • • • • • • • • ■
• • • • • • • • • • • • • • • • • • • • • • • • • • • • • • • • • • • • • • • • • • • • • • • • • • • • • • • • • • • • • • • • • • • • • • • • • • • • • • • • • • • • • • • • • • • • • • • • • • • • • • • • • • • • • • • • • • •
Figure 1: Section 1, EOC Condition, resulting critical failure surface on the U/S slope
Figure 2: Section 1, EOC Condition, resulting critical failure surface on the D/S slope
1
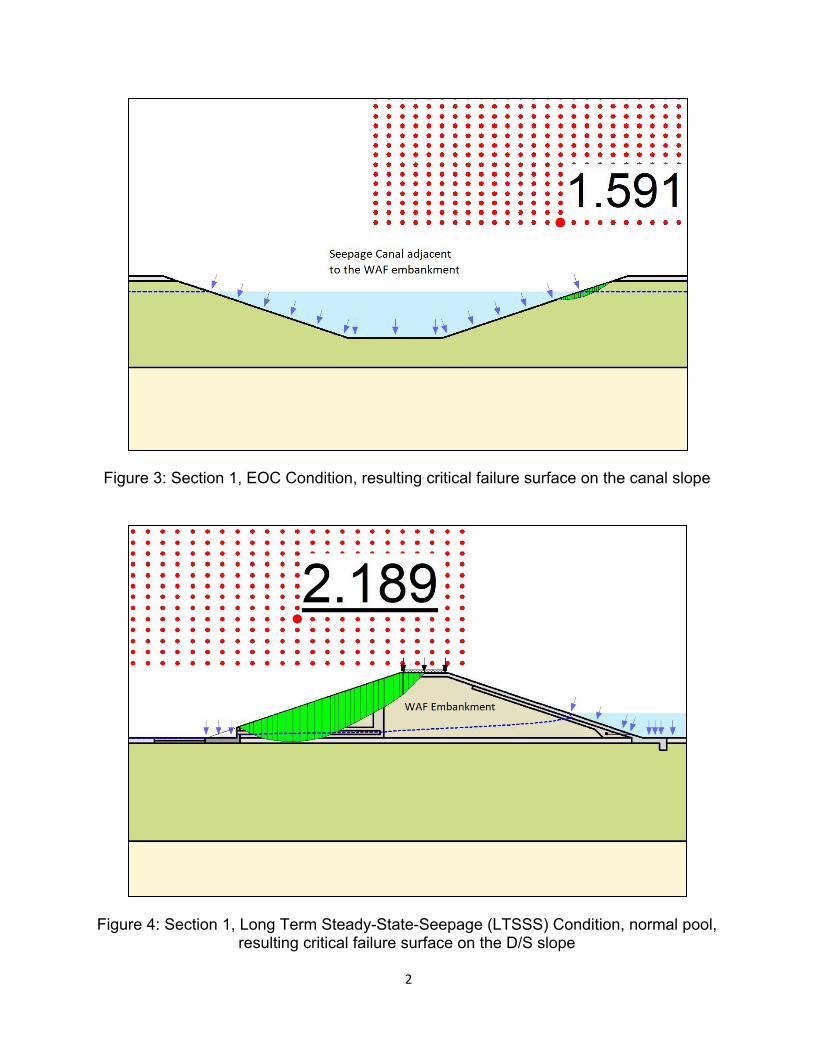
• • • • • • • • • • • • • • • • • • • • • • • • • • • • • • • • • • • • • • • • • • • • • • • • • • • • • • • • • • • • • • • • • • • • • • • • • • • • • • • • • • • • • • • • • • • • • • • • • • • • • • • • • • • • • 1 591 • • • • • • • • • • • • • • • • • • • • • ■ • • • • • • • • • • • • • • •·· • • • • • • • Seepage Cana l adjacent
to the WAF embankment
• • • • • • • • • • • • • • • • • • • • • • • • • • • • • • • • • • • • • • • • • • • • • • • • • • • • • • • • • • - - - - - • • • • • • • • • • • • • ~2 1 89 • • • • • • • • • • • • • • • • • • • • • • • • • • • • • • • • • • • • • • • ■ • • • • • • • • • • • • • • • • • • • • • • • • • • • • • • • • • • • • • • • • • • • • • • • • • • • • • • • • • • • • • • • • • • • • • • • • • • • • • • • • • • • • • • • • • • • • • • • • • • • • • • • • • • • • • • • •
Figure 3: Section 1, EOC Condition, resulting critical failure surface on the canal slope
Figure 4: Section 1, Long Term Steady-State-Seepage (LTSSS) Condition, normal pool, resulting critical failure surface on the D/S slope
2
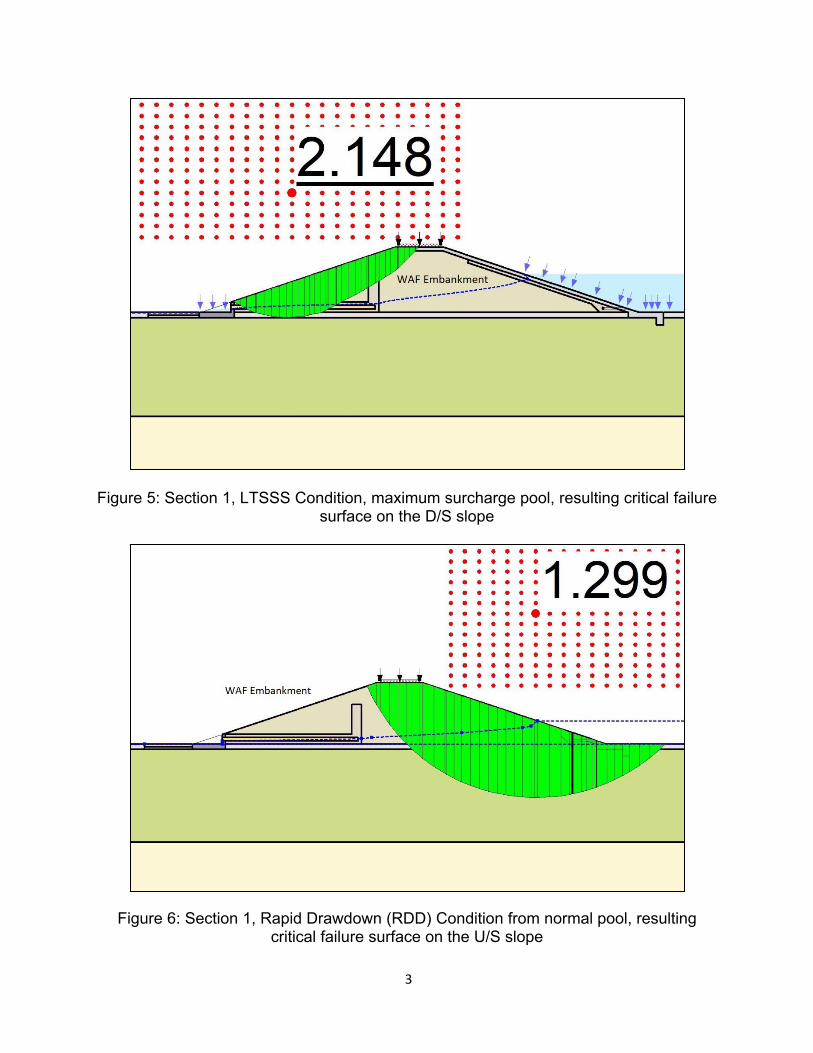
• • • • • • • • • • • • • • • • • • • • • • • • • • • • • • • • • • • • • • • • • • • • • • • • • • • • • • • • • • • • • • • • • • !2 1 48 • • • • • • • • • • • • • • • • • • • • • • • • • • • • • • • • • • • • ■ • • • • • • • • • • • • • • • • • • • • • • • • • • • • • • • • • • • • • • • • • • • • • • • • • • • • • • • • • • • • • • • • • • • • • • • • • • • • • • • • • • • • • • • • • • • • • • • • • • • • • • • • • • • • • • • • • • • • •
---------------
• • • • • • • • • . . . . • • • • • • • • • • • • • • • • • • • • • • • • • • • • • • • • • • • • • • • • • • • • • • • • • • • • • • • • • • • • • • • • • • • • • • • • • • • • • • • • • • • • • • • • • • • • • • • • • • • • • • • • • • • • • • • • • • • • • • • • • • • • • • • • • • • • • • •
WAF Embankment
Figure 5: Section 1, LTSSS Condition, maximum surcharge pool, resulting critical failure surface on the D/S slope
Figure 6: Section 1, Rapid Drawdown (RDD) Condition from normal pool, resulting critical failure surface on the U/S slope
3
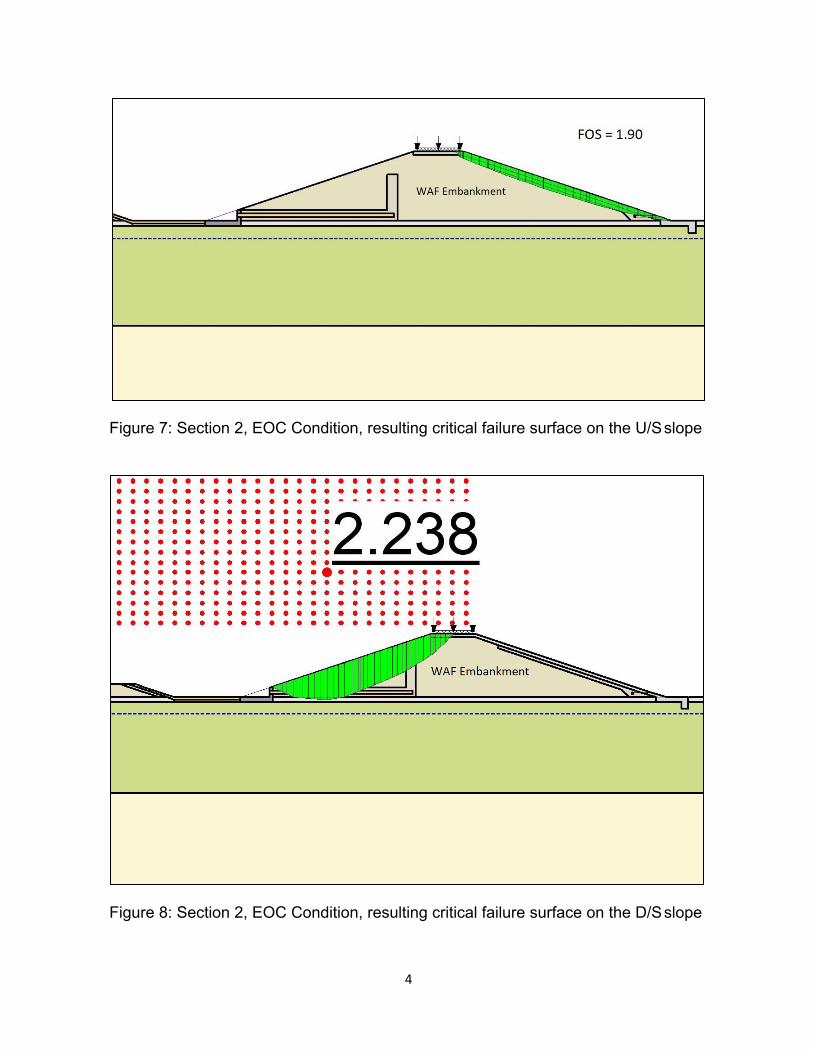
= 1.90
WAF Embankment
• • • • • • • • • • • • • • • • • • • • • • • • • • • • • • • • • • • • • • • • • • • • • • • • • • • • • • • • • • • 12 238 • • • • • • • • • • • • • • • • • • • • • • • • • • • • ■
• • • • • • • • • • • • • • • • • • • • • • • • • • • • • • • • • • • • • • • • • • • • • • • • • • • • • • • • • • • • • • • • • • • • • • • • • • • • • • • • • • • • • • • • • • • • • • • • • • • • • • • •
Figure 7: Section 2, EOC Condition, resulting critical failure surface on the U/S slope
Figure 8: Section 2, EOC Condition, resulting critical failure surface on the D/S slope
4
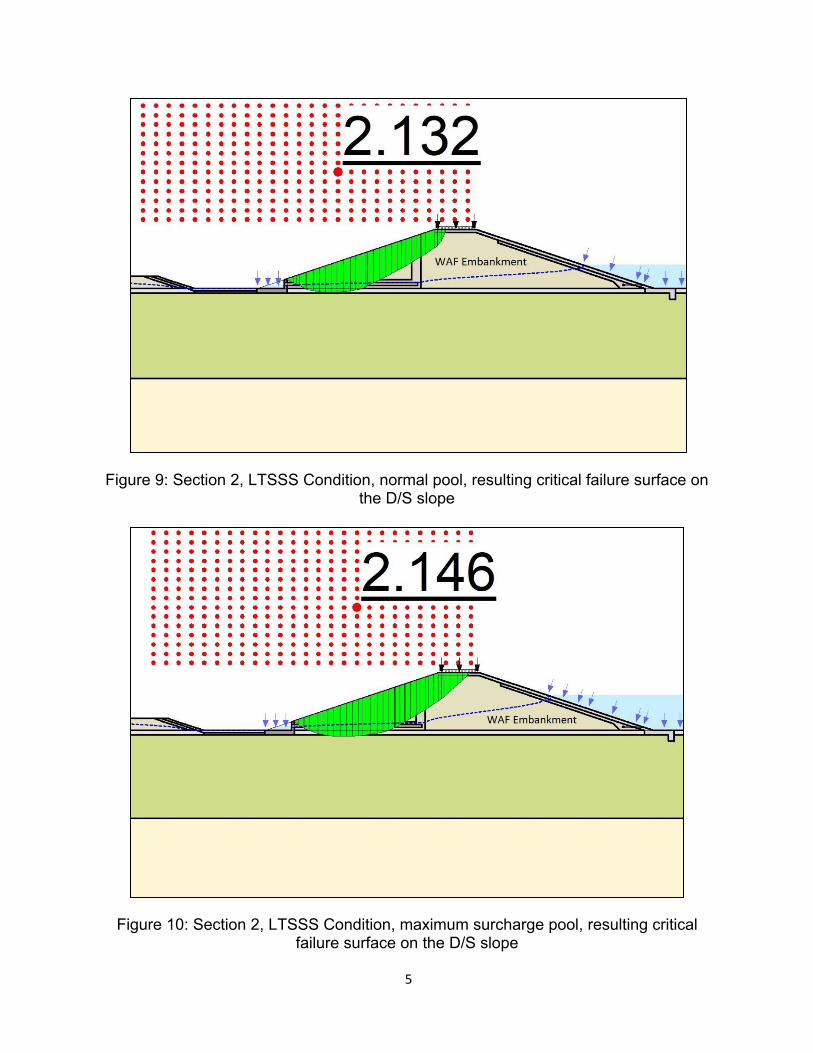
• • • • • • • • • - - - - - - - - - -• • • • • • • • • ;2 1 32 • • • • • • • • • • • • • • • • • • • • • • • • • • • • • • • • • • • • ■
• • • • • • • • • • • • • • • • • • • • • • • • • • • • • • • • • • • • • • • • • • • • • • • • • • • • • • • • • • • • • • • • • • • • • • • • • • • • • • • • • • • • • • • • • • • •
• • • • • • • • • • • • • • • • • • • • • • • • • • • • • • • • • • • • • • • - - - - - -- - -• • • • • • • • • • • • •
\2 1 46 • • • • • • • • • • • • • • • • • • • • • • • • • • • • • • • • • • • • • • • • • • • • • • • • • • • • ■
• • • • • • • • • • • • • • • • • • • • • • • • • • • • • • • • • • • • • • • • • • • • • • • • • • • • • • • • • • • • • • • • • • • • • • • • • • • • • • • • • • • • • • • • • • • • • • • • • • • • • • • • • • • • • • • • • • • • • • • • • • • • • • • • • • • • • • • • • • • • • • • • • • • • • • • • • • • • • • • • • • • • • •
--------...
Figure 9: Section 2, LTSSS Condition, normal pool, resulting critical failure surface on the D/S slope
Figure 10: Section 2, LTSSS Condition, maximum surcharge pool, resulting critical failure surface on the D/S slope
5
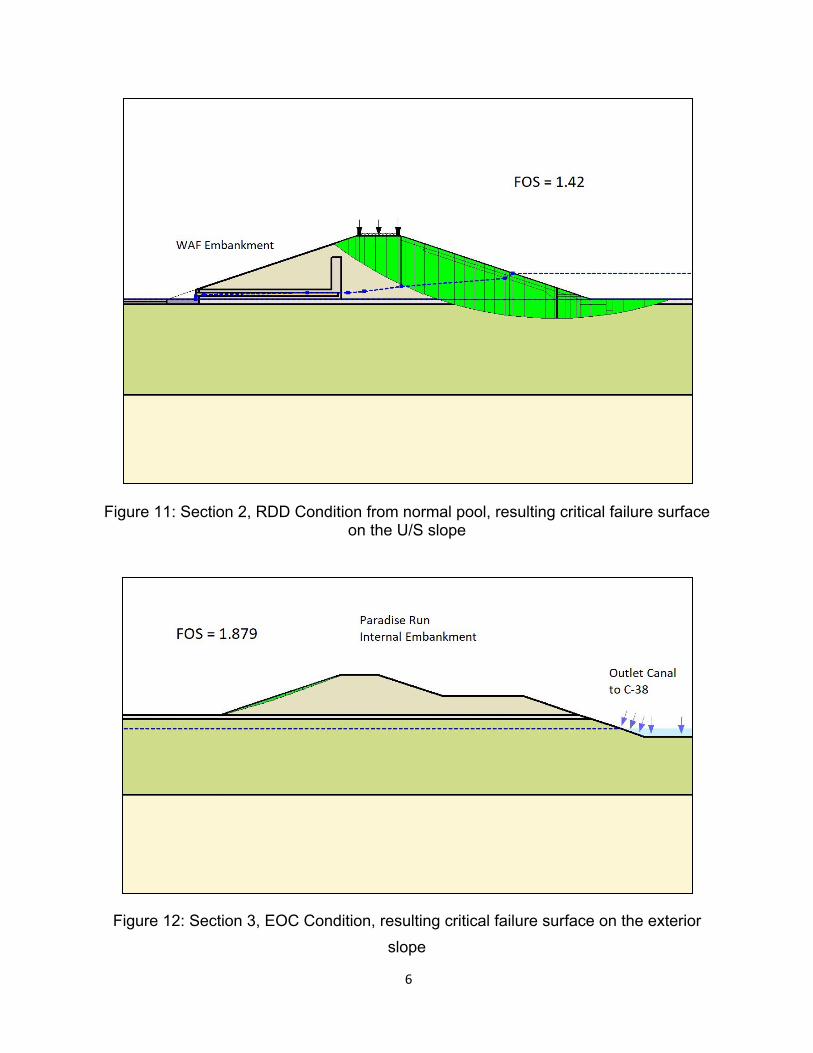
Embankment
Parad ise Run FOS = 1.879 Internal Embankment
FOS = 1.42
Outlet Canal
to C-38
Figure 11: Section 2, RDD Condition from normal pool, resulting critical failure surface on the U/S slope
Figure 12: Section 3, EOC Condition, resulting critical failure surface on the exterior
slope
6
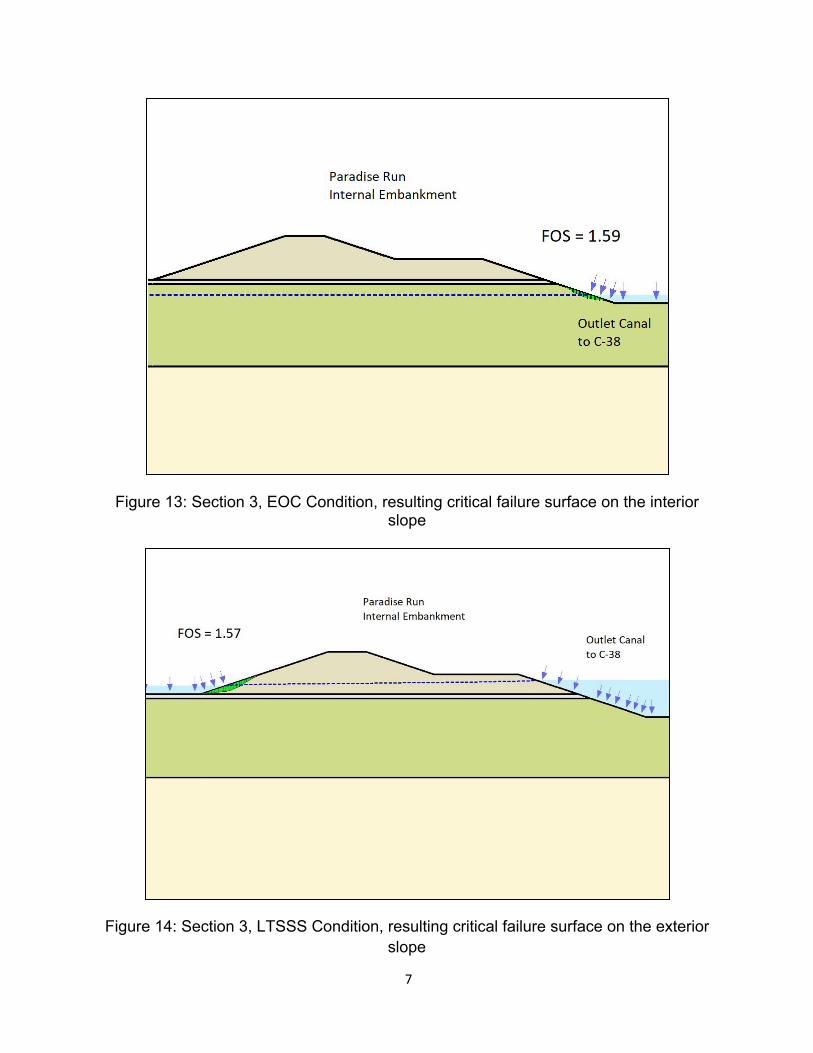
radise Run
Internal Embankment
Paradise Run
Internal Embankment
FOS = 1.57
FOS = 1.59
Outlet Canal
to C-38
Outlet Canal
to C-38
Figure 13: Section 3, EOC Condition, resulting critical failure surface on the interior slope
Figure 14: Section 3, LTSSS Condition, resulting critical failure surface on the exterior slope
7
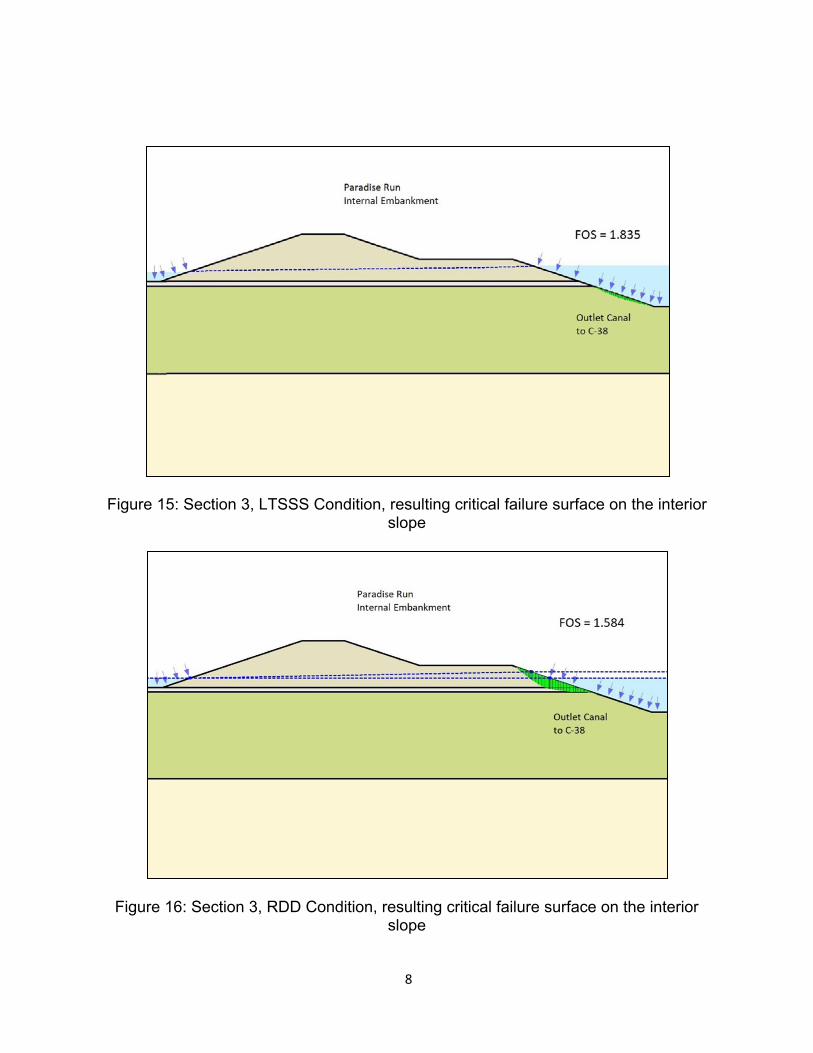
d ise Run Inte rnal Embankment
Paradise Ru n
Internal Embankment
FOS = 1.835
,
Outlet Canal
toC-38
FOS = 1.584
Outlet Canal to C-38
Figure 15: Section 3, LTSSS Condition, resulting critical failure surface on the interior slope
Figure 16: Section 3, RDD Condition, resulting critical failure surface on the interior slope
8
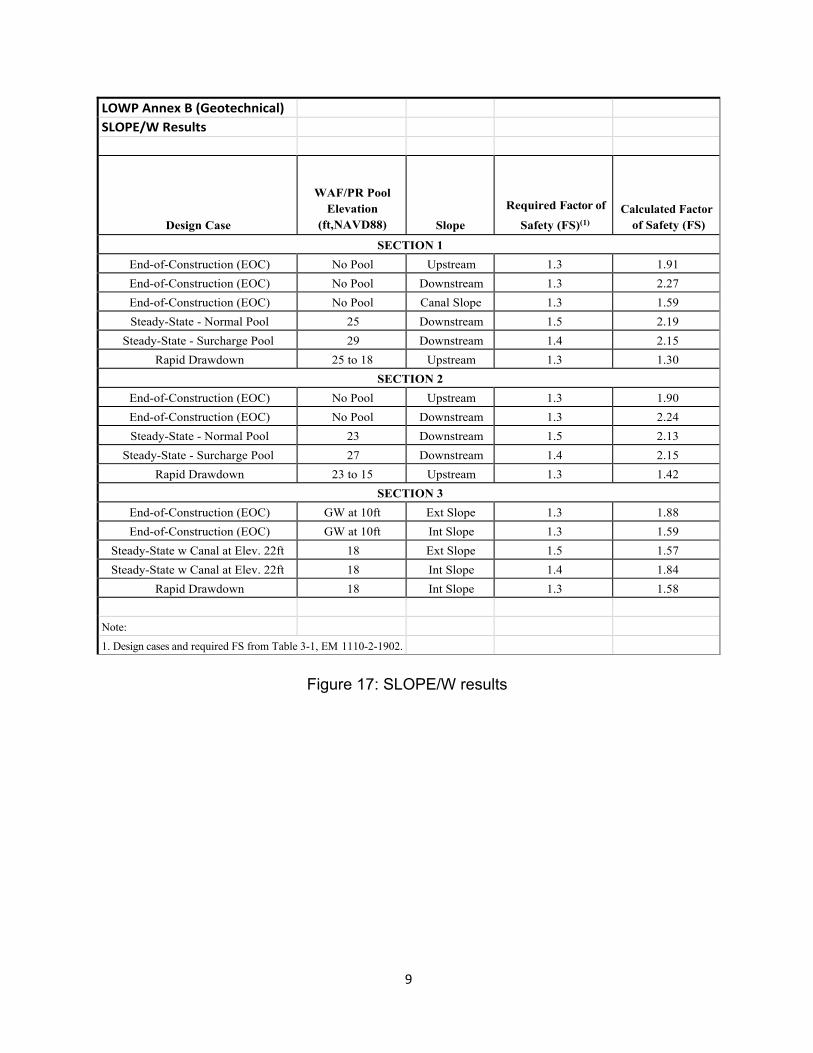
t t t
t t t
LOWP Annex B (Geotechnical) SLOPE/W Results
Design Case
WAF/PR Pool Elevation
(ft,NAVD88) Slope
Required Factor of
Safety (FS)(1)
Calculated Factor of Safety (FS)
SECTION 1
End-of-Construction (EOC) No Pool Upstream 1.3 1.91
End-of-Construction (EOC) No Pool Downstream 1.3 2.27
End-of-Construction (EOC) No Pool Canal Slope 1.3 1.59
Steady-State - Normal Pool 25 Downstream 1.5 2.19
Steady-State - Surcharge Pool 29 Downstream 1.4 2.15
Rapid Drawdown 25 to 18 Upstream 1.3 1.30
SECTION 2
End-of-Construction (EOC) No Pool Upstream 1.3 1.90
End-of-Construction (EOC) No Pool Downstream 1.3 2.24
Steady-State - Normal Pool 23 Downstream 1.5 2.13
Steady-State - Surcharge Pool 27 Downstream 1.4 2.15
Rapid Drawdown 23 to 15 Upstream 1.3 1.42
SECTION 3
End-of-Construction (EOC) GW at 10ft Ext Slope 1.3 1.88
End-of-Construction (EOC) GW at 10ft Int Slope 1.3 1.59
Steady-State w Canal at Elev. 22ft 18 Ext Slope 1.5 1.57
Steady-State w Canal at Elev. 22ft 18 Int Slope 1.4 1.84
Rapid Drawdown 18 Int Slope 1.3 1.58
Note:
1. Design cases and required FS from Table 3-1, EM 1110-2-1902.
Figure 17: SLOPE/W results
9
SLOPE/W Program Files

Slope Stability US Slope G&R (EOC) Report generated using GeoStudio 2012. Copyright © 1991‐2013 GEO‐SLOPE International Ltd.
File Information Title: LOWP PIR Analysis Section B Created By: Viessman, Michael W CIV USARMY CESAJ (US) Last Edited By: Viessman, Michael W CIV USARMY CESAJ (US) Revision Number: 557 File Version: 8.2 Tool Version: 8.12.3.7901 Date: 8/26/2018 Time: 4:51:28 PM File Name: Section B EOC USP w toe drain.gsz Directory: C:\Users\k3engmwv\Documents\LOWP\FY17‐18 PIR Work\SEEP and SLOPEW Files\ Last Solved Date: 8/26/2018 Last Solved Time: 3:55:50 PM
Project Settings Length(L) Units: feet Time(t) Units: Seconds Force(F) Units: lbf Pressure(p) Units: psf Strength Units: psf Unit Weight of Water: 62.4 pcf View: 2D Element Thickness: 1
Analysis Settings
Slope Stability US Slope G&R (EOC) Description: No U/S pool Kind: SLOPE/W Parent: Steady‐State Seepage (EOC) Method: Spencer Settings
Lambda Lambda 1: ‐1 Lambda 2: ‐0.8 Lambda 3: ‐0.6 Lambda 4: ‐0.4 Lambda 5: ‐0.2 Lambda 6: 0

Lambda 7: 0.2 Lambda 8: 0.4 Lambda 9: 0.6 Lambda 10: 0.8 Lambda 11: 1
PWP Conditions Source: Parent Analysis Slip Surface
Direction of movement: Left to Right Use Passive Mode: No Slip Surface Option: Grid and Radius Critical slip surfaces saved: 1 Optimize Critical Slip Surface Location: Yes Tension Crack
Tension Crack Option: (none) F of S Distribution
F of S Calculation Option: Constant Advanced
Number of Slices: 30 F of S Tolerance: 0.001 Minimum Slip Surface Depth: 1 ft Optimization Maximum Iterations: 2,000 Optimization Convergence Tolerance: 1e‐007 Starting Optimization Points: 8 Ending Optimization Points: 16 Complete Passes per Insertion: 1 Driving Side Maximum Convex Angle: 5 ° Resisting Side Maximum Convex Angle: 1 °
Materials
Matl. 1 ‐ Embankment Material Model: Mohr‐Coulomb Unit Weight: 125 pcf Cohesion': 0 psf Phi': 32 ° Phi‐B: 0 ° Constant Unit Wt. Above Water Table: 120 pcf
Matl. 2 ‐ Surficial Overburden Layer Model: Mohr‐Coulomb Unit Weight: 109 pcf Cohesion': 0 psf Phi': 29 ° Phi‐B: 0 ° Constant Unit Wt. Above Water Table: 106 pcf

Matl. 3 ‐ Shallow Alluvial Deposits Model: Mohr‐Coulomb Unit Weight: 123 pcf Cohesion': 0 psf Phi': 30 ° Phi‐B: 0 °
Matl. 4 ‐ Deeper Marine Deposits Model: Mohr‐Coulomb Unit Weight: 125 pcf Cohesion': 0 psf Phi': 33 ° Phi‐B: 0 °
Matl. 5 ‐ Soil Cement Armoring Model: Mohr‐Coulomb Unit Weight: 125 pcf Cohesion': 0 psf Phi': 35 ° Phi‐B: 0 ° Constant Unit Wt. Above Water Table: 120 pcf
Matl. 6 ‐ Fine Drainage Gravel Model: Mohr‐Coulomb Unit Weight: 130 pcf Cohesion': 0 psf Phi': 35 ° Phi‐B: 0 ° Constant Unit Wt. Above Water Table: 115 pcf
Matl. 8 ‐ Filter Sand Model: Mohr‐Coulomb Unit Weight: 120 pcf Cohesion': 0 psf Phi': 33 ° Phi‐B: 0 ° Constant Unit Wt. Above Water Table: 115 pcf
Matl. 9 Concrete Outfall Works Model: Bedrock (Impenetrable)
Slip Surface Grid Upper Left: (26.7361, 199.5947) ft Lower Left: (26.7361, 121.5108) ft Lower Right: (133.6033, 121.5108) ft Grid Horizontal Increment: 25

Grid Vertical Increment: 25 Left Projection Angle: 0 ° Right Projection Angle: 0 °
Slip Surface Radius Upper Left Coordinate: (‐20.2029, 18.4347) ft Upper Right Coordinate: (110.6382, 18.6036) ft Lower Left Coordinate: (‐20.08, ‐21.0305) ft Lower Right Coordinate: (109.6866, ‐21.2416) ft Number of Increments: 50 Left Projection: No Left Projection Angle: 135 ° Right Projection: No Right Projection Angle: 45 °
Slip Surface Limits Left Coordinate: (‐1,200, 18) ft Right Coordinate: (1,100, 18) ft
Surcharge Loads
Surcharge Load 1 Surcharge (Unit Weight): 200 pcf Direction: Vertical
Coordinates
X (ft) Y (ft)
‐6 37.5
6 37.5
Points X (ft) Y (ft)
Point 1 ‐53.5 21
Point 2 ‐14.5 21
Point 3 ‐14.5 30
Point 4 ‐11.5 30
Point 5 ‐11.5 18
Point 6 ‐7 36.5

7
8
9
10
11
12
13
14
15
16
17
18
19
20
21
22
23
24
25
26
27
28
29
30
31
32
33
34
35
36
37
38
39
40
41
42
Point ‐7 35.5
Point 6.8 35.5
Point 14 33
Point 13.7 32.1
Point 48.6 20.5
Point 51.2 18
Point 52.0033 19.4828
Point 51.9 19.4
Point 51.8636 19.2065
Point 52.097 19.0075
Point 52.3031 19.0832
Point 52.3561 19.2916
Point 52.3 19.4
Point 52.1797 19.4906
Point 59.3 18
Point 56.3 19
Point 54.8 19.5
Point 58 19.5
Point 7 36.5
Point 59.3 16.5
Point 67.3 16.5
Point 67.3 14.5
Point 69.3 14.5
Point 69.3 16.5
Point 69.3 18
Point 62.5 18
Point 59.5 19
Point ‐90 18
Point ‐90 16.5
Point 100 18
Point 100 16.5
Point 100 ‐11.4
Point ‐90 ‐11.4
Point 100 ‐111.5
Point ‐90 ‐111.5
Point ‐139 18
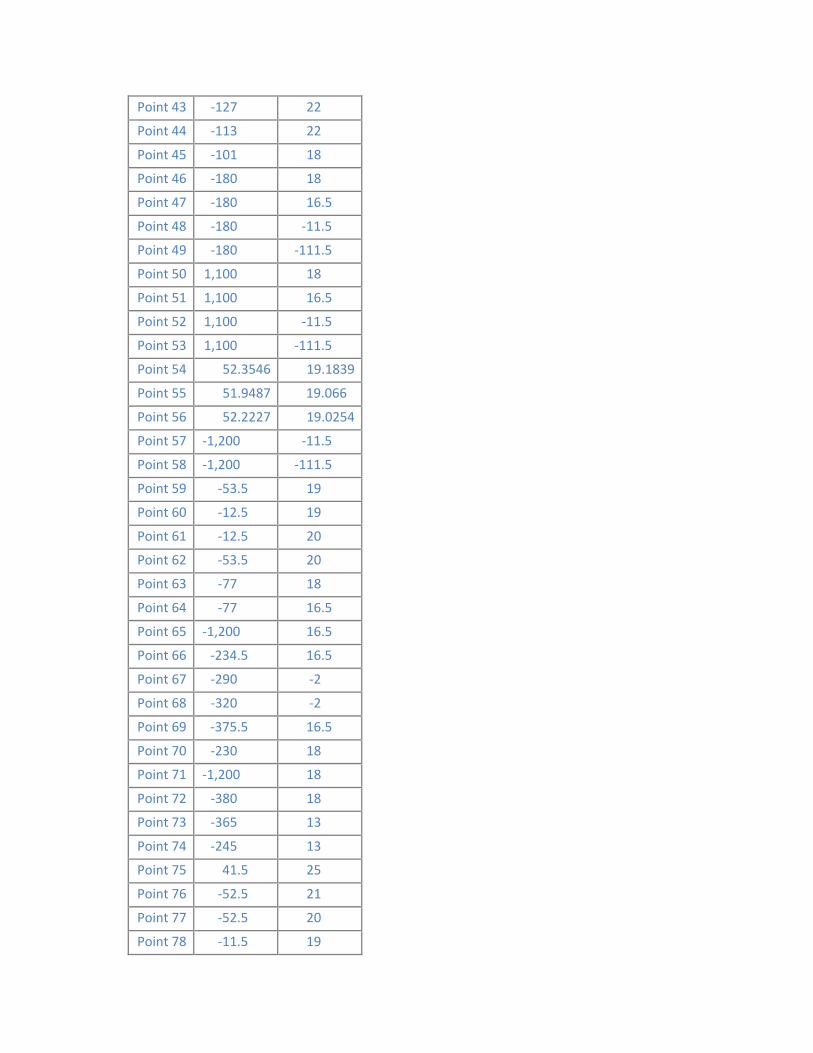
43
44
45
46
47
48
49
50
51
52
53
54
55
56
57
58
59
60
61
62
63
64
65
66
67
68
69
70
71
72
73
74
75
76
77
78
Point ‐127 22
Point ‐113 22
Point ‐101 18
Point ‐180 18
Point ‐180 16.5
Point ‐180 ‐11.5
Point ‐180 ‐111.5
Point 1,100 18
Point 1,100 16.5
Point 1,100 ‐11.5
Point 1,100 ‐111.5
Point 52.3546 19.1839
Point 51.9487 19.066
Point 52.2227 19.0254
Point ‐1,200 ‐11.5
Point ‐1,200 ‐111.5
Point ‐53.5 19
Point ‐12.5 19
Point ‐12.5 20
Point ‐53.5 20
Point ‐77 18
Point ‐77 16.5
Point ‐1,200 16.5
Point ‐234.5 16.5
Point ‐290 ‐2
Point ‐320 ‐2
Point ‐375.5 16.5
Point ‐230 18
Point ‐1,200 18
Point ‐380 18
Point ‐365 13
Point ‐245 13
Point 41.5 25
Point ‐52.5 21
Point ‐52.5 20
Point ‐11.5 19

Point 79 ‐52.5 19
Point 80 ‐52.5 18
Point 81 ‐52.5 16.5
Point 82 ‐62.5 18
Point 83 ‐53.5 18
Point 84 ‐62.5 16.5
Point 85 ‐77 17.25
Point 86 ‐62.5 17.25
Point 87 29.5 29
Regions Material Points Area (ft²)
Region
1
Matl. 1 ‐ Embankment
Material 1,6,7,8,9,10,11,12,5,78,4,3,2,76 993.93
Region
2 13,14,15,55,16,56,17,54,18,19,20 0.18474
Region
3 Matl. 8 ‐ Filter Sand 9,10,11,12,21,22,16,55,15,14,13,20,23 49.637
Region
4 Matl. 5 ‐ Soil Cement Armoring
6,7,8,9,23,24,75,87,25 69.1
Region
5
Matl. 5 ‐ Soil Cement
Armoring 22,21,26,27,28,29,30,31,32,33 22.2
Region
6
Matl. 2 ‐ Surficial
Overburden Layer 31,36,37,30 46.05
Region
7
Matl. 4 ‐ Deeper
Marine Deposits 39,38,40,41 19,019
Region
8 Matl. 1 ‐ Embankment Material
42,43,44,45 104
Region
9 Matl. 2 ‐ Surficial Overburden Layer
46,42,45,34,35,47 135
Region
10
Matl. 3 ‐ Shallow
Alluvial Deposits 47,35,39,48 2,515.5
Region
11
Matl. 4 ‐ Deeper
Marine Deposits 48,39,41,49 9,004.5
Region
12
Matl. 2 ‐ Surficial
Overburden Layer 36,50,51,37 1,500

13
14
15
16
17
18
19
20
21
22
23
24
25
26
27
28
29
30
31
Region Matl. 3 ‐ Shallow Alluvial Deposits
37,51,52,38 27,950
Region Matl. 4 ‐ Deeper Marine Deposits
38,52,53,40 1.0005e+005
Region Matl. 8 ‐ Filter Sand 20,23,22,16,56,17,54,18,19 1.5978
Region Matl. 5 ‐ Soil Cement
Armoring 23,24,33,22 1.6
Region Matl. 4 ‐ Deeper
Marine Deposits 57,48,49,58 1.02e+005
Region Matl. 3 ‐ Shallow Alluvial Deposits
35,39,38,37,30,29,28,27,26,81,84,64 5,297
Region Matl. 2 ‐ Surficial Overburden Layer
34,35,64,85,63 19.5
Region Matl. 3 ‐ Shallow
Alluvial Deposits 65,57,48,47,66,74,67,68,73,69 26,978
Region Matl. 2 ‐ Surficial
Overburden Layer 66,70,46,47 78.375
Region Matl. 2 ‐ Surficial
Overburden Layer 71,65,69,72 1,233.4
Region Matl. 9 Concrete Outfall Works
76,77,62,1 1
Region Matl. 8 ‐ Filter Sand 76,2,3,4,78,60,61,77 69
Region Matl. 8 ‐ Filter Sand 79,60,78,5,80 41
Region Matl. 2 ‐ Surficial
Overburden Layer 80,5,12,21,26,81 167.7
Region Matl. 9 Concrete
Outfall Works 82,83,59,79,80,81,84,86 16
Region Matl. 8 ‐ Filter Sand 85,64,84,86 10.875
Region Matl. 6 ‐ Fine Drainage Gravel
63,85,86,82 10.875
Region Matl. 6 ‐ Fine Drainage
Gravel 77,61,60,79 40
Region Matl. 6 ‐ Fine Drainage
Gravel 62,77,79,59 1
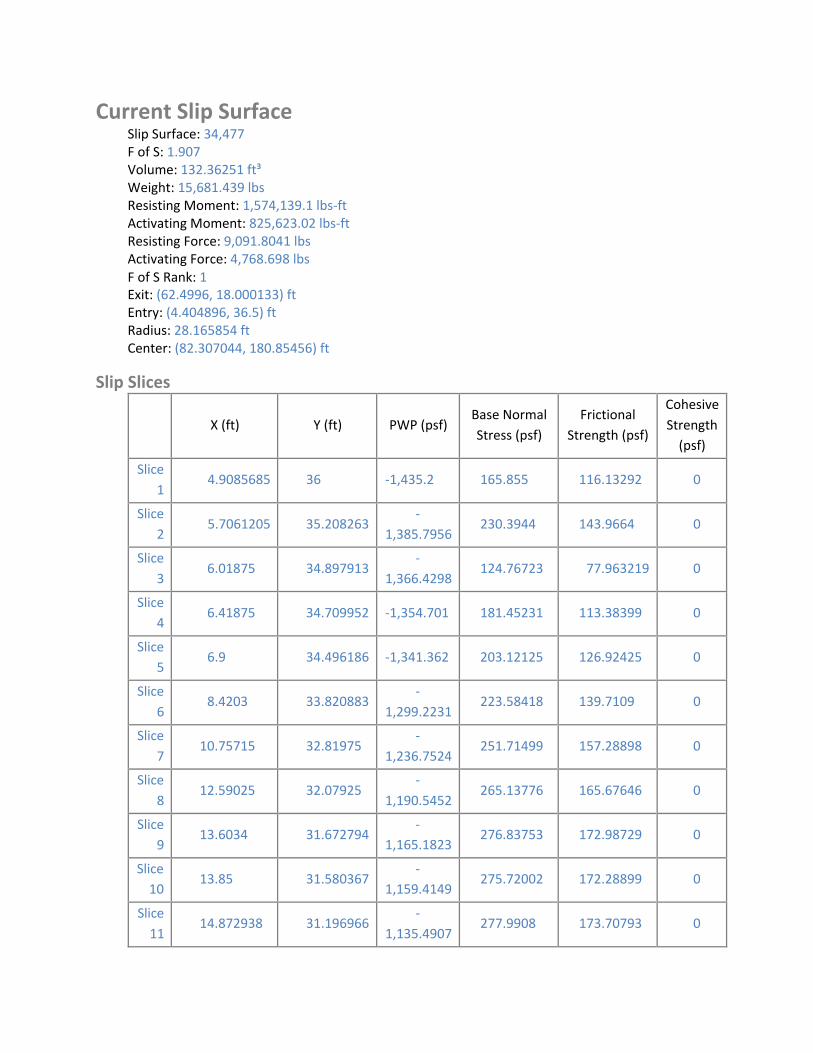
Current Slip Surface Slip Surface: 34,477 F of S: 1.907 Volume: 132.36251 ft³ Weight: 15,681.439 lbs Resisting Moment: 1,574,139.1 lbs‐ft Activating Moment: 825,623.02 lbs‐ft Resisting Force: 9,091.8041 lbs Activating Force: 4,768.698 lbs F of S Rank: 1 Exit: (62.4996, 18.000133) ft Entry: (4.404896, 36.5) ft Radius: 28.165854 ft Center: (82.307044, 180.85456) ft
Slip Slices
X (ft) Y (ft) PWP (psf) Base Normal
Stress (psf)
Frictional
Strength (psf)
Cohesive
Strength (psf)
Slice
1 4.9085685 36 ‐1,435.2 165.855 116.13292 0
Slice
2 5.7061205 35.208263
‐
1,385.7956 230.3944 143.9664 0
Slice
3 6.01875 34.897913
‐
1,366.4298 124.76723 77.963219 0
Slice
4 6.41875 34.709952 ‐1,354.701 181.45231 113.38399 0
Slice
5 6.9 34.496186 ‐1,341.362 203.12125 126.92425 0
Slice
6 8.4203 33.820883
‐
1,299.2231 223.58418 139.7109 0
Slice
7 10.75715 32.81975
‐
1,236.7524 251.71499 157.28898 0
Slice
8 12.59025 32.07925
‐
1,190.5452 265.13776 165.67646 0
Slice
9 13.6034 31.672794
‐
1,165.1823 276.83753 172.98729 0
Slice 10
13.85 31.580367 ‐
1,159.4149 275.72002 172.28899 0
Slice
11 14.872938 31.196966
‐
1,135.4907 277.9908 173.70793 0
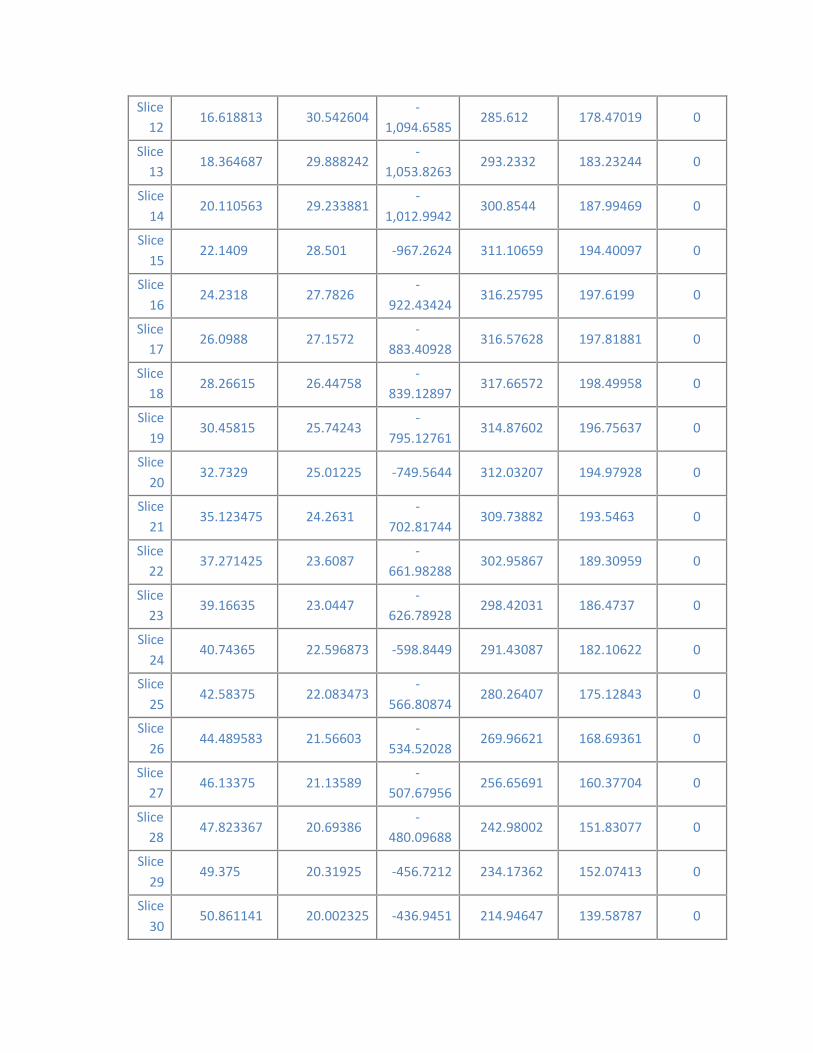
12
13
14
15
16
17
18
19
20
21
22
23
24
25
26
27
28
29
30
Slice 16.618813 30.542604
‐
1,094.6585 285.612 178.47019 0
Slice 18.364687 29.888242
‐
1,053.8263 293.2332 183.23244 0
Slice 20.110563 29.233881
‐
1,012.9942 300.8544 187.99469 0
Slice 22.1409 28.501 ‐967.2624 311.10659 194.40097 0
Slice 24.2318 27.7826
‐
922.43424 316.25795 197.6199 0
Slice 26.0988 27.1572
‐
883.40928 316.57628 197.81881 0
Slice 28.26615 26.44758
‐
839.12897 317.66572 198.49958 0
Slice 30.45815 25.74243
‐
795.12761 314.87602 196.75637 0
Slice 32.7329 25.01225 ‐749.5644 312.03207 194.97928 0
Slice 35.123475 24.2631
‐
702.81744 309.73882 193.5463 0
Slice 37.271425 23.6087
‐
661.98288 302.95867 189.30959 0
Slice 39.16635 23.0447
‐
626.78928 298.42031 186.4737 0
Slice 40.74365 22.596873 ‐598.8449 291.43087 182.10622 0
Slice 42.58375 22.083473
‐
566.80874 280.26407 175.12843 0
Slice 44.489583 21.56603
‐
534.52028 269.96621 168.69361 0
Slice 46.13375 21.13589
‐
507.67956 256.65691 160.37704 0
Slice 47.823367 20.69386
‐
480.09688 242.98002 151.83077 0
Slice 49.375 20.31925 ‐456.7212 234.17362 152.07413 0
Slice 50.861141 20.002325 ‐436.9451 214.94647 139.58787 0
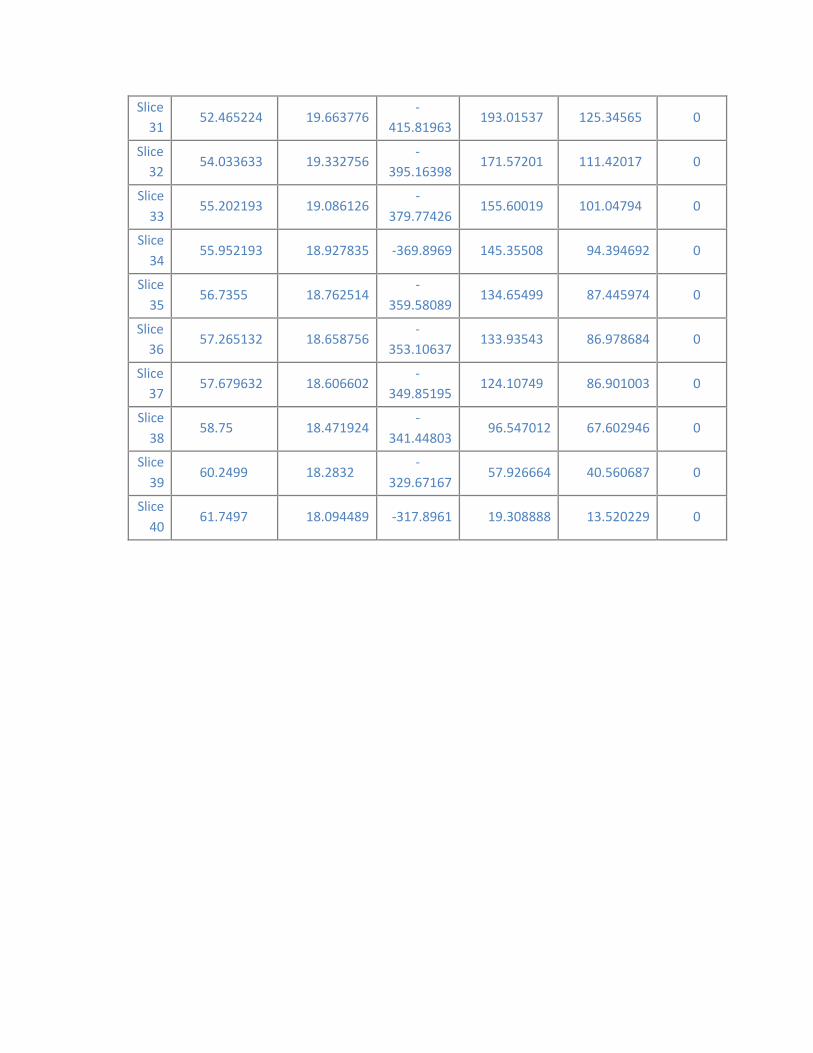
31
32
33
34
35
36
37
38
39
40
Slice 52.465224 19.663776
‐
415.81963 193.01537 125.34565 0
Slice 54.033633 19.332756
‐
395.16398 171.57201 111.42017 0
Slice 55.202193 19.086126
‐
379.77426 155.60019 101.04794 0
Slice 55.952193 18.927835 ‐369.8969 145.35508 94.394692 0
Slice 56.7355 18.762514
‐
359.58089 134.65499 87.445974 0
Slice 57.265132 18.658756
‐
353.10637 133.93543 86.978684 0
Slice 57.679632 18.606602
‐
349.85195 124.10749 86.901003 0
Slice 58.75 18.471924
‐
341.44803 96.547012 67.602946 0
Slice 60.2499 18.2832
‐
329.67167 57.926664 40.560687 0
Slice 61.7497 18.094489 ‐317.8961 19.308888 13.520229 0
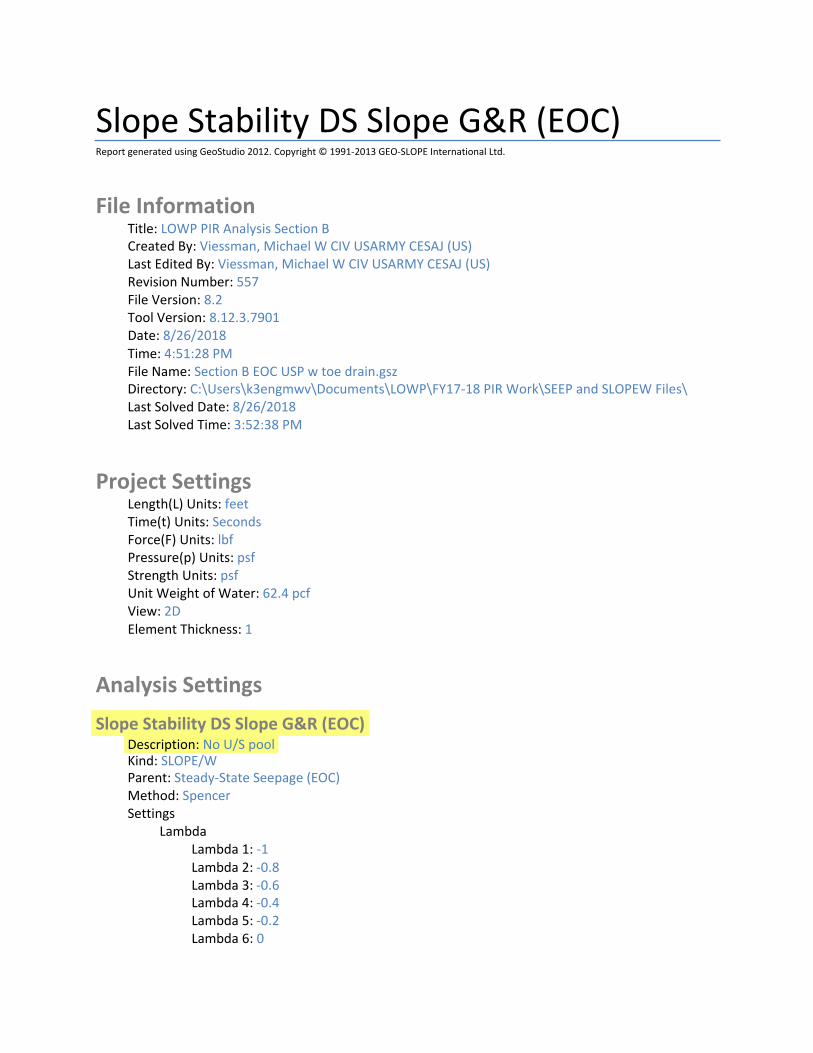
Slope Stability DS Slope G&R (EOC) Report generated using GeoStudio 2012. Copyright © 1991‐2013 GEO‐SLOPE International Ltd.
File Information Title: LOWP PIR Analysis Section B Created By: Viessman, Michael W CIV USARMY CESAJ (US) Last Edited By: Viessman, Michael W CIV USARMY CESAJ (US) Revision Number: 557 File Version: 8.2 Tool Version: 8.12.3.7901 Date: 8/26/2018 Time: 4:51:28 PM File Name: Section B EOC USP w toe drain.gsz Directory: C:\Users\k3engmwv\Documents\LOWP\FY17‐18 PIR Work\SEEP and SLOPEW Files\ Last Solved Date: 8/26/2018 Last Solved Time: 3:52:38 PM
Project Settings Length(L) Units: feet Time(t) Units: Seconds Force(F) Units: lbf Pressure(p) Units: psf Strength Units: psf Unit Weight of Water: 62.4 pcf View: 2D Element Thickness: 1
Analysis Settings
Slope Stability DS Slope G&R (EOC) Description: No U/S pool Kind: SLOPE/W Parent: Steady‐State Seepage (EOC) Method: Spencer Settings
Lambda Lambda 1: ‐1 Lambda 2: ‐0.8 Lambda 3: ‐0.6 Lambda 4: ‐0.4 Lambda 5: ‐0.2 Lambda 6: 0

Lambda 7: 0.2 Lambda 8: 0.4 Lambda 9: 0.6 Lambda 10: 0.8 Lambda 11: 1
PWP Conditions Source: Parent Analysis Slip Surface
Direction of movement: Right to Left Use Passive Mode: No Slip Surface Option: Grid and Radius Critical slip surfaces saved: 1 Optimize Critical Slip Surface Location: Yes Tension Crack
Tension Crack Option: (none) F of S Distribution
F of S Calculation Option: Constant Advanced
Number of Slices: 30 F of S Tolerance: 0.001 Minimum Slip Surface Depth: 1 ft Optimization Maximum Iterations: 2,000 Optimization Convergence Tolerance: 1e‐007 Starting Optimization Points: 8 Ending Optimization Points: 16 Complete Passes per Insertion: 1 Driving Side Maximum Convex Angle: 5 ° Resisting Side Maximum Convex Angle: 1 °
Materials
Matl. 1 ‐ Embankment Material Model: Mohr‐Coulomb Unit Weight: 125 pcf Cohesion': 0 psf Phi': 32 ° Phi‐B: 0 ° Constant Unit Wt. Above Water Table: 120 pcf
Matl. 2 ‐ Surficial Overburden Layer Model: Mohr‐Coulomb Unit Weight: 109 pcf Cohesion': 0 psf Phi': 29 ° Phi‐B: 0 ° Constant Unit Wt. Above Water Table: 106 pcf

Matl. 3 ‐ Shallow Alluvial Deposits Model: Mohr‐Coulomb Unit Weight: 123 pcf Cohesion': 0 psf Phi': 30 ° Phi‐B: 0 °
Matl. 4 ‐ Deeper Marine Deposits Model: Mohr‐Coulomb Unit Weight: 125 pcf Cohesion': 0 psf Phi': 33 ° Phi‐B: 0 °
Matl. 5 ‐ Soil Cement Armoring Model: Mohr‐Coulomb Unit Weight: 125 pcf Cohesion': 0 psf Phi': 35 ° Phi‐B: 0 ° Constant Unit Wt. Above Water Table: 120 pcf
Matl. 6 ‐ Fine Drainage Gravel Model: Mohr‐Coulomb Unit Weight: 130 pcf Cohesion': 0 psf Phi': 35 ° Phi‐B: 0 ° Constant Unit Wt. Above Water Table: 115 pcf
Matl. 8 ‐ Filter Sand Model: Mohr‐Coulomb Unit Weight: 120 pcf Cohesion': 0 psf Phi': 33 ° Phi‐B: 0 ° Constant Unit Wt. Above Water Table: 115 pcf
Matl. 9 Concrete Outfall Works Model: Bedrock (Impenetrable)
Slip Surface Grid Upper Left: (‐95.9639, 117.4947) ft Lower Left: (‐95.9639, 39.4108) ft Lower Right: (10.9033, 39.4108) ft Grid Horizontal Increment: 25

Grid Vertical Increment: 25 Left Projection Angle: 0 ° Right Projection Angle: 0 °
Slip Surface Radius Upper Left Coordinate: (‐120.2029, 18.4347) ft Upper Right Coordinate: (10.6382, 18.6036) ft Lower Left Coordinate: (‐120.08, ‐21.0305) ft Lower Right Coordinate: (9.6866, ‐21.2416) ft Number of Increments: 50 Left Projection: No Left Projection Angle: 135 ° Right Projection: No Right Projection Angle: 45 °
Slip Surface Limits Left Coordinate: (‐1,200, 18) ft Right Coordinate: (1,100, 18) ft
Surcharge Loads
Surcharge Load 1 Surcharge (Unit Weight): 200 pcf Direction: Vertical
Coordinates
X (ft) Y (ft)
‐6 37.5
6 37.5
Points X (ft) Y (ft)
Point 1 ‐53.5 21
Point 2 ‐14.5 21
Point 3 ‐14.5 30
Point 4 ‐11.5 30
Point 5 ‐11.5 18
Point 6 ‐7 36.5
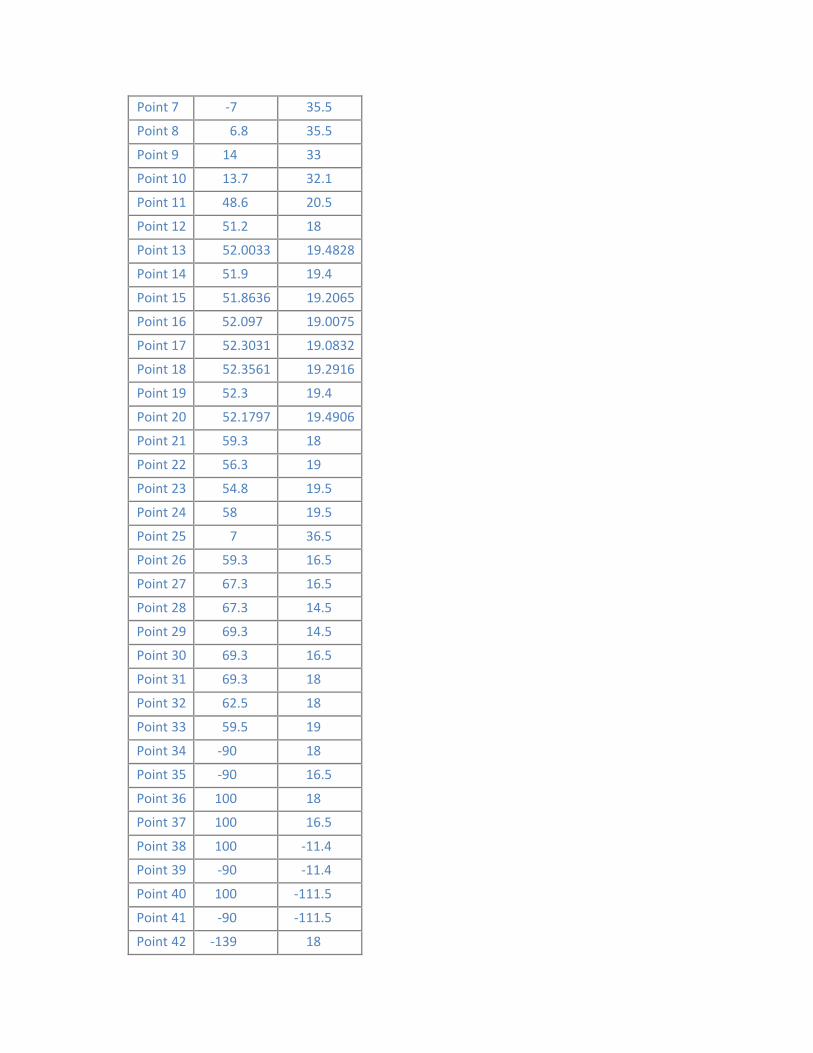
7
8
9
10
11
12
13
14
15
16
17
18
19
20
21
22
23
24
25
26
27
28
29
30
31
32
33
34
35
36
37
38
39
40
41
42
Point ‐7 35.5
Point 6.8 35.5
Point 14 33
Point 13.7 32.1
Point 48.6 20.5
Point 51.2 18
Point 52.0033 19.4828
Point 51.9 19.4
Point 51.8636 19.2065
Point 52.097 19.0075
Point 52.3031 19.0832
Point 52.3561 19.2916
Point 52.3 19.4
Point 52.1797 19.4906
Point 59.3 18
Point 56.3 19
Point 54.8 19.5
Point 58 19.5
Point 7 36.5
Point 59.3 16.5
Point 67.3 16.5
Point 67.3 14.5
Point 69.3 14.5
Point 69.3 16.5
Point 69.3 18
Point 62.5 18
Point 59.5 19
Point ‐90 18
Point ‐90 16.5
Point 100 18
Point 100 16.5
Point 100 ‐11.4
Point ‐90 ‐11.4
Point 100 ‐111.5
Point ‐90 ‐111.5
Point ‐139 18

43
44
45
46
47
48
49
50
51
52
53
54
55
56
57
58
59
60
61
62
63
64
65
66
67
68
69
70
71
72
73
74
75
76
77
78
Point ‐127 22
Point ‐113 22
Point ‐101 18
Point ‐180 18
Point ‐180 16.5
Point ‐180 ‐11.5
Point ‐180 ‐111.5
Point 1,100 18
Point 1,100 16.5
Point 1,100 ‐11.5
Point 1,100 ‐111.5
Point 52.3546 19.1839
Point 51.9487 19.066
Point 52.2227 19.0254
Point ‐1,200 ‐11.5
Point ‐1,200 ‐111.5
Point ‐53.5 19
Point ‐12.5 19
Point ‐12.5 20
Point ‐53.5 20
Point ‐77 18
Point ‐77 16.5
Point ‐1,200 16.5
Point ‐234.5 16.5
Point ‐290 ‐2
Point ‐320 ‐2
Point ‐375.5 16.5
Point ‐230 18
Point ‐1,200 18
Point ‐380 18
Point ‐365 13
Point ‐245 13
Point 41.5 25
Point ‐52.5 21
Point ‐52.5 20
Point ‐11.5 19

Point 79 ‐52.5 19
Point 80 ‐52.5 18
Point 81 ‐52.5 16.5
Point 82 ‐62.5 18
Point 83 ‐53.5 18
Point 84 ‐62.5 16.5
Point 85 ‐77 17.25
Point 86 ‐62.5 17.25
Point 87 29.5 29
Regions Material Points Area (ft²)
Region
1
Matl. 1 ‐ Embankment
Material 1,6,7,8,9,10,11,12,5,78,4,3,2,76 993.93
Region
2 13,14,15,55,16,56,17,54,18,19,20 0.18474
Region
3 Matl. 8 ‐ Filter Sand 9,10,11,12,21,22,16,55,15,14,13,20,23 49.637
Region
4 Matl. 5 ‐ Soil Cement Armoring
6,7,8,9,23,24,75,87,25 69.1
Region
5
Matl. 5 ‐ Soil Cement
Armoring 22,21,26,27,28,29,30,31,32,33 22.2
Region
6
Matl. 2 ‐ Surficial
Overburden Layer 31,36,37,30 46.05
Region
7
Matl. 4 ‐ Deeper
Marine Deposits 39,38,40,41 19,019
Region
8 Matl. 1 ‐ Embankment Material
42,43,44,45 104
Region
9 Matl. 2 ‐ Surficial Overburden Layer
46,42,45,34,35,47 135
Region
10
Matl. 3 ‐ Shallow
Alluvial Deposits 47,35,39,48 2,515.5
Region
11
Matl. 4 ‐ Deeper
Marine Deposits 48,39,41,49 9,004.5
Region
12
Matl. 2 ‐ Surficial
Overburden Layer 36,50,51,37 1,500

13
14
15
16
17
18
19
20
21
22
23
24
25
26
27
28
29
30
31
Region Matl. 3 ‐ Shallow Alluvial Deposits
37,51,52,38 27,950
Region Matl. 4 ‐ Deeper Marine Deposits
38,52,53,40 1.0005e+005
Region Matl. 8 ‐ Filter Sand 20,23,22,16,56,17,54,18,19 1.5978
Region Matl. 5 ‐ Soil Cement
Armoring 23,24,33,22 1.6
Region Matl. 4 ‐ Deeper
Marine Deposits 57,48,49,58 1.02e+005
Region Matl. 3 ‐ Shallow Alluvial Deposits
35,39,38,37,30,29,28,27,26,81,84,64 5,297
Region Matl. 2 ‐ Surficial Overburden Layer
34,35,64,85,63 19.5
Region Matl. 3 ‐ Shallow
Alluvial Deposits 65,57,48,47,66,74,67,68,73,69 26,978
Region Matl. 2 ‐ Surficial
Overburden Layer 66,70,46,47 78.375
Region Matl. 2 ‐ Surficial
Overburden Layer 71,65,69,72 1,233.4
Region Matl. 9 Concrete Outfall Works
76,77,62,1 1
Region Matl. 8 ‐ Filter Sand 76,2,3,4,78,60,61,77 69
Region Matl. 8 ‐ Filter Sand 79,60,78,5,80 41
Region Matl. 2 ‐ Surficial
Overburden Layer 80,5,12,21,26,81 167.7
Region Matl. 9 Concrete
Outfall Works 82,83,59,79,80,81,84,86 16
Region Matl. 8 ‐ Filter Sand 85,64,84,86 10.875
Region Matl. 6 ‐ Fine Drainage Gravel
63,85,86,82 10.875
Region Matl. 6 ‐ Fine Drainage
Gravel 77,61,60,79 40
Region Matl. 6 ‐ Fine Drainage
Gravel 62,77,79,59 1
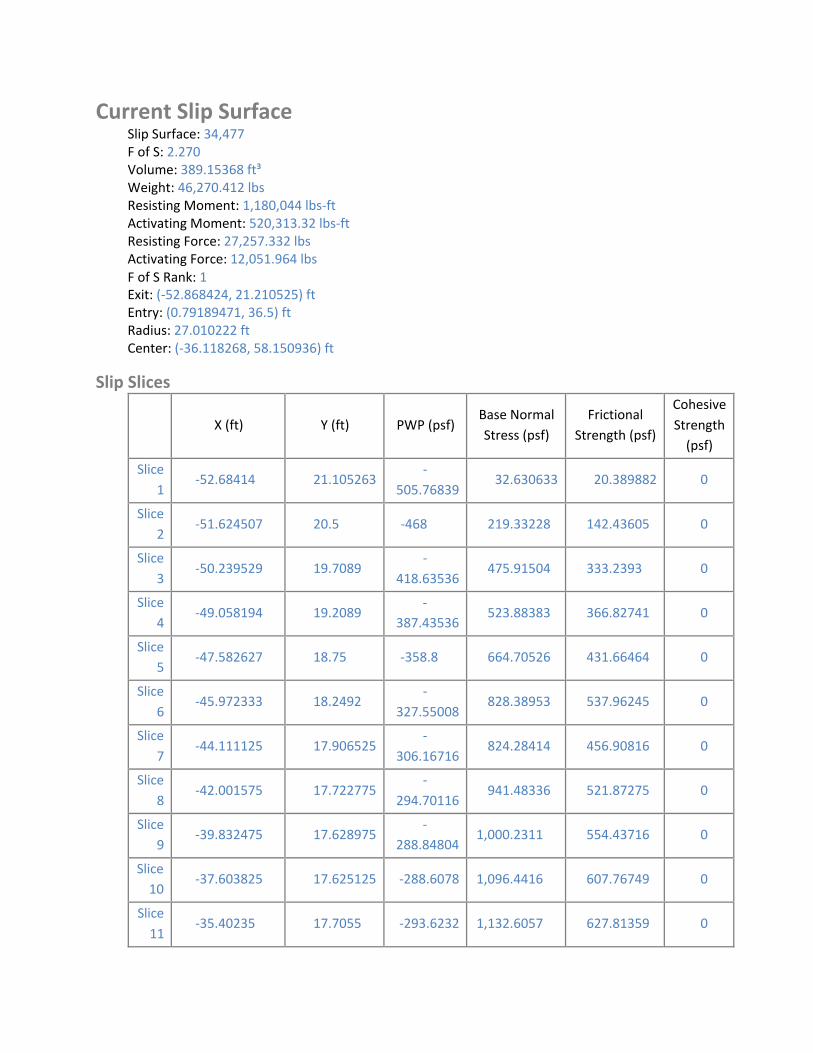
Current Slip Surface Slip Surface: 34,477 F of S: 2.270 Volume: 389.15368 ft³ Weight: 46,270.412 lbs Resisting Moment: 1,180,044 lbs‐ft Activating Moment: 520,313.32 lbs‐ft Resisting Force: 27,257.332 lbs Activating Force: 12,051.964 lbs F of S Rank: 1 Exit: (‐52.868424, 21.210525) ft Entry: (0.79189471, 36.5) ft Radius: 27.010222 ft Center: (‐36.118268, 58.150936) ft
Slip Slices
X (ft) Y (ft) PWP (psf) Base Normal
Stress (psf)
Frictional
Strength (psf)
Cohesive
Strength (psf)
Slice
1 ‐52.68414 21.105263
‐
505.76839 32.630633 20.389882 0
Slice
2 ‐51.624507 20.5 ‐468 219.33228 142.43605 0
Slice
3 ‐50.239529 19.7089
‐
418.63536 475.91504 333.2393 0
Slice
4 ‐49.058194 19.2089
‐
387.43536 523.88383 366.82741 0
Slice
5 ‐47.582627 18.75 ‐358.8 664.70526 431.66464 0
Slice
6 ‐45.972333 18.2492
‐
327.55008 828.38953 537.96245 0
Slice
7 ‐44.111125 17.906525
‐
306.16716 824.28414 456.90816 0
Slice
8 ‐42.001575 17.722775
‐
294.70116 941.48336 521.87275 0
Slice
9 ‐39.832475 17.628975
‐
288.84804 1,000.2311 554.43716 0
Slice 10
‐37.603825 17.625125 ‐288.6078 1,096.4416 607.76749 0
Slice
11 ‐35.40235 17.7055 ‐293.6232 1,132.6057 627.81359 0
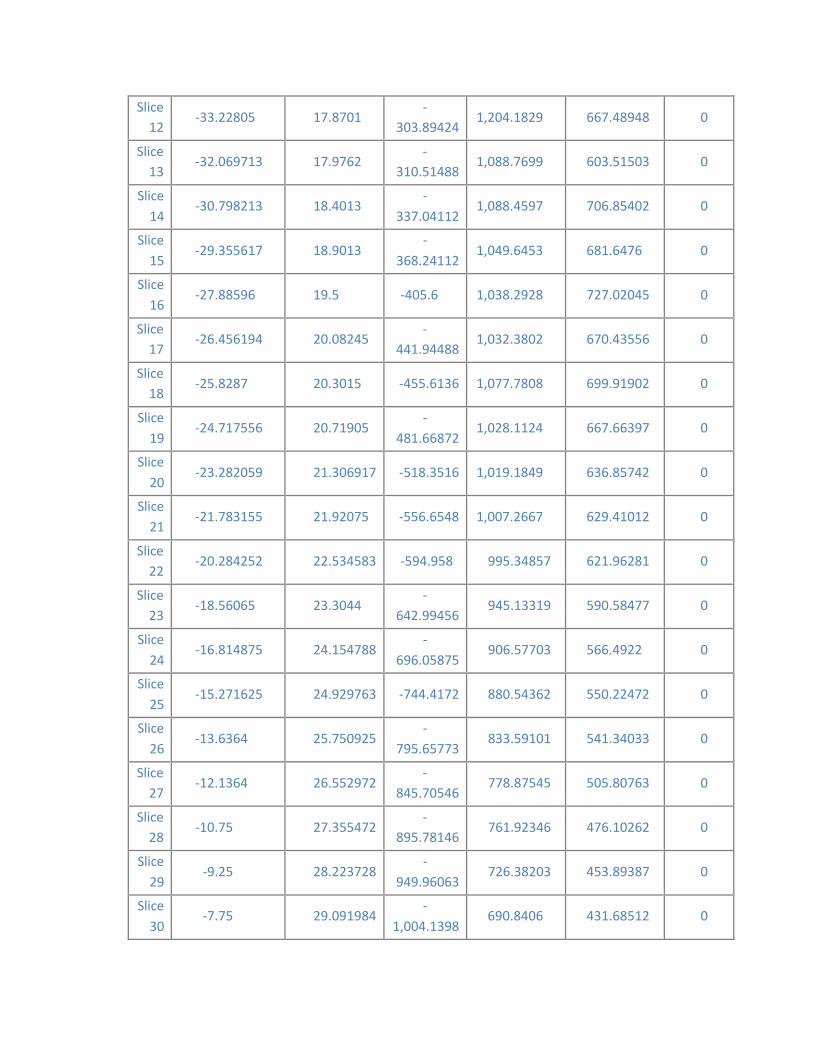
12
13
14
15
16
17
18
19
20
21
22
23
24
25
26
27
28
29
30
Slice ‐33.22805 17.8701
‐
303.89424 1,204.1829 667.48948 0
Slice ‐32.069713 17.9762
‐
310.51488 1,088.7699 603.51503 0
Slice ‐30.798213 18.4013
‐
337.04112 1,088.4597 706.85402 0
Slice ‐29.355617 18.9013
‐
368.24112 1,049.6453 681.6476 0
Slice ‐27.88596 19.5 ‐405.6 1,038.2928 727.02045 0
Slice ‐26.456194 20.08245
‐
441.94488 1,032.3802 670.43556 0
Slice ‐25.8287 20.3015 ‐455.6136 1,077.7808 699.91902 0
Slice ‐24.717556 20.71905
‐
481.66872 1,028.1124 667.66397 0
Slice ‐23.282059 21.306917 ‐518.3516 1,019.1849 636.85742 0
Slice ‐21.783155 21.92075 ‐556.6548 1,007.2667 629.41012 0
Slice ‐20.284252 22.534583 ‐594.958 995.34857 621.96281 0
Slice ‐18.56065 23.3044
‐
642.99456 945.13319 590.58477 0
Slice ‐16.814875 24.154788
‐
696.05875 906.57703 566.4922 0
Slice ‐15.271625 24.929763 ‐744.4172 880.54362 550.22472 0
Slice ‐13.6364 25.750925
‐
795.65773 833.59101 541.34033 0
Slice ‐12.1364 26.552972
‐
845.70546 778.87545 505.80763 0
Slice ‐10.75 27.355472
‐
895.78146 761.92346 476.10262 0
Slice ‐9.25 28.223728
‐
949.96063 726.38203 453.89387 0
Slice ‐7.75 29.091984
‐
1,004.1398 690.8406 431.68512 0
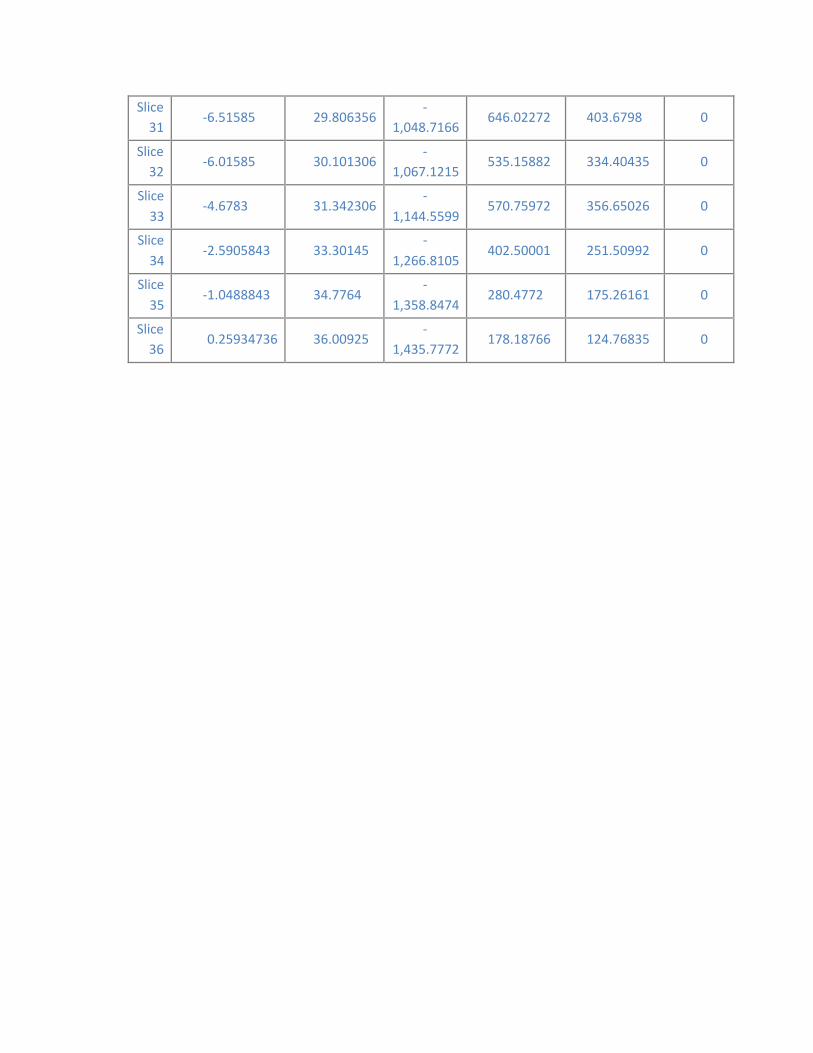
31
32
33
34
35
36
Slice ‐6.51585 29.806356
‐
1,048.7166 646.02272 403.6798 0
Slice ‐6.01585 30.101306
‐
1,067.1215 535.15882 334.40435 0
Slice ‐4.6783 31.342306
‐
1,144.5599 570.75972 356.65026 0
Slice ‐2.5905843 33.30145
‐
1,266.8105 402.50001 251.50992 0
Slice ‐1.0488843 34.7764
‐
1,358.8474 280.4772 175.26161 0
Slice 0.25934736 36.00925
‐
1,435.7772 178.18766 124.76835 0
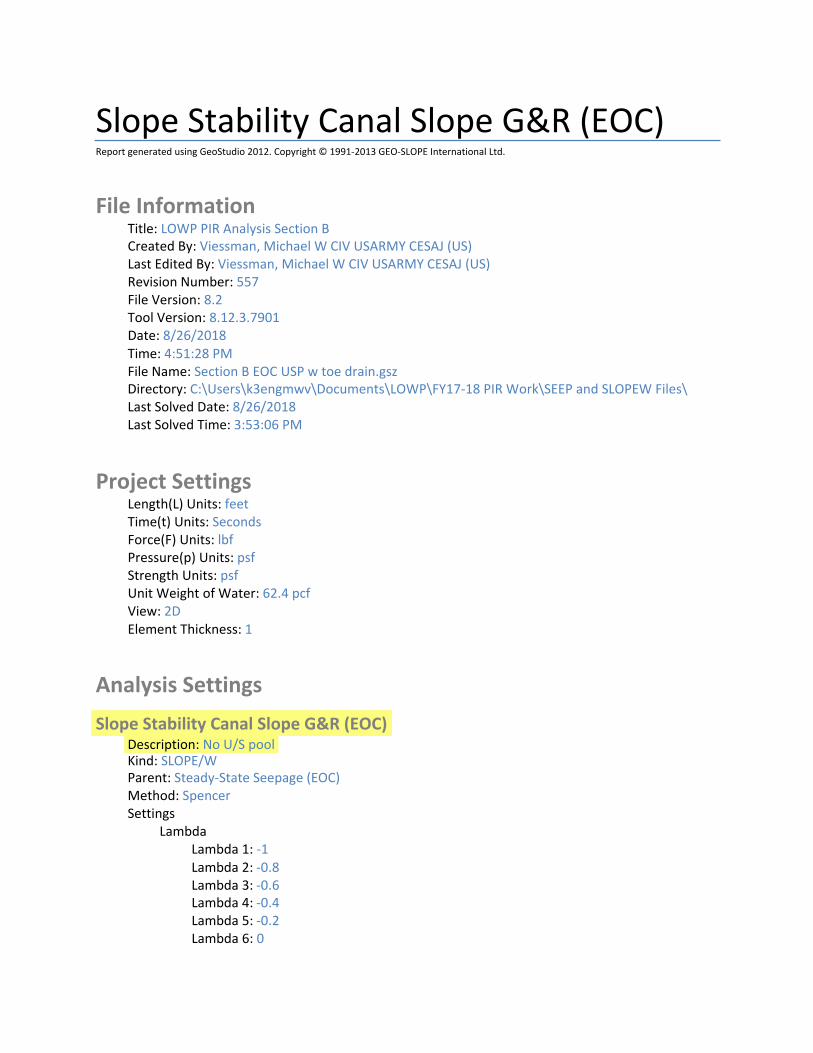
Slope Stability Canal Slope G&R (EOC) Report generated using GeoStudio 2012. Copyright © 1991‐2013 GEO‐SLOPE International Ltd.
File Information Title: LOWP PIR Analysis Section B Created By: Viessman, Michael W CIV USARMY CESAJ (US) Last Edited By: Viessman, Michael W CIV USARMY CESAJ (US) Revision Number: 557 File Version: 8.2 Tool Version: 8.12.3.7901 Date: 8/26/2018 Time: 4:51:28 PM File Name: Section B EOC USP w toe drain.gsz Directory: C:\Users\k3engmwv\Documents\LOWP\FY17‐18 PIR Work\SEEP and SLOPEW Files\ Last Solved Date: 8/26/2018 Last Solved Time: 3:53:06 PM
Project Settings Length(L) Units: feet Time(t) Units: Seconds Force(F) Units: lbf Pressure(p) Units: psf Strength Units: psf Unit Weight of Water: 62.4 pcf View: 2D Element Thickness: 1
Analysis Settings
Slope Stability Canal Slope G&R (EOC) Description: No U/S pool Kind: SLOPE/W Parent: Steady‐State Seepage (EOC) Method: Spencer Settings
Lambda Lambda 1: ‐1 Lambda 2: ‐0.8 Lambda 3: ‐0.6 Lambda 4: ‐0.4 Lambda 5: ‐0.2 Lambda 6: 0

Lambda 7: 0.2 Lambda 8: 0.4 Lambda 9: 0.6 Lambda 10: 0.8 Lambda 11: 1
PWP Conditions Source: Parent Analysis Slip Surface
Direction of movement: Right to Left Use Passive Mode: No Slip Surface Option: Grid and Radius Critical slip surfaces saved: 1 Optimize Critical Slip Surface Location: Yes Tension Crack
Tension Crack Option: (none) F of S Distribution
F of S Calculation Option: Constant Advanced
Number of Slices: 30 F of S Tolerance: 0.001 Minimum Slip Surface Depth: 1 ft Optimization Maximum Iterations: 2,000 Optimization Convergence Tolerance: 1e‐007 Starting Optimization Points: 8 Ending Optimization Points: 16 Complete Passes per Insertion: 1 Driving Side Maximum Convex Angle: 5 ° Resisting Side Maximum Convex Angle: 1 °
Materials
Matl. 1 ‐ Embankment Material Model: Mohr‐Coulomb Unit Weight: 125 pcf Cohesion': 0 psf Phi': 32 ° Phi‐B: 0 ° Constant Unit Wt. Above Water Table: 120 pcf
Matl. 2 ‐ Surficial Overburden Layer Model: Mohr‐Coulomb Unit Weight: 109 pcf Cohesion': 0 psf Phi': 29 ° Phi‐B: 0 ° Constant Unit Wt. Above Water Table: 106 pcf

Matl. 3 ‐ Shallow Alluvial Deposits Model: Mohr‐Coulomb Unit Weight: 123 pcf Cohesion': 0 psf Phi': 30 ° Phi‐B: 0 °
Matl. 4 ‐ Deeper Marine Deposits Model: Mohr‐Coulomb Unit Weight: 125 pcf Cohesion': 0 psf Phi': 33 ° Phi‐B: 0 °
Matl. 5 ‐ Soil Cement Armoring Model: Mohr‐Coulomb Unit Weight: 125 pcf Cohesion': 0 psf Phi': 35 ° Phi‐B: 0 ° Constant Unit Wt. Above Water Table: 120 pcf
Matl. 6 ‐ Fine Drainage Gravel Model: Mohr‐Coulomb Unit Weight: 130 pcf Cohesion': 0 psf Phi': 35 ° Phi‐B: 0 ° Constant Unit Wt. Above Water Table: 115 pcf
Matl. 8 ‐ Filter Sand Model: Mohr‐Coulomb Unit Weight: 120 pcf Cohesion': 0 psf Phi': 33 ° Phi‐B: 0 ° Constant Unit Wt. Above Water Table: 115 pcf
Matl. 9 Concrete Outfall Works Model: Bedrock (Impenetrable)
Slip Surface Grid Upper Left: (‐311.2639, 113.4947) ft Lower Left: (‐311.2639, 35.4108) ft Lower Right: (‐204.3967, 35.4108) ft Grid Horizontal Increment: 25
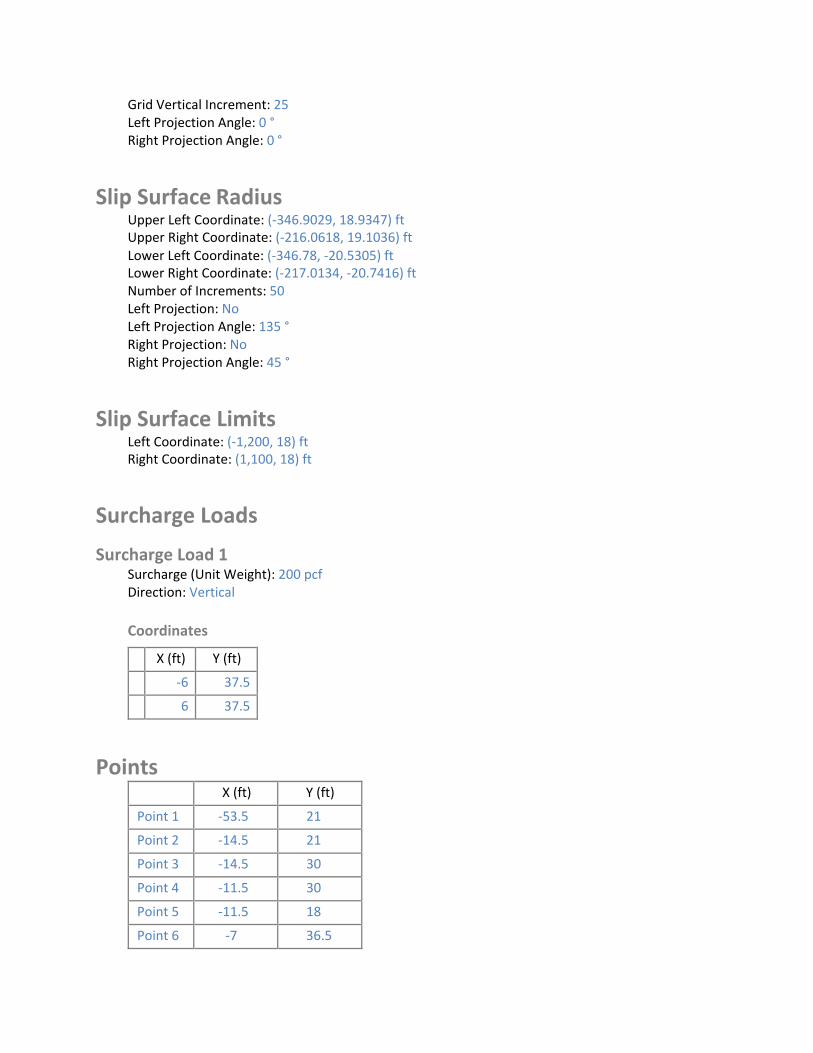
Grid Vertical Increment: 25 Left Projection Angle: 0 ° Right Projection Angle: 0 °
Slip Surface Radius Upper Left Coordinate: (‐346.9029, 18.9347) ft Upper Right Coordinate: (‐216.0618, 19.1036) ft Lower Left Coordinate: (‐346.78, ‐20.5305) ft Lower Right Coordinate: (‐217.0134, ‐20.7416) ft Number of Increments: 50 Left Projection: No Left Projection Angle: 135 ° Right Projection: No Right Projection Angle: 45 °
Slip Surface Limits Left Coordinate: (‐1,200, 18) ft Right Coordinate: (1,100, 18) ft
Surcharge Loads
Surcharge Load 1 Surcharge (Unit Weight): 200 pcf Direction: Vertical
Coordinates
X (ft) Y (ft)
‐6 37.5
6 37.5
Points X (ft) Y (ft)
Point 1 ‐53.5 21
Point 2 ‐14.5 21
Point 3 ‐14.5 30
Point 4 ‐11.5 30
Point 5 ‐11.5 18
Point 6 ‐7 36.5

7
8
9
10
11
12
13
14
15
16
17
18
19
20
21
22
23
24
25
26
27
28
29
30
31
32
33
34
35
36
37
38
39
40
41
42
Point ‐7 35.5
Point 6.8 35.5
Point 14 33
Point 13.7 32.1
Point 48.6 20.5
Point 51.2 18
Point 52.0033 19.4828
Point 51.9 19.4
Point 51.8636 19.2065
Point 52.097 19.0075
Point 52.3031 19.0832
Point 52.3561 19.2916
Point 52.3 19.4
Point 52.1797 19.4906
Point 59.3 18
Point 56.3 19
Point 54.8 19.5
Point 58 19.5
Point 7 36.5
Point 59.3 16.5
Point 67.3 16.5
Point 67.3 14.5
Point 69.3 14.5
Point 69.3 16.5
Point 69.3 18
Point 62.5 18
Point 59.5 19
Point ‐90 18
Point ‐90 16.5
Point 100 18
Point 100 16.5
Point 100 ‐11.4
Point ‐90 ‐11.4
Point 100 ‐111.5
Point ‐90 ‐111.5
Point ‐139 18

43
44
45
46
47
48
49
50
51
52
53
54
55
56
57
58
59
60
61
62
63
64
65
66
67
68
69
70
71
72
73
74
75
76
77
78
Point ‐127 22
Point ‐113 22
Point ‐101 18
Point ‐180 18
Point ‐180 16.5
Point ‐180 ‐11.5
Point ‐180 ‐111.5
Point 1,100 18
Point 1,100 16.5
Point 1,100 ‐11.5
Point 1,100 ‐111.5
Point 52.3546 19.1839
Point 51.9487 19.066
Point 52.2227 19.0254
Point ‐1,200 ‐11.5
Point ‐1,200 ‐111.5
Point ‐53.5 19
Point ‐12.5 19
Point ‐12.5 20
Point ‐53.5 20
Point ‐77 18
Point ‐77 16.5
Point ‐1,200 16.5
Point ‐234.5 16.5
Point ‐290 ‐2
Point ‐320 ‐2
Point ‐375.5 16.5
Point ‐230 18
Point ‐1,200 18
Point ‐380 18
Point ‐365 13
Point ‐245 13
Point 41.5 25
Point ‐52.5 21
Point ‐52.5 20
Point ‐11.5 19
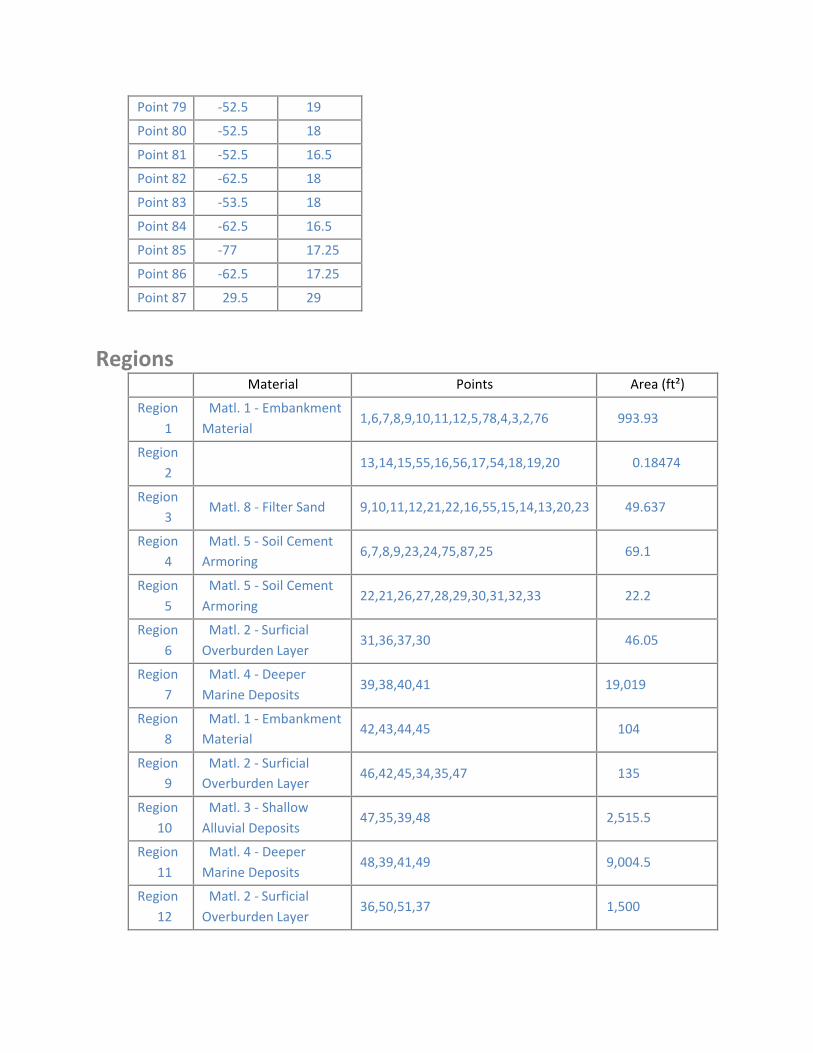
Point 79 ‐52.5 19
Point 80 ‐52.5 18
Point 81 ‐52.5 16.5
Point 82 ‐62.5 18
Point 83 ‐53.5 18
Point 84 ‐62.5 16.5
Point 85 ‐77 17.25
Point 86 ‐62.5 17.25
Point 87 29.5 29
Regions Material Points Area (ft²)
Region
1
Matl. 1 ‐ Embankment
Material 1,6,7,8,9,10,11,12,5,78,4,3,2,76 993.93
Region
2 13,14,15,55,16,56,17,54,18,19,20 0.18474
Region
3 Matl. 8 ‐ Filter Sand 9,10,11,12,21,22,16,55,15,14,13,20,23 49.637
Region
4 Matl. 5 ‐ Soil Cement Armoring
6,7,8,9,23,24,75,87,25 69.1
Region
5
Matl. 5 ‐ Soil Cement
Armoring 22,21,26,27,28,29,30,31,32,33 22.2
Region
6
Matl. 2 ‐ Surficial
Overburden Layer 31,36,37,30 46.05
Region
7
Matl. 4 ‐ Deeper
Marine Deposits 39,38,40,41 19,019
Region
8 Matl. 1 ‐ Embankment Material
42,43,44,45 104
Region
9 Matl. 2 ‐ Surficial Overburden Layer
46,42,45,34,35,47 135
Region
10
Matl. 3 ‐ Shallow
Alluvial Deposits 47,35,39,48 2,515.5
Region
11
Matl. 4 ‐ Deeper
Marine Deposits 48,39,41,49 9,004.5
Region
12
Matl. 2 ‐ Surficial
Overburden Layer 36,50,51,37 1,500
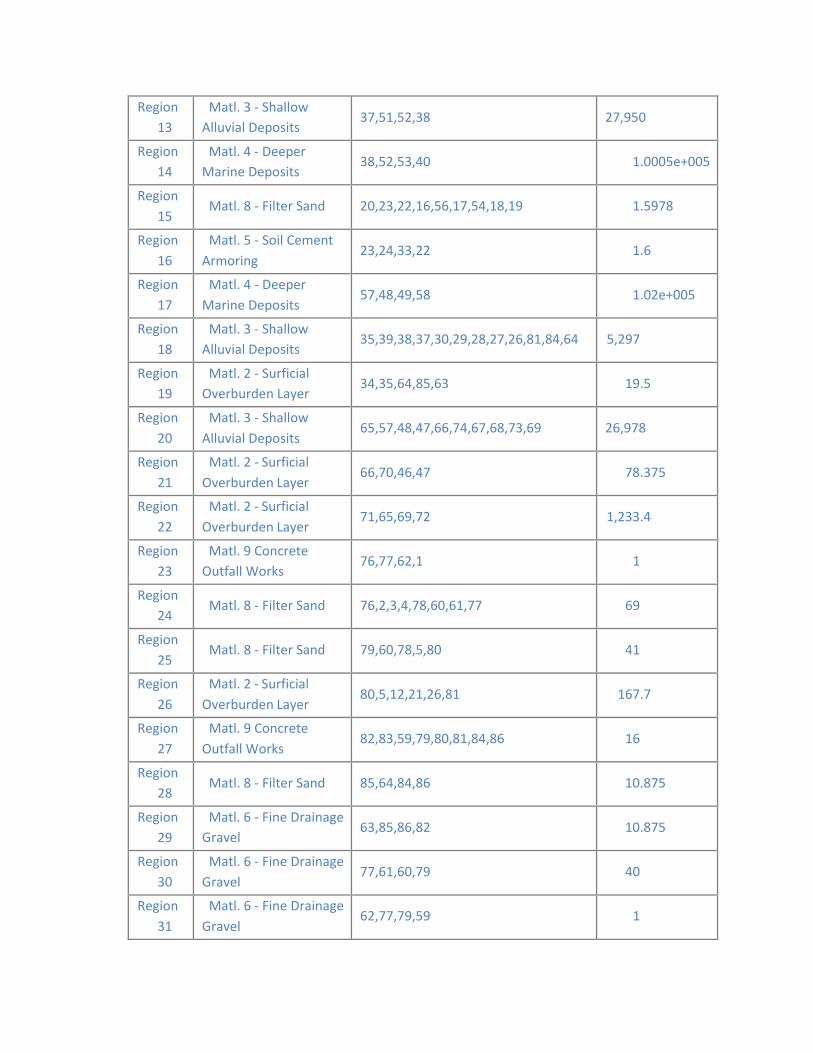
13
14
15
16
17
18
19
20
21
22
23
24
25
26
27
28
29
30
31
Region Matl. 3 ‐ Shallow Alluvial Deposits
37,51,52,38 27,950
Region Matl. 4 ‐ Deeper Marine Deposits
38,52,53,40 1.0005e+005
Region Matl. 8 ‐ Filter Sand 20,23,22,16,56,17,54,18,19 1.5978
Region Matl. 5 ‐ Soil Cement
Armoring 23,24,33,22 1.6
Region Matl. 4 ‐ Deeper
Marine Deposits 57,48,49,58 1.02e+005
Region Matl. 3 ‐ Shallow Alluvial Deposits
35,39,38,37,30,29,28,27,26,81,84,64 5,297
Region Matl. 2 ‐ Surficial Overburden Layer
34,35,64,85,63 19.5
Region Matl. 3 ‐ Shallow
Alluvial Deposits 65,57,48,47,66,74,67,68,73,69 26,978
Region Matl. 2 ‐ Surficial
Overburden Layer 66,70,46,47 78.375
Region Matl. 2 ‐ Surficial
Overburden Layer 71,65,69,72 1,233.4
Region Matl. 9 Concrete Outfall Works
76,77,62,1 1
Region Matl. 8 ‐ Filter Sand 76,2,3,4,78,60,61,77 69
Region Matl. 8 ‐ Filter Sand 79,60,78,5,80 41
Region Matl. 2 ‐ Surficial
Overburden Layer 80,5,12,21,26,81 167.7
Region Matl. 9 Concrete
Outfall Works 82,83,59,79,80,81,84,86 16
Region Matl. 8 ‐ Filter Sand 85,64,84,86 10.875
Region Matl. 6 ‐ Fine Drainage Gravel
63,85,86,82 10.875
Region Matl. 6 ‐ Fine Drainage
Gravel 77,61,60,79 40
Region Matl. 6 ‐ Fine Drainage
Gravel 62,77,79,59 1
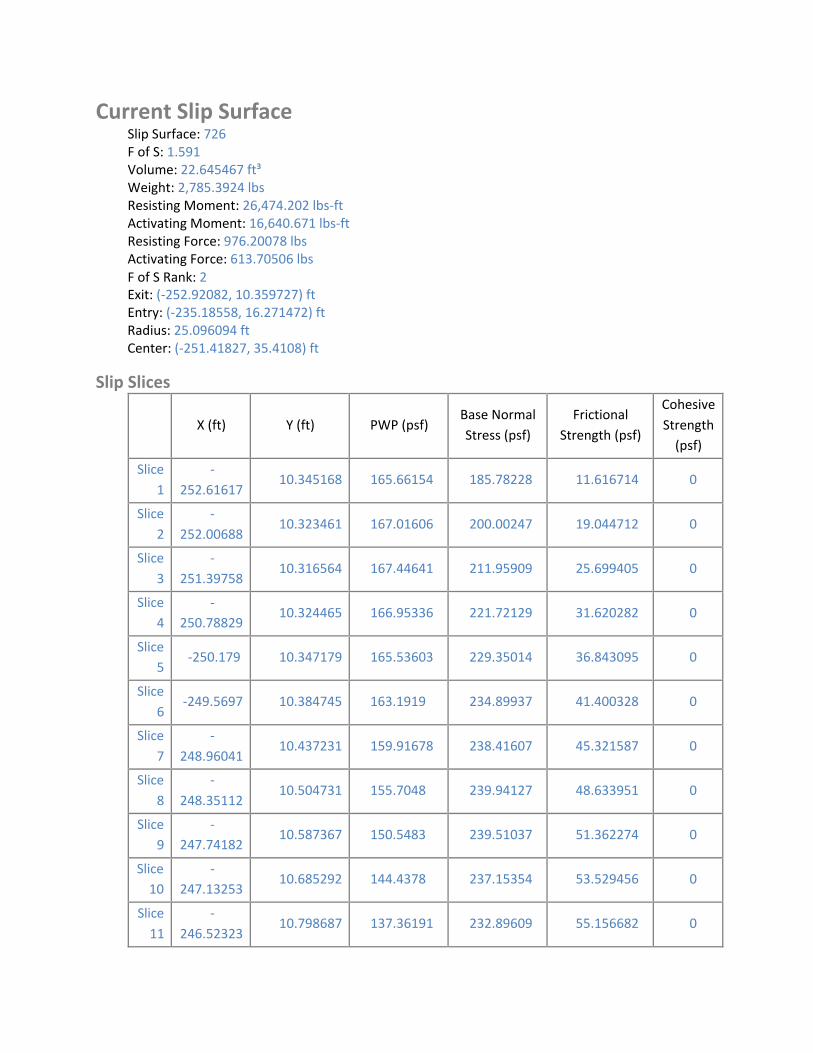
Current Slip Surface Slip Surface: 726 F of S: 1.591 Volume: 22.645467 ft³ Weight: 2,785.3924 lbs Resisting Moment: 26,474.202 lbs‐ft Activating Moment: 16,640.671 lbs‐ft Resisting Force: 976.20078 lbs Activating Force: 613.70506 lbs F of S Rank: 2 Exit: (‐252.92082, 10.359727) ft Entry: (‐235.18558, 16.271472) ft Radius: 25.096094 ft Center: (‐251.41827, 35.4108) ft
Slip Slices
X (ft) Y (ft) PWP (psf) Base Normal
Stress (psf)
Frictional
Strength (psf)
Cohesive
Strength (psf)
Slice
1
‐
252.61617 10.345168 165.66154 185.78228 11.616714 0
Slice
2
‐
252.00688 10.323461 167.01606 200.00247 19.044712 0
Slice
3
‐
251.39758 10.316564 167.44641 211.95909 25.699405 0
Slice
4 ‐
250.78829 10.324465 166.95336 221.72129 31.620282 0
Slice
5 ‐250.179 10.347179 165.53603 229.35014 36.843095 0
Slice
6 ‐249.5697 10.384745 163.1919 234.89937 41.400328 0
Slice
7
‐
248.96041 10.437231 159.91678 238.41607 45.321587 0
Slice
8
‐
248.35112 10.504731 155.7048 239.94127 48.633951 0
Slice
9
‐
247.74182 10.587367 150.5483 239.51037 51.362274 0
Slice 10
‐
247.13253 10.685292 144.4378 237.15354 53.529456 0
Slice
11
‐
246.52323 10.798687 137.36191 232.89609 55.156682 0
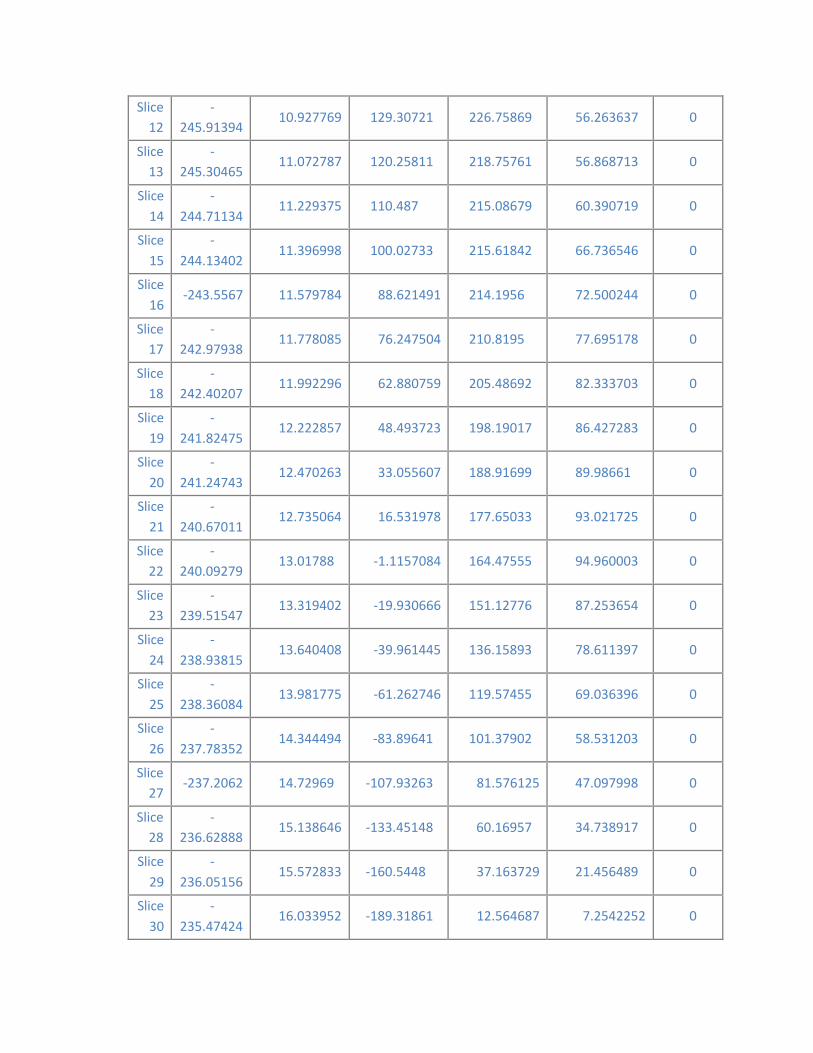
12
13
14
15
16
17
18
19
20
21
22
23
24
25
26
27
28
29
30
Slice ‐
245.91394 10.927769 129.30721 226.75869 56.263637 0
Slice ‐
245.30465 11.072787 120.25811 218.75761 56.868713 0
Slice ‐
244.71134 11.229375 110.487 215.08679 60.390719 0
Slice ‐
244.13402 11.396998 100.02733 215.61842 66.736546 0
Slice ‐243.5567 11.579784 88.621491 214.1956 72.500244 0
Slice ‐
242.97938 11.778085 76.247504 210.8195 77.695178 0
Slice ‐
242.40207 11.992296 62.880759 205.48692 82.333703 0
Slice ‐
241.82475 12.222857 48.493723 198.19017 86.427283 0
Slice ‐
241.24743 12.470263 33.055607 188.91699 89.98661 0
Slice ‐
240.67011 12.735064 16.531978 177.65033 93.021725 0
Slice ‐
240.09279 13.01788 ‐1.1157084 164.47555 94.960003 0
Slice ‐
239.51547 13.319402 ‐19.930666 151.12776 87.253654 0
Slice ‐
238.93815 13.640408 ‐39.961445 136.15893 78.611397 0
Slice ‐
238.36084 13.981775 ‐61.262746 119.57455 69.036396 0
Slice ‐
237.78352 14.344494 ‐83.89641 101.37902 58.531203 0
Slice ‐237.2062 14.72969 ‐107.93263 81.576125 47.097998 0
Slice ‐
236.62888 15.138646 ‐133.45148 60.16957 34.738917 0
Slice ‐
236.05156 15.572833 ‐160.5448 37.163729 21.456489 0
Slice ‐
235.47424 16.033952 ‐189.31861 12.564687 7.2542252 0
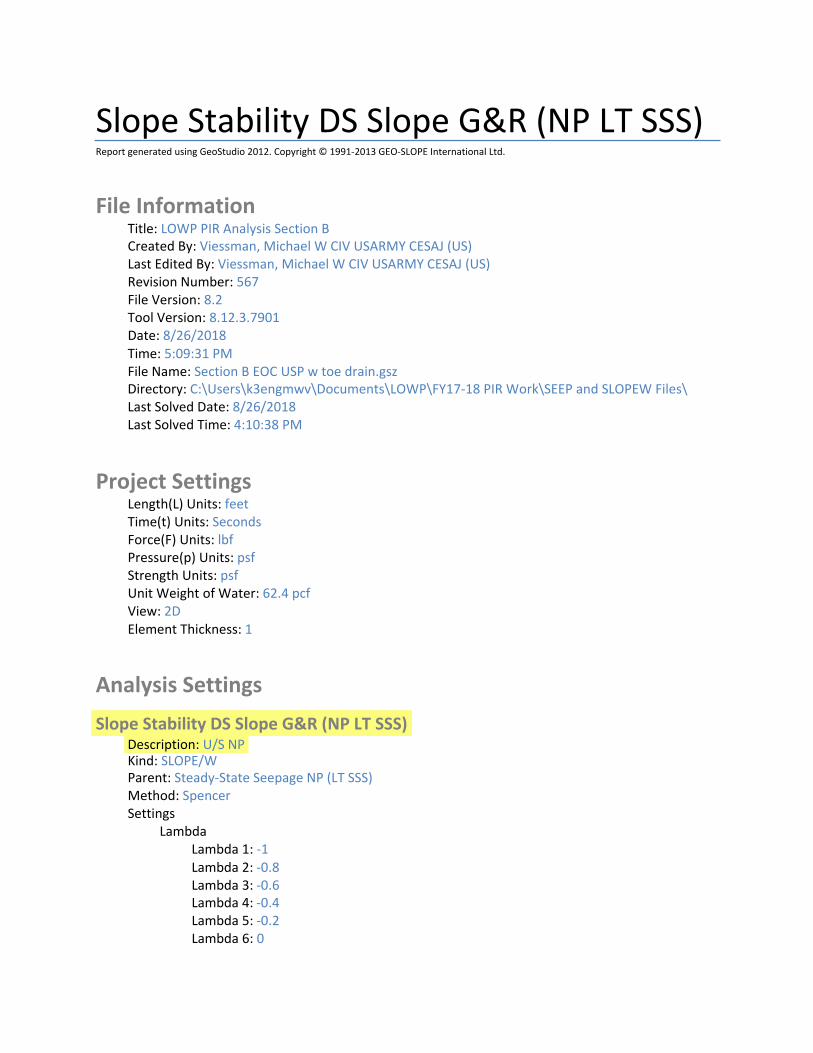
Slope Stability DS Slope G&R (NP LT SSS) Report generated using GeoStudio 2012. Copyright © 1991‐2013 GEO‐SLOPE International Ltd.
File Information Title: LOWP PIR Analysis Section B Created By: Viessman, Michael W CIV USARMY CESAJ (US) Last Edited By: Viessman, Michael W CIV USARMY CESAJ (US) Revision Number: 567 File Version: 8.2 Tool Version: 8.12.3.7901 Date: 8/26/2018 Time: 5:09:31 PM File Name: Section B EOC USP w toe drain.gsz Directory: C:\Users\k3engmwv\Documents\LOWP\FY17‐18 PIR Work\SEEP and SLOPEW Files\ Last Solved Date: 8/26/2018 Last Solved Time: 4:10:38 PM
Project Settings Length(L) Units: feet Time(t) Units: Seconds Force(F) Units: lbf Pressure(p) Units: psf Strength Units: psf Unit Weight of Water: 62.4 pcf View: 2D Element Thickness: 1
Analysis Settings
Slope Stability DS Slope G&R (NP LT SSS) Description: U/S NP Kind: SLOPE/W Parent: Steady‐State Seepage NP (LT SSS) Method: Spencer Settings
Lambda Lambda 1: ‐1 Lambda 2: ‐0.8 Lambda 3: ‐0.6 Lambda 4: ‐0.4 Lambda 5: ‐0.2 Lambda 6: 0

Lambda 7: 0.2 Lambda 8: 0.4 Lambda 9: 0.6 Lambda 10: 0.8 Lambda 11: 1
PWP Conditions Source: Parent Analysis Slip Surface
Direction of movement: Right to Left Use Passive Mode: No Slip Surface Option: Grid and Radius Critical slip surfaces saved: 1 Optimize Critical Slip Surface Location: Yes Tension Crack
Tension Crack Option: (none) F of S Distribution
F of S Calculation Option: Constant Advanced
Number of Slices: 30 F of S Tolerance: 0.001 Minimum Slip Surface Depth: 1 ft Optimization Maximum Iterations: 2,000 Optimization Convergence Tolerance: 1e‐007 Starting Optimization Points: 8 Ending Optimization Points: 16 Complete Passes per Insertion: 1 Driving Side Maximum Convex Angle: 5 ° Resisting Side Maximum Convex Angle: 1 °
Materials
Matl. 1 ‐ Embankment Material Model: Mohr‐Coulomb Unit Weight: 125 pcf Cohesion': 0 psf Phi': 32 ° Phi‐B: 0 ° Constant Unit Wt. Above Water Table: 120 pcf
Matl. 2 ‐ Surficial Overburden Layer Model: Mohr‐Coulomb Unit Weight: 109 pcf Cohesion': 0 psf Phi': 29 ° Phi‐B: 0 ° Constant Unit Wt. Above Water Table: 106 pcf
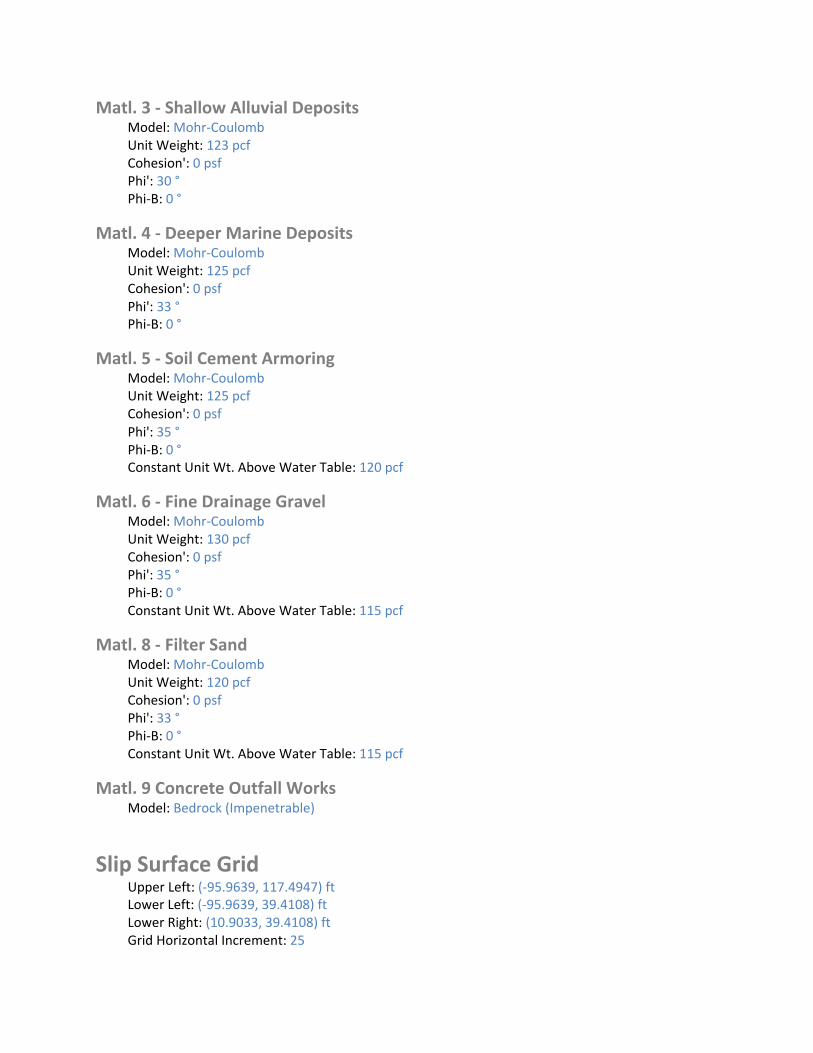
Matl. 3 ‐ Shallow Alluvial Deposits Model: Mohr‐Coulomb Unit Weight: 123 pcf Cohesion': 0 psf Phi': 30 ° Phi‐B: 0 °
Matl. 4 ‐ Deeper Marine Deposits Model: Mohr‐Coulomb Unit Weight: 125 pcf Cohesion': 0 psf Phi': 33 ° Phi‐B: 0 °
Matl. 5 ‐ Soil Cement Armoring Model: Mohr‐Coulomb Unit Weight: 125 pcf Cohesion': 0 psf Phi': 35 ° Phi‐B: 0 ° Constant Unit Wt. Above Water Table: 120 pcf
Matl. 6 ‐ Fine Drainage Gravel Model: Mohr‐Coulomb Unit Weight: 130 pcf Cohesion': 0 psf Phi': 35 ° Phi‐B: 0 ° Constant Unit Wt. Above Water Table: 115 pcf
Matl. 8 ‐ Filter Sand Model: Mohr‐Coulomb Unit Weight: 120 pcf Cohesion': 0 psf Phi': 33 ° Phi‐B: 0 ° Constant Unit Wt. Above Water Table: 115 pcf
Matl. 9 Concrete Outfall Works Model: Bedrock (Impenetrable)
Slip Surface Grid Upper Left: (‐95.9639, 117.4947) ft Lower Left: (‐95.9639, 39.4108) ft Lower Right: (10.9033, 39.4108) ft Grid Horizontal Increment: 25
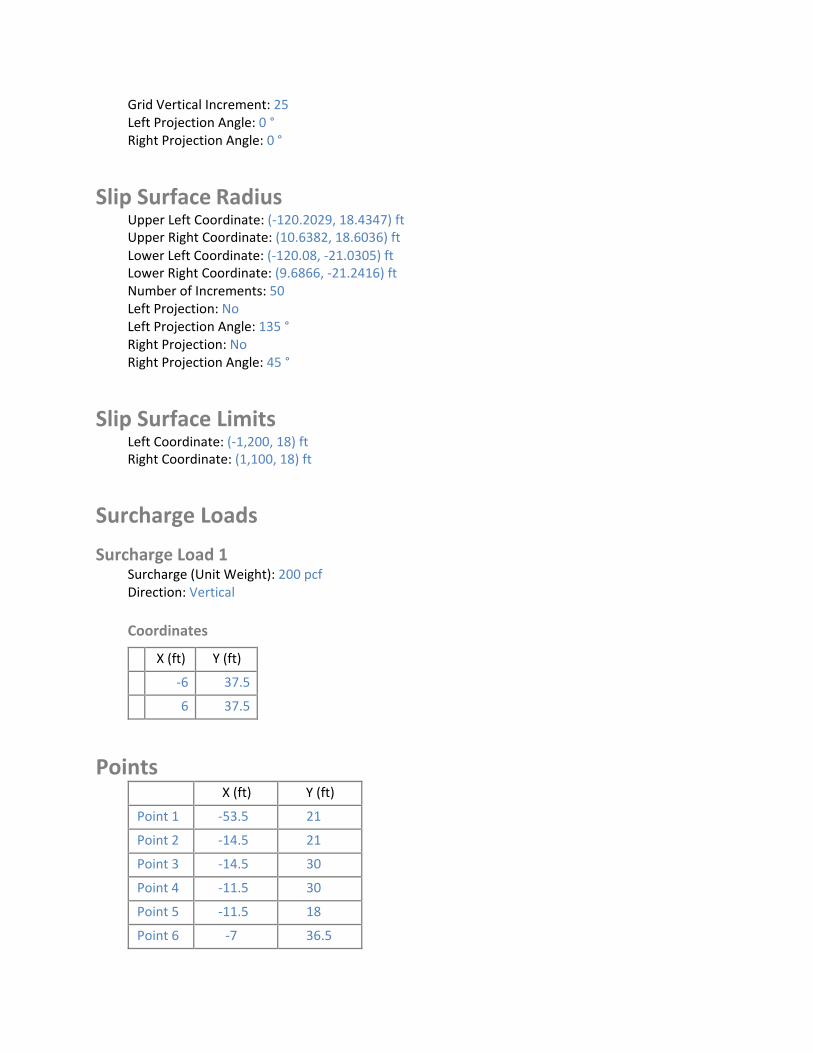
Grid Vertical Increment: 25 Left Projection Angle: 0 ° Right Projection Angle: 0 °
Slip Surface Radius Upper Left Coordinate: (‐120.2029, 18.4347) ft Upper Right Coordinate: (10.6382, 18.6036) ft Lower Left Coordinate: (‐120.08, ‐21.0305) ft Lower Right Coordinate: (9.6866, ‐21.2416) ft Number of Increments: 50 Left Projection: No Left Projection Angle: 135 ° Right Projection: No Right Projection Angle: 45 °
Slip Surface Limits Left Coordinate: (‐1,200, 18) ft Right Coordinate: (1,100, 18) ft
Surcharge Loads
Surcharge Load 1 Surcharge (Unit Weight): 200 pcf Direction: Vertical
Coordinates
X (ft) Y (ft)
‐6 37.5
6 37.5
Points X (ft) Y (ft)
Point 1 ‐53.5 21
Point 2 ‐14.5 21
Point 3 ‐14.5 30
Point 4 ‐11.5 30
Point 5 ‐11.5 18
Point 6 ‐7 36.5

7
8
9
10
11
12
13
14
15
16
17
18
19
20
21
22
23
24
25
26
27
28
29
30
31
32
33
34
35
36
37
38
39
40
41
42
Point ‐7 35.5
Point 6.8 35.5
Point 14 33
Point 13.7 32.1
Point 48.6 20.5
Point 51.2 18
Point 52.0033 19.4828
Point 51.9 19.4
Point 51.8636 19.2065
Point 52.097 19.0075
Point 52.3031 19.0832
Point 52.3561 19.2916
Point 52.3 19.4
Point 52.1797 19.4906
Point 59.3 18
Point 56.3 19
Point 54.8 19.5
Point 58 19.5
Point 7 36.5
Point 59.3 16.5
Point 67.3 16.5
Point 67.3 14.5
Point 69.3 14.5
Point 69.3 16.5
Point 69.3 18
Point 62.5 18
Point 59.5 19
Point ‐90 18
Point ‐90 16.5
Point 100 18
Point 100 16.5
Point 100 ‐11.4
Point ‐90 ‐11.4
Point 100 ‐111.5
Point ‐90 ‐111.5
Point ‐139 18

43
44
45
46
47
48
49
50
51
52
53
54
55
56
57
58
59
60
61
62
63
64
65
66
67
68
69
70
71
72
73
74
75
76
77
78
Point ‐127 22
Point ‐113 22
Point ‐101 18
Point ‐180 18
Point ‐180 16.5
Point ‐180 ‐11.5
Point ‐180 ‐111.5
Point 1,100 18
Point 1,100 16.5
Point 1,100 ‐11.5
Point 1,100 ‐111.5
Point 52.3546 19.1839
Point 51.9487 19.066
Point 52.2227 19.0254
Point ‐1,200 ‐11.5
Point ‐1,200 ‐111.5
Point ‐53.5 19
Point ‐12.5 19
Point ‐12.5 20
Point ‐53.5 20
Point ‐77 18
Point ‐77 16.5
Point ‐1,200 16.5
Point ‐234.5 16.5
Point ‐290 ‐2
Point ‐320 ‐2
Point ‐375.5 16.5
Point ‐230 18
Point ‐1,200 18
Point ‐380 18
Point ‐365 13
Point ‐245 13
Point 41.5 25
Point ‐52.5 21
Point ‐52.5 20
Point ‐11.5 19

Point 79 ‐52.5 19
Point 80 ‐52.5 18
Point 81 ‐52.5 16.5
Point 82 ‐62.5 18
Point 83 ‐53.5 18
Point 84 ‐62.5 16.5
Point 85 ‐77 17.25
Point 86 ‐62.5 17.25
Point 87 29.5 29
Regions Material Points Area (ft²)
Region
1
Matl. 1 ‐ Embankment
Material 1,6,7,8,9,10,11,12,5,78,4,3,2,76 993.93
Region
2 13,14,15,55,16,56,17,54,18,19,20 0.18474
Region
3 Matl. 8 ‐ Filter Sand 9,10,11,12,21,22,16,55,15,14,13,20,23 49.637
Region
4 Matl. 5 ‐ Soil Cement Armoring
6,7,8,9,23,24,75,87,25 69.1
Region
5
Matl. 5 ‐ Soil Cement
Armoring 22,21,26,27,28,29,30,31,32,33 22.2
Region
6
Matl. 2 ‐ Surficial
Overburden Layer 31,36,37,30 46.05
Region
7
Matl. 4 ‐ Deeper
Marine Deposits 39,38,40,41 19,019
Region
8 Matl. 1 ‐ Embankment Material
42,43,44,45 104
Region
9 Matl. 2 ‐ Surficial Overburden Layer
46,42,45,34,35,47 135
Region
10
Matl. 3 ‐ Shallow
Alluvial Deposits 47,35,39,48 2,515.5
Region
11
Matl. 4 ‐ Deeper
Marine Deposits 48,39,41,49 9,004.5
Region
12
Matl. 2 ‐ Surficial
Overburden Layer 36,50,51,37 1,500

13
14
15
16
17
18
19
20
21
22
23
24
25
26
27
28
29
30
31
Region Matl. 3 ‐ Shallow Alluvial Deposits
37,51,52,38 27,950
Region Matl. 4 ‐ Deeper Marine Deposits
38,52,53,40 1.0005e+005
Region Matl. 8 ‐ Filter Sand 20,23,22,16,56,17,54,18,19 1.5978
Region Matl. 5 ‐ Soil Cement
Armoring 23,24,33,22 1.6
Region Matl. 4 ‐ Deeper
Marine Deposits 57,48,49,58 1.02e+005
Region Matl. 3 ‐ Shallow Alluvial Deposits
35,39,38,37,30,29,28,27,26,81,84,64 5,297
Region Matl. 2 ‐ Surficial Overburden Layer
34,35,64,85,63 19.5
Region Matl. 3 ‐ Shallow
Alluvial Deposits 65,57,48,47,66,74,67,68,73,69 26,978
Region Matl. 2 ‐ Surficial
Overburden Layer 66,70,46,47 78.375
Region Matl. 2 ‐ Surficial
Overburden Layer 71,65,69,72 1,233.4
Region Matl. 9 Concrete Outfall Works
76,77,62,1 1
Region Matl. 8 ‐ Filter Sand 76,2,3,4,78,60,61,77 69
Region Matl. 8 ‐ Filter Sand 79,60,78,5,80 41
Region Matl. 2 ‐ Surficial
Overburden Layer 80,5,12,21,26,81 167.7
Region Matl. 9 Concrete
Outfall Works 82,83,59,79,80,81,84,86 16
Region Matl. 8 ‐ Filter Sand 85,64,84,86 10.875
Region Matl. 6 ‐ Fine Drainage Gravel
63,85,86,82 10.875
Region Matl. 6 ‐ Fine Drainage
Gravel 77,61,60,79 40
Region Matl. 6 ‐ Fine Drainage
Gravel 62,77,79,59 1
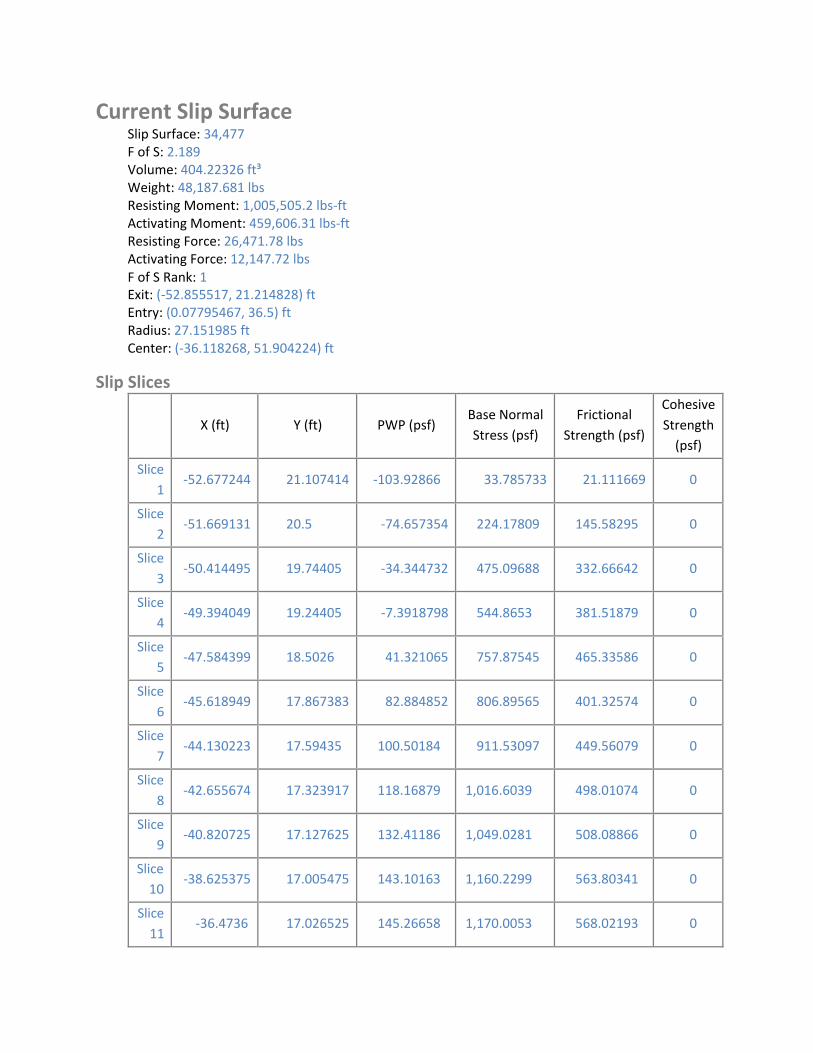
Current Slip Surface Slip Surface: 34,477 F of S: 2.189 Volume: 404.22326 ft³ Weight: 48,187.681 lbs Resisting Moment: 1,005,505.2 lbs‐ft Activating Moment: 459,606.31 lbs‐ft Resisting Force: 26,471.78 lbs Activating Force: 12,147.72 lbs F of S Rank: 1 Exit: (‐52.855517, 21.214828) ft Entry: (0.07795467, 36.5) ft Radius: 27.151985 ft Center: (‐36.118268, 51.904224) ft
Slip Slices
X (ft) Y (ft) PWP (psf) Base Normal
Stress (psf)
Frictional
Strength (psf)
Cohesive
Strength (psf)
Slice
1 ‐52.677244 21.107414 ‐103.92866 33.785733 21.111669 0
Slice
2 ‐51.669131 20.5 ‐74.657354 224.17809 145.58295 0
Slice
3 ‐50.414495 19.74405 ‐34.344732 475.09688 332.66642 0
Slice
4 ‐49.394049 19.24405 ‐7.3918798 544.8653 381.51879 0
Slice
5 ‐47.584399 18.5026 41.321065 757.87545 465.33586 0
Slice
6 ‐45.618949 17.867383 82.884852 806.89565 401.32574 0
Slice
7 ‐44.130223 17.59435 100.50184 911.53097 449.56079 0
Slice
8 ‐42.655674 17.323917 118.16879 1,016.6039 498.01074 0
Slice
9 ‐40.820725 17.127625 132.41186 1,049.0281 508.08866 0
Slice 10
‐38.625375 17.005475 143.10163 1,160.2299 563.80341 0
Slice
11 ‐36.4736 17.026525 145.26658 1,170.0053 568.02193 0
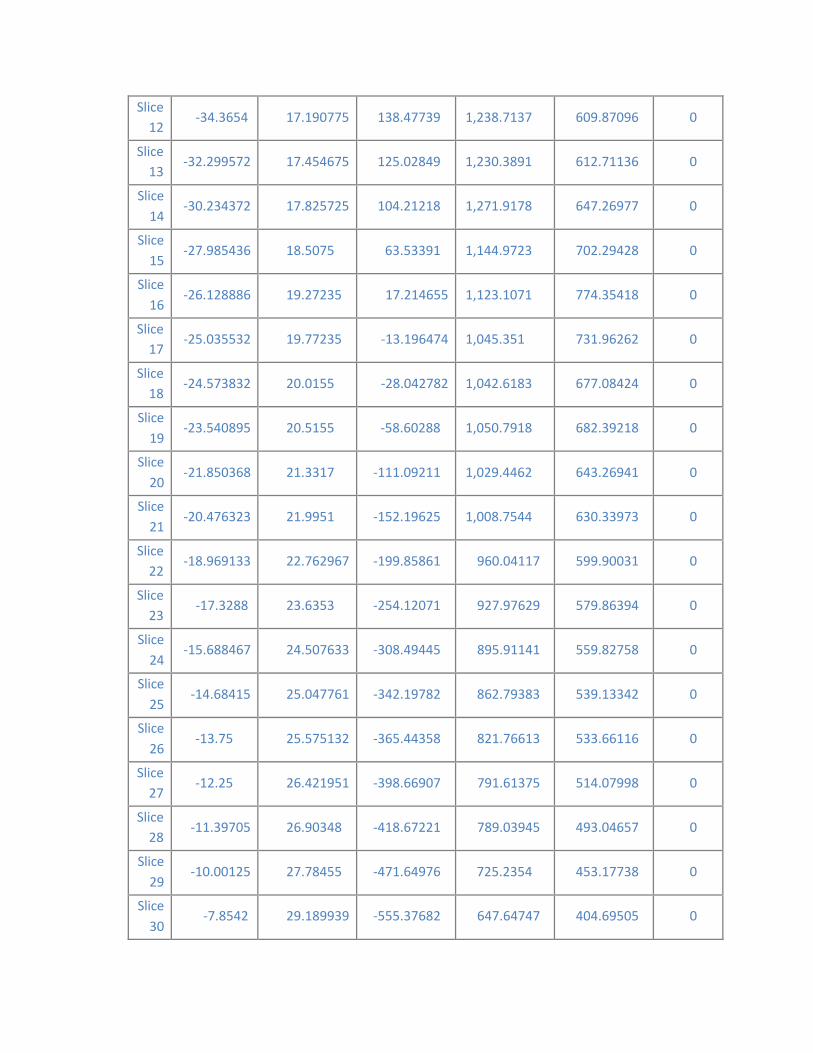
12
13
14
15
16
17
18
19
20
21
22
23
24
25
26
27
28
29
30
Slice ‐34.3654 17.190775 138.47739 1,238.7137 609.87096 0
Slice ‐32.299572 17.454675 125.02849 1,230.3891 612.71136 0
Slice ‐30.234372 17.825725 104.21218 1,271.9178 647.26977 0
Slice ‐27.985436 18.5075 63.53391 1,144.9723 702.29428 0
Slice ‐26.128886 19.27235 17.214655 1,123.1071 774.35418 0
Slice ‐25.035532 19.77235 ‐13.196474 1,045.351 731.96262 0
Slice ‐24.573832 20.0155 ‐28.042782 1,042.6183 677.08424 0
Slice ‐23.540895 20.5155 ‐58.60288 1,050.7918 682.39218 0
Slice ‐21.850368 21.3317 ‐111.09211 1,029.4462 643.26941 0
Slice ‐20.476323 21.9951 ‐152.19625 1,008.7544 630.33973 0
Slice ‐18.969133 22.762967 ‐199.85861 960.04117 599.90031 0
Slice ‐17.3288 23.6353 ‐254.12071 927.97629 579.86394 0
Slice ‐15.688467 24.507633 ‐308.49445 895.91141 559.82758 0
Slice ‐14.68415 25.047761 ‐342.19782 862.79383 539.13342 0
Slice ‐13.75 25.575132 ‐365.44358 821.76613 533.66116 0
Slice ‐12.25 26.421951 ‐398.66907 791.61375 514.07998 0
Slice ‐11.39705 26.90348 ‐418.67221 789.03945 493.04657 0
Slice ‐10.00125 27.78455 ‐471.64976 725.2354 453.17738 0
Slice ‐7.8542 29.189939 ‐555.37682 647.64747 404.69505 0
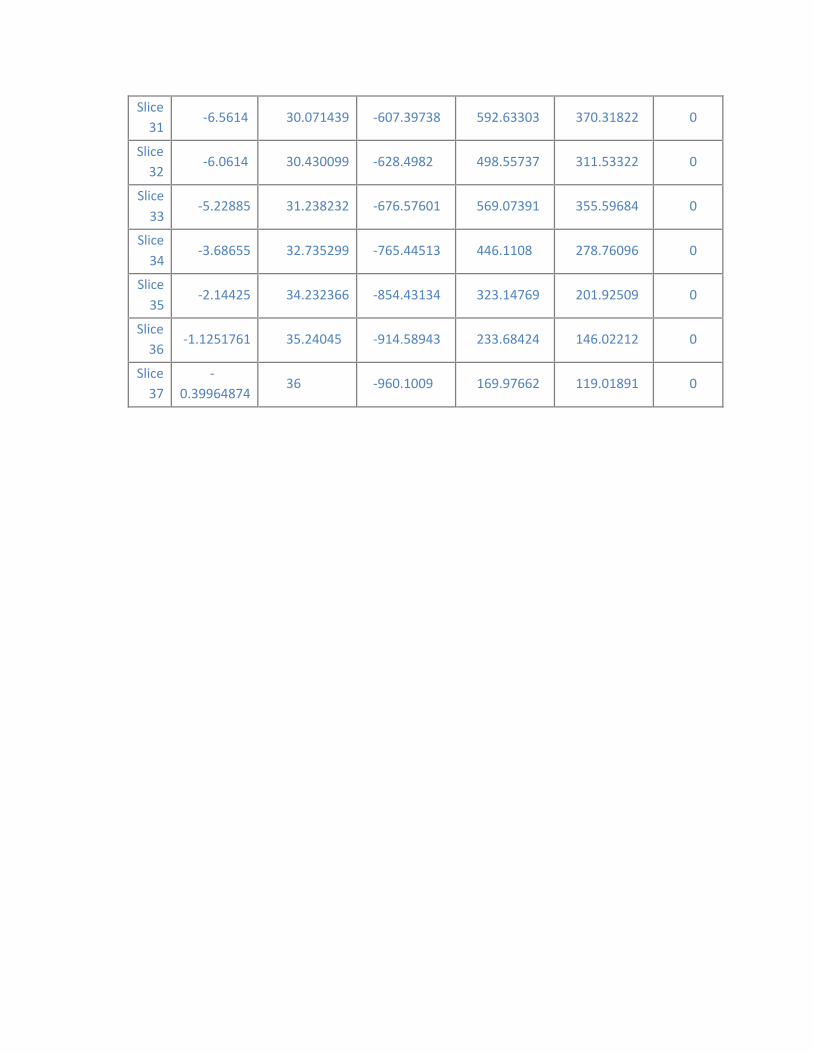
31
32
33
34
35
36
37
Slice ‐6.5614 30.071439 ‐607.39738 592.63303 370.31822 0
Slice ‐6.0614 30.430099 ‐628.4982 498.55737 311.53322 0
Slice ‐5.22885 31.238232 ‐676.57601 569.07391 355.59684 0
Slice ‐3.68655 32.735299 ‐765.44513 446.1108 278.76096 0
Slice ‐2.14425 34.232366 ‐854.43134 323.14769 201.92509 0
Slice ‐1.1251761 35.24045 ‐914.58943 233.68424 146.02212 0
Slice ‐
0.39964874 36 ‐960.1009 169.97662 119.01891 0
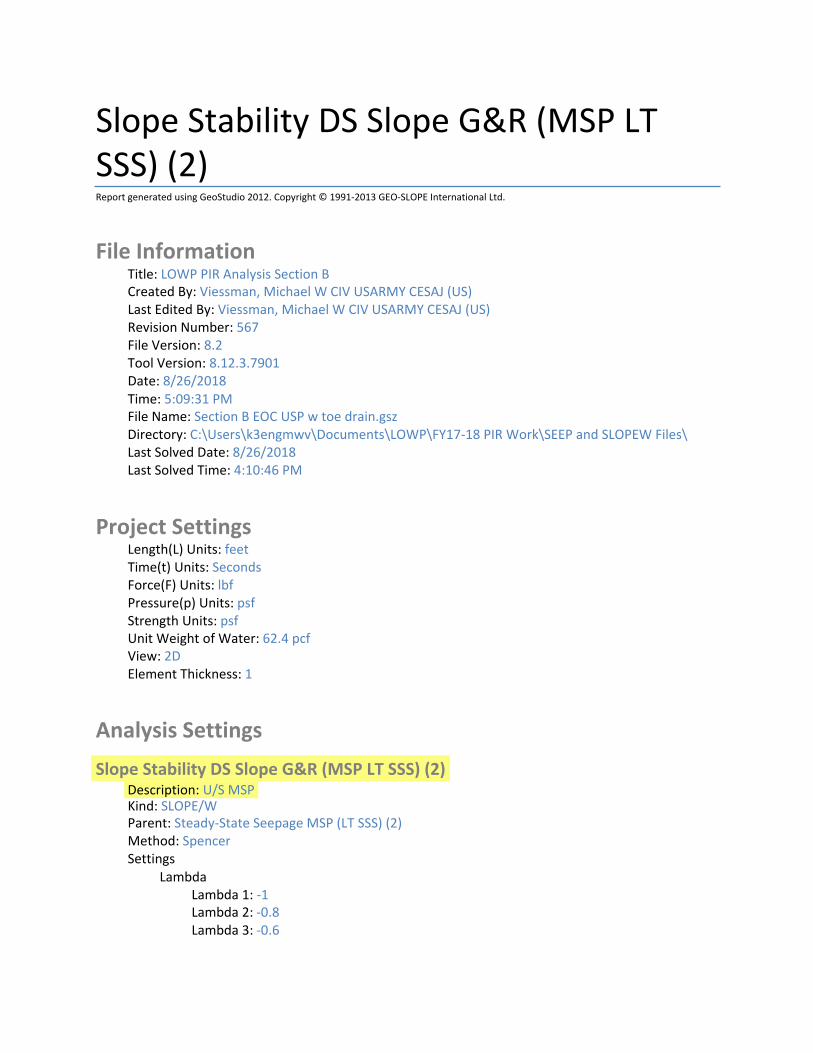
Slope Stability DS Slope G&R (MSP LT SSS) (2) Report generated using GeoStudio 2012. Copyright © 1991‐2013 GEO‐SLOPE International Ltd.
File Information Title: LOWP PIR Analysis Section B Created By: Viessman, Michael W CIV USARMY CESAJ (US) Last Edited By: Viessman, Michael W CIV USARMY CESAJ (US) Revision Number: 567 File Version: 8.2 Tool Version: 8.12.3.7901 Date: 8/26/2018 Time: 5:09:31 PM File Name: Section B EOC USP w toe drain.gsz Directory: C:\Users\k3engmwv\Documents\LOWP\FY17‐18 PIR Work\SEEP and SLOPEW Files\ Last Solved Date: 8/26/2018 Last Solved Time: 4:10:46 PM
Project Settings Length(L) Units: feet Time(t) Units: Seconds Force(F) Units: lbf Pressure(p) Units: psf Strength Units: psf Unit Weight of Water: 62.4 pcf View: 2D Element Thickness: 1
Analysis Settings
Slope Stability DS Slope G&R (MSP LT SSS) (2) Description: U/S MSP Kind: SLOPE/W Parent: Steady‐State Seepage MSP (LT SSS) (2) Method: Spencer Settings
Lambda Lambda 1: ‐1 Lambda 2: ‐0.8 Lambda 3: ‐0.6
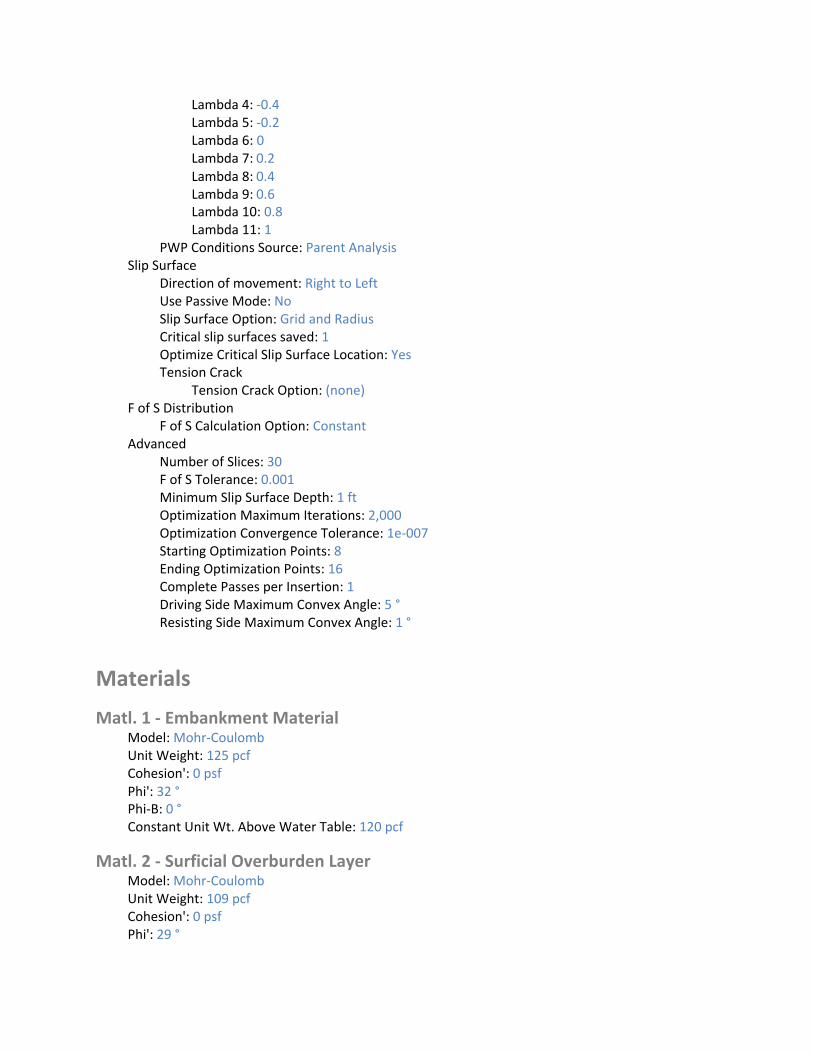
Lambda 4: ‐0.4 Lambda 5: ‐0.2 Lambda 6: 0 Lambda 7: 0.2 Lambda 8: 0.4 Lambda 9: 0.6 Lambda 10: 0.8 Lambda 11: 1
PWP Conditions Source: Parent Analysis Slip Surface
Direction of movement: Right to Left Use Passive Mode: No Slip Surface Option: Grid and Radius Critical slip surfaces saved: 1 Optimize Critical Slip Surface Location: Yes Tension Crack
Tension Crack Option: (none) F of S Distribution
F of S Calculation Option: Constant Advanced
Number of Slices: 30 F of S Tolerance: 0.001 Minimum Slip Surface Depth: 1 ft Optimization Maximum Iterations: 2,000 Optimization Convergence Tolerance: 1e‐007 Starting Optimization Points: 8 Ending Optimization Points: 16 Complete Passes per Insertion: 1 Driving Side Maximum Convex Angle: 5 ° Resisting Side Maximum Convex Angle: 1 °
Materials
Matl. 1 ‐ Embankment Material Model: Mohr‐Coulomb Unit Weight: 125 pcf Cohesion': 0 psf Phi': 32 ° Phi‐B: 0 ° Constant Unit Wt. Above Water Table: 120 pcf
Matl. 2 ‐ Surficial Overburden Layer Model: Mohr‐Coulomb Unit Weight: 109 pcf Cohesion': 0 psf Phi': 29 °

Phi‐B: 0 ° Constant Unit Wt. Above Water Table: 106 pcf
Matl. 3 ‐ Shallow Alluvial Deposits Model: Mohr‐Coulomb Unit Weight: 123 pcf Cohesion': 0 psf Phi': 30 ° Phi‐B: 0 °
Matl. 4 ‐ Deeper Marine Deposits Model: Mohr‐Coulomb Unit Weight: 125 pcf Cohesion': 0 psf Phi': 33 ° Phi‐B: 0 °
Matl. 5 ‐ Soil Cement Armoring Model: Mohr‐Coulomb Unit Weight: 125 pcf Cohesion': 0 psf Phi': 35 ° Phi‐B: 0 ° Constant Unit Wt. Above Water Table: 120 pcf
Matl. 6 ‐ Fine Drainage Gravel Model: Mohr‐Coulomb Unit Weight: 130 pcf Cohesion': 0 psf Phi': 35 ° Phi‐B: 0 ° Constant Unit Wt. Above Water Table: 115 pcf
Matl. 8 ‐ Filter Sand Model: Mohr‐Coulomb Unit Weight: 120 pcf Cohesion': 0 psf Phi': 33 ° Phi‐B: 0 ° Constant Unit Wt. Above Water Table: 115 pcf
Matl. 9 Concrete Outfall Works Model: Bedrock (Impenetrable)
Slip Surface Grid Upper Left: (‐95.9639, 117.4947) ft
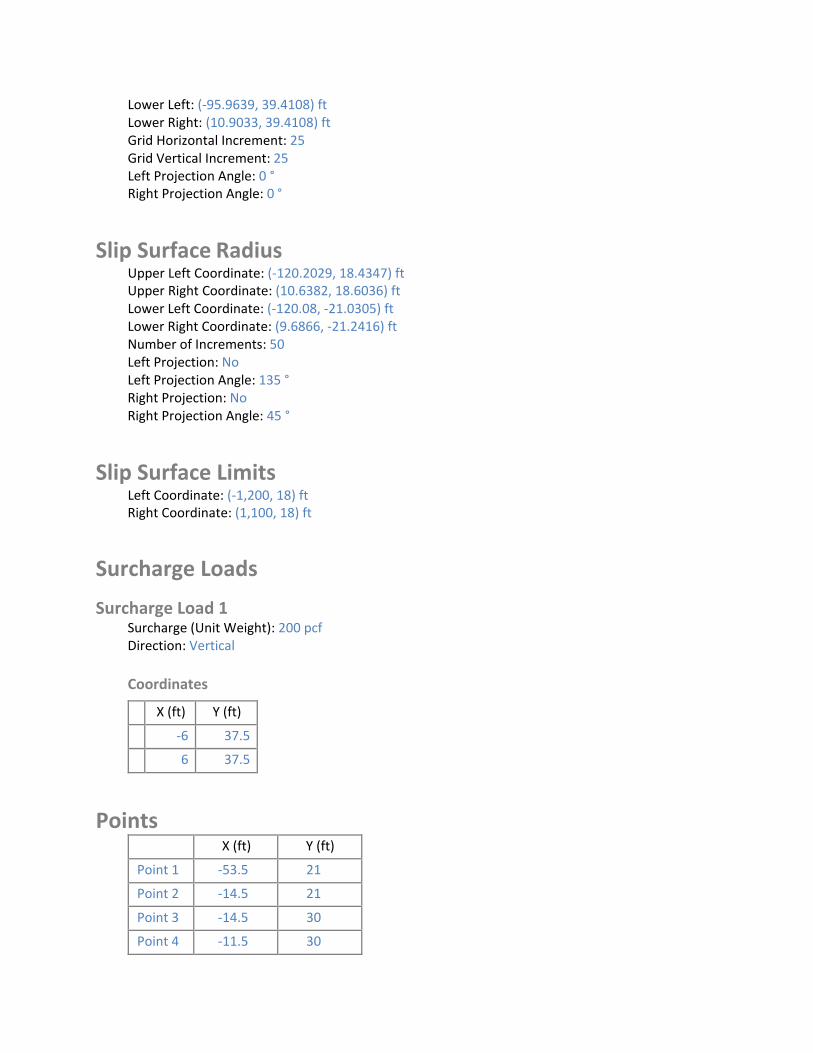
Lower Left: (‐95.9639, 39.4108) ft Lower Right: (10.9033, 39.4108) ft Grid Horizontal Increment: 25 Grid Vertical Increment: 25 Left Projection Angle: 0 ° Right Projection Angle: 0 °
Slip Surface Radius Upper Left Coordinate: (‐120.2029, 18.4347) ft Upper Right Coordinate: (10.6382, 18.6036) ft Lower Left Coordinate: (‐120.08, ‐21.0305) ft Lower Right Coordinate: (9.6866, ‐21.2416) ft Number of Increments: 50 Left Projection: No Left Projection Angle: 135 ° Right Projection: No Right Projection Angle: 45 °
Slip Surface Limits Left Coordinate: (‐1,200, 18) ft Right Coordinate: (1,100, 18) ft
Surcharge Loads
Surcharge Load 1 Surcharge (Unit Weight): 200 pcf Direction: Vertical
Coordinates
X (ft) Y (ft)
‐6 37.5
6 37.5
Points X (ft) Y (ft)
Point 1 ‐53.5 21
Point 2 ‐14.5 21
Point 3 ‐14.5 30
Point 4 ‐11.5 30
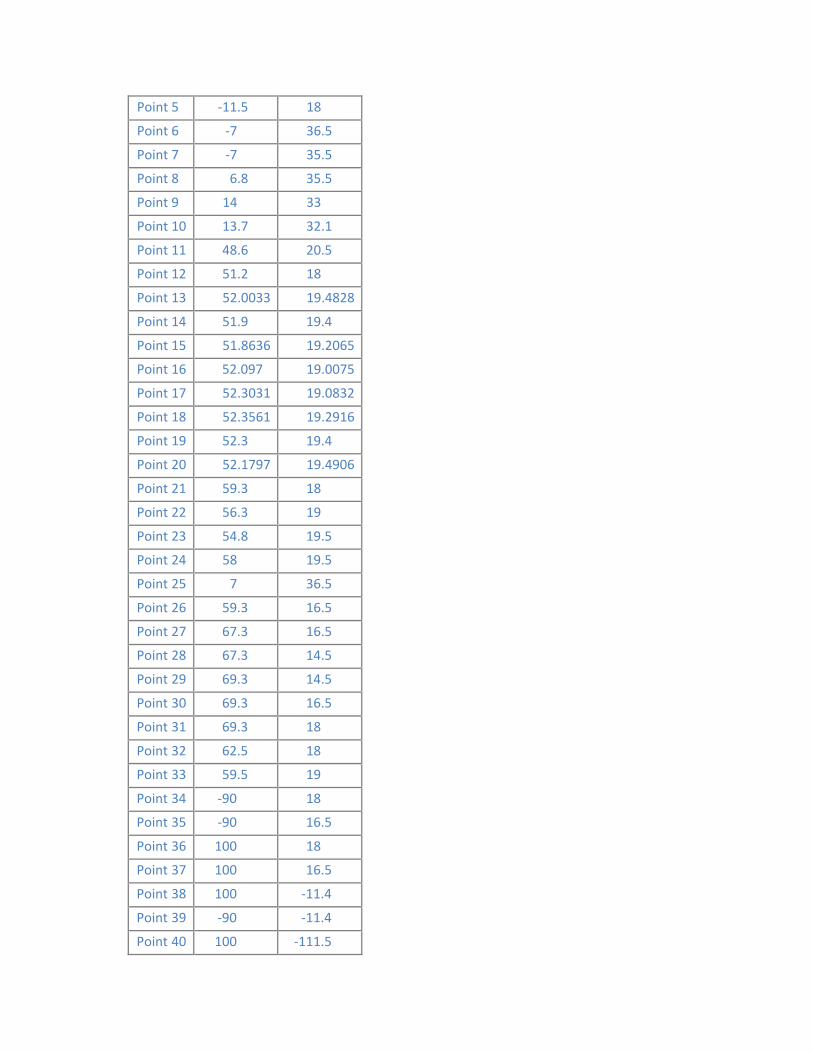
5
6
7
8
9
10
11
12
13
14
15
16
17
18
19
20
21
22
23
24
25
26
27
28
29
30
31
32
33
34
35
36
37
38
39
40
Point ‐11.5 18
Point ‐7 36.5
Point ‐7 35.5
Point 6.8 35.5
Point 14 33
Point 13.7 32.1
Point 48.6 20.5
Point 51.2 18
Point 52.0033 19.4828
Point 51.9 19.4
Point 51.8636 19.2065
Point 52.097 19.0075
Point 52.3031 19.0832
Point 52.3561 19.2916
Point 52.3 19.4
Point 52.1797 19.4906
Point 59.3 18
Point 56.3 19
Point 54.8 19.5
Point 58 19.5
Point 7 36.5
Point 59.3 16.5
Point 67.3 16.5
Point 67.3 14.5
Point 69.3 14.5
Point 69.3 16.5
Point 69.3 18
Point 62.5 18
Point 59.5 19
Point ‐90 18
Point ‐90 16.5
Point 100 18
Point 100 16.5
Point 100 ‐11.4
Point ‐90 ‐11.4
Point 100 ‐111.5
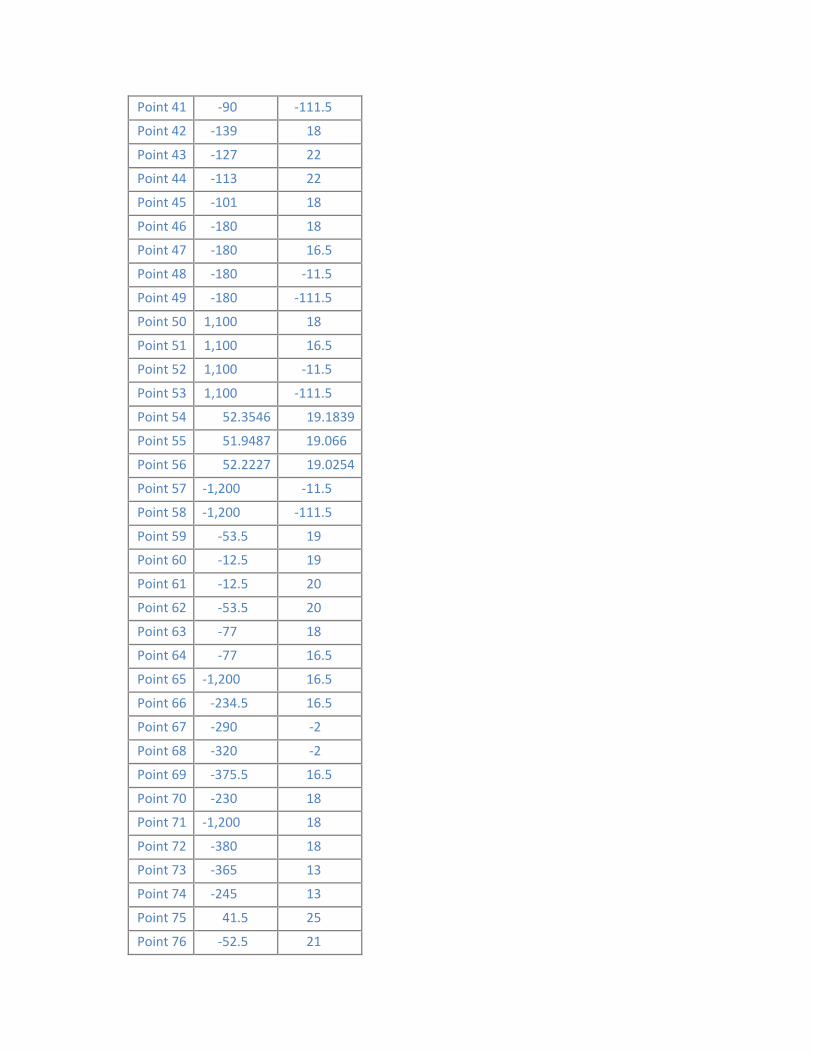
41
42
43
44
45
46
47
48
49
50
51
52
53
54
55
56
57
58
59
60
61
62
63
64
65
66
67
68
69
70
71
72
73
74
75
76
Point ‐90 ‐111.5
Point ‐139 18
Point ‐127 22
Point ‐113 22
Point ‐101 18
Point ‐180 18
Point ‐180 16.5
Point ‐180 ‐11.5
Point ‐180 ‐111.5
Point 1,100 18
Point 1,100 16.5
Point 1,100 ‐11.5
Point 1,100 ‐111.5
Point 52.3546 19.1839
Point 51.9487 19.066
Point 52.2227 19.0254
Point ‐1,200 ‐11.5
Point ‐1,200 ‐111.5
Point ‐53.5 19
Point ‐12.5 19
Point ‐12.5 20
Point ‐53.5 20
Point ‐77 18
Point ‐77 16.5
Point ‐1,200 16.5
Point ‐234.5 16.5
Point ‐290 ‐2
Point ‐320 ‐2
Point ‐375.5 16.5
Point ‐230 18
Point ‐1,200 18
Point ‐380 18
Point ‐365 13
Point ‐245 13
Point 41.5 25
Point ‐52.5 21
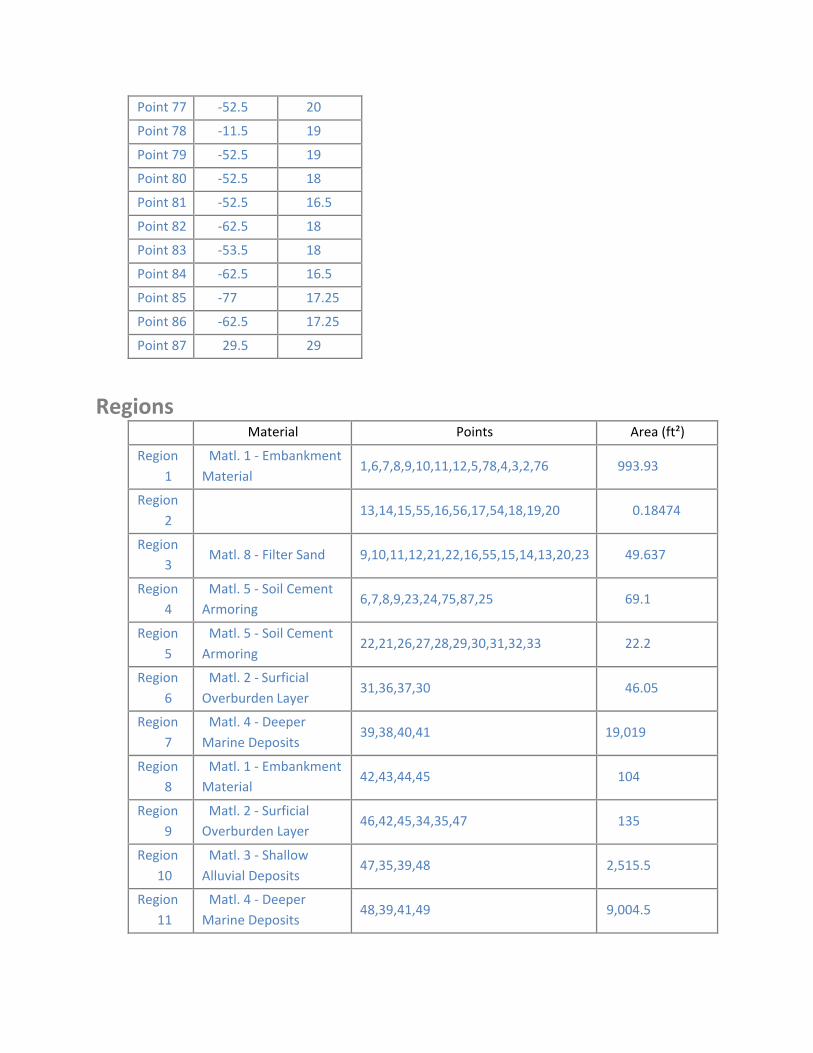
Point 77 ‐52.5 20
Point 78 ‐11.5 19
Point 79 ‐52.5 19
Point 80 ‐52.5 18
Point 81 ‐52.5 16.5
Point 82 ‐62.5 18
Point 83 ‐53.5 18
Point 84 ‐62.5 16.5
Point 85 ‐77 17.25
Point 86 ‐62.5 17.25
Point 87 29.5 29
Regions Material Points Area (ft²)
Region
1
Matl. 1 ‐ Embankment
Material 1,6,7,8,9,10,11,12,5,78,4,3,2,76 993.93
Region
2 13,14,15,55,16,56,17,54,18,19,20 0.18474
Region
3 Matl. 8 ‐ Filter Sand 9,10,11,12,21,22,16,55,15,14,13,20,23 49.637
Region
4
Matl. 5 ‐ Soil Cement Armoring
6,7,8,9,23,24,75,87,25 69.1
Region
5
Matl. 5 ‐ Soil Cement
Armoring 22,21,26,27,28,29,30,31,32,33 22.2
Region
6
Matl. 2 ‐ Surficial
Overburden Layer 31,36,37,30 46.05
Region
7
Matl. 4 ‐ Deeper
Marine Deposits 39,38,40,41 19,019
Region
8
Matl. 1 ‐ Embankment Material
42,43,44,45 104
Region
9
Matl. 2 ‐ Surficial Overburden Layer
46,42,45,34,35,47 135
Region
10
Matl. 3 ‐ Shallow
Alluvial Deposits 47,35,39,48 2,515.5
Region
11
Matl. 4 ‐ Deeper
Marine Deposits 48,39,41,49 9,004.5
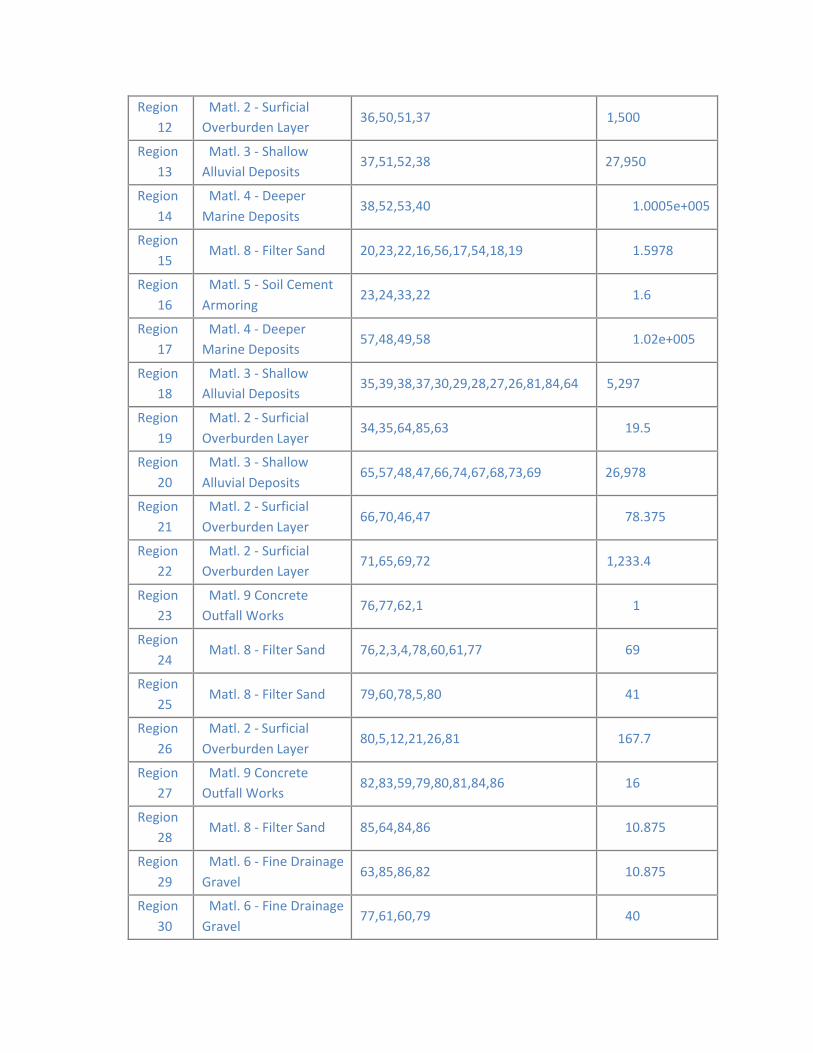
12
13
14
15
16
17
18
19
20
21
22
23
24
25
26
27
28
29
30
Region Matl. 2 ‐ Surficial Overburden Layer
36,50,51,37 1,500
Region Matl. 3 ‐ Shallow Alluvial Deposits
37,51,52,38 27,950
Region Matl. 4 ‐ Deeper
Marine Deposits 38,52,53,40 1.0005e+005
Region Matl. 8 ‐ Filter Sand 20,23,22,16,56,17,54,18,19 1.5978
Region Matl. 5 ‐ Soil Cement
Armoring 23,24,33,22 1.6
Region Matl. 4 ‐ Deeper Marine Deposits
57,48,49,58 1.02e+005
Region Matl. 3 ‐ Shallow Alluvial Deposits
35,39,38,37,30,29,28,27,26,81,84,64 5,297
Region Matl. 2 ‐ Surficial
Overburden Layer 34,35,64,85,63 19.5
Region Matl. 3 ‐ Shallow
Alluvial Deposits 65,57,48,47,66,74,67,68,73,69 26,978
Region Matl. 2 ‐ Surficial
Overburden Layer 66,70,46,47 78.375
Region Matl. 2 ‐ Surficial Overburden Layer
71,65,69,72 1,233.4
Region Matl. 9 Concrete Outfall Works
76,77,62,1 1
Region Matl. 8 ‐ Filter Sand 76,2,3,4,78,60,61,77 69
Region Matl. 8 ‐ Filter Sand 79,60,78,5,80 41
Region Matl. 2 ‐ Surficial
Overburden Layer 80,5,12,21,26,81 167.7
Region Matl. 9 Concrete Outfall Works
82,83,59,79,80,81,84,86 16
Region Matl. 8 ‐ Filter Sand 85,64,84,86 10.875
Region Matl. 6 ‐ Fine Drainage
Gravel 63,85,86,82 10.875
Region Matl. 6 ‐ Fine Drainage
Gravel 77,61,60,79 40
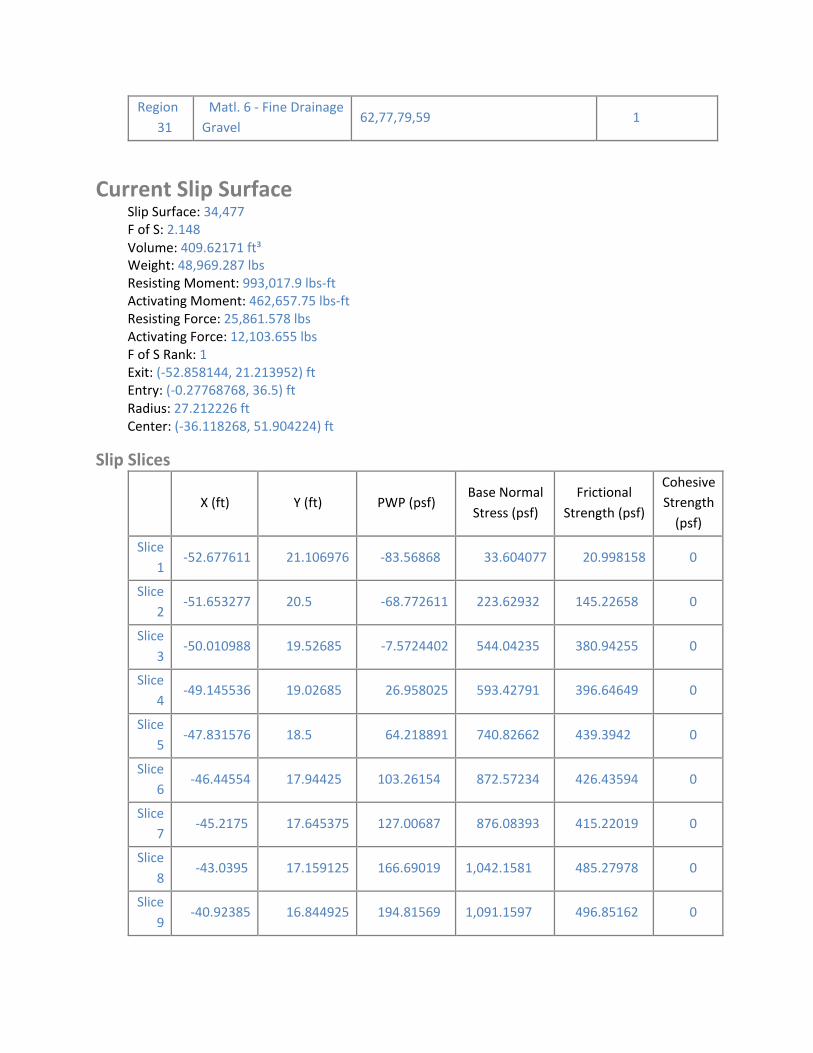
Region
31 Matl. 6 ‐ Fine Drainage Gravel
62,77,79,59 1
Current Slip Surface Slip Surface: 34,477 F of S: 2.148 Volume: 409.62171 ft³ Weight: 48,969.287 lbs Resisting Moment: 993,017.9 lbs‐ft Activating Moment: 462,657.75 lbs‐ft Resisting Force: 25,861.578 lbs Activating Force: 12,103.655 lbs F of S Rank: 1 Exit: (‐52.858144, 21.213952) ft Entry: (‐0.27768768, 36.5) ft Radius: 27.212226 ft Center: (‐36.118268, 51.904224) ft
Slip Slices
X (ft) Y (ft) PWP (psf) Base Normal
Stress (psf)
Frictional
Strength (psf)
Cohesive Strength
(psf)
Slice
1 ‐52.677611 21.106976 ‐83.56868 33.604077 20.998158 0
Slice
2 ‐51.653277 20.5 ‐68.772611 223.62932 145.22658 0
Slice
3 ‐50.010988 19.52685 ‐7.5724402 544.04235 380.94255 0
Slice
4 ‐49.145536 19.02685 26.958025 593.42791 396.64649 0
Slice
5 ‐47.831576 18.5 64.218891 740.82662 439.3942 0
Slice
6 ‐46.44554 17.94425 103.26154 872.57234 426.43594 0
Slice
7 ‐45.2175 17.645375 127.00687 876.08393 415.22019 0
Slice
8 ‐43.0395 17.159125 166.69019 1,042.1581 485.27978 0
Slice
9 ‐40.92385 16.844925 194.81569 1,091.1597 496.85162 0
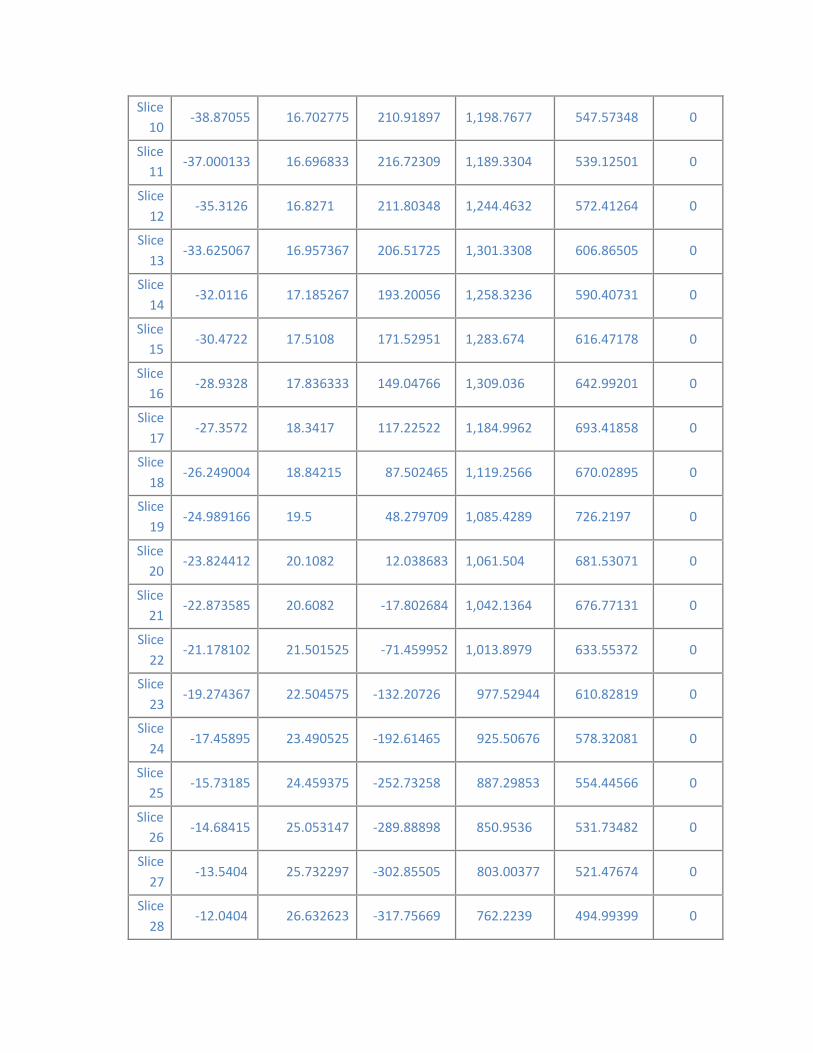
10
11
12
13
14
15
16
17
18
19
20
21
22
23
24
25
26
27
28
Slice ‐38.87055 16.702775 210.91897 1,198.7677 547.57348 0
Slice ‐37.000133 16.696833 216.72309 1,189.3304 539.12501 0
Slice ‐35.3126 16.8271 211.80348 1,244.4632 572.41264 0
Slice ‐33.625067 16.957367 206.51725 1,301.3308 606.86505 0
Slice ‐32.0116 17.185267 193.20056 1,258.3236 590.40731 0
Slice ‐30.4722 17.5108 171.52951 1,283.674 616.47178 0
Slice ‐28.9328 17.836333 149.04766 1,309.036 642.99201 0
Slice ‐27.3572 18.3417 117.22522 1,184.9962 693.41858 0
Slice ‐26.249004 18.84215 87.502465 1,119.2566 670.02895 0
Slice ‐24.989166 19.5 48.279709 1,085.4289 726.2197 0
Slice ‐23.824412 20.1082 12.038683 1,061.504 681.53071 0
Slice ‐22.873585 20.6082 ‐17.802684 1,042.1364 676.77131 0
Slice ‐21.178102 21.501525 ‐71.459952 1,013.8979 633.55372 0
Slice ‐19.274367 22.504575 ‐132.20726 977.52944 610.82819 0
Slice ‐17.45895 23.490525 ‐192.61465 925.50676 578.32081 0
Slice ‐15.73185 24.459375 ‐252.73258 887.29853 554.44566 0
Slice ‐14.68415 25.053147 ‐289.88898 850.9536 531.73482 0
Slice ‐13.5404 25.732297 ‐302.85505 803.00377 521.47674 0
Slice ‐12.0404 26.632623 ‐317.75669 762.2239 494.99399 0
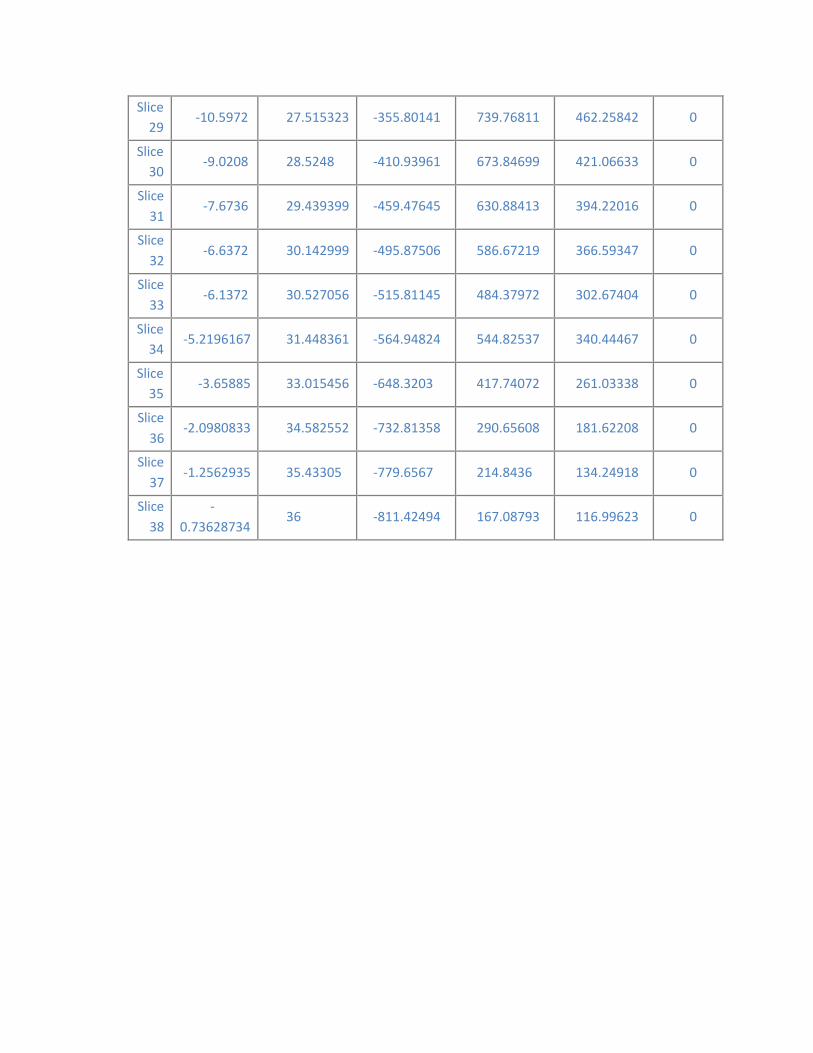
29
30
31
32
33
34
35
36
37
38
Slice ‐10.5972 27.515323 ‐355.80141 739.76811 462.25842 0
Slice ‐9.0208 28.5248 ‐410.93961 673.84699 421.06633 0
Slice ‐7.6736 29.439399 ‐459.47645 630.88413 394.22016 0
Slice ‐6.6372 30.142999 ‐495.87506 586.67219 366.59347 0
Slice ‐6.1372 30.527056 ‐515.81145 484.37972 302.67404 0
Slice ‐5.2196167 31.448361 ‐564.94824 544.82537 340.44467 0
Slice ‐3.65885 33.015456 ‐648.3203 417.74072 261.03338 0
Slice ‐2.0980833 34.582552 ‐732.81358 290.65608 181.62208 0
Slice ‐1.2562935 35.43305 ‐779.6567 214.8436 134.24918 0
Slice ‐
0.73628734 36 ‐811.42494 167.08793 116.99623 0

Slope Stability US Slope G&R (RDD) Report generated using GeoStudio 2012. Copyright © 1991‐2013 GEO‐SLOPE International Ltd.
File Information Title: LOWP PIR Analysis Section B Created By: Viessman, Michael W CIV USARMY CESAJ (US) Last Edited By: Viessman, Michael W CIV USARMY CESAJ (US) Revision Number: 594 File Version: 8.2 Tool Version: 8.12.3.7901 Date: 8/27/2018 Time: 10:31:26 AM File Name: Section B EOC USP w toe drain.gsz Directory: C:\Users\k3engmwv\Documents\LOWP\FY17‐18 PIR Work\SEEP and SLOPEW Files\ Last Solved Date: 8/27/2018 Last Solved Time: 9:35:04 AM
Project Settings Length(L) Units: feet Time(t) Units: Seconds Force(F) Units: lbf Pressure(p) Units: psf Strength Units: psf Unit Weight of Water: 62.4 pcf View: 2D Element Thickness: 1
Analysis Settings
Slope Stability US Slope G&R (RDD) Description: U/S NP Kind: SLOPE/W Method: Spencer Settings
Lambda Lambda 1: ‐1 Lambda 2: ‐0.8 Lambda 3: ‐0.6 Lambda 4: ‐0.4 Lambda 5: ‐0.2 Lambda 6: 0 Lambda 7: 0.2
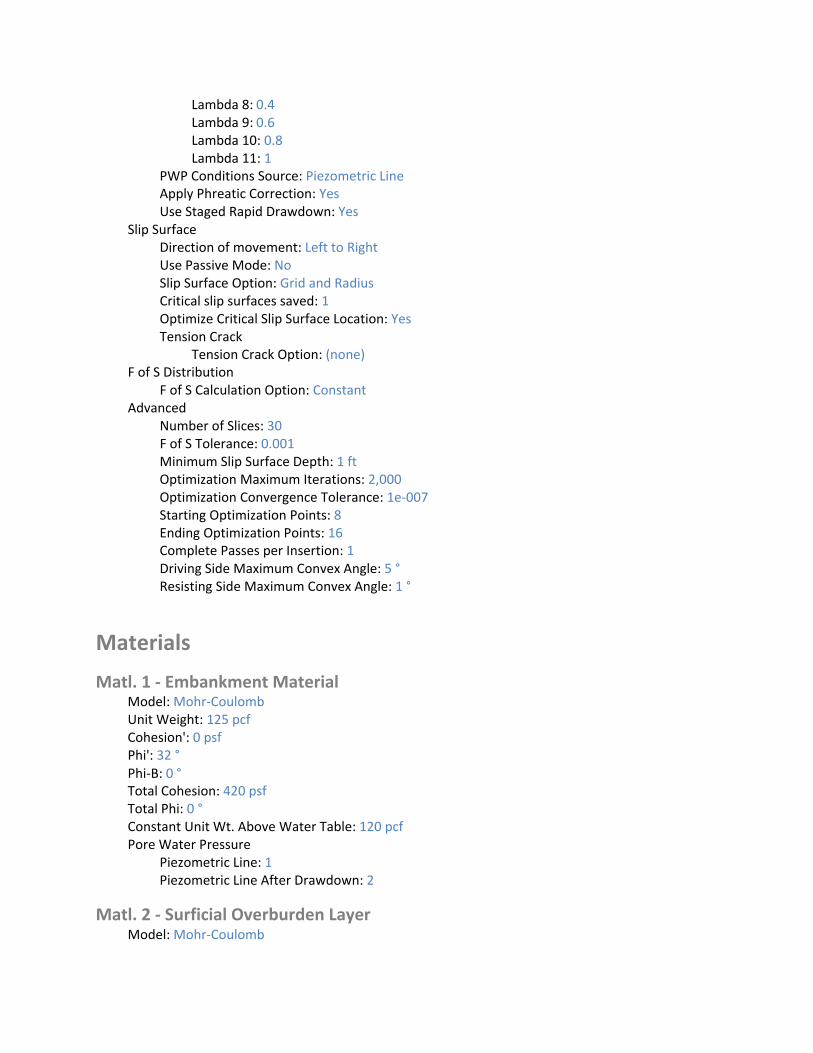
Lambda 8: 0.4 Lambda 9: 0.6 Lambda 10: 0.8 Lambda 11: 1
PWP Conditions Source: Piezometric Line Apply Phreatic Correction: Yes Use Staged Rapid Drawdown: Yes
Slip Surface Direction of movement: Left to Right Use Passive Mode: No Slip Surface Option: Grid and Radius Critical slip surfaces saved: 1 Optimize Critical Slip Surface Location: Yes Tension Crack
Tension Crack Option: (none) F of S Distribution
F of S Calculation Option: Constant Advanced
Number of Slices: 30 F of S Tolerance: 0.001 Minimum Slip Surface Depth: 1 ft Optimization Maximum Iterations: 2,000 Optimization Convergence Tolerance: 1e‐007 Starting Optimization Points: 8 Ending Optimization Points: 16 Complete Passes per Insertion: 1 Driving Side Maximum Convex Angle: 5 ° Resisting Side Maximum Convex Angle: 1 °
Materials
Matl. 1 ‐ Embankment Material Model: Mohr‐Coulomb Unit Weight: 125 pcf Cohesion': 0 psf Phi': 32 ° Phi‐B: 0 ° Total Cohesion: 420 psf Total Phi: 0 ° Constant Unit Wt. Above Water Table: 120 pcf Pore Water Pressure
Piezometric Line: 1 Piezometric Line After Drawdown: 2
Matl. 2 ‐ Surficial Overburden Layer Model: Mohr‐Coulomb

Unit Weight: 109 pcf Cohesion': 0 psf Phi': 29 ° Phi‐B: 0 ° Total Cohesion: 420 psf Total Phi: 0 ° Constant Unit Wt. Above Water Table: 106 pcf Pore Water Pressure
Piezometric Line: 1 Piezometric Line After Drawdown: 2
Matl. 3 ‐ Shallow Alluvial Deposits Model: Mohr‐Coulomb Unit Weight: 123 pcf Cohesion': 0 psf Phi': 30 ° Phi‐B: 0 ° Total Cohesion: 420 psf Total Phi: 0 ° Pore Water Pressure
Piezometric Line: 1 Piezometric Line After Drawdown: 2
Matl. 4 ‐ Deeper Marine Deposits Model: Mohr‐Coulomb Unit Weight: 125 pcf Cohesion': 0 psf Phi': 33 ° Phi‐B: 0 ° Total Cohesion: 420 psf Total Phi: 0 ° Pore Water Pressure
Piezometric Line: 1 Piezometric Line After Drawdown: 2
Matl. 5 ‐ Soil Cement Armoring Model: Mohr‐Coulomb Unit Weight: 125 pcf Cohesion': 0 psf Phi': 35 ° Phi‐B: 0 ° Total Cohesion: 2,500 psf Total Phi: 0 ° Constant Unit Wt. Above Water Table: 120 pcf Pore Water Pressure
Piezometric Line: 1 Piezometric Line After Drawdown: 2
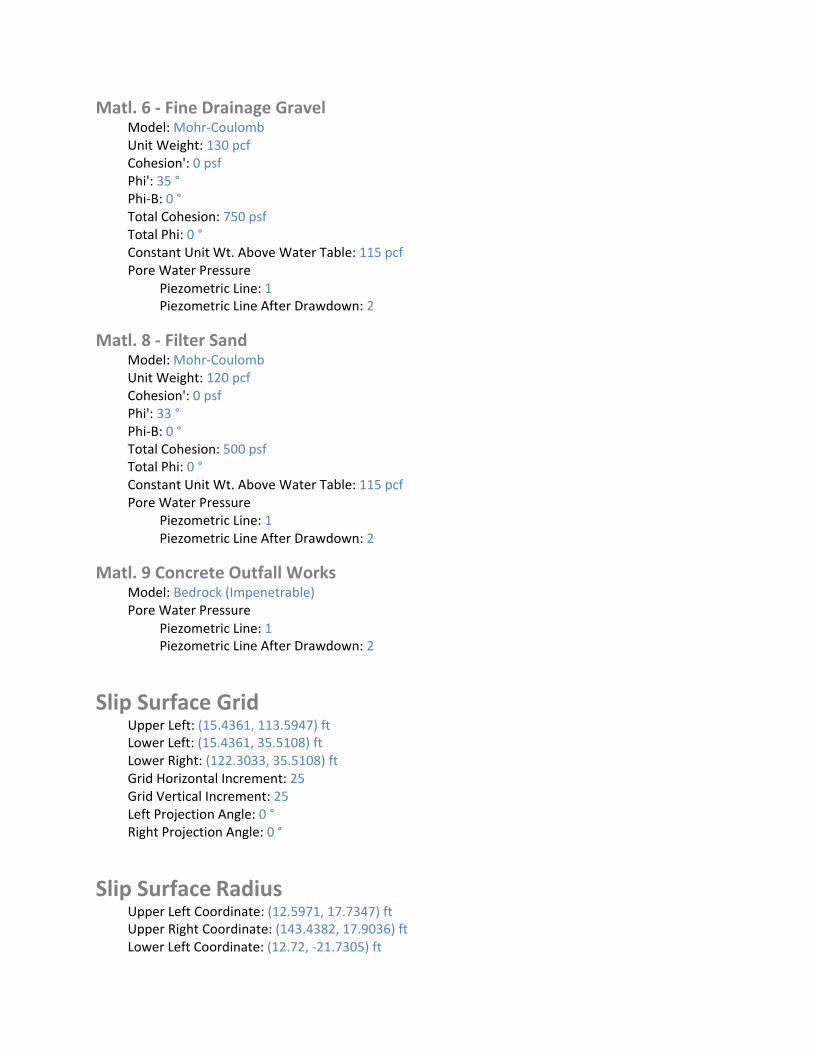
Matl. 6 ‐ Fine Drainage Gravel Model: Mohr‐Coulomb Unit Weight: 130 pcf Cohesion': 0 psf Phi': 35 ° Phi‐B: 0 ° Total Cohesion: 750 psf Total Phi: 0 ° Constant Unit Wt. Above Water Table: 115 pcf Pore Water Pressure
Piezometric Line: 1 Piezometric Line After Drawdown: 2
Matl. 8 ‐ Filter Sand Model: Mohr‐Coulomb Unit Weight: 120 pcf Cohesion': 0 psf Phi': 33 ° Phi‐B: 0 ° Total Cohesion: 500 psf Total Phi: 0 ° Constant Unit Wt. Above Water Table: 115 pcf Pore Water Pressure
Piezometric Line: 1 Piezometric Line After Drawdown: 2
Matl. 9 Concrete Outfall Works Model: Bedrock (Impenetrable) Pore Water Pressure
Piezometric Line: 1 Piezometric Line After Drawdown: 2
Slip Surface Grid Upper Left: (15.4361, 113.5947) ft Lower Left: (15.4361, 35.5108) ft Lower Right: (122.3033, 35.5108) ft Grid Horizontal Increment: 25 Grid Vertical Increment: 25 Left Projection Angle: 0 ° Right Projection Angle: 0 °
Slip Surface Radius Upper Left Coordinate: (12.5971, 17.7347) ft Upper Right Coordinate: (143.4382, 17.9036) ft Lower Left Coordinate: (12.72, ‐21.7305) ft
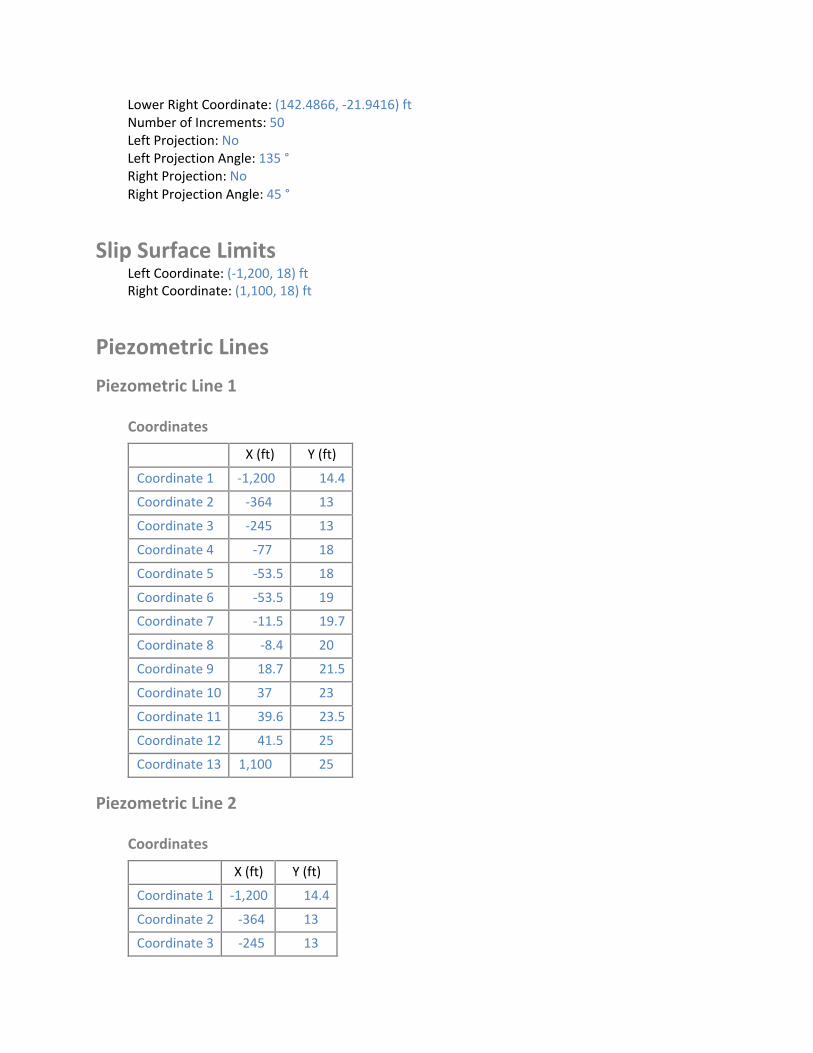
Lower Right Coordinate: (142.4866, ‐21.9416) ft Number of Increments: 50 Left Projection: No Left Projection Angle: 135 ° Right Projection: No Right Projection Angle: 45 °
Slip Surface Limits Left Coordinate: (‐1,200, 18) ft Right Coordinate: (1,100, 18) ft
Piezometric Lines
Piezometric Line 1
Coordinates
X (ft) Y (ft)
Coordinate 1 ‐1,200 14.4
Coordinate 2 ‐364 13
Coordinate 3 ‐245 13
Coordinate 4 ‐77 18
Coordinate 5 ‐53.5 18
Coordinate 6 ‐53.5 19
Coordinate 7 ‐11.5 19.7
Coordinate 8 ‐8.4 20
Coordinate 9 18.7 21.5
Coordinate 10 37 23
Coordinate 11 39.6 23.5
Coordinate 12 41.5 25
Coordinate 13 1,100 25
Piezometric Line 2
Coordinates
X (ft) Y (ft)
Coordinate 1 ‐1,200 14.4
Coordinate 2 ‐364 13
Coordinate 3 ‐245 13
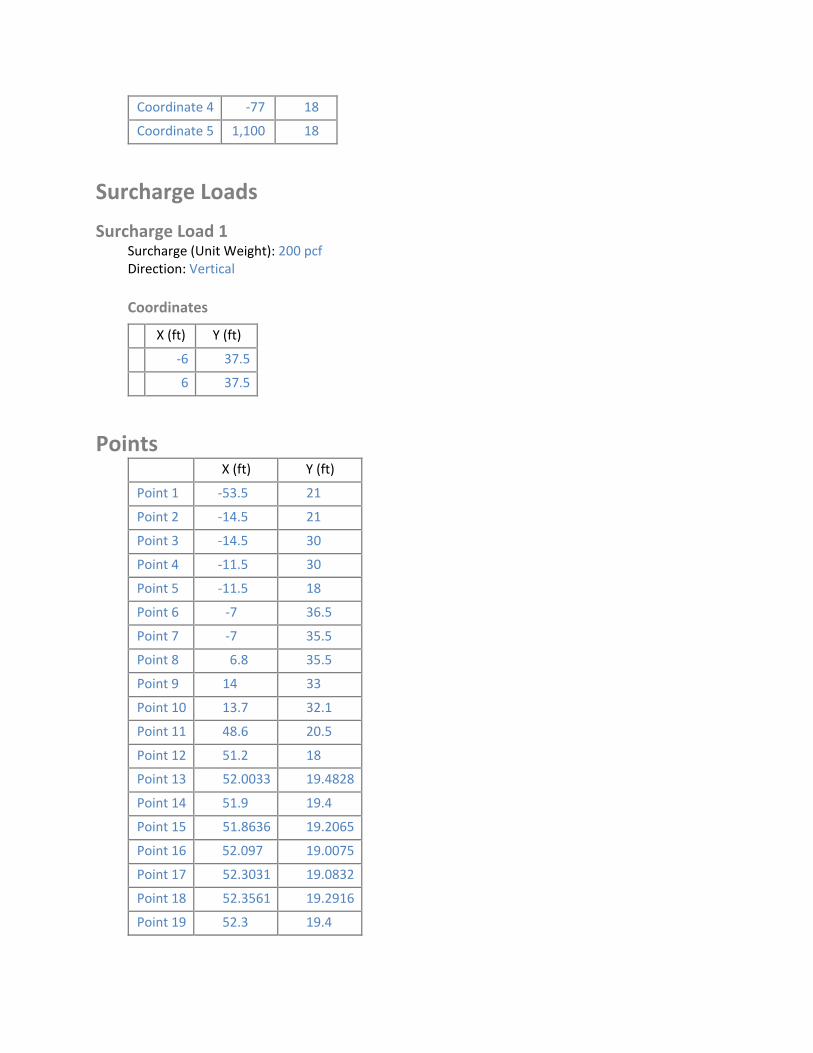
Coordinate 4 ‐77 18
Coordinate 5 1,100 18
Surcharge Loads
Surcharge Load 1 Surcharge (Unit Weight): 200 pcf Direction: Vertical
Coordinates
X (ft) Y (ft)
‐6 37.5
6 37.5
Points X (ft) Y (ft)
Point 1 ‐53.5 21
Point 2 ‐14.5 21
Point 3 ‐14.5 30
Point 4 ‐11.5 30
Point 5 ‐11.5 18
Point 6 ‐7 36.5
Point 7 ‐7 35.5
Point 8 6.8 35.5
Point 9 14 33
Point 10 13.7 32.1
Point 11 48.6 20.5
Point 12 51.2 18
Point 13 52.0033 19.4828
Point 14 51.9 19.4
Point 15 51.8636 19.2065
Point 16 52.097 19.0075
Point 17 52.3031 19.0832
Point 18 52.3561 19.2916
Point 19 52.3 19.4
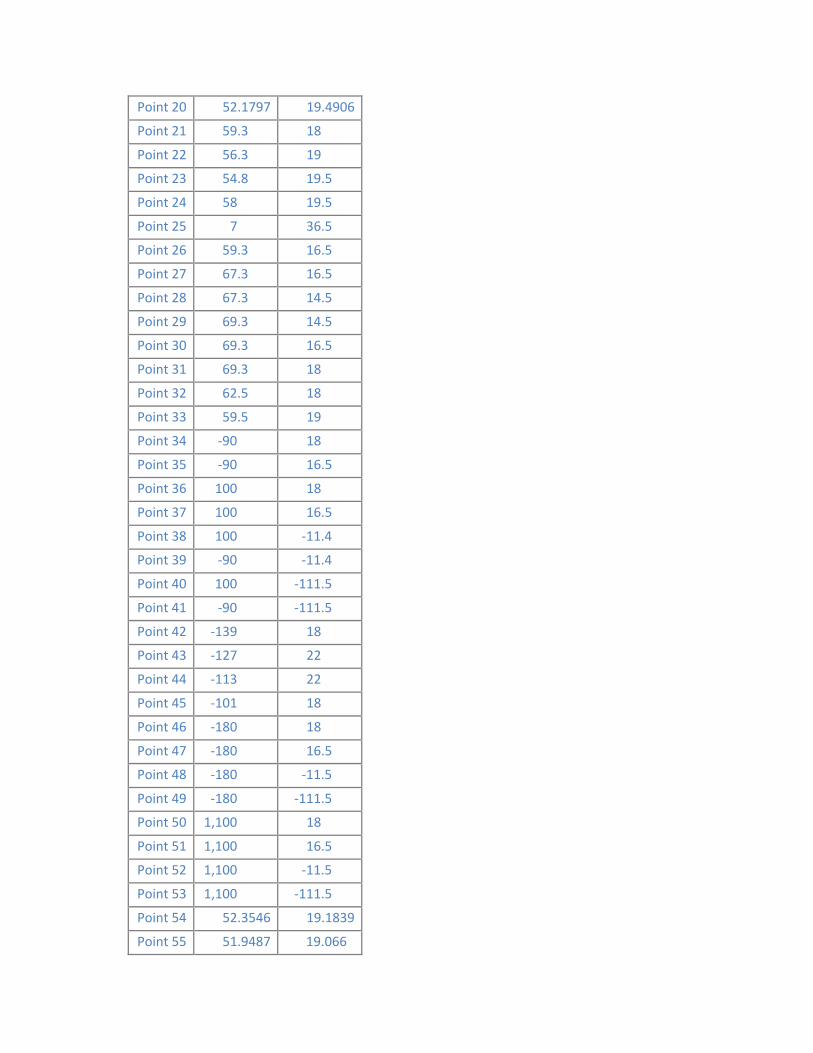
20
21
22
23
24
25
26
27
28
29
30
31
32
33
34
35
36
37
38
39
40
41
42
43
44
45
46
47
48
49
50
51
52
53
54
55
Point 52.1797 19.4906
Point 59.3 18
Point 56.3 19
Point 54.8 19.5
Point 58 19.5
Point 7 36.5
Point 59.3 16.5
Point 67.3 16.5
Point 67.3 14.5
Point 69.3 14.5
Point 69.3 16.5
Point 69.3 18
Point 62.5 18
Point 59.5 19
Point ‐90 18
Point ‐90 16.5
Point 100 18
Point 100 16.5
Point 100 ‐11.4
Point ‐90 ‐11.4
Point 100 ‐111.5
Point ‐90 ‐111.5
Point ‐139 18
Point ‐127 22
Point ‐113 22
Point ‐101 18
Point ‐180 18
Point ‐180 16.5
Point ‐180 ‐11.5
Point ‐180 ‐111.5
Point 1,100 18
Point 1,100 16.5
Point 1,100 ‐11.5
Point 1,100 ‐111.5
Point 52.3546 19.1839
Point 51.9487 19.066
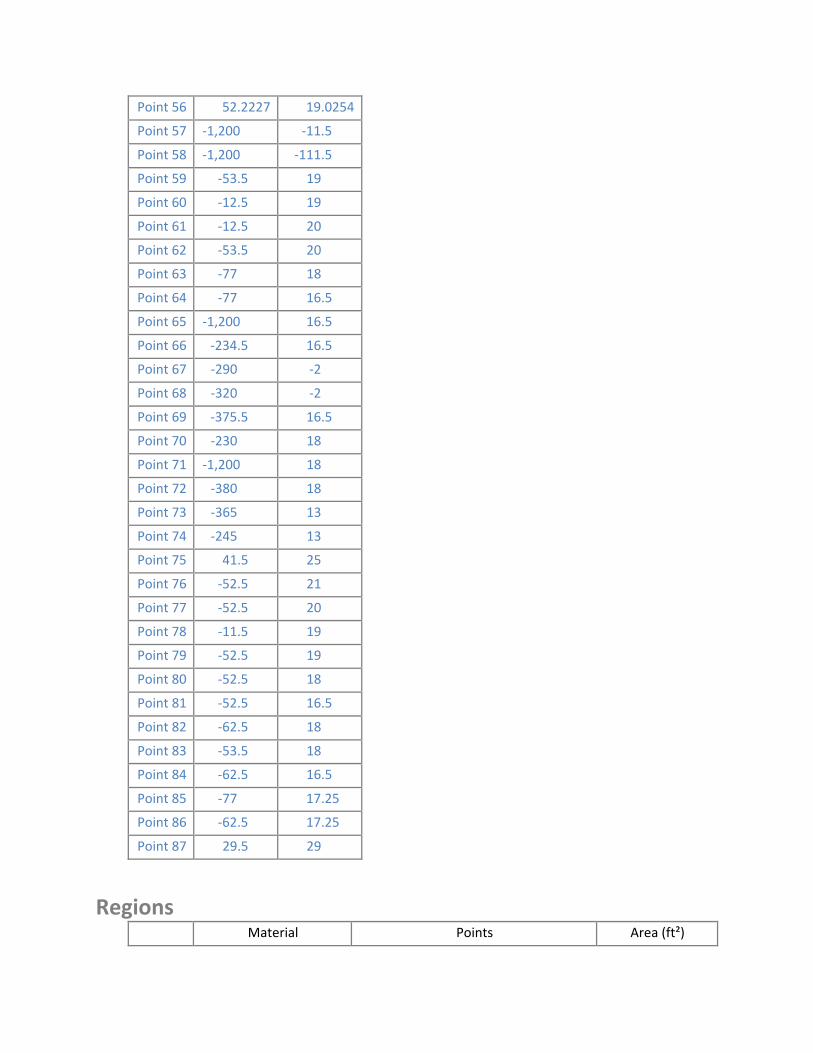
60
65
70
75
80
85
Point 56 52.2227 19.0254
Point 57 ‐1,200 ‐11.5
Point 58 ‐1,200 ‐111.5
Point 59 ‐53.5 19
Point ‐12.5 19
Point 61 ‐12.5 20
Point 62 ‐53.5 20
Point 63 ‐77 18
Point 64 ‐77 16.5
Point ‐1,200 16.5
Point 66 ‐234.5 16.5
Point 67 ‐290 ‐2
Point 68 ‐320 ‐2
Point 69 ‐375.5 16.5
Point ‐230 18
Point 71 ‐1,200 18
Point 72 ‐380 18
Point 73 ‐365 13
Point 74 ‐245 13
Point 41.5 25
Point 76 ‐52.5 21
Point 77 ‐52.5 20
Point 78 ‐11.5 19
Point 79 ‐52.5 19
Point ‐52.5 18
Point 81 ‐52.5 16.5
Point 82 ‐62.5 18
Point 83 ‐53.5 18
Point 84 ‐62.5 16.5
Point ‐77 17.25
Point 86 ‐62.5 17.25
Point 87 29.5 29
Regions Material Points Area (ft²)
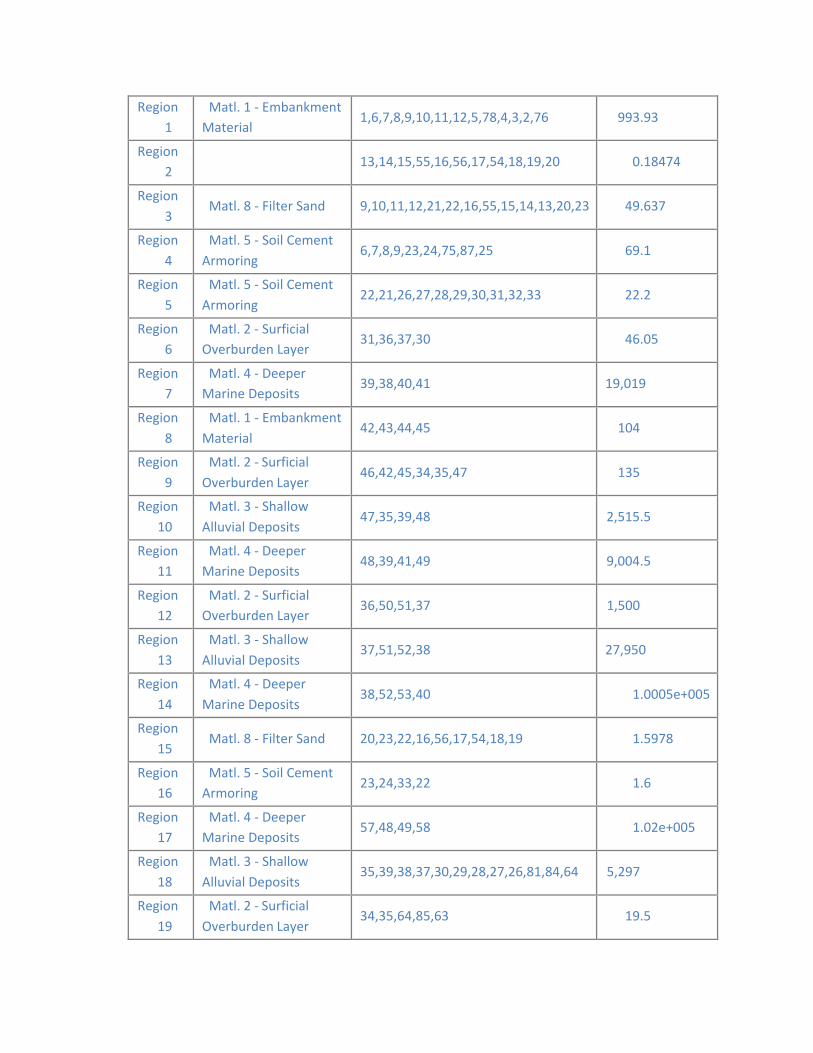
1
2
3
4
5
6
7
8
9
10
11
12
13
14
15
16
17
18
19
Region Matl. 1 ‐ Embankment Material
1,6,7,8,9,10,11,12,5,78,4,3,2,76 993.93
Region 13,14,15,55,16,56,17,54,18,19,20 0.18474
Region Matl. 8 ‐ Filter Sand 9,10,11,12,21,22,16,55,15,14,13,20,23 49.637
Region Matl. 5 ‐ Soil Cement
Armoring 6,7,8,9,23,24,75,87,25 69.1
Region Matl. 5 ‐ Soil Cement
Armoring 22,21,26,27,28,29,30,31,32,33 22.2
Region Matl. 2 ‐ Surficial Overburden Layer
31,36,37,30 46.05
Region Matl. 4 ‐ Deeper Marine Deposits
39,38,40,41 19,019
Region Matl. 1 ‐ Embankment
Material 42,43,44,45 104
Region Matl. 2 ‐ Surficial
Overburden Layer 46,42,45,34,35,47 135
Region Matl. 3 ‐ Shallow
Alluvial Deposits 47,35,39,48 2,515.5
Region Matl. 4 ‐ Deeper Marine Deposits
48,39,41,49 9,004.5
Region Matl. 2 ‐ Surficial Overburden Layer
36,50,51,37 1,500
Region Matl. 3 ‐ Shallow
Alluvial Deposits 37,51,52,38 27,950
Region Matl. 4 ‐ Deeper
Marine Deposits 38,52,53,40 1.0005e+005
Region Matl. 8 ‐ Filter Sand 20,23,22,16,56,17,54,18,19 1.5978
Region Matl. 5 ‐ Soil Cement Armoring
23,24,33,22 1.6
Region Matl. 4 ‐ Deeper Marine Deposits
57,48,49,58 1.02e+005
Region Matl. 3 ‐ Shallow
Alluvial Deposits 35,39,38,37,30,29,28,27,26,81,84,64 5,297
Region Matl. 2 ‐ Surficial
Overburden Layer 34,35,64,85,63 19.5
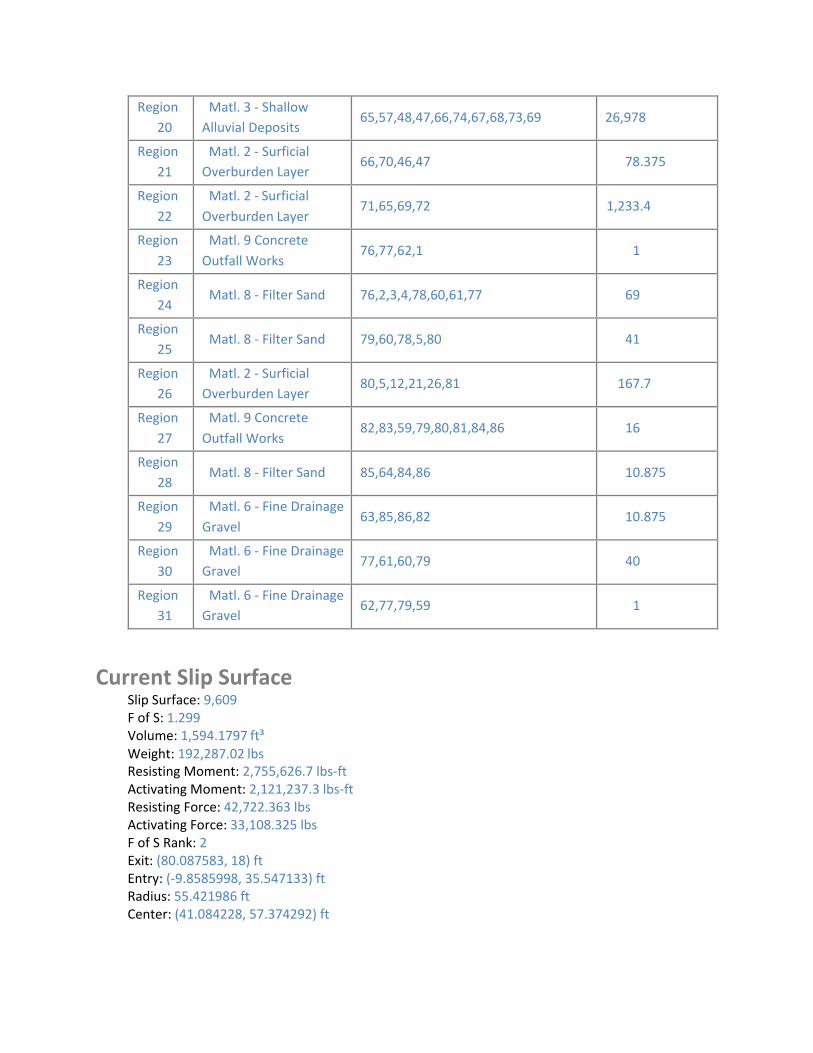
Region
20 Matl. 3 ‐ Shallow Alluvial Deposits
65,57,48,47,66,74,67,68,73,69 26,978
Region
21 Matl. 2 ‐ Surficial Overburden Layer
66,70,46,47 78.375
Region
22
Matl. 2 ‐ Surficial
Overburden Layer 71,65,69,72 1,233.4
Region
23
Matl. 9 Concrete
Outfall Works 76,77,62,1 1
Region
24 Matl. 8 ‐ Filter Sand 76,2,3,4,78,60,61,77 69
Region
25 Matl. 8 ‐ Filter Sand 79,60,78,5,80 41
Region
26
Matl. 2 ‐ Surficial Overburden Layer
80,5,12,21,26,81 167.7
Region
27
Matl. 9 Concrete
Outfall Works 82,83,59,79,80,81,84,86 16
Region
28 Matl. 8 ‐ Filter Sand 85,64,84,86 10.875
Region
29
Matl. 6 ‐ Fine Drainage
Gravel 63,85,86,82 10.875
Region
30
Matl. 6 ‐ Fine Drainage Gravel
77,61,60,79 40
Region
31
Matl. 6 ‐ Fine Drainage Gravel
62,77,79,59 1
Current Slip Surface Slip Surface: 9,609 F of S: 1.299 Volume: 1,594.1797 ft³ Weight: 192,287.02 lbs Resisting Moment: 2,755,626.7 lbs‐ft Activating Moment: 2,121,237.3 lbs‐ft Resisting Force: 42,722.363 lbs Activating Force: 33,108.325 lbs F of S Rank: 2 Exit: (80.087583, 18) ft Entry: (‐9.8585998, 35.547133) ft Radius: 55.421986 ft Center: (41.084228, 57.374292) ft
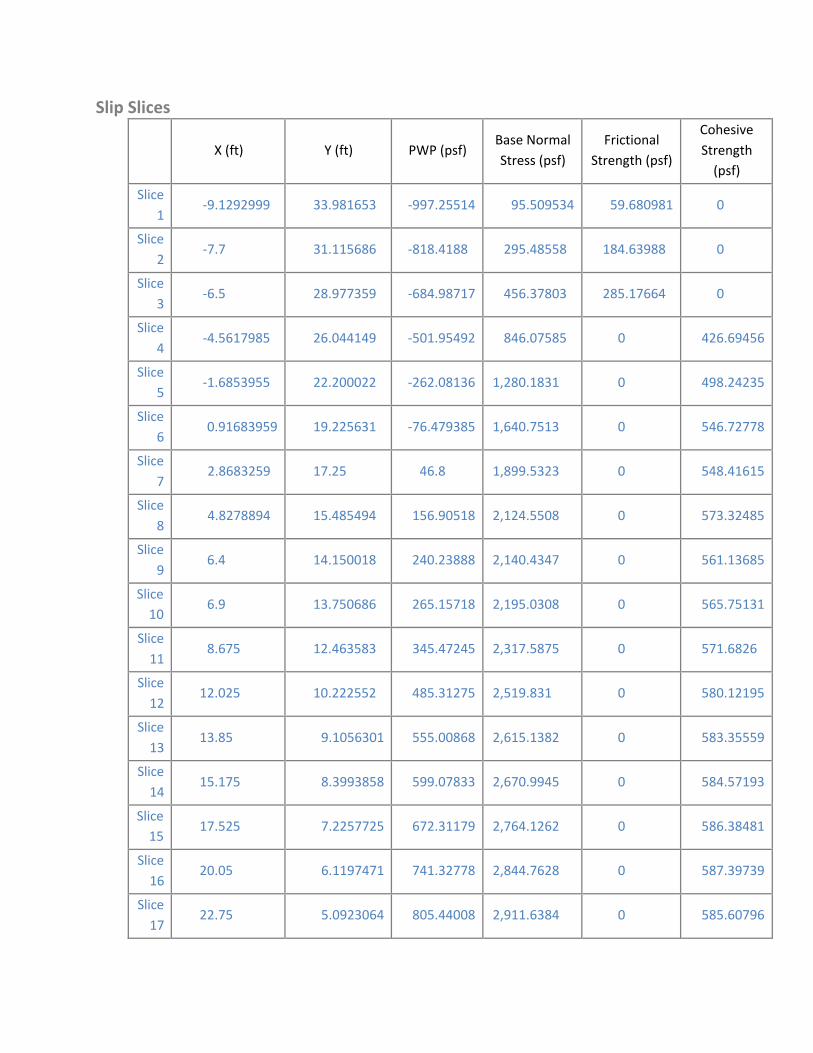
Slip Slices
X (ft) Y (ft) PWP (psf) Base Normal
Stress (psf)
Frictional
Strength (psf)
Cohesive
Strength (psf)
Slice
1 ‐9.1292999 33.981653 ‐997.25514 95.509534 59.680981 0
Slice
2 ‐7.7 31.115686 ‐818.4188 295.48558 184.63988 0
Slice
3 ‐6.5 28.977359 ‐684.98717 456.37803 285.17664 0
Slice
4 ‐4.5617985 26.044149 ‐501.95492 846.07585 0 426.69456
Slice
5 ‐1.6853955 22.200022 ‐262.08136 1,280.1831 0 498.24235
Slice
6 0.91683959 19.225631 ‐76.479385 1,640.7513 0 546.72778
Slice
7 2.8683259 17.25 46.8 1,899.5323 0 548.41615
Slice
8 4.8278894 15.485494 156.90518 2,124.5508 0 573.32485
Slice
9 6.4 14.150018 240.23888 2,140.4347 0 561.13685
Slice 10
6.9 13.750686 265.15718 2,195.0308 0 565.75131
Slice
11 8.675 12.463583 345.47245 2,317.5875 0 571.6826
Slice
12 12.025 10.222552 485.31275 2,519.831 0 580.12195
Slice
13 13.85 9.1056301 555.00868 2,615.1382 0 583.35559
Slice
14 15.175 8.3993858 599.07833 2,670.9945 0 584.57193
Slice 15
17.525 7.2257725 672.31179 2,764.1262 0 586.38481
Slice
16 20.05 6.1197471 741.32778 2,844.7628 0 587.39739
Slice
17 22.75 5.0923064 805.44008 2,911.6384 0 585.60796
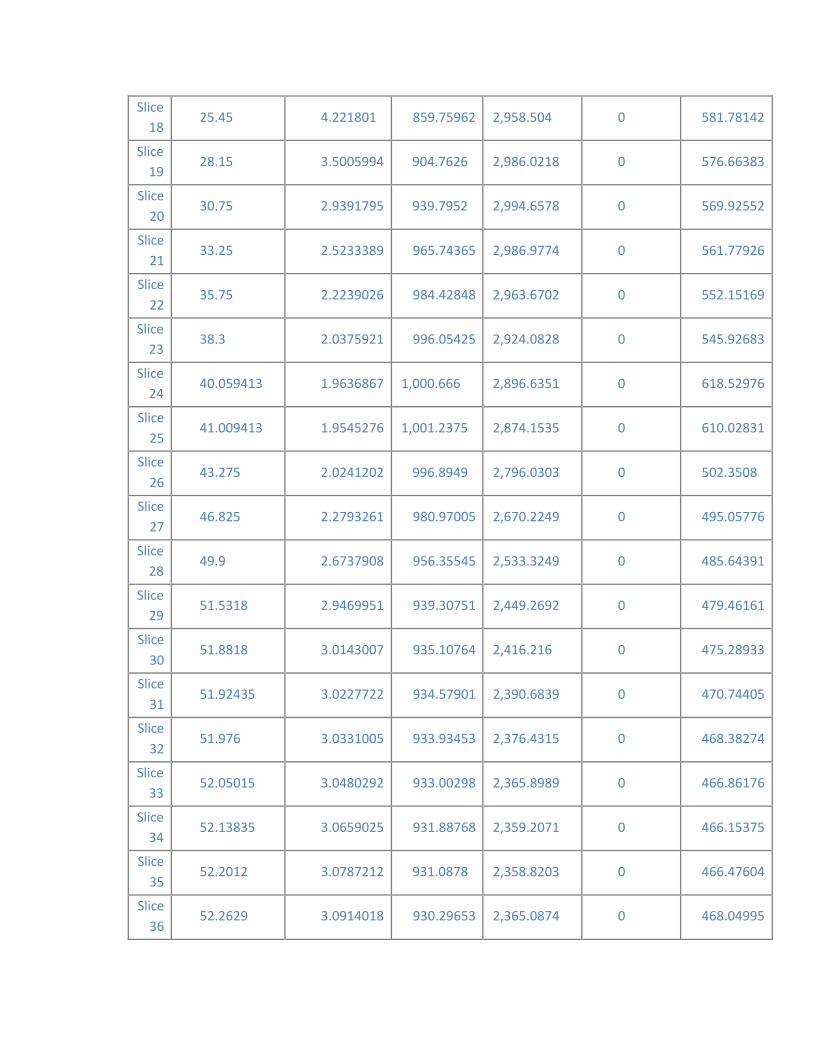
18
19
20
21
22
23
24
25
26
27
28
29
30
31
32
33
34
35
36
Slice 25.45 4.221801 859.75962 2,958.504 0 581.78142
Slice 28.15 3.5005994 904.7626 2,986.0218 0 576.66383
Slice 30.75 2.9391795 939.7952 2,994.6578 0 569.92552
Slice 33.25 2.5233389 965.74365 2,986.9774 0 561.77926
Slice 35.75 2.2239026 984.42848 2,963.6702 0 552.15169
Slice 38.3 2.0375921 996.05425 2,924.0828 0 545.92683
Slice 40.059413 1.9636867 1,000.666 2,896.6351 0 618.52976
Slice 41.009413 1.9545276 1,001.2375 2,874.1535 0 610.02831
Slice 43.275 2.0241202 996.8949 2,796.0303 0 502.3508
Slice 46.825 2.2793261 980.97005 2,670.2249 0 495.05776
Slice 49.9 2.6737908 956.35545 2,533.3249 0 485.64391
Slice 51.5318 2.9469951 939.30751 2,449.2692 0 479.46161
Slice 51.8818 3.0143007 935.10764 2,416.216 0 475.28933
Slice 51.92435 3.0227722 934.57901 2,390.6839 0 470.74405
Slice 51.976 3.0331005 933.93453 2,376.4315 0 468.38274
Slice 52.05015 3.0480292 933.00298 2,365.8989 0 466.86176
Slice 52.13835 3.0659025 931.88768 2,359.2071 0 466.15375
Slice 52.2012 3.0787212 931.0878 2,358.8203 0 466.47604
Slice 52.2629 3.0914018 930.29653 2,365.0874 0 468.04995
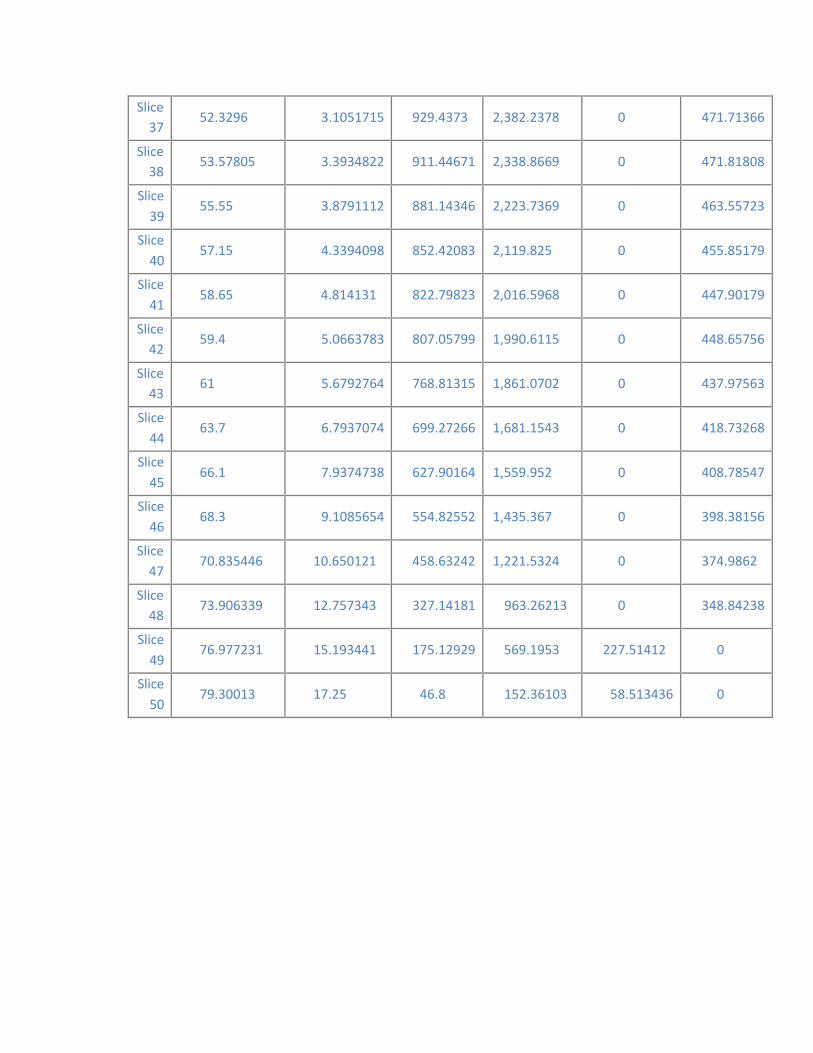
37
38
39
40
41
42
43
44
45
46
47
48
49
50
Slice 52.3296 3.1051715 929.4373 2,382.2378 0 471.71366
Slice 53.57805 3.3934822 911.44671 2,338.8669 0 471.81808
Slice 55.55 3.8791112 881.14346 2,223.7369 0 463.55723
Slice 57.15 4.3394098 852.42083 2,119.825 0 455.85179
Slice 58.65 4.814131 822.79823 2,016.5968 0 447.90179
Slice 59.4 5.0663783 807.05799 1,990.6115 0 448.65756
Slice 61 5.6792764 768.81315 1,861.0702 0 437.97563
Slice 63.7 6.7937074 699.27266 1,681.1543 0 418.73268
Slice 66.1 7.9374738 627.90164 1,559.952 0 408.78547
Slice 68.3 9.1085654 554.82552 1,435.367 0 398.38156
Slice 70.835446 10.650121 458.63242 1,221.5324 0 374.9862
Slice 73.906339 12.757343 327.14181 963.26213 0 348.84238
Slice 76.977231 15.193441 175.12929 569.1953 227.51412 0
Slice 79.30013 17.25 46.8 152.36103 58.513436 0

Slope Stability US Slope G&R (EOC) Report generated using GeoStudio 2012. Copyright © 1991‐2013 GEO‐SLOPE International Ltd.
File Information Title: LOWP PIR Analysis Section H Created By: Viessman, Michael W CIV USARMY CESAJ (US) Last Edited By: Viessman, Michael W CIV USARMY CESAJ (US) Revision Number: 548 File Version: 8.2 Tool Version: 8.12.3.7901 Date: 8/26/2018 Time: 9:18:38 PM File Name: Section H EOC USP‐DSP w toe drain.gsz Directory: C:\Users\k3engmwv\Documents\LOWP\FY17‐18 PIR Work\SEEP and SLOPEW Files\ Last Solved Date: 8/26/2018 Last Solved Time: 8:24:02 PM
Project Settings Length(L) Units: feet Time(t) Units: Seconds Force(F) Units: lbf Pressure(p) Units: psf Strength Units: psf Unit Weight of Water: 62.4 pcf View: 2D Element Thickness: 1
Analysis Settings
Slope Stability US Slope G&R (EOC) Description: No U/S pool, No D/S pool Kind: SLOPE/W Parent: Steady‐State Seepage (EOC) Method: Spencer Settings
Lambda Lambda 1: ‐1 Lambda 2: ‐0.8 Lambda 3: ‐0.6 Lambda 4: ‐0.4 Lambda 5: ‐0.2 Lambda 6: 0

Lambda 7: 0.2 Lambda 8: 0.4 Lambda 9: 0.6 Lambda 10: 0.8 Lambda 11: 1
PWP Conditions Source: Parent Analysis Slip Surface
Direction of movement: Left to Right Use Passive Mode: No Slip Surface Option: Grid and Radius Critical slip surfaces saved: 1 Optimize Critical Slip Surface Location: Yes Tension Crack
Tension Crack Option: (none) F of S Distribution
F of S Calculation Option: Constant Advanced
Number of Slices: 30 F of S Tolerance: 0.001 Minimum Slip Surface Depth: 1 ft Optimization Maximum Iterations: 2,000 Optimization Convergence Tolerance: 1e‐007 Starting Optimization Points: 8 Ending Optimization Points: 16 Complete Passes per Insertion: 1 Driving Side Maximum Convex Angle: 5 ° Resisting Side Maximum Convex Angle: 1 °
Materials
Matl. 1 ‐ Embankment Material Model: Mohr‐Coulomb Unit Weight: 125 pcf Cohesion': 0 psf Phi': 32 ° Phi‐B: 0 ° Constant Unit Wt. Above Water Table: 120 pcf
Matl. 2 ‐ Surficial Overburden Layer Model: Mohr‐Coulomb Unit Weight: 109 pcf Cohesion': 0 psf Phi': 29 ° Phi‐B: 0 ° Constant Unit Wt. Above Water Table: 106 pcf

Matl. 3 ‐ Shallow Alluvial Deposits Model: Mohr‐Coulomb Unit Weight: 123 pcf Cohesion': 0 psf Phi': 30 ° Phi‐B: 0 °
Matl. 4 ‐ Deeper Marine Deposits Model: Mohr‐Coulomb Unit Weight: 125 pcf Cohesion': 0 psf Phi': 33 ° Phi‐B: 0 °
Matl. 5 ‐ Soil Cement Armoring Model: Mohr‐Coulomb Unit Weight: 125 pcf Cohesion': 0 psf Phi': 35 ° Phi‐B: 0 ° Constant Unit Wt. Above Water Table: 120 pcf
Matl. 6 ‐ Fine Drainage Gravel Model: Mohr‐Coulomb Unit Weight: 130 pcf Cohesion': 0 psf Phi': 35 ° Phi‐B: 0 ° Constant Unit Wt. Above Water Table: 115 pcf
Matl. 8 ‐ Filter Sand Model: Mohr‐Coulomb Unit Weight: 120 pcf Cohesion': 0 psf Phi': 33 ° Phi‐B: 0 ° Constant Unit Wt. Above Water Table: 115 pcf
Matl. 9 Concrete Outfall Works Model: Bedrock (Impenetrable)
Slip Surface Grid Upper Left: (45.7361, 199.5947) ft Lower Left: (45.7361, 121.5108) ft Lower Right: (152.6033, 121.5108) ft Grid Horizontal Increment: 25
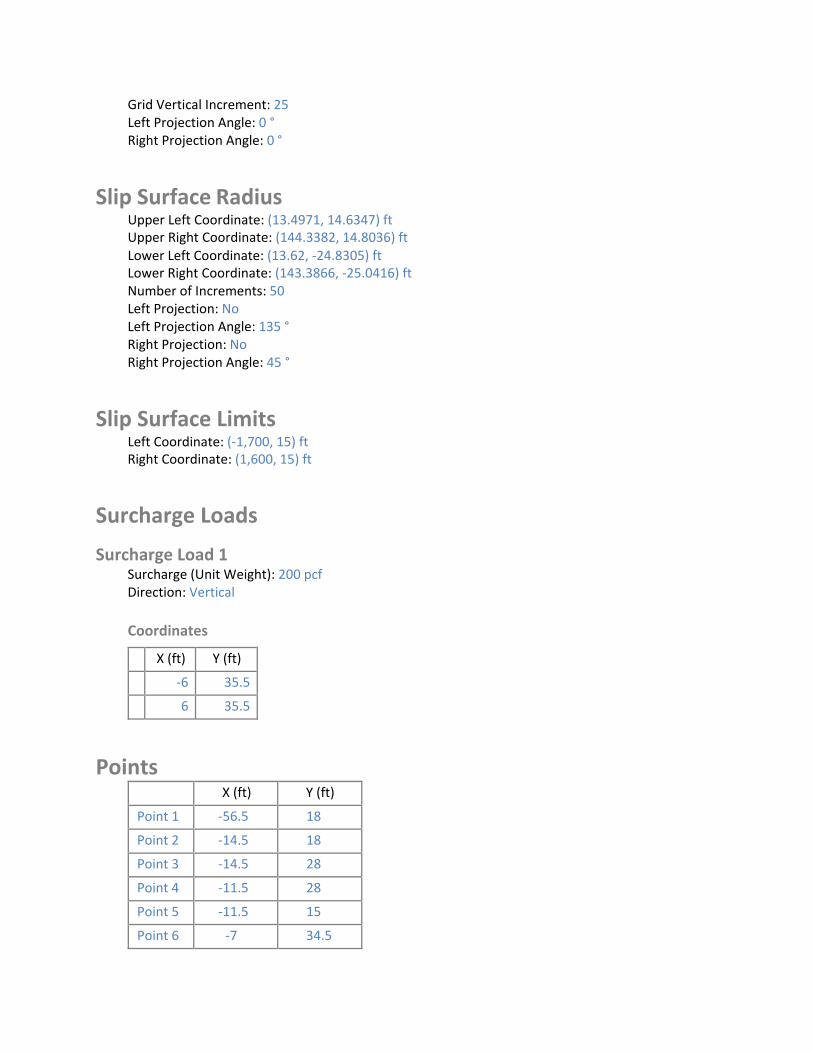
Grid Vertical Increment: 25 Left Projection Angle: 0 ° Right Projection Angle: 0 °
Slip Surface Radius Upper Left Coordinate: (13.4971, 14.6347) ft Upper Right Coordinate: (144.3382, 14.8036) ft Lower Left Coordinate: (13.62, ‐24.8305) ft Lower Right Coordinate: (143.3866, ‐25.0416) ft Number of Increments: 50 Left Projection: No Left Projection Angle: 135 ° Right Projection: No Right Projection Angle: 45 °
Slip Surface Limits Left Coordinate: (‐1,700, 15) ft Right Coordinate: (1,600, 15) ft
Surcharge Loads
Surcharge Load 1 Surcharge (Unit Weight): 200 pcf Direction: Vertical
Coordinates
X (ft) Y (ft)
‐6 35.5
6 35.5
Points X (ft) Y (ft)
Point 1 ‐56.5 18
Point 2 ‐14.5 18
Point 3 ‐14.5 28
Point 4 ‐11.5 28
Point 5 ‐11.5 15
Point 6 ‐7 34.5
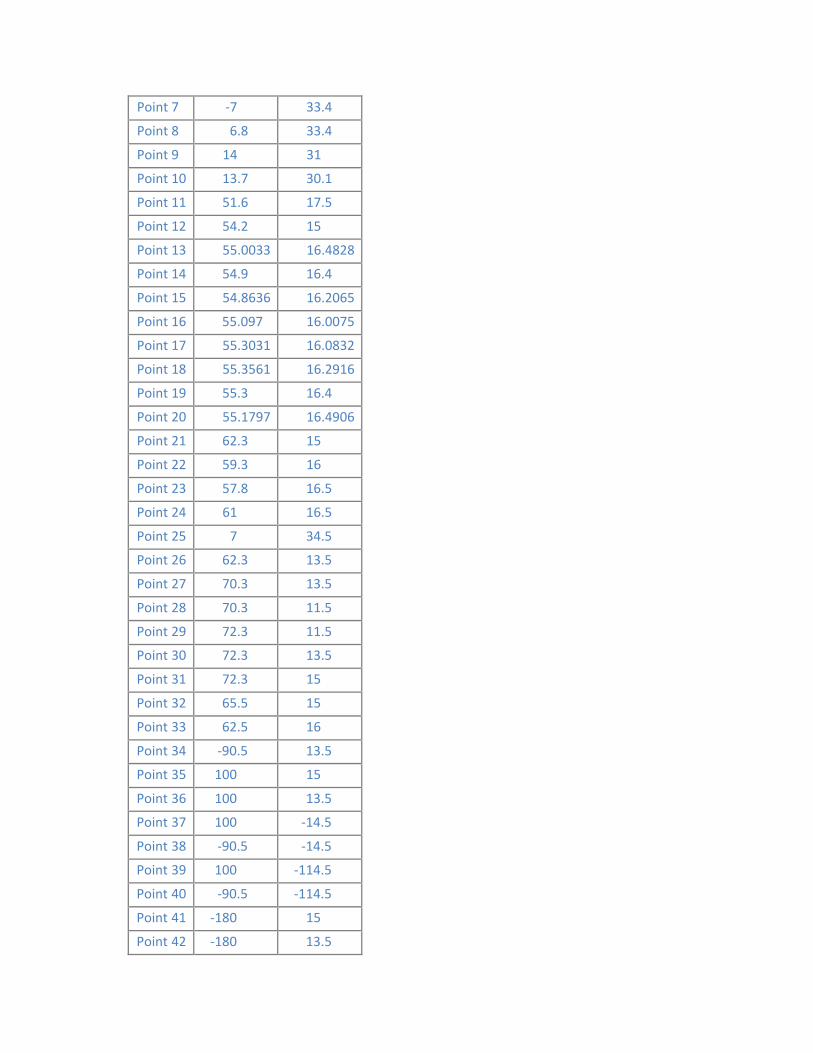
7
8
9
10
11
12
13
14
15
16
17
18
19
20
21
22
23
24
25
26
27
28
29
30
31
32
33
34
35
36
37
38
39
40
41
42
Point ‐7 33.4
Point 6.8 33.4
Point 14 31
Point 13.7 30.1
Point 51.6 17.5
Point 54.2 15
Point 55.0033 16.4828
Point 54.9 16.4
Point 54.8636 16.2065
Point 55.097 16.0075
Point 55.3031 16.0832
Point 55.3561 16.2916
Point 55.3 16.4
Point 55.1797 16.4906
Point 62.3 15
Point 59.3 16
Point 57.8 16.5
Point 61 16.5
Point 7 34.5
Point 62.3 13.5
Point 70.3 13.5
Point 70.3 11.5
Point 72.3 11.5
Point 72.3 13.5
Point 72.3 15
Point 65.5 15
Point 62.5 16
Point ‐90.5 13.5
Point 100 15
Point 100 13.5
Point 100 ‐14.5
Point ‐90.5 ‐14.5
Point 100 ‐114.5
Point ‐90.5 ‐114.5
Point ‐180 15
Point ‐180 13.5

43
44
45
46
47
48
49
50
51
52
53
54
55
56
57
58
59
60
61
62
63
64
65
66
67
68
69
70
71
72
73
74
75
76
77
78
Point ‐180 ‐14.5
Point ‐180 ‐114.5
Point 1,600 15
Point 1,600 13.5
Point 1,600 ‐14.5
Point 1,600 ‐114.5
Point 41.5 23
Point 55.3546 16.1839
Point 54.9487 16.066
Point 55.2227 16.0254
Point ‐1,700 15
Point ‐1,700 13.5
Point ‐1,700 ‐14.5
Point ‐1,700 ‐114.5
Point ‐65.5 13.5
Point ‐55.5 13.5
Point ‐55.5 15
Point ‐55.5 16
Point ‐55.5 17
Point ‐55.5 18
Point ‐11.5 16
Point ‐12.5 16
Point ‐12.5 17
Point ‐56.5 16
Point ‐56.5 17
Point ‐65.5 15
Point ‐56.5 15
Point ‐70.5 13.5
Point ‐70.5 14.25
Point ‐65.5 14.25
Point ‐70.5 15
Point ‐85.5 13.5
Point ‐85.5 14.25
Point ‐85.5 15
Point ‐90.5 15
Point ‐85.9 13.5
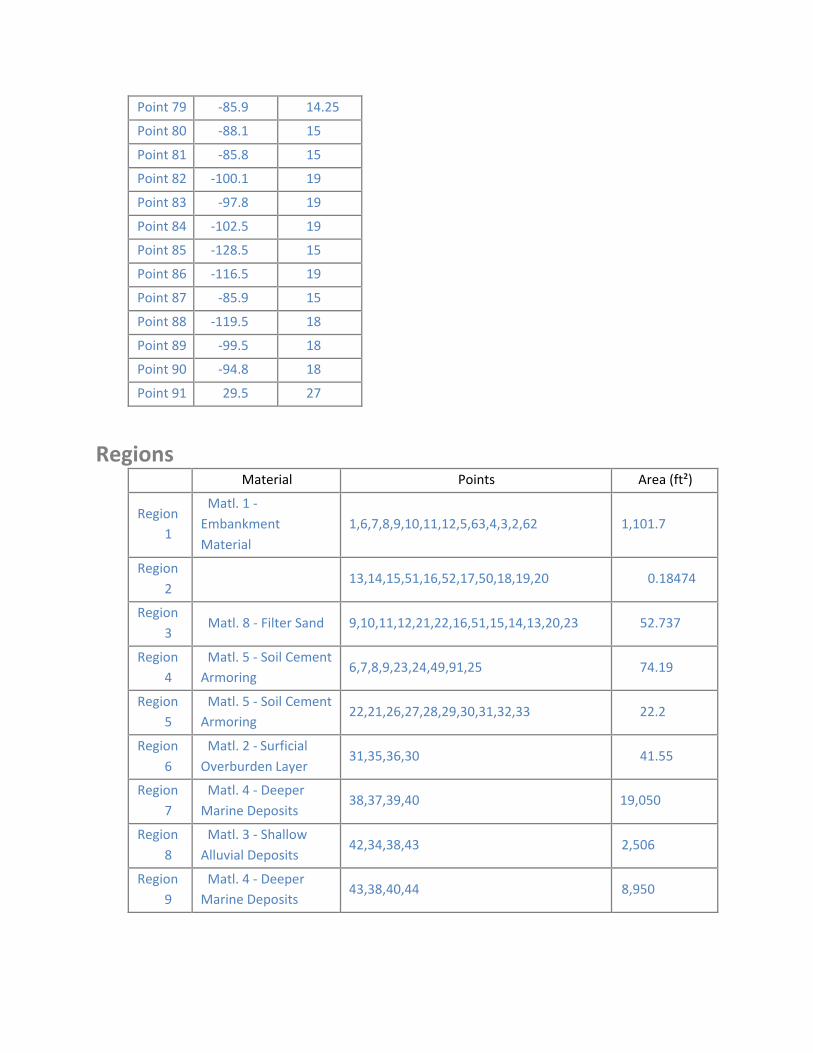
Point 79 ‐85.9 14.25
Point 80 ‐88.1 15
Point 81 ‐85.8 15
Point 82 ‐100.1 19
Point 83 ‐97.8 19
Point 84 ‐102.5 19
Point 85 ‐128.5 15
Point 86 ‐116.5 19
Point 87 ‐85.9 15
Point 88 ‐119.5 18
Point 89 ‐99.5 18
Point 90 ‐94.8 18
Point 91 29.5 27
Regions Material Points Area (ft²)
Region 1
Matl. 1 ‐
Embankment
Material
1,6,7,8,9,10,11,12,5,63,4,3,2,62 1,101.7
Region
2 13,14,15,51,16,52,17,50,18,19,20 0.18474
Region
3 Matl. 8 ‐ Filter Sand 9,10,11,12,21,22,16,51,15,14,13,20,23 52.737
Region
4
Matl. 5 ‐ Soil Cement Armoring
6,7,8,9,23,24,49,91,25 74.19
Region
5
Matl. 5 ‐ Soil Cement Armoring
22,21,26,27,28,29,30,31,32,33 22.2
Region
6
Matl. 2 ‐ Surficial
Overburden Layer 31,35,36,30 41.55
Region
7
Matl. 4 ‐ Deeper
Marine Deposits 38,37,39,40 19,050
Region
8
Matl. 3 ‐ Shallow
Alluvial Deposits 42,34,38,43 2,506
Region
9
Matl. 4 ‐ Deeper Marine Deposits
43,38,40,44 8,950
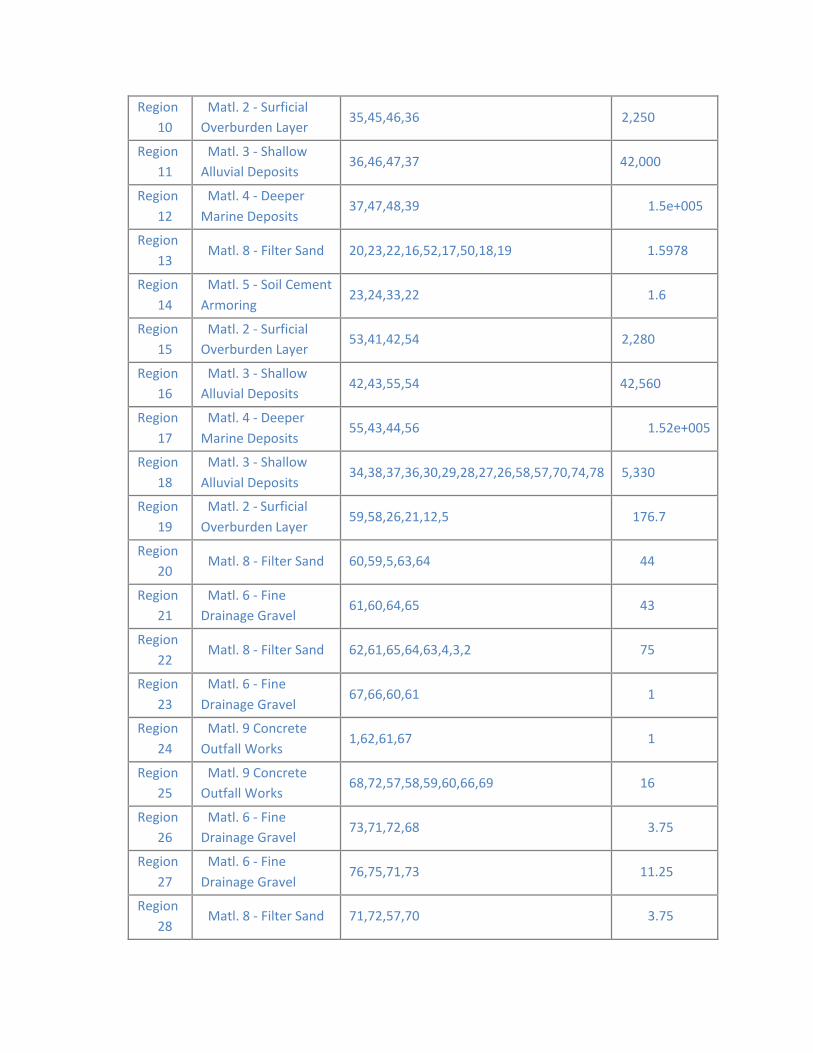
10
11
12
13
14
15
16
17
18
19
20
21
22
23
24
25
26
27
28
Region Matl. 2 ‐ Surficial Overburden Layer
35,45,46,36 2,250
Region Matl. 3 ‐ Shallow Alluvial Deposits
36,46,47,37 42,000
Region Matl. 4 ‐ Deeper
Marine Deposits 37,47,48,39 1.5e+005
Region Matl. 8 ‐ Filter Sand 20,23,22,16,52,17,50,18,19 1.5978
Region Matl. 5 ‐ Soil Cement
Armoring 23,24,33,22 1.6
Region Matl. 2 ‐ Surficial Overburden Layer
53,41,42,54 2,280
Region Matl. 3 ‐ Shallow Alluvial Deposits
42,43,55,54 42,560
Region Matl. 4 ‐ Deeper
Marine Deposits 55,43,44,56 1.52e+005
Region Matl. 3 ‐ Shallow
Alluvial Deposits 34,38,37,36,30,29,28,27,26,58,57,70,74,78 5,330
Region Matl. 2 ‐ Surficial
Overburden Layer 59,58,26,21,12,5 176.7
Region Matl. 8 ‐ Filter Sand 60,59,5,63,64 44
Region Matl. 6 ‐ Fine Drainage Gravel
61,60,64,65 43
Region Matl. 8 ‐ Filter Sand 62,61,65,64,63,4,3,2 75
Region Matl. 6 ‐ Fine
Drainage Gravel 67,66,60,61 1
Region Matl. 9 Concrete
Outfall Works 1,62,61,67 1
Region Matl. 9 Concrete Outfall Works
68,72,57,58,59,60,66,69 16
Region Matl. 6 ‐ Fine Drainage Gravel
73,71,72,68 3.75
Region Matl. 6 ‐ Fine
Drainage Gravel 76,75,71,73 11.25
Region Matl. 8 ‐ Filter Sand 71,72,57,70 3.75
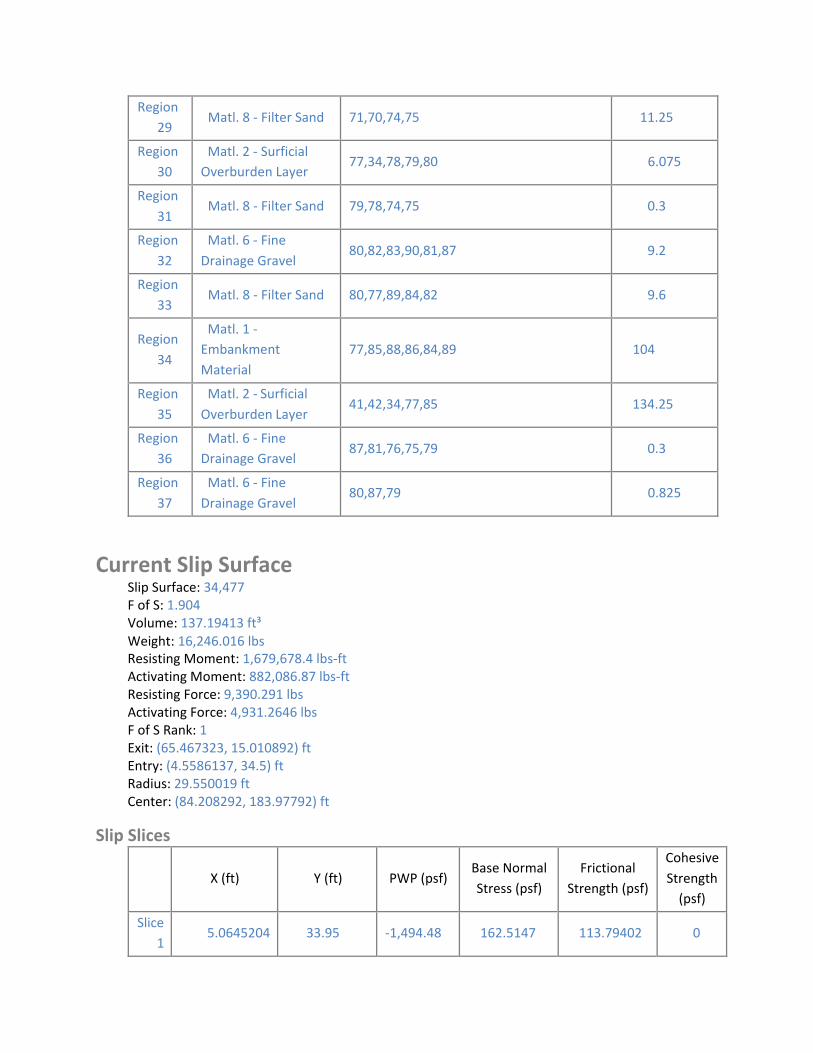
Region
29 Matl. 8 ‐ Filter Sand 71,70,74,75 11.25
Region
30 Matl. 2 ‐ Surficial Overburden Layer
77,34,78,79,80 6.075
Region
31 Matl. 8 ‐ Filter Sand 79,78,74,75 0.3
Region
32
Matl. 6 ‐ Fine
Drainage Gravel 80,82,83,90,81,87 9.2
Region
33 Matl. 8 ‐ Filter Sand 80,77,89,84,82 9.6
Region
34
Matl. 1 ‐Embankment
Material
77,85,88,86,84,89 104
Region
35
Matl. 2 ‐ Surficial
Overburden Layer 41,42,34,77,85 134.25
Region
36 Matl. 6 ‐ Fine Drainage Gravel
87,81,76,75,79 0.3
Region
37
Matl. 6 ‐ Fine
Drainage Gravel 80,87,79 0.825
Current Slip Surface Slip Surface: 34,477 F of S: 1.904 Volume: 137.19413 ft³ Weight: 16,246.016 lbs Resisting Moment: 1,679,678.4 lbs‐ft Activating Moment: 882,086.87 lbs‐ft Resisting Force: 9,390.291 lbs Activating Force: 4,931.2646 lbs F of S Rank: 1 Exit: (65.467323, 15.010892) ft Entry: (4.5586137, 34.5) ft Radius: 29.550019 ft Center: (84.208292, 183.97792) ft
Slip Slices
X (ft) Y (ft) PWP (psf) Base Normal
Stress (psf)
Frictional
Strength (psf)
Cohesive
Strength (psf)
Slice
1 5.0645204 33.95 ‐1,494.48 162.5147 113.79402 0
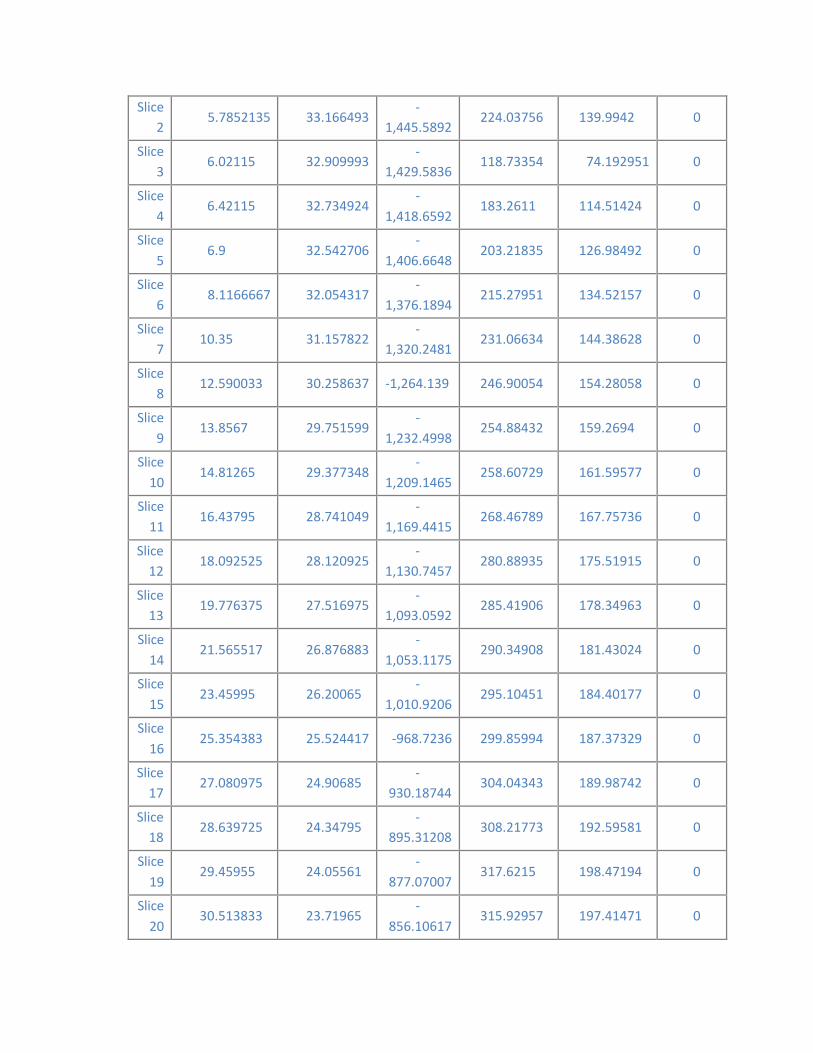
2
3
4
5
6
7
8
9
10
11
12
13
14
15
16
17
18
19
20
Slice 5.7852135 33.166493
‐
1,445.5892 224.03756 139.9942 0
Slice 6.02115 32.909993
‐
1,429.5836 118.73354 74.192951 0
Slice 6.42115 32.734924
‐
1,418.6592 183.2611 114.51424 0
Slice 6.9 32.542706
‐
1,406.6648 203.21835 126.98492 0
Slice 8.1166667 32.054317
‐
1,376.1894 215.27951 134.52157 0
Slice 10.35 31.157822
‐
1,320.2481 231.06634 144.38628 0
Slice 12.590033 30.258637 ‐1,264.139 246.90054 154.28058 0
Slice 13.8567 29.751599
‐
1,232.4998 254.88432 159.2694 0
Slice 14.81265 29.377348
‐
1,209.1465 258.60729 161.59577 0
Slice 16.43795 28.741049
‐
1,169.4415 268.46789 167.75736 0
Slice 18.092525 28.120925
‐
1,130.7457 280.88935 175.51915 0
Slice 19.776375 27.516975
‐
1,093.0592 285.41906 178.34963 0
Slice 21.565517 26.876883
‐
1,053.1175 290.34908 181.43024 0
Slice 23.45995 26.20065
‐
1,010.9206 295.10451 184.40177 0
Slice 25.354383 25.524417 ‐968.7236 299.85994 187.37329 0
Slice 27.080975 24.90685
‐
930.18744 304.04343 189.98742 0
Slice 28.639725 24.34795
‐
895.31208 308.21773 192.59581 0
Slice 29.45955 24.05561
‐
877.07007 317.6215 198.47194 0
Slice 30.513833 23.71965
‐
856.10617 315.92957 197.41471 0
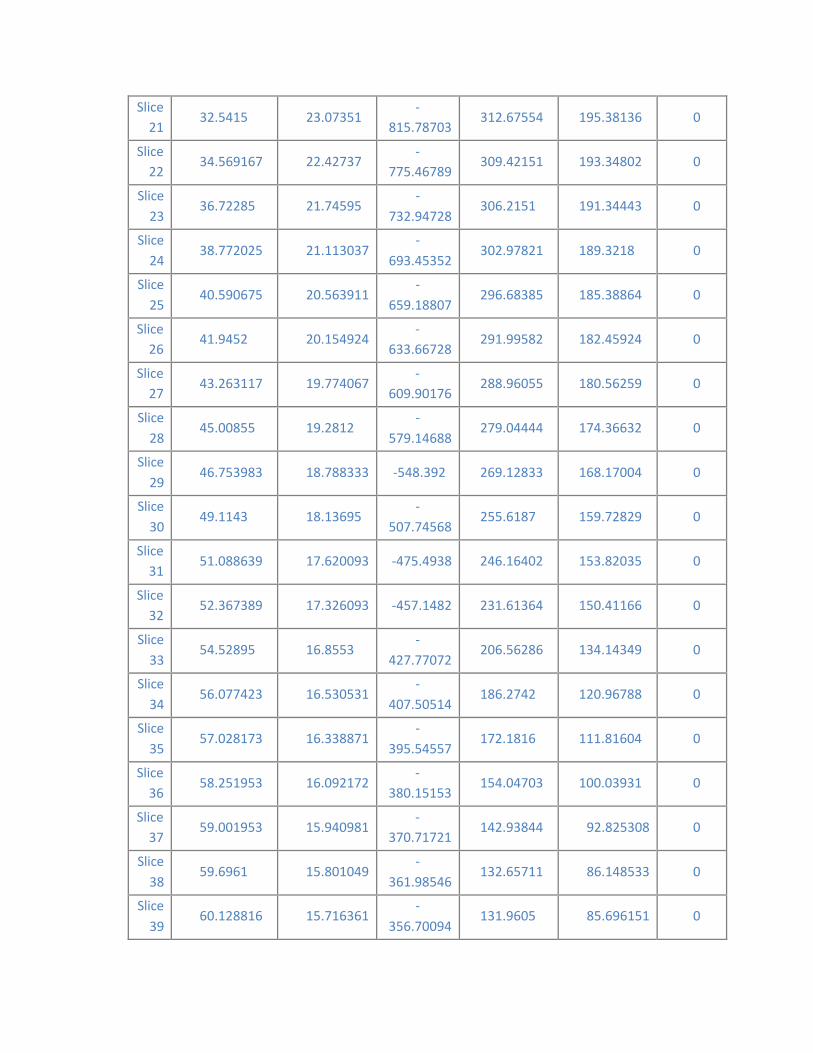
21
22
23
24
25
26
27
28
29
30
31
32
33
34
35
36
37
38
39
Slice 32.5415 23.07351
‐
815.78703 312.67554 195.38136 0
Slice 34.569167 22.42737
‐
775.46789 309.42151 193.34802 0
Slice 36.72285 21.74595
‐
732.94728 306.2151 191.34443 0
Slice 38.772025 21.113037
‐
693.45352 302.97821 189.3218 0
Slice 40.590675 20.563911
‐
659.18807 296.68385 185.38864 0
Slice 41.9452 20.154924
‐
633.66728 291.99582 182.45924 0
Slice 43.263117 19.774067
‐
609.90176 288.96055 180.56259 0
Slice 45.00855 19.2812
‐
579.14688 279.04444 174.36632 0
Slice 46.753983 18.788333 ‐548.392 269.12833 168.17004 0
Slice 49.1143 18.13695
‐
507.74568 255.6187 159.72829 0
Slice 51.088639 17.620093 ‐475.4938 246.16402 153.82035 0
Slice 52.367389 17.326093 ‐457.1482 231.61364 150.41166 0
Slice 54.52895 16.8553
‐
427.77072 206.56286 134.14349 0
Slice 56.077423 16.530531
‐
407.50514 186.2742 120.96788 0
Slice 57.028173 16.338871
‐
395.54557 172.1816 111.81604 0
Slice 58.251953 16.092172
‐
380.15153 154.04703 100.03931 0
Slice 59.001953 15.940981
‐
370.71721 142.93844 92.825308 0
Slice 59.6961 15.801049
‐
361.98546 132.65711 86.148533 0
Slice 60.128816 15.716361
‐
356.70094 131.9605 85.696151 0

Slice 40
60.582716 15.65638 ‐
352.95809 121.42703 85.024124 0
Slice 41
61.75 15.502126 ‐
343.33268 92.409381 64.705745 0
Slice
42 63.983661 15.206954
‐
324.91394 36.88252 25.825418 0
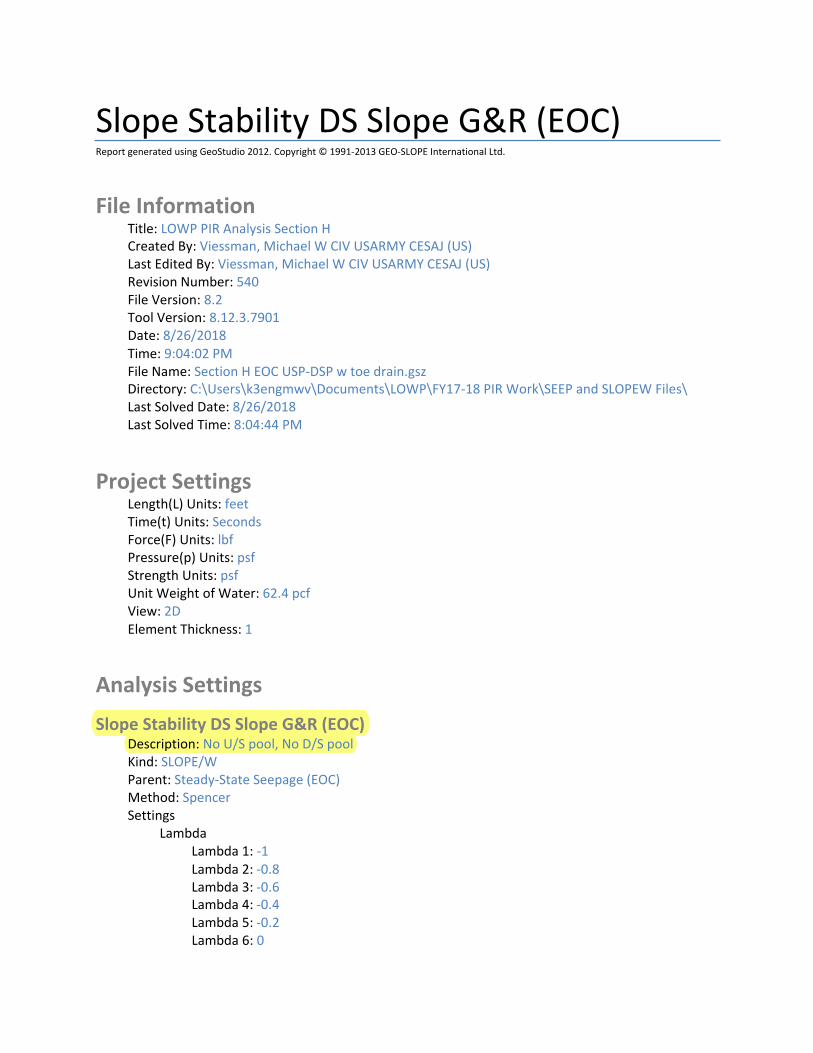
Slope Stability DS Slope G&R (EOC) Report generated using GeoStudio 2012. Copyright © 1991‐2013 GEO‐SLOPE International Ltd.
File Information Title: LOWP PIR Analysis Section H Created By: Viessman, Michael W CIV USARMY CESAJ (US) Last Edited By: Viessman, Michael W CIV USARMY CESAJ (US) Revision Number: 540 File Version: 8.2 Tool Version: 8.12.3.7901 Date: 8/26/2018 Time: 9:04:02 PM File Name: Section H EOC USP‐DSP w toe drain.gsz Directory: C:\Users\k3engmwv\Documents\LOWP\FY17‐18 PIR Work\SEEP and SLOPEW Files\ Last Solved Date: 8/26/2018 Last Solved Time: 8:04:44 PM
Project Settings Length(L) Units: feet Time(t) Units: Seconds Force(F) Units: lbf Pressure(p) Units: psf Strength Units: psf Unit Weight of Water: 62.4 pcf View: 2D Element Thickness: 1
Analysis Settings
Slope Stability DS Slope G&R (EOC) Description: No U/S pool, No D/S pool Kind: SLOPE/W Parent: Steady‐State Seepage (EOC) Method: Spencer Settings
Lambda Lambda 1: ‐1 Lambda 2: ‐0.8 Lambda 3: ‐0.6 Lambda 4: ‐0.4 Lambda 5: ‐0.2 Lambda 6: 0

Lambda 7: 0.2 Lambda 8: 0.4 Lambda 9: 0.6 Lambda 10: 0.8 Lambda 11: 1
PWP Conditions Source: Parent Analysis Slip Surface
Direction of movement: Right to Left Use Passive Mode: No Slip Surface Option: Grid and Radius Critical slip surfaces saved: 1 Optimize Critical Slip Surface Location: Yes Tension Crack
Tension Crack Option: (none) F of S Distribution
F of S Calculation Option: Constant Advanced
Number of Slices: 30 F of S Tolerance: 0.001 Minimum Slip Surface Depth: 1 ft Optimization Maximum Iterations: 2,000 Optimization Convergence Tolerance: 1e‐007 Starting Optimization Points: 8 Ending Optimization Points: 16 Complete Passes per Insertion: 1 Driving Side Maximum Convex Angle: 5 ° Resisting Side Maximum Convex Angle: 1 °
Materials
Matl. 1 ‐ Embankment Material Model: Mohr‐Coulomb Unit Weight: 125 pcf Cohesion': 0 psf Phi': 32 ° Phi‐B: 0 ° Constant Unit Wt. Above Water Table: 120 pcf
Matl. 2 ‐ Surficial Overburden Layer Model: Mohr‐Coulomb Unit Weight: 109 pcf Cohesion': 0 psf Phi': 29 ° Phi‐B: 0 ° Constant Unit Wt. Above Water Table: 106 pcf

Matl. 3 ‐ Shallow Alluvial Deposits Model: Mohr‐Coulomb Unit Weight: 123 pcf Cohesion': 0 psf Phi': 30 ° Phi‐B: 0 °
Matl. 4 ‐ Deeper Marine Deposits Model: Mohr‐Coulomb Unit Weight: 125 pcf Cohesion': 0 psf Phi': 33 ° Phi‐B: 0 °
Matl. 5 ‐ Soil Cement Armoring Model: Mohr‐Coulomb Unit Weight: 125 pcf Cohesion': 0 psf Phi': 35 ° Phi‐B: 0 ° Constant Unit Wt. Above Water Table: 120 pcf
Matl. 6 ‐ Fine Drainage Gravel Model: Mohr‐Coulomb Unit Weight: 130 pcf Cohesion': 0 psf Phi': 35 ° Phi‐B: 0 ° Constant Unit Wt. Above Water Table: 115 pcf
Matl. 8 ‐ Filter Sand Model: Mohr‐Coulomb Unit Weight: 120 pcf Cohesion': 0 psf Phi': 33 ° Phi‐B: 0 ° Constant Unit Wt. Above Water Table: 115 pcf
Matl. 9 Concrete Outfall Works Model: Bedrock (Impenetrable)
Slip Surface Grid Upper Left: (‐102.8639, 115.7947) ft Lower Left: (‐102.8639, 37.7108) ft Lower Right: (4.0033, 37.7108) ft Grid Horizontal Increment: 25

Grid Vertical Increment: 25 Left Projection Angle: 0 ° Right Projection Angle: 0 °
Slip Surface Radius Upper Left Coordinate: (‐137.2029, 14.9347) ft Upper Right Coordinate: (‐6.3618, 15.1036) ft Lower Left Coordinate: (‐137.08, ‐24.5305) ft Lower Right Coordinate: (‐7.3134, ‐24.7416) ft Number of Increments: 50 Left Projection: No Left Projection Angle: 135 ° Right Projection: No Right Projection Angle: 45 °
Slip Surface Limits Left Coordinate: (‐1,700, 15) ft Right Coordinate: (1,600, 15) ft
Surcharge Loads
Surcharge Load 1 Surcharge (Unit Weight): 200 pcf Direction: Vertical
Coordinates
X (ft) Y (ft)
‐6 35.5
6 35.5
Points X (ft) Y (ft)
Point 1 ‐56.5 18
Point 2 ‐14.5 18
Point 3 ‐14.5 28
Point 4 ‐11.5 28
Point 5 ‐11.5 15
Point 6 ‐7 34.5

7
8
9
10
11
12
13
14
15
16
17
18
19
20
21
22
23
24
25
26
27
28
29
30
31
32
33
34
35
36
37
38
39
40
41
42
Point ‐7 33.4
Point 6.8 33.4
Point 14 31
Point 13.7 30.1
Point 51.6 17.5
Point 54.2 15
Point 55.0033 16.4828
Point 54.9 16.4
Point 54.8636 16.2065
Point 55.097 16.0075
Point 55.3031 16.0832
Point 55.3561 16.2916
Point 55.3 16.4
Point 55.1797 16.4906
Point 62.3 15
Point 59.3 16
Point 57.8 16.5
Point 61 16.5
Point 7 34.5
Point 62.3 13.5
Point 70.3 13.5
Point 70.3 11.5
Point 72.3 11.5
Point 72.3 13.5
Point 72.3 15
Point 65.5 15
Point 62.5 16
Point ‐90.5 13.5
Point 100 15
Point 100 13.5
Point 100 ‐14.5
Point ‐90.5 ‐14.5
Point 100 ‐114.5
Point ‐90.5 ‐114.5
Point ‐180 15
Point ‐180 13.5
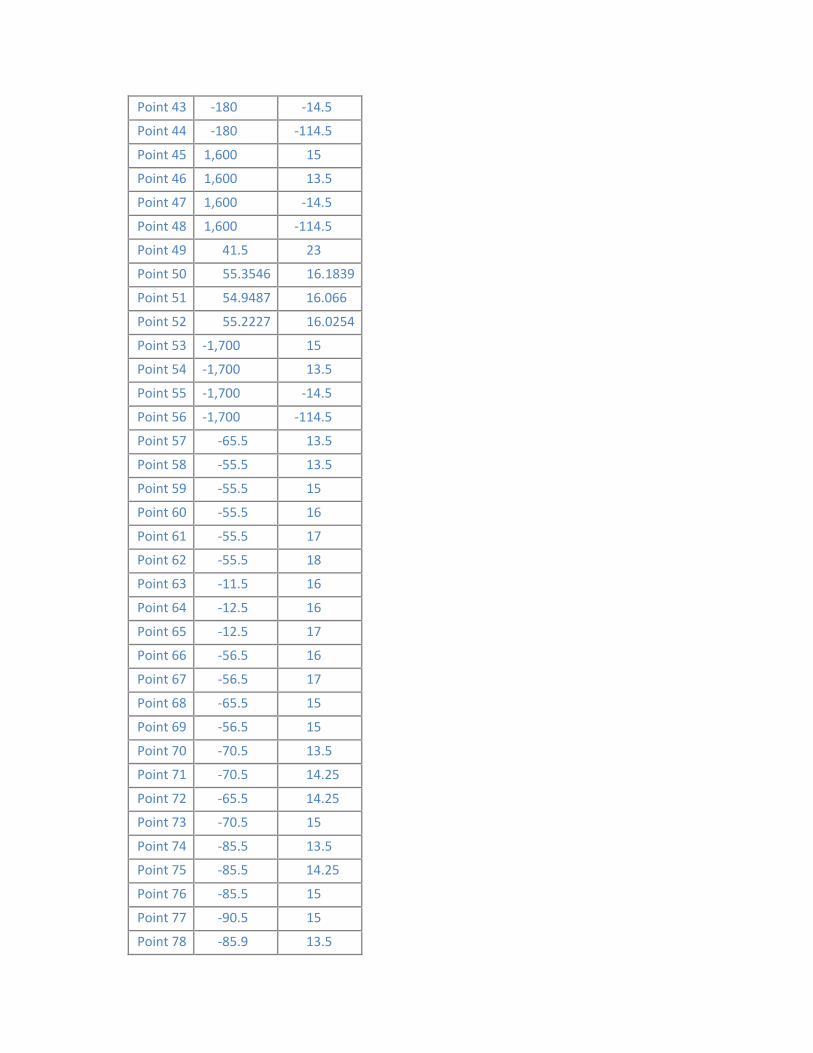
43
44
45
46
47
48
49
50
51
52
53
54
55
56
57
58
59
60
61
62
63
64
65
66
67
68
69
70
71
72
73
74
75
76
77
78
Point ‐180 ‐14.5
Point ‐180 ‐114.5
Point 1,600 15
Point 1,600 13.5
Point 1,600 ‐14.5
Point 1,600 ‐114.5
Point 41.5 23
Point 55.3546 16.1839
Point 54.9487 16.066
Point 55.2227 16.0254
Point ‐1,700 15
Point ‐1,700 13.5
Point ‐1,700 ‐14.5
Point ‐1,700 ‐114.5
Point ‐65.5 13.5
Point ‐55.5 13.5
Point ‐55.5 15
Point ‐55.5 16
Point ‐55.5 17
Point ‐55.5 18
Point ‐11.5 16
Point ‐12.5 16
Point ‐12.5 17
Point ‐56.5 16
Point ‐56.5 17
Point ‐65.5 15
Point ‐56.5 15
Point ‐70.5 13.5
Point ‐70.5 14.25
Point ‐65.5 14.25
Point ‐70.5 15
Point ‐85.5 13.5
Point ‐85.5 14.25
Point ‐85.5 15
Point ‐90.5 15
Point ‐85.9 13.5

Point 79 ‐85.9 14.25
Point 80 ‐88.1 15
Point 81 ‐85.8 15
Point 82 ‐100.1 19
Point 83 ‐97.8 19
Point 84 ‐102.5 19
Point 85 ‐128.5 15
Point 86 ‐116.5 19
Point 87 ‐85.9 15
Point 88 ‐119.5 18
Point 89 ‐99.5 18
Point 90 ‐94.8 18
Point 91 29.5 27
Regions Material Points Area (ft²)
Region 1
Matl. 1 ‐
Embankment
Material
1,6,7,8,9,10,11,12,5,63,4,3,2,62 1,101.7
Region
2 13,14,15,51,16,52,17,50,18,19,20 0.18474
Region
3 Matl. 8 ‐ Filter Sand 9,10,11,12,21,22,16,51,15,14,13,20,23 52.737
Region
4
Matl. 5 ‐ Soil Cement Armoring
6,7,8,9,23,24,49,91,25 74.19
Region
5
Matl. 5 ‐ Soil Cement Armoring
22,21,26,27,28,29,30,31,32,33 22.2
Region
6
Matl. 2 ‐ Surficial
Overburden Layer 31,35,36,30 41.55
Region
7
Matl. 4 ‐ Deeper
Marine Deposits 38,37,39,40 19,050
Region
8
Matl. 3 ‐ Shallow
Alluvial Deposits 42,34,38,43 2,506
Region
9
Matl. 4 ‐ Deeper Marine Deposits
43,38,40,44 8,950

10
11
12
13
14
15
16
17
18
19
20
21
22
23
24
25
26
27
28
Region Matl. 2 ‐ Surficial Overburden Layer
35,45,46,36 2,250
Region Matl. 3 ‐ Shallow Alluvial Deposits
36,46,47,37 42,000
Region Matl. 4 ‐ Deeper
Marine Deposits 37,47,48,39 1.5e+005
Region Matl. 8 ‐ Filter Sand 20,23,22,16,52,17,50,18,19 1.5978
Region Matl. 5 ‐ Soil Cement
Armoring 23,24,33,22 1.6
Region Matl. 2 ‐ Surficial Overburden Layer
53,41,42,54 2,280
Region Matl. 3 ‐ Shallow Alluvial Deposits
42,43,55,54 42,560
Region Matl. 4 ‐ Deeper
Marine Deposits 55,43,44,56 1.52e+005
Region Matl. 3 ‐ Shallow
Alluvial Deposits 34,38,37,36,30,29,28,27,26,58,57,70,74,78 5,330
Region Matl. 2 ‐ Surficial
Overburden Layer 59,58,26,21,12,5 176.7
Region Matl. 8 ‐ Filter Sand 60,59,5,63,64 44
Region Matl. 6 ‐ Fine Drainage Gravel
61,60,64,65 43
Region Matl. 8 ‐ Filter Sand 62,61,65,64,63,4,3,2 75
Region Matl. 6 ‐ Fine
Drainage Gravel 67,66,60,61 1
Region Matl. 9 Concrete
Outfall Works 1,62,61,67 1
Region Matl. 9 Concrete Outfall Works
68,72,57,58,59,60,66,69 16
Region Matl. 6 ‐ Fine Drainage Gravel
73,71,72,68 3.75
Region Matl. 6 ‐ Fine
Drainage Gravel 76,75,71,73 11.25
Region Matl. 8 ‐ Filter Sand 71,72,57,70 3.75
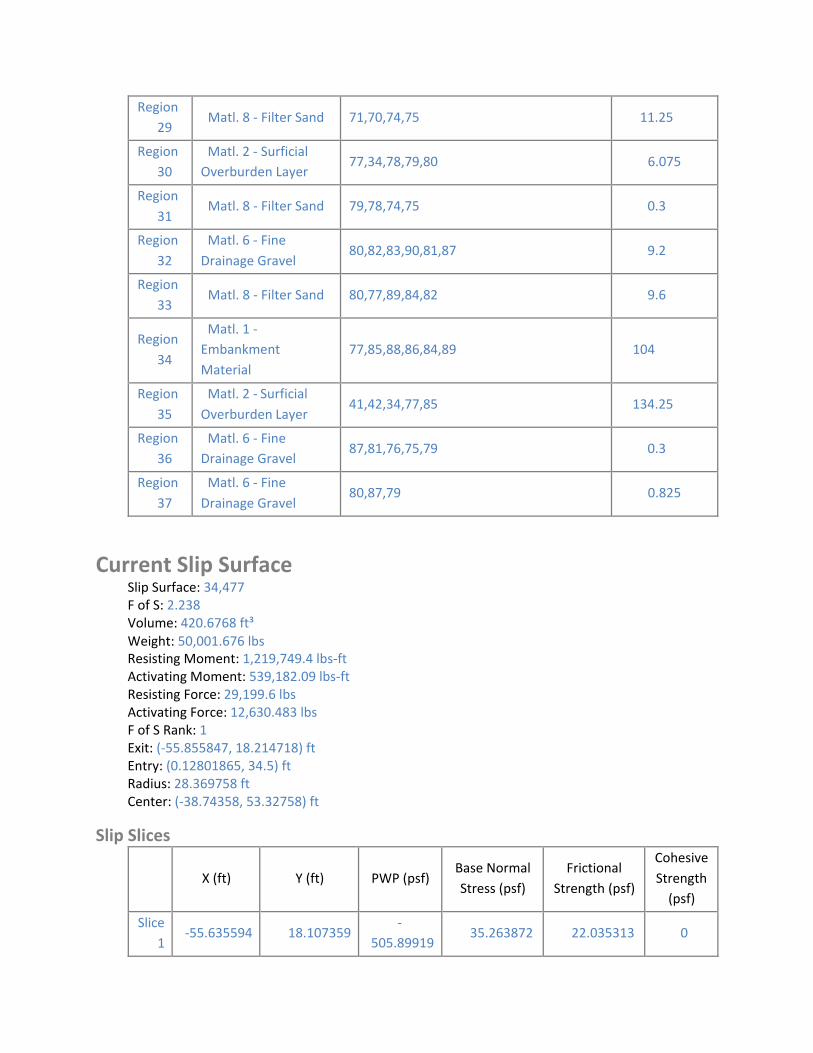
Region
29 Matl. 8 ‐ Filter Sand 71,70,74,75 11.25
Region
30 Matl. 2 ‐ Surficial Overburden Layer
77,34,78,79,80 6.075
Region
31 Matl. 8 ‐ Filter Sand 79,78,74,75 0.3
Region
32
Matl. 6 ‐ Fine
Drainage Gravel 80,82,83,90,81,87 9.2
Region
33 Matl. 8 ‐ Filter Sand 80,77,89,84,82 9.6
Region
34
Matl. 1 ‐Embankment
Material
77,85,88,86,84,89 104
Region
35
Matl. 2 ‐ Surficial
Overburden Layer 41,42,34,77,85 134.25
Region
36 Matl. 6 ‐ Fine Drainage Gravel
87,81,76,75,79 0.3
Region
37
Matl. 6 ‐ Fine
Drainage Gravel 80,87,79 0.825
Current Slip Surface Slip Surface: 34,477 F of S: 2.238 Volume: 420.6768 ft³ Weight: 50,001.676 lbs Resisting Moment: 1,219,749.4 lbs‐ft Activating Moment: 539,182.09 lbs‐ft Resisting Force: 29,199.6 lbs Activating Force: 12,630.483 lbs F of S Rank: 1 Exit: (‐55.855847, 18.214718) ft Entry: (0.12801865, 34.5) ft Radius: 28.369758 ft Center: (‐38.74358, 53.32758) ft
Slip Slices
X (ft) Y (ft) PWP (psf) Base Normal
Stress (psf)
Frictional
Strength (psf)
Cohesive
Strength (psf)
Slice
1 ‐55.635594 18.107359
‐
505.89919 35.263872 22.035313 0
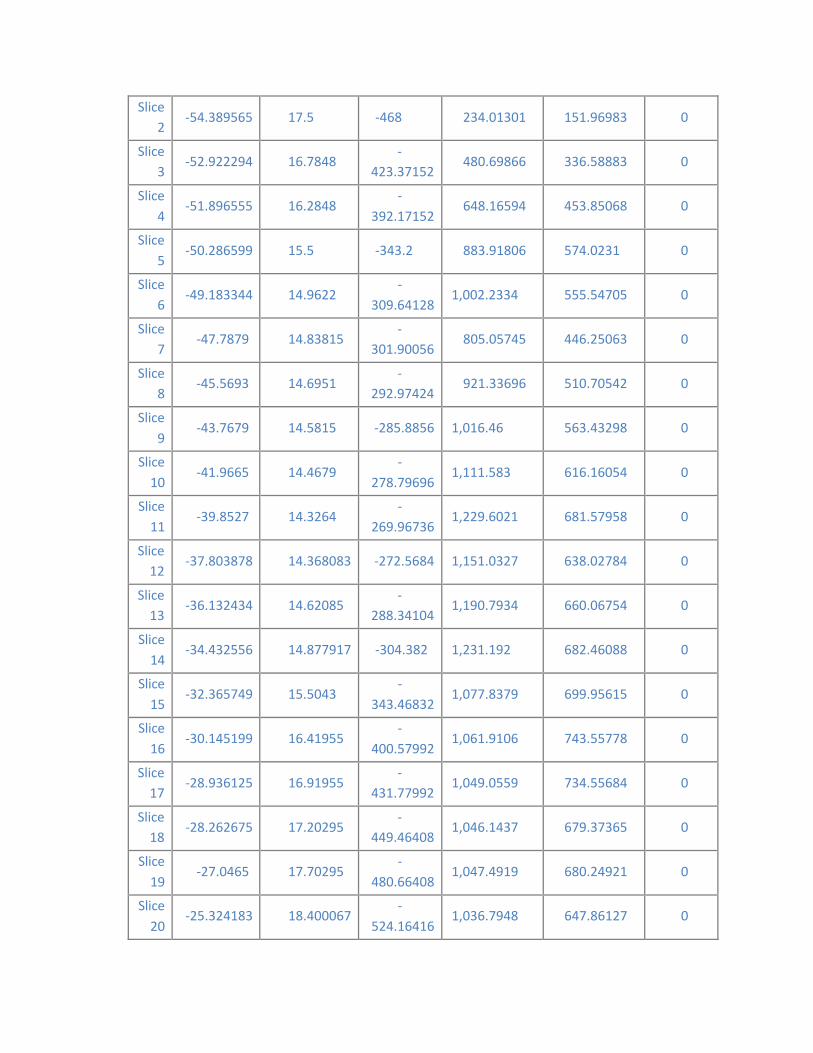
2
3
4
5
6
7
8
9
10
11
12
13
14
15
16
17
18
19
20
Slice ‐54.389565 17.5 ‐468 234.01301 151.96983 0
Slice ‐52.922294 16.7848
‐
423.37152 480.69866 336.58883 0
Slice ‐51.896555 16.2848
‐
392.17152 648.16594 453.85068 0
Slice ‐50.286599 15.5 ‐343.2 883.91806 574.0231 0
Slice ‐49.183344 14.9622
‐
309.64128 1,002.2334 555.54705 0
Slice ‐47.7879 14.83815
‐
301.90056 805.05745 446.25063 0
Slice ‐45.5693 14.6951
‐
292.97424 921.33696 510.70542 0
Slice ‐43.7679 14.5815 ‐285.8856 1,016.46 563.43298 0
Slice ‐41.9665 14.4679
‐
278.79696 1,111.583 616.16054 0
Slice ‐39.8527 14.3264
‐
269.96736 1,229.6021 681.57958 0
Slice ‐37.803878 14.368083 ‐272.5684 1,151.0327 638.02784 0
Slice ‐36.132434 14.62085
‐
288.34104 1,190.7934 660.06754 0
Slice ‐34.432556 14.877917 ‐304.382 1,231.192 682.46088 0
Slice ‐32.365749 15.5043
‐
343.46832 1,077.8379 699.95615 0
Slice ‐30.145199 16.41955
‐
400.57992 1,061.9106 743.55778 0
Slice ‐28.936125 16.91955
‐
431.77992 1,049.0559 734.55684 0
Slice ‐28.262675 17.20295
‐
449.46408 1,046.1437 679.37365 0
Slice ‐27.0465 17.70295
‐
480.66408 1,047.4919 680.24921 0
Slice ‐25.324183 18.400067
‐
524.16416 1,036.7948 647.86127 0
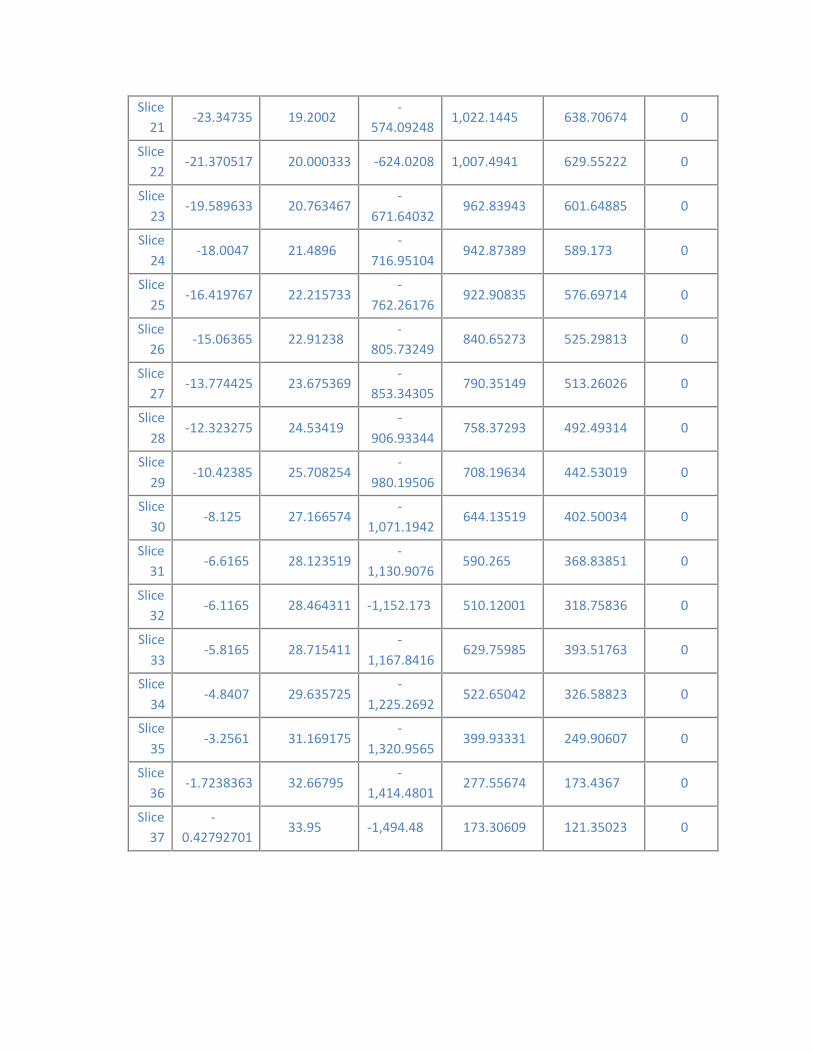
21
22
23
24
25
26
27
28
29
30
31
32
33
34
35
36
37
Slice ‐23.34735 19.2002
‐
574.09248 1,022.1445 638.70674 0
Slice ‐21.370517 20.000333 ‐624.0208 1,007.4941 629.55222 0
Slice ‐19.589633 20.763467
‐
671.64032 962.83943 601.64885 0
Slice ‐18.0047 21.4896
‐
716.95104 942.87389 589.173 0
Slice ‐16.419767 22.215733
‐
762.26176 922.90835 576.69714 0
Slice ‐15.06365 22.91238
‐
805.73249 840.65273 525.29813 0
Slice ‐13.774425 23.675369
‐
853.34305 790.35149 513.26026 0
Slice ‐12.323275 24.53419
‐
906.93344 758.37293 492.49314 0
Slice ‐10.42385 25.708254
‐
980.19506 708.19634 442.53019 0
Slice ‐8.125 27.166574
‐
1,071.1942 644.13519 402.50034 0
Slice ‐6.6165 28.123519
‐
1,130.9076 590.265 368.83851 0
Slice ‐6.1165 28.464311 ‐1,152.173 510.12001 318.75836 0
Slice ‐5.8165 28.715411
‐
1,167.8416 629.75985 393.51763 0
Slice ‐4.8407 29.635725
‐
1,225.2692 522.65042 326.58823 0
Slice ‐3.2561 31.169175
‐
1,320.9565 399.93331 249.90607 0
Slice ‐1.7238363 32.66795
‐
1,414.4801 277.55674 173.4367 0
Slice ‐
0.42792701 33.95 ‐1,494.48 173.30609 121.35023 0
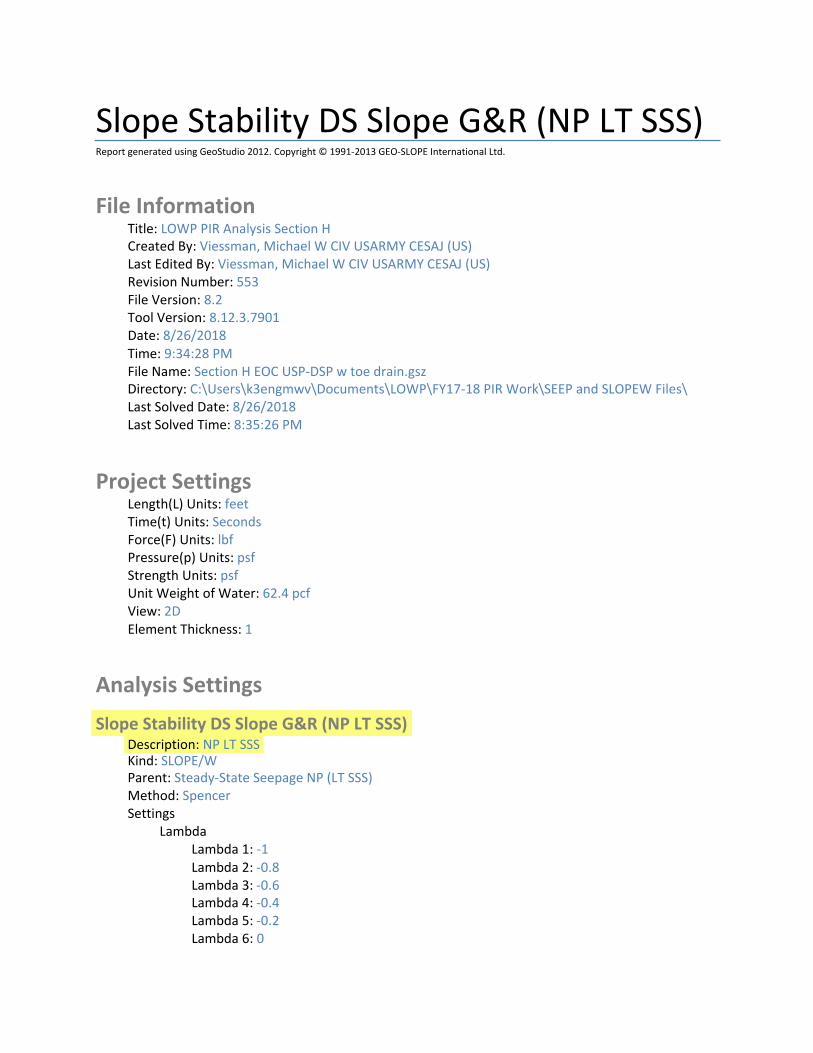
Slope Stability DS Slope G&R (NP LT SSS) Report generated using GeoStudio 2012. Copyright © 1991‐2013 GEO‐SLOPE International Ltd.
File Information Title: LOWP PIR Analysis Section H Created By: Viessman, Michael W CIV USARMY CESAJ (US) Last Edited By: Viessman, Michael W CIV USARMY CESAJ (US) Revision Number: 553 File Version: 8.2 Tool Version: 8.12.3.7901 Date: 8/26/2018 Time: 9:34:28 PM File Name: Section H EOC USP‐DSP w toe drain.gsz Directory: C:\Users\k3engmwv\Documents\LOWP\FY17‐18 PIR Work\SEEP and SLOPEW Files\ Last Solved Date: 8/26/2018 Last Solved Time: 8:35:26 PM
Project Settings Length(L) Units: feet Time(t) Units: Seconds Force(F) Units: lbf Pressure(p) Units: psf Strength Units: psf Unit Weight of Water: 62.4 pcf View: 2D Element Thickness: 1
Analysis Settings
Slope Stability DS Slope G&R (NP LT SSS) Description: NP LT SSS Kind: SLOPE/W Parent: Steady‐State Seepage NP (LT SSS) Method: Spencer Settings
Lambda Lambda 1: ‐1 Lambda 2: ‐0.8 Lambda 3: ‐0.6 Lambda 4: ‐0.4 Lambda 5: ‐0.2 Lambda 6: 0
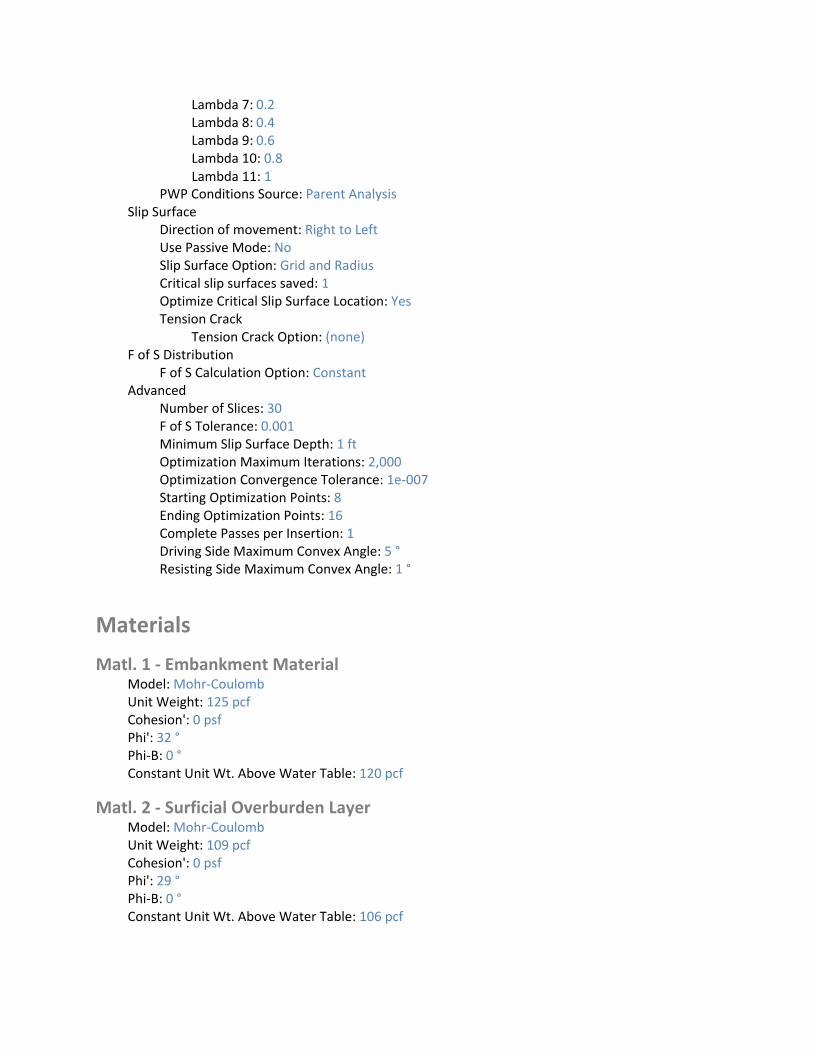
Lambda 7: 0.2 Lambda 8: 0.4 Lambda 9: 0.6 Lambda 10: 0.8 Lambda 11: 1
PWP Conditions Source: Parent Analysis Slip Surface
Direction of movement: Right to Left Use Passive Mode: No Slip Surface Option: Grid and Radius Critical slip surfaces saved: 1 Optimize Critical Slip Surface Location: Yes Tension Crack
Tension Crack Option: (none) F of S Distribution
F of S Calculation Option: Constant Advanced
Number of Slices: 30 F of S Tolerance: 0.001 Minimum Slip Surface Depth: 1 ft Optimization Maximum Iterations: 2,000 Optimization Convergence Tolerance: 1e‐007 Starting Optimization Points: 8 Ending Optimization Points: 16 Complete Passes per Insertion: 1 Driving Side Maximum Convex Angle: 5 ° Resisting Side Maximum Convex Angle: 1 °
Materials
Matl. 1 ‐ Embankment Material Model: Mohr‐Coulomb Unit Weight: 125 pcf Cohesion': 0 psf Phi': 32 ° Phi‐B: 0 ° Constant Unit Wt. Above Water Table: 120 pcf
Matl. 2 ‐ Surficial Overburden Layer Model: Mohr‐Coulomb Unit Weight: 109 pcf Cohesion': 0 psf Phi': 29 ° Phi‐B: 0 ° Constant Unit Wt. Above Water Table: 106 pcf

Matl. 3 ‐ Shallow Alluvial Deposits Model: Mohr‐Coulomb Unit Weight: 123 pcf Cohesion': 0 psf Phi': 30 ° Phi‐B: 0 °
Matl. 4 ‐ Deeper Marine Deposits Model: Mohr‐Coulomb Unit Weight: 125 pcf Cohesion': 0 psf Phi': 33 ° Phi‐B: 0 °
Matl. 5 ‐ Soil Cement Armoring Model: Mohr‐Coulomb Unit Weight: 125 pcf Cohesion': 0 psf Phi': 35 ° Phi‐B: 0 ° Constant Unit Wt. Above Water Table: 120 pcf
Matl. 6 ‐ Fine Drainage Gravel Model: Mohr‐Coulomb Unit Weight: 130 pcf Cohesion': 0 psf Phi': 35 ° Phi‐B: 0 ° Constant Unit Wt. Above Water Table: 115 pcf
Matl. 8 ‐ Filter Sand Model: Mohr‐Coulomb Unit Weight: 120 pcf Cohesion': 0 psf Phi': 33 ° Phi‐B: 0 ° Constant Unit Wt. Above Water Table: 115 pcf
Matl. 9 Concrete Outfall Works Model: Bedrock (Impenetrable)
Slip Surface Grid Upper Left: (‐102.8639, 115.7947) ft Lower Left: (‐102.8639, 37.7108) ft Lower Right: (4.0033, 37.7108) ft Grid Horizontal Increment: 25
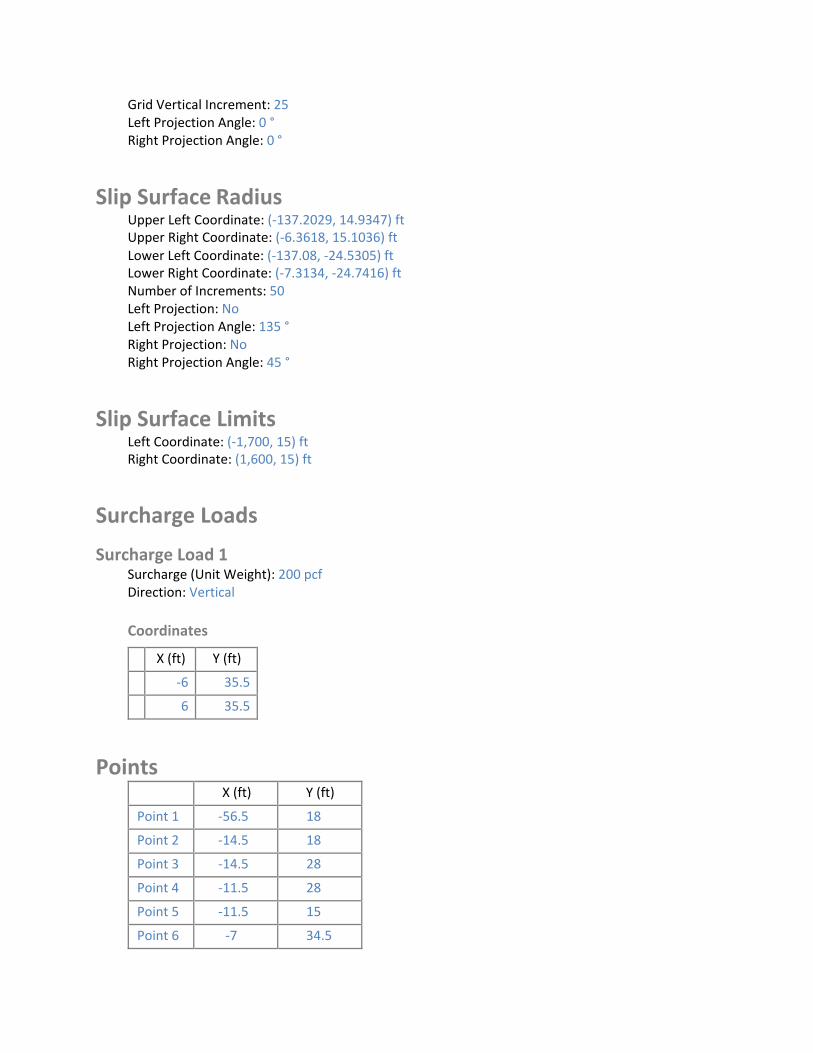
Grid Vertical Increment: 25 Left Projection Angle: 0 ° Right Projection Angle: 0 °
Slip Surface Radius Upper Left Coordinate: (‐137.2029, 14.9347) ft Upper Right Coordinate: (‐6.3618, 15.1036) ft Lower Left Coordinate: (‐137.08, ‐24.5305) ft Lower Right Coordinate: (‐7.3134, ‐24.7416) ft Number of Increments: 50 Left Projection: No Left Projection Angle: 135 ° Right Projection: No Right Projection Angle: 45 °
Slip Surface Limits Left Coordinate: (‐1,700, 15) ft Right Coordinate: (1,600, 15) ft
Surcharge Loads
Surcharge Load 1 Surcharge (Unit Weight): 200 pcf Direction: Vertical
Coordinates
X (ft) Y (ft)
‐6 35.5
6 35.5
Points X (ft) Y (ft)
Point 1 ‐56.5 18
Point 2 ‐14.5 18
Point 3 ‐14.5 28
Point 4 ‐11.5 28
Point 5 ‐11.5 15
Point 6 ‐7 34.5

7
8
9
10
11
12
13
14
15
16
17
18
19
20
21
22
23
24
25
26
27
28
29
30
31
32
33
34
35
36
37
38
39
40
41
42
Point ‐7 33.4
Point 6.8 33.4
Point 14 31
Point 13.7 30.1
Point 51.6 17.5
Point 54.2 15
Point 55.0033 16.4828
Point 54.9 16.4
Point 54.8636 16.2065
Point 55.097 16.0075
Point 55.3031 16.0832
Point 55.3561 16.2916
Point 55.3 16.4
Point 55.1797 16.4906
Point 62.3 15
Point 59.3 16
Point 57.8 16.5
Point 61 16.5
Point 7 34.5
Point 62.3 13.5
Point 70.3 13.5
Point 70.3 11.5
Point 72.3 11.5
Point 72.3 13.5
Point 72.3 15
Point 65.5 15
Point 62.5 16
Point ‐90.5 13.5
Point 100 15
Point 100 13.5
Point 100 ‐14.5
Point ‐90.5 ‐14.5
Point 100 ‐114.5
Point ‐90.5 ‐114.5
Point ‐180 15
Point ‐180 13.5

43
44
45
46
47
48
49
50
51
52
53
54
55
56
57
58
59
60
61
62
63
64
65
66
67
68
69
70
71
72
73
74
75
76
77
78
Point ‐180 ‐14.5
Point ‐180 ‐114.5
Point 1,600 15
Point 1,600 13.5
Point 1,600 ‐14.5
Point 1,600 ‐114.5
Point 41.5 23
Point 55.3546 16.1839
Point 54.9487 16.066
Point 55.2227 16.0254
Point ‐1,700 15
Point ‐1,700 13.5
Point ‐1,700 ‐14.5
Point ‐1,700 ‐114.5
Point ‐65.5 13.5
Point ‐55.5 13.5
Point ‐55.5 15
Point ‐55.5 16
Point ‐55.5 17
Point ‐55.5 18
Point ‐11.5 16
Point ‐12.5 16
Point ‐12.5 17
Point ‐56.5 16
Point ‐56.5 17
Point ‐65.5 15
Point ‐56.5 15
Point ‐70.5 13.5
Point ‐70.5 14.25
Point ‐65.5 14.25
Point ‐70.5 15
Point ‐85.5 13.5
Point ‐85.5 14.25
Point ‐85.5 15
Point ‐90.5 15
Point ‐85.9 13.5

Point 79 ‐85.9 14.25
Point 80 ‐88.1 15
Point 81 ‐85.8 15
Point 82 ‐100.1 19
Point 83 ‐97.8 19
Point 84 ‐102.5 19
Point 85 ‐128.5 15
Point 86 ‐116.5 19
Point 87 ‐85.9 15
Point 88 ‐119.5 18
Point 89 ‐99.5 18
Point 90 ‐94.8 18
Point 91 29.5 27
Regions Material Points Area (ft²)
Region 1
Matl. 1 ‐
Embankment
Material
1,6,7,8,9,10,11,12,5,63,4,3,2,62 1,101.7
Region
2 13,14,15,51,16,52,17,50,18,19,20 0.18474
Region
3 Matl. 8 ‐ Filter Sand 9,10,11,12,21,22,16,51,15,14,13,20,23 52.737
Region
4
Matl. 5 ‐ Soil Cement Armoring
6,7,8,9,23,24,49,91,25 74.19
Region
5
Matl. 5 ‐ Soil Cement Armoring
22,21,26,27,28,29,30,31,32,33 22.2
Region
6
Matl. 2 ‐ Surficial
Overburden Layer 31,35,36,30 41.55
Region
7
Matl. 4 ‐ Deeper
Marine Deposits 38,37,39,40 19,050
Region
8
Matl. 3 ‐ Shallow
Alluvial Deposits 42,34,38,43 2,506
Region
9
Matl. 4 ‐ Deeper Marine Deposits
43,38,40,44 8,950

10
11
12
13
14
15
16
17
18
19
20
21
22
23
24
25
26
27
28
Region Matl. 2 ‐ Surficial Overburden Layer
35,45,46,36 2,250
Region Matl. 3 ‐ Shallow Alluvial Deposits
36,46,47,37 42,000
Region Matl. 4 ‐ Deeper
Marine Deposits 37,47,48,39 1.5e+005
Region Matl. 8 ‐ Filter Sand 20,23,22,16,52,17,50,18,19 1.5978
Region Matl. 5 ‐ Soil Cement
Armoring 23,24,33,22 1.6
Region Matl. 2 ‐ Surficial Overburden Layer
53,41,42,54 2,280
Region Matl. 3 ‐ Shallow Alluvial Deposits
42,43,55,54 42,560
Region Matl. 4 ‐ Deeper
Marine Deposits 55,43,44,56 1.52e+005
Region Matl. 3 ‐ Shallow
Alluvial Deposits 34,38,37,36,30,29,28,27,26,58,57,70,74,78 5,330
Region Matl. 2 ‐ Surficial
Overburden Layer 59,58,26,21,12,5 176.7
Region Matl. 8 ‐ Filter Sand 60,59,5,63,64 44
Region Matl. 6 ‐ Fine Drainage Gravel
61,60,64,65 43
Region Matl. 8 ‐ Filter Sand 62,61,65,64,63,4,3,2 75
Region Matl. 6 ‐ Fine
Drainage Gravel 67,66,60,61 1
Region Matl. 9 Concrete
Outfall Works 1,62,61,67 1
Region Matl. 9 Concrete Outfall Works
68,72,57,58,59,60,66,69 16
Region Matl. 6 ‐ Fine Drainage Gravel
73,71,72,68 3.75
Region Matl. 6 ‐ Fine
Drainage Gravel 76,75,71,73 11.25
Region Matl. 8 ‐ Filter Sand 71,72,57,70 3.75
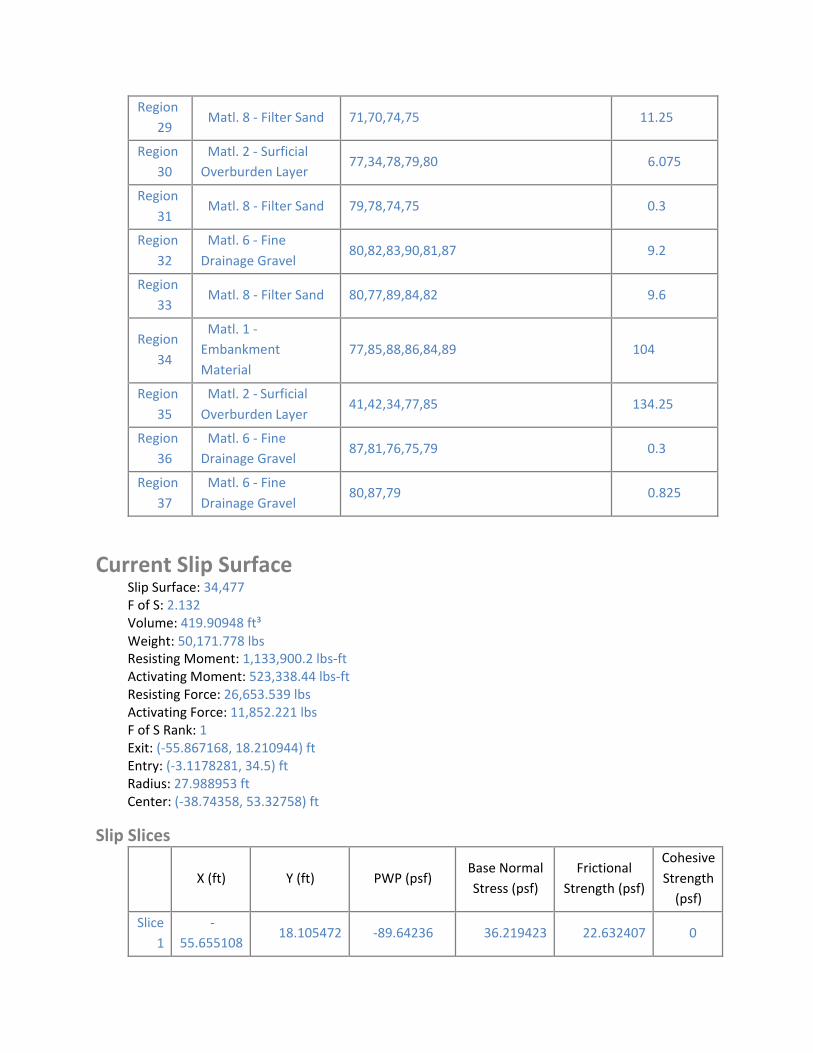
Region
29 Matl. 8 ‐ Filter Sand 71,70,74,75 11.25
Region
30 Matl. 2 ‐ Surficial Overburden Layer
77,34,78,79,80 6.075
Region
31 Matl. 8 ‐ Filter Sand 79,78,74,75 0.3
Region
32
Matl. 6 ‐ Fine
Drainage Gravel 80,82,83,90,81,87 9.2
Region
33 Matl. 8 ‐ Filter Sand 80,77,89,84,82 9.6
Region
34
Matl. 1 ‐Embankment
Material
77,85,88,86,84,89 104
Region
35
Matl. 2 ‐ Surficial
Overburden Layer 41,42,34,77,85 134.25
Region
36 Matl. 6 ‐ Fine Drainage Gravel
87,81,76,75,79 0.3
Region
37
Matl. 6 ‐ Fine
Drainage Gravel 80,87,79 0.825
Current Slip Surface Slip Surface: 34,477 F of S: 2.132 Volume: 419.90948 ft³ Weight: 50,171.778 lbs Resisting Moment: 1,133,900.2 lbs‐ft Activating Moment: 523,338.44 lbs‐ft Resisting Force: 26,653.539 lbs Activating Force: 11,852.221 lbs F of S Rank: 1 Exit: (‐55.867168, 18.210944) ft Entry: (‐3.1178281, 34.5) ft Radius: 27.988953 ft Center: (‐38.74358, 53.32758) ft
Slip Slices
X (ft) Y (ft) PWP (psf) Base Normal
Stress (psf)
Frictional
Strength (psf)
Cohesive
Strength (psf)
Slice
1
‐
55.655108 18.105472 ‐89.64236 36.219423 22.632407 0
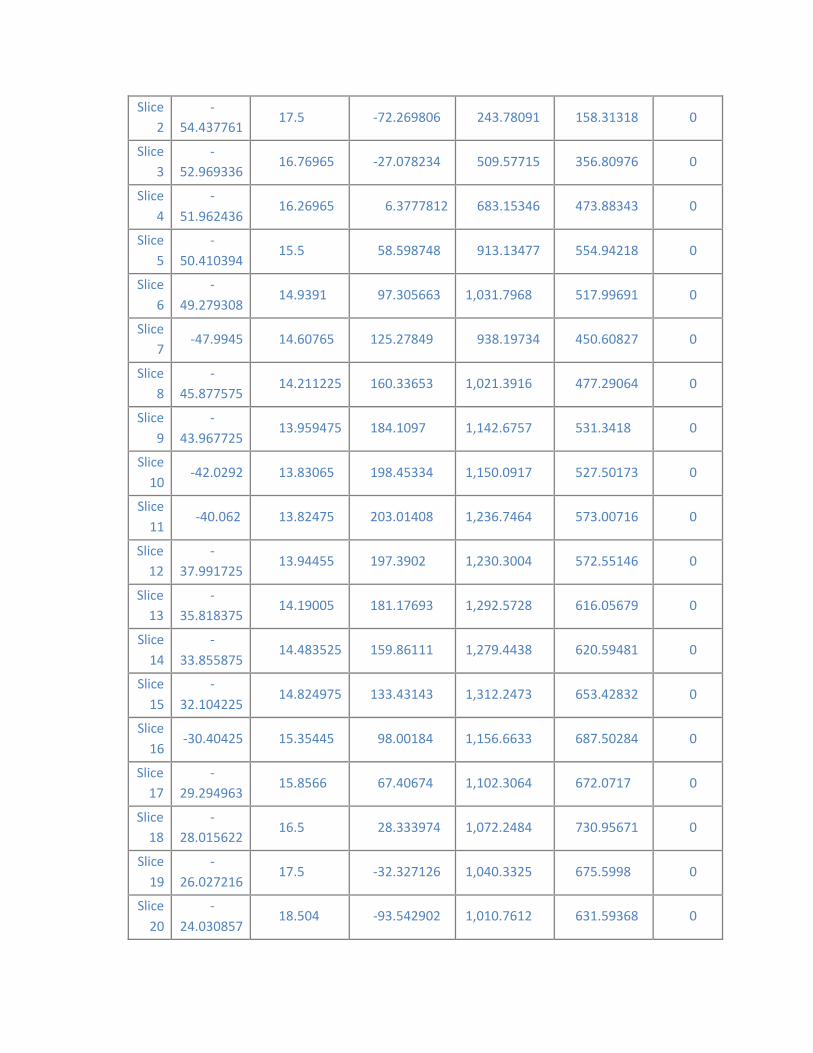
2
3
4
5
6
7
8
9
10
11
12
13
14
15
16
17
18
19
20
Slice ‐
54.437761 17.5 ‐72.269806 243.78091 158.31318 0
Slice ‐
52.969336 16.76965 ‐27.078234 509.57715 356.80976 0
Slice ‐
51.962436 16.26965 6.3777812 683.15346 473.88343 0
Slice ‐
50.410394 15.5 58.598748 913.13477 554.94218 0
Slice ‐
49.279308 14.9391 97.305663 1,031.7968 517.99691 0
Slice ‐47.9945 14.60765 125.27849 938.19734 450.60827 0
Slice ‐
45.877575 14.211225 160.33653 1,021.3916 477.29064 0
Slice ‐
43.967725 13.959475 184.1097 1,142.6757 531.3418 0
Slice ‐42.0292 13.83065 198.45334 1,150.0917 527.50173 0
Slice ‐40.062 13.82475 203.01408 1,236.7464 573.00716 0
Slice ‐
37.991725 13.94455 197.3902 1,230.3004 572.55146 0
Slice ‐
35.818375 14.19005 181.17693 1,292.5728 616.05679 0
Slice ‐
33.855875 14.483525 159.86111 1,279.4438 620.59481 0
Slice ‐
32.104225 14.824975 133.43143 1,312.2473 653.42832 0
Slice ‐30.40425 15.35445 98.00184 1,156.6633 687.50284 0
Slice ‐
29.294963 15.8566 67.40674 1,102.3064 672.0717 0
Slice ‐
28.015622 16.5 28.333974 1,072.2484 730.95671 0
Slice ‐
26.027216 17.5 ‐32.327126 1,040.3325 675.5998 0
Slice ‐
24.030857 18.504 ‐93.542902 1,010.7612 631.59368 0
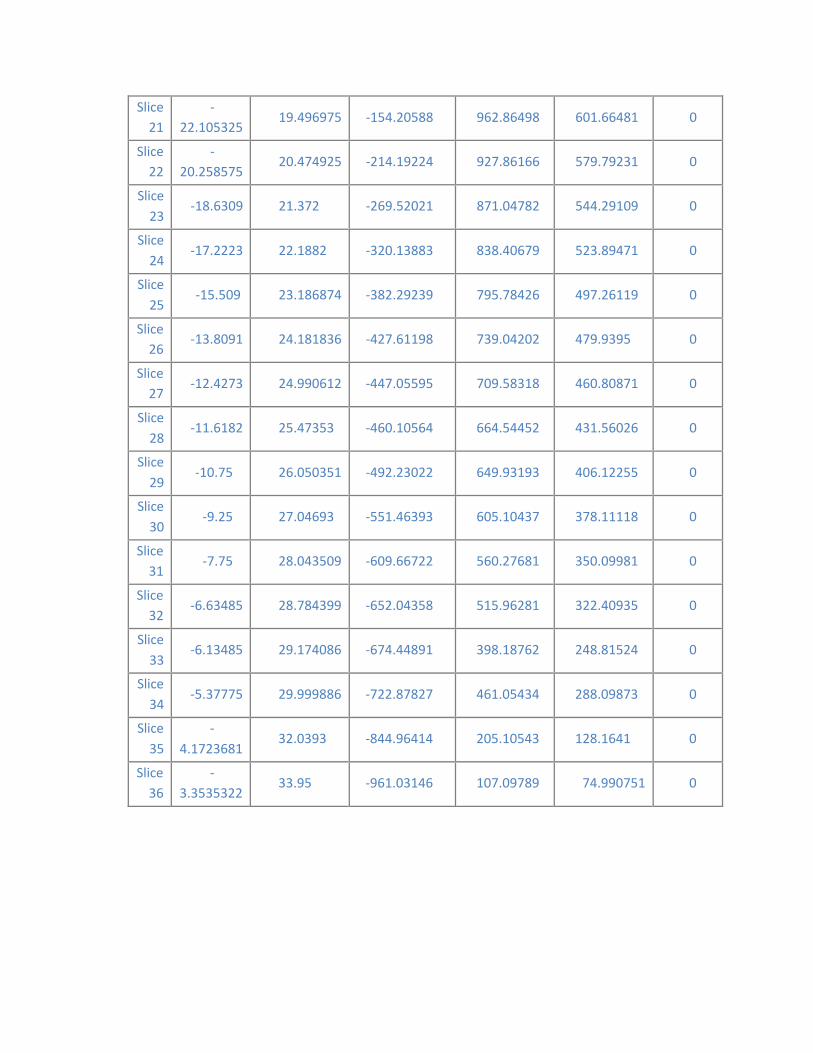
21
22
23
24
25
26
27
28
29
30
31
32
33
34
35
36
Slice ‐
22.105325 19.496975 ‐154.20588 962.86498 601.66481 0
Slice ‐
20.258575 20.474925 ‐214.19224 927.86166 579.79231 0
Slice ‐18.6309 21.372 ‐269.52021 871.04782 544.29109 0
Slice ‐17.2223 22.1882 ‐320.13883 838.40679 523.89471 0
Slice ‐15.509 23.186874 ‐382.29239 795.78426 497.26119 0
Slice ‐13.8091 24.181836 ‐427.61198 739.04202 479.9395 0
Slice ‐12.4273 24.990612 ‐447.05595 709.58318 460.80871 0
Slice ‐11.6182 25.47353 ‐460.10564 664.54452 431.56026 0
Slice ‐10.75 26.050351 ‐492.23022 649.93193 406.12255 0
Slice ‐9.25 27.04693 ‐551.46393 605.10437 378.11118 0
Slice ‐7.75 28.043509 ‐609.66722 560.27681 350.09981 0
Slice ‐6.63485 28.784399 ‐652.04358 515.96281 322.40935 0
Slice ‐6.13485 29.174086 ‐674.44891 398.18762 248.81524 0
Slice ‐5.37775 29.999886 ‐722.87827 461.05434 288.09873 0
Slice ‐
4.1723681 32.0393 ‐844.96414 205.10543 128.1641 0
Slice ‐
3.3535322 33.95 ‐961.03146 107.09789 74.990751 0
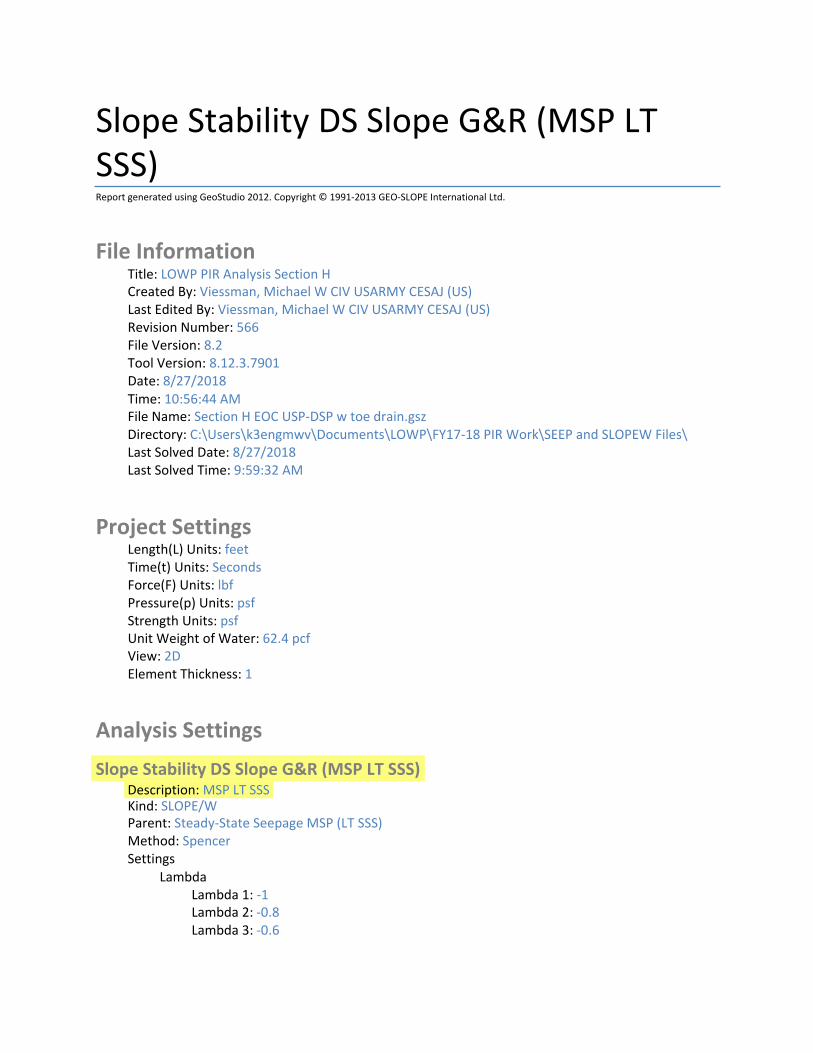
Slope Stability DS Slope G&R (MSP LT SSS) Report generated using GeoStudio 2012. Copyright © 1991‐2013 GEO‐SLOPE International Ltd.
File Information Title: LOWP PIR Analysis Section H Created By: Viessman, Michael W CIV USARMY CESAJ (US) Last Edited By: Viessman, Michael W CIV USARMY CESAJ (US) Revision Number: 566 File Version: 8.2 Tool Version: 8.12.3.7901 Date: 8/27/2018 Time: 10:56:44 AM File Name: Section H EOC USP‐DSP w toe drain.gsz Directory: C:\Users\k3engmwv\Documents\LOWP\FY17‐18 PIR Work\SEEP and SLOPEW Files\ Last Solved Date: 8/27/2018 Last Solved Time: 9:59:32 AM
Project Settings Length(L) Units: feet Time(t) Units: Seconds Force(F) Units: lbf Pressure(p) Units: psf Strength Units: psf Unit Weight of Water: 62.4 pcf View: 2D Element Thickness: 1
Analysis Settings
Slope Stability DS Slope G&R (MSP LT SSS) Description: MSP LT SSS Kind: SLOPE/W Parent: Steady‐State Seepage MSP (LT SSS) Method: Spencer Settings
Lambda Lambda 1: ‐1 Lambda 2: ‐0.8 Lambda 3: ‐0.6
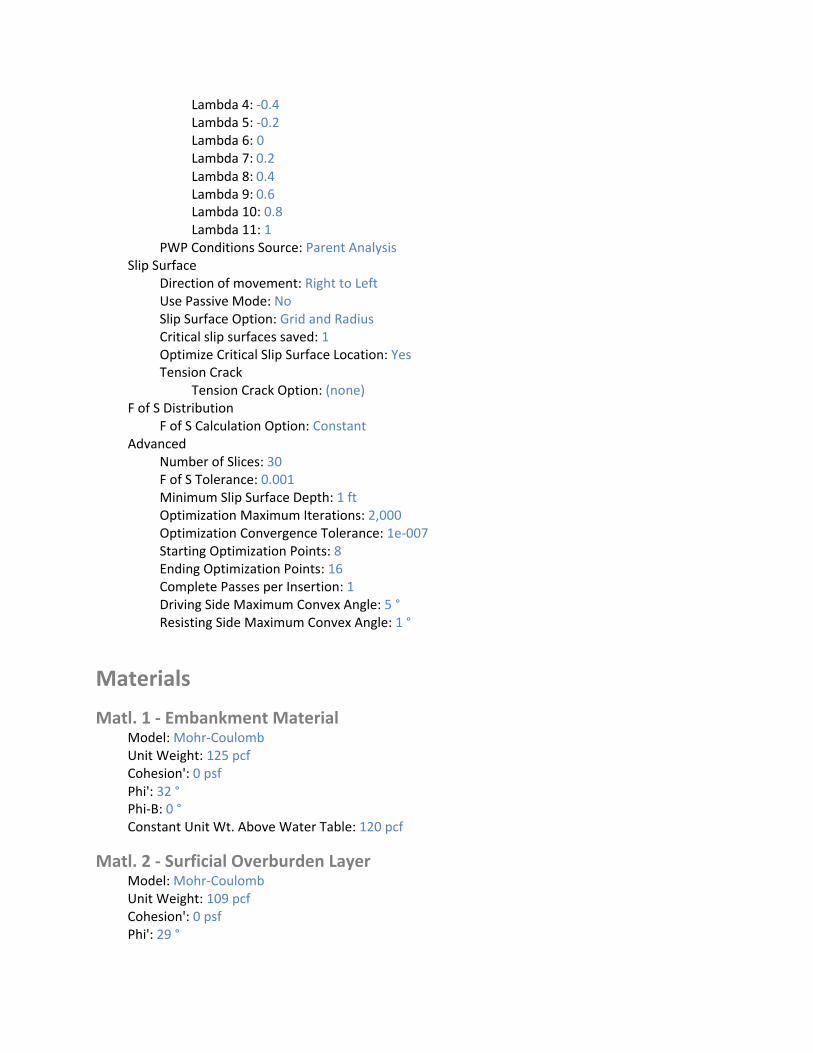
Lambda 4: ‐0.4 Lambda 5: ‐0.2 Lambda 6: 0 Lambda 7: 0.2 Lambda 8: 0.4 Lambda 9: 0.6 Lambda 10: 0.8 Lambda 11: 1
PWP Conditions Source: Parent Analysis Slip Surface
Direction of movement: Right to Left Use Passive Mode: No Slip Surface Option: Grid and Radius Critical slip surfaces saved: 1 Optimize Critical Slip Surface Location: Yes Tension Crack
Tension Crack Option: (none) F of S Distribution
F of S Calculation Option: Constant Advanced
Number of Slices: 30 F of S Tolerance: 0.001 Minimum Slip Surface Depth: 1 ft Optimization Maximum Iterations: 2,000 Optimization Convergence Tolerance: 1e‐007 Starting Optimization Points: 8 Ending Optimization Points: 16 Complete Passes per Insertion: 1 Driving Side Maximum Convex Angle: 5 ° Resisting Side Maximum Convex Angle: 1 °
Materials
Matl. 1 ‐ Embankment Material Model: Mohr‐Coulomb Unit Weight: 125 pcf Cohesion': 0 psf Phi': 32 ° Phi‐B: 0 ° Constant Unit Wt. Above Water Table: 120 pcf
Matl. 2 ‐ Surficial Overburden Layer Model: Mohr‐Coulomb Unit Weight: 109 pcf Cohesion': 0 psf Phi': 29 °
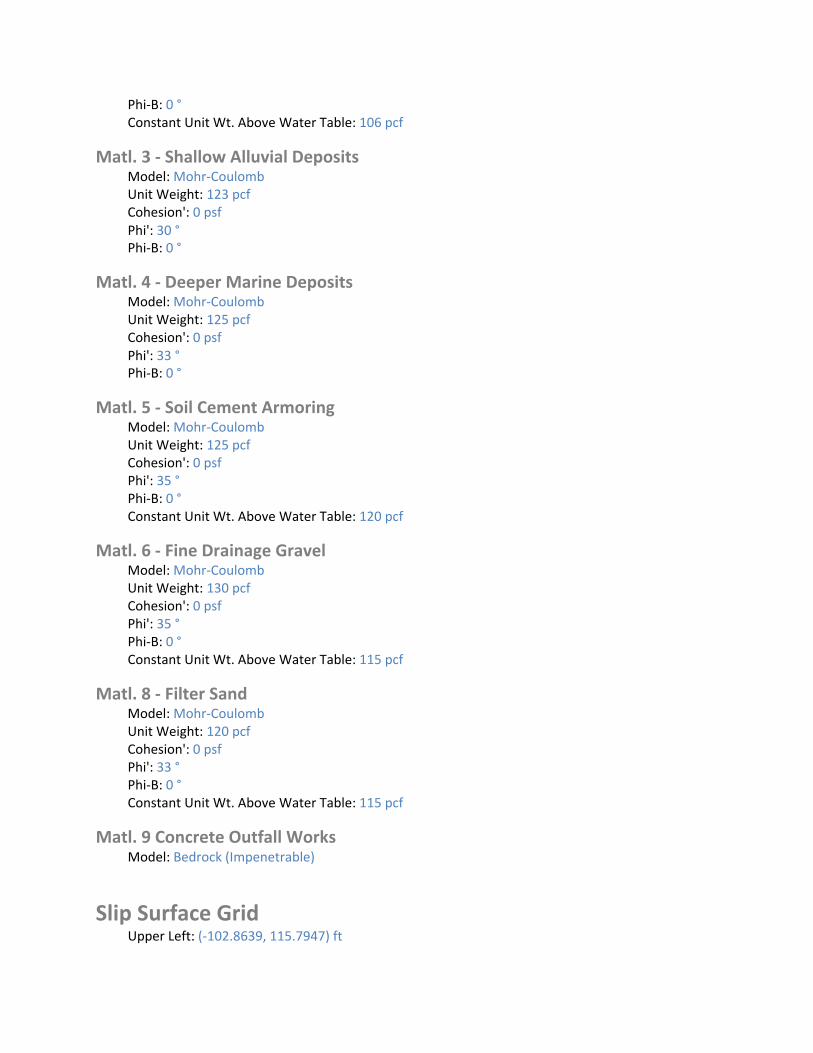
Phi‐B: 0 ° Constant Unit Wt. Above Water Table: 106 pcf
Matl. 3 ‐ Shallow Alluvial Deposits Model: Mohr‐Coulomb Unit Weight: 123 pcf Cohesion': 0 psf Phi': 30 ° Phi‐B: 0 °
Matl. 4 ‐ Deeper Marine Deposits Model: Mohr‐Coulomb Unit Weight: 125 pcf Cohesion': 0 psf Phi': 33 ° Phi‐B: 0 °
Matl. 5 ‐ Soil Cement Armoring Model: Mohr‐Coulomb Unit Weight: 125 pcf Cohesion': 0 psf Phi': 35 ° Phi‐B: 0 ° Constant Unit Wt. Above Water Table: 120 pcf
Matl. 6 ‐ Fine Drainage Gravel Model: Mohr‐Coulomb Unit Weight: 130 pcf Cohesion': 0 psf Phi': 35 ° Phi‐B: 0 ° Constant Unit Wt. Above Water Table: 115 pcf
Matl. 8 ‐ Filter Sand Model: Mohr‐Coulomb Unit Weight: 120 pcf Cohesion': 0 psf Phi': 33 ° Phi‐B: 0 ° Constant Unit Wt. Above Water Table: 115 pcf
Matl. 9 Concrete Outfall Works Model: Bedrock (Impenetrable)
Slip Surface Grid Upper Left: (‐102.8639, 115.7947) ft

Lower Left: (‐102.8639, 37.7108) ft Lower Right: (4.0033, 37.7108) ft Grid Horizontal Increment: 25 Grid Vertical Increment: 25 Left Projection Angle: 0 ° Right Projection Angle: 0 °
Slip Surface Radius Upper Left Coordinate: (‐137.2029, 14.9347) ft Upper Right Coordinate: (‐6.3618, 15.1036) ft Lower Left Coordinate: (‐137.08, ‐24.5305) ft Lower Right Coordinate: (‐7.3134, ‐24.7416) ft Number of Increments: 50 Left Projection: No Left Projection Angle: 135 ° Right Projection: No Right Projection Angle: 45 °
Slip Surface Limits Left Coordinate: (‐1,700, 15) ft Right Coordinate: (1,600, 15) ft
Surcharge Loads
Surcharge Load 1 Surcharge (Unit Weight): 200 pcf Direction: Vertical
Coordinates
X (ft) Y (ft)
‐6 35.5
6 35.5
Points X (ft) Y (ft)
Point 1 ‐56.5 18
Point 2 ‐14.5 18
Point 3 ‐14.5 28
Point 4 ‐11.5 28
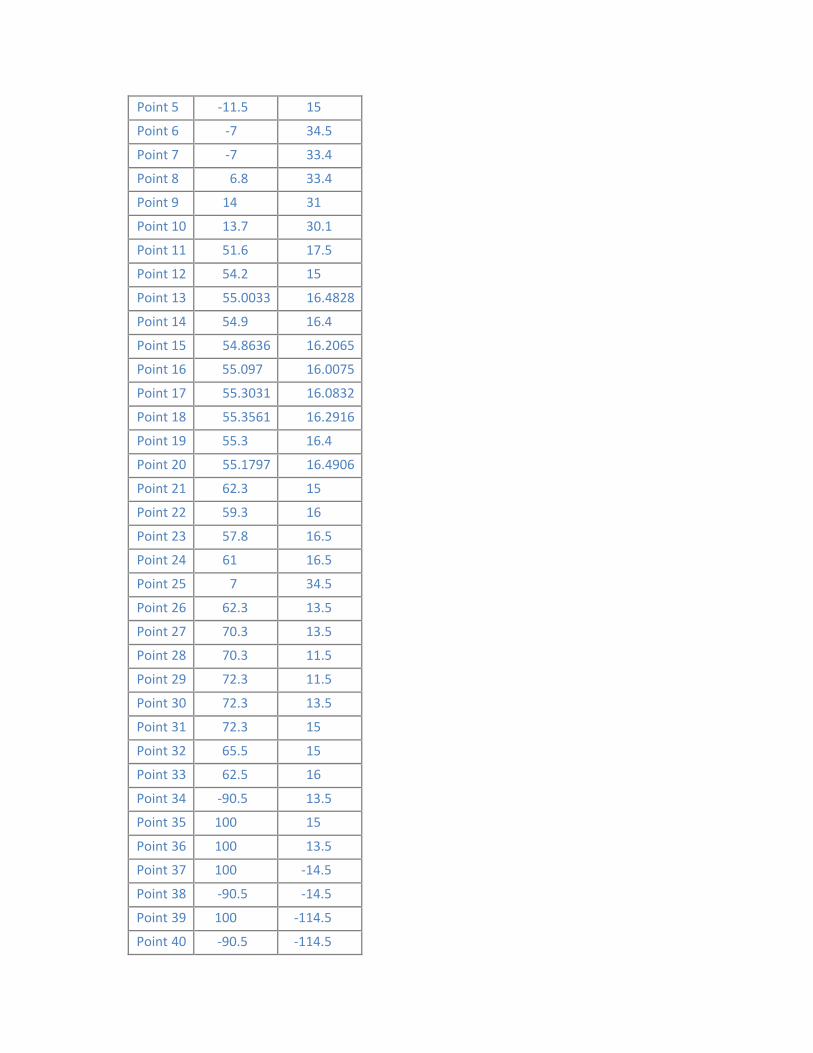
5
6
7
8
9
10
11
12
13
14
15
16
17
18
19
20
21
22
23
24
25
26
27
28
29
30
31
32
33
34
35
36
37
38
39
40
Point ‐11.5 15
Point ‐7 34.5
Point ‐7 33.4
Point 6.8 33.4
Point 14 31
Point 13.7 30.1
Point 51.6 17.5
Point 54.2 15
Point 55.0033 16.4828
Point 54.9 16.4
Point 54.8636 16.2065
Point 55.097 16.0075
Point 55.3031 16.0832
Point 55.3561 16.2916
Point 55.3 16.4
Point 55.1797 16.4906
Point 62.3 15
Point 59.3 16
Point 57.8 16.5
Point 61 16.5
Point 7 34.5
Point 62.3 13.5
Point 70.3 13.5
Point 70.3 11.5
Point 72.3 11.5
Point 72.3 13.5
Point 72.3 15
Point 65.5 15
Point 62.5 16
Point ‐90.5 13.5
Point 100 15
Point 100 13.5
Point 100 ‐14.5
Point ‐90.5 ‐14.5
Point 100 ‐114.5
Point ‐90.5 ‐114.5
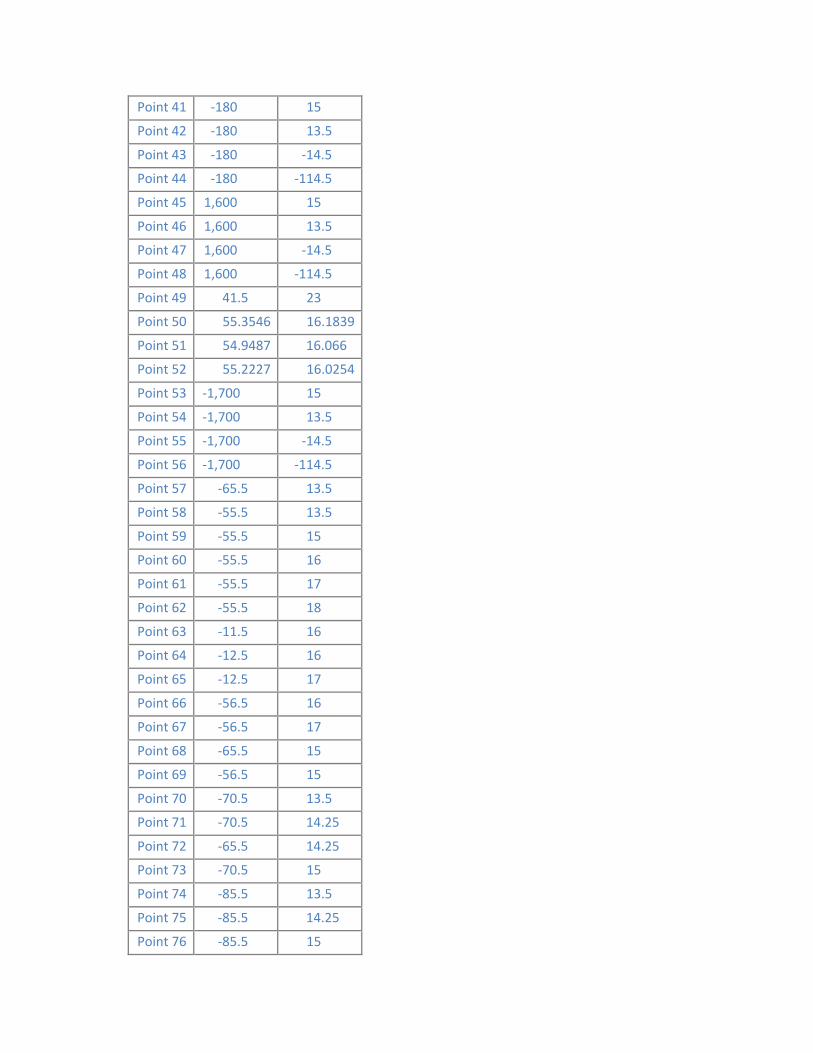
41
42
43
44
45
46
47
48
49
50
51
52
53
54
55
56
57
58
59
60
61
62
63
64
65
66
67
68
69
70
71
72
73
74
75
76
Point ‐180 15
Point ‐180 13.5
Point ‐180 ‐14.5
Point ‐180 ‐114.5
Point 1,600 15
Point 1,600 13.5
Point 1,600 ‐14.5
Point 1,600 ‐114.5
Point 41.5 23
Point 55.3546 16.1839
Point 54.9487 16.066
Point 55.2227 16.0254
Point ‐1,700 15
Point ‐1,700 13.5
Point ‐1,700 ‐14.5
Point ‐1,700 ‐114.5
Point ‐65.5 13.5
Point ‐55.5 13.5
Point ‐55.5 15
Point ‐55.5 16
Point ‐55.5 17
Point ‐55.5 18
Point ‐11.5 16
Point ‐12.5 16
Point ‐12.5 17
Point ‐56.5 16
Point ‐56.5 17
Point ‐65.5 15
Point ‐56.5 15
Point ‐70.5 13.5
Point ‐70.5 14.25
Point ‐65.5 14.25
Point ‐70.5 15
Point ‐85.5 13.5
Point ‐85.5 14.25
Point ‐85.5 15
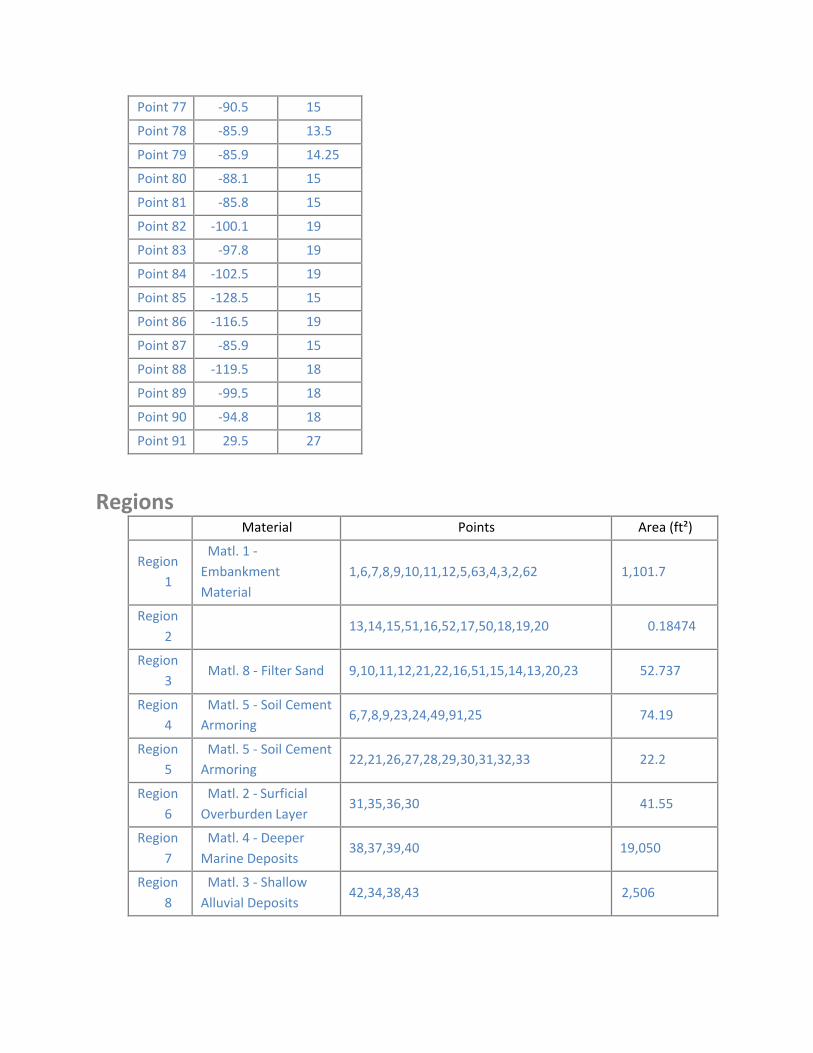
Point 77 ‐90.5 15
Point 78 ‐85.9 13.5
Point 79 ‐85.9 14.25
Point 80 ‐88.1 15
Point 81 ‐85.8 15
Point 82 ‐100.1 19
Point 83 ‐97.8 19
Point 84 ‐102.5 19
Point 85 ‐128.5 15
Point 86 ‐116.5 19
Point 87 ‐85.9 15
Point 88 ‐119.5 18
Point 89 ‐99.5 18
Point 90 ‐94.8 18
Point 91 29.5 27
Regions Material Points Area (ft²)
Region 1
Matl. 1 ‐
Embankment
Material
1,6,7,8,9,10,11,12,5,63,4,3,2,62 1,101.7
Region
2 13,14,15,51,16,52,17,50,18,19,20 0.18474
Region
3 Matl. 8 ‐ Filter Sand 9,10,11,12,21,22,16,51,15,14,13,20,23 52.737
Region
4 Matl. 5 ‐ Soil Cement Armoring
6,7,8,9,23,24,49,91,25 74.19
Region
5 Matl. 5 ‐ Soil Cement Armoring
22,21,26,27,28,29,30,31,32,33 22.2
Region
6
Matl. 2 ‐ Surficial
Overburden Layer 31,35,36,30 41.55
Region
7
Matl. 4 ‐ Deeper
Marine Deposits 38,37,39,40 19,050
Region
8
Matl. 3 ‐ Shallow
Alluvial Deposits 42,34,38,43 2,506
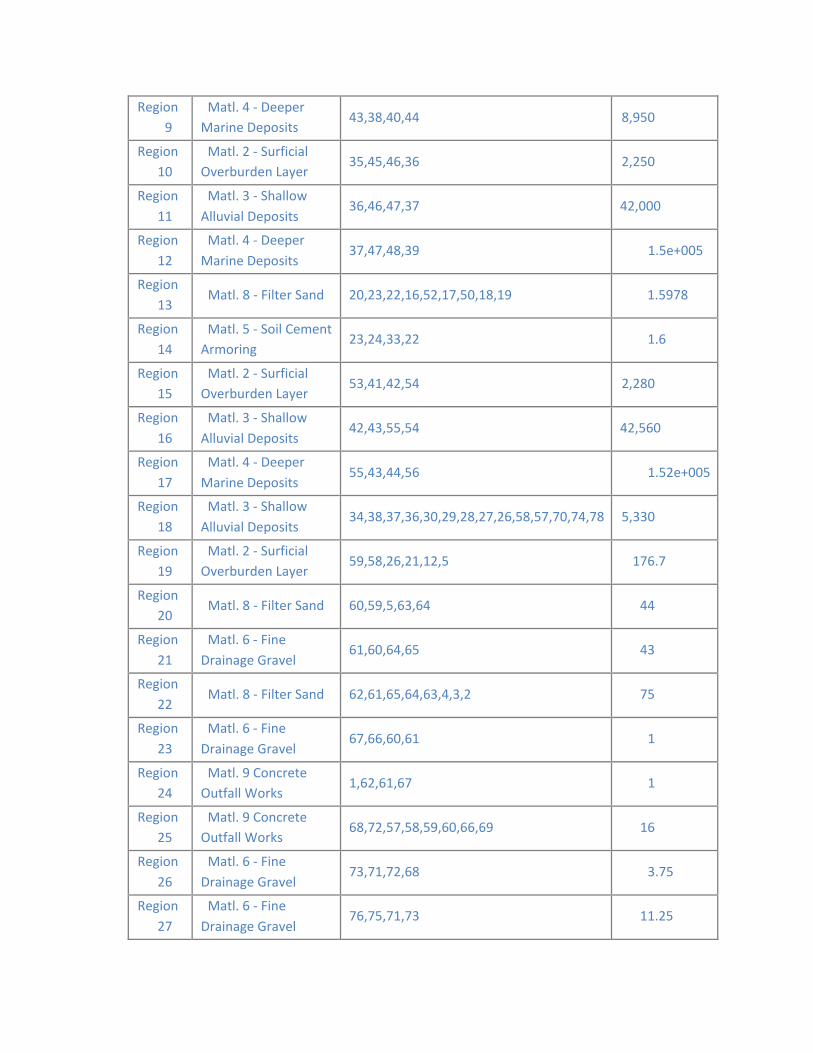
9
10
11
12
13
14
15
16
17
18
19
20
21
22
23
24
25
26
27
Region Matl. 4 ‐ Deeper Marine Deposits
43,38,40,44 8,950
Region Matl. 2 ‐ Surficial Overburden Layer
35,45,46,36 2,250
Region Matl. 3 ‐ Shallow
Alluvial Deposits 36,46,47,37 42,000
Region Matl. 4 ‐ Deeper
Marine Deposits 37,47,48,39 1.5e+005
Region Matl. 8 ‐ Filter Sand 20,23,22,16,52,17,50,18,19 1.5978
Region Matl. 5 ‐ Soil Cement Armoring
23,24,33,22 1.6
Region Matl. 2 ‐ Surficial Overburden Layer
53,41,42,54 2,280
Region Matl. 3 ‐ Shallow
Alluvial Deposits 42,43,55,54 42,560
Region Matl. 4 ‐ Deeper
Marine Deposits 55,43,44,56 1.52e+005
Region Matl. 3 ‐ Shallow
Alluvial Deposits 34,38,37,36,30,29,28,27,26,58,57,70,74,78 5,330
Region Matl. 2 ‐ Surficial Overburden Layer
59,58,26,21,12,5 176.7
Region Matl. 8 ‐ Filter Sand 60,59,5,63,64 44
Region Matl. 6 ‐ Fine
Drainage Gravel 61,60,64,65 43
Region Matl. 8 ‐ Filter Sand 62,61,65,64,63,4,3,2 75
Region Matl. 6 ‐ Fine
Drainage Gravel 67,66,60,61 1
Region Matl. 9 Concrete Outfall Works
1,62,61,67 1
Region Matl. 9 Concrete Outfall Works
68,72,57,58,59,60,66,69 16
Region Matl. 6 ‐ Fine
Drainage Gravel 73,71,72,68 3.75
Region Matl. 6 ‐ Fine
Drainage Gravel 76,75,71,73 11.25
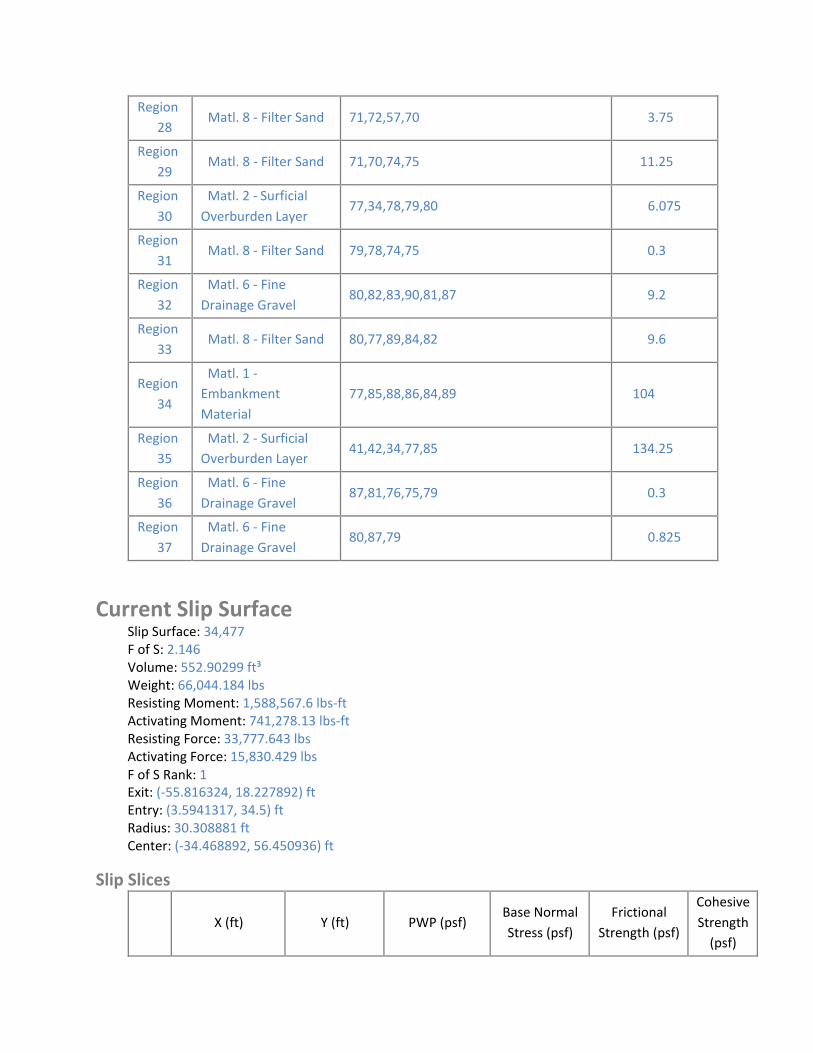
I I
Region
28 Matl. 8 ‐ Filter Sand 71,72,57,70 3.75
Region
29 Matl. 8 ‐ Filter Sand 71,70,74,75 11.25
Region
30
Matl. 2 ‐ Surficial
Overburden Layer 77,34,78,79,80 6.075
Region
31 Matl. 8 ‐ Filter Sand 79,78,74,75 0.3
Region
32
Matl. 6 ‐ Fine
Drainage Gravel 80,82,83,90,81,87 9.2
Region
33 Matl. 8 ‐ Filter Sand 80,77,89,84,82 9.6
Region
34
Matl. 1 ‐Embankment
Material
77,85,88,86,84,89 104
Region
35 Matl. 2 ‐ Surficial Overburden Layer
41,42,34,77,85 134.25
Region
36
Matl. 6 ‐ Fine
Drainage Gravel 87,81,76,75,79 0.3
Region
37
Matl. 6 ‐ Fine
Drainage Gravel 80,87,79 0.825
Current Slip Surface Slip Surface: 34,477 F of S: 2.146 Volume: 552.90299 ft³ Weight: 66,044.184 lbs Resisting Moment: 1,588,567.6 lbs‐ft Activating Moment: 741,278.13 lbs‐ft Resisting Force: 33,777.643 lbs Activating Force: 15,830.429 lbs F of S Rank: 1 Exit: (‐55.816324, 18.227892) ft Entry: (3.5941317, 34.5) ft Radius: 30.308881 ft Center: (‐34.468892, 56.450936) ft
Slip Slices
X (ft) Y (ft) PWP (psf) Base Normal
Stress (psf)
Frictional
Strength (psf)
Cohesive
Strength (psf)
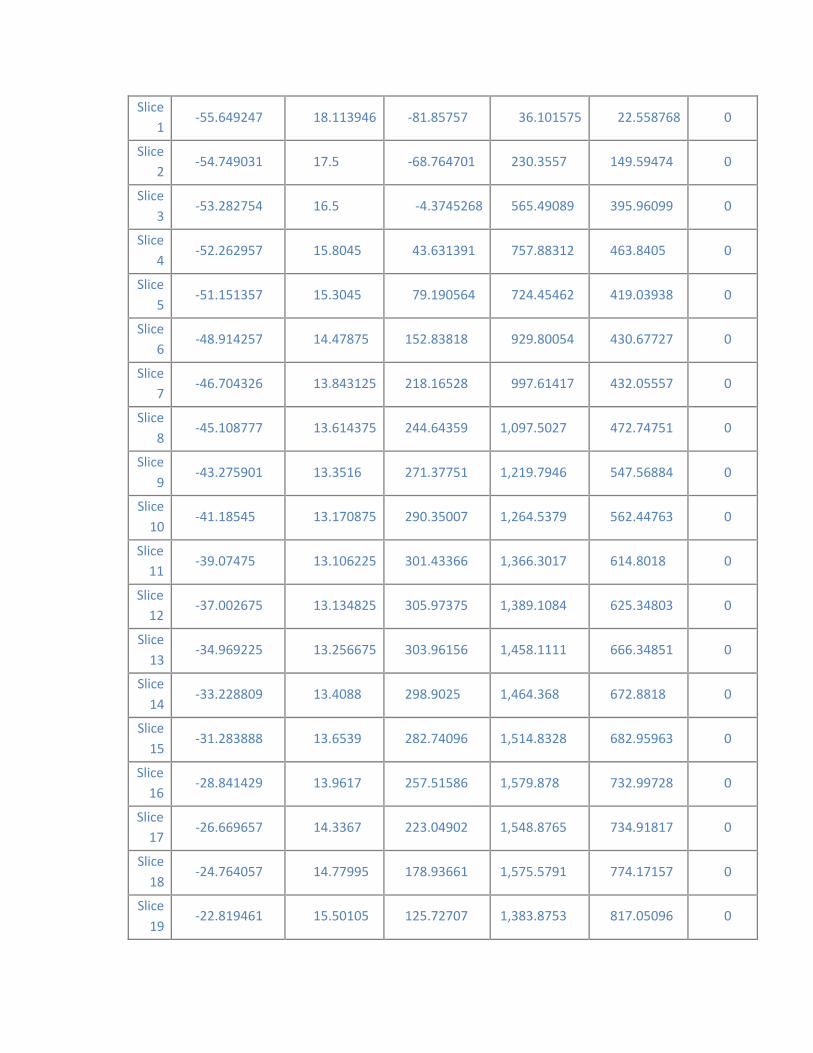
1
2
3
4
5
6
7
8
9
10
11
12
13
14
15
16
17
18
19
Slice ‐55.649247 18.113946 ‐81.85757 36.101575 22.558768 0
Slice ‐54.749031 17.5 ‐68.764701 230.3557 149.59474 0
Slice ‐53.282754 16.5 ‐4.3745268 565.49089 395.96099 0
Slice ‐52.262957 15.8045 43.631391 757.88312 463.8405 0
Slice ‐51.151357 15.3045 79.190564 724.45462 419.03938 0
Slice ‐48.914257 14.47875 152.83818 929.80054 430.67727 0
Slice ‐46.704326 13.843125 218.16528 997.61417 432.05557 0
Slice ‐45.108777 13.614375 244.64359 1,097.5027 472.74751 0
Slice ‐43.275901 13.3516 271.37751 1,219.7946 547.56884 0
Slice ‐41.18545 13.170875 290.35007 1,264.5379 562.44763 0
Slice ‐39.07475 13.106225 301.43366 1,366.3017 614.8018 0
Slice ‐37.002675 13.134825 305.97375 1,389.1084 625.34803 0
Slice ‐34.969225 13.256675 303.96156 1,458.1111 666.34851 0
Slice ‐33.228809 13.4088 298.9025 1,464.368 672.8818 0
Slice ‐31.283888 13.6539 282.74096 1,514.8328 682.95963 0
Slice ‐28.841429 13.9617 257.51586 1,579.878 732.99728 0
Slice ‐26.669657 14.3367 223.04902 1,548.8765 734.91817 0
Slice ‐24.764057 14.77995 178.93661 1,575.5791 774.17157 0
Slice ‐22.819461 15.50105 125.72707 1,383.8753 817.05096 0
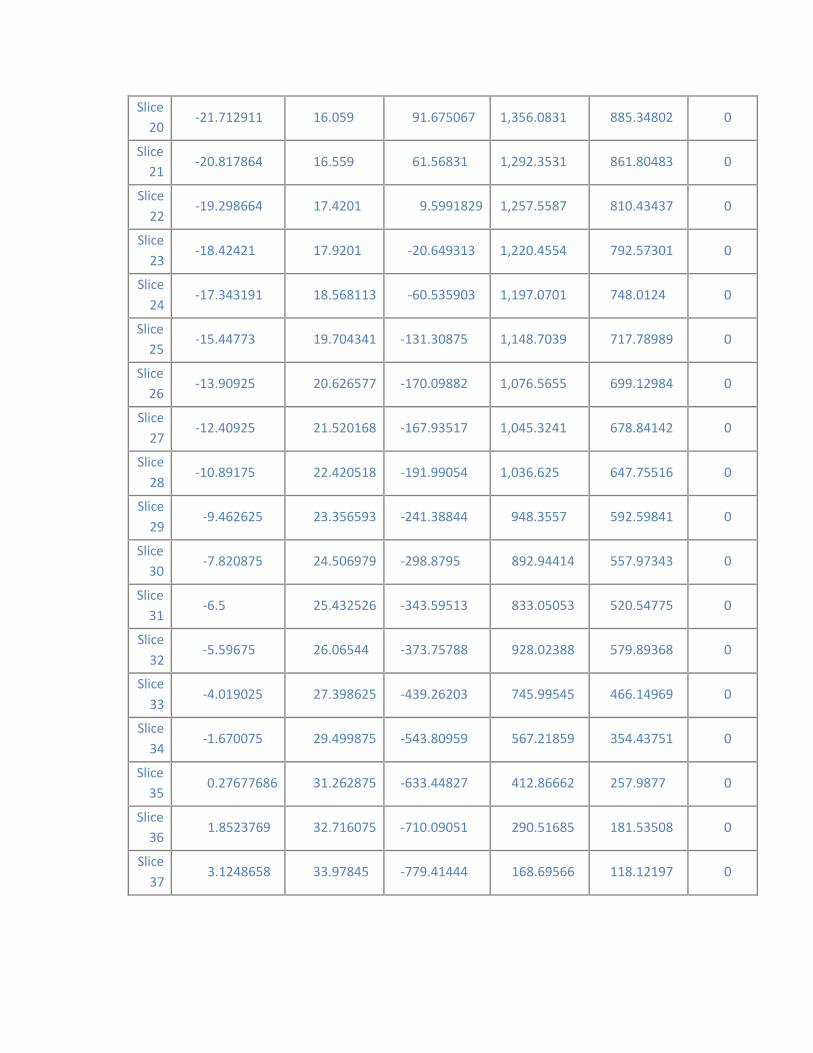
20
21
22
23
24
25
26
27
28
29
30
31
32
33
34
35
36
37
Slice ‐21.712911 16.059 91.675067 1,356.0831 885.34802 0
Slice ‐20.817864 16.559 61.56831 1,292.3531 861.80483 0
Slice ‐19.298664 17.4201 9.5991829 1,257.5587 810.43437 0
Slice ‐18.42421 17.9201 ‐20.649313 1,220.4554 792.57301 0
Slice ‐17.343191 18.568113 ‐60.535903 1,197.0701 748.0124 0
Slice ‐15.44773 19.704341 ‐131.30875 1,148.7039 717.78989 0
Slice ‐13.90925 20.626577 ‐170.09882 1,076.5655 699.12984 0
Slice ‐12.40925 21.520168 ‐167.93517 1,045.3241 678.84142 0
Slice ‐10.89175 22.420518 ‐191.99054 1,036.625 647.75516 0
Slice ‐9.462625 23.356593 ‐241.38844 948.3557 592.59841 0
Slice ‐7.820875 24.506979 ‐298.8795 892.94414 557.97343 0
Slice ‐6.5 25.432526 ‐343.59513 833.05053 520.54775 0
Slice ‐5.59675 26.06544 ‐373.75788 928.02388 579.89368 0
Slice ‐4.019025 27.398625 ‐439.26203 745.99545 466.14969 0
Slice ‐1.670075 29.499875 ‐543.80959 567.21859 354.43751 0
Slice 0.27677686 31.262875 ‐633.44827 412.86662 257.9877 0
Slice 1.8523769 32.716075 ‐710.09051 290.51685 181.53508 0
Slice 3.1248658 33.97845 ‐779.41444 168.69566 118.12197 0
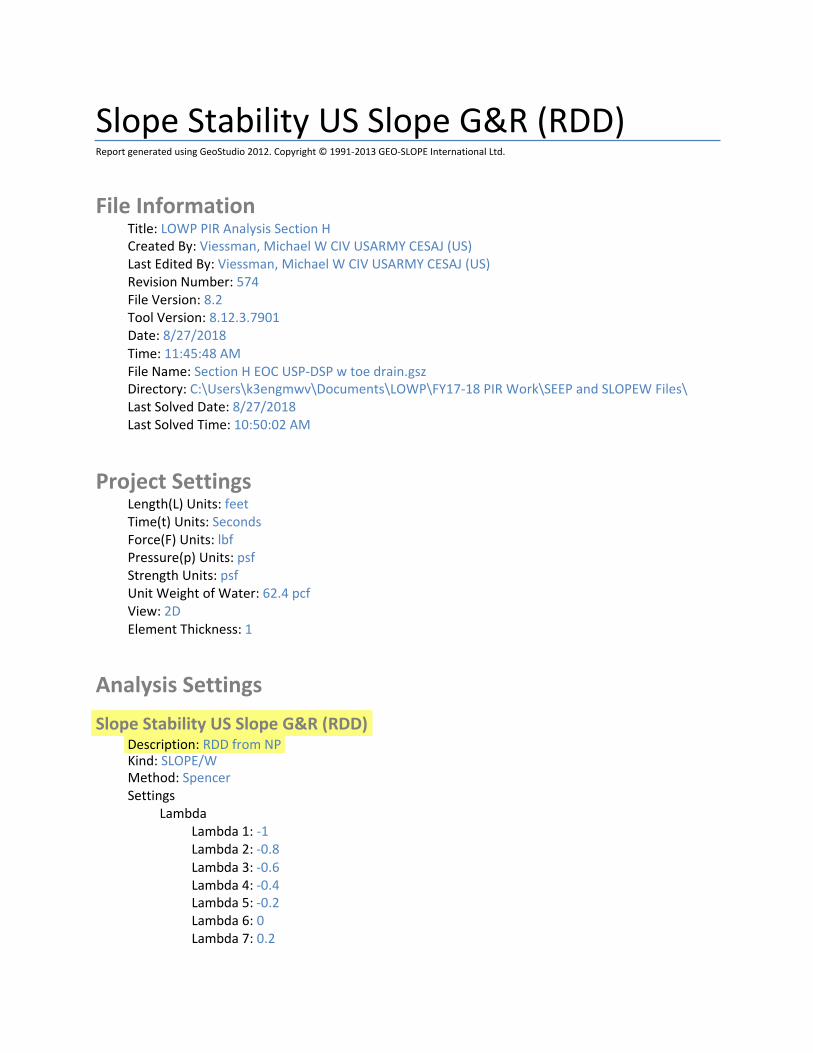
Slope Stability US Slope G&R (RDD) Report generated using GeoStudio 2012. Copyright © 1991‐2013 GEO‐SLOPE International Ltd.
File Information Title: LOWP PIR Analysis Section H Created By: Viessman, Michael W CIV USARMY CESAJ (US) Last Edited By: Viessman, Michael W CIV USARMY CESAJ (US) Revision Number: 574 File Version: 8.2 Tool Version: 8.12.3.7901 Date: 8/27/2018 Time: 11:45:48 AM File Name: Section H EOC USP‐DSP w toe drain.gsz Directory: C:\Users\k3engmwv\Documents\LOWP\FY17‐18 PIR Work\SEEP and SLOPEW Files\ Last Solved Date: 8/27/2018 Last Solved Time: 10:50:02 AM
Project Settings Length(L) Units: feet Time(t) Units: Seconds Force(F) Units: lbf Pressure(p) Units: psf Strength Units: psf Unit Weight of Water: 62.4 pcf View: 2D Element Thickness: 1
Analysis Settings
Slope Stability US Slope G&R (RDD) Description: RDD from NP Kind: SLOPE/W Method: Spencer Settings
Lambda Lambda 1: ‐1 Lambda 2: ‐0.8 Lambda 3: ‐0.6 Lambda 4: ‐0.4 Lambda 5: ‐0.2 Lambda 6: 0 Lambda 7: 0.2

Lambda 8: 0.4 Lambda 9: 0.6 Lambda 10: 0.8 Lambda 11: 1
PWP Conditions Source: Piezometric Line Apply Phreatic Correction: Yes Use Staged Rapid Drawdown: Yes
Slip Surface Direction of movement: Left to Right Use Passive Mode: No Slip Surface Option: Grid and Radius Critical slip surfaces saved: 1 Optimize Critical Slip Surface Location: Yes Tension Crack
Tension Crack Option: (none) F of S Distribution
F of S Calculation Option: Constant Advanced
Number of Slices: 30 F of S Tolerance: 0.001 Minimum Slip Surface Depth: 1 ft Optimization Maximum Iterations: 2,000 Optimization Convergence Tolerance: 1e‐007 Starting Optimization Points: 8 Ending Optimization Points: 16 Complete Passes per Insertion: 1 Driving Side Maximum Convex Angle: 5 ° Resisting Side Maximum Convex Angle: 1 °
Materials
Matl. 1 ‐ Embankment Material Model: Mohr‐Coulomb Unit Weight: 125 pcf Cohesion': 0 psf Phi': 32 ° Phi‐B: 0 ° Total Cohesion: 420 psf Total Phi: 0 ° Constant Unit Wt. Above Water Table: 120 pcf Pore Water Pressure
Piezometric Line: 1 Piezometric Line After Drawdown: 2
Matl. 2 ‐ Surficial Overburden Layer Model: Mohr‐Coulomb
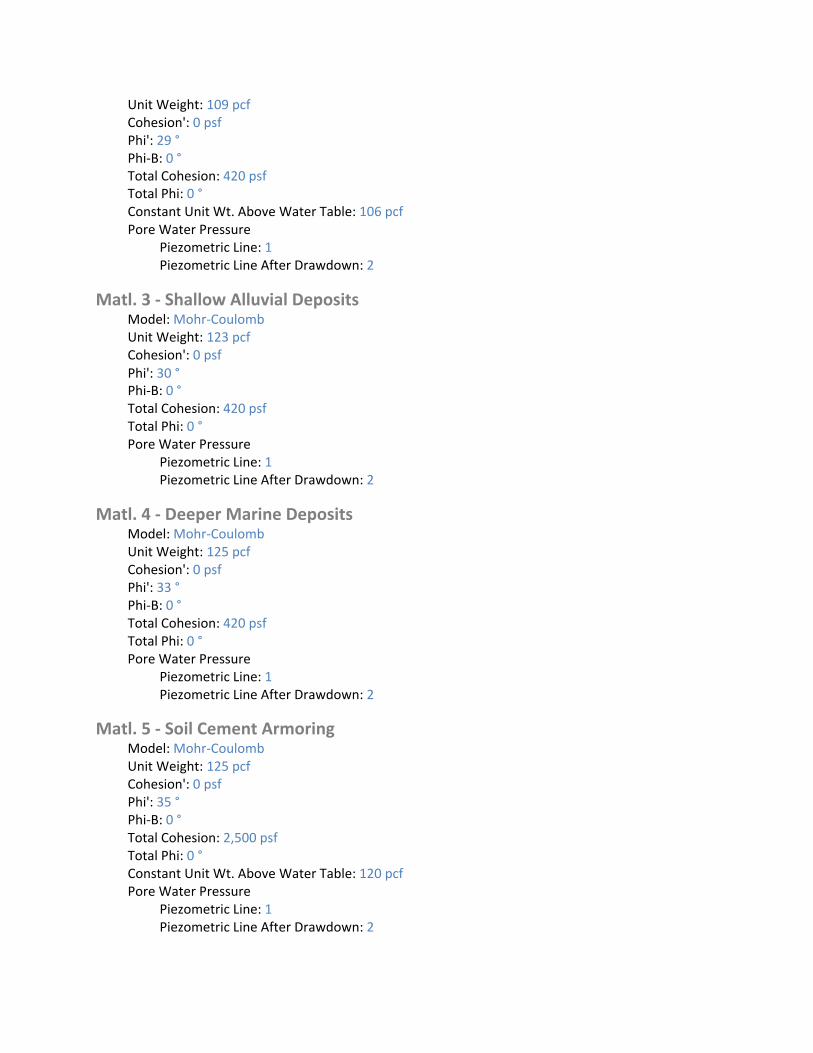
Unit Weight: 109 pcf Cohesion': 0 psf Phi': 29 ° Phi‐B: 0 ° Total Cohesion: 420 psf Total Phi: 0 ° Constant Unit Wt. Above Water Table: 106 pcf Pore Water Pressure
Piezometric Line: 1 Piezometric Line After Drawdown: 2
Matl. 3 ‐ Shallow Alluvial Deposits Model: Mohr‐Coulomb Unit Weight: 123 pcf Cohesion': 0 psf Phi': 30 ° Phi‐B: 0 ° Total Cohesion: 420 psf Total Phi: 0 ° Pore Water Pressure
Piezometric Line: 1 Piezometric Line After Drawdown: 2
Matl. 4 ‐ Deeper Marine Deposits Model: Mohr‐Coulomb Unit Weight: 125 pcf Cohesion': 0 psf Phi': 33 ° Phi‐B: 0 ° Total Cohesion: 420 psf Total Phi: 0 ° Pore Water Pressure
Piezometric Line: 1 Piezometric Line After Drawdown: 2
Matl. 5 ‐ Soil Cement Armoring Model: Mohr‐Coulomb Unit Weight: 125 pcf Cohesion': 0 psf Phi': 35 ° Phi‐B: 0 ° Total Cohesion: 2,500 psf Total Phi: 0 ° Constant Unit Wt. Above Water Table: 120 pcf Pore Water Pressure
Piezometric Line: 1 Piezometric Line After Drawdown: 2
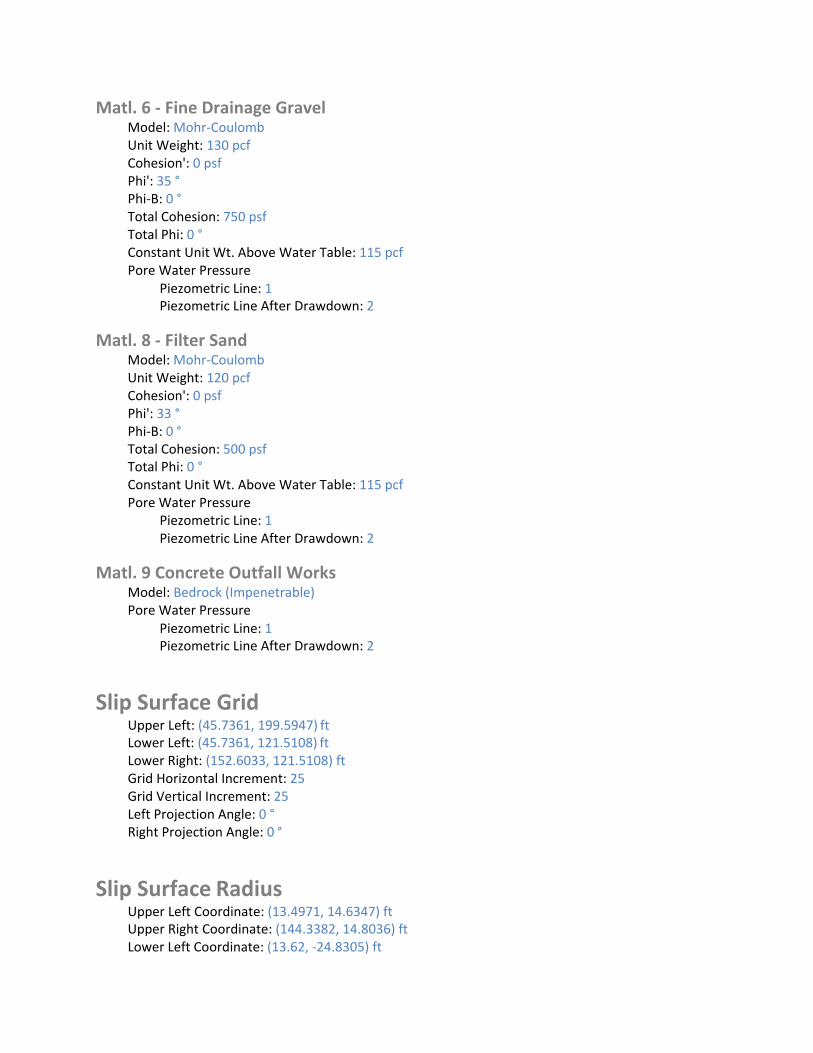
Matl. 6 ‐ Fine Drainage Gravel Model: Mohr‐Coulomb Unit Weight: 130 pcf Cohesion': 0 psf Phi': 35 ° Phi‐B: 0 ° Total Cohesion: 750 psf Total Phi: 0 ° Constant Unit Wt. Above Water Table: 115 pcf Pore Water Pressure
Piezometric Line: 1 Piezometric Line After Drawdown: 2
Matl. 8 ‐ Filter Sand Model: Mohr‐Coulomb Unit Weight: 120 pcf Cohesion': 0 psf Phi': 33 ° Phi‐B: 0 ° Total Cohesion: 500 psf Total Phi: 0 ° Constant Unit Wt. Above Water Table: 115 pcf Pore Water Pressure
Piezometric Line: 1 Piezometric Line After Drawdown: 2
Matl. 9 Concrete Outfall Works Model: Bedrock (Impenetrable) Pore Water Pressure
Piezometric Line: 1 Piezometric Line After Drawdown: 2
Slip Surface Grid Upper Left: (45.7361, 199.5947) ft Lower Left: (45.7361, 121.5108) ft Lower Right: (152.6033, 121.5108) ft Grid Horizontal Increment: 25 Grid Vertical Increment: 25 Left Projection Angle: 0 ° Right Projection Angle: 0 °
Slip Surface Radius Upper Left Coordinate: (13.4971, 14.6347) ft Upper Right Coordinate: (144.3382, 14.8036) ft Lower Left Coordinate: (13.62, ‐24.8305) ft
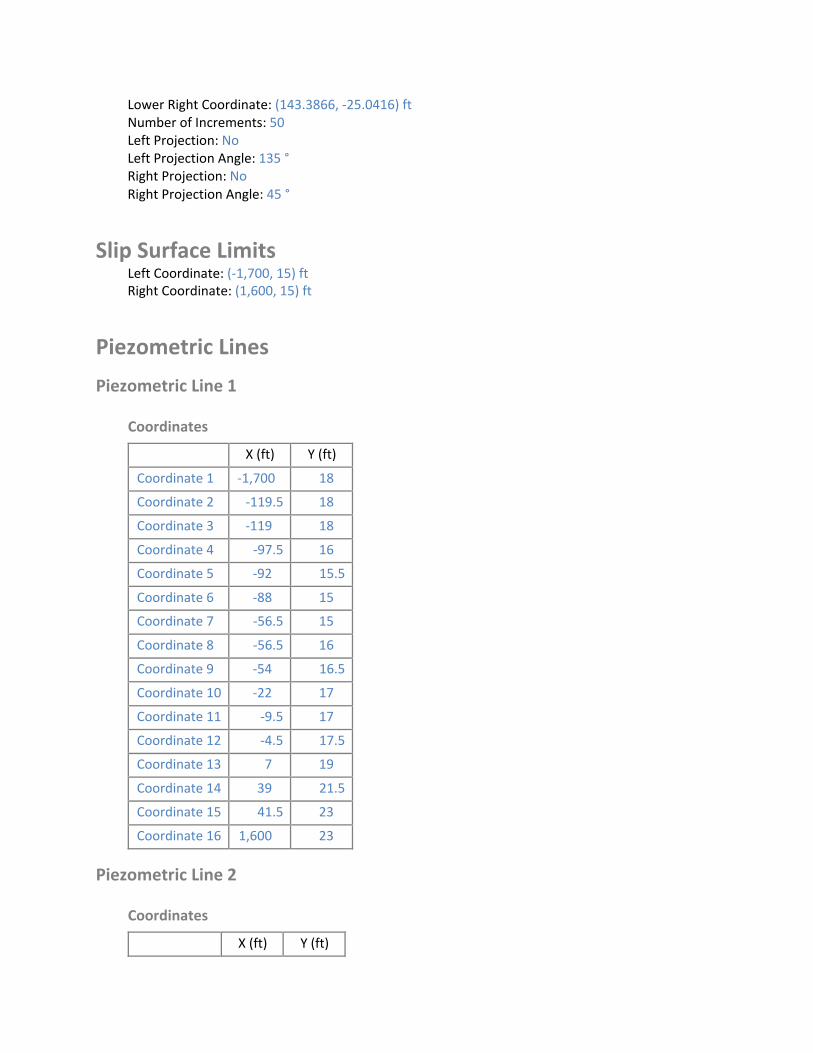
Lower Right Coordinate: (143.3866, ‐25.0416) ft Number of Increments: 50 Left Projection: No Left Projection Angle: 135 ° Right Projection: No Right Projection Angle: 45 °
Slip Surface Limits Left Coordinate: (‐1,700, 15) ft Right Coordinate: (1,600, 15) ft
Piezometric Lines
Piezometric Line 1
Coordinates
X (ft) Y (ft)
Coordinate 1 ‐1,700 18
Coordinate 2 ‐119.5 18
Coordinate 3 ‐119 18
Coordinate 4 ‐97.5 16
Coordinate 5 ‐92 15.5
Coordinate 6 ‐88 15
Coordinate 7 ‐56.5 15
Coordinate 8 ‐56.5 16
Coordinate 9 ‐54 16.5
Coordinate 10 ‐22 17
Coordinate 11 ‐9.5 17
Coordinate 12 ‐4.5 17.5
Coordinate 13 7 19
Coordinate 14 39 21.5
Coordinate 15 41.5 23
Coordinate 16 1,600 23
Piezometric Line 2
Coordinates
X (ft) Y (ft)
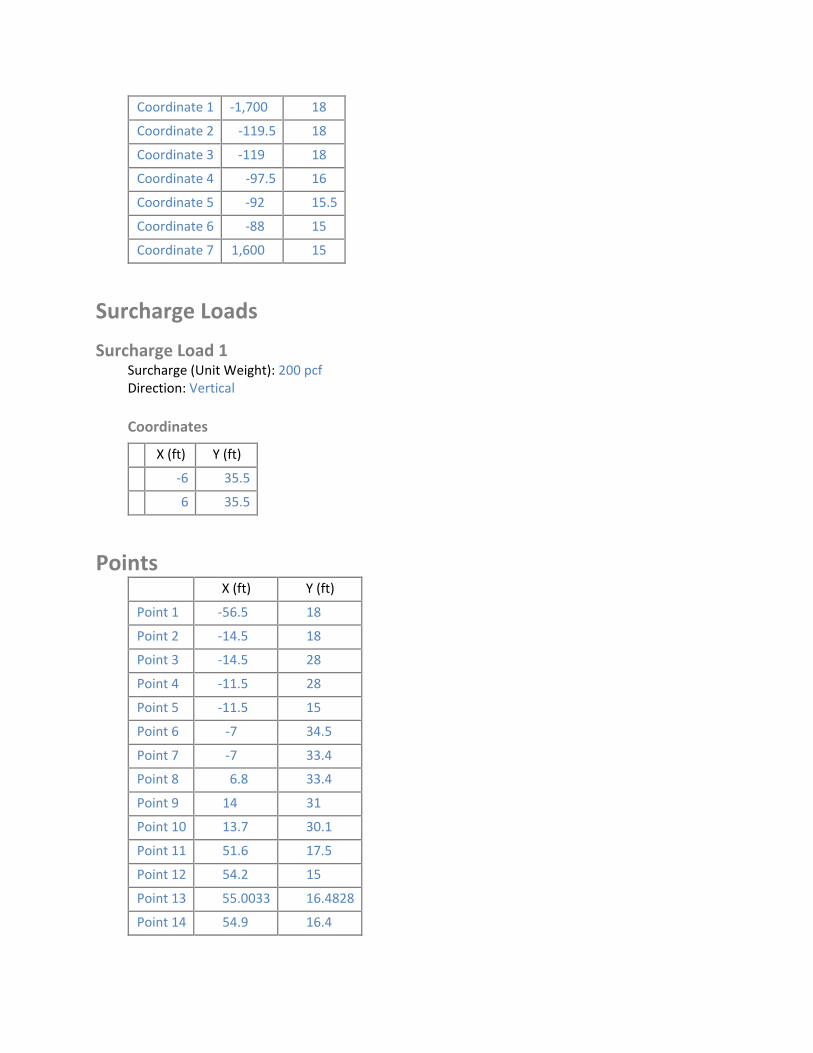
Coordinate 1 ‐1,700 18
Coordinate 2 ‐119.5 18
Coordinate 3 ‐119 18
Coordinate 4 ‐97.5 16
Coordinate 5 ‐92 15.5
Coordinate 6 ‐88 15
Coordinate 7 1,600 15
Surcharge Loads
Surcharge Load 1 Surcharge (Unit Weight): 200 pcf Direction: Vertical
Coordinates
X (ft) Y (ft)
‐6 35.5
6 35.5
Points X (ft) Y (ft)
Point 1 ‐56.5 18
Point 2 ‐14.5 18
Point 3 ‐14.5 28
Point 4 ‐11.5 28
Point 5 ‐11.5 15
Point 6 ‐7 34.5
Point 7 ‐7 33.4
Point 8 6.8 33.4
Point 9 14 31
Point 10 13.7 30.1
Point 11 51.6 17.5
Point 12 54.2 15
Point 13 55.0033 16.4828
Point 14 54.9 16.4
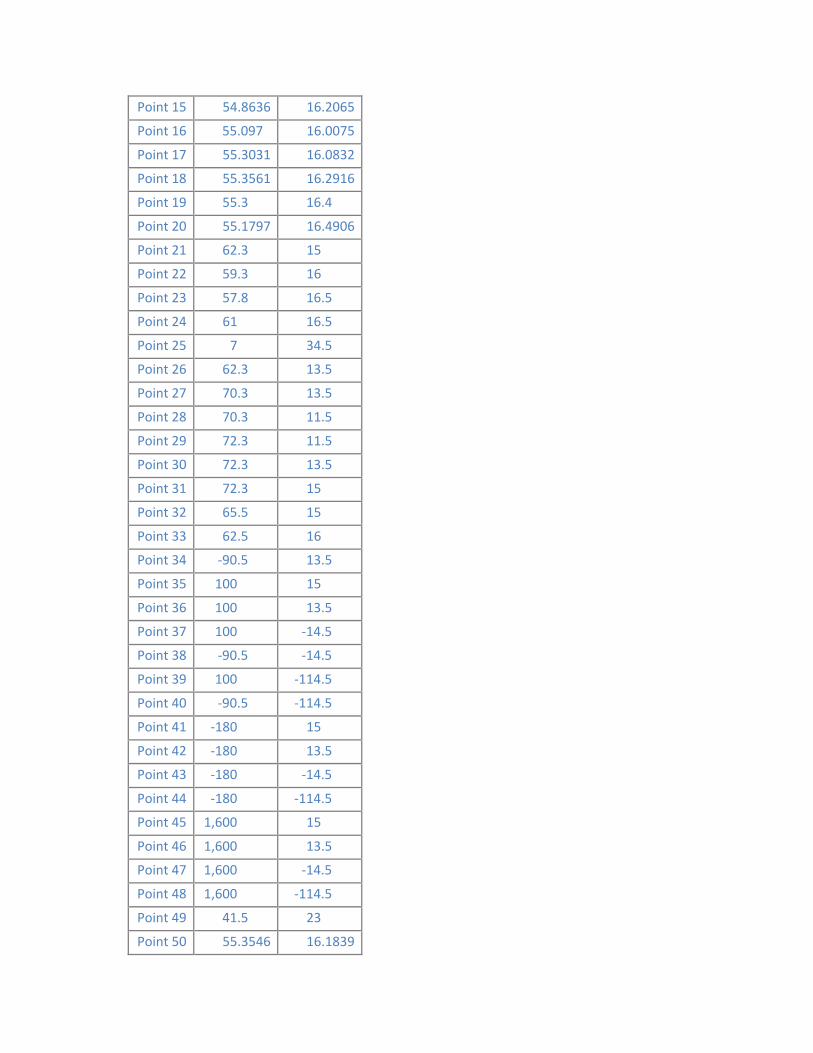
15
16
17
18
19
20
21
22
23
24
25
26
27
28
29
30
31
32
33
34
35
36
37
38
39
40
41
42
43
44
45
46
47
48
49
50
Point 54.8636 16.2065
Point 55.097 16.0075
Point 55.3031 16.0832
Point 55.3561 16.2916
Point 55.3 16.4
Point 55.1797 16.4906
Point 62.3 15
Point 59.3 16
Point 57.8 16.5
Point 61 16.5
Point 7 34.5
Point 62.3 13.5
Point 70.3 13.5
Point 70.3 11.5
Point 72.3 11.5
Point 72.3 13.5
Point 72.3 15
Point 65.5 15
Point 62.5 16
Point ‐90.5 13.5
Point 100 15
Point 100 13.5
Point 100 ‐14.5
Point ‐90.5 ‐14.5
Point 100 ‐114.5
Point ‐90.5 ‐114.5
Point ‐180 15
Point ‐180 13.5
Point ‐180 ‐14.5
Point ‐180 ‐114.5
Point 1,600 15
Point 1,600 13.5
Point 1,600 ‐14.5
Point 1,600 ‐114.5
Point 41.5 23
Point 55.3546 16.1839
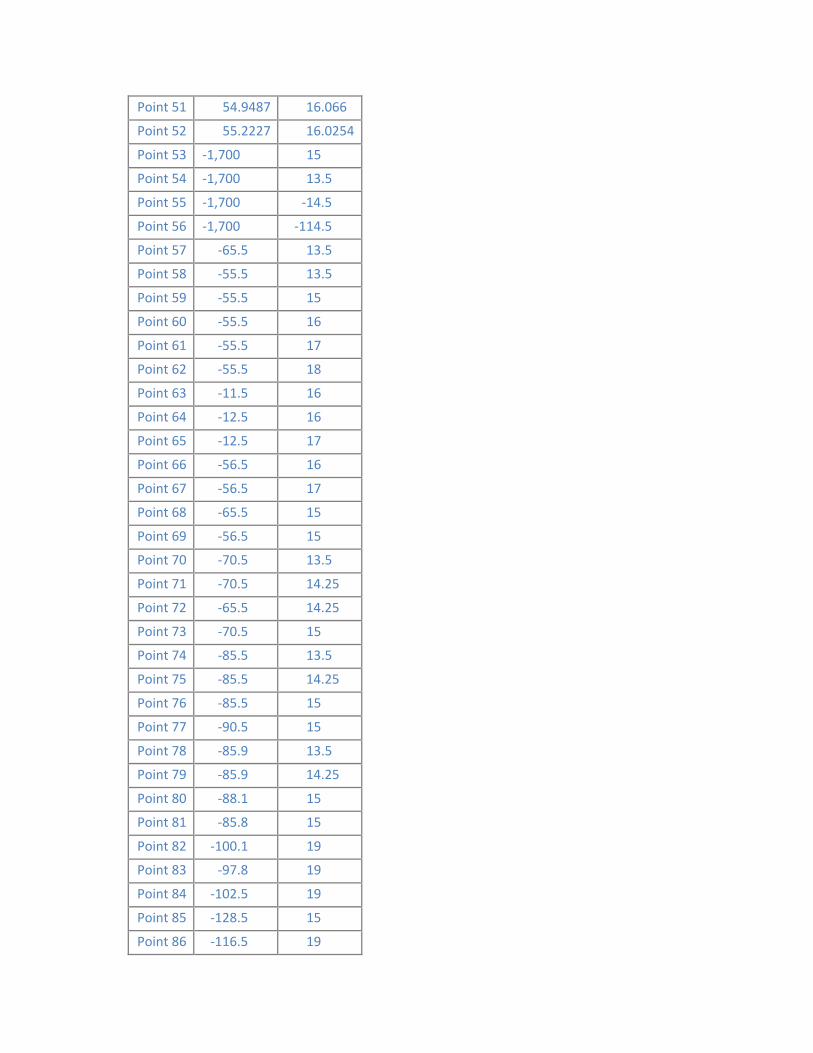
51
52
53
54
55
56
57
58
59
60
61
62
63
64
65
66
67
68
69
70
71
72
73
74
75
76
77
78
79
80
81
82
83
84
85
86
Point 54.9487 16.066
Point 55.2227 16.0254
Point ‐1,700 15
Point ‐1,700 13.5
Point ‐1,700 ‐14.5
Point ‐1,700 ‐114.5
Point ‐65.5 13.5
Point ‐55.5 13.5
Point ‐55.5 15
Point ‐55.5 16
Point ‐55.5 17
Point ‐55.5 18
Point ‐11.5 16
Point ‐12.5 16
Point ‐12.5 17
Point ‐56.5 16
Point ‐56.5 17
Point ‐65.5 15
Point ‐56.5 15
Point ‐70.5 13.5
Point ‐70.5 14.25
Point ‐65.5 14.25
Point ‐70.5 15
Point ‐85.5 13.5
Point ‐85.5 14.25
Point ‐85.5 15
Point ‐90.5 15
Point ‐85.9 13.5
Point ‐85.9 14.25
Point ‐88.1 15
Point ‐85.8 15
Point ‐100.1 19
Point ‐97.8 19
Point ‐102.5 19
Point ‐128.5 15
Point ‐116.5 19
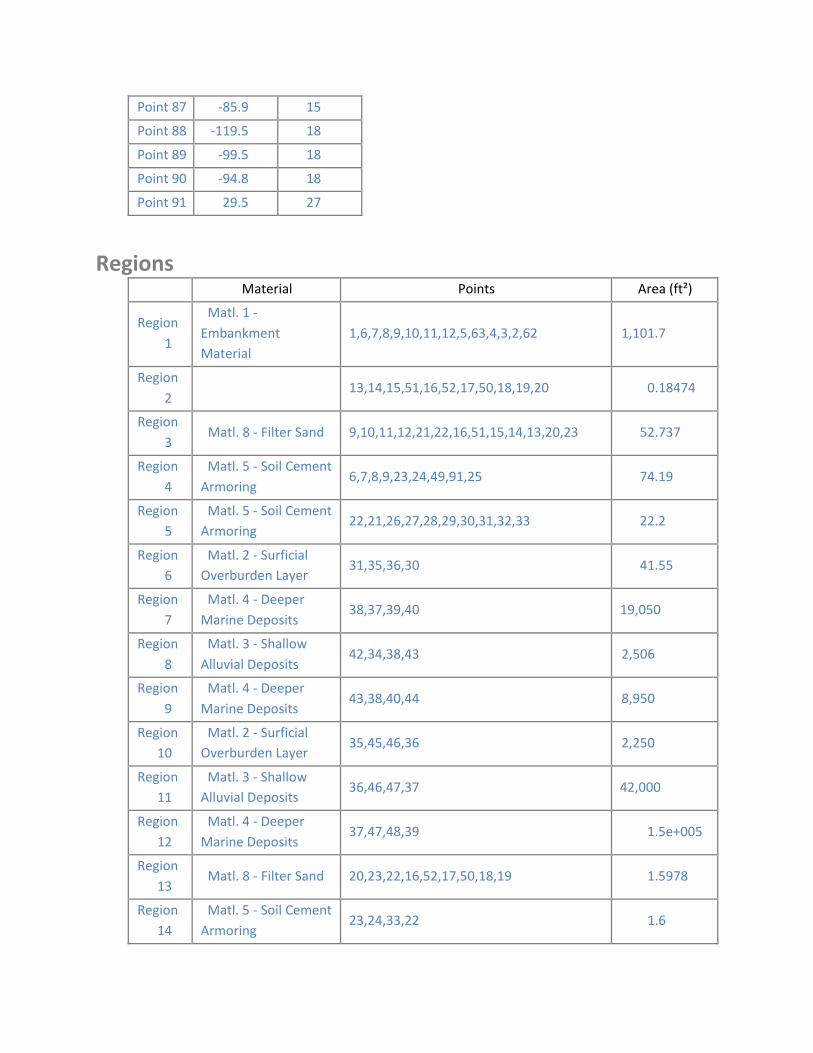
Point 87 ‐85.9 15
Point 88 ‐119.5 18
Point 89 ‐99.5 18
Point 90 ‐94.8 18
Point 91 29.5 27
Regions Material Points Area (ft²)
Region
1
Matl. 1 ‐
Embankment Material
1,6,7,8,9,10,11,12,5,63,4,3,2,62 1,101.7
Region
2 13,14,15,51,16,52,17,50,18,19,20 0.18474
Region
3 Matl. 8 ‐ Filter Sand 9,10,11,12,21,22,16,51,15,14,13,20,23 52.737
Region
4
Matl. 5 ‐ Soil Cement
Armoring 6,7,8,9,23,24,49,91,25 74.19
Region
5
Matl. 5 ‐ Soil Cement Armoring
22,21,26,27,28,29,30,31,32,33 22.2
Region
6
Matl. 2 ‐ Surficial Overburden Layer
31,35,36,30 41.55
Region
7
Matl. 4 ‐ Deeper
Marine Deposits 38,37,39,40 19,050
Region
8
Matl. 3 ‐ Shallow
Alluvial Deposits 42,34,38,43 2,506
Region
9
Matl. 4 ‐ Deeper
Marine Deposits 43,38,40,44 8,950
Region
10
Matl. 2 ‐ Surficial Overburden Layer
35,45,46,36 2,250
Region
11 Matl. 3 ‐ Shallow Alluvial Deposits
36,46,47,37 42,000
Region
12
Matl. 4 ‐ Deeper
Marine Deposits 37,47,48,39 1.5e+005
Region
13 Matl. 8 ‐ Filter Sand 20,23,22,16,52,17,50,18,19 1.5978
Region
14
Matl. 5 ‐ Soil Cement
Armoring 23,24,33,22 1.6
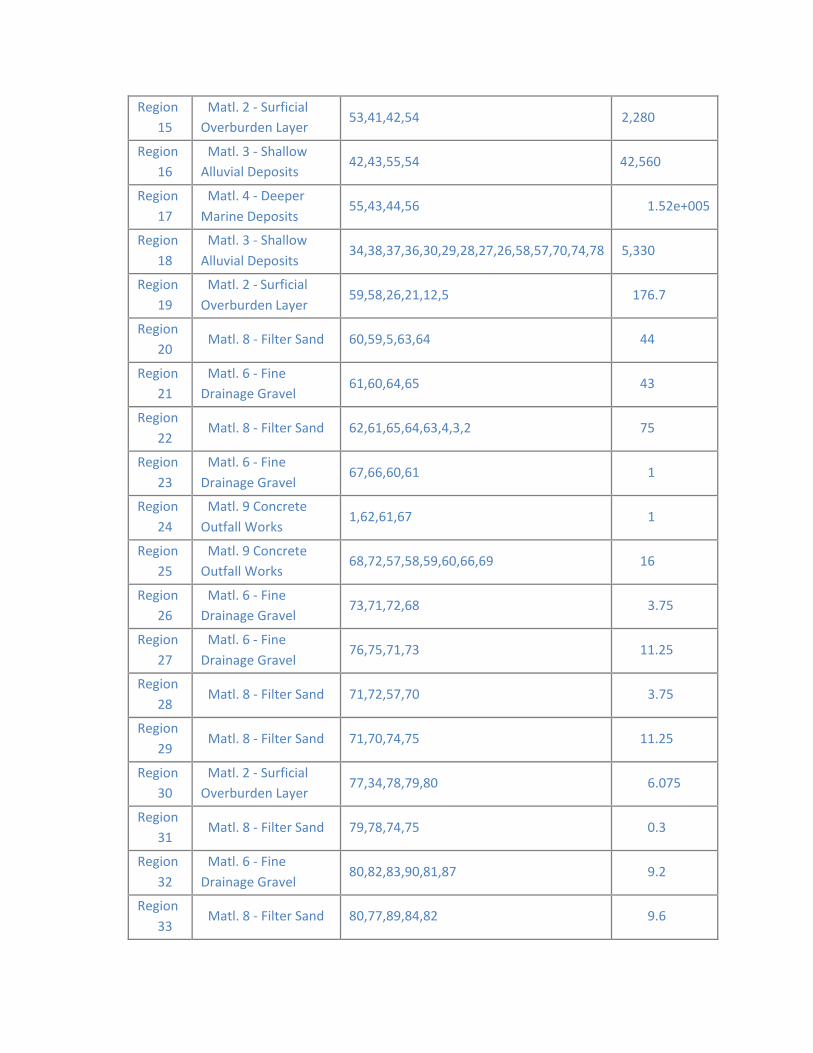
15
16
17
18
19
20
21
22
23
24
25
26
27
28
29
30
31
32
33
Region Matl. 2 ‐ Surficial Overburden Layer
53,41,42,54 2,280
Region Matl. 3 ‐ Shallow Alluvial Deposits
42,43,55,54 42,560
Region Matl. 4 ‐ Deeper
Marine Deposits 55,43,44,56 1.52e+005
Region Matl. 3 ‐ Shallow
Alluvial Deposits 34,38,37,36,30,29,28,27,26,58,57,70,74,78 5,330
Region Matl. 2 ‐ Surficial
Overburden Layer 59,58,26,21,12,5 176.7
Region Matl. 8 ‐ Filter Sand 60,59,5,63,64 44
Region Matl. 6 ‐ Fine Drainage Gravel
61,60,64,65 43
Region Matl. 8 ‐ Filter Sand 62,61,65,64,63,4,3,2 75
Region Matl. 6 ‐ Fine
Drainage Gravel 67,66,60,61 1
Region Matl. 9 Concrete
Outfall Works 1,62,61,67 1
Region Matl. 9 Concrete Outfall Works
68,72,57,58,59,60,66,69 16
Region Matl. 6 ‐ Fine Drainage Gravel
73,71,72,68 3.75
Region Matl. 6 ‐ Fine
Drainage Gravel 76,75,71,73 11.25
Region Matl. 8 ‐ Filter Sand 71,72,57,70 3.75
Region Matl. 8 ‐ Filter Sand 71,70,74,75 11.25
Region Matl. 2 ‐ Surficial Overburden Layer
77,34,78,79,80 6.075
Region Matl. 8 ‐ Filter Sand 79,78,74,75 0.3
Region Matl. 6 ‐ Fine
Drainage Gravel 80,82,83,90,81,87 9.2
Region Matl. 8 ‐ Filter Sand 80,77,89,84,82 9.6
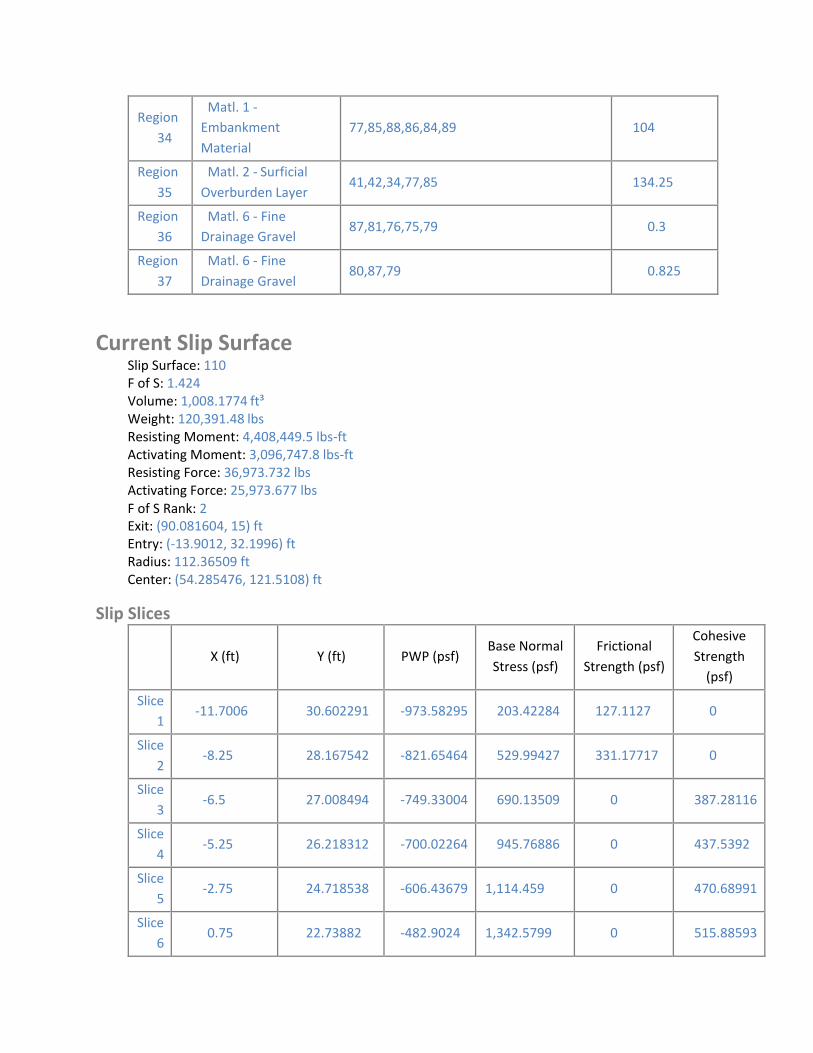
Region
34
Matl. 1 ‐Embankment
Material
77,85,88,86,84,89 104
Region
35
Matl. 2 ‐ Surficial
Overburden Layer 41,42,34,77,85 134.25
Region
36 Matl. 6 ‐ Fine Drainage Gravel
87,81,76,75,79 0.3
Region
37
Matl. 6 ‐ Fine
Drainage Gravel 80,87,79 0.825
Current Slip Surface Slip Surface: 110 F of S: 1.424 Volume: 1,008.1774 ft³ Weight: 120,391.48 lbs Resisting Moment: 4,408,449.5 lbs‐ft Activating Moment: 3,096,747.8 lbs‐ft Resisting Force: 36,973.732 lbs Activating Force: 25,973.677 lbs F of S Rank: 2 Exit: (90.081604, 15) ft Entry: (‐13.9012, 32.1996) ft Radius: 112.36509 ft Center: (54.285476, 121.5108) ft
Slip Slices
X (ft) Y (ft) PWP (psf) Base Normal
Stress (psf)
Frictional
Strength (psf)
Cohesive
Strength (psf)
Slice
1 ‐11.7006 30.602291 ‐973.58295 203.42284 127.1127 0
Slice
2 ‐8.25 28.167542 ‐821.65464 529.99427 331.17717 0
Slice
3 ‐6.5 27.008494 ‐749.33004 690.13509 0 387.28116
Slice
4 ‐5.25 26.218312 ‐700.02264 945.76886 0 437.5392
Slice
5 ‐2.75 24.718538 ‐606.43679 1,114.459 0 470.68991
Slice
6 0.75 22.73882 ‐482.9024 1,342.5799 0 515.88593
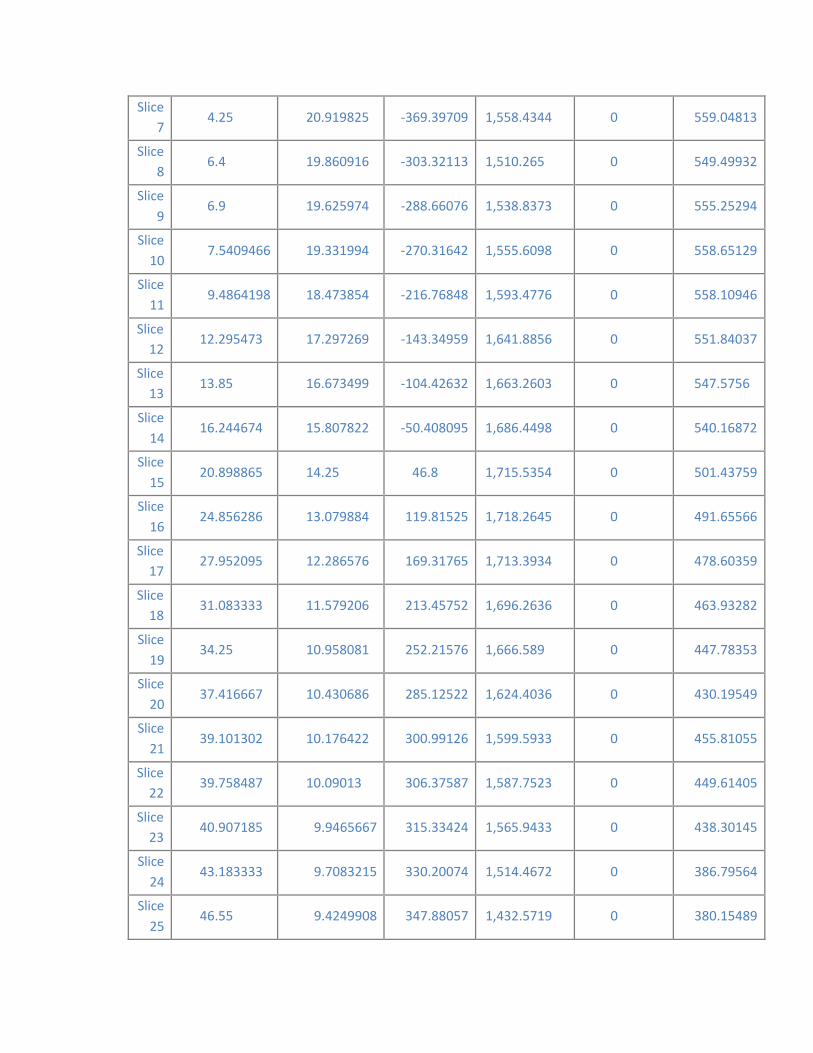
7
8
9
10
11
12
13
14
15
16
17
18
19
20
21
22
23
24
25
Slice 4.25 20.919825 ‐369.39709 1,558.4344 0 559.04813
Slice 6.4 19.860916 ‐303.32113 1,510.265 0 549.49932
Slice 6.9 19.625974 ‐288.66076 1,538.8373 0 555.25294
Slice 7.5409466 19.331994 ‐270.31642 1,555.6098 0 558.65129
Slice 9.4864198 18.473854 ‐216.76848 1,593.4776 0 558.10946
Slice 12.295473 17.297269 ‐143.34959 1,641.8856 0 551.84037
Slice 13.85 16.673499 ‐104.42632 1,663.2603 0 547.5756
Slice 16.244674 15.807822 ‐50.408095 1,686.4498 0 540.16872
Slice 20.898865 14.25 46.8 1,715.5354 0 501.43759
Slice 24.856286 13.079884 119.81525 1,718.2645 0 491.65566
Slice 27.952095 12.286576 169.31765 1,713.3934 0 478.60359
Slice 31.083333 11.579206 213.45752 1,696.2636 0 463.93282
Slice 34.25 10.958081 252.21576 1,666.589 0 447.78353
Slice 37.416667 10.430686 285.12522 1,624.4036 0 430.19549
Slice 39.101302 10.176422 300.99126 1,599.5933 0 455.81055
Slice 39.758487 10.09013 306.37587 1,587.7523 0 449.61405
Slice 40.907185 9.9465667 315.33424 1,565.9433 0 438.30145
Slice 43.183333 9.7083215 330.20074 1,514.4672 0 386.79564
Slice 46.55 9.4249908 347.88057 1,432.5719 0 380.15489
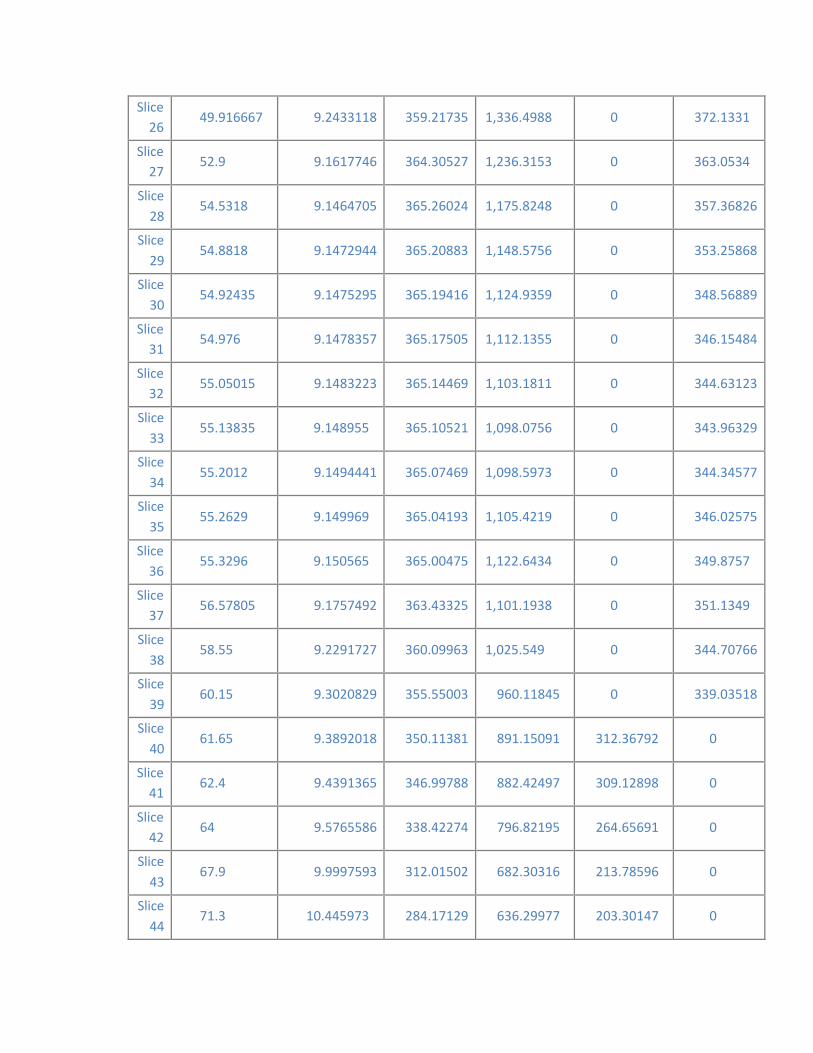
26
27
28
29
30
31
32
33
34
35
36
37
38
39
40
41
42
43
44
Slice 49.916667 9.2433118 359.21735 1,336.4988 0 372.1331
Slice 52.9 9.1617746 364.30527 1,236.3153 0 363.0534
Slice 54.5318 9.1464705 365.26024 1,175.8248 0 357.36826
Slice 54.8818 9.1472944 365.20883 1,148.5756 0 353.25868
Slice 54.92435 9.1475295 365.19416 1,124.9359 0 348.56889
Slice 54.976 9.1478357 365.17505 1,112.1355 0 346.15484
Slice 55.05015 9.1483223 365.14469 1,103.1811 0 344.63123
Slice 55.13835 9.148955 365.10521 1,098.0756 0 343.96329
Slice 55.2012 9.1494441 365.07469 1,098.5973 0 344.34577
Slice 55.2629 9.149969 365.04193 1,105.4219 0 346.02575
Slice 55.3296 9.150565 365.00475 1,122.6434 0 349.8757
Slice 56.57805 9.1757492 363.43325 1,101.1938 0 351.1349
Slice 58.55 9.2291727 360.09963 1,025.549 0 344.70766
Slice 60.15 9.3020829 355.55003 960.11845 0 339.03518
Slice 61.65 9.3892018 350.11381 891.15091 312.36792 0
Slice 62.4 9.4391365 346.99788 882.42497 309.12898 0
Slice 64 9.5765586 338.42274 796.82195 264.65691 0
Slice 67.9 9.9997593 312.01502 682.30316 213.78596 0
Slice 71.3 10.445973 284.17129 636.29977 203.30147 0
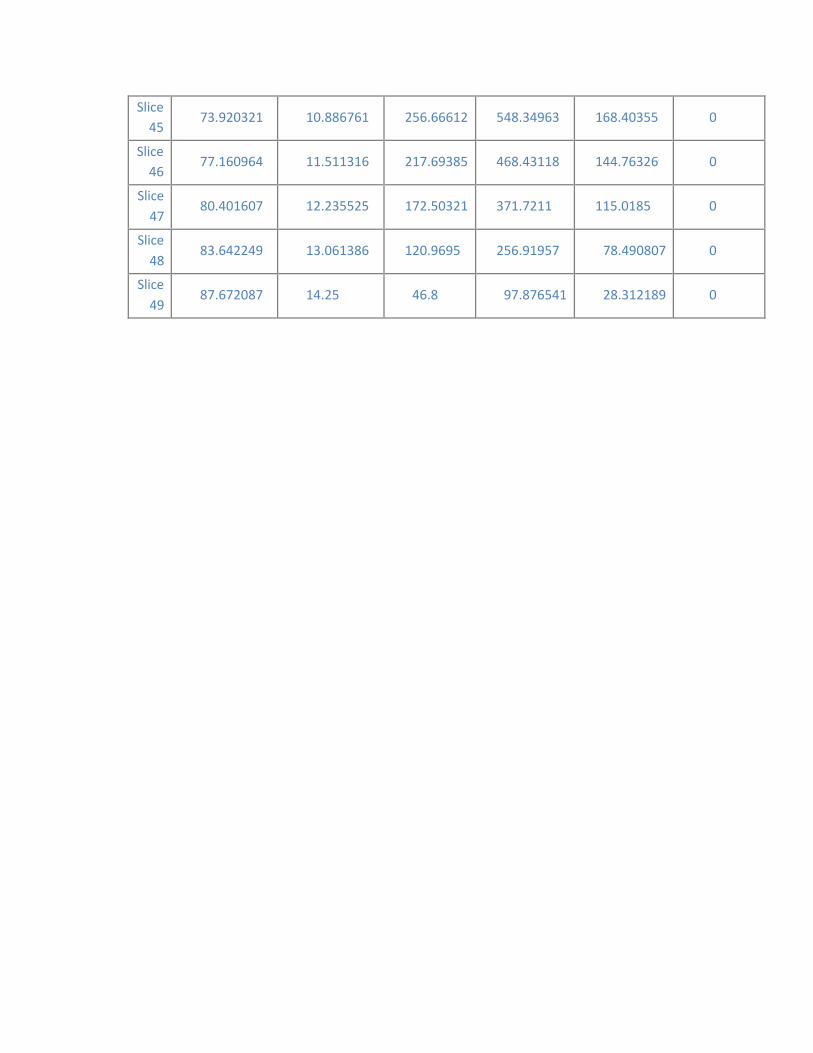
45
46
47
48
49
Slice 73.920321 10.886761 256.66612 548.34963 168.40355 0
Slice 77.160964 11.511316 217.69385 468.43118 144.76326 0
Slice 80.401607 12.235525 172.50321 371.7211 115.0185 0
Slice 83.642249 13.061386 120.9695 256.91957 78.490807 0
Slice 87.672087 14.25 46.8 97.876541 28.312189 0
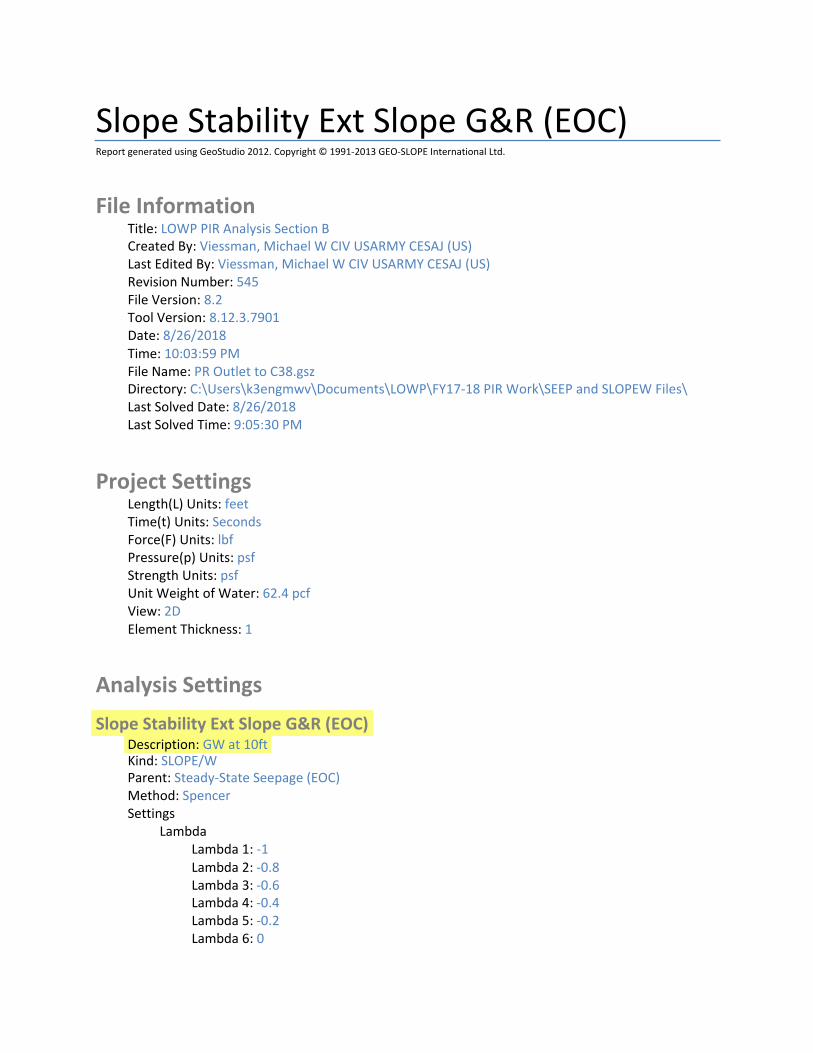
Slope Stability Ext Slope G&R (EOC) Report generated using GeoStudio 2012. Copyright © 1991‐2013 GEO‐SLOPE International Ltd.
File Information Title: LOWP PIR Analysis Section B Created By: Viessman, Michael W CIV USARMY CESAJ (US) Last Edited By: Viessman, Michael W CIV USARMY CESAJ (US) Revision Number: 545 File Version: 8.2 Tool Version: 8.12.3.7901 Date: 8/26/2018 Time: 10:03:59 PM File Name: PR Outlet to C38.gsz Directory: C:\Users\k3engmwv\Documents\LOWP\FY17‐18 PIR Work\SEEP and SLOPEW Files\ Last Solved Date: 8/26/2018 Last Solved Time: 9:05:30 PM
Project Settings Length(L) Units: feet Time(t) Units: Seconds Force(F) Units: lbf Pressure(p) Units: psf Strength Units: psf Unit Weight of Water: 62.4 pcf View: 2D Element Thickness: 1
Analysis Settings
Slope Stability Ext Slope G&R (EOC) Description: GW at 10ft Kind: SLOPE/W Parent: Steady‐State Seepage (EOC) Method: Spencer Settings
Lambda Lambda 1: ‐1 Lambda 2: ‐0.8 Lambda 3: ‐0.6 Lambda 4: ‐0.4 Lambda 5: ‐0.2 Lambda 6: 0
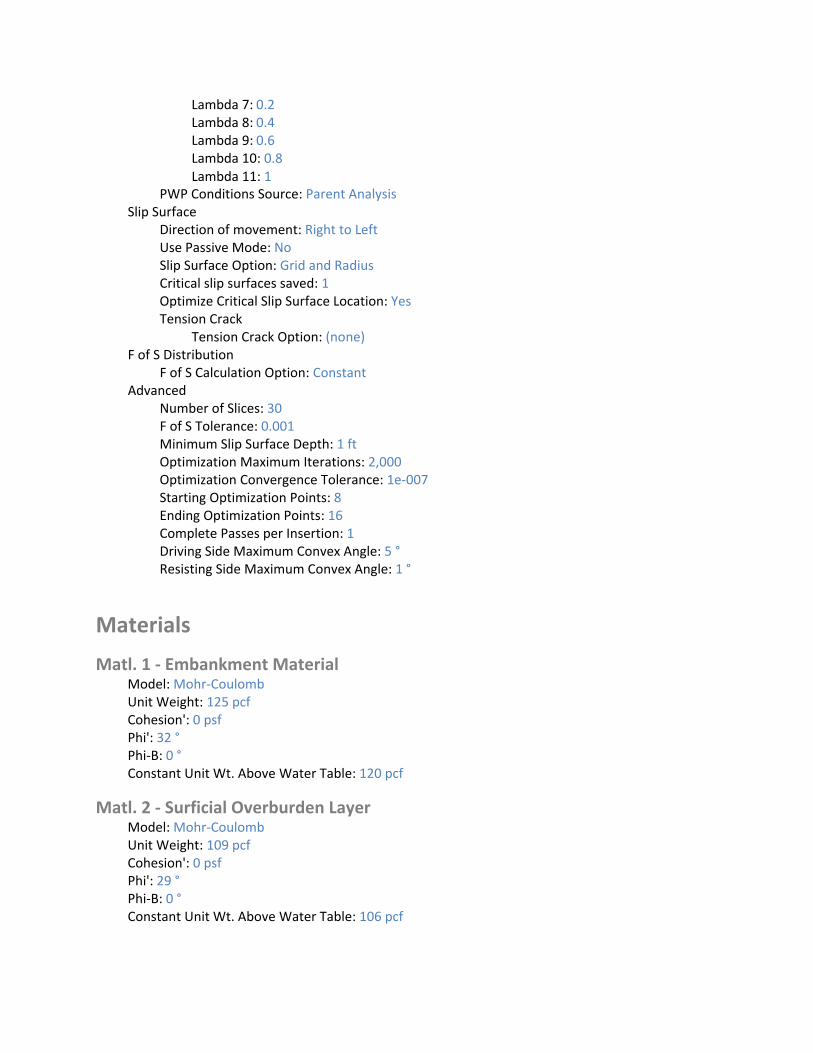
Lambda 7: 0.2 Lambda 8: 0.4 Lambda 9: 0.6 Lambda 10: 0.8 Lambda 11: 1
PWP Conditions Source: Parent Analysis Slip Surface
Direction of movement: Right to Left Use Passive Mode: No Slip Surface Option: Grid and Radius Critical slip surfaces saved: 1 Optimize Critical Slip Surface Location: Yes Tension Crack
Tension Crack Option: (none) F of S Distribution
F of S Calculation Option: Constant Advanced
Number of Slices: 30 F of S Tolerance: 0.001 Minimum Slip Surface Depth: 1 ft Optimization Maximum Iterations: 2,000 Optimization Convergence Tolerance: 1e‐007 Starting Optimization Points: 8 Ending Optimization Points: 16 Complete Passes per Insertion: 1 Driving Side Maximum Convex Angle: 5 ° Resisting Side Maximum Convex Angle: 1 °
Materials
Matl. 1 ‐ Embankment Material Model: Mohr‐Coulomb Unit Weight: 125 pcf Cohesion': 0 psf Phi': 32 ° Phi‐B: 0 ° Constant Unit Wt. Above Water Table: 120 pcf
Matl. 2 ‐ Surficial Overburden Layer Model: Mohr‐Coulomb Unit Weight: 109 pcf Cohesion': 0 psf Phi': 29 ° Phi‐B: 0 ° Constant Unit Wt. Above Water Table: 106 pcf

Matl. 3 ‐ Shallow Alluvial Deposits Model: Mohr‐Coulomb Unit Weight: 123 pcf Cohesion': 0 psf Phi': 30 ° Phi‐B: 0 °
Matl. 4 ‐ Deeper Marine Deposits Model: Mohr‐Coulomb Unit Weight: 125 pcf Cohesion': 0 psf Phi': 33 ° Phi‐B: 0 °
Slip Surface Grid Upper Left: (‐262.2639, 239.5947) ft Lower Left: (‐262.2639, 161.5108) ft Lower Right: (‐155.3967, 161.5108) ft Grid Horizontal Increment: 25 Grid Vertical Increment: 25 Left Projection Angle: 0 ° Right Projection Angle: 0 °
Slip Surface Radius Upper Left Coordinate: (‐242.3029, 15.0347) ft Upper Right Coordinate: (‐111.4618, 15.2036) ft Lower Left Coordinate: (‐242.18, ‐24.4305) ft Lower Right Coordinate: (‐112.4134, ‐24.6416) ft Number of Increments: 50 Left Projection: No Left Projection Angle: 135 ° Right Projection: No Right Projection Angle: 45 °
Slip Surface Limits Left Coordinate: (‐1,200, 15) ft Right Coordinate: (1,200, 15) ft
Points X (ft) Y (ft)
Point 1 ‐183 15

2
3
4
5
6
7
8
9
10
11
12
13
14
15
16
17
18
19
20
21
22
23
24
25
26
27
28
29
30
31
32
33
34
35
36
37
Point ‐138 30
Point ‐124 30
Point ‐100 22
Point ‐70.1 22
Point ‐49 15
Point 49 15
Point 70 22
Point 100 22
Point 124 30
Point 138 30
Point 183 15
Point ‐183 13.5
Point ‐44.5 13.5
Point ‐183 ‐14.5
Point ‐44.5 ‐14.5
Point ‐183 ‐114.5
Point ‐44.5 ‐114.5
Point 44.5 ‐14.5
Point 44.5 13.5
Point 25 7
Point ‐25 7
Point 44.5 ‐114.5
Point 183 13.5
Point 183 ‐14.5
Point 183 ‐114.5
Point ‐64 19.9763
Point 64 20
Point ‐174 18
Point 174 18
Point 1,200 15
Point 1,200 13.5
Point 1,200 ‐14.5
Point 1,200 ‐114.5
Point ‐1,200 15
Point ‐1,200 13.5
Point ‐1,200 ‐14.5
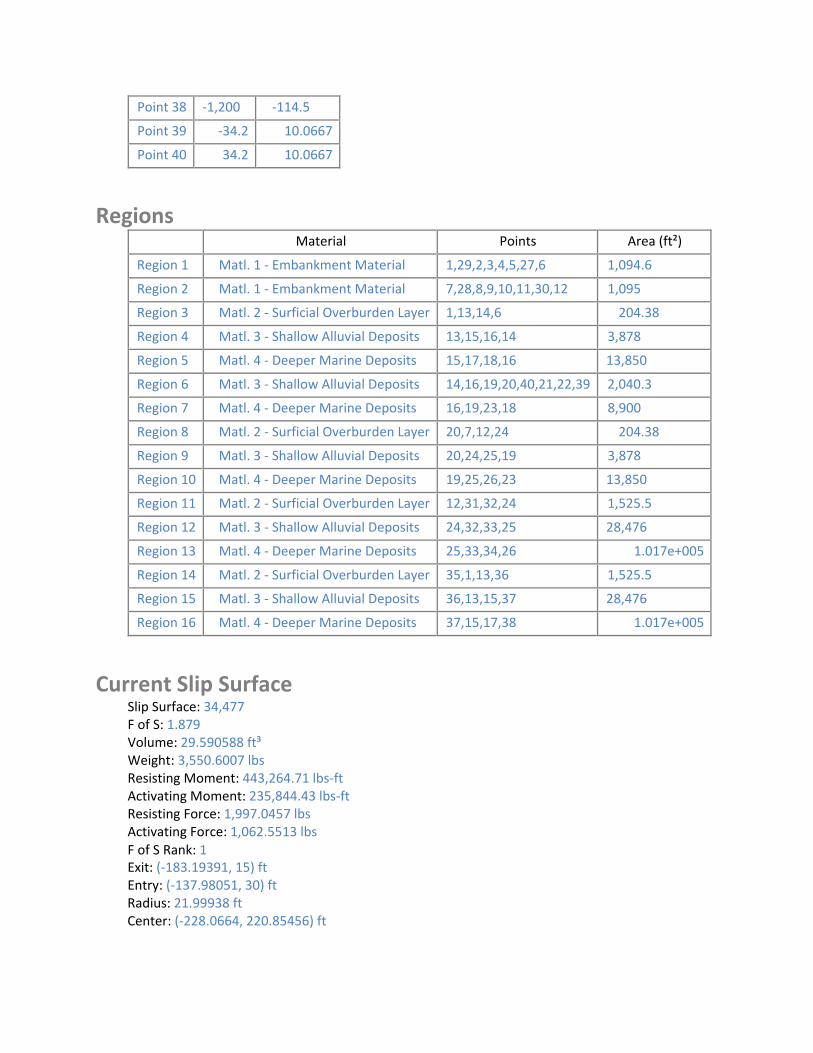
I I I
Point 38 ‐1,200 ‐114.5
Point 39 ‐34.2 10.0667
Point 40 34.2 10.0667
Regions Material Points Area (ft²)
Region 1 Matl. 1 ‐ Embankment Material 1,29,2,3,4,5,27,6 1,094.6
Region 2 Matl. 1 ‐ Embankment Material 7,28,8,9,10,11,30,12 1,095
Region 3 Matl. 2 ‐ Surficial Overburden Layer 1,13,14,6 204.38
Region 4 Matl. 3 ‐ Shallow Alluvial Deposits 13,15,16,14 3,878
Region 5 Matl. 4 ‐ Deeper Marine Deposits 15,17,18,16 13,850
Region 6 Matl. 3 ‐ Shallow Alluvial Deposits 14,16,19,20,40,21,22,39 2,040.3
Region 7 Matl. 4 ‐ Deeper Marine Deposits 16,19,23,18 8,900
Region 8 Matl. 2 ‐ Surficial Overburden Layer 20,7,12,24 204.38
Region 9 Matl. 3 ‐ Shallow Alluvial Deposits 20,24,25,19 3,878
Region 10 Matl. 4 ‐ Deeper Marine Deposits 19,25,26,23 13,850
Region 11 Matl. 2 ‐ Surficial Overburden Layer 12,31,32,24 1,525.5
Region 12 Matl. 3 ‐ Shallow Alluvial Deposits 24,32,33,25 28,476
Region 13 Matl. 4 ‐ Deeper Marine Deposits 25,33,34,26 1.017e+005
Region 14 Matl. 2 ‐ Surficial Overburden Layer 35,1,13,36 1,525.5
Region 15 Matl. 3 ‐ Shallow Alluvial Deposits 36,13,15,37 28,476
Region 16 Matl. 4 ‐ Deeper Marine Deposits 37,15,17,38 1.017e+005
Current Slip Surface Slip Surface: 34,477 F of S: 1.879 Volume: 29.590588 ft³ Weight: 3,550.6007 lbs Resisting Moment: 443,264.71 lbs‐ft Activating Moment: 235,844.43 lbs‐ft Resisting Force: 1,997.0457 lbs Activating Force: 1,062.5513 lbs F of S Rank: 1 Exit: (‐183.19391, 15) ft Entry: (‐137.98051, 30) ft Radius: 21.99938 ft Center: (‐228.0664, 220.85456) ft
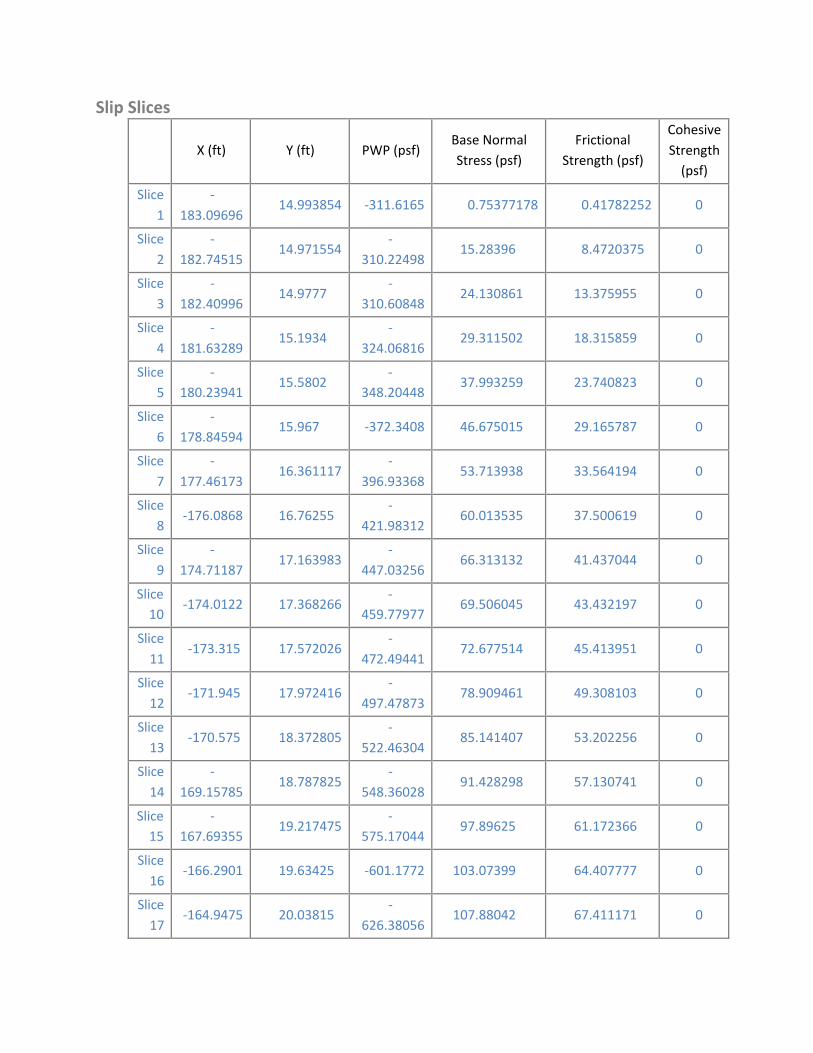
Slip Slices
X (ft) Y (ft) PWP (psf) Base Normal
Stress (psf)
Frictional
Strength (psf)
Cohesive
Strength (psf)
Slice
1
‐
183.09696 14.993854 ‐311.6165 0.75377178 0.41782252 0
Slice
2
‐
182.74515 14.971554
‐
310.22498 15.28396 8.4720375 0
Slice
3
‐
182.40996 14.9777
‐
310.60848 24.130861 13.375955 0
Slice
4
‐
181.63289 15.1934
‐
324.06816 29.311502 18.315859 0
Slice
5
‐
180.23941 15.5802
‐
348.20448 37.993259 23.740823 0
Slice
6
‐
178.84594 15.967 ‐372.3408 46.675015 29.165787 0
Slice
7
‐
177.46173 16.361117
‐
396.93368 53.713938 33.564194 0
Slice
8 ‐176.0868 16.76255
‐
421.98312 60.013535 37.500619 0
Slice
9
‐
174.71187 17.163983
‐
447.03256 66.313132 41.437044 0
Slice 10
‐174.0122 17.368266 ‐
459.77977 69.506045 43.432197 0
Slice
11 ‐173.315 17.572026
‐
472.49441 72.677514 45.413951 0
Slice
12 ‐171.945 17.972416
‐
497.47873 78.909461 49.308103 0
Slice
13 ‐170.575 18.372805
‐
522.46304 85.141407 53.202256 0
Slice
14
‐
169.15785 18.787825
‐
548.36028 91.428298 57.130741 0
Slice 15
‐
167.69355 19.217475
‐
575.17044 97.89625 61.172366 0
Slice
16 ‐166.2901 19.63425 ‐601.1772 103.07399 64.407777 0
Slice
17 ‐164.9475 20.03815
‐
626.38056 107.88042 67.411171 0
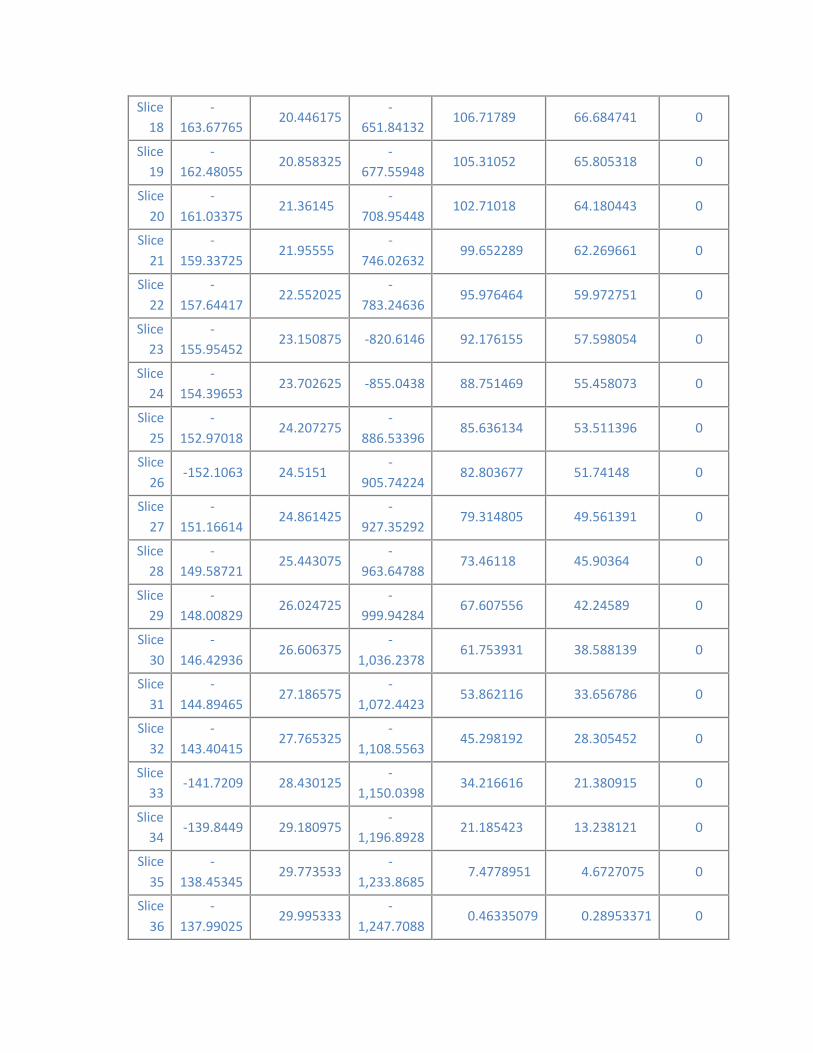
18
19
20
21
22
23
24
25
26
27
28
29
30
31
32
33
34
35
36
Slice ‐
163.67765 20.446175
‐
651.84132 106.71789 66.684741 0
Slice ‐
162.48055 20.858325
‐
677.55948 105.31052 65.805318 0
Slice ‐
161.03375 21.36145
‐
708.95448 102.71018 64.180443 0
Slice ‐
159.33725 21.95555
‐
746.02632 99.652289 62.269661 0
Slice ‐
157.64417 22.552025
‐
783.24636 95.976464 59.972751 0
Slice ‐
155.95452 23.150875 ‐820.6146 92.176155 57.598054 0
Slice ‐
154.39653 23.702625 ‐855.0438 88.751469 55.458073 0
Slice ‐
152.97018 24.207275
‐
886.53396 85.636134 53.511396 0
Slice ‐152.1063 24.5151
‐
905.74224 82.803677 51.74148 0
Slice ‐
151.16614 24.861425
‐
927.35292 79.314805 49.561391 0
Slice ‐
149.58721 25.443075
‐
963.64788 73.46118 45.90364 0
Slice ‐
148.00829 26.024725
‐
999.94284 67.607556 42.24589 0
Slice ‐
146.42936 26.606375
‐
1,036.2378 61.753931 38.588139 0
Slice ‐
144.89465 27.186575
‐
1,072.4423 53.862116 33.656786 0
Slice ‐
143.40415 27.765325
‐
1,108.5563 45.298192 28.305452 0
Slice ‐141.7209 28.430125
‐
1,150.0398 34.216616 21.380915 0
Slice ‐139.8449 29.180975
‐
1,196.8928 21.185423 13.238121 0
Slice ‐
138.45345 29.773533
‐
1,233.8685 7.4778951 4.6727075 0
Slice ‐
137.99025 29.995333
‐
1,247.7088 0.46335079 0.28953371 0
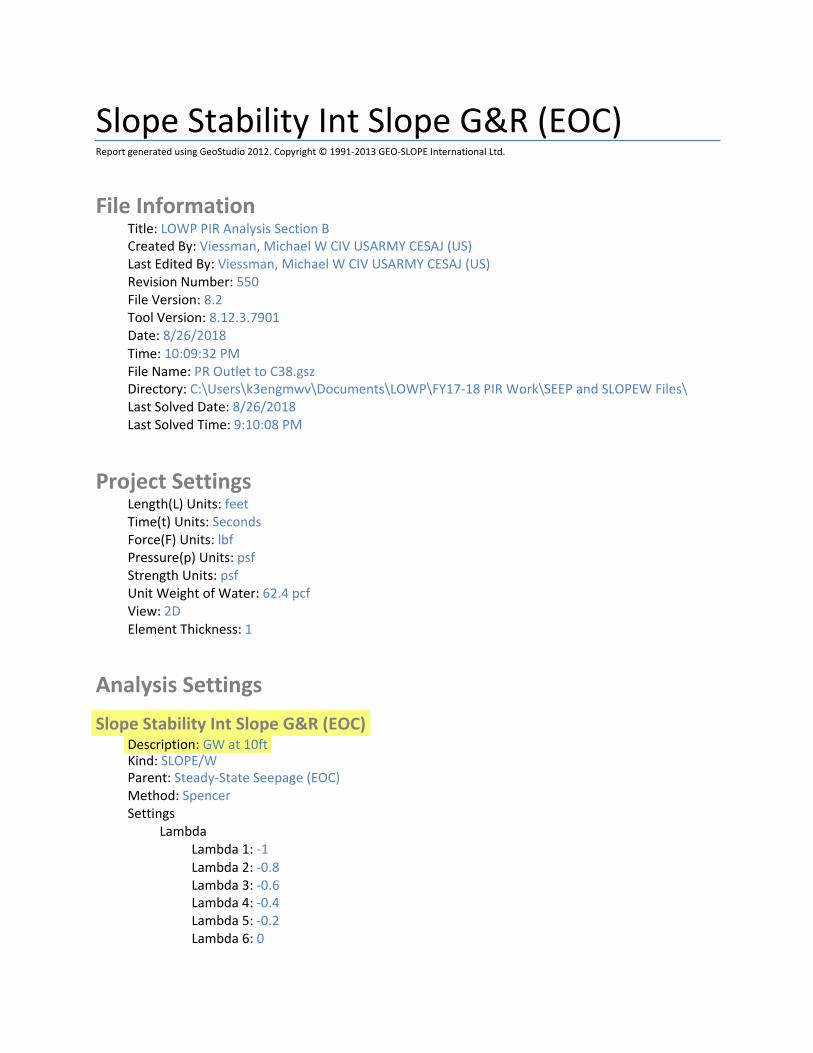
Slope Stability Int Slope G&R (EOC) Report generated using GeoStudio 2012. Copyright © 1991‐2013 GEO‐SLOPE International Ltd.
File Information Title: LOWP PIR Analysis Section B Created By: Viessman, Michael W CIV USARMY CESAJ (US) Last Edited By: Viessman, Michael W CIV USARMY CESAJ (US) Revision Number: 550 File Version: 8.2 Tool Version: 8.12.3.7901 Date: 8/26/2018 Time: 10:09:32 PM File Name: PR Outlet to C38.gsz Directory: C:\Users\k3engmwv\Documents\LOWP\FY17‐18 PIR Work\SEEP and SLOPEW Files\ Last Solved Date: 8/26/2018 Last Solved Time: 9:10:08 PM
Project Settings Length(L) Units: feet Time(t) Units: Seconds Force(F) Units: lbf Pressure(p) Units: psf Strength Units: psf Unit Weight of Water: 62.4 pcf View: 2D Element Thickness: 1
Analysis Settings
Slope Stability Int Slope G&R (EOC) Description: GW at 10ft Kind: SLOPE/W Parent: Steady‐State Seepage (EOC) Method: Spencer Settings
Lambda Lambda 1: ‐1 Lambda 2: ‐0.8 Lambda 3: ‐0.6 Lambda 4: ‐0.4 Lambda 5: ‐0.2 Lambda 6: 0

Lambda 7: 0.2 Lambda 8: 0.4 Lambda 9: 0.6 Lambda 10: 0.8 Lambda 11: 1
PWP Conditions Source: Parent Analysis Slip Surface
Direction of movement: Left to Right Use Passive Mode: No Slip Surface Option: Grid and Radius Critical slip surfaces saved: 1 Optimize Critical Slip Surface Location: Yes Tension Crack
Tension Crack Option: (none) F of S Distribution
F of S Calculation Option: Constant Advanced
Number of Slices: 30 F of S Tolerance: 0.001 Minimum Slip Surface Depth: 1 ft Optimization Maximum Iterations: 2,000 Optimization Convergence Tolerance: 1e‐007 Starting Optimization Points: 8 Ending Optimization Points: 16 Complete Passes per Insertion: 1 Driving Side Maximum Convex Angle: 5 ° Resisting Side Maximum Convex Angle: 1 °
Materials
Matl. 1 ‐ Embankment Material Model: Mohr‐Coulomb Unit Weight: 125 pcf Cohesion': 0 psf Phi': 32 ° Phi‐B: 0 ° Constant Unit Wt. Above Water Table: 120 pcf
Matl. 2 ‐ Surficial Overburden Layer Model: Mohr‐Coulomb Unit Weight: 109 pcf Cohesion': 0 psf Phi': 29 ° Phi‐B: 0 ° Constant Unit Wt. Above Water Table: 106 pcf

Matl. 3 ‐ Shallow Alluvial Deposits Model: Mohr‐Coulomb Unit Weight: 123 pcf Cohesion': 0 psf Phi': 30 ° Phi‐B: 0 °
Matl. 4 ‐ Deeper Marine Deposits Model: Mohr‐Coulomb Unit Weight: 125 pcf Cohesion': 0 psf Phi': 33 ° Phi‐B: 0 °
Slip Surface Grid Upper Left: (‐63.4639, 97.2947) ft Lower Left: (‐63.4639, 19.2108) ft Lower Right: (43.4033, 19.2108) ft Grid Horizontal Increment: 25 Grid Vertical Increment: 25 Left Projection Angle: 0 ° Right Projection Angle: 0 °
Slip Surface Radius Upper Left Coordinate: (‐140.2029, 30.2347) ft Upper Right Coordinate: (‐9.3618, 30.4036) ft Lower Left Coordinate: (‐140.08, ‐9.2305) ft Lower Right Coordinate: (‐10.3134, ‐9.4416) ft Number of Increments: 50 Left Projection: No Left Projection Angle: 135 ° Right Projection: No Right Projection Angle: 45 °
Slip Surface Limits Left Coordinate: (‐1,200, 15) ft Right Coordinate: (1,200, 15) ft
Points X (ft) Y (ft)
Point 1 ‐183 15

2
3
4
5
6
7
8
9
10
11
12
13
14
15
16
17
18
19
20
21
22
23
24
25
26
27
28
29
30
31
32
33
34
35
36
37
Point ‐138 30
Point ‐124 30
Point ‐100 22
Point ‐70.1 22
Point ‐49 15
Point 49 15
Point 70 22
Point 100 22
Point 124 30
Point 138 30
Point 183 15
Point ‐183 13.5
Point ‐44.5 13.5
Point ‐183 ‐14.5
Point ‐44.5 ‐14.5
Point ‐183 ‐114.5
Point ‐44.5 ‐114.5
Point 44.5 ‐14.5
Point 44.5 13.5
Point 25 7
Point ‐25 7
Point 44.5 ‐114.5
Point 183 13.5
Point 183 ‐14.5
Point 183 ‐114.5
Point ‐64 19.9763
Point 64 20
Point ‐174 18
Point 174 18
Point 1,200 15
Point 1,200 13.5
Point 1,200 ‐14.5
Point 1,200 ‐114.5
Point ‐1,200 15
Point ‐1,200 13.5
Point ‐1,200 ‐14.5

I I I
Point 38 ‐1,200 ‐114.5
Point 39 ‐34.2 10.0667
Point 40 34.2 10.0667
Regions Material Points Area (ft²)
Region 1 Matl. 1 ‐ Embankment Material 1,29,2,3,4,5,27,6 1,094.6
Region 2 Matl. 1 ‐ Embankment Material 7,28,8,9,10,11,30,12 1,095
Region 3 Matl. 2 ‐ Surficial Overburden Layer 1,13,14,6 204.38
Region 4 Matl. 3 ‐ Shallow Alluvial Deposits 13,15,16,14 3,878
Region 5 Matl. 4 ‐ Deeper Marine Deposits 15,17,18,16 13,850
Region 6 Matl. 3 ‐ Shallow Alluvial Deposits 14,16,19,20,40,21,22,39 2,040.3
Region 7 Matl. 4 ‐ Deeper Marine Deposits 16,19,23,18 8,900
Region 8 Matl. 2 ‐ Surficial Overburden Layer 20,7,12,24 204.38
Region 9 Matl. 3 ‐ Shallow Alluvial Deposits 20,24,25,19 3,878
Region 10 Matl. 4 ‐ Deeper Marine Deposits 19,25,26,23 13,850
Region 11 Matl. 2 ‐ Surficial Overburden Layer 12,31,32,24 1,525.5
Region 12 Matl. 3 ‐ Shallow Alluvial Deposits 24,32,33,25 28,476
Region 13 Matl. 4 ‐ Deeper Marine Deposits 25,33,34,26 1.017e+005
Region 14 Matl. 2 ‐ Surficial Overburden Layer 35,1,13,36 1,525.5
Region 15 Matl. 3 ‐ Shallow Alluvial Deposits 36,13,15,37 28,476
Region 16 Matl. 4 ‐ Deeper Marine Deposits 37,15,17,38 1.017e+005
Current Slip Surface Slip Surface: 4,415 F of S: 1.590 Volume: 13.381281 ft³ Weight: 1,645.8976 lbs Resisting Moment: 13,305.242 lbs‐ft Activating Moment: 8,366.479 lbs‐ft Resisting Force: 602.22004 lbs Activating Force: 378.6864 lbs F of S Rank: 2 Exit: (‐28.351716, 8.1172507) ft Entry: (‐42.2763, 12.758774) ft Radius: 20.484049 ft Center: (‐29.266396, 28.580868) ft
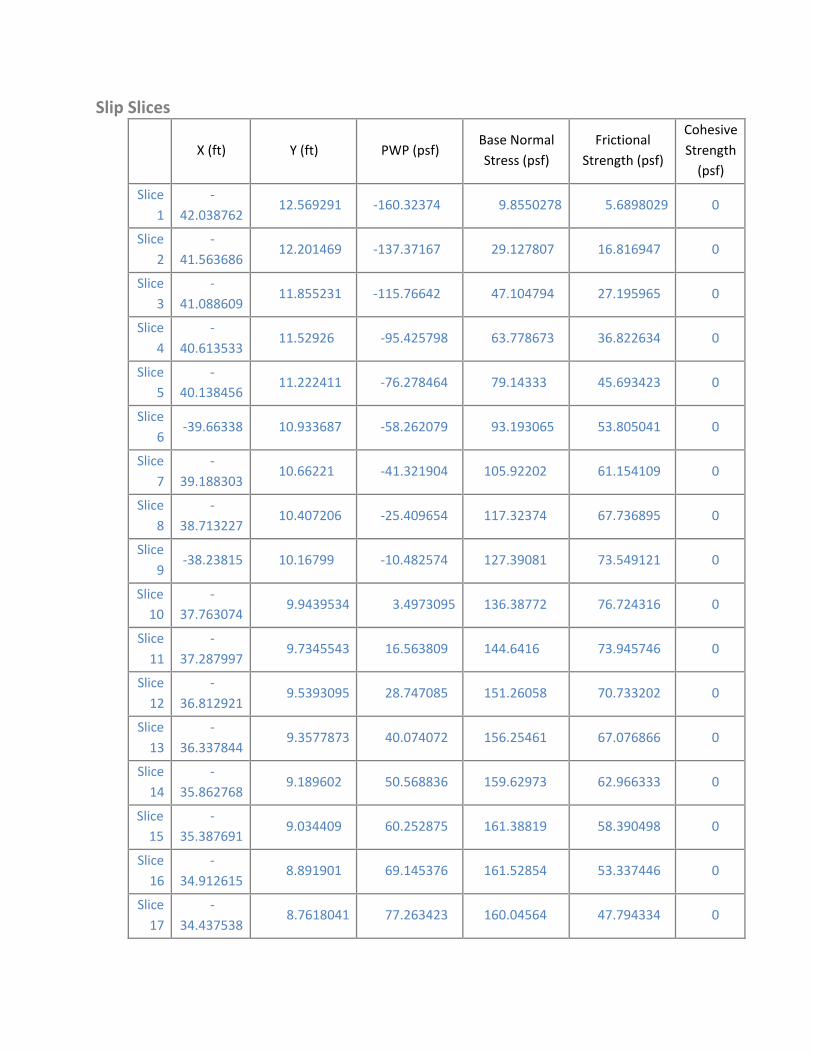
Slip Slices
X (ft) Y (ft) PWP (psf) Base Normal
Stress (psf)
Frictional
Strength (psf)
Cohesive
Strength (psf)
Slice
1
‐
42.038762 12.569291 ‐160.32374 9.8550278 5.6898029 0
Slice
2
‐
41.563686 12.201469 ‐137.37167 29.127807 16.816947 0
Slice
3
‐
41.088609 11.855231 ‐115.76642 47.104794 27.195965 0
Slice
4
‐
40.613533 11.52926 ‐95.425798 63.778673 36.822634 0
Slice
5
‐
40.138456 11.222411 ‐76.278464 79.14333 45.693423 0
Slice
6 ‐39.66338 10.933687 ‐58.262079 93.193065 53.805041 0
Slice
7
‐
39.188303 10.66221 ‐41.321904 105.92202 61.154109 0
Slice
8
‐
38.713227 10.407206 ‐25.409654 117.32374 67.736895 0
Slice
9 ‐38.23815 10.16799 ‐10.482574 127.39081 73.549121 0
Slice 10
‐
37.763074 9.9439534 3.4973095 136.38772 76.724316 0
Slice
11
‐
37.287997 9.7345543 16.563809 144.6416 73.945746 0
Slice
12
‐
36.812921 9.5393095 28.747085 151.26058 70.733202 0
Slice
13
‐
36.337844 9.3577873 40.074072 156.25461 67.076866 0
Slice
14
‐
35.862768 9.189602 50.568836 159.62973 62.966333 0
Slice 15
‐
35.387691 9.034409 60.252875 161.38819 58.390498 0
Slice
16
‐
34.912615 8.891901 69.145376 161.52854 53.337446 0
Slice
17
‐
34.437538 8.7618041 77.263423 160.04564 47.794334 0
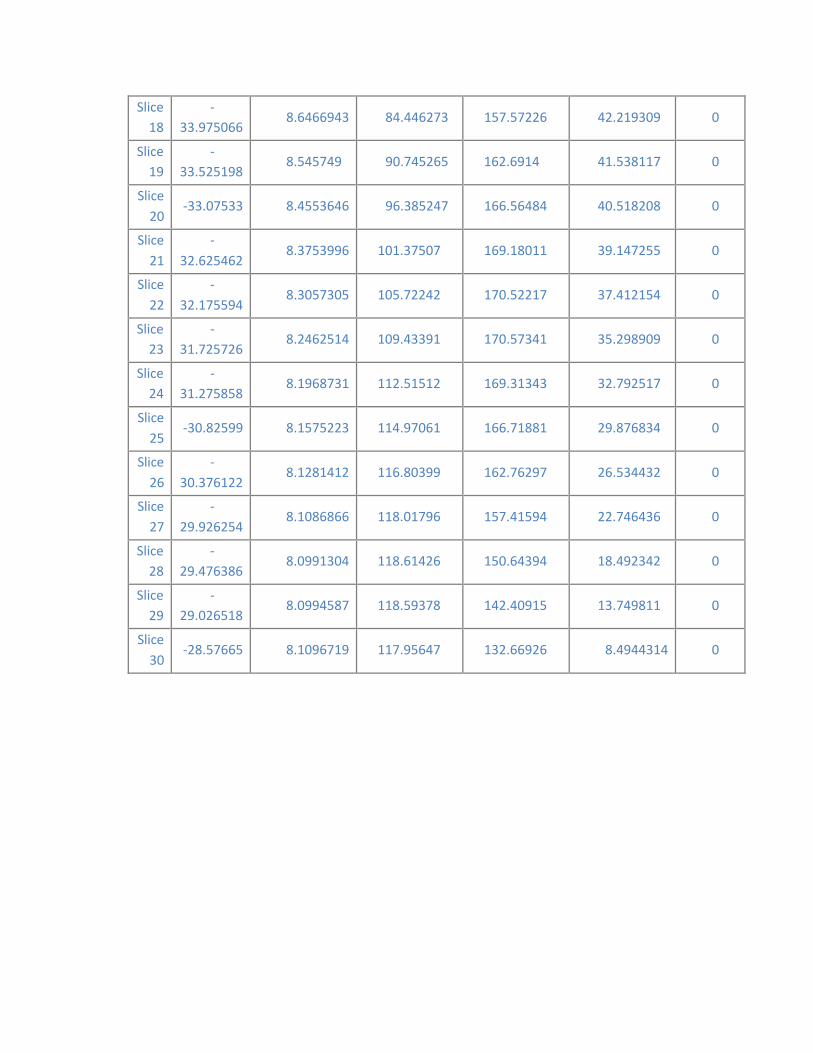
18
19
20
21
22
23
24
25
26
27
28
29
30
Slice ‐
33.975066 8.6466943 84.446273 157.57226 42.219309 0
Slice ‐
33.525198 8.545749 90.745265 162.6914 41.538117 0
Slice ‐33.07533 8.4553646 96.385247 166.56484 40.518208 0
Slice ‐
32.625462 8.3753996 101.37507 169.18011 39.147255 0
Slice ‐
32.175594 8.3057305 105.72242 170.52217 37.412154 0
Slice ‐
31.725726 8.2462514 109.43391 170.57341 35.298909 0
Slice ‐
31.275858 8.1968731 112.51512 169.31343 32.792517 0
Slice ‐30.82599 8.1575223 114.97061 166.71881 29.876834 0
Slice ‐
30.376122 8.1281412 116.80399 162.76297 26.534432 0
Slice ‐
29.926254 8.1086866 118.01796 157.41594 22.746436 0
Slice ‐
29.476386 8.0991304 118.61426 150.64394 18.492342 0
Slice ‐
29.026518 8.0994587 118.59378 142.40915 13.749811 0
Slice ‐28.57665 8.1096719 117.95647 132.66926 8.4944314 0
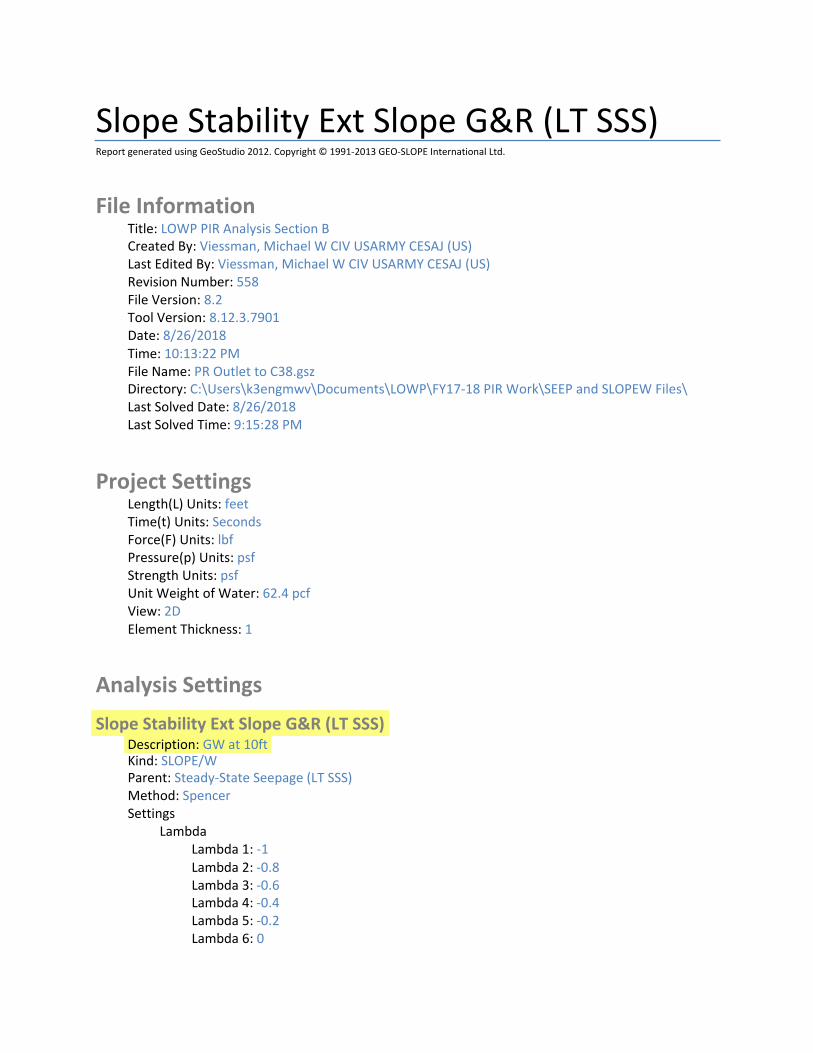
Slope Stability Ext Slope G&R (LT SSS) Report generated using GeoStudio 2012. Copyright © 1991‐2013 GEO‐SLOPE International Ltd.
File Information Title: LOWP PIR Analysis Section B Created By: Viessman, Michael W CIV USARMY CESAJ (US) Last Edited By: Viessman, Michael W CIV USARMY CESAJ (US) Revision Number: 558 File Version: 8.2 Tool Version: 8.12.3.7901 Date: 8/26/2018 Time: 10:13:22 PM File Name: PR Outlet to C38.gsz Directory: C:\Users\k3engmwv\Documents\LOWP\FY17‐18 PIR Work\SEEP and SLOPEW Files\ Last Solved Date: 8/26/2018 Last Solved Time: 9:15:28 PM
Project Settings Length(L) Units: feet Time(t) Units: Seconds Force(F) Units: lbf Pressure(p) Units: psf Strength Units: psf Unit Weight of Water: 62.4 pcf View: 2D Element Thickness: 1
Analysis Settings
Slope Stability Ext Slope G&R (LT SSS) Description: GW at 10ft Kind: SLOPE/W Parent: Steady‐State Seepage (LT SSS) Method: Spencer Settings
Lambda Lambda 1: ‐1 Lambda 2: ‐0.8 Lambda 3: ‐0.6 Lambda 4: ‐0.4 Lambda 5: ‐0.2 Lambda 6: 0

Lambda 7: 0.2 Lambda 8: 0.4 Lambda 9: 0.6 Lambda 10: 0.8 Lambda 11: 1
PWP Conditions Source: Parent Analysis Slip Surface
Direction of movement: Right to Left Use Passive Mode: No Slip Surface Option: Grid and Radius Critical slip surfaces saved: 1 Optimize Critical Slip Surface Location: Yes Tension Crack
Tension Crack Option: (none) F of S Distribution
F of S Calculation Option: Constant Advanced
Number of Slices: 30 F of S Tolerance: 0.001 Minimum Slip Surface Depth: 1 ft Optimization Maximum Iterations: 2,000 Optimization Convergence Tolerance: 1e‐007 Starting Optimization Points: 8 Ending Optimization Points: 16 Complete Passes per Insertion: 1 Driving Side Maximum Convex Angle: 5 ° Resisting Side Maximum Convex Angle: 1 °
Materials
Matl. 1 ‐ Embankment Material Model: Mohr‐Coulomb Unit Weight: 125 pcf Cohesion': 0 psf Phi': 32 ° Phi‐B: 0 ° Constant Unit Wt. Above Water Table: 120 pcf
Matl. 2 ‐ Surficial Overburden Layer Model: Mohr‐Coulomb Unit Weight: 109 pcf Cohesion': 0 psf Phi': 29 ° Phi‐B: 0 ° Constant Unit Wt. Above Water Table: 106 pcf
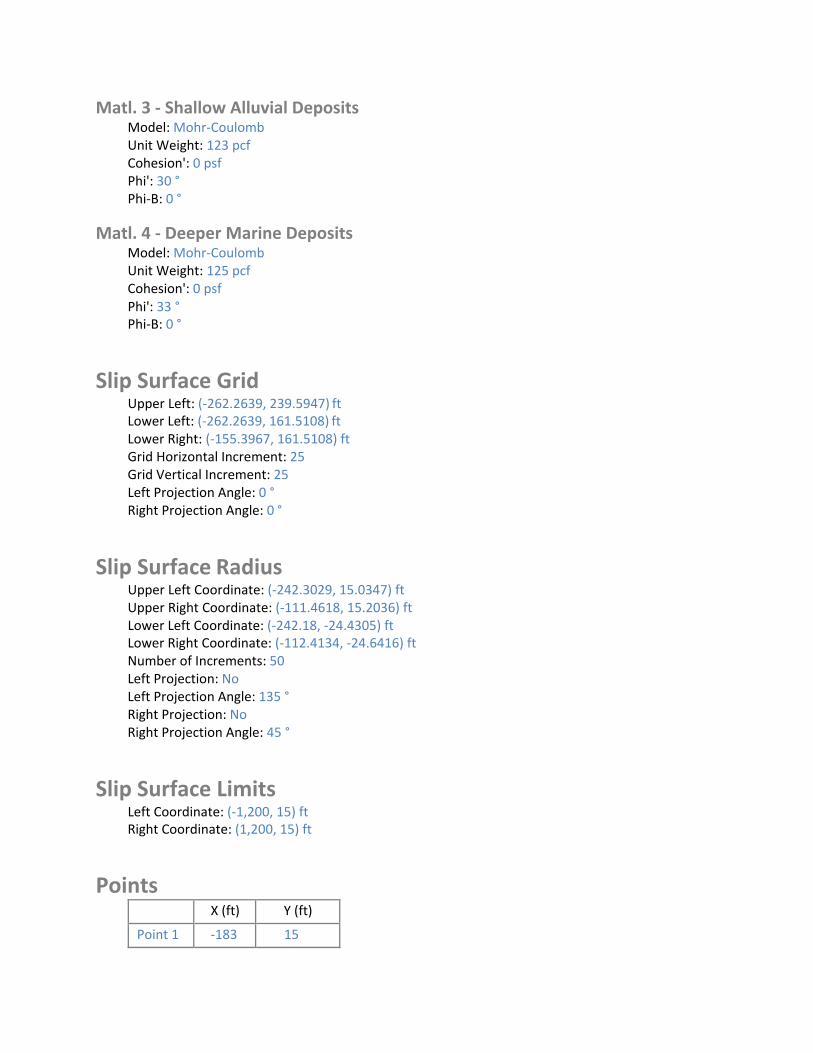
Matl. 3 ‐ Shallow Alluvial Deposits Model: Mohr‐Coulomb Unit Weight: 123 pcf Cohesion': 0 psf Phi': 30 ° Phi‐B: 0 °
Matl. 4 ‐ Deeper Marine Deposits Model: Mohr‐Coulomb Unit Weight: 125 pcf Cohesion': 0 psf Phi': 33 ° Phi‐B: 0 °
Slip Surface Grid Upper Left: (‐262.2639, 239.5947) ft Lower Left: (‐262.2639, 161.5108) ft Lower Right: (‐155.3967, 161.5108) ft Grid Horizontal Increment: 25 Grid Vertical Increment: 25 Left Projection Angle: 0 ° Right Projection Angle: 0 °
Slip Surface Radius Upper Left Coordinate: (‐242.3029, 15.0347) ft Upper Right Coordinate: (‐111.4618, 15.2036) ft Lower Left Coordinate: (‐242.18, ‐24.4305) ft Lower Right Coordinate: (‐112.4134, ‐24.6416) ft Number of Increments: 50 Left Projection: No Left Projection Angle: 135 ° Right Projection: No Right Projection Angle: 45 °
Slip Surface Limits Left Coordinate: (‐1,200, 15) ft Right Coordinate: (1,200, 15) ft
Points X (ft) Y (ft)
Point 1 ‐183 15
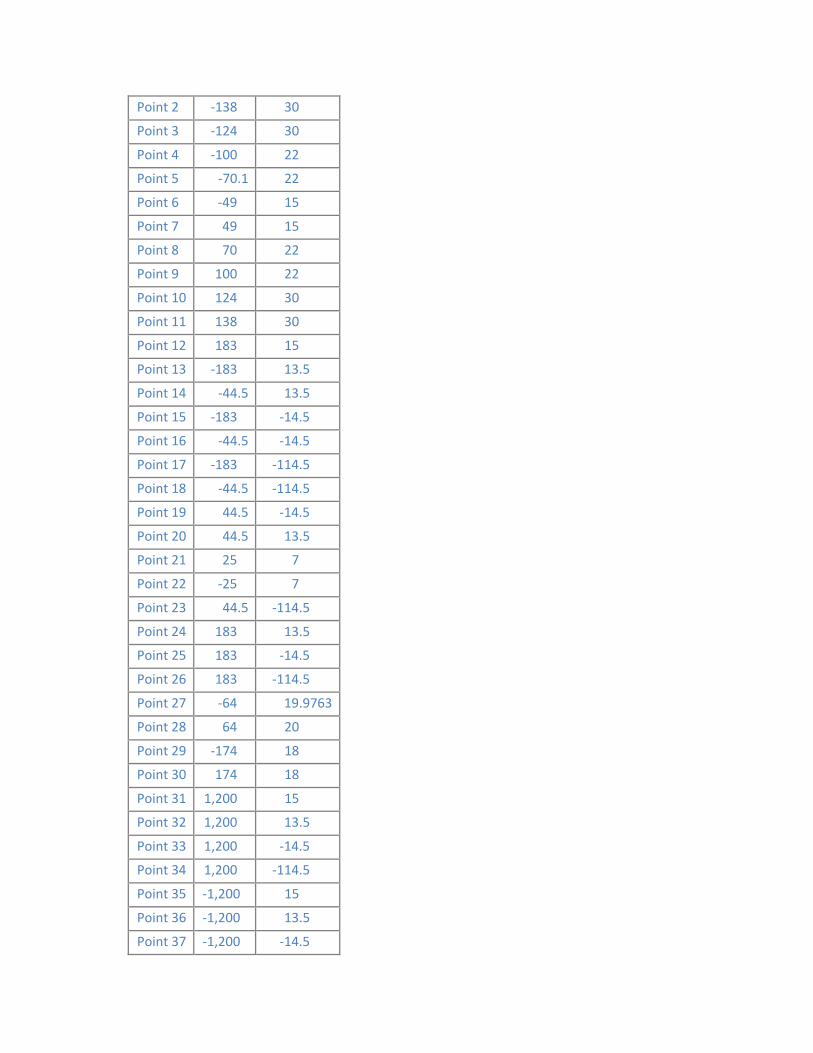
2
3
4
5
6
7
8
9
10
11
12
13
14
15
16
17
18
19
20
21
22
23
24
25
26
27
28
29
30
31
32
33
34
35
36
37
Point ‐138 30
Point ‐124 30
Point ‐100 22
Point ‐70.1 22
Point ‐49 15
Point 49 15
Point 70 22
Point 100 22
Point 124 30
Point 138 30
Point 183 15
Point ‐183 13.5
Point ‐44.5 13.5
Point ‐183 ‐14.5
Point ‐44.5 ‐14.5
Point ‐183 ‐114.5
Point ‐44.5 ‐114.5
Point 44.5 ‐14.5
Point 44.5 13.5
Point 25 7
Point ‐25 7
Point 44.5 ‐114.5
Point 183 13.5
Point 183 ‐14.5
Point 183 ‐114.5
Point ‐64 19.9763
Point 64 20
Point ‐174 18
Point 174 18
Point 1,200 15
Point 1,200 13.5
Point 1,200 ‐14.5
Point 1,200 ‐114.5
Point ‐1,200 15
Point ‐1,200 13.5
Point ‐1,200 ‐14.5
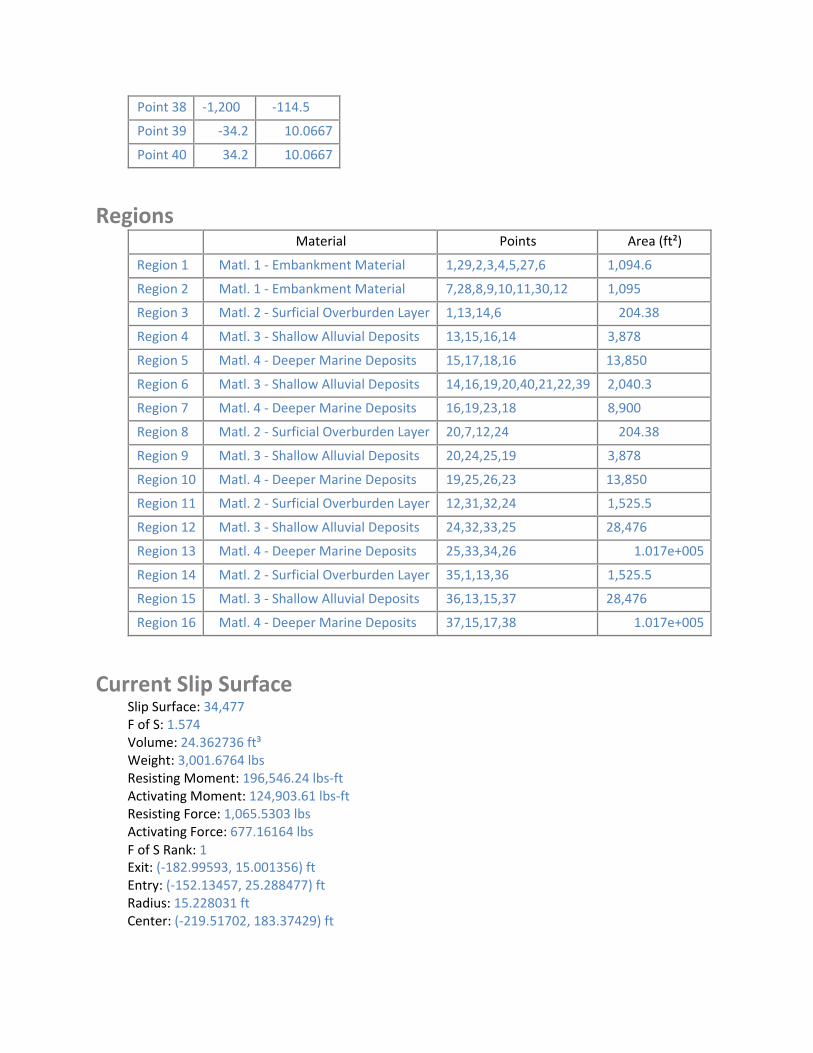
I I I
Point 38 ‐1,200 ‐114.5
Point 39 ‐34.2 10.0667
Point 40 34.2 10.0667
Regions Material Points Area (ft²)
Region 1 Matl. 1 ‐ Embankment Material 1,29,2,3,4,5,27,6 1,094.6
Region 2 Matl. 1 ‐ Embankment Material 7,28,8,9,10,11,30,12 1,095
Region 3 Matl. 2 ‐ Surficial Overburden Layer 1,13,14,6 204.38
Region 4 Matl. 3 ‐ Shallow Alluvial Deposits 13,15,16,14 3,878
Region 5 Matl. 4 ‐ Deeper Marine Deposits 15,17,18,16 13,850
Region 6 Matl. 3 ‐ Shallow Alluvial Deposits 14,16,19,20,40,21,22,39 2,040.3
Region 7 Matl. 4 ‐ Deeper Marine Deposits 16,19,23,18 8,900
Region 8 Matl. 2 ‐ Surficial Overburden Layer 20,7,12,24 204.38
Region 9 Matl. 3 ‐ Shallow Alluvial Deposits 20,24,25,19 3,878
Region 10 Matl. 4 ‐ Deeper Marine Deposits 19,25,26,23 13,850
Region 11 Matl. 2 ‐ Surficial Overburden Layer 12,31,32,24 1,525.5
Region 12 Matl. 3 ‐ Shallow Alluvial Deposits 24,32,33,25 28,476
Region 13 Matl. 4 ‐ Deeper Marine Deposits 25,33,34,26 1.017e+005
Region 14 Matl. 2 ‐ Surficial Overburden Layer 35,1,13,36 1,525.5
Region 15 Matl. 3 ‐ Shallow Alluvial Deposits 36,13,15,37 28,476
Region 16 Matl. 4 ‐ Deeper Marine Deposits 37,15,17,38 1.017e+005
Current Slip Surface Slip Surface: 34,477 F of S: 1.574 Volume: 24.362736 ft³ Weight: 3,001.6764 lbs Resisting Moment: 196,546.24 lbs‐ft Activating Moment: 124,903.61 lbs‐ft Resisting Force: 1,065.5303 lbs Activating Force: 677.16164 lbs F of S Rank: 1 Exit: (‐182.99593, 15.001356) ft Entry: (‐152.13457, 25.288477) ft Radius: 15.228031 ft Center: (‐219.51702, 183.37429) ft
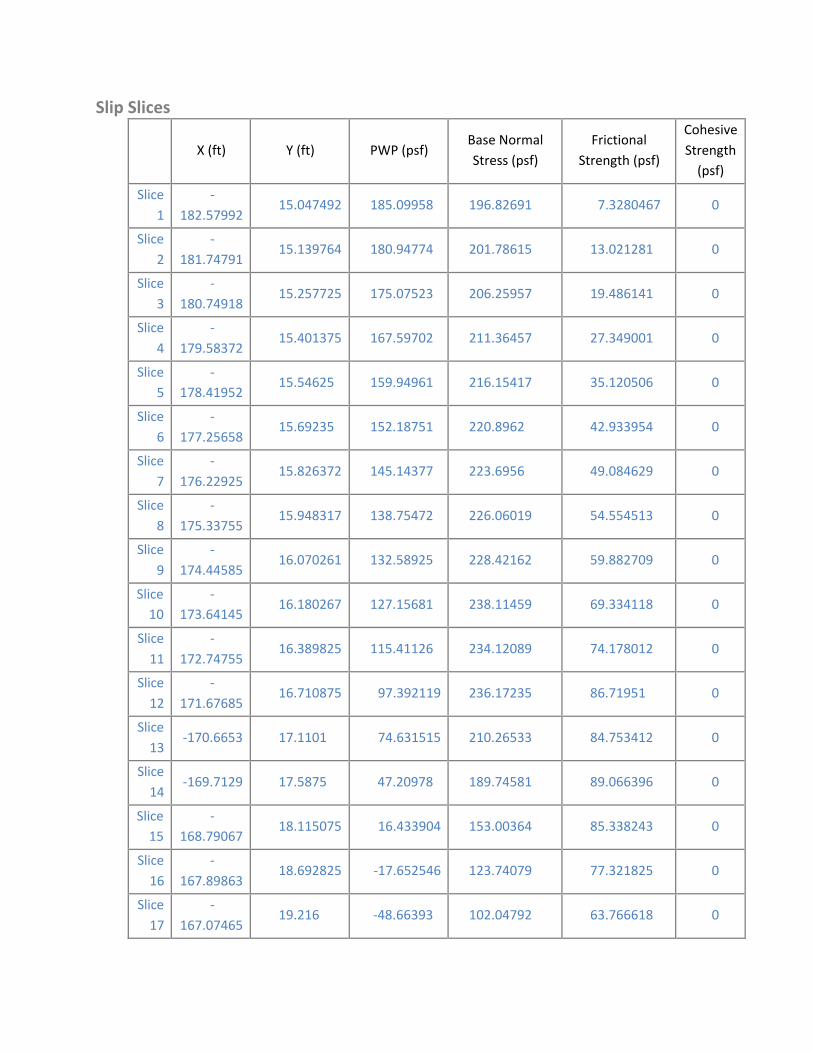
Slip Slices
X (ft) Y (ft) PWP (psf) Base Normal
Stress (psf)
Frictional
Strength (psf)
Cohesive
Strength (psf)
Slice
1
‐
182.57992 15.047492 185.09958 196.82691 7.3280467 0
Slice
2
‐
181.74791 15.139764 180.94774 201.78615 13.021281 0
Slice
3
‐
180.74918 15.257725 175.07523 206.25957 19.486141 0
Slice
4
‐
179.58372 15.401375 167.59702 211.36457 27.349001 0
Slice
5
‐
178.41952 15.54625 159.94961 216.15417 35.120506 0
Slice
6
‐
177.25658 15.69235 152.18751 220.8962 42.933954 0
Slice
7
‐
176.22925 15.826372 145.14377 223.6956 49.084629 0
Slice
8
‐
175.33755 15.948317 138.75472 226.06019 54.554513 0
Slice
9
‐
174.44585 16.070261 132.58925 228.42162 59.882709 0
Slice 10
‐
173.64145 16.180267 127.15681 238.11459 69.334118 0
Slice
11
‐
172.74755 16.389825 115.41126 234.12089 74.178012 0
Slice
12
‐
171.67685 16.710875 97.392119 236.17235 86.71951 0
Slice
13 ‐170.6653 17.1101 74.631515 210.26533 84.753412 0
Slice
14 ‐169.7129 17.5875 47.20978 189.74581 89.066396 0
Slice 15
‐
168.79067 18.115075 16.433904 153.00364 85.338243 0
Slice
16
‐
167.89863 18.692825 ‐17.652546 123.74079 77.321825 0
Slice
17
‐
167.07465 19.216 ‐48.66393 102.04792 63.766618 0
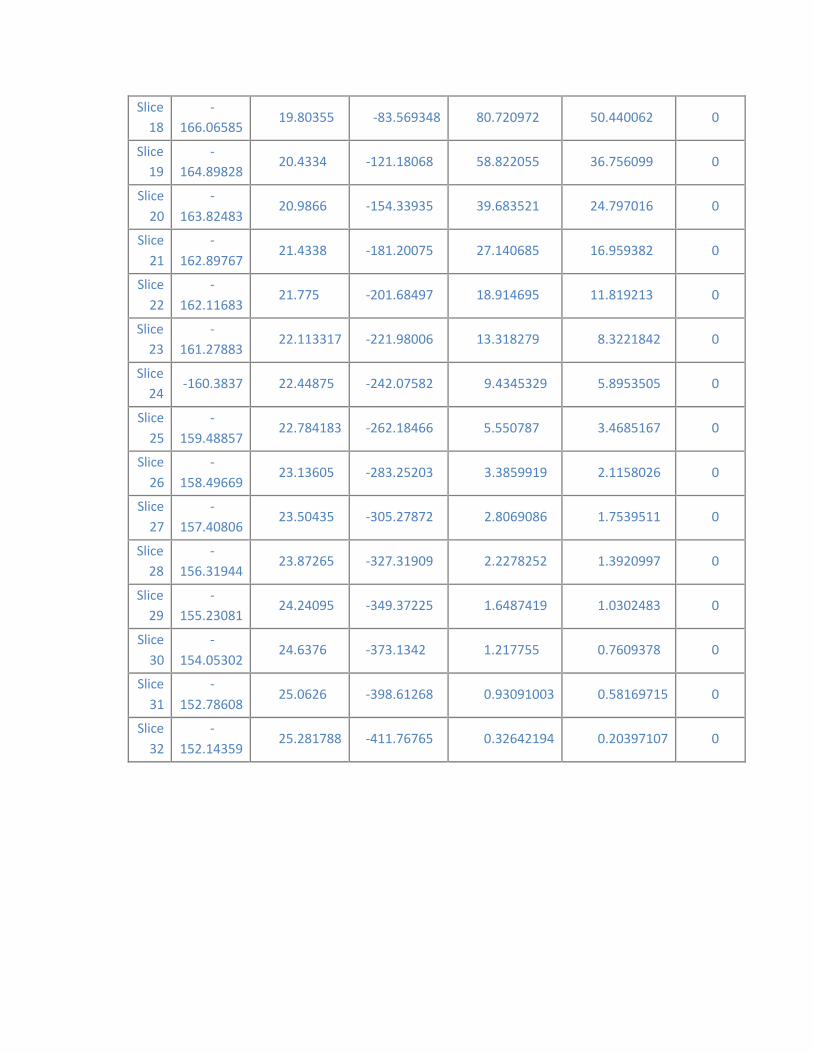
18
19
20
21
22
23
24
25
26
27
28
29
30
31
32
Slice ‐
166.06585 19.80355 ‐83.569348 80.720972 50.440062 0
Slice ‐
164.89828 20.4334 ‐121.18068 58.822055 36.756099 0
Slice ‐
163.82483 20.9866 ‐154.33935 39.683521 24.797016 0
Slice ‐
162.89767 21.4338 ‐181.20075 27.140685 16.959382 0
Slice ‐
162.11683 21.775 ‐201.68497 18.914695 11.819213 0
Slice ‐
161.27883 22.113317 ‐221.98006 13.318279 8.3221842 0
Slice ‐160.3837 22.44875 ‐242.07582 9.4345329 5.8953505 0
Slice ‐
159.48857 22.784183 ‐262.18466 5.550787 3.4685167 0
Slice ‐
158.49669 23.13605 ‐283.25203 3.3859919 2.1158026 0
Slice ‐
157.40806 23.50435 ‐305.27872 2.8069086 1.7539511 0
Slice ‐
156.31944 23.87265 ‐327.31909 2.2278252 1.3920997 0
Slice ‐
155.23081 24.24095 ‐349.37225 1.6487419 1.0302483 0
Slice ‐
154.05302 24.6376 ‐373.1342 1.217755 0.7609378 0
Slice ‐
152.78608 25.0626 ‐398.61268 0.93091003 0.58169715 0
Slice ‐
152.14359 25.281788 ‐411.76765 0.32642194 0.20397107 0
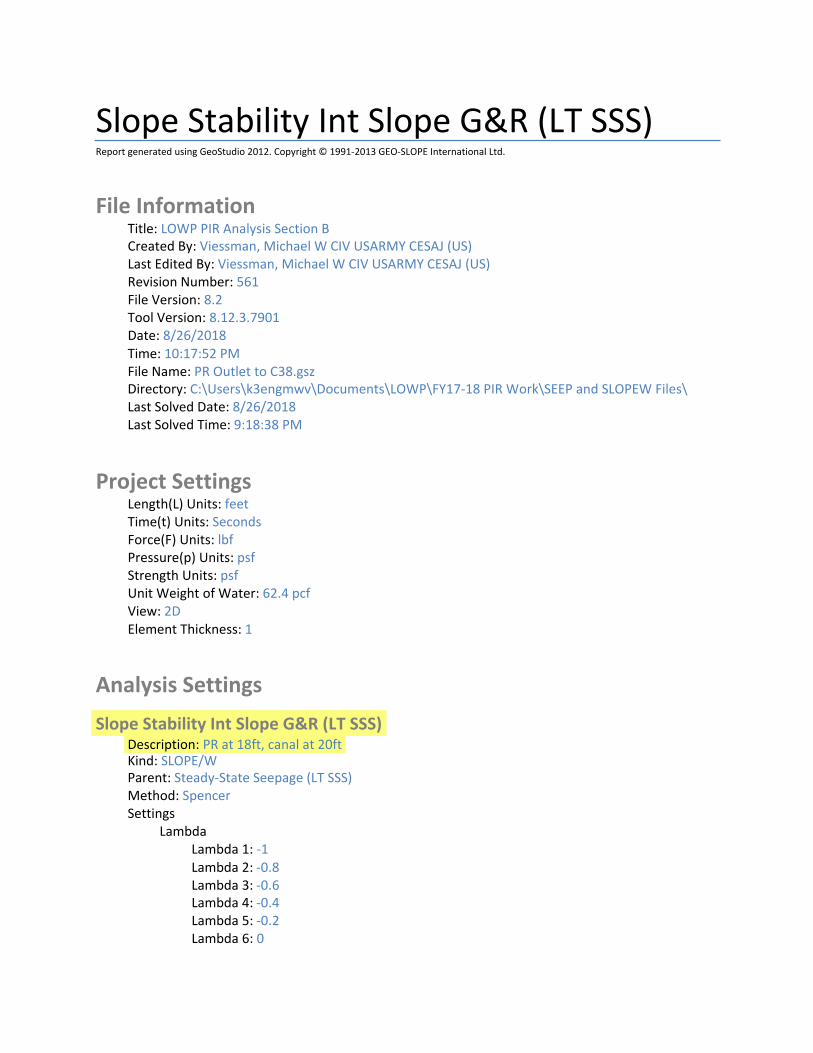
Slope Stability Int Slope G&R (LT SSS) Report generated using GeoStudio 2012. Copyright © 1991‐2013 GEO‐SLOPE International Ltd.
File Information Title: LOWP PIR Analysis Section B Created By: Viessman, Michael W CIV USARMY CESAJ (US) Last Edited By: Viessman, Michael W CIV USARMY CESAJ (US) Revision Number: 561 File Version: 8.2 Tool Version: 8.12.3.7901 Date: 8/26/2018 Time: 10:17:52 PM File Name: PR Outlet to C38.gsz Directory: C:\Users\k3engmwv\Documents\LOWP\FY17‐18 PIR Work\SEEP and SLOPEW Files\ Last Solved Date: 8/26/2018 Last Solved Time: 9:18:38 PM
Project Settings Length(L) Units: feet Time(t) Units: Seconds Force(F) Units: lbf Pressure(p) Units: psf Strength Units: psf Unit Weight of Water: 62.4 pcf View: 2D Element Thickness: 1
Analysis Settings
Slope Stability Int Slope G&R (LT SSS) Description: PR at 18ft, canal at 20ft Kind: SLOPE/W Parent: Steady‐State Seepage (LT SSS) Method: Spencer Settings
Lambda Lambda 1: ‐1 Lambda 2: ‐0.8 Lambda 3: ‐0.6 Lambda 4: ‐0.4 Lambda 5: ‐0.2 Lambda 6: 0
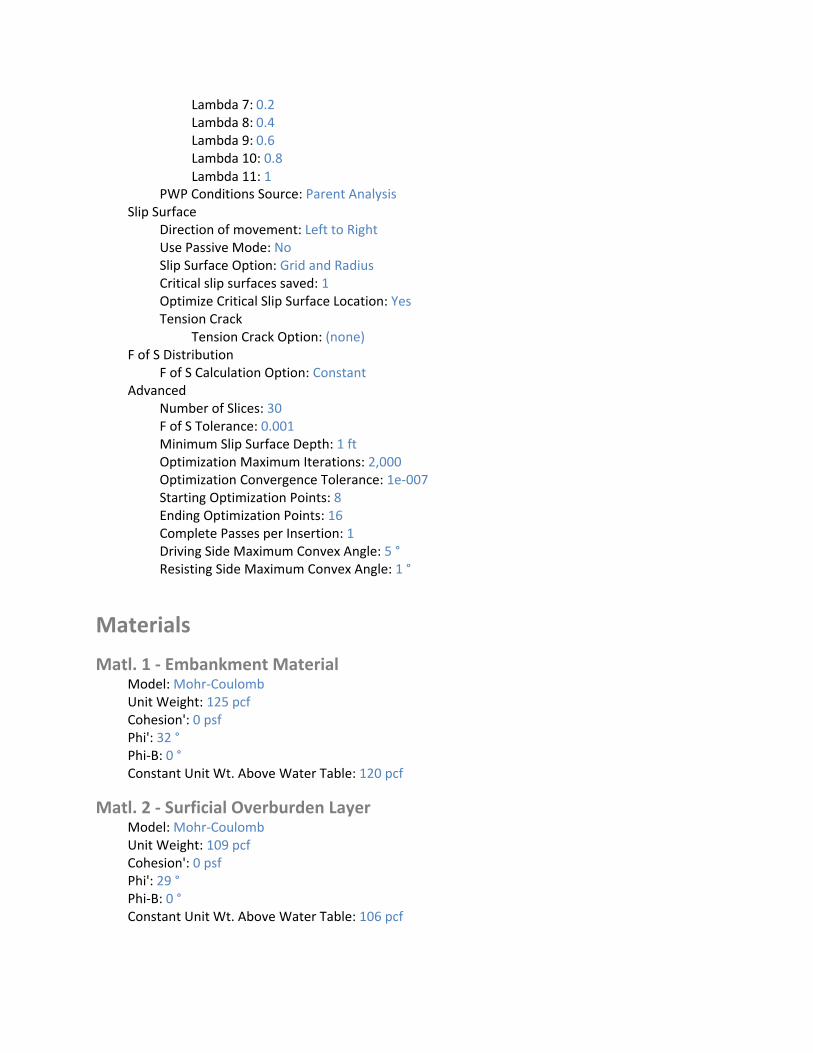
Lambda 7: 0.2 Lambda 8: 0.4 Lambda 9: 0.6 Lambda 10: 0.8 Lambda 11: 1
PWP Conditions Source: Parent Analysis Slip Surface
Direction of movement: Left to Right Use Passive Mode: No Slip Surface Option: Grid and Radius Critical slip surfaces saved: 1 Optimize Critical Slip Surface Location: Yes Tension Crack
Tension Crack Option: (none) F of S Distribution
F of S Calculation Option: Constant Advanced
Number of Slices: 30 F of S Tolerance: 0.001 Minimum Slip Surface Depth: 1 ft Optimization Maximum Iterations: 2,000 Optimization Convergence Tolerance: 1e‐007 Starting Optimization Points: 8 Ending Optimization Points: 16 Complete Passes per Insertion: 1 Driving Side Maximum Convex Angle: 5 ° Resisting Side Maximum Convex Angle: 1 °
Materials
Matl. 1 ‐ Embankment Material Model: Mohr‐Coulomb Unit Weight: 125 pcf Cohesion': 0 psf Phi': 32 ° Phi‐B: 0 ° Constant Unit Wt. Above Water Table: 120 pcf
Matl. 2 ‐ Surficial Overburden Layer Model: Mohr‐Coulomb Unit Weight: 109 pcf Cohesion': 0 psf Phi': 29 ° Phi‐B: 0 ° Constant Unit Wt. Above Water Table: 106 pcf
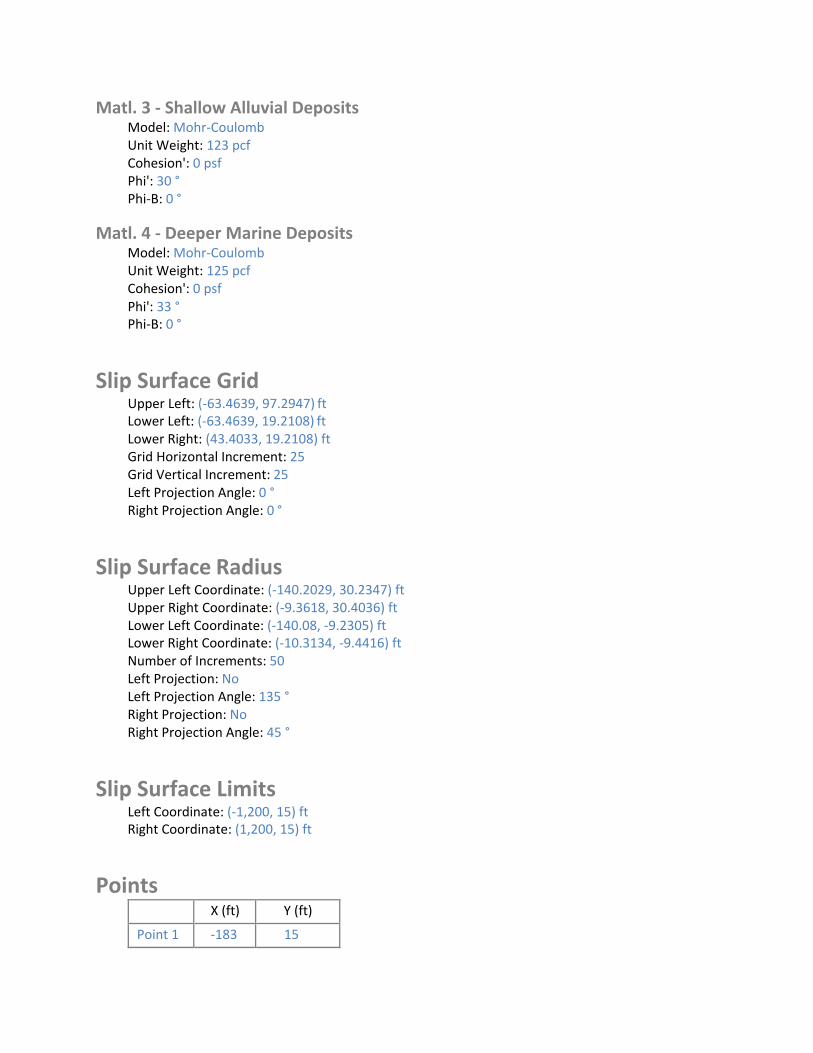
Matl. 3 ‐ Shallow Alluvial Deposits Model: Mohr‐Coulomb Unit Weight: 123 pcf Cohesion': 0 psf Phi': 30 ° Phi‐B: 0 °
Matl. 4 ‐ Deeper Marine Deposits Model: Mohr‐Coulomb Unit Weight: 125 pcf Cohesion': 0 psf Phi': 33 ° Phi‐B: 0 °
Slip Surface Grid Upper Left: (‐63.4639, 97.2947) ft Lower Left: (‐63.4639, 19.2108) ft Lower Right: (43.4033, 19.2108) ft Grid Horizontal Increment: 25 Grid Vertical Increment: 25 Left Projection Angle: 0 ° Right Projection Angle: 0 °
Slip Surface Radius Upper Left Coordinate: (‐140.2029, 30.2347) ft Upper Right Coordinate: (‐9.3618, 30.4036) ft Lower Left Coordinate: (‐140.08, ‐9.2305) ft Lower Right Coordinate: (‐10.3134, ‐9.4416) ft Number of Increments: 50 Left Projection: No Left Projection Angle: 135 ° Right Projection: No Right Projection Angle: 45 °
Slip Surface Limits Left Coordinate: (‐1,200, 15) ft Right Coordinate: (1,200, 15) ft
Points X (ft) Y (ft)
Point 1 ‐183 15

2
3
4
5
6
7
8
9
10
11
12
13
14
15
16
17
18
19
20
21
22
23
24
25
26
27
28
29
30
31
32
33
34
35
36
37
Point ‐138 30
Point ‐124 30
Point ‐100 22
Point ‐70.1 22
Point ‐49 15
Point 49 15
Point 70 22
Point 100 22
Point 124 30
Point 138 30
Point 183 15
Point ‐183 13.5
Point ‐44.5 13.5
Point ‐183 ‐14.5
Point ‐44.5 ‐14.5
Point ‐183 ‐114.5
Point ‐44.5 ‐114.5
Point 44.5 ‐14.5
Point 44.5 13.5
Point 25 7
Point ‐25 7
Point 44.5 ‐114.5
Point 183 13.5
Point 183 ‐14.5
Point 183 ‐114.5
Point ‐64 19.9763
Point 64 20
Point ‐174 18
Point 174 18
Point 1,200 15
Point 1,200 13.5
Point 1,200 ‐14.5
Point 1,200 ‐114.5
Point ‐1,200 15
Point ‐1,200 13.5
Point ‐1,200 ‐14.5
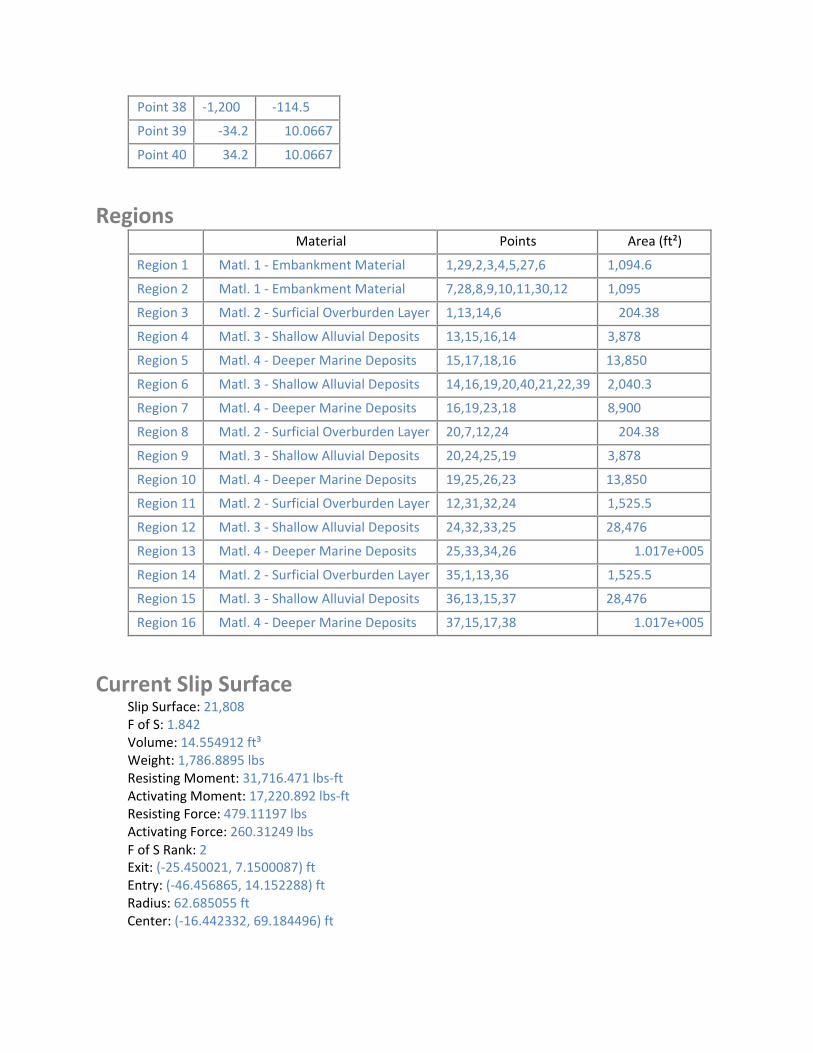
I I I
Point 38 ‐1,200 ‐114.5
Point 39 ‐34.2 10.0667
Point 40 34.2 10.0667
Regions Material Points Area (ft²)
Region 1 Matl. 1 ‐ Embankment Material 1,29,2,3,4,5,27,6 1,094.6
Region 2 Matl. 1 ‐ Embankment Material 7,28,8,9,10,11,30,12 1,095
Region 3 Matl. 2 ‐ Surficial Overburden Layer 1,13,14,6 204.38
Region 4 Matl. 3 ‐ Shallow Alluvial Deposits 13,15,16,14 3,878
Region 5 Matl. 4 ‐ Deeper Marine Deposits 15,17,18,16 13,850
Region 6 Matl. 3 ‐ Shallow Alluvial Deposits 14,16,19,20,40,21,22,39 2,040.3
Region 7 Matl. 4 ‐ Deeper Marine Deposits 16,19,23,18 8,900
Region 8 Matl. 2 ‐ Surficial Overburden Layer 20,7,12,24 204.38
Region 9 Matl. 3 ‐ Shallow Alluvial Deposits 20,24,25,19 3,878
Region 10 Matl. 4 ‐ Deeper Marine Deposits 19,25,26,23 13,850
Region 11 Matl. 2 ‐ Surficial Overburden Layer 12,31,32,24 1,525.5
Region 12 Matl. 3 ‐ Shallow Alluvial Deposits 24,32,33,25 28,476
Region 13 Matl. 4 ‐ Deeper Marine Deposits 25,33,34,26 1.017e+005
Region 14 Matl. 2 ‐ Surficial Overburden Layer 35,1,13,36 1,525.5
Region 15 Matl. 3 ‐ Shallow Alluvial Deposits 36,13,15,37 28,476
Region 16 Matl. 4 ‐ Deeper Marine Deposits 37,15,17,38 1.017e+005
Current Slip Surface Slip Surface: 21,808 F of S: 1.842 Volume: 14.554912 ft³ Weight: 1,786.8895 lbs Resisting Moment: 31,716.471 lbs‐ft Activating Moment: 17,220.892 lbs‐ft Resisting Force: 479.11197 lbs Activating Force: 260.31249 lbs F of S Rank: 2 Exit: (‐25.450021, 7.1500087) ft Entry: (‐46.456865, 14.152288) ft Radius: 62.685055 ft Center: (‐16.442332, 69.184496) ft
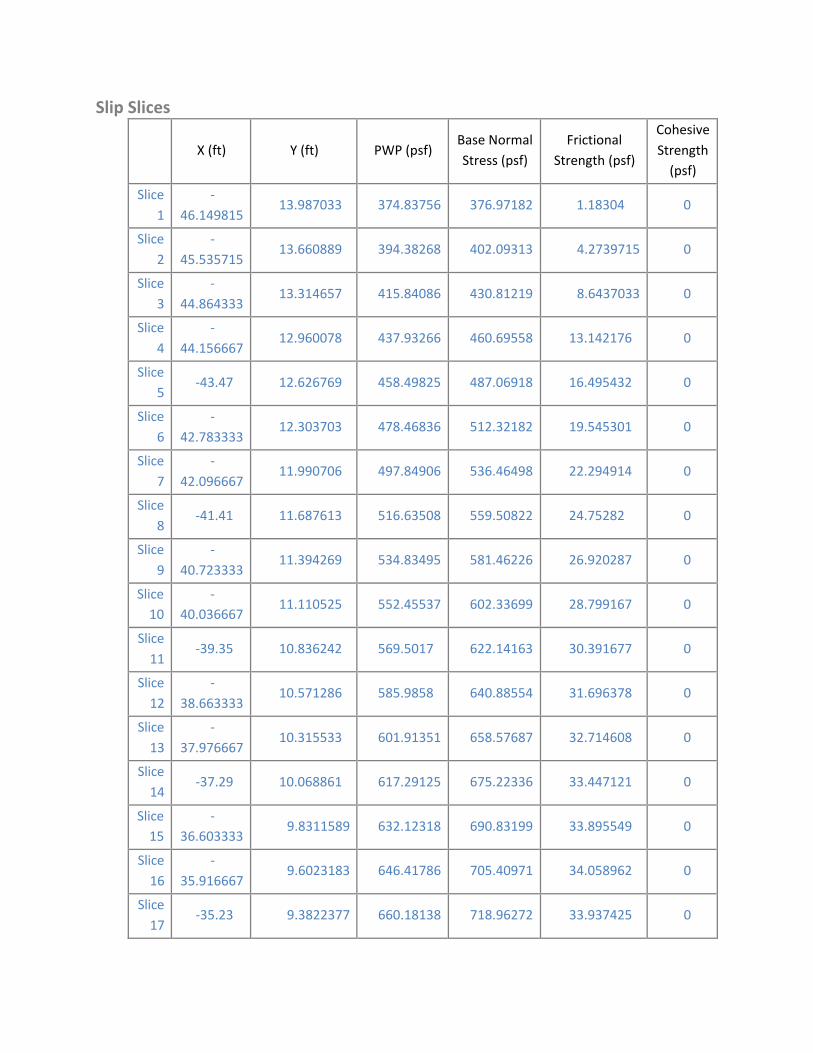
Slip Slices
X (ft) Y (ft) PWP (psf) Base Normal
Stress (psf)
Frictional
Strength (psf)
Cohesive
Strength (psf)
Slice
1
‐
46.149815 13.987033 374.83756 376.97182 1.18304 0
Slice
2
‐
45.535715 13.660889 394.38268 402.09313 4.2739715 0
Slice
3
‐
44.864333 13.314657 415.84086 430.81219 8.6437033 0
Slice
4
‐
44.156667 12.960078 437.93266 460.69558 13.142176 0
Slice
5 ‐43.47 12.626769 458.49825 487.06918 16.495432 0
Slice
6
‐
42.783333 12.303703 478.46836 512.32182 19.545301 0
Slice
7
‐
42.096667 11.990706 497.84906 536.46498 22.294914 0
Slice
8 ‐41.41 11.687613 516.63508 559.50822 24.75282 0
Slice
9
‐
40.723333 11.394269 534.83495 581.46226 26.920287 0
Slice 10
‐
40.036667 11.110525 552.45537 602.33699 28.799167 0
Slice
11 ‐39.35 10.836242 569.5017 622.14163 30.391677 0
Slice
12
‐
38.663333 10.571286 585.9858 640.88554 31.696378 0
Slice
13
‐
37.976667 10.315533 601.91351 658.57687 32.714608 0
Slice
14 ‐37.29 10.068861 617.29125 675.22336 33.447121 0
Slice 15
‐
36.603333 9.8311589 632.12318 690.83199 33.895549 0
Slice
16
‐
35.916667 9.6023183 646.41786 705.40971 34.058962 0
Slice
17 ‐35.23 9.3822377 660.18138 718.96272 33.937425 0
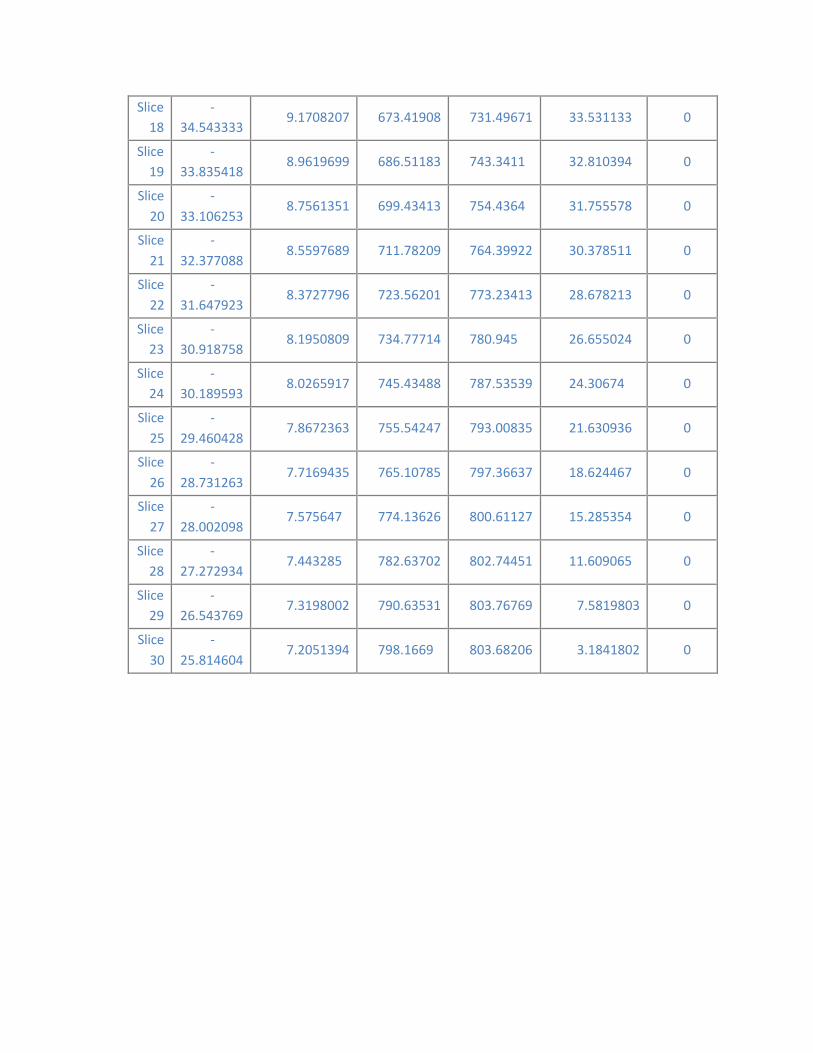
18
19
20
21
22
23
24
25
26
27
28
29
30
Slice ‐
34.543333 9.1708207 673.41908 731.49671 33.531133 0
Slice ‐
33.835418 8.9619699 686.51183 743.3411 32.810394 0
Slice ‐
33.106253 8.7561351 699.43413 754.4364 31.755578 0
Slice ‐
32.377088 8.5597689 711.78209 764.39922 30.378511 0
Slice ‐
31.647923 8.3727796 723.56201 773.23413 28.678213 0
Slice ‐
30.918758 8.1950809 734.77714 780.945 26.655024 0
Slice ‐
30.189593 8.0265917 745.43488 787.53539 24.30674 0
Slice ‐
29.460428 7.8672363 755.54247 793.00835 21.630936 0
Slice ‐
28.731263 7.7169435 765.10785 797.36637 18.624467 0
Slice ‐
28.002098 7.575647 774.13626 800.61127 15.285354 0
Slice ‐
27.272934 7.443285 782.63702 802.74451 11.609065 0
Slice ‐
26.543769 7.3198002 790.63531 803.76769 7.5819803 0
Slice ‐
25.814604 7.2051394 798.1669 803.68206 3.1841802 0
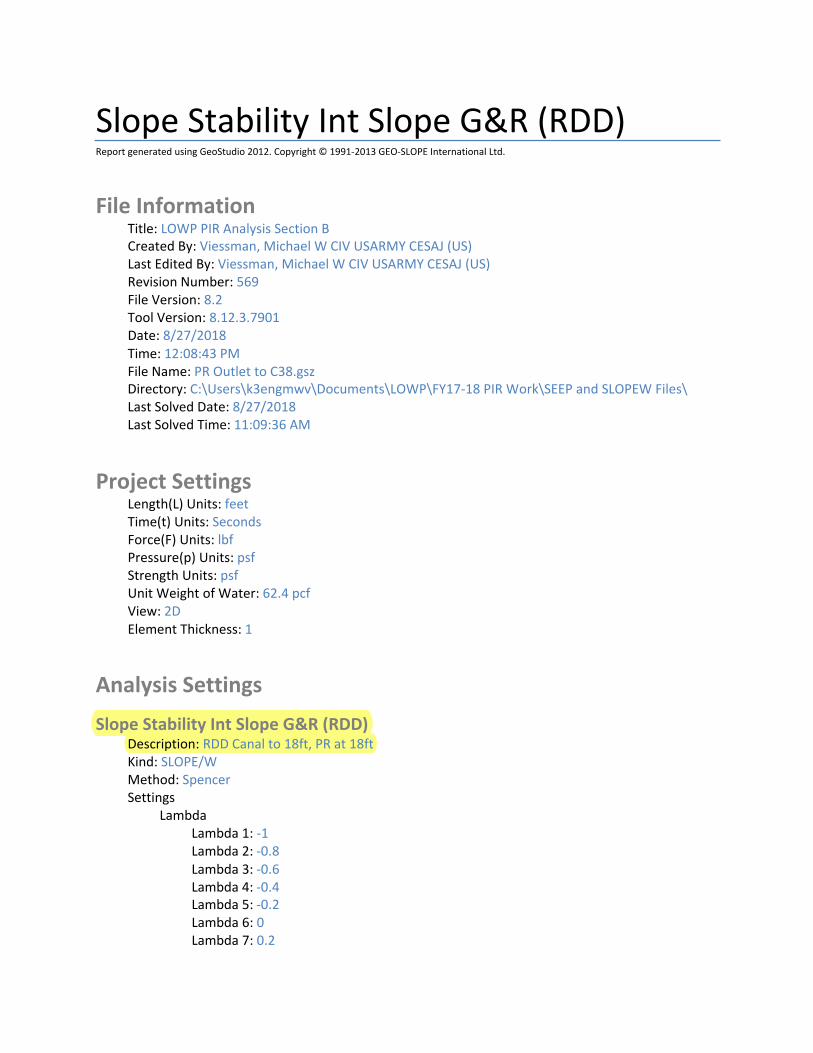
Slope Stability Int Slope G&R (RDD) Report generated using GeoStudio 2012. Copyright © 1991‐2013 GEO‐SLOPE International Ltd.
File Information Title: LOWP PIR Analysis Section B Created By: Viessman, Michael W CIV USARMY CESAJ (US) Last Edited By: Viessman, Michael W CIV USARMY CESAJ (US) Revision Number: 569 File Version: 8.2 Tool Version: 8.12.3.7901 Date: 8/27/2018 Time: 12:08:43 PM File Name: PR Outlet to C38.gsz Directory: C:\Users\k3engmwv\Documents\LOWP\FY17‐18 PIR Work\SEEP and SLOPEW Files\ Last Solved Date: 8/27/2018 Last Solved Time: 11:09:36 AM
Project Settings Length(L) Units: feet Time(t) Units: Seconds Force(F) Units: lbf Pressure(p) Units: psf Strength Units: psf Unit Weight of Water: 62.4 pcf View: 2D Element Thickness: 1
Analysis Settings
Slope Stability Int Slope G&R (RDD) Description: RDD Canal to 18ft, PR at 18ft Kind: SLOPE/W Method: Spencer Settings
Lambda Lambda 1: ‐1 Lambda 2: ‐0.8 Lambda 3: ‐0.6 Lambda 4: ‐0.4 Lambda 5: ‐0.2 Lambda 6: 0 Lambda 7: 0.2

Lambda 8: 0.4 Lambda 9: 0.6 Lambda 10: 0.8 Lambda 11: 1
PWP Conditions Source: Piezometric Line Apply Phreatic Correction: Yes Use Staged Rapid Drawdown: Yes
Slip Surface Direction of movement: Left to Right Use Passive Mode: No Slip Surface Option: Grid and Radius Critical slip surfaces saved: 1 Optimize Critical Slip Surface Location: Yes Tension Crack
Tension Crack Option: (none) F of S Distribution
F of S Calculation Option: Constant Advanced
Number of Slices: 30 F of S Tolerance: 0.001 Minimum Slip Surface Depth: 1 ft Optimization Maximum Iterations: 2,000 Optimization Convergence Tolerance: 1e‐007 Starting Optimization Points: 8 Ending Optimization Points: 16 Complete Passes per Insertion: 1 Driving Side Maximum Convex Angle: 5 ° Resisting Side Maximum Convex Angle: 1 °
Materials
Matl. 1 ‐ Embankment Material Model: Mohr‐Coulomb Unit Weight: 125 pcf Cohesion': 0 psf Phi': 32 ° Phi‐B: 0 ° Total Cohesion: 420 psf Total Phi: 0 ° Constant Unit Wt. Above Water Table: 120 pcf Pore Water Pressure
Piezometric Line: 1 Piezometric Line After Drawdown: 2
Matl. 2 ‐ Surficial Overburden Layer Model: Mohr‐Coulomb
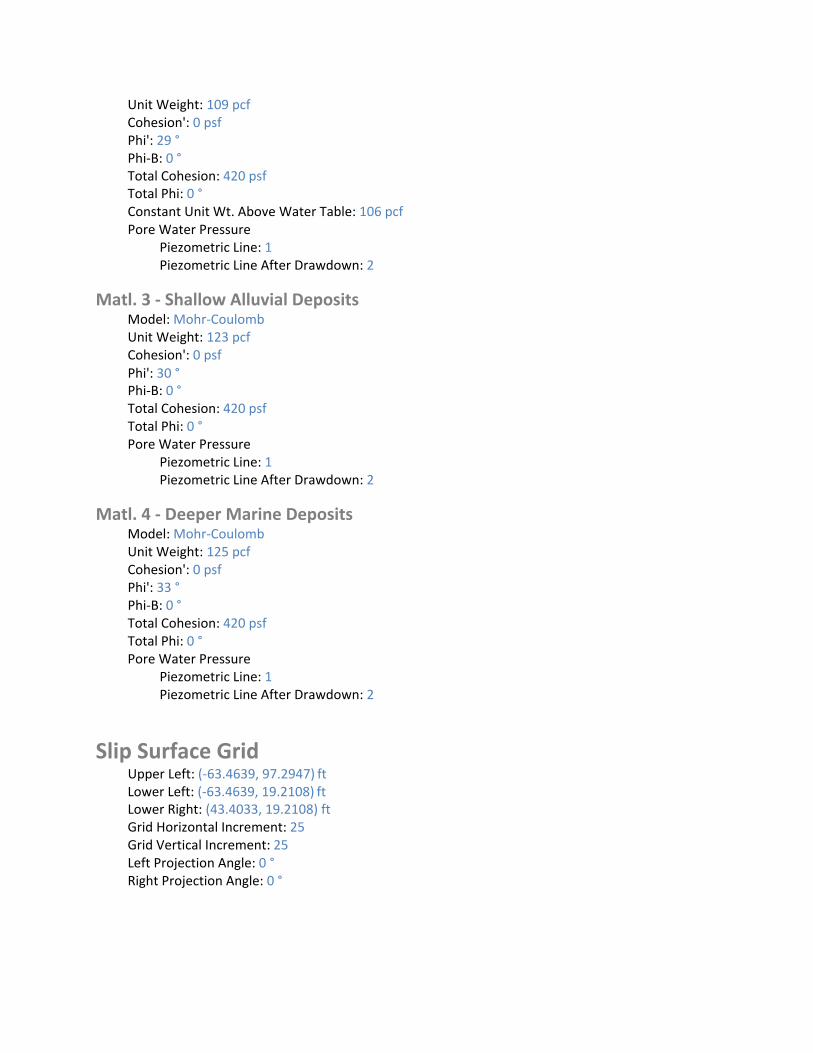
Unit Weight: 109 pcf Cohesion': 0 psf Phi': 29 ° Phi‐B: 0 ° Total Cohesion: 420 psf Total Phi: 0 ° Constant Unit Wt. Above Water Table: 106 pcf Pore Water Pressure
Piezometric Line: 1 Piezometric Line After Drawdown: 2
Matl. 3 ‐ Shallow Alluvial Deposits Model: Mohr‐Coulomb Unit Weight: 123 pcf Cohesion': 0 psf Phi': 30 ° Phi‐B: 0 ° Total Cohesion: 420 psf Total Phi: 0 ° Pore Water Pressure
Piezometric Line: 1 Piezometric Line After Drawdown: 2
Matl. 4 ‐ Deeper Marine Deposits Model: Mohr‐Coulomb Unit Weight: 125 pcf Cohesion': 0 psf Phi': 33 ° Phi‐B: 0 ° Total Cohesion: 420 psf Total Phi: 0 ° Pore Water Pressure
Piezometric Line: 1 Piezometric Line After Drawdown: 2
Slip Surface Grid Upper Left: (‐63.4639, 97.2947) ft Lower Left: (‐63.4639, 19.2108) ft Lower Right: (43.4033, 19.2108) ft Grid Horizontal Increment: 25 Grid Vertical Increment: 25 Left Projection Angle: 0 ° Right Projection Angle: 0 °
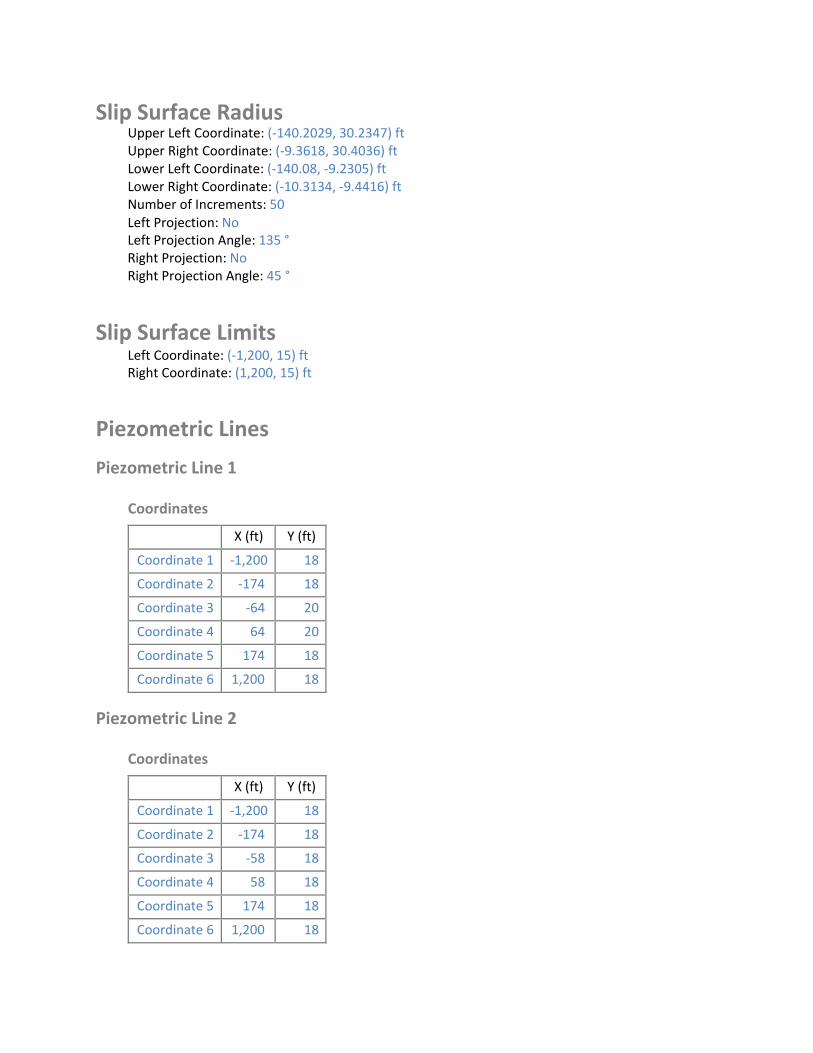
Slip Surface RadiusUpper Left Coordinate: (‐140.2029, 30.2347) ft Upper Right Coordinate: (‐9.3618, 30.4036) ft Lower Left Coordinate: (‐140.08, ‐9.2305) ft Lower Right Coordinate: (‐10.3134, ‐9.4416) ft Number of Increments: 50 Left Projection: No Left Projection Angle: 135 ° Right Projection: No Right Projection Angle: 45 °
Slip Surface Limits Left Coordinate: (‐1,200, 15) ft Right Coordinate: (1,200, 15) ft
Piezometric Lines
Piezometric Line 1
Coordinates
X (ft) Y (ft)
Coordinate 1 ‐1,200 18
Coordinate 2 ‐174 18
Coordinate 3 ‐64 20
Coordinate 4 64 20
Coordinate 5 174 18
Coordinate 6 1,200 18
Piezometric Line 2
Coordinates
X (ft) Y (ft)
Coordinate 1 ‐1,200 18
Coordinate 2 ‐174 18
Coordinate 3 ‐58 18
Coordinate 4 58 18
Coordinate 5 174 18
Coordinate 6 1,200 18

1
2
3
4
5
6
7
8
9
10
11
12
13
14
15
16
17
18
19
20
21
22
23
24
25
26
27
28
29
30
31
32
33
Points X (ft) Y (ft)
Point ‐183 15
Point ‐138 30
Point ‐124 30
Point ‐100 22
Point ‐70.1 22
Point ‐49 15
Point 49 15
Point 70 22
Point 100 22
Point 124 30
Point 138 30
Point 183 15
Point ‐183 13.5
Point ‐44.5 13.5
Point ‐183 ‐14.5
Point ‐44.5 ‐14.5
Point ‐183 ‐114.5
Point ‐44.5 ‐114.5
Point 44.5 ‐14.5
Point 44.5 13.5
Point 25 7
Point ‐25 7
Point 44.5 ‐114.5
Point 183 13.5
Point 183 ‐14.5
Point 183 ‐114.5
Point ‐64 19.9763
Point 64 20
Point ‐174 18
Point 174 18
Point 1,200 15
Point 1,200 13.5
Point 1,200 ‐14.5
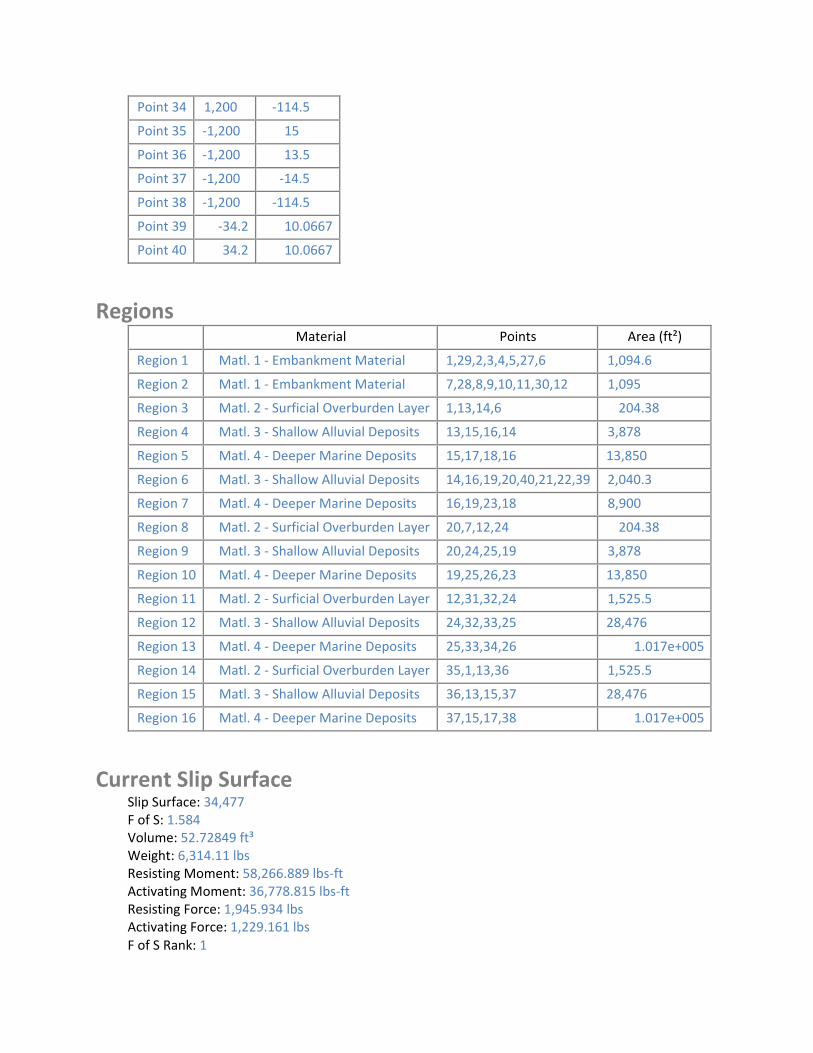
Point 34 1,200 ‐114.5
Point 35 ‐1,200 15
Point 36 ‐1,200 13.5
Point 37 ‐1,200 ‐14.5
Point 38 ‐1,200 ‐114.5
Point 39 ‐34.2 10.0667
Point 40 34.2 10.0667
Regions Material Points Area (ft²)
Region 1 Matl. 1 ‐ Embankment Material 1,29,2,3,4,5,27,6 1,094.6
Region 2 Matl. 1 ‐ Embankment Material 7,28,8,9,10,11,30,12 1,095
Region 3 Matl. 2 ‐ Surficial Overburden Layer 1,13,14,6 204.38
Region 4 Matl. 3 ‐ Shallow Alluvial Deposits 13,15,16,14 3,878
Region 5 Matl. 4 ‐ Deeper Marine Deposits 15,17,18,16 13,850
Region 6 Matl. 3 ‐ Shallow Alluvial Deposits 14,16,19,20,40,21,22,39 2,040.3
Region 7 Matl. 4 ‐ Deeper Marine Deposits 16,19,23,18 8,900
Region 8 Matl. 2 ‐ Surficial Overburden Layer 20,7,12,24 204.38
Region 9 Matl. 3 ‐ Shallow Alluvial Deposits 20,24,25,19 3,878
Region 10 Matl. 4 ‐ Deeper Marine Deposits 19,25,26,23 13,850
Region 11 Matl. 2 ‐ Surficial Overburden Layer 12,31,32,24 1,525.5
Region 12 Matl. 3 ‐ Shallow Alluvial Deposits 24,32,33,25 28,476
Region 13 Matl. 4 ‐ Deeper Marine Deposits 25,33,34,26 1.017e+005
Region 14 Matl. 2 ‐ Surficial Overburden Layer 35,1,13,36 1,525.5
Region 15 Matl. 3 ‐ Shallow Alluvial Deposits 36,13,15,37 28,476
Region 16 Matl. 4 ‐ Deeper Marine Deposits 37,15,17,38 1.017e+005
Current Slip Surface Slip Surface: 34,477 F of S: 1.584 Volume: 52.72849 ft³ Weight: 6,314.11 lbs Resisting Moment: 58,266.889 lbs‐ft Activating Moment: 36,778.815 lbs‐ft Resisting Force: 1,945.934 lbs Activating Force: 1,229.161 lbs F of S Rank: 1
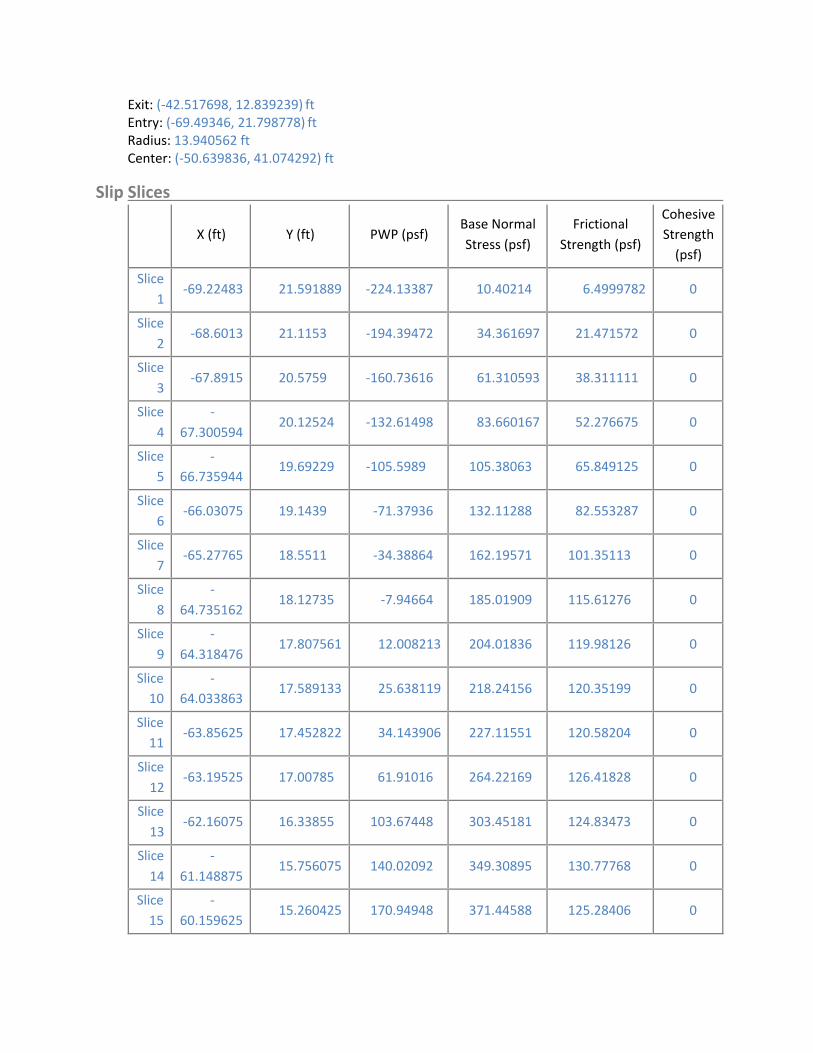
Exit: (‐42.517698, 12.839239) ft Entry: (‐69.49346, 21.798778) ft Radius: 13.940562 ft Center: (‐50.639836, 41.074292) ft
Slip Slices
X (ft) Y (ft) PWP (psf) Base Normal
Stress (psf)
Frictional
Strength (psf)
Cohesive Strength (psf)
Slice
1 ‐69.22483 21.591889 ‐224.13387 10.40214 6.4999782 0
Slice
2 ‐68.6013 21.1153 ‐194.39472 34.361697 21.471572 0
Slice
3 ‐67.8915 20.5759 ‐160.73616 61.310593 38.311111 0
Slice
4
‐
67.300594 20.12524 ‐132.61498 83.660167 52.276675 0
Slice
5 ‐
66.735944 19.69229 ‐105.5989 105.38063 65.849125 0
Slice
6 ‐66.03075 19.1439 ‐71.37936 132.11288 82.553287 0
Slice
7 ‐65.27765 18.5511 ‐34.38864 162.19571 101.35113 0
Slice
8
‐
64.735162 18.12735 ‐7.94664 185.01909 115.61276 0
Slice
9
‐
64.318476 17.807561 12.008213 204.01836 119.98126 0
Slice 10
‐
64.033863 17.589133 25.638119 218.24156 120.35199 0
Slice 11
‐63.85625 17.452822 34.143906 227.11551 120.58204 0
Slice
12 ‐63.19525 17.00785 61.91016 264.22169 126.41828 0
Slice
13 ‐62.16075 16.33855 103.67448 303.45181 124.83473 0
Slice
14
‐
61.148875 15.756075 140.02092 349.30895 130.77768 0
Slice 15
‐
60.159625 15.260425 170.94948 371.44588 125.28406 0
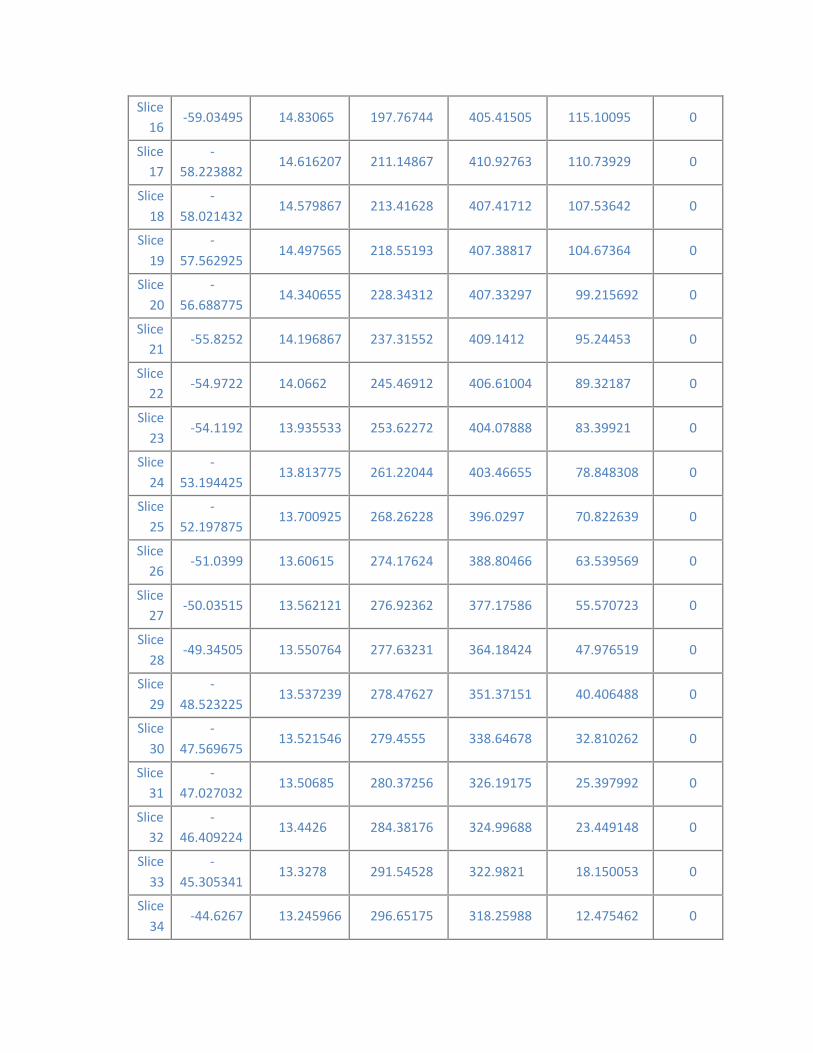
16
17
18
19
20
21
22
23
24
25
26
27
28
29
30
31
32
33
34
Slice ‐59.03495 14.83065 197.76744 405.41505 115.10095 0
Slice ‐
58.223882 14.616207 211.14867 410.92763 110.73929 0
Slice ‐
58.021432 14.579867 213.41628 407.41712 107.53642 0
Slice ‐
57.562925 14.497565 218.55193 407.38817 104.67364 0
Slice ‐
56.688775 14.340655 228.34312 407.33297 99.215692 0
Slice ‐55.8252 14.196867 237.31552 409.1412 95.24453 0
Slice ‐54.9722 14.0662 245.46912 406.61004 89.32187 0
Slice ‐54.1192 13.935533 253.62272 404.07888 83.39921 0
Slice ‐
53.194425 13.813775 261.22044 403.46655 78.848308 0
Slice ‐
52.197875 13.700925 268.26228 396.0297 70.822639 0
Slice ‐51.0399 13.60615 274.17624 388.80466 63.539569 0
Slice ‐50.03515 13.562121 276.92362 377.17586 55.570723 0
Slice ‐49.34505 13.550764 277.63231 364.18424 47.976519 0
Slice ‐
48.523225 13.537239 278.47627 351.37151 40.406488 0
Slice ‐
47.569675 13.521546 279.4555 338.64678 32.810262 0
Slice ‐
47.027032 13.50685 280.37256 326.19175 25.397992 0
Slice ‐
46.409224 13.4426 284.38176 324.99688 23.449148 0
Slice ‐
45.305341 13.3278 291.54528 322.9821 18.150053 0
Slice ‐44.6267 13.245966 296.65175 318.25988 12.475462 0

Slice 35
‐
44.004425 13.125958 304.14021 321.64859 10.108469 0
Slice 36
‐
43.013274 12.934812 316.06772 326.14516 5.8182114 0


Filter Design
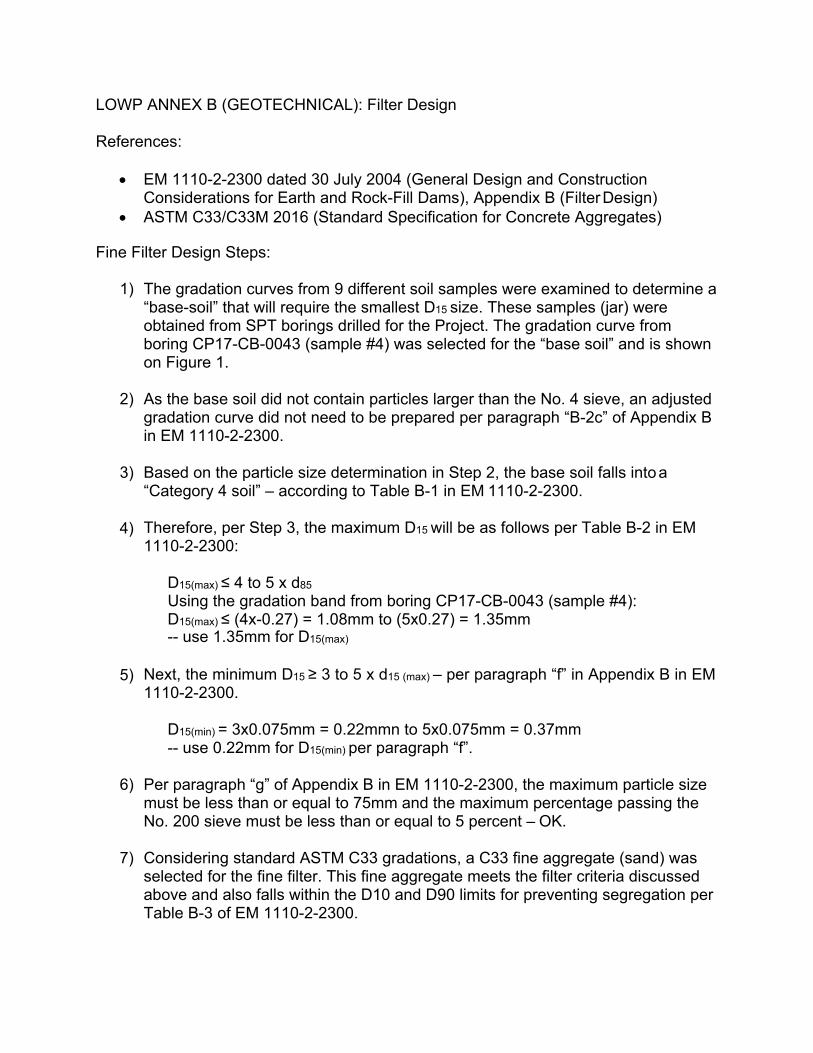
LOWP ANNEX B (GEOTECHNICAL): Filter Design
References:
EM 1110-2-2300 dated 30 July 2004 (General Design and Construction Considerations for Earth and Rock-Fill Dams), Appendix B (Filter Design)
ASTM C33/C33M 2016 (Standard Specification for Concrete Aggregates)
Fine Filter Design Steps:
1) The gradation curves from 9 different soil samples were examined to determine a “base-soil” that will require the smallest D15 size. These samples (jar) were obtained from SPT borings drilled for the Project. The gradation curve from boring CP17-CB-0043 (sample #4) was selected for the “base soil” and is shown on Figure 1.
2) As the base soil did not contain particles larger than the No. 4 sieve, an adjusted gradation curve did not need to be prepared per paragraph “B-2c” of Appendix B in EM 1110-2-2300.
3) Based on the particle size determination in Step 2, the base soil falls into a “Category 4 soil” – according to Table B-1 in EM 1110-2-2300.
4) Therefore, per Step 3, the maximum D15 will be as follows per Table B-2 in EM 1110-2-2300:
D15(max) ≤ 4 to 5 x d85
Using the gradation band from boring CP17-CB-0043 (sample #4): D15(max) ≤ (4x-0.27) = 1.08mm to (5x0.27) = 1.35mm-- use 1.35mm for D15(max)
5) Next, the minimum D15 ≥ 3 to 5 x d15 (max) – per paragraph “f” in Appendix B in EM 1110-2-2300.
D15(min) = 3x0.075mm = 0.22mmn to 5x0.075mm = 0.37mm -- use 0.22mm for D15(min) per paragraph “f”.
6) Per paragraph “g” of Appendix B in EM 1110-2-2300, the maximum particle size must be less than or equal to 75mm and the maximum percentage passing the No. 200 sieve must be less than or equal to 5 percent – OK.
7) Considering standard ASTM C33 gradations, a C33 fine aggregate (sand) was selected for the fine filter. This fine aggregate meets the filter criteria discussed above and also falls within the D10 and D90 limits for preventing segregation per Table B-3 of EM 1110-2-2300.
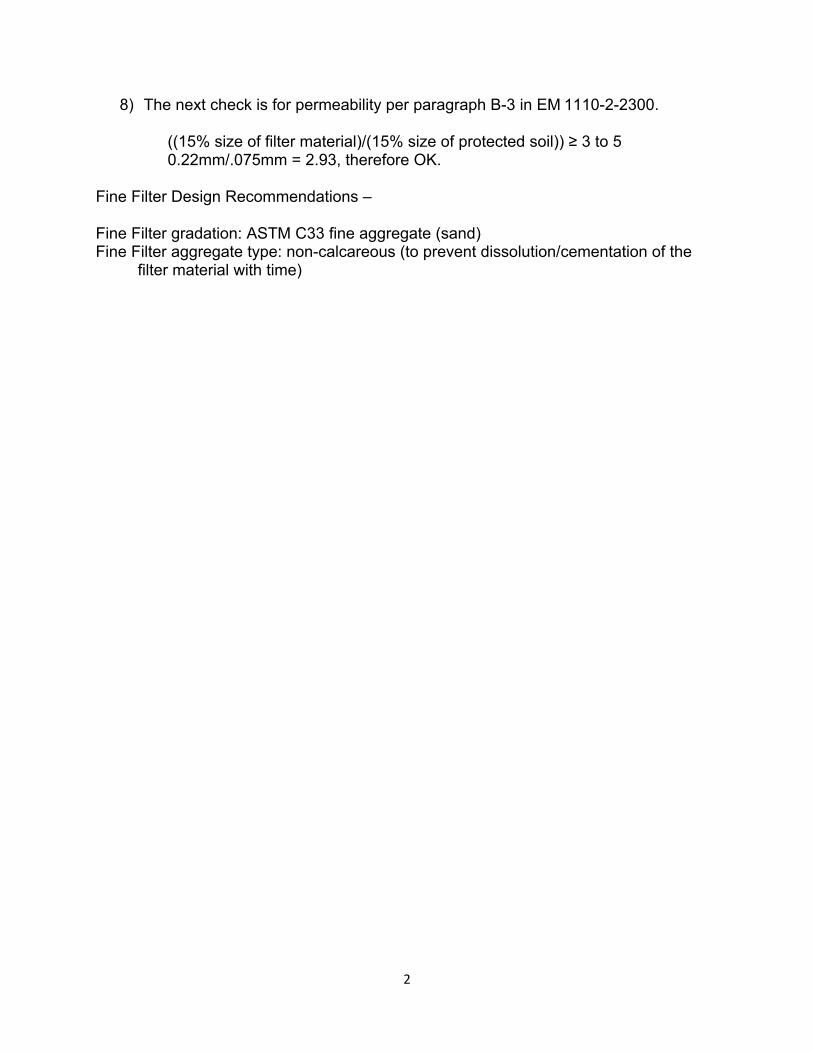
8) The next check is for permeability per paragraph B-3 in EM 1110-2-2300.
((15% size of filter material)/(15% size of protected soil)) ≥ 3 to 5 0.22mm/.075mm = 2.93, therefore OK.
Fine Filter Design Recommendations –
Fine Filter gradation: ASTM C33 fine aggregate (sand) Fine Filter aggregate type: non-calcareous (to prevent dissolution/cementation of the
filter material with time)
2
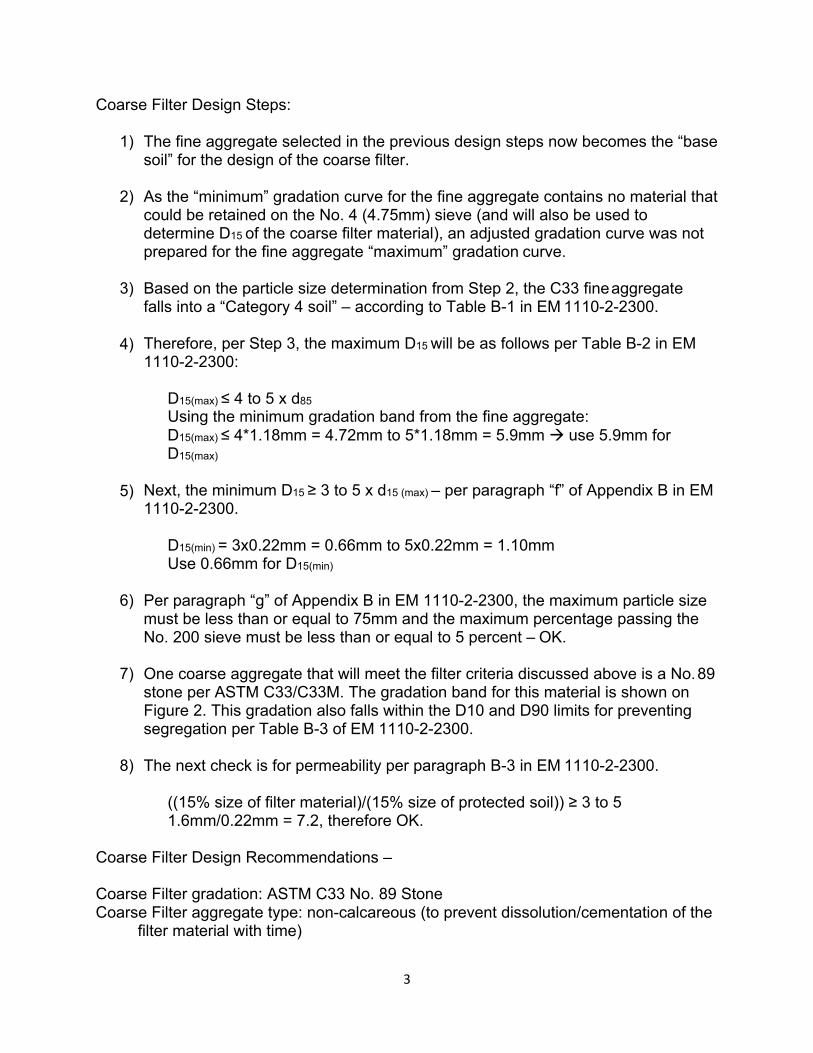
Coarse Filter Design Steps:
1) The fine aggregate selected in the previous design steps now becomes the “base soil” for the design of the coarse filter.
2) As the “minimum” gradation curve for the fine aggregate contains no material that could be retained on the No. 4 (4.75mm) sieve (and will also be used to determine D15 of the coarse filter material), an adjusted gradation curve was not prepared for the fine aggregate “maximum” gradation curve.
3) Based on the particle size determination from Step 2, the C33 fine aggregate falls into a “Category 4 soil” – according to Table B-1 in EM 1110-2-2300.
4) Therefore, per Step 3, the maximum D15 will be as follows per Table B-2 in EM 1110-2-2300:
D15(max) ≤ 4 to 5 x d85
Using the minimum gradation band from the fine aggregate: D15(max) ≤ 4*1.18mm = 4.72mm to 5*1.18mm = 5.9mm use 5.9mm for D15(max)
5) Next, the minimum D15 ≥ 3 to 5 x d15 (max) – per paragraph “f” of Appendix B in EM 1110-2-2300.
D15(min) = 3x0.22mm = 0.66mm to 5x0.22mm = 1.10mm Use 0.66mm for D15(min)
6) Per paragraph “g” of Appendix B in EM 1110-2-2300, the maximum particle size must be less than or equal to 75mm and the maximum percentage passing the No. 200 sieve must be less than or equal to 5 percent – OK.
7) One coarse aggregate that will meet the filter criteria discussed above is a No. 89 stone per ASTM C33/C33M. The gradation band for this material is shown on Figure 2. This gradation also falls within the D10 and D90 limits for preventing segregation per Table B-3 of EM 1110-2-2300.
8) The next check is for permeability per paragraph B-3 in EM 1110-2-2300.
((15% size of filter material)/(15% size of protected soil)) ≥ 3 to 5 1.6mm/0.22mm = 7.2, therefore OK.
Coarse Filter Design Recommendations –
Coarse Filter gradation: ASTM C33 No. 89 Stone Coarse Filter aggregate type: non-calcareous (to prevent dissolution/cementation of the
filter material with time)
3
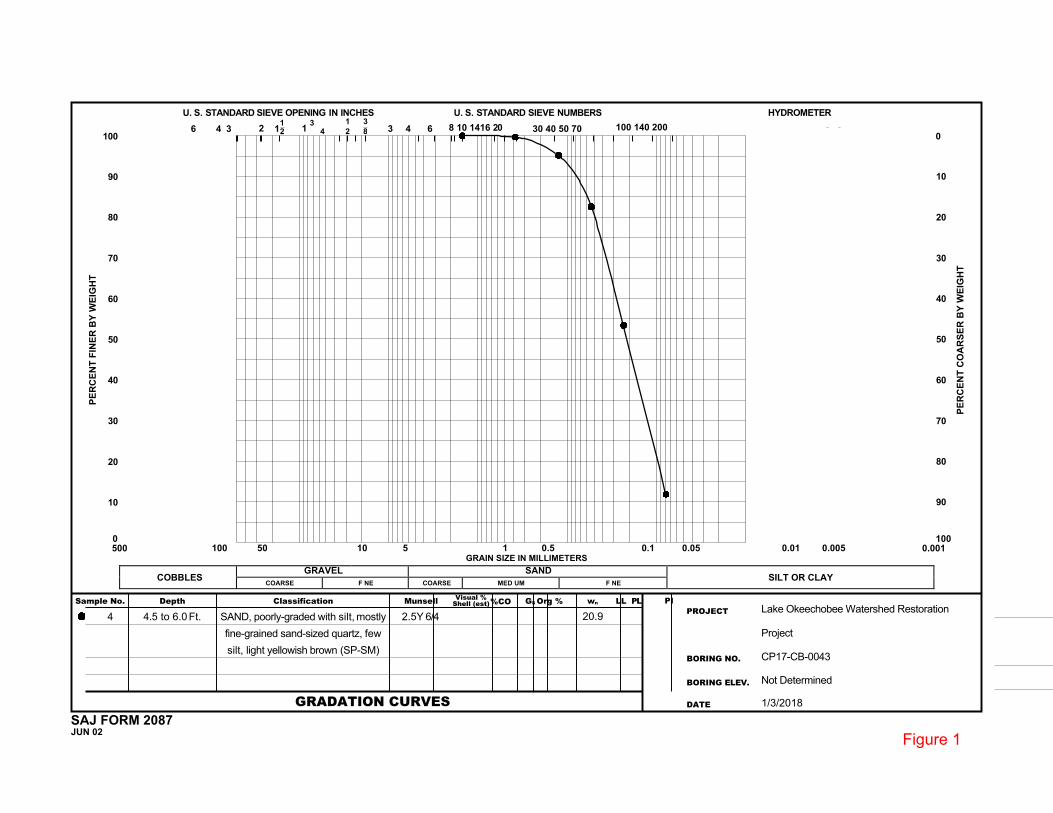
U. S. STANDARD SIEVE OPENING IN INCHES
6 4 3 100
90
80
70
60
50
40
30
20
10
0 500 100
COBBLES
Sample No. Depth
2
50
121
1 3
4 1 2
3 8 3 4
U. S. STANDARD SIEVE NUMBERS
6 8 10 1416 20 30 40 50 70 100 140 200
HYDROMETER
0
10
20
30
40
50
60
70
80
90
100 0.01 0.005 0.001
SILT OR CLAY
- - - --I I I I I I IIT -..... I I I I
............ -.....
' • ' \
\
\ '
I I I I I
•
PE
RC
EN
T C
OA
RS
ER
BY
WE
IGH
T
PE
RC
EN
T F
INE
R B
Y W
EIG
HT
GRAVEL
10 5
F NE
1 0.5
COARSE
Classification
GRAIN SIZE IN MILLIMETERS
SAND
Munsell %CO GS Org % wnShell (est)
COARSE MED UM
Visual %
F NE
LL PL
0.1
PI
0.05
PROJECT Lake Okeechobee Watershed Restoration 20.94.5 to 6.0 Ft. SAND, poorly-graded with silt, mostly 2.5Y 6/4
Project fine-grained sand-sized quartz, few
silt, light yellowish brown (SP-SM) BORING NO. CP17-CB-0043
BORING ELEV. Not Determined
GRADATION CURVES DATE 1/3/2018
SAJ FORM 2087 JUN 02
Figure 1
4
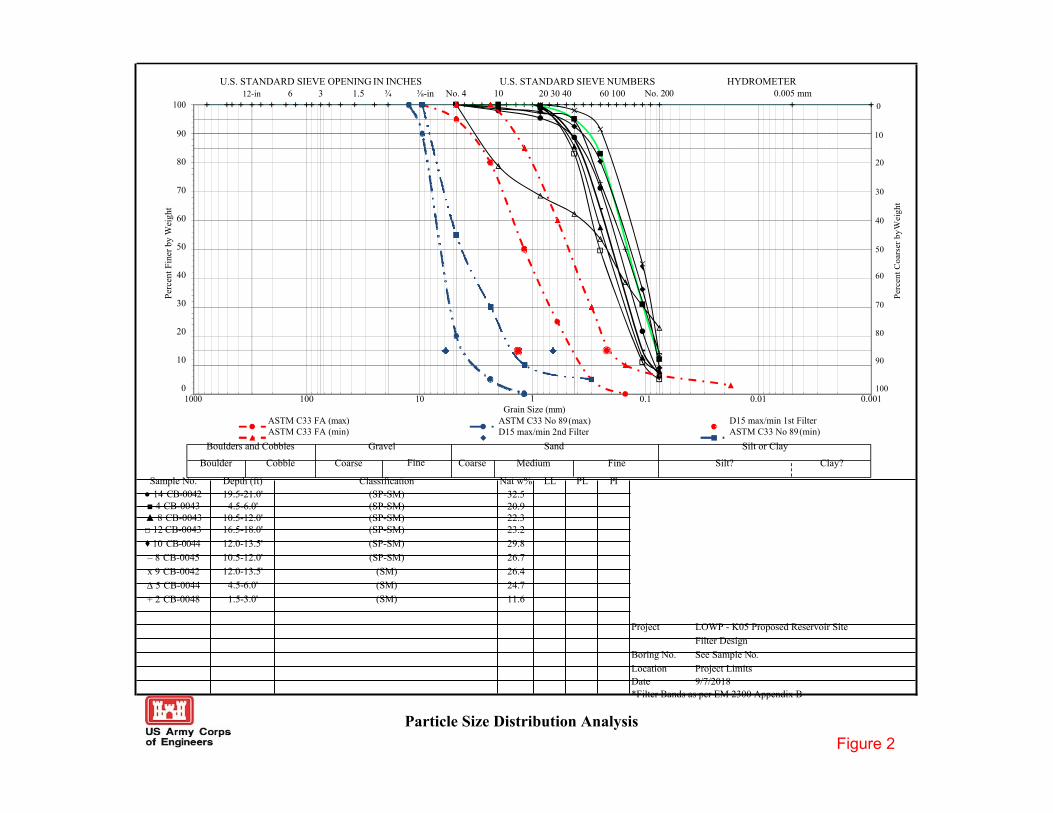
I
I~ US Army Corps of Engineers
-•-_.., -
I
-
' '
I I
...
. ' . . . '
. 1
\ . .
I
:--..1
i\ " ~
. ~ -~ -.
·' ~ \
' I . . \
~
~ ' . ~ -...
I
\
. ·-k '-- . ••
...... ·-
-· ♦
I
~ r- · ~ ' i"lo,.. I
I 'N ' .~I\ ,~, \ ~r:
~ 1'--i--
~\fl I I\ I !~
\ "\~11 · .
\ ;i . • \ I~ I
" . ' \\ I ,. . \ ~
. i\, ,. -,.. - I·_ l ~, r~ .J ~- i . . ~ I • - ...
• -· I I I ' ' I
U.S. STANDARD SIEVE OPENING IN INCHES U.S. STANDARD SIEVE NUMBERS HYDROMETER 12-in 6 3 1.5 ¾ ⅜-in No. 4 10 20 30 40 60 100 No. 200 0.005 mm
100 0
90 10
80 20
70 30
ASTM C33 FA (max) ASTM C33 No 89(max) D15 max/min 1st Filter
1000 100
ASTM C33 FA (min)
10 1 Grain Size (mm)
D15 max/min 2nd Filter
0.1 0.01
ASTM C33 No 89(min)
0.001
Perc
ent F
iner
by
Wei
ght
60 40
50 50
40 60
30 70
20 80
10 90
0 100
Per
cent
Coa
rser
by
Wei
ght
Boulders and Cobbles Gravel Sand Silt or Clay
Boulder Cobble Coarse Fine Coarse Medium Fine Silt? Clay?
Sample No. Depth (ft) Classification Nat w% LL PL PI ● 14 CB-0042 19.5-21.0' (SP-SM) 32.5 ■ 4 CB-0043 4.5-6.0' (SP-SM) 20.9 ▲ 8 CB-0043 10.5-12.0' (SP-SM) 22.3 □ 12 CB-0043 16.5-18.0' (SP-SM) 23.2
12.0-13.5' (SP-SM) 29.8 ◆ 10 CB-0044
10.5-12.0' (SP-SM) 26.7 – 8 CB-0045 12.0-13.5' (SM) 26.4 x 9 CB-0042
4.5-6.0' (SM) 24.7 ∆ 5 CB-0044
1.5-3.0' (SM) 11.6 + 2 CB-0048
Project LOWP - K05 Proposed Reservoir Site
Filter Design
Boring No. See Sample No.
Location Project Limits Date 9/7/2018 *Filter Bands as per EM 2300 Appendix B
Particle Size Distribution Analysis
Figure 2
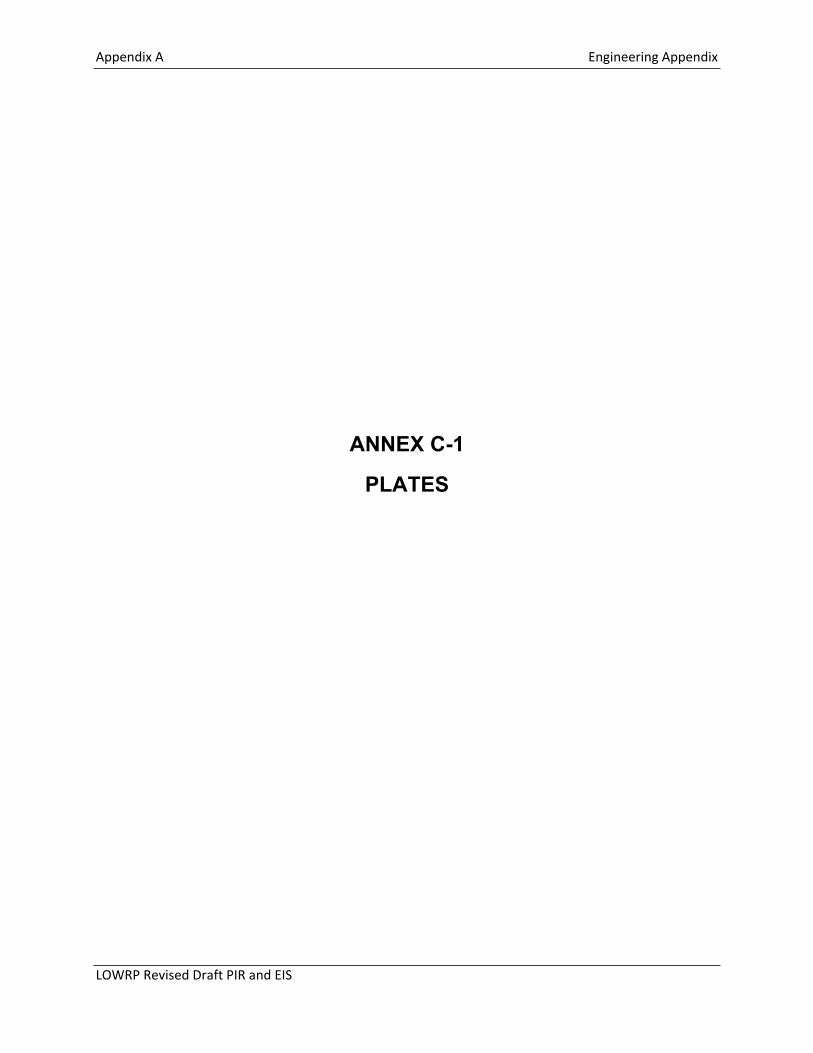
Appendix A Engineering Appendix
ANNEX C-1
PLATES
LOWRP Revised Draft PIR and EIS
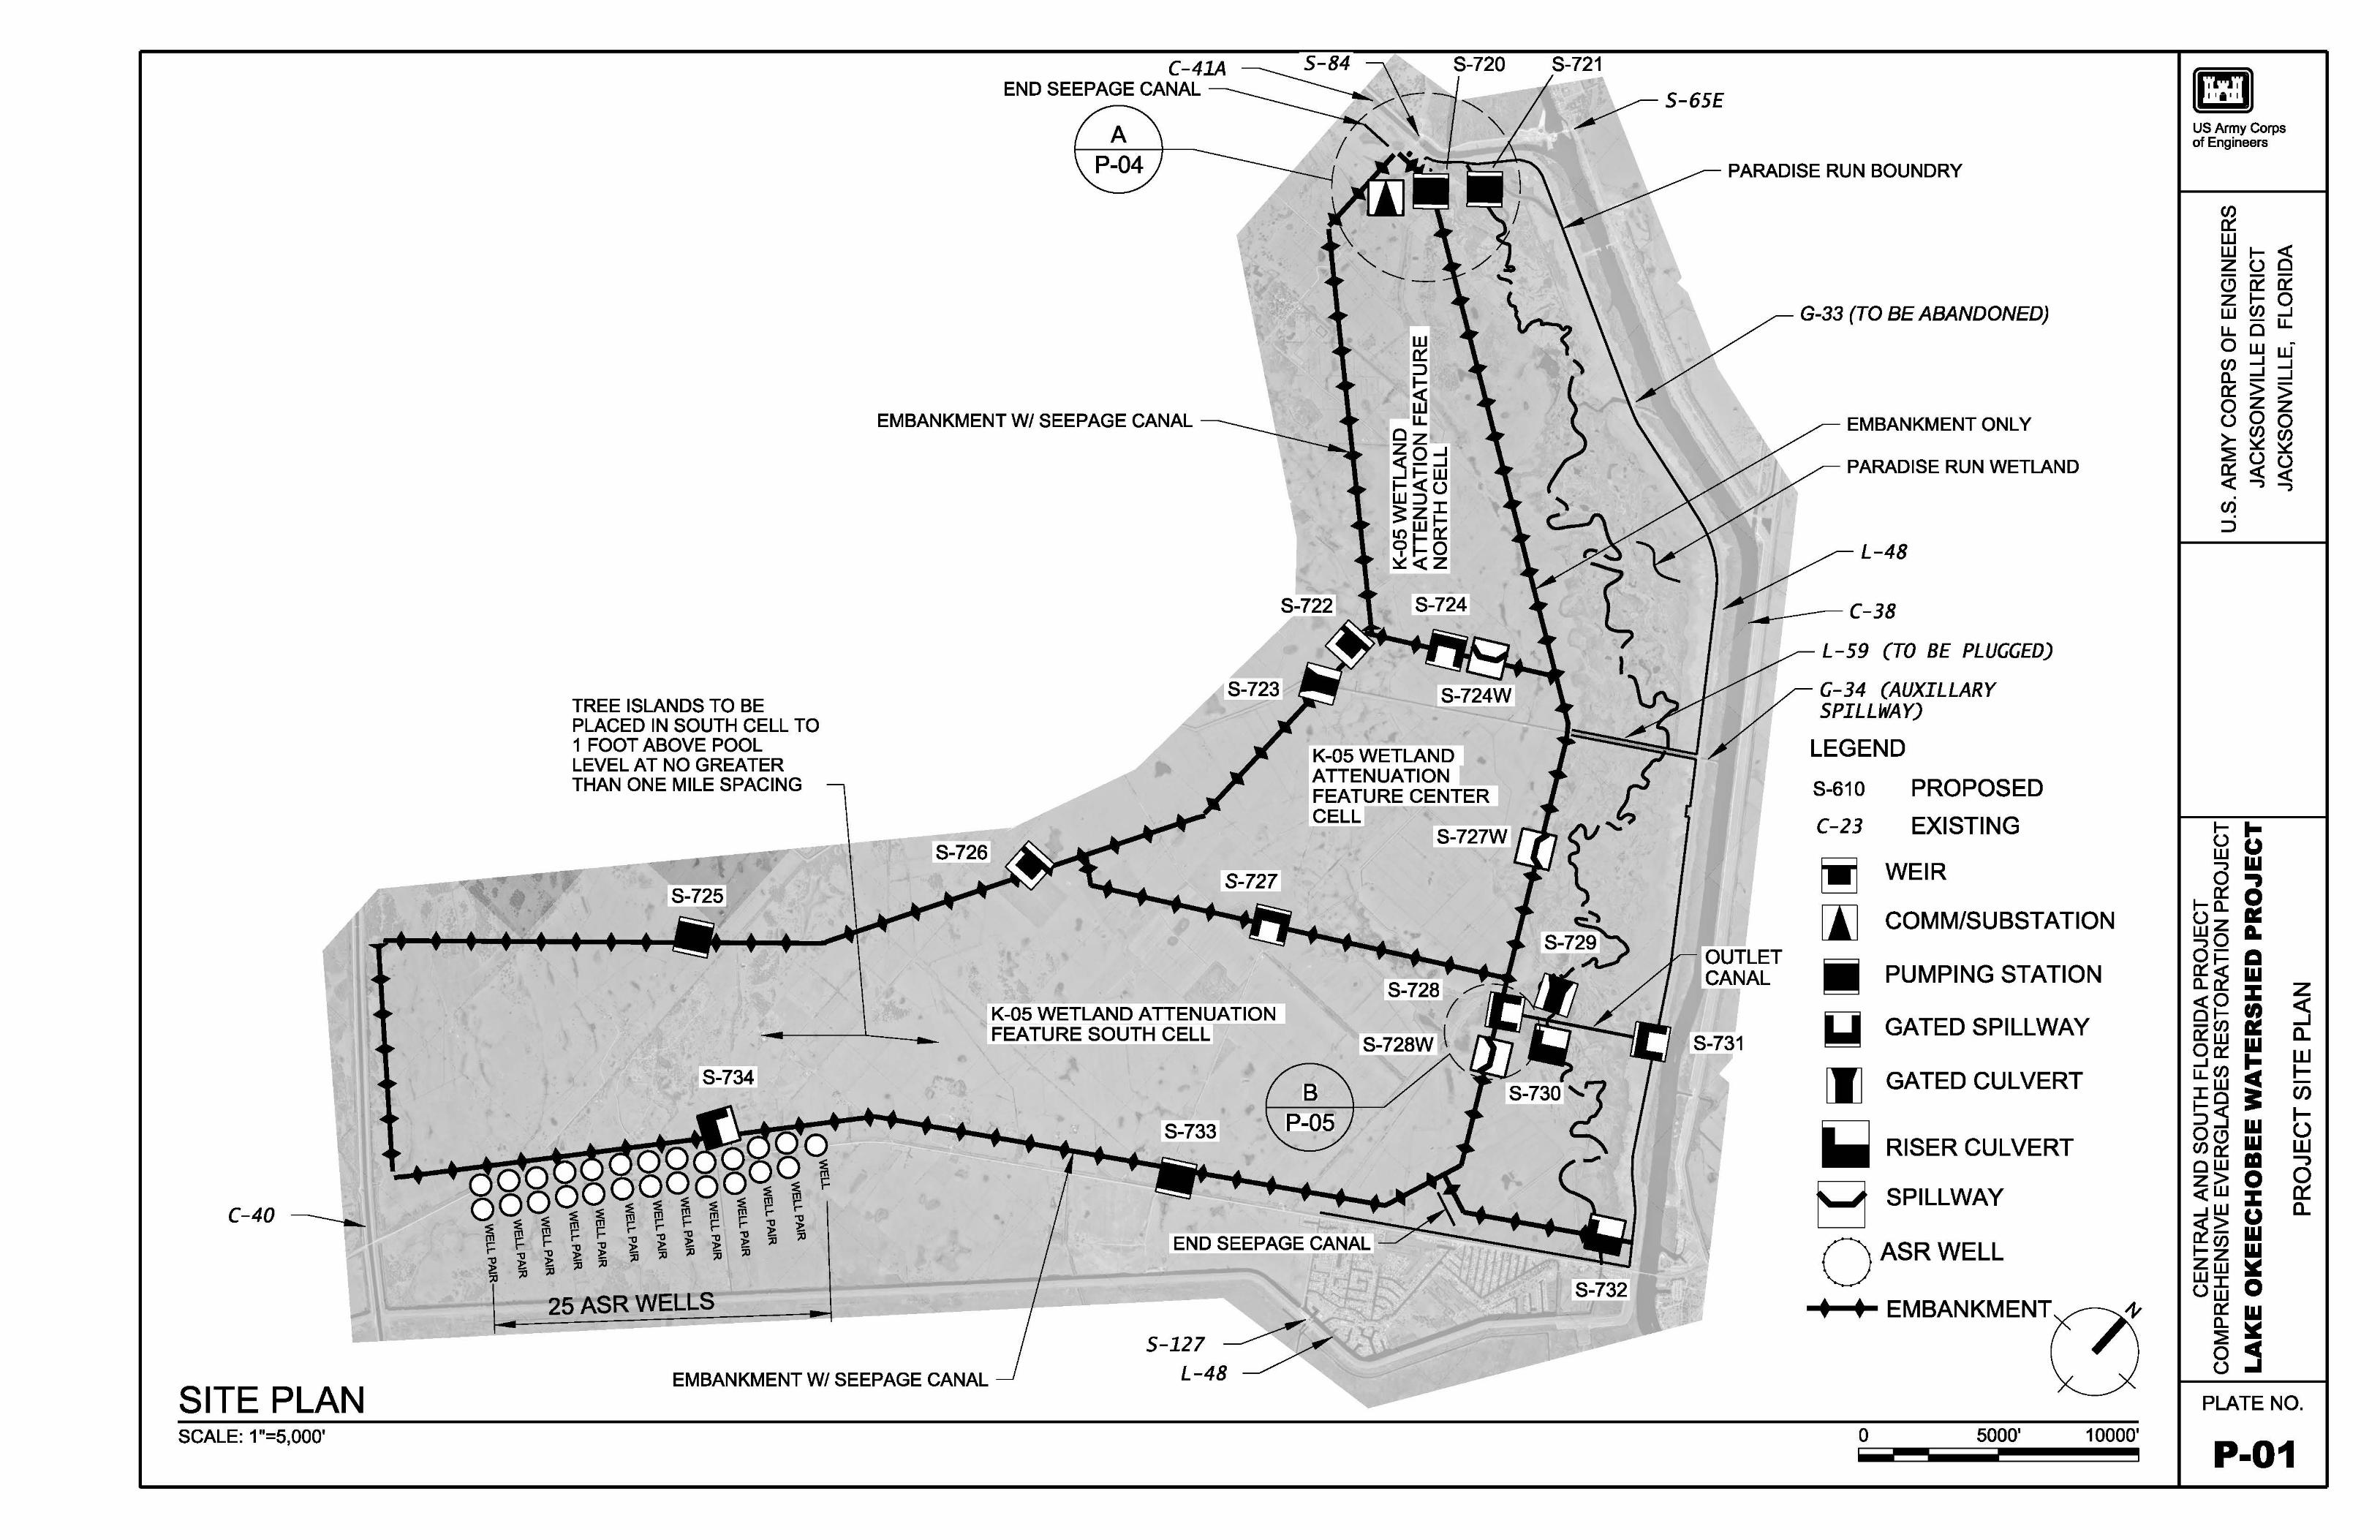
5-84 S-720 S-721C-41A END SEEPAGE CANAL -----
A P-04
EMBANKMENT W/ SEEPAGE CANAL ------
S-724
S-723 TREE ISLANDS TO BE PLACED IN SOUTH CELL TO 1 FOOT ABOVE POOL
K-05 WETLANDLEVEL AT NO GREATER ATTENUATION .____THAN ONE MILE SPACING FEATURE CENTER CELL
S-727W S-726
/S-727
S-725
• ~i ~,,,.-
S-65E
,,,,.- PARADISE RUN BOUNDRY
G-33 (TO BE ABANDONED)
EMBANKMENT ONLY
PARADISE RUN WETLAND
L-48
....:..---.---- c-38
L-59 (TO BE PLUGGED)
G-34 (AUXILLARYSPILLWAY)
LEGEND
S-61 o PROPOSED
C-23 EXISTING
~ WEIR
[I] COMM/SUBSTATION
OUTLET
US Army Corps of Engineers
I- I-(..) uw ""'J w.,0 0::: 0I- D..
Uz a:: A.~oo- Cl
S-728 ,,,,/. , K-05 WETLAND ATTENUATION
FEATURE SOUTH CELL S-728W \
S-734 S-730 '-
CANAL PUMPING STATION
~ GATED SPILLWAY
[I] GATED CULVERT
w~~ z:z:<(0 <(OI- ....J-en0::: w a.. =w0 0::: wI-...Jen I-LLW -Io ; en
C-40 ---------....i_
RISER CULVERT
B SPILLWAY
I-<( I-::J ...J w (.)Oc.9 w wen c::: --,Illow 0z> 0<(W 0:::z:...JW a..u
END SEEPAGE CANAL OASRWELL
~~ wI-en wzZ S-732
25ASRWELLS t t EMBANKMENT
WW ~ (..) [TI 0
0::: wD.. ~ ~
L-48EMBANKMENT W/ SEEPAGE CANAL
cc0 (..) ..I
SITE PLAN PLATE NO.
SCALE: 1 "=5,000' 0 5000' 10000'- - - P-01
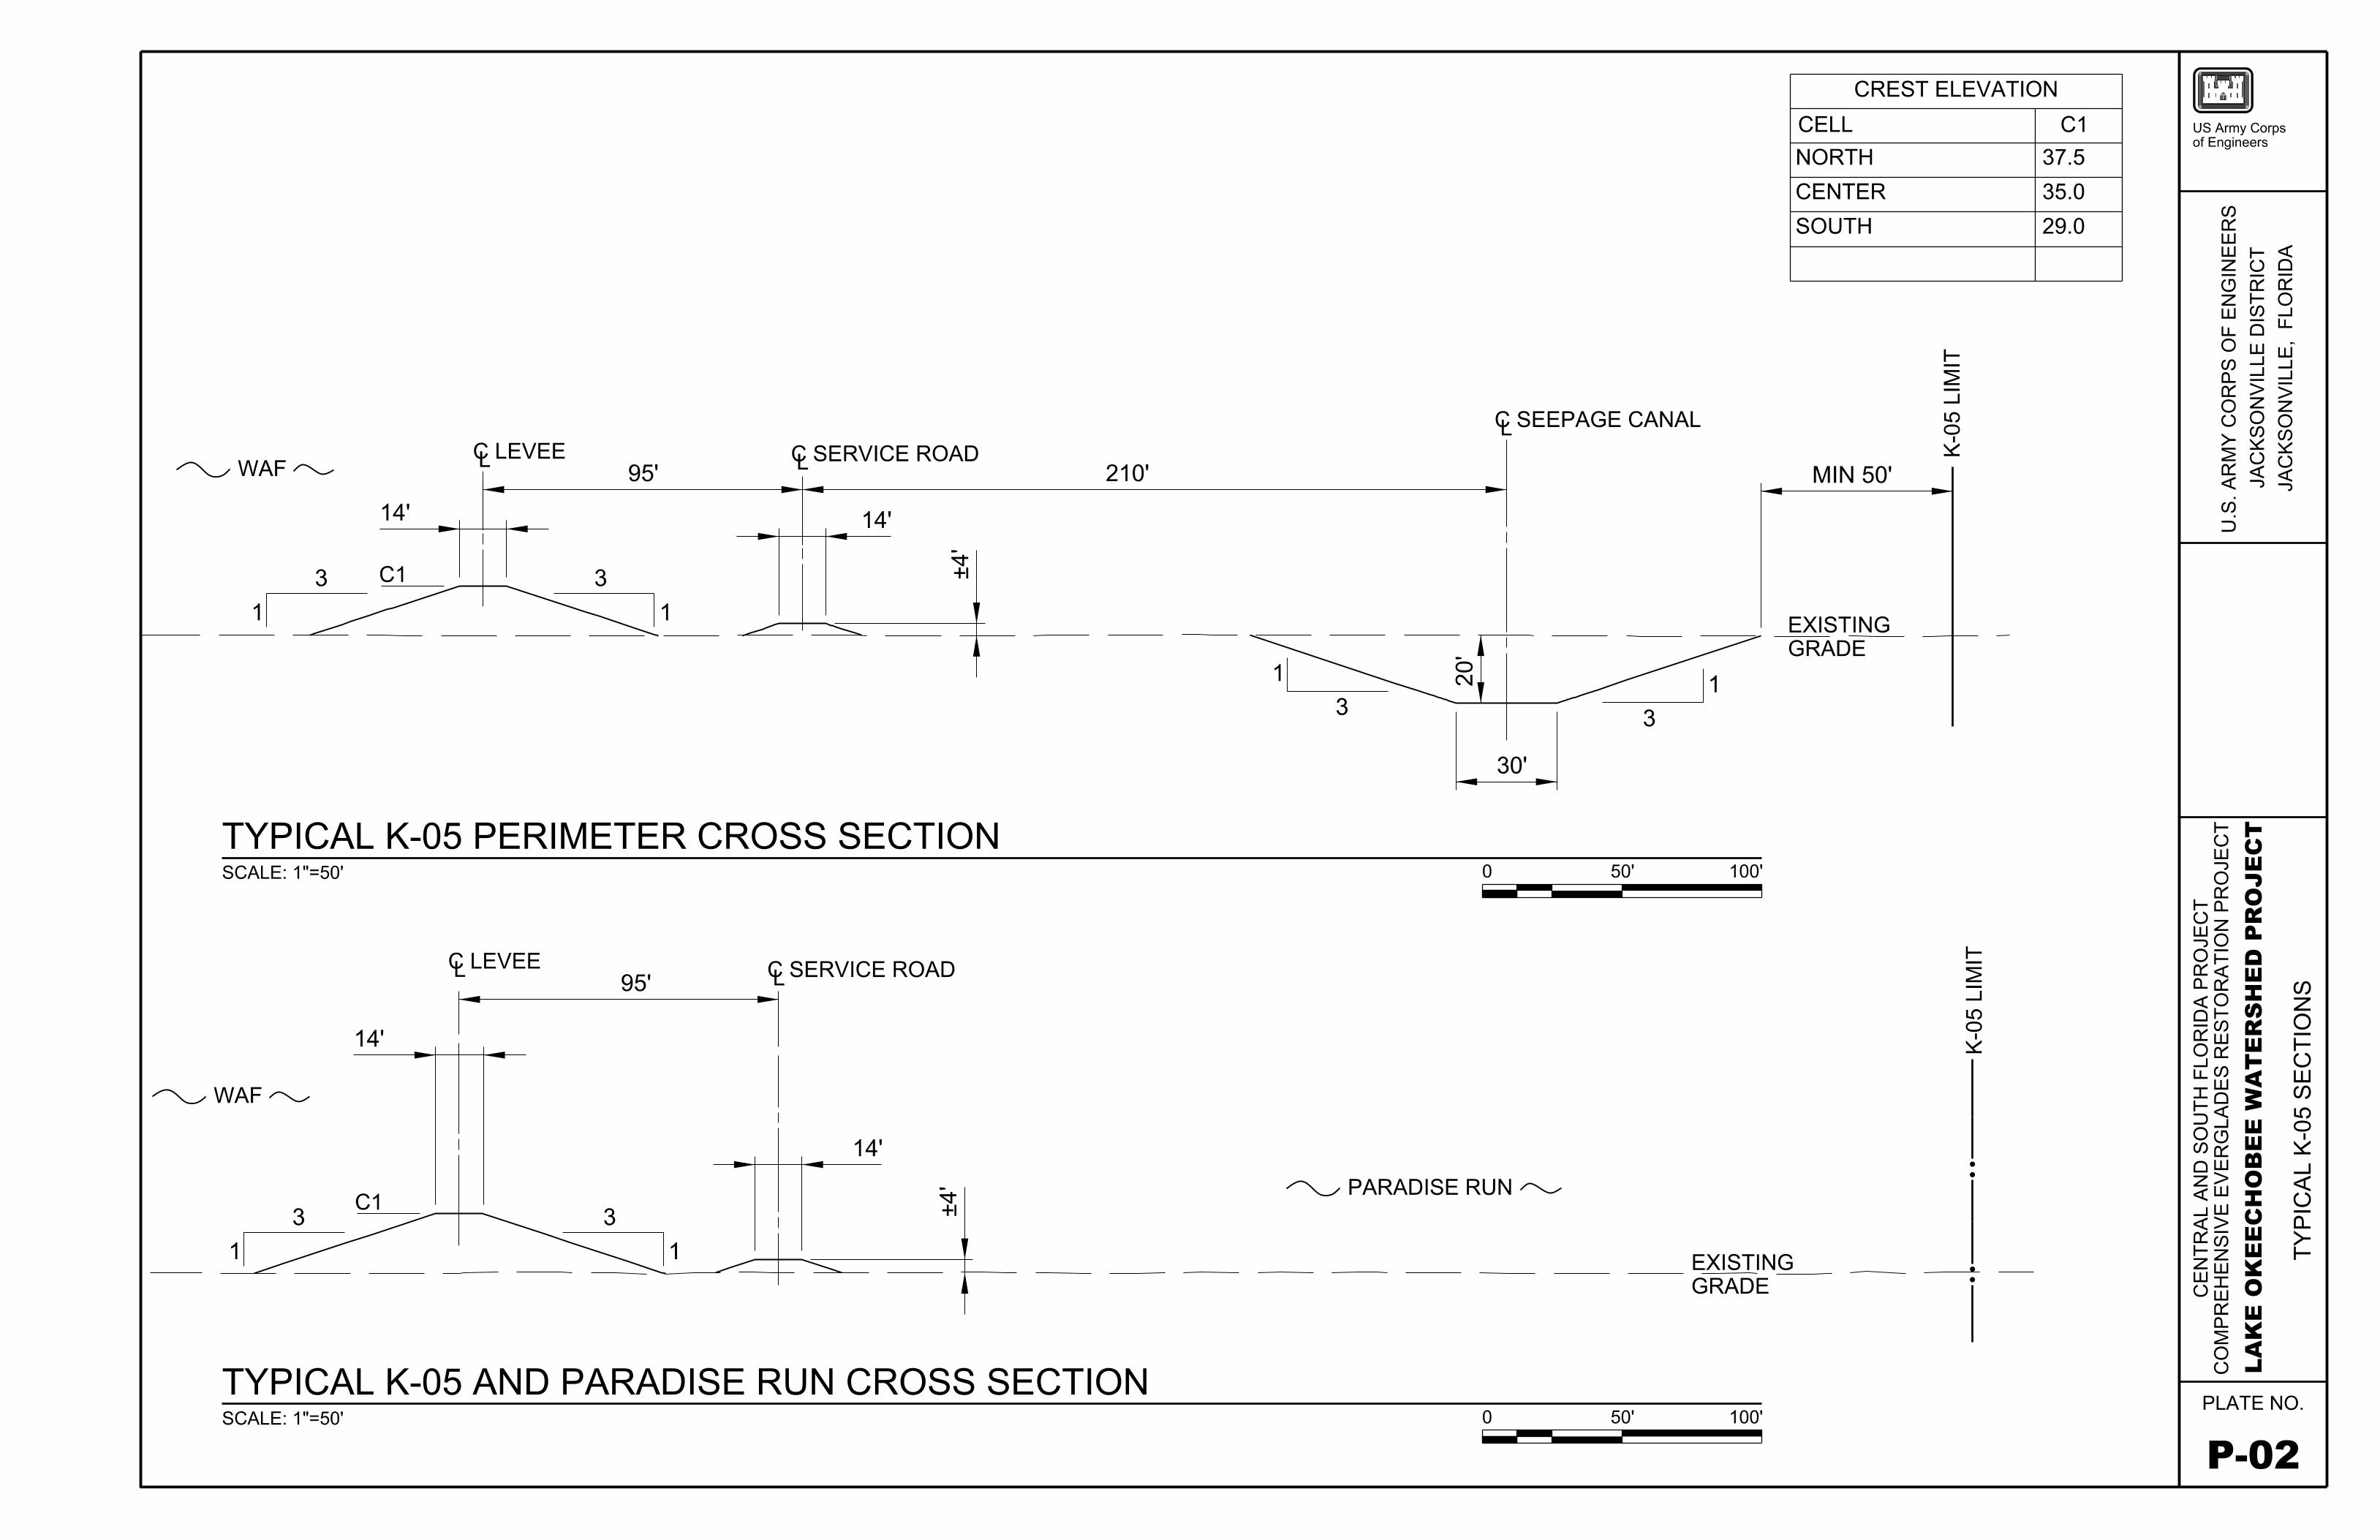
~WAF'"'--Ce_ LEVEE
95' Ce_ SERVICE ROAD
21 O'
14' 14' I
3 C1 3
11 ~ 11 ------
TYPICAL K-05 PERIMETER CROSS SECTION SCALE: 1 "=50'
Ce_ LEVEE 95'
Ce_ SERVICE ROAD
14'
~ WAF '"'--
14' -
3
---
TYPICAL K-05 AND PARADISE RUN CROSS SECTION SCALE: 1 "=50'
CREST ELEVATION
CELL C1
NORTH 37.5
CENTER 35.0
SOUTH 29.0
I--~
Ce_ SEEPAGE CANAL ....J LC) a
1~1 __ 3
- . 0 N.
0
30'
~ PARADISE RUN '"'--
0
11 ---3
50' 100' '
MIN 50'
EXISTING GRADE
EXISTING -- --
GRADE
50' 100' '
~
I--~ ....J LC) a ~
• •
• •
US Army Corps of Engineers
en c::: w w I- <( zoo B ~ c::: z I- 0 w en ...J LL O LL
Owu.j en ...J ...J a.. _J _J
c::: > > ozz ooo >- en en ~ ~ ~ C::: 0 O <( <( <(
...,...,
en . =>
I- ... 0 CJ ~ ILi 0 -,
1-8: 0 Oz g: ~o a. o- C11 8:~ ILi <( 0 :z: CJ)
U) z 0 1- M o_ c::: ~ ... 0 c::: ILi lo
w CJ)
Lien tI w ;;!: 1-0 --6 ::i ILi ~ en~ ILi ~ ow m _J
z> 0 <( <( w :z: () ...JW CJ -<( ~ a.. 1-c::: en ILi >-z z ILi 1-w w ~ 0~ 0
c::: ILi ~ ~ 8 j
PLATE NO.
P-02
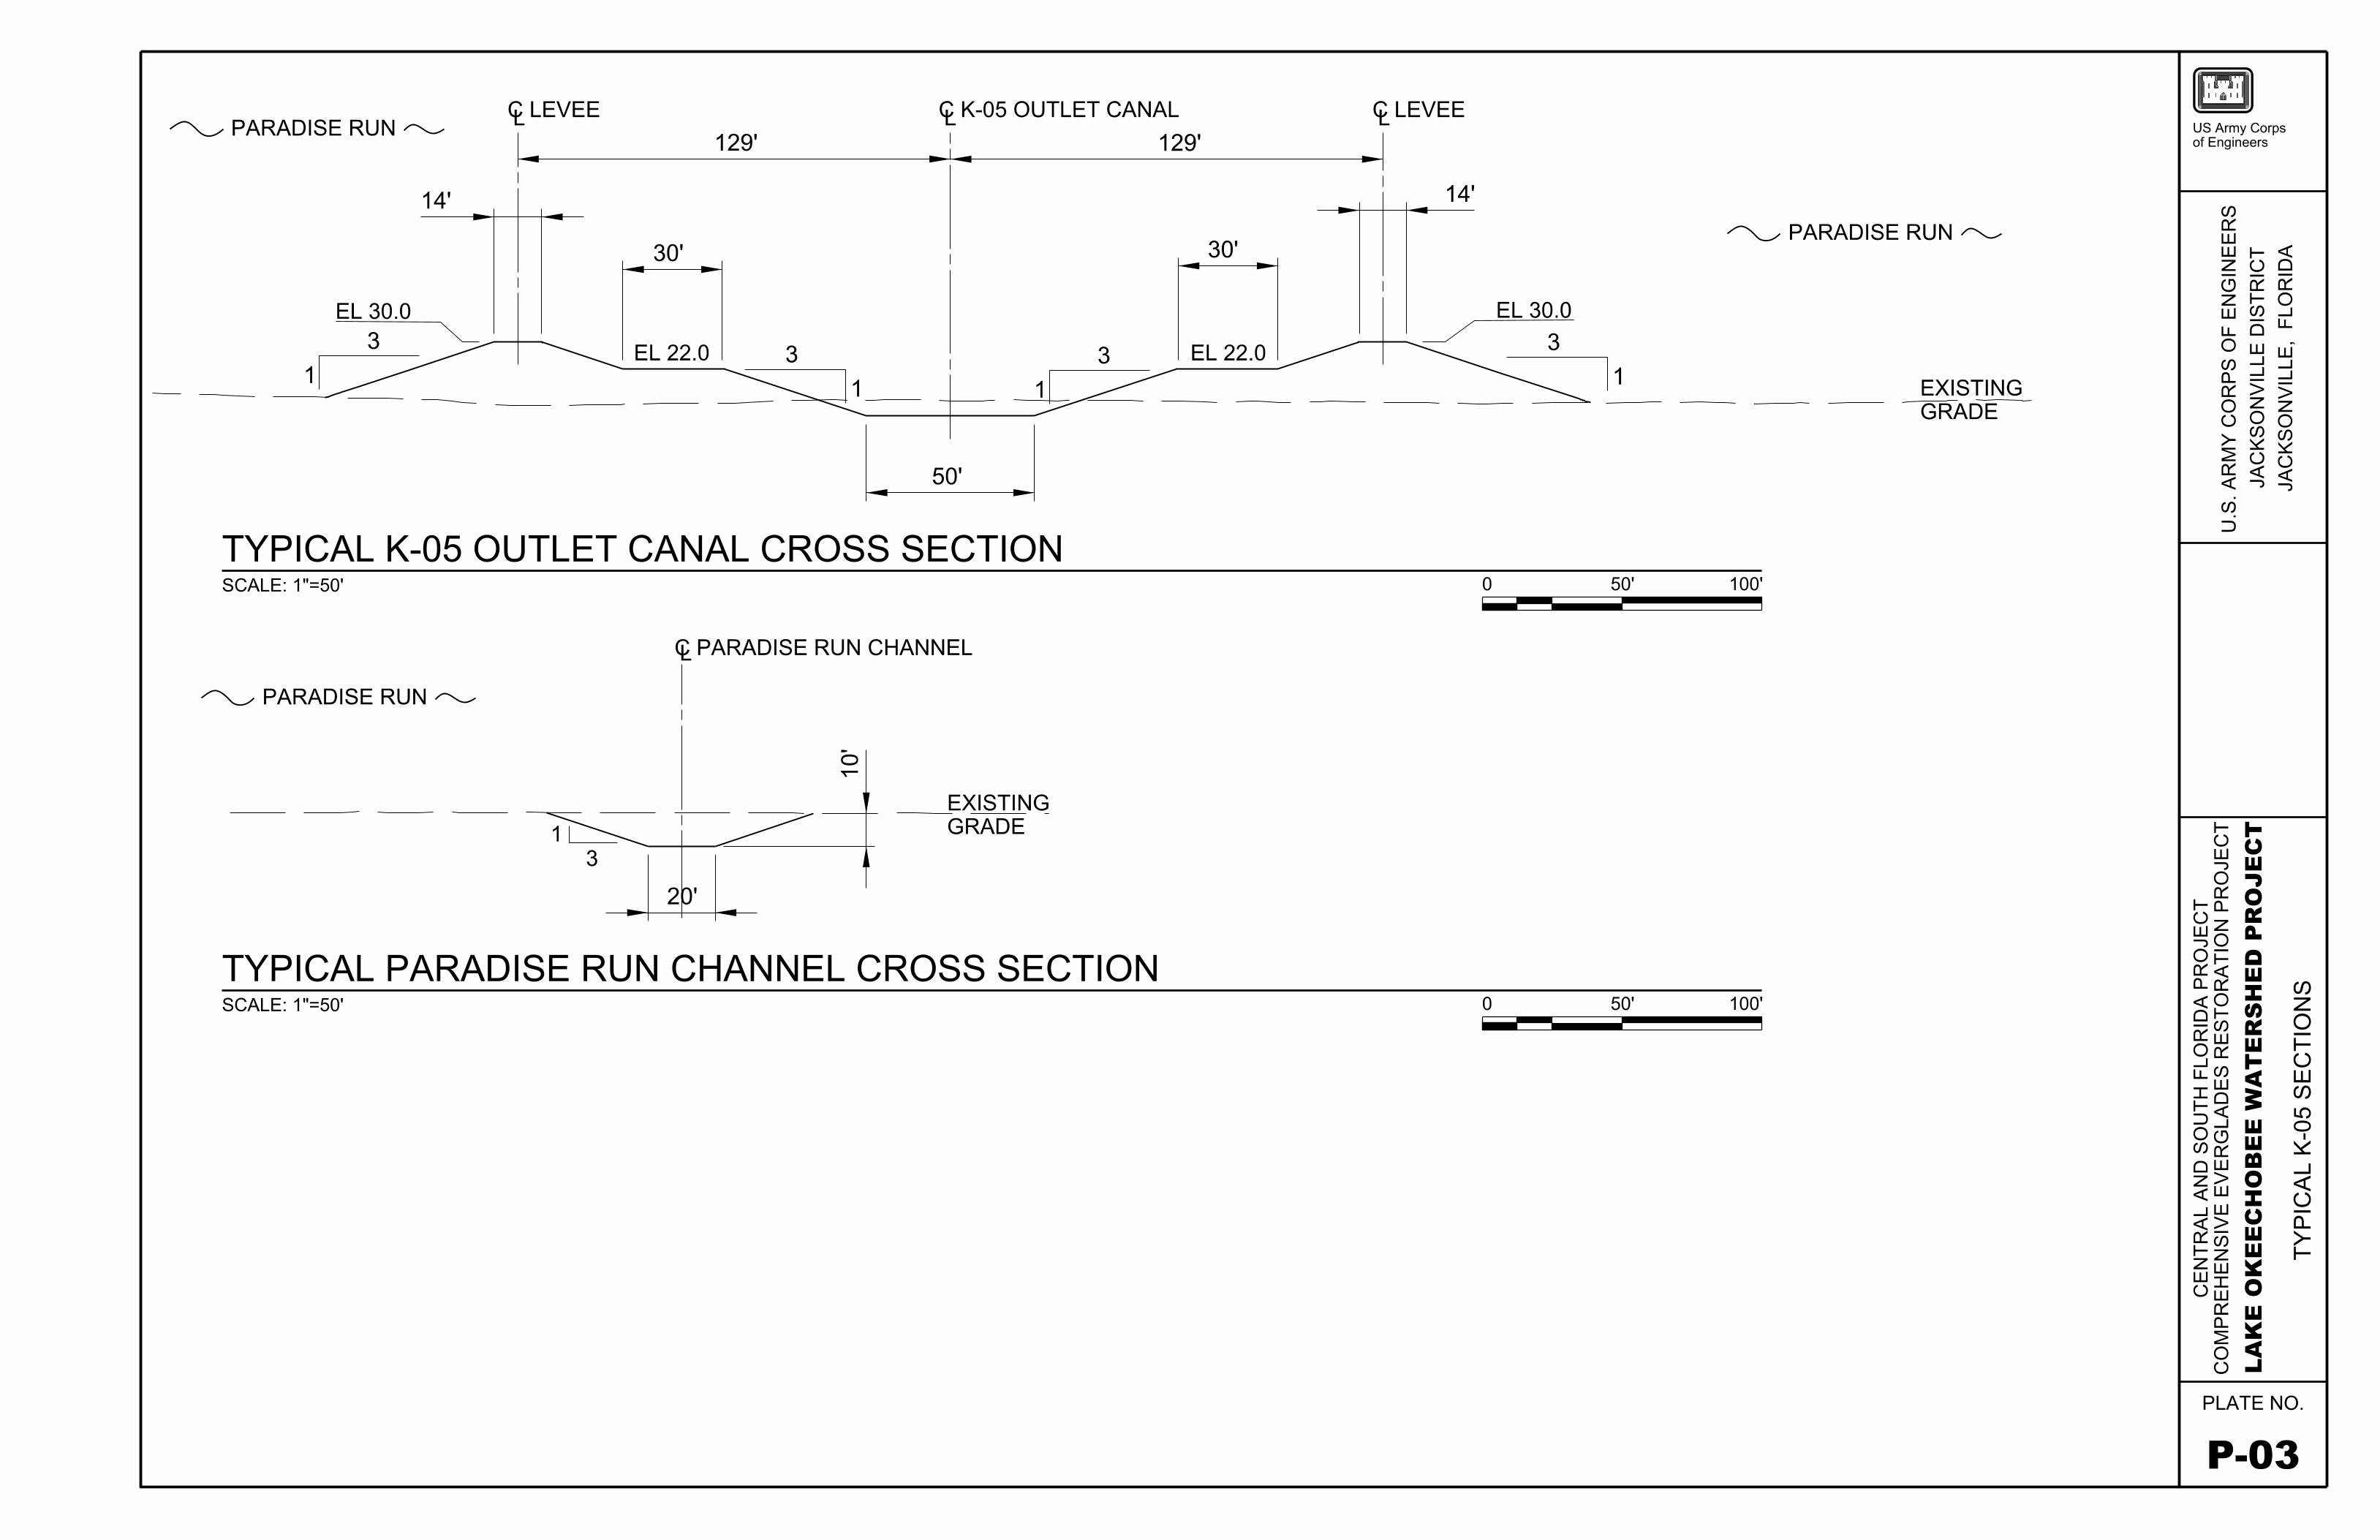
~ PARADISE RUN r--..-<t_LEVEE
1- 129'
ct_ K-05 OUTLET CANAL
I 129' .1. 14'
30' I 30' I
EL 30.0
3 EL 22.0 3 3 EL 22.0 11 I
1 11 ~ -
50'
TYPICAL K-05 OUTLET CANAL CROSS SECTION SCALE: 1 "=50'
~ PARADISE RUN CHANNEL
~ PARADISE RUN r--..-I
-0 T""
' EXISTING -
1~ I GRADE
3 '
2 J'
TYPICAL PARADISE RUN CHANNEL CROSS SECTION SCALE: 1 "=50'
ct_ LEVEE
-1 14'
I
EL 30.0
~
0
0
11
50'
50'
~ PARADISE RUN r--..-
100' '
100' '
EXISTING GRADE
US Army Corps of Engineers
en c::: w w I- <( zoo B ~ c::: z I- 0 w en ...J LL O LL
Owu.j en ...J ...J a.. _J _J c::: > > ozz ooo >- en en ~ ~ ~ C::: 0 O <( <( <(
""') ""')
en . =>
I- I-0 u w ""') w 0 -, c::: 0 I- a..
Oz ai:: ~o IL o- Cl c::: I-a..~ w
:z: <(0 U) OI--en ai:: c::: w 0 c::: w Lien I-; IW 1-0 =><( o_J w en~ w ow m z> 0 <(W :z: _J w u ~~ w I-en w zZ
~ WW 0~ 0
c::: w a.. ~ ~
0 cc 0 ..I
CJ) z 0 -I-u w CJ)
LO 0
I
~ _J
<( u -a.. ~
PLATE NO.
P-03
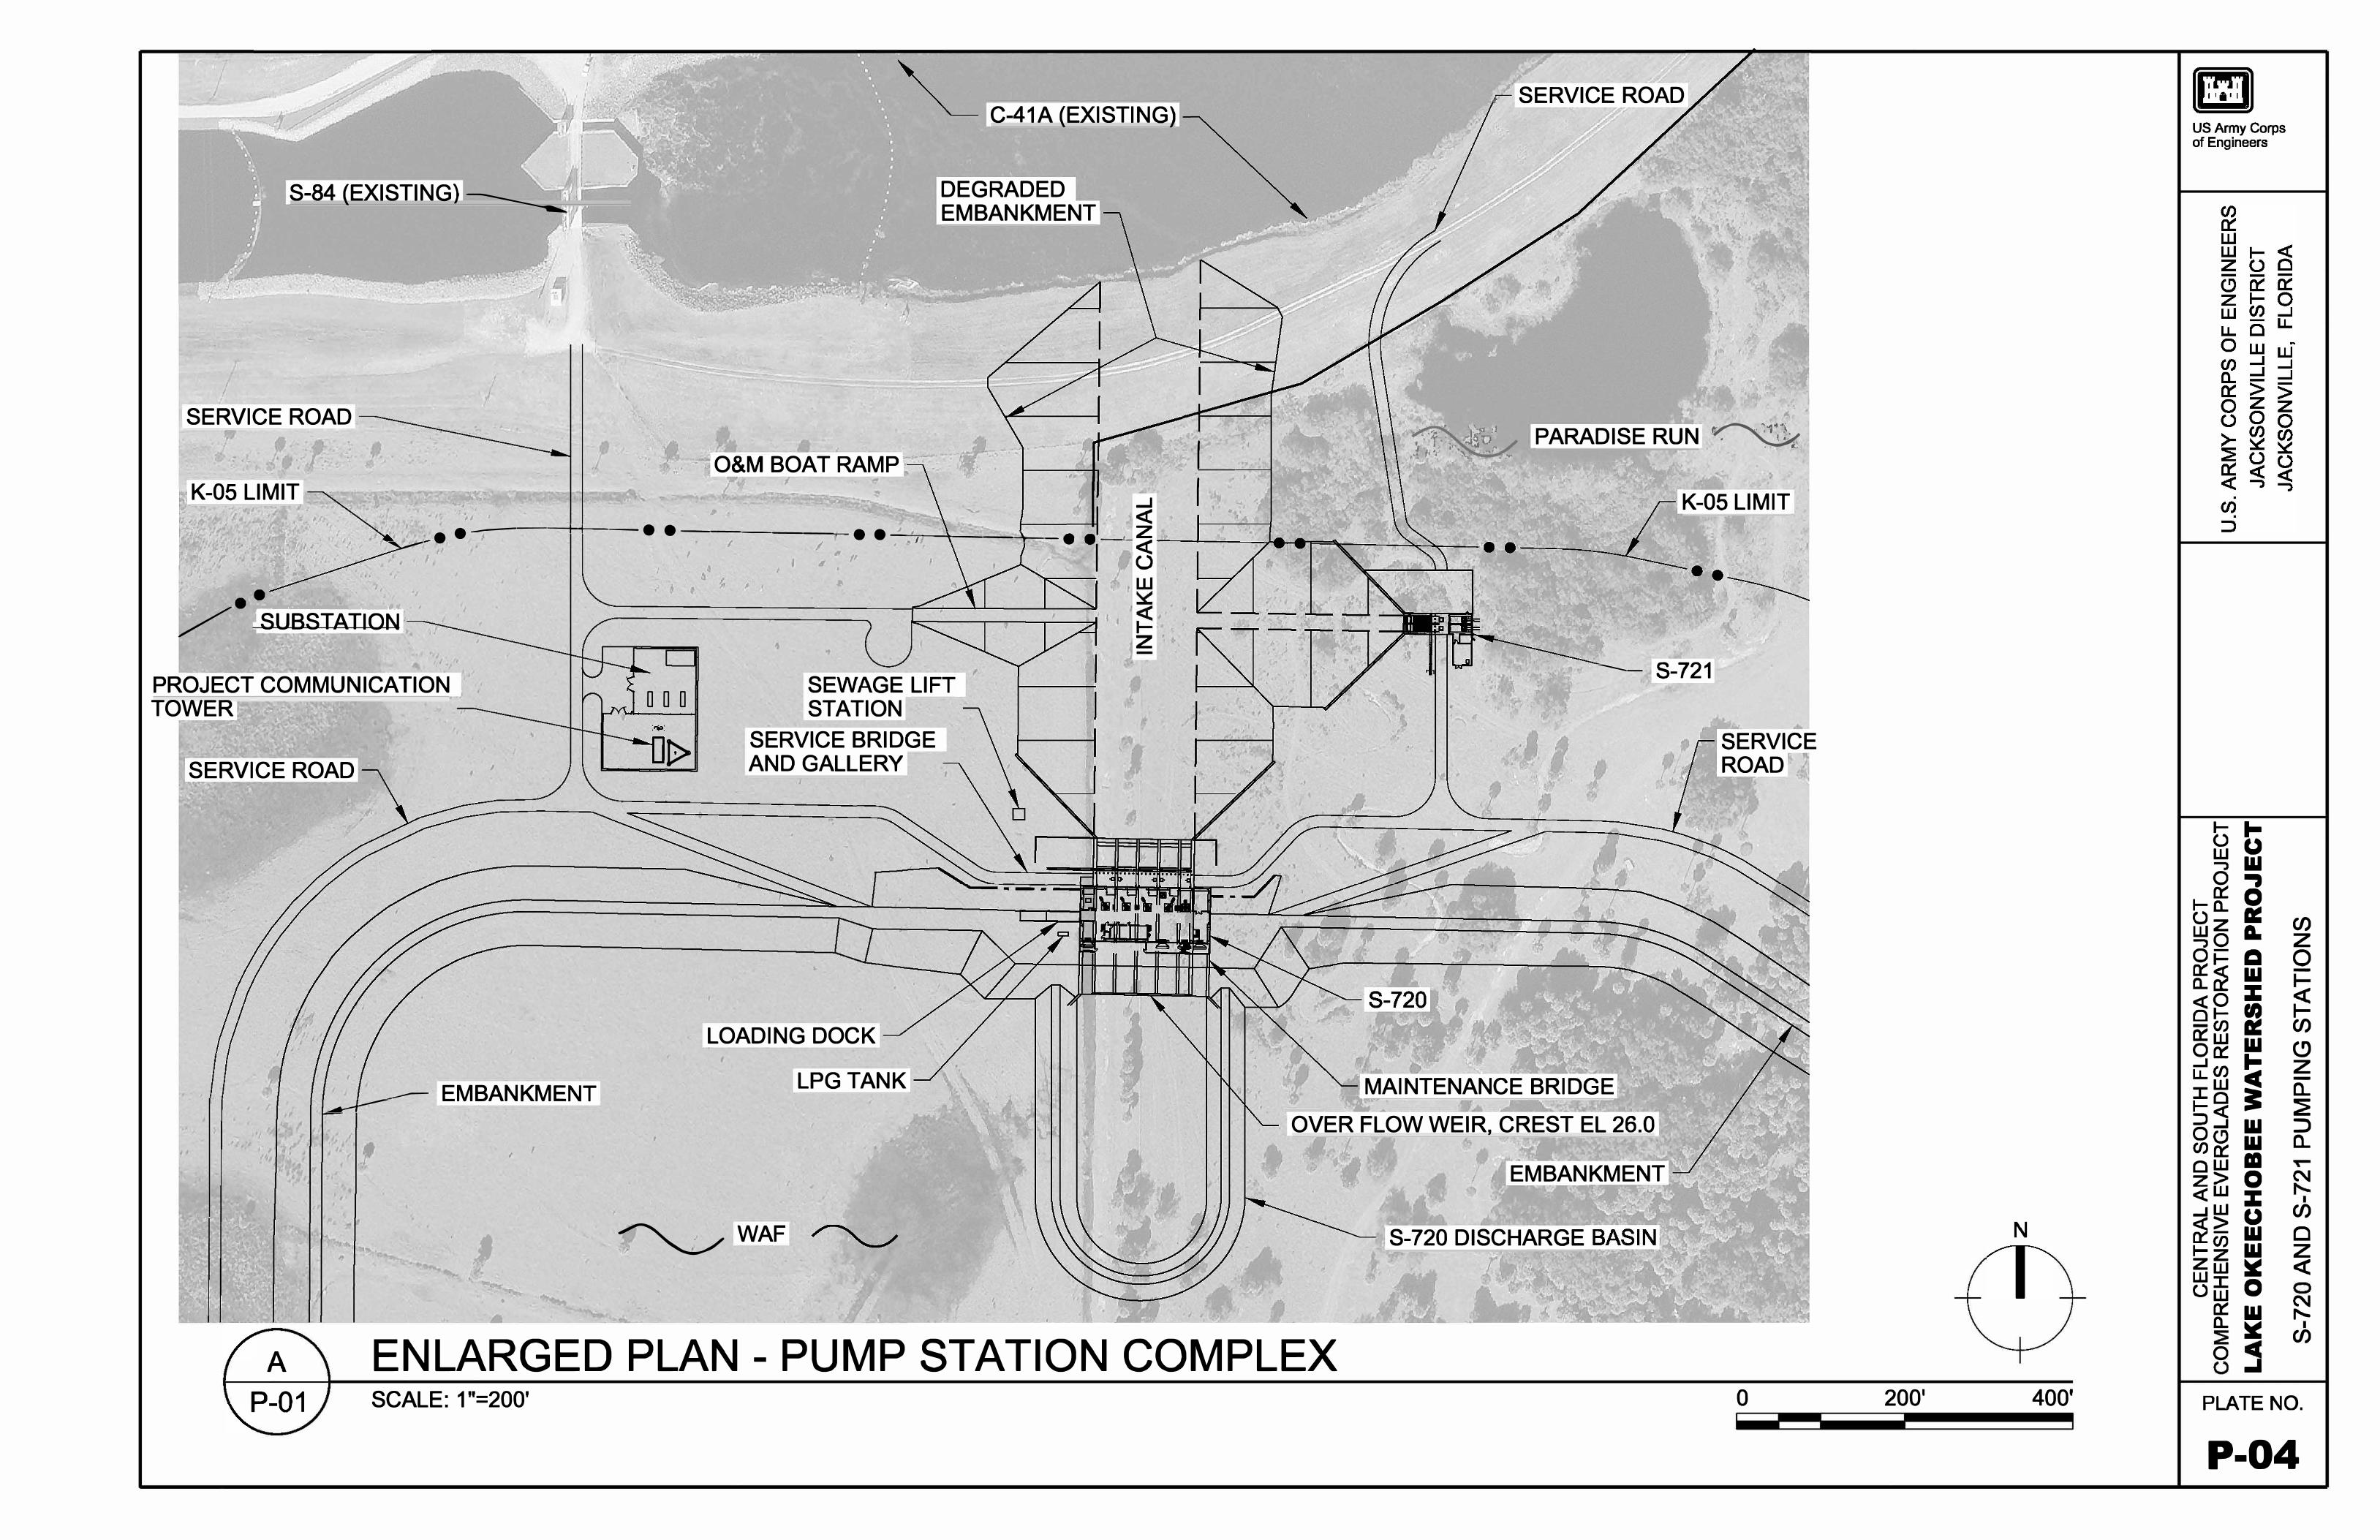
en 0::: w w I- <( z (.) Cl - ~ -(!) 0::: z I- 0 w en ....J
u. Cl u. 0 w -w ....J en ....J a.. ....J ....J 0::: > > ./ 0 z z
0 (.) 0 >- en en
~ ~ ,, ~ (.) (.) - , 0::: <( <( <( -, -, . • en ;, .
:::::> • -
• ~~ ••
' ~ , ~ I. I , w ~ I ::::,:::: • ;5
..
-,
I-
T"""
0
I
�
�
• ,. I '
, SERVICE ROAD � C-41A (EXISTING)
US Army Corps of Engineers
DEGRADED1 " EMBANKMENT
I
•SERVICE ROAD PARADISE RUN �
O&M BOAT RAMP� I �
K-05 LIMIT ...J I • K-05 LIMIT ,,' <(
. z
S-84 (EXISTING)�
, � •, I
•----++--, ••--I
---I
�, ••-'' . �,,---\------Cc+---c� <(. ·,' ,,I t)'
'
••
V ..-S-UB_S_T-AT-10-N.... I
PROJECT COMMUNICATION TOWER
SERVICE ROAD f I
•
D D D
t>
•
..
SEWAGE LIFT STATION
SERVICE BRIDGE AND GALLERY
LOADING DOCK ,
---
I I
z·
------ S-721
MAINTENANCE BRIDGE --�==O VER FLOW WEIR, CREST EL 26.0
EMBANKMENT
------ S-720 DISCHARGE
SERVICE ROAD
A ENLARGED PLAN - PUMP STATION COMPLEX P-01 SCALE: 1 "=200' 0
N
200' 400'
I- I-(.) uw
w0 .,0::: 0I- D..
Uz a::A. �o
o- Cl ��
w <( 0 :z: OI- = - en0::: w
w0 0::: I-
owz>
�� wI- en
(.) [TI 0 0::: wD..
�
0 ..I
Cl) z
0-
� Cl)
C)
C'\I r-,.. Cl)
PLATE NO.
P-04
z-..J enLL WLPG TANK I
a.--- EMBANKMENT.---1-- Io ;I- <(::J ..J =>
�
w' , a.Oc.9 en c::: w, ' I
Ill 0 C'\II
<( W ..J W
, :z: u Cl)
Cl
I �WAF w z
<( • z Z
W W
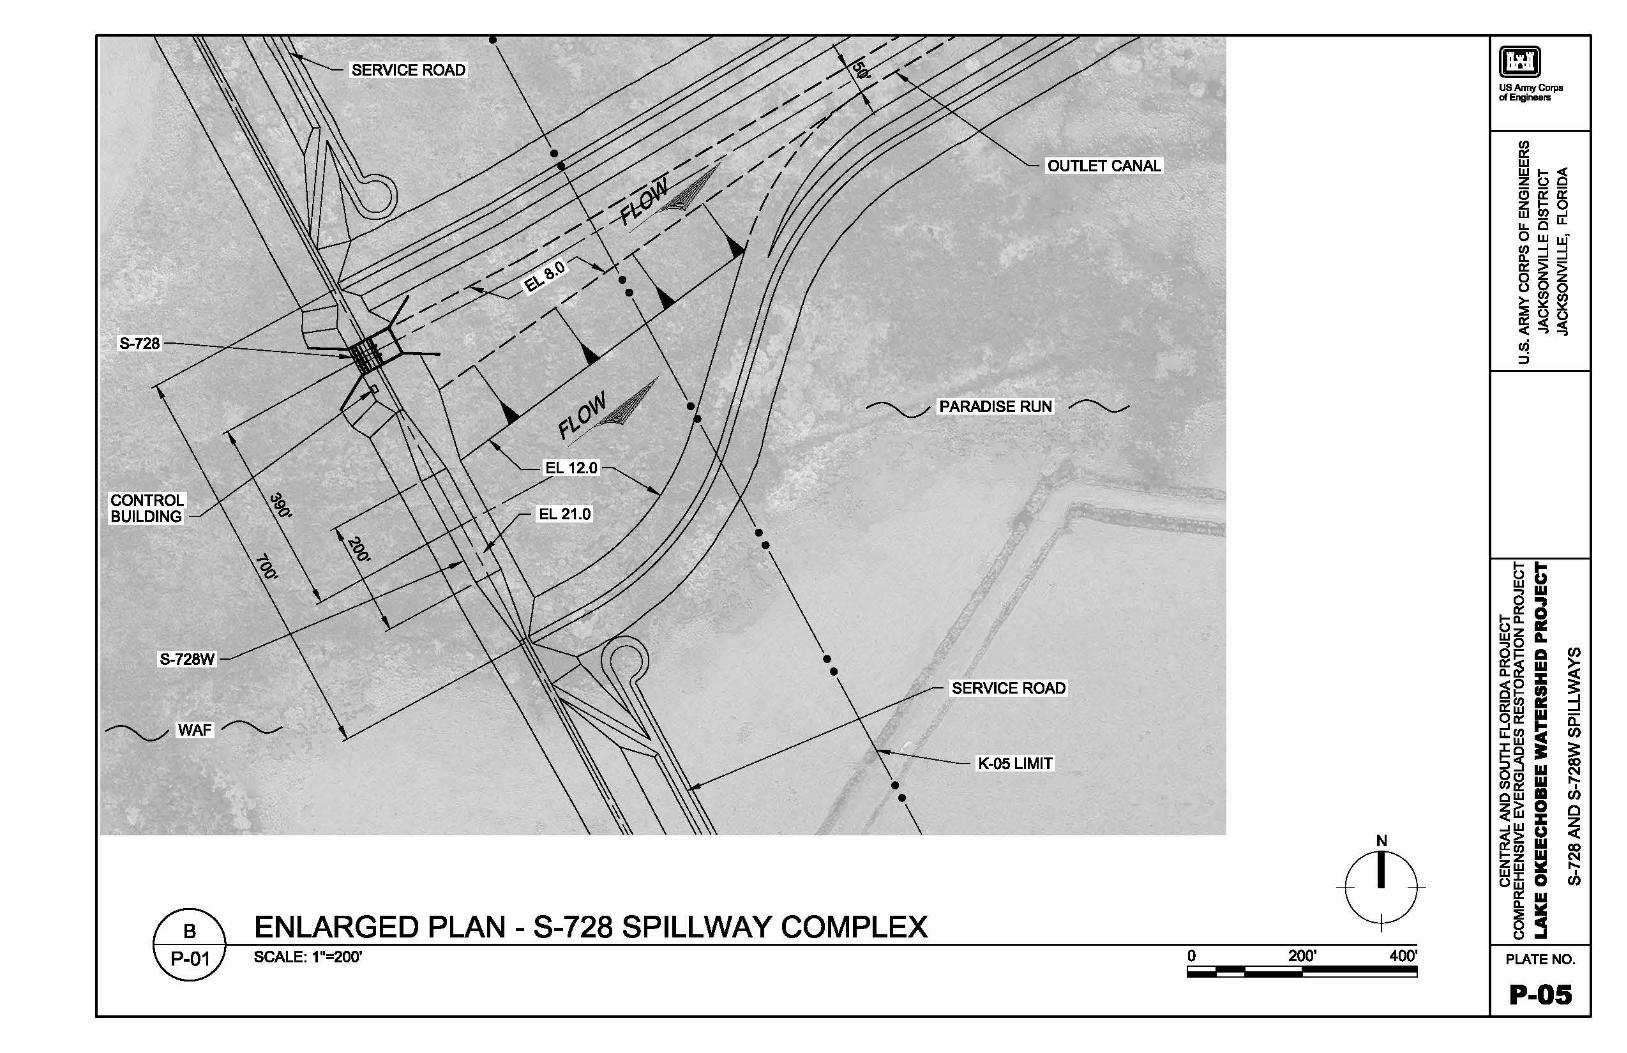
- - -
SERVICE ROAD
OUTLET CANAL
~ PARADISE RUN ,,.,-......,__,
~WAF,,.,-......,__,
US AnnyCorpa ofEngineers
N
ENLARGED PLAN - S-728 SPILLWAY COMPLEX SCALE: 1"=200' 0 200' 400' PLATE NO.
P-05
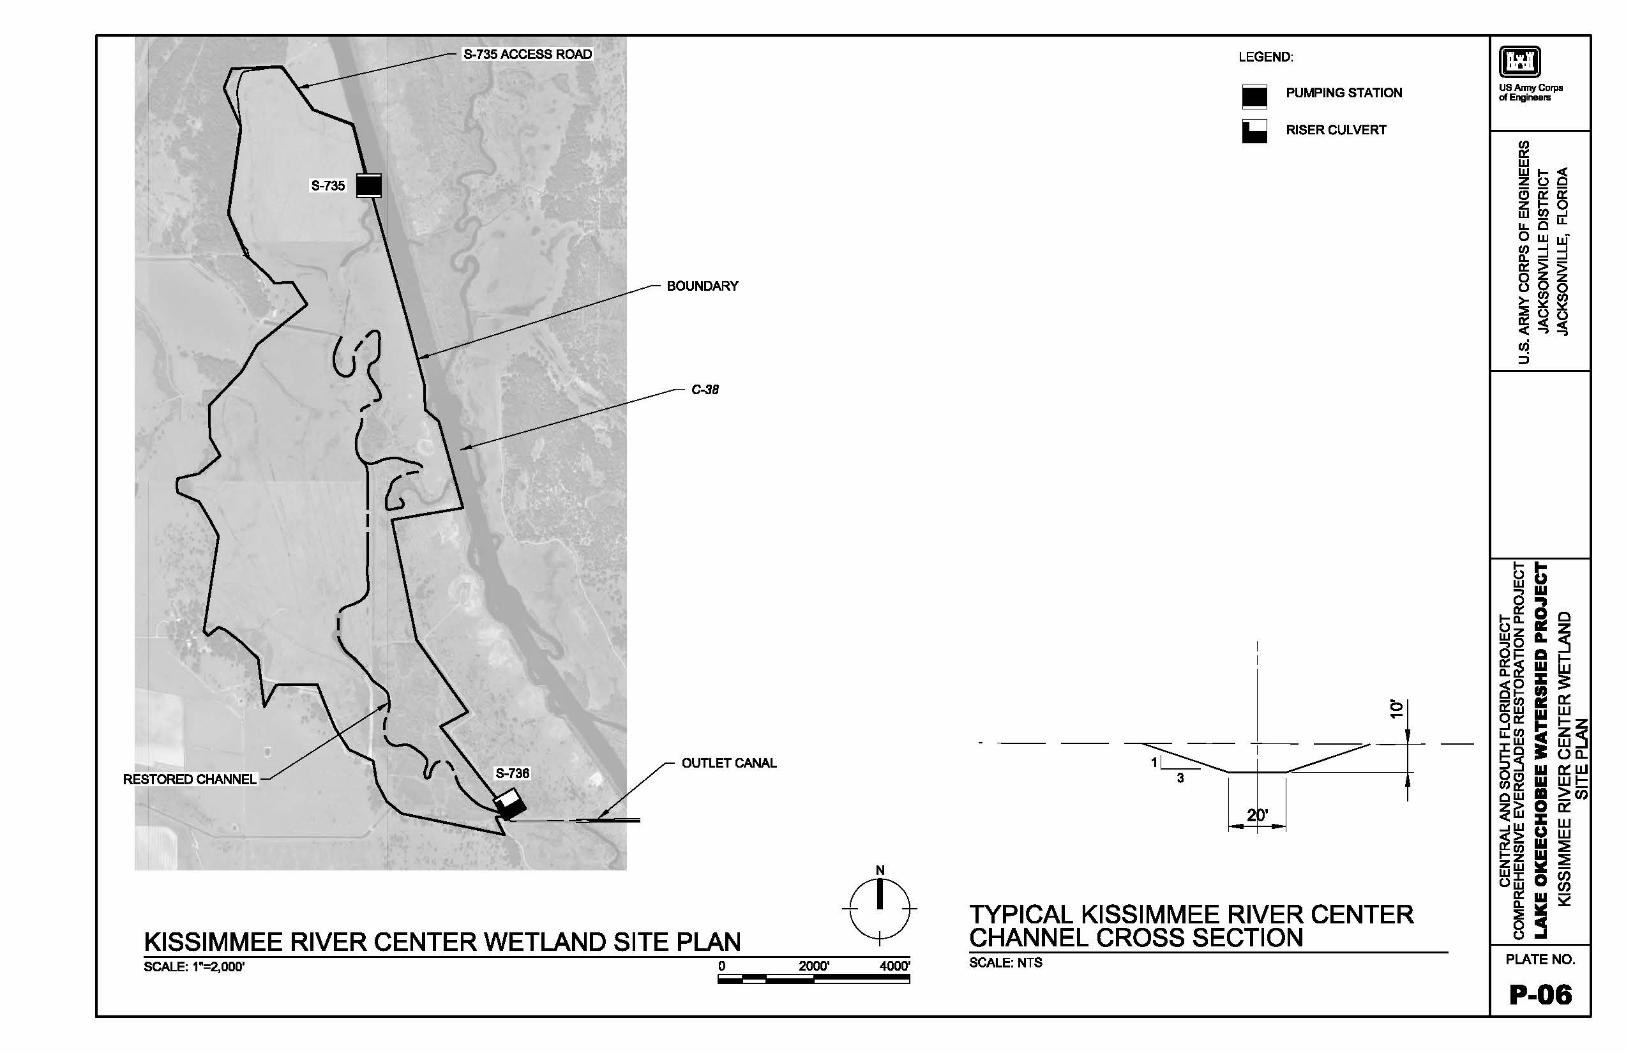
S-735 ACCESS ROAD
S-735
BOUNDARY
C-38
I
j
RESTORED CHANNEL ~--x OUTLETCANAL
KISSIMMEE RIVER CENTER WETLAND SITE PLAN SCALE: 1"=2,000' 0 2000' 4000'- - - -
LEGEND:
II PUMPING STATION
._ RISER CULVERT
0 .....
1 L..:::::::: 3
2'
TYPICAL KISSIMMEE RIVER CENTER CHANNEL CROSS SECTION SCALE: NTS
US AnnyCorpa ofEngineers
PLATE NO.
P-06
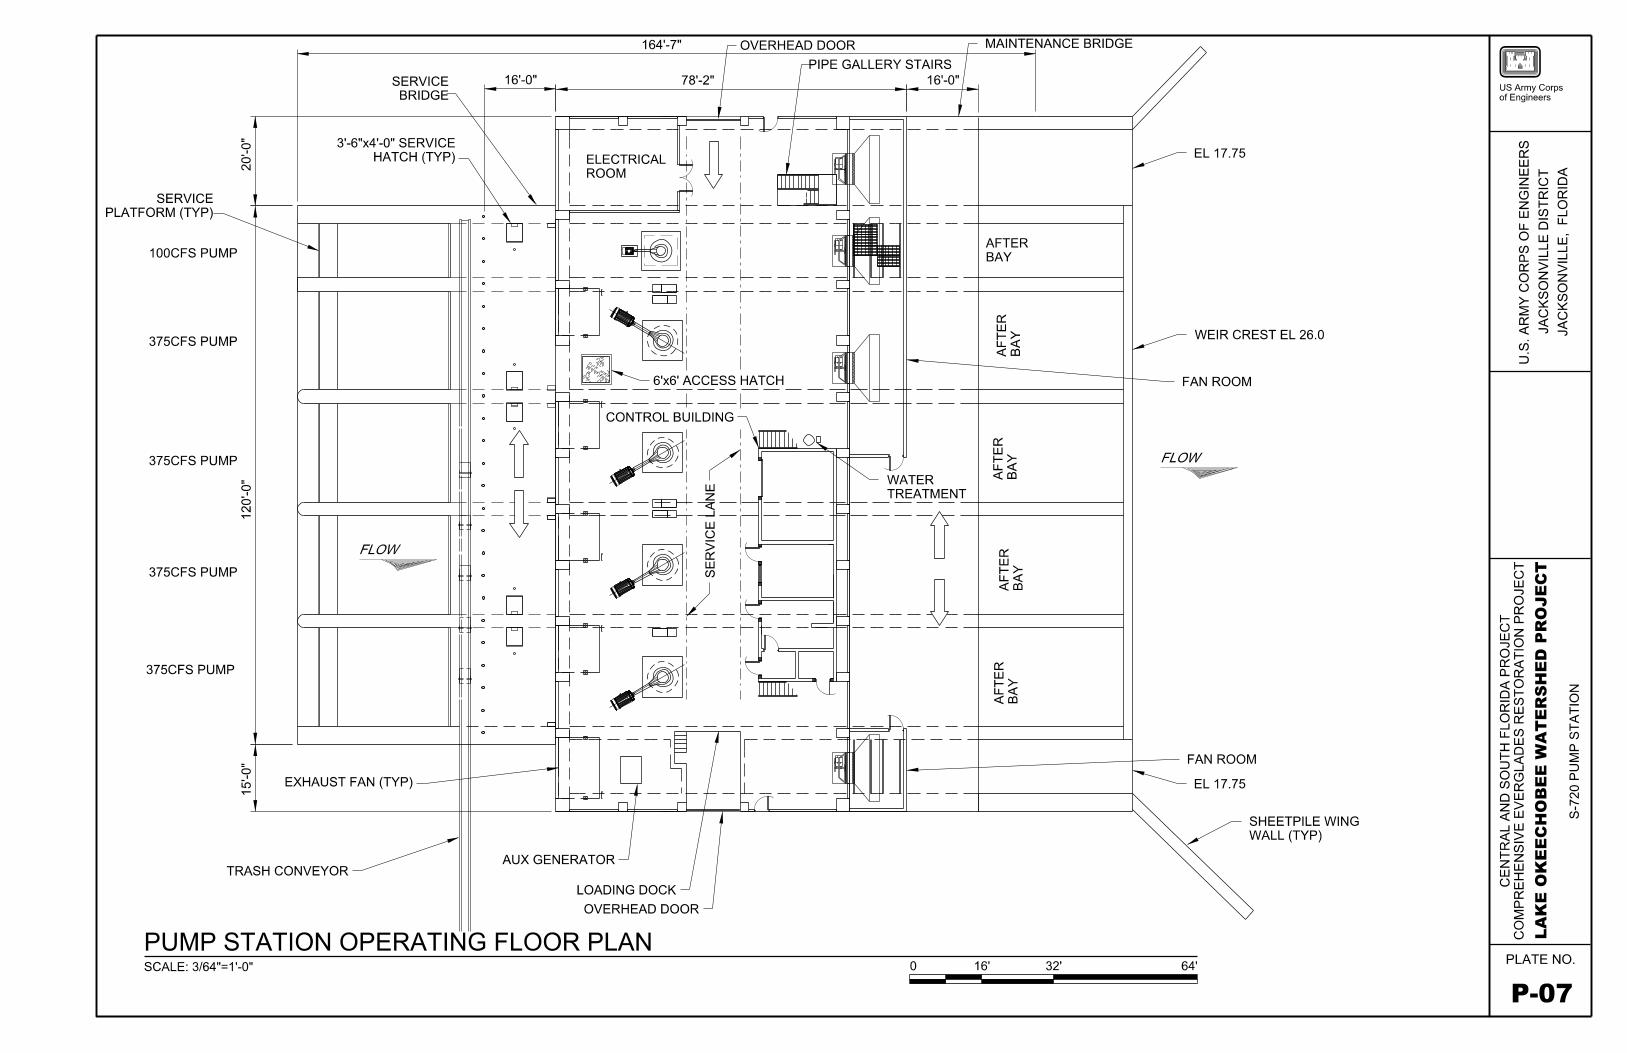
a I
a N
164'-7" , OVERHEAD DOOR , MAINTENANCE BRIDGE
SERVICE 16'-0" 78'-2" / /IPE GALLERY ~T~I~~ .. / ,
BRIDGE\ I ' / I J
~ EL17.753'-6''><4;;1~~~Rmp~\\\ f ELECTRICAL1-I n : ,1 1Jj1] ,/~ - - - -
\ I ROOM V ' 1111111111 l~
SERVICE \ I , ! I 1111 ""-
PLATFORM (TYP)---------------~f---~--------ll=ll-:-b. _ i::::-----111
~1r1
! - -
1
:- - _~cl===-----!-------~ 100CFS PUMP ----...._ AFTER
• ~ ~, , BAY
375CFS PUMP
375CFS PUMP
375CFS PUMP
375CFS PUMP
a I
a N T""
0_, I!) T""
f--_.__c______~1-11-. - - - - 7 L _____ ~ __ !- _ _ _ _ _ _ __ --+----------1 ---- r r--~ 1 --
1--------------+-----------1
• I CTI ' '
: R------" ~: : C /- ~ ~ I~ WEIR CRESTEL 26.0
l~-'--L__________il_ll-ll-: -□- ch~f' :~. lccESS iHATCH_ - ~ ~ --- - -----4c~<(~-a:i--_-_-_-_-_-_-_-_-_-}L- FAN ROOM
:-i-c :~"~ILDING\~~:--'=--- --. LJ I _.,, '1 (i ,
~ WATER
er: w t;: ~<( Ill
• I , w 1~_.__c__________il_ll-ll-. _ -fl- c,-- _ -~~-,- ___ = __TREATMENT
II : - v C : , jJ1- ,-:=-==-~= - - - -u---+-cr:-----------a FLOW
I I I w = w o 7 I, Cl) t=~
1,------L-------'----------____J_L__jj.._ll-: -□ --7 l_ - - - ~ ~ l)_ -Lt- - - ~- - - - - -R----+----<((()-------a .-□ -- I r - - rn : - - !- ~- -7= - - - - - -II . . I - ~✓-,: iUL l=f O I - .,,1 i i WillJ.L.. \1 .
I " - o _c 7~ ,-----,----______, - r=1"i===~r-n·- - -
FLOW
'---------111--11-------------l - - - 7 s i - - - - = i7 - - - -I IL ~ L--------+----------7-- FAN ROOM
L-- -1 7 I EXHAUST FAN (TYP)----------rr ------- EL 17 75
~ -t -n- - -~~ - ~_r[ - - - 1 ~~ - - - - . ~-------------11--11-------
AUX GENERATOR j . TRASH CONVEYOR~
.,,.,,----- SHEETPILE WING / WALL(TYP)
LOADING DOCK
OVERHEAD DOOR
PUMP STATION OPERATING FLOOR PLAN SCALE: 3/64"=1 '-0" 0 16' 32' 64'
US Army Corps of Engineers
I- I-() CJw --, w 0 -,0::: 0I- c..
Oz ,:ii=
~o A. o- Cl8:~ w <(0 :z::
Cl)DI--Cl) ,:ii=O:::w wOcr: [I Cl) I-;IW 1-0 =><(o....1 w Cl)~ w
mow z> 0<( w :z:: ...J w CJ ~~ wI- Cl) wzZ
~WWoiE 0
0::: wc.. ~ ~ 0 cc () ..I
z 0 j:::
~ Cl)
c.. ~ => c.. 0 N I'--
I Cl)
PLATE NO.
P-07
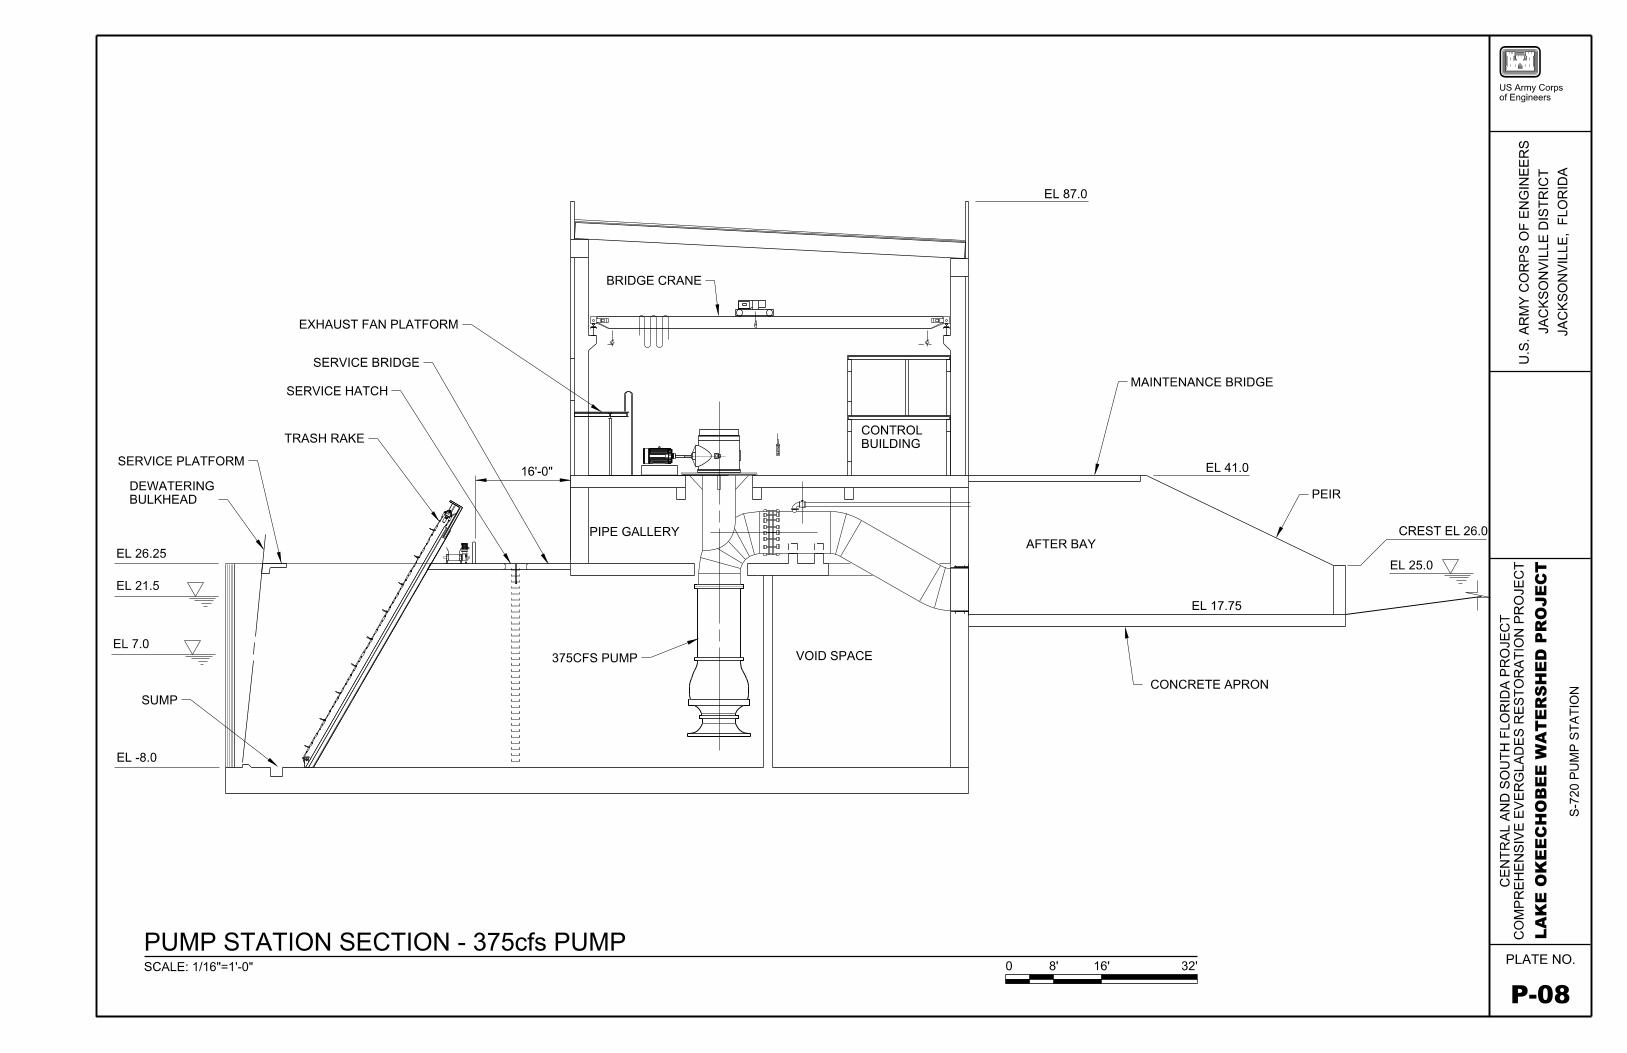
SERVICE PLATFORM
DEWATERING BULKHEAD
EXHAUST FAN PLATFORM
SERVICE BRIDGE
SERVICE HATCH
TRASH RAKE
BRIDGE CRANE
16'-0"
PIPE GALLERY
CONTROL BUILDING
EL 87.0
EL 26.25 \>-1-c,lU',,----.----.-----.--.LJ-.J AFTER BAY
EL 21.5 V
EL 7.0 y 375CFS PUMP VOID SPACE
SUMP
EL -8.0
PUMP STATION SECTION - 375cfs PUMP SCALE: 1/16"-1'-0" 0 8' 16'
MAINTENANCE BRIDGE
EL 41.0
PEIR
CREST EL 26.0
~ -=--
EL 17.75
CONCRETE APRON
32'
US Army Corps of Engineers
I- I-(..) CJw --, w 0 -,0::: 0I- c..
Oz ,:ii=
~o A. o- Cl8:~ w <(0 :z:: DI- Cl) -Cl) ,:ii=O:::w wOo::: [I Cl) I-;IW 1-0 =><(o....1 w Cl)~ w ow m z> 0<(W :z::...JW CJ ~~ wI- Cl) wzZ
~WW(..) iE 0
0::: wc.. ~ ~ 0 cc (..) ..I
z 0
~ en a.. ~ =>a.. 0 C\I r--
I en
PLATE NO.
P-08
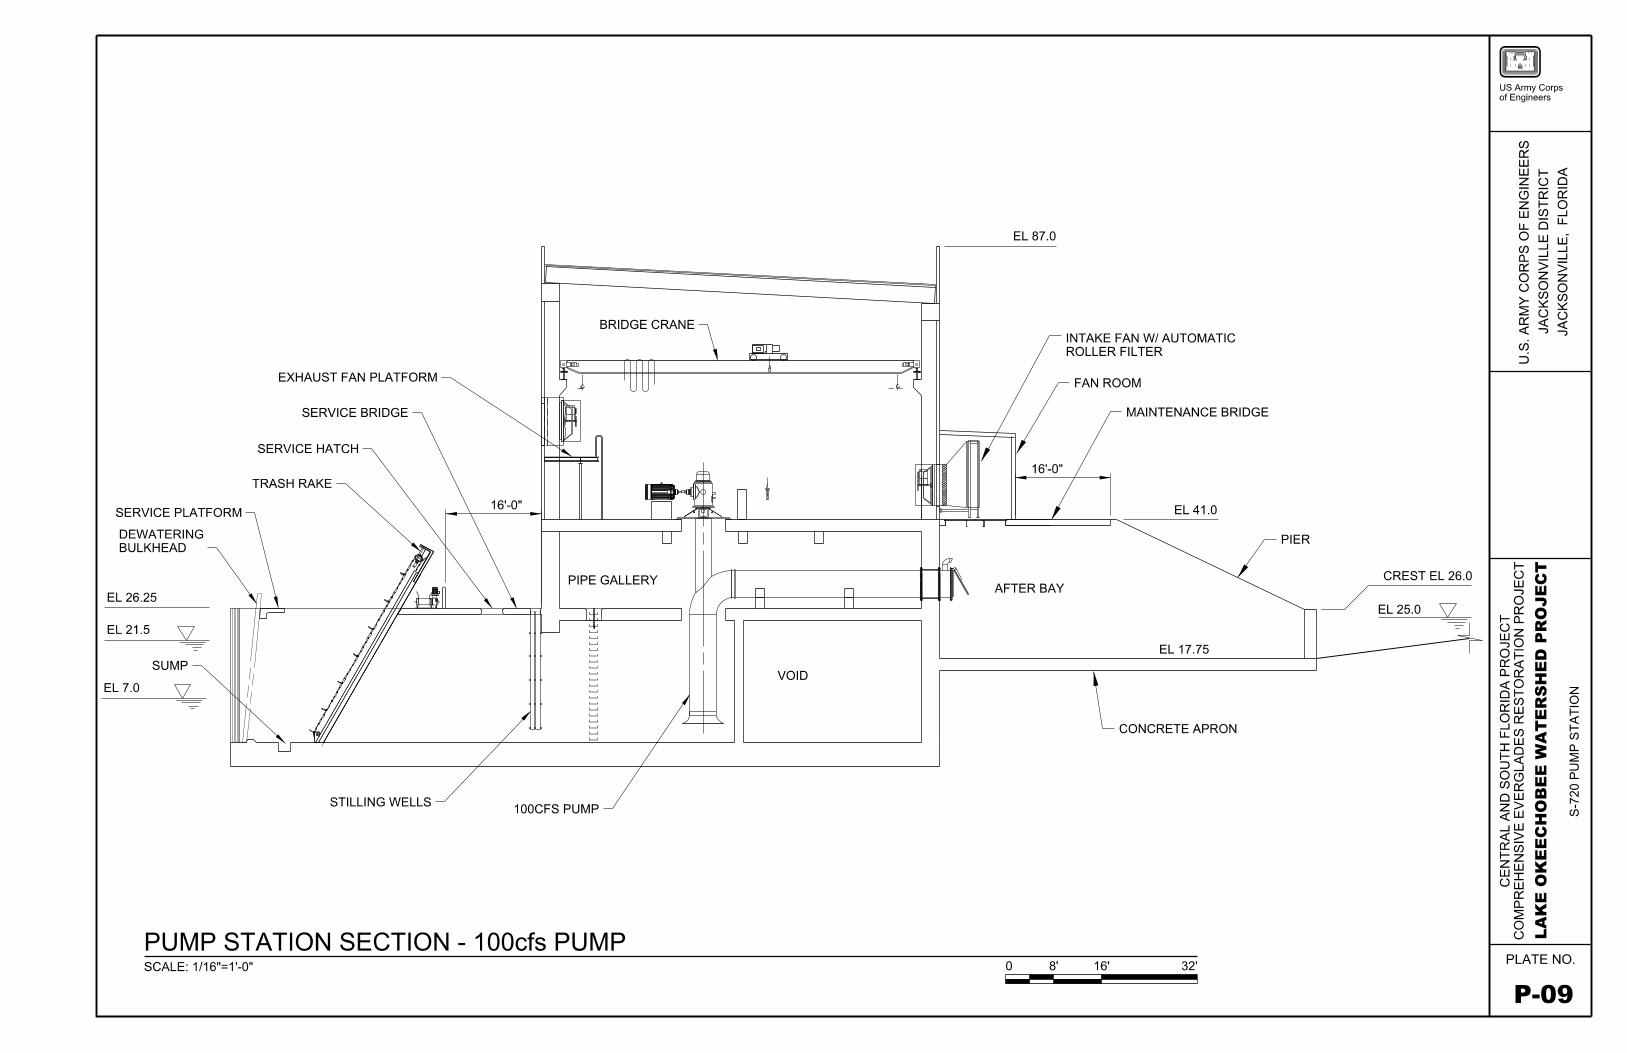
SERVICE PLATFORM
DEWATERING BULKHEAD
EL 26.25
EL 21.5 S7
SUMP
EL 7.0 S7
EXHAUST FAN PLATFORM
SERVICE BRIDGE
SERVICE HATCH
TRASH RAKE
STILLING WELLS
BRIDGE CRANE
16'-0"
PIPE GALLERY
100CFS PUMP
PUMP STATION SECTION - 100cfs PUMP SCALE: 1/16"=1'-0"
VOID
EL 87.0
INTAKE FAN W/ AUTOMATIC ROLLER FILTER
/
FANROOM
MAINTENANCE BRIDGE
f===/:::.~
16'-0"
EL 41.0
AFTER BAY
EL 17.75
CONCRETE APRON
0 8' 16' 32'
m US Army Corps of Engineers
Cl) Cl'.'. w w I- <( z (.) 0 CJ o:'. o:'. z I- 0 w Cl) _J LL 0 LL
0 w w Cl) _J _J 0..
_J _J Cl'.'. > >0 z z (.) 0 0 >- Cl) Cl)
:a: ~ ~ (.) (.)Cl'.'. <( <(<( --, --,
0 =>
PIER
I- I-CREST EL 26.0 (.) CJw
~ --, w 0 -, Cl'.'. 0I- 0..
Uz ,:ii=
~o A. o- Cl8:~ w <(0 :z:: 01- Cl) z -Cl) ,:ii= 0O'.'.w w ~00'.'. [I Cl) I-; en IW a..1-0 ~=><( w =>o_J a.. Cl)~ w 0 ow m C\I
z> 0 r---' <(W :z:: en
_Jw CJ ~~ wI- Cl) wzZ
~WW(.) iE 0
Cl'.'. w0.. ~:a: 0 cc (.) ..I
PLATE NO.
P-09
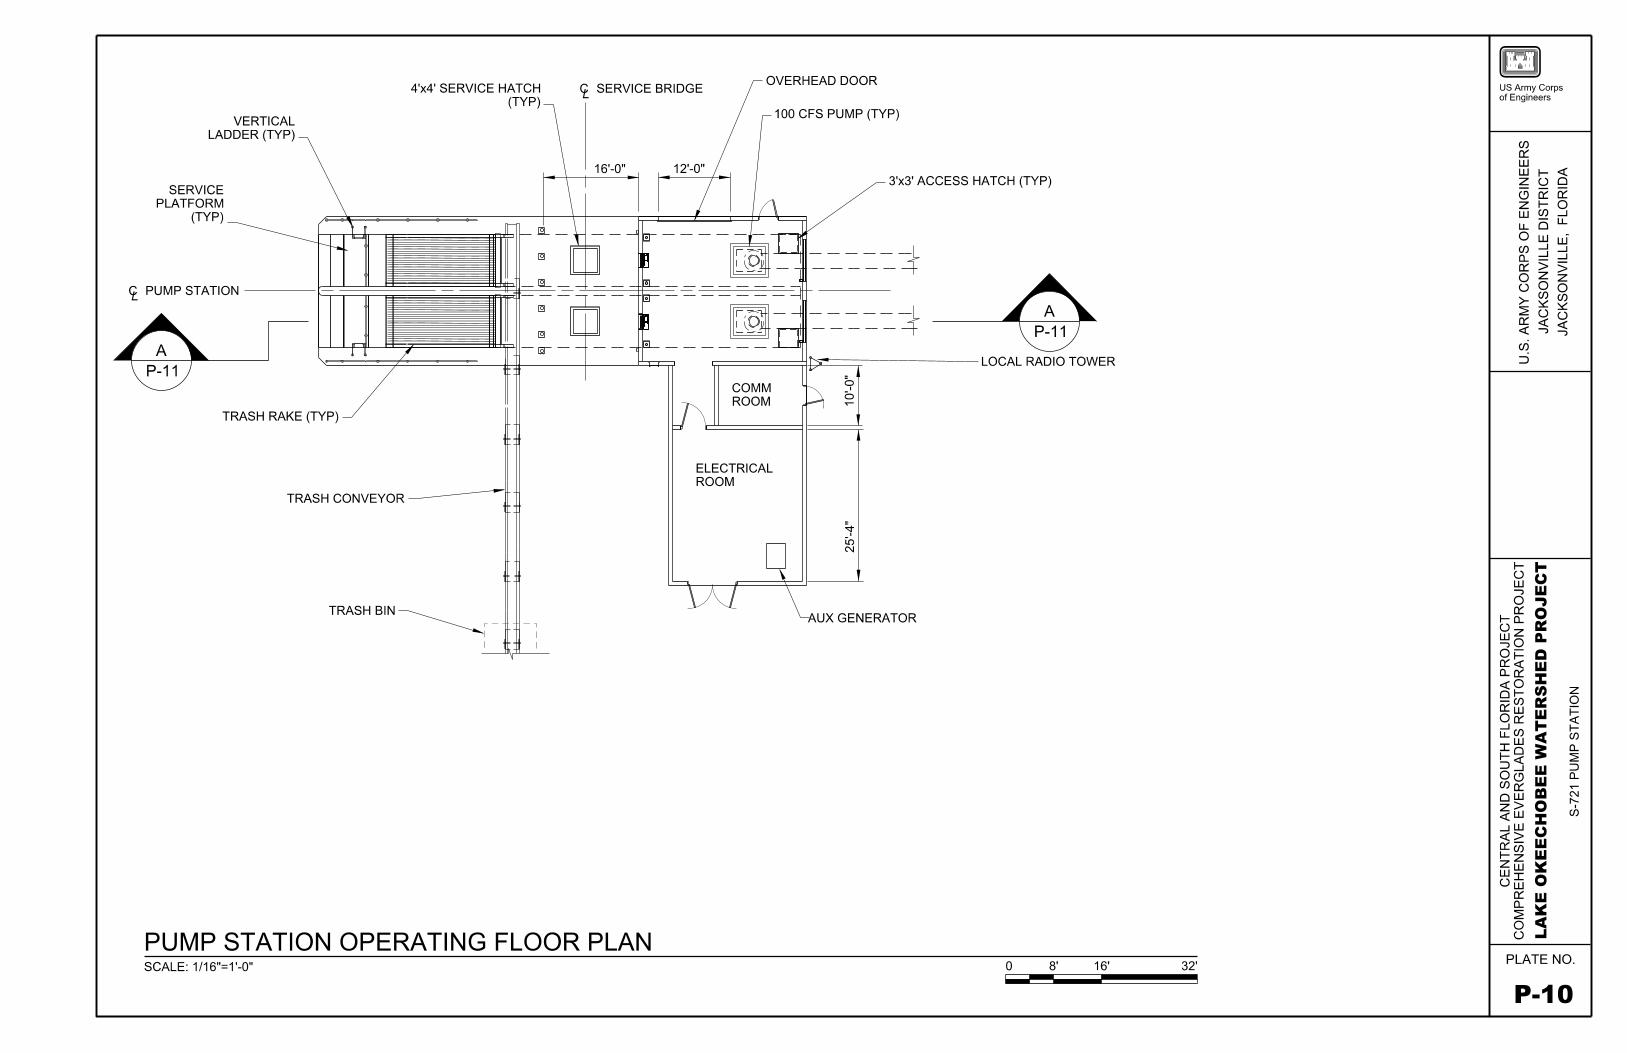
4'x4' SERVICE HATCH (TYP)
't_ SERVICE BRIDGE OVERHEAD DOOR
100 CFS PUMP (TYP) VERTICAL
LADDER (TYP)
SERVICE PLATFORM
(TYP)
<t_ PUMP STATION----
--------------.@~I TRASH RAKE (TYP)
TRASH CONVEYOR-------~
TRASH BIN~,_
I
16'-0"
PUMP STATION OPERATING FLOOR PLAN SCALE: 1/16" 1'-0"
12'-0"
COMM ROOM
ELECTRICAL ROOM
3'x3' ACCESS HATCH (TYP)
----- -L -----4
b I
b
1" LC) N
UX GENERATOR
0 8' 16' 32'
US Army Corps of Engineers
I- I-() CJ w --, w 0 -, 0::: 0 I- c..
Oz ,:ii=
~o A. o- Cl 8:~ w <(0 :z:: DI- Cl) -Cl) ,:ii= O:::w w Oo::: [I Cl) I-IW ; 1-0 =><( o....1 w Cl)~ w ow m z> 0 <(W :z:: ...JW CJ ~~ w I- Cl) w zZ
~ WW
oiE 0 0::: w c.. ~ ~ 0 cc () ..I
z 0
~ en a.. ~ => a.. ..-C\I r--
I en
PLATE NO.
P-10
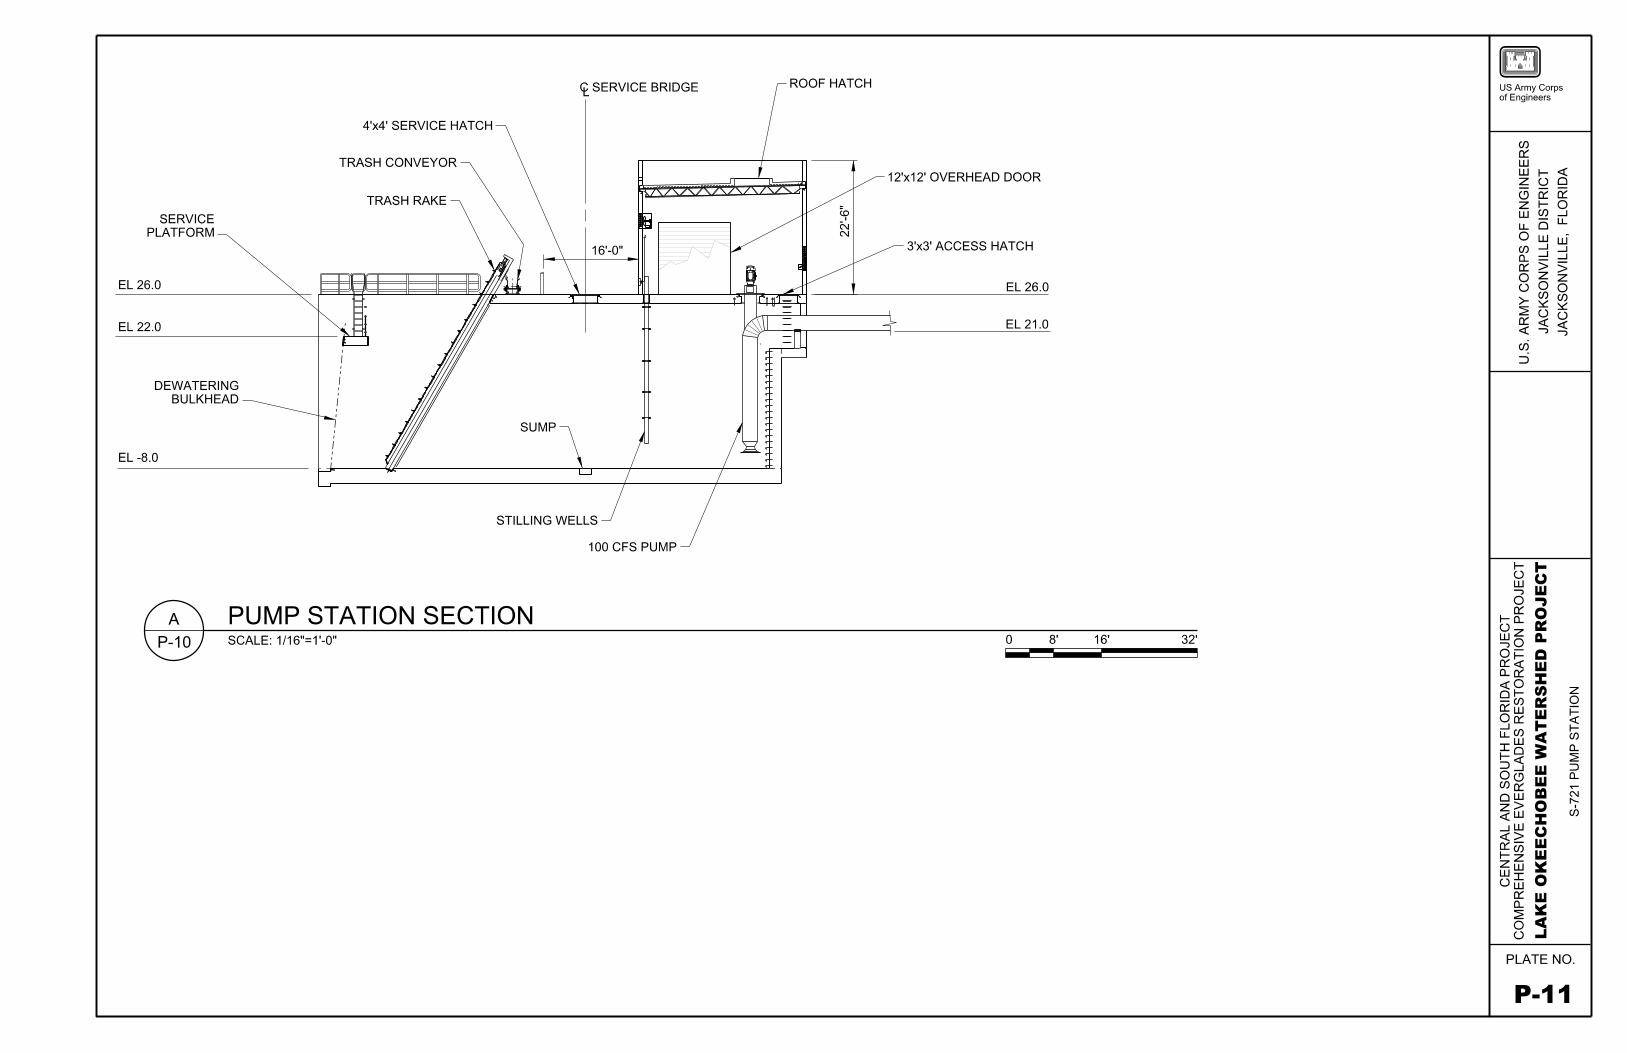
SERVICE PLATFORM
EL 22.0
DEWATERING BULKHEAD
EL -8.0
4'x4' SERVICE HATCH
TRASH CONVEYOR
TRASH RAKE
ct_ SERVICE BRIDGE
SUMP
STILLING WELLS
100 CFS PUMP
PUMP STATION SECTION SCALE: 1/16"=1 '-0"
(0 I
N N
12'x12' OVERHEAD DOOR
3'x3' ACCESS HATCH
EL 21.0
0
m US Army Corps of Engineers
Cl) Cl'.'. w w I- <( z (.) 0 CJ o:'. o:'. z I- 0 w Cl) _J LL 0 LL
0 w w Cl) _J _J 0..
_J _J Cl'.'. > >0 z z (.) 0 0 >- Cl) Cl)
:a: ~ ~ (.) (.)Cl'.'. <( <(<( --, --,
0 =>
I- I-(.) CJw --, w 0 -, Cl'.'. 0I- 0..
Uz ,:ii= 8' 16' 32' ~o A.
o- Cl8:~ w <(0 :z:: DI- Cl) z -Cl) ,:ii= 0O'.'.w w ~00'.'. [I Cl) I-; en IW a..1-0 ~=><( w =>o_J a.. Cl)~ w ..-ow m N
z> 0 r---I
<(W :z:: en _Jw CJ ~~ wI- Cl) wzZ
~WW(.) iE 0
Cl'.'. w0.. ~:a: 0 cc (.) ..I
PLATE NO.
P-11
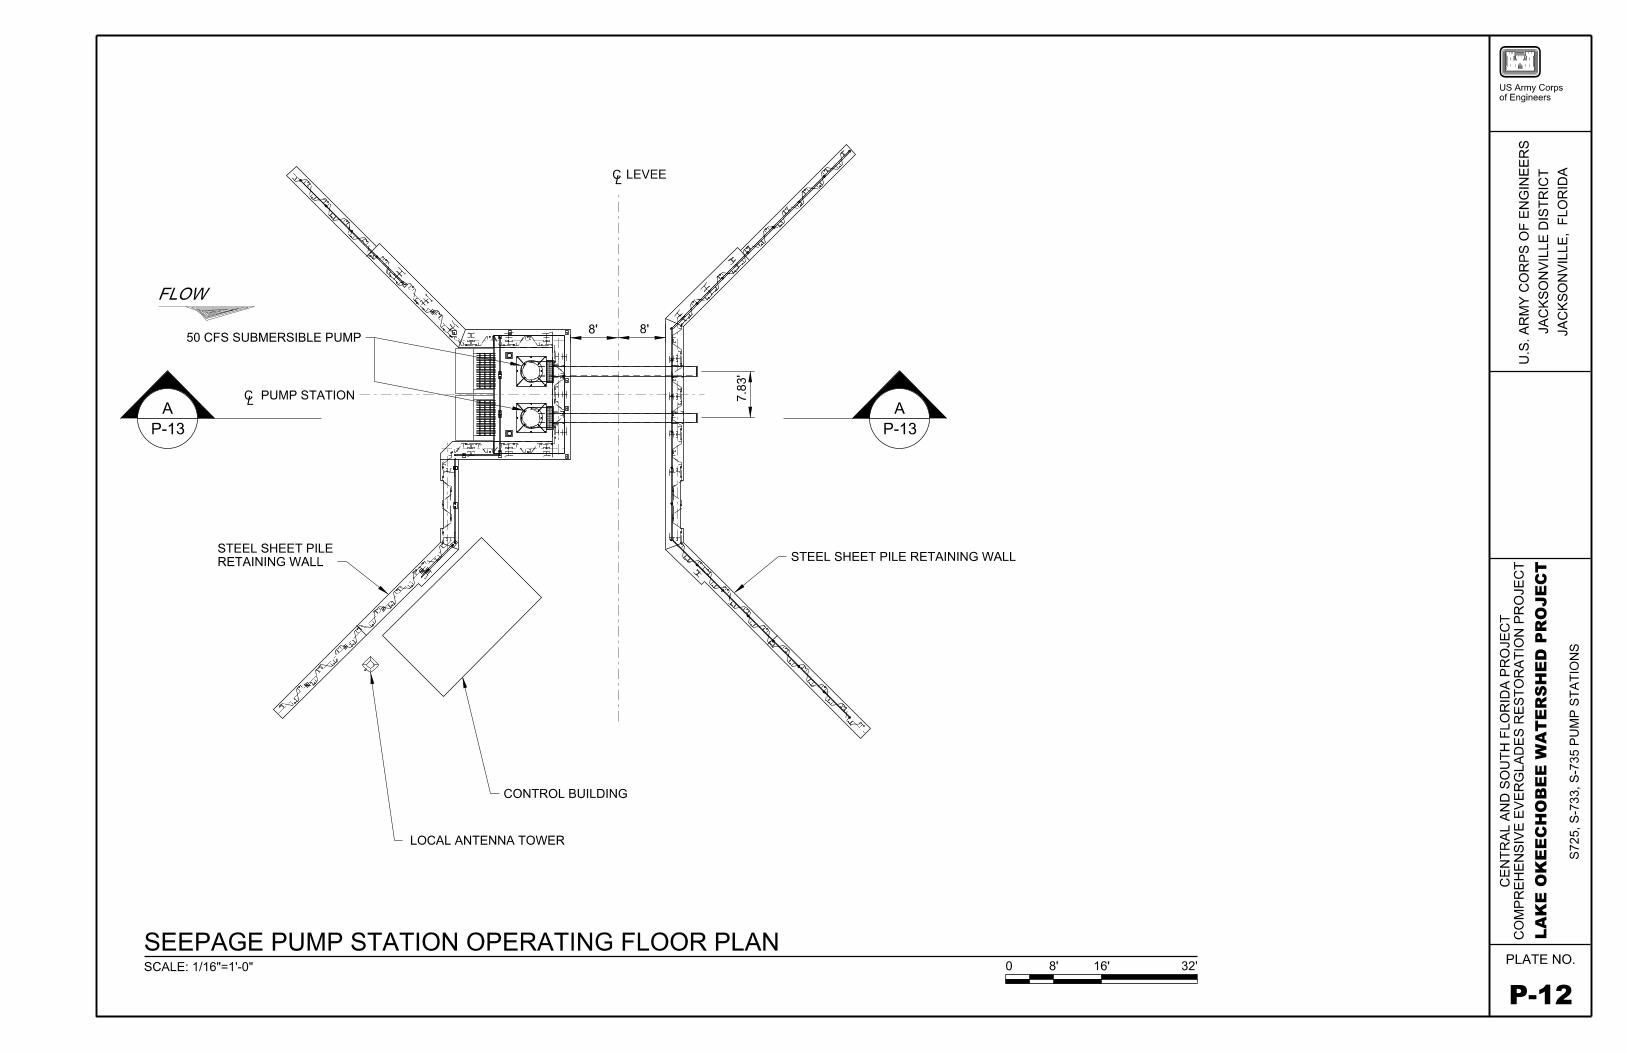
FLOW
50 CFS SUBMERSIBLE PUMP
STEEL SHEET PILE RETAINING WALL
Ci_ LEVEE
CONTROL BUILDING
LOCAL ANTENNA TOWER
SEEPAGE PUMP STATION OPERATING FLOOR PLAN SCALE: 1/16"=1'-0"
STEEL SHEET PILE RETAINING WALL
0 8' 16' 32'
US Army Corps of Engineers
I- I-() CJw --, w 0 -,0::: 0I- c..
Oz ,:ii=
~o A. o- Cl8:~ w <(0 :z:: DI- Cl) -Cl) ,:ii=O:::w wOo::: [I Cl) I-;IW 1-0 =><( wo....1 Cl)~ w ow m z> 0<(W :z::...JW CJ ~~ wI- Cl) wzZ
~WW
oiE 0 0::: wc.. ~ ~ 0 cc () ..I
Cl) z 0 ~
~ Cl)
a.. ~ => a.. LO CV) I'--'Cl)
C") CV) I'--
'Cl)
LO" C\I I'--Cl)
PLATE NO.
P-12
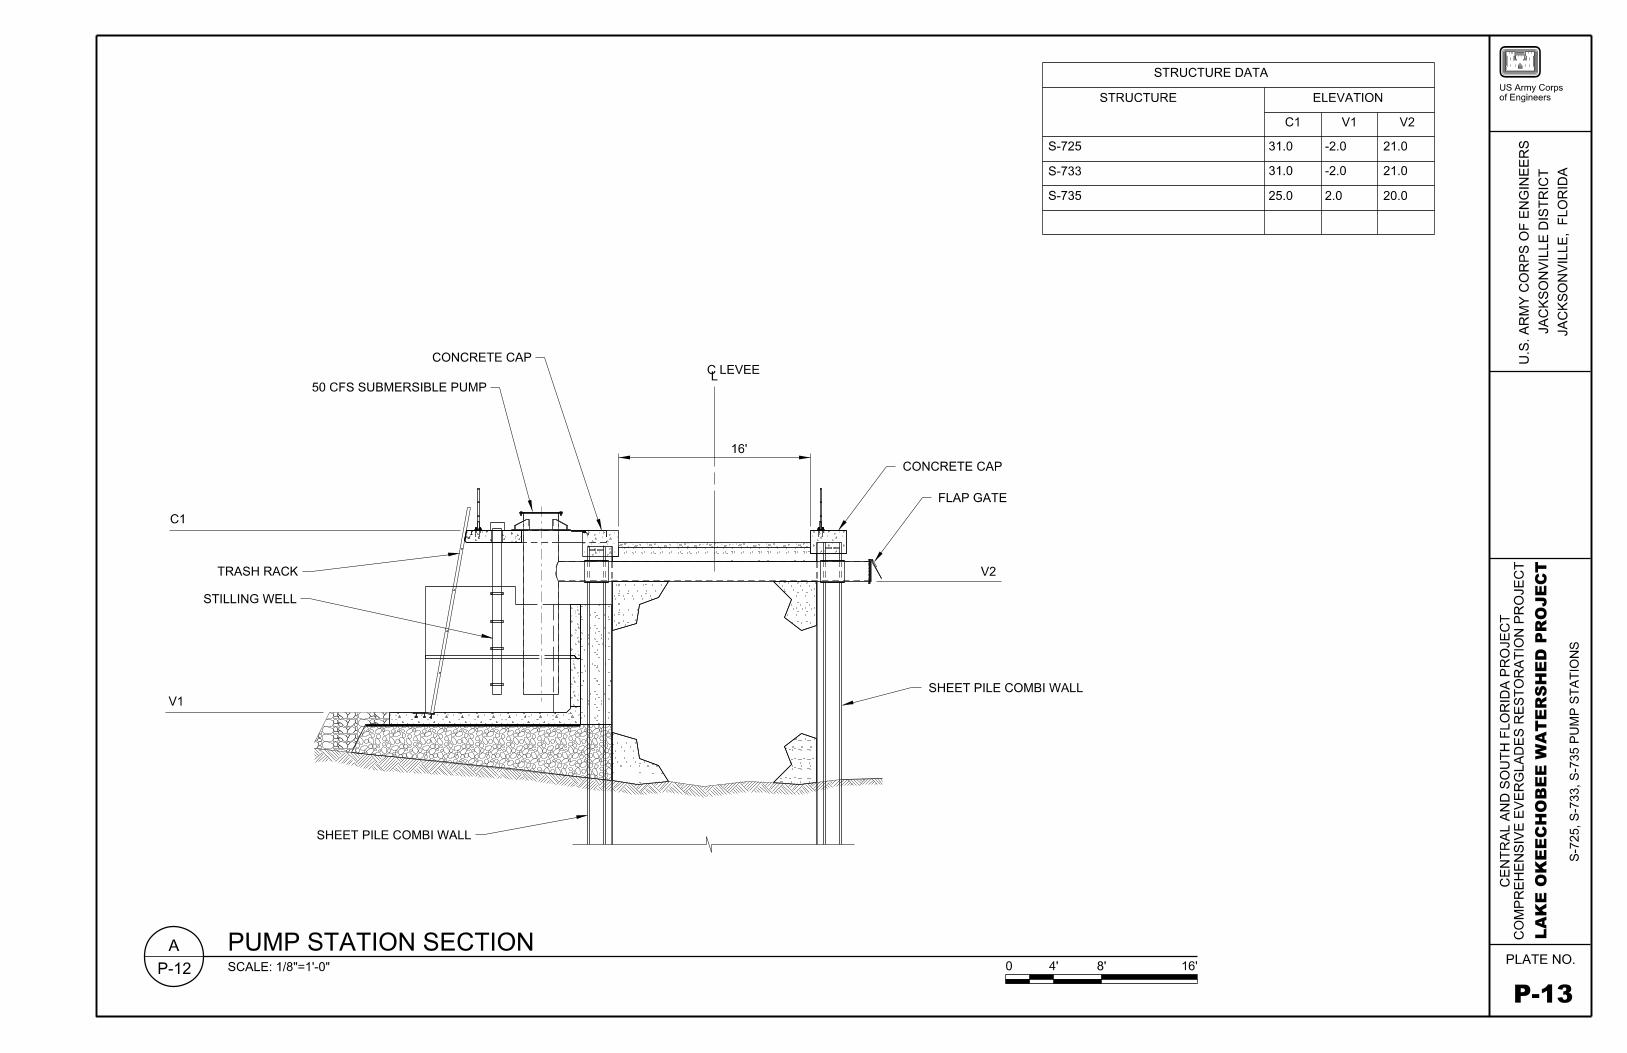
C1
V1
TRASH RACK
STILLING WELL
CONCRETE CAP
50 CFS SUBMERSIBLE PUMP
SHEET PILE COMBI WALL
PUMP STATION SECTION SCALE: 1/8"=1'-0"
Cr_ LEVEE
16'
CONCRETE CAP
FLAP GATE
V2
S-725
S-733
S-735
~ SHEET PILE COMBI WALL
0 4'
STRUCTURE DATA
STRUCTURE
8' 16'
m ELEVATION
US Army Corps of Engineers
C1 V1 V2
31.0 -2.0 21.0 Cl) Cl'.'.
31.0 -2.0 21.0 w w I- <( z (.) 0
25.0 2.0 20.0 CJ o:'. o:'. z I- 0 w Cl) _J LL 0 LL
0 w w Cl)
_J _J 0..
_J _J Cl'.'. >> 0 Zz (.) 0o >- Cl) Cl) ~ ~:a: (.) (.)
Cl'.'. <( <(<( --, --,
0 =>
I- I-(.) CJw --, w 0 -, Cl'.'. 0I- 0..
Uz ,:ii=
~o A. Cl)o- Cl z
8:~ w 0
<(0 :z:: ~ DI- Cl) I--Cl) ,:ii= Cl)
O'.'.w w a.. 00'.'. ~ [I Cl) I- => IW ; a.. 1-0 LO
=><( C")
w r---o_J I
Cl)~ w Cl)
m C"')ow C")
z> 0 r---<(W
I
:z:: Cl)_Jw CJ LO ~~ w N r---I- Cl) w I
zZ ~
Cl)
WW(.) iE 0
Cl'.'. w0.. ~:a: 0 cc (.) ..I
PLATE NO.
P-13
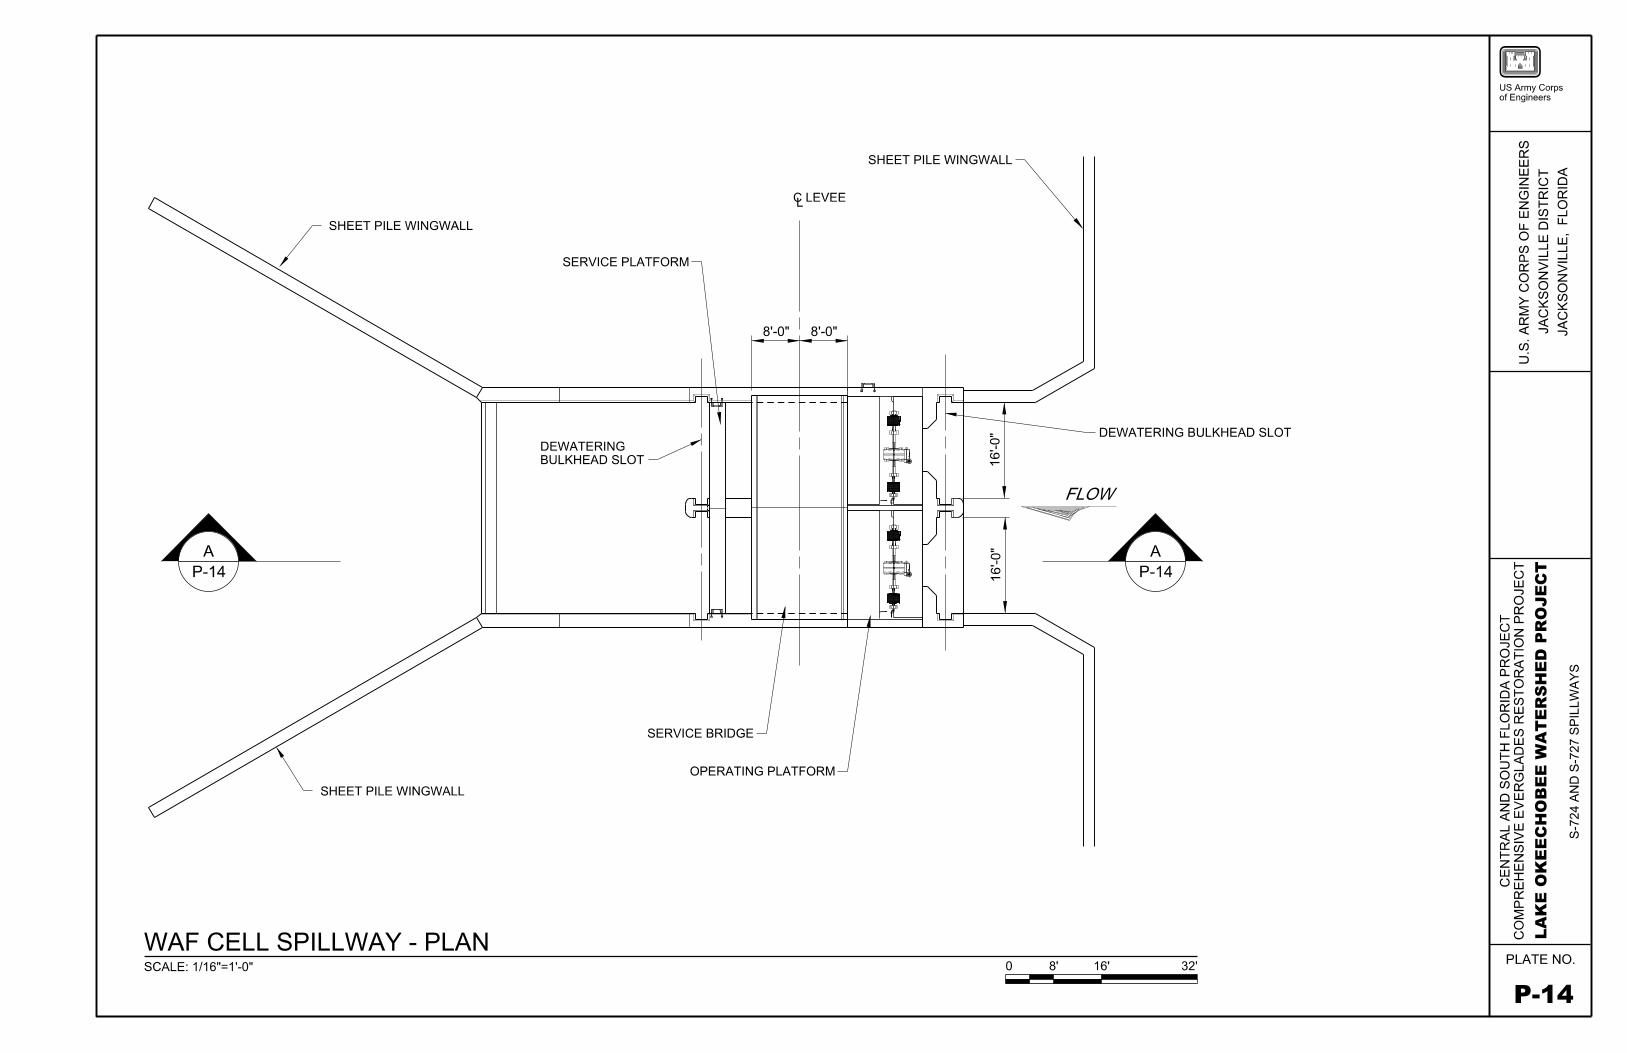
/ SHEET PILE WINGWALL
SHEET PILE WINGWALL
WAF CELL SPILLWAY - PLAN SCALE: 1/16"-1'-0"
SERVICE PLATFORM
DEWATERING _,,....-I BULKHEAD SLOT~ I
SERVICE BRIDGE
't_LEVEE
8'-0" I 8'-0"
OPERATING PLATFORM
SHEET PILE WINGWALL
b I co .....
b I co .....
0
DEWATERING BULKHEAD SLOT
FLOW
8' 16' 32'
US Army Corps of Engineers
I- I-() CJw --, w 0 -,0::: 0I- c..
Oz ,:ii=
~o A. o- Cl8:~ w <(0 :z:: DI- Cl) -Cl) ,:ii=O:::w wOo::: [I Cl) I-IW ;1-0 =><(o....1 w Cl)~ w
mow z> 0<(W :z::...JW CJ ~~ wI- Cl) wzZ
~WW
oiE 0 0::: wc.. ~ ~ 0 cc () ..I
en
~ ...J ...J
a: en r--N r--
I en 0 z <(
"""N r--I en
PLATE NO.
P-14
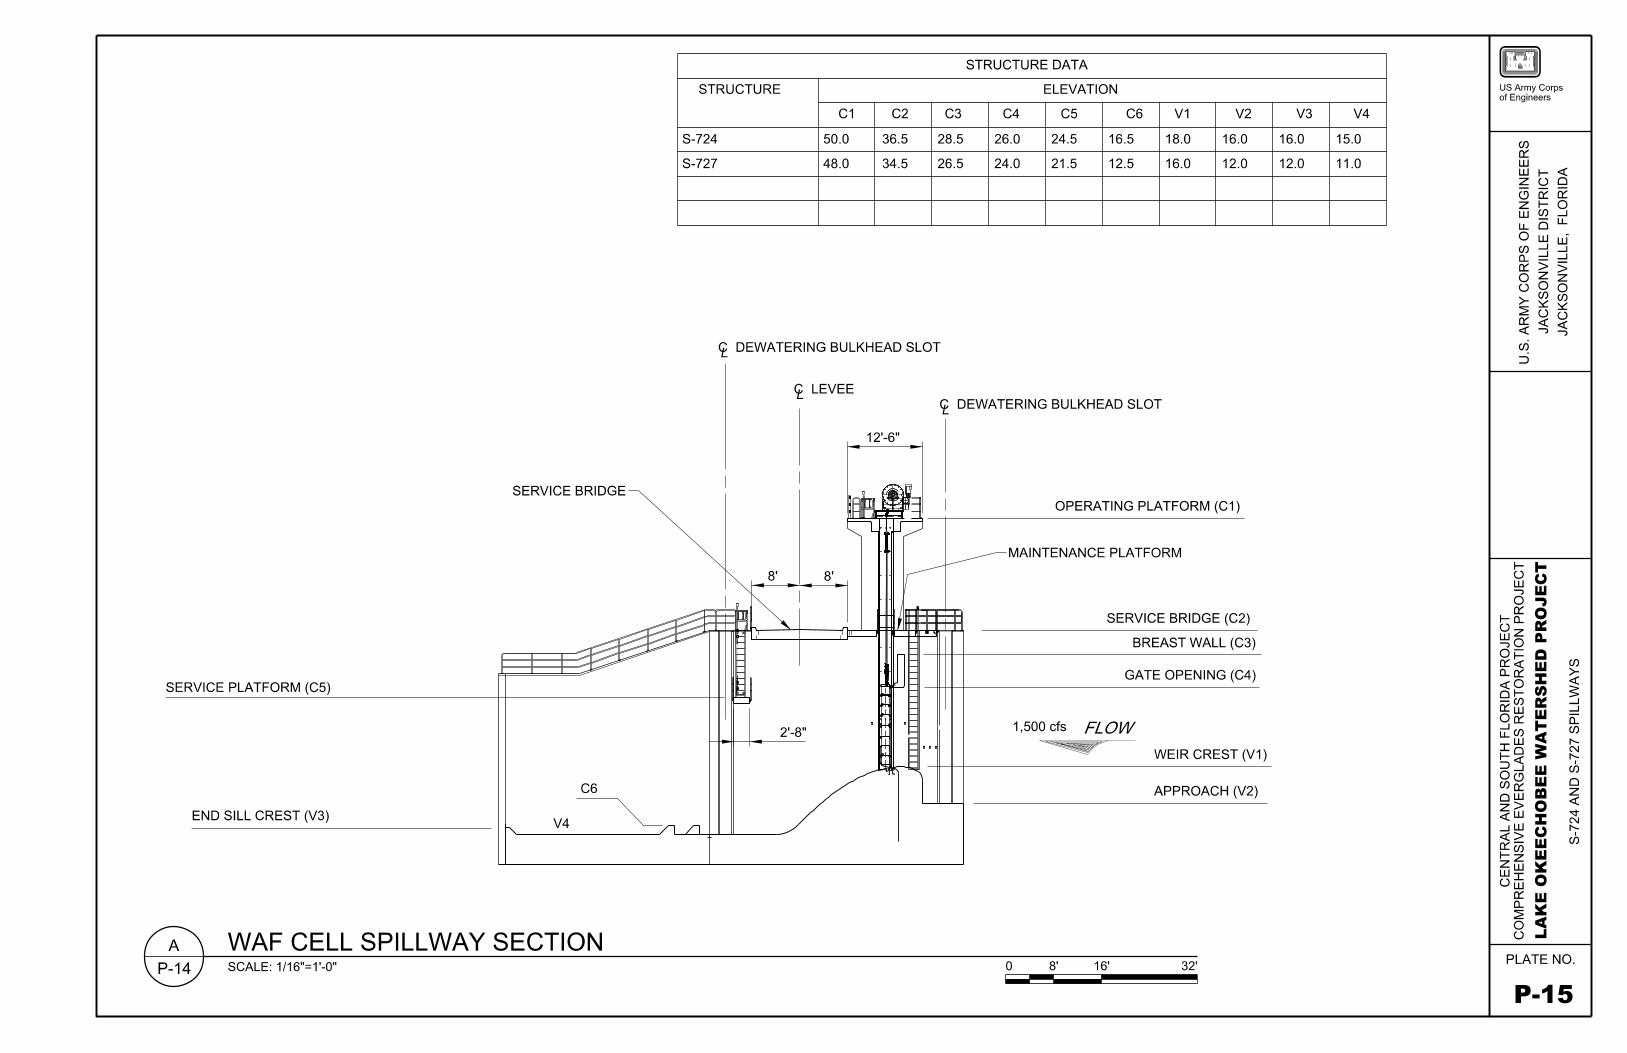
STRUCTURE DATA
STRUCTURE ELEVATION
C1 C2 C3 C4 cs C6 V1 V2
S-724 50.0 36.5 28.5 26.0 24.5 16.5 18.0 16.0
S-727 48.0 34.5 26.5 24.0 21.5 12.5 16.0 12.0
<t DEWATERING BULKHEAD SLOT
<t LEVEE <t DEWATERING BULKHEAD SLOT
SERVICE BRIDGE~
~ 8'
a:~I:P'H~ I ---
SERVICE PLATFORM (CS) ~ j--------++--------+-+-I~
I
C6
,,
2'-8"
END SILL CREST (V3) r.~__V_4_~----~ ~~/7--'---±-~~--
WAF CELL SPILLWAY SECTION SCALE: 1/16"=1 '-0"
8'
Q I OPERATING PLATFORM (C1) 'nlll" ~---+-------------
Cl-··µ::::J
.. r--~MAINTENANCE PLATFORM
~ SERVICE BRIDGE (C2) ,, ll -
. . .... .... BREAST WALL (C3)
--~§I ,-
l ::
! .... ..... •,-....
I~ '''
GATE OPENING (C4)
1,soo cfs FLOW
WEIR CREST (V1)
1 APPROACH (V2)
0 8' 16' 32'
V3 V4
16.0 15.0
12.0 11.0
US Army Corps of Engineers
I- I-() CJw --, w 0 -,0::: 0I- c..
Oz ,:ii=
~o A. o- Cl8:~ w <(0 :z:: DI- Cl) -Cl) ,:ii=O:::w wOo::: [I Cl) I-IW ;1-0 =><(o....1 w Cl)~ w
mow z> 0<(W :z::...JW CJ ~~ wI- Cl) wzZ
~WW
oiE 0 0::: wc.. ~ ~ 0 cc () ..I
Cl)
~ s:...J...J a: Cl)
r-... C\I r-...
I Cl)
0 z <( s::r-C\I r-...
I Cl)
PLATE NO.
P-15
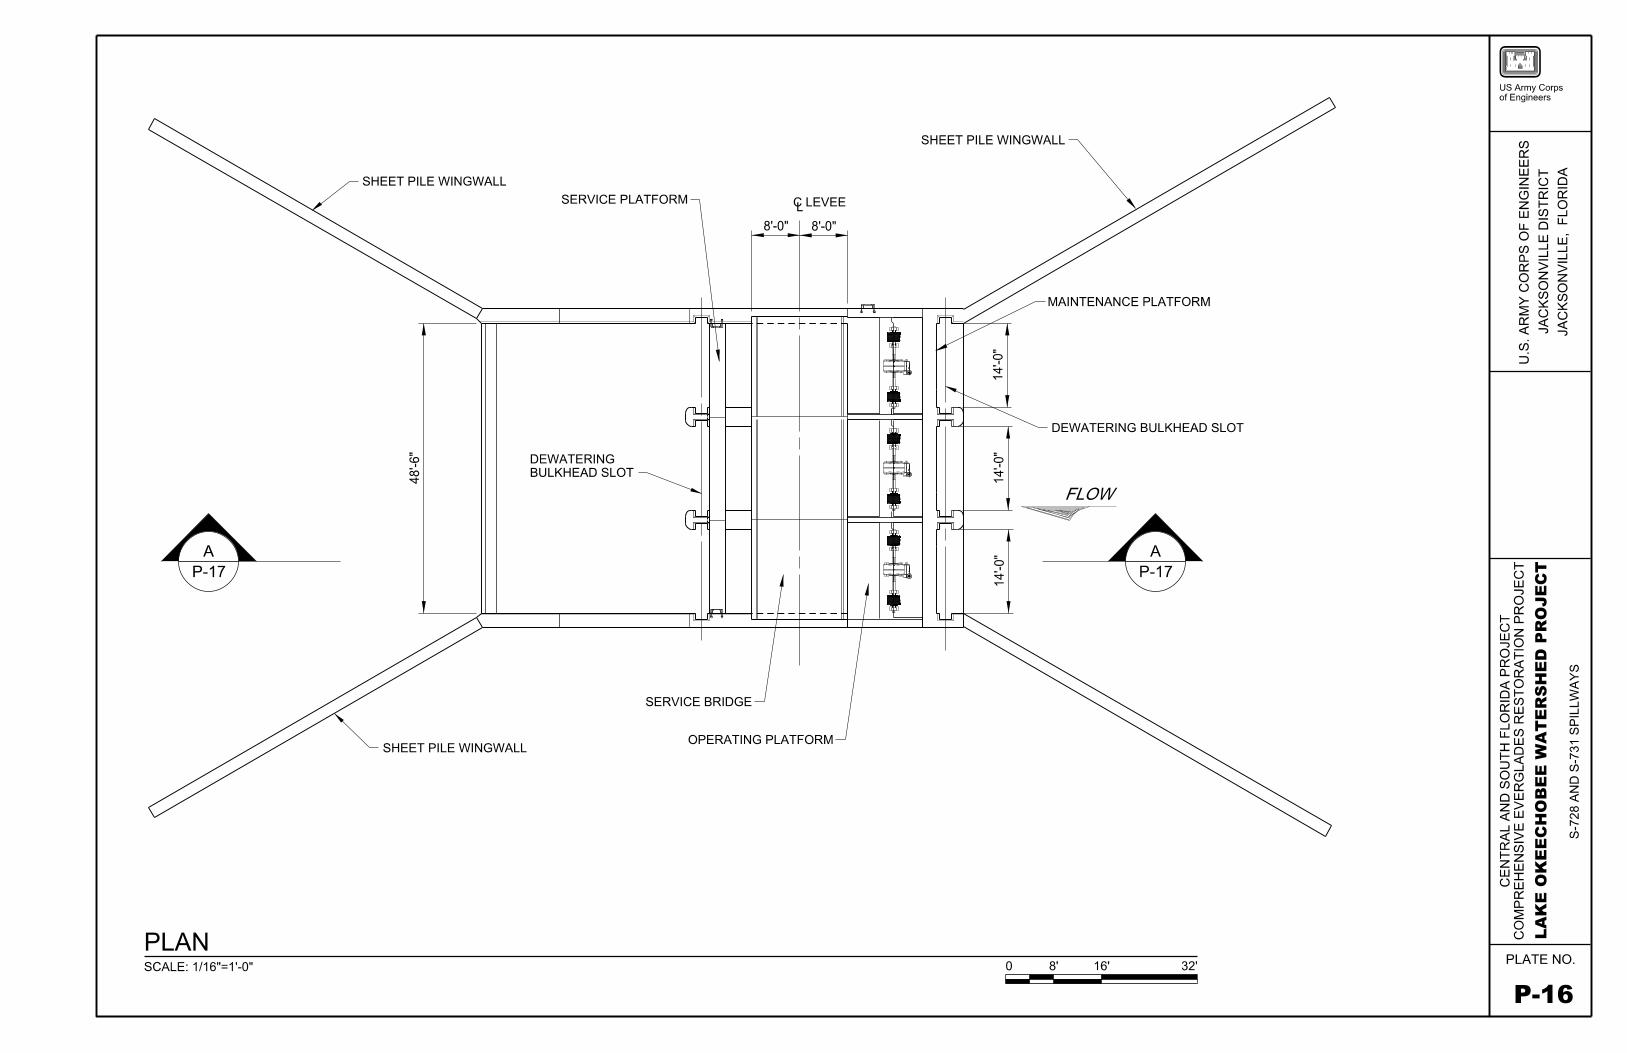
PLAN SCALE: 1/16"-1'-0"
SHEET PILE WINGWALL
(0 I
c:o -.:t"
SHEET PILE WINGWALL
SERVICE PLATFORM
DEWATERING BULKHEAD SLOT
SERVICE BRIDGE
8'-0"
<t_LEVEE
8'-0"
---!----
OPERATING PLATFORM
SHEET PILE WINGWALL
MAINTENANCE PLATFORM
DEWATERING BULKHEAD SLOT
b I
~ ..... FLOW
0 8' 16' 32'
m US Army Corps of Engineers
Cl) Cl'.'. w w I- <( z (.) 0 CJ o:'. o:'. z I- 0 w Cl) _J LL 0 LL
0 w w Cl)
_J _J 0..
_J _J Cl'.'. >> 0 Zz (.) 0o >- Cl) Cl) ~ ~:a: (.) (.)
Cl'.'. <( <(<( --, --,
0 =>
I- I-(.) CJw --, w 0 -, Cl'.'. 0I- 0..
Uz ,:ii=
~o A. o- Cl8:~ w en <(0 :z:: ~DI- Cl) -Cl) ,:ii=O'.'.w ...J
w ...J 00'.'. a:[I Cl) I- en IW ; .,.... 1-0
(") I"-
=><( I
o_J w en Cl)~ w 0
m z ow <(z> 0 CX)<(W :z:: N_Jw I"-
CJ I
~~ enwI- Cl) wzZ
~WW(.) iE 0
Cl'.'. w0.. ~:a: 0 cc (.) ..I
PLATE NO.
P-16
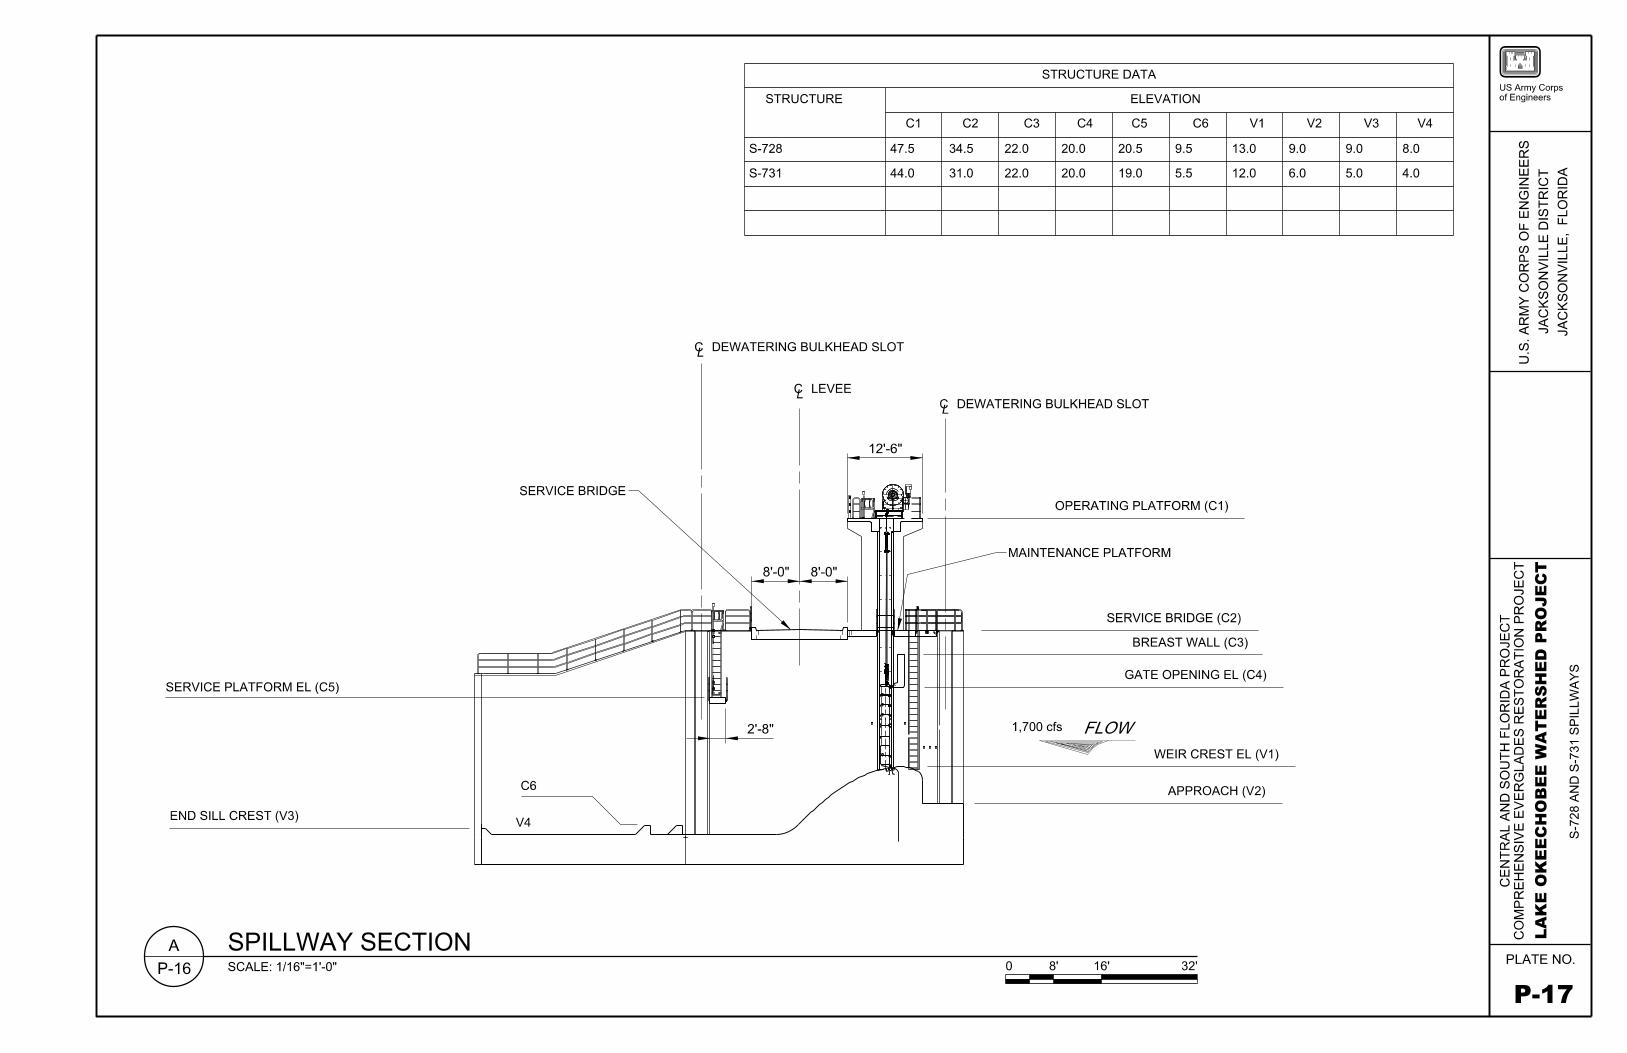
STRUCTURE DATA m US Army Corps
STRUCTURE ELEVATION of Engineers
C1 C2 C3 C4 C5 C6 V1 V2 V3 V4
S-728 47.5 34.5 22.0 20.0 20.5 9.5 13.0 9.0 9.0 8.0 Cl) Cl'.'. w
S-731 44.0 31.0 22.0 20.0 19.0 5.5 12.0 6.0 5.0 4.0 w I- <( z (.) 0 CJ o:'. o:'. z I- 0 w Cl) _J LL 0 LL
0 w w Cl)
_J _J 0..
_J _J Cl'.'. > >0 z z (.) 0 0 >- Cl) Cl) ~ ~:a: (.) (.)
Cl'.'. <( <(<( --, --,
<r DEWATERING BULKHEAD SLOT 0 =>
't LEVEE 't DEWATERING BULKHEAD SLOT
I I QSERVICE BRIDGE~ I OPERATING PLATFORM (C1)
Cl-· ·µ::::J
~ 8'--0"
~MAINTENANCE PLATFORM
r-- I- I-8'-0" .. (.) CJw I •:~~I
--, w .. 0 -, SERVICE BRIDGE (C2)
Cl'.'. 0
' I- 0..Uz ,:ii= ,, ,, II - A.... BREAST WALL (C3) ~o... .. ...
.-~!~ o- Cl... 8:~... GATE OPENING EL (C4)
w en SERVICE PLATFORM EL (C5) ~ <(0 :z:: ~I ,._ Cl)
~ :~ DI--Cl) ,:ii= ...J
I
,.... O'.'.w~ ,.... w ...J
• w 00'.'. a:2'-8" .,.... 1,700 cfs FLOW [I Cl) I-
~ ,.... en
I -
I~ IW ; .,....... ~ (")
WEIR CREST EL (V1) 1-0 r--=><( I
o_J w en C6 l Cl)~ w 0
APPROACH (V2) m z
v~
ow <(
END SILL CREST (V3) z> 0 CX)<(W :z:: N
k. ,r _Jw r--CJ I
~~ enwI- Cl) wzZ
~WW(.) iE 0
Cl'.'. w0.. ~:a:
(A\ 0 cc
SPILLWAY SECTION (.) ..I
~ SCALE: 1/16"=1 '-0" 0 8' 16' 32' PLATE NO.
P-17
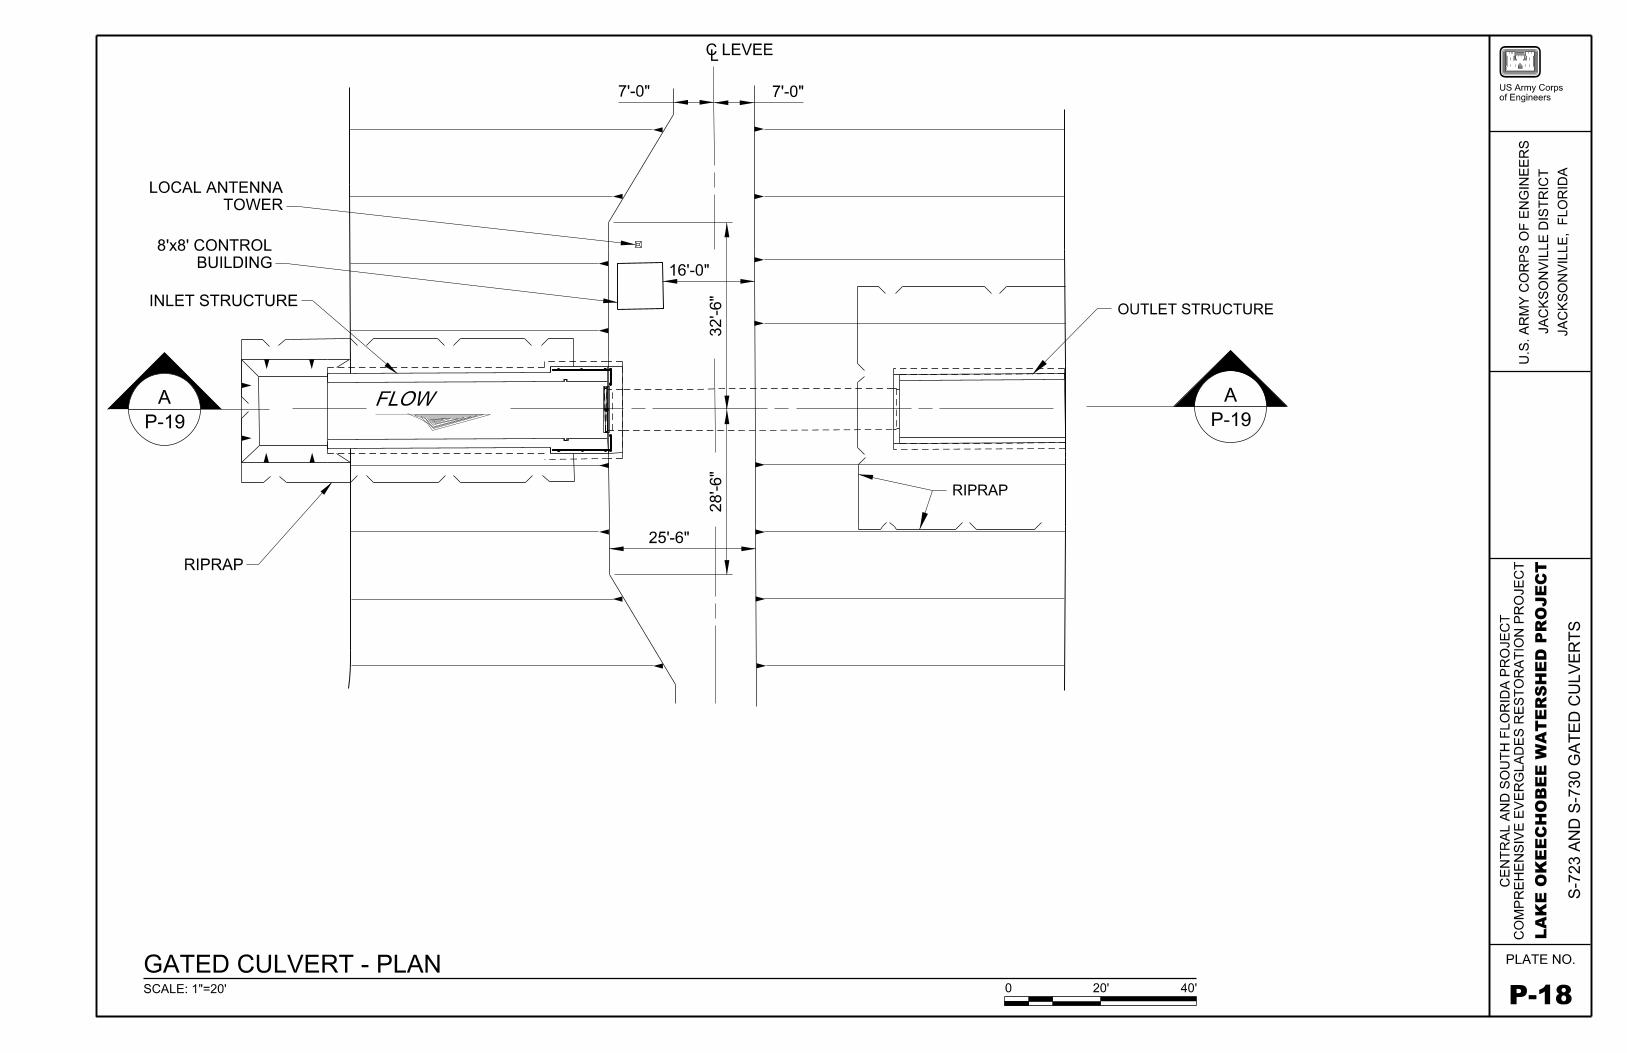
LOCAL ANTENNA TOWER---------L
8'x8' CONTROL BUILDING -----_j------------~
INLET STRUCTURE
-------------~--
FLOW---+----vgr
RIPRAP
GATED CULVERT- PLAN SCALE: 1"=20'
<t_LEVEE
7'-0"
16'-0"
251-6 11
co I
N C")
co I
co C'\I
7'-0"
RIPRAP
0
OUTLET STRUCTURE
20' 40'
US Army Corps of Engineers
en ~ w >_J
::::> 0 0 w ~ C.9 0 C") r--.
I en 0 z <( C") C'\I r--.
I en
PLATE NO.
P-18
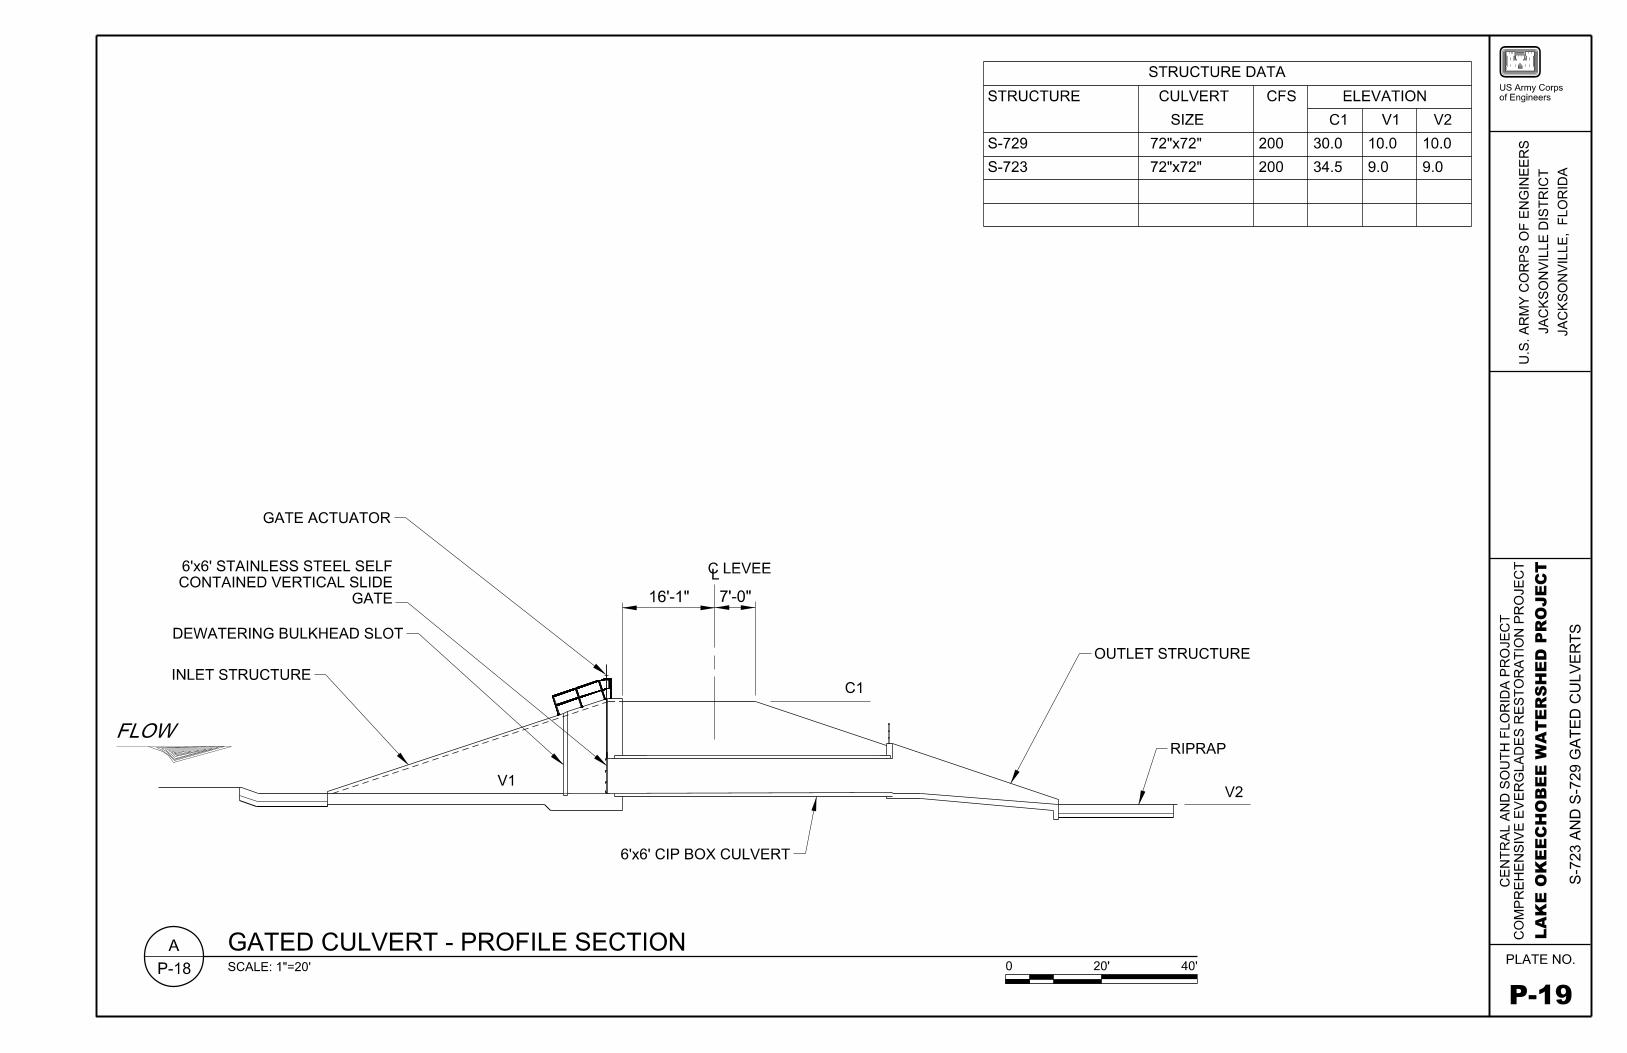
GATE ACTUATOR
6'x6' STAINLESS STEEL SELF CONTAINED VERTICAL SLIDE
GATE
DEWATERING BULKHEAD SLOT
INLET STRUCTURE
FLOW
<t_ LEVEE
16'-1" 7'-0"
6'x6' CIP BOX CULVERT
GATED CULVERT- PROFILE SECTION SCALE: 1"=20'
C1
STRUCTURE DATA
STRUCTURE CULVERT CFS
SIZE
S-729 72"x72" 200
S-723 72"x72" 200
OUTLET STRUCTURE
RIPRAP
0 20' 40'
ELEVATION
C1 V1 V2
30.0 10.0 10.0
34.5 9.0 9.0
US Army Corps of Engineers
I- I-() CJw --, w 0 -,0::: 0I- c..
Oz ,:ii=
~o A. o- Cl8:~ w <(0 :z::
Cl)DI--Cl) ,:ii=O:::w wOo::: [I Cl) I-;IW 1-0 =><( wo....1 Cl)~ w ow m z> 0<(W :z::...JW CJ ~~ wI- Cl) wzZ
~WW
oiE 0 0::: wc.. ~ ~ 0 cc () ..I
en I-0::: w >....J :::> (.)
0 w I-<( (.!) (j) N r,...
I
en 0 z <( C") N r,...
I
en
PLATE NO.
P-19
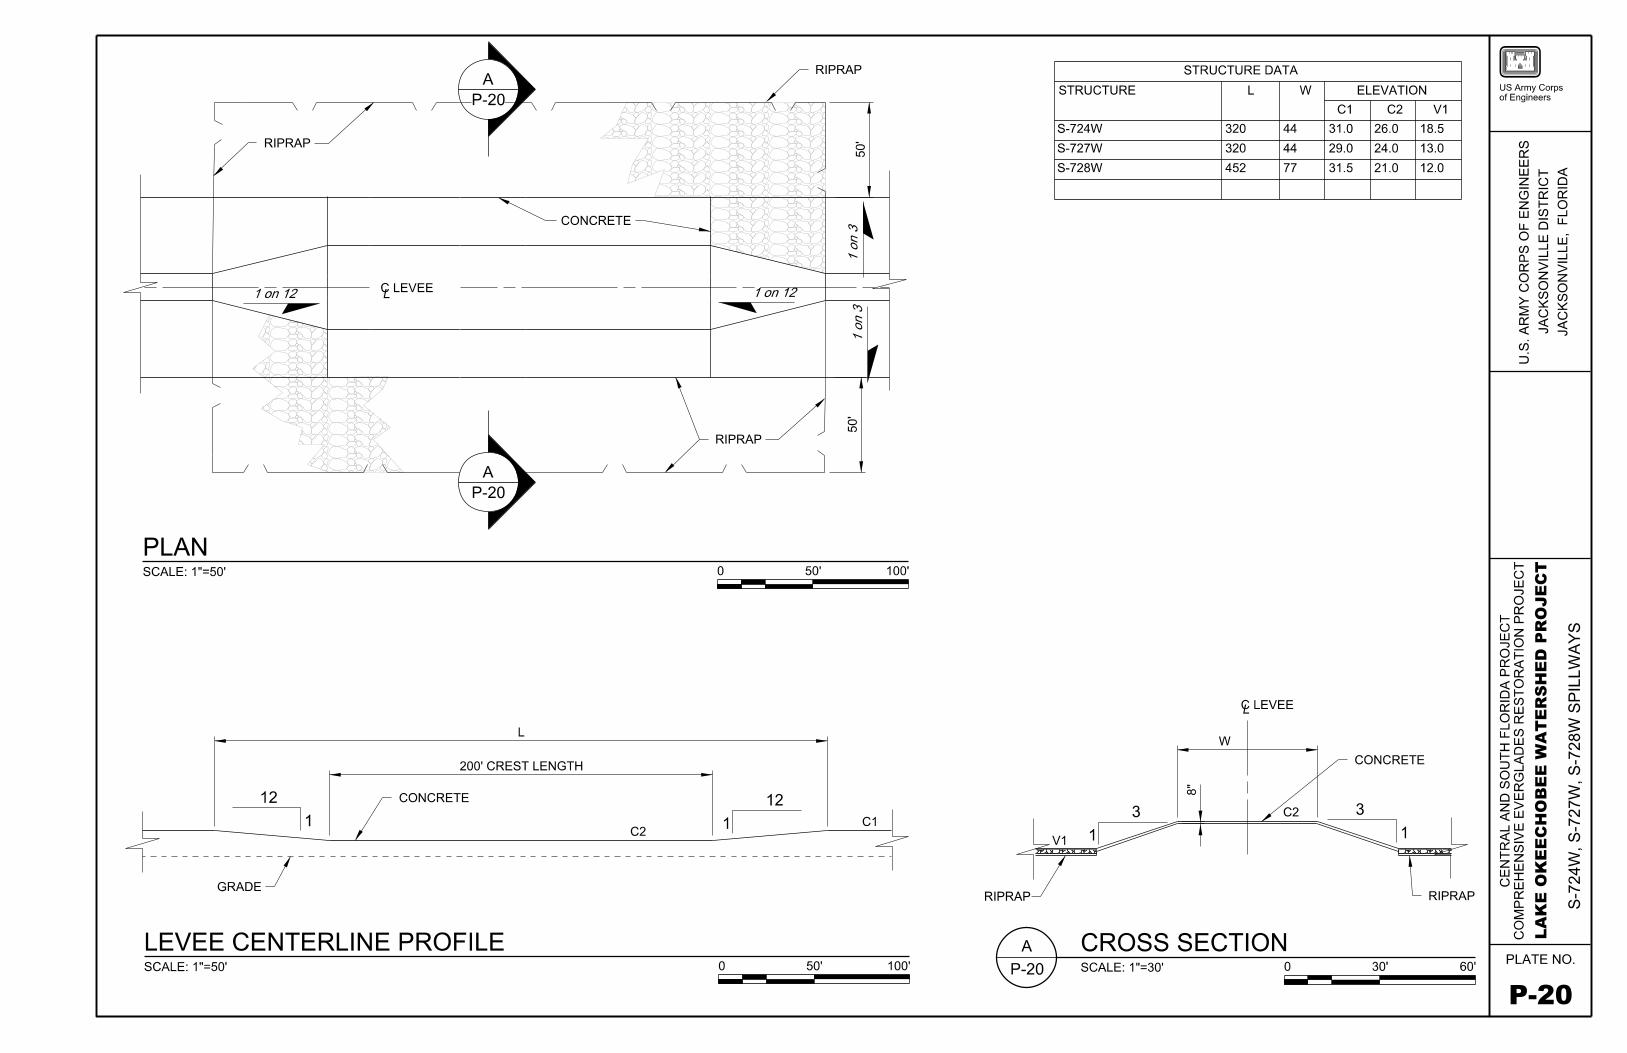
RIPRAP7
\
CONCRETE
ton 12 'r_ LEVEE --------
PLAN SCALE: 1"=50'
L
200' CREST LENGTH
LEVEE CENTERLINE PROFILE SCALE: 1"=50'
RIPRAP
0
0
RIPRAP
50'
50'
b LC)
b LC)
STRUCTURE DATA
STRUCTURE L
S-724W 320 44
S-727W 320 44
S-728W 452 77
100'
ct LEVEE
w
co 3
RIPRAP
CROSS SECTION 100' SCALE: 1"=30' 0
w ELEVATION
C1 C2 V1
31.0 26.0 18.5
29.0 24.0 13.0
31.5 21.0 12.0
CONCRETE
RIPRAP
30' 60'
US Army Corps of Engineers
I- I-() CJw --, w 0 -,0::: 0I- c..
Oz ,:ii=
~o A. o- Cl8:~ w
:z::<(0DI- Cl) -Cl) ,:ii=O:::w wOo::: [I Cl) I-;IW 1-0 =><(o....1 w Cl)~ w ow m z> 0<(W :z::...JW CJ ~~ wI- Cl) wzZ
~WW
oiE 0 0::: wc.. ~ ~ 0 cc () ..I
CJ)
~ s _J _J
a.. CJ)
s CX) N r-,..
I CJ)
~ r-,.. N r-,..
I CJ)
$-
"""N r-,..
I CJ)
PLATE NO.
P-20
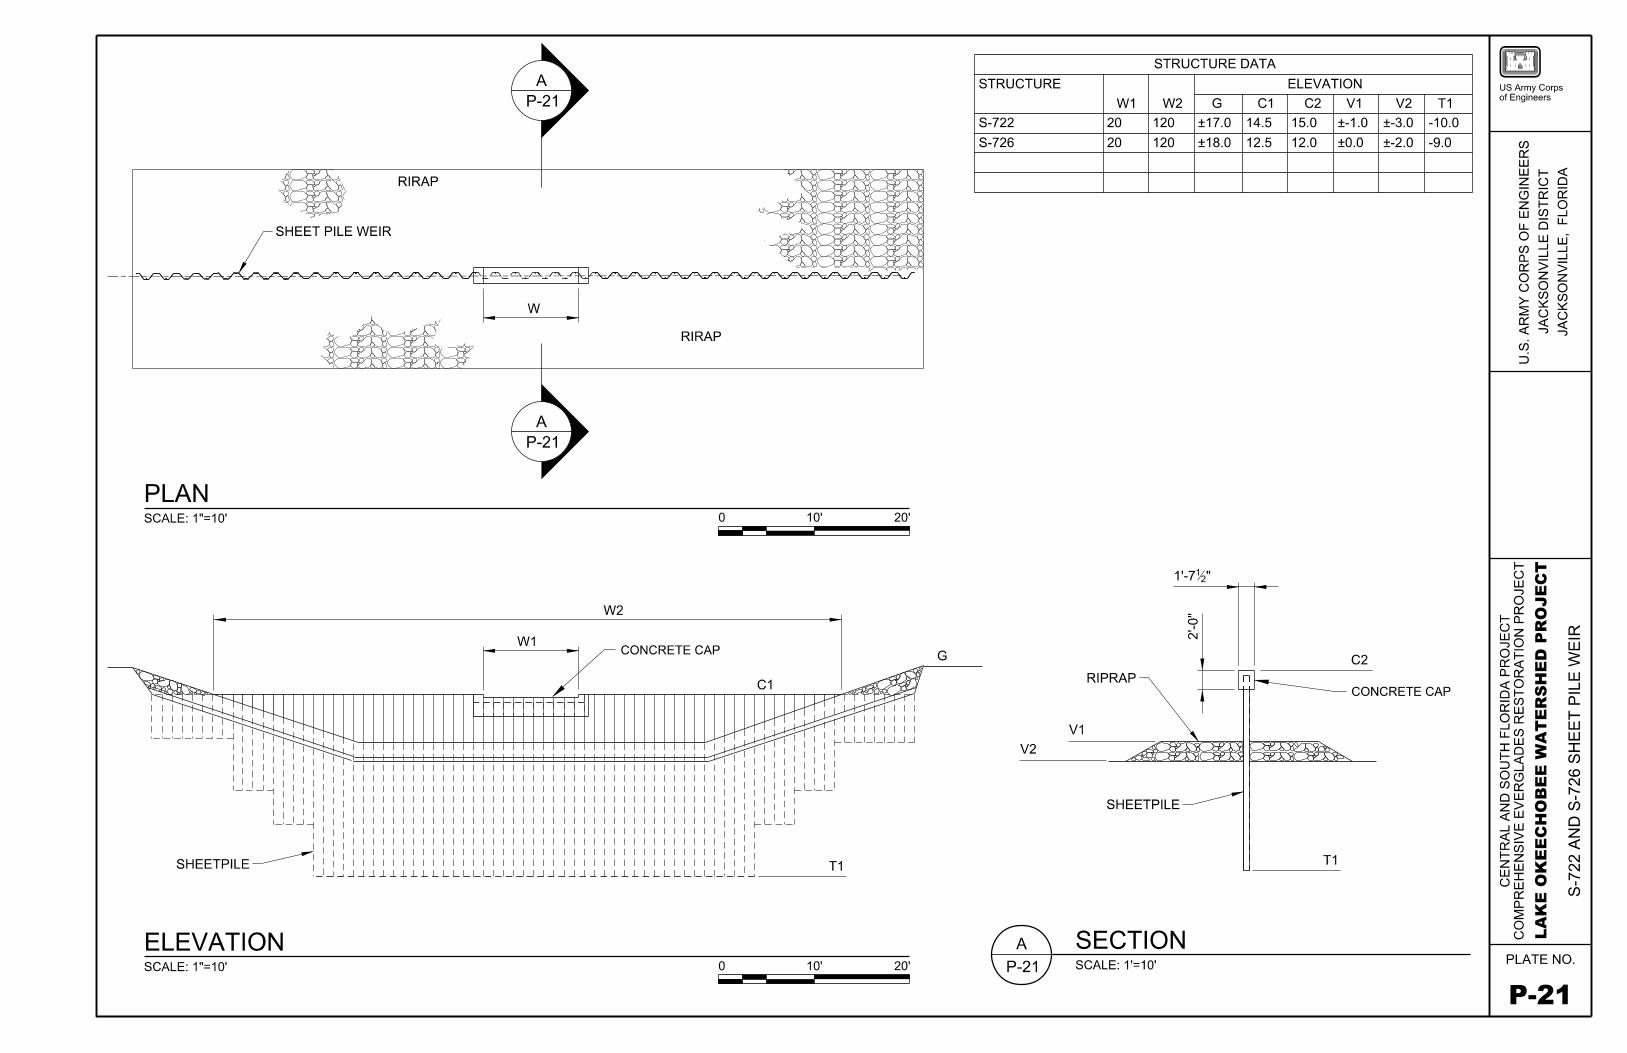
PLAN SCALE: 1"=10'
I I I I I I I I I I
RIRAP
SHEET PILE WEIR
w
W1
RIRAP
0 10' 20'
W2
CONCRETE CAP
I_I_I_I_I_I_I l---1 I
I I I I I I I I I I I I I I I I I I I I I I I I I I I I I I f-LI_I_I_I_I_J_J
I ~~±:j±±:jt±±t±±t:±±±::±±±:±±±:i±±:jt±±t±±t±±t:±::±:::::l= I I I I I I I I I I I I I I I I I 1_,_I_J 7 f-l_,_1_1
I I I I I I : I I I I I I I ,_._---1"""1 f-L_,_I
: I I I I I I I I I I I I I I I I I I I I I I I I I I I I I I I I I I I I I I I : -------I 1 1 1111111111111111111111111111111111111 I
SHEETPILE ------ : 1 1 1 1 1 1 1 1 1 1 1 1 1 1 1 1 1 1 1 1 1 1 1 1 1 1 1 1 1 1 1 1 1 1 1 1 1 1 1 1 T1 ,_-I~ -I -I ...l ..1 J. J. 1- 1- .L .L LL LI_U_U_U---1 -I -I ...l ..1 J. J.1- .L .L LL L LI_U ___ _J ______
ELEVATION SCALE: 1"=10' 0 10' 20'
STRUCTURE DATA
STRUCTURE
W1 W2 G C1
S-722 20 120 ±17.0 14.5
S-726 20 120 ±18.0 12.5
1'-7½"
0 I
N
G
RIPRAP
V1
V2
SHEETPILE
SECTION SCALE: 1'= 1O'
m ELEVATION US Army Corps
C2 V1 V2 T1 of Engineers
15.0 ±-1.0 ±-3.0 -10.0
12.0 ±0.0 ±-2.0 -9.0 Cl) Cl'.'. w w I- <( z (.) 0 CJ o:'. o:'. z I- 0 w Cl) _J LL 0 LL
0 w w Cl)
_J _J 0..
_J _J Cl'.'. > >0 z z (.) 0 0 >- Cl) Cl)
:a: ~ ~ (.) (.)Cl'.'. <( <(<( --, --,
0 =>
I- I-(.) CJw --, w 0 -, Cl'.'. 0I- 0..
Uz ,:ii= 0:: ~o A. w
C2 o- Cl s8:~ w <(0 :z:: w
CONCRETE CAP DI- Cl) _J
-Cl) ,:ii= a..O'.'.w w I-00'.'. [I Cl) I- w; wIW I1-0 en=><(o_J w co Cl)~ w C'\I
m t---ow I
z> 0 en<(W :z:: 0_Jw CJ z ~~ w <(
T1 I- Cl) w C'\IzZ
~WW C'\I
(.) iE 0 t---I
Cl'.'. w en 0.. ~:a: 0 cc (.) ..I
PLATE NO.
P-21
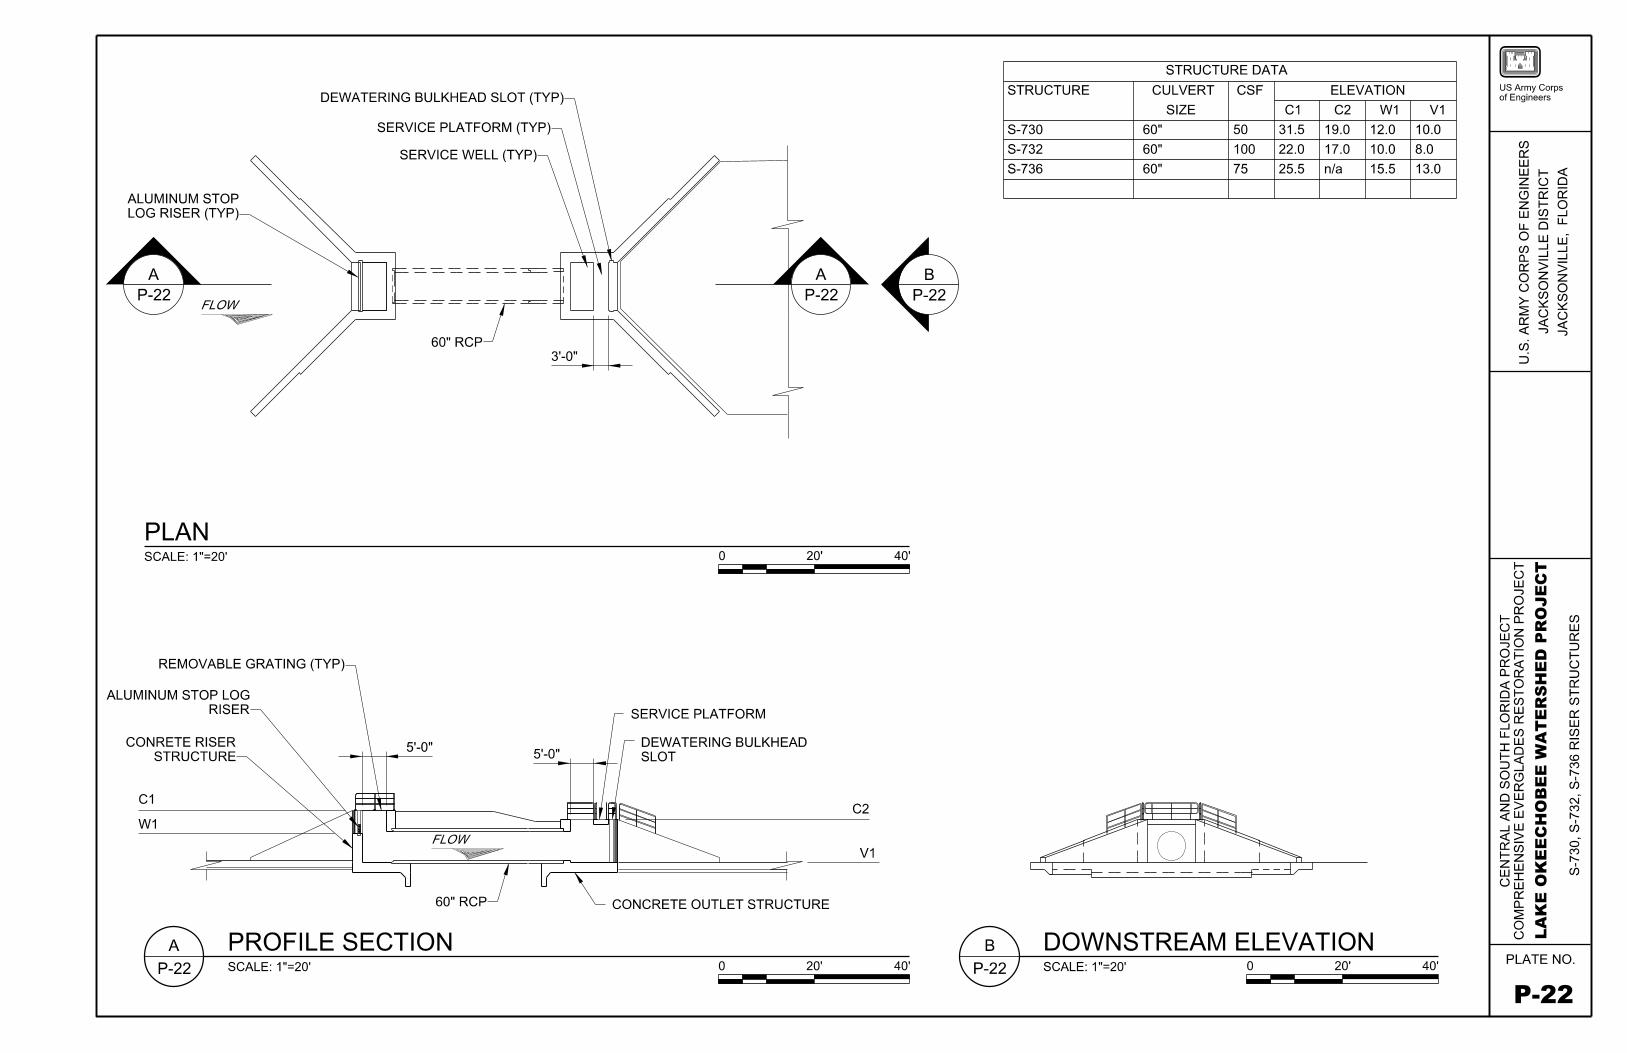
ALUMINUM STOP LOG RISER (TYP)
@FLOW -
PLAN SCALE: 1 "=20'
DEWATERING BULKHEAD SLOT (TYP)
SERVICE PLATFORM {TYP)
SERVICE WELL {TYP)
-=== -=== -=== -=== -=== - ~
60"RCP7 3'-0"
REMOVABLE GRATING (TYP)
ALUMINUM STOP LOG RISER
CONRETE RISER STRUCTURE
C1
W1
5'-0"
FLOW
60" RCP
PROFILE SECTION SCALE: 1"=20'
5'-0"
0 20'
SERVICE PLATFORM
DEWATERING BULKHEAD SLOT
CONCRETE OUTLET STRUCTURE
0 20'
40'
C2
V1
40'
STRUCTURE DATA
STRUCTURE CULVERT CSF ELEVATION
SIZE C1 C2 W1
S-730 60" 50 31.5 19.0 12.0
S-732 60" 100 22.0 17.0 10.0
S-736 60" 75 25.5 n/a 15.5
DOWNSTREAM ELEVATION SCALE: 1 "=20' 0 20'
V1
10.0
8.0
13.0
40'
US Army Corps of Engineers
I- I-() CJ w --, w 0 -, 0::: 0 I- c..
Oz ,:ii=
~o A. o- Cl 8:~ w
:z:: <(0 DI- Cl) -Cl) ,:ii= O:::w w Oo::: [I Cl) I-; IW 1-0 =><( w o....1 Cl)~ w ow m z> 0 <(W :z:: ...JW
~~ CJ w I- Cl) w zZ
~ WW oiE 0
0::: w c.. ~ ~ 0 cc () ..I
Cl) w 0::: => I-() => 0::: I-Cl)
0::: w Cl)
a:: co (V) r--
I Cl)
C\I (V) r--
I Cl)
6 (V) r--
I Cl)
PLATE NO.
P-22
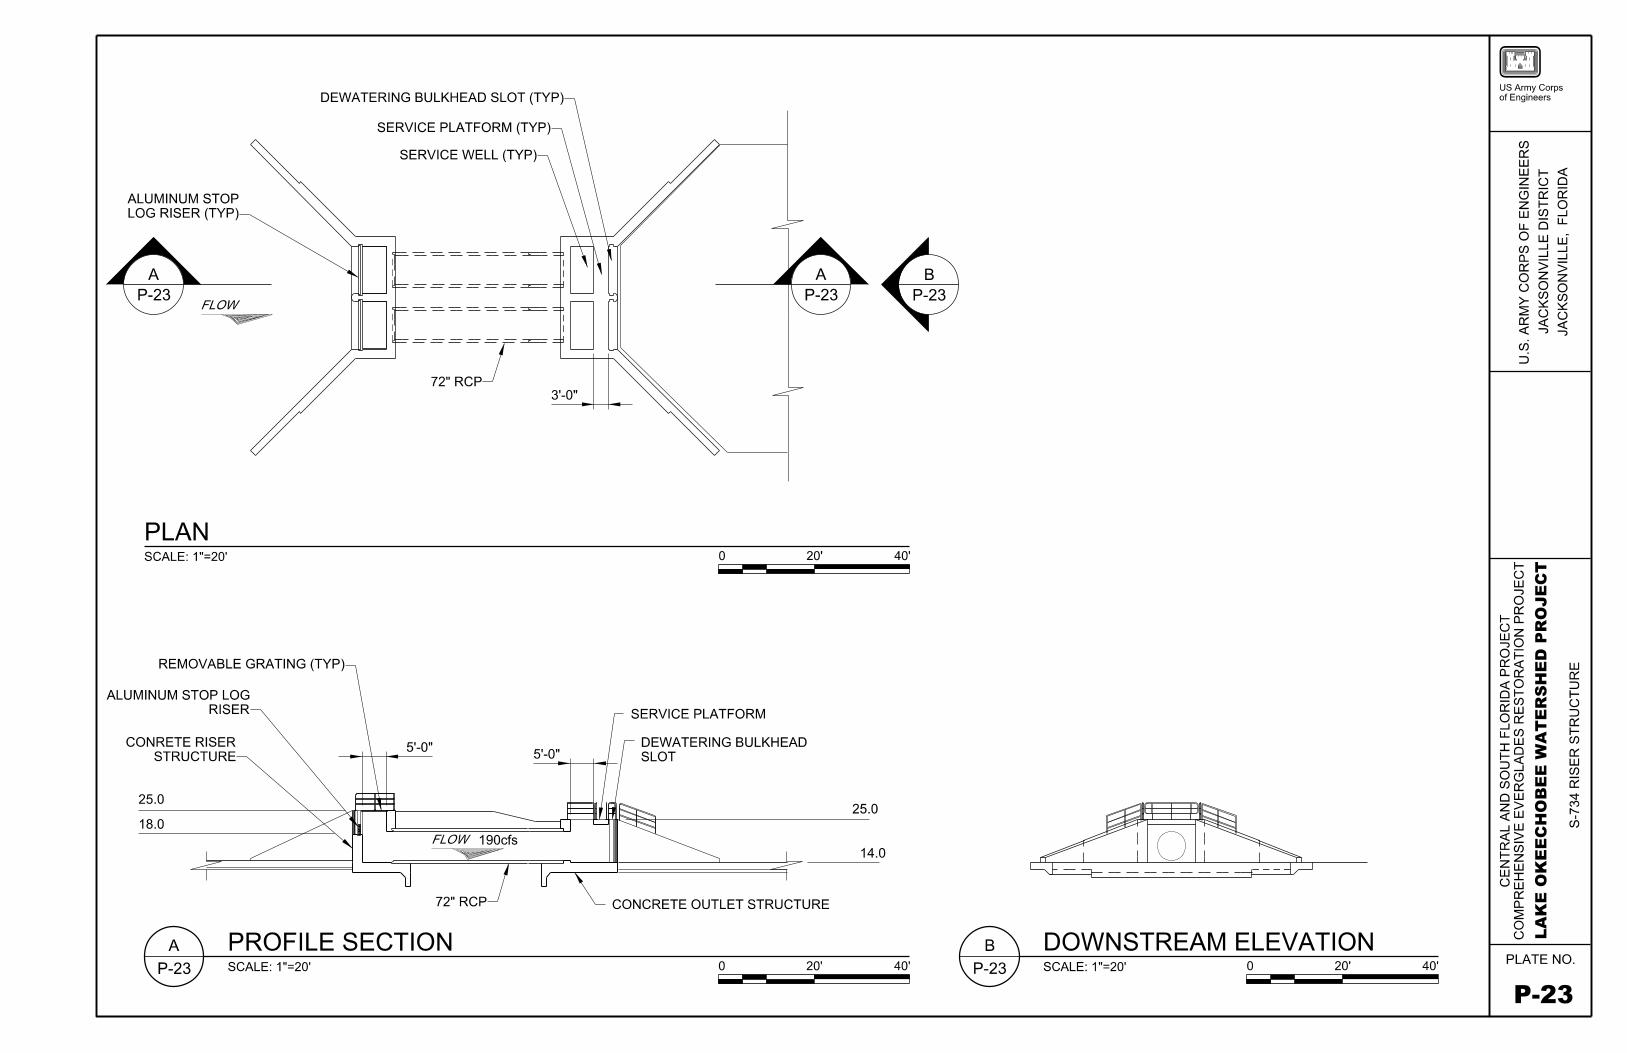
ALUMINUM STOP LOG RISER (TYP)
@FLOW -
PLAN SCALE: 1 "=20'
DEWATERING BULKHEAD SLOT (TYP)
SERVICE PLATFORM {TYP)
SERVICE WELL {TYP)
-==- -==- -==- -==- -==- -==-~
3'-0"
REMOVABLE GRATING (TYP)
ALUMINUM STOP LOG RISER
CONRETE RISER STRUCTURE
25.0
18.0
5'-0"
FLOW 190cfs
72" RCP
PROFILE SECTION SCALE: 1"=20'
5'-0"
0 20'
SERVICE PLATFORM
DEWATERING BULKHEAD SLOT
CONCRETE OUTLET STRUCTURE
0 20'
40'
25.0
14.0
DOWNSTREAM ELEVATION 40' SCALE: 1 "=20' 0 20' 40'
US Army Corps of Engineers
I- I-() CJ w --, w 0 -, 0::: 0 I- c..
Oz ,:ii=
~o A. o- Cl 8:~ w
:z:: <(0 Cl) DI--Cl) ,:ii= O:::w w Oo:::
I-[I Cl) ; IW 1-0 :::J <( w o....1 Cl)~ w ow m z> 0 <(W :z:: ...JW CJ ~~ w I- Cl) w zZ
~ WW
oiE 0 0::: w c.. ~ ~ 0 cc () ..I
w 0::: :::J I-() :::J 0::: I-Cl)
0::: w Cl)
a:: -.:t" C'? r--
I Cl)
PLATE NO.
P-23
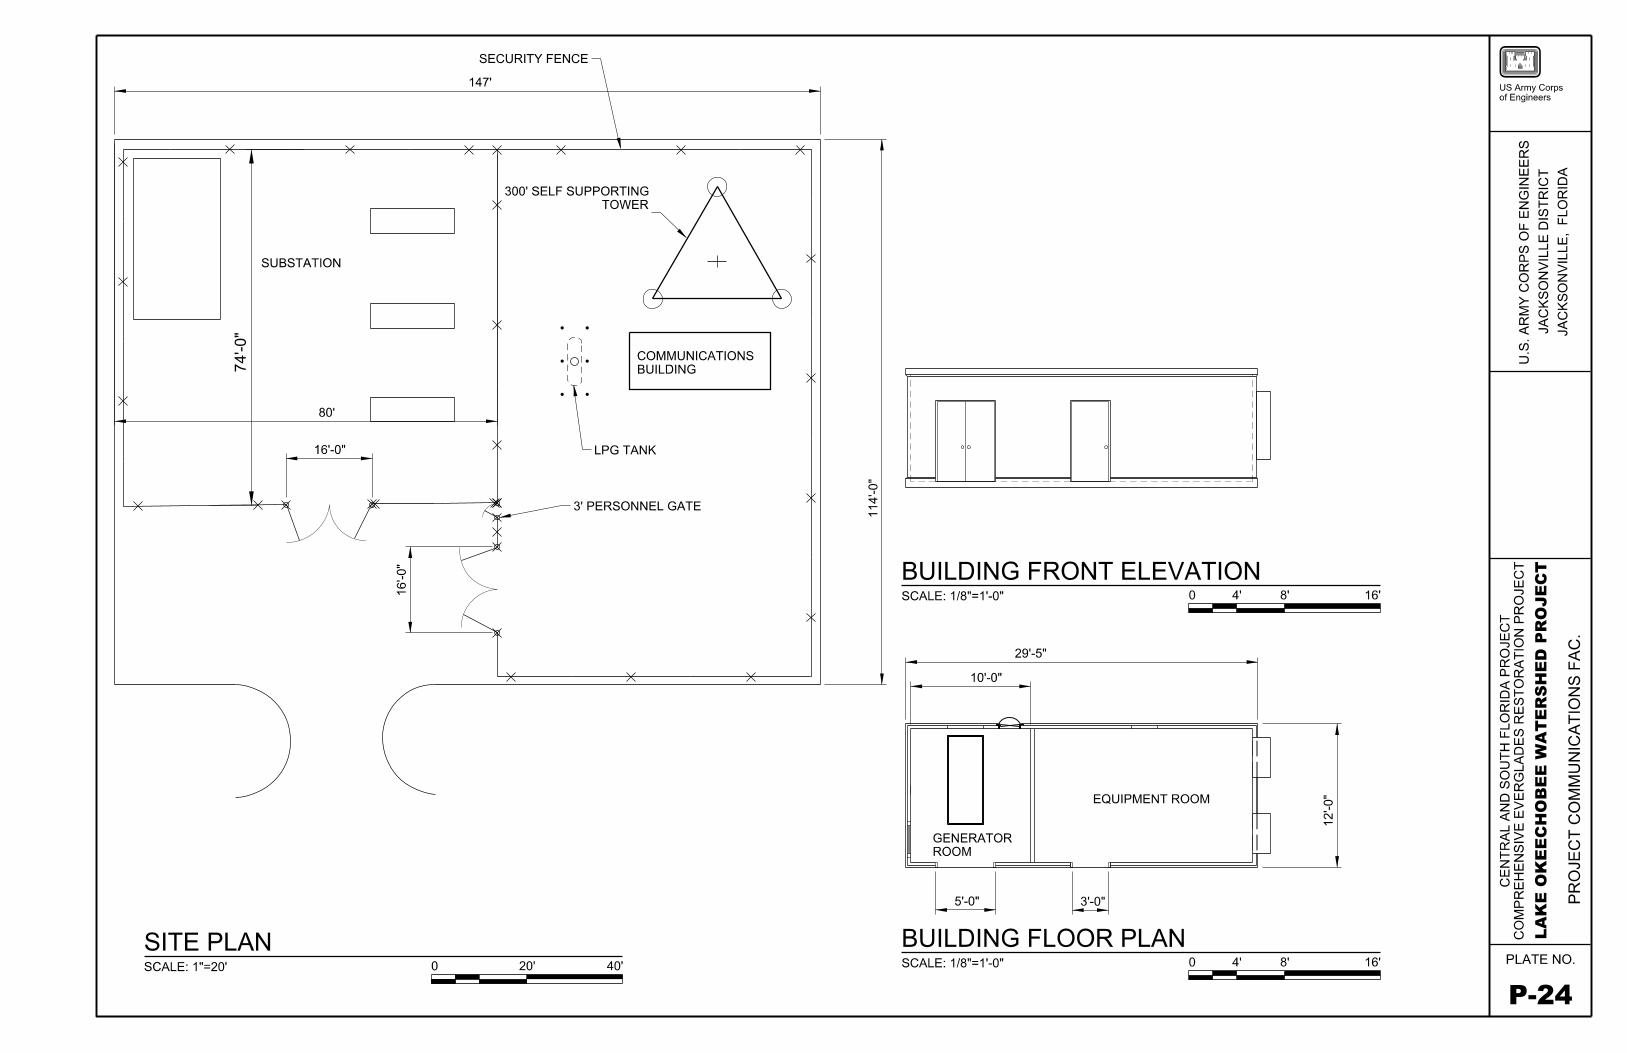
SUBSTATION
80'
II 6
I
co .....
SITE PLAN SCALE: 1 "=20' 0
SECURITY FENCE
147'
300' SELF SUPPORTING TOWER
~, I I
• 10 1. COMMUNICATIONS I I BUILDING I J
• tLPGTANK
3' PERSONNEL GATE
20' 40'
b I
~ ..... .....
I I I I'--I I I I I I I I I 00 0 I I I_ I I
½::--- ~
BUILDING FRONT ELEVATION SCALE: 1/8"=1'-0" 0 4' 8' 16' - -- -
29'-5"
10'-0"
,,,.-..__
- L II
-
EQUIPMENT ROOM b I
- N - ..... GENERATOR
II ROOM ~ r
w LJ BUILDING FLOOR PLAN SCALE: 1/8"=1'-0" 0 4' 8' 16' - -- -
US Army Corps of Engineers
I- I-(..) CJ w --, w 0 -, 0::: 0 I- c..
Oz ,:ii=
~o A. o- Cl 8:~ w <(0 :z:: DI- Cl) -Cl) ,:ii= O:::w Oo::: w [I Cl) I-IW ; 1-0 =><( o....1 w Cl)~ w ow m z> 0 <(W :z:: ...JW CJ ~~ w I- Cl) w zZ
~ WW (..) iE 0
0::: w c.. ~ ~ 0 cc (..) ..I
0 <( LL Cl) z 0
~ 0 z ::J ~ ~ 0 0 I-0 w --, 0 fl'.'. a..
PLATE NO.
P-24
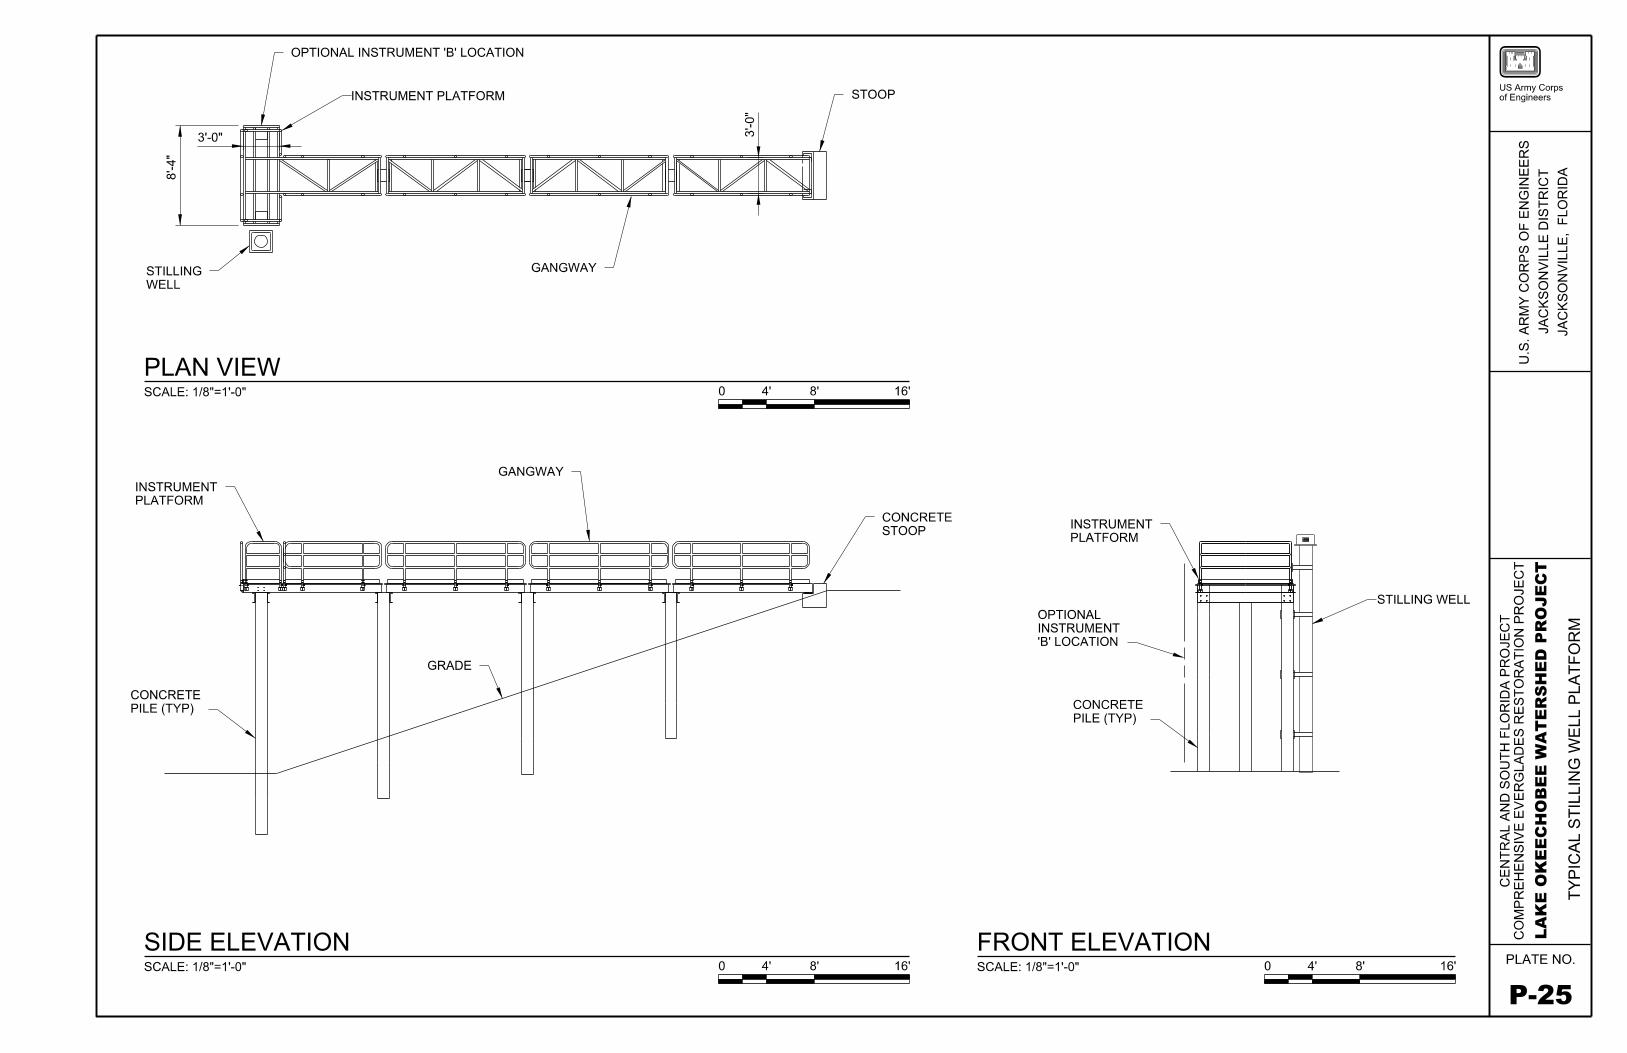
3'-0"
s:f" I
c:o
STILLING ~ WELL
PLAN VIEW SCALE: 1/8"=1'-0"
INSTRUMENT PLATFORM
OPTIONAL INSTRUMENT 'B' LOCATION
INSTRUMENT PLATFORM
GANGWAY
0 4'
GANGWAY
~!a====l~l □a==~~===s a==~~===s□□~=~~=~ 111a===•II'==:==== =□=:a===:===:=== ==:a======:=□===□=::===:===:==
CONCRETE PILE (TYP)
SIDE ELEVATION SCALE: 1/8"=1'-0"
GRADE
0 4'
8'
8'
STOOP
16'
CONCRETE STOOP
16'
INSTRUMENT PLATFORM
OPTIONAL INSTRUMENT 'B' LOCATION ~
I
CONCRETE PILE (TYP)
FRONT ELEVATION SCALE: 1/8"=1'-0"
STILLING WELL
0 4' 8' 16'
US Army Corps of Engineers
~ 0::: 0 LL
~ D... _J _J
w s C) z _J _J
IC/) _J
(3 D...
~
PLATE NO.
P-25
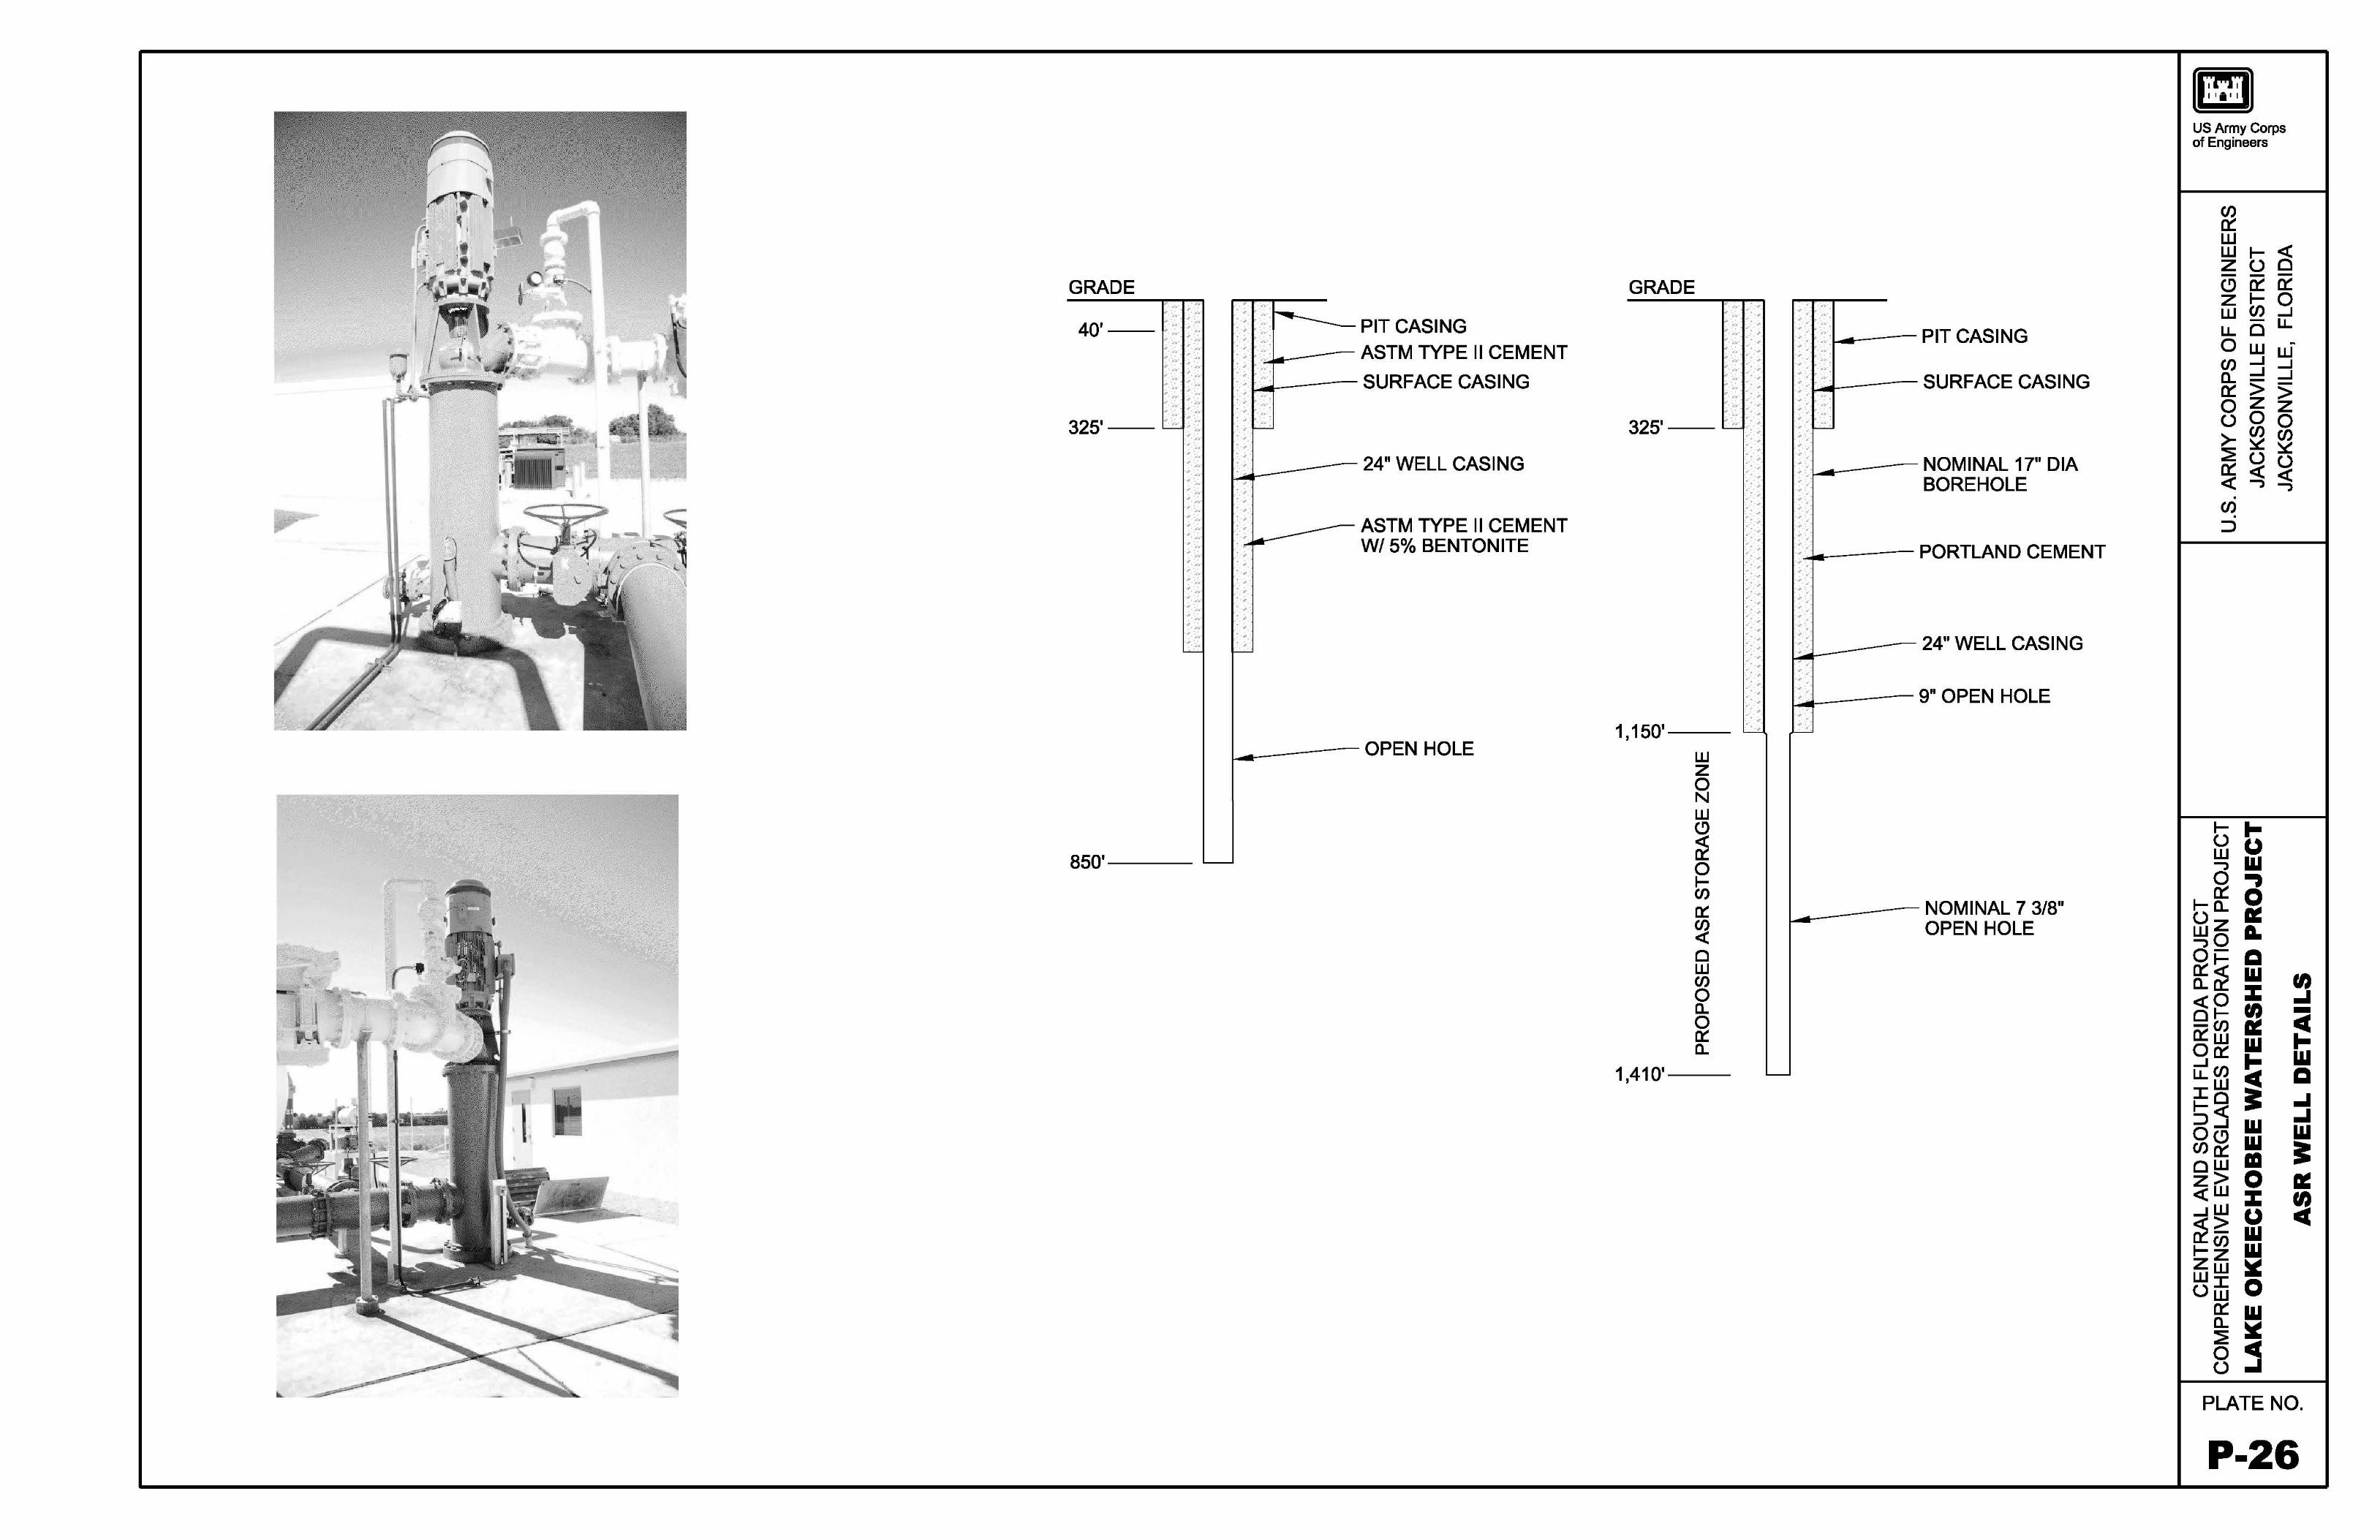
--
--
___
___
- -I- 0
US Army Corps of Engineers
.· .... ..•._
::::Yi------......_ PIT CASING _._..,. .-... · _:_..;._ ,:.~.:
::: :::J:: ....---ASTM TYPE II CEMENT . .,. ... ::::< ·.,. '· '.'~:
, '
. .•. _: ..;._ ,:.~.· _: . .,._. ,.-..~.: : ..;. L::..:·•· .·•
..,. __
l:J<J____:·
__ ..,._ .
SURFACE CASING
24" WELL CASING
i:!1..------- ASTM TYPE II CEMENT :,,, WI 5% BENTONITE
__ . .,._ __ ..,._ .
_._. ... _
__ . .,._ .
__ . .,._ .... _.
: . .;.· i..:....:....a. ·
1------ OPEN HOLE
~~
GRADE
.- .,._ ,..
.. .,._ ......
.. .,._ ... .,,
.- <#'_ ,.. .. .,._ .- "'·
.- <#'_ ,.. 1,150'-
UJ z 0 N UJ
~ 0 IC/)
0:::
~ Cl UJ en 0 Cl. 0 0::: Cl.
1,410'---
GRADE
SURFACE CASING
.,
:: l.------NOMINAL 17" DIA :·
"'-·,.·
'.4·'----
40'
3251
...·-~:-. -.-:-::,••,... '.,.,.,. .... ,,. ·. . .,. .. ,,. . . .,. .. ,. ...•. ' ·.:...•... ... .,. .,. .... ,,. ·. . .,. .. ,. .. ' .,.... .,. .. ,. .... .,. ·. . .,. .. .. .,. ·.-, .· ••~ -.,..:. _.
.:. ·
.;. ._. ... '• ,.,. ·-.:. ·-
.:. ·
.;. ._. ..;. '• ,.,. ·-.:. ·-
..:. ·.;. ._. ..:. '• ,.,. .. .:. ·-
... ·.-w.:.::
850'----
BOREHOLE
PORTLAND CEMENT
24" WELL CASING
9" OPEN HOLE
NOMINAL 7 3/8" OPEN HOLE
-~_:< ~-:•·:
., .. Ll.: J_.:
........ <-:
j_:,: l,· ...
-
en 0::: UJ UJ z-C) z UJ u. 0 en Cl. 0::: 0 (.)
>-~ 0::: <( . en. ::J
I-(.) UJ ""')
0 0:::
I- Cl.Uz a::
A.~oo- Cl ~~ <(0OI--en0::: UJ 0 0::: ...Jen u.UJIo I-<(::J ...J Oe> en 0::: OUJz> <( UJ ...J UJ
~~ I-zZen UJUJ(.) [TI
0::: Cl. ~
(.)
I- <( (.) Cl 0::: 0:::
en ...J- u.Cl -UJ UJ...J ...J...J
> > ...J- -
z 0 en ~ (.) <( ""')
I-u .,w 0
w:z:
= ; w I-
w w Ill 0:z: u w w ~ 0 w cc ~ ..I
z 0 Cl) ~ (.) <( ""')
en ..I-~ w Cl ..I ..I w I a::
=
PLATE NO.
0
P-26
Appendix A Engineering Appendix
ANNEX G-1
GEOLOGICAL INVESTIGATIONS
LOWRP Revised Draft PIR and EIS
CESAJ-EN-G 10 October 2017
MEMORANDUM FOR RECORD
SUBJECT: Preliminary summary of soils and shallow subsurface geological characteristics on the footprints of the proposed K-42 and K-05 reservoir sites, Highlands and Glades Counties, Florid? for the Lake Okeechobee Watershed Restoration Project
1. Engineering Division has performed a technical evaluation of the material characteristics and permeability of soils that underlie the footprints of the proposed K-42 and K-05 reservoir sites. This evaluation was conducted to estimate seepage losses at each proposed site. This memorandum supports the 3x3x3 SMART planning process for the Lake Okeechobee Watershed Restoration Project.
2. Preliminary geotechnical data obtained for this project consists of existing and newly acquired Standard Penetration Test (SPT) borings, results from constant-head gravity tests and double-ring infiltrometer tests. These subsurface datasets are supplemented with surface soil permeability data obtained from the National Resource Conservation Survey's (NRCS) web soil survey tool. A full analysis of the double-ring infiltrometer data has yet to be performed.
3. Saturated hydraulic conductivity values of the surface soils range from 0.0028 to 0.0092 cm/sec at the K-42 site, and from 0.0078 to 0.0092 cm/sec at the K-05 site. These values are interpreted by the NRCS as moderately high to high, indicating the ease of infiltration from the reservoir through surface soils.
4. Hydraulic conductivity values were calculated from constant-head gravity tests · and NRCS data. These values were input to a 2D finite element seepage model using SEEP/W. The conceptual model was constructed for both reservoir sites with 3 layers below each site's embankment, the embankment, and a seepage canal. Three pool depths (5 feet, 10 feet, and 15 feet) were evaluated for each site. Each pool depth simulation was run with and without a 60-foot deep seepage cutoff wall at each site.
5. The range of seepage losses are similar at both reservoir sites. Without a cutoff wall, seepage losses range between 362 and 638 cfs at the K-42 site, and between 278 and 592 cfs at the K-05 site. With a cutoff wall, seepage losses are reduced by approximately one-third and range between 254 and 438 cfs at K-42, and between 189 and 378 cfs at K-05. The largest seepage loss occurs at the deepest pool depth of 15 feet.
6. For further questions or additional information, please contact Michael W. Viessman, P.E., (904) 232-1969, [email protected]; or June E.
Mirecki, Ph.D., P.G. (904) 232-1236, [email protected].
al!@ 1 Encl {2,t._LAUREEN A. BOROCHANER, P.E.
Chief, Engineering Division
2
CESAJ-EN-G 10 October 2017
MEMORANDUM FOR RECORD
SUBJECT: Preliminary summary of soils and shallow subsurface geological characteristics on the footprints of the proposed K-42 and K-05 reservoir sites, Highlands and Glades Counties, Florida for the Lake Okeechobee Watershed Restoration Project
1. References. a. Challenge Engineering & Testing, Inc., Final Report Lake Okeechobee
Watershed, Highland & Glades Counties, Florida. Undated report (2007), 812 p. b. Challenge Engineering & Testing, Inc., Final Report Lake Okeechobee
Watershed, K-42 and 1-17 Project, Phase II, 2008, 242 p. c. Domenico, P.A. and Schwartz, F.W., 1990. Physical and Chemical
Hydrogeology. New York: John Wiley & Sons, p. 89. d. Dunnicliff, J. Geotechnical Instrumentation for Monitoring Field Performance.
New York: John Wiley & Sons, Inc., 1993. Print. e. Hvorslev, M. J. April 1951. Time Lag and Soil Permeability in Ground-Water
Observations. Vicksburg Mississippi: Waterways Experiment Station U.S. Army Corps of Engineers, Bulletin No. 36.
f. National Resource Conservation Service Web Soil Survey Tool, available at https://websoilsurvey.nrcs.usda.gov/app/
g. U.S. Department of Interior, Bureau of Reclamation. January 2014. Design Standards No. 13, Embankment Dams, Chapter 8: Seepage, Phase 4 (Final).
2. Background. Construction of two reservoirs is proposed in the alternative list for the Lake Okeechobee Watershed Restoration Project (LOWRP). The proposed K-42 reservoir footprint extends along the north side of canal C-41 A from State Road (S.R.) 721 on the eastern margin to a north-south line extending north from Structure S-83 on the western margin (Figure 1). The proposed K-05 reservoir footprint extends west from the Kissimmee River floodplain, and is bounded on the south by S.R. 78. The areas are within the Eastern Flatlands physiographic region, consists of relatively flat topography with ponds and depressional wetlands, and grades into the Kissimmee River alluvial plain to the east.
The LOWRP currently is in the SMART Planning phase, leading to selection of the "Tentatively Selected Plan" (TSP) in October 2017. The alternatives currently under consideration consist of a combination of reservoirs, aquifer storage and recovery wells, and tracts of land for wetland restoration. With respect to the reservoir footprints, the project delivery team requested an estimate of the seepage losses from each impoundment. Excessive seepage could reduce the likelihood that one or both reservoirs are chosen as a part of the TSP.
1
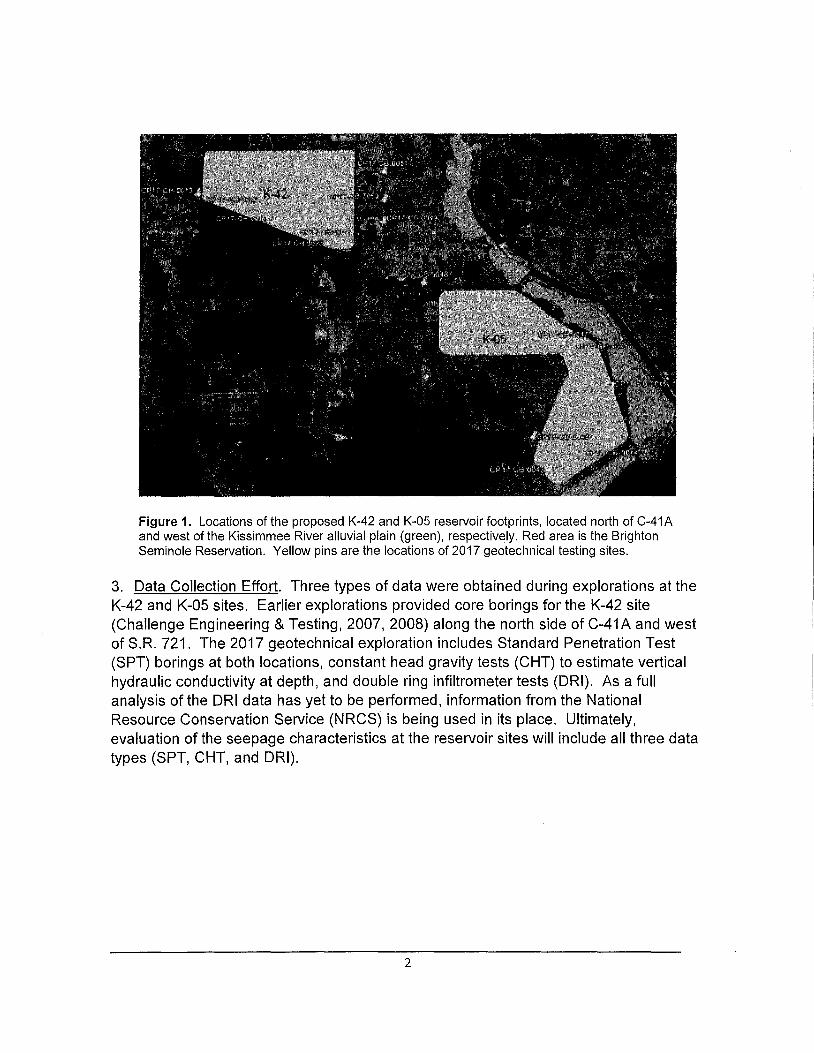
Figure 1. Locations of the proposed K-42 and K-05 reservoir footprints, located north of C-41 A and west of the Kissimmee River alluvial plain (green), respectively. Red area is the Brighton Seminole Reservation. Yellow pins are the locations of 2017 geotechnical testing sites.
3. Data Collection Effort. Three types of data were obtained during explorations at the K-42 and K-05 sites. Earlier explorations provided core borings for the K-42 site (Challenge Engineering & Testing, 2007, 2008) along the north side of C-41A and west of S.R. 721. The 2017 geotechnical exploration includes Standard Penetration Test (SPT) borings at both locations, constant head gravity tests (CHT) to estimate vertical hydraulic conductivity at depth, and double ring infiltrometer tests (ORI). As a full analysis of the ORI data has yet to be performed, information from the National Resource Conservation Service (NRCS) is being used in its place. Ultimately, evaluation of the seepage characteristics at the reservoir sites will include all three data types (SPT, CHT, and ORI).
2
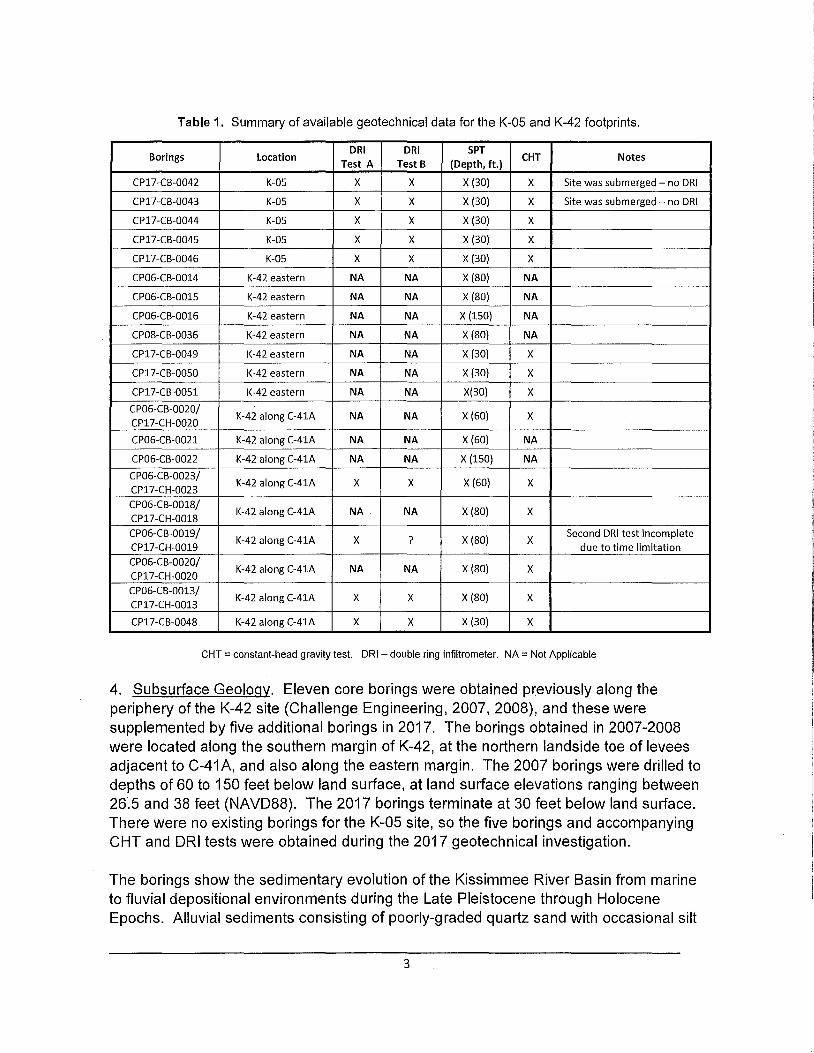
Table 1. Summary of available geotechnical data for the K-05 and K-42 footprints.
Borings Location DRI
Test A DRI
Test B SPT
(Depth, ft.) CHT Notes
CP17-CB-0042 K-05 X X X (30) X Site was submerged - no DRI
CP17-CB-0043 K-05 X X X {30) X Site was submerged - no DRI
CP17-CB-0044 K-05 X X X {30) X
CP17-CB-0045 K-05 X X X {30) X
CP17-CB-0046 K-05 X X X {30) X
CP06-CB-0014 K-42 eastern NA NA X {80) NA
CP06-CB-0015 K-42 eastern NA NA X (80) NA
CP06-CB-0016 K-42 eastern NA NA X (150) NA
CP08-CB-0036 K-42 eastern NA NA X (80) NA
CP17-CB-0049 K-42 eastern NA NA X (30) X
CP17-CB-0050 K-42 eastern NA NA X (30) X
CP17-CB-0051 K-42 eastern NA NA X(30) X
CP06-CB-0020/ CP17-CH-0020
K-42 along C-41A NA NA X (60) X
CP06-CB-0021 K-42 along C-41A NA NA X {60) NA
CP06-CB-0022 K-42 along C-41A NA NA X (150) NA CP06-CB-0023/ CP17-CH-0023
K-42 along C-41A X X X {60) X
CP06-CB-0018/ CP17-CH-0018
K-42 along C-41A NA NA X {80) X
CP06-CB-0019/ CP17-CH-0019
K-42 along C-41A X ? X (80) X Second DRI test incomplete
due to time limitation CP06-CB-0020/ CP17-CH-0020
K-42 along C-41A NA NA X (80) X
CP06-CB-0013/ CP17-CH-0013
K-42 along C-41A X X X {80) X
CP17-CB-0048 K-42 along C-41A X X X (30) X
CHT = constant-head gravity test. DRI - double ring infiltrometer. NA = Not Applicable
4. Subsurface Geology. Eleven core borings were obtained previously along the periphery of the K-42 site (Challenge Engineering, 2007, 2008), and these were supplemented by five additional borings in 2017. The borings obtained in 2007-2008 were located along the southern margin of K-42, at the northern landside toe of levees adjacent to C-41A, and also along the eastern margin. The 2007 borings were drilled to depths of 60 to 150 feet below land surface, at land surface elevations ranging between 26.5 and 38 feet (NAVD88). The 2017 borings terminate at 30 feet below land surface. There were no existing borings for the K-05 site, so the five borings and accompanying CHT and ORI tests were obtained during the 2017 geotechnical investigation.
The borings show the sedimentary evolution of the Kissimmee River Basin from marine to fluvial depositional environments during the Late Pleistocene through Holocene Epochs. Alluvial sediments consisting of poorly-graded quartz sand with occasional silt
3
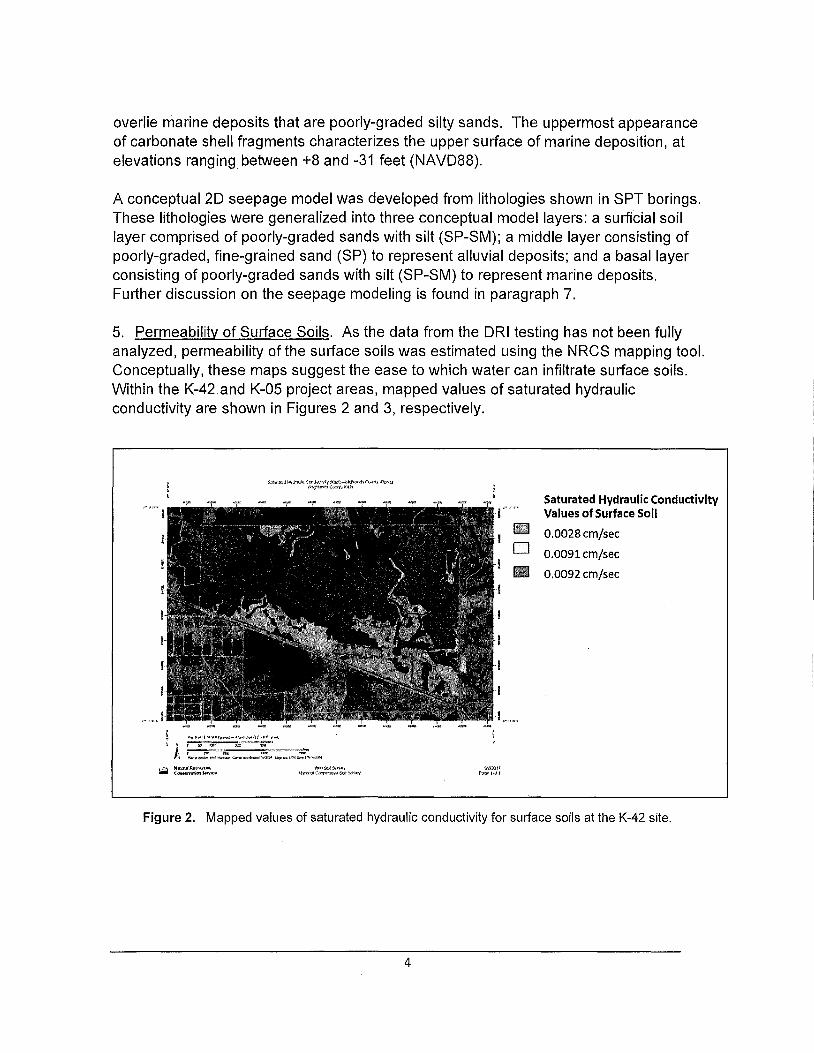
overlie marine deposits that are poorly-graded silty sands. The uppermost appearance of carbonate shell fragments characterizes the upper surface of marine deposition, at elevations ranging between +8 and -31 feet (NAVD88).
A conceptual 2D seepage model was developed from lithologies shown in SPT borings. These lithologies were generalized into three conceptual model layers: a surficial soil layer comprised of poorly-graded sands with silt (SP-SM); a middle layer consisting of poorly-graded, fine-grained sand (SP) to represent alluvial deposits; and a basal layer consisting of poorly-graded sands with silt (SP-SM) to represent marine deposits. Further discussion on the seepage modeling is found in paragraph 7.
5. Permeability of Surface Soils. As the data from the ORI testing has not been fully analyzed, permeability of the surface soils was estimated using the NRCS mapping tool. Conceptually, these maps suggest the ease to which water can infiltrate surface soils. Within the K-42 and K-05 project areas, mapped values of saturated hydraulic conductivity are shown in Figures 2 and 3, respectively.
~ff~).l~ab:C<:nMM,'j/.¥/tt,-•l~U"ffl(:tN?, n:n)J ('1~(,:;,.rlfKt;)
1·· ,,.
D
Saturated Hydraulic Conductivity Values of Surface Soil
0.0028 cm/sec
0.0091 cm/sec
0.0092 cm/sec
WW/JS,AS..n'<'I ~C~!tmOO.~I
Figure 2. Mapped values of saturated hydraulic conductivity for surface soils at the K-42 site.
4
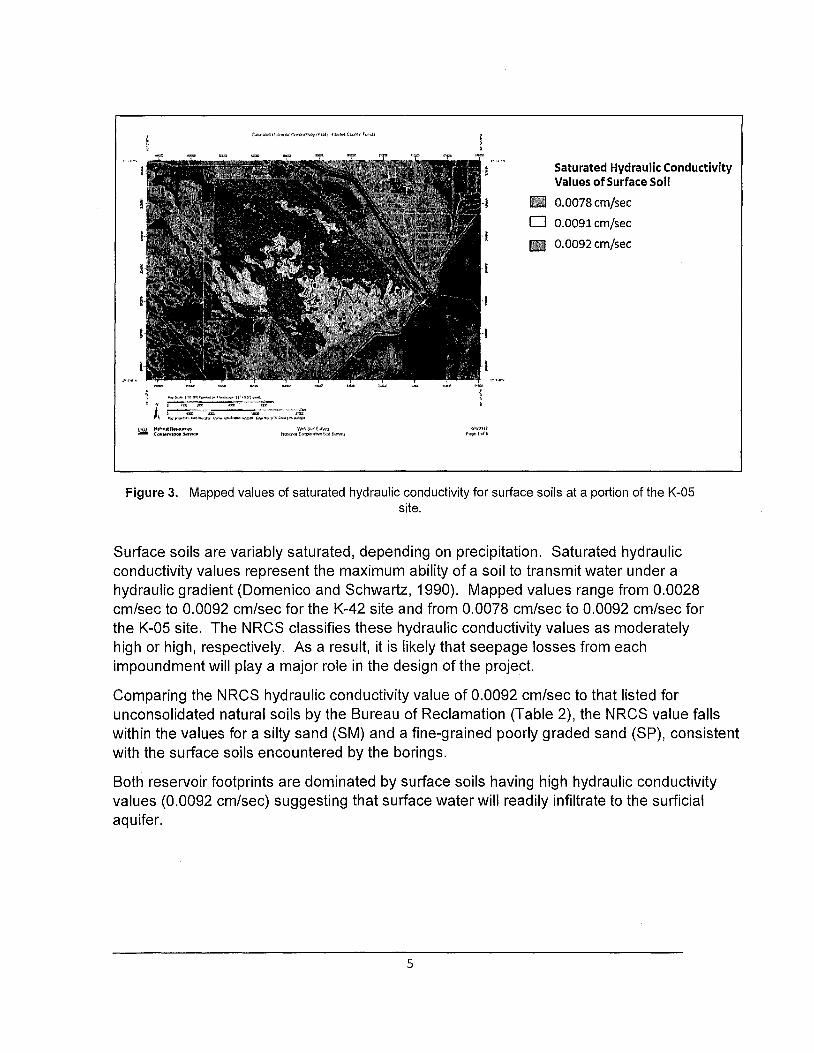
e .,,._,t..,_~,..- .... ,..-,ii••t:S;...-
ii ~ t - 7!Z1. «m -
J, ~,--~~~~~- ..~~~,::=:~1::
Saturated Hydraulic Conductivity Values of Surface Soil
0.0078 cm/sec
D 0.0091 cm/sec
0.0092 cm/sec
Figure 3. Mapped values of saturated hydraulic conductivity for surface soils at a portion of the K-05 site.
Surface soils are variably saturated, depending on precipitation. Saturated hydraulic conductivity values represent the maximum ability of a soil to transmit water under a hydraulic gradient (Domenico and Schwartz, 1990). Mapped values range from 0.0028 cm/sec to 0.0092 cm/sec for the K-42 site and from 0.0078 cm/sec to 0.0092 cm/sec for the K-05 site. The NRCS classifies these hydraulic conductivity values as moderately high or high, respectively. As a result, it is likely that seepage losses from each impoundment will play a major role in the design of the project.
Comparing the NRCS hydraulic conductivity value of 0.0092 cm/sec to that listed for unconsolidated natural soils by the Bureau of Reclamation (Table 2), the NRCS value falls within the values for a silty sand (SM) and a fine-grained poorly graded sand (SP), consistent with the surface soils encountered by the borings.
Both reservoir footprints are dominated by surface soils having high hydraulic conductivity values (0.0092 cm/sec) suggesting that surface water will readily infiltrate to the surficial aquifer.
5
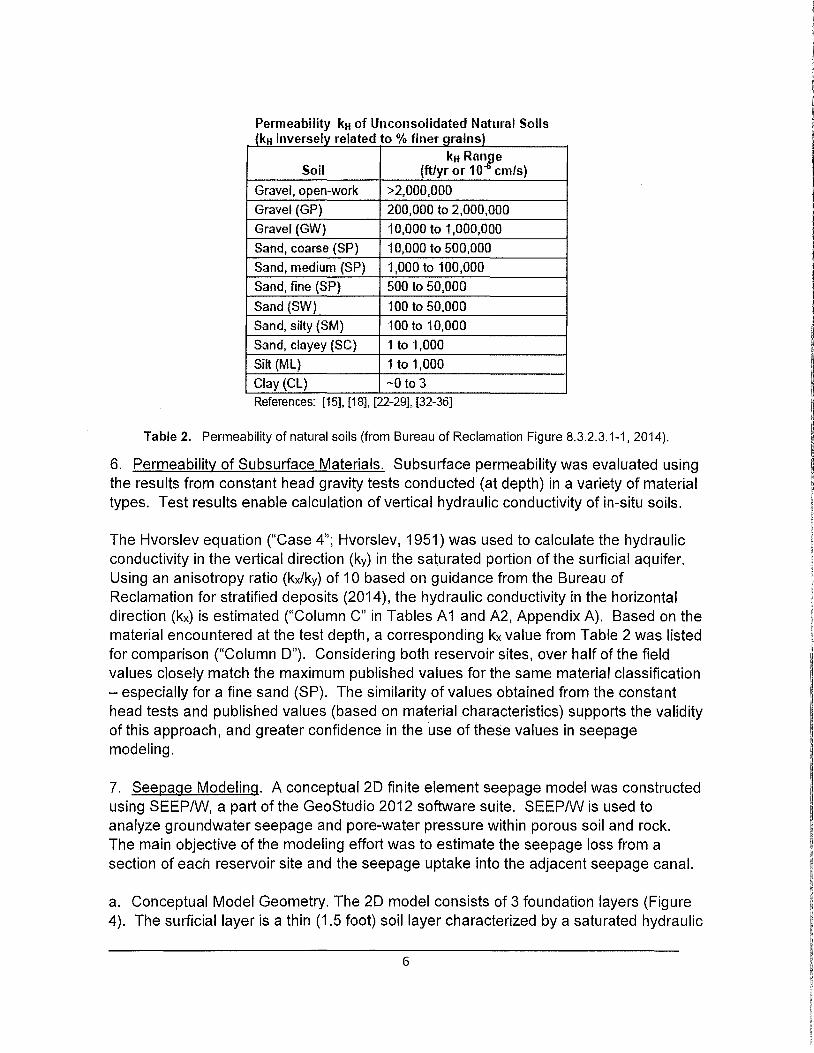
Permeability kH of Unconsolidated Natural Soils (kH inversely related to % finer cirainsl
Soil kH Ran_pe
(ft/yr or 10 emfs)
Gravel, open-work >2,000,000
Gravel (GP} 200,000 to 2,000,000
Gravel (GW) 10,000 to 1,000,000
Sand, coarse (SP) 10,000 to 500,000
Sand, medium (SP) 1,000 to 100,000
Sand, fine (SP) 500 to 50,000
Sand (SW) 100 to 50,000
Sand, silty (SM) 100to 10,000
Sand, clayey (SC} 1 to 1,000
Silt (ML) 1 to 1,000
Clay (CL) ~Oto 3
References: [15], [18], [22-291, [32-36]
Table 2. Permeability of natural soils (from Bureau of Reclamation Figure 8.3.2.3.1-1, 2014).
6. Permeability of Subsurface Materials. Subsurface permeability was evaluated using the results from constant head gravity tests conducted (at depth) in a variety of material types. Test results enable calculation of vertical hydraulic conductivity of in-situ soils.
The Hvorslev equation ("Case 4"; Hvorslev, 1951) was used to calculate the hydraulic conductivity in the vertical direction (ky) in the saturated portion of the surficial aquifer. Using an anisotropy ratio (kx/ky) of 10 based on guidance from the Bureau of Reclamation for stratified deposits (2014), the hydraulic conductivity in the horizontal direction (kx) is estimated ("Column C" in Tables A1 and A2, Appendix A). Based on the material encountered at the test depth, a corresponding kx value from Table 2 was listed for comparison ("Column O"). Considering both reservoir sites, over half of the field values closely match the maximum published values for the same material classification - especially for a fine sand (SP). The similarity of values obtained from the constant head tests and published values (based on material characteristics) supports the validity of this approach, and greater confidence in the use of these values in seepage modeling.
7. Seepage Modeling. A conceptual 20 finite element seepage model was constructed using SEEP/W, a part of the GeoStudio 2012 software suite. SEEP/W is used to analyze groundwater seepage and pore-water pressure within porous soil and rock. The main objective of the modeling effort was to estimate the seepage loss from a section of each reservoir site and the seepage uptake into the adjacent seepage canal.
a. Conceptual Model Geometry. The 20 model consists of 3 foundation layers (Figure 4). The surficial layer is a thin (1.5 foot) soil layer characterized by a saturated hydraulic
6
conductivity value of 0.0092 cm/sec, obtained from the NRCS graphics. Shallow alluvial deposits are represented as a 30-foot thick poorly-graded sand layer (SP) characterized by a hydraulic conductivity value (kx) of 0.049 cm/sec for K-42 and 0.053 cm/sec for K-05. Deeper marine deposits are represented as a 120-foot thick poorly-graded sand with silt (SP-SM) characterized by a saturated hydraulic conductivity value of 0.03 cm/sec. Hydraulic conductivity values for the SP and SP-SM layers are based on average values obtained from constant head gravity tests (Tables A1 and A2, Appendix A).
For K-42, the ground surface elevation was set at +30 feet based on top-of-boring survey data and the crest elevation for the perimeter embankment was set at +60 feet (both NAVD88). For K-05, the ground surface elevation was set at +17 feet based on top-of-boring survey data and the crest elevation for the perimeter embankment was set at +4 7 feet (both NAVD88). The near-edge of the perimeter seepage canal was placed 150 feet south of the exterior toe of the perimeter embankment and the bottom elevation was set at +9 feet for K-42 and -4 feet for K-05 (both NAVD88). Side slopes of 1 V:3H were used for both the perimeter embankment and seepage canal.
b. Pool Depth and Seepage Canal Stage. Simulations were run for three pool depths: 5-feet, 10-feet, and 15-feet. The water surface elevation in the perimeter seepage canal was set at +21 feet for K-42 and +12 feet for K-05 (both NAVD88), based on groundwater readings taken in the boreholes after 24 hours. Both the reservoir pool and the canal stage were set as a steady-state condition.
c. Cutoff Wall Configuration. A seepage barrier (cutoff wall) was added to the model in each pool-depth simulation. The cutoff wall began 10 feet below the top of the perimeter embankment, extended 60 feet below ground surface, and was 3 feet wide. The wall depth (below ground surface) was selected as construction costs have already been determined for a cutoff wall with similar dimensions.
7
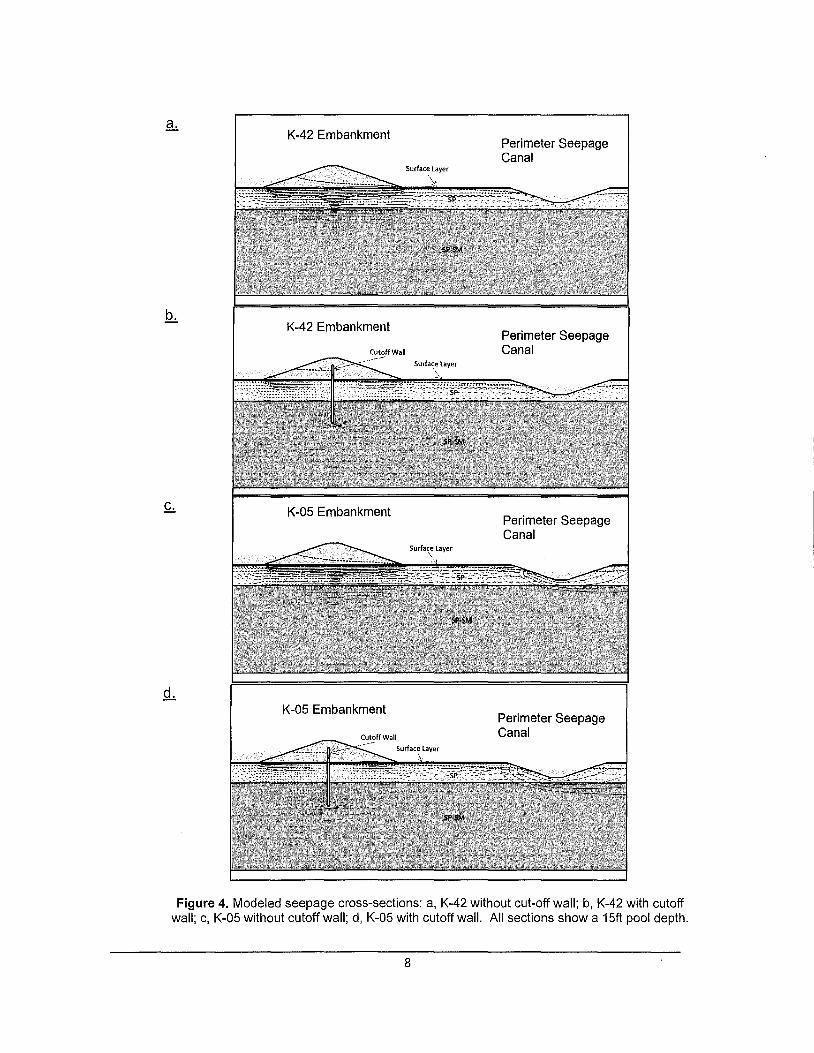
K-42 Embankment Perimeter Seepage Canal
g_,_
Figure 4. Modeled seepage cross-sections: a, K-42 without cut-off wall; b, K-42 with cutoff wall; c, K-05 without cutoff wall; d, K-05 with cutoff wall. All sections show a 15ft pool depth.
K-42 Embankment
K-05 Embankment
K-05 Embankment
Surface Layer
\.
Surfa~~ layer ~:
Perimeter Seepage Canal
Perimeter Seepage Canal
Perimeter Seepage Canal
8
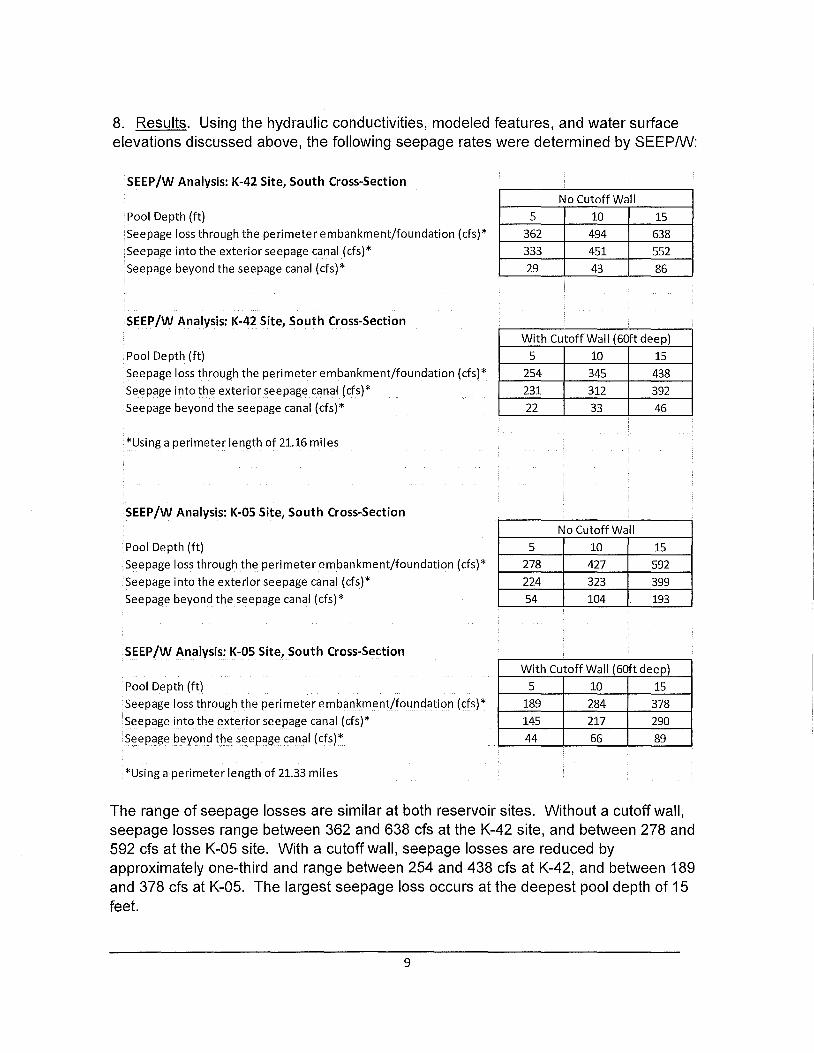
8. Results. Using the hydraulic conductivities, modeled features, and water surface elevations discussed above, the following seepage rates were determined by SEEP/W:
SEEP/W Analysis: K-42 Site, South Cross-Section
No Cutoff Wall
Pool Depth (ft)
Seepage loss through the perimeter embankment/foundation (cfs)*
Seepage into the exterior seepage canal (cfs)*
Seepage beyond the seepage canal (cfs)*
SEEP/W Analysis: K-42 Site, South Cross-Section
Pool Depth (ft)
Seepage loss through the perimeter embankment/foundation (cfs)*
Seepage into the exterior seepage canal ( cfs)*
Seepage beyond the seepage canal (cfs)*
5
362
333
29 •
10
494
451
43
15
638
552
86
. •
With Cutoff Wall (60ft deep)
5 10 15
254 345 438
231 312 392
22 33 46
*Using a perimeter length of 21.16 miles
SEEP/W Analysis: K-05 Site, South Cross-Section •
No Cutoff Wal I
Pool Depth (ft) 5
Seepage loss through the perimeter embankment/foundation (cfs)* 278
Seepage into the exterior seepage canal (cfs)* 224
Seepage beyond the seepage canal (cfs)* 54
10 15
427 592
323 399
104 193
SEEP/W Analysis: K-05 Site, South Cross-Section
Pool Depth (ft)
Seepage loss through the perimeter embankment/foundation (cfs)*
Seepage into the exterior seepage canal (cfs)*
Seepage beyond the seepage canal (cfs)*
*Using a perimeter length of 21.33 miles
With Cutoff Wall (60ftdeep)
5
189
145
44
10 15
284 378
217 290
66 89 .
The range of seepage losses are similar at both reservoir sites. Without a cutoff wall, seepage losses range between 362 and 638 cfs at the K-42 site, and between 278 and 592 cfs at the K-05 site. With a cutoff wall, seepage losses are reduced by approximately one-third and range between 254 and 438 cfs at K-42, and between 189 and 378 cfs at K-05. The largest seepage loss occurs at the deepest pool depth of 15 feet.
9
9. Conclusions. The hydraulic conductivity values from the NRCS soil survey map and the constant head gravity tests closely correlate with published values for the soils encountered by the present and past subsurface investigations. It is therefore recommended that these values be used in subsequent planning analyses for the project supplemented by additional investigations during the design phase. As ORI data set is not yet complete, the data from that portion of the current fieldwork was not used in the 20 seepage analysis discussed above. Once the fieldwork is complete, the double ring infiltrometer data will be revisited and incorporated (if possible) into the design of the project.
10. Point of Contact. Any questions or comments regarding this MFR should be addressed to: Michael W. Viessman, P.E., (904) 232-1969, [email protected]; or June E. Mirecki, Ph.D., P.G. (904) 232-1236, [email protected].
J ~i ~~~ w~-i.~-·· DENNIS J. ZEVENEY, P.E.
/ Chief, Geotechnical Branch
10
Appendix A (Data Tables)
11
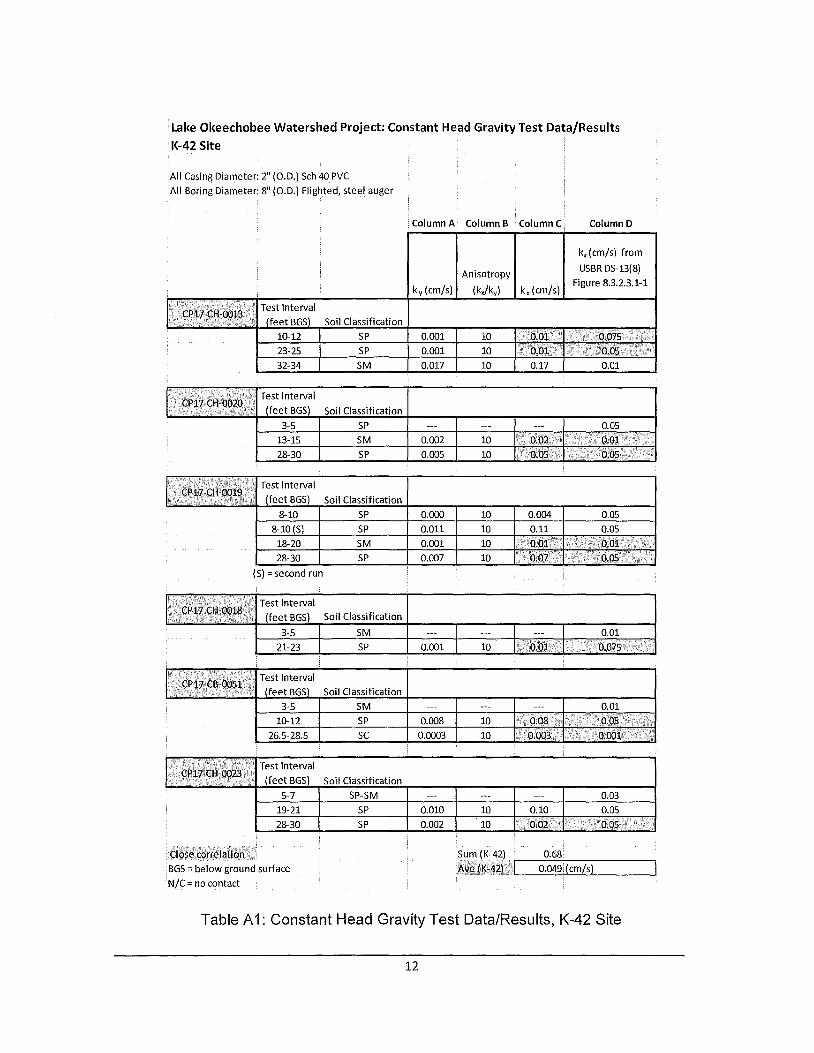
--- ---
Lake Okeechobee Watershed Project: Constant Head Gravity Test Data/Results K-42 Site
All Casing Diameter: 2" (O.D.) Sch 40 PVC
All Boring Diameter: 8" (O.D.) Flighted, steel auger
Column A Column B Column C Column D
kx(cm/s) from
USBR DS-13(8)Anisotropy
Figure 8.3.2.3.1-1 kv (cm/s)
I kx (cm/s)
Test Interval
(kJkv)
CP17-CH-0013 /feet BGSl Soil Classification
10-12 SP 0.001 10 O.ol oms 23-25 SP 0.001 10 0.01 0.05
32-34 SM 0.017 10 0.17 0.01
I CP17-CH-0020 Test Interval
(feet BGS) Soil Classification
3-5 SP --- --- --- 0.05
13-15 SM 0.002 10 0.02 0.01
28-30 SP 0.005 10 0.05 0,05 .
I CP17-CH-0019 Test Interval
(feet BGS) Soil Classification
8--10 SP 0.000 10 0.004 0.05
8-10(5) SP 0.011 10 0.11 0.05
18-20 SM 0.001 10 0.01 O.Ql 28-30 SP 0.007 10 om 0.05
(S) =second run
I Test Interval CP17-CH-0018
(feet BGS) Soil Classification
3-5 I SM --- I --- I --- I 0.01
21-23 I SP 0.001 I 10 I 0.01 I oms
I Test Interval CP17-CB-0051
(feet BGS)
3-5
10-12
26.5-28.5
I Test Interval CP17-CH-0023
(feet BGS)
5-7
19-21
28-30
Close correlation
BGS = below ground surface
N/C = no contact
Soil Classification
SM --- --- --- 0.01
SP 0.008 10 0.08 0.05
SC 0.0003 10 0.003 0.001
Soil Classification
.
SP-SM
SP
SP
i
0.010
0.002 . 10
10
Sum (K-42)
Ave(K-42)
.
--- 0.03
0.10 0.05
0.02 0.05
0.68
0.049 (emfs)
Table A1: Constant Head Gravity Test Data/Results, K-42 Site
12
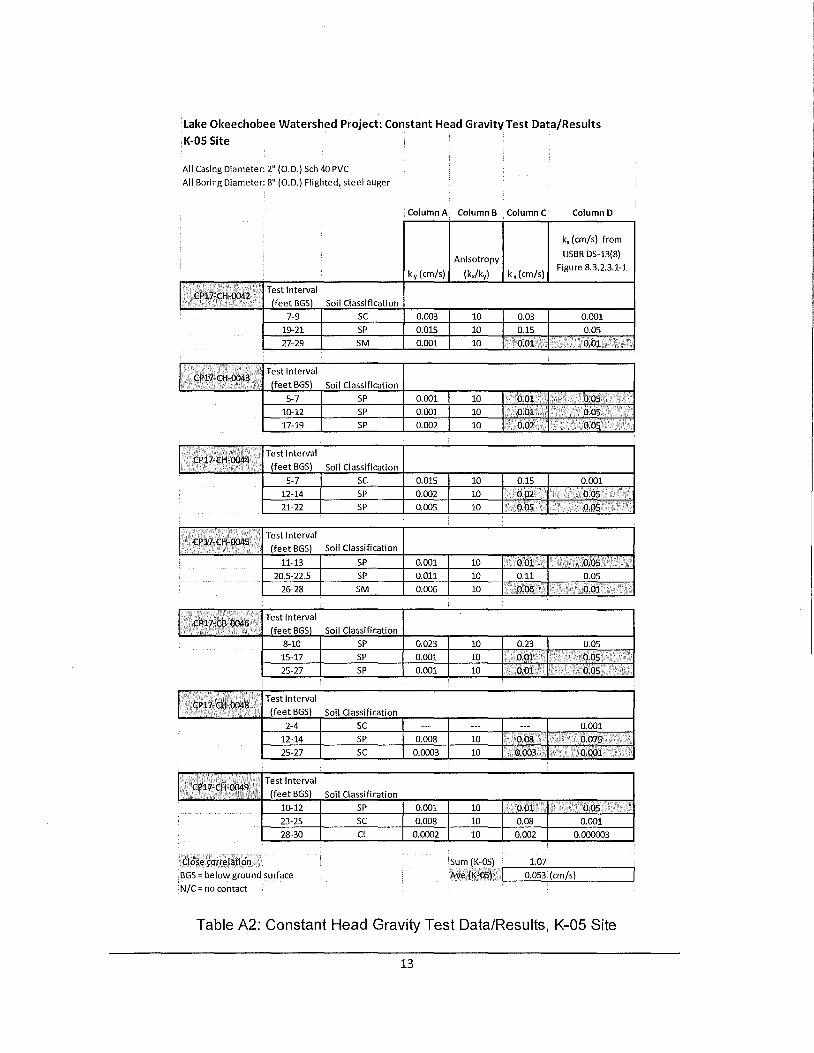
Lake Okeechobee Watershed Project: Constant Head Gravity Test Data/Results K-05 Site
All Casing Diameter: 2" {O.D.) Sch 40 PVC
All Boring Diameter: 8" {O.D.) Flighted, steel auger
Column A• Column B Column C Column D
I
I
k, (cm/s) from
Anisotropy USBR DS-13{8)
kv (cm/s) (kJkv) k,(cm/s) Figure 8.3.2.3.1-1
CP17-CH-0042 Test Interval
(feet BGSl Soil Classification
7-9 SC 0.003 10 0.03 0.001
19-21 SP 0.015 10 0.15 0.05
27-29 SM 0.001 10 0.01 0.01
CP17-CH-0043 Test Interval
{feet BGS) Soil Classification
5-7 SP 0.001 10 0.01 0.05
10-12 SP 0.001 10 0.01 0.05
17-19 SP 0.002 10 0.02 0.05
:
I CP17-CH-0044 Test Interval
(feet BGS) Soil Classification
5-7 SC 0.015 10 0.15 0.001
12-14 SP 0.002 10 0.02 0.05 21-22 SP 0.005 10 0.05 0.05
.
I CP17-CH-0045 Test Interval
(feet BGS) Soil Classification
11-13 SP 0.001 10 0.01 0.05
20.5-22.5 SP 0.011 10 0.11 0.05
26-28 SM 0.006 10 0.06 0.01 .
I CP17-CB-0046 Test Interval
(feet BGSl Soil Classification
8-10 SP 0.023 10 0.23 0.05
15-17 SP 0.001 10 0.01 0.05
25-27 SP 0.001 10 0.01 0.05
I CP17-CH-0048 Test Interval
{feet BGS) Soil Classification
2-4 SC --- ... -·· 0.001
12-14 SP 0.008 10 0.08 O.D75 25-27 SC 0.0003 10 0.003 0.001
.
Test Interval CP17·CH-0049
{feet BGS) Soil Classification
10-12 SP 0.001 10 0.01 0.05 23-25 SC 0.008 10 0.08 0.001
28-30 CL 0.0002 10 0.002 0.000003
Close correlation jSum (K-05) ....: __1._07______~
BGS =below ground surface Ave (K-05) j"-__0._05_3_,_(c_m__,_/_,s)_____,
N/C =no contact
Table A2: Constant Head Gravity Test Data/Results, K-05 Site
13
I