Energy Potential Mapping - A systematic approach to sustainable regional planning based on climate...
11
CIB2007-047 Energy Potential Mapping – A systematic approach to sustainable regional planning based on climate change, local potentials and exergy Andy van den Dobbelsteen, Sabine Jansen, Arjan van Timmeren & Rob Roggema ABSTRACT Global climate change most probably is going to cause a sea level rise of half a meter within the current century. Together with natural off-balance effects, many regions on the earth will be under threat of flooding. Meanwhile, the reserves of fossil fuels are depleting, necessitating energy planning for a sustainable future. A new paradigm for sustainable redevelopment can be found in cooperating with the changes in climate rather than fighting them, and basing spatial planning on local energy potentials and in accordance with the exergy principle rather than extrapolating current developments. This new approach leads to energy potential maps that form the basis for a map with proposed interventions, which consequently can shape the regional plan. This can be illustrated by the final products of two research projects in the Northern Netherlands. The approach however can be applied to any other region in the world. Energy potential mapping is especially valuable to developing countries, of which the future energy system can be based on local potentials rather than made dependent on expensive supply from abroad. Keywords: climate change, energy potentials, exergy, heat cascade, sustainable planning.
-
Upload
independent -
Category
Documents
-
view
6 -
download
0
Transcript of Energy Potential Mapping - A systematic approach to sustainable regional planning based on climate...

CIB2007-047
Energy Potential Mapping – A systematic approach to sustainable
regional planning based on climate change, local potentials and exergy
Andy van den Dobbelsteen, Sabine Jansen,
Arjan van Timmeren & Rob Roggema
ABSTRACT
Global climate change most probably is going to cause a sea level rise of half a meter within the current century. Together with natural off-balance effects, many regions on the earth will be under threat of flooding. Meanwhile, the reserves of fossil fuels are depleting, necessitating energy planning for a sustainable future.
A new paradigm for sustainable redevelopment can be found in cooperating with the changes in climate rather than fighting them, and basing spatial planning on local energy potentials and in accordance with the exergy principle rather than extrapolating current developments.
This new approach leads to energy potential maps that form the basis for a map with proposed interventions, which consequently can shape the regional plan. This can be illustrated by the final products of two research projects in the Northern Netherlands. The approach however can be applied to any other region in the world.
Energy potential mapping is especially valuable to developing countries, of which the future energy system can be based on local potentials rather than made dependent on expensive supply from abroad.
Keywords: climate change, energy potentials, exergy, heat cascade, sustainable planning.

2 Energy Potential Mapping
1 INTRODUCTION
1.1 Climate Change
The principle of human influence on the climate is simple: prehistoric lush jungles that evolved into these fossil fuels over millions of years are being converted to carbon dioxide within two centuries. Only now nature cannot compensate for it, because we as human beings obstruct the regeneration of plants to once again absorb CO2. The Earth would need new jungles for that. Climate change is a hot issue, literally, also thanks to Al Gore (2006) who managed to get it on the political agenda again. The most probable scenario for the global climate is based on the latest findings and expectations by the International Panel on Climate Change (IPCC, 2007). In this scenario, within this century, the earth heats up a few degrees. Eternal snow, glaciers and icecaps will melt. Just as by the expansion of the warmer sea water, the sea levels will rise due to this increased run-off of water from the land. There will be more clouding, precipitation and heavier storms. The difference between wet and arid areas will be greater. These developments are already taking place, and it is an illusion we can stop them within 50 years, so a quick response is necessary to cope with the probable effects of climate change. This in particular applies to developing countries, which seem to part of regions that will encounter the severest climate change.
1.2 Energy depletion
While dramatic changes are taking place to our climate, one of its causes, consumption of fossil fuel, will become an uncertain asset to the near future. Natural oil and gas reserves are depleting, or at least their extraction is becoming too complex and expensive. This will make the availability of energy uncertain and very expensive, which will probably strike the hardest in developing countries. The tendency to widely use coal again for the generation of electricity – not just in China, also in the Western world – will have an impact even more devastating to greenhouse emissions, as well as to pollutions that seemed to have been almost banished. Many countries now seek refuge to nuclear power but uranium is also depleting and as long as safety issues and the processing of nuclear waste have not been tackled properly, doubts may be expressed. Meanwhile, sustainable energy is abundant: based on the potential for energy from the sun, wind and water, Jong et al. (2006) calculated that the tiny Netherlands alone could already sufficiently provide the global economy with energy. However, at this instant local potentials are not effectively seized.

Energy Potential Mapping 3
1.3 Catalyst
Paradoxically, the threats of climate change and energy depletion can be used as a catalyst for sustainable redevelopment. A new paradigm can be found in cooperating with the inevitable changes in climate rather than fighting them. Spatial planning can be based on local energy potentials and in accordance with an optimal usage of the energy cycle by means of the exergy principle rather than extrapolating current developments. The local potentials for energy generation can be based on analyses of the climatic conditions, landscape and land use typology, local natural, cultural and technical features, and existing 'hotspots' of energy and heat production. This new approach to sustainable regional planning leads to energy potential maps, which can be combined to a map of interventions that should be done from an energetic point of view. This approach can be illustrated by the final product of two research projects of the sustainable developments in the Northern Netherlands. The approach however can be applied to any other region in the world.
2 FUTURE PERSPECTIVE OF THE NORTHERN NETHERLANDS
2.1 The region in a nutshell
The Northern Netherlands (Figure 1, left) consist of the three provinces of Frisia, Groningen and Drenthe. Frisia is well-known for its lakes and ice-skating tradition, Groningen for its vast landscapes and picturesque villages, and Drenthe for its small-scale communities in forested or heath areas. Ecological value can be attributed to the Wadden Sea, north of the mainland, of which the sandbanks run dry with the tides, forming a habitat to specific eco-systems and making a cross-over hike to the Wadden islands occasionally possible.
Figure 1 The Northern Netherlands at present (left) and around 2001, sea level risen by 1 meter, after a dike breakthrough (right)

4 Energy Potential Mapping
A considerable part of Groningen and Frisia lies below sea level; the presence of knolls is a reminder of times when the land was frequently flooded. If the sea level rises and a dike breaks through, the landscape will alter completely (Figure 1, right). In terms of energy, the Northern Netherlands have always played an important role: during the 19th century large areas of peat were colonised and excavated, and after WWII the discovery of oil and natural gas made it one of the most significant contributors to the national treasury. Although huge in size, the gas reserves are expected to deplete within 25 years, forcing gas-related companies to concentrate on import and storage of gas from elsewhere. Nevertheless, this will only postpone depletion. In spite of its natural riches, economically, the North is a relatively weak Dutch region, subject to emigration of young people to the Randstad, the economic centre of the Netherlands corner-stoned by Amsterdam, Utrecht, Rotterdam and The Hague. This together with the increasing water threat due to climate change and the energy depletion problem make the Northern Netherlands an interesting case for drastic measures needed for a sustainable future.
2.2 Responding to climate change and energy depletion
To counter the increased threat one may apply business as usual: raising the sea dikes. However, salty seepage will not be reduced by this and the draining of polders will only aggravate this seepage, apart from the increased demand for energy for drainage pumps. Another and probably more effective strategy will be a layered defence that partly interacts with natural developments: additional defensive banks at sea and areas behind the present dikes that may be temporarily flooded in case of emergency. Furthermore, the Northern Netherlands can profit from climate change by touristic-recreative developments. Due to the temperature rise, comparison with the present climate in France is realistic. As a result of this, in the future less energy will be required for heating and hot water (heat), and more for cooling (electricity). Likewise, a different strategy for the provision of energy would be wise, i.e. a system that is less dependent on the availability of fossil fuels and more reliant upon local energy potentials, many of which are already present but not seized, others to be developed in the near future.
2.3 Three regional initiatives
Being aware of the threats described, local administrations, research institutes and energy companies established a foundation called Energy Valley, aiming at strategic solutions for energy in the future. Partly funded by Energy Valley, the Grounds for Change project (discussed in Dobbelsteen et al., 2006) was initiated to explore the possibilities of establishing a desirable yet imaginable future image of the Northern Netherlands. It led to a new approach to regional planning and specific

Energy Potential Mapping 5
measures related to, for instance, water management, energy provision and habitats for living, working and leisure. Grounds for Change got a follow-up by the provincial administration of Groningen, who in their preparation of the provincial development plan made climate change and energy as two of the steering principles. As a result of this, the method of energy potential mapping was enhanced.
3 HEAT CASCADING
3.1 Exergy
The Second Law of Thermodynamics states that processes constantly develop towards a state of increasing entropy. Hence, as entropy embodies the non-useful waste energy evolving during processes, exergy is the useful part, the part that set things to work, a measure of energy quality. Energy-converting processes can be efficient, but in terms of exergy this efficiency can be totally different when the initial exergy level could serve more functions. For instance, a boiler may have an energetic efficiency of 95%, but considering the gas flame of 1500oC, more can be done with it than just heating up houses to 20oC. The exergetic efficiency is approximately 15%. If the gas flame heat were used in the metal industry, the exergetic efficiency would approximate 100%. Therefore, energy of a high-quality level should be used for high-grade functions before it transforms into a lower-quality state, which can still be useful to low-grade functions.
Figure 2 Graphical example of a heat cascade

6 Energy Potential Mapping
3.2 Low-exergy approach
The low-exergy (low-ex) approach strives for limiting exergy losses between process steps by inserting as many function steps in an energy chain as possible, as in a cascade. High temperatures would be used only in heavy industrial processes, of which waste heat could be used in lower-grade functions as manufacturing processes, horticulture, and consequently for residential heating (Figure 2). Thus, four instead of just one function would be served by the same amount of primary energy. The low-ex principle implies efficient use of heat flows by heat cascades. Low-caloric heat cannot be transported over long distances: heat losses would be too big. Therefore, spatial functions should be concentrated and mixed: horticulture near industry, residences near horticulture. The heat cascade starts with a power plant and heavy industry and ends with residences and agriculture, which can eventually 'feed' the power plant again with biomass and waste.
4 ENERGY POTENTIAL MAPPING
4.1 Local strengths and weaknesses
Energy is usually neglected as a tool for regional and urban planning, especially with regard to local potentials for self-provision. Energy potential maps clarify the local strengths and weaknesses with regard to potentials for specific energy generation or conversion. Possibilities of heat cascading are also included. Thus, energy potential maps indicate in which places which energy resources are available. They also point out the locations that are most logical for certain developments if these should be directed by energy supply and if transport of energy over long distances should be avoided.
4.2 Methodology
So far, few has been written about the synergy of spatial planning and energy considerations. Some experience has been gained from surveys of, for instance, the potential of the underground for vertical heat exchangers [Novem, 2001] but these stand apart from planning strategies. The SREX project [Roo et al., 2005] is one of the first to couple regional planning to exergy, but it has commenced only recently. The method of energy potential mapping had to developed throughout the two projects mentioned earlier. In order to draw energy potential maps, first an extensive analysis of the local characteristics is necessary. Therefore, basic information is collected of matters such as climate, historical developments, topography, soil and underground, landscape, ground use and infrastructure. The local

Energy Potential Mapping 7
climate is essential for the determination of potentials of solar and wind energy, and ground use gives a clue to the possibilities of biomass, for instance. This basic information then is translated to energy potential maps for fuel, electricity, heat and cold, and CO2 capture. These maps evolve through a process of deduction, association and creativity. In order to get the full picture of heat cascading potentials, a survey needs to be executed of all regional functions, their exact location, temperature levels required for their processes, the demand of energy and the supply of waste energy and other products. In order to make the inventory feasible, for some of these functions – such as housing and offices – one may use generic values of energy demand and supply. Specific industrial functions however require individual study of internal processes and energy characteristics. Not every company is willing to give this information, but regional administrations often need the same data for environmental licences, and one can use these in the energy survey. After the collection of data, the exact location of heat and cold supply and demand can be mapped. This will visualise areas with excess and lack of energy, and evoke measures to be taken for closing the heat chains.
4.3 New energy potential maps for Groningen
For the elaborate study of energy potentials of the province of Groningen (Dobbelsteen et al., 2007), energy potential maps for the new provincial development plan were drawn in GIS.
G
G
G
G
G
G
G
G
GG
G
GG
G
G
G
GG
G
G
G
G
G
G
G
G
G
G
G
G
G
G
G
G
G
G
G
G
G
G
G
G
G
G
GG
GGG
G
G
GG
G
G
GG
G
G
Energiecentrales
afval
gas
kolen
micro-biomassaG
G
G
multifuel
zoekgebied biomassacentrale
ADECS BV. DELFT. TEL. 015- 2154242 v1.03COPYRIGHT & ONTWIKKELING SOFTWARE ArcScope
DATUM : 01-03-2007SCHAAL : 1: 330000TEKENING : Elektriciteitscentrales
GEBRUIKER: jl (Popelektriciteitcentrale.mxd)
Figure 3 Overlay map of the energy potentials for the generation of electricity
8 Energy Potential Mapping
Figure 3 shows the map of all potentials for electricity generation. It gives the best location for wind parks, a tidal plant and a few osmosis plants ('blue energy') along the coast, for a biomass-based industrial cluster in the centre, and for a new type of plant: an inundation plant for occasional flooding of the deepest polders in case of emergency. Furthermore, there are small decentralised bio-yeasting installations with combined heat and power generation, spread through the country-side, which contains many isolated farms and villages. Energy values of solar radiation showed little variance over the province, so use of photovoltaic panels is possible anywhere. For large-scale solar plants, the energy properties of a northern place as Groningen are unfavourable. Local self-supply, however, can be helped by solar panels, as well as small wind turbines.
##
#
#
####
#
#
## #
#
#
##
##
#
#
###
#
###
#
#
#############
#####
###
#########
######
#
###
#########
#########
###
###
#
########
##########
#######
#
#
#####
#
##
######
####
##
#######
#####
####
##
##### #######
###
Koudevraag
(Warmteaanbod
!
Warmtevraag
(Koudeaanbod
!
ADECS BV. DELFT. TEL. 015- 2154242 v1.03COPYRIGHT & ONTWIKKELING SOFTWARE ArcScope
DATUM : 01-03-2007SCHAAL : 1: 330000TEKENING : Vraag, aanbod, opslagpotentie
warmte en koude
GEBRUIKER: stedbouw (Samengestelde vraag aanbodopslag warmte en koude.mxd)
Ondiepe aquifers
+! !
! !
! !
0 +! !
! !
- 0! !
! !
Potentie voorgeothermie
14
13
12
11
10
9
Boorpunten
#
#
#
Aardwarmte-potentie
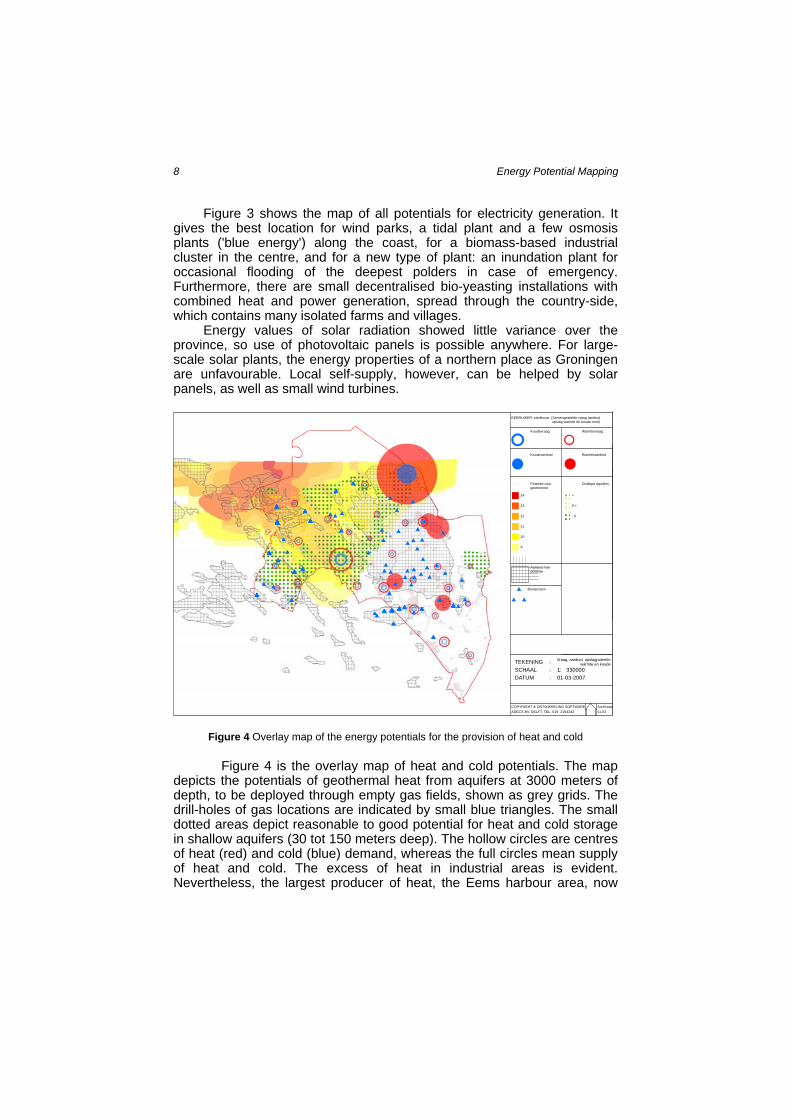
Figure 4 Overlay map of the energy potentials for the provision of heat and cold
Figure 4 is the overlay map of heat and cold potentials. The map depicts the potentials of geothermal heat from aquifers at 3000 meters of depth, to be deployed through empty gas fields, shown as grey grids. The drill-holes of gas locations are indicated by small blue triangles. The small dotted areas depict reasonable to good potential for heat and cold storage in shallow aquifers (30 tot 150 meters deep). The hollow circles are centres of heat (red) and cold (blue) demand, whereas the full circles mean supply of heat and cold. The excess of heat in industrial areas is evident. Nevertheless, the largest producer of heat, the Eems harbour area, now
Energy Potential Mapping 9
has no heat-demanding function close to it. This can be altered through spatial planning based on this potential map. Solar heat, again, is available anywhere and should be seized when possible. This also applies to local exchange of heat and cold with exhaust air, the soil and open water.
QQQQQQQQQQQQQQQQQQQQQQQQQQQQQQQQ
QQQQQQQQQQQQQQQQQQQQQQQQQQQQQQ
##
#
#
####
#
#
## #
#
#
##
##
#
#
###
#
###
#
#
#############
#####
###
#########
######
#
###
#########
#########
###
###
#
########
##########
#######
#
#
#####
#
##
######
####
##
#######
#####
####
##
##### #######
###
Boorpunten
#
#
#
CO2-afvangkassengebieden
QQQQQQQQQQQQQQQQQQQQQQQQQ
CO2-afvang EHS
CO2-opslaggasvelden
ADECS BV. DELFT. TEL. 015- 2154242 v1.03COPYRIGHT & ONTWIKKELING SOFTWARE ArcScope
DATUM : 01-03-2007SCHAAL : 1: 330000TEKENING : CO2 opslag potentie
GEBRUIKER: stedbouw (POP CO2 afvang potentie.mxd)
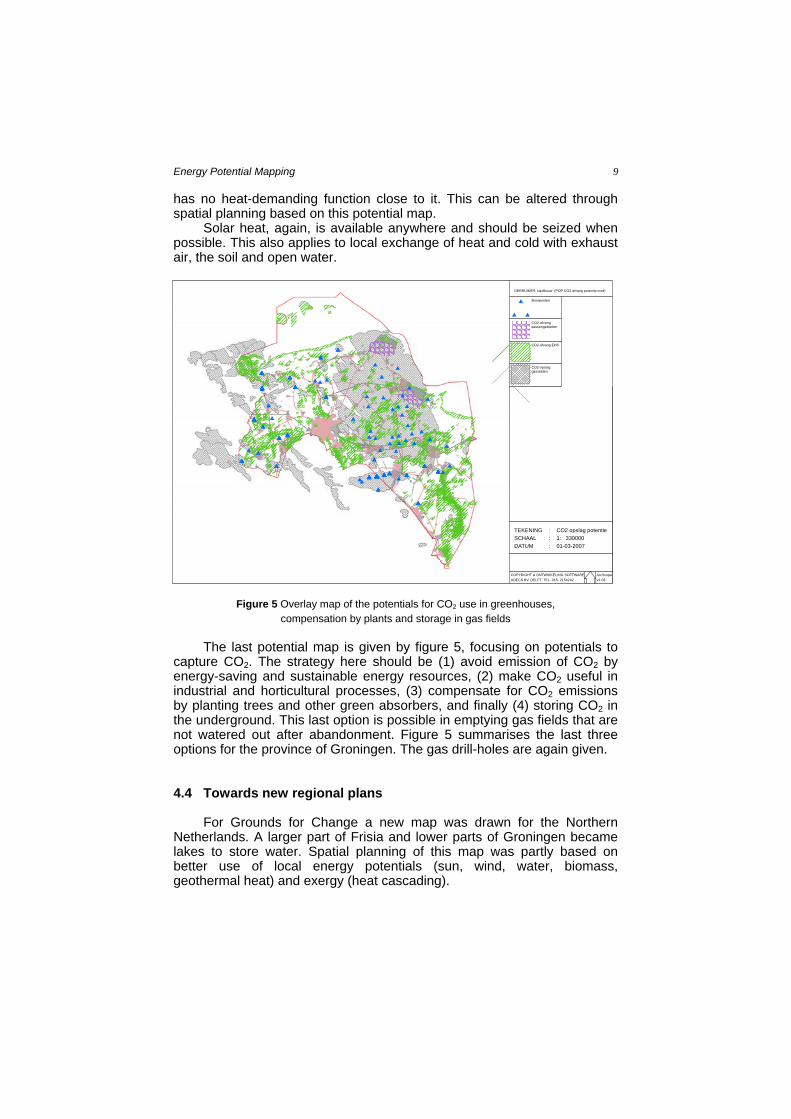
Figure 5 Overlay map of the potentials for CO2 use in greenhouses,
compensation by plants and storage in gas fields
The last potential map is given by figure 5, focusing on potentials to capture CO2. The strategy here should be (1) avoid emission of CO2 by energy-saving and sustainable energy resources, (2) make CO2 useful in industrial and horticultural processes, (3) compensate for CO2 emissions by planting trees and other green absorbers, and finally (4) storing CO2 in the underground. This last option is possible in emptying gas fields that are not watered out after abandonment. Figure 5 summarises the last three options for the province of Groningen. The gas drill-holes are again given.
4.4 Towards new regional plans
For Grounds for Change a new map was drawn for the Northern Netherlands. A larger part of Frisia and lower parts of Groningen became lakes to store water. Spatial planning of this map was partly based on better use of local energy potentials (sun, wind, water, biomass, geothermal heat) and exergy (heat cascading).

10 Energy Potential Mapping
For the provincial development plan of Groningen the map with proposed spatial interventions evolved directly from the energy potentials study and was based solely on energy considerations. A few examples of interventions from this map are: again opening the Lauwers sea inlet for tidal energy and an osmosis plant behind this barrier, the establishment of a biomass-based industrial cluster, and the location of new greenhouse and residential developments near industrial hotspots of heat production. These proposals are currently evaluated.
5 CONCLUSION
Energy potential mapping enables sustainable spatial planning based on effective use of local energy potentials. It visualises sustainable ambitions for the future and the consequence of it to planning. It has proved to be an ideal catalyst for discussions, as opposed to written policy plans. The new approach can be used anywhere in the world, most probably leading to different solutions. A sustainable future has different faces, depending on local potentials and local demands. Energy potential mapping is especially valuable to developing countries, of which the future energy system can be based on local potentials rather than made dependent on expensive supplies from abroad. Surveying local characteristics of climate and the current ground use and relating these to energy technologies will make developing regions more self-conscious of their own strengths. Planning based on them will utilise all available potentials and reinforce these regions. Not least, a pragmatic look at the characteristics and qualities of a region will inspire to innovate, which may be needed in a world facing climate change and energy depletion.
6 REFERENCES
Dobbelsteen A. van den, Jansen S. & Timmeren A. van, 2007, Omgevingsplan Groningen Energiegestuurd – ruimtelijke sturing door energiepotenties en warmtecascades (Shanghai: CIB/SRIBS), 435-442
Dobbelsteen A. van den, Roggema R. & Stegenga K., 2006, Grounds for Change - The Sustainable Redevelopment of a Region under Threat of Climate Change and Energy Depletion. In Proceedings SASBE 2006 – 2nd CIB International Conference on Smart and Sustainable Built Environments (Shanghai: CIB/SRIBS), 435-442
IPCC (Intergovernmental Panel on Climate Change), 2007, Climate Change 2007: Fourth Assessment Report (IPCC, Switzerland)
Jong T.M. de (ed.), Moens M.J., Akker C. van den & Steenbergen C.M. (2004), Sun Wind Water Earth Life Living – Legends for design (Delft University of Technology)
Novem (2001), Bodemgeschiktheid voor toepassing verticale bodem-warmtewisselaars (Utrecht: Senternovem)
Roo G. de, Jong M. de, Roggema R., Dobbelsteen A. van den, Linden K. van der, Rovers, R., Timmermans W., Koh J., Simmelink E. (2005),

Energy Potential Mapping 11
SREX - Synergy of Regional Planning and Exergy (University of Groningen)