Employer Survey VEAC Report - Regent University
43
Employer Survey VEAC Report 2019-2020 Fall 2020
-
Upload
khangminh22 -
Category
Documents
-
view
1 -
download
0
Transcript of Employer Survey VEAC Report - Regent University
Employer Survey VEAC Report 2019-2020
Fall 2020
1
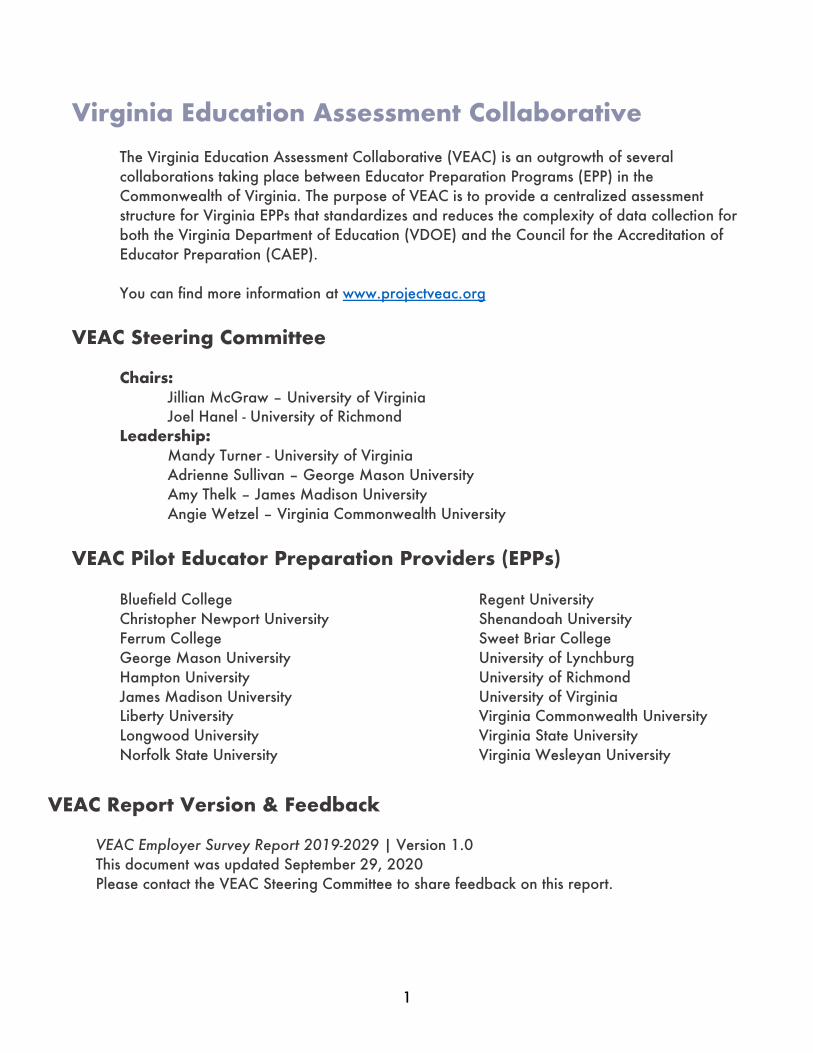
Virginia Education Assessment Collaborative
The Virginia Education Assessment Collaborative (VEAC) is an outgrowth of several collaborations taking place between Educator Preparation Programs (EPP) in the Commonwealth of Virginia. The purpose of VEAC is to provide a centralized assessment structure for Virginia EPPs that standardizes and reduces the complexity of data collection for both the Virginia Department of Education (VDOE) and the Council for the Accreditation of Educator Preparation (CAEP). You can find more information at www.projectveac.org
VEAC Steering Committee
Chairs: Jillian McGraw – University of Virginia Joel Hanel - University of Richmond
Leadership: Mandy Turner - University of Virginia Adrienne Sullivan – George Mason University Amy Thelk – James Madison University Angie Wetzel – Virginia Commonwealth University
VEAC Pilot Educator Preparation Providers (EPPs)
Bluefield College Christopher Newport University Ferrum College George Mason University Hampton University James Madison University Liberty University Longwood University Norfolk State University
Regent University Shenandoah University Sweet Briar College University of Lynchburg University of Richmond University of Virginia Virginia Commonwealth University Virginia State University Virginia Wesleyan University
VEAC Report Version & Feedback
VEAC Employer Survey Report 2019-2029 | Version 1.0 This document was updated September 29, 2020 Please contact the VEAC Steering Committee to share feedback on this report.
1
Table of Contents
VIRGINIA EDUCATION ASSESSMENT COLLABORATIVE ..................................................................................................................... 1
TABLE OF CONTENTS ....................................................................................................................................................................... 1
PROJECT SUMMARY ........................................................................................................................................................................ 2
PROJECT TIMELINE .......................................................................................................................................................................... 3
DATA COLLECTION & RESPONSE RATES ........................................................................................................................................... 5
SURVEY RESPONSE BACKGROUND ................................................................................................................................................... 6
EMPLOYER OVERALL READINESS OF COMPLETERS ......................................................................................................................... 10
EMPLOYER SATISFACTION ON VUPS/INTASC ................................................................................................................................. 16
APPENDIX A: OVERALL SATISFACTION DESCRIPTIVE STATISTICS .................................................................................................... 29
APPENDIX B: VUPS/INTASC SATISFACTION DESCRIPTIVE STATISTICS ............................................................................................. 31
APPENDIX C: RELIABILITY, CORRELATIONS, FACTOR ANALYSIS ....................................................................................................... 38
APPENDIX E: 2019-2020 VEAC PILOT CONTACTS ............................................................................................................................ 40
2
Project Summary The Virginia Education Assessment Collaborative (VEAC) is a partnership among Educator Preparation Programs (EPPs) in the Commonwealth of Virginia. The purpose of VEAC is provide a centralized assessment structure for Virginia EPPs in order to standardize and reduce the complexity of data collection required for accreditation and program improvement. The use of common instruments and data collection processes will improve EPPs’ ability to understand their relative strengths and opportunities for improvement. Shared instruments also provide a common language and can prompt discussion around areas for collective improvement across the commonwealth. The first phase of the VEAC initiative centered on the collection of survey data. Every year, all 39 EPPs in Virginia send their own program surveys to program completers and their employers. These surveys provide feedback to support program improvement and to meet the requirements of the Virginia Department of Education and the Council for the Accreditation of Educator Preparation. In years past, because these surveys have been specific to each institution, principals were required to respond to multiple surveys with different content and structures throughout the year. In an effort to streamline and improve the survey process,18 institutions have come together to administer common surveys to program completers and employers. This group includes public and private institutions representing a range of sizes, program structures, and contexts. In addition to reducing the complexity of survey completion for administrators, the use of common instruments has allowed these 18 institutions to benchmark their data against the larger consortium of participating EPPs. The surveys are also aligned to the Commonwealth of Virginia’s Uniform Performance Standards, which school administrators currently use to evaluate in-service teachers’ performance. Central to understanding the quality of an educator preparation program is an examination of completers’ performance as they apply their acquired knowledge and skills. Phase 2 will supplement survey data with teacher evaluation data collected through partnerships with Virginia School Divisions. This report includes information on the VEAC employer survey. In addition to this consortium-level report, each partner institutions will receive an individualized report that allows member EPPs to benchmark and compare their EPPs data to consortium-level data.
3
Project Timeline Pre-Phase I: Fall 2018 – Summer 2019 Early Collaboration
• Faculty and staff at the University of Richmond and Virginia Commonwealth University collaborated during the 2018-19 academic year to develop a common employer survey. Both institutions’ advisory boards reviewed the survey, which was designed to measure competencies outlined in the Virginia Uniform Performance Standards as the InTASC standards.
Spring 2019: • The University of Richmond and Virginia Commonwealth University administered the employer
survey to the employers of program completers working in the Richmond Region. • The University of Virginia administered the employer survey to the employers of all program
graduates. • The University of Richmond developed and administered a completer survey aligned with the
employer survey. Consortium Development
• In spring 2019, VEAC leadership came together to discuss the scope of assessment collaboration in the Commonwealth of Virginia. At the Association for Teacher Educators in Virginia Conference in Richmond, Virginia, VEAC leaders held conversations with representatives from EPPs across Virginia to explore opportunities to increase collaboration through the use of common assessments.
• VEAC leadership surveyed the 36 Virginia EPPs to assess their interest in participating in a collaborative project that would initially focus on CAEP Standard 4: Program Impact. Based on EPP responses, VEAC leadership determined the completer and employer surveys would be the focus of Phase I of the project.
Phase I: Fall 2019 – Summer 2020 Survey Preparation
• At the Fall 2019 Virginia Association of Colleges for Teacher Education conference at Roanoke College, VEAC leadership recruited EPPs to participate in the pilot for completer and employer surveys for initial licensure. Eighteen institutions signed on to the pilot.
• VEAC leadership provided EPPs a template to submit completer and employer data to VEAC. EPPs submitted information for up to three years of program completers.
• EPPs reviewed drafts of each survey and provided feedback to VEAC leadership. Based on this feedback, VEAC leadership revised both surveys for the spring 2020 administration.
Completer Survey Administration • VEAC administered the completer survey on February 27, 2020. They closed the survey on March
13, 2020. Employer Survey Administration
• In March 2020, institutions of higher education, school divisions, and independent schools across the nation moved to online instruction in response to the COVID-19.
• In April 2020, VEAC leadership reached out to 14 school division central offices to determine the best new timeline that considered principal’s workload through the COVID-19 pandemic. In consultation with school partners, a division was made to delay the administration of the employer survey until summer 2020.
• VEAC administered the employer survey on July 30, 2020. It was closed in September 31 2020. Teacher Evaluation Data: Initial Conversations
4
• EPP representatives met with school division leadership to discuss opportunities and challenges related to sharing teacher evaluation data with EPPs. These data would be used to support two additional components of CAEP standard 4: (4.1) Impact on P-12 Student Learning and Development and (4.2) Indicators of Teaching Effectiveness.
Phase II: Fall 2020 – Summer 2021 Consortium Engagement and Expansion
• VEAC leadership with share reports from 2020-2021 with stakeholders from all Virginia EPPs, the Virginia Department of Education, and P-12 school partners.
• VEAC leadership will solicit feedback from university and school partners on the design and distribution of the completer and employer surveys.
• All EPPs will be invited to participate in the 2020-2021 survey administration. • Survey Revision and Administration • VEAC leadership will use feedback from stakeholders to revise the completer and employer surveys. • VEAC will distribute revised completer and employer surveys in February and March 2021,
respectively. • VEAC will prepare reports for EPPs and other stakeholders in late spring 2021.
Teacher Evaluation Data: • VEAC is re-evaluating plans based on the new CAEP Streamlined Standard S4.1.
Please visit projectveac.org for updates on VEAC timelines, recruitment, and events.
5
Data Collection & Response Rates VEAC partners submitted contact information for program completer’s employers to VEAC in January 2020. Initial recruitment for the survey was conducted on July 30, 2020 and was open with reminders through late September 2020. Due to COVID-19, VEAC extended the timeline for data collection in the employer survey.
Survey Response Rates
For our 2019-2020 Pilot, VEAC fielded the Employer Survey to 1902 employers from17 of the 18 EPP pilot participants who provided contact fields for program completers’ employers. Upon closing the survey in September 2020, VEAC collected 488 (25.66%) complete and partial responses. Related to the 14 InTASC/VUPS items, VEAC collected between 441(23.19) to 456 (23.97%) responses. On the overall satisfaction item, VEAC collected 457 (24.03%) employer responses. On the optional open-ended item, 201(10.57%) employers provided a response to the open-ended items. Each EPP has been provided with their specific response rates in their individual reports. The EPP specific response rates ranged from 17% to 38%. Throughout fielding the survey, VEAC and each EPP worked to correct bounced/failed emails to improve the reach of the survey. After receiving feedback from EPPS, divisions, and completers, VEAC is developing a streamlined process to increase communication and improve survey recruitment tactics for the VEAC surveys.
6
Survey Response Background
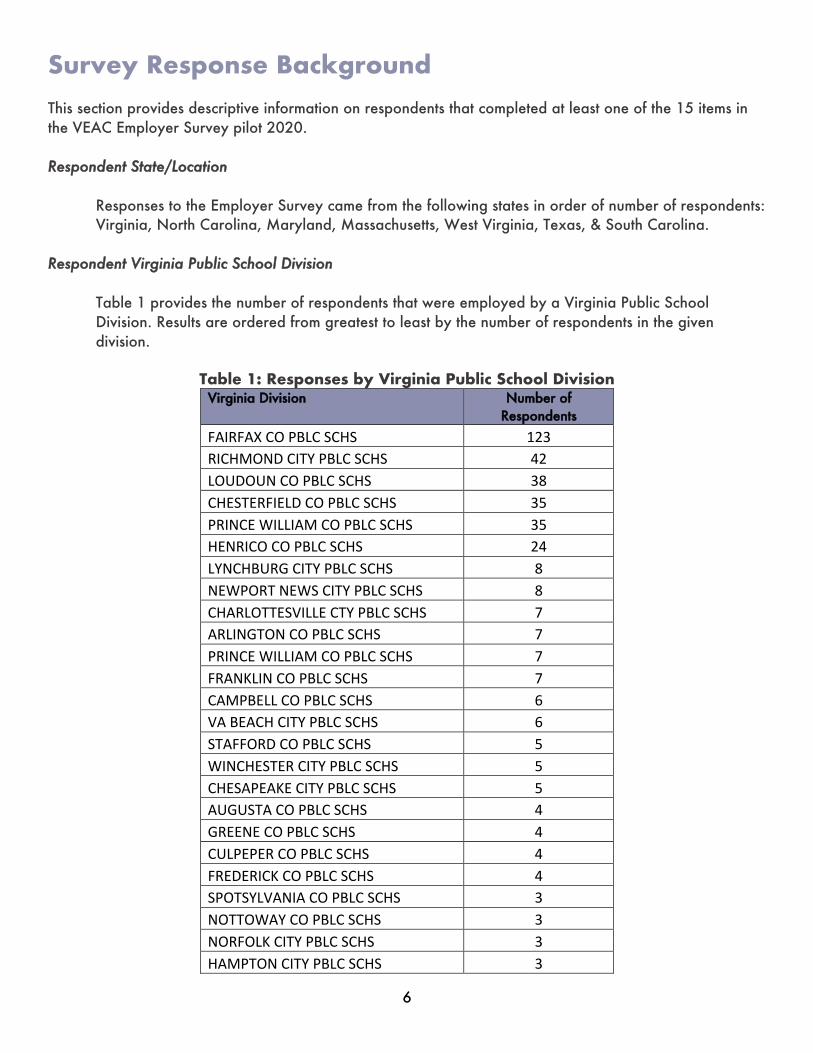
This section provides descriptive information on respondents that completed at least one of the 15 items in the VEAC Employer Survey pilot 2020. Respondent State/Location
Responses to the Employer Survey came from the following states in order of number of respondents: Virginia, North Carolina, Maryland, Massachusetts, West Virginia, Texas, & South Carolina.
Respondent Virginia Public School Division
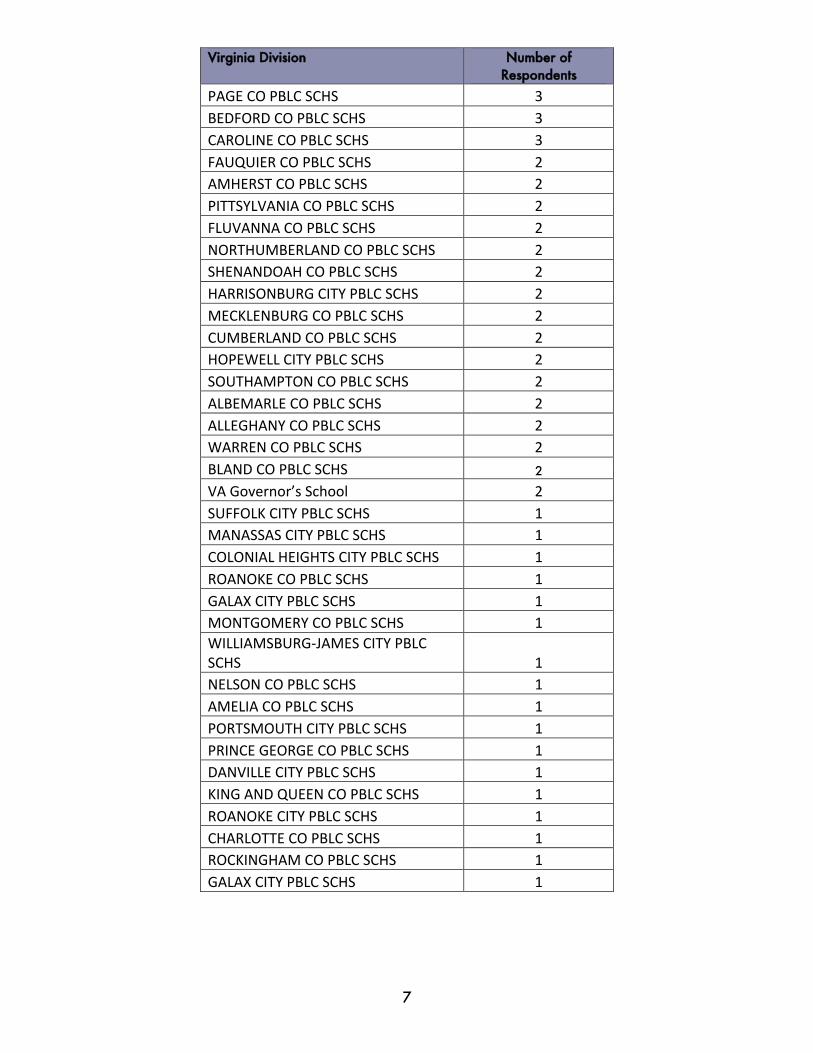
Table 1 provides the number of respondents that were employed by a Virginia Public School Division. Results are ordered from greatest to least by the number of respondents in the given division.
Table 1: Responses by Virginia Public School Division
Virginia Division Number of Respondents
FAIRFAX CO PBLC SCHS 123
RICHMOND CITY PBLC SCHS 42
LOUDOUN CO PBLC SCHS 38
CHESTERFIELD CO PBLC SCHS 35
PRINCE WILLIAM CO PBLC SCHS 35
HENRICO CO PBLC SCHS 24
LYNCHBURG CITY PBLC SCHS 8
NEWPORT NEWS CITY PBLC SCHS 8
CHARLOTTESVILLE CTY PBLC SCHS 7
ARLINGTON CO PBLC SCHS 7
PRINCE WILLIAM CO PBLC SCHS 7
FRANKLIN CO PBLC SCHS 7
CAMPBELL CO PBLC SCHS 6
VA BEACH CITY PBLC SCHS 6
STAFFORD CO PBLC SCHS 5
WINCHESTER CITY PBLC SCHS 5
CHESAPEAKE CITY PBLC SCHS 5
AUGUSTA CO PBLC SCHS 4
GREENE CO PBLC SCHS 4
CULPEPER CO PBLC SCHS 4
FREDERICK CO PBLC SCHS 4
SPOTSYLVANIA CO PBLC SCHS 3
NOTTOWAY CO PBLC SCHS 3
NORFOLK CITY PBLC SCHS 3
HAMPTON CITY PBLC SCHS 3
7
Virginia Division Number of Respondents
PAGE CO PBLC SCHS 3
BEDFORD CO PBLC SCHS 3
CAROLINE CO PBLC SCHS 3
FAUQUIER CO PBLC SCHS 2
AMHERST CO PBLC SCHS 2
PITTSYLVANIA CO PBLC SCHS 2
FLUVANNA CO PBLC SCHS 2
NORTHUMBERLAND CO PBLC SCHS 2
SHENANDOAH CO PBLC SCHS 2
HARRISONBURG CITY PBLC SCHS 2
MECKLENBURG CO PBLC SCHS 2
CUMBERLAND CO PBLC SCHS 2
HOPEWELL CITY PBLC SCHS 2
SOUTHAMPTON CO PBLC SCHS 2
ALBEMARLE CO PBLC SCHS 2
ALLEGHANY CO PBLC SCHS 2
WARREN CO PBLC SCHS 2
BLAND CO PBLC SCHS 2
VA Governor’s School 2
SUFFOLK CITY PBLC SCHS 1
MANASSAS CITY PBLC SCHS 1
COLONIAL HEIGHTS CITY PBLC SCHS 1
ROANOKE CO PBLC SCHS 1
GALAX CITY PBLC SCHS 1
MONTGOMERY CO PBLC SCHS 1
WILLIAMSBURG-JAMES CITY PBLC
SCHS 1
NELSON CO PBLC SCHS 1
AMELIA CO PBLC SCHS 1
PORTSMOUTH CITY PBLC SCHS 1
PRINCE GEORGE CO PBLC SCHS 1
DANVILLE CITY PBLC SCHS 1
KING AND QUEEN CO PBLC SCHS 1
ROANOKE CITY PBLC SCHS 1
CHARLOTTE CO PBLC SCHS 1
ROCKINGHAM CO PBLC SCHS 1
GALAX CITY PBLC SCHS 1
8
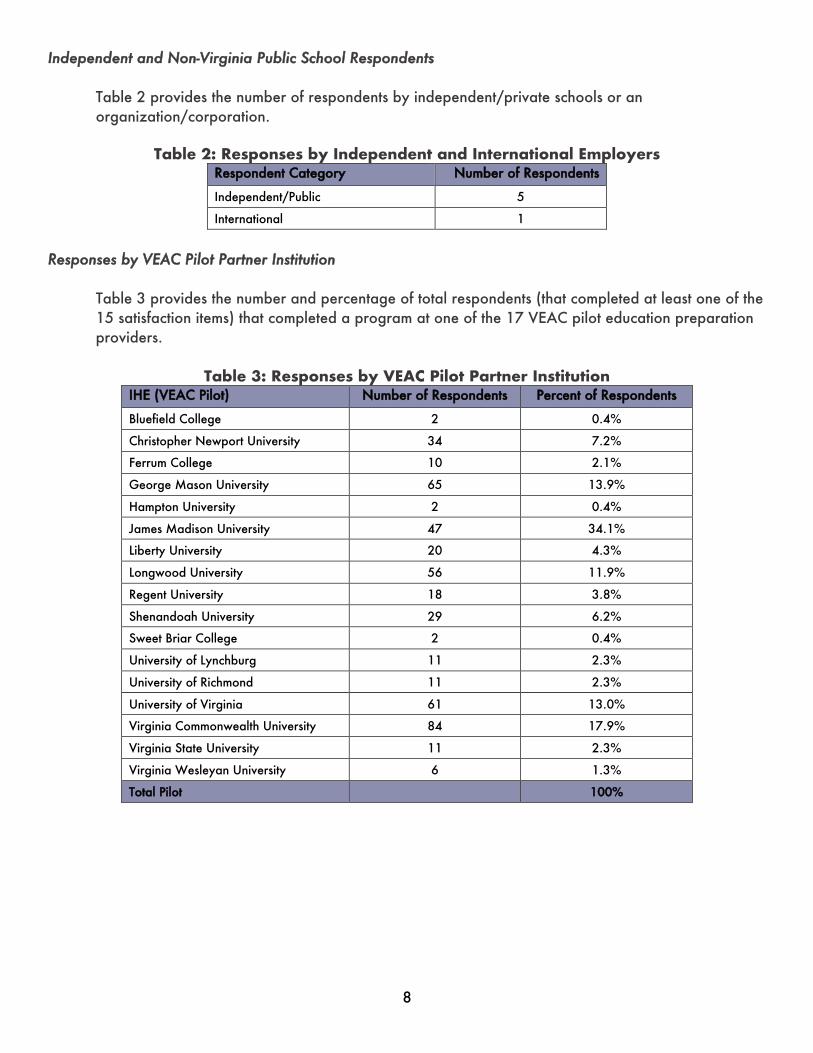
Independent and Non-Virginia Public School Respondents
Table 2 provides the number of respondents by independent/private schools or an organization/corporation.
Table 2: Responses by Independent and International Employers Respondent Category Number of Respondents
Independent/Public 5
International 1
Responses by VEAC Pilot Partner Institution
Table 3 provides the number and percentage of total respondents (that completed at least one of the 15 satisfaction items) that completed a program at one of the 17 VEAC pilot education preparation providers.
Table 3: Responses by VEAC Pilot Partner Institution IHE (VEAC Pilot) Number of Respondents Percent of Respondents
Bluefield College 2 0.4%
Christopher Newport University 34 7.2%
Ferrum College 10 2.1%
George Mason University 65 13.9%
Hampton University 2 0.4%
James Madison University 47 34.1%
Liberty University 20 4.3%
Longwood University 56 11.9%
Regent University 18 3.8%
Shenandoah University 29 6.2%
Sweet Briar College 2 0.4%
University of Lynchburg 11 2.3%
University of Richmond 11 2.3%
University of Virginia 61 13.0%
Virginia Commonwealth University 84 17.9%
Virginia State University 11 2.3%
Virginia Wesleyan University 6 1.3%
Total Pilot 100%
9
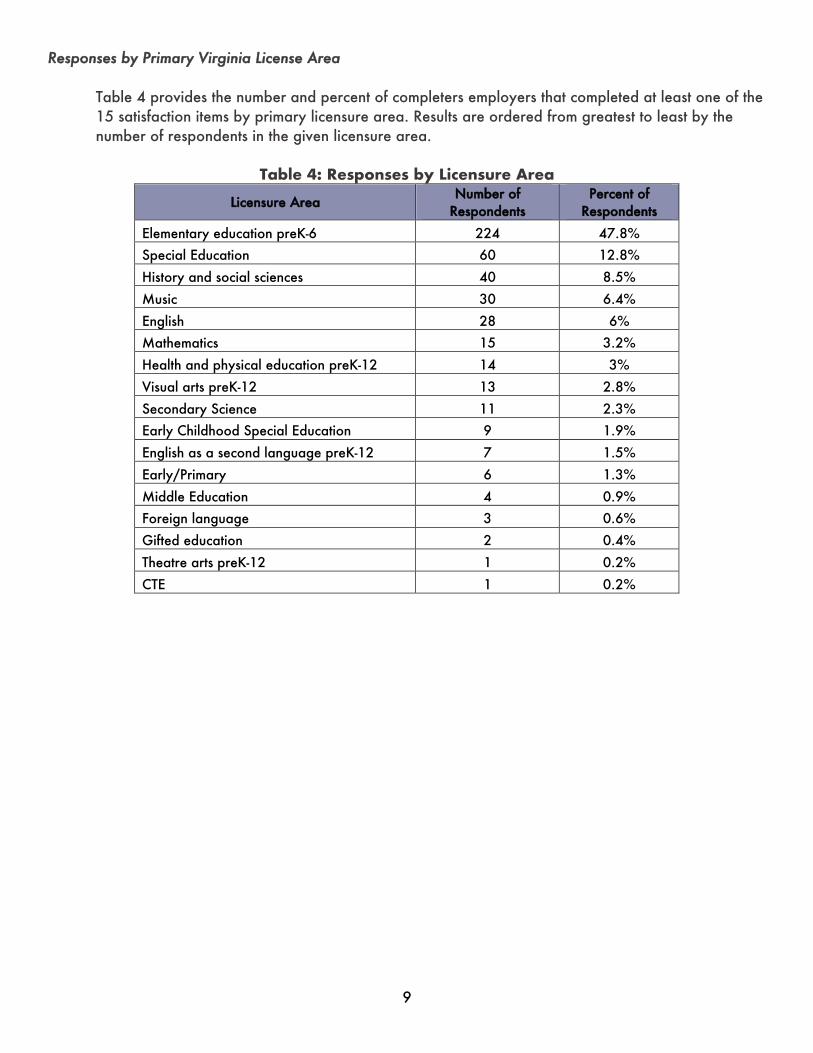
Responses by Primary Virginia License Area
Table 4 provides the number and percent of completers employers that completed at least one of the 15 satisfaction items by primary licensure area. Results are ordered from greatest to least by the number of respondents in the given licensure area.
Table 4: Responses by Licensure Area
Licensure Area Number of
Respondents Percent of
Respondents
Elementary education preK-6 224 47.8%
Special Education 60 12.8%
History and social sciences 40 8.5%
Music 30 6.4%
English 28 6%
Mathematics 15 3.2%
Health and physical education preK-12 14 3%
Visual arts preK-12 13 2.8%
Secondary Science 11 2.3%
Early Childhood Special Education 9 1.9%
English as a second language preK-12 7 1.5%
Early/Primary 6 1.3%
Middle Education 4 0.9%
Foreign language 3 0.6%
Gifted education 2 0.4%
Theatre arts preK-12 1 0.2%
CTE 1 0.2%
10
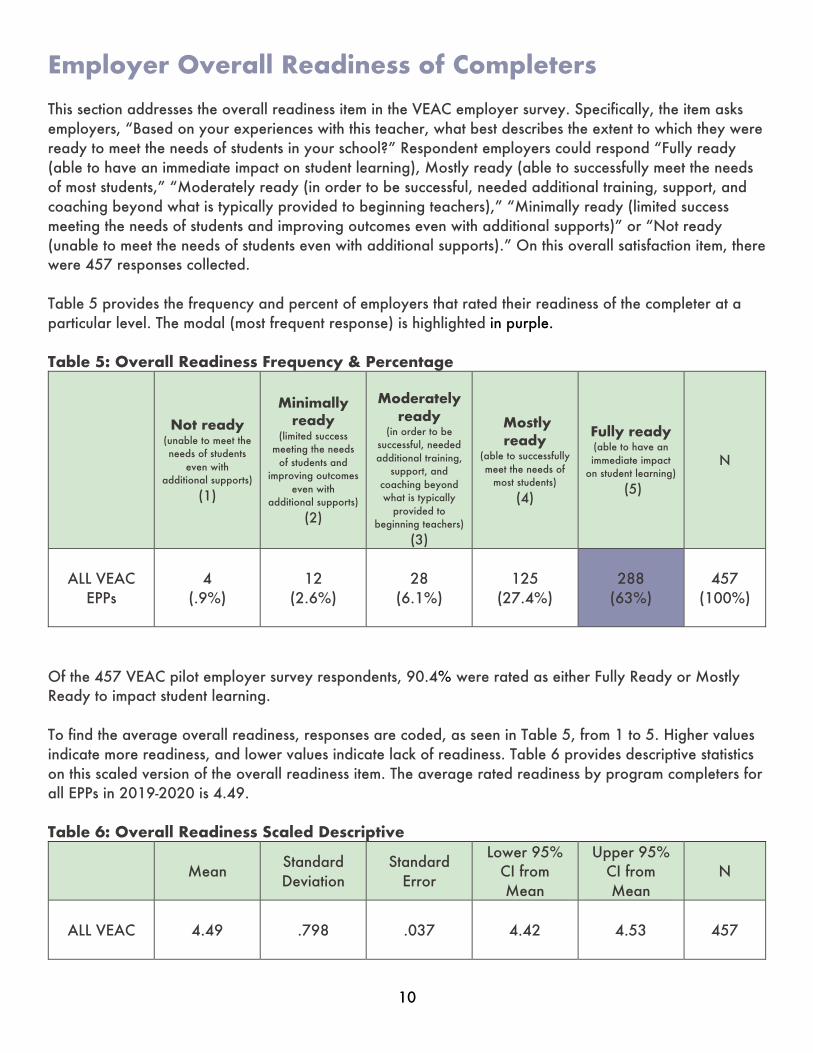
Employer Overall Readiness of Completers This section addresses the overall readiness item in the VEAC employer survey. Specifically, the item asks employers, “Based on your experiences with this teacher, what best describes the extent to which they were ready to meet the needs of students in your school?” Respondent employers could respond “Fully ready (able to have an immediate impact on student learning), Mostly ready (able to successfully meet the needs of most students,” “Moderately ready (in order to be successful, needed additional training, support, and coaching beyond what is typically provided to beginning teachers),” “Minimally ready (limited success meeting the needs of students and improving outcomes even with additional supports)” or “Not ready (unable to meet the needs of students even with additional supports).” On this overall satisfaction item, there were 457 responses collected. Table 5 provides the frequency and percent of employers that rated their readiness of the completer at a particular level. The modal (most frequent response) is highlighted in purple. Table 5: Overall Readiness Frequency & Percentage
Not ready (unable to meet the needs of students
even with additional supports)
(1)
Minimally ready
(limited success meeting the needs
of students and improving outcomes
even with additional supports)
(2)
Moderately
ready (in order to be
successful, needed additional training,
support, and coaching beyond what is typically
provided to beginning teachers)
(3)
Mostly ready
(able to successfully meet the needs of
most students)
(4)
Fully ready (able to have an immediate impact
on student learning) (5)
N
ALL VEAC
EPPs
4 (.9%)
12 (2.6%)
28 (6.1%)
125 (27.4%)
288 (63%)
457 (100%)
Of the 457 VEAC pilot employer survey respondents, 90.4% were rated as either Fully Ready or Mostly Ready to impact student learning. To find the average overall readiness, responses are coded, as seen in Table 5, from 1 to 5. Higher values indicate more readiness, and lower values indicate lack of readiness. Table 6 provides descriptive statistics on this scaled version of the overall readiness item. The average rated readiness by program completers for all EPPs in 2019-2020 is 4.49. Table 6: Overall Readiness Scaled Descriptive
Mean
Standard Deviation
Standard Error
Lower 95% CI from Mean
Upper 95% CI from Mean
N
ALL VEAC
4.49 .798 .037 4.42 4.53 457
11
Overall Readiness Sub-Benchmarks
Using background data on completer respondent’s institutions, the following section provides average overall readiness by EPP size, EPP type, license category, graduate/undergraduate licensure, and rough estimation of year of completion. For EPPs interpreting these items, VEAC suggests finding your average (mean) readiness of your candidates and compare to the various average benchmarks. These multiple benchmarks will help you interpret your EPP’s data. In this section, VEAC provides graphical representations of data, however, in Appendix A, these descriptive statistics are listed for convenience. EPPs can utilize
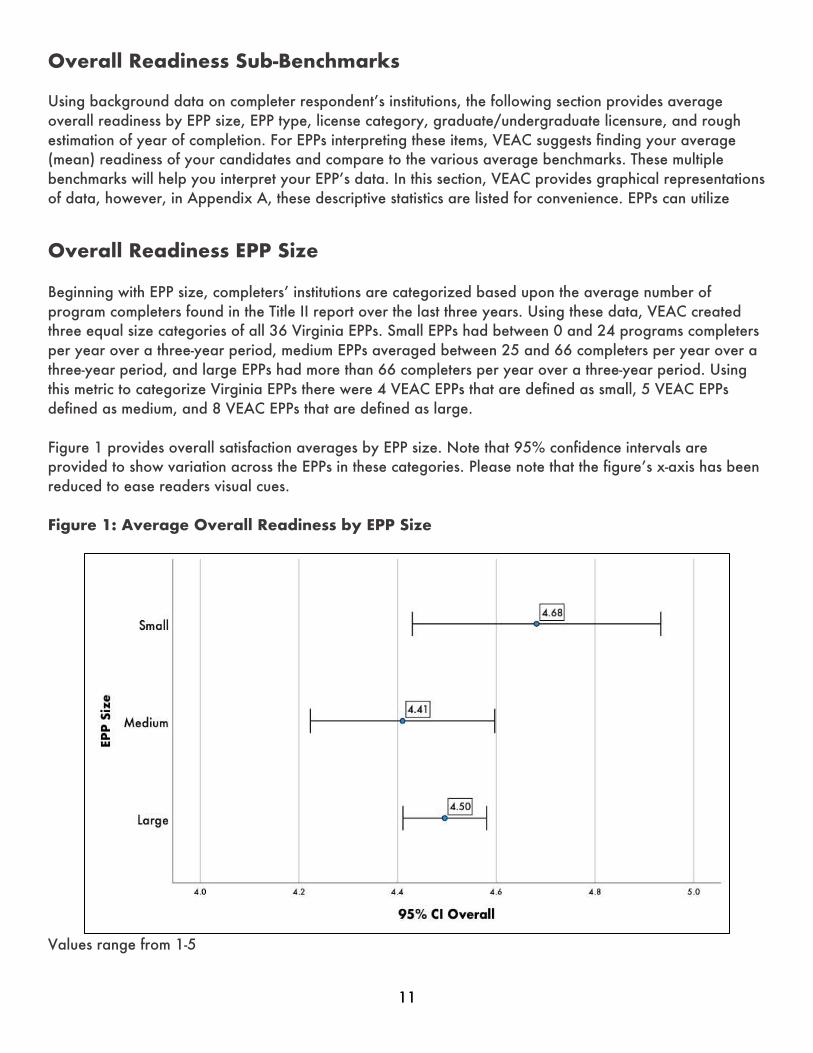
Overall Readiness EPP Size Beginning with EPP size, completers’ institutions are categorized based upon the average number of program completers found in the Title II report over the last three years. Using these data, VEAC created three equal size categories of all 36 Virginia EPPs. Small EPPs had between 0 and 24 programs completers per year over a three-year period, medium EPPs averaged between 25 and 66 completers per year over a three-year period, and large EPPs had more than 66 completers per year over a three-year period. Using this metric to categorize Virginia EPPs there were 4 VEAC EPPs that are defined as small, 5 VEAC EPPs defined as medium, and 8 VEAC EPPs that are defined as large. Figure 1 provides overall satisfaction averages by EPP size. Note that 95% confidence intervals are provided to show variation across the EPPs in these categories. Please note that the figure’s x-axis has been reduced to ease readers visual cues. Figure 1: Average Overall Readiness by EPP Size
Values range from 1-5
12
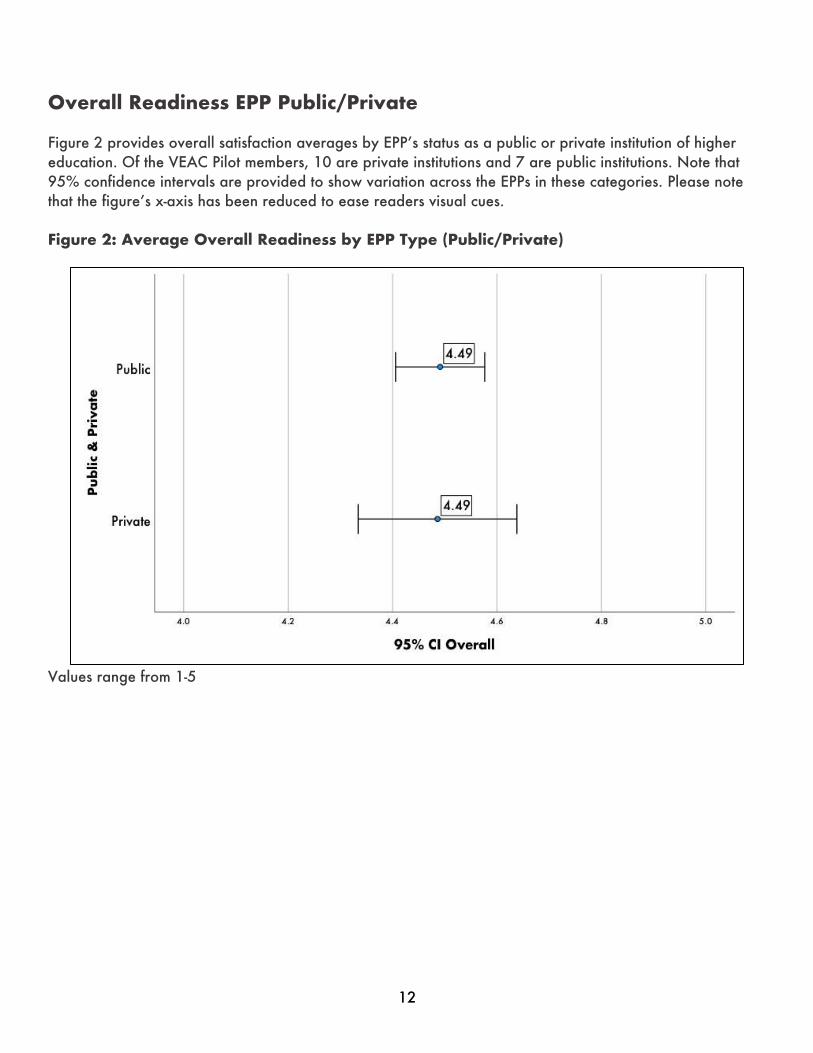
Overall Readiness EPP Public/Private
Figure 2 provides overall satisfaction averages by EPP’s status as a public or private institution of higher education. Of the VEAC Pilot members, 10 are private institutions and 7 are public institutions. Note that 95% confidence intervals are provided to show variation across the EPPs in these categories. Please note that the figure’s x-axis has been reduced to ease readers visual cues. Figure 2: Average Overall Readiness by EPP Type (Public/Private)
Values range from 1-5
13
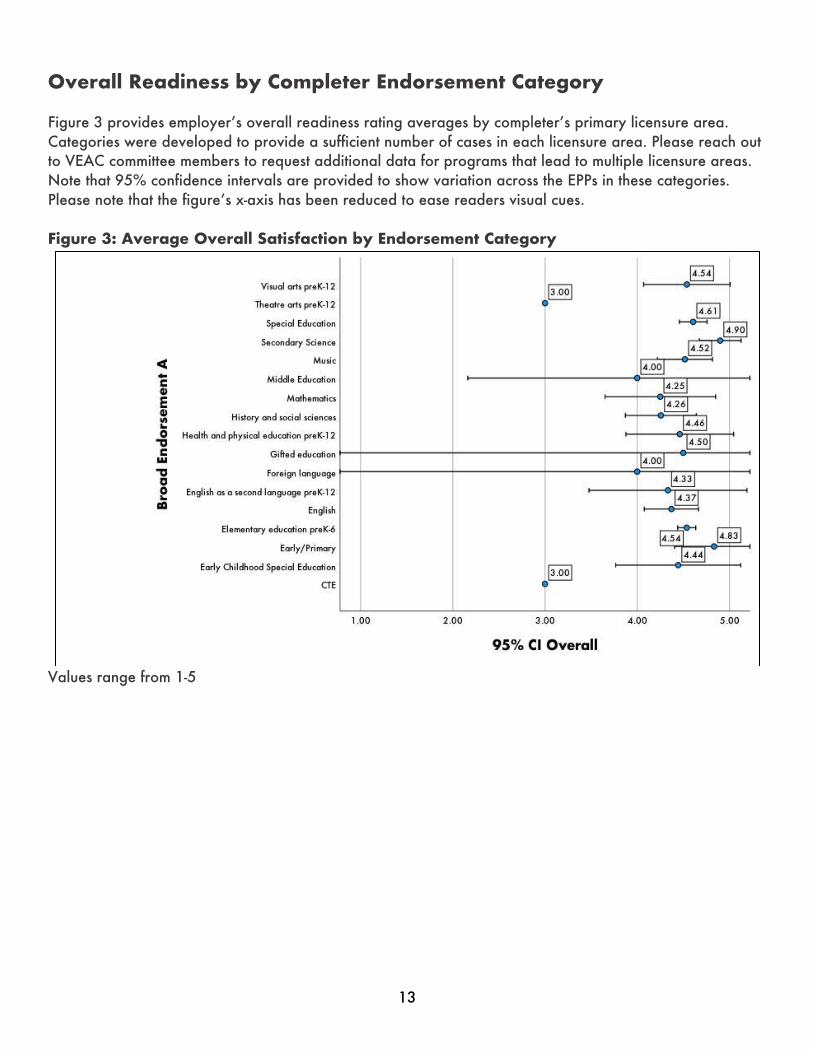
Overall Readiness by Completer Endorsement Category
Figure 3 provides employer’s overall readiness rating averages by completer’s primary licensure area. Categories were developed to provide a sufficient number of cases in each licensure area. Please reach out to VEAC committee members to request additional data for programs that lead to multiple licensure areas. Note that 95% confidence intervals are provided to show variation across the EPPs in these categories. Please note that the figure’s x-axis has been reduced to ease readers visual cues. Figure 3: Average Overall Satisfaction by Endorsement Category
Values range from 1-5
14
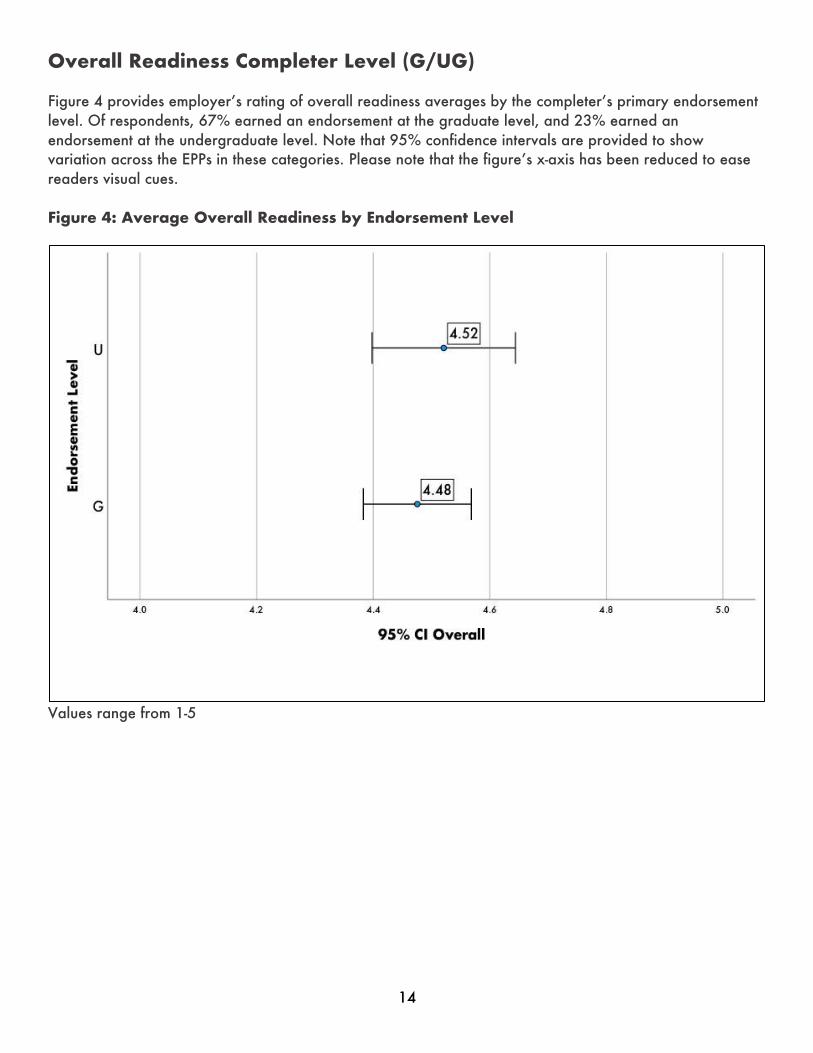
Overall Readiness Completer Level (G/UG)
Figure 4 provides employer’s rating of overall readiness averages by the completer’s primary endorsement level. Of respondents, 67% earned an endorsement at the graduate level, and 23% earned an endorsement at the undergraduate level. Note that 95% confidence intervals are provided to show variation across the EPPs in these categories. Please note that the figure’s x-axis has been reduced to ease readers visual cues. Figure 4: Average Overall Readiness by Endorsement Level
Values range from 1-5
15
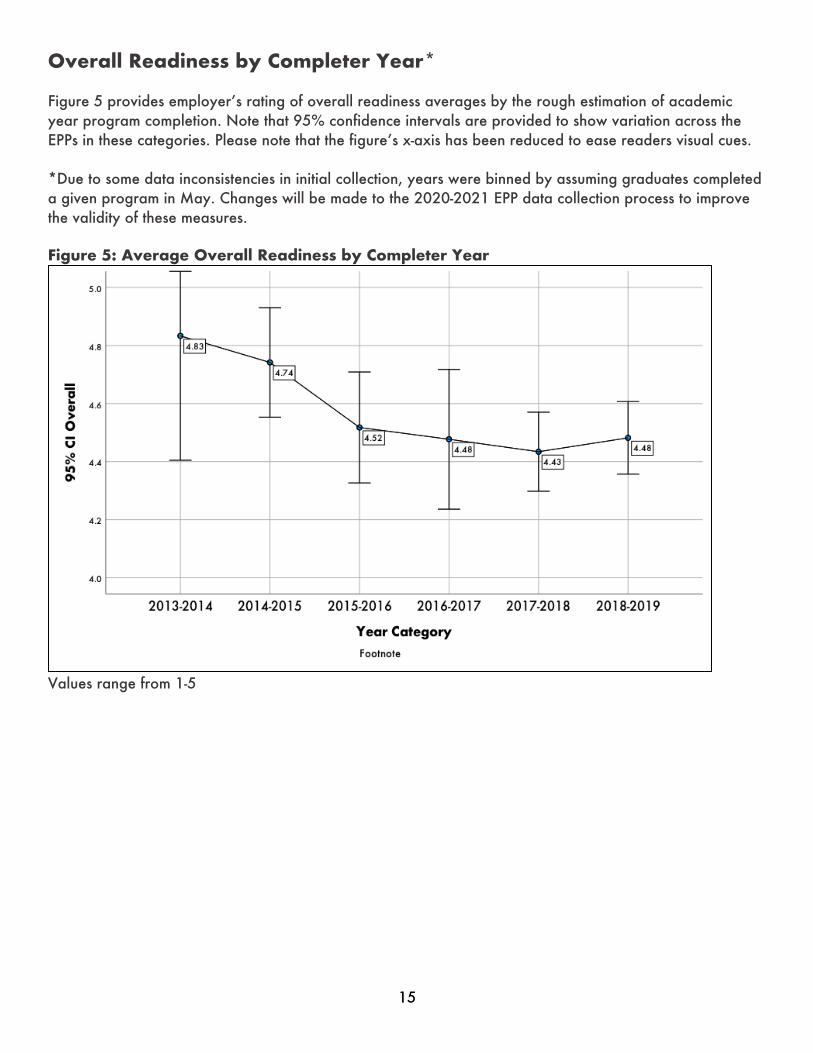
Overall Readiness by Completer Year*
Figure 5 provides employer’s rating of overall readiness averages by the rough estimation of academic year program completion. Note that 95% confidence intervals are provided to show variation across the EPPs in these categories. Please note that the figure’s x-axis has been reduced to ease readers visual cues. *Due to some data inconsistencies in initial collection, years were binned by assuming graduates completed a given program in May. Changes will be made to the 2020-2021 EPP data collection process to improve the validity of these measures.
Figure 5: Average Overall Readiness by Completer Year
Values range from 1-5
16
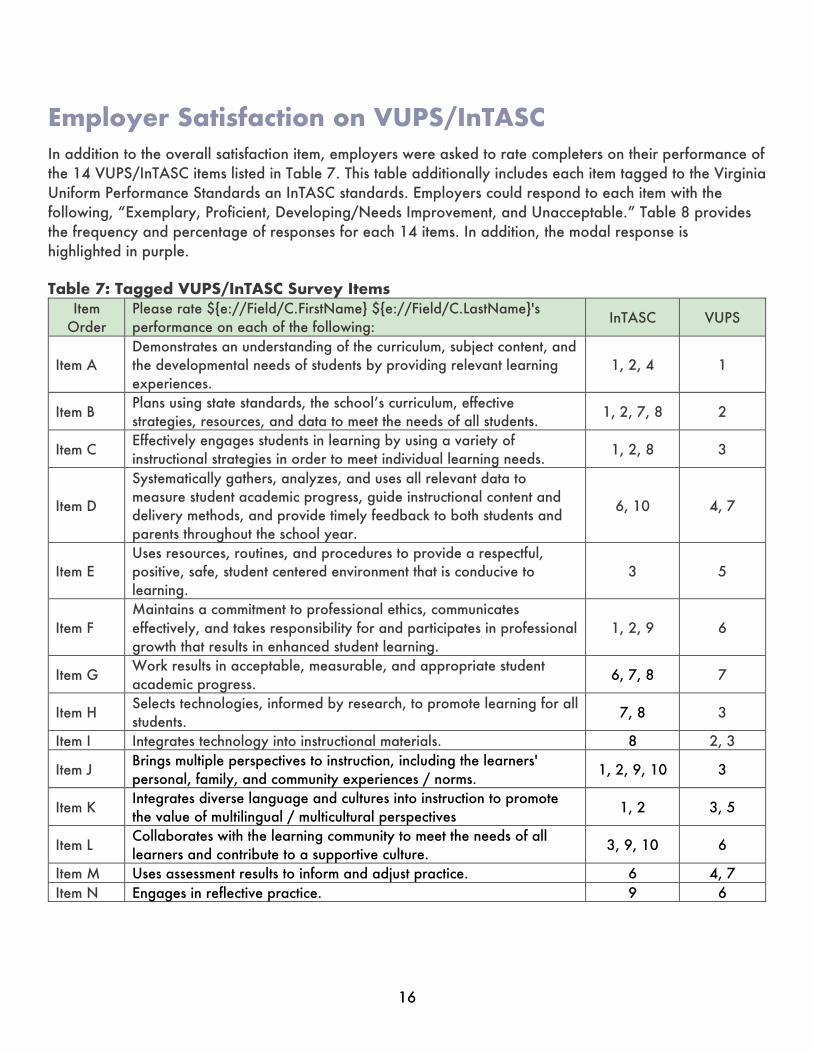
Employer Satisfaction on VUPS/InTASC
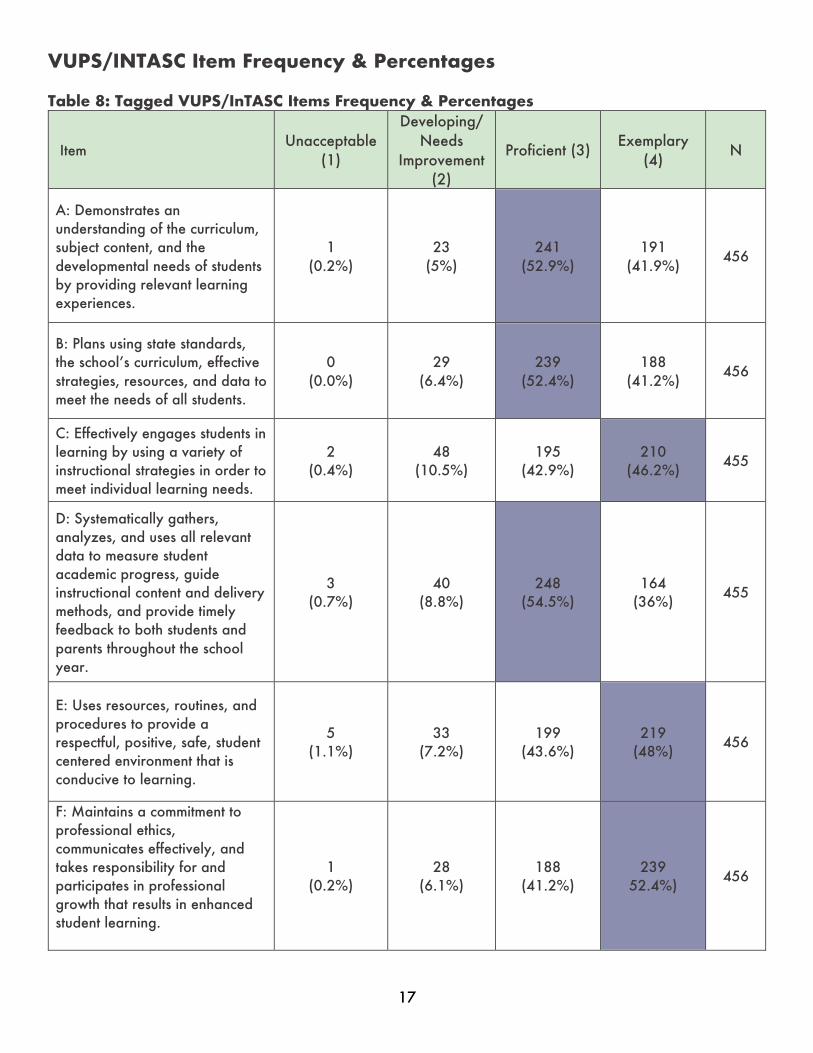
In addition to the overall satisfaction item, employers were asked to rate completers on their performance of the 14 VUPS/InTASC items listed in Table 7. This table additionally includes each item tagged to the Virginia Uniform Performance Standards an InTASC standards. Employers could respond to each item with the following, “Exemplary, Proficient, Developing/Needs Improvement, and Unacceptable.” Table 8 provides the frequency and percentage of responses for each 14 items. In addition, the modal response is highlighted in purple.
Table 7: Tagged VUPS/InTASC Survey Items Item
Order Please rate ${e://Field/C.FirstName} ${e://Field/C.LastName}'s performance on each of the following:
InTASC VUPS
Item A Demonstrates an understanding of the curriculum, subject content, and the developmental needs of students by providing relevant learning experiences.
1, 2, 4 1
Item B Plans using state standards, the school’s curriculum, effective strategies, resources, and data to meet the needs of all students.
1, 2, 7, 8 2
Item C Effectively engages students in learning by using a variety of instructional strategies in order to meet individual learning needs.
1, 2, 8 3
Item D
Systematically gathers, analyzes, and uses all relevant data to measure student academic progress, guide instructional content and delivery methods, and provide timely feedback to both students and parents throughout the school year.
6, 10 4, 7
Item E Uses resources, routines, and procedures to provide a respectful, positive, safe, student centered environment that is conducive to learning.
3 5
Item F Maintains a commitment to professional ethics, communicates effectively, and takes responsibility for and participates in professional growth that results in enhanced student learning.
1, 2, 9 6
Item G Work results in acceptable, measurable, and appropriate student academic progress.
6, 7, 8 7
Item H Selects technologies, informed by research, to promote learning for all students.
7, 8 3
Item I Integrates technology into instructional materials. 8 2, 3
Item J Brings multiple perspectives to instruction, including the learners' personal, family, and community experiences / norms.
1, 2, 9, 10 3
Item K Integrates diverse language and cultures into instruction to promote the value of multilingual / multicultural perspectives
1, 2 3, 5
Item L Collaborates with the learning community to meet the needs of all learners and contribute to a supportive culture.
3, 9, 10 6
Item M Uses assessment results to inform and adjust practice. 6 4, 7 Item N Engages in reflective practice. 9 6
17
VUPS/INTASC Item Frequency & Percentages
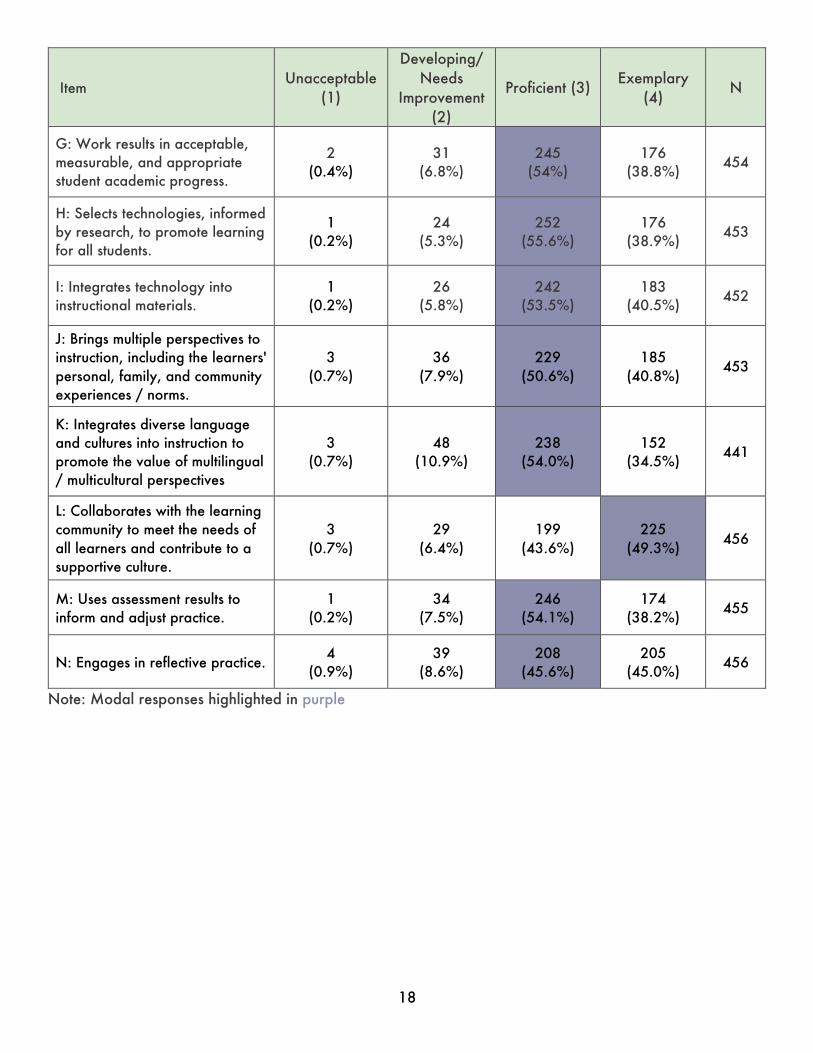
Table 8: Tagged VUPS/InTASC Items Frequency & Percentages
Item Unacceptable
(1)
Developing/ Needs
Improvement (2)
Proficient (3) Exemplary
(4) N
A: Demonstrates an understanding of the curriculum, subject content, and the developmental needs of students by providing relevant learning experiences.
1 (0.2%)
23 (5%)
241 (52.9%)
191 (41.9%)
456
B: Plans using state standards, the school’s curriculum, effective strategies, resources, and data to meet the needs of all students.
0 (0.0%)
29 (6.4%)
239 (52.4%)
188 (41.2%)
456
C: Effectively engages students in learning by using a variety of instructional strategies in order to meet individual learning needs.
2 (0.4%)
48 (10.5%)
195 (42.9%)
210 (46.2%)
455
D: Systematically gathers, analyzes, and uses all relevant data to measure student academic progress, guide instructional content and delivery methods, and provide timely feedback to both students and parents throughout the school year.
3 (0.7%)
40 (8.8%)
248 (54.5%)
164 (36%)
455
E: Uses resources, routines, and procedures to provide a respectful, positive, safe, student centered environment that is conducive to learning.
5 (1.1%)
33 (7.2%)
199 (43.6%)
219 (48%)
456
F: Maintains a commitment to professional ethics, communicates effectively, and takes responsibility for and participates in professional growth that results in enhanced student learning.
1 (0.2%)
28 (6.1%)
188 (41.2%)
239 52.4%)
456
18
Item Unacceptable
(1)
Developing/ Needs
Improvement (2)
Proficient (3) Exemplary
(4) N
G: Work results in acceptable, measurable, and appropriate student academic progress.
2 (0.4%)
31 (6.8%)
245 (54%)
176 (38.8%)
454
H: Selects technologies, informed by research, to promote learning for all students.
1 (0.2%)
24 (5.3%)
252 (55.6%)
176 (38.9%)
453
I: Integrates technology into instructional materials.
1 (0.2%)
26 (5.8%)
242 (53.5%)
183 (40.5%)
452
J: Brings multiple perspectives to instruction, including the learners' personal, family, and community experiences / norms.
3 (0.7%)
36 (7.9%)
229 (50.6%)
185 (40.8%)
453
K: Integrates diverse language and cultures into instruction to promote the value of multilingual / multicultural perspectives
3 (0.7%)
48 (10.9%)
238 (54.0%)
152 (34.5%)
441
L: Collaborates with the learning community to meet the needs of all learners and contribute to a supportive culture.
3 (0.7%)
29 (6.4%)
199 (43.6%)
225 (49.3%)
456
M: Uses assessment results to inform and adjust practice.
1 (0.2%)
34 (7.5%)
246 (54.1%)
174 (38.2%)
455
N: Engages in reflective practice. 4
(0.9%) 39
(8.6%) 208
(45.6%) 205
(45.0%) 456
Note: Modal responses highlighted in purple
19
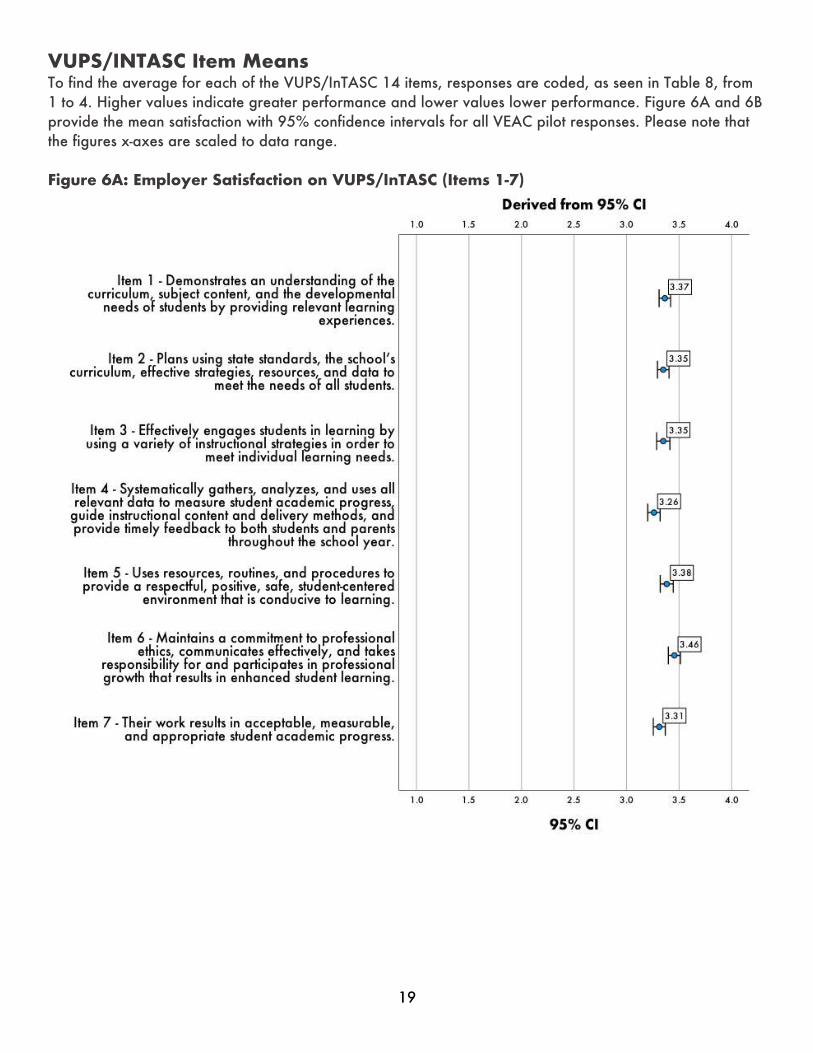
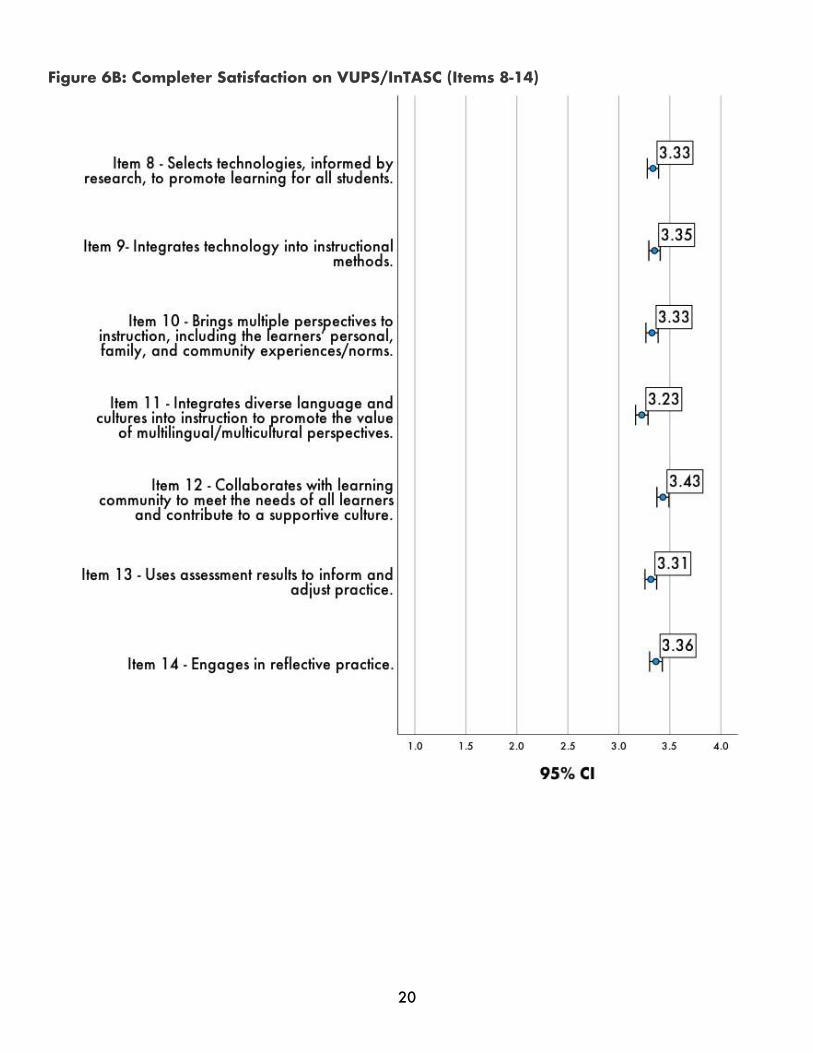
VUPS/INTASC Item Means To find the average for each of the VUPS/InTASC 14 items, responses are coded, as seen in Table 8, from 1 to 4. Higher values indicate greater performance and lower values lower performance. Figure 6A and 6B provide the mean satisfaction with 95% confidence intervals for all VEAC pilot responses. Please note that the figures x-axes are scaled to data range. Figure 6A: Employer Satisfaction on VUPS/InTASC (Items 1-7)
20
Figure 6B: Completer Satisfaction on VUPS/InTASC (Items 8-14)
21
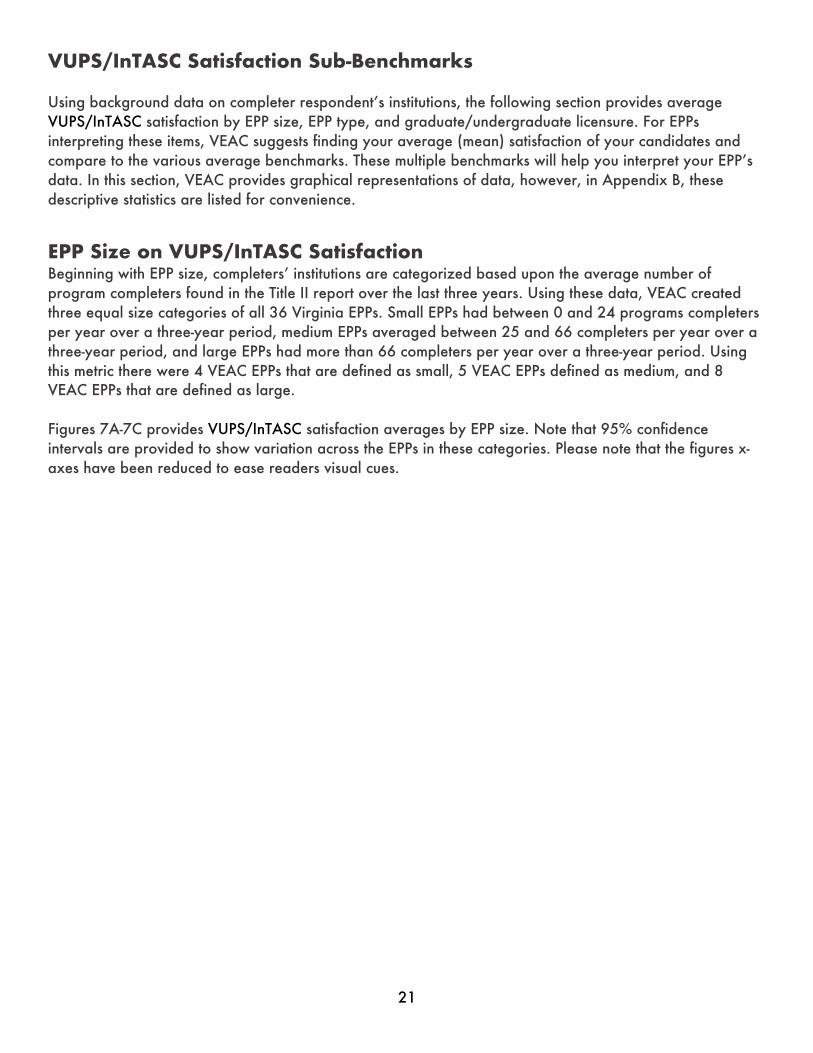
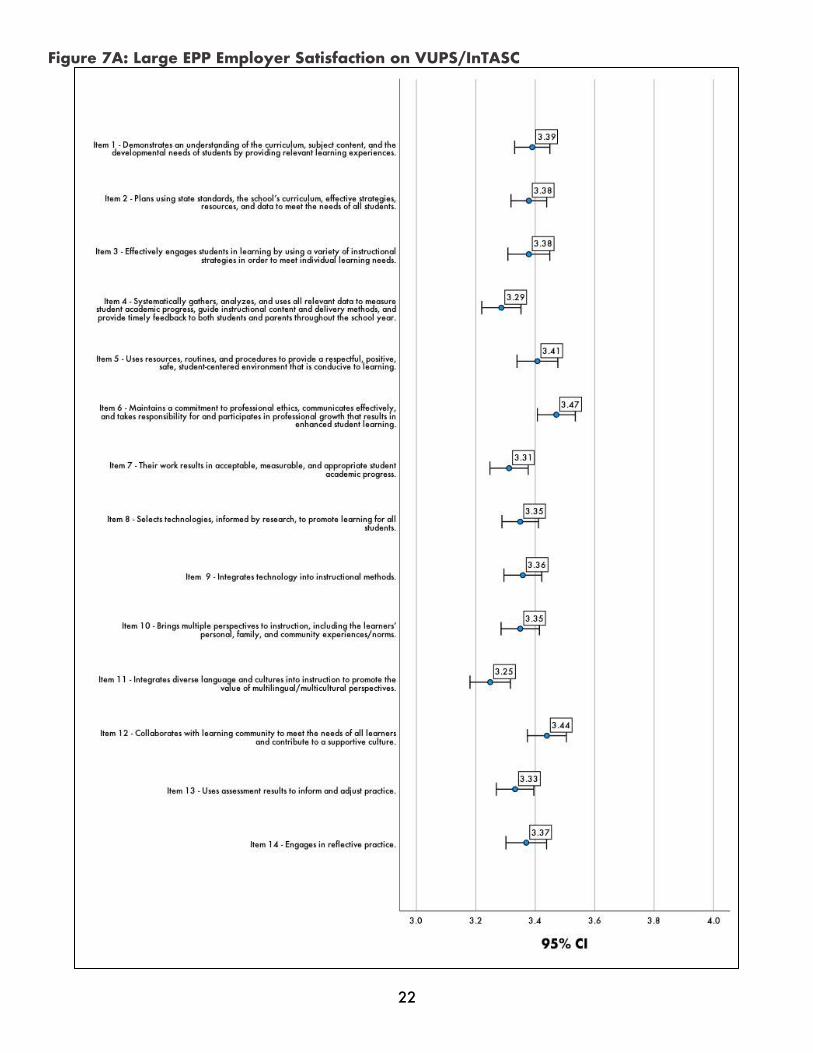
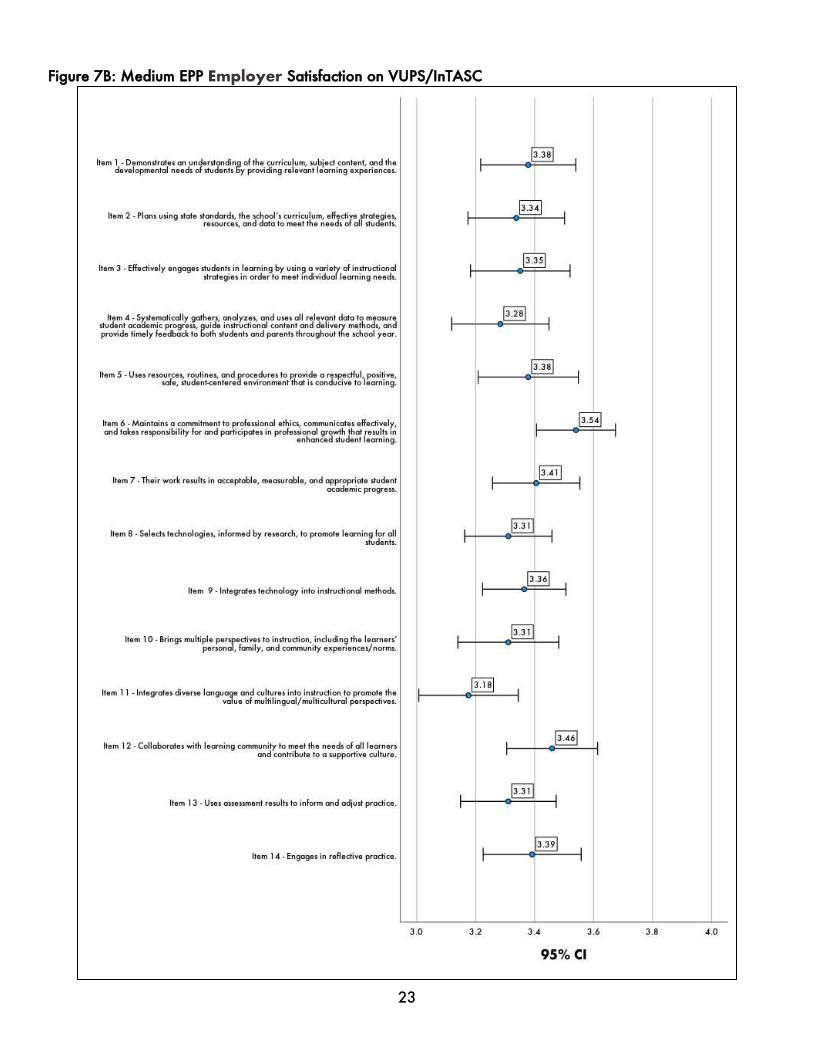
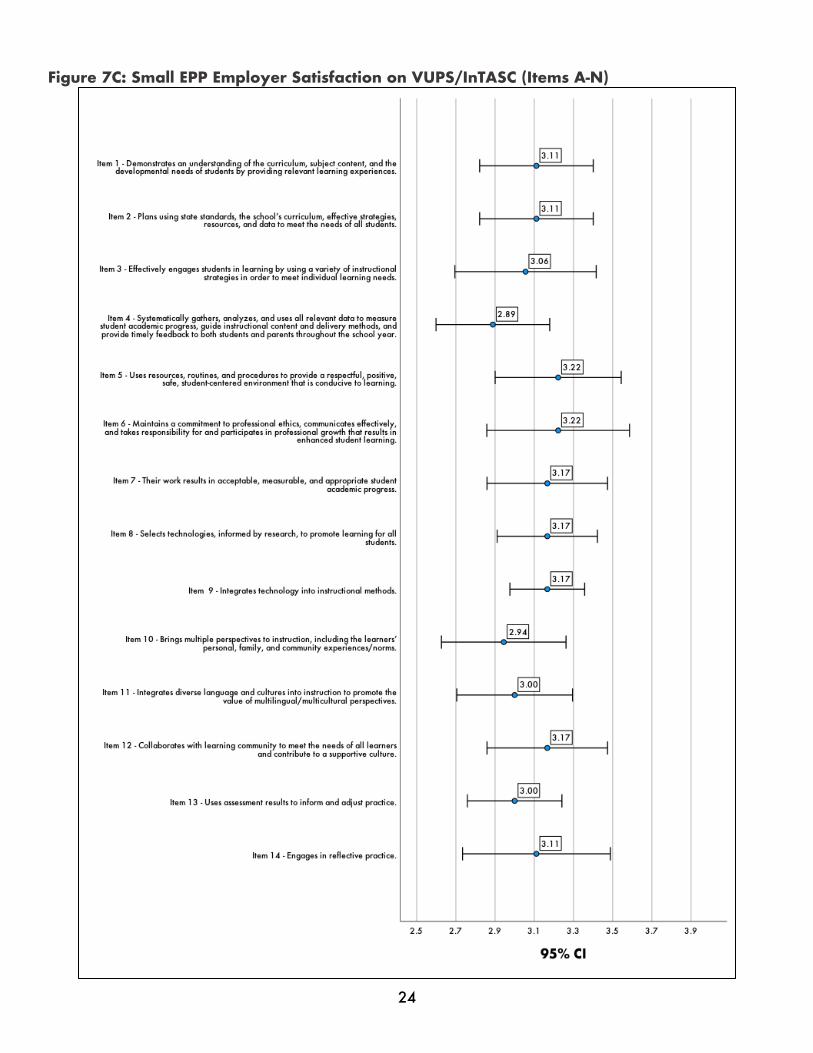
VUPS/InTASC Satisfaction Sub-Benchmarks Using background data on completer respondent’s institutions, the following section provides average VUPS/InTASC satisfaction by EPP size, EPP type, and graduate/undergraduate licensure. For EPPs interpreting these items, VEAC suggests finding your average (mean) satisfaction of your candidates and compare to the various average benchmarks. These multiple benchmarks will help you interpret your EPP’s data. In this section, VEAC provides graphical representations of data, however, in Appendix B, these descriptive statistics are listed for convenience.
EPP Size on VUPS/InTASC Satisfaction Beginning with EPP size, completers’ institutions are categorized based upon the average number of program completers found in the Title II report over the last three years. Using these data, VEAC created three equal size categories of all 36 Virginia EPPs. Small EPPs had between 0 and 24 programs completers per year over a three-year period, medium EPPs averaged between 25 and 66 completers per year over a three-year period, and large EPPs had more than 66 completers per year over a three-year period. Using this metric there were 4 VEAC EPPs that are defined as small, 5 VEAC EPPs defined as medium, and 8 VEAC EPPs that are defined as large. Figures 7A-7C provides VUPS/InTASC satisfaction averages by EPP size. Note that 95% confidence intervals are provided to show variation across the EPPs in these categories. Please note that the figures x-axes have been reduced to ease readers visual cues.
22
Figure 7A: Large EPP Employer Satisfaction on VUPS/InTASC
23
Figure 7B: Medium EPP Employer Satisfaction on VUPS/InTASC
24
Figure 7C: Small EPP Employer Satisfaction on VUPS/InTASC (Items A-N)
25
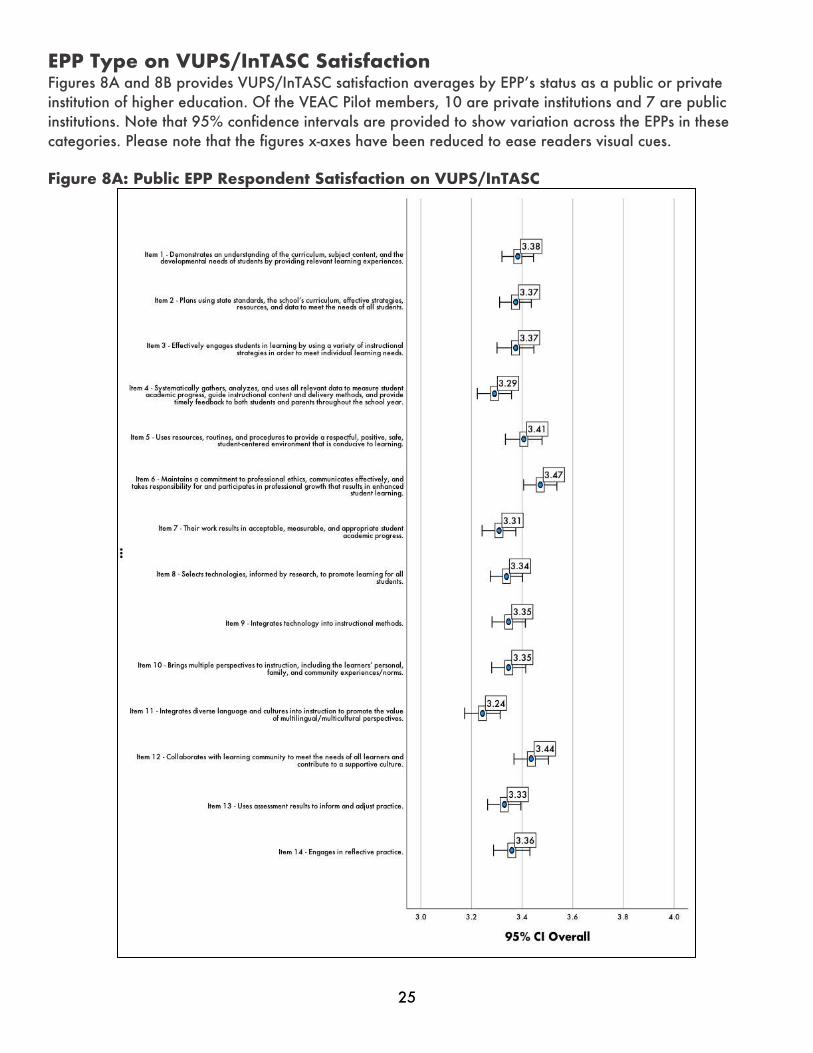
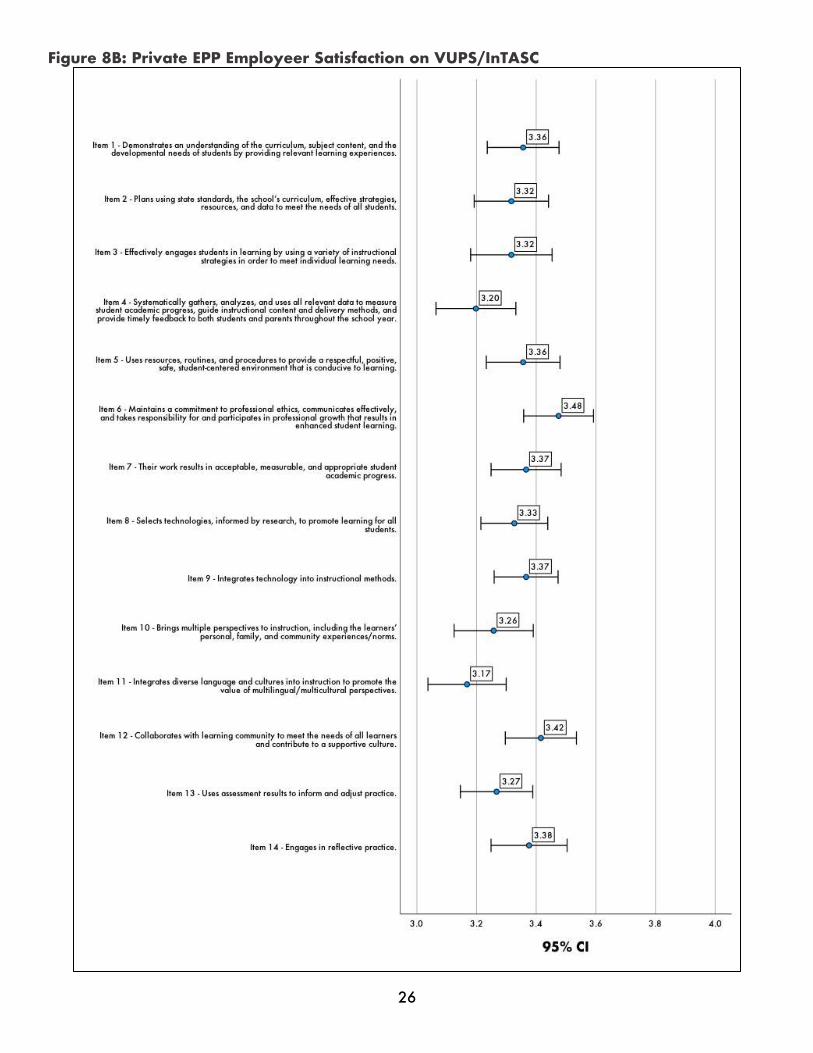
EPP Type on VUPS/InTASC Satisfaction Figures 8A and 8B provides VUPS/InTASC satisfaction averages by EPP’s status as a public or private institution of higher education. Of the VEAC Pilot members, 10 are private institutions and 7 are public institutions. Note that 95% confidence intervals are provided to show variation across the EPPs in these categories. Please note that the figures x-axes have been reduced to ease readers visual cues.
Figure 8A: Public EPP Respondent Satisfaction on VUPS/InTASC
26
Figure 8B: Private EPP Employeer Satisfaction on VUPS/InTASC
27
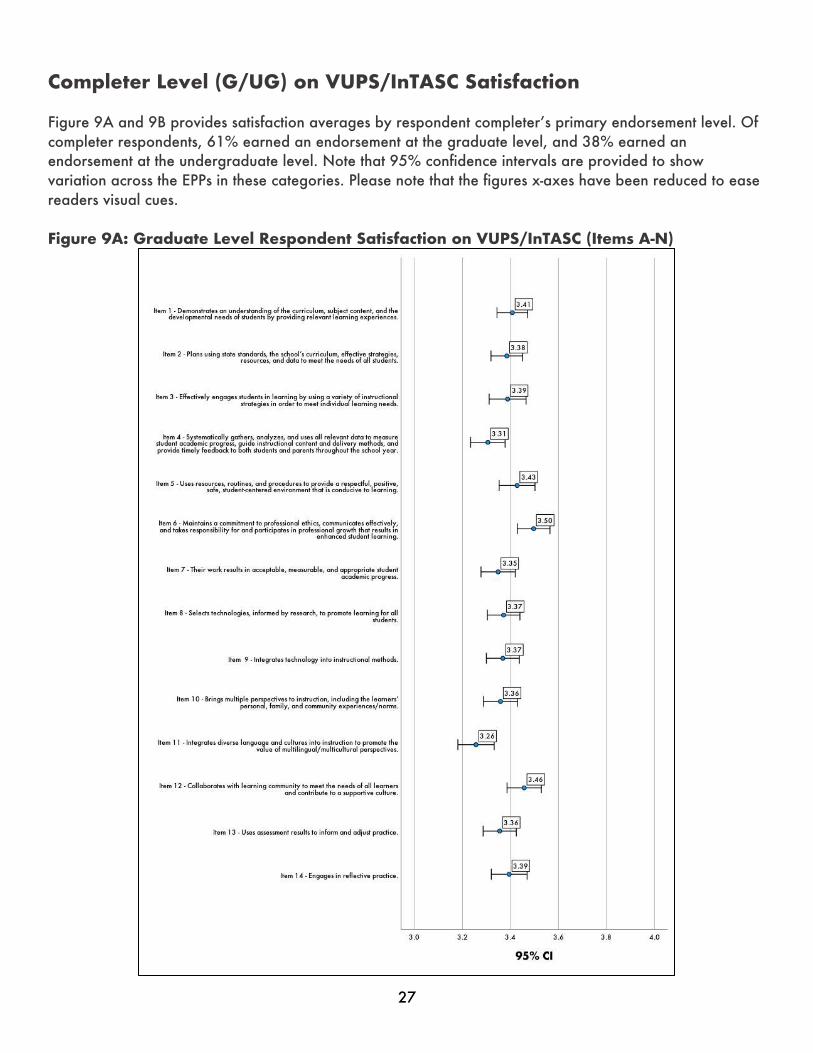
Completer Level (G/UG) on VUPS/InTASC Satisfaction
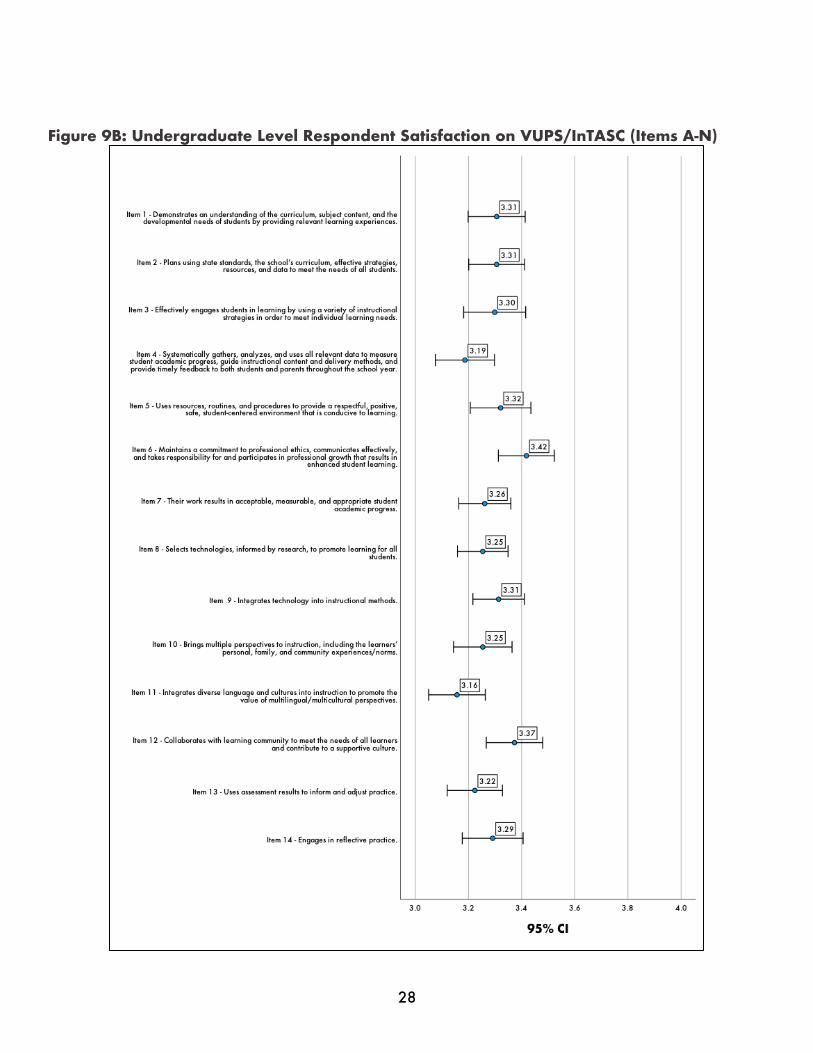
Figure 9A and 9B provides satisfaction averages by respondent completer’s primary endorsement level. Of completer respondents, 61% earned an endorsement at the graduate level, and 38% earned an endorsement at the undergraduate level. Note that 95% confidence intervals are provided to show variation across the EPPs in these categories. Please note that the figures x-axes have been reduced to ease readers visual cues. Figure 9A: Graduate Level Respondent Satisfaction on VUPS/InTASC (Items A-N)
28
Figure 9B: Undergraduate Level Respondent Satisfaction on VUPS/InTASC (Items A-N)
29
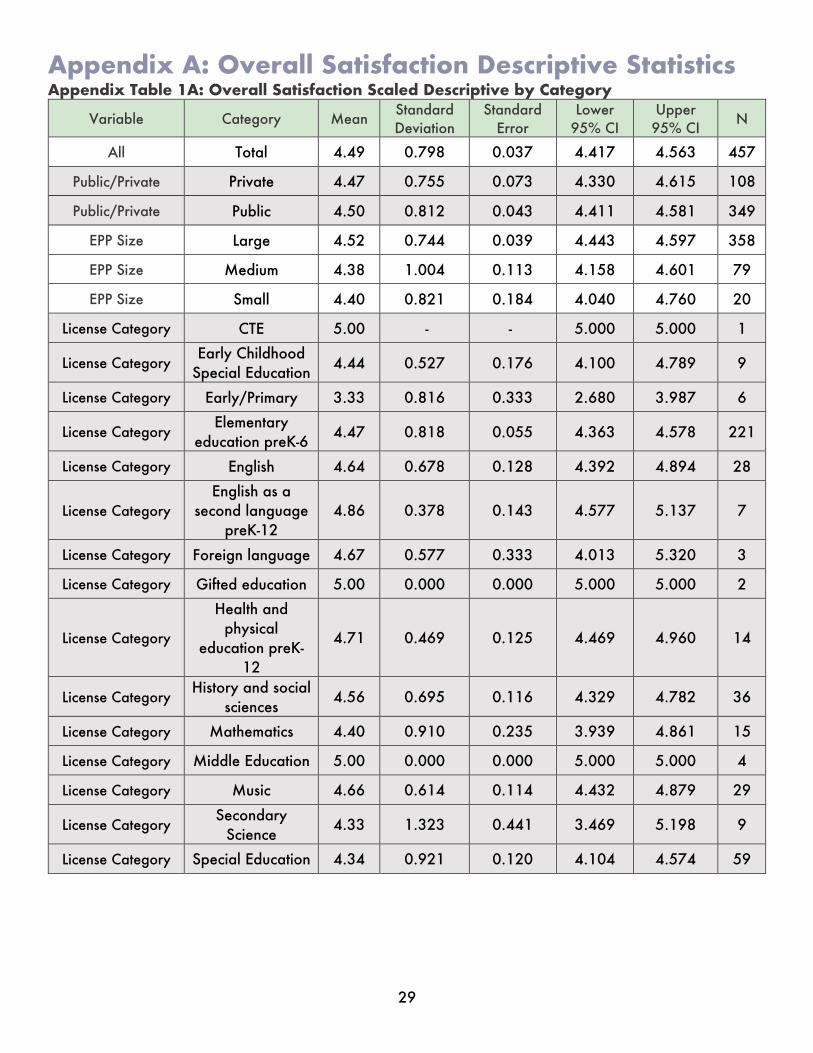
Appendix A: Overall Satisfaction Descriptive Statistics Appendix Table 1A: Overall Satisfaction Scaled Descriptive by Category
Variable Category Mean Standard Deviation
Standard Error
Lower 95% CI
Upper 95% CI
N
All Total 4.49 0.798 0.037 4.417 4.563 457
Public/Private Private 4.47 0.755 0.073 4.330 4.615 108
Public/Private Public 4.50 0.812 0.043 4.411 4.581 349
EPP Size Large 4.52 0.744 0.039 4.443 4.597 358
EPP Size Medium 4.38 1.004 0.113 4.158 4.601 79
EPP Size Small 4.40 0.821 0.184 4.040 4.760 20
License Category CTE 5.00 - - 5.000 5.000 1
License Category Early Childhood
Special Education 4.44 0.527 0.176 4.100 4.789 9
License Category Early/Primary 3.33 0.816 0.333 2.680 3.987 6
License Category Elementary
education preK-6 4.47 0.818 0.055 4.363 4.578 221
License Category English 4.64 0.678 0.128 4.392 4.894 28
License Category English as a
second language preK-12
4.86 0.378 0.143 4.577 5.137 7
License Category Foreign language 4.67 0.577 0.333 4.013 5.320 3
License Category Gifted education 5.00 0.000 0.000 5.000 5.000 2
License Category
Health and physical
education preK-12
4.71 0.469 0.125 4.469 4.960 14
License Category History and social
sciences 4.56 0.695 0.116 4.329 4.782 36
License Category Mathematics 4.40 0.910 0.235 3.939 4.861 15
License Category Middle Education 5.00 0.000 0.000 5.000 5.000 4
License Category Music 4.66 0.614 0.114 4.432 4.879 29
License Category Secondary
Science 4.33 1.323 0.441 3.469 5.198 9
License Category Special Education 4.34 0.921 0.120 4.104 4.574 59
30
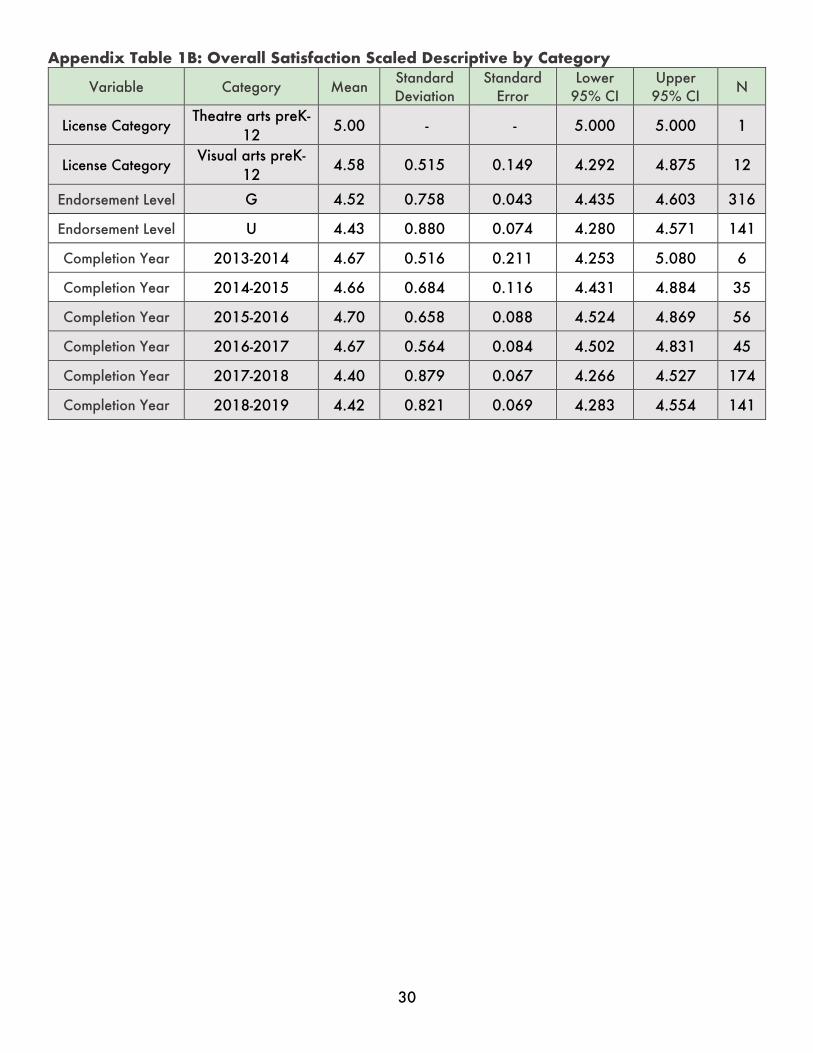
Appendix Table 1B: Overall Satisfaction Scaled Descriptive by Category
Variable Category Mean Standard Deviation
Standard Error
Lower 95% CI
Upper 95% CI
N
License Category Theatre arts preK-
12 5.00 - - 5.000 5.000 1
License Category Visual arts preK-
12 4.58 0.515 0.149 4.292 4.875 12
Endorsement Level G 4.52 0.758 0.043 4.435 4.603 316
Endorsement Level U 4.43 0.880 0.074 4.280 4.571 141
Completion Year 2013-2014 4.67 0.516 0.211 4.253 5.080 6
Completion Year 2014-2015 4.66 0.684 0.116 4.431 4.884 35
Completion Year 2015-2016 4.70 0.658 0.088 4.524 4.869 56
Completion Year 2016-2017 4.67 0.564 0.084 4.502 4.831 45
Completion Year 2017-2018 4.40 0.879 0.067 4.266 4.527 174
Completion Year 2018-2019 4.42 0.821 0.069 4.283 4.554 141
31
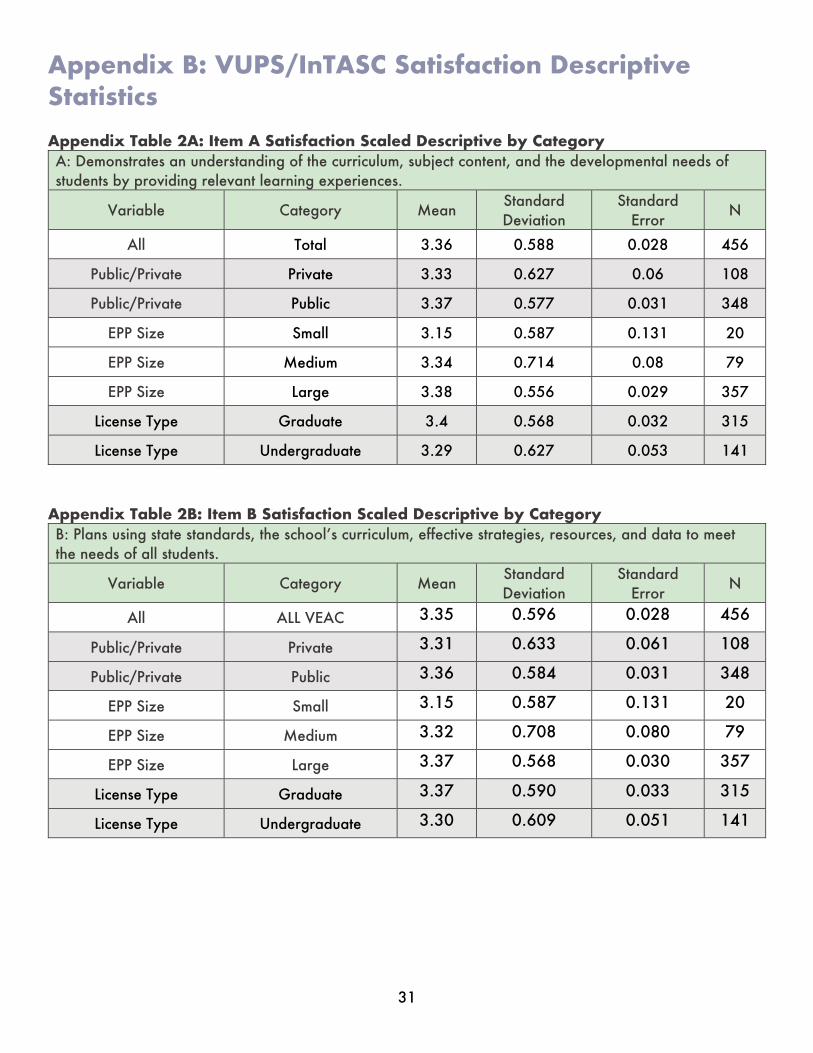
Appendix B: VUPS/InTASC Satisfaction Descriptive Statistics Appendix Table 2A: Item A Satisfaction Scaled Descriptive by Category A: Demonstrates an understanding of the curriculum, subject content, and the developmental needs of students by providing relevant learning experiences.
Variable Category Mean Standard Deviation
Standard Error
N
All Total 3.36 0.588 0.028 456
Public/Private Private 3.33 0.627 0.06 108
Public/Private Public 3.37 0.577 0.031 348
EPP Size Small 3.15 0.587 0.131 20
EPP Size Medium 3.34 0.714 0.08 79
EPP Size Large 3.38 0.556 0.029 357
License Type Graduate 3.4 0.568 0.032 315
License Type Undergraduate 3.29 0.627 0.053 141
Appendix Table 2B: Item B Satisfaction Scaled Descriptive by Category B: Plans using state standards, the school’s curriculum, effective strategies, resources, and data to meet the needs of all students.
Variable Category Mean Standard Deviation
Standard Error
N
All ALL VEAC 3.35 0.596 0.028 456
Public/Private Private 3.31 0.633 0.061 108
Public/Private Public 3.36 0.584 0.031 348
EPP Size Small 3.15 0.587 0.131 20
EPP Size Medium 3.32 0.708 0.080 79
EPP Size Large 3.37 0.568 0.030 357
License Type Graduate 3.37 0.590 0.033 315
License Type Undergraduate 3.30 0.609 0.051 141
32
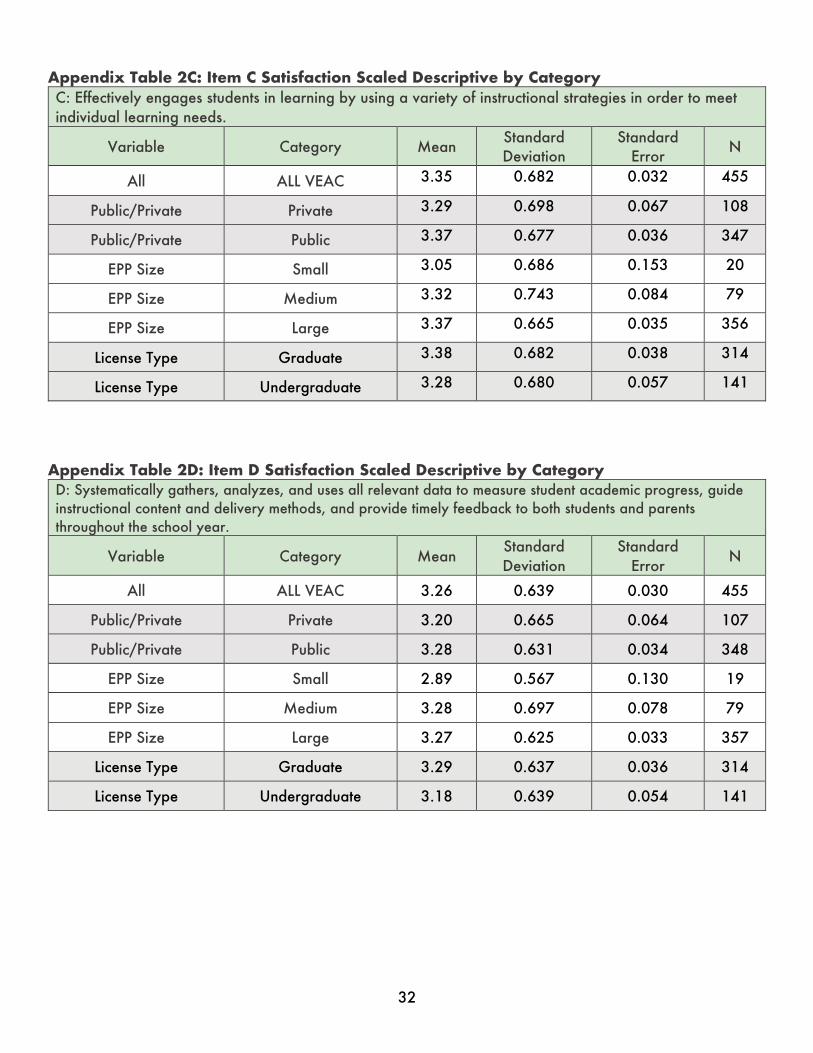
Appendix Table 2C: Item C Satisfaction Scaled Descriptive by Category C: Effectively engages students in learning by using a variety of instructional strategies in order to meet individual learning needs.
Variable Category Mean Standard Deviation
Standard Error
N
All ALL VEAC 3.35 0.682 0.032 455
Public/Private Private 3.29 0.698 0.067 108
Public/Private Public 3.37 0.677 0.036 347
EPP Size Small 3.05 0.686 0.153 20
EPP Size Medium 3.32 0.743 0.084 79
EPP Size Large 3.37 0.665 0.035 356
License Type Graduate 3.38 0.682 0.038 314
License Type Undergraduate 3.28 0.680 0.057 141
Appendix Table 2D: Item D Satisfaction Scaled Descriptive by Category D: Systematically gathers, analyzes, and uses all relevant data to measure student academic progress, guide instructional content and delivery methods, and provide timely feedback to both students and parents throughout the school year.
Variable Category Mean Standard Deviation
Standard Error
N
All ALL VEAC 3.26 0.639 0.030 455
Public/Private Private 3.20 0.665 0.064 107
Public/Private Public 3.28 0.631 0.034 348
EPP Size Small 2.89 0.567 0.130 19
EPP Size Medium 3.28 0.697 0.078 79
EPP Size Large 3.27 0.625 0.033 357
License Type Graduate 3.29 0.637 0.036 314
License Type Undergraduate 3.18 0.639 0.054 141

33
Appendix Table 2E: Item E Satisfaction Scaled Descriptive by Category E: Uses resources, routines, and procedures to provide a respectful, positive, safe, student centered environment that is conducive to learning.
Variable Category Mean Standard Deviation
Standard Error
N
All ALL VEAC 3.39 0.670 0.031 456
Public/Private Private 3.34 0.629 0.061 108
Public/Private Public 3.40 0.682 0.037 348
EPP Size Small 3.25 0.639 0.143 20
EPP Size Medium 3.33 0.780 0.088 79
EPP Size Large 3.41 0.645 0.034 357
License Type Graduate 3.43 0.656 0.037 315
License Type Undergraduate 3.30 0.694 0.058 141
Appendix Table 2F: Item F Satisfaction Scaled Descriptive by Category F: Maintains a commitment to professional ethics, communicates effectively, and takes responsibility for and participates in professional growth that results in enhanced student learning.
Variable Category Mean Standard Deviation
Standard Error
N
All ALL VEAC 3.46 0.621 0.029 456
Public/Private Private 3.45 0.602 0.058 108
Public/Private Public 3.46 0.627 0.034 348
EPP Size Small 3.22 0.716 0.160 20
EPP Size Medium 3.48 0.658 0.074 79
EPP Size Large 3.46 0.606 0.032 357
License Type Graduate 3.49 0.610 0.034 315
License Type Undergraduate 3.40 0.642 0.054 141
34
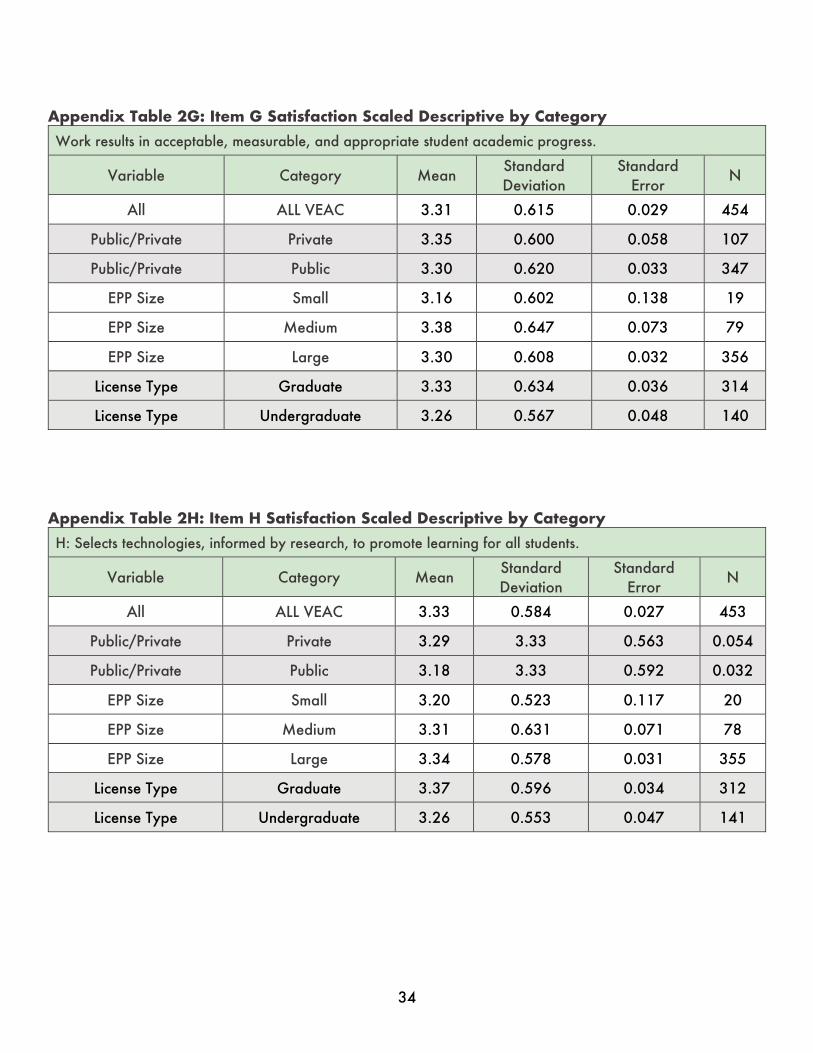
Appendix Table 2G: Item G Satisfaction Scaled Descriptive by Category
Work results in acceptable, measurable, and appropriate student academic progress.
Variable Category Mean Standard Deviation
Standard Error
N
All ALL VEAC 3.31 0.615 0.029 454
Public/Private Private 3.35 0.600 0.058 107
Public/Private Public 3.30 0.620 0.033 347
EPP Size Small 3.16 0.602 0.138 19
EPP Size Medium 3.38 0.647 0.073 79
EPP Size Large 3.30 0.608 0.032 356
License Type Graduate 3.33 0.634 0.036 314
License Type Undergraduate 3.26 0.567 0.048 140
Appendix Table 2H: Item H Satisfaction Scaled Descriptive by Category
H: Selects technologies, informed by research, to promote learning for all students.
Variable Category Mean Standard Deviation
Standard Error
N
All ALL VEAC 3.33 0.584 0.027 453
Public/Private Private 3.29 3.33 0.563 0.054
Public/Private Public 3.18 3.33 0.592 0.032
EPP Size Small 3.20 0.523 0.117 20
EPP Size Medium 3.31 0.631 0.071 78
EPP Size Large 3.34 0.578 0.031 355
License Type Graduate 3.37 0.596 0.034 312
License Type Undergraduate 3.26 0.553 0.047 141
35
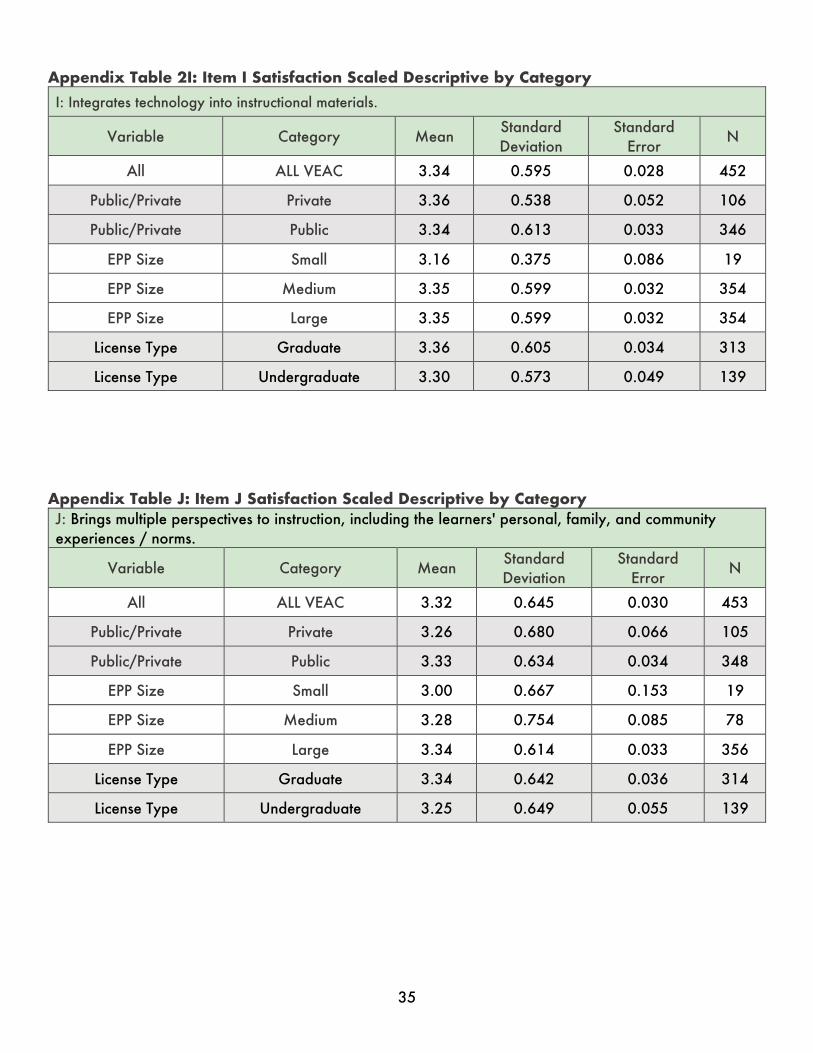
Appendix Table 2I: Item I Satisfaction Scaled Descriptive by Category
I: Integrates technology into instructional materials.
Variable Category Mean Standard Deviation
Standard Error
N
All ALL VEAC 3.34 0.595 0.028 452
Public/Private Private 3.36 0.538 0.052 106
Public/Private Public 3.34 0.613 0.033 346
EPP Size Small 3.16 0.375 0.086 19
EPP Size Medium 3.35 0.599 0.032 354
EPP Size Large 3.35 0.599 0.032 354
License Type Graduate 3.36 0.605 0.034 313
License Type Undergraduate 3.30 0.573 0.049 139
Appendix Table J: Item J Satisfaction Scaled Descriptive by Category J: Brings multiple perspectives to instruction, including the learners' personal, family, and community experiences / norms.
Variable Category Mean Standard Deviation
Standard Error
N
All ALL VEAC 3.32 0.645 0.030 453
Public/Private Private 3.26 0.680 0.066 105
Public/Private Public 3.33 0.634 0.034 348
EPP Size Small 3.00 0.667 0.153 19
EPP Size Medium 3.28 0.754 0.085 78
EPP Size Large 3.34 0.614 0.033 356
License Type Graduate 3.34 0.642 0.036 314
License Type Undergraduate 3.25 0.649 0.055 139
36
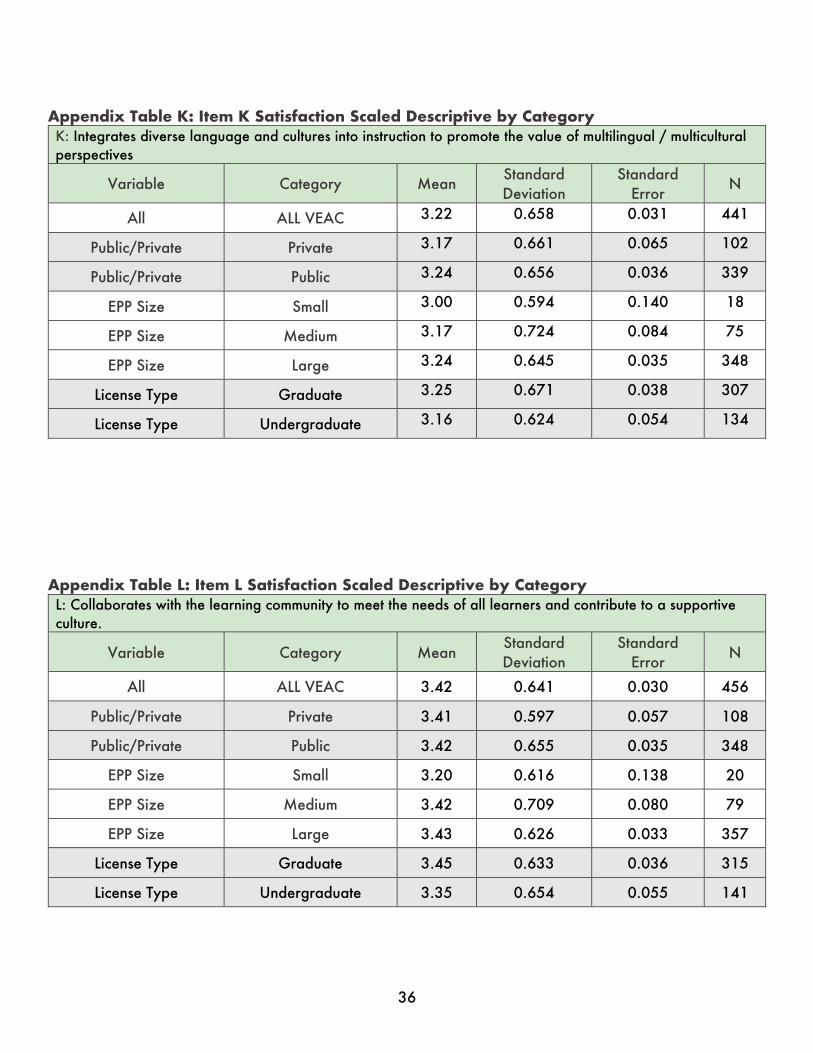
Appendix Table K: Item K Satisfaction Scaled Descriptive by Category K: Integrates diverse language and cultures into instruction to promote the value of multilingual / multicultural perspectives
Variable Category Mean Standard Deviation
Standard Error
N
All ALL VEAC 3.22 0.658 0.031 441
Public/Private Private 3.17 0.661 0.065 102
Public/Private Public 3.24 0.656 0.036 339
EPP Size Small 3.00 0.594 0.140 18
EPP Size Medium 3.17 0.724 0.084 75
EPP Size Large 3.24 0.645 0.035 348
License Type Graduate 3.25 0.671 0.038 307
License Type Undergraduate 3.16 0.624 0.054 134
Appendix Table L: Item L Satisfaction Scaled Descriptive by Category L: Collaborates with the learning community to meet the needs of all learners and contribute to a supportive culture.
Variable Category Mean Standard Deviation
Standard Error
N
All ALL VEAC 3.42 0.641 0.030 456
Public/Private Private 3.41 0.597 0.057 108
Public/Private Public 3.42 0.655 0.035 348
EPP Size Small 3.20 0.616 0.138 20
EPP Size Medium 3.42 0.709 0.080 79
EPP Size Large 3.43 0.626 0.033 357
License Type Graduate 3.45 0.633 0.036 315
License Type Undergraduate 3.35 0.654 0.055 141
37
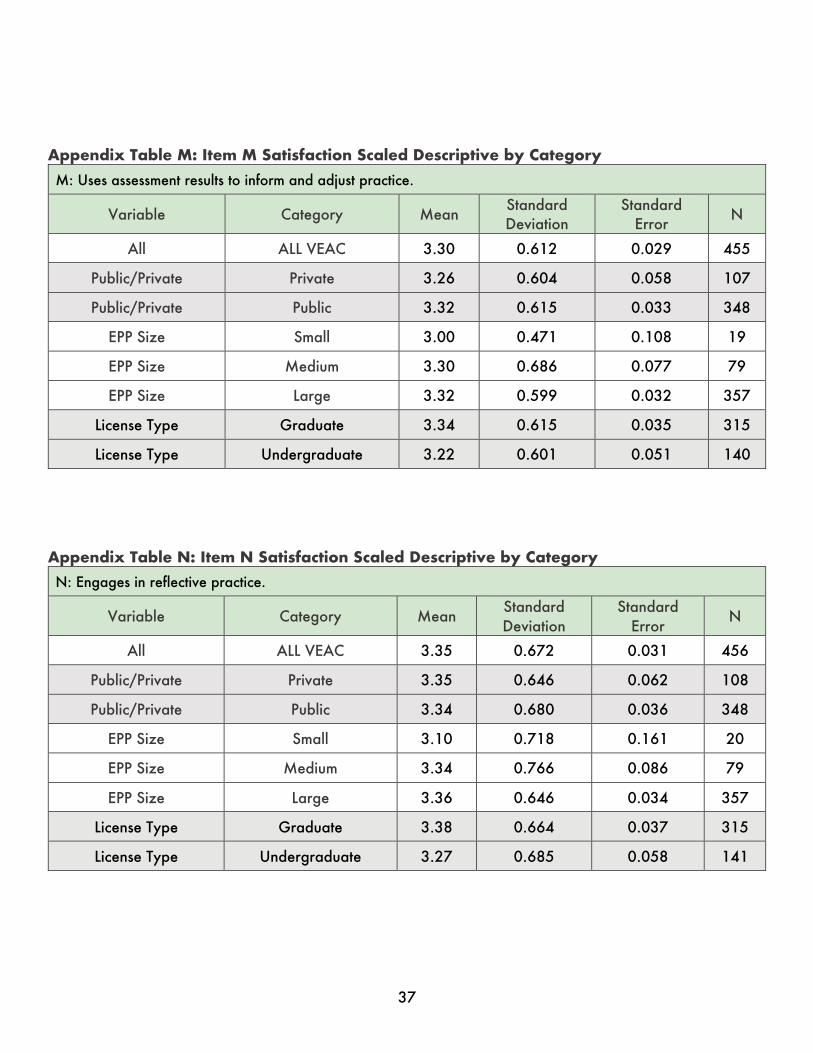
Appendix Table M: Item M Satisfaction Scaled Descriptive by Category
M: Uses assessment results to inform and adjust practice.
Variable Category Mean Standard Deviation
Standard Error
N
All ALL VEAC 3.30 0.612 0.029 455
Public/Private Private 3.26 0.604 0.058 107
Public/Private Public 3.32 0.615 0.033 348
EPP Size Small 3.00 0.471 0.108 19
EPP Size Medium 3.30 0.686 0.077 79
EPP Size Large 3.32 0.599 0.032 357
License Type Graduate 3.34 0.615 0.035 315
License Type Undergraduate 3.22 0.601 0.051 140
Appendix Table N: Item N Satisfaction Scaled Descriptive by Category
N: Engages in reflective practice.
Variable Category Mean Standard Deviation
Standard Error
N
All ALL VEAC 3.35 0.672 0.031 456
Public/Private Private 3.35 0.646 0.062 108
Public/Private Public 3.34 0.680 0.036 348
EPP Size Small 3.10 0.718 0.161 20
EPP Size Medium 3.34 0.766 0.086 79
EPP Size Large 3.36 0.646 0.034 357
License Type Graduate 3.38 0.664 0.037 315
License Type Undergraduate 3.27 0.685 0.058 141
38
Appendix C: Reliability, Correlations, Factor Analysis
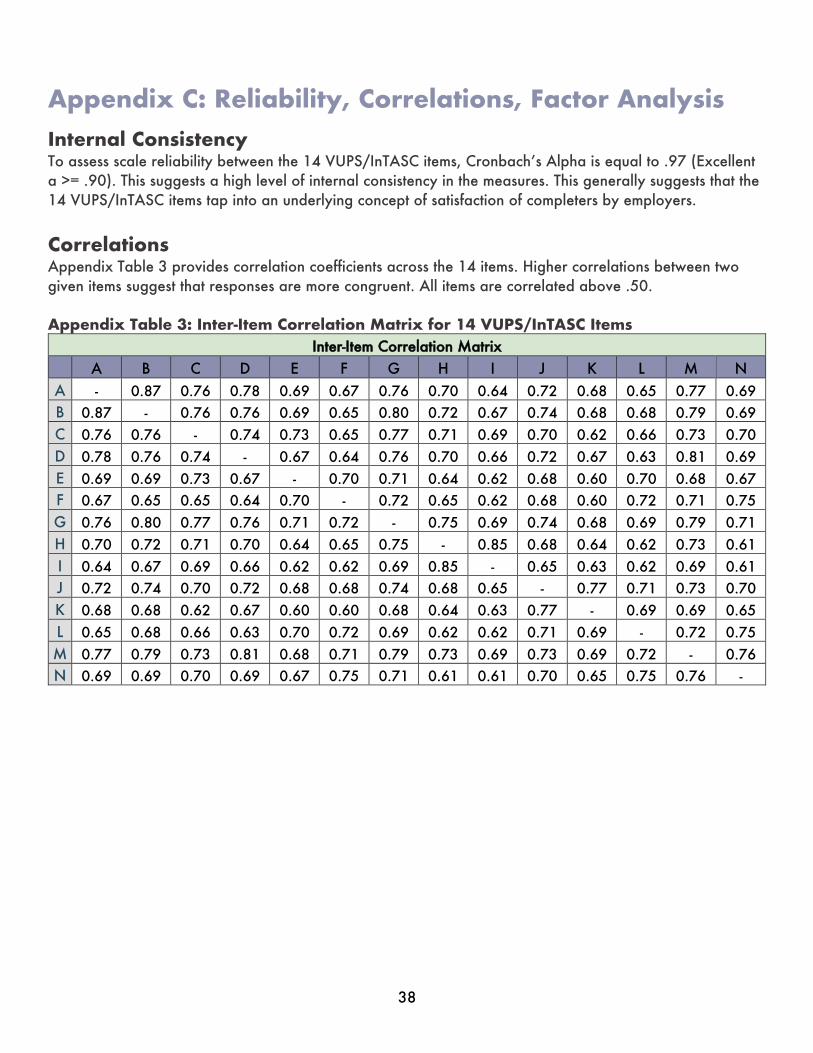
Internal Consistency To assess scale reliability between the 14 VUPS/InTASC items, Cronbach’s Alpha is equal to .97 (Excellent a >= .90). This suggests a high level of internal consistency in the measures. This generally suggests that the 14 VUPS/InTASC items tap into an underlying concept of satisfaction of completers by employers.
Correlations Appendix Table 3 provides correlation coefficients across the 14 items. Higher correlations between two given items suggest that responses are more congruent. All items are correlated above .50. Appendix Table 3: Inter-Item Correlation Matrix for 14 VUPS/InTASC Items
Inter-Item Correlation Matrix
A B C D E F G H I J K L M N
A - 0.87 0.76 0.78 0.69 0.67 0.76 0.70 0.64 0.72 0.68 0.65 0.77 0.69
B 0.87 - 0.76 0.76 0.69 0.65 0.80 0.72 0.67 0.74 0.68 0.68 0.79 0.69
C 0.76 0.76 - 0.74 0.73 0.65 0.77 0.71 0.69 0.70 0.62 0.66 0.73 0.70
D 0.78 0.76 0.74 - 0.67 0.64 0.76 0.70 0.66 0.72 0.67 0.63 0.81 0.69
E 0.69 0.69 0.73 0.67 - 0.70 0.71 0.64 0.62 0.68 0.60 0.70 0.68 0.67
F 0.67 0.65 0.65 0.64 0.70 - 0.72 0.65 0.62 0.68 0.60 0.72 0.71 0.75
G 0.76 0.80 0.77 0.76 0.71 0.72 - 0.75 0.69 0.74 0.68 0.69 0.79 0.71
H 0.70 0.72 0.71 0.70 0.64 0.65 0.75 - 0.85 0.68 0.64 0.62 0.73 0.61
I 0.64 0.67 0.69 0.66 0.62 0.62 0.69 0.85 - 0.65 0.63 0.62 0.69 0.61
J 0.72 0.74 0.70 0.72 0.68 0.68 0.74 0.68 0.65 - 0.77 0.71 0.73 0.70
K 0.68 0.68 0.62 0.67 0.60 0.60 0.68 0.64 0.63 0.77 - 0.69 0.69 0.65
L 0.65 0.68 0.66 0.63 0.70 0.72 0.69 0.62 0.62 0.71 0.69 - 0.72 0.75
M 0.77 0.79 0.73 0.81 0.68 0.71 0.79 0.73 0.69 0.73 0.69 0.72 - 0.76
N 0.69 0.69 0.70 0.69 0.67 0.75 0.71 0.61 0.61 0.70 0.65 0.75 0.76 -
39
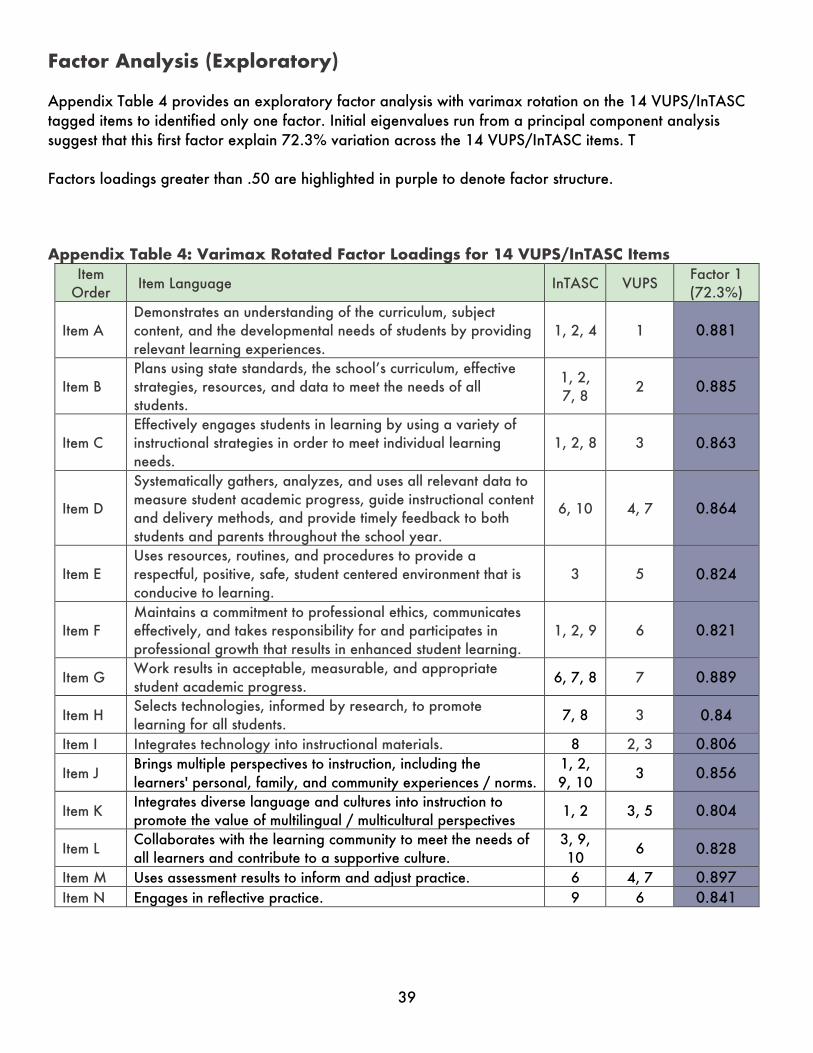
Factor Analysis (Exploratory)
Appendix Table 4 provides an exploratory factor analysis with varimax rotation on the 14 VUPS/InTASC tagged items to identified only one factor. Initial eigenvalues run from a principal component analysis suggest that this first factor explain 72.3% variation across the 14 VUPS/InTASC items. T Factors loadings greater than .50 are highlighted in purple to denote factor structure.
Appendix Table 4: Varimax Rotated Factor Loadings for 14 VUPS/InTASC Items Item
Order Item Language InTASC VUPS
Factor 1 (72.3%)
Item A Demonstrates an understanding of the curriculum, subject content, and the developmental needs of students by providing relevant learning experiences.
1, 2, 4 1 0.881
Item B Plans using state standards, the school’s curriculum, effective strategies, resources, and data to meet the needs of all students.
1, 2, 7, 8
2 0.885
Item C Effectively engages students in learning by using a variety of instructional strategies in order to meet individual learning needs.
1, 2, 8 3 0.863
Item D
Systematically gathers, analyzes, and uses all relevant data to measure student academic progress, guide instructional content and delivery methods, and provide timely feedback to both students and parents throughout the school year.
6, 10 4, 7 0.864
Item E Uses resources, routines, and procedures to provide a respectful, positive, safe, student centered environment that is conducive to learning.
3 5 0.824
Item F Maintains a commitment to professional ethics, communicates effectively, and takes responsibility for and participates in professional growth that results in enhanced student learning.
1, 2, 9 6 0.821
Item G Work results in acceptable, measurable, and appropriate student academic progress.
6, 7, 8 7 0.889
Item H Selects technologies, informed by research, to promote learning for all students.
7, 8 3 0.84
Item I Integrates technology into instructional materials. 8 2, 3 0.806
Item J Brings multiple perspectives to instruction, including the learners' personal, family, and community experiences / norms.
1, 2, 9, 10
3 0.856
Item K Integrates diverse language and cultures into instruction to promote the value of multilingual / multicultural perspectives
1, 2 3, 5 0.804
Item L Collaborates with the learning community to meet the needs of all learners and contribute to a supportive culture.
3, 9, 10
6 0.828
Item M Uses assessment results to inform and adjust practice. 6 4, 7 0.897 Item N Engages in reflective practice. 9 6 0.841
40
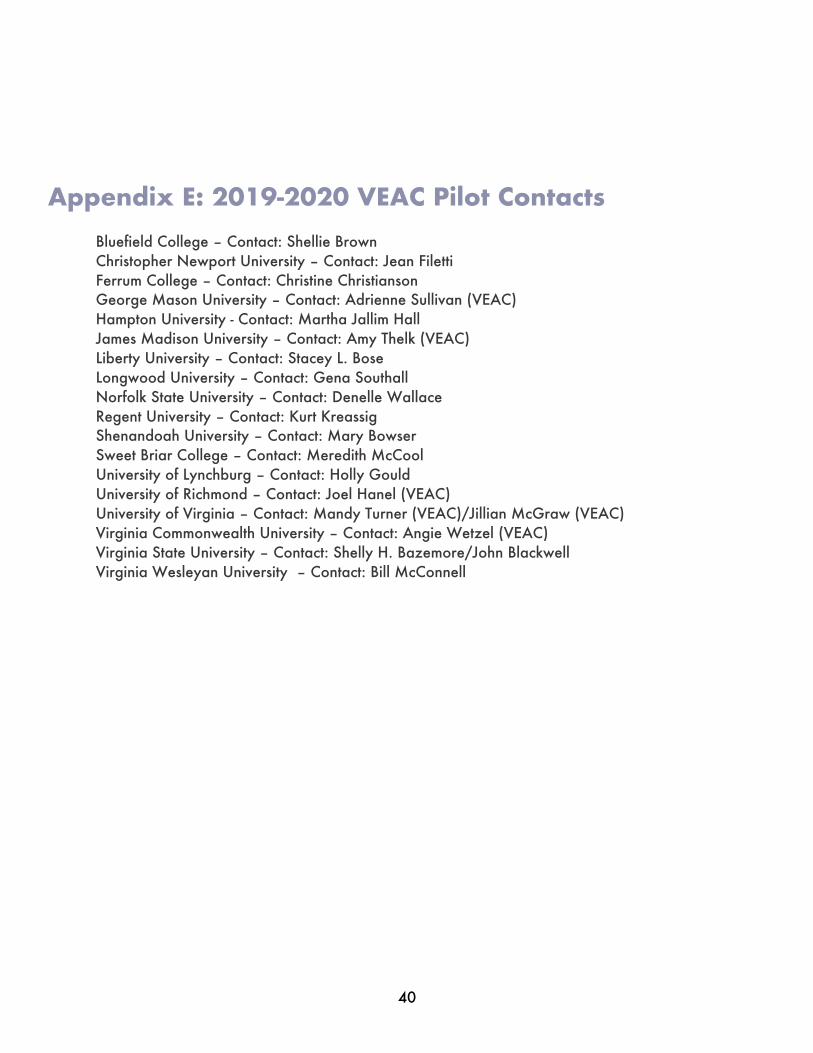
Appendix E: 2019-2020 VEAC Pilot Contacts
Bluefield College – Contact: Shellie Brown Christopher Newport University – Contact: Jean Filetti Ferrum College – Contact: Christine Christianson George Mason University – Contact: Adrienne Sullivan (VEAC) Hampton University - Contact: Martha Jallim Hall James Madison University – Contact: Amy Thelk (VEAC) Liberty University – Contact: Stacey L. Bose Longwood University – Contact: Gena Southall Norfolk State University – Contact: Denelle Wallace Regent University – Contact: Kurt Kreassig Shenandoah University – Contact: Mary Bowser Sweet Briar College – Contact: Meredith McCool University of Lynchburg – Contact: Holly Gould University of Richmond – Contact: Joel Hanel (VEAC) University of Virginia – Contact: Mandy Turner (VEAC)/Jillian McGraw (VEAC) Virginia Commonwealth University – Contact: Angie Wetzel (VEAC) Virginia State University – Contact: Shelly H. Bazemore/John Blackwell Virginia Wesleyan University – Contact: Bill McConnell

41