employer brand research 2018 country report hong kong.
53
employer brand research 2018 country report hong kong.
-
Upload
khangminh22 -
Category
Documents
-
view
0 -
download
0
Transcript of employer brand research 2018 country report hong kong.

employer brand research 2018
country report hong kong.
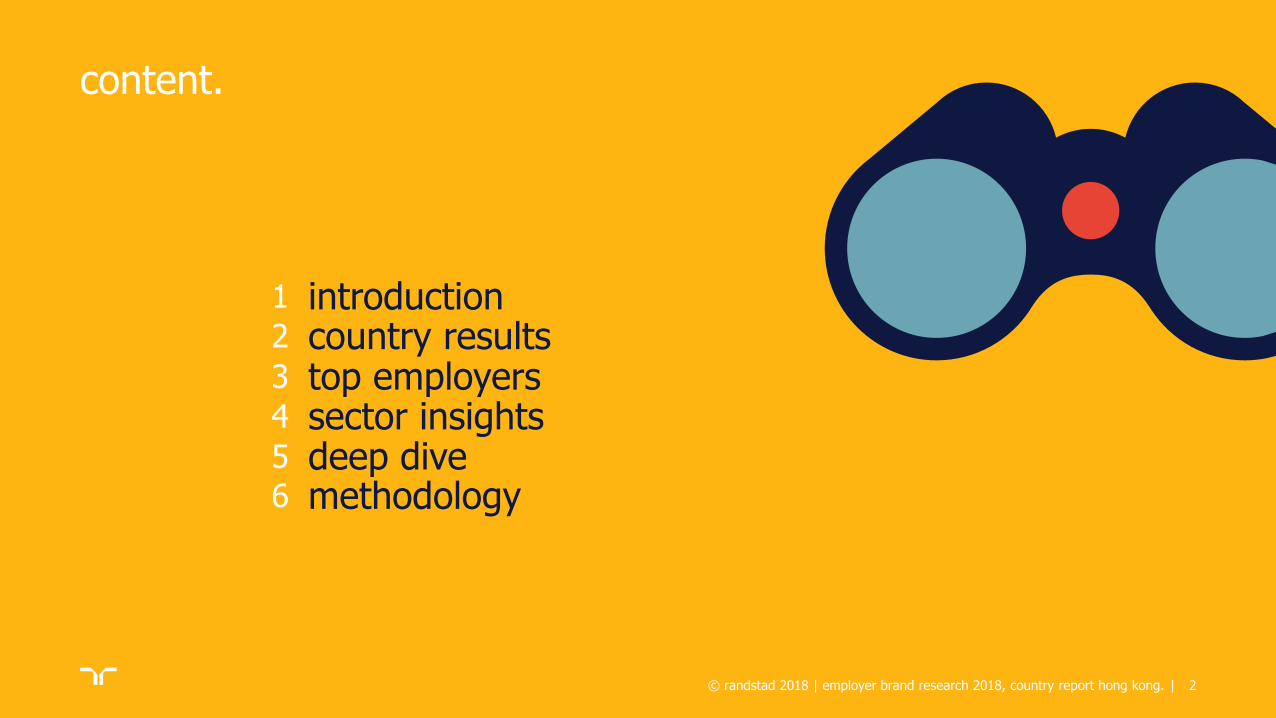
content.
introduction 1
country results 2
top employers 3
sector insights 4
deep dive 5
| 2 © randstad 2018 | employer brand research 2018, country report hong kong.
methodology 6

|
introduction.
3 © randstad 2018 | employer brand research 2018, country report hong kong.
| |
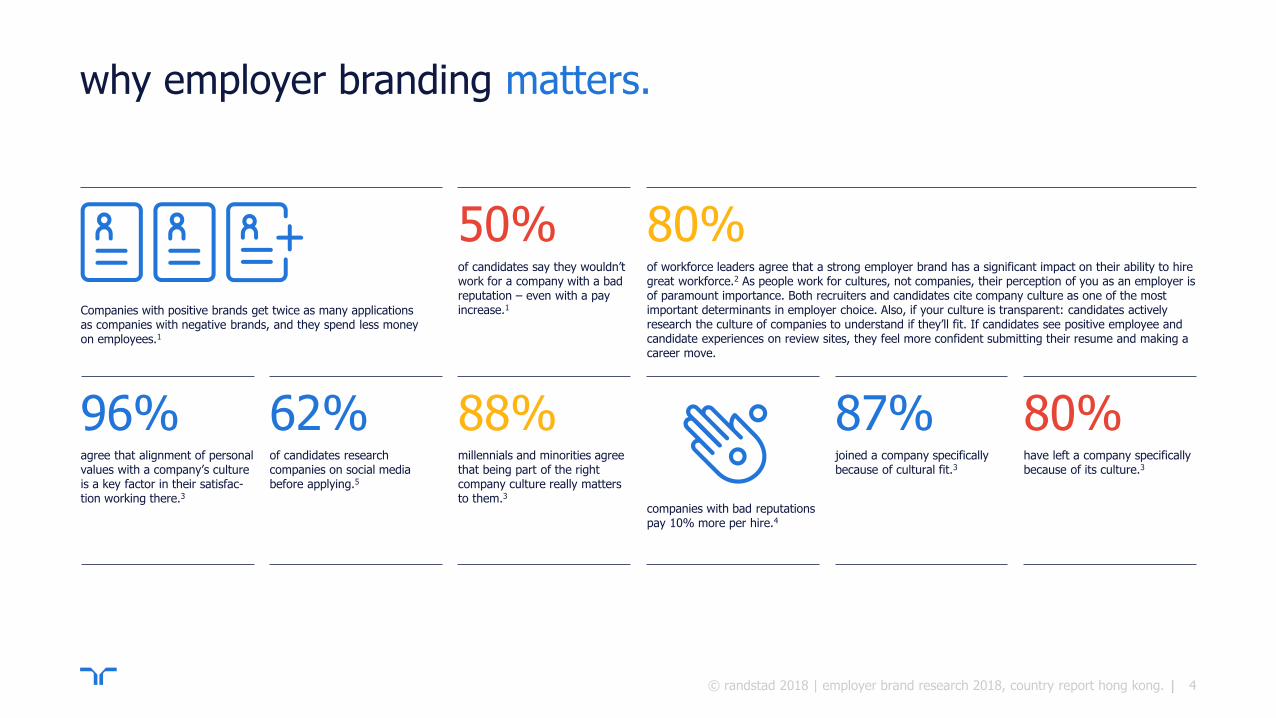
why employer branding matters.
Companies with positive brands get twice as many applications as companies with negative brands, and they spend less money on employees.1
agree that alignment of personal values with a company’s culture is a key factor in their satisfac-tion working there.3
of candidates research companies on social media before applying.5
millennials and minorities agree that being part of the right company culture really matters to them.3
of candidates say they wouldn’t work for a company with a bad reputation – even with a pay increase.1
of workforce leaders agree that a strong employer brand has a significant impact on their ability to hire great workforce.2 As people work for cultures, not companies, their perception of you as an employer is of paramount importance. Both recruiters and candidates cite company culture as one of the most important determinants in employer choice. Also, if your culture is transparent: candidates actively research the culture of companies to understand if they’ll fit. If candidates see positive employee and candidate experiences on review sites, they feel more confident submitting their resume and making a career move.
joined a company specifically because of cultural fit.3
have left a company specifically because of its culture.3
companies with bad reputations pay 10% more per hire.4
50% 80%
96% 62% 88% 87% 80%
4 © randstad 2018 | employer brand research 2018, country report hong kong.
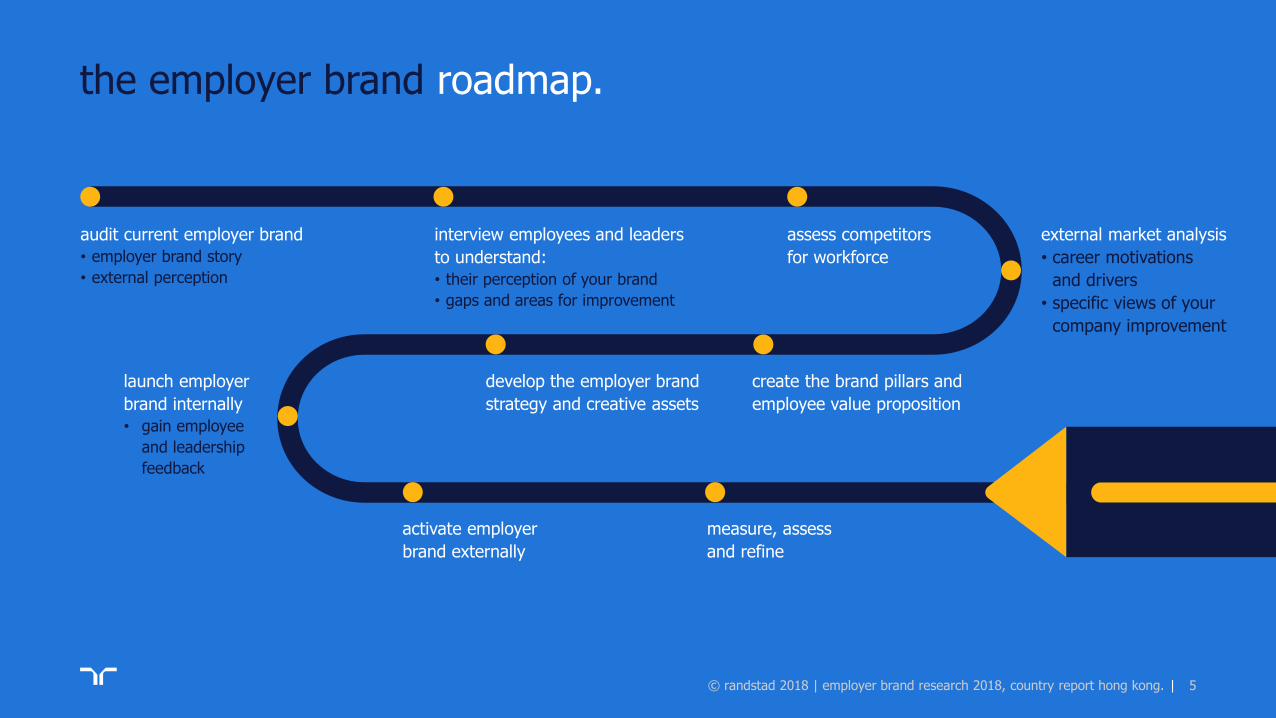
the employer brand roadmap.
|
audit current employer brand
• employer brand story
• external perception
interview employees and leaders
to understand:
• their perception of your brand
• gaps and areas for improvement
assess competitors
for workforce
create the brand pillars and
employee value proposition
develop the employer brand
strategy and creative assets
measure, assess
and refine
activate employer
brand externally
launch employer
brand internally
• gain employee
and leadership
feedback
external market analysis
• career motivations
and drivers
• specific views of your
company improvement
5 © randstad 2018 | employer brand research 2018, country report hong kong.
| |
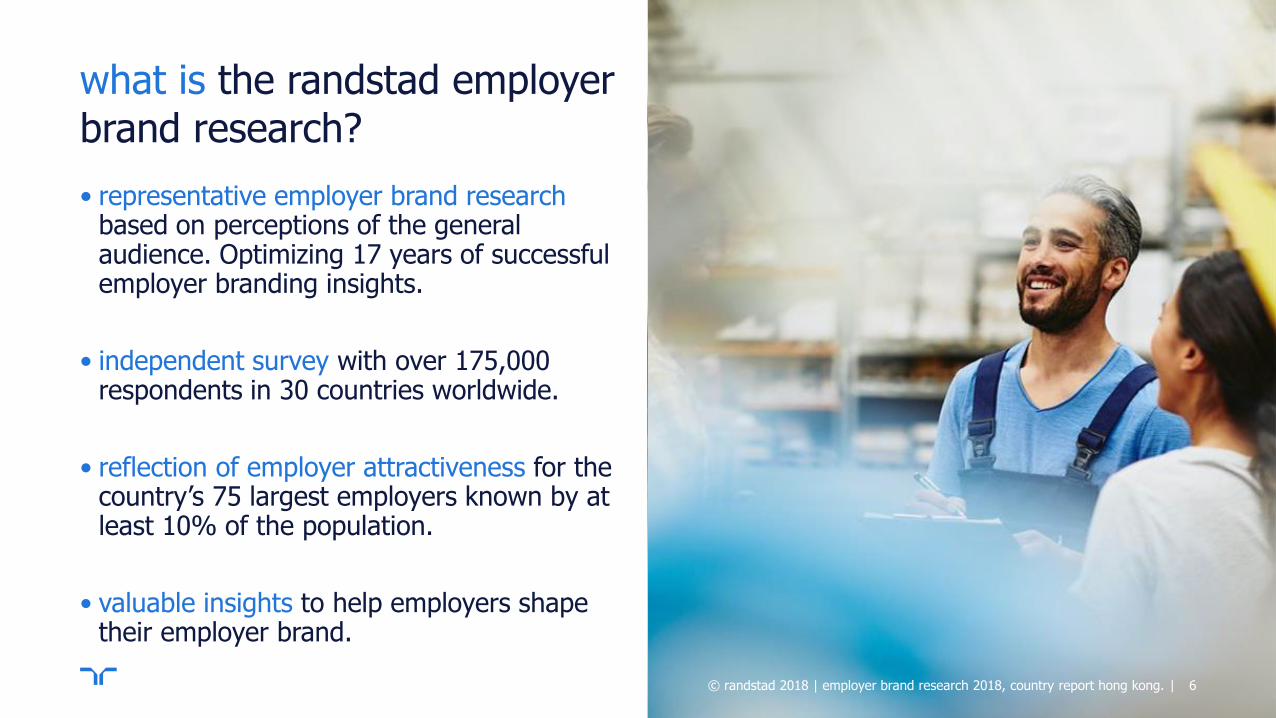
what is the randstad employer brand research?
• representative employer brand research based on perceptions of the general audience. Optimizing 17 years of successful employer branding insights.
• independent survey with over 175,000 respondents in 30 countries worldwide.
• reflection of employer attractiveness for the country’s 75 largest employers known by at least 10% of the population.
• valuable insights to help employers shape their employer brand.
6 © randstad 2018 | employer brand research 2018, country report hong kong.

30 countries surveyed covering more than 75% of the global economy.
|
Austria
Australia
Argentina
Belgium
Brazil
Canada
China
Czech Republic
Dubai
France
Germany
Greece
Hong Kong
Hungary
Italy
India
Japan
Luxembourg
Malaysia
New Zealand
Netherlands
Poland
Portugal
Russia
Singapore
Spain
Sweden
Switzerland
UK
USA countries surveyed
7
worldwide
• over 175,000 respondents
• 5,755 companies surveyed
sample
• aged 18 to 65
• representative on gender
• overrepresentated on age 25 – 44
• comprised of students, employed
and unemployed workforce
Country
fieldwork
length of interview
• 4295 respondents
• online interviews
• between 15 november and 14 december 2017
• 16 minutes
© randstad 2018 | employer brand research 2018, country report hong kong.
| |
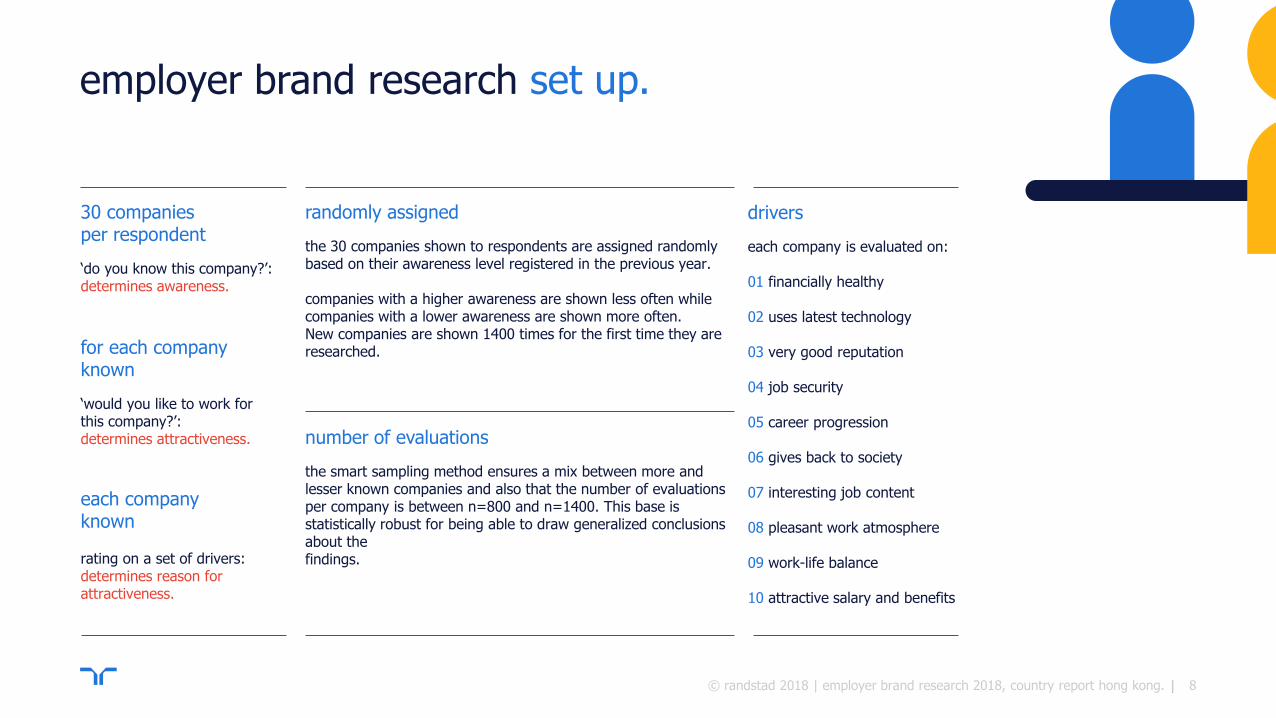
employer brand research set up.
drivers
each company is evaluated on: 01 financially healthy 02 uses latest technology 03 very good reputation 04 job security 05 career progression 06 gives back to society 07 interesting job content 08 pleasant work atmosphere 09 work-life balance 10 attractive salary and benefits
randomly assigned
the 30 companies shown to respondents are assigned randomly based on their awareness level registered in the previous year. companies with a higher awareness are shown less often while companies with a lower awareness are shown more often. New companies are shown 1400 times for the first time they are researched.
number of evaluations
the smart sampling method ensures a mix between more and lesser known companies and also that the number of evaluations per company is between n=800 and n=1400. This base is statistically robust for being able to draw generalized conclusions about the findings.
30 companies per respondent
‘do you know this company?’: determines awareness.
for each company known
‘would you like to work for this company?’: determines attractiveness.
each company known rating on a set of drivers: determines reason for attractiveness.
8 © randstad 2018 | employer brand research 2018, country report hong kong.
| |
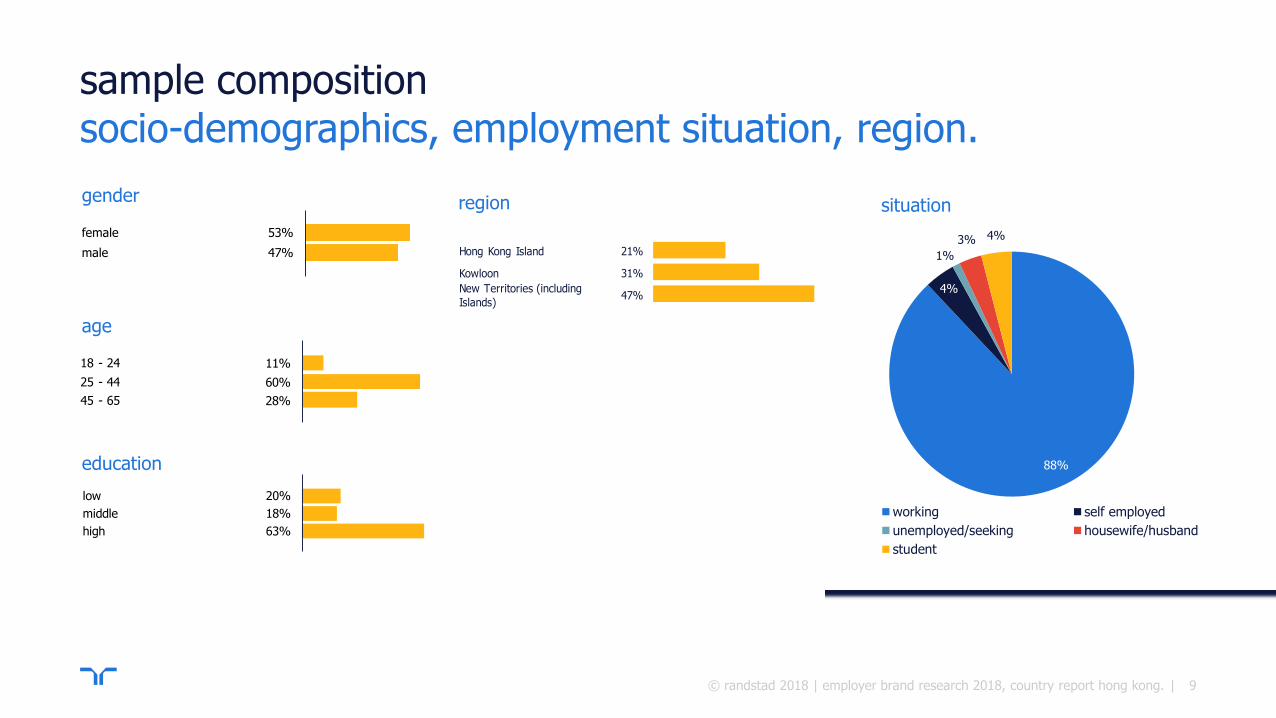
53%
47%
female
male
20%
18%
63%
low
middle
high
11%
60%
28%
18 - 24
25 - 44
45 - 65
sample composition socio-demographics, employment situation, region.
gender
age
education
9
situation
© randstad 2018 | employer brand research 2018, country report hong kong.
88%
4%
1%
3% 4%
working self employed
unemployed/seeking housewife/husband
student
1
21%Hong Kong Island
31%Kowloon
47%New Territories (including
Islands)
region
| |
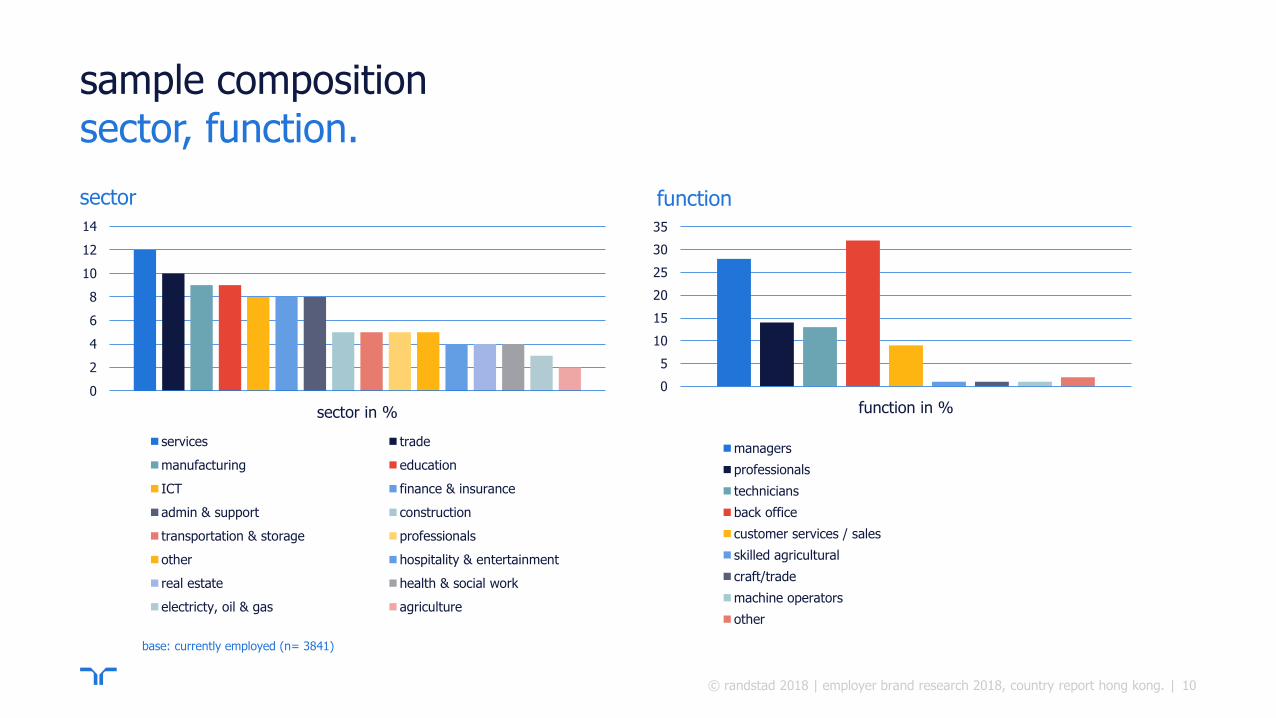
sample composition sector, function.
sector
10
1
agriculture 2%
oil & gas 1%
manufacturing 9%
electricity & gas supply 2%
water supply & sewage 1%
construction 5%
trade 10%
transportation & storage 5%
accommodation & food 2%
ICT 8%
finance & insurance 8%
real estate 4%
professional & scientific 5%
administration & support 8%
public administration 3%
education 9%
human health/social work 4%
arts & entertainment 2%
international organizations 1%
services 12%
© randstad 2018 | employer brand research 2018, country report hong kong.
0
2
4
6
8
10
12
14
sector in %
services trade
manufacturing education
ICT finance & insurance
admin & support construction
transportation & storage professionals
other hospitality & entertainment
real estate health & social work
electricty, oil & gas agriculture
function
base: currently employed (n= 3841)
0
5
10
15
20
25
30
35
function in %
managers
professionals
technicians
back office
customer services / sales
skilled agricultural
craft/trade
machine operators
other
| |
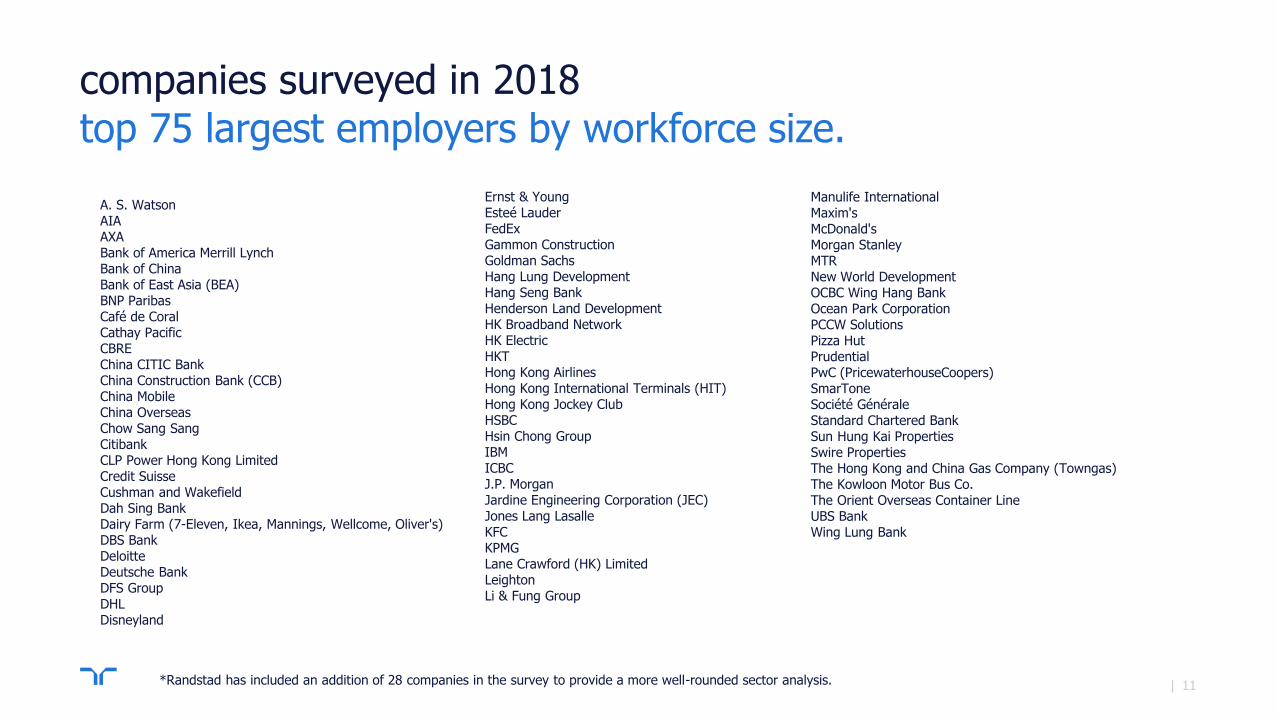
companies surveyed in 2018 top 75 largest employers by workforce size.
11
A. S. Watson AIA AXA Bank of America Merrill Lynch Bank of China Bank of East Asia (BEA) BNP Paribas Café de Coral Cathay Pacific CBRE China CITIC Bank China Construction Bank (CCB) China Mobile China Overseas Chow Sang Sang Citibank CLP Power Hong Kong Limited Credit Suisse Cushman and Wakefield Dah Sing Bank Dairy Farm (7-Eleven, Ikea, Mannings, Wellcome, Oliver's) DBS Bank Deloitte Deutsche Bank DFS Group DHL Disneyland
Ernst & Young Esteé Lauder FedEx Gammon Construction Goldman Sachs Hang Lung Development Hang Seng Bank Henderson Land Development HK Broadband Network HK Electric HKT Hong Kong Airlines Hong Kong International Terminals (HIT) Hong Kong Jockey Club HSBC Hsin Chong Group IBM ICBC J.P. Morgan Jardine Engineering Corporation (JEC) Jones Lang Lasalle KFC KPMG Lane Crawford (HK) Limited Leighton Li & Fung Group
Manulife International Maxim's McDonald's Morgan Stanley MTR New World Development OCBC Wing Hang Bank Ocean Park Corporation PCCW Solutions Pizza Hut Prudential PwC (PricewaterhouseCoopers) SmarTone Société Générale Standard Chartered Bank Sun Hung Kai Properties Swire Properties The Hong Kong and China Gas Company (Towngas) The Kowloon Motor Bus Co. The Orient Overseas Container Line UBS Bank Wing Lung Bank
*Randstad has included an addition of 28 companies in the survey to provide a more well-rounded sector analysis.
|
country
results.
12 © randstad 2018 | employer brand research 2018, country report hong kong.
| |
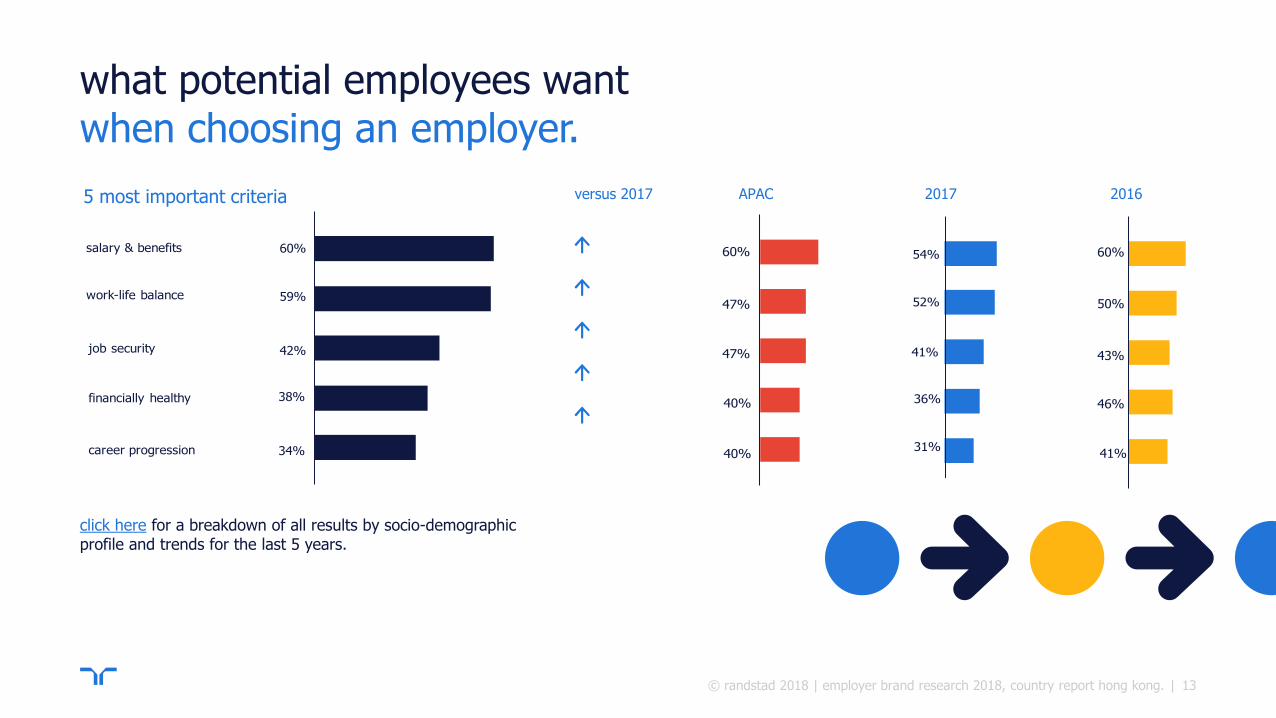
60%
34%
38%
42%
59%
salary & benefits
career progression
financially healthy
job security
work-life balance
what potential employees want when choosing an employer.
click here for a breakdown of all results by socio-demographic profile and trends for the last 5 years.
2017 2016 versus 2017
13
5 most important criteria
60%
40%
40%
47%
47%
54%
31%
36%
41%
52%
60%
41%
46%
43%
50%
APAC
© randstad 2018 | employer brand research 2018, country report hong kong.
| |
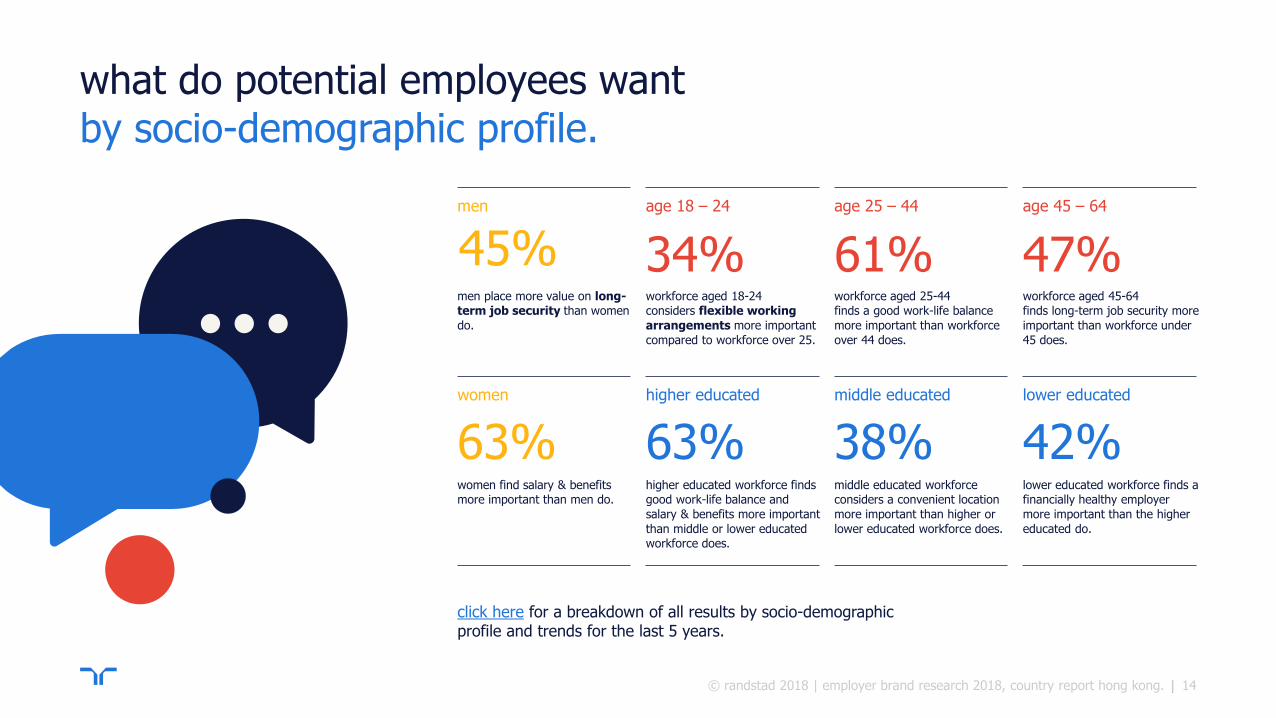
what do potential employees want by socio-demographic profile.
men place more value on long-term job security than women
do.
45%
workforce aged 18-24 considers flexible working
arrangements more important
compared to workforce over 25.
34%
workforce aged 25-44 finds a good work-life balance
more important than workforce
over 44 does.
61%
workforce aged 45-64 finds long-term job security more
important than workforce under
45 does.
47%
women find salary & benefits more important than men do.
63%
higher educated workforce finds good work-life balance and
salary & benefits more important
than middle or lower educated workforce does.
63%
middle educated workforce considers a convenient location
more important than higher or
lower educated workforce does.
38%
lower educated workforce finds a financially healthy employer
more important than the higher
educated do.
42%
men
women
age 18 – 24
higher educated
age 25 – 44
middle educated
age 45 – 64
lower educated
click here for a breakdown of all results by socio-demographic profile and trends for the last 5 years.
14 © randstad 2018 | employer brand research 2018, country report hong kong.
| |
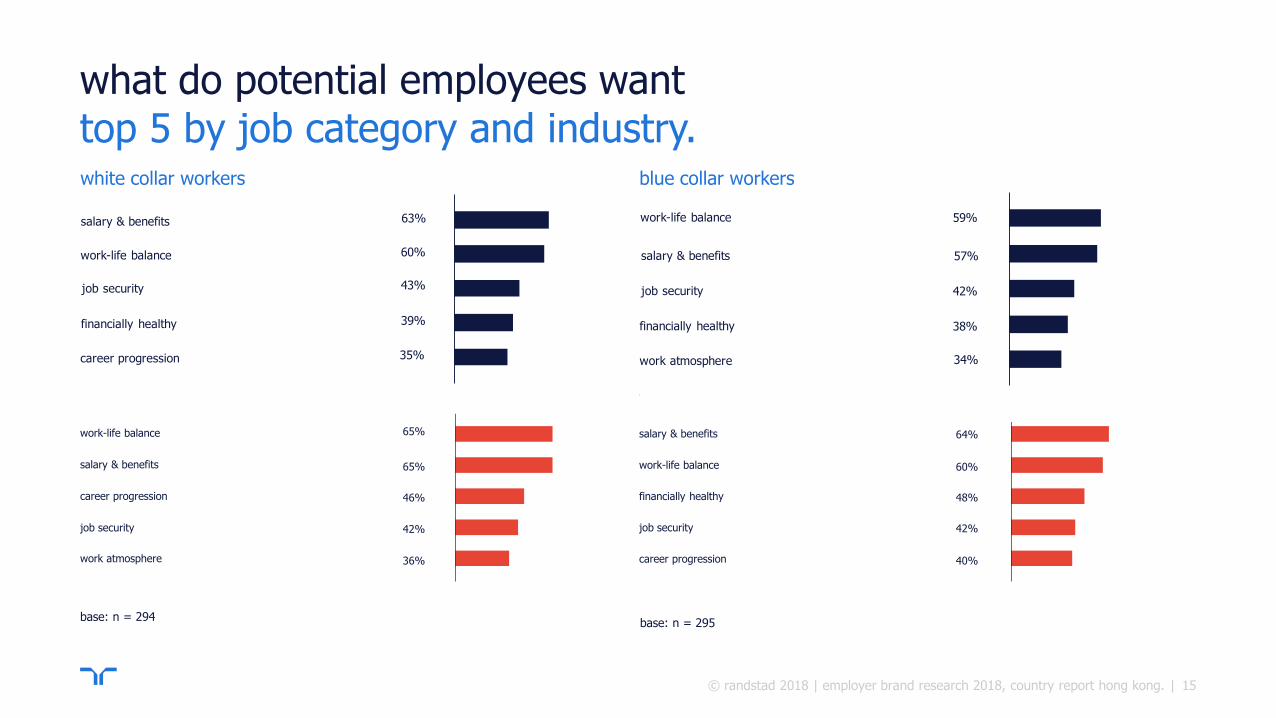
work atmosphere
65%
65%
46%
42%
36%
work-life balance
salary & benefits
career progression
job security
64%
60%
48%
42%
40%
salary & benefits
work-life balance
financially healthy
job security
career progression
what do potential employees want top 5 by job category and industry.
blue collar workers white collar workers
information and communication (ICT) financial and insurance activities
base: n = 294 base: n = 295
15
63%
60%
43%
39%
35%
salary & benefits
job security
work-life balance
financially healthy
career progression
59%
57%
42%
38%
34%
work-life balance
job security
salary & benefits
financially healthy
work atmosphere
© randstad 2018 | employer brand research 2018, country report hong kong.
| |
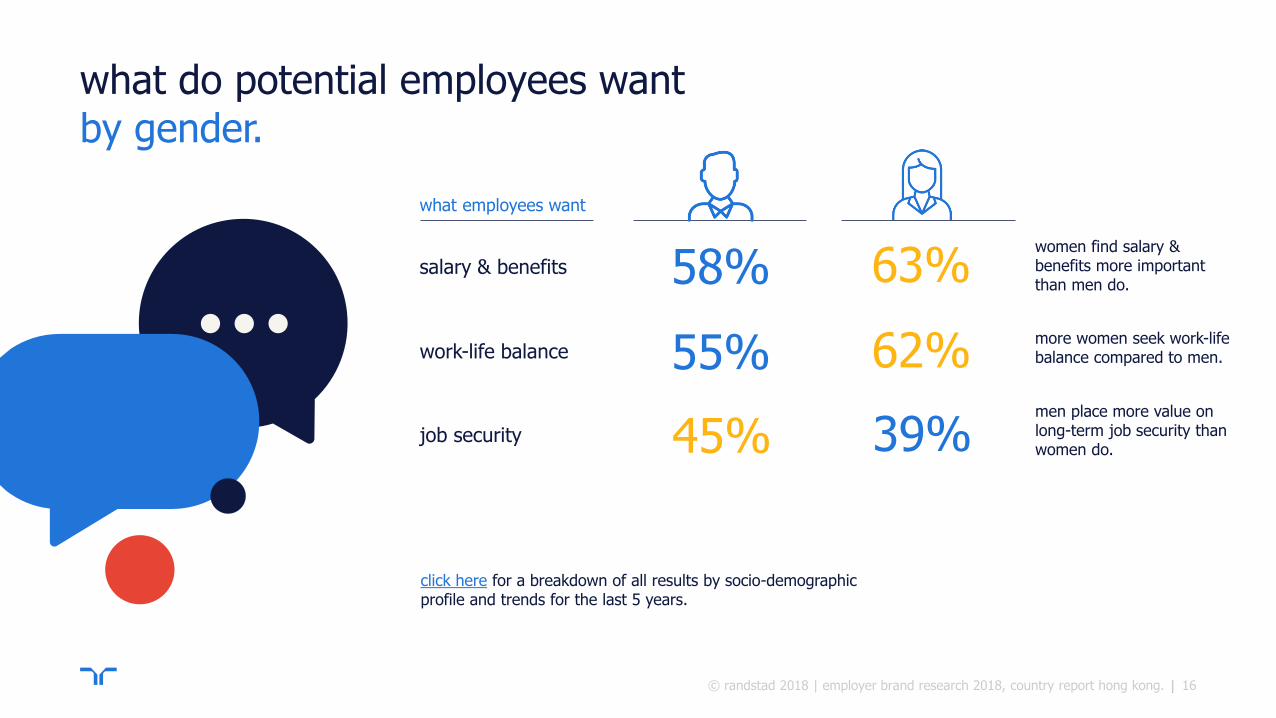
what do potential employees want by gender.
click here for a breakdown of all results by socio-demographic profile and trends for the last 5 years.
16 © randstad 2018 | employer brand research 2018, country report hong kong.
what employees want
58% 63%
55% 62%
45% 39%
women find salary & benefits more important than men do.
more women seek work-life balance compared to men.
men place more value on long-term job security than women do.
salary & benefits
work-life balance
job security
| |
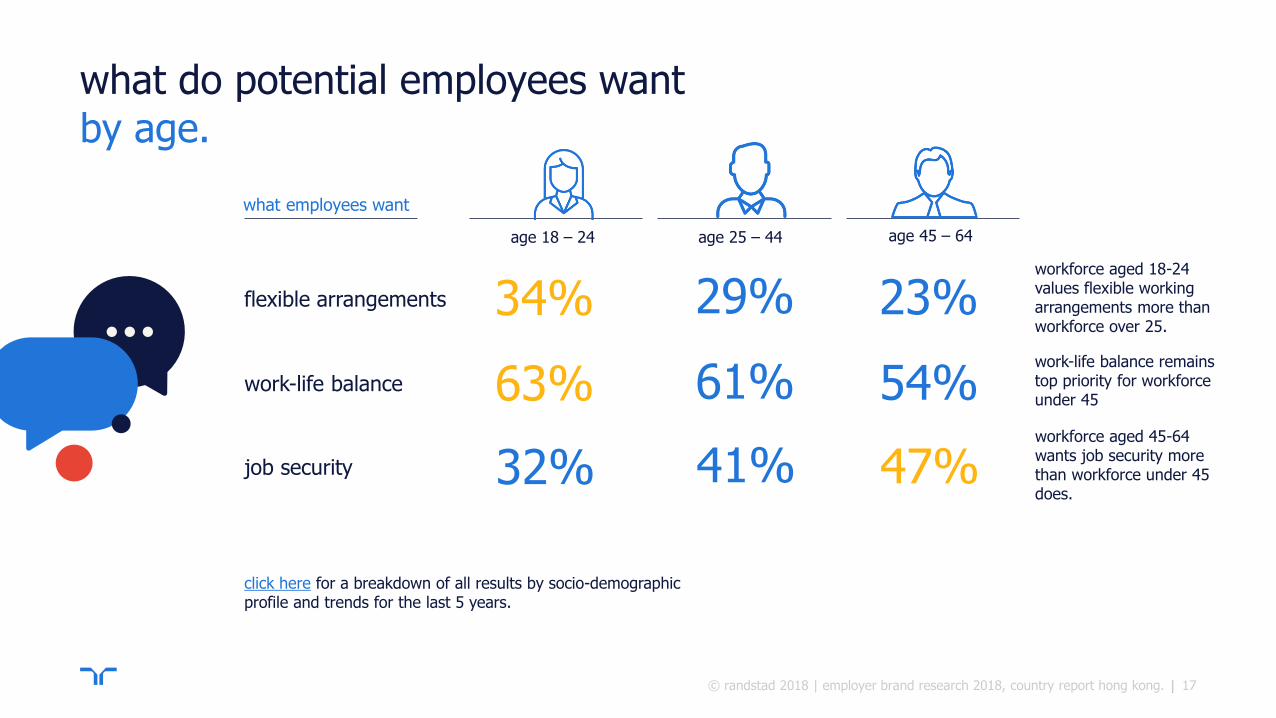
what do potential employees want by age.
click here for a breakdown of all results by socio-demographic profile and trends for the last 5 years.
17 © randstad 2018 | employer brand research 2018, country report hong kong.
what employees want
flexible arrangements 34% 29%
63% 61%
32% 41%
age 18 – 24 age 25 – 44 age 45 – 64
23%
54%
47%
workforce aged 18-24 values flexible working arrangements more than workforce over 25.
work-life balance remains top priority for workforce under 45
workforce aged 45-64 wants job security more than workforce under 45 does.
work-life balance
job security
| |
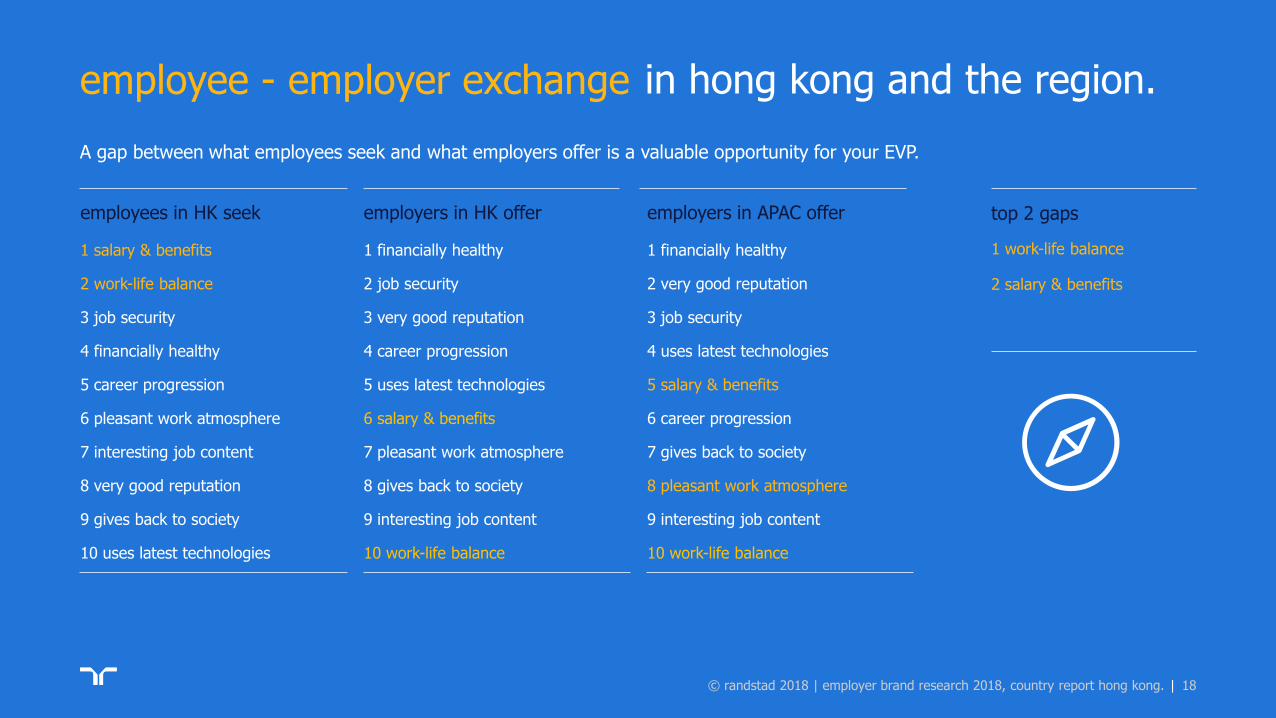
employee - employer exchange
A gap between what employees seek and what employers offer is a valuable opportunity for your EVP.
| 18
in hong kong and the region.
© randstad 2018 | employer brand research 2018, country report hong kong.
employees in HK seek employers in HK offer employers in APAC offer
1 salary & benefits 1 financially healthy 1 financially healthy
2 work-life balance 2 job security 2 very good reputation
3 job security 3 very good reputation 3 job security
4 financially healthy 4 career progression 4 uses latest technologies
5 career progression 5 uses latest technologies 5 salary & benefits
6 pleasant work atmosphere 6 salary & benefits 6 career progression
7 interesting job content 7 pleasant work atmosphere 7 gives back to society
8 very good reputation 8 gives back to society 8 pleasant work atmosphere
9 gives back to society 9 interesting job content 9 interesting job content
10 uses latest technologies 10 work-life balance 10 work-life balance
top 2 gaps
1 work-life balance
2 salary & benefits
| |
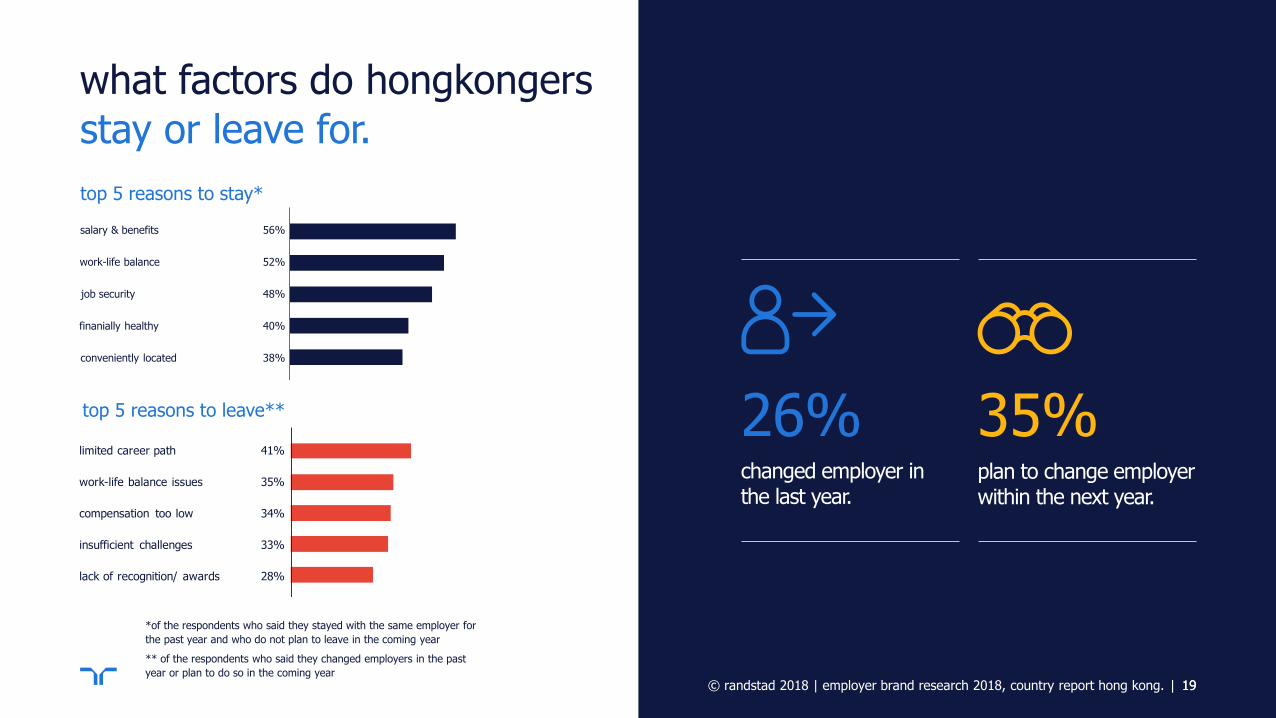
26% 35% changed employer in the last year.
plan to change employer within the next year.
19 | 19
55%
49%
42%
36%
39%
35%
37%
34%
30%
27%
job boards (eg. jobsdb, ctgoodjobs, efinancial
careers etc)
job aggregators (eg recruit.net, indeed.com.hk,
jobs.com.hk)
recruiters (agencies/headhunters)
company career site
personal connections / referrals
plan to change employer changed employer
© randstad 2018 | employer brand research 2018, country report hong kong.
what factors do hongkongers
top 5 reasons to stay*
top 5 reasons to leave**
*of the respondents who said they stayed with the same employer for
the past year and who do not plan to leave in the coming year
** of the respondents who said they changed employers in the past
year or plan to do so in the coming year
41%
35%
34%
33%
28%
limited career path
work-life balance issues
compensation too low
insufficient challenges
lack of recognition/ awards
stay or leave for.
56%
52%
48%
40%
38%
salary & benefits
job security
work-life balance
finanially healthy
conveniently located
| |
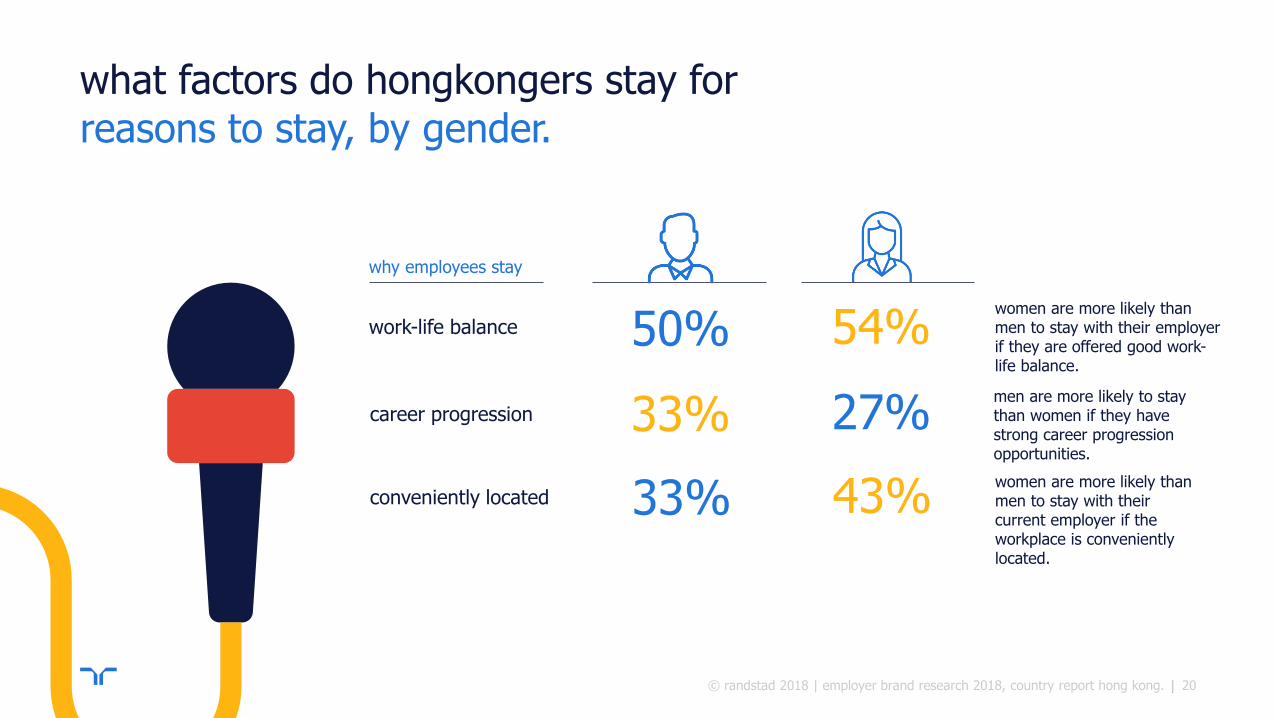
what factors do hongkongers stay for
20
reasons to stay, by gender.
© randstad 2018 | employer brand research 2018, country report hong kong.
why employees stay
50% 54%
33% 27%
33% 43%
women are more likely than men to stay with their employer if they are offered good work-life balance.
men are more likely to stay than women if they have strong career progression opportunities.
women are more likely than men to stay with their current employer if the workplace is conveniently located.
work-life balance
career progression
conveniently located
| | 21
reasons to stay, by age.
© randstad 2018 | employer brand research 2018, country report hong kong.
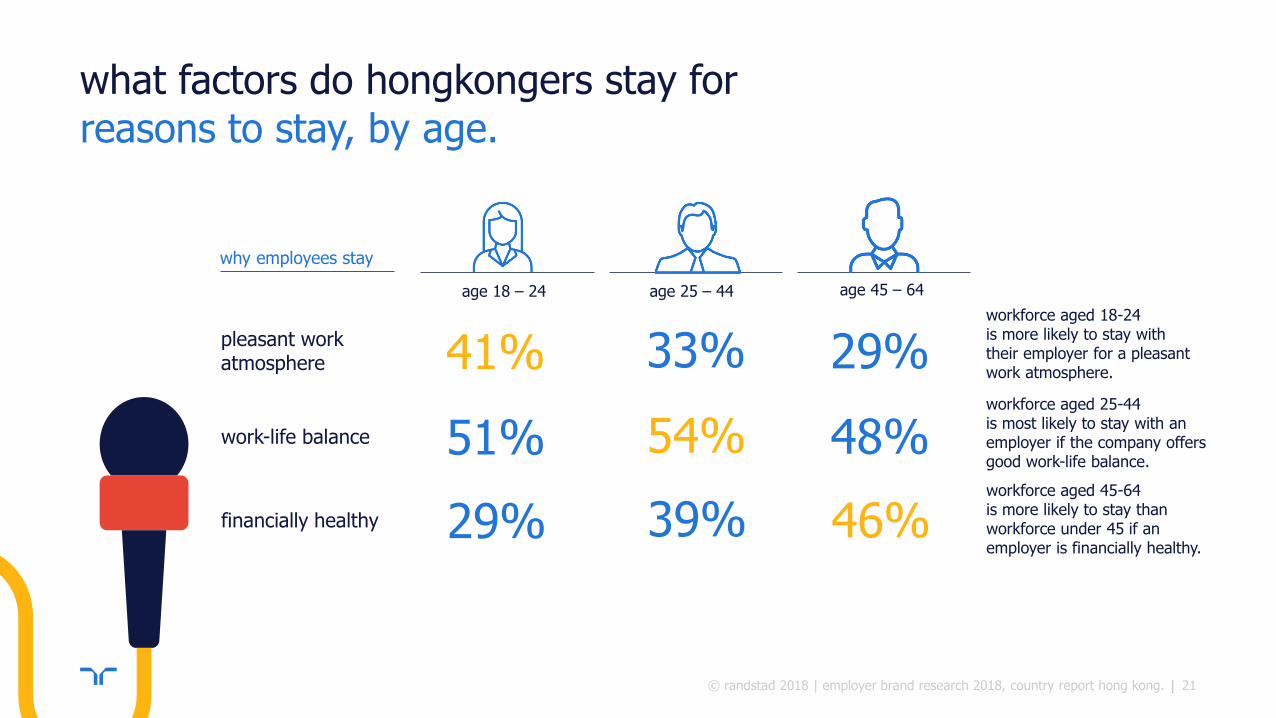
why employees stay
pleasant work atmosphere 41% 33%
51% 54%
29% 39%
age 18 – 24 age 25 – 44 age 45 – 64
29%
48%
46%
workforce aged 18-24 is more likely to stay with their employer for a pleasant work atmosphere.
workforce aged 25-44 is most likely to stay with an employer if the company offers good work-life balance.
workforce aged 45-64 is more likely to stay than workforce under 45 if an employer is financially healthy.
work-life balance
financially healthy
what factors do hongkongers stay for

| | 22
reasons to leave, by gender.
© randstad 2018 | employer brand research 2018, country report hong kong.
why employees leave
32% 36%
30% 26%
41% 41%
women are more likely to leave their employer if they believe their compensation is too low.
men are more likely than women to leave because of a lack of recognition or rewards.
both men and women are equally likely to leave if there is lack of career progression opportunities
what factors do hongkongers leave for
low compensation
lack of recognition and rewards
lack of career progression

| | 23
reasons to leave, by age.
© randstad 2018 | employer brand research 2018, country report hong kong.
what factors do hongkongers leave for
lack interest in my job 41% 32%
34% 33%
16% 27%
age 18 – 24 age 25 – 44 age 45 – 64
31%
39%
29%
workforce aged 18-24 is more likely to leave than workforce over 25 because of insufficient challenges.
workforce aged 45-64 is more likely to leave because of work-life balance issues than workforce aged 25-44 does.
workforce over 25 is most likely to leave because of poor leadership.
work-life balance
poor leadership
why employees leave
| | 24
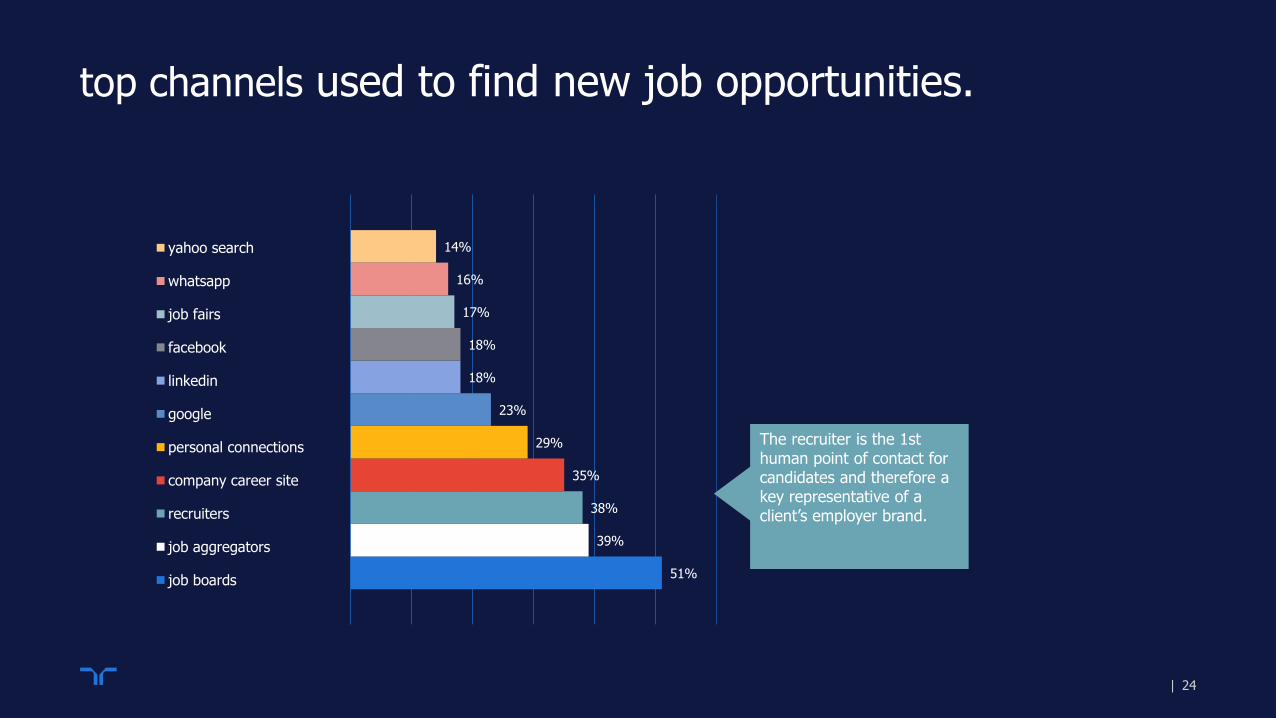
top channels used to find new job opportunities.
51%
39%
38%
35%
29%
23%
18%
18%
17%
16%
14%
0% 10% 20% 30% 40% 50% 60%
yahoo search
job fairs
personal connections
company career site
recruiters
job aggregators
job boards
The recruiter is the 1st human point of contact for candidates and therefore a key representative of a client’s employer brand.
| | 25
0
10
20
30
40
50
60
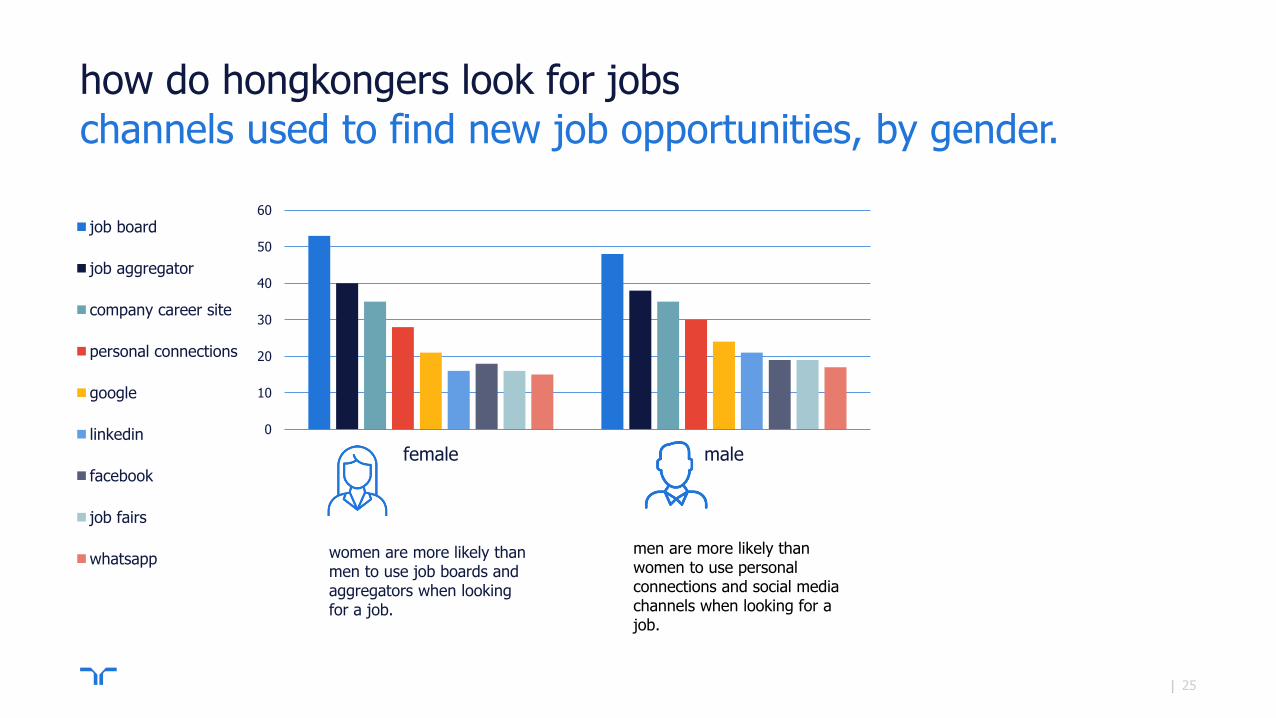
female male
job board
job aggregator
company career site
personal connections
job fairs
whatsapp women are more likely than men to use job boards and aggregators when looking for a job.
men are more likely than women to use personal connections and social media channels when looking for a job.
how do hongkongers look for jobs
channels used to find new job opportunities, by gender.

| | 26
0
10
20
30
40
50
60
age 18-24 age 25-44 age 45+
job board
job aggregator
recruiter
company career site
personal connections
job fairs
whatsappworkforce aged 18-24 are more likely to use google, facebook and whatsapp than workforce over 25.
workforce aged 25-44 are more likely to use linkedin than workforce below age 25 and above 45.
workforce aged 45+ are more likely to rely on a recruiter than workforce aged below 45.
how do hongkongers look for jobs
channels used to find new job opportunities, by age.
| |
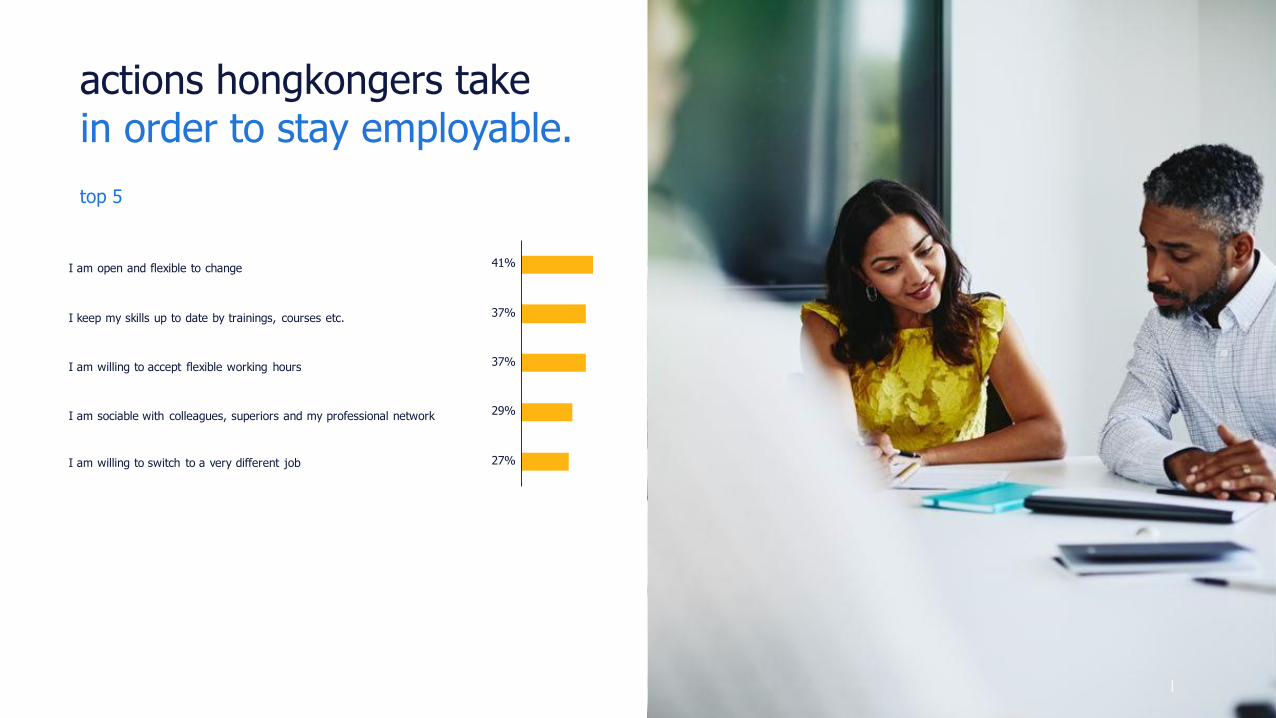
actions hongkongers take
27
41%
37%
37%
29%
27%
I am open and flexible to change
I keep my skills up to date by trainings, courses etc.
I am willing to accept flexible working hours
I am sociable with colleagues, superiors and my professional network
I am willing to switch to a very different job
top 5
in order to stay employable.
© randstad 2018 | employer brand research 2018, country report hong kong.

| |
actions hongkongers take in order to stay employable
28
staying engaged as an employee, by gender.
© randstad 2018 | employer brand research 2018, country report hong kong.
how employees stay employable
40% 35%
30% 21%
39% 43%
men are more likely than women to keep their skills up to date by training, courses etc.
men are more likely than women to adopt the latest techniques and technologies.
women are more likely than men to be open and flexible to change.
I keep my skills up to date by trainings, courses etc.
I adopt the latest techniques and technologies.
I’m open and flexible to change.
| |
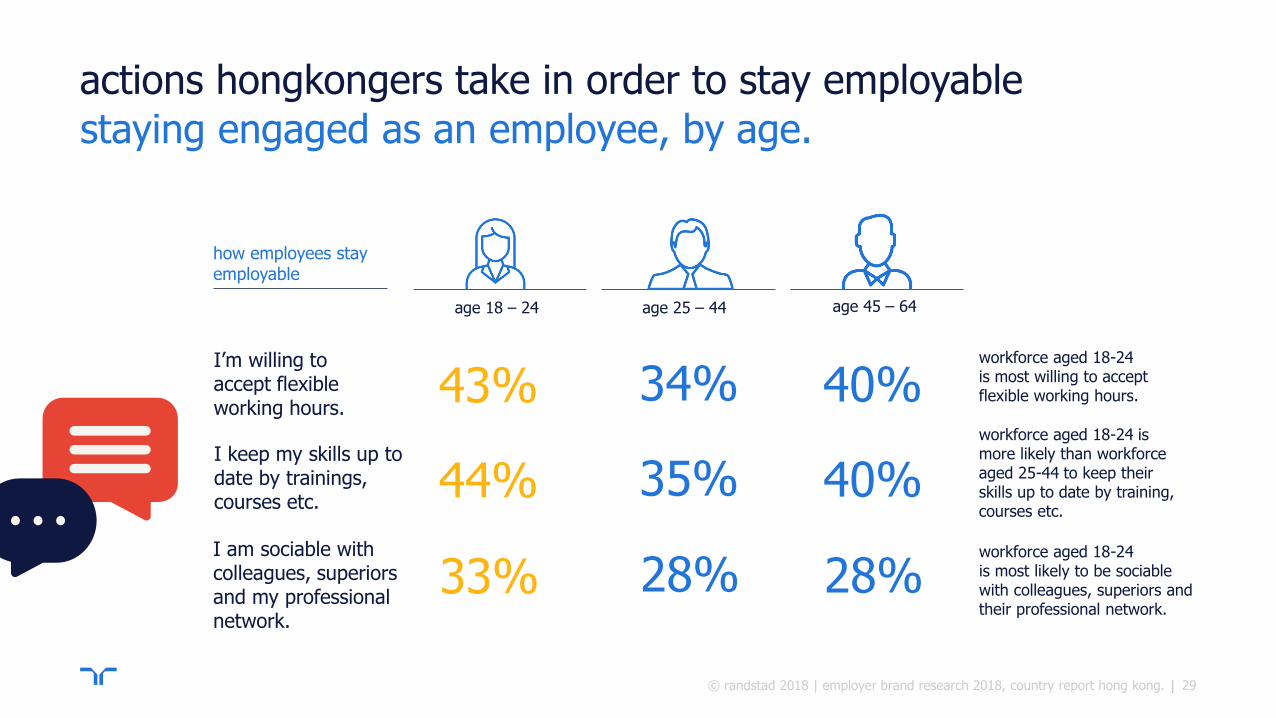
actions hongkongers take in order to stay employable
29
staying engaged as an employee, by age.
© randstad 2018 | employer brand research 2018, country report hong kong.
I’m willing to accept flexible working hours.
43% 34%
44% 35%
33% 28%
age 18 – 24 age 25 – 44 age 45 – 64
40%
40%
28%
workforce aged 18-24 is most willing to accept flexible working hours.
workforce aged 18-24 is more likely than workforce aged 25-44 to keep their skills up to date by training, courses etc.
workforce aged 18-24 is most likely to be sociable with colleagues, superiors and their professional network.
I keep my skills up to date by trainings, courses etc.
I am sociable with colleagues, superiors and my professional network.
how employees stay employable

30 |
top
employers.
© randstad 2018 | employer brand research 2018, country report hong kong.
| |
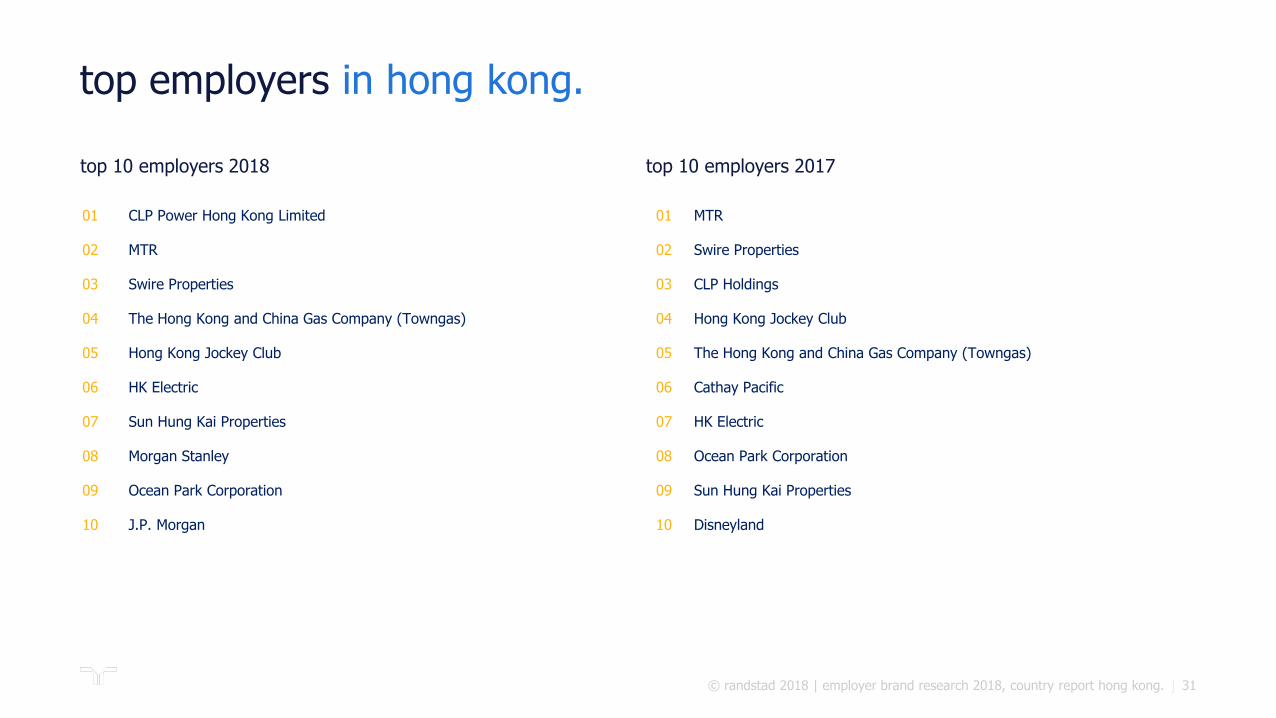
top employers
|
top 10 employers 2018 top 10 employers 2017
31
in hong kong.
© randstad 2018 | employer brand research 2018, country report hong kong.
01 CLP Power Hong Kong Limited 01 MTR
02 MTR 02 Swire Properties
03 Swire Properties 03 CLP Holdings
04 The Hong Kong and China Gas Company (Towngas) 04 Hong Kong Jockey Club
05 Hong Kong Jockey Club 05 The Hong Kong and China Gas Company (Towngas)
06 HK Electric 06 Cathay Pacific
07 Sun Hung Kai Properties 07 HK Electric
08 Morgan Stanley 08 Ocean Park Corporation
09 Ocean Park Corporation 09 Sun Hung Kai Properties
10 J.P. Morgan 10 Disneyland

| |
hong kong’s top companies
top 3 EVP drivers
32
top 3 EVP drivers for the top 5 companies.
© randstad 2018 | employer brand research 2018, country report hong kong.
top 5 companies 1 2 3
1 CLP Power Hong Kong Limited financially healthy job security very good reputation
2 MTR financially healthy job security career progression
3 Swire Properties financially healthy very good reputation job security
4 The Hong Kong and China Gas Company
financially healthy job security very good reputation
5 Hong Kong Jockey Club financially healthy gives back to society job security
| |
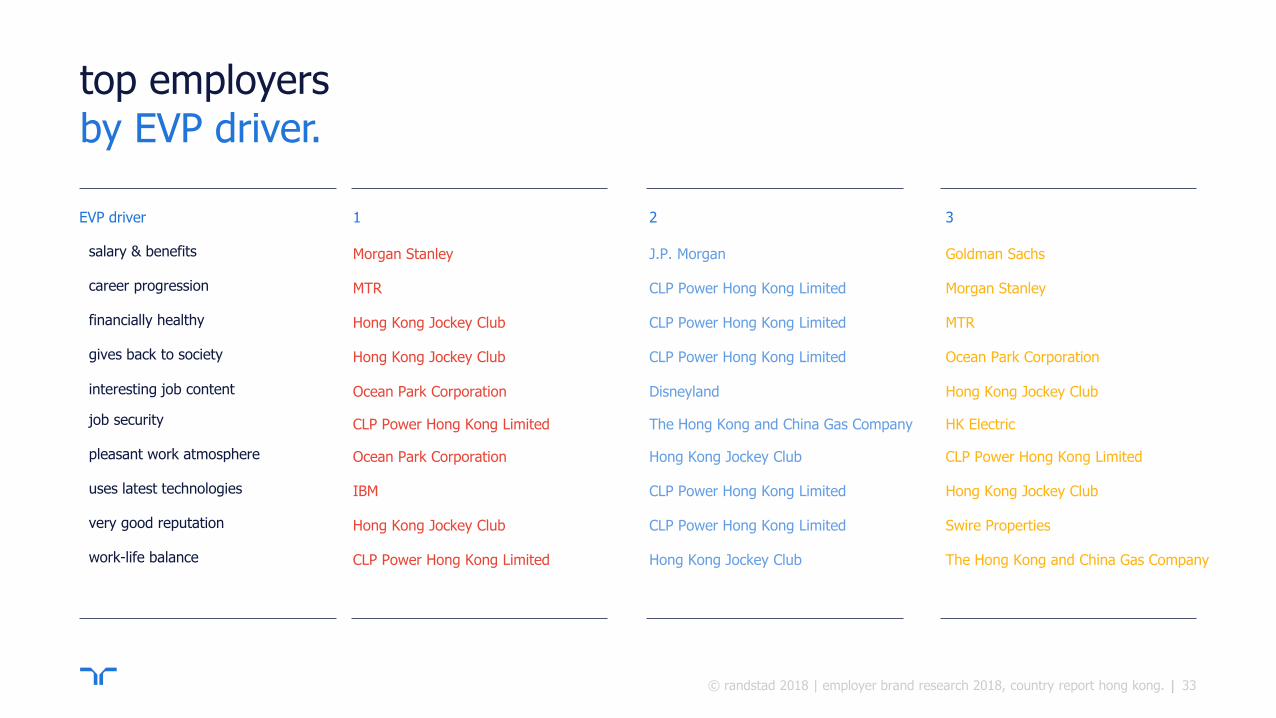
top employers by EVP driver.
33 © randstad 2018 | employer brand research 2018, country report hong kong.
EVP driver 1 2 3
salary & benefits Morgan Stanley J.P. Morgan Goldman Sachs
career progression MTR CLP Power Hong Kong Limited Morgan Stanley
financially healthy Hong Kong Jockey Club CLP Power Hong Kong Limited MTR
gives back to society Hong Kong Jockey Club CLP Power Hong Kong Limited Ocean Park Corporation
interesting job content Ocean Park Corporation Disneyland Hong Kong Jockey Club
job security CLP Power Hong Kong Limited The Hong Kong and China Gas Company HK Electric
pleasant work atmosphere Ocean Park Corporation Hong Kong Jockey Club CLP Power Hong Kong Limited
uses latest technologies IBM CLP Power Hong Kong Limited Hong Kong Jockey Club
very good reputation Hong Kong Jockey Club CLP Power Hong Kong Limited Swire Properties
work-life balance CLP Power Hong Kong Limited Hong Kong Jockey Club The Hong Kong and China Gas Company

|
sector
insights.
34 © randstad 2018 | employer brand research 2018, country report hong kong.

| |
professional services
IT banking & financial services
FMCG & Consumer
energy
telecommunications
dining, leisure, hospitality
insurance
engineering, construction
shipping & logistics
transportation
luxury & retail
conglomerate
property, real estate (inc. consulting, services)
awareness
att
ract
iveness
high
high low
low
top performing sectors in hong kong
high awareness
Having a high awareness means that employers in the sector are widely known.
high attractiveness
A sector with high attractiveness contains more highly attractive companies than other sectors.
35
by awareness and attractiveness.
© randstad 2018 | employer brand research 2018, country report hong kong.
− sectors in this report are locally defined based on the companies surveyed . − all sector results in this report are based on the company scores within the sector.
| |
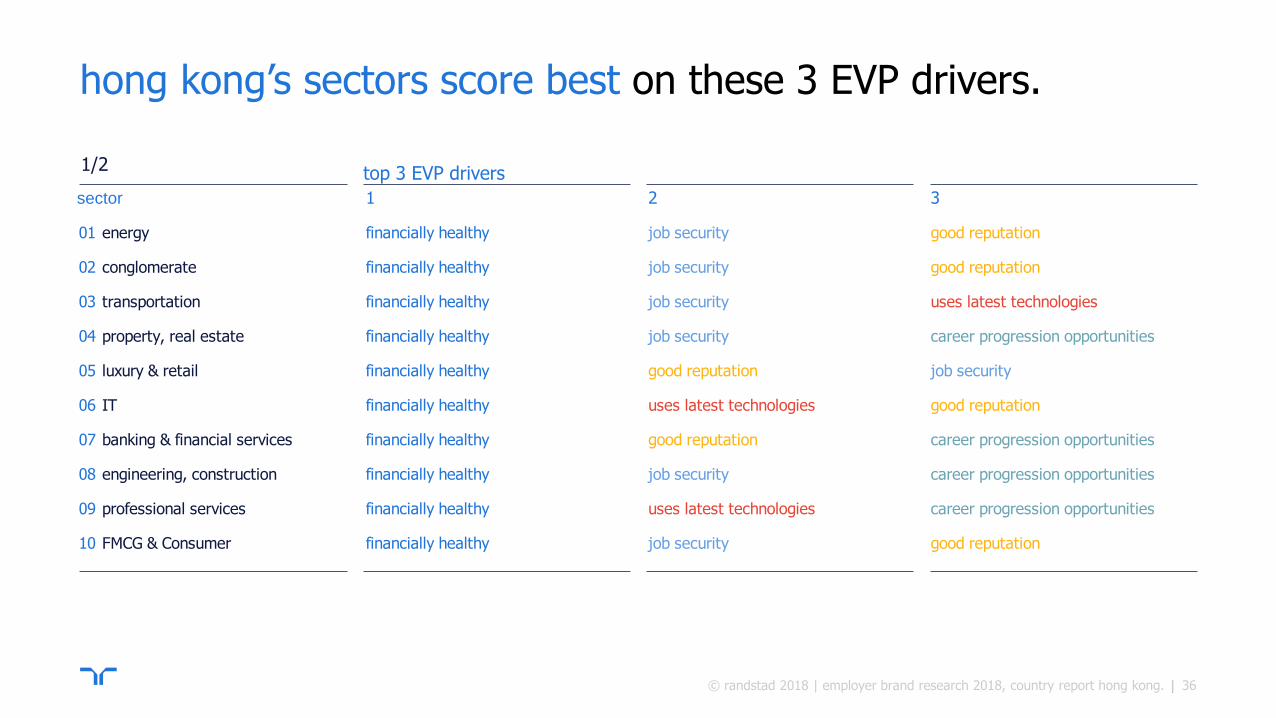
hong kong’s sectors score best on these 3 EVP drivers.
top 3 EVP drivers
36
1/2
© randstad 2018 | employer brand research 2018, country report hong kong.
1 2 3
01 energy financially healthy job security good reputation
02 conglomerate financially healthy job security good reputation
03 transportation financially healthy job security uses latest technologies
04 property, real estate (inc. consulting, services)financially healthy job security career progression opportunities
05 luxury & retail financially healthy good reputation job security
06 IT financially healthy uses latest technologies good reputation
07 banking & financial services financially healthy good reputation career progression opportunities
08 engineering, construction financially healthy job security career progression opportunities
09 professional services financially healthy uses latest technologies career progression opportunities
10 FMCG & Consumer financially healthy job security good reputation
sector
| |
top 3 EVP drivers
37
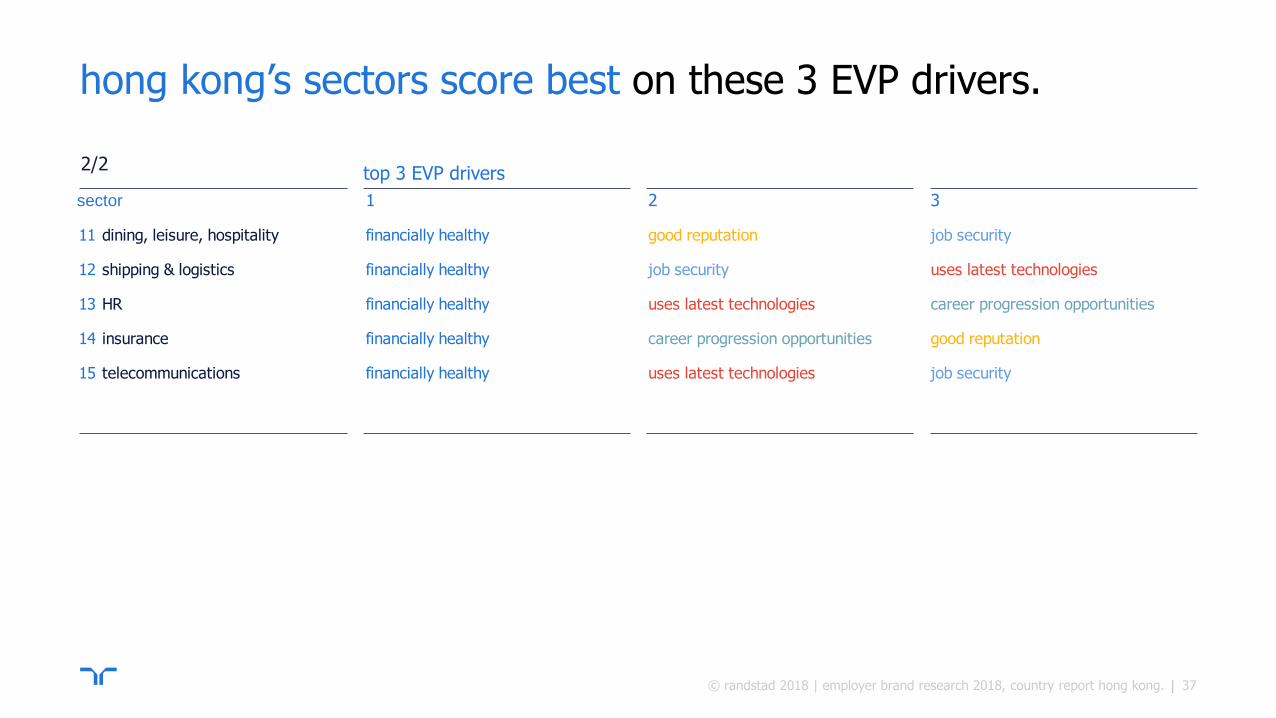
hong kong’s sectors score best on these 3 EVP drivers. 2/2
© randstad 2018 | employer brand research 2018, country report hong kong.
1 2 3
11 dining, leisure, hospitality financially healthy good reputation job security
12 shipping & logistics financially healthy job security uses latest technologies
13 HR financially healthy uses latest technologies career progression opportunities
14 insurance financially healthy career progression opportunities good reputation
15 telecommunications financially healthy uses latest technologies job security
sector

| |
top 3 sectors in hong kong
38
by EVP driver.
© randstad 2018 | employer brand research 2018, country report hong kong.
EVP driver 1 2 3
attractive salary & benefits energy conglomerate banking & financial services
career progression energy conglomerate property, real estate (inc. consulting, services)
financially healthy energy conglomerate property, real estate (inc. consulting, services)
gives back to society energy transportation conglomerate
interesting job content transportation energy IT
job security energy conglomerate property, real estate (inc. consulting, services)
pleasant working atmosphere energy conglomerate IT
uses latest technologies IT energy telecommunications
good reputation energy conglomerate property, real estate (inc. consulting, services)
work-life balance energy conglomerate IT

bridging
the gaps.
© randstad 2018 | employer brand research 2018, country report singapore. | 39
| |
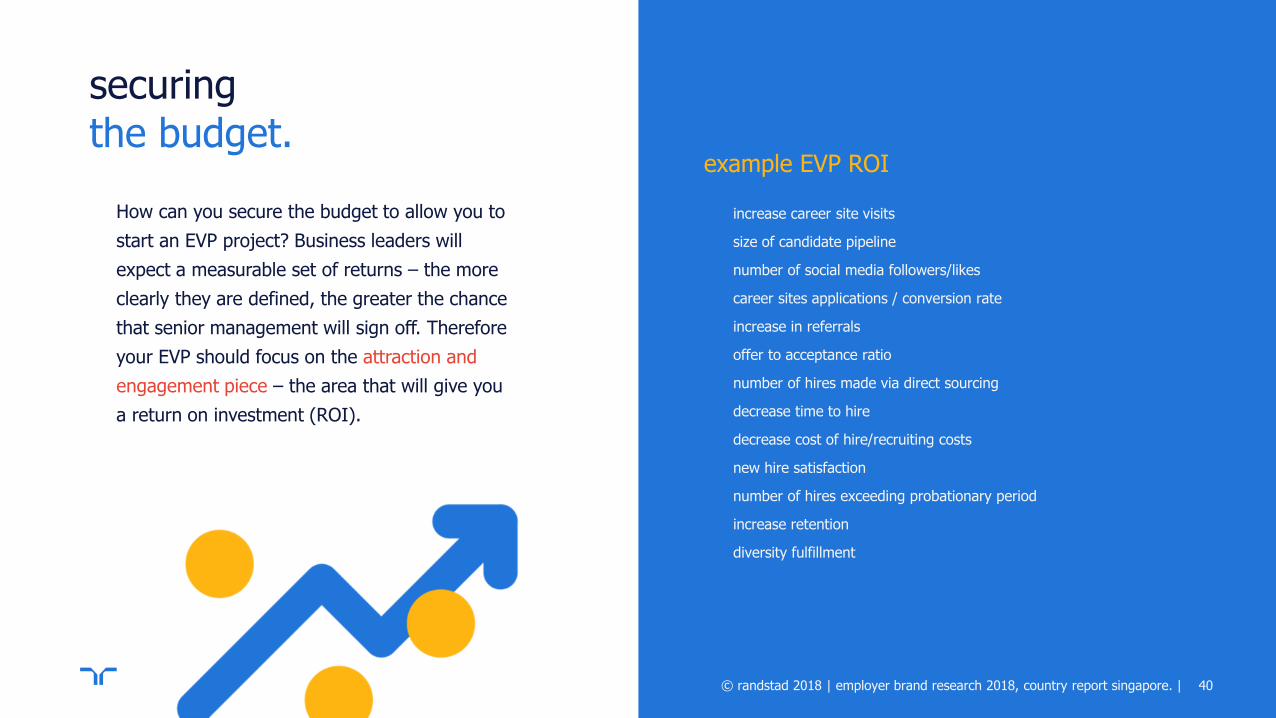
How can you secure the budget to allow you to
start an EVP project? Business leaders will
expect a measurable set of returns – the more
clearly they are defined, the greater the chance
that senior management will sign off. Therefore
your EVP should focus on the attraction and
engagement piece – the area that will give you
a return on investment (ROI).
securing the budget.
© randstad 2018 | employer brand research 2018, country report singapore. | 40
example EVP ROI
increase career site visits
size of candidate pipeline
number of social media followers/likes
career sites applications / conversion rate
increase in referrals
offer to acceptance ratio
number of hires made via direct sourcing
decrease time to hire
decrease cost of hire/recruiting costs
new hire satisfaction
number of hires exceeding probationary period
increase retention
diversity fulfillment
| |
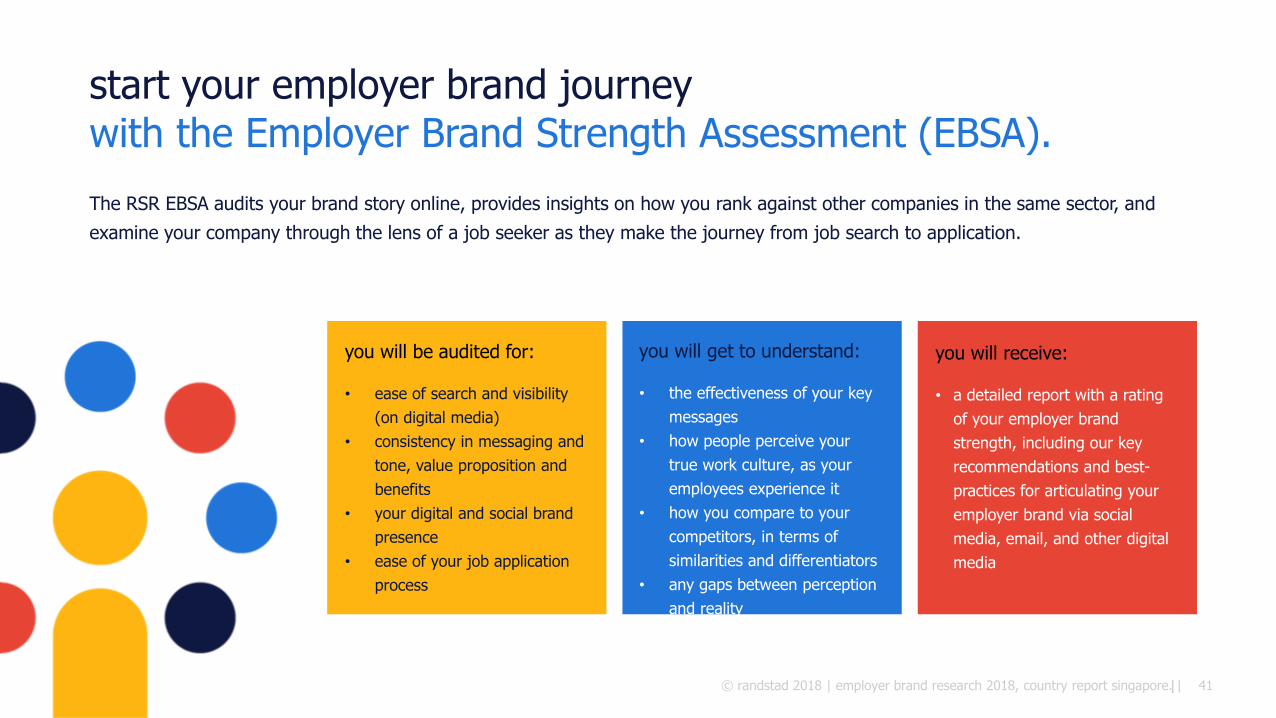
start your employer brand journey with the Employer Brand Strength Assessment (EBSA).
© randstad 2018 | employer brand research 2018, country report singapore. | 41
The RSR EBSA audits your brand story online, provides insights on how you rank against other companies in the same sector, and
examine your company through the lens of a job seeker as they make the journey from job search to application.
you will get to understand:
• the effectiveness of your key
messages
• how people perceive your
true work culture, as your
employees experience it
• how you compare to your
competitors, in terms of
similarities and differentiators
• any gaps between perception
and reality
you will be audited for:
• ease of search and visibility
(on digital media)
• consistency in messaging and
tone, value proposition and
benefits
• your digital and social brand
presence
• ease of your job application
process
you will receive:
• a detailed report with a rating
of your employer brand
strength, including our key
recommendations and best-
practices for articulating your
employer brand via social
media, email, and other digital
media
| |
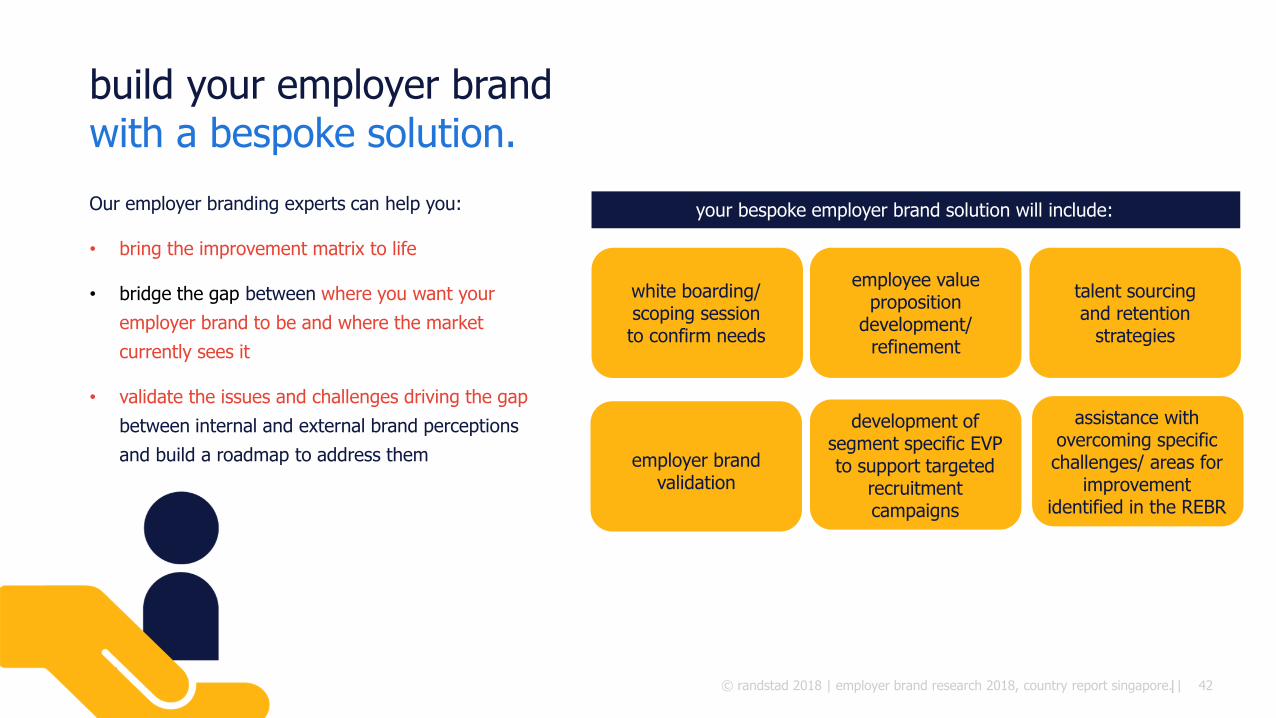
build your employer brand with a bespoke solution.
© randstad 2018 | employer brand research 2018, country report singapore. | 42
Our employer branding experts can help you:
• bring the improvement matrix to life
• bridge the gap between where you want your
employer brand to be and where the market
currently sees it
• validate the issues and challenges driving the gap
between internal and external brand perceptions
and build a roadmap to address them
white boarding/ scoping session to confirm needs
employee value proposition
development/ refinement
talent sourcing and retention
strategies
employer brand validation
development of segment specific EVP to support targeted
recruitment campaigns
assistance with overcoming specific challenges/ areas for
improvement identified in the REBR
your bespoke employer brand solution will include:
|
deep dive
appendix 1.
43 © randstad 2018 | employer brand research 2018, country report hong kong.
| |
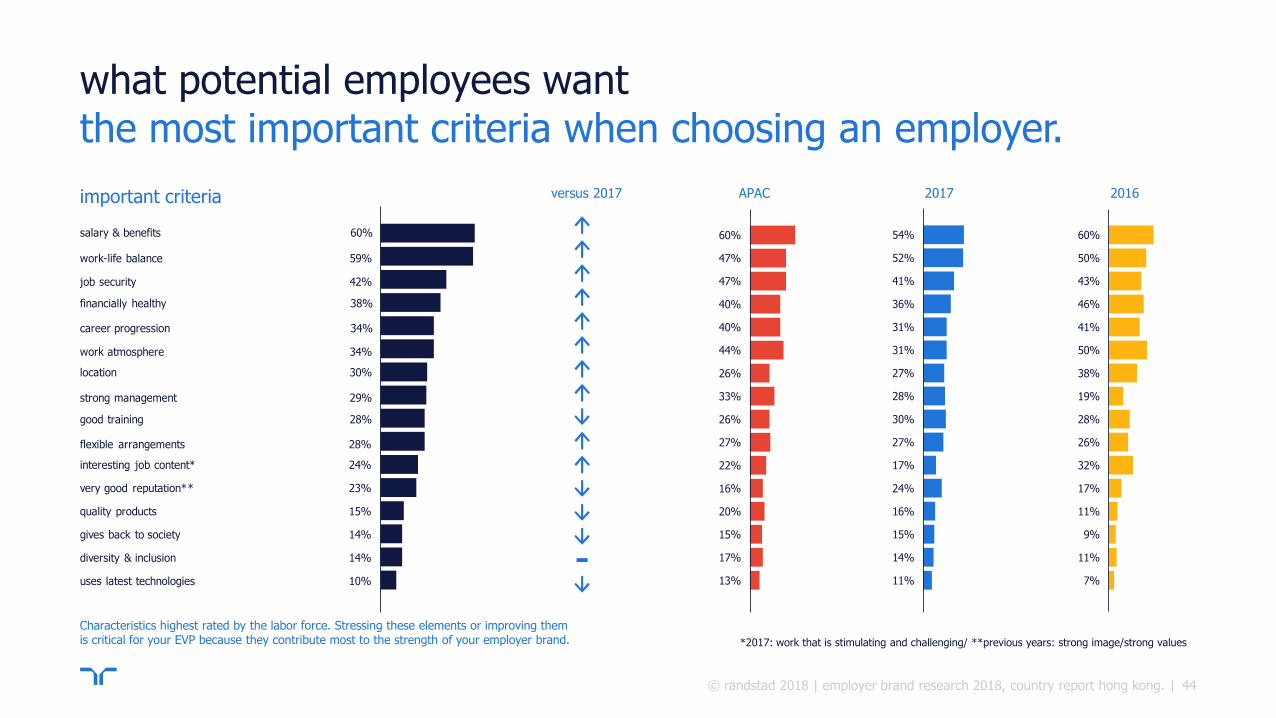
what potential employees want the most important criteria when choosing an employer.
versus 2017
44
60%
13%
17%
15%
20%
16%
22%
27%
26%
33%
26%
44%
40%
40%
47%
47%
54%
11%
14%
15%
16%
24%
17%
27%
30%
28%
27%
31%
31%
36%
41%
52%
7%
60%
11%
9%
11%
17%
32%
26%
28%
19%
38%
50%
41%
46%
43%
50%
60%salary & benefits
10%uses latest technologies
14%diversity & inclusion
14%gives back to society
15%quality products
23%very good reputation**
24%interesting job content*
28%flexible arrangements
28%good training
29%strong management
30%location
34%work atmosphere
34%career progression
38%financially healthy
42%job security
59%work-life balance
important criteria
Characteristics highest rated by the labor force. Stressing these elements or improving them is critical for your EVP because they contribute most to the strength of your employer brand.
APAC 2017 2016
*2017: work that is stimulating and challenging/ **previous years: strong image/strong values
© randstad 2018 | employer brand research 2018, country report hong kong.
| |
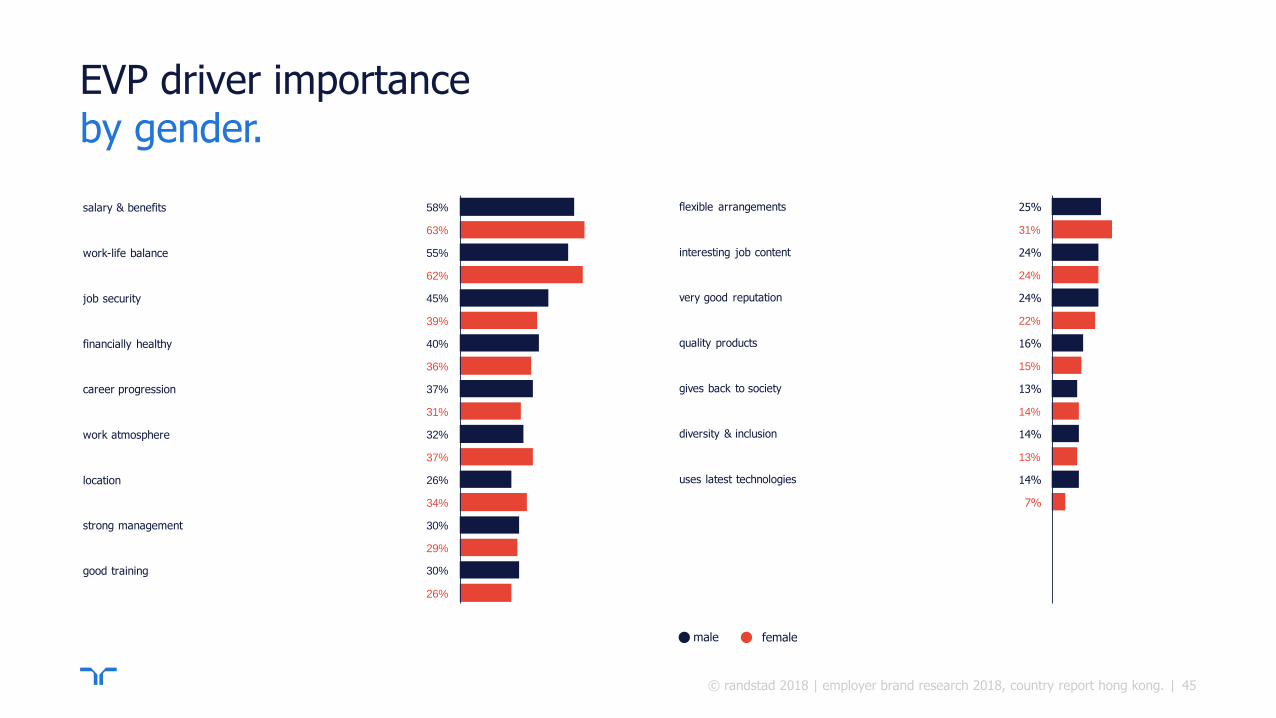
EVP driver importance by gender.
female male
45
salary & benefits
career progression
location
work atmosphere
financially healthy
job security
work-life balance
30%
58%
37%
30%
26%
32%
40%
45%
55%
63%
62%
39%
36%
31%
37%
34%
29%
26%
strong management
good training
1
2
3
4
5
6
7
8
9
flexible arrangements
interesting job content
25%
13%
14%
14%
16%
24%
24%
31%
24%
22%
15%
14%
13%
7%
very good reputation
quality products
gives back to society
diversity & inclusion
uses latest technologies
© randstad 2018 | employer brand research 2018, country report hong kong.

| |
EVP driver importance by education.
high middle low
46
1
2
3
4
5
6
7
8
strong management
31%
30%
27%
salary & benefits 63%
57%
56%
work-life balance
50%
63%
57%
job security 43%
38%
43%
career progression
29%
38%
27%
work atmosphere 38%
32%
26%
location
38%
27%
33%
financially healthy
40%
42%
37%
1
2
3
4
5
6
7
8
uses latest technologies
10%
11%
8%
good training 26%
31%
33%
flexible arrangements
24%
30%
27%
interesting job content 25%
24%
23%
quality products
14%
16%
15%
gives back to society 12%
16%
15%
diversity & inclusion
14%
13%
15%
very good reputation
23%
25%
23%
© randstad 2018 | employer brand research 2018, country report hong kong.
| |
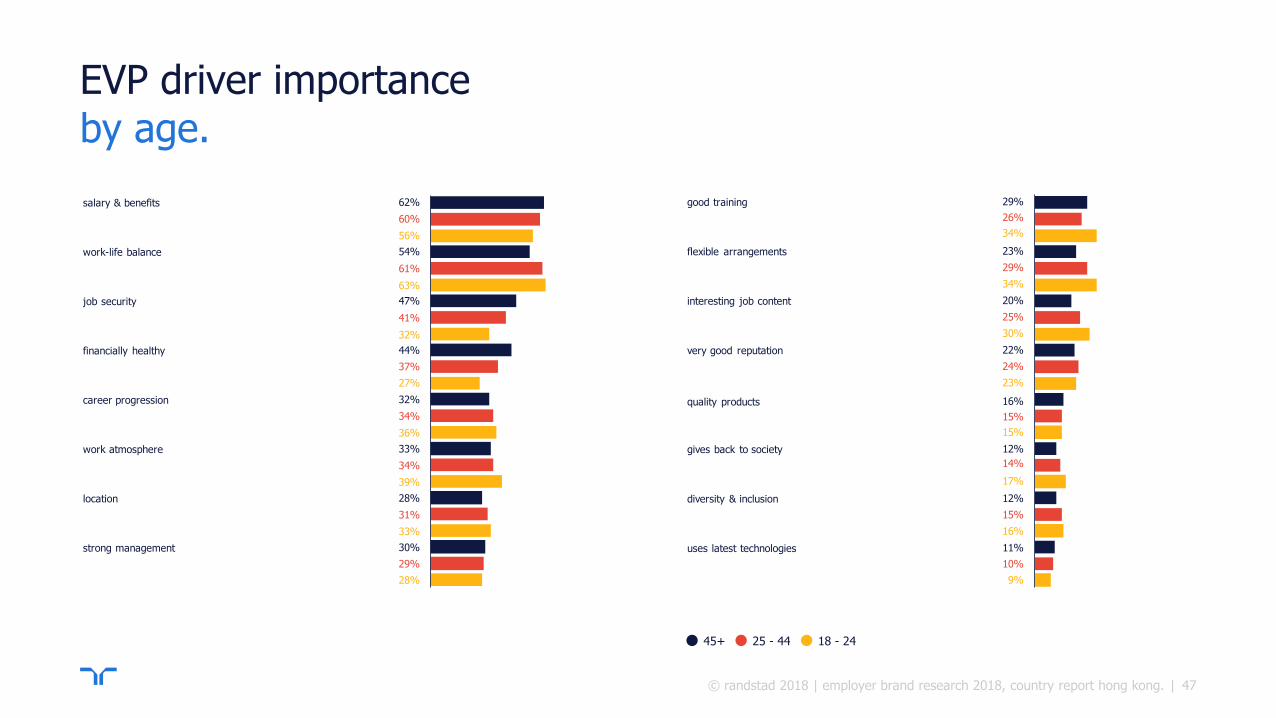
EVP driver importance by age.
45+ 25 - 44 18 - 24
47
strong management
29%
30%
28%
salary & benefits 62%
60%
56%
work-life balance
63%
54%
61%
job security 47%
32%
41%
career progression
34%
32%
36%
work atmosphere 33%
34%
39%
location
31%
28%
33%
financially healthy
37%
27%
44%
uses latest technologies
10%
11%
9%
good training 29%
26%
34%
flexible arrangements
34%
23%
29%
interesting job content 20%
30%
25%
quality products
15%
16%
15%
gives back to society 12%
14%
17%
diversity & inclusion
15%
12%
16%
very good reputation
24%
23%
22%
© randstad 2018 | employer brand research 2018, country report hong kong.

| |
EVP driver importance trends, total. 1/2
48
0
20
40
60
80
2014 2015 2016 2017 2018
work-life balance
40
60
80
2014 2015 2016 2017 2018
salary & benefits
0
20
40
60
2014 2015 2016 2017 2018
job security
0
20
40
60
2014 2015 2016 2017 2018
financially healthy
0
20
40
60
2014 2015 2016 2017 2018
career progression
0
20
40
60
2014 2015 2016 2017 2018
work atmosphere
0
20
40
2014 2015 2016 2017 2018
location
0
20
40
2014 2015 2016 2017 2018
strong management
© randstad 2018 | employer brand research 2018, country report hong kong.

| |
EVP driver importance trends, total. 2/2
49
0
20
40
60
2014 2015 2016 2017 2018
good training
0
20
40
2014 2015 2016 2017 2018
flexible
arrangements
0
20
40
2014 2015 2016 2017 2018
interesting job
content
0
20
40
2014 2015 2016 2017 2018
very good reputation
0
20
2014 2015 2016 2017 2018
quality products
0
20
2014 2015 2016 2017 2018
gives back to society
0
20
2014 2015 2016 2017 2018
diversity & inclusion
0
20
2014 2015 2016 2017 2018
uses latest
technologies
© randstad 2018 | employer brand research 2018, country report hong kong.

|
methodology
appendix 2.
50 © randstad 2018 | employer brand research 2018, country report hong kong.

| |
methodology why smart sampling?
In the past, companies were evaluated by 140 to 1400 respondents.
Having analysed the data and error margins, it was concluded that a
large sample was not necessary when reliable data can also be
obtained with a smaller sample size. Therefore, since REBR 2017
companies are evaluated between 140 and 800 respondents. The
actual number of evaluations per company depends on the
awareness of the company.
The error margin is determined by the % of respondents giving
a certain answer and the sample size to which the question has
been asked. The highest error margin occurs when 50% of the
respondents give a certain answer. The error margin is lower
when 30% (or 70%) of the respondents give a certain answer.
example
140 respondents have evaluated company X. Of these 140, 50% find the
company nice to work for. Taking the error margin at n=140/50% into
account, the real answer lies between 42% and 58%.
400 respondents have evaluated company Y and of these 400, 50% finds
the company nice to work for. Taking the error margin at n=400/50% into
account, the real answer lies between 45% and 55%.
1200 respondents have evaluated company Z and of these 1200, 50%
finds the company nice to work for. Taking into account the error margin
at n=1200/50%, the real answer lies between 47% and 53%.
Therefore, the difference in error margin is very small between n=1200
and n=400 evaluations per company (5% margin vs 3% margin at the most).
As such it can be concluded that maximum 400 evaluations per company
are sufficient in order to determine a reliable attractiveness per company.
In practice, this means that every company with an awareness over 35%
will have max 400 respondents evaluating the company. Companies with an
awareness below 35% will be evaluated by 140 to 400 people (depending
on awareness).
51 © randstad 2018 | employer brand research 2018, country report hong kong.
| |
source bibliography.
1 Betterteam Blog https://www.betterteam.com/blog/employer-branding 2 PwC, A marketplace without boundaries? Responding to disruption https://www.pwc.com/gx/en/ceo-survey/2015/assets/pwc-18th-annual-global-ceo-survey-jan-2015.pdf 3 JWTInside, “The Evolving Culture-scape and Employee Expectation” Research Study 2014, High Performance Employees https://www.slideshare.net/JWTINSIDE/culture-scape-1028-sm 4 Harvard Business Review, A Bad Reputation Costs a Company at Least 10% More Per Hire https://hbr.org/2016/03/a-bad-reputation-costs-company-at-least-10-more-per-hire
5 HR in Asia, Do You Think Your Employer Brand Can Be Ruined by Social Media? www.hrinasia.com/employer-branding/do-you-think-your-employer-brand-can-be-ruined-by-social-media/
52 © randstad 2018 | employer brand research 2018, country report hong kong.