Embedded Commissioning of Building Systems
310
Embedded Commissioning of Building Systems
-
Upload
khangminh22 -
Category
Documents
-
view
3 -
download
0
Transcript of Embedded Commissioning of Building Systems

Embedded Commissioningof Building Systems

For a listing of recent titles in the Artech House Building Technology Series
turn to the back of this book.

Embedded Commissioningof Building Systems
Ömer AkınTanyel Türkaslan-Bülbül
Sang Hoon LeeJames GarrettBurcu AkıncıDaniel HuberMario BergésSteven Bushby

Library of Congress Cataloging-in-Publication DataA catalog record for this book is available from the U.S. Library of Congress.
British Library Cataloguing in Publication DataA catalog record for this book is available from the British Library.
ISBN-13: 978-1-60807-147-0
Cover design by Vicki Kane
© 2012 Artech House685 Canton StreetNorwood, MA 02060
All rights reserved. Printed and bound in the United States of America. No part of this book may be reproduced or utilized in any form or by any means, elec-tronic or mechanical, including photocopying, recording, or by any information storage and retrieval system, without permission in writing from the publisher.
All terms mentioned in this book that are known to be trademarks or service marks have been appropriately capitalized. Artech House cannot attest to the accuracy of this information. Use of a term in this book should not be regarded as affecting the validity of any trademark or service mark.
10 9 8 7 6 5 4 3 2 1

To Mete and Ayça who are full of wonderand delıght ever sınce theır synchronous arrıval

vii
Contents
Preface xv
Acknowledgments xvii
Part I: Introduction to Building Evaluation 1
CHAPTER 1
The Motivation for Building Evaluation 3
1.1 Building Types According to Technology 31.2 Costliest Building Failures 4
1.2.1 Cost of Silent Failures 51.2.2 The Most Expensive and Prevalent Market Commodity 6
1.3 Building Evaluation 81.3.1 Post-Occupancy Evaluation (POE) 91.3.2 Simulation-Based Evaluation 111.3.3 Commissioning Building Energy Systems 11
1.4 Emerging Practices and Opportunities 12References 13
CHAPTER 2
Embedded Commissioning 15
2.1 Commissioning Energy-Consuming Capital Projects 152.1.1 Signifi cance of Energy Consumption in Capital Projects 162.1.2 Building Commissioning (BCx) 16
2.2 Current Challenges and Opportunities in the AEC Sector 202.2.1 Performance Emphasis 202.2.2 Stakeholder Awareness 202.2.3 Integration of Design and Operations of Capital Projects 212.2.4 Building Information Modeling: The Digital Platform for CPD 22
2.3 Dawning of a New Practice in the AEC Sector: ECx 22References 25
viii Contents
Part II: Elaboration 27
CHAPTER 3
Institutional Structure and Practice of Building Commissioning in
the Digital Era 31
3.1 The Global Scope of Building Commissioning 313.2 Institutional Structure in Building Commissioning [5] 32
3.2.1 European Union Countries 323.2.2 Pacifi c Rim Countries 39
3.2.3 BCx Standards in United States and Canada 433.3 Emerging Requirements for BCx in the Information Age 50
3.3.1 Modeling 513.3.2 Standardization 543.3.3 Interoperability 553.3.4 Cost of Interoperability 57References 58
CHAPTER 4
Product and Process Models for Building Commissioning 63
4.1 The Need for Product and Process Models in Building Commissioning 634.2 Capturing the Building Commissioning Process in a Flowchart 65
4.2.1 Process Model Terminology 674.2.2 BCx Process Description 724.2.3 Signifi cance of the ECx Model 75
4.3 Capturing Embedded Commissioning Information in the Product Model 754.3.1 Identifying BCx Data 754.3.2 Developing the Product Model 76References 82
CHAPTER 5
Building Information Modeling: Current Practices in Building Evaluation
Models and Updates 85
5.1 Introduction 855.2 Utilization of BIM in Evaluating Facilities During Preconstruction 87
5.2.1 Using BIM for Energy Analysis During Design 885.2.2 Using BIM in Building Code Compliance Checking 90
5.3 Using BIM in Evaluating Facilities During Construction 91 5.3.1 Using BIM for Coordination of Building Systems and Specialty Trades 925.3.2 Use of BIM and 3D Imaging Techniques for Construction Quality Control 92
5.4 Using BIM in Evaluating Facilities Throughout Their Life Cycle 935.4.1 Utilization of BIM for Traditional Commissioning Activities 935.4.2 Using BIM for Fault Diagnosis of Building Systems 94
Contents ix
5.4.3 Using BIM in Planning of Maintenance Tasks 945.5 Evolution of BIM and the Need for Information Updating 95
References 97
CHAPTER 6
As-Is Modeling: Capturing Existing Spatial Conditions Using Laser Scanners 103
6.1 Introduction 1036.1.1 Sensors and Methods for Capturing As-Is Conditions 1036.1.2 The Scan-to-BIM Workfl ow 1046.1.3 As-Is Modeling Needs and Requirements 1056.1.4 Comparison with As-Designed Modeling 106
6.2 Preparation and Data Collection 1066.2.1 Laser Scanner Technology 1086.2.2 Scan Planning 1106.2.3 Scanning 110
6.3 Registration and Data Cleanup 1116.4 Modeling 112
6.4.1 Interoperability Issues 1146.5 Quality Assurance 1156.6 The Future of As-Is Modeling 117
References 120
CHAPTER 7
Standards: IFC and STEP 123
7.1 Standard for Exchange of Product Model Data (STEP) 1247.1.1 AP225 Building Elements Using Explicit Shape Representation (ISO 10303-225:1999) 125
7.2 Industry Foundation Classes (IFC) 1277.2.1 IFC Development Process 1287.2.2 IFC Model Architecture 1297.2.3 ifcXML 131
7.3 Automating Information Exchange (AEX) Project 1317.3.1 cfi XML Schema Development Process 1327.3.2 cfi XML Schema Structure 132
7.4 CIS/2 and the CIMsteel Integration Standards 1337.4.1 CIMsteel Development Process 1337.4.2 CIS/2 133
7.5 Analysis of the Presented State of the Art 134References 135
CHAPTER 8
Mapping Between Process Product Models: Challenges and Opportunities 137
8.1 Derivation of Product Models from Process Models 1378.2 Three PPM Mapping Application Domains 139
8.2.1 PPM Mapping in the Steel Construction Domain 139
x Contents
8.2.2 PPM Mapping in the Precast Construction Domain 1398.2.3 PPM Mapping in the Building Commissioning Domain 140
8.3 A Generalized Framework for PPM Mapping 1438.3.1 Natural Language Processing 1448.3.2 Ontology Building in the AEC Industry 1448.3.3 Just-in-Time Information 145
8.4 A Detailed Case Study of PPM Mapping in Embedded Commissioning 1478.4.1 Natural Language Parsing in ECx PPM Mapping 1498.4.2 Ontology Development in ECx PPM Mapping 1518.4.3 Schema Matcher and Schema Parser in ECx PPM Mapping 152
8.5 Opportunities for PPM Mapping in ECx 153References 155
CHAPTER 9
Communication Protocols and Data Accessibility 159
9.1 Context 1599.1.1 What Are Communication Protocols and Why Do They Exist? 1609.1.2 Standardization of Communication Protocols 1609.1.3 Protocol Gateways or Translators 162
9.2 An Overview of Communication Protocols Commonly Used in Building Automation 163
9.2.1 BACnet® 1639.2.2 Modbus 1659.2.3 LonTalk 1669.2.4 KNX 167
9.3 Design Phase Commissioning Considerations for BACnet Systems 1679.4 Functional Performance Testing of BACnet Systems 1699.5 A Growing Role for Building System Communication Protocols in ECx 169
References 170
CHAPTER 10
Building Codes 173
10.1 Introduction to Building Codes and Standards 17310.1.1 Nature of Codes 17410.1.2 Purpose of Codes 17410.1.3 Types of Codes and Code Organizations 175
10.2 Processes for Creation and Use of Building Codes and Standards 17610.2.1 The Processes Used to Create Building Codes and Standards 17610.2.2 The Processes in Which These Codes and Standards Are Used 177
10.3 History of Computer-Based Approaches for Code Creation and Use 17810.3.1 Procedural Programming–Based Approaches 18010.3.2 Decision Table–Based Approaches 18010.3.3 Object-Oriented Approaches 18110.3.4 Logic Programming–Based Approaches 18110.3.5 Context-Oriented Approach 182
Contents xi
10.3.6 Standards Modeling Language 18310.4 More Recent Approaches for Supporting Code Creation and Use 184
10.4.1 SMARTcodes Approach 18410.4.2 Other Approaches 18510.4.3 An Approach Based on OWL 186
10.5 Remaining Challenges and Opportunities 186 References 187
Part III: The Future 191
CHAPTER 11
Sensors 193
11.1 Context 19311.1.1 Ubiquitous sensors 19311.1.2 The Internet of Things 19411.1.3 Streaming Data 19511.1.4 Opportunities for Embedded Commissioning 196
11.2 Going Beyond Specifi c Protocols and Formats 19711.2.1 Abstraction Layers for Communication 19811.2.2 Metadata Encapsulation 199
11.3 Issues Regarding Scalability 20011.3.1 Event-Driven Architecture 202
11.4 Privacy, Security, and Access Control 20211.5 Future Prospects 203
11.5.1 Sensor Andrew 203 References 205
CHAPTER 12
Value-Based Design 207
12.1 Innovation in the AEC Industries 20712.1.1 Value in Design 20812.1.2 Value Engineering 208
12.2 Design Added Value Engineering 20912.2.1 An Illustrative Example of a DAV Case: Fallingwater 211
12.2.2 DAV Cost/Benefi t Analysis 21412.3 A Detailed Example of DAV Analysis: Swiss Re Tower, London 219
12.3.1 Introduction 21912.3.2 DAV Parameters: Stakeholders 22112.3.3 DAV Analysis of the Swiss Re Tower 22212.3.4 Economic Analysis of the Swiss Re Tower 229
12.4 Methods of DAV Engineering 23112.4.1 Archival Documentation of Parameters 23212.4.2 Carryover from Precedents 23312.4.3 Qualitative and Intervariable Estimates 23312.4.4 DAV Elicitation Methods 233
xii Contents
12.5 Analyzing the Value of Designs 236 References 237
CHAPTER 13
Field Tools and Augmented Reality Technology 241
13.1 Need for Computational Field Tools 24113.2 Existing Commissioning Tools 24113.3 Key System Components 24313.4 Limitations of Conventional Field Tools 24413.5 Augmented Reality Technology for Commissioning-Support Field Tools 24413.6 System Architecture of an AR System 24513.7 An Example AR-Based Information Support System 24613.8 Benefi ts of AR Technology 24813.9 Representative Commissioning Procedures Using AR Technology 249
References 250
CHAPTER 14
JIT Technology and Wearable Computers 253
14.1 Just-in-Time Technology 25314.1.1 Introduction 25314.1.2 The JIT Concept of Information Support for Commissioning Processes 25414.1.3 Core Technologies for the JIT Approach 25614.1.4 Just-in-Time Data Delivery 257
14.2 Wearable Computers 25714.2.1 Need for Wearable Computers in Commissioning Activities 25814.2.2 Wearable Computers Being Developed for Inspection 25814.2.3 Key Components of Wearable Computers and Their Challenges 261
14.3 An Application Scenario Using the JIT Technology and Wearable Computers 262
References 263
CHAPTER 15
Future of Embedded Commissioning: What Is Possible in 20 Years? 265
15.1 What Is Possible in the Physical World of Capital Projects? 26515.2 Envisioning the Future of the World of Facility Management 26715.3 A Vision of the Future State of ECx 268
15.3.1 Locating Rooms and Equipment 26815.3.2 Measuring Ambient Temperature 26915.3.3 Verifying the Setpoint Value 26915.3.4 Validating User Acceptability of Measured Values 26915.3.5 What Are the Thresholds for Value Comparison? 27015.3.6 How Do We Know Which Value Is Correct? 270

Contents xiii
15.3.7 What Does It Mean to Discover Errand As-Measured Value? 27115.3.8 If a Fault Detection Is Confi rmed, What Can We Do About It? 271
15.4 Visions of Information Technology Futures 27215.5 A Vision of the World of Facilities, Owners/Users, and Capital Project Marketplace 272
References 273
Abbreviations and Acronyms 275
About the Author 281
Index 283

xv
Preface
It is remarkable that buildings and their infrastructures, for how much they cost, lack comprehensive and reliable metrics that can ensure their expected perfor-mance. Although considerable care is put into designing green buildings, once they are put into use there is no systematic and reliable way of evaluating their perfor-mance. Many such capital projects, even those that are legendary for breaking new ground in the interests of energy efficiency and environmental impact, have fallen into states of undesirable performance through natural degradation, disrepair, or poor operational practices [1].
Building commissioning and post-occupancy evaluation are two of the best known methods that have been used to remedy this problem, albeit with mixed success. In today’s digital, green, and consumer-driven marketplace, increasingly, architecture-engineering-construction (AEC) professionals are looking for sophis-ticated approaches, tools, and systems that can help them conduct building perfor-mance verification assessments reliably and effectively.
This book provides a vision for the future of building evaluation in AEC fields through an approach we call embedded commissioning (ECx). ECx is an infor-mation-based digital technology applied longitudinally to the building life-cycle process. Its purpose is to embed every stage of the capital project delivery (CPD) process, from requirement specification to operation, with interoperable and per-sistent information (Chapter 2).
Initially, in Part I, we make the case for building evaluation in general and ECx specifically as a general strategy to overcome inefficiencies and failures seen in buildings. Due to evolving client awareness, facility standards, and new digital technologies, these approaches offer the possibility of successfully addressing the most serious challenges in building evaluation engineering.
In the next part, Part II, we place the ECx approach in the context of a variety of tools and technologies currently available and emerging in the AEC sector. We will review major institutional structures that furbish current AEC practices: build-ing information modeling (BIM), product and process modeling, mapping between process and product models, laser technology–based modeling, building code com-pliance verification, and data access and exchange standards.
In the final part, Part III, we discuss emerging research findings in the areas of sensor networks, value-based design, fields tools and AR/VR methods, just-in-time technologies, and wearable computers. Finally, we conclude with a brief look at visions of new developments beyond the immediate future.

xvi Preface
Reference
[1] Bailey, R., “Unsustainable Promises: Not-So-Green Architecture,” Reason, May 2002.

xvii
Acknowledgments
This book was authored by a team consisting of Burcu Akıncı, Mario Berges, Steven Bushby, James Garrett, Daniel Huber, Sang Hoon Lee, Tanyel Türkaslan-Bülbül, and Ömer Akın, who authored half of the chapters and edited this volume. This team represents affiliations with institutions including Carnegie Mellon University, Penn State University, and Virginia Polytechnic Institute and State University.
The authors owe a debt of gratitude to the individuals, too many in numbers to mention in their entirety here, who helped to make this book the best that it can be. Below we acknowledge some of them.
We gratefully acknowledge that Ms. Aslı Akçamete jointly with Mr. Xuesong Liu wrote the first draft of Chapter 5, the outline of which was developed by Dr. Akıncı. Then, this draft was extensively edited and added to by Dr. Akıncı as well as Ms. Akçamete and Mr. Liu.
We gratefully acknowledge that Mr. Kwang Jun Lee wrote the first draft of Chapter 8, the outline of which was developed by Dr. Akın. Then, this draft was extensively edited and added to by Dr. Akın, as well as Mr. Lee.
We gratefully acknowledge that Mr. Salih Demir wrote the first draft of Chap-ter 10, the outline of which was developed by Dr. Garrett. Then, this draft was extensively edited and added to by Dr. Garrett, as well as Mr. Demir.
We gratefully acknowledge that Ms. Alejandra Munoz Munoz, Ms. Bhavna Muttreja, and Mr. Vinit Kumar Jain wrote the first draft of the Swiss Re case study in Chapter 12, the outline of which was developed by Dr. Akın. Then, this draft was extensively edited and added to by Dr. Akın, as well as Ms. Munoz Munoz, Ms. Muttreja, and Mr. Jain.
The first draft of all chapters of this book was edited by Ms. Sarah Zeigler and Ms. Bhavna Muttreja, making the task of the editor and the technical editing staff much easier. In addition, Ms. Muttreja and Ms. Zeigler embarked on the arduous tasks of obtaining copyright permissions for the plethora of tables and figures in-cluded in the book, and creating the first version of the volume’s index.
Last but not least, we thank current and former staff of Artech House, in par-ticular Ms. Lindsey Gendall, Ms. Deirdre Byrne, and Ms. Judi Stone for the profes-sional job that they have done in initiating, facilitating, and bringing to this manu-script a successful conclusion, which we believe will be a seminal book in the field.
This field is best represented by a very large number of academic and industrial colleagues as well as national and international institutions of research such as the National Institute of Standards and Technology, National Science Foundation,

xviii Acknowledgments
International Agency for Interoperability, and International Energy Agency, with whom we have worked and collaborated over the long years during which much of the research reported on in this book has been conducted and continues to be conducted.
We are deeply grateful for the direct and indirect help that our colleagues, lit-erally located at the four corners of the world, have afforded us in developing the knowledge base that made this book possible. This collaboration is a tribute to the enormously valuable synergy that has been developing during the past few decades between academia and industry, which we hope and trust will continue to flourish in the future.
Ömer AkınPittsburgh, PA
September 21, 2011
1
Part I: Introduction to Building Evaluation
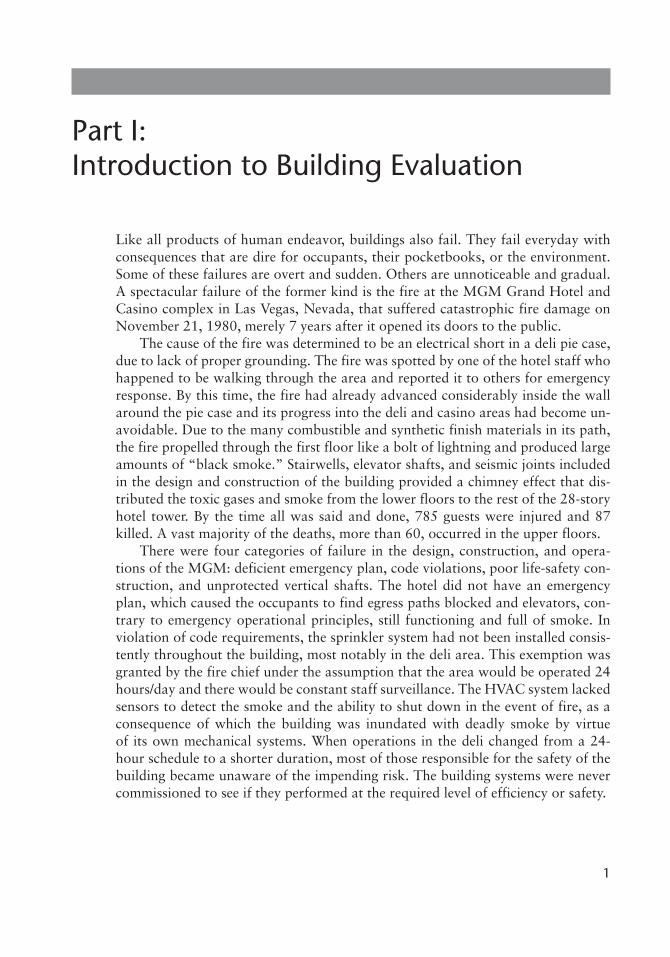
Like all products of human endeavor, buildings also fail. They fail everyday with consequences that are dire for occupants, their pocketbooks, or the environment. Some of these failures are overt and sudden. Others are unnoticeable and gradual. A spectacular failure of the former kind is the fire at the MGM Grand Hotel and Casino complex in Las Vegas, Nevada, that suffered catastrophic fire damage on November 21, 1980, merely 7 years after it opened its doors to the public.
The cause of the fire was determined to be an electrical short in a deli pie case, due to lack of proper grounding. The fire was spotted by one of the hotel staff who happened to be walking through the area and reported it to others for emergency response. By this time, the fire had already advanced considerably inside the wall around the pie case and its progress into the deli and casino areas had become un-avoidable. Due to the many combustible and synthetic finish materials in its path, the fire propelled through the first floor like a bolt of lightning and produced large amounts of “black smoke.” Stairwells, elevator shafts, and seismic joints included in the design and construction of the building provided a chimney effect that dis-tributed the toxic gases and smoke from the lower floors to the rest of the 28-story hotel tower. By the time all was said and done, 785 guests were injured and 87 killed. A vast majority of the deaths, more than 60, occurred in the upper floors.
There were four categories of failure in the design, construction, and opera-tions of the MGM: deficient emergency plan, code violations, poor life-safety con-struction, and unprotected vertical shafts. The hotel did not have an emergency plan, which caused the occupants to find egress paths blocked and elevators, con-trary to emergency operational principles, still functioning and full of smoke. In violation of code requirements, the sprinkler system had not been installed consis-tently throughout the building, most notably in the deli area. This exemption was granted by the fire chief under the assumption that the area would be operated 24 hours/day and there would be constant staff surveillance. The HVAC system lacked sensors to detect the smoke and the ability to shut down in the event of fire, as a consequence of which the building was inundated with deadly smoke by virtue of its own mechanical systems. When operations in the deli changed from a 24-hour schedule to a shorter duration, most of those responsible for the safety of the building became unaware of the impending risk. The building systems were never commissioned to see if they performed at the required level of efficiency or safety.

2 Part I: Introduction to Building Evaluation
The life-safety system faults included lack of fire and smoke compartmentaliza-tion, noncombustible material use, and ventilation away from occupied spaces. It is estimated that the first two items alone would have accounted for three-quarters of the lives to be saved. Unsealed and unpartitioned vertical shafts included those that were not meant to act as air ducts, such as the seismic joints and elevator and stair towers. These were poorly designed and were not evaluated to account for emergency situations.
In the final analysis, it is quite easy to fall into the trap of labeling this event “just another case of human design error” or “construction failure,” like those that have been widely publicized in literature: the Citicorp tower in New York, the John Hancock tower in Boston, the Kansas city Hyatt Regency, and the Tacoma Narrows Bridge. However, such an assumption would most certainly bypass the opportunity to understand the critical relationship between building evaluation and building performance, the main thesis of this book. It is through a critical understanding of such cases that we get to appreciate the important role of building evaluation in general and building commissioning (BCx) specifically. These are critical preven-tive measures for both catastrophic events and for improving building performance under ordinary circumstances that can translate into enormous energy and envi-ronmental savings. We will elaborate further on this point in Chapter 1.
In the case of the MGM fire, regular commissioning of the facility (Chapters 4 and 7), interoperable modeling of building information (Chapter 5), up-to-date as-is drawings of the facility (Chapter 6), live and robust system information com-municated through reliable protocols (Chapter 9), proper and persistent code com-pliance checking (Chapter 10), and installation and upkeep of sensors (Chapter 11) would have all contributed to the prevention of its catastrophic failure.
We also cover additional aspects of persistent building performance evalua-tion through commissioning in the remaining chapters of this book. In Chapter 8, we describe how product and process information can be automatically intercon-nected. In Chapter 12, we review a method for estimating the economic value of innovation in capital projects. Finally, in Chapters 13 and 14, we describe the role of virtual reality, augmented reality, and just-in-time technologies used in building operations and maintenance. These pieces of information technology used in the evaluation and monitoring of building performance make up a mosaic representing the overall framework we call embedded commissioning (ECx). In Chapter 2, we describe this framework in greater detail, and then place it in its global context in Chapter 3. But first let us consider the motivations that have led us to writing this book, in the first place.
References
[1] “MGM Fire Investigation Report.” Las Vegas, NV: Clark County Fire Department, 1980.[2] “Investigation Report on the MGM Grand Hotel Fire; Las Vegas, Nevada, November 21,
1980.” Quincy, MA: National Fire Protection Association, 1982.
3
C H A P T E R 1
The Motivation for Building Evaluation
The case of MGM Grand Hotel and Casino fire that we introduced in the intro-duction to Part I illustrates how building failure can be sudden and catastrophic. However, there are other forms of failure that are slow to develop and not obvious to building occupants. These are the so-called silent failures that include systemic as well as component malfunctions, usually due to suboptimal conditions within the systems providing HVAC (heating, ventilation, and air conditioning), emergency egress, universal access, day lighting, healthful environments, and sensory comfort. Their inconspicuous nature often conceals the seriousness with which they degrade occupant health, deplete assets, reduce productivity and comfort, remove opportu-nities for aesthetic appreciation, and devalue environmental assets. Building well-ness is an extremely broad topic that requires careful delineation in order to develop pointed and effective strategies for evaluation, monitoring, and improvement of building performance.
In this chapter, we explore some of the important dimensions of this domain in order to define the contents of this book within the larger building wellness context. These include the economic value of buildings, particularly the invisible costs of silent failures such as performance degradation and environmental risks. We will show that while buildings are among the most expensive investments we ever make, their proper documentation and operational parameters are among the least well understood and publicized facts. The variety of methods used to date to document these facts and actively evaluate buildings include both challenges and opportunities. Among these, building commissioning (BCx) provides the greatest potential to improve matters in the area of building evaluation.
1.1 Building Types According to Technology
A consultancy based in England entitled Building Use Studies has been conduct-ing surveys and user response studies for several decades under the umbrella of a general question: “What are buildings for?” The answer they provide can be boiled down into three deceptively simple queries [1]. Does a building (1) help or hinder occupants’ productivity, (2) provide good value for money as an investment, and (3) minimize environmental impact? Furthermore, the consultancy observed that buildings that work well in all three categories are scarce. Those that do work well or come close enough can be sorted into three major categories.

4 The Motivation for Building Evaluation
We call the first one the close-fit buildings (CBs). These are buildings that use sophisticated systems and complex technologies to satisfy their missions. These buildings rely on well-informed users, abundant resources, and advanced opera-tions and management (O&M) procedures to closely meet the performance re-quirements defined at the outset. They use, or need to use, formal and ongoing monitoring and evaluation methods to keep performance efficiency high.
The second category, loose-fit buildings (LBs), consists of buildings that are usually low tech and contextually appropriate: “shallow planed, naturally venti-lated, smaller, sophisticated in concept, and with robust domestic scale technol-ogy” [1]. These can adapt to new uses and expansions of existing uses since the match between spaces and functions is loosely structured and subject to adaptive technologies.
The third category, experimental buildings (EBs), is a special set that provides living laboratories for environmental organizations, research centers, and univer-sities. The occupants of these buildings are rarely those other than the designers and constructors of these facilities. In fact, these designers continue to adapt and improve their designs to new needs and experimental objectives throughout the life cycle of these buildings. Throughout this book we will use cases studies that fall into one or another of these three categories to illustrate the methods and tools that will be described.
1.2 Costliest Building Failures
Silent failures can have a significant impact on the value of capital projects—build-ings and infrastructures—through occupant productivity, value of investment, and environmental impact. More specifically, these failures can cause systemic as well as component malfunctions, often in the use and comfort categories, by disrupting am-bient temperature, environment healthfulness, acoustic comfort, daylight, indoor air quality, humidity levels, protection from contaminants, and human productivity. Through the design, construction, operations, and maintenance techniques used in each of the three building categories introduced above offer different remedies for these failures; failures that influence performance variables such as temperature, humidity, ventilation, day lighting, and acoustics.
In a study correlating ambient temperature with productivity measured through performance of standard office tasks, Seppänen et al. [2] showed that productiv-ity is optimal in the range between 21º and 24ºC indoor air temperatures. Best performance was observed at 22ºC, while almost 9% degradation of performance occurred at 30ºC. It is clear from these results, and many others like it [3], that controlling indoor air temperature can add significant value to building and oc-cupant performance.
Another significant indoor air quality issue is moisture and dampness that causes biological and chemical agents to become airborne. There are many causes for this including “water leaks, plumbing system leaks, groundwater entry, damp construction materials, indoor moisture generation, humid outdoor air entry, insuf-ficient dehumidification, water vapor condensation, and floods” [4]. About half of U.S. homes have high levels of dampness or mold present, compared to 45%

1.2 Costliest Building Failures 5
of offices and 30% of schools with water leakage, and 27% of schools with roof leakage problems.
High levels of moisture promote mold and mite growth that emits hazard-ous biological and chemical agents into the air as well as increasing outgassing of chemicals such as formaldehyde from building materials. Through respiratory ill-nesses, these airborne agents contribute negatively to the health and productivity of occupants in a variety of ways.
Because a substandard supply of fresh air, in schools, offices, and “sick build-ings” causes absences from work, respiratory illness, and drops in performance [3], ventilation rates in indoor environments are regarded as an important factor for health and productivity. It has been shown that the minimum standard of 15 cfm/person, when exceeded, can realize dramatic increases in productivity and com-mensurate decreases in absenteeism [3]. When tested in the 14- to 30-cfm range, the speed and accuracy of work in the office setting can be improved by 0.8% per 10 cfm/person. In the school setting, a 5% to 10% improvement may be attribut-able to doubling the ventilation rates for conditions at or below the minimum standard of 15 cfm/person.
Both in schools and offices, by doubling the ventilation rate from 25 to 50 cfm/person, absenteeism can be reduced by as much as 30%. Victims of sick building syndrome, symptoms of which include irritation of eyes, nose, and throat, head-ache, fatigue, cough, and tight chest, show anywhere from 10% to 80% fewer symptoms when ventilations levels are above average, up to 40 cfm/person. Dra-matically higher levels of respiratory illness (50% to 370%) have been documented in “high-density buildings,” including, of all places, nursing homes and health care facilities where fresh air intake is limited by design.
In laboratory conditions, the exposure to low-wavelength (blue) daylight is a significant stimulator of the circadian rhythm of the human body that controls patterns of sleep, work, and many hormonal activities in the body. DLMO (dim light melatonin onset) can be delayed by 30 minutes when students are deprived of exposure to blue light by wearing filtered glasses [5]. There is ample evidence that proper day lighting is a determinant of human performance, not only in the classroom but also at the office and the home [2].
Because its impact on performance reaches far into one’s future, one indoor en-vironment that is critical for improving human performance is the classroom. Re-moving acoustic impediments such as high reverberation and noise levels is central to communication and learning, whether in the classroom or the office environ-ment [6]. To improve acoustical performance conditions, limits on classroom noise and reverberation times have been defined in the American National Standards In-stitute’s standard entitled Acoustical Performance Criteria, Design Requirements, and Guidelines for Schools (ANSI S12.60-2002).
1.2.1 Cost of Silent Failures
The quality of the indoor environment of buildings is a significant aspect of occu-pant health and productivity, which, if not properly handled, also presents an enor-mous price tag. For instance, a sizable component of respiratory illnesses is asthma resulting from dampness and mold [7]. Studies conducted in homes show that of the 21.8 million people with asthma in the United States, about 4.6 million (around
6 The Motivation for Building Evaluation
21%) suffer due to dampness and mold in their indoor environments, primarily in the home. Similarly, severe health problems have been observed in schools, work-places, and institutional buildings [3].
In the United States, the cost associated with asthma attributable to dampness and mold is estimated to be $3.5 billion, which leaves no room to doubt the seri-ousness of the economic impact humidity control can have in the area of improving occupant health and productivity. In routine office tasks as opposed to “creative writing or proofreading,” when indoor pollutants are removed, an improvement of 4% to 16% in productivity (accuracy and speed) is realized [3]. Perception of the indoor air quality also impacts productivity at the rate of 1% improvement for every 10% increase in the number of favorable occupant opinions. Overall produc-tivity-related benefits of indoor air quality are an order of magnitude greater (10 times) than the costs of realizing them.
Through the reduction in respiratory diseases, the “potential annual savings and productivity gains are estimated to be in the range of $6 to $14 billion: $1 to $4 billion from reduced allergies and asthma, $10 to $30 billion from reduced sick building syndrome symptoms, and $20 to $160 billion from direct improvements in worker performance that are unrelated to health” [3]. Altogether the impact of poor indoor environments, whether due to temperature, humidity, ventilation, daylight, health agents, or mental well-being, is in the range of $37 billion to $208 billion.
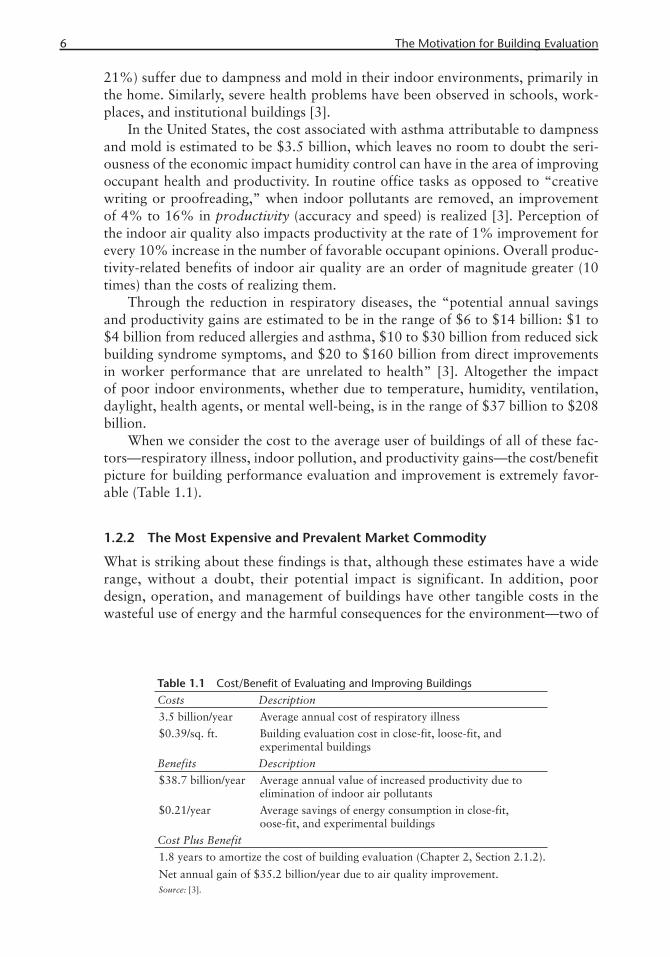
When we consider the cost to the average user of buildings of all of these fac-tors—respiratory illness, indoor pollution, and productivity gains—the cost/benefit picture for building performance evaluation and improvement is extremely favor-able (Table 1.1).
1.2.2 The Most Expensive and Prevalent Market Commodity
What is striking about these findings is that, although these estimates have a wide range, without a doubt, their potential impact is significant. In addition, poor design, operation, and management of buildings have other tangible costs in the wasteful use of energy and the harmful consequences for the environment—two of
Table 1.1 Cost/Benefit of Evaluating and Improving BuildingsCosts Description
3.5 billion/year Average annual cost of respiratory illness
$0.39/sq. ft. Building evaluation cost in close-fit, loose-fit, and experimental buildings
Benefits Description
$38.7 billion/year Average annual value of increased productivity due to elimination of indoor air pollutants
$0.21/year Average savings of energy consumption in close-fit, oose-fit, and experimental buildings
Cost Plus Benefit
1.8 years to amortize the cost of building evaluation (Chapter 2, Section 2.1.2).
Net annual gain of $35.2 billion/year due to air quality improvement.Source: [3].

1.2 Costliest Building Failures 7
the value aspects of buildings defined by Lehman [3]—which we will discuss further in the following sections.
Arguably, the most significant personal expenditure in the United States, both in terms of absolute numbers and percentages, is in the building sector. “We no longer build buildings like we used to, nor do we pay for them in the same way. Buildings today are... life support systems, communication terminals, data manu-facturing centers, and much more, they are incredibly expensive tools that must be constantly adjusted to function efficiently. The economics of building has become as complex as its design” [8].
According to the U.S. Department of Labor’s Bureau of Labor Statistics, in a report published in March 2010, the average annual expenditures of all consumer units for 2008 was $50,486. Out of this, by far the greatest component is for housing (33.9%), with transportation and food a distant second and third, respec-tively, at 17% and 12.8% (Table 1.2). Outside of the housing sector, principally the industry, commerce, and transportation sectors, as well as a myriad of others, also contribute significantly to the construction, operation, and maintenance of buildings and their infrastructure. One estimate published in a reference manual, A Measure of Everything, places it upwards of 35% of the annual GDP. However we slice it, the importance of buildings in the economic life of the United States comes up paramount.
This is no different in other developed economies all around the globe, so much so that the measure of human development has become synonymous with capital projects. Whether considering the emergence of a nexus for business and commer-cial investments, as in Dubai in the Near East or Shanghai in China, or the descrip-tions of ancient civilizations in antique Egypt, Greece, or Rome, the construction of physical infrastructure and buildings is often the most convincing testimonial to superiority of cultures and societies. By the same token, the economic investment in them is undeniably and unavoidably a serious commitment that needs greater scrutiny and clarity.
Table 1.2 Average Annual Expenditures, 2008Expenditures Amount Percentage
Food $6,443 12.8
Alcoholic beverages $444 0.9
Housing $17,109 33.9
Apparel and services $1,801 3.6
Transportation $8,604 17.0
Health care $2,976 5.9
Entertainment $2,835 5.6
Personal care products and services $616 1.2
Reading $116 0.2
Education $1,046 2.1
Tobacco products and smoking supplies $317 0.6
Miscellaneous $840 1.7
Cash contributions $1,737 3.4
Personal insurance and pensions $5,605 11.1
Total $50,486 100Source: [9]. (Courtesy of U.S. Department of Labor, Bureau of Labor Statistics, 2008.)

8 The Motivation for Building Evaluation
1.3 Building Evaluation
While capital projects constitute the largest investment humans ever make, they suffer from an inexplicable neglect of the information transfer needed for their use, care, and proper upkeep. Any modern consumer product in our day comes with supporting literature that usually includes information about the product model, manufacturer, user manual, and warranty, if not an ongoing update for its contin-ued maintenance. One website dedicated to portable, electronic consumer products by manufacturers like Panasonic, Sharp, Casio, Funai, ICOM, Philips, Motorola, Samsung, Kenwood, and Sanyo contains 716 items at its top level. Each item in turn points to an average of 57 different user manual versions, each of which is around 48 PDF pages long. This constitutes a total of 1,958,976 pages and nearly half a billion words.
In contrast, buildings rarely if ever come with a “user manual.” Some of their components, like boilers, chillers, and air exchangers, have printed instructions and data embedded in proprietary controls and maintenance software. This is largely because these components are manufactured products in their own right. However, the conference room, hallway, assembly hall, roof, and exterior cladding among many other components of a building, which are assembled from a plethora of dif-ferent structural, enclosure, MEP (mechanical, electrical, plumbing), finishing, and furnishing components, do not get called out as consumer items. They are not for-mally described for use, operations, or maintenance. Whereas from the perspective of building economics they constitute the largest investment anyone ever makes, as consumer products the codification of their user information aspects is a foreign concept to capital project delivery (CPD) professionals. How do these professionals get away with it? Four factors are often cited in explaining this deficiency in AEC practices:
1. Buildings are one-off assemblies that do not conform to the ground rules of industrially produced consumer items.
2. Buildings are too complex to describe succinctly and accurately in a single, or even multiple, documents.
3. Buildings have a life of their own; they evolve and are subject to changing use patterns.
4. Writing a manual for one building is not cost effective since it is not likely to apply to any other buildings.
In spite of these explanations, a number of practices specialized to buildings provide significant motivation to change or even reverse current trends. It is ex-pected, if not accepted, in the building sector that the cost and delivery time of buildings are highly unpredictable. Cost overruns are routine. It is not unusual for delivery times to slide and actual completion to be realized much later than the es-timated point of occupancy. Contractors and even designers of building systems are hard pressed to predict the precise performance that a finished building will deliver. In the case of close-fit and experimental buildings, this can be ascertained through field measurements, tune-ups of installed systems, and even sophisticated computer simulations of subsystems. But in loose-fit buildings, the vast majority of the build-ing stock, this is much more difficult and continuous monitoring must be used.
1.3.1 Post-Occupancy Evaluation (POE) 9
There are many stages in the life of a building. The average age of a building in the United States is slightly over 70 years, with significant variation based on the materials used in constructing its structure—wood, masonry, steel, or concrete, in ascending order [10]. Infrastructure, as in the case of roads, bridges, and utilities, is all together a different category, in which both investments and life expectancy are double or even triple those of the building sector. As a result, they are by far the consumer products with the longest life cycle, which to a certain extent justi-fies the large capital investment in buildings and infrastructure. By the same token, however, these capital investments should command a much more vigorous evalu-ation and improvement cycle. Finally, building codes, zoning ordinances, contract documents, warranty documents, commissioning reports, and formal evaluation of buildings through post-occupancy evaluation processes should be better structured to make up for the lack of user information (manuals) for buildings.
In spite of all of these motivating factors, the absence of a persistent and in-clusive information bridge to connect capital projects with their users results in endemic problems of design, operations, and maintenance that are costly, serious, and rarely observed with other consumer products.
The impetus for change in the AEC industry is also present due to a number of evolving trends, such as stakeholder sophistication, growing performance emphasis, digital information use, and integration of design and operations. As a result, the evolving relationship between users, owners, and CPD professionals has brought to the fore the potential impact of computation and digital information access as a real game changer (Section 1.4). This book is about describing this shift in the landscape of AEC in detail, predicting some of the positive changes that will benefit all build-ing owners and users, sizing up the challenges that await us, and providing nuts and bolts information about some of the important emergent technologies. Before we launch into describing this innovative approach we call embedded commissioning (Chapter 2), let us briefly review the legacy methods that are its precursors: post-occupancy evaluation, building simulation, and building commissioning.
1.3.1 Post-Occupancy Evaluation (POE)
POE is a practice that started in the United States and is primarily recognized by this acronym in the United States and Canada. It is the “the process of evaluating build-ings in a systematic and rigorous manner after they have been built and occupied for some time” [11]. It has a broad scope, which is usually customized to fit the project at hand. It can be specifically targeted to a performance issue like day light-ing or energy consumption as well as broadly applied to diagnose many potential problems in capital projects. Since its inception through the environmental design movement of the 1960s, it has grown and evolved into a recognized evaluation process in the life cycle of a building.
A typical, broad-scoped POE will involve three stages: problem definition, ob-servation and measurement, and data interpretation and reporting. Some POEs are defined through performance dimensions such as visual, acoustic, thermal, orga-nizational, privacy, lighting, orientation, and maintenance issues. Others are orga-nized around physically situated features of a building, such as lobby waiting areas, dining and cafeterias, patient rooms, classrooms, terraces, and the like. In either

10 The Motivation for Building Evaluation
approach a set of methods is developed to make observations in situ and conduct interviews with primary constituents like the occupants, owners, operators, and design professionals. Some of this data lends itself to only qualitative analysis, as in visual aspects, comfort indicators, privacy, and interaction between occupants, while others can be analyzed quantitatively.
A POE study that exemplifies the best practices in the field was performed for the Philip Merrill Environmental Center by the Center for Environmental Design Research at UC Berkeley [12]. In this study the authors found the following:
• Occupants were highly satisfied with the building as a whole.
• The response to air quality was positive.
• 90% of occupants were satisfied with the day lighting.
• With 80% of the occupants, all psychosocial ratings were positive.
• Occupants expressed a strong sense of pride in the building.
• Acoustical conditions were most negatively rated, primarily due to speech privacy.
Some of these variables are objectively quantifiable like airflow and light levels. Others are subjectively quantifiable like satisfaction with air quality and light levels (Table 1.3).
Recently, research institutions have teamed with government agencies like the General Services Administration to redefine the POE process as facility perfor-mance evaluation (FPE) [13]. The distinction appears to be in the methodological clarity and rigor that is promoted by FPE. In place of a customized approach, an a priori set of tools and techniques is employed to discover faults and substandard
Table 1.3 POE Performance Measures at the Philip Merrill Environmental Center—Average Scores by Catego-ry (N = 71) on a Seven-Point scale of -3 Through +3General satisfaction—building 2.3
General satisfaction—workspace 2.0
Office layout 1.3
Office furnishings 2.2
Thermal comfort 0.6
Air quality 2.1
Lighting 1.8
Views 1.7
Acoustic quality 1.0
Cleanliness and maintenance 1.5
Attention and concentration 1.0
Awareness and communication 1.1
Interactive behavior 1.3
Functionality 1.7
Acoustic functionality 0.3
Community 1.8
Morale and well-being 1.5Source: [12].
1.3.1 Post-Occupancy Evaluation (POE) 11
performance aspects of buildings. Building feasibility analysis (BFA) studies also bear a resemblance to POE and FPE. They are performed on existing facilities to specify the requirements for a replacement facility or to determine the feasibility of a brand new design. While its purpose is somewhat different from POE and FPE, its agenda is similar. In a BFA, the factors to consider include “given building facilities, physical layout of the space, building systems: HVAC, electrical, communication, structural and technical constrains, location, neighborhood, parking facilities, lease terms, demolition and improvement costs necessary to update building, client’s budget constraints, building codes, and Americans for Disabilities Act (ADA) com-pliance requirements. If more than one building is considered, then the compara-tive analysis between the different sites becomes necessary” [14].
With the enormous number of buildings already in existence in the world, this is a daunting task. Furthermore, most of these buildings contribute the lion’s share to energy consumption and carbon emissions. The economic and environmental impact of properly done retrofit and feasibility studies has the potential to be one of the most important areas of building evaluation and performance improvement.
1.3.2 Simulation-Based Evaluation
The rationale for computer simulations for building evaluation arises from the need to accurately estimate, predict, and control the parameters, such as pressure, tem-perature, energy, and fluid flow rate in HVAC components of a functioning building system, in their dynamic state. This requires that in addition to the attributes of the building system, the building’s response to changing external conditions must be accurately modeled. To accomplish this, usually, a steady-state simulation of the sys-tem’s energy and control flows is required. For more complex cases, including light-ing, acoustic, and ventilation flows, finite element analysis simulations can be used.
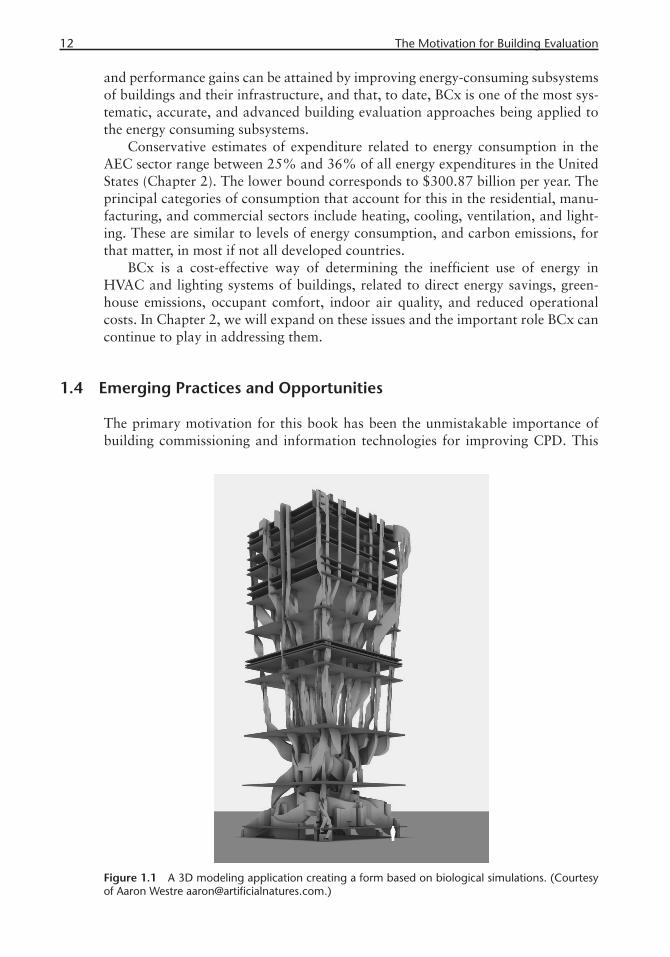
The use of simulation as an evaluative technique is common in close-fit build-ings where advanced technology is used in designing the MEP systems. Otherwise, it becomes almost impossible to connect the dots between the plethora of settings generated by control systems that are governed by proprietary software composed of subcomponents and drive air handling units, heat exchangers, and variable air volume boxes delivering the environmental conditions in a building. Simulations provide the benchmarks against which the measurements obtained from the field can be validated and accurately interpreted (Figure 3.2) [15]. Other applications of building system simulation include self-configuring systems [16], egress patterns [17, 18], biological analogs (Figure 1.1) [19], and productivity modeling [20].
The principal concept of simulation applications is to create sufficiently realistic virtual representations of phenomenon to enable accurate evaluations of how well they would perform in reality, that is, if they were constructed as designed. This approach has the enormous advantage of assessing performance prior to significant capital expenditures and catching mistakes before they happen. This is a growing area of application that will remain an important aspect of building evaluation.
1.3.3 Commissioning Building Energy Systems
Arguably the gold standard of capital project evaluation is building commissioning (BCx). To understand this we have to understand two factors: that the greatest cost
12 The Motivation for Building Evaluation
and performance gains can be attained by improving energy-consuming subsystems of buildings and their infrastructure, and that, to date, BCx is one of the most sys-tematic, accurate, and advanced building evaluation approaches being applied to the energy consuming subsystems.
Conservative estimates of expenditure related to energy consumption in the AEC sector range between 25% and 36% of all energy expenditures in the United States (Chapter 2). The lower bound corresponds to $300.87 billion per year. The principal categories of consumption that account for this in the residential, manu-facturing, and commercial sectors include heating, cooling, ventilation, and light-ing. These are similar to levels of energy consumption, and carbon emissions, for that matter, in most if not all developed countries.
BCx is a cost-effective way of determining the inefficient use of energy in HVAC and lighting systems of buildings, related to direct energy savings, green-house emissions, occupant comfort, indoor air quality, and reduced operational costs. In Chapter 2, we will expand on these issues and the important role BCx can continue to play in addressing them.
1.4 Emerging Practices and Opportunities
The primary motivation for this book has been the unmistakable importance of building commissioning and information technologies for improving CPD. This
Figure 1.1 A 3D modeling application creating a form based on biological simulations. (Courtesy of Aaron Westre aaron@artifi cialnatures.com.)
1.4 Emerging Practices and Opportunities 13
amalgam, embedded commissioning (ECx), at once builds on existing approaches like Continuous Commissioning©™ and emerging technologies of computation. Thus, in this book, we will show how some of the critical AEC sector performance problems we described in Section 1.3, in the center of which lies the challenge of reliable information availability, can be addressed and, in fact, solved through the ECx approach.
In the immediate future, due to the emergence of ubiquitous computation and the World Wide Web as a global information repository and access mechanism, capital project information will be digitally based, in order to improve its delivery, operation, maintenance, and usability. Through emerging technologies, storage, access, and modification of just-in-time information about all aspects of buildings and building products will become a reality sooner than we expect.
The tools of this paradigm shift are currently at hand. The information base for the effective design, operation, and maintenance of complex building systems is being standardized and regulated by international organizations like the ISO (In-ternational Standards Organization) and IEA (International Energy Agency), and national bodies like the NIBS (National Institute of Building Sciences) in the United States, and SHASE (Society of Heating, Air-conditioning and Sanitary Engineers) in Japan (Chapter 3). Current developments in product and process modeling exem-plified in the work done by suborganizations of ISO and research centers examin-ing the mapping of data between them (Chapters 4, 7, and 8) and the emergence of a prevalent practice called BIM (building information modeling) (Chapter 5) have begun to transform the capital project design and delivery fields at a pace unprec-edented in the AEC sector.
The gap between as-designed and as-built information, which resides at the nexus of most information-based approaches in advanced CPD, is being bridged by laser-based scanning and automated modeling tools (Chapter 6). Coupled with the advances in communication protocols and data accessibility (Chapter 9), and automated building code checking (Chapter 10), future building evaluation tech-nologies offer opportunities for accuracy, persistence, and effectiveness through improved performance.
This potential is expected to usher in the broad use of a diverse spectrum of sensors and sophisticated sensor networks (Chapter 11). The economic trade-offs between these approaches will have to be measured in tangible ways that can help us engineer the value of innovation against risk (Chapter 12). Digital field tools (Chapter 13) and just-in-time technologies (Chapter 14) are expected to provide the connection between the designer and the field worker that is critical in realizing the value of high-performance buildings and infrastructure.
References
[1] Lehman, A., “Within These Walls,” Safety and Health Practitioner, http://www.shponline.co.uk, October 31, 2005.
[2] Seppänen, O., Fisk, W. J., and Lei, Q.H., “Effect of Temperature on Task Performance in Offi ce Environment,” Berkeley, CA: Lawrence Berkeley National Laboratory, Environmen-tal Energy Technologies Division, Indoor Environment Department, July 2006.
14 The Motivation for Building Evaluation
[3] “Impacts of Building Ventilation on Health and Performance,” IAQ-SFRB Indoor Air Quality Scientifi c Findings Resource Bank, Lawrence Berkeley National Laboratory, http://www.iaqscience.lbl.gov/vent-summary.html, April 21, 2011.
[4] “Indoor Dampness, Biological Contaminants and Health,” IAQ-SFRB Indoor Air Quality Scientifi c Findings Resource Bank, Lawrence Berkeley National Laboratory, http://www.iaqscience.lbl.gov/vent-summary.html. April 21, 2011.
[5] Crowley, S. J., et al., “Estimating Dim Light Melatonin Onset (DLMO) Phase in Adoles-cents Using Summer or School-Year Sleep/Wake Schedules,” Sleep, Vol. 29, No. 12, 2006, pp. 1632.
[6] Nabelek, A., and Nabelek, I., “Room Acoustics and Speech Perception,” in Handbook of Clinical Audiology, J. Katz (Ed.), Baltimore, MD: Williams & Wilkins, 1985, pp. 834–846.
[7] Fisk, W. J., “Health-Related Costs of Indoor ETS, Dampness, and Mold in the United States and in California,” in Proceedings of Indoor Air Conference 2005, Beijing, Septem-ber 4–9, 2005, pp. 308–313.
[8] Wilson, J., “Foreword,” in Building Economics, H. E. Marshall and R. T. Ruegg, New York: Van Nostrand Reinhold, 1990.
[9] U.S. Department of Labor, Bureau of Labor Statistics, “Consumer Expenditures in 2008,” Report 1023, Tables A and B, March 2010, p. 2.
[10] O’Connor J., “Survey on Actual Service Lives for North American Buildings,” presented at Woodframe Housing Durability and Disaster Issues Conference, Las Vegas, NV, October 2004.
[11] Preiser, W. F. E., Rabinowitz, H. Z., and White, E. T., Post Occupancy Evaluation. New York: Van Nostrand Reinhold, 1998.
[12] Heerwagen, J., Zagreus, L., and Zagreus, J. H., “The Human Factors of Sustainable Build-ing Design: Post Occupancy Evaluation of the Philip Merrill Environmental Center,” In-door Environmental Quality (IEQ) Series, Berkeley, CA: Center for the Built Environment, Center for Environmental Design Research, UC Berkeley, April 1, 2005.
[13] Zimring, C., Mahbub, R., and Kampschroer, K., “Facility Performance Evaluation (FPE),” website in collaboration with the Public Buildings Service, U.S. General Services Adminis-tration, last updated: June 11, 2010.
[14] ITECH, Interior Design Support website, http://web.ku.edu/~itech/index.html, April 21, 2011.
[15] Hensen, J. L. M., “On System Simulation for Building Performance Evaluation,” in Pro-ceedings of the 4th IBPSA World Congress on Building Simulation ’95, Madison, WI, Au-gust 1995, pp. 259–267.
[16] Akın, Ö., Akinci, B., and Garrett, J. H., Jr., “Identifi cation of Functional Requirements and Possible Approaches for Self-Confi guring Intelligent Building Systems,” Interim Progress Report for the Period 07/01/2009–9/30/2009, Carnegie Mellon University, Pittsburgh, PA, submitted to National Institute for Standards and Technology, 2009.
[17] Pan, X., et al., “A Computational Framework to Simulate Human and Social Behaviors for Egress Analysis,” presented at Joint International Conference on Computing and Decision Making in Civil and Building Engineering, Montréal, Canada, June 14–16, 2006.
[18] Rahman, A., and Mahmood, A. K., “Agent-Based Simulation Using Prometheus Methodol-ogy in Evacuation Planning,” in Proceedings from International Symposium on Informa-tion Technology, Kuala Lumpur, August 26–28, 2008, Vol. 3, pp. 1–8.
[19] Westre A., “Complexity Machine 1: A 3D Modeling Application Implementing Behavioral Simulation,” in Proceedings of the ACADIA 2008: Silicon + Skin: Biological Processes and Computation Conference, October 16–19, 2008.
[20] Hong, T., Chou, S. K., and Bong, T. Y., “Building Simulation: An Overview of Develop-ments and Information Sources,” Building and Environment, Vol. 35, No. 4, May 1, 2000, pp. 347–361.

15
C H A P T E R 2
Embedded Commissioning
In Chapter 1, we referred to a set of practices—surrounding and defining the cur-rent state of evaluating buildings and their infrastructures—that motivate our work. Building commissioning (BCx), recognized as one of the most effective evaluation methods, is the model around which we will build a new tool-based and analytical application that supports persistent, reliable, robust, and repeatable building evalu-ation strategies. At the core of our approach is the objective of making information ubiquitous in the AEC domain, thanks to the availability of advanced and ever improving hardware/software tools and applications. Our vision of a universal BCx method for the capital project delivery (CPD) process includes information that is continuously accumulated, accessed, and used through interoperable product and process models.
We call this approach embedded commissioning (ECx), referring to the no-tion that information is embedded in the delivery process in various useful forms, regardless of whether it originates from databases, sensors, people, drawings, or images. This approach subsumes several critical and emergent technologies that are described in detail in Parts II and III of this book: sensors, BIM, BACnet, laser scanning, industry foundation classes (IFCs), process-product modeling, automat-ed building code checking, and AR/VR and JIT technologies.
In this chapter, we get things started by first providing a brief overview of BCx and the important role it plays in building evaluation. Then we describe the setting in which our vision of ECx can flourish based on the current trends that are rap-idly reshaping the AEC industry and the CPD process. Finally, we conclude with a description of the ECx framework.
2.1 Commissioning Energy-Consuming Capital Projects
While there are many challenges in the design of capital projects, these are often matched and even exceeded by the challenges in their operations and maintenance. In fact, the most significant cost issue in the building life cycle is in the category of energy consumption and its impact on the environment.

16 Embedded Commissioning
2.1.1 Signifi cance of Energy Consumption in Capital Projects
“In the United States, the building sector (residential and commercial) uses more energy than the transportation sector, and almost as much as the industrial sector. Moreover, the building sector emits more carbon than either the industrial or the transportation sectors. In 1998, the building sector used 36 percent (33.7 quadril-lion BTU) of the primary energy and emitted 35 percent (523 million metric tons) of the carbon” [1].
Are these unavoidable economic and environmental costs? What can be done about them? Short of reinventing all end-use systems and replacing them with ef-ficient ones (which will happen on its own in the long run) in the short run, we need to make sure that existing systems are made to function as efficiently as possible. This requires an aggressive agenda for building evaluation and retrofitting, which is a primary motivation for this book
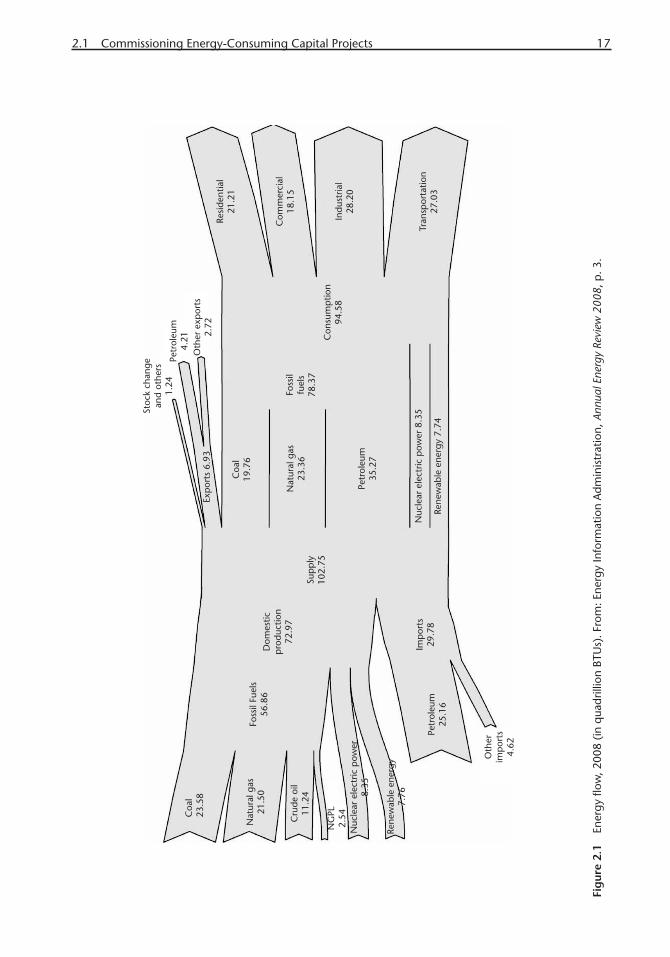
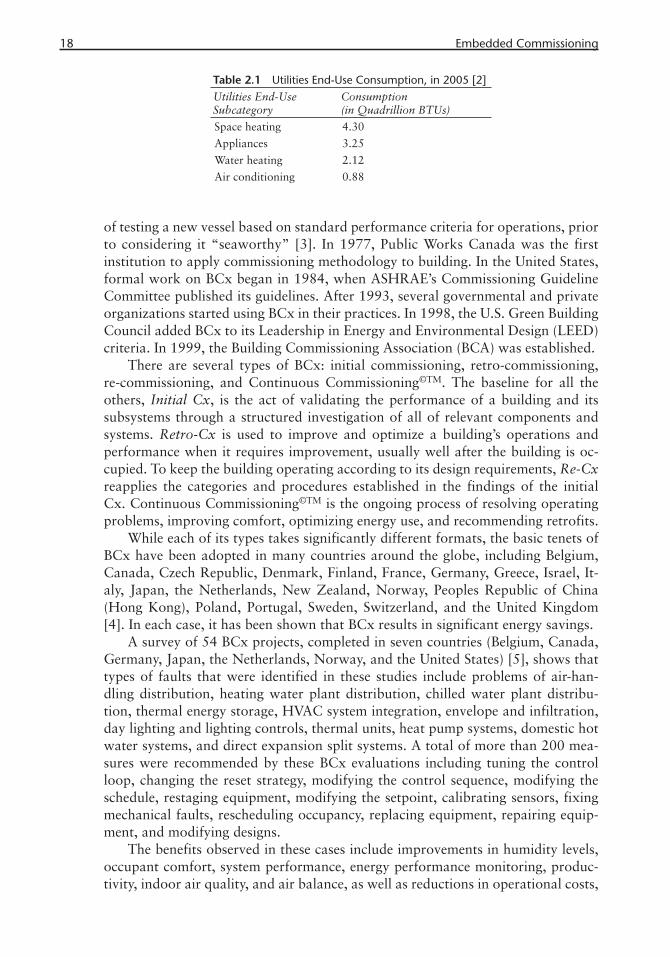
Based on the Energy Information Administration’s Annual Energy Review 2008, there are four major sectors of consumption: residential, industrial, commer-cial, and transportation (Figure 2.1).The housing costs we included in Table 1.2 in Chapter 1 are dominated by the “shelter” item, with “utilities” running a signifi-cant second, 59.5% versus 21.3%, respectively. End-use consumption by utilities in turn breaks down into four subcategories (Table 2.1).
The total energy consumption for the housing sector, excluding appliances, is 8.33 quadrillion BTUs. To this has to be added to the consumption of energy in the other three sectors, namely, commerce, industry, and transportation. In 2005, the lighting, cooling, ventilating, and space heating in commercial buildings to-taled 2.42 quadrillion BTUs; and 0.9 quadrillion BTUs in the manufacturing sec-tor consumed for HVAC and lighting purposes. Altogether the MEP factor in all sectors, excluding transportation, adds to 11.65 quadrillion BTUs, per year. Then, the cost of energy use in the four sectors, in nominal dollars per million BTUs are 21.56 (residential), 20.64 (commercial), 1.33 (industrial), and 19.11 (transporta-tion). This translates into total expenditures of $226, $167, $227, and $538 bil-lion, respectively.
As a conservative estimate, that is, just including the categories we considered—residential (space heating, water heating, air conditioning), industrial (HVAC, lighting), and commercial (lighting, cooling, ventilation, space heating), in which building professionals are the primary design and operations decision makers—the total expenditure, prorated to the consumption in each category, is $300.87 billion per year. This constitutes 25.9% of the total expenditures in the U.S. economy, per annum. This estimate does not include the building activity in the transportation sector nor a myriad of smaller sectors like office, education, health care, warehouse and storage, lodging, food service, food sales, public assembly, and service. An-other source estimates the energy consumption in the housing and the commercial sectors to be 36% of all consumption [2].
2.1.2 Building Commissioning (BCx)
As stated earlier, we consider BCx to be the most advanced method in use for evalu-ating and reducing energy consumption in buildings for all major sectors of the AEC industry. The term commissioning has been borrowed from the naval practice
2.1 Commissioning Energy-Consuming Capital Projects 17
Fig
ure
2.1
Ener
gy fl
ow, 2
008
(in q
uadr
illio
n BT
Us)
. Fro
m: E
nerg
y In
form
atio
n A
dmin
istr
atio
n, A
nnua
l Ene
rgy
Revi
ew 2
008,
p. 3
.
18 Embedded Commissioning
of testing a new vessel based on standard performance criteria for operations, prior to considering it “seaworthy” [3]. In 1977, Public Works Canada was the first institution to apply commissioning methodology to building. In the United States, formal work on BCx began in 1984, when ASHRAE’s Commissioning Guideline Committee published its guidelines. After 1993, several governmental and private organizations started using BCx in their practices. In 1998, the U.S. Green Building Council added BCx to its Leadership in Energy and Environmental Design (LEED) criteria. In 1999, the Building Commissioning Association (BCA) was established.
There are several types of BCx: initial commissioning, retro-commissioning, re-commissioning, and Continuous Commissioning©TM. The baseline for all the others, Initial Cx, is the act of validating the performance of a building and its subsystems through a structured investigation of all of relevant components and systems. Retro-Cx is used to improve and optimize a building’s operations and performance when it requires improvement, usually well after the building is oc-cupied. To keep the building operating according to its design requirements, Re-Cx reapplies the categories and procedures established in the findings of the initial Cx. Continuous Commissioning©TM is the ongoing process of resolving operating problems, improving comfort, optimizing energy use, and recommending retrofits.
While each of its types takes significantly different formats, the basic tenets of BCx have been adopted in many countries around the globe, including Belgium, Canada, Czech Republic, Denmark, Finland, France, Germany, Greece, Israel, It-aly, Japan, the Netherlands, New Zealand, Norway, Peoples Republic of China (Hong Kong), Poland, Portugal, Sweden, Switzerland, and the United Kingdom [4]. In each case, it has been shown that BCx results in significant energy savings.
A survey of 54 BCx projects, completed in seven countries (Belgium, Canada, Germany, Japan, the Netherlands, Norway, and the United States) [5], shows that types of faults that were identified in these studies include problems of air-han-dling distribution, heating water plant distribution, chilled water plant distribu-tion, thermal energy storage, HVAC system integration, envelope and infiltration, day lighting and lighting controls, thermal units, heat pump systems, domestic hot water systems, and direct expansion split systems. A total of more than 200 mea-sures were recommended by these BCx evaluations including tuning the control loop, changing the reset strategy, modifying the control sequence, modifying the schedule, restaging equipment, modifying the setpoint, calibrating sensors, fixing mechanical faults, rescheduling occupancy, replacing equipment, repairing equip-ment, and modifying designs.
The benefits observed in these cases include improvements in humidity levels, occupant comfort, system performance, energy performance monitoring, produc-tivity, indoor air quality, and air balance, as well as reductions in operational costs,
Table 2.1 Utilities End-Use Consumption, in 2005 [2]Utilities End-UseSubcategory
Consumption(in Quadrillion BTUs)
Space heating 4.30
Appliances 3.25
Water heating 2.12
Air conditioning 0.88
2.1 Commissioning Energy-Consuming Capital Projects 19
direct energy expenditures, and greenhouse emissions. Claridge et al. [5] found that the benefits accrued from the use of BCx with new construction ranged from $0.05 to $0.64/sq. ft., while for existing buildings these values were $0.11 to $0.26/sq. ft.
These evaluations were also helpful in uncovering design problems and poten-tial design improvements based on the performance deficiencies observed. Opera-tional, control, and maintenance-related problems accounted for 32% of the total set of problems; 33% dealt with construction and installation; and design account-ed for 35% of all faults [5]. This highlights the potentially positive impact building information systems that seamlessly connect the stages of CPD through interoper-able information repositories (Section 1.4.4) can have on nipping design problems in the bud, before they cause months if not years of inefficient performance.
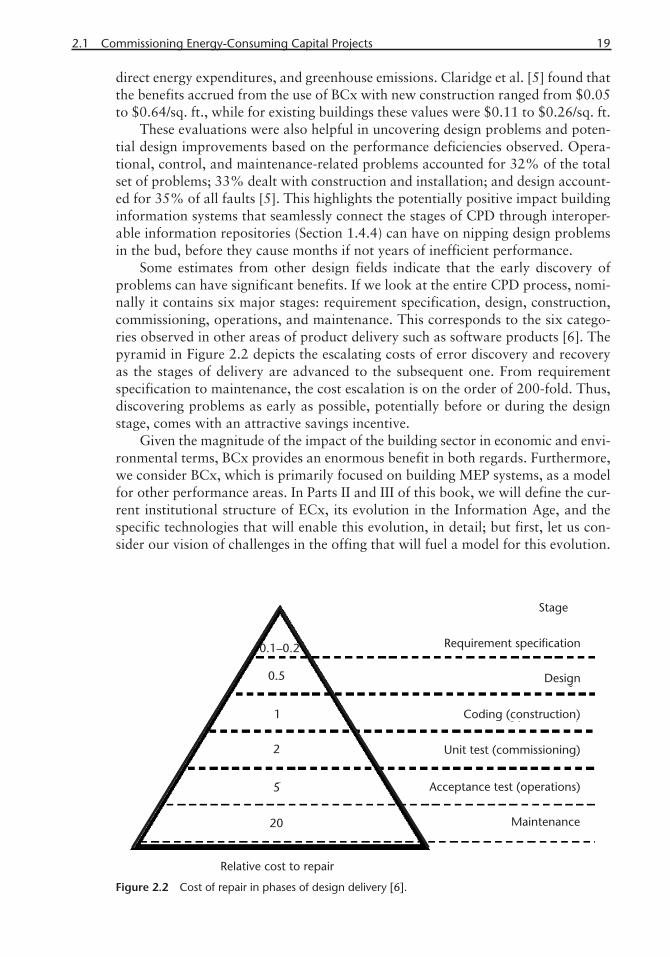
Some estimates from other design fields indicate that the early discovery of problems can have significant benefits. If we look at the entire CPD process, nomi-nally it contains six major stages: requirement specification, design, construction, commissioning, operations, and maintenance. This corresponds to the six catego-ries observed in other areas of product delivery such as software products [6]. The pyramid in Figure 2.2 depicts the escalating costs of error discovery and recovery as the stages of delivery are advanced to the subsequent one. From requirement specification to maintenance, the cost escalation is on the order of 200-fold. Thus, discovering problems as early as possible, potentially before or during the design stage, comes with an attractive savings incentive.
Given the magnitude of the impact of the building sector in economic and envi-ronmental terms, BCx provides an enormous benefit in both regards. Furthermore, we consider BCx, which is primarily focused on building MEP systems, as a model for other performance areas. In Parts II and III of this book, we will define the cur-rent institutional structure of ECx, its evolution in the Information Age, and the specific technologies that will enable this evolution, in detail; but first, let us con-sider our vision of challenges in the offing that will fuel a model for this evolution.
Figure 2.2 Cost of repair in phases of design delivery [6].
20 Embedded Commissioning
2.2 Current Challenges and Opportunities in the AEC Sector
Arguably, the AEC industry presents a dynamic and at times unpredictable picture to the outside world. Cost, schedule, and design quality, the three indispensible pillars of CPD, are often compromised beyond the level of acceptability that is standard in other industries. We recognize several key concepts that will shape the emerging new practices: performance basis, stakeholder awareness, and design and operations integration through digital information systems.
2.2.1 Performance Emphasis
Recently, in the interest of improving accuracy and quality in CPD, there has been a shift in requirement specification and evaluation techniques. Prescriptive specifications are being abandoned, or at least augmented, in the interest of using performance-based specifications. This is an active issue in areas such as energy-consuming systems [15], construction methods [16], and construction safety [17], among others. Performance-based building specifications and requirements empha-size functional metrics for design and construction. The means of construction and the ends of design are measured through process or functional descriptions. Solu-tions, products, or processes are not prescribed. Designers and contractors accom-plish desirable performance outcomes in whatever way they deem most suitable. While this can lead to innovation and increased quality, it can also mean that the bottom line can drag design and construction choices to the lowest possible level allowable by performance requirements. Prescribed solutions, on the other hand, can be overdesigned and, by the same token, avoid the least acceptable outcomes.
2.2.2 Stakeholder Awareness
Stakeholders are the owners, users, financiers, and developers of buildings and in-frastructure systems. Increasingly, stakeholders are assuming greater responsibility in all phases of building delivery. In the programming phase, when the require-ments are specified, they insist on meeting certain performance metrics, for in-stance, in energy conservation, reduction of carbon emissions, and remediation of indoor air quality. Increasingly, they also consider improving occupant performance requirements.
After the commissioning of buildings and building infrastructures, owners play an increasingly active role in their O&M functions. Large institutional cli-ents usually have their own facilities departments and closely monitor their capital project performance indicators. Frequently, the critical performance issues consist of achieving energy efficiency and carbon emission reduction. However, facilities with critical functions such as laboratories, industrial plants, prisons, hospitals, and transportation hubs face special performance issues like security, uninterrupted operations, egress control, and operations flexibility.
As a result of this heightened awareness, capital project performance measure-ment and evaluation have become more common, sophisticated, and accessible. Clients and users require—even demand—environments that match and exceed their requirements for high productivity, low cost, environmental sensitivity, and
2.2 Current Challenges and Opportunities in the AEC Sector 21
agility of use. They expect buildings and infrastructures to add value through their design and methods of construction (Chapter 12).
2.2.3 Integration of Design and Operations of Capital Projects
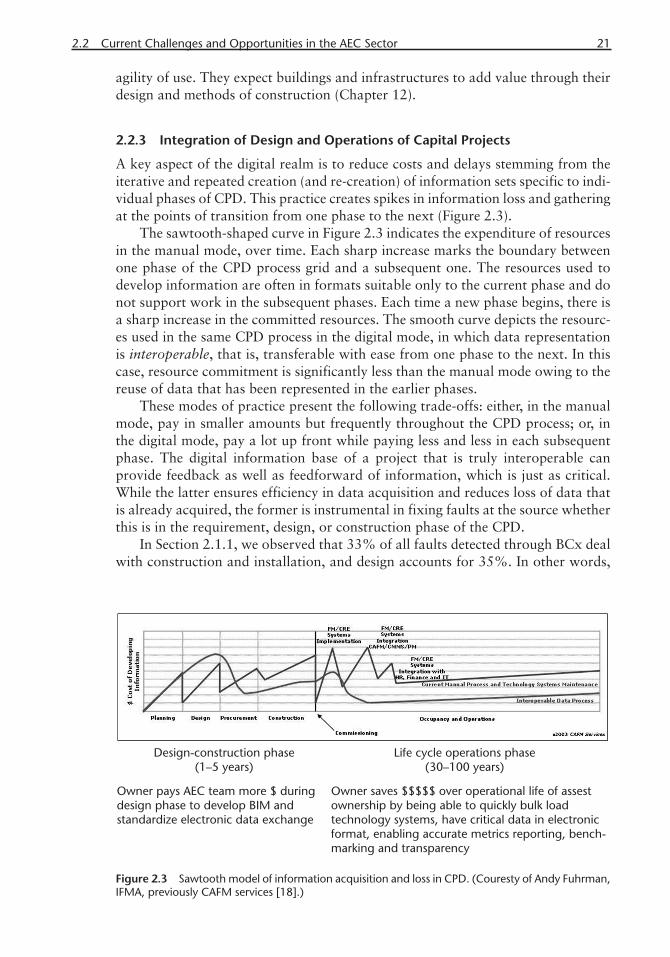
A key aspect of the digital realm is to reduce costs and delays stemming from the iterative and repeated creation (and re-creation) of information sets specific to indi-vidual phases of CPD. This practice creates spikes in information loss and gathering at the points of transition from one phase to the next (Figure 2.3).
The sawtooth-shaped curve in Figure 2.3 indicates the expenditure of resources in the manual mode, over time. Each sharp increase marks the boundary between one phase of the CPD process grid and a subsequent one. The resources used to develop information are often in formats suitable only to the current phase and do not support work in the subsequent phases. Each time a new phase begins, there is a sharp increase in the committed resources. The smooth curve depicts the resourc-es used in the same CPD process in the digital mode, in which data representation is interoperable, that is, transferable with ease from one phase to the next. In this case, resource commitment is significantly less than the manual mode owing to the reuse of data that has been represented in the earlier phases.
These modes of practice present the following trade-offs: either, in the manual mode, pay in smaller amounts but frequently throughout the CPD process; or, in the digital mode, pay a lot up front while paying less and less in each subsequent phase. The digital information base of a project that is truly interoperable can provide feedback as well as feedforward of information, which is just as critical. While the latter ensures efficiency in data acquisition and reduces loss of data that is already acquired, the former is instrumental in fixing faults at the source whether this is in the requirement, design, or construction phase of the CPD.
In Section 2.1.1, we observed that 33% of all faults detected through BCx deal with construction and installation, and design accounts for 35%. In other words,
Figure 2.3 Sawtooth model of information acquisition and loss in CPD. (Couresty of Andy Fuhrman, IFMA, previously CAFM services [18].)

22 Embedded Commissioning
68% of faults detected in the operations phase should have been prevented in an earlier phase. Robust information that connects all of the phases can help diagnose and remedy faults through feedback loops.
2.2.4 Building Information Modeling: The Digital Platform for CPD
BIM came to fruition on the heels of the growing interest in modeling and visu-alization of complex and notable building projects of the 1990s [19]. Assisted by emerging object-based modeling in software engineering and advanced computer hardware, BIM aspires to organize: “all of the information about buildings in a multi-dimensional space, … containing information on topics as diverse as life-cycle of building delivery, specialized building systems consultants, product and process coordination, cost-schedule-quality measures, … subsuming a space that is governed by shared product and process representations conforming to broadly accepted standards” [20].
BIM is shaped by three major influences: large data management, intratask collaboration, and smart representations. Capital projects have become very large, with even the most modest versions requiring hundreds of thousands of objects to be modeled. Ease in modeling and communication with other professionals with-out information loss of such a large repertoire of objects gives impetus to BIM applications, where syntactic, if not semantic, information is embedded with the modeled entity (Chapter 5).
Core CPD operations, like requirement specification, design, costing, schedul-ing, construction, and operations, benefit from complete and efficient modeling environments. Accurate, complete, and persistent data that is readily computable can enhance all CPD operations and assist in interoperability of information be-tween delivery phases. Just-in-time access to information can reduce errors, costs, and time to completion dramatically.
Finally, BIM allows the inclusion of “intelligence” in data, through self-aware-ness, identity, and dependencies with respect to other objects. This provides oppor-tunities for “providing persistent, ontological, and data dependent structures in the building information realm. Standards for interoperability, which come in many shades but with one dominant color: Industry Foundation Classes (IFC), provide the platform for data exchange intelligence so essential to BIM” [20].
2.3 Dawning of a New Practice in the AEC Sector: ECx
The core of the CPD process consists of five stages: project programming, design, construction, project commissioning, and project operations (Figure 2.4). In the conventional CPD, the capital project program is the input to the design stage. In turn, the output of the design stage, or the design, is the input for the construc-tion stage. Once the construction is complete, its output, the building, becomes the input into the capital project commissioning stage. Finally, the commissioned building constitutes the input into the capital project operations stage. Each hand-shake between successive stages is accomplished through a physical entity, namely, the program document, design document, building, and the commissioning report,
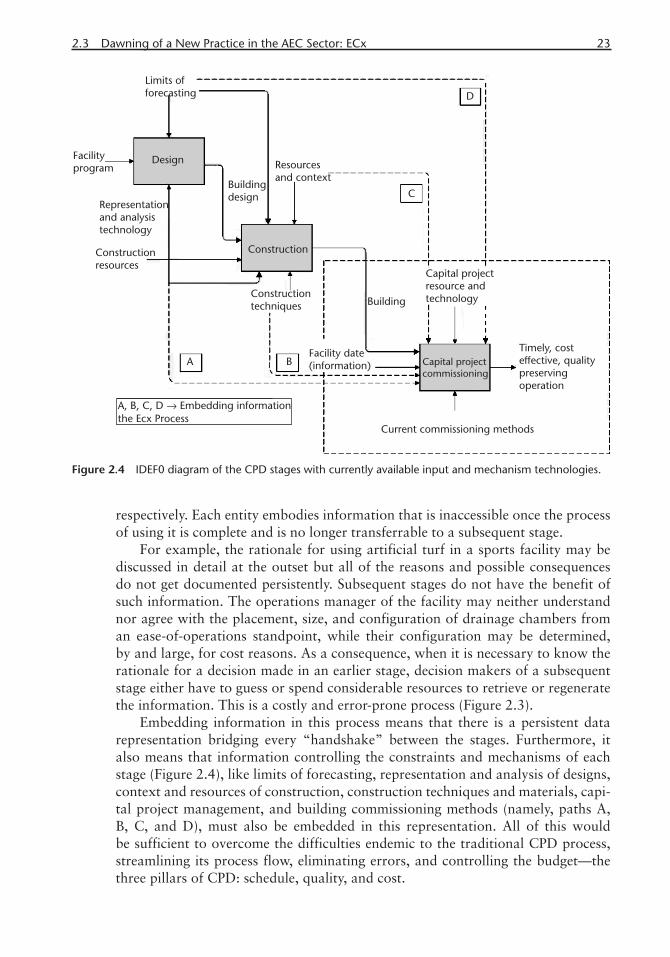
2.3 Dawning of a New Practice in the AEC Sector: ECx 23
respectively. Each entity embodies information that is inaccessible once the process of using it is complete and is no longer transferrable to a subsequent stage.
For example, the rationale for using artificial turf in a sports facility may be discussed in detail at the outset but all of the reasons and possible consequences do not get documented persistently. Subsequent stages do not have the benefit of such information. The operations manager of the facility may neither understand nor agree with the placement, size, and configuration of drainage chambers from an ease-of-operations standpoint, while their configuration may be determined, by and large, for cost reasons. As a consequence, when it is necessary to know the rationale for a decision made in an earlier stage, decision makers of a subsequent stage either have to guess or spend considerable resources to retrieve or regenerate the information. This is a costly and error-prone process (Figure 2.3).
Embedding information in this process means that there is a persistent data representation bridging every “handshake” between the stages. Furthermore, it also means that information controlling the constraints and mechanisms of each stage (Figure 2.4), like limits of forecasting, representation and analysis of designs, context and resources of construction, construction techniques and materials, capi-tal project management, and building commissioning methods (namely, paths A, B, C, and D), must also be embedded in this representation. All of this would be sufficient to overcome the difficulties endemic to the traditional CPD process, streamlining its process flow, eliminating errors, and controlling the budget—the three pillars of CPD: schedule, quality, and cost.
Figure 2.4 IDEF0 diagram of the CPD stages with currently available input and mechanism technologies.
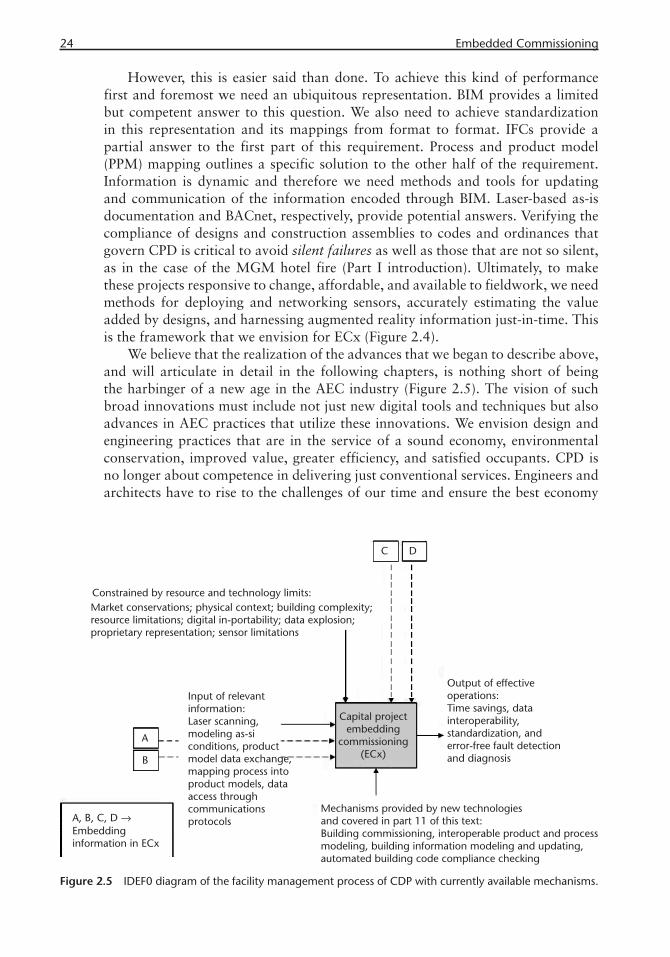
24 Embedded Commissioning
However, this is easier said than done. To achieve this kind of performance first and foremost we need an ubiquitous representation. BIM provides a limited but competent answer to this question. We also need to achieve standardization in this representation and its mappings from format to format. IFCs provide a partial answer to the first part of this requirement. Process and product model (PPM) mapping outlines a specific solution to the other half of the requirement. Information is dynamic and therefore we need methods and tools for updating and communication of the information encoded through BIM. Laser-based as-is documentation and BACnet, respectively, provide potential answers. Verifying the compliance of designs and construction assemblies to codes and ordinances that govern CPD is critical to avoid silent failures as well as those that are not so silent, as in the case of the MGM hotel fire (Part I introduction). Ultimately, to make these projects responsive to change, affordable, and available to fieldwork, we need methods for deploying and networking sensors, accurately estimating the value added by designs, and harnessing augmented reality information just-in-time. This is the framework that we envision for ECx (Figure 2.4).
We believe that the realization of the advances that we began to describe above, and will articulate in detail in the following chapters, is nothing short of being the harbinger of a new age in the AEC industry (Figure 2.5). The vision of such broad innovations must include not just new digital tools and techniques but also advances in AEC practices that utilize these innovations. We envision design and engineering practices that are in the service of a sound economy, environmental conservation, improved value, greater efficiency, and satisfied occupants. CPD is no longer about competence in delivering just conventional services. Engineers and architects have to rise to the challenges of our time and ensure the best economy
Figure 2.5 IDEF0 diagram of the facility management process of CDP with currently available mechanisms.
2.3 Dawning of a New Practice in the AEC Sector: ECx 25
by providing the greatest value to stakeholders. Performance needs have to be opti-mized against first and life-cycle cost of designs. Value must be assessed not just for the bottom line but for other tangible (health, productivity) and intangible (com-fort, happiness, recognition) stakeholder benefits. Last but not least, their products must meet the three pillars of the CPD market place: quality, cost, and schedule.
We also envision a computer-based information environment that enhances data acquisition, mining, representation, filtering, processing, transformation, ac-cess, fidelity, and communication. In terms of professional and business applica-tions, computers have come of age. Since its early beginnings in the 1960s [20], computer-aided design (CAD) has become the industry standard. Today, with the advent of BIM, we enjoy almost universal acceptance of object-based representa-tions of AEC products and processes. IFCs, an outgrowth of the ISO (International Organization for Standardization), have established a sound basis for universal ex-change of data with reliable results. Thanks to ubiquitous Internet communication, data mining and shared repositories of information are commonplace. Special ap-plications that can translate among different data formats, compare specifications against designs, and translate among processes and products, are available just for the asking. The remaining problems of standardization, fidelity, and reliability are on their way to being part of the compendium of solutions broadly available.
These developments in the digital realm provide a rich and powerful set of opportunities for engineers and architects to address the challenges of the new and emerging world of the AEC industry. In the following chapters, this book will address specific solutions that match the opportunities we introduced and the chal-lenges we recognized in this part.
References
[1] Battles, S. J., and Burns, E. M., “Trends in Building-Related Energy and Carbon Emissions: Actual and Alternate Scenarios,” presented at Summer Study on Energy Effi ciency in Build-ings Conference, American Council for an Energy-Effi cient Economy, August 21, 2000.
[2] Energy Information Administration, Annual Energy Review 2008, Tables 1.1, 1.2, 1.3, 1.4, 2.1a, Washington, DC: U.S. Department of Energy, p. 3.
[3] Reilly, J. C., Jr., Ships of the United States Navy: Christening, Launching and Commis-sioning, 2nd ed., Washington, DC: Naval History Division of the Department of the Navy, 1975.
[4] Akın, Ö., et al., “Flow Charts and Data Models for Initial Commissioning of Advanced and Low Energy Building Systems,” Report No. 4, in Cost-Effective Commissioning of Existing and Low Energy Buildings, Annex 47 of the International Energy Agency’s Energy Conser-vation in Buildings and Community Systems Program, http://www.iea-annex47.org, 2010.
[5] Claridge, D., “Commissioning Cost-Benefi t and Persistence,” Chap. 3 in Cost-Effective Commissioning of Existing and Low Energy Buildings, Annex 47 Reports of the Interna-tional Energy Agency’s Energy Conservation in Buildings and Community Systems Pro-gram, http://www.iea-annex47.org,2010.
[6] Kelley, S. W., Hoffman, K. D., and Davis, M. A., “A Typology of Retail Failures and Re-coveries,” Journal of Retailing, Vol. 69, No. 4, 1993, pp. 429–452.
[7] Beck, P., “The AEC Dilemma: Exploring the Barriers to Change,” Design Intelligence. Washington, DC: Greenway Communications and Design Futures Council, http://www.di.net/articles/archive/2046, February 1, 2001.
26 Embedded Commissioning
[8] Teicholz, P., “Labor Productivity Declines in the Construction Industry: Causes and Rem-edies,” AECbytes Analysis (Research, Reviews, Web Publication), No. 4, http://www.aecbytes.com/viewpoints.html, April 14, 2004.
[9] LePatner, B. B., “It’s Time to Fix America’s Broken Construction Industry,” Engineering News-Record, http://enr.ecnext.com/coms2/article_tebm090429BIMDivisiono, March 12, 2008.
[10] Akın, Ö., and Anadol, Z., “Determining the Impact of Computer Aided Design Tools on the Building Delivery Process: A Bench Marking Study,” in Proceedings of First Inter-national Conference on The Management of Information Technology, Singapore, August 1994, pp. 17–20.
[11] Ballard, G., “The Lean Project Delivery System: An Update,” Lean Construction Jour-nal, 2008, pp. 1–19, http://www.leanconstruction.org/lcj/paper_2008_issue.html, accessed April 25, 2011.
[12] Construction Industry Institute, 3925 West Braker Lane (R4500), Austin, TX, https://www.construction-institute.org/scriptcontent/r-teams-list.cfm?section=res, accessed April 25, 2011.
[13] Lee, S. H., and Akin, Ö., “Augmented Reality-based Computational Support for Opera-tions and Maintenance Fieldwork,” Automation in Construction, Vol. 20, No. 4, 2011, pp. 338–352.
[14] Beck, P., “The AEC Dilemma: Exploring the Barriers to Change,” Design Intelligence, Washington, DC: Greenway Communications and Design Futures Council, http://www.di.net/articles/archive/2046, February 1, 2001.
[15] Pati, D., Park, C.-S., and Augenbroe, G., “Roles of Building Performance Assessment in Stakeholder Dialogue in AEC,” Automation in Construction, Vol. 15, No. 4, pp. 415–427.
[16] Lemay, L., “Prescriptive Specifi cation versus Performance Specifi cations,” Concrete Monthly, http://www.concretemonthly.com/monthly/art.php?884, July 2004.
[17] Performance Specifi cations Strategic Roadmap: A Vision for the Future, U.S. Department of Transportation, Federal Highway Administration, Spring 2004.
[18] Fuhrman, A., “Pay Now or Pay Later, Diagram Motivating Interoperable and Persistent Information Models for the Architecture-Engineering-Construction Industry,” Houston, TX: International Facility Management Association.
[19] Eastman, C., et al., Handbook: A Guide to Building Information Modeling for Owners, Managers, Designers, Engineers and Contractors, Hoboken, NJ: John Wiley and Sons, 2008.
[20] Akın, Ö, “Chapter 1: Current Trends and Future Direction in CAD,” Chap. 1 in CAD/GIS Integration: Existing and Emerging Solutions, H. Karimi and B. Akinci (Eds.), New York: Taylor & Francis, 2008.

27
Part II: Elaboration
In Part I, we provided evidence and compelling argument that through systematic and reliable evaluation of capital projects we can ensure the maintenance of the highest levels of performance, throughout the projects’ life cycles. In the following chapters, we will show that the methods needed to perform these evaluations are nonexistent in some cases and inadequate in others. Consequently, we will describe a dozen specific techniques that will improve our chances of objectively monitoring performance and enhancing their delivery in capital projects.
Needless to say capital project delivery (CPD) is complex. To construct a com-prehensible overview of this process we provide a broad-brush view of the three key phases of CPD: design, construction, and commissioning (Figure 2.4). This figure is drawn in the style of an IDEF0 diagram [1] that shows mutually exclu-sive process steps interconnected by input/output links and further defined by con-straints and mechanisms.
II.1 Programming and Design
The facility program, or design requirement specification [2], is the input that ini-tiates the design process. In fact, in a more inclusive version of the same IDEF0 diagram, this input would constitute the output of a process called facility program-ming that precedes design. The output of design is the customary construction doc-uments including working drawings, shop drawings, and the project manual. Every design is limited by the powers of estimation that the designers have in judging the closeness of the performance expected in the facility program and the performance predictions carried out through visual and quantitative simulations.
Currently, there is a plethora of computer simulation tools that predict per-formance issues all the way from realistic appearance of rendered designs (Figure 1.1) to precise annual energy consumption values (Figure 3.2). The limitations of these tools, in addition to the budget, timetable, zoning ordinances, building codes, and available construction materials and methods, constitute the constraints of the design process. On the other hand, these outcomes are facilitated by the capabili-ties of various representation and analysis software among many other CPD tech-
28 Part II: Elaboration
nologies, such as BIM software [3], standardization tools [4], and communication protocols [5].
II.2 Construction
By definition the input of the construction process includes facility designs. In ad-dition, it also benefits from resources needed to carry out the construction includ-ing site conditions, available financing, construction materials, and construction techniques. The construction process is at once enabled (as input) and constrained by the budget, schedule, materials, methods, and even the site conditions. Zoning and building codes impact the construction just as much as they do the design. The mechanisms that enable design, design representation and analysis software, also influence the construction process. In addition, construction is enhanced by new tools that improve as-built representations, digital scheduling and inventory meth-ods, wearable computers, and sensor technology.
II.3 Project Commissioning and Operations
This process is the most persistent one during the CPD life cycle. It includes the upkeep, operations, and maintenance of the facility throughout its life including feedforward into decommissioning (the process step not included in Figure 2.4 for the sake of brevity).
Capital project commissioning includes embedded commissioning (ECx), the topic of this text. The embedding of information in the capital project life cycle is shown in Figure 2.4 by the dotted arrows labeled A, B, C, and D. In other words, through the use of interoperable data, information generated through the constraints and mechanisms of the previous stages (both design and construction) is included seamlessly in the project commissioning process.
The input to the commissioning process by and large consists of the physical fa-cility completed by the construction process. The output is timely, economical, and quality preserving evaluations of capital projects. This is facilitated by the methods and tools of ECx and constrained by the limitations of those aspects of these tools and methods that still need further development.
II.4 Further Elaboration Through Embedded Commissioning
In addition to the constructed building, the input into this process consists of meth-ods we have developed during the past decade to harvest information from physical facilities (Figure 2.5). Many of these methods, including (1) surveying equipment, 3D imaging, laser scanners, cameras, and sensors/methods for modeling as-is con-ditions (Chapter 6); (2) standards for the exchange of product model data (IFCs) (Chapter 7); (3) embedding commissioning information by mapping process models into product models (Chapter 8); and (4) communication protocols and data ac-cessibility (Chapter 9), also enable ECx in the context of the entire project commis-sioning process.
II.4 Further Elaboration Through Embedded Commissioning 29
The mechanisms that make the commissioning process work include methods such as (1) traditional building commissioning processes (Chapter 3); (2) interoper-able product and process modeling (Chapter 4); (3) building information modeling (BIM) and updating (Chapter 5); and (4) automated code compliance checking (Chapter 10). In the following chapters we will elaborate of these aspects of the ECx process highlighted in the original IDEF0 diagram (Figure 2.4), and as ex-panded on in the input and mechanism sections of Figure 2.5.
Stakeholders and CPD professionals alike, primarily if not exclusively, rely on computer-based representations in order to design, construct, manage, and com-municate. Development of specialized software and BIM technology has made the use of digital design nearly ubiquitous (Chapters 4, 5, and 8). Protocols of data exchange enable productive communication (Chapters 6, 7, and 9). Also, build-ing code checking applications offer more reliable and faster verification of re-quirements (Chapter 10). Finally, sensor and laser technologies make possible the gathering of remote and just-in-time information (Chapters 11, 13, and 14). The benefits expected, and in some areas substantially realized, are increased value, reduced cost, reliable delivery schedules, and improved O&M performance.
References
[1] Standard for Integration Defi nition for Function Modeling (IDEF0), Draft Federal Infor-mation Processing Standards Publication 183, Computer Systems Laboratory of the Na-tional Institute of Standards and Technology (NIST), December 21, 1993.
[2] Ozkaya, I., and Akın, Ö., “Tool Support for Computer-Aided Requirements Traceability in Architectural Design: The Case of DESIGNTRACK,” Automation in Construction, Vol. 16, No. 5, 2007, pp. 674–684.
[3] REVIT, Autodesk, Revit Architecture, http://www.usa.autodesk.com, 2008.[4] Froese, T., “Future Directions for IFC-Based Interoperability,” ITcon, Vol. 8, 2003, pp.
231–246, http://www.itcon.org/2003/17.[5] ANSI/ASHRAE, “BACnet: A Data Communication Protocol for Building Automation and
Control Networks,” ANSI/ASHRAE Standard 135, American Society of Heating, Refrig-erating, and Air-Conditioning Engineers, 2010.


31
C H A P T E R 3
Institutional Structure and Practice of Building Commissioning in the Digital Era
3.1 The Global Scope of Building Commissioning
Building commissioning (BCx) has different guises around the globe. In the United States, Canada, Great Britain, and Japan, it is called commissioning and is subject to the guidelines of public and private standards organizations like the NRC [1], SHASE [2], CIBSE, ASHRAE, and NIST. In some European countries such as Ger-many, Sweden, and Norway, the functions of BCx are satisfied through building warranty practices that usually apply to the early years of a building’s lifetime. In other European countries, like France, the Netherlands, and the Czech Republic, and Pacific Rim countries, like Hong Kong–China, Singapore, and Korea, the pro-cess is a part of the quality assurance requirements usually applied to close-fit and experimental buildings.
The International Energy Agency’s Energy Conservation for Building and Com-munity Systems (ECBCS) organization has been conducting international consortia called Annexes since 1977 to coordinate standards for energy efficiency in build-ings. Several Annexes, notably Annex-40 [3] and Annex-47 [4], have dealt with BCx. Under this framework, BCx systems and components (Table 3.1), automation tools (Table 3.2) and cases illustrating practices in different countries have been documented (Table 3.3).
All of this points to the challenges and opportunities underlying the global ef-forts to define and standardize BCx in the Information Age that will be addressed in this chapter and the rest of this text. We will do this through the representa-tive countries where these methods and tools for BCx have been developed. They include the Asia Pacific region (Australia, Hong Kong–China, Japan, Korea, Tai-wan), the European Union (Belgium, Czech Republic, Finland, France, Germany, The Netherlands, United Kingdom), and North America (Canada, United States). In the next section, we focus on a representative sample of national practices from each of these regions.

32 Institutional Structure and Practice of Building Commissioning in the Digital Era
3.2 Institutional Structure in Building Commissioning
As we will see in the following sections [5], current BCx applications around the globe illustrate both the “best” and the “no-so-good” practices of data and work-flow management that illustrate the problems we identified in Section 3.1.
3.2.1 European Union Countries
In the European Union, the Energy Performance of Building Directive (EPBD) pro-vides the framework under which energy efficiency procedures and measurements must be conducted for a shared quality assurance process [6]. The directive, while maintaining a shared perspective, recognizes national and regional variations due to local conditions, building age, building type, data availability, technological in-novations and legal provisions. The EPBD software calculates U-values, the K-level (average insulation), and the E-level (energy consumption) to help gauge compli-ance of buildings with energy consumption and indoor air quality standards.
3.2.1.1 BCx Practices in Belgium
Since 2002, the implementation of EPBD in Belgium has facilitated Cx practices during the building performance certification process. In addition to the EPB (En-ergy Performance of Buildings) and PAE (Procedure d’Avis Energetique) software, in the case of passive solar houses and very low energy buildings, PHP passive (PHPP) software is being used (Table 3.4) [7].
The certification process is fragmented due to the division of labor between the designer (architect) and the energy consultant (engineer) who is qualified to provide passive house design advice, by performing PHPP calculations, and speci-fications for products and appropriate technologies [7]. It was observed during a workflow analysis of a prototype design application, in which a design was first modeled in SketchUp [8] and then in REVIT [9] (Figure 3.1), that data collection and entry were fragmented and relied on e-mail and telephone transmissions. Data came in natural language format and human operators were required to perform entry, maintenance, and error detection. This led to repeated entries, lack of in-teroperability with other cases, and inconsistent and unreliable data repositories. The extension of the analysis with IFC modeling showed that a fully data-centric
Table 3.1 BCx Systems and Components Modeled by the Annex ProcessAir-to-air plate heat exchanger Building zone Coil heat recovery loop
Cooling coil and control valve
Cooling tower Fan (variable speed) Fan and drive train Fan/duct system–VAV
Heat pipe heat recovery Heat pump Heat recovery wheel Heating coil and control valve
Heating coil and control valve
Humidifier Mixing box Mixing box
Terminal unit Terminal unit control Vapor compression chiller
VAV terminal units
Courtesy of Annex 40, ECBCS, IEA [3].
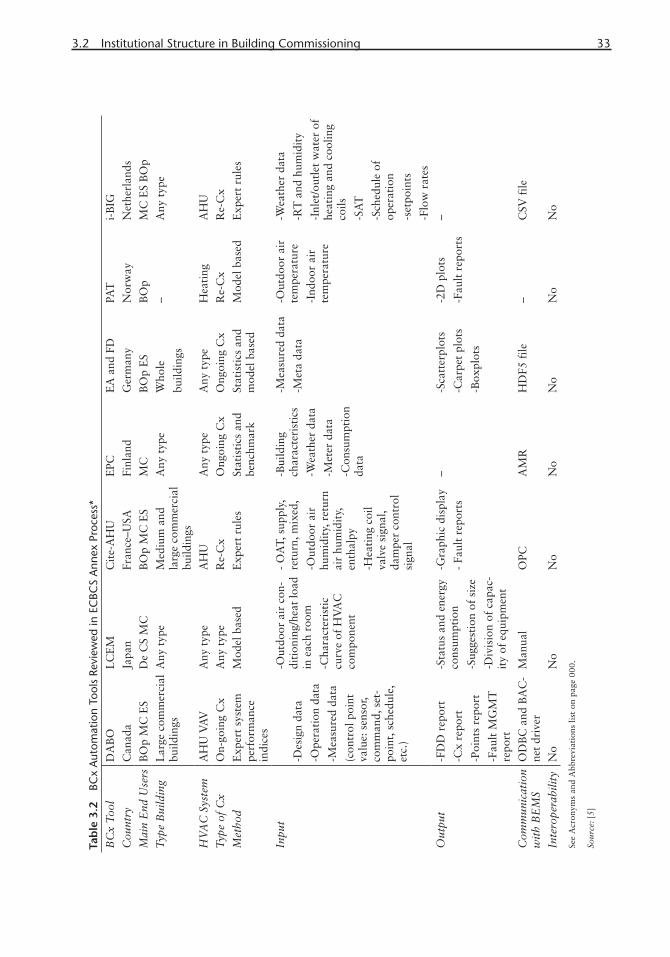
3.2 Institutional Structure in Building Commissioning 33
Tab
le 3
.2
BCx
Aut
omat
ion
Tool
s Re
view
ed in
EC
BCS
Ann
ex P
roce
ss*
BC
x T
ool
DA
BO
L
CE
MC
ite-
AH
U
EPC
EA
and
FD
PA
T
i-B
IG
Cou
ntry
C
anad
a Ja
pan
Fran
ce–U
SA
Finl
and
Ger
man
yN
orw
ayN
ethe
rlan
ds
Mai
n E
nd U
sers
B
Op
MC
ES
De
CS
MC
B
Op
MC
ES
MC
BO
p E
S B
Op
MC
ES
BO
p
Typ
e B
uild
ing
Lar
ge c
omm
erci
al
build
ings
A
ny t
ype
Med
ium
and
la
rge
com
mer
cial
bu
ildin
gs
Any
typ
e W
hole
build
ings
– A
ny t
ype
HV
AC
Sys
tem
A
HU
VA
V
Any
typ
eA
HU
A
ny t
ype
Any
typ
eH
eati
ng
AH
U
Typ
e of
Cx
On-
goin
g C
xA
ny t
ype
Re-
Cx
Ong
oing
Cx
Ong
oing
Cx
Re-
Cx
Re-
Cx
Met
hod
Exp
ert
syst
em
perf
orm
ance
in
dice
s
Mod
el b
ased
E
xper
t ru
les
Stat
isti
cs a
nd
benc
hmar
kSt
atis
tics
and
m
odel
bas
ed
Mod
el b
ased
Exp
ert
rule
s
Inpu
t
-Des
ign
data
-Ope
rati
on d
ata
-Mea
sure
d da
ta
(con
trol
poi
nt
valu
e: s
enso
r, co
mm
and,
set
-po
int,
sch
edul
e,
etc.
)
-Out
door
air
con
-di
tion
ing/
heat
load
in
eac
h ro
om
-Cha
ract
eris
tic
curv
e of
HV
AC
co
mpo
nent
- O
AT,
sup
ply,
re
turn
, mix
ed,
-Out
door
air
hu
mid
ity,
ret
urn
air
hum
idit
y,
enth
alpy
-Hea
ting
coi
l va
lve
sign
al,
dam
per
cont
rol
sign
al
-Bui
ldin
g ch
arac
teri
stic
s
-Wea
ther
dat
a
-Met
er d
ata
-Con
sum
ptio
n da
ta
-Mea
sure
d da
ta
-Met
a da
ta
-Out
door
air
te
mpe
ratu
re
-Ind
oor
air
tem
pera
ture
-Wea
ther
dat
a
-RT
and
hum
idit
y
-Inl
et/o
utle
t w
ater
of
heat
ing
and
cool
ing
coils
-SA
T
-Sch
edul
e of
op
erat
ion
-set
poin
ts
-Flo
w r
ates
Out
put
-FD
D r
epor
t
-Cx
repo
rt
-Poi
nts
repo
rt
-Fau
lt M
GM
T
repo
rt
-Sta
tus
and
ener
gy
cons
umpt
ion
-Sug
gest
ion
of s
ize
-Div
isio
n of
cap
ac-
ity
of e
quip
men
t
-Gra
phic
dis
play
- Fa
ult
repo
rts
–-S
catt
erpl
ots
-Car
pet
plot
s
-Box
plot
s
-2D
plo
ts
-Fau
lt r
epor
ts
–
Com
mun
icat
ion
wit
h B
EM
S O
DB
C a
nd B
AC
-ne
t dr
iver
M
anua
lO
PC
AM
RH
DF5
file
–
CSV
file
Inte
rope
rabi
lity
No
No
No
No
No
No
No
See
Acr
onym
s an
d A
bbre
viat
ions
list
on
page
000
.
Sour
ce: [
5]
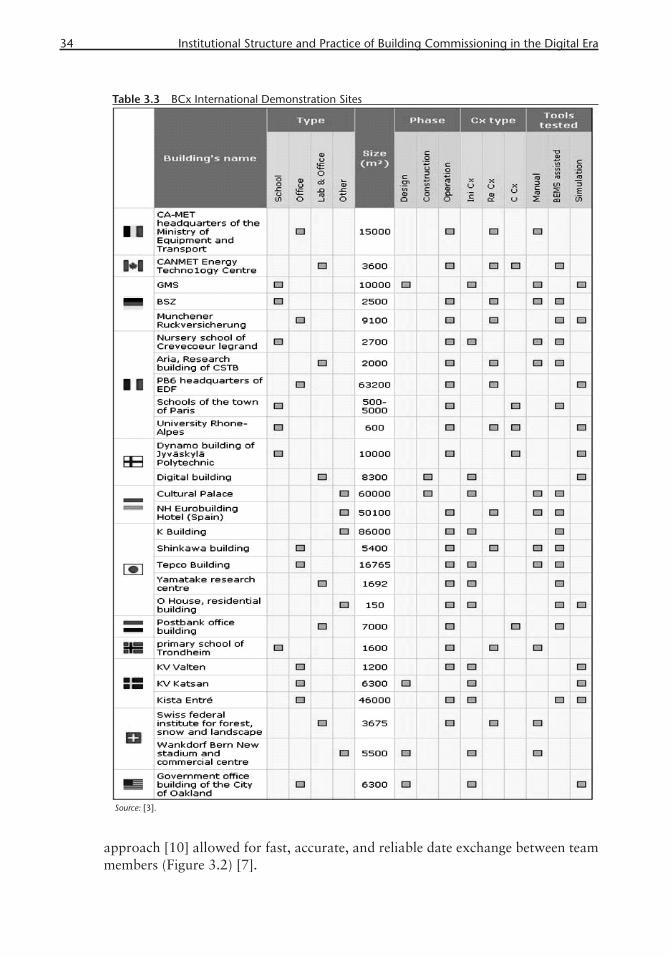
34 Institutional Structure and Practice of Building Commissioning in the Digital Era
approach [10] allowed for fast, accurate, and reliable date exchange between team members (Figure 3.2) [7].
Table 3.3 BCx International Demonstration Sites

3.2 Institutional Structure in Building Commissioning 35
3.2.1.2 BCx Practices in the Czech Republic
The practice of regulating energy consumption of buildings is based on estimating demand and consumption of energy in buildings and building zones, based on the “standard use” notion that is determined by “normative conditions of indoor and outdoor environment and operations” [11]. The NKN, the national calculation tool of the Czech Republic, has been developed as a spreadsheet application to facilitate the calculation of heating, cooling, hot water, and lighting system demands and loads, based on appropriate use patterns. The data input into NKN obtained from the sources is listed in Table 3.5.
NKN calculations are streamlined by the use of standard profiles to represent typical cases and contexts. Each profile contains information about the uses, set temperatures, operating periods, lighting standards, climate data, system type, and
Table 3.4 EPBD Requirements in the Flemish Region, Belgium [7]EPBD REQUIREMENTS Purpose of Building
Type of Construction ResidentialOffice and School Industry Other
New building Rebuilding dismantling Partial rebuilding (heated volume >800 m3)
Enlargement (minimum of one residential building)
Thermal insulation
Max K45Max U or Min R
Max K45 Max U or Min R
Max K55Max U or Min R
Max K45Max Uor Min R
Energy performance
Max E100 Max E100 — —
Indoor climate Min ventilationMin risk overheating
Minventilation
Minventilation
Minventilation
Figure 3.1 BIM model in Revit [7].

36 Institutional Structure and Practice of Building Commissioning in the Digital Era
efficiencies. Calculating the consumption values is difficult since it can be time consuming to collect the requisite data for it. Therefore, parametric consumption profiles for prototypical cases have been established; see Table 3.6, in which dif-ferent performance levels are predefined for different building types (A–C for new buildings; D–F for existing ones). Complications arise when different setpoints are established in different buildings of the same type and category [11].
Finer grain profiles are used that specify operation times, heating and cooling setpoints, HVAC input/output air temperatures, heat gain, and lighting settings. To complete this data bank of profiles, both national and international standards and regulations are used. To date, a total of 49 profiles in nine groups of the type shown in Table 3.6 have been identified [11].
Table 3.5 Input to the NKN [11]Information Source
Building geometry, areas, orientation, etc.
Reads from drawings or direct measurement
Climatic data From the internal database calculation tool
Occupancy profiles for activity areas assigned to each space
For consistency, these come from an internal database; building type and activity are chosen for each zone
Building envelope constructions Inputs parameters directly (“inference” procedures may be used for energy certification of existing buildings)
HVAC systems Selects from internal databases or input parameters
Lighting Selects from internal databases or inputs parameters
Figure 3.2 3D view of IFC model with integrated EPB analyses [7].
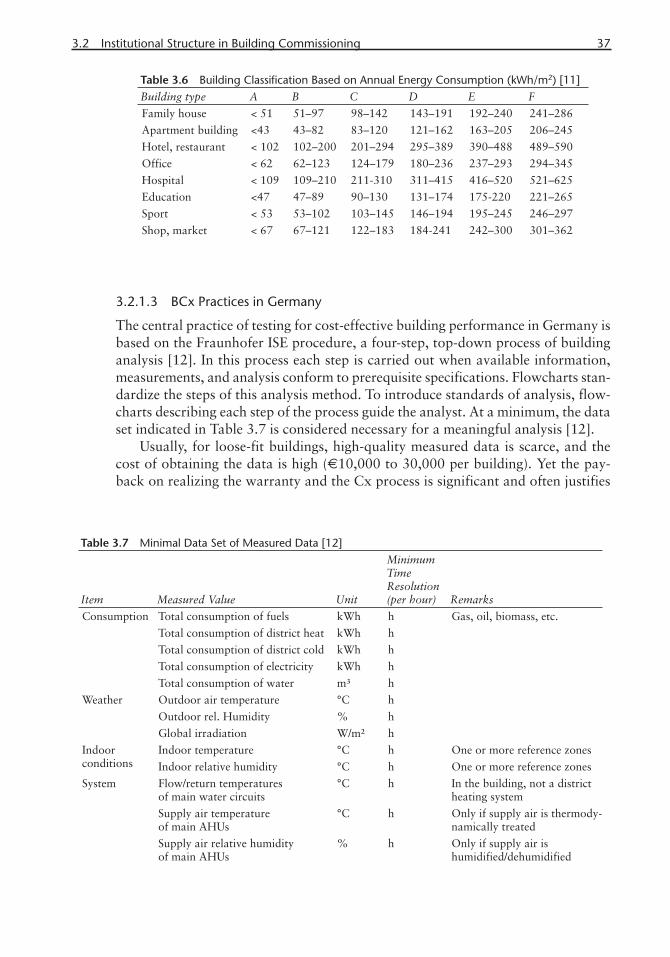
3.2 Institutional Structure in Building Commissioning 37
3.2.1.3 BCx Practices in Germany
The central practice of testing for cost-effective building performance in Germany is based on the Fraunhofer ISE procedure, a four-step, top-down process of building analysis [12]. In this process each step is carried out when available information, measurements, and analysis conform to prerequisite specifications. Flowcharts stan-dardize the steps of this analysis method. To introduce standards of analysis, flow-charts describing each step of the process guide the analyst. At a minimum, the data set indicated in Table 3.7 is considered necessary for a meaningful analysis [12].
Usually, for loose-fit buildings, high-quality measured data is scarce, and the cost of obtaining the data is high (€10,000 to 30,000 per building). Yet the pay-back on realizing the warranty and the Cx process is significant and often justifies
Table 3.6 Building Classification Based on Annual Energy Consumption (kWh/m2) [11]Building type A B C D E F
Family house < 51 51–97 98–142 143–191 192–240 241–286
Apartment building <43 43–82 83–120 121–162 163–205 206–245
Hotel, restaurant < 102 102–200 201–294 295–389 390–488 489–590
Office < 62 62–123 124–179 180–236 237–293 294–345
Hospital < 109 109–210 211-310 311–415 416–520 521–625
Education <47 47–89 90–130 131–174 175-220 221–265
Sport < 53 53–102 103–145 146–194 195–245 246–297
Shop, market < 67 67–121 122–183 184-241 242–300 301–362
Table 3.7 Minimal Data Set of Measured Data [12]
Item Measured Value Unit
MinimumTime Resolution(per hour) Remarks
Consumption Total consumption of fuels kWh h Gas, oil, biomass, etc.
Total consumption of district heat kWh h
Total consumption of district cold kWh h
Total consumption of electricity kWh h
Total consumption of water m³ h
Weather Outdoor air temperature °C h
Outdoor rel. Humidity % h
Global irradiation W/m² h
Indoor conditions
Indoor temperature °C h One or more reference zones
Indoor relative humidity °C h One or more reference zones
System Flow/return temperaturesof main water circuits
°C h In the building, not a district heating system
Supply air temperatureof main AHUs
°C h Only if supply air is thermody-namically treated
Supply air relative humidityof main AHUs
% h Only if supply air is humidified/dehumidified
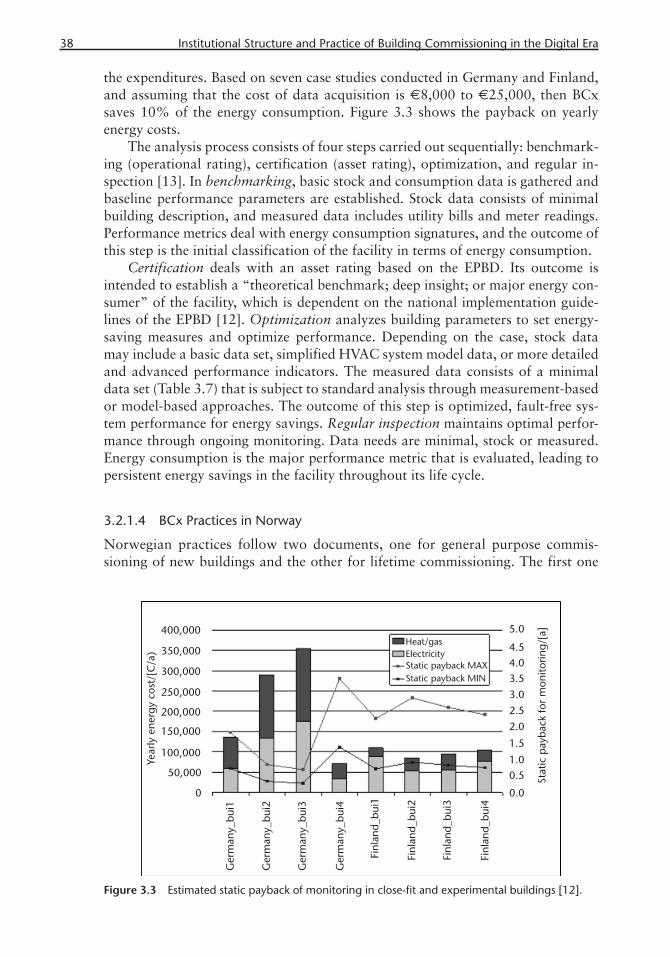
38 Institutional Structure and Practice of Building Commissioning in the Digital Era
the expenditures. Based on seven case studies conducted in Germany and Finland, and assuming that the cost of data acquisition is €8,000 to €25,000, then BCx saves 10% of the energy consumption. Figure 3.3 shows the payback on yearly energy costs.
The analysis process consists of four steps carried out sequentially: benchmark-ing (operational rating), certification (asset rating), optimization, and regular in-spection [13]. In benchmarking, basic stock and consumption data is gathered and baseline performance parameters are established. Stock data consists of minimal building description, and measured data includes utility bills and meter readings. Performance metrics deal with energy consumption signatures, and the outcome of this step is the initial classification of the facility in terms of energy consumption.
Certification deals with an asset rating based on the EPBD. Its outcome is intended to establish a “theoretical benchmark; deep insight; or major energy con-sumer” of the facility, which is dependent on the national implementation guide-lines of the EPBD [12]. Optimization analyzes building parameters to set energy-saving measures and optimize performance. Depending on the case, stock data may include a basic data set, simplified HVAC system model data, or more detailed and advanced performance indicators. The measured data consists of a minimal data set (Table 3.7) that is subject to standard analysis through measurement-based or model-based approaches. The outcome of this step is optimized, fault-free sys-tem performance for energy savings. Regular inspection maintains optimal perfor-mance through ongoing monitoring. Data needs are minimal, stock or measured. Energy consumption is the major performance metric that is evaluated, leading to persistent energy savings in the facility throughout its life cycle.
3.2.1.4 BCx Practices in Norway
Norwegian practices follow two documents, one for general purpose commis-sioning of new buildings and the other for lifetime commissioning. The first one
Figure 3.3 Estimated static payback of monitoring in close-fi t and experimental buildings [12].
3.2 Institutional Structure in Building Commissioning 39
(Standard NS 3935:2005) is called ITB for integrated technical building installa-tions, and is intended for close-fit and experimental building systems. It regulates the coordination of design, Cx of installations, and monitoring of building systems. It covers energy supply and distribution, indoor air quality, safety systems, com-munications, circulation, water systems, and O&M in new buildings. The Lifetime Commissioning Standard (NS 3451 and 3455) was fashioned after international standards in order to improve communication and interoperability between differ-ent agents of the Cx process. This standard recommends a nine-part process, not necessarily sequentially implemented (Table 3.8).
This plan is designed to realize “Owner’s Project Requirements (OPR) so that performance verification is possible at an early stage” [14]. In addition, it ensures effective “verification checklists and pre-functional test (PFT) procedures that en-sure proper equipment installation and functioning” [14]. However, due to the lack of customization of building types, these requirements do not come with pre-defined performance metrics. Currently, these procedures are implemented by and large manually [14].
3.2.2 Pacifi c Rim Countries
3.2.2.1 BCx Practices in Japan
Currently, BCx practices in Japan are guided by the standards issued by SHASE (Society of Heating, Air-Conditioning and Sanitary Engineers). These standards are designed to manage information flow as shown in Figure 3.4. This process has sev-eral problems, including manual handling of data, management of large amounts of BEMS data generated automatically, and a lack of interoperability between BCx and database applications. To remedy these problems, the interaction features il-lustrated in Figure 3.5 have been implemented [15].
First, a CAD application including a common file format for designers and con-tractors is created. This is defined to incorporate international standards like IFC, Seadec data eXchange Format (SXF), or Green Building XML (gbXML). Second, databases used in BCx operations are modified to store equipment manufacturer’s specifications, and operational, sensed data. Relational database management sys-tem (RDBMS) and Hierarchical Data Format version 5 (HDF5) technologies are being used to handle the size and complexity of these data formats. Some of this data can be public, such as performance and specification plots of equipment, as opposed to others, like the sensor collected time series data, which is kept private
Table 3.8 Relationship Between Parts and Outputs of the Lifetime Cx Approach [14]Framework forLifetime Cx Design Construction Operation
Part 1: Requirements Part 1.1: Performance requirements in the design phase
Part 1.2: Performance requirements in the con-struction phase
Part 1.3: Performance requirements in the operation phase
Part 2: Plan Part 2.1: Plan for com-missioning in the design phase
Part 2.2: Plan for commis-sioning in the construc-tion phase
Part 2.3: Plan for commissioning in the operation phase
Part 3: Common Performance requirements and description. This is a common document built through all three building phases.

40 Institutional Structure and Practice of Building Commissioning in the Digital Era
[15]. To address some of the problems with manual processing of data, several au-tomation tools have been developed. “Since it is inefficient to read data off of plot-ted data functions, a tool to build a mathematical model of an HVAC component from its specification curve was developed,” using a visual digitizer [15]. This tool displays the specification curve, digitizes the curve when prompted, and calculates model parameters automatically (Figure 3.6).
Figure 3.4 Present information fl ow of BCx practices in Japan [15].
Figure 3.5 Proposed information fl ow of BCx practices in Japan [15].
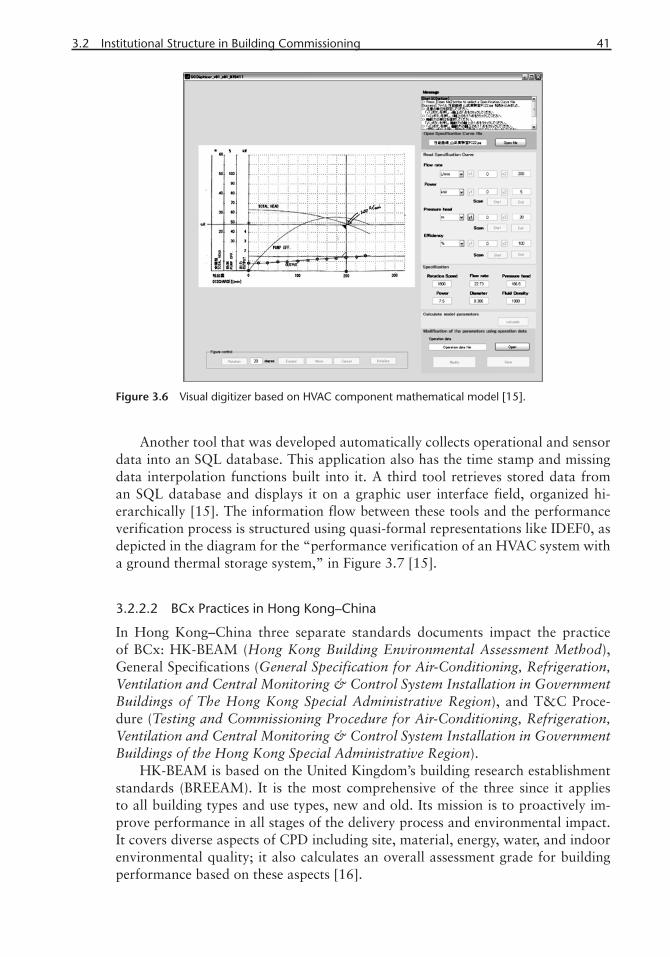
3.2 Institutional Structure in Building Commissioning 41
Another tool that was developed automatically collects operational and sensor data into an SQL database. This application also has the time stamp and missing data interpolation functions built into it. A third tool retrieves stored data from an SQL database and displays it on a graphic user interface field, organized hi-erarchically [15]. The information flow between these tools and the performance verification process is structured using quasi-formal representations like IDEF0, as depicted in the diagram for the “performance verification of an HVAC system with a ground thermal storage system,” in Figure 3.7 [15].
3.2.2.2 BCx Practices in Hong Kong–China
In Hong Kong–China three separate standards documents impact the practice of BCx: HK-BEAM (Hong Kong Building Environmental Assessment Method), General Specifications (General Specification for Air-Conditioning, Refrigeration, Ventilation and Central Monitoring & Control System Installation in Government Buildings of The Hong Kong Special Administrative Region), and T&C Proce-dure (Testing and Commissioning Procedure for Air-Conditioning, Refrigeration, Ventilation and Central Monitoring & Control System Installation in Government Buildings of the Hong Kong Special Administrative Region).
HK-BEAM is based on the United Kingdom’s building research establishment standards (BREEAM). It is the most comprehensive of the three since it applies to all building types and use types, new and old. Its mission is to proactively im-prove performance in all stages of the delivery process and environmental impact. It covers diverse aspects of CPD including site, material, energy, water, and indoor environmental quality; it also calculates an overall assessment grade for building performance based on these aspects [16].
Figure 3.6 Visual digitizer based on HVAC component mathematical model [15].
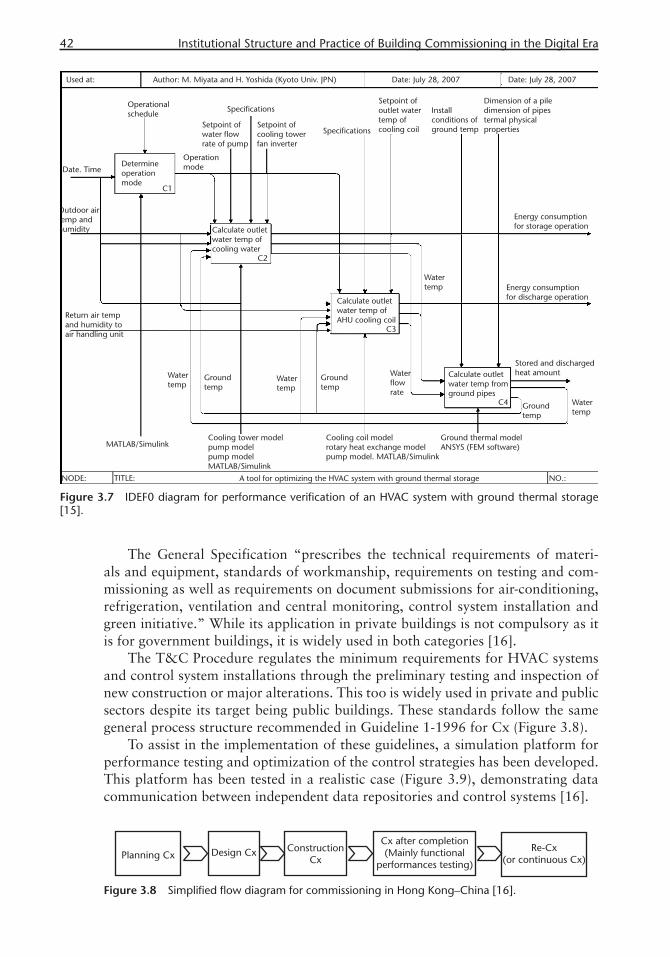
42 Institutional Structure and Practice of Building Commissioning in the Digital Era
The General Specification “prescribes the technical requirements of materi-als and equipment, standards of workmanship, requirements on testing and com-missioning as well as requirements on document submissions for air-conditioning, refrigeration, ventilation and central monitoring, control system installation and green initiative.” While its application in private buildings is not compulsory as it is for government buildings, it is widely used in both categories [16].
The T&C Procedure regulates the minimum requirements for HVAC systems and control system installations through the preliminary testing and inspection of new construction or major alterations. This too is widely used in private and public sectors despite its target being public buildings. These standards follow the same general process structure recommended in Guideline 1-1996 for Cx (Figure 3.8).
To assist in the implementation of these guidelines, a simulation platform for performance testing and optimization of the control strategies has been developed. This platform has been tested in a realistic case (Figure 3.9), demonstrating data communication between independent data repositories and control systems [16].
Figure 3.7 IDEF0 diagram for performance verifi cation of an HVAC system with ground thermal storage [15].
Figure 3.8 Simplifi ed fl ow diagram for commissioning in Hong Kong–China [16].
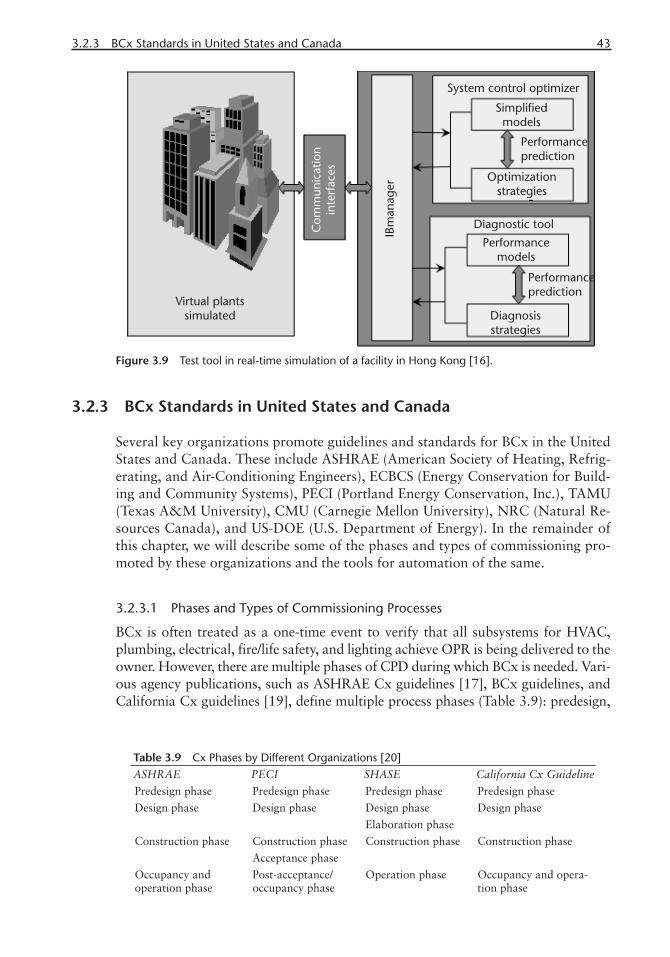
3.2.3 BCx Standards in United States and Canada 43
3.2.3 BCx Standards in United States and Canada
Several key organizations promote guidelines and standards for BCx in the United States and Canada. These include ASHRAE (American Society of Heating, Refrig-erating, and Air-Conditioning Engineers), ECBCS (Energy Conservation for Build-ing and Community Systems), PECI (Portland Energy Conservation, Inc.), TAMU (Texas A&M University), CMU (Carnegie Mellon University), NRC (Natural Re-sources Canada), and US-DOE (U.S. Department of Energy). In the remainder of this chapter, we will describe some of the phases and types of commissioning pro-moted by these organizations and the tools for automation of the same.
3.2.3.1 Phases and Types of Commissioning Processes
BCx is often treated as a one-time event to verify that all subsystems for HVAC, plumbing, electrical, fire/life safety, and lighting achieve OPR is being delivered to the owner. However, there are multiple phases of CPD during which BCx is needed. Vari-ous agency publications, such as ASHRAE Cx guidelines [17], BCx guidelines, and California Cx guidelines [19], define multiple process phases (Table 3.9): predesign,
Figure 3.9 Test tool in real-time simulation of a facility in Hong Kong [16].
Table 3.9 Cx Phases by Different Organizations [20]ASHRAE PECI SHASE California Cx Guideline
Predesign phase Predesign phase Predesign phase Predesign phase
Design phase Design phase Design phase Design phase
Elaboration phase
Construction phase Construction phase Construction phase Construction phase
Acceptance phase
Occupancy and operation phase
Post-acceptance/occupancy phase
Operation phase Occupancy and opera-tion phase

44 Institutional Structure and Practice of Building Commissioning in the Digital Era
design, construction, and occupancy/operation. The state of California has developed summary descriptions for their Cx guidelines for each phase (Table 3.10).
In the earliest phase, the OPR is expected to define clearly the design intent and program document, develop and update the initial Cx plan, determine related O&M requirements, and prepare the system manual and O&M training docu-ments. In addition to these requirements, there is multiple-stakeholder involvement, including the owner, architect, engineer, contractor, commissioner, and O&M staff. It can be observed in Tables 3.15 and 3.16 that these stakeholders are involved in defining requirement specifications for each phase. A large amount of information is generated, much of which needs to be shared with others or transferred to other phases of the CPD process. The BCx process subsumes all phases of delivery, from predesign to operation and maintenance; due to the broad scope indicated in the above tables four types of Cx have been created for use in the field (Table 3.11).
Table 3.10 Cx Activity and Process Type in Each BCx Phase for State of California
Predesign Design ConstructionOperation & Maintenance
Select a Cx lead
Predesign phase Cx meeting
Begin developing OPR
Develop initial Cx plan outline
Design phase meeting (if Pre-design meeting did not occur)
Perform Cx-focused design review
Update Cx plan
Develop Cx requirement for the specification
Begin planning for verification checklists, functional tests, system manual, and training requirement
Construction phase kick-off meeting
Review submittals, monitor de-velopment of shop and coordina-tion drawings
Review O&M manuals
Perform ongoing construction observation
Perform verification checks
Perform diagnostic monitoring
Perform functional testing
Develop Cx report and system manual
Develop Re-Cx plan
Review and verify owner’s staff training
Resolve outstand-ing Cx issue
Perform seasonal/ deferred testing
Perform new warranty-end review
Courtesy of the California Commission Collaborative [19].
Table 3.11 Four Types of Commissioning
Capital Project Delivery (CPD) ProcessOperation & Maintenance
Predesign Design Elaboration ConstructionOccupancy & Operation
Program Planning Preliminary design
Working design
Elaboration Construction Acceptance Post-acceptance
Ordinary operation
Initial Commissioning Ongoing Cx
Initial commissioning Re-Cx
Missing initial commissioning (or missing documentation on initial commissioning) Retro-Cx Courtesy of Annex 40, ECBCS, IEA [3].
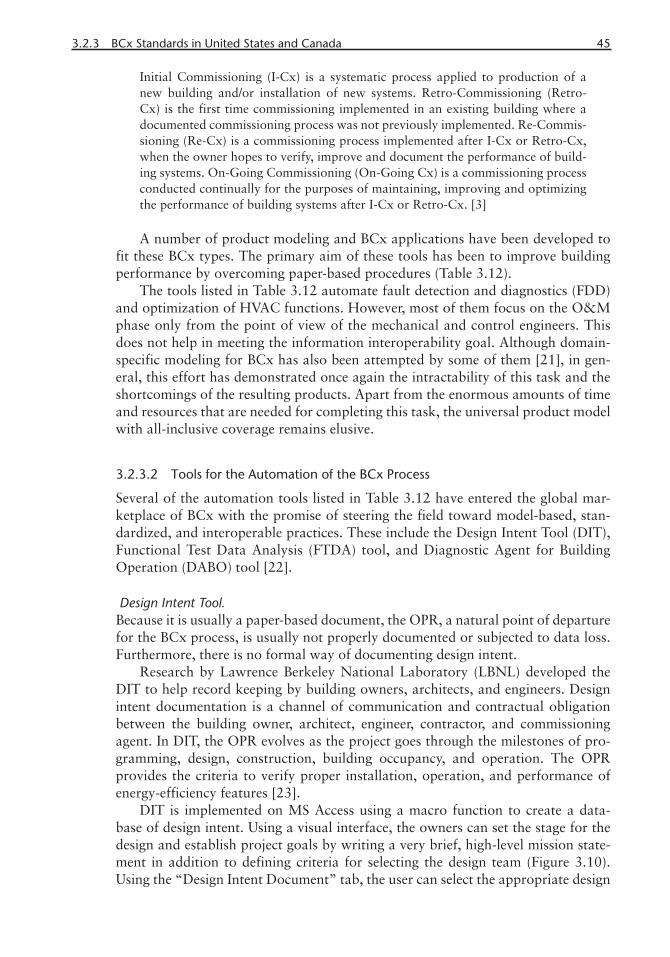
3.2.3 BCx Standards in United States and Canada 45
Initial Commissioning (I-Cx) is a systematic process applied to production of a new building and/or installation of new systems. Retro-Commissioning (Retro-Cx) is the first time commissioning implemented in an existing building where a documented commissioning process was not previously implemented. Re-Commis-sioning (Re-Cx) is a commissioning process implemented after I-Cx or Retro-Cx, when the owner hopes to verify, improve and document the performance of build-ing systems. On-Going Commissioning (On-Going Cx) is a commissioning process conducted continually for the purposes of maintaining, improving and optimizing the performance of building systems after I-Cx or Retro-Cx. [3]
A number of product modeling and BCx applications have been developed to fit these BCx types. The primary aim of these tools has been to improve building performance by overcoming paper-based procedures (Table 3.12).
The tools listed in Table 3.12 automate fault detection and diagnostics (FDD) and optimization of HVAC functions. However, most of them focus on the O&M phase only from the point of view of the mechanical and control engineers. This does not help in meeting the information interoperability goal. Although domain-specific modeling for BCx has also been attempted by some of them [21], in gen-eral, this effort has demonstrated once again the intractability of this task and the shortcomings of the resulting products. Apart from the enormous amounts of time and resources that are needed for completing this task, the universal product model with all-inclusive coverage remains elusive.
3.2.3.2 Tools for the Automation of the BCx Process
Several of the automation tools listed in Table 3.12 have entered the global mar-ketplace of BCx with the promise of steering the field toward model-based, stan-dardized, and interoperable practices. These include the Design Intent Tool (DIT), Functional Test Data Analysis (FTDA) tool, and Diagnostic Agent for Building Operation (DABO) tool [22].
Design Intent Tool.Because it is usually a paper-based document, the OPR, a natural point of departure for the BCx process, is usually not properly documented or subjected to data loss. Furthermore, there is no formal way of documenting design intent.
Research by Lawrence Berkeley National Laboratory (LBNL) developed the DIT to help record keeping by building owners, architects, and engineers. Design intent documentation is a channel of communication and contractual obligation between the building owner, architect, engineer, contractor, and commissioning agent. In DIT, the OPR evolves as the project goes through the milestones of pro-gramming, design, construction, building occupancy, and operation. The OPR provides the criteria to verify proper installation, operation, and performance of energy-efficiency features [23].
DIT is implemented on MS Access using a macro function to create a data-base of design intent. Using a visual interface, the owners can set the stage for the design and establish project goals by writing a very brief, high-level mission state-ment in addition to defining criteria for selecting the design team (Figure 3.10). Using the “Design Intent Document” tab, the user can select the appropriate design
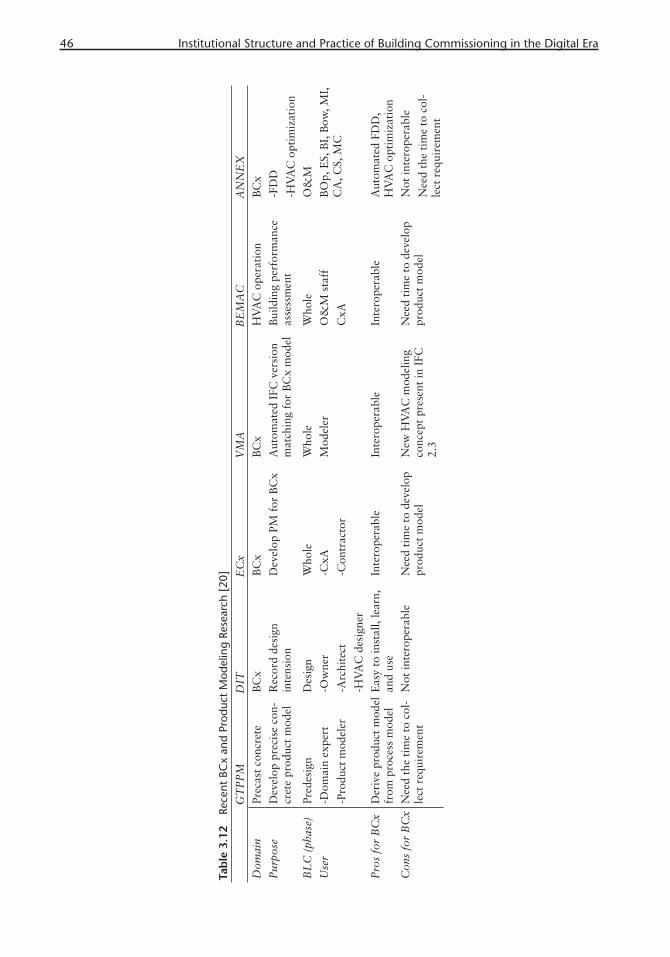
46 Institutional Structure and Practice of Building Commissioning in the Digital Era
Tab
le 3
.12
Rece
nt B
Cx
and
Prod
uct
Mod
elin
g Re
sear
ch [
20]
GT
PP
MD
ITE
Cx
VM
AB
EM
AC
AN
NE
X
Dom
ain
Prec
ast
conc
rete
BC
xB
Cx
BC
xH
VA
C o
pera
tion
BC
x
Pur
pose
Dev
elop
pre
cise
con
-cr
ete
prod
uct
mod
el
Rec
ord
desi
gn
inte
nsio
nD
evel
op P
M f
or B
Cx
Aut
omat
ed I
FC v
ersi
on
mat
chin
g fo
r B
Cx
mod
elB
uild
ing
perf
orm
ance
as
sess
men
t-F
DD
-HV
AC
opt
imiz
atio
n
BL
C (
phas
e)Pr
edes
ign
Des
ign
Who
leW
hole
Who
leO
&M
Use
r-D
omai
n ex
pert
-Pro
duct
mod
eler
-Ow
ner
-Arc
hite
ct
-HV
AC
des
igne
r
-CxA
-Con
trac
tor
Mod
eler
O&
M s
taff
CxA
BO
p, E
S, B
I, B
ow, M
I,
CA
, CS,
MC
Pro
s fo
r B
Cx
Der
ive
prod
uct
mod
el
from
pro
cess
mod
elE
asy
to in
stal
l, le
arn,
an
d us
e In
tero
pera
ble
Inte
rope
rabl
e In
tero
pera
ble
Aut
omat
ed F
DD
, H
VA
C o
ptim
izat
ion
Con
s fo
r B
Cx
Nee
d th
e ti
me
to c
ol-
lect
req
uire
men
tN
ot in
tero
pera
ble
Nee
d ti
me
to d
evel
op
prod
uct
mod
elN
ew H
VA
C m
odel
ing
conc
ept
pres
ent
in I
FC
2.3
Nee
d ti
me
to d
evel
op
prod
uct
mod
elN
ot in
tero
pera
ble
Nee
d th
e ti
me
to c
ol-
lect
req
uire
men
t
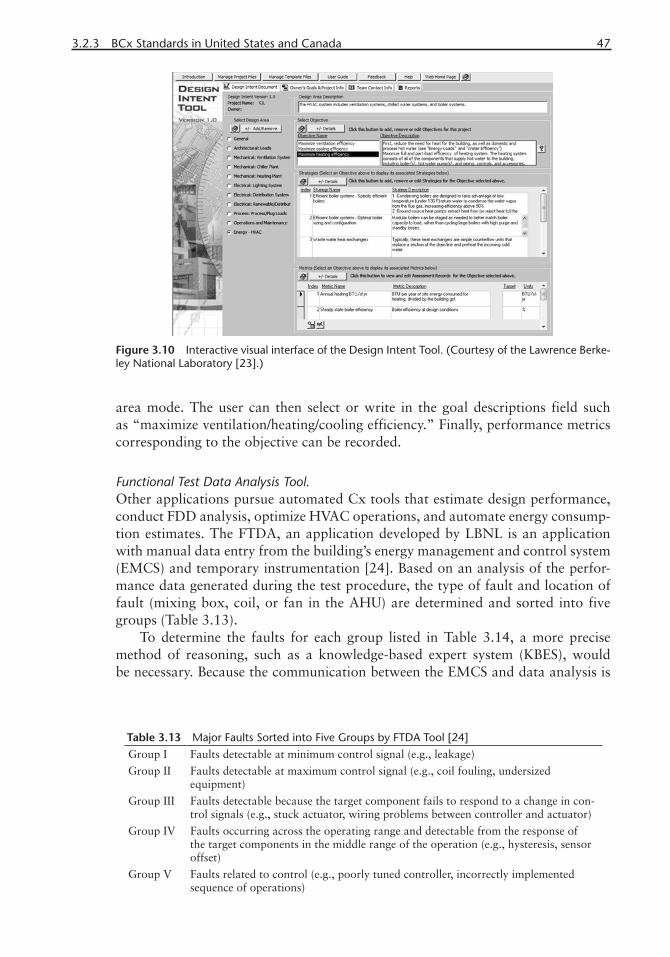
3.2.3 BCx Standards in United States and Canada 47
area mode. The user can then select or write in the goal descriptions field such as “maximize ventilation/heating/cooling efficiency.” Finally, performance metrics corresponding to the objective can be recorded.
Functional Test Data Analysis Tool.Other applications pursue automated Cx tools that estimate design performance, conduct FDD analysis, optimize HVAC operations, and automate energy consump-tion estimates. The FTDA, an application developed by LBNL is an application with manual data entry from the building’s energy management and control system (EMCS) and temporary instrumentation [24]. Based on an analysis of the perfor-mance data generated during the test procedure, the type of fault and location of fault (mixing box, coil, or fan in the AHU) are determined and sorted into five groups (Table 3.13).
To determine the faults for each group listed in Table 3.14, a more precise method of reasoning, such as a knowledge-based expert system (KBES), would be necessary. Because the communication between the EMCS and data analysis is
Figure 3.10 Interactive visual interface of the Design Intent Tool. (Courtesy of the Lawrence Berke-ley National Laboratory [23].)
Table 3.13 Major Faults Sorted into Five Groups by FTDA Tool [24]Group I Faults detectable at minimum control signal (e.g., leakage)
Group II Faults detectable at maximum control signal (e.g., coil fouling, undersized equipment)
Group III Faults detectable because the target component fails to respond to a change in con-trol signals (e.g., stuck actuator, wiring problems between controller and actuator)
Group IV Faults occurring across the operating range and detectable from the response of the target components in the middle range of the operation (e.g., hysteresis, sensor offset)
Group V Faults related to control (e.g., poorly tuned controller, incorrectly implemented sequence of operations)
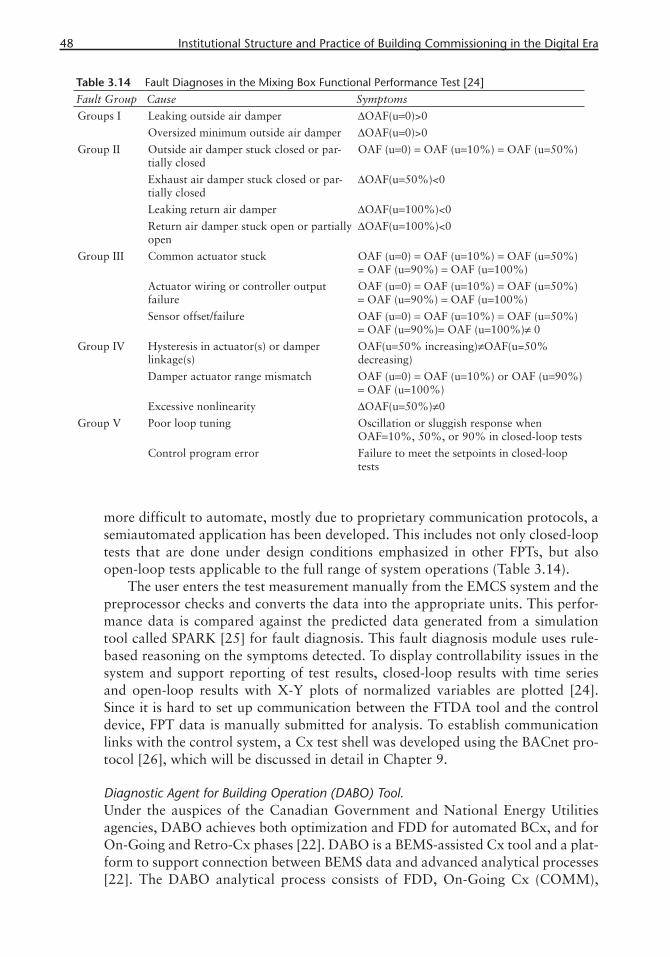
48 Institutional Structure and Practice of Building Commissioning in the Digital Era
more difficult to automate, mostly due to proprietary communication protocols, a semiautomated application has been developed. This includes not only closed-loop tests that are done under design conditions emphasized in other FPTs, but also open-loop tests applicable to the full range of system operations (Table 3.14).
The user enters the test measurement manually from the EMCS system and the preprocessor checks and converts the data into the appropriate units. This perfor-mance data is compared against the predicted data generated from a simulation tool called SPARK [25] for fault diagnosis. This fault diagnosis module uses rule-based reasoning on the symptoms detected. To display controllability issues in the system and support reporting of test results, closed-loop results with time series and open-loop results with X-Y plots of normalized variables are plotted [24]. Since it is hard to set up communication between the FTDA tool and the control device, FPT data is manually submitted for analysis. To establish communication links with the control system, a Cx test shell was developed using the BACnet pro-tocol [26], which will be discussed in detail in Chapter 9.
Diagnostic Agent for Building Operation (DABO) Tool.Under the auspices of the Canadian Government and National Energy Utilities agencies, DABO achieves both optimization and FDD for automated BCx, and for On-Going and Retro-Cx phases [22]. DABO is a BEMS-assisted Cx tool and a plat-form to support connection between BEMS data and advanced analytical processes [22]. The DABO analytical process consists of FDD, On-Going Cx (COMM),
Table 3.14 Fault Diagnoses in the Mixing Box Functional Performance Test [24]Fault Group Cause Symptoms
Groups I Leaking outside air damper ΔOAF(u=0)>0
Oversized minimum outside air damper ΔOAF(u=0)>0
Group II Outside air damper stuck closed or par-tially closed
OAF (u=0) = OAF (u=10%) = OAF (u=50%)
Exhaust air damper stuck closed or par-tially closed
ΔOAF(u=50%)<0
Leaking return air damper ΔOAF(u=100%)<0
Return air damper stuck open or partially open
ΔOAF(u=100%)<0
Group III Common actuator stuck OAF (u=0) = OAF (u=10%) = OAF (u=50%) = OAF (u=90%) = OAF (u=100%)
Actuator wiring or controller output failure
OAF (u=0) = OAF (u=10%) = OAF (u=50%) = OAF (u=90%) = OAF (u=100%)
Sensor offset/failure OAF (u=0) = OAF (u=10%) = OAF (u=50%) = OAF (u=90%)= OAF (u=100%)≠ 0
Group IV Hysteresis in actuator(s) or damper linkage(s)
OAF(u=50% increasing)≠OAF(u=50% decreasing)
Damper actuator range mismatch OAF (u=0) = OAF (u=10%) or OAF (u=90%) = OAF (u=100%)
Excessive nonlinearity ΔOAF(u=50%)≠0
Group V Poor loop tuning Oscillation or sluggish response when OAF=10%, 50%, or 90% in closed-loop tests
Control program error Failure to meet the setpoints in closed-loop tests
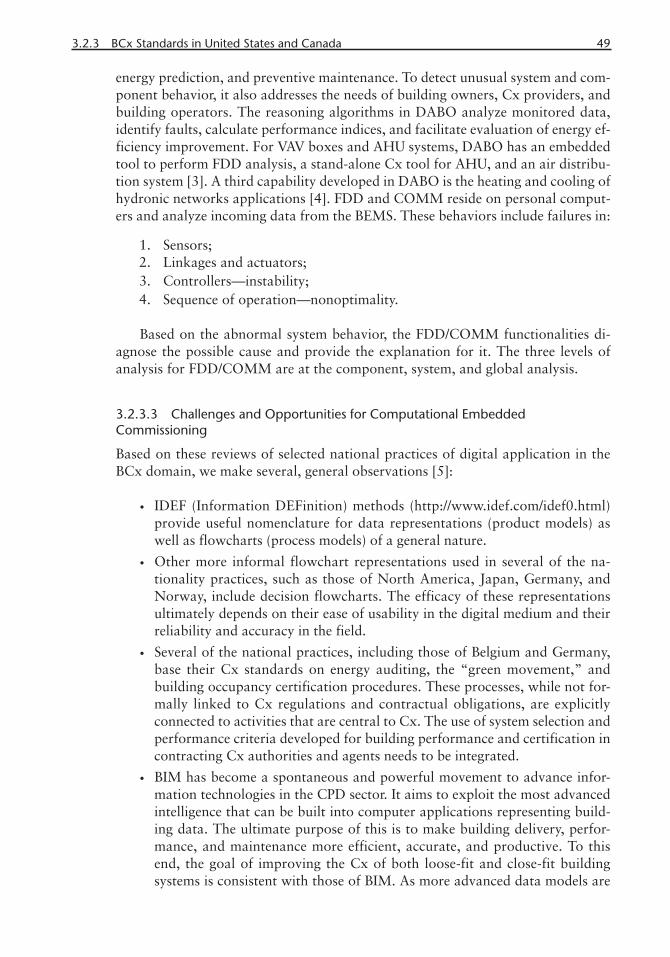
3.2.3 BCx Standards in United States and Canada 49
energy prediction, and preventive maintenance. To detect unusual system and com-ponent behavior, it also addresses the needs of building owners, Cx providers, and building operators. The reasoning algorithms in DABO analyze monitored data, identify faults, calculate performance indices, and facilitate evaluation of energy ef-ficiency improvement. For VAV boxes and AHU systems, DABO has an embedded tool to perform FDD analysis, a stand-alone Cx tool for AHU, and an air distribu-tion system [3]. A third capability developed in DABO is the heating and cooling of hydronic networks applications [4]. FDD and COMM reside on personal comput-ers and analyze incoming data from the BEMS. These behaviors include failures in:
1. Sensors; 2. Linkages and actuators;3. Controllers—instability;4. Sequence of operation—nonoptimality.
Based on the abnormal system behavior, the FDD/COMM functionalities di-agnose the possible cause and provide the explanation for it. The three levels of analysis for FDD/COMM are at the component, system, and global analysis.
3.2.3.3 Challenges and Opportunities for Computational Embedded Commissioning
Based on these reviews of selected national practices of digital application in the BCx domain, we make several, general observations [5]:
• IDEF (Information DEFinition) methods (http://www.idef.com/idef0.html) provide useful nomenclature for data representations (product models) as well as flowcharts (process models) of a general nature.
• Other more informal flowchart representations used in several of the na-tionality practices, such as those of North America, Japan, Germany, and Norway, include decision flowcharts. The efficacy of these representations ultimately depends on their ease of usability in the digital medium and their reliability and accuracy in the field.
• Several of the national practices, including those of Belgium and Germany, base their Cx standards on energy auditing, the “green movement,” and building occupancy certification procedures. These processes, while not for-mally linked to Cx regulations and contractual obligations, are explicitly connected to activities that are central to Cx. The use of system selection and performance criteria developed for building performance and certification in contracting Cx authorities and agents needs to be integrated.
• BIM has become a spontaneous and powerful movement to advance infor-mation technologies in the CPD sector. It aims to exploit the most advanced intelligence that can be built into computer applications representing build-ing data. The ultimate purpose of this is to make building delivery, perfor-mance, and maintenance more efficient, accurate, and productive. To this end, the goal of improving the Cx of both loose-fit and close-fit building systems is consistent with those of BIM. As more advanced data models are

50 Institutional Structure and Practice of Building Commissioning in the Digital Era
developed, standardization of Cx data and process models and interoperabil-ity of data between different agents and stages in the CPD process will reach higher levels of acceptance.
• Several data (product) modeling standards including STEP-21, EXPRESS Language of the industry foundation classes (IFCs), Seadec data eXchange Format (SXF), and Green Building XML (gbXML) are suitable for develop-ing new and better applications in the Cx domain.
• Furthermore, sophisticated digital applications are emerging in the Cx field, using Unified Modeling Language (UML) and object-oriented (OO) comput-ing. This demonstrates that mapping between stable and standardized prod-uct and process models will offer significant improvements in Cx standards and functionalities (Chapter 8).
• For these advances to become mainstream in the practice of BCx, a steep learning curve among researchers and practitioners is required. Until then, conventional database representations such as ACCESS, RDBMS, and HDF5 will be used to move into formalizing data representations and flowcharts. This will help create mature and robust data banks on which sound UML and OO applications can be constructed.
• Finally, there is a need for further work toward determining the most suitable visualization types and minimum data requirements. Data obtained from sensors and other building automation system (BAS) software can be ex-tremely detailed and overwhelming, especially in the field. Culling useful information from such data is a challenge. Visualization tools developed in digital applications, including carpet plots, data abstraction techniques, and 2D and 3D graphic tools can be effective in assisting Cx agents to quickly process large amounts of BAS data.
3.3 Emerging Requirements for BCx in the Information Age
The transition to the information age presents multiple interrelated and complex challenges that stem from the need for digital connectivity. Industrialized societies have made the transition into this world of information abundance through the Internet and related technologies that provide unimpeded access to data, people, institutions, and sensed information. This phenomenon pervades not only in the so-cial realm (YouTube, Facebook) but also in the business world through business-to-business (B2B) interactions and business to client or consumer (B2C), to employee (B2E), and to government institutions (B2G). In advanced industrialized nations, the overall volume of Internet connections confirms this trend. A similar trend is discerned in emerging industrialized nations, when we consider the rate of connec-tivity growth (Table 3.15).
As stated in Chapter 1, the AEC industry has been one of the last manufac-turing sectors to join the information technology (IT) movement. While its prog-ress is evident in all fronts, including design collaboration [28], ontology librar-ies [29, 30], data sharing [31], and standardization [32], its achievements pale in comparison to many other manufacturing areas, such as the auto, electronics, and
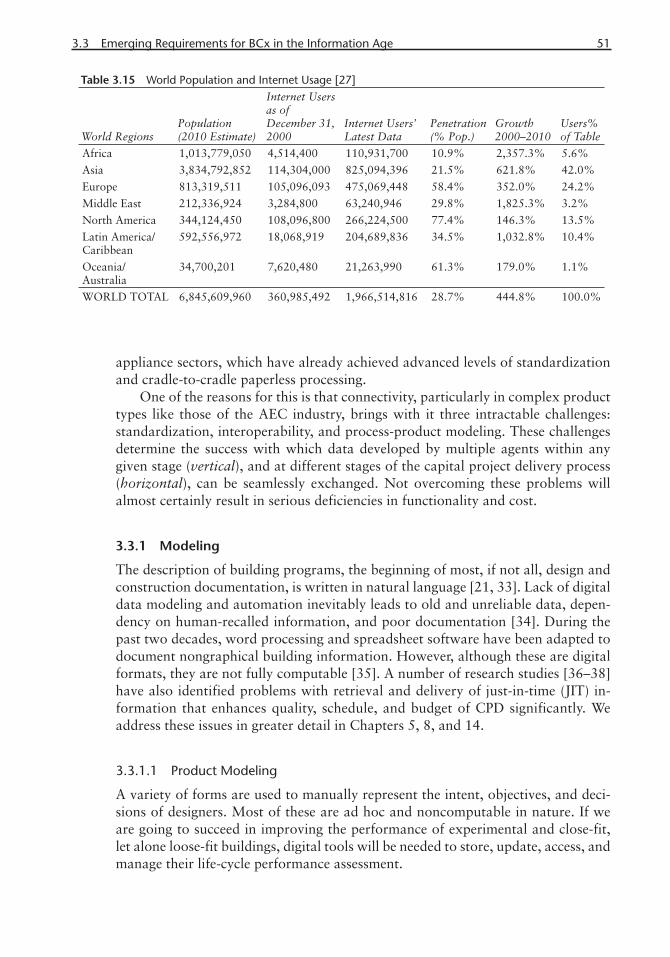
3.3 Emerging Requirements for BCx in the Information Age 51
appliance sectors, which have already achieved advanced levels of standardization and cradle-to-cradle paperless processing.
One of the reasons for this is that connectivity, particularly in complex product types like those of the AEC industry, brings with it three intractable challenges: standardization, interoperability, and process-product modeling. These challenges determine the success with which data developed by multiple agents within any given stage (vertical), and at different stages of the capital project delivery process (horizontal), can be seamlessly exchanged. Not overcoming these problems will almost certainly result in serious deficiencies in functionality and cost.
3.3.1 Modeling
The description of building programs, the beginning of most, if not all, design and construction documentation, is written in natural language [21, 33]. Lack of digital data modeling and automation inevitably leads to old and unreliable data, depen-dency on human-recalled information, and poor documentation [34]. During the past two decades, word processing and spreadsheet software have been adapted to document nongraphical building information. However, although these are digital formats, they are not fully computable [35]. A number of research studies [36–38] have also identified problems with retrieval and delivery of just-in-time (JIT) in-formation that enhances quality, schedule, and budget of CPD significantly. We address these issues in greater detail in Chapters 5, 8, and 14.
3.3.1.1 Product Modeling
A variety of forms are used to manually represent the intent, objectives, and deci-sions of designers. Most of these are ad hoc and noncomputable in nature. If we are going to succeed in improving the performance of experimental and close-fit, let alone loose-fit buildings, digital tools will be needed to store, update, access, and manage their life-cycle performance assessment.
Table 3.15 World Population and Internet Usage [27]
World RegionsPopulation (2010 Estimate)
Internet Usersas of December 31, 2000
Internet Users’Latest Data
Penetration(% Pop.)
Growth2000–2010
Users%of Table
Africa 1,013,779,050 4,514,400 110,931,700 10.9% 2,357.3% 5.6%
Asia 3,834,792,852 114,304,000 825,094,396 21.5% 621.8% 42.0%
Europe 813,319,511 105,096,093 475,069,448 58.4% 352.0% 24.2%
Middle East 212,336,924 3,284,800 63,240,946 29.8% 1,825.3% 3.2%
North America 344,124,450 108,096,800 266,224,500 77.4% 146.3% 13.5%
Latin America/ Caribbean
592,556,972 18,068,919 204,689,836 34.5% 1,032.8% 10.4%
Oceania/Australia
34,700,201 7,620,480 21,263,990 61.3% 179.0% 1.1%
WORLD TOTAL 6,845,609,960 360,985,492 1,966,514,816 28.7% 444.8% 100.0%
52 Institutional Structure and Practice of Building Commissioning in the Digital Era
Developing centralized and universally applicable product models in the digi-tal realm has its own challenges. While it is possible to create inclusive models saturated with data, it is next to impossible to codify and maintain ontologically comprehensive models for all times [39].
Various approaches to creating comprehensive models have been developed in different application domains. For instance, a graphical user interface and multidi-mensional performance environments that support different stakeholder decision making have been modeled through data warehousing. A decision support tool “that integrates energy-efficient decisions into existing maintenance planning” has been developed in the CLIP EPI-REM environment of Delft University [40]. A concerted effort for standardization of AEC products and processes has been in existence in Finland, through a series of research programs supported by the Finn-ish Funding Agency for Technology and Innovation (TEKES) and the Finnish con-struction industry [41]. This effort includes several major research tracks: RATAS, intended to create a research environment for cooperative joint work; SARA, in-tended to support participating networking business models and IT-based practices into the construction field; and VERA, distributed construction field IT methods and processes for continuous exchange of information between the customer, man-ufacturer, contractor, and designer without loss of the information spikes depicted in the sawtooth model shown in Figure 2.3.
There are two types of product models: general and domain specific [42]. Prob-lems with the universal model include the inability of any one model and its compu-tational power to support the range and diversity of design and analysis capabilities required in CPD. The process of developing product models based on the universal model approach is too complex, long, arduous, politically complicated, costly, and ultimately suboptimal [35, 43]. Often it results in a “least common denominator” for all potential capital projects, failing to satisfy anybody’s needs [35]. Conversely, in a limited domain, such product models specify only as much of the product data as required for use [35, 44]. A typical problem with such approaches is that prod-uct models useful in a given domain, say the BCx process, are hard to standardize due to the lack of standardization in that domain. Since the environment of each building and the configuration of its components are different, the Cx process has to be revised and modified to meet the project requirements of various owners [45].
There is an approach that mediates these two and utilizes information that is both easy for BIM applications to produce and for building analysis applications to consume information. For example, using an XML-based protocol, Green Building XML (gbXML) transfers building model data from BIM to Energy Plus, an energy simulation tool.
Even formal modeling using mathematical representations has been applied to product modeling [46]. Formal models are conducive to semantic and syntactic validation, data combination using ordinary mathematics, and ease of specification through matrix tools used in software engineering. In spite of these advantages, formal modeling has not caught on in the AEC domain. Rather, the standard prac-tice in the field relies on commercial products for BIM applications. A partial list of these vendors is in the left-hand column of Table 3.16.
We will address this topic in greater detail in Chapters 4 and 5. Process model-ing is another related topic that we will be addressed in detail in Chapter 8.
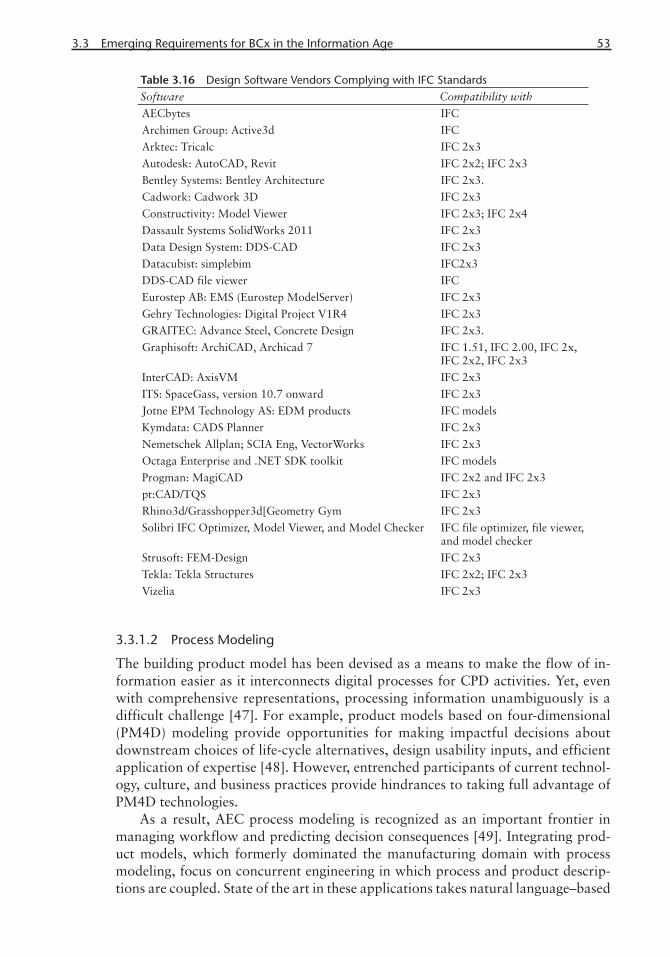
3.3 Emerging Requirements for BCx in the Information Age 53
3.3.1.2 Process Modeling
The building product model has been devised as a means to make the flow of in-formation easier as it interconnects digital processes for CPD activities. Yet, even with comprehensive representations, processing information unambiguously is a difficult challenge [47]. For example, product models based on four-dimensional (PM4D) modeling provide opportunities for making impactful decisions about downstream choices of life-cycle alternatives, design usability inputs, and efficient application of expertise [48]. However, entrenched participants of current technol-ogy, culture, and business practices provide hindrances to taking full advantage of PM4D technologies.
As a result, AEC process modeling is recognized as an important frontier in managing workflow and predicting decision consequences [49]. Integrating prod-uct models, which formerly dominated the manufacturing domain with process modeling, focus on concurrent engineering in which process and product descrip-tions are coupled. State of the art in these applications takes natural language–based
Table 3.16 Design Software Vendors Complying with IFC Standards Software Compatibility with
AECbytes IFC
Archimen Group: Active3d IFC
Arktec: Tricalc IFC 2x3
Autodesk: AutoCAD, Revit IFC 2x2; IFC 2x3
Bentley Systems: Bentley Architecture IFC 2x3.
Cadwork: Cadwork 3D IFC 2x3
Constructivity: Model Viewer IFC 2x3; IFC 2x4
Dassault Systems SolidWorks 2011 IFC 2x3
Data Design System: DDS-CAD IFC 2x3
Datacubist: simplebim IFC2x3
DDS-CAD file viewer IFC
Eurostep AB: EMS (Eurostep ModelServer) IFC 2x3
Gehry Technologies: Digital Project V1R4 IFC 2x3
GRAITEC: Advance Steel, Concrete Design IFC 2x3.
Graphisoft: ArchiCAD, Archicad 7 IFC 1.51, IFC 2.00, IFC 2x, IFC 2x2, IFC 2x3
InterCAD: AxisVM IFC 2x3
ITS: SpaceGass, version 10.7 onward IFC 2x3
Jotne EPM Technology AS: EDM products IFC models
Kymdata: CADS Planner IFC 2x3
Nemetschek Allplan; SCIA Eng, VectorWorks IFC 2x3
Octaga Enterprise and .NET SDK toolkit IFC models
Progman: MagiCAD IFC 2x2 and IFC 2x3
pt:CAD/TQS IFC 2x3
Rhino3d/Grasshopper3d[Geometry Gym IFC 2x3
Solibri IFC Optimizer, Model Viewer, and Model Checker IFC file optimizer, file viewer, and model checker
Strusoft: FEM-Design IFC 2x3
Tekla: Tekla Structures IFC 2x2; IFC 2x3
Vizelia IFC 2x3
54 Institutional Structure and Practice of Building Commissioning in the Digital Era
ontological approaches to represent design activities formally. In the domain-specif-ic modeling area, there have been several successful implementations for structural design, precast concrete construction, and BCx. This involves not only exchanges between different CAD systems but also between heterogeneous combinations like graphics and construction scheduling, material takeoff, and costing. Through these exchanges, several aspects of the CPD process can realize time and cost savings by virtue of automating tedious computational tasks and avoiding data incompatibil-ity errors. These aspects of process modeling and mapping into product models will be described in detail in Chapter 8.
3.3.2 Standardization
Modern manufacturing processes are dependent on versioning and alternative specifications of product components throughout their life cycle [50]. Whereas in other manufacturing sectors standardization is of paramount importance, in the AEC sector, there has been only limited product model standardization through the specification of building components like windows, doors, foundations, and wall assemblies. Although significant focus has been placed on standard 3D models of objects and building components, this has been a distraction, if not an impediment, to the difficult task of achieving true standardization for most if not all aspects of CPD.
This endeavor began at the grassroots level through ad hoc and improvised means of digital data exchange—through web access, DVDs, and CD-ROMs. Yet centralized and widely available standard platforms offer the best opportunity not just for data exchange but also for the subsequent computability of data [51]. The International BuildingSmart Consortium, previously known as the International Alliance for Interoperability (IAI), has dedicated its efforts to standardizing prod-uct data exchange formats. This has ultimately led to the creation of industry foun-dation classes (IFCs), a leading standard for the industry. IFCs “describe an object model with concepts (classes or terms), relations (as direct association or objecti-fied relationships), and attributes (or properties)” [52]. Based on IFCs, a multitude of design software systems have developed strategies for design collaboration and optimization toward better building performance [53] (Table 3.16).
However, from the point of view of a specific user of such universal models of standardization, often the models contain excessive information that increases processing overhead. For example, in an IFC-STEP file, a fan coil unit drawn in the AutoCAD Revit MEP application has 793 entity instances, a majority of which is taken up by geometric information, which is the least critical information in BCx. Only 88 out of 793 entity instances represent functional properties of the fan coil unit, while 705 instances are for geometric properties. IFC representations have responded to the increasing requirements of complex CPD processes by modeling AEC information in the third and fourth dimensions; however, some of the consul-tancy information best shown in 2D and related annotations have been left behind. As a result, an application of IAI called XM-4 has been developed to address this problem [54].
Bentley systems have proposed to exchange AEC-specific business-to-business information that is nongraphic through aecXML technology. The aecXML technol-ogy exchanges entities in building delivery processes without explicitly modeling
3.3 Emerging Requirements for BCx in the Information Age 55
the building. Taking advantage of the overlap between IFC and aecXML in rep-resenting nongraphic data, once a graphic representation is completed in IFC, the representation can be extended to other areas such as project management and cost estimation [55]. As a result, aecXML has become a part of BuildingSmart.
While IFCs offer the best chance the AEC industry has for a centralized stan-dard for seamless exchange of data, it needs to be extended significantly to meet the diverse requirements of interoperability in the AEC industry and the BCx area [56]. These include broader scope of information types, project types, exchange mechanisms, formalized transactions, model-based functionality, and project man-agement integration strategies. In Chapter 7, we will cover the opportunities pre-sented by data modeling standards, which are diverse and internationally located. These standards enable the sharing of building information in order to improve productivity in design, construction, and maintenance operations.
3.3.3 Interoperability
According to Froese [56] interoperability is the transferability of “a building prod-uct model data … with all of the relevant applications, throughout the life cycle of a facility or a building, by using a common logical structure.” Interoperability is intended to serve the seamless flow of information throughout the CPD process and building life cycle (Chapter 5).
Earlier we stated that a complete representation of the building’s design and construction is difficult to accomplish. Each stakeholder involved in the building delivery processes has the incentive to be interested only in a subset of BIM data. In spite of the fact that it has been a long-time goal of the myriad of tools, systems, and research projects [57–59], the ultimate success of seamless information ex-change, both horizontally and vertically, has been elusive.
For example, through the INTEROP NoE EC project guidelines, an ontologi-cal approach, nonstandard proprietary representations have been transformed into representations with fidelity of data standardization, information interoperability, and semantic consistency. To facilitate such interactions, the viability of linguistic models to support interoperability has been explored. A language called PSL (Pro-cess Specification Language) has been developed in order to translate proprietary data into a neutral-standard information representation and facilitate efficient and accurate communication between related AEC sectors [10, 60]. Another ontologi-cal approach is the ISO 15531 “MANDATE” (MANufacturing management DATa Exchange) to facilitate interoperability. MANDATE makes use of system theory to provide a general overview of manufacturing-management data modeling and standardized information exchange between software applications. MANDATE, which is written in EXPRESS, the exchange language of STEP, has been instru-mental in improving the costs, schedules, and quality of manufactured products through data management [10].
Multiprong efforts are being made at LBNL to implement tools and systems that assist interoperability. University College Cork developed a framework named BEMAC (Building Energy Monitoring Analyzing and Controlling) that is aimed at improving building operations by tracking performance metrics throughout the CPD [61]. They use the BIM technologies supported by IFC standards as the basis for interoperability (Figure 3.11). A C++ programming language–based application
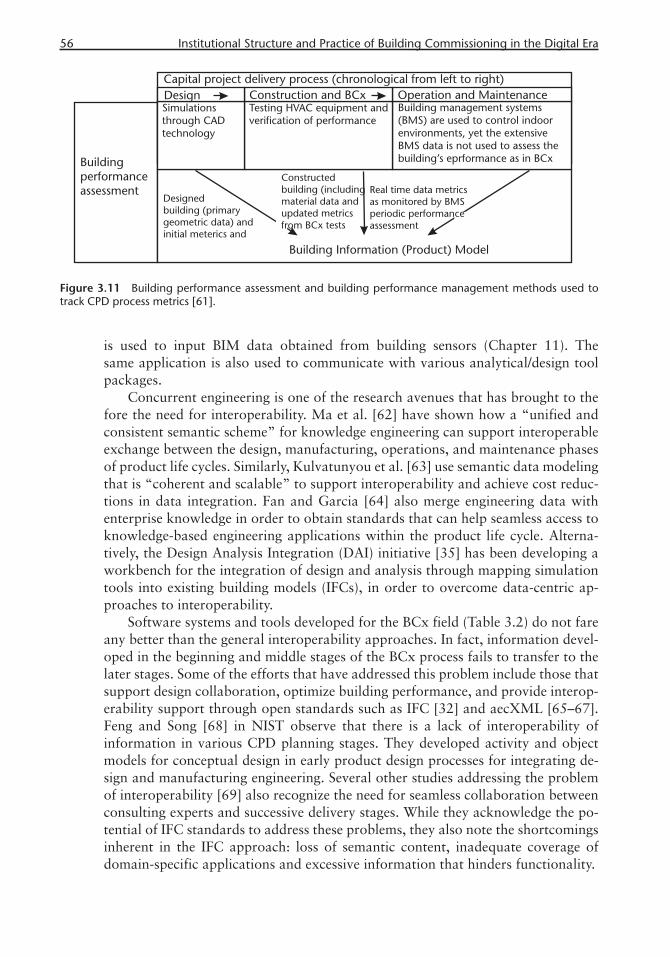
56 Institutional Structure and Practice of Building Commissioning in the Digital Era
is used to input BIM data obtained from building sensors (Chapter 11). The same application is also used to communicate with various analytical/design tool packages.
Concurrent engineering is one of the research avenues that has brought to the fore the need for interoperability. Ma et al. [62] have shown how a “unified and consistent semantic scheme” for knowledge engineering can support interoperable exchange between the design, manufacturing, operations, and maintenance phases of product life cycles. Similarly, Kulvatunyou et al. [63] use semantic data modeling that is “coherent and scalable” to support interoperability and achieve cost reduc-tions in data integration. Fan and Garcia [64] also merge engineering data with enterprise knowledge in order to obtain standards that can help seamless access to knowledge-based engineering applications within the product life cycle. Alterna-tively, the Design Analysis Integration (DAI) initiative [35] has been developing a workbench for the integration of design and analysis through mapping simulation tools into existing building models (IFCs), in order to overcome data-centric ap-proaches to interoperability.
Software systems and tools developed for the BCx field (Table 3.2) do not fare any better than the general interoperability approaches. In fact, information devel-oped in the beginning and middle stages of the BCx process fails to transfer to the later stages. Some of the efforts that have addressed this problem include those that support design collaboration, optimize building performance, and provide interop-erability support through open standards such as IFC [32] and aecXML [65–67]. Feng and Song [68] in NIST observe that there is a lack of interoperability of information in various CPD planning stages. They developed activity and object models for conceptual design in early product design processes for integrating de-sign and manufacturing engineering. Several other studies addressing the problem of interoperability [69] also recognize the need for seamless collaboration between consulting experts and successive delivery stages. While they acknowledge the po-tential of IFC standards to address these problems, they also note the shortcomings inherent in the IFC approach: loss of semantic content, inadequate coverage of domain-specific applications and excessive information that hinders functionality.
Figure 3.11 Building performance assessment and building performance management methods used to track CPD process metrics [61].

3.3 Emerging Requirements for BCx in the Information Age 57
3.3.4 Cost of Interoperability
Lack of interoperability has its cost that far exceeds the cost of implementing and maintaining these capabilities. A research project by the National Institute of Stan-dards and Technology (NIST) has documented the additional costs incurred by the building owner as a result of inadequate interoperability (Figure 3.12) [59]. The cost of inadequate interoperability in the O&M phase is the highest ($9 billion) compared to other phases. Interoperability of BCx data can help facilitate preven-tive maintenance amounting to substantial savings.
On the other hand, estimating the cost of interoperability in the entire AEC sec-tor is difficult. The industry lacks standards and is distributed, diverse, and poorly documented. However, there are comparable manufacturing industries in which the cost of interoperability has been estimated with reasonable accuracy. The auto-motive industry, although less unruly than the construction sector, is also large (9% of goods, 4% of employment in all of manufacturing; and 5% of all consumption expenditures (p. 1-1) [70], widely distributed in the lower tiers of the production cycle (first-tier suppliers: in the hundreds, some large some small; subtier suppliers: in the thousands, mostly small), and utilizes CAD tools that are similar to those of the AEC sector [70].
Multiple CAD/CAM systems used in the automobile supply chain are clas-sified into three tiers: original equipment manufacturers, first-tier suppliers, and sub-tier suppliers (p. 3-3) [70]. In the top tier CATIA, Unigraphics, CADDS, and I-DEAS are used. The representations developed in this system are then passed on to the second tier where CADDS, I-DEAS, Intergraph, pro/ENGINEER, CA-TIA, and Unigraphics are used. In turn, their representations are interlinked with those in the third tier, namely, CADKEY, ARIES, Applicon, ANVIL, AutoCAD, Pro/ENGINEER, I-DEAS, PDGS, HP, Intergraph, EUCLID, and CATIA [70]. More significantly, the sources of interoperability costs include a series of maintenance is-sues: redundant systems, multiple point-to-point translations, errors in translation, undetected translation errors, time lost due to manual entry of data, and transla-tion problems (p. 1-6) [70]. Once errors have been detected, there are several costly
Figure 3.12 Cost of inadequate interoperability by life-cycle phase (in $ millions) [59].
58 Institutional Structure and Practice of Building Commissioning in the Digital Era
courses of action such as reattempting to transfer, repairing the errors, or entering data from scratch. All of these factors contribute to the cost of inoperability.
In the automotive sector the sources of costs incurred due to interoperability also are diverse [70]. Based on the cost component approach, there are avoidance costs, mitigating costs, and delay costs. Using an aggregate cost approach, the to-tal costs consist of estimates of interoperability and “discounted present value” of delay costs [71] (Table 3.18). Both estimates agree that the total cost of in-teroperability is around a billion dollars a year. Adjusted to 2010 values, this is $2,786,972.000, which is more than 1% of the total sector expenditures. Based on the cost component approach, the estimate of avoidance cost is $52,799,000/year, mitigating costs are $907,645,000/year, and delay costs are $90,000,000/year, add-ing up to a total of $1,050,444,000/year [70].
In other CAD/CAM-related sectors, solutions to interoperability problems ad-vocate either standardization into a single system of exchange, providing tools for point-to-point translation, or manual data entry or neutral data translation [13, 71].
By far, the largest portion of interoperability costs is due to the need to repair or replace unusable data files—approximately $248 million per year is spent on cor-recting or recreating unusable data. On the average, rework requires an average of 4.9 hours per data exchange. With over 450,000 PDEs per year, this rework is extremely expensive in terms of engineering labor time. … Suppliers and tooling companies also incur significant mitigating costs. Suppliers incur over $204 million per year for reworking data files. [70]
In the aggregate cost approach, direct interoperability costs are $925,602,000/year, plus delayed profit losses amounting to $90,000,000/year, together represent-ing a total of $1,015,602,000 annual loss due to interoperability problems [70].
These challenges, namely, modeling, standardization, and interoperability and recent developments in several national practices around the globe, shed light on current trends. Data is volatile by nature. Depending on the phase of building de-livery, the actors involved in each phase, applicable standards, emerging technolo-gies, and corporate and institutional practices, the data needed for commissioning close-fit or loose-fit buildings can be very different. Therefore, the parameters of Cx data, users, and practices need to be standardized; representations that can carry data from one phase of building delivery to the next, and minimizing of data loss, need to be developed. Current efforts in the area of BIM need to be tapped into and parallel models and software applications for Cx are needed. Challenges of cost, function, and payback in using digital BCx tools need further research. Finally, historic data records for BCx need to be captured.
References
[1] Energy Effi ciency Planning and Management Guide, Offi ce of Energy Effi ciency, Natural Resources Canada, 2002.
[2] Society of Heating, Air-Conditioning and Sanitary Engineers of Japan, 2006, http://www.shasej.org/English, last accessed November 12, 2009.
3.3 Emerging Requirements for BCx in the Information Age 59
[3] International Energy Agency, Annex 40: Commissioning of Building HVAC Systems for Improving Energy Performance, 2004, http://www.commissioning-hvac.org, accessed Feb-ruary 17, 2009.
[4] International Energy Agency, Annex 47: Cost Effective Commissioning of Existing and Low Energy Buildings, 2008, http://cetc-varennes.nrcan.gc.ca/fi chier/37285/Fyler_work_program_e_fi nal.pdf, accessed March 21, 2008.
[5] Akın, Ö., et al., “Flow Charts and Data Models for Initial Commissioning of Advanced and Low Energy Building Systems,” Report No. 4, in Cost-Effective Commissioning of Existing and Low Energy Buildings, Annex 47 of the International Energy Agency’s Energy Conser-vation in Buildings and Community Systems Program, http://www.iea-annex47.org, 2010.
[6] European Commission, “Green Paper: Towards a European Strategy for the Security of Energy Supply,” contribution of Energie-Cités (adopted by the General Meeting, London Borough of Southwark, 5th April), Practical Guide to Contract Procedures for EC External Actions, 2000.
[7] Versele, A., “Belgium,” in “Flow Charts and Data Models for Initial Commissioning of Ad-vanced and Low Energy Building Systems,” O. Akin (Ed.), Report No. 4, in Cost-Effective Commissioning of Existing and Low Energy Buildings, Annex 47 of the International En-ergy Agency’s Energy Conservation in Buildings and Community Systems Program, http://www.iea-annex47.org, 2010.
[8] SketchUp, Google, SketchUp, http://www.sketchup.com, 2008.[9] REVIT, Autodesk, Revit Architecture, http://usa.autodesk.com, 2008.
[10] Cutting-Decelle, A. F., et al., “ISO 15531 MANDATE: A Product-Process-Resource Based Approach for Managing Modularity in Production Management,” Concurrent Engineer-ing: Research and Applications, Vol. 15, No. 2, 2007, pp. 217–235.
[11] Kabele, K., “Calculation of EPBD Energy Performance Certifi cation in the Czech Repub-lic,” in Proceedings of Indoor Climate of Buildings 2007, Bratislava: Slovenska spolocnost pro techniku prostredia, ISBN 978-80-89216-18-5, 2007, pp. 197–211.
[12] Neumann, C., and Jacob, D., Guidelines for the Evaluation of Building Performance, Re-port for the Framework of the IEE Project Building EQ: Tools and Methods for Linking EPDB and Continuous Commissioning, Freiburg, Germany: Fraunhofer Institute for Solar Energy Systems, http://www.buildingeq.eu, 2008.
[13] Mazzarella, L., et al., “Description of European Prototype Tool for Evaluation of Build-ing Performance and the National Tools,” in Intelligent Energy, Europe (IEE) Publication Agreement No. EIE/06/038/SI2.448300, supported by the European Commission. This report was prepared as a deliverable of Workpackage 5 of Building EQ, May 2009, http://www.buildingeq.eu.
[14] Djuric, N., “Norway,” in “Flow Charts and Data Models for Initial Commissioning of Ad-vanced and Low Energy Building Systems,” O. Akin (Ed.), Report No. 4, in Cost-Effective Commissioning of Existing and Low Energy Buildings, Annex 47 of the International En-ergy Agency’s Energy Conservation in Buildings and Community Systems Program, http://www.iea-annex47.org, 2010.,
[15] Yoshida, H., “Japan,” in “Flow Charts and Data Models for Initial Commissioning of Ad-vanced and Low Energy Building Systems,” O. Akin (Ed.), Report No. 4, in Cost-Effective Commissioning of Existing and Low Energy Buildings, Annex 47 of the International En-ergy Agency’s Energy Conservation in Buildings and Community Systems Program, http://www.iea-annex47.org, 2010.
[16] Wang, S., “China (Hong Kong),” in “Flow Charts and Data Models for Initial Commis-sioning of Advanced and Low Energy Building Systems,” O. Akin (Ed.), Report No. 4, in Cost-Effective Commissioning of Existing and Low Energy Buildings, Annex 47 of the International Energy Agency’s Energy Conservation in Buildings and Community Systems Program, http://www.iea-annex47.org, 2010.
[17] “The HVAC Commissioning Process,” Atlanta, GA: American Society of Heating, Refrig-erating, and Air-Conditioning Engineers, 1996.
60 Institutional Structure and Practice of Building Commissioning in the Digital Era
[18] PECI, “Building Commissioning Guidelines,” Bonneville Power Administration, U.S. De-partment of Energy, 1992.
[19] CCC, “California Commissioning Guide: New Buildings,” 2006, http://www.cacx.org/resources/documents/CA_Commissioning_Guide_New.pdf, last accessed November 11, 2009.
[20] Lee, K. J., Functionalizing Product and Process Models for Embedded Commissioning of Buildings, Unpublished PhD proposal, School of Architecture, Carnegie Mellon University, Pittsburgh, PA, 15217, USA, 2010
[21] Türkaslan-Bulbul, M. T., “Process and Product Modeling for Computational Support of Building Commissioning,” Ph.D. Dissertation, Carnegie Mellon University, Pittsburgh, PA, 2006.
[22] Choiniere, D., “DABO: A BEMS Assisted On-Going Commissioning Tool,” in Proceedings of National Conference on Building Commissioning, Newport Beach, CA, 2008.
[23] Lawrence Berkeley National Laboratory, “Design Intent Tool,” 2008, http://ateam.lbl.gov/DesignIntent/home.html, last accessed November 1, 2009.
[24] Xu, P., Haves, P., and Kim, M. “A Semi-Automated Functional Test Data Analysis Tool,” in Proceedings of National Conference on Building Commissioning, New York, NY, 2005.
[25] SPARK, “Simulation Problem Analysis and Research Kernel,” 2005, http://simulationre-search.lbl.gov, last accessed Oct 10, 2008.
[26] Xu, P., Haves, P. and Kim, M., “A Semi-Automated Functional Test Data Analysis Tool,” in Proceedings of National Conference on Building Commissioning, New York, NY, 2005.
[27] Internet World Stats, Usage and Population, June 30, 2010, http://www.internetworldstats.com/stats.htm. Copyright © 2000–2010, Miniwatts Marketing Group. All rights reserved worldwide.
[28] Nahm, Y. E., and Ishikawa, H. “Integrated Product and Process Modeling for Collab-orative Design Environment,” Concurrent Engineering, Vol. 12, No. 5, http://cer.sagepub.com/content/12/1/5, 2004.
[29] McCallum, A., Wang, X. and Mohanty, N. “Joint Group and Topic Discovery from Rela-tions and Text,” Statistical Network Analysis: Models, Issues and New Directions, Lecture Notes in Computer Science 4503, 2007, pp. 28–44.
[30] Katranuschkov, P., Gehre, A., and Scherer, R. J., Reusable Process Patterns for Collabora-tive Work Environments in AEC, Dresden, Germany: Institute of Construction Informat-ics. Funded by the FP6 project InteliGrid (IST-004664) of the European Commission and Project ArKoS (Project No. 01ISC35C) of the German Ministry of Education and Research (BMBF), 2008.
[31] East, C. M., Lee, G. and Sacks, R. “Deriving a Product Model from Process Models,” in Proceedings of ISPE/CE2002, Cranfi eld University, UK, 2002.
[32] EuroSTEP Inc., “4D Application Development: MS Project—IFC Mapping Specifi cation,” Released June 29, 2001.
[33] O’Sullivan, D. T. J., Keane, M. M, and Kelliher, D., “Improving Building Operation by Tracking Performance Metrics Throughout the Building Lifecycle (BLC),” Energy and Buildings, Vol. 36, No. 11, 2004, pp. 1075–1090.
[34] Lee, S.H., “Computational Fieldwork Support for Effi cient Operation and Maintenance of Mechanical, Electrical and Plumbing Systems,” Ph.D. Dissertation, Carnegie Mellon Uni-versity, Pittsburgh, PA, 2009.
[35] Augenbroe, G., et al., “An Interoperability Workbench for Design Analysis Integration,” Energy and Buildings, Vol. 36, No. 8, 2004, pp. 737–748.
[36] Clayton, M. J., Johnson, R. E., and Song, Y., Operations Documents: Addressing the In-formation Needs of Facility Managers, 1999, http://itc.scix.net/data/works/att/w78-1999-2441.content.pdf, last accessed January 16, 2007.
[37] Lui, L. Y., et al., “Capturing As-Built Project Information for Facility Management,” in Proceedings of First Congress Held in Conjunction with A/E/C Systems ASCE, Washing-ton, DC, 1994, pp. 614–612.

3.3 Emerging Requirements for BCx in the Information Age 61
[38] PECI, “O&M Best Practices Series: Operation and Maintenance Assessments,” 1999, http://www.energystar.gov/ia/business/assessment.pdf, last accessed December 16, 2008.
[39] Türkaslan-Bülbül, M.T., and Akın, Ö, “Computational Support for Building Evaluation: Embedded Commissioning Model,” Automation in Construction, Vol. 15, pp. 438–447.
[40] Gürsel, I., Sarıyıldız, S., Stouffs, R., and Akın, Ö., “Contextual Ontology Support as Exter-nal Knowledge Representation for Building Information Modeling,” in Proceedings of the 13th International CAAD Futures Conference, T. Tidafi and T. Dorta (Eds.), Montréal:,Les Presses de l’Université de Montréal, ISBN: 978-2-7606-2177-0, 2009.
[41] Penilla, H. “The State of the Art of Finnish Building Product Modeling Methodology,” in Computer Aided Architectural Design Futures, B. Martens and A. Brown (Eds.), Vienna: Springer Verlag, 2005, pp. 225–239.
[42] Ito, K., “General Product Model and Domain Specifi c Product Model in the A/E/C Indus-try,” in Proceedings of Computing in Civil Engineering/Proceedings of the Second Con-gress Held in Conjunction with A/E/C Systems ’95, Vol. 1, 1996, pp. 13–16.
[43] Spearpoint, M. J, “Integrating the IFC Building Product Model with Fire Zone Mod-els,” 2003, http://ir.canterbury.ac.nz/bitstream/10092/486/1/12589008_Integrating%20the%20IFC%20building%20product%20model%20with%20zone%20fi re%20simula-tion%20software.pdf, last accessed September 20, 2010.
[44] Spearpoint, M. J, “Integrating the IFC Building Product Model with Fire Zone Mod-els,” 2003, http://ir.canterbury.ac.nz/bitstream/10092/486/1/12589008_Integrating%20the%20IFC%20building%20product%20model%20with%20zone%20fi re%20simula-tion%20software.pdf, last accessed September 20, 2010.
[45] Akın, Ö, et al., “Product and Process Modeling for Functional Performance Testing in Low-Energy Building Embedded Commissioning Cases,” in Proceedings of the ICEBO Conference, San Francisco, CA, November 2007.
[46] Chadha, H., Baugh, J., and Wing, J., “Formal Specifi cation of AEC Product Models,” in Computing in Civil Engineering, Proceedings of the 1st Congress, American Society of Civil Engineers, 1994, pp. 571–578.
[47] Horvath, L., and Rudas, I. J., “Product Modeling Beyond Information,” in Proceedings of Applied Computational Intelligence and Informatics, SACI ’09, 5th International Sympo-sium, May 28–29, 2009, pp. 177–182.
[48] Kam, C., et al., “The Product Model and Fourth Dimension Project,” ITcon, Vol. 8, 2003, pp. 137–166, http://www.itcon.org/2003/11.
[49] Bletzinger, K. U., and Lähr, A., “Prediction of Interdisciplinary Consequences for Decisions in AEC Design Processes,” ITcon, Vol. 11, 2006, p. 529, http://www.itcon.org/2006/38/g.
[50] Tarandi, V., “Editorial: IFC—Product Models for the AEC Arena,” ITcon, Vol. 8, 2003, pp. 135–137, http://www.itcon.org.
[51] Owolabi, A., Anumba, C. J., and El-Hamalawi, A. “Architecture for implementing IFC-Based Online Construction Product Libraries,” ITcon, Vol. 8, 2003, pp. 201–218, http://www.itcon.org/2003/15.
[52] Lima, C., et al., “ A Historical Perspective on the Evolution of Controlled Vocabularies in Europe,” in Proceedings of the CIB W102 3rd International Conference 2007, Fraunhofer IRB Verlag, Stuttgart, Germany, 2007.
[53] “Industry Foundation Classes,” Wikipedia, http://en.wikipedia.org/wiki/Industry_Founda-tion_Classes, last modifi ed May 27, 2011.
[54] Kim I, Liebich, T., and Kim, S. S. “Development of a Two Dimensional Model Space Ex-tension for IAI/IFC2.X2nd Model,” ITcon, Vol. 8, 2003, pp. 219–230, http://www.itcon.org/2003/16.
[55] Froese, T., et al., “Industry Foundation Classes for Project Management—A Trial Imple-mentation,” ITcon, Vol. 4, November 1999, pp. 17–36, http://www.itcon.org/1999/2.
[56] Froese, T., “Future Directions for IFC-Based Interoperability,” ITcon, Vol. 8, 2003, pp. 231–246, http://www.itcon.org/2003/17.
62 Institutional Structure and Practice of Building Commissioning in the Digital Era
[57] Gallaher, M. P., et al., “Cost Analysis of Inadequate Interoperability in the US Capital Facilities Industry,” National Institute of Standards and Technology, Gaithersburg, MD, 2004.
[58] IAI, “International Alliance for Interoperability,” 2004, http://www.iai-na.org, last ac-cessed December 11, 2004.
[59] Yang, Q. Z., and Zhang, Y. “Semantic Interoperability in Building Design: Methods and Tools,” Computer Aided Design, Vol. 38, No. 10, 2006, pp. 1099–1112.
[60] Das, B., et al., “Towards the Understanding of the Requirements of a Communication Language to Support Process Interoperation in Cross-Disciplinary Supply Chains,” Inter-national Journal of Computer Integrated Manufacturing, Vol. 20, No. 4, June 2007.
[61] O’Sullivan, D. T. J., et al., “Improving Building Operation by Tracking Performance Met-rics Throughout the Building Lifecycle (BLC),” Energy and Buildings, Vol. 36, No. 11, 2004, pp. 1075–1090.
[62] Ma, Z. J., Wang, S.W., and Pau, W. K., “Secondary Loop Chilled Water in Super High-Rise,” ASHRAE Journal, Vol. 50, No. 5, 2008, pp. 42–52.
[63] Kulvatunyou, B., et al., “Development Life Cycle for Semantically Coherent Data Exchange Specifi cation,” Concurrent Engineering, Vol. 16, No. 4, 2008, p. 279. http://cer.sagepub.com/content/16/4/279.
[64] Fan, I. S., and Garcia, P. B., “International Standard Development for Knowledge Based Engineering Services for Product Lifecycle Management,” Concurrent Engineering, Vol. 16, No. 4, 2008, p. 271, http://cer.sagepub.com/content/16/4/271.
[65] AEX, “Automating Information Equipment Exchange,” 2004, http://www.fi atech.org/projects/idim/aex.htm, last accessed December 12, 2004.
[66] CIMSteel, “Computer Integrated Manufacturing for Constructional Steelwork,” 2004, http://www.cae.civil.leeds.ac.uk/past/cimsteel/cimsteel.htm, last accessed December 12, 2004.
[67] COMBINE, “Computer Models for the Building Industry in Europe,” http://erg.ucd.ie/combine.html, last accessed December 12, 2004.
[68] Feng, S. C., and Song, E. Y. “Information Modeling of Conceptual Design Integrated with Process Planning,” in Proceedings of Symposia on Design for Manufacturability, 2000 In-ternational Mechanical Engineering Congress and Exposition, Orlando, FL, 2000.
[69] Sacksa, R., et al., “The Rosewood Experiment—Building Information Modeling and In-teroperability for Architectural Precast Facades,” Automation in Construction, Vol. 19, No. 4, July 2010, pp. 419–432.
[70] Brunnermeier, S. B., and Martin, S. A., Interoperability Cost Analysis of the U.S. Automo-tive Supply Chain, Final Report: RTI Project Number 7007-03, prepared at Research Tri-angle Institute, Center for Economics Research, Research Triangle Park, 3040 Cornwallis Road, Post Offi ce Box 12194, North Carolina 27709-2194 USA, for Gregory Tassey, Na-tional Institute of Standards and Technology, Bldg. 101, Room A1013, Gaithersburg, MD 20899-1060, 1999.
[71] Doty, R., “Open Systems: The Next STEP,” Action Line, January/February, 1994, pp. 30–33.
63
C H A P T E R 4
Product and Process Models for Building Commissioning
4.1 The Need for Product and Process Models in Building Commissioning
Building features fulfill performance categories that need to be evaluated for con-formance to a variety of requirements. However, evaluation procedures in the architecture-engineering-construction (AEC) sector are complex. Furthermore, the multifaceted nature of the capital project delivery (CPD) process presents an obstacle for defining measurement methods toward a general-purpose evaluation objective. This leads to practices that use isolated measurements with discrete ob-jectives. To improve building quality and value throughout its life cycle, evaluation should be a persistent part of the operations and maintenance of CPD [1–3]. Persis-tent evaluation can be achieved through a systematic and standardized approach. The need for building evaluation and the significance of Embedded Commissioning (ECx) has been discussed in Chapters 1 and 2.
As for any other aspect of building evaluation, the building commissioning (BCx) process needs to become systematic and standardized [3, 4]. Related prac-tices and evaluation techniques need to be standardized among various BCx pro-viders. This is important for two reasons: First, having standard data in the domain will provide a universal basis for equipment design, maintenance, and assessment. Second, it will provide seamless information flow, ease of interoperability, and fa-cilitate communication among stakeholders including manufacturers, designers, and maintenance staff [2]. The importance of standardization and interoperability in the AEC sector is clearly defined in the literature [6–11] and elaborated on in Chapter 3.
In this context, it is important to have reliable standards for ECx data, test procedures, and methods. For example, while testing an air-handling unit (AHU) fan, BCx providers should apply standard inspection protocols like verifying that a fan is installed, operational, and oriented in the correct airflow direction. In prac-tice, procedures and methods used for a specific equipment test may have to differ depending on who is performing the test, for what purpose, the type of building, and whether it is done before or after the building is occupied [11].
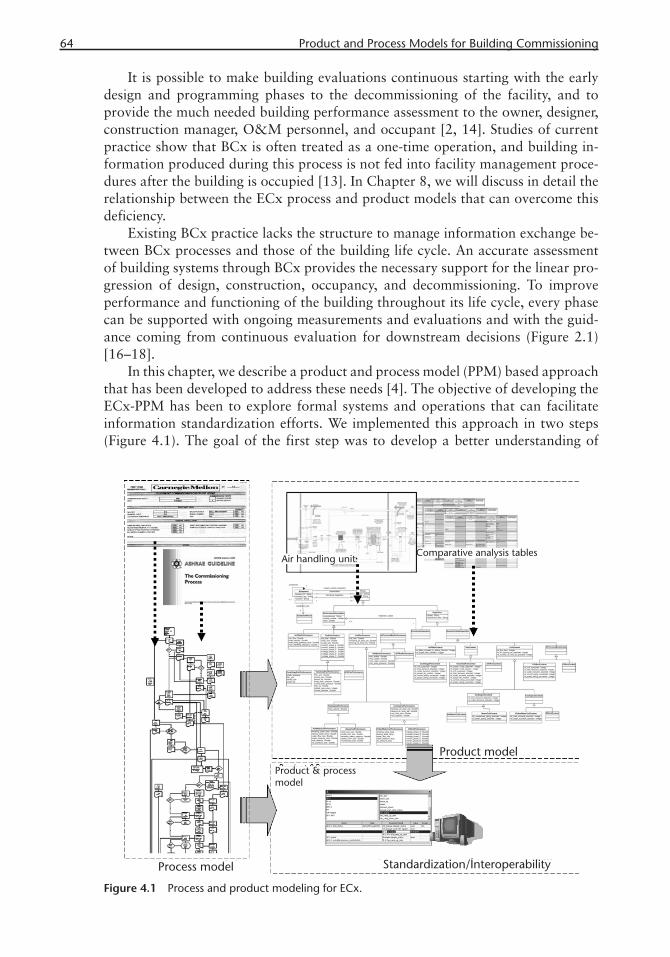
64 Product and Process Models for Building Commissioning
It is possible to make building evaluations continuous starting with the early design and programming phases to the decommissioning of the facility, and to provide the much needed building performance assessment to the owner, designer, construction manager, O&M personnel, and occupant [2, 14]. Studies of current practice show that BCx is often treated as a one-time operation, and building in-formation produced during this process is not fed into facility management proce-dures after the building is occupied [13]. In Chapter 8, we will discuss in detail the relationship between the ECx process and product models that can overcome this deficiency.
Existing BCx practice lacks the structure to manage information exchange be-tween BCx processes and those of the building life cycle. An accurate assessment of building systems through BCx provides the necessary support for the linear pro-gression of design, construction, occupancy, and decommissioning. To improve performance and functioning of the building throughout its life cycle, every phase can be supported with ongoing measurements and evaluations and with the guid-ance coming from continuous evaluation for downstream decisions (Figure 2.1) [16–18].
In this chapter, we describe a product and process model (PPM) based approach that has been developed to address these needs [4]. The objective of developing the ECx-PPM has been to explore formal systems and operations that can facilitate information standardization efforts. We implemented this approach in two steps (Figure 4.1). The goal of the first step was to develop a better understanding of
Figure 4.1 Process and product modeling for ECx.
4.2 Capturing the Building Commissioning Process in a Flowchart 65
how BCx works. The ECx process model was created to represent an illustrative BCx scenario. A detailed description of the illustrative scenario can be found in [2, 21]. More detail on the process is also given in [4]. In this chapter, our focus is specifically on the ECx process model. We describe the general layout and the flow of the BCx tasks. Guidelines from the American Society of Heating, Refrigerating and Air-Conditioning Engineers (ASHRAE) [23, 24] are used as the main source for the scenario. Then, an observed BCx process is compared and incorporated into the ideal scenario to identify the general layout of BCx operations and how they are practiced in the real world.
The second step of the ECx-PPM approach involves creating an ontological framework for representing the specific BCx information through an object-based data model (Chapter 8). ECx tasks and documents identified in the process model are used as a source in this step for identifying specific ECx documents. Because a very large amount of information is generated during the ECx process, we lim-ited our exploration to the object model of a singular building component: an air-handling unit (AHU). To generate a robust structure that can easily be expanded to include every component in a building system, we developed a modular configura-tion for the ECx data model.
4.2 Capturing the Building Commissioning Process in a Flowchart
In the ASHRAE guidelines [24–26] the BCx process is defined as a comprehensive progression of specifications, tests, and measurements. So far, ASHRAE has pub-lished three guidelines on commissioning. The first guideline was published in 1989 [20] and later superseded by a more comprehensive version, Guideline 1-1996. The second [21] and third [19] guidelines were published in 2005 and 2007, re-spectively. The focus of the first guideline is specifically on HVAC commissioning, whereas Guideline 0-2005 has a larger scope and defines the process from a more general perspective for the commissioning of all building systems. The most recent guideline, Guideline 1.1-2007, complements Guideline 1-1996 by focusing on the HVAC domain and providing details on the technical requirements of HVAC Cx. All three guidelines are specification-oriented documents that give in-depth and thorough descriptions on how to perform BCx tasks. Sample documents for report-ing are provided together with testing procedures and data collection sheets.
In addition, example documentation and guidelines for BCx have been pub-lished by private companies that provide such services as well as local and state agencies that standardize BCx practices under their jurisdiction. It would serve the uninitiated reader to quickly review some of the sample documents and procedures recommended by these entities, before reading through the detailed description of ASHRAE’s guidelines, which exemplify the “best practices” in the field, that we provide in this chapter. In Table 4.1 we provide some links to notable private and public web resources that exemplify BCx practices.
Our ECx process model aims to take the standard process descriptions in the ASHRAE guidelines and elaborate on them further by defining every task, docu-ment, and decision point. Since the scope of PPM covers AHU commissioning,
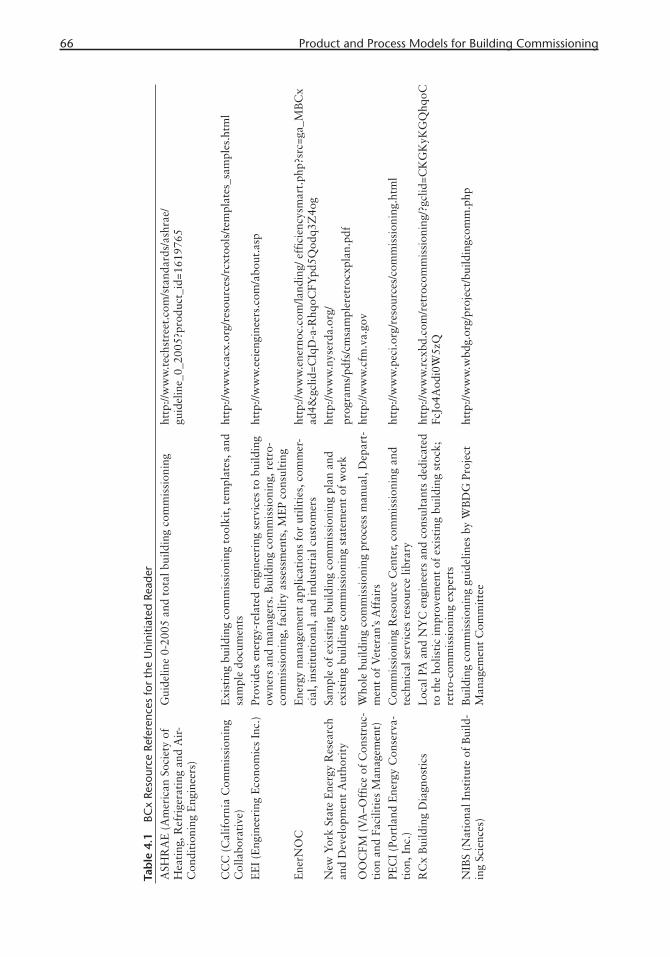
66 Product and Process Models for Building Commissioning
Tab
le 4
.1
BCx
Reso
urce
Ref
eren
ces
for
the
Uni
nitia
ted
Read
erA
SHR
AE
(A
mer
ican
Soc
iety
of
Hea
ting
, Ref
rige
rati
ng a
nd A
ir-
Con
diti
onin
g E
ngin
eers
)
Gui
delin
e 0-
2005
and
tot
al b
uild
ing
com
mis
sion
ing
http
://w
ww
.tec
hstr
eet.
com
/sta
ndar
ds/a
shra
e/gu
idel
ine_
0_20
05?p
rodu
ct_i
d=16
1976
5
CC
C (
Cal
ifor
nia
Com
mis
sion
ing
Col
labo
rati
ve)
Exi
stin
g bu
ildin
g co
mm
issi
onin
g to
olki
t, t
empl
ates
, and
sa
mpl
e do
cum
ents
http
://w
ww
.cac
x.or
g/re
sour
ces/
rcxt
ools
/tem
plat
es_s
ampl
es.h
tml
EE
I (E
ngin
eeri
ng E
cono
mic
s In
c.)
Prov
ides
ene
rgy-
rela
ted
engi
neer
ing
serv
ices
to
build
ing
owne
rs a
nd m
anag
ers.
Bui
ldin
g co
mm
issi
onin
g, r
etro
-co
mm
issi
onin
g, f
acili
ty a
sses
smen
ts, M
EP
cons
ulti
ng
http
://w
ww
.eei
engi
neer
s.co
m/a
bout
.asp
Ene
rNO
CE
nerg
y m
anag
emen
t ap
plic
atio
ns f
or u
tilit
ies,
com
mer
-ci
al, i
nsti
tuti
onal
, and
indu
stri
al c
usto
mer
s ht
tp://
ww
w.e
nern
oc.c
om/la
ndin
g/ e
ffic
ienc
ysm
art.
php?
src=
ga_M
BC
x ad
4&gc
lid=C
IqD
-a-R
hqoC
FYpd
5Qod
q3Z
4og
New
Yor
k St
ate
Ene
rgy
Res
earc
h an
d D
evel
opm
ent
Aut
hori
ty
Sam
ple
of e
xist
ing
build
ing
com
mis
sion
ing
plan
and
ex
isti
ng b
uild
ing
com
mis
sion
ing
stat
emen
t of
wor
kht
tp://
ww
w.n
yser
da.o
rg/
prog
ram
s/pd
fs/c
msa
mpl
eret
rocx
plan
OO
CFM
(V
A–O
ffic
e of
Con
stru
c-ti
on a
nd F
acili
ties
Man
agem
ent)
W
hole
bui
ldin
g co
mm
issi
onin
g pr
oces
s m
anua
l, D
epar
t-m
ent
of V
eter
an’s
Aff
airs
ht
tp://
ww
w.c
fm.v
a.go
v
PEC
I (P
ortl
and
Ene
rgy
Con
serv
a-ti
on, I
nc.)
C
omm
issi
onin
g R
esou
rce
Cen
ter,
com
mis
sion
ing
and
tech
nica
l ser
vice
s re
sour
ce li
brar
y ht
tp://
ww
w.p
eci.o
rg/r
esou
rces
/com
mis
sion
ing.
htm
l
RC
x B
uild
ing
Dia
gnos
tics
Loc
al P
A a
nd N
YC
eng
inee
rs a
nd c
onsu
ltan
ts d
edic
ated
to
the
hol
isti
c im
prov
emen
t of
exi
stin
g bu
ildin
g st
ock;
re
tro-
com
mis
sion
ing
expe
rts
http
://w
ww
.rcx
bd.c
om/r
etro
com
mis
sion
ing/
?gcl
id=C
KG
KyK
GQ
hqoC
FcJo
4Aod
i0W
5zQ
NIB
S (N
atio
nal I
nsti
tute
of
Bui
ld-
ing
Scie
nces
) B
uild
ing
com
mis
sion
ing
guid
elin
es b
y W
BD
G P
roje
ct
Man
agem
ent
Com
mit
tee
http
://w
ww
.wbd
g.or
g/pr
ojec
t/bu
ildin
gcom
m.p
hp
4.2 Capturing the Building Commissioning Process in a Flowchart 67
we specifically focused on Guideline 1-1996 and Guideline 1.1-2007. Our ECx process model representation is intended to visually capture the crucial steps in HVAC-Cx and shows the general flow of BCx while illustrating the relationships between different tasks and decision points. In this representation, it is also pos-sible to observe how the information is transferred and modified from one party to another while the changes are tracked and recorded in log files.
To map the differences between an ideal scenario and real world practice, we compared the Process Model with an observed BCx example [17], Then we orga-nized a flowchart similar to a design-bid-construct process, capturing the Process model contained in ASHRAE’s BCx description that consists of five main phas-es: predesign, design, construction, acceptance, and post-acceptance (Figures 4.2 through 4.6) [32, 33].
All BCx procedures, including those that pertain to the HVAC-BCx process, can be explained in relation to these phases. This process model distinguishes tasks from documents. BCx tasks that are explained in the ASHRAE guideline [19] are represented in the flowchart in Figures 4.2 through 4.6, and the professional per-forming each task is denoted in the “action” box. All inputs and outputs of tasks are identified and relationships between documents are differentiated, such as “part-of” and “transformation relations” (Figure 4.7). This helps to keep track of changes in the BCx documentation. Every document is represented as the output of a certain task. We also distinguished between decision points and roles of deci-sion makers. Accept or reject conditions are identified for decisions. In the process model, every procedure is divided into simple actions. This helped in identifying and representing some key steps for HVAC Cx.
4.2.1 Process Model Terminology
The terms used in the process model, as discussed next, map into the descriptions of the BCx process in the ASHRAE guideline [19]:
ActorsOwner: A person or company, who owns the property, hires the commissioning authority, and has the right to decide building-related issues.
Commissioning authority: The person chosen to implement the overall commis-sioning process. The commissioning authority can be a company or an agent that is specialized in this practice and has the necessary experience in the AEC industry.
Design professional: The person or company hired by the owner responsible for the design of the building.
Construction manager: The designated person, company, or agent who is respon-sible for managing the overall construction process.
DocumentsBasis of design: The information that is essential to realize the design intent, such as targeted cost, climate conditions, design considerations, codes, and regulations.
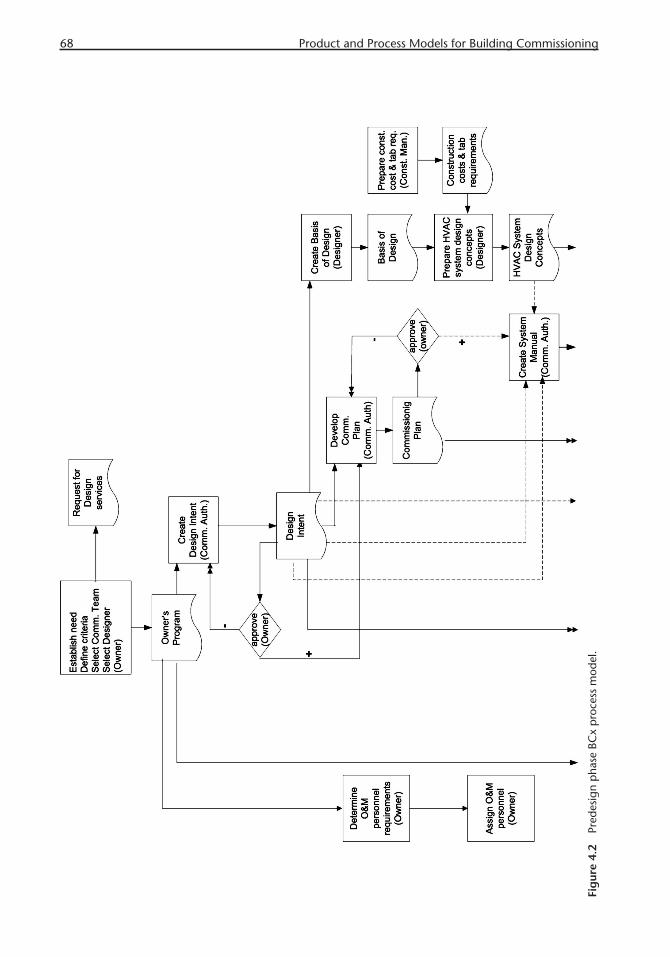
68 Product and Process Models for Building Commissioning
Fig
ure
4.2
Pred
esig
n p
hase
BC
x p
roce
ss m
odel
.
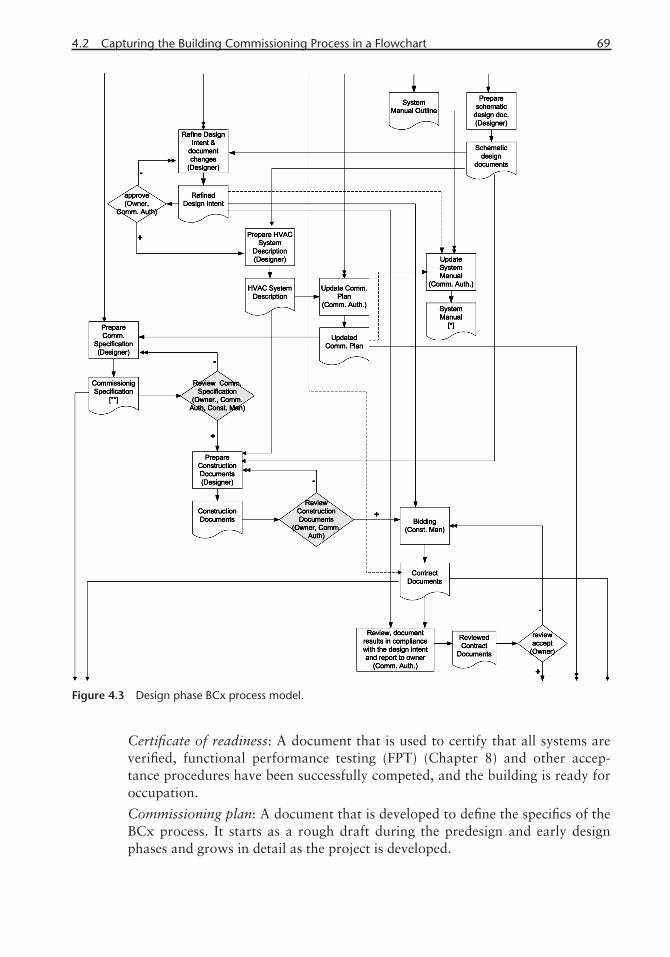
4.2 Capturing the Building Commissioning Process in a Flowchart 69
Certifi cate of readiness: A document that is used to certify that all systems are verifi ed, functional performance testing (FPT) (Chapter 8) and other accep-tance procedures have been successfully competed, and the building is ready for occupation.
Commissioning plan: A document that is developed to defi ne the specifi cs of the BCx process. It starts as a rough draft during the predesign and early design phases and grows in detail as the project is developed.
Figure 4.3 Design phase BCx process model.
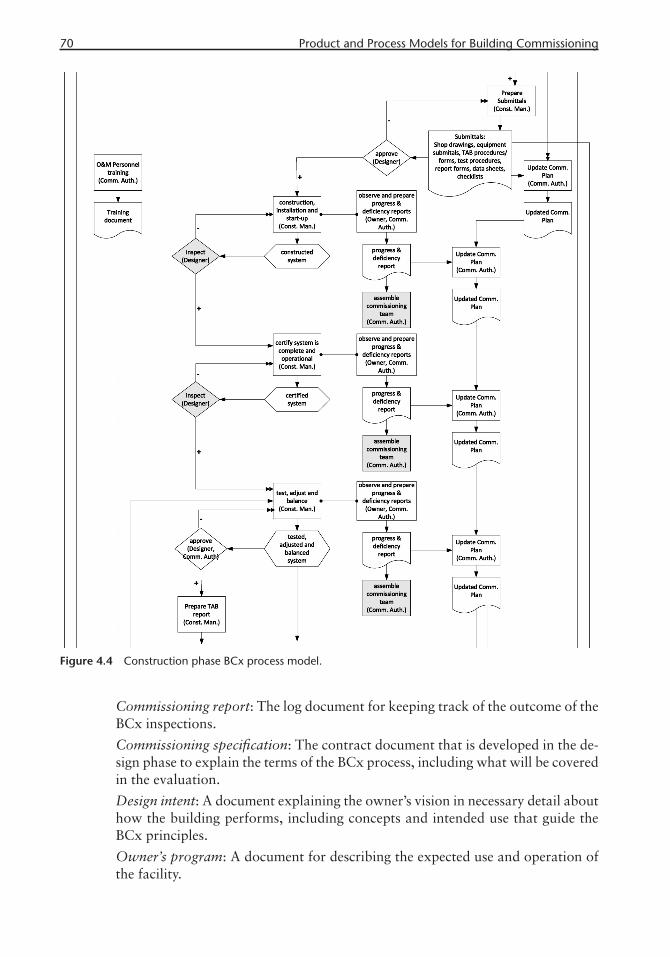
70 Product and Process Models for Building Commissioning
Commissioning report: The log document for keeping track of the outcome of the BCx inspections.
Commissioning specifi cation: The contract document that is developed in the de-sign phase to explain the terms of the BCx process, including what will be covered in the evaluation.
Design intent: A document explaining the owner’s vision in necessary detail about how the building performs, including concepts and intended use that guide the BCx principles.
Owner’s program: A document for describing the expected use and operation of the facility.
Figure 4.4 Construction phase BCx process model.

4.2 Capturing the Building Commissioning Process in a Flowchart 71
Systems manual: A manual created by compiling documents prepared during the BCx process that can be used as an operation and maintenance manual.
OperationsFunctional performance testing (FPT): The inspection done to measure the over-all performance of building systems.
Verifi cation: The process of testing each piece of building equipment and verify-ing that all systems and subsystems function properly as described in the contract documents.
Figure 4.5 Acceptance phase BCx process model.

72 Product and Process Models for Building Commissioning
4.2.2 BCx Process Description
In this section, we include a brief description of the BCx process as denoted in the process model (refer to Figures 4.2 to 4.6) [4].
4.2.2.1 Predesign Phase
Predesign phase BCx operations start with the establishment of the need and end when the necessary HVAC system design concepts have been formalized. The over-all target in this phase is generating the first group of information that will be used as a guide during the design of the system and the system performance criteria. At the beginning of this phase, the owner picks the commissioning authority in order to facilitate the involvement of the BCx team in the early design decisions. Then owner’s program is developed by the owner to describe the preliminary design prin-ciples. The owner’s program is used as a basis for starting other documents such as the initial design intent document, which is created by the commissioning agent and approved by the owner. Design intent evolves through the BCx process and is used to keep track of every project alteration. Then, from the design intent document, the designer produces the basis of design and the commissioning agent produces the commissioning plan. Both of these documents need to be consistent with the design intent document and should be reviewed and updated as the design intent goes through changes during the project’s life cycle.
Figure 4.6 Post-acceptance phase process model.
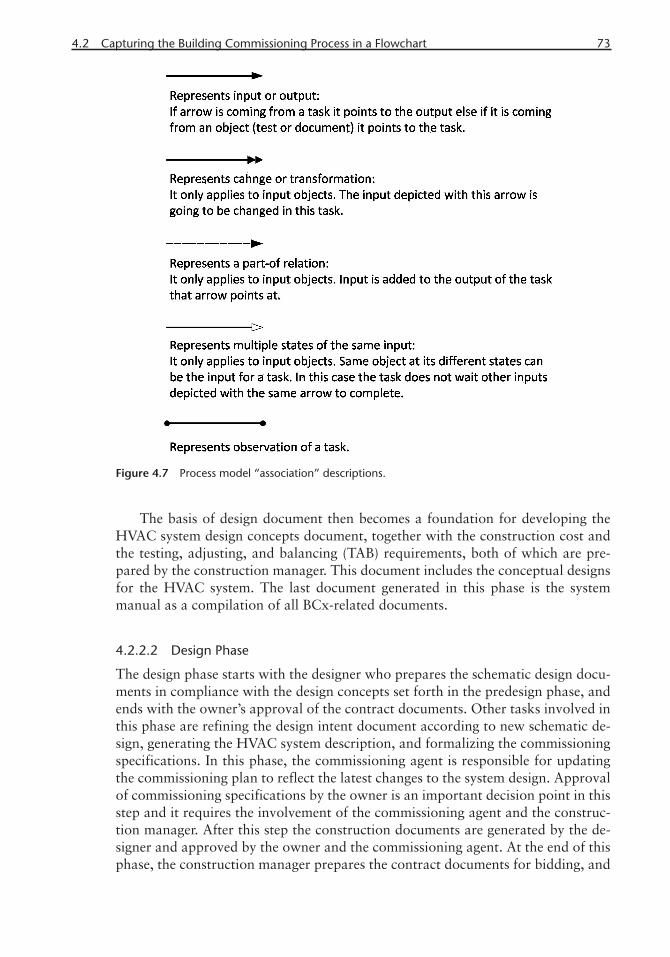
4.2 Capturing the Building Commissioning Process in a Flowchart 73
The basis of design document then becomes a foundation for developing the HVAC system design concepts document, together with the construction cost and the testing, adjusting, and balancing (TAB) requirements, both of which are pre-pared by the construction manager. This document includes the conceptual designs for the HVAC system. The last document generated in this phase is the system manual as a compilation of all BCx-related documents.
4.2.2.2 Design Phase
The design phase starts with the designer who prepares the schematic design docu-ments in compliance with the design concepts set forth in the predesign phase, and ends with the owner’s approval of the contract documents. Other tasks involved in this phase are refining the design intent document according to new schematic de-sign, generating the HVAC system description, and formalizing the commissioning specifications. In this phase, the commissioning agent is responsible for updating the commissioning plan to reflect the latest changes to the system design. Approval of commissioning specifications by the owner is an important decision point in this step and it requires the involvement of the commissioning agent and the construc-tion manager. After this step the construction documents are generated by the de-signer and approved by the owner and the commissioning agent. At the end of this phase, the construction manager prepares the contract documents for bidding, and
Figure 4.7 Process model “association” descriptions.

74 Product and Process Models for Building Commissioning
with the review and consent of all parties on these documents, the preconstruction tasks are considered to be completed.
4.2.2.3 Construction Phase
At the beginning of the construction phase, the construction manager develops the project submittals and secures the approval of the designer. This phase has three main tasks that are all completed by the construction manager: (1) construction, installation, and start-up of the HVAC system; (2) certifying that the system is complete and operational; and (3) TAB operations. The designer inspects the con-structed system at every stage and gives a final approval to the construction man-ager after the TAB is completed. This phase ends when the construction manager submits the TAB report to the commissioning agent for FPT. The commissioning agent’s main responsibility during the construction is observing and preparing prog-ress and deficiency reports. The commissioning plan is also updated to reflect all as-built information in the evaluation procedures.
4.2.2.4 Acceptance Phase
In comparison to the previous phases of BCx, the acceptance phase is completed in a very short time. However most of the testing, measurement, and evaluation of the HVAC system is conducted in this stage. The commissioning agent performs two main tasks in this phase: completion of a prefunctional checklist (PFC) and functional performance testing (FPT). PFC starts after the TAB report is received. The commissioning plan and the contract documents are the main sources of this task together with other BCx documents created in the previous phases. The result of the verification checks are recorded in data sheets and the commissioning agent generates the verification report to document the outcome. If this report is satisfac-tory, it is certified by the designer with the certificate of readiness document. After that, the FPT starts and the commissioning agent populates the results into FPT data sheets. Before generating the FPT report, the commissioning agent needs to await the completion of all deferred tests. If there are any deficiencies in the HVAC system that are not in accordance with the design intent or contract documents, the construction manager needs to make the necessary arrangements for fixing the problems. The tests need to be repeated to verify every fix and system update.
4.2.2.5 Post-Acceptance Phase
The post-acceptance phase tasks primarily involve finalizing the documentation and generating system description for operations. The first task is completing as-built documents, operation and maintenance manuals, and training materials. After these have been accepted by the designer, the commissioning agent compiles and delivers the system manual and develops a comprehensive commissioning report. This report is reviewed and accepted by the owner, the designer and the construc-tion manager. The BCx process flow is culminated by the construction manager and designer by requesting and recommending the acceptance of the HVAC system from the owner.

4.3 Capturing Embedded Commissioning Information in the Product Model 75
4.2.3 Signifi cance of the ECx Model
The ECx process model we developed is significant for various reasons. First it puts all ECx-related activities in the context of the CPD process. This allows one to easily follow how ECx supports and gets feedback from the predesign, design, and construction activities. Next, it provides a visual yet detailed representation of ECx that is not contained in BCx manuals and guidelines. The visual representation of the ECx-PPM allows us to see how building information flows between different parties and different tasks, how this information is recorded in various documents, and what quantity of information is needed for making specific decisions. One can follow the interactions between tasks and identify loops, parallel actions, and any missing elements between phases. From the perspective of generating a product model for ECx, the process model is also fundamental for identifying the type of data that is required for ECx tasks.
4.3 Capturing Embedded Commissioning Information in the Product Model
The ECx product model is developed in two steps: defining and classifying the data and developing the data model structure. The specific focus of the product model we use for illustration purposes is the AHU Cx.
4.3.1 Identifying BCx Data
As illustrated by the ECx process model, BCx information generated throughout the phases of the CPD process, from predesign to post-acceptance, is accumulated in several documents such as the commissioning plan, system manual, and PFC and FPT reports. In our observations of commissioning practice, we note that these reports can have significant differences based on the time BCx is performed, the commissioning agent completing these tasks, and the motivation of the owner for ordering it [4].
BCx guidelines are also produced by different organizations or government agencies, such as ASHRAE [24–26], NIST [24], IEA [25], and others [43, 44]. These guidelines agree on a general outline for HVAC Cx; however, the specific BCx data identified in these resources can show variances on different cases. The ECx product model addresses this issue with a formal ontology framework that can promote standardization, interoperability, and efficiency in ECx, using a ge-neric, normalized data set (Chapter 8).
The process of identifying the normalized data set that we use in the ECx prod-uct model has two main steps. First, since they contain different data types, we select as many different types of sources as possible. Then, we identify a structured way to compile this data into a standard representation.
In this illustrative example, we collected HVAC-Cx data from four source types [22]: (1) commissioning reports and PFC and FPT records collected from practic-ing companies; (2) codes, regulations, and guidelines from institutions, such as ASHRAE [25, 26] and NIST [24]; (3) HVAC equipment specifications from manu-facturers, such as Trane and Carrier; and (4) body of research from groups like
76 Product and Process Models for Building Commissioning
Portland Energy Conservation, Inc. (PECI) [49, 50] and Lawrence Berkeley Na-tional Laboratory (LBNL) [30] that practice in this domain. To compile the data from these four groups, we used comparative analysis tables (CATs) [22]. Because of the eclectic nature of the data, CATs are useful in identifying different terms referring to the same concept, such as “Fan Capacity” and “Airflow (cfm),” or sorting out the ambiguities that come with natural language, like one data point referring to the two features of a piece of equipment. One source may record data as “supply fan belt properly installed” when referring to “proper V belt align-ment” as well as to “proper V belt tension.” Separate CATs were developed for nine basic AHU components, including air filters, fans, coils, sensors, humidifiers, ducts, dampers, pumps, VAV boxes, and economizers. The organization of a CAT requires placing of the same attributes from different sources in the same row. Each source has its own column and if a source does not have matching data for a spe-cific attribute that cell is left empty.
4.3.2 Developing the Product Model
After creating the generic and normalized data set for BCx, we developed a for-mal model that encapsulates this data. To determine the requirements of a product model that can represent standardized ECx information, we need to identify the general characteristics of ECx information [2]. The first characteristic of ECx infor-mation is its generality. It is not specific to the commissioning operations and can be generated and exchanged between various parties for different purposes. Because our premise for creating a data model is to achieve interoperability, we include not just technical attributes, but information that can be used for reasoning purposes, in the case of automated tests and accurate representation of the domain knowledge. For example, for the modeling of a humidifier we need to include “entering air rela-tive humidity” and “leaving air relative humidity” to the attribute sets since this information is crucial during the prefunctional checklists (PFC) and FPT procedures (Chapter 8). During the PFC procedure the “unique identification number” of the humidifier is validated, which normally has no impact on its performance. How-ever, this information needs to be included in the data model because it is elemental in identifying the humidifier in the overall system and allows us to keep track of the history of the equipment.
Another characteristic of the ECx information is its fragmented but synthetic nature—every piece comes together to create a whole. This requires developing a systems-based approach to modeling. An AHU is a complex piece of equipment that can take many different forms depending on which subcomponent types are used during its design. When evaluating the performance of an AHU, the commis-sioning agent needs to verify the functional performance of every equipment type separately, including the fan, heating coil, and cooling coil. At the same time, the relationships between these components need to be checked, like the connection of the return duct to the return fan or the location of a temperature sensor in relation to a heating coil.
The next level of checks needs to be performed at the AHU level. The overall performance of the AHU as an individual component should be verified for dif-ferent purposes such as the manual shutdown and start-up operations or smoke management systems. To accurately represent the relationships between different
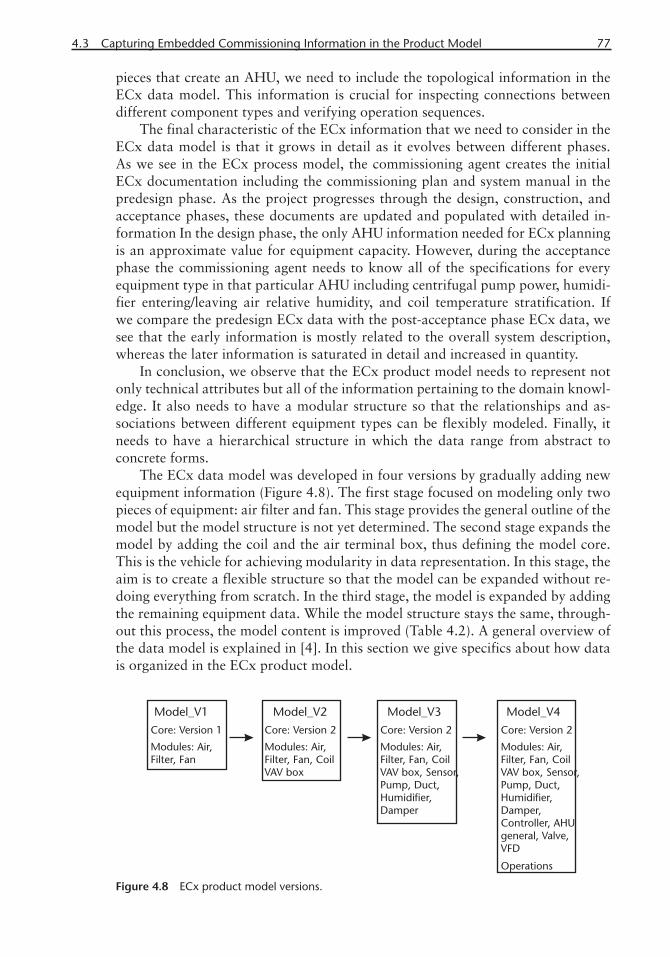
4.3 Capturing Embedded Commissioning Information in the Product Model 77
pieces that create an AHU, we need to include the topological information in the ECx data model. This information is crucial for inspecting connections between different component types and verifying operation sequences.
The final characteristic of the ECx information that we need to consider in the ECx data model is that it grows in detail as it evolves between different phases. As we see in the ECx process model, the commissioning agent creates the initial ECx documentation including the commissioning plan and system manual in the predesign phase. As the project progresses through the design, construction, and acceptance phases, these documents are updated and populated with detailed in-formation In the design phase, the only AHU information needed for ECx planning is an approximate value for equipment capacity. However, during the acceptance phase the commissioning agent needs to know all of the specifications for every equipment type in that particular AHU including centrifugal pump power, humidi-fier entering/leaving air relative humidity, and coil temperature stratification. If we compare the predesign ECx data with the post-acceptance phase ECx data, we see that the early information is mostly related to the overall system description, whereas the later information is saturated in detail and increased in quantity.
In conclusion, we observe that the ECx product model needs to represent not only technical attributes but all of the information pertaining to the domain knowl-edge. It also needs to have a modular structure so that the relationships and as-sociations between different equipment types can be flexibly modeled. Finally, it needs to have a hierarchical structure in which the data range from abstract to concrete forms.
The ECx data model was developed in four versions by gradually adding new equipment information (Figure 4.8). The first stage focused on modeling only two pieces of equipment: air filter and fan. This stage provides the general outline of the model but the model structure is not yet determined. The second stage expands the model by adding the coil and the air terminal box, thus defining the model core. This is the vehicle for achieving modularity in data representation. In this stage, the aim is to create a flexible structure so that the model can be expanded without re-doing everything from scratch. In the third stage, the model is expanded by adding the remaining equipment data. While the model structure stays the same, through-out this process, the model content is improved (Table 4.2). A general overview of the data model is explained in [4]. In this section we give specifics about how data is organized in the ECx product model.
Figure 4.8 ECx product model versions.
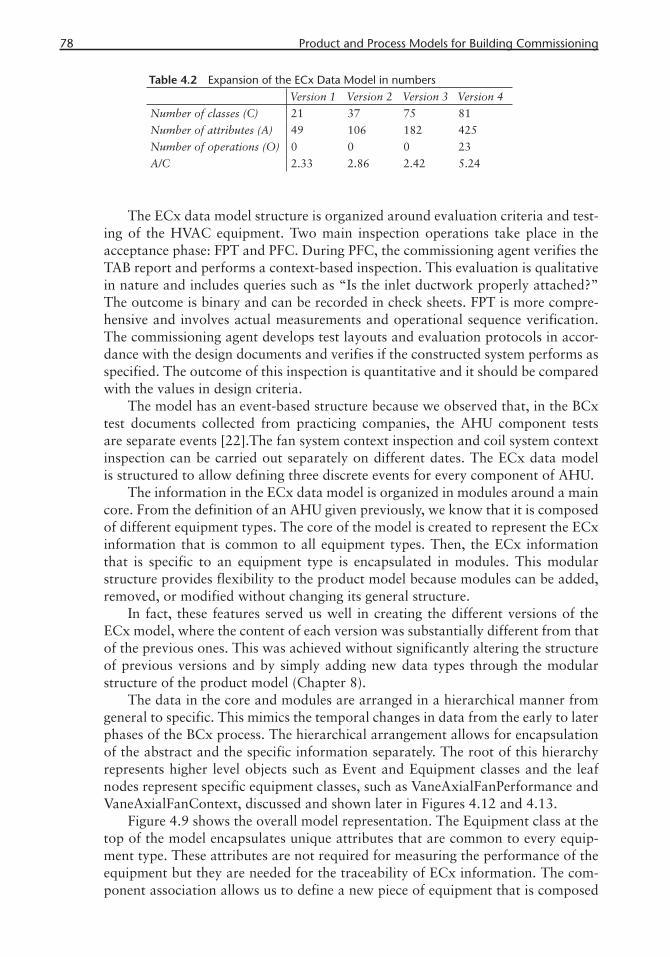
78 Product and Process Models for Building Commissioning
The ECx data model structure is organized around evaluation criteria and test-ing of the HVAC equipment. Two main inspection operations take place in the acceptance phase: FPT and PFC. During PFC, the commissioning agent verifies the TAB report and performs a context-based inspection. This evaluation is qualitative in nature and includes queries such as “Is the inlet ductwork properly attached?” The outcome is binary and can be recorded in check sheets. FPT is more compre-hensive and involves actual measurements and operational sequence verification. The commissioning agent develops test layouts and evaluation protocols in accor-dance with the design documents and verifies if the constructed system performs as specified. The outcome of this inspection is quantitative and it should be compared with the values in design criteria.
The model has an event-based structure because we observed that, in the BCx test documents collected from practicing companies, the AHU component tests are separate events [22].The fan system context inspection and coil system context inspection can be carried out separately on different dates. The ECx data model is structured to allow defining three discrete events for every component of AHU.
The information in the ECx data model is organized in modules around a main core. From the definition of an AHU given previously, we know that it is composed of different equipment types. The core of the model is created to represent the ECx information that is common to all equipment types. Then, the ECx information that is specific to an equipment type is encapsulated in modules. This modular structure provides flexibility to the product model because modules can be added, removed, or modified without changing its general structure.
In fact, these features served us well in creating the different versions of the ECx model, where the content of each version was substantially different from that of the previous ones. This was achieved without significantly altering the structure of previous versions and by simply adding new data types through the modular structure of the product model (Chapter 8).
The data in the core and modules are arranged in a hierarchical manner from general to specific. This mimics the temporal changes in data from the early to later phases of the BCx process. The hierarchical arrangement allows for encapsulation of the abstract and the specific information separately. The root of this hierarchy represents higher level objects such as Event and Equipment classes and the leaf nodes represent specific equipment classes, such as VaneAxialFanPerformance and VaneAxialFanContext, discussed and shown later in Figures 4.12 and 4.13.
Figure 4.9 shows the overall model representation. The Equipment class at the top of the model encapsulates unique attributes that are common to every equip-ment type. These attributes are not required for measuring the performance of the equipment but they are needed for the traceability of ECx information. The com-ponent association allows us to define a new piece of equipment that is composed
Table 4.2 Expansion of the ECx Data Model in numbersVersion 1 Version 2 Version 3 Version 4
Number of classes (C) 21 37 75 81
Number of attributes (A) 49 106 182 425
Number of operations (O) 0 0 0 23
A/C 2.33 2.86 2.42 5.24
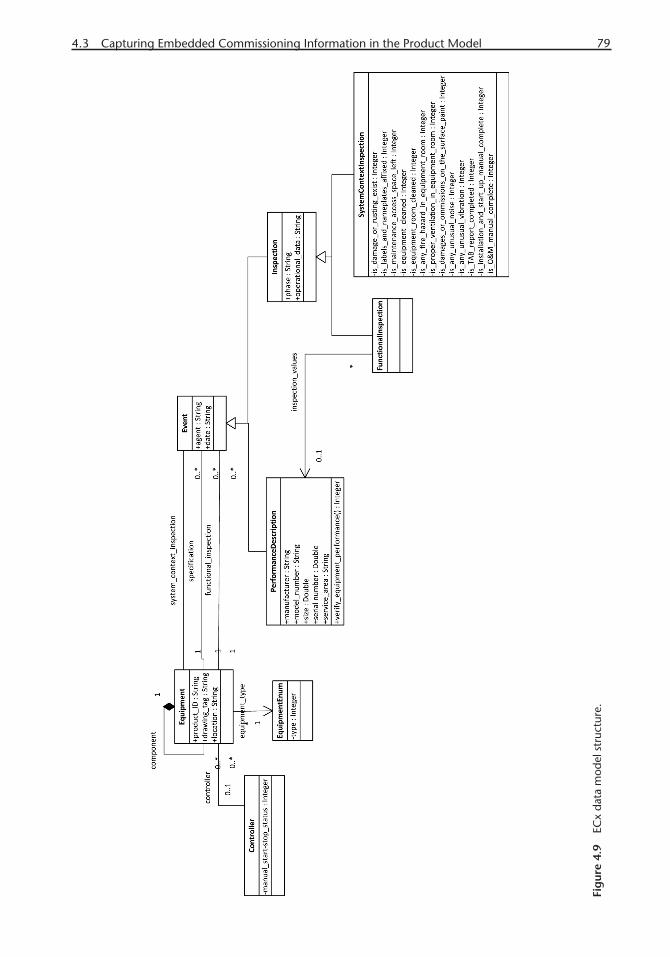
4.3 Capturing Embedded Commissioning Information in the Product Model 79
Fig
ure
4.9
ECx
data
mod
el s
truc
ture
.
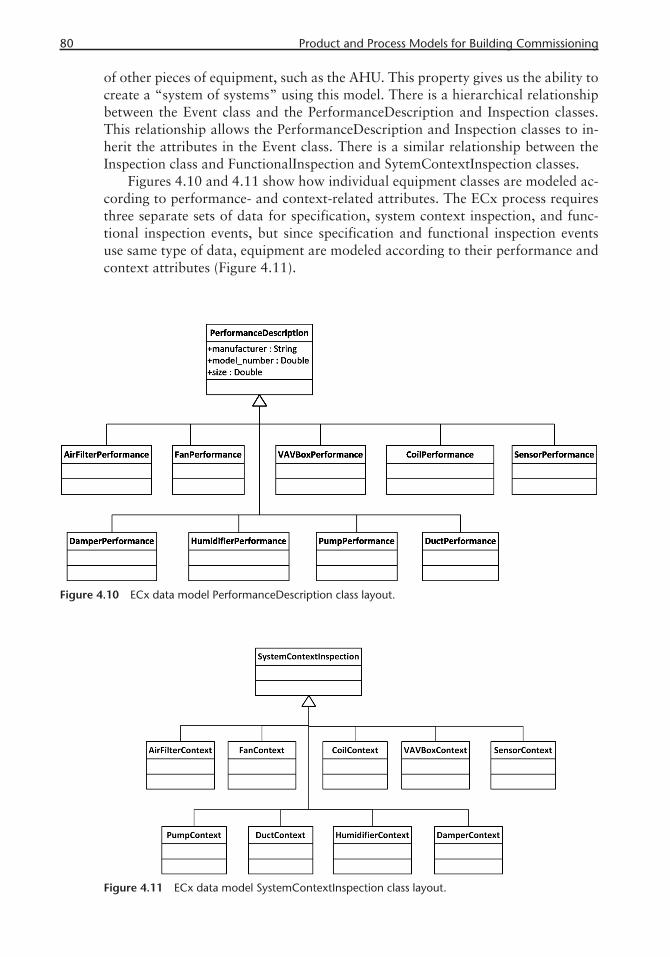
80 Product and Process Models for Building Commissioning
of other pieces of equipment, such as the AHU. This property gives us the ability to create a “system of systems” using this model. There is a hierarchical relationship between the Event class and the PerformanceDescription and Inspection classes. This relationship allows the PerformanceDescription and Inspection classes to in-herit the attributes in the Event class. There is a similar relationship between the Inspection class and FunctionalInspection and SytemContextInspection classes.
Figures 4.10 and 4.11 show how individual equipment classes are modeled ac-cording to performance- and context-related attributes. The ECx process requires three separate sets of data for specification, system context inspection, and func-tional inspection events, but since specification and functional inspection events use same type of data, equipment are modeled according to their performance and context attributes (Figure 4.11).
Figure 4.11 ECx data model SystemContextInspection class layout.
Figure 4.10 ECx data model PerformanceDescription class layout.

4.3 Capturing Embedded Commissioning Information in the Product Model 81
The individual modeling of an HVAC equipment type as a leaf node is shown in Figures 4.12 and 4.13 for the fan example. The hierarchical structure of the larger model continues in the leaf nodes as well. The VaneAxialFanPerformance and the CentrifugalFanPerformance classes are children of the FanPerformance class and they inherit all of its attributes. The same relationship exists between the VaneAxialFanContext and the CentrifugalFanContext classes and the FanContext class. Since the FanPerformance and the FanContext classes are children to the PerformanceDescription and the SystemContextInspection classes, the hierarchy reaches to the top Event class.
We developed the data model through a model-based-approach aimed at stan-dardizing and automating the ECx process. This approach has been implemented in two steps. First, the ECx process model is developed as a detailed visual repre-sentation of BCx operations and an analysis of how BCx tasks, documents, and decision points are related. This information is later fed into data model develop-ment in order to identify the characteristics of BCx data. Next, specific ECx data, distilled from CAT, are used to develop the ECx data model.
Although the ECx process model covers the entire commissioning process for a new construction, the ECx product model focuses only on the AHU. This model can be expanded to an ontology representing all HVAC-Cx-related information. From the standardization and interoperability perspectives, having both process and product models has clear benefits. On the other hand, capturing, storing, and
Figure 4.12 FanPerformance class hierarchy.
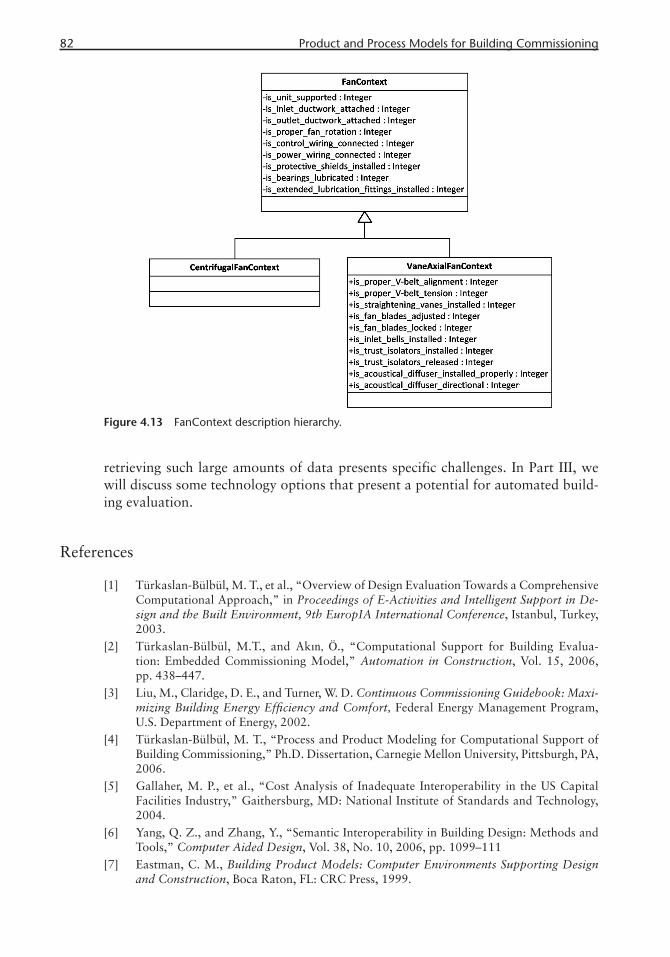
82 Product and Process Models for Building Commissioning
retrieving such large amounts of data presents specific challenges. In Part III, we will discuss some technology options that present a potential for automated build-ing evaluation.
References
[1] Türkaslan-Bülbül, M. T., et al., “Overview of Design Evaluation Towards a Comprehensive Computational Approach,” in Proceedings of E-Activities and Intelligent Support in De-sign and the Built Environment, 9th EuropIA International Conference, Istanbul, Turkey, 2003.
[2] Türkaslan-Bülbül, M.T., and Akın, Ö., “Computational Support for Building Evalua-tion: Embedded Commissioning Model,” Automation in Construction, Vol. 15, 2006, pp. 438–447.
[3] Liu, M., Claridge, D. E., and Turner, W. D. Continuous Commissioning Guidebook: Maxi-mizing Building Energy Effi ciency and Comfort, Federal Energy Management Program, U.S. Department of Energy, 2002.
[4] Türkaslan-Bülbül, M. T., “Process and Product Modeling for Computational Support of Building Commissioning,” Ph.D. Dissertation, Carnegie Mellon University, Pittsburgh, PA, 2006.
[5] Gallaher, M. P., et al., “Cost Analysis of Inadequate Interoperability in the US Capital Facilities Industry,” Gaithersburg, MD: National Institute of Standards and Technology, 2004.
[6] Yang, Q. Z., and Zhang, Y., “Semantic Interoperability in Building Design: Methods and Tools,” Computer Aided Design, Vol. 38, No. 10, 2006, pp. 1099–111
[7] Eastman, C. M., Building Product Models: Computer Environments Supporting Design and Construction, Boca Raton, FL: CRC Press, 1999.
Figure 4.13 FanContext description hierarchy.
4.3 Capturing Embedded Commissioning Information in the Product Model 83
[8] Owolabi, A., Anumba, C. J., and El-Hamalawi, A., “Architecture for Implementing IFC-Based Online Construction Product Libraries,” ITcon, Vol. 8, 2003, pp. 201–218, http://www.itcon.org/2003/15.
[9] Koivu, T. J., “Future of Product Modeling and Knowledge Sharing in the FM/AEC Indus-try.” ITcon, Vol. 7, 2002, pp. 139–156.
[10] Penilla, H., “The State of the Art of Finnish Building Product Modeling Methodology,” in Computer Aided Architectural Design Futures, B. Martens and A. Brown (Eds.), Vienna: Springer Verlag, 2005, pp. 225–239.
[11] Hagler Bailly Consulting, Inc. “Building Commissioning: Survey of Attitudes and Practices in Wisconsin,” Report #172-1, Madison, WI: Energy Center of Wisconsin, 1998.
[12] Claridge, D. E., et al., “Is Commissioning Once Enough?” Energy Engineering, Vol. 101, No. 4, June–July 2004.
[13] Piette, M. A., Kinney, S., and Haves, P., “Analysis of an Information Monitoring and Di-agnostic System to Improve Building Operations,” Energy and Buildings Vol. 33, No. 8, 2001, pp. 783–791.
[14] Brambley, M. R., and Katipamula, S., “Automating Commissioning Activities: Update with Examples,” in Proceedings of the 11th National Conference on Building Commissioning, Portland, OR, May 20–22, 2003, Portland Energy Conservation Inc.
[15] Claridge, D. E., et al., “Campus-Wide Continuous Commissioning SM of University Build-ings,” in Proceedings of the 2000 ACEEE Summer Study, Washington, DC: American Council for an Energy Effi cient Economy, 2000.
[16] Katipamula, S., Brambley, M. R., and Luskay, L., “Automated Proactive Techniques for Commissioning Air-Handling Units.” ASME Journal of Solar Energy Engineering, Vol. 125, No. 1, 2003, pp. 282–291.
[17] Akın, Ö.. et al., “Comparison of ASHRAE Guidelines with Building Commissioning Prac-tice,” in Proceedings of National Conference on Building Commissioning, Palm Springs, CA, 2003.
[18] “The HVAC Commissioning Process,” Atlanta, GA: American Society of Heating, Refrig-erating, and Air-Conditioning Engineers, 1996.
[19] HVAC&R Technical Requirements for the Commissioning Process, ASHRAE Guideline 1.1-2007, Atlanta, GA: American Society of Heating, Refrigerating, and Air-Conditioning Engineers, 2007.
[20] “The HVAC Commissioning Process,” Atlanta, GA: ASHRAE American Society of Heat-ing, Refrigerating, and Air-Conditioning Engineers, 1996.
[21] “The Commissioning Process,” Atlanta, GA: ASHRAE American Society of Heating, Re-frigerating, & Air-Conditioning Engineers, 2005.
[22] Türkaslan-Bülbül, M.T., and Akın, Ö., “Formal Models for Embedded Commissioning,” in Proceedings of the International Conference for Enhanced Building Operations, Pitts-burgh, PA, 2005.
[23] Akın, Ö., et al., “Embedded Commissioning for Building Design,” in Proceedings of Eu-ropean Conference on Product and Process Modeling in the Building and Construction Industry, Istanbul, Turkey, 2004.
[24] Kao, J. Y., HVAC Functional Inspection and Testing Guide, Gaithersburg, MD: National Institute of Standards and Technology (NIST), U.S. Department of Commerce, 1992.
[25] “Cost-Effective Commissioning for Existing and Low Energy Buildings,” Annex 47 IAE, 2005, http://www.iea-annex47.org, last accessed April 2011.
[26] Haasl, T., and Sharp, T., “A Practical Guide for Commissioning Existing Buildings,” Re-port ORNL/TM-1999/34, prepared by Portland Energy Conservation, Inc., and Oak Ridge National Laboratory for the Offi ce of Building Technology, State and Community Pro-grams U.S. Department of Energy.
[27] Model Commissioning Plan and Guide Commissioning Specifi cations, NTIS: # DE9700456, Gaithersburg, MD: National Institute of Standards and Technology, 1997.

84 Product and Process Models for Building Commissioning
[28] PECI, “Building Commissioning Guidelines,” Bonneville Power Administration, U.S. De-partment of Energy, 1992.
[29] PECI, “O&M Best Practices Series: Operation and Maintenance Assessments,” 1999, http://www.energystar.gov/ia/business/assessment.pdf, last accessed in April 2011.
[30] LBNL, “Design Intent Tool,” 2008, http://ateam.lbl.gov/DesignIntent/home.html, last ac-cessed in April 2011.

85
C H A P T E R 5
Building Information Modeling: Current Practices in Building Evaluation Models and Updates
5.1 Introduction
Building information modeling (BIM), “a modeling technology and associated set of processes to produce, communicate and analyze building models” [1], has been changing the capital project delivery (CPD) processes significantly. BIM provides a common way to store information that is created by different stakeholders in a data-rich, parametric, and digital representation [1]. It also provides semantically rich information for building elements that can be accessed automatically by soft-ware applications [2]. Many analyses tools, enabled by BIM and its information-rich models, are being heavily used in the architecture-engineering-construction/facility management (AEC/FM) industries to support a diverse set of process, analy-sis, and decision methods throughout a project’s life cycle.
Today, most architects, engineers, contractors, and owners realize the potential benefits of utilizing semantically rich information for managing infrastructure sys-tems. Many federal owners in the United States, such as the Government Services Association (GSA), U.S. Army Corps of Engineers (USACE), and Veterans Admin-istration [3–5]; state agencies, such as the Wisconsin Division of State Facilities and Texas Facilities Commission [6]; and institutions, such as Penn State University and Indiana University [7, 8], have developed integrated project delivery guidelines and contracts that incorporate BIM into the CPD processes. In addition, organizations like the Association for General Contractors (AGC) and the American Institute of Architects (AIA) have also developed BIM guidelines that promote BIM’s adoption into their respective sectors. The National Institute for Building Sciences (NIBS) has been undertaking a major effort to target the development of a national build-ing information modeling standard [9]. Under this effort, NIBS oversees important initiatives like the creation of industry foundation classes [10] to enable transfer of rich information and interoperability between different software systems, and Construction Operation Building Information Exchange (COBIE), which targets the capture of facility information throughout building’s life cycle [10, 11]. These

86 Building Information Modeling: Current Practices in Building Evaluation Models and Updates
efforts have significantly increased the adoption of building information modeling by the AEC/FM industry.
BIM was initially considered to provide a competitive advantage for AEC/FM firms, but later became a necessity for improving the existing business processes of capital project design, construction, and operations. Today, it supports early design decisions and the communication of the conceptual design to stakeholders. It al-lows fast comparison of design options as the parametric capabilities, which come with BIM-enabled design tools that make design modifications easier. In addition, it enables collaboration and communication among project team members and stakeholders and supports functional analyses of buildings through detailed 3D visualization capabilities [1]. BIM also supports simulations for energy, emergency egress and lighting, comparison of alternatives for energy efficient buildings, and evaluation of LEED certification requirements. Upon design completion, it pro-vides an intelligent model that can be automatically evaluated. As automatic build-ing code verification becomes available through efforts such as SMARTcodes [12], BIM’s potential impact during the CPD process will become even more prominent (Chapter 10).
During the construction phase, many documented case studies highlight the benefits of BIM in supporting mechanical, electrical, and plumbing (MEP) coor-dination [13–15]. These studies highlight significant improvement in coordinating the construction trades, which reduces the number of field-generated change orders drastically through the integration of model-based clash detection. Furthermore, the coordinated models can be trusted for their accuracy. The parties involved in their generation utilize them for prefabrication of building components, allowing for smoother construction and field installation and waste reduction. Likewise, BIM is utilized for generating shop drawings during construction. Other ways in which BIM supports timely delivery and cost control during construction includes 4D scheduling and simulation and model-based estimation. Though currently un-derutilized, 4D scheduling is gaining importance, especially in complicated proj-ects, to identify spatial conflicts, to identify logic errors in the schedule, and to facilitate communicating construction plans to tradespeople. It is used as a visual means to perform constructability analyses. Model-based estimation helps engi-neers avoid errors in the quantity takeoff process with significant time savings in the generation and monitoring of cost estimates.
Spatial conflicts are common. Structural, mechanical, and lighting engineers all compete for the often limited space available in the plenum. Unless there is conflict detection software, light fixtures, ducts, and beams can physically collide or inter-fere with each other’s performance, as in the case of the light fixture heating the air carried in the duct. Furthermore, installation of the fixtures, if not scheduled after the ducts, or vice versa, depending on their physical configuration, can create serious installation problems and labor scheduling problems. BIM software can be “smart” enough to detect these sequencing conflicts in the 4D and alert fieldwork-ers to them. Often the logic underlying these scheduling conflicts is impossible to detect through algorithmic processes. In these cases in particular, designers and contractors can detect the problems visually when the BIM system is equipped with sophisticated 4D visual display tools.
Other than time and cost controls, BIM has the potential to be used along with data captured by reality capture technologies, such as laser scanners, for quality

5.2 Utilization of BIM in Evaluating Facilities During Preconstruction 87
control purposes during construction. Laser scanning can be performed regularly to compare the progress with respect to the design model and construction sched-ules as well as to check and document existing as-built conditions (Chapter 6).
Because post-construction is the longest phase in a building’s life cycle, utiliza-tion of BIM during this phase promises the greatest benefits. During the handover of the building to facility operators, building information models can be submitted as part of as-built documentation. Such models can then be populated with facility asset and operations-related data, such as equipment manuals. Availability of inte-grated information is valuable for the facility operators and managers by improv-ing their access to relevant information depicting up-to-date representation. For instance, fieldworkers can benefit greatly from pulling up on their portable devices 3D views of invisible items like pipes, ducts, and other equipment concealed be-hind walls, floors, or ceilings. Since building information models subsume seman-tic information that enables spatial and topological analyses, like identity, type, manufacture, and configuration of building components, they can support fault diagnosis (Chapter 8) and emergency response activities [1, 16]. A plumber would not need to break a wall apart, for example, only to discover that the specialty for the fix belongs to steamfitters.
The information contained in as-built information models can be used to di-rectly populate the data needed in facility management tools, such a computerized maintenance management systems (CMMS) and computer-aided facilities man-agement systems (CAFM) [17, 18]. Through BIM integrated facility management tools, it is possible to significantly reduce the reentry of facility information since the information would be contained in the as-built information model.
To utilize BIM throughout a building’s life cycle, these models must be con-tinuously updated to include information needed by different stakeholders and to reflect the changes to facilities. New processes and standards being accepted by the AEC/FM industry are aimed at enabling information capture and transfer between life-cycle phases. One of the greatest impediments to efficient fault diagnosis and repair of building systems is the lack of reliable information of existing conditions. While the location of a piece of equipment, an actuator, a valve, or an electrical panel may be an easy search for the design engineer, the fieldworker looking for them may spend precious minutes, in an emergency, or hours locating them.
BIM usage during preconstruction, construction, and post-construction phas-es is expected to support methods of facility evaluation for ECx throughout the building life cycle. Next, we consider these aspects of BIM and conclude with a discussion of the challenges and opportunities associated with updating building information models.
5.2 Utilization of BIM in Evaluating Facilities During Preconstruction
Surveys of the AEC/FM industry highlight that BIM is commonly used during the design/preconstruction phase of facilities. In 2009, 60% of architects used BIM for building design. More than half of them also used BIM for analysis including for code compliance checking and energy evaluation [19]. The design phase, and hence decisions made during this phase, impact the overall performance of a facility sig-nificantly. This is evidenced by the life-cycle cost escalation due to modification of
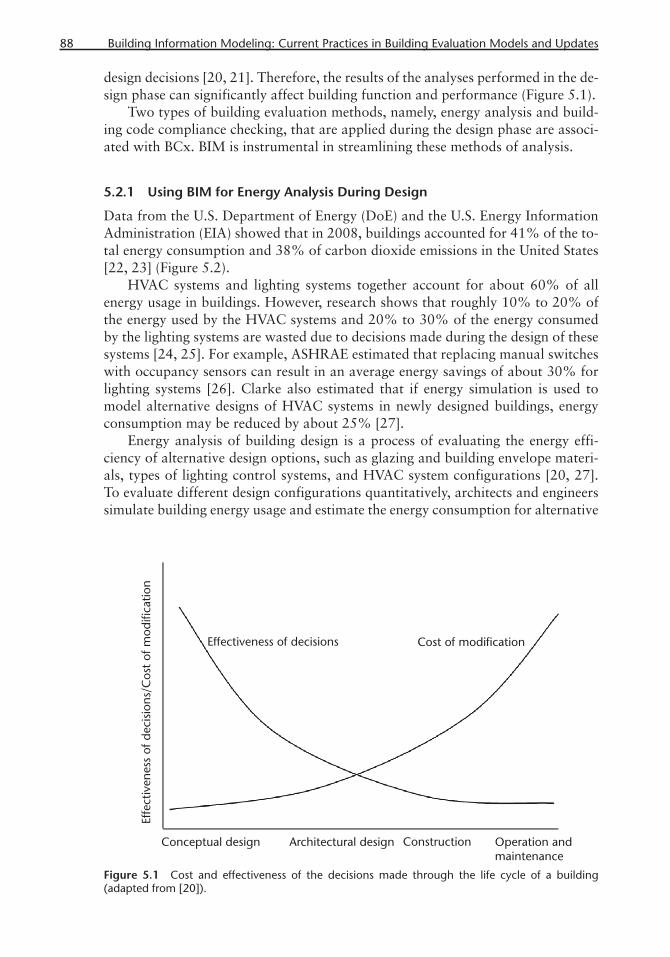
88 Building Information Modeling: Current Practices in Building Evaluation Models and Updates
design decisions [20, 21]. Therefore, the results of the analyses performed in the de-sign phase can significantly affect building function and performance (Figure 5.1).
Two types of building evaluation methods, namely, energy analysis and build-ing code compliance checking, that are applied during the design phase are associ-ated with BCx. BIM is instrumental in streamlining these methods of analysis.
5.2.1 Using BIM for Energy Analysis During Design
Data from the U.S. Department of Energy (DoE) and the U.S. Energy Information Administration (EIA) showed that in 2008, buildings accounted for 41% of the to-tal energy consumption and 38% of carbon dioxide emissions in the United States [22, 23] (Figure 5.2).
HVAC systems and lighting systems together account for about 60% of all energy usage in buildings. However, research shows that roughly 10% to 20% of the energy used by the HVAC systems and 20% to 30% of the energy consumed by the lighting systems are wasted due to decisions made during the design of these systems [24, 25]. For example, ASHRAE estimated that replacing manual switches with occupancy sensors can result in an average energy savings of about 30% for lighting systems [26]. Clarke also estimated that if energy simulation is used to model alternative designs of HVAC systems in newly designed buildings, energy consumption may be reduced by about 25% [27].
Energy analysis of building design is a process of evaluating the energy effi-ciency of alternative design options, such as glazing and building envelope materi-als, types of lighting control systems, and HVAC system configurations [20, 27]. To evaluate different design configurations quantitatively, architects and engineers simulate building energy usage and estimate the energy consumption for alternative
Figure 5.1 Cost and effectiveness of the decisions made through the life cycle of a building (adapted from [20]).
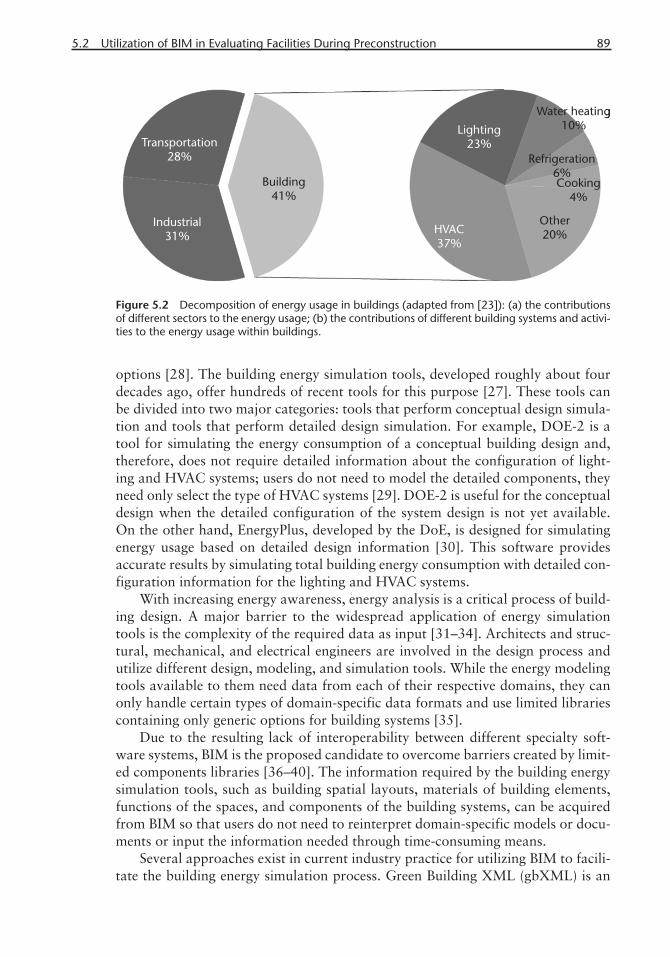
5.2 Utilization of BIM in Evaluating Facilities During Preconstruction 89
options [28]. The building energy simulation tools, developed roughly about four decades ago, offer hundreds of recent tools for this purpose [27]. These tools can be divided into two major categories: tools that perform conceptual design simula-tion and tools that perform detailed design simulation. For example, DOE-2 is a tool for simulating the energy consumption of a conceptual building design and, therefore, does not require detailed information about the configuration of light-ing and HVAC systems; users do not need to model the detailed components, they need only select the type of HVAC systems [29]. DOE-2 is useful for the conceptual design when the detailed configuration of the system design is not yet available. On the other hand, EnergyPlus, developed by the DoE, is designed for simulating energy usage based on detailed design information [30]. This software provides accurate results by simulating total building energy consumption with detailed con-figuration information for the lighting and HVAC systems.
With increasing energy awareness, energy analysis is a critical process of build-ing design. A major barrier to the widespread application of energy simulation tools is the complexity of the required data as input [31–34]. Architects and struc-tural, mechanical, and electrical engineers are involved in the design process and utilize different design, modeling, and simulation tools. While the energy modeling tools available to them need data from each of their respective domains, they can only handle certain types of domain-specific data formats and use limited libraries containing only generic options for building systems [35].
Due to the resulting lack of interoperability between different specialty soft-ware systems, BIM is the proposed candidate to overcome barriers created by limit-ed components libraries [36–40]. The information required by the building energy simulation tools, such as building spatial layouts, materials of building elements, functions of the spaces, and components of the building systems, can be acquired from BIM so that users do not need to reinterpret domain-specific models or docu-ments or input the information needed through time-consuming means.
Several approaches exist in current industry practice for utilizing BIM to facili-tate the building energy simulation process. Green Building XML (gbXML) is an
Figure 5.2 Decomposition of energy usage in buildings (adapted from [23]): (a) the contributions of different sectors to the energy usage; (b) the contributions of different building systems and activi-ties to the energy usage within buildings.
90 Building Information Modeling: Current Practices in Building Evaluation Models and Updates
open schema for BIM and focuses on representing information for energy simula-tion of facilities [41]. It represents material and geometric information about build-ing elements, configuration of the building systems, and space load information. Autodesk Ecotect software is a conceptual energy simulation and analysis tool with the ability to import information using BIM formats, such as IFC and gbXML [42, 43]. While such applications are emerging, many of the better known energy simulation systems have yet to actively interface with BIM completely utilization of BIM generated information [37]. A major barrier for this is existing BIM stan-dard schemata, such as those in IFC that do not contain information related to detailed configurations of lighting and HVAC systems [44, 45]. For instance, IFC schema mainly represent the material and geometric information of the ducts and equipment in the HVAC systems, while the configuration of the HVAC control sys-tems, such as the controller and data interfaces, is not covered. With the increased development and usage of such standards, this impediment will be significantly reduced, and BIM will contain most, if not all, of the information needed to per-form energy simulations. Dong et al. proposed an extension for gbXML schema to provide information for lighting simulation applications [45]. In the latest version of IFC schema, about 40 new classes, such as IfcAirTerminal, IfcSpaceHeater, and IfcTank, have been added to support the representation of HVAC systems [10].
5.2.2 Using BIM in Building Code Compliance Checking
Building codes are rules that guide the design and construction of buildings so that acceptable levels of performance can be realized. They are usually published by federal, state, and local government agencies, such as the California Code of Regu-lations (CCR), and international industry organizations, such as the International Code Council (ICC) and ASHRAE. Every design must be checked and verified against violation of applicable codes and ordinances. Provisions of codes specify the minimum requirements for building elements including structural safety, space accessibility, and energy efficiency. After a building design is completed, the design documents are submitted to building officials for assessment of their compliance with relevant codes and ordinances. If in conformance, a permit for construction is granted; otherwise, the design is returned to the designers for modification. Chapter 10 describes in detail the nature of building codes and the processes associated with code generation, maintenance, and conformance assessment.
In current industry practices, compliance checking is conducted manually, us-ing text-based descriptions. This tedious and error-prone process relies on building officials’ knowledge and interpretation of codes, which may contain conflicting provisions and inconsistencies. As a result, the permitting process is time consum-ing, error prone, and nonreplicable [46, 47]. To overcome these problems, auto-mated approaches have been widely researched.
With the increased utilization of BIM in the AEC/FM industry and its ability to provide semantically rich design information, two major industry-driven efforts in code compliance checking have emerged: SMARTcodes [12] and CORENET [48].
SMARTcodes is an automated code checking platform, developed by the ICC. It has two main components: computer-interpretable building codes and an au-tomated code checking engine [12]. The rules defined in the codes are described digitally, facilitating interpretation by the code checking engine and evaluation of
5.3 Using BIM in Evaluating Facilities During Construction 91
a given design depicted in a semantically rich way. The SMARTcodes platform assumes that the building design is documented in BIM so that the computerized approach can access and interpret the information in relevant building codes.
CORENET is an automated, web-based electronic permitting system utilized by Singapore’s Building and Construction Authority [48]. This system also utilizes IFC-based model files for automated code checking and is leading the effort in demonstrating the feasibility of automated code checking and e-permitting based on computer-interpretable representations such as those supported in BIM.
In addition to these two major industry-driven initiatives, several other soft-ware systems check BIM representations against codes including Solibri Model Checker [49]. This tool takes an IFC-based building information model as its input and performs validity compliance of a BIM model with respect to user-defined rules as well as rules available in the system library, to identify modeling errors and components that violate the given rule sets [46].
5.3 Using BIM in Evaluating Facilities During Construction
The success of construction projects is based on how they satisfy time, cost, and quality constraints. Construction project teams using BIM often meet and exceed the requirements of these constraints. For example, BIM allows streamlining of the cost estimating process and provides more time to evaluate design alternatives (e.g., [1, 50]). Design-based BIM can be further augmented by creating 4D simula-tions to identify whether there are inconsistencies and time-space conflicts in proj-ect schedules; and to evaluate alternative construction methods and sequences. To proactively coordinate and manage the trades, information models generated by different specialty trades are evaluated for clash detection, prior to construction. Finally, as-designed information models augmented by data from data capture tech-nologies, such as 3D imaging, help in quality control by assessing compliance with construction tolerances written into the construction specifications.
Several cost estimating systems that support these processes, including Tim-berline Precision Estimating and Vico Estimator, take these models as input and perform automated quantity takeoffs. Similarly, parametric modeling environ-ments like Revit provide quantity takeoff capabilities. Automated quantity take-off streamlines the cost-estimating process and enables architects and engineers to perform what-if analyses in a more reliable and efficient manner. Similarly, many software systems perform 4D simulation, such as Synchro 4D and Bentley Con-strucSim, to streamline the linking schedules with 3D models and the simulation of the construction process for spatiotemporal analyses used for identifying problems in the schedule and time-space conflicts. Finally, several software systems, such as Navisworks and Solibri, utilize federated building information models generated by specialty trades to streamline clash detection and construction process analysis and coordination.
The documented benefits of BIM include improved cost estimation, scheduling, and quality control support. Examples include increased efficiency, and accuracy for estimating, proactive management, and communication of schedules and ac-tive quality control at construction sites (e.g., [1, 13, 50–52]). Closely related to the general theme of ECx, the following sections describe these topics in greater
92 Building Information Modeling: Current Practices in Building Evaluation Models and Updates
detail such as how BIM helps coordinate different building trades and assists with the quality control of the construction process, thus ensuring that building systems meet their design intent.
5.3.1 Using BIM for Coordination of Building Systems and Specialty Trades
A major benefit of BIM is the coordination of designs generated by architects, engineers, and specialty trades to identify clashes prior to fieldwork. Identifying problems in the schedule and time-space conflicts prevents undocumented design changes and costly fixes caused by clashes that used to be identified only in the field. Such changes can result in inconsistencies between design and as-built documents that may invalidate the original design intent. This has significant implications for ECx.
Without BIM, clash detection consists of overlaying one 2D drawing over an-other to identify possible inconsistencies. This manual approach is cumbersome and error prone. Potentially, it results in unidentified clashes. BIM-based tools enable automatic clash identification through geometry and semantic rule-based analysis. They enable identification of both hard-clashes, in which two components spatially conflict with each other, and soft-clashes, in which there is physical intrusion into the work and access spaces needed to construct or operate a building component.
Studies have documented possible savings associated with proactive coordina-tion of specialty trades through automated clash detection. A major metric used in these studies is the comparison of costly field-generated requests for information (RFI) versus those generated during coordination. Another advantage is that once the design information is coordinated, the models can be trusted and components can be prefabricated. Case studies show that these benefits translate into savings of both time and money (e.g., [13, 15, 53]).
One of the limitations of current BIM-based coordination is that the accuracy and the effectiveness of coordination depend on models with the appropriate level of detail provided by specialty trades. If key components are absent from these models, then clashes associated with such components will be missed [13, 54]. On the other hand, if too much detail is provided, then there will be many false positives, which can overwhelm data management. As BIM-based coordination becomes more widely adopted, companies will develop their own policies and pro-cesses regarding the desirable levels of detail in models and effective clash manage-ment strategies.
5.3.2 Use of BIM and 3D Imaging Techniques for Construction Quality Control
A coordinated BIM depicts an accurate construction scope and a baseline for qual-ity control. 3D imaging, such as laser scanners, enables capturing and documenting the as-is field conditions spatially (Chapter 6). Such technologies coupled with BIM provide an opportunity for thorough quality control and assessment of as-built conditions [51, 55]. Through assessment, it is possible to identify discrepancies between as-built and as-designed conditions, and evaluate whether discrepancies constitute defects. In addition, capturing as-built conditions during construction provides accurate dimensions for engineered-to-order components and ensures that

5.4 Using BIM in Evaluating Facilities Throughout Their Life Cycle 93
they match work done at the job site. Chapter 6 further details the capture of as-built conditions using 3D imaging technologies.
5.4 Using BIM in Evaluating Facilities Throughout Their Life Cycle
Building operation accounts for about 60% of the total costs throughout a build-ing’s life cycle. A major portion of this cost arises from expenses associated with energy usage during building systems operations and the materials and equipment needed for their maintenance and repair [56–58]. Previous research, however, shows that current operation phase practices have inefficiencies and are not always effec-tive. First, unnecessary energy is consumed by building systems due to the defective components’ inability to diagnose faults effectively. About 20% to 30% of energy used by HVAC systems is wasted due to faults such as misplaced sensors (Chapter 11), malfunctioning controllers, and controlled devices (Chapter 8), as well as the improper implementation and execution of control logic [24, 59–61]. Computer-ized analysis of system components is needed to automatically diagnose these faults and reduce energy waste [60–66].
Second, most of the maintenance work performed in current practice is reac-tive, costing three to four times more than planned work [67–69]. Planning of maintenance activities requires improved facility information and analysis, like as-built information models and maintenance histories [70]. Three types of building analyses can be performed to service facilities that are streamlined by BIM.
5.4.1 Utilization of BIM for Traditional Commissioning Activities
Currently, BCx is performed mainly through manual inspection, testing, and analy-sis. Previous research has concluded that manual commissioning suffers from the limited time and resources to undertake testing, a shortage of skilled personnel, and the difficulty of defining performance criteria using prescriptive metrics [71–73]. Therefore, a computerized approach is needed to automate the current commission-ing process and fully realize ECx [74, 75] (Chapters 2, 4, and 8).
Correct commissioning protocols require various types of information about building elements and building system configurations, performance measurements of system components, and benchmark values for the performance requirements [61]. Researchers have proposed approaches for using building automation systems to acquire performance measurements for automated BCx (Chapter 3). Choiniere [76] used building energy management systems to acquire measurements, such as indoor temperature and occupancy, that supported a rule-based automated com-missioning application [76]. BIM represents semantic information about building elements and enables computerized approaches to automatically access and reason about building information. Previous studies have applied BIM to storing and pro-viding the required information for automated BCx. Türkaslan-Bülbül and Akın [77] developed an information model based on BIM that represents the informa-tion requirements for embedded commissioning [77]. Wang and his collaborators analyzed the capability of IFC schema for representing the information require-ments for ECx and proposed a potential extension for IFC schema [78]. O’Donnell et al. [80] proposed an architecture for an integrated framework that not only

94 Building Information Modeling: Current Practices in Building Evaluation Models and Updates
accesses existing BIM information, but also maintains the commissioning rules and measurements to achieve automation in BCx. Ahmed et al. [79] proposed an ap-proach that integrates data from information models and sensor networks into a data warehouse to support automated and Continuous Cx© [79].
A major barrier inhibiting the use of BIM in BCx is the lack of formal repre-sentations of building system information and measurement of data within BIM schemata [80]. Existing approaches focus on framework architecture and not rep-resentation deficiencies. Therefore, current research is directed at extending BIM schemata to include needed information representations to satisfy the information requirements of automated BCx and to evolve into ECx (Chapter 8).
5.4.2 Using BIM for Fault Diagnosis of Building Systems
Building automation systems typically consist of sensors, controllers, actuators, and controlled devices [81]. Control is achieved by configuring these components and implementing the control logic. The designed control systems malfunction if a component fails to behave as designed. However, due to rising indoor environ-ment requirements, an increasing number of software and hardware components are being used in building automation systems (BASs). As BASs become increasingly complex, it becomes increasingly challenging for operators to manually diagnose building system conditions [62, 82, 83]. Fault detection and diagnosis (FDD) meth-ods have been studied and developed to address some of the challenges associated with manual operation and maintenance of BASs. Both laboratory and real-world experiments have been conducted to validate the energy-saving capabilities of exist-ing computer-aided FDD approaches [59, 84, 85]. One limitation of computerized FDD approaches is that they are mainly developed within academia. Very few are deployed in real-world applications [86]. Deployment requires a thorough knowl-edge of BAS parameters, such as condition measures of the building environment, the configuration of the BAS, and physical properties of the building elements. Due to the proprietary nature of this information, it is difficult for system operators to acquire and reformat the information to support various FDD requirements [62].
BIM contains information, including properties of building elements and BAS components, that helps in the deployment of BAS and corresponding computer-aided FDD approaches. Currently, only a few proposals utilize BIM in automated FDD for BAS. One such an approach by Provan et al. [16] uses BIM to generate a simulation model of the HVAC systems and to acquire sensor information to col-lect the needed measurements from the BAS.
The major challenge in this approach is that BIM schemata for holistic repre-sentation of the information requirements for existing FDD approaches, like sche-mata that represent information on fault types and faulty components, have not yet been developed.
5.4.3 Using BIM in Planning of Maintenance Tasks
The performance of maintenance tasks is critical for ensuring the continuous, correct functioning of buildings [87]. However, maintenance tasks that are reac-tive cost three to four times more than planned maintenance [67–69]. Reactive maintenance only fixes the symptoms instead of the root cause of problems [70].
5.5 Evolution of BIM and the Need for Information Updating 95
Increasing the number of planned maintenance tasks, therefore, will reduce the costs of building maintenance. Various products are available for computer-aided facilities management (CAFM), computerized maintenance management systems (CMMS), and integrated workplace management system (IWMS). These products provide users with the necessary functions for planning preventive maintenance tasks. For example, FM:Systems is a suite of software applications for CAFM. The FM:Interact application enables users to schedule preventive maintenance work orders for equipment [88]. Similar software applications include Maximo [89], Ar-chiBus [90], and Tririga [91].
One limitation of these software applications is that they predominantly pro-vide the template for the user to manually input the required information but do not support automated planning of maintenance tasks, except for the scheduling of recurring preventive maintenance. Planning of maintenance tasks requires as-is building information and the performance history of building elements and sys-tems (Chapter 6). Planning preventive maintenance requires having access to the specifications of existing equipment and information about their loads [92]. There-fore, automated planning requires that the software application be able to access and reason about this information. BIM provides semantic-rich information about building elements and has the potential to support the planning of maintenance tasks.
Existing software applications, such as ArchiBus and FM:Systems, can import information from BIM-based design software like Autodesk Revit [93]. However, the information imported is limited and these approaches still do not support au-tomated maintenance planning. Currently, the utilization of BIM for supporting maintenance tasks is still an evolving field with only a few approaches proposed for utilizing BIM for maintenance tasks planning. For example, Hao et al. [94] proposed an approach that integrates BIM with condition monitoring systems and CAFM to develop a decision support framework for planning preventive mainte-nance and condition-based maintenance [94]. Akçamete et al. [70] discussed the potential of using BIM to store the performance history of the building elements so that the information can be used to identify spatial/topological breakdown patterns and to evaluate conditions for supporting decisions related to maintenance plan-ning [70]. Chapters 13 and 14 introduce several emerging areas of field applica-tions in facility operations and maintenance: augmented reality, wearable comput-ers, and just-in-time technologies.
5.5 Evolution of BIM and the Need for Information Updating
As buildings evolve, building information models must evolve to correspond to changing representational requirements. Due to its creative nature, the parameters of a design are unpredictable. Moreover, constructability issues, costs, and quality constraints require design changes even during the detailed design and construction phases of CPD. In each phase, the stakeholders require information from previous phases and from various parties, necessitating the transfer of information from one phase to another. However, every stakeholder has different building information needs in terms of the level of representation and the level of detail in a building in-formation model. As the information evolves, it becomes more detailed. Providing

96 Building Information Modeling: Current Practices in Building Evaluation Models and Updates
the details of system O&M manuals creates additional challenges to streamlining the progression of the information throughout the capital project life cycle.
The solutions proposed for this problem promote adding information to the in-formation model, when created by its creator [11, 95]. However, because different parties need to input data into the same model, this raises problems of information ownership, accountability, creation, and maintenance authority allocation.
Studies suggest placing a new CPD approach to resolve these issues, under the title of integrated project delivery (IPD). IPD aims to optimize stakeholder collabo-ration between all participants at every phase by encouraging early contribution of knowledge and experience through the proactive involvement of key participants [96].
Currently, building information is transferred manually from one phase to an-other. The transferred documents generally include only the necessary information for the users of the successor phase. Since the information is not captured and transferred automatically, it requires re-creation by each stakeholder. In a study conducted at NIST, recollecting and transferring information adds redundant costs to projects, estimated to be about $65 million a year [97]. On the other hand, if redundant tasks were not performed, then new problems would arise due to the unavailability of necessary information. Through the integration of BIM during all stages of a capital project’s life cycle, it is possible to keep the model up to date and adequate for each phase.
Construction Operations Building Information Exchange (COBIE) is a stan-dard that was developed to capture building information during design, construc-tion, and commissioning, to enable the handover of the information to the opera-tions phase [11]. Because it enables different parties to input information for which they are responsible, it is a structured way to capture information essential for operations in a common database that persists throughout design and construc-tion. As a result, building information is ready and complete at the time of the handover to the next phase of CPD. This information can be input into the facility management database or be automatically transferred to more specialized facil-ity management tools. Similarly, the Specifiers’ Properties Information Exchange (SPie) project assists manufacturers in exporting product data in an open format used by designers, specifiers, builders, owners, and operators [95].
Even though the information transfer to facility operators can be streamlined through these efforts, there still remains the challenge of keeping the information up to date in an information model during the service life of a facility because facili-ties continually change during occupancy. In addition to major renovations initi-ated by users, changes in building functionality and daily maintenance and repair activities also result in facility modifications. Information related to these changes must be recorded to update the facility information [98]. Therefore, it is extremely important to maintain an information model and update it throughout a facility’s service life.
In conclusion, BIM has a critical role in supporting a variety of tasks in relation to ECx throughout the life cycle of facilities. These include, but are not limited to, energy analysis, building code compliance checking, clash detection, trade coordi-nation, quality control during construction, traditional commissioning activities, fault detection and diagnosis, and planning of maintenance tasks during facility operations. While the added values of BIM to these functions are well documented,

5.5 Evolution of BIM and the Need for Information Updating 97
a few major challenges still remain in ensuring that BIM is a reliable source of information to support these tasks. The primary challenge is that the information model necessitates frequent updates. In addition, the level of information detail provided by BIM must evolve with the facility life cycle and must support corre-sponding decisions and tasks. These challenges must be addressed to maximize the usefulness of BIM in supporting ECx tasks.
References
[1] Eastman, C., et al., BIM Handbook A Guide to Building Information Modeling for Own-ers, Managers, Designers, Engineers, and Contractors, Hoboken, NJ: John Wiley & Sons, 2008.
[2] Borrmann, A., and E. Rank, Query Support for BIMs using Semantic and Spatial Condi-tions, Handbook of Research on Building Information Modeling and Construction Infor-matics: Concepts and Technologies, IGI Global, 2010.
[3] GSA, 3D-4D Building Information Modeling, 2010, available from http://www.gsa.gov/portal/content/105075, accessed February 21, 2011.
[4] USACE, USACE BIM Roadmap, 2011, available from https://cadbim.usace.army.mil/MyFiles%5C1%5C2%5C1%5CERDC-TR-06-10,%20supplement%202.pdf, accessed February 11, 2011.
[5] VA, The VA BIM Guide, 2010, available from http://www.cfm.va.gov/til/bim/BIMGuide/, accessed February 11, 2011.
[6] DSF, State of Wisconsin BIM Guidelines and Standards, 2009, available from http://www.doa.state.wi.us/dsf/masterspec_view_new.asp?catid=61&locid=4, accessed February 11, 2011.
[7] CIC Research Group, BIM Project Execution Planning Guide, Department of Architec-tural Engineering, The Pennsylvania State University, 2009, available from http://www.engr.psu.edu/ae/cic/bimex/download.aspx, accessed February 11, 2011.
[8] BIM, Indiana University BIM Standards, 2010, available from http://www.indiana.edu/~uao/iubim.html, accessed February 11, 2011.
[9] NBIMS. National BIM Standard Version 1—Part 1: Overview, Principles, and Methodolo-gies, 2010, available from http://www.wbdg.org/pdfs/NBIMSv1_p1.pdf, accessed February 11, 2011.
[10] IAI-Tech, IFC2x Edition 4 Release Candidate 2 Specifi cation, 2011, available from http://www.iai-tech.org/ifc/IFC2x4/rc2/html/index.htm, accessed February 27, 2011.
[11] East, E. W., Construction Operations Building Information Exchange, 2010, available from http://www.wbdg.org/resources/cobie.php.
[12] Nisbet, N., Wix, J., and Conover, D., “The Future of Virtual Construction and Regulation Checking,” in Virtual Futures for Design, Const. and Procuremenet, P. S. Brandon and T. Kocatürk (Eds.), New York: Wiley-Blackwell, 2008, pp. 241–251.
[13] Khanzode, A., Fischer, M., and Reed, D., “Benefi ts and Lessons Learned of Implementing Building Virtual Design and Construction (VDC) Technologies for Coordination of Me-chanical, Electrical, and Plumbing (MEP) Systems on a Large Healthcare Project,” Journal of Information Technology in Construction (ITCON), Vol. 13, 2008, pp. 324–342.
[14] Kunz, J., and Fischer, M., “Virtual Design and Construction: Themes, Case Studies and Im-plementation Suggestions,” CIFE Technical Reports, Stanford, CA: Center for Integrated Facility Engineering, 2007.
[15] Tocci, ROI for VDC, 2011, available from http://www.tocci.com/index.php?option=com_content&view=article&id=160&Itemid=168, accessed February 11, 2011.
98 Building Information Modeling: Current Practices in Building Evaluation Models and Updates
[16] Provan, G., et al., “Using BIM Data for Generating and Updating Diagnostic Models,” in Proceedings of the Twelfth International Conference on Civil, Structural and Environmen-tal Engineering Computing, Stirlingshire, Scotland, 2009.
[17] EcoDomus website, http://www.ecodomus.com, accessed February 21, 2011.[18] Onuma System website, http://www.onuma.com/index.php, accessed February 27, 2011.[19] “Green BIM—How Building Information Modeling is Contributing to Green Design and
Construction,” SmartMarket Report, McGraw-Hill Construction, 2010.[20] Al-Homoud, M. S., “Computer-Aided Building Energy Analysis Techniques,” Building and
Environment, Vol. 36, No. 4, 2001, pp. 421–433.[21] Cornford, S. L., Feather, M. S., and Jenkins, J. S., “Intertwining Risk Insights and Design
Decisions,” in Proceedings of the 8th International Conference on Probabilistic Safety As-sessment and Management, New Orleans, LA, 2006.
[22] Building Energy Data Book, Washington, DC: Energy Effi ciency and Renewable Energy, Buildings Technologies Program, U.S. Department of Energy, 2008.
[23] The 2007 Commercial Building Energy Consumption Survey (CBECS), Washington, DC: U.S. Energy Information Administration, 2008.
[24] Roth, K. W., et al., The Energy Impact of Commercial Building Controls and Performance Diagnostics: Market Characterization, Energy Impact of Building Faults and Energy Sav-ings Potential, 2005, Cambridge, MA: TIAX:.
[25] Bourgeois, D., Reinhart, C., and Macdonald, I., “Adding Advanced Behavioural Models in Whole Building Energy Simulation: A Study on the Total Energy Impact of Manual and Automated Lighting Control,” Energy and Buildings, Vol. 38, No. 7, 2006 pp. 814–823.
[26] ASHRAE/IESNA Standard 90.1-2004, Energy Standard for Buildings Except Low-Rise Residential Buildings, Atlanta, GA: American Society of Heating, Refrigerating, and Air-Conditioning Engineers, 2004.
[27] Clarke, J., Energy Simulation in Building Design, Woburn, MA: Butterworth-Heinemann, 2001.
[28] Crawley, D., et al., “Contrasting the Capabilities of Building Energy Performance Simula-tion Programs,” Building and Environment, Vol. 43, No. 4, 2008, pp. 661–673.
[29] DOE2 website, http://www.doe2.com, accessed January 3, 2011.[30] Crawley, D. B., et al., “EnergyPlus: Creating a New-Generation Building Energy Simulation
Program,” Energy and Buildings, Vol. 33, No. 4, 2001, pp. 319–331.[31] Papamichael, K., and Pal, V., “Barriers in Developing and Using Simulation-Based Deci-
sion-Support Software,” in ACEEE 2002 Summer Study on Energy Effi ciency in Buildings. Pacifi c Grove, CA, 2002.
[32] Hong, T., Chou, S. K., and Bong, T. Y., “Building Simulation: An Overview of Devel-opments and Information Sources,” Building and Environment, Vol. 35, No. 4, 2000, pp. 347–361.
[33] Bazjanac, V., “Acquisition of Building Geometry in the Simulation of Energy Performance,” Building Simulation, 2001, pp. 305–311.
[34] Augenbroe, G., “Trends in Building Simulation,” Building and Environment, Vol. 37, Nos. 8–9, 2002, pp. 891–902.
[35] Punjabi, S., and Miranda, V., “Development of an Integrated Building Design Informa-tion Interface,” in Ninth International IBPSA Conference, Montréal, Canada, 2005, pp. 969–976.
[36] Laine, T., et al., “Benefi ts of Building Information Models in Energy Analysis,” in Proceed-ings of Clima 2007 Well-Being Indoors, 2007.
[37] Azhar, S., Brown, J., and Farooqui, R., “BIM-Based Sustainability Analysis: An Evaluation of Building Performance Analysis Software,” in Proceedings of the 45th ASC Annual Con-ference, Gainesville, FL, 2009.
5.5 Evolution of BIM and the Need for Information Updating 99
[38] Bazjanac, V., and Maile, T., IFC HVAC Interface to EnergyPlus—A Case of Expanded Interoperability for Energy Simulation. Berkeley, CA: Lawrence Berkeley National Labora-tory, 2004.
[39] Howell, I., and Batcheler, B., “Building Information Modeling Two Years Later—Huge Potential, Some Success and Several Limitations,” The Laiserin Letter, Vol. 22, 2005.
[40] van Treeck, C., Romberg, R., and Rank, E. “Simulation Based on the Product Model Stan-dard IFC,” in Proceedings of Building Simulation, Eindhoven, Netherlands, 2003.
[41] gbXML website, http://www.gbxml.org, accessed January 3, 2011.[42] Autodesk Ecotect Analysis website, http://usa.autodesk.com/adsk/servlet/pc/index?id=126
02821&siteID=123112, accessed February 20, 2011.[43] Thuesen, N., Kirkegaard, P. H., and Jensen, R. L., “Evaluation of BIM and Ecotect for
Conceptual Architectural Design Analysis,” in Proceedings of the International Conference on Computing in Civil and Building Engineering, Nottingham, UK: Nottingham University Press, 2010.
[44] Glazer, J., “Common Data Defi nitions for HVAC&R Industry Applications,” ASHRAE Transactions, Vol. 115, 2009, pp. 531–544.
[45] Dong, B., et al., “A Comparative Study of the IFC and gbXML Informational Infrastruc-tures for Data Exchange in Computational Design Support Environments,” in Proceedings Building Simulation 2007, Vol. 1, 2007, pp. 1530–1537.
[46] Han, C. S., Kunz, J. C. and Law, K. H., “A Hybrid Prescriptive/Performance Based Ap-proach to Automated Building Code Checking,” in Fifth Congress in Computing in Civil Engineering. Boston, MA, 1998.
[47] Lee, J. M., “Automated Checking of Building Requirements on Circulation over a Range of Design Phases,” Atlanta: Georgia Institute of Technology, 2010.
[48] Sing, T. F. and Zhong, Q. “Construction and Real Estate NETwork (CORENET),” Facili-ties, Vol. 19, No. 11/12, 2001, pp. 419–428.
[49] Solibri Model Checker website, http://www.solibri.com/solibri-model-checker.html, ac-cessed February 20, 2011..
[50] Shen, Z., and Issa, R. “Quantitative Evaluation of the BIM-Assisted Construction Detailed Cost Estimates,” Journal of Information Technology in Construction (ITcon), Vol. 15, 2010, pp. 234–257.
[51] Akinci, B., et al., “A Formalism for Utilization of Sensor Systems and Integrated Project Models for Active Construction Quality Control,” Automation in Construction, Vol. 15, No. 2, 2006, pp. 124–138.
[52] Issa, R. R. A., Flood, I., and O’Brien, W. J., 4D CAD and Visualization in Construction: Developments and Applications, Taylor & Francis, 2003.
[53] Staub-French, S., and Khanzode, A., “3D and 4D Modeling for Design and Construction Coordination: Issues and Lessons Learned,” ITcon, Vol. 12, 2007, pp. 381–407.
[54] Leite, F., et al., “Analysis of modeling effort and impact of different levels of detail in build-ing information models,” Automation in Construction, 2011. In Press.
[55] Bosche, F., and Haas, C. T., Automated Retrieval of Project Three-Dimensional CAD Ob-jects in Range Point Clouds To Support Automated Dimensional QA/QC,” Information Technologies in Construction, Vol. 13, 2008, pp. 71–85.
[56] Liu, L., et al., “Capturing As-Built Project Information for Facility Management,” in OM-PUT, CIV ENG, New York: ASCE, Vol. 1, 1994, pp. 614–621.
[57] Clayton, M., Johnson, R., and Song, Y., “Operations Documents: Addressing the Informa-tion Needs of Facility Managers,” Durability of Building Materials and Components, Vol. 8, No. 4, 1999p. 2441–2451.
[58] Teicholz, E., “Bridging the AEC/FM Technology Gap,” IFMA Facility Management Jour-nal,. March–April 2004.
[59] Mansson, L.-G., and McIntyre, D. “Controlling and Regulating Heating, Cooling and Ventilation Methods and Examples,” in IEA Annex 16 & 17 Technical Synthesis Report, International Energy Agency, 1997.
100 Building Information Modeling: Current Practices in Building Evaluation Models and Updates
[60] Liddament, M. W., Technical Synthesis Report: Real Time Simulation of HVAC Systems for Building Optimisation, Fault Detection and Diagnostics, Coventry, UK: ESSU, 1999.
[61] Liu, M., Claridge, D., and Turner, W. Continuous Commissioning Guidebook: Maximizing Building Energy Effi ciency and Comfort, Washington, DC: Federal Energy Management Program, U.S. Department of Energy, 2002.
[62] Katipamula, S., and Brambley, M. “Methods for Fault Detection, Diagnostics, and Prog-nostics for Building Systems—A Review, Part I,” HVAC&R Research, Vol. 11, No. 1, 2005, pp. 3–25.
[64] IEA, “Commissioning Tools for Improved Energy Performance,” No. 40, International Energy Agency, 2004.
[65] House, J., and Kelly. G. “An Overview of Building Diagnostics,” in National Conference on Building Commissioning. 2000.
[66] Castro, N. “Commissioning of Building HVAC Systems for Improved Energy Perfor-mance,” in Proceedings of the Fourth International Conference for Enhanced Building Operations. Paris, France, 2004.
[67] Mobley, R. K., “Corrective Maintenance,” in Maintenance Engineering Handbook, L. R. Higgins and D. J. Wikoff (Eds.), New York: McGraw-Hill, 2008, pp. 2.3–2.6.
[68] Franklin, S., “Redefi ning Maintenance—Delivering Reliability,” in Maintenance Engineer-ing Handbook, L. R. Higgins and D. J. Wikoff (Eds.), New York: McGraw-Hill, 2008, pp. 1.3–1.8.
[69] Sullivan, G. P., Pugh, R., and Melendez, A. P., Operations and Maintenance Best Prac-tices—A Guide to Achieving Operational Effi ciency, Richland, WA: Pacifi c Northwest Na-tional Laboratory, 2002.
[70] Akcamete, A., Akinci, B., and Garrett, Jr., J. H., “Potential Utilization of Building Infor-mation Models for Planning Maintenance Activities,” in Proceedings of the International Conference on Computing in Civil and Building Engineering, Nottingham, UK: Notting-ham University Press, 2010.
[71] Salsbury, T., and Diamond, R., “Automated Testing of HVAC Systems for Commission-ing,” in PECI Commissioning Conference, Portland, OR, 1999.
[72] Castro, N. S., and Vaezi-Nejad, H., “CITE-AHU, an Automated Commissioning Tool for Air-Handling Units,” in National Conference on Building Commissioning, 2005.
[73] Brambley, M. R., and Katipamula, S., “Automated Commissioning for Lower-Cost, Widely Deployed Building Commissioning of the Future,” in Web Based Enterprise Energy and Building Automation Systems, B. L. Capehart and L. C. Capehart (Eds.), The Fairmont Press, 2007, pp. 145–156.
[74] Katipamula, S., Brambley, M., and Luskay, L., “Automated Proactive Techniques for Com-missioning Air-Handling Units,” Journal of Solar Energy Engineering, Vol. 125, 2003, pp. 282–291.
[75] Vaezi-Nejad, H., Salsbury, T., and Choiniere, D., “Using Building Control System for Com-missioning,” in International Conference for Enhanced Building Operation, Paris, France, 2004.
[76] Choiniere, D., “DABO: A BEMS Assisted On-Going Commissioning Tool,” in Asia-Pacifi c Conference on Building Commissioning (APCBC) Workshop, Kyoto, Japan, 2008.
[77] Turkaslan-Bulbul, M. T., and Akin, O. “Computational Support for Building Evaluation: Embedded Commissioning Model,” Automation in Construction, Vol. 15, No. 4, 2006, pp. 438–447.
[78] Wang, H., et al., “Feasibility and Fidelity of Data Exchange Through IFC for Building Commissioning,” in ICEBO 2005, Pittsburgh, PA, USA, 2005.
[79] Ahmed, A., et al., “Multi-Dimensional Building Performance Data Management for Con-tinuous Commissioning,” Advanced Engineering Informatics, Vol. 24, 2010, pp. 466–475.
[80] O’Donnell, J., et al., “BuildingPI: A Future Tool for Building Life Cycle Analysis,” in Pro-ceedings of the SimBuild 2004 Conference, Boulder, CO, 2004, Citeseer.
5.5 Evolution of BIM and the Need for Information Updating 101
[81] 2009 ASHRAE Handbook—Fundamentals, Atlanta, GA: American Society of Heating, Refrigerating and Air-Conditioning Engineers, 2009.
[82] Jagpal, R., “Computer Aided Evaluation of HVAC System Performance: Technical Synthe-sis Report,” 2006.
[83] Lee, W., House, J., and Kyong, N., “Subsystem Level Fault Diagnosis OF A Building’s Air-Handling Unit Using General Regression Neural Networks,” Applied Energy, Vol. 77, No. 2, 2004, pp. 153–170.
[84] Schein, J., and Bushby, S., “A Simulation Study of a Hierarchical, Rule-Based Method for System-Level Fault Detection and Diagnostics in HVAC Systems,” NISTIR 7216, 2005.
[85] Wang, S., Zhou, Q., and Xiao, F., “A System-Level Fault Detection AND Diagnosis Strat-egy for HVAC Systems Involving Sensor Faults,” Energy and Buildings, Vol. 42, No. 4, 2009, pp. 477–490.
[86] Liang, J., and Du, R., “Model-Based Fault Detection and Diagnosis of HVAC Systems Us-ing Support Vector Machine Method,” International Journal of Refrigeration, Vol. 30, No. 6, 2007, pp. 1104–1114.
[87] Chanter, B., and Swallow, P., Building Maintenance Management, Oxford, UK: Wiley-Blackwell, 2007.
[88] FM:Systems website, http://www.fmsystems.com, accessed February 21, 2011.[89] IBM Maximo Asset Management Software website, http://www-01.ibm. com/software/
tivoli/products/maximo-asset-mgmt, accessed February 21, 2011. [90] ArchiBus website, http://www.archibus.com, accessed February 21, 2011.[91] Tririga website, http://www.tririga.com/home, accessed February 21, 2011.[92] Horner, R., El-Haram, M., and Munns, A., “Building Maintenance Strategy: A New Man-
agement Approach,” Journal of Quality in Maintenance Engineering, Vol. 3, No. 4, 1997, pp. 273–280.
[93] Autodesk Revit website, http://usa.autodesk. com/adsk/servlet/pc/index?id=3781831&siteID=123112, accessed February 21, 2011.
[94] Hao, Q., et al., “A Decision Support System for Integrating Corrective Maintenance, Preventive Maintenance, and Condition-Based Maintenance,” in Construction Research Congress 2010: Innovation for Reshaping Construction Practice, Banff, Alberta, Canada, 2010, ASCE.
[95] BuildingSMART website, http://www.buildingsmartalliance.org/index.php/projects, ac-cessed February 11, 2011.
[96] AIA. IPD Guide, available from http://images.autodesk. com/adsk/fi les/ipd_defi nition_doc_fi nal_with_supplemental_info.pdf, accessed February 11, 2011.
[97] Gallaher, M., et al., “Cost Analysis of Inadequate Interoperability in the U.S. Capital Facili-ties Industry,” in NIST GCR 04-867, National Institute of Standards & Technology , 2004.
[98] Akcamete, A., Akinci, B., and Garrett, Jr., J. H., “Motivation for Computational Support for Updating Building Information Models (BIMs),” in 2009 ASCE International Work-shop on Computing in Civil Engineering. Austin, TX, 2009, ASCE.

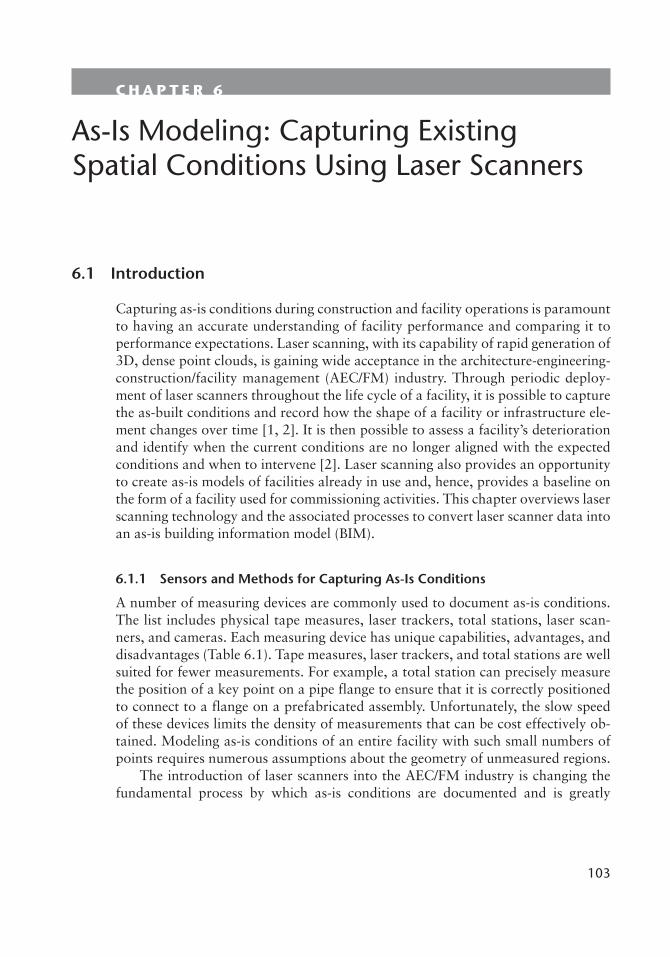
103
C H A P T E R 6
As-Is Modeling: Capturing Existing Spatial Conditions Using Laser Scanners
6.1 Introduction
Capturing as-is conditions during construction and facility operations is paramount to having an accurate understanding of facility performance and comparing it to performance expectations. Laser scanning, with its capability of rapid generation of 3D, dense point clouds, is gaining wide acceptance in the architecture-engineering-construction/facility management (AEC/FM) industry. Through periodic deploy-ment of laser scanners throughout the life cycle of a facility, it is possible to capture the as-built conditions and record how the shape of a facility or infrastructure ele-ment changes over time [1, 2]. It is then possible to assess a facility’s deterioration and identify when the current conditions are no longer aligned with the expected conditions and when to intervene [2]. Laser scanning also provides an opportunity to create as-is models of facilities already in use and, hence, provides a baseline on the form of a facility used for commissioning activities. This chapter overviews laser scanning technology and the associated processes to convert laser scanner data into an as-is building information model (BIM).
6.1.1 Sensors and Methods for Capturing As-Is Conditions
A number of measuring devices are commonly used to document as-is conditions. The list includes physical tape measures, laser trackers, total stations, laser scan-ners, and cameras. Each measuring device has unique capabilities, advantages, and disadvantages (Table 6.1). Tape measures, laser trackers, and total stations are well suited for fewer measurements. For example, a total station can precisely measure the position of a key point on a pipe flange to ensure that it is correctly positioned to connect to a flange on a prefabricated assembly. Unfortunately, the slow speed of these devices limits the density of measurements that can be cost effectively ob-tained. Modeling as-is conditions of an entire facility with such small numbers of points requires numerous assumptions about the geometry of unmeasured regions.
The introduction of laser scanners into the AEC/FM industry is changing the fundamental process by which as-is conditions are documented and is greatly

104 As-Is Modeling: Capturing Existing Spatial Conditions Using Laser Scanners
enhancing the accuracy and level of detail at which a facility can be modeled. Laser scanners rapidly and accurately measure a dense array of points in 3D space, cap-turing the shape of all surfaces visible to the scanner (Figure 6.1). The 3D points produced by a laser scanner are known as a scan or a point cloud. Although all of the aforementioned measuring technologies may be used in a given project, this chapter focuses primarily on workflows involving the use of laser scanners.
6.1.2 The Scan-to-BIM Workfl ow
It is possible to conduct many types of analysis directly using point clouds obtained from a laser scanner. Virtual measurements can determine the distance between individual points. The point cloud can be overlaid with an existing CAD model or BIM to test for intersecting surfaces—a process known as clash detection. The dif-ference between points and a design model can identify construction mistakes or deviations from the design [1].
Table 6.1 Common Devices Used for Measuring As-Is Conditions and Their Advantages and DisadvantagesMeasurement Device Advantages Disadvantages
Tape measure Low cost, can measure curved surfaces
Slow, low accuracy
Laser tracker Very high accuracy Slow, limited range
Total station High accuracy Slow, relatively high cost
Laser scanner Moderately high accuracy, fast
High cost
Camera Low cost Moderate accuracy, scale ambiguity
Figure 6.1 A scan (or point cloud) created by a laser scanner.
6.1 Introduction 105
Despite the myriad applications of point cloud data, this type of analysis is ul-timately limited because the point cloud model represents the facility at a raw, un-intelligent level. For example, the model does not specify which points belong to a wall and which ones belong to the floor. The model does not indicate where a pipe originates or where it leads. The burden of interpretation falls on the user, which leads to labor-intensive analysis processes and raises a barrier against straightfor-ward usage by nonexperts.
The limitations on the use of point cloud data suggest that there is a substantial benefit to abstracting the raw point cloud data to a higher level by converting the data into a BIM. Building information models are information-rich, object-orient-ed representations of a facility. A BIM represents a facility in terms of components, such as walls, floors, and windows, with geometry to describe their shape. The components also include metadata that describes the behavior of components and their relationships to one another. This metadata endows components with intel-ligence. For example, a wall “knows” when it is connected to another wall, and a window is “aware” that it is embedded within a wall.
A BIM is useful for many purposes, including facility management (e.g., to plan space usage and maintenance), simulation (e.g., to model the effects of a building fire), construction planning (e.g., for planning a renovation project), and visualiza-tion (e.g., for a virtual walkthrough of a facility). The process of transforming laser scan data into a BIM is known as the points-to-BIM or scan-to-BIM process [3].
The scan-to-BIM workflow typically involves four steps: data collection, data registration, modeling, and verification. In the data collection step, laser scans are obtained from locations throughout the facility. Scanning locations are selected to ensure that surfaces are imaged with sufficient coverage and accuracy to support project requirements. Next, the individual scans are aligned in a common coordi-nate system through a process known as data registration. In the modeling step, the BIM is created by estimating the geometry, identity, and other relevant properties of each component, and by adding relationships among components. Finally, the BIM is verified to ensure that it was constructed to the accuracy requirements of the project.
The next several sections describe this scan-to-BIM workflow in detail. The workflow and supporting details are based on the experiences of the authors and on interviews with key personnel in government and industry (Ron Aarts, inter-view, April 1, 2011; Landon “Alfie” Cross, interview, April 1, 2011; Eric Hoff-man, personal communication, March 23, 2011; Jason Hosch, interview, March 23, 2011; Dale Stenning, interview, March 23, 2011; Peggy Yee, interview, March 31, 2011).
6.1.3 As-Is Modeling Needs and Requirements
Documentation of as-is conditions is applicable to several environment types within the AEC/FM domain, each with unique characteristics and requirements. The main divisions include architecture (e.g., buildings); process plants (e.g., chemical plants or refineries); mechanical, electrical, and piping (MEP); and transportation infra-structure (e.g., bridges). Architectural models usually include structural components, such as walls, ceilings, floors, windows, doorways, beams, columns, and stairways. Plant models typically include pipes, flanges, valves, manufactured equipment, and

106 As-Is Modeling: Capturing Existing Spatial Conditions Using Laser Scanners
structural steel. Models for MEP projects are similar to plant models, but are usu-ally part of a building rather than a process plant. These models involve pipes, duc-twork, wiring trays, mounting brackets, and specialized components, such as lights and sprinkler heads. Infrastructure models, such as bridges, may include concrete components, like columns and piers, as well as steel assemblies.
The necessary level of detail and accuracy for a model varies by project and anticipated downstream needs for the data. Process plant models generally involve key points, known as tie points, where pipes or structural steel must meet exactly. For such tie points, scan data may be augmented by measurements from total sta-tions or laser trackers. An architectural BIM may require a high level of detail if the model is for renovation planning or historical preservation. On the other hand, less accuracy may be needed for space usage planning or energy simulations.
6.1.4 Comparison with As-Designed Modeling
The concept of BIM was originally developed to support design and construction of facilities [4]. A BIM that documents as-is conditions differs significantly from a design or construction BIM. Most importantly, an as-is BIM is challenged to rep-resent the actual, and generally imperfect, conditions of a facility, rather than the idealized conditions of a virtual design model. Real-world walls are rarely perfectly flat or plumb, and they rarely meet at 90-degree angles, even for perfectly square corners. The imperfections of reality can be difficult, because modelers must, on a case-by-case basis, decide whether to include such imperfections in the model or to approximate a component by its idealized counterpart.
Because an as-is BIM is an abstraction of the associated underlying point cloud, a number of aspects of the abstraction process are unique to an as-is BIM [5]. Re-cording and visualizing these features can provide downstream users with a more complete picture of the as-is BIM. The geometry and position of modeled compo-nents is uncertain due to accumulated uncertainties in the scanning, registration, and modeling procedures. Some surfaces may be occluded in the scan data, due to self-occlusions (e.g., the back side of a pipe) or due to other objects in the environ-ment (e.g., furniture blocking a wall). Depending on the scanner position, surfaces may be measured at different densities, which affect the size of features that can be accurately modeled. Finally, having access to the underlying point data associ-ated with a BIM component can be helpful when the accuracy of the original data is needed. In the example shown in Figure 6.2, the wall surface (boxed region) in part (a) is analyzed according to these characteristics: (b) data density (in points per square meter), (c) occlusion regions (black = occluded, gray = unoccluded), (d) data uncertainty, and (e) deviation from the ideal planar wall (in meters).
6.2 Preparation and Data Collection
The first step in the scan-to-BIM process is obtaining the scans. Scanning a facility is the culmination of an extensive preparation process that includes choosing the appropriate scanner technology, planning the scan locations, setup and survey of registration targets, and, finally, scanning.

6.2 Preparation and Data Collection 107
Fig
ure
6.2
The
wal
l sur
face
in (
a) is
ana
lyze
d ac
cord
ing
to (
b) d
ata
dens
ity, (
c) o
cclu
sion
reg
ions
, (d)
dat
a un
cert
aint
y, a
nd (
e) d
evia
tion
from
the
idea
l pla
nar
wal
l.
108 As-Is Modeling: Capturing Existing Spatial Conditions Using Laser Scanners
6.2.1 Laser Scanner Technology
Laser scanners determine 3D position by measuring the distance and direction to visible surfaces. A typical scanner design uses a laser emitter/receiver that rotates about two orthogonal axes, with one axis spinning rapidly and one axis spinning slowly. With two axes of rotation working together, one can achieve nearly full coverage over the sphere of possible viewing directions. It is also possible to mount a single axis laser scanner on a vehicle for mobile scanning of transportation infra-structure elements, such as bridges and tunnels. In this case, the laser rotates around an axis parallel to the direction of vehicle travel, producing a fan-shaped pattern of measurements to the sides and above the vehicle.
The range measurement produced by a laser scanner is usually accomplished by one of two technologies. The first approach is pulsed time of flight (PToF). In this method, a short-duration pulse of laser light is emitted, the time required for the light to reflect off of a target surface and return to the sensor is measured, and the distance is computed based on the measured “time of flight” and the speed of light. The second common laser scanner technology is amplitude modulated con-tinuous waveform (AMCW). In this method, a continuous laser beam with varying amplitude—typically a sine wave pattern—is emitted. The distance to the target surface is estimated by measuring the phase difference between the reflected signal and the currently emitted waveform, a function of range.
Each scanning technology has strengths and weaknesses. Pulsed scanners are generally slower than phase-based scanners, sampling at rates of tens of thousands of points per second as compared to hundreds of thousands to nearly a million points per second for phase-based scanners. Pulsed scanners can measure longer ranges than a phase-based scanner. Currently, commercially available pulsed scan-ners operate at ranges up to 3,000m, whereas phase-based scanners have ranges only up to 153m. Phase-based scanner range measurements are subject to an am-biguity interval—the range at which a complete wavelength of phase offset occurs. Objects beyond this distance cannot be measured accurately because the range measurement restarts at zero at the ambiguity interval distance. As an example, if the ambiguity interval is 50m, then an object at 51m would actually be reported as being 1m away. For this reason, phase-based scanners are more frequently used for indoor applications rather than outdoors, because it is possible to ensure that no observable surfaces lie beyond the ambiguity interval distance.
Laser scanners are not perfect range-measuring devices and have limitations not explicitly expressed by device manufacturers. Some types of surfaces are difficult or impossible for laser scanners to measure. Dark-colored surfaces absorb nearly all laser light, resulting in either an uncertain range estimate or no measurement at all. Shiny surfaces reflect most of the incident light away from the scanner, making it difficult to determine the range to the surface. Often, the laser beam will hit anoth-er, nonshiny surface, and the reflected light will produce a phantom surface in the scene at a distance beyond the shiny surface. This problem commonly occurs, for example, with water, mirrors, and reflectors on commercial light fixtures. Figure 6.3b shows an example where a mirror in a bathroom (highlighted box) creates a wall surface that extends beyond the boundary of the room, as indicated in the side view. Shiny surfaces and retroreflectors can also cause unexpectedly large magni-

6.2 Preparation and Data Collection 109
tudes of reflected light, which can saturate the receiver and cause range errors that persist for a significant number of future measurements.
Transparent surfaces, such as glass and plastic, are also difficult to scan, and, depending on various factors, the surface may act like a mirror, resulting in a vir-tual surface as described above, or the laser may pass through and measure a sur-face beyond. In either case, the transparent surface is not usually imaged. Different colored surfaces can also introduce errors into the range measurement due to color-based range biases [6].
The geometry of the scene itself can cause measurement errors. Concave cor-ners in the scene enable reflections along multiple paths, which can bias the range estimate. At depth discontinuities in the scene, the laser spot can span two sur-faces simultaneously, leading to the “mixed-pixel” effect (Figure 6.3a) [7]. In this example, mixed pixels create phantom points at the boundary between two walls (top). The close-up (bottom) shows three curved lines of mixed pixels from the region within the hightlighted box. Depending on the underlying scanner technol-ogy, the reported range of mixed pixels may be located between the two surfaces, or it may lie in front of the front surface or behind the back surface. Mixed pixels can give the impression of false surfaces, especially in regions with small, highly detailed geometry, for example, along occluding edges of moldings high up on a
Figure 6.3 Laser scanners diffi culties: (a) mixed pixels create phantom points at object boundaries; (b) re-fl ections in a mirror create a wall surface extending beyond the room boundary.
110 As-Is Modeling: Capturing Existing Spatial Conditions Using Laser Scanners
building’s exterior façade. The combined effects of mixed pixels and the sparseness of laser scanner measurements leads to edge loss at depth discontinuities [8]. The amount of edge loss can be significant with respect to the accuracy goals of as-is BIM projects. For example, depending on the viewing angle, scans of a bridge from a distance of 10m can result in edge loss of between 1 and 10 cm [8]. Awareness of these sensing limitations is crucial because of their potential direct impact on creat-ing accurate models of existing conditions.
6.2.2 Scan Planning
Once the appropriate scanner technology is chosen, the next step is to create a scan plan. A scan plan indicates the expected positions where the scanner and registra-tion targets will be placed during data collection. This is typically accomplished us-ing blueprints of the facility, if available, or hand-drawn layouts, as well as pictures or videos of a walkthrough of the facility obtained during field reconnaissance. A good scan plan will ensure that the relevant components are scanned with adequate coverage to enable modelers to correctly construct the BIM. Additionally, logistics, such as site access, safety, and design of special-purpose setups for scanning chal-lenging locations, are addressed prior to data collection.
6.2.3 Scanning
On arrival to the site, registration targets are set up at locations throughout the fa-cility (Figure 6.4a). Some or all of these targets will be surveyed using, for example, a total station, to establish a set of known 3D control points, known as a control network. Additional surveying may be conducted to link the control network to known surveying monuments to allow georeferencing of the project data (i.e., put the data into a global coordinate reference frame).
A variety of target types are available, each with different advantages and dis-advantages (Figure 6.4b). The simplest and least expensive type of target is printed on paper, and often consists of a two-square by two-square checkerboard. Such targets can only be observed from limited viewing directions. This problem can be addressed with paddle-style targets, which may use a checkerboard pattern or concentric circles. Paddles may be reoriented to face the current scanner location without moving the 3D position of the target center. Spheres are a third type of commonly used target. The benefit of spheres is that they can be viewed from any direction without reorientation. Targets may be augmented with a number or code to help identify the targets during processing.
A challenge of modeling large facilities is accurately relating the data from dif-ferent rooms, different floors, and from inside and outside of the facility. This prob-lem can be addressed by surveying points visible through windows and doorways and in stairwells and elevator shafts.
Once the control network is in place, scanning can commence. At each location specified in the scan plan, the scanner is set up and a scan is collected. The exact scan location is often modified somewhat based on the judgment and experience of the scanning team. The visible registration targets are normally scanned again at a higher resolution to maximize the accuracy of target position estimates. Because
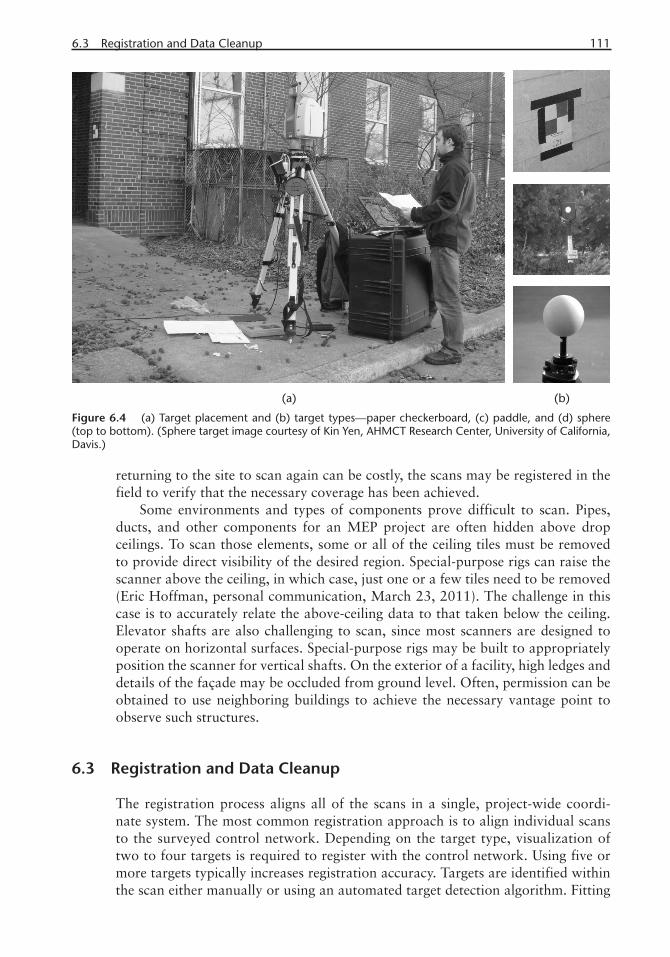
6.3 Registration and Data Cleanup 111
returning to the site to scan again can be costly, the scans may be registered in the field to verify that the necessary coverage has been achieved.
Some environments and types of components prove difficult to scan. Pipes, ducts, and other components for an MEP project are often hidden above drop ceilings. To scan those elements, some or all of the ceiling tiles must be removed to provide direct visibility of the desired region. Special-purpose rigs can raise the scanner above the ceiling, in which case, just one or a few tiles need to be removed (Eric Hoffman, personal communication, March 23, 2011). The challenge in this case is to accurately relate the above-ceiling data to that taken below the ceiling. Elevator shafts are also challenging to scan, since most scanners are designed to operate on horizontal surfaces. Special-purpose rigs may be built to appropriately position the scanner for vertical shafts. On the exterior of a facility, high ledges and details of the façade may be occluded from ground level. Often, permission can be obtained to use neighboring buildings to achieve the necessary vantage point to observe such structures.
6.3 Registration and Data Cleanup
The registration process aligns all of the scans in a single, project-wide coordi-nate system. The most common registration approach is to align individual scans to the surveyed control network. Depending on the target type, visualization of two to four targets is required to register with the control network. Using five or more targets typically increases registration accuracy. Targets are identified within the scan either manually or using an automated target detection algorithm. Fitting
Figure 6.4 (a) Target placement and (b) target types—paper checkerboard, (c) paddle, and (d) sphere (top to bottom). (Sphere target image courtesy of Kin Yen, AHMCT Research Center, University of California, Davis.)

112 As-Is Modeling: Capturing Existing Spatial Conditions Using Laser Scanners
algorithms will precisely find the 3D position of the control point on the target (e.g., sphere center or checkerboard center). The detected targets are then matched to their corresponding targets in the control network. Once the correspondences have been established, the optimal rigid body transformation (i.e., rotation and transla-tion) that registers the scan to the control network can be computed directly. Figure 6.5 shows five registered scans, each using a different color.
For some projects, it is necessary to manually remove undesirable data from the scans. Manual deletion of clutter objects, such as trees, can simplify the mod-eling process. Data from moving objects, such as passing cars or people, can also be detected and removed. The scans may be filtered to remove uncertain data or artifacts like mixed pixels or reflections.
6.4 Modeling
The modeling process converts a registered point cloud into a BIM, which provides a semantically rich information repository as described in Chapter 5. Typically, generating a BIM from point cloud data involves three tasks: (1) modeling the geometry of each component, (2) assigning object identity and metadata to the component, and (3) establishing spatial and functional relationships among compo-nents. The components that need modeling vary with the type of project and level of detail requirements. For example, typical components for an architectural project include walls, slabs, windows, doors, and roofs.
Figure 6.5 Five registered scans. (Image courtesy of Intelisum, Inc.)
6.4 Modeling 113
In the geometric modeling task, a simplified representation of the component is created based on the 3D measurements on that component’s surfaces. Usually, the desired BIM representation is a solid, volumetric object model. For example, a wall may be modeled as a rectangular parallelepiped (box shape). The wall surface observed from two adjacent rooms is used to determine the thickness of the wall. However, some or all portions of the surface may be unobserved. For instance, the wall surface adjacent to a void will only be observable from one side. In such cas-es, the modeler must make assumptions about the unobserved data using domain knowledge or information specific to the project.
Although numerous techniques for modeling the components of a BIM exist, the methods can be broadly divided into two categories: sectioning and surface fitting. The sectioning method uses 2D cross sections to create the model, whereas the surface-fitting method uses optimization algorithms to fit geometric primitives to the data.
In the sectioning method (Figure 6.6a), 2D cross sections of the data are gener-ated by projecting the points from a thin slice through the point cloud onto a plane. The lines and curves in the cross section serve as a guide for positioning and sizing components. Once the 2D outline of a component is set, it can be converted to 3D by lofting (i.e., extending the outline along a path). This method can be used to model walls from a plan view cross section, to model complex molding shapes, or to model pipe assemblies. A disadvantage of the sectioning method is that it only uses some of the available data for modeling a component. One way to address this limitation is to use multiple cross sections for modeling. For example, to model a column, cross sections at three different heights can identify whether the column is plumb or has unacceptable shape variations (Jason Hosch, interview, March 23, 2011).
In contrast to the sectioning approach, the surface-fitting method uses all of the available data. With the surface-fitting method, the modeler selects a point or a patch of points and specifies a specific geometric primitive to fit to this patch (Figure 6.6b). For example, the modeler may select a patch of points on a wall surface, and the software will fit a plane to the selected data. Automated tools can extend the patch beyond the initially selected data, making it easier to model large surfaces. For planar surfaces, the boundaries may be inaccurately detected or may not be observable at all. Intersections of adjacent components can be used to clean up edge and corner estimates.
A library of known objects or standard components can be used to improve the modeling process. For example, if a cylinder is fitted to a pipe, a library of standard pipe diameters can be used to limit the pipe model to a feasible choice. As new automated and semiautomated tools for modeling are developed, the process of segmenting and modeling components becomes increasingly easier.
Identifying the appropriate object category may be performed simultaneously with modeling or as a separate process. Some software packages require specifying the object type being modeled before the modeling of that component can begin. In other cases, the object category may be automatically determined by the geometry. For example, a component is modeled as a particular flange picked from a model library. Components may be further annotated with metadata, such as the part number of a manufactured component or the surface material.
Finally, the BIM must be annotated with information about relationships be-tween components and groups of components. Many relationships are automatically

114 As-Is Modeling: Capturing Existing Spatial Conditions Using Laser Scanners
generated during the modeling process. For example, modeling software may cre-ate “attachment” relationships by automatically joining one wall to another when-ever its end approaches close to another wall.
6.4.1 Interoperability Issues
While several standards exist to depict BIM, as described in Chapter 7, there is no standard format for storing or transferring working process information associated with point clouds. Different products are best suited for different aspects of the
Figure 6.6 Two common modeling techniques are sectioning and surface fi tting: (a) sectioning; (b) surface fi tting; (c) resulting BIM, in Autodesk Revit (adapted from [3]).

6.5 Quality Assurance 115
problem. A service provider may need to transfer data between 10 or more products throughout the scan-to-BIM workflow (Jason Hosch, interview, March 23, 2011; Dale Stenning, interview, March 23, 2011). Each time data is transferred, there is a potential for information loss or miscommunication between software packages.
This lack of interoperability introduces inefficiencies in the scan-to-BIM work-flow. A modeler may be forced to perform redundant processes to re-create the nec-essary information in the software where it is needed. For example, it is common to initially create a 3D model using a non-BIM modeling program, such as AutoCAD or Polyworks, export the 3D model to a BIM-capable program like Revit, and finally re-create the model from scratch using the imported model as a template. However, BIM-capable programs do not, as yet, have the ability to convert existing 3D models into intelligent BIM components. As the software for the scan-to-BIM process matures, and as the techniques become more standardized, the limitations of interoperability should decrease.
6.5 Quality Assurance
Once created, the BIM must be checked to ensure that it accurately reflects exist-ing conditions—a process known as quality assurance (QA). Ideally, QA should be conducted by a different contractor from the one(s) performing the scanning and modeling steps of the scan-to-BIM process to ensure that the analysis is an objective one. Although it is important to verify the correctness of all aspects of the BIM, the primary focus of QA has centered on verifying the geometric accuracy of the model. Occasionally, components are modeled with an incorrect shape or position or are omitted entirely.
Errors may be introduced at any step in the scan-to-BIM process. In the data collection step, errors may arise from incorrect calibration of the scanner or from scan data artifacts, such as those described in Section 2.1. In the registration step, the registration results can be degraded by a poor-quality control network, errors in localizing targets in scan data, or mistakes in matching detected targets to their cor-responding targets in the network. However, the modeling step allows the greatest potential for the introduction of errors, since the process is subjective and primarily manual. Modelers must decide what to model and at what level of detail. They are constrained by the representations allowed by the particular software being used to create the model. Furthermore, they are limited by the capabilities of the modeling tools available within the software. Modeling errors can be divided into four cat-egories: (1) failing to model a component entirely, (2) modeling a component using incorrect geometry, (3) modeling a component using incorrect positioning, and (4) using the wrong component type to model a component. Several methods can be used to conduct QA of an as-is BIM. These methods include visual inspection, clash detection, physical inspection, and deviation analysis.
In the visual inspection method, an inspector overlays the modeled BIM with the original point cloud data and visually checks that the BIM and the point cloud are in agreement. Errors in the model appear because the point cloud will jut out from the model in an unexpected manner. Although the approach is easy to imple-ment, it is, by nature, subjective. The inspector may overlook obvious modeling errors where the point cloud is hidden inside a BIM component.
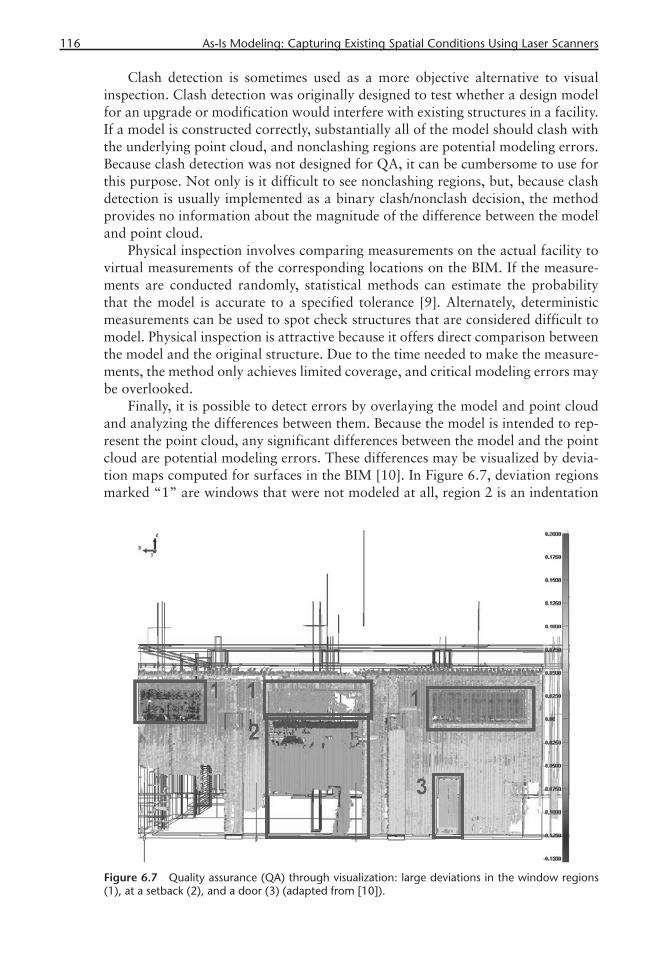
116 As-Is Modeling: Capturing Existing Spatial Conditions Using Laser Scanners
Clash detection is sometimes used as a more objective alternative to visual inspection. Clash detection was originally designed to test whether a design model for an upgrade or modification would interfere with existing structures in a facility. If a model is constructed correctly, substantially all of the model should clash with the underlying point cloud, and nonclashing regions are potential modeling errors. Because clash detection was not designed for QA, it can be cumbersome to use for this purpose. Not only is it difficult to see nonclashing regions, but, because clash detection is usually implemented as a binary clash/nonclash decision, the method provides no information about the magnitude of the difference between the model and point cloud.
Physical inspection involves comparing measurements on the actual facility to virtual measurements of the corresponding locations on the BIM. If the measure-ments are conducted randomly, statistical methods can estimate the probability that the model is accurate to a specified tolerance [9]. Alternately, deterministic measurements can be used to spot check structures that are considered difficult to model. Physical inspection is attractive because it offers direct comparison between the model and the original structure. Due to the time needed to make the measure-ments, the method only achieves limited coverage, and critical modeling errors may be overlooked.
Finally, it is possible to detect errors by overlaying the model and point cloud and analyzing the differences between them. Because the model is intended to rep-resent the point cloud, any significant differences between the model and the point cloud are potential modeling errors. These differences may be visualized by devia-tion maps computed for surfaces in the BIM [10]. In Figure 6.7, deviation regions marked “1” are windows that were not modeled at all, region 2 is an indentation
Figure 6.7 Quality assurance (QA) through visualization: large deviations in the window regions (1), at a setback (2), and a door (3) (adapted from [10]).

6.6 The Future of As-Is Modeling 117
that was modeled at an incorrect setback, and region 3 is a door that was modeled at the wrong location. A deviation map, if “thresholded,” is essentially the inverse of clash detection. The patterns in the deviation maps can be used to identify re-gions needing further analysis for modeling errors.
The deviation map concept is applicable to pairs of overlapping point clouds as well. In this case, the patterns can identify calibration errors or registration problems. Advantages of the deviation analysis method include providing objective measures of the differences (unlike visual inspection), offering fine-grained visual-ization of deviation patterns (unlike clash detection), and achieving complete cov-erage of a facility (unlike physical inspection). The primary limitation is the need to filter out deviations caused by clutter in the environment, which requires a QA inspector to carefully check models in cluttered regions. Although this method is not yet commonplace for as-is QA inspections, the same basic idea has been used in the inspection of manufactured parts. Several software packages for creating and analyzing 3D models already support the creation of deviation maps to a limited extent [11].
6.6 The Future of As-Is Modeling
The demand for as-is modeling is steadily rising as stakeholders develop a better understanding of the benefits of the BIM approach to AEC/FM projects. The U.S. General Services Administration (GSA), which owns and operates all federal build-ing facilities, initiated a national 3D-4D BIM program in 2003. The GSA sought to determine whether adopting BIM practices would reduce costs and increase it ability to manage its assets effectively (Peggy Yee, interview, March 31, 2011). Ini-tial studies were sufficiently compelling that the GSA mandated that, from 2007 onward, major projects would be required to use building information models to support spatial program validation. The GSA has conducted studies to evaluate the use of building information models for facility management, energy performance analysis, support for renovations, and historical preservation (Peggy Yee, interview, March 31, 2011). The lessons learned have been distilled into a series of BIM guides published by the GSA [12].
Other organizations are championing the use of as-is BIM as well. For example, Intel uses laser scanners and surveying methods to capture and model their wafer fabrication facilities (Jason Hosch, interview, March 23, 2011; Dale Stenning, in-terview, March 23, 2011). In the chip manufacturing industry, the time required to construct or upgrade a facility can have a significant impact on profitability. Intel uses building information models to assist in scheduling and synchronizing con-struction activities. First, an as-is model of an existing building is created, including the precise locations of the supply lines that will be connected to the equipment. In parallel, the equipment is prefabricated off-site. When the equipment is ready for installation, the measurements of the BIM ensure that the connections will match up correctly. Not only does this process save time and money in construction, but because assemblies can be manufactured off-site, it is easier to maintain the cleanli-ness required of a clean-room environment.
In response to the increased demand for as-is building information models, the hardware and software processes for capturing existing conditions of facilities
118 As-Is Modeling: Capturing Existing Spatial Conditions Using Laser Scanners
are evolving at a rapid pace. Each new generation of laser scanners improves per-formance along metrics (e.g., range, accuracy, and speed), reduces the price, or a combination of both. For example, the maximum range of phase-based scanners has increased by a factor of almost 4 in the past 10 years. Meanwhile, the measure-ment speed has increased to nearly 1 million points per second, and the price for scanners has dropped by as much as 75% during this time. As the performance improves and the price drops, the benefits of using laser scanners for as-is model-ing will increase, and the applications for which the devices are practical should become more widespread.
Other hardware devices and configurations are also making inroads in indus-try. Outdoor mobile scanning, which was a nearly nonexistent field 3 years ago, is experiencing significant growth. Mounted on vehicles, these sensors scan roads, bridges, tunnels, and other transportation infrastructure elements. More recently, indoor mobile scanning systems, such as the Trimble Indoor Mobile Mapping Solu-tion, have been introduced [13]. These devices have the potential to revolutionize the indoor scanning marketplace. Laser scanners are mounted on mobile platforms that are either tele-operated or autonomously navigate throughout a facility. A 3D model is constructed as the sensor travels using a method known as simultaneous localization and mapping (SLAM), along with inertial sensors and other motion es-timation methods, to localize the platform. Although the accuracy of the resulting maps is not yet high enough to replace fixed-position laser scanning for most BIM applications, the data can be collected in a fraction of the time. One can expect that improvements in the accuracy of the mobile maps may lead to these devices overtaking fixed-position laser scanners in the not-too-distant future.
Software products have been continuously improving their support for model-ing as-is conditions. A few years ago, support for the large point clouds produced by laser scanners was rare, which restricted as-is modeling to a few specialized products. Since then, major CAD, BIM, and architectural modeling software pro-grams have introduced support for point clouds, either directly or through third-party plug-ins.
Tools and techniques to automate or partially automate the as-is modeling process are now beginning to appear in commercial software products. Semiau-tomated pipe modeling, in particular, has experienced significant progress toward automation. One interface allows the user to select a portion of a pipe and then the software fits a cylinder to the data and attempts to follow the pipe along its axis. With another interface, the user clicks on two points on the axis of the pipe, and the software automatically determines the best fitting pipe along that axis. Fully automated approaches detect all cylindrically shaped regions in a scene and fit cylinders to those detected regions [14]. Similar techniques allow modeling of structural steel components.
Automation for architectural modeling is also improving. BIM creation soft-ware uses “snapping” capabilities to dynamically fit planar components to data as the user interactively constructs the model [15]. Modeling algorithms by ClearEdge [14] automatically detect planar patches in data. Research on more advanced auto-matic modeling capabilities is under way. It is possible to extract approximate floor plans from point cloud data by projecting cross sections onto the ground plane and fitting lines to the resulting 2D data [16]. A number of researchers have de-veloped façade modeling pipelines that are capable of modeling building exteriors,
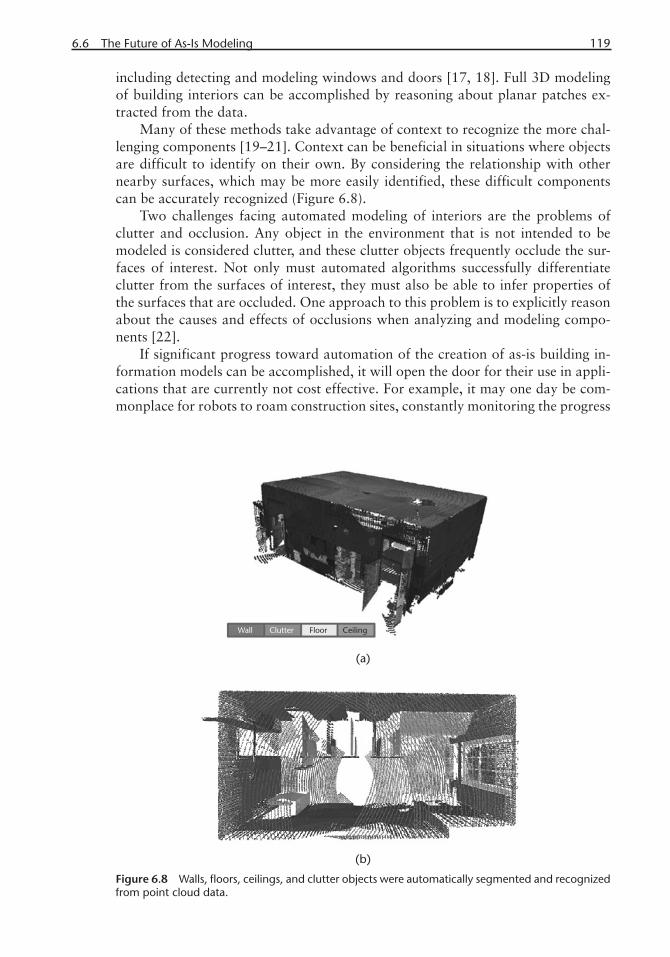
6.6 The Future of As-Is Modeling 119
including detecting and modeling windows and doors [17, 18]. Full 3D modeling of building interiors can be accomplished by reasoning about planar patches ex-tracted from the data.
Many of these methods take advantage of context to recognize the more chal-lenging components [19–21]. Context can be beneficial in situations where objects are difficult to identify on their own. By considering the relationship with other nearby surfaces, which may be more easily identified, these difficult components can be accurately recognized (Figure 6.8).
Two challenges facing automated modeling of interiors are the problems of clutter and occlusion. Any object in the environment that is not intended to be modeled is considered clutter, and these clutter objects frequently occlude the sur-faces of interest. Not only must automated algorithms successfully differentiate clutter from the surfaces of interest, they must also be able to infer properties of the surfaces that are occluded. One approach to this problem is to explicitly reason about the causes and effects of occlusions when analyzing and modeling compo-nents [22].
If significant progress toward automation of the creation of as-is building in-formation models can be accomplished, it will open the door for their use in appli-cations that are currently not cost effective. For example, it may one day be com-monplace for robots to roam construction sites, constantly monitoring the progress
Figure 6.8 Walls, fl oors, ceilings, and clutter objects were automatically segmented and recognized from point cloud data.
120 As-Is Modeling: Capturing Existing Spatial Conditions Using Laser Scanners
and dynamically creating as-built models on a daily basis. Similar methods could easily and quickly document the as-is conditions of any existing building.
Methods of capturing as-is conditions of a facility provide a great resource for embedded commissioning (ECx) as well as traditional forms of commissioning (Chapter 3). While currently, most commissioning activities revolve around assess-ing the behavior of building systems, not knowing the forms of such systems could potentially result in misleading assessments. Laser scanners and the corresponding as-is models, as described in this chapter, provide accurate information about the geometric and spatial aspects of a facility, much needed in assessing its perfor-mance. It is expected that as the usage of laser scanning becomes more pervasive, it will be possible to capture the spatial changes occurring in a facility promptly and accurately to further support ECx.
References
[1] Akinci, B., et al., “A Formalism for Utilization of Sensor Systems and Integrated Project Models for Active Construction Quality Control,” Automation in Construction, Vol. 15, No. 2, February 2006, pp. 124–138.
[2] Tang, P., Akinci, B., and Garrett, J. H., “Laser Scanning for Bridge Inspection and Manage-ment,” in Proceedings of the International Association for Bridge and Structural Engineer-ing (IABSE) Symposium, Weimar, Germany, 2007.
[3] Tang, P., et al., “Automatic Reconstruction of As-built Building Information Models from Laser-Scanned Point Clouds: A Review of Related Techniques,” Automation in Construc-tion, Vol. 19, No. 7, November 2010, pp. 829–843.
[4] Eastman, C., et al., BIM Handbook: A Guide to Building Information Modeling for Own-ers, Managers, Designers, Engineers and Contractors, New York: Wiley, 2008.
[5] Anil, E., Akinci, B., and Huber, D., “Representation Requirements of As-is Building Infor-mation Models Generated from Laser Scanned Point Cloud Data,” in Proceedings of the International Symposium on Automation and Robotics in Construction (ISARC), Seoul, Korea, June 2011.
[6] Cheok, G., Leigh, S., and Rukhin, A., “Calibration Experiments of a Laser Scanner,” NISTIR 6922, Gaithersburg, MD: Building and Fire Research Laboratory, National Insti-tute of Standards and Technology, September 2002.
[7] Hebert, M., and Krotkov, E., “3-D Measurements from Imaging Laser Radars: How Good Are They?” Image and Vision Computing, Vol. 10, No. 3, 1992, pp. 170–178.
[8] Tang, P., Akinci, B., and Huber, D., “Quantifi cation of Edge Loss of Laser Scanned Data at Spatial Discontinuities,” Automation in Construction, Vol. 18, No. 8, December 2009, pp. 1070–1083.
[9] Cheok, G. S., Filliben, J. J., and Lytle, A. M., “Guidelines for Accepting 2D Building Plans,” NISTIR-7638, Gaithersburg, MD: National Institute of Standards, 2009.
[10] Anil, E., et al., “Assessment of Quality of As-is Building Information Models Generated from Point Clouds Using Deviation Analysis,” in Proceedings of the SPIE Vol. 7864A, Electronics Imaging Science and Technology Conference (IS&T), 3D Imaging Metrology, San Francisco, CA, January 2011.
[11] Polyworks, Innovmetric Software, http://www.innovmetric.com.[12] GSA BIM Guide Series, http://www.gsa.gov/bim.[13] Trimble Indoor Mobile Mapping Solution, http://www.trimble.com/Indoor-Mobile-Map-
ping-Solution/Indoor-Mapping.aspx.[14] ClearEdge 3D, Inc., http://www.clearedge3d.com.
6.6 The Future of As-Is Modeling 121
[15] Revit Architecture, Autodesk, Inc., http://usa.autodesk.com/adsk/servlet/index?id=3781831&siteID=123112.
[16] Okorn, B., et al., “Toward Automated Modeling of Floor Plans,” in Proceedings of the Symposium on 3D Data Processing, Visualization and Transmission, Paris, France, May 2010.
[17] Böhm, J., Becker, S., and Haala, N., “Model Refi nement by Integrated Processing of Laser Scanning and Photogrammetry,” in Proceedings of 3D Virtual Reconstruction and Visual-ization of Complex Architectures (3D-Arch), Zurich, Switzerland, 2007.
[18] Pu, S., and Vosselman, G., “Extracting Windows from Terrestrial Laser Scanning,” in IS-PRS Workshop on Laser Scanning, 2007, pp. 320–325.
[19] Cantzler, H., Fisher, R. B., and Devy, M., “Improving Architectural 3D Reconstruction by Plane and Edge Constraining,” in Proceedings of the British Machine Vision Conference, 2002, pp. 663–672.
[20] Nüchter, A., and Hertzberg, J., “Towards Semantic Maps for Mobile Robots,” Journal of Robotics and Autonomous Systems, Vol. 56, No. 11, November 2008, pp. 915–926.
[21] Xiong, X., and Huber, D., “Using Context to Create Semantic 3D Models of Indoor Envi-ronments,” in Proceedings of the British Machine Vision Conference (BMVC), 2010.
[22] Adan, A., and Huber, D., “3D Reconstruction of Interior Wall Surfaces Under Occlu-sion and Clutter,” in Proceedings of 3D Imaging, Modeling, Processing, Visualization and Transmission (3DIMPVT), Hangzhou, China, May 2011.


123
C H A P T E R 7
Standards: IFC and STEP
Architecture-engineering-construction (AEC) information encapsulated in building product models plays a significant role in capturing the domain knowledge and supporting interoperability between various software tools in the building industry (Chapters 3 and 4).
Capturing domain knowledge is the overarching target of the AEC industry’s standardization efforts. One of the earliest initiatives in this area comes from the Construction Specification Institute (CSI). CSI was established in 1948 by a group of government specification writers in order to provide quality construction in-formation during the post–World War II construction boom [1]. CSI created Mas-terFormat to classify all construction-related information provided through a list of titles with unique identification numbers. The latest version of MasterFormat, developed in 2004, contains 50 divisions expanded from 16 in the earlier versions [2]. In addition to MasterFormat, CSI also generated GreenFormat and UniFor-mat. GreenFormat consists of a taxonomy for manufacturers to classify the sus-tainability properties of their products [3]. Similarly, UniFormat is a classification system for early capital project delivery (CPD) information such as design criteria and cost estimates [4].
After the introduction of computer applications in the AEC domain, the need for capturing domain knowledge and standardization gained a new emphasis. In comparison to manufactured goods, buildings are unique constructs with individu-al features, and the scale of the end product prevents the AEC domain from creat-ing a prototype to test realistically against design requirements (Chapters 1 and 2). Consequently, because computer-aided design (CAD) tools allow quick and realis-tic visualization of design features, the industry became one of the early adopters of CAD tools. Once CAD tools reached a level of maturity, with Autodesk’s Auto-CAD and Bentley’s Microstation, other CPD operations began relying on comput-er-based tools, particularly for procurement and delivery. Because it is elemental to have interoperability among different tools and provide data exchange at different levels of the CPD process, standardization gained more importance. The current trend in the industry reflects this need through a shift from CAD-based tools to building information model (BIM) based tools. The domain knowledge that can be captured by various data modeling and standardization initiatives is likely to justify the “I” in BIM.
As discussed earlier, BCx is crucial for providing quality and efficiency in the CPD process. In this chapter, we look at the standardization efforts in AEC through
124 Standards: IFC and STEP
various information modeling initiatives and discuss how specific ECx-related ap-proaches can be incorporated in these initiatives. Our focus will be on developing a better understanding of how these initiatives are organized, what the specific steps are for developing information models, and whether ECx is adequately considered. We will also evaluate existing models as a point of departure for developing a framework for representing ECx information more comprehensively than current practice allows.
Two of the major efforts in collecting and modeling building information for data exchange and interoperability are the ongoing development of the STandard for Exchange of Product Model Data (STEP) [5] and industry foundation classes (IFCs). STEP was developed by International Organization for Standardization (ISO) Technical Committee TC 184. Its reference code is ISO 10303. The IFC project was started by the International Alliance for Interoperability (IAI) [6] and is currently being developed and maintained by the buildingSMART Alliance. build-ingSMART is also the developer of ifcXML, which represents AEC information in XML (eXtensible Markup Language) schemata [7]. Similar to ifcXML, AEX (Automating Equipment Information Exchange) is another standard developed by FIATECH utilizing XML technology [8]. Unlike the first three models, which target the entire AEC domain, AEX focuses only on HVAC equipment.
In addition to these models, CIS/2 (CIMSteel Integration Standards, Release 2) is another important modeling effort in the AEC domain. It is an internationally accepted standard for digital data exchange of technical, engineering information across the entire steel frameworks life cycle [9]. In the following sections we present an overview of these initiatives.
7.1 Standard for Exchange of Product Model Data (STEP)
The overall idea behind STEP is to generate a mechanism that describes a com-plete and unequivocal definition of a product, independent of any specific computer platform, throughout its life cycle [10–12]. This initiative was started by the ISO in 1984 and is formally known as ISO 10303. STEP is the successor to the U.S. standard IGES (Initial Graphics Exchange Specification) that, in turn, was started in 1979 by a group of CAD vendors with the support of the National Institute of Standards and Technology (NIST) and the U.S. Department of Defense (DoD) [11]. Under ISO, the group that is responsible for the development of STEP is Technical Committee (TC) 184, Sub-Committee (SC) 4.
For anyone who is involved in product design and delivery, it is important to have seamless product information flow between upstream and downstream decisions and among different stakeholders such as manufacturers, contractors, suppliers, and customers. Because different parties often use different computer systems that are specifically designed for their needs, data transfer is an essential requirement for the procurement of quality products. STEP tries to achieve stan-dardization during these data transfers through a neutral computer-interpretable representation of industrial products.
STEP is the most ambitious effort in the product modeling area. It not only focuses on the AEC industry but also covers all CAD/CAM and product informa-tion management systems, including electronics, ship building, and process plants.
7.1 Standard for Exchange of Product Model Data (STEP) 125
It is intended to cover industrial automation standards for all product data repre-sentation and exchange issues. STEP’s approach to product modeling is modular. Instead of defining a large model with subsets of specific domain views, STEP defines various partial models, called application protocols, which are expected to become larger domain-specific models. The overall structure of STEP is based on five groups, which cover all phases of process modeling (Chapter 4) [13]:
1. The description methods group defi nes modeling languages, such as EX-PRESS, NIAM, and IDEF1x. EXPRESS is a formal language that defi nes how the product data will be represented. EXPRESS is similar to the Uni-fi ed Modeling Language (UML) for facilitating software implementations and providing consistency and precision in the representation of various product data.
2. The integrated resources group develops reusable model subsets that are used for model definitions, such as geometry and material properties.
3. The application protocols group focuses on specific model parts developed for particular application domains, such as ship design, electrotechnical plants, or structural frames for steel construction. STEP’s scope is broad enough to cover several hundred application protocols to support many industrial products and processes.
4. The implementations methods group covers the methods that can be used as a source for STEP implementations. So far, the STEP Physical File (SPF) and Standard Data Access Interface (SDAI) have been implemented. STEP 21 is a widely used data exchange form of STEP. It has an ASCII structure that is easy to read and write with one instance per line. ISO 10303-21 describes the encoding mechanism of any EXPRESS schema. The file exten-sions are .stp or .step to show that the data in the file conforms to STEP application protocols (Figures 7.1 and 7.2).
5. Conformance testing group defi nes and generates the tests that verify whether an implementation is properly executed and in line with STEP specifi cations.
STEP is one of the most comprehensive product modeling approaches that in-volves not only capturing the knowledge but also defining the modeling language, the format of information exchange files, protocols for data exchange, and model conformance mechanisms. On the other hand, because it is a large-scale effort with limited funding, it takes longer to fully complete every feature. Some of the appli-cation protocols such as configuration controlled design, core data for automotive design processes, explicit drafting and associative drafting, the model is mature enough to be used as a data exchange alternative for a variety of transactions.
7.1.1 AP225 Building Elements Using Explicit Shape Representation (ISO 10303-225:1999)
Application protocol (AP) 225 in ISO 10303 specifically targets the standardization of the information related to building elements. AP 225 became an industry stan-dard in 1999 [14–16]. The information that is specified in this protocol pertains to the building element “shape, property, and spatial arrangement requirements” ([5],
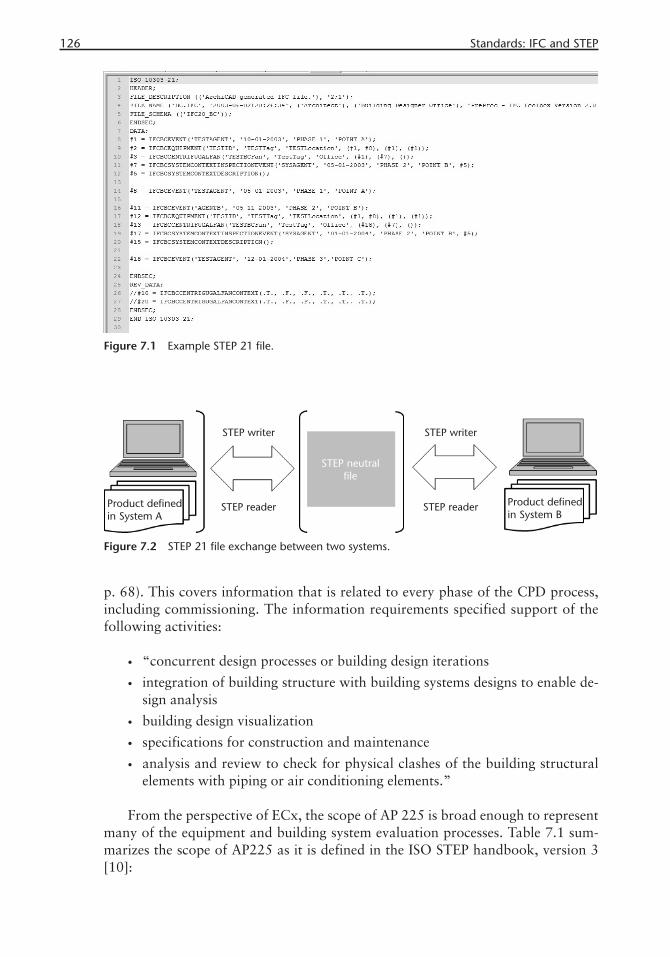
126 Standards: IFC and STEP
p. 68). This covers information that is related to every phase of the CPD process, including commissioning. The information requirements specified support of the following activities:
• “concurrent design processes or building design iterations
• integration of building structure with building systems designs to enable de-sign analysis
• building design visualization
• specifications for construction and maintenance
• analysis and review to check for physical clashes of the building structural elements with piping or air conditioning elements.”
From the perspective of ECx, the scope of AP 225 is broad enough to represent many of the equipment and building system evaluation processes. Table 7.1 sum-marizes the scope of AP225 as it is defined in the ISO STEP handbook, version 3 [10]:
Figure 7.1 Example STEP 21 fi le.
Figure 7.2 STEP 21 fi le exchange between two systems.
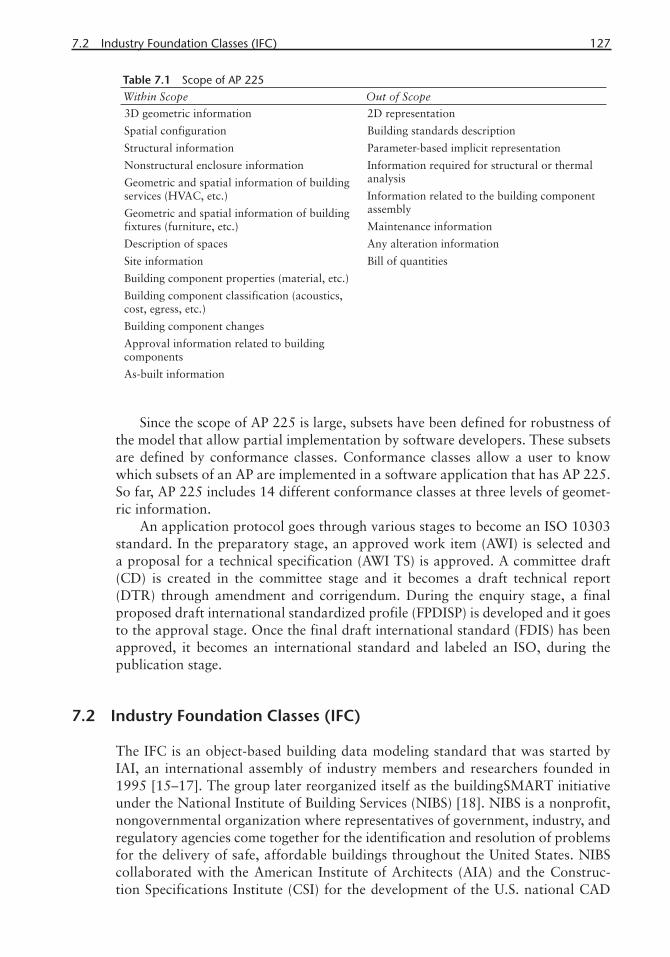
7.2 Industry Foundation Classes (IFC) 127
Since the scope of AP 225 is large, subsets have been defined for robustness of the model that allow partial implementation by software developers. These subsets are defined by conformance classes. Conformance classes allow a user to know which subsets of an AP are implemented in a software application that has AP 225. So far, AP 225 includes 14 different conformance classes at three levels of geomet-ric information.
An application protocol goes through various stages to become an ISO 10303 standard. In the preparatory stage, an approved work item (AWI) is selected and a proposal for a technical specification (AWI TS) is approved. A committee draft (CD) is created in the committee stage and it becomes a draft technical report (DTR) through amendment and corrigendum. During the enquiry stage, a final proposed draft international standardized profile (FPDISP) is developed and it goes to the approval stage. Once the final draft international standard (FDIS) has been approved, it becomes an international standard and labeled an ISO, during the publication stage.
7.2 Industry Foundation Classes (IFC)
The IFC is an object-based building data modeling standard that was started by IAI, an international assembly of industry members and researchers founded in 1995 [15–17]. The group later reorganized itself as the buildingSMART initiative under the National Institute of Building Services (NIBS) [18]. NIBS is a nonprofit, nongovernmental organization where representatives of government, industry, and regulatory agencies come together for the identification and resolution of problems for the delivery of safe, affordable buildings throughout the United States. NIBS collaborated with the American Institute of Architects (AIA) and the Construc-tion Specifications Institute (CSI) for the development of the U.S. national CAD
Table 7.1 Scope of AP 225Within Scope Out of Scope
3D geometric information
Spatial configuration
Structural information
Nonstructural enclosure information
Geometric and spatial information of building services (HVAC, etc.)
Geometric and spatial information of building fixtures (furniture, etc.)
Description of spaces
Site information
Building component properties (material, etc.)
Building component classification (acoustics, cost, egress, etc.)
Building component changes
Approval information related to building components
As-built information
2D representation
Building standards description
Parameter-based implicit representation
Information required for structural or thermal analysis
Information related to the building component assembly
Maintenance information
Any alteration information
Bill of quantities
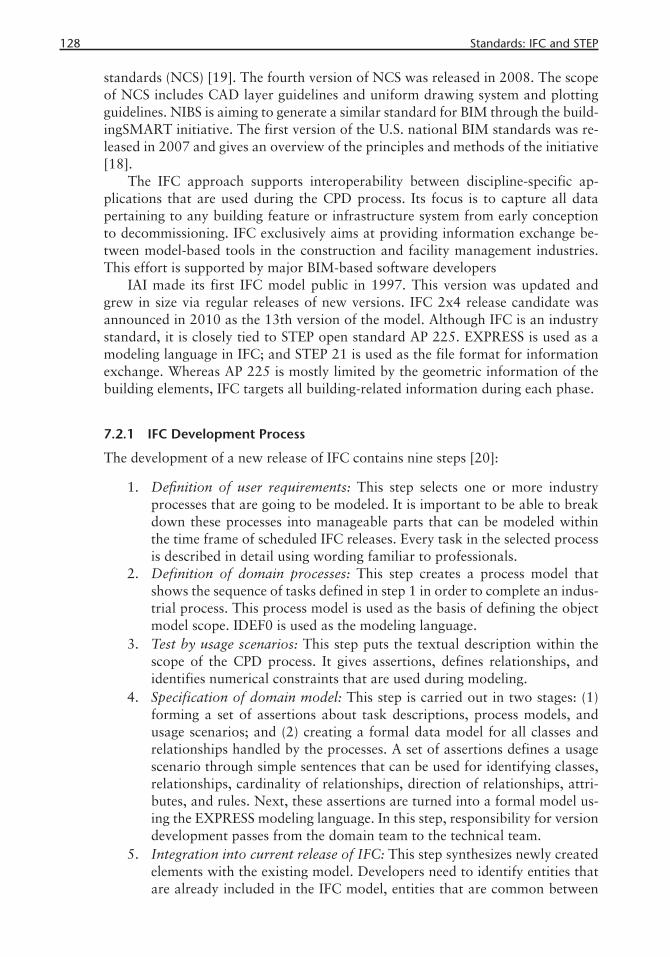
128 Standards: IFC and STEP
standards (NCS) [19]. The fourth version of NCS was released in 2008. The scope of NCS includes CAD layer guidelines and uniform drawing system and plotting guidelines. NIBS is aiming to generate a similar standard for BIM through the build-ingSMART initiative. The first version of the U.S. national BIM standards was re-leased in 2007 and gives an overview of the principles and methods of the initiative [18].
The IFC approach supports interoperability between discipline-specific ap-plications that are used during the CPD process. Its focus is to capture all data pertaining to any building feature or infrastructure system from early conception to decommissioning. IFC exclusively aims at providing information exchange be-tween model-based tools in the construction and facility management industries. This effort is supported by major BIM-based software developers
IAI made its first IFC model public in 1997. This version was updated and grew in size via regular releases of new versions. IFC 2x4 release candidate was announced in 2010 as the 13th version of the model. Although IFC is an industry standard, it is closely tied to STEP open standard AP 225. EXPRESS is used as a modeling language in IFC; and STEP 21 is used as the file format for information exchange. Whereas AP 225 is mostly limited by the geometric information of the building elements, IFC targets all building-related information during each phase.
7.2.1 IFC Development Process
The development of a new release of IFC contains nine steps [20]:
1. Defi nition of user requirements: This step selects one or more industry processes that are going to be modeled. It is important to be able to break down these processes into manageable parts that can be modeled within the time frame of scheduled IFC releases. Every task in the selected process is described in detail using wording familiar to professionals.
2. Definition of domain processes: This step creates a process model that shows the sequence of tasks defined in step 1 in order to complete an indus-trial process. This process model is used as the basis of defining the object model scope. IDEF0 is used as the modeling language.
3. Test by usage scenarios: This step puts the textual description within the scope of the CPD process. It gives assertions, defines relationships, and identifies numerical constraints that are used during modeling.
4. Specification of domain model: This step is carried out in two stages: (1) forming a set of assertions about task descriptions, process models, and usage scenarios; and (2) creating a formal data model for all classes and relationships handled by the processes. A set of assertions defines a usage scenario through simple sentences that can be used for identifying classes, relationships, cardinality of relationships, direction of relationships, attri-butes, and rules. Next, these assertions are turned into a formal model us-ing the EXPRESS modeling language. In this step, responsibility for version development passes from the domain team to the technical team.
5. Integration into current release of IFC: This step synthesizes newly created elements with the existing model. Developers need to identify entities that are already included in the IFC model, entities that are common between
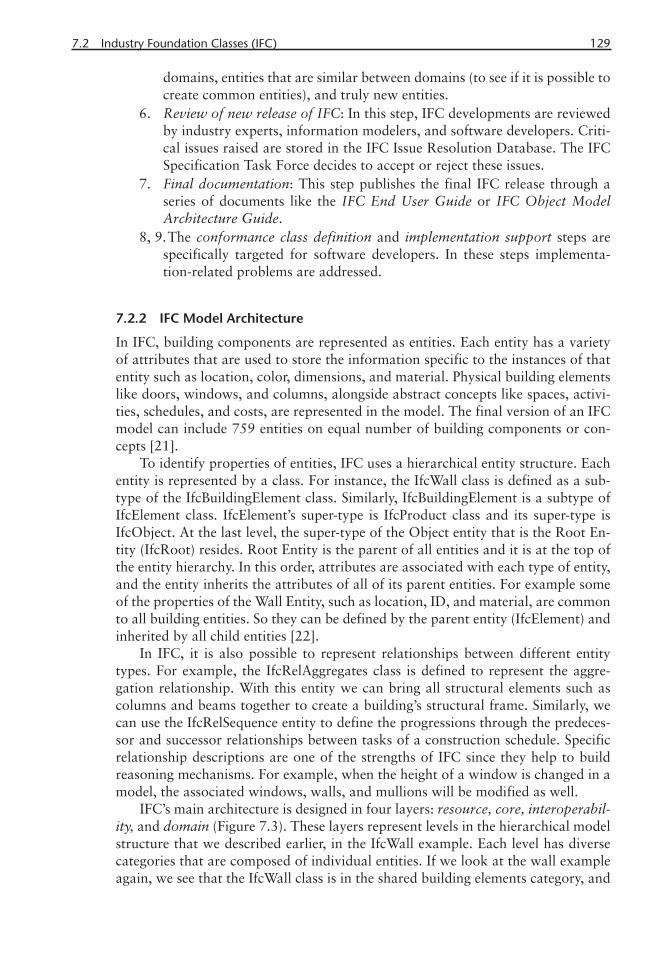
7.2 Industry Foundation Classes (IFC) 129
domains, entities that are similar between domains (to see if it is possible to create common entities), and truly new entities.
6. Review of new release of IFC: In this step, IFC developments are reviewed by industry experts, information modelers, and software developers. Criti-cal issues raised are stored in the IFC Issue Resolution Database. The IFC Specification Task Force decides to accept or reject these issues.
7. Final documentation: This step publishes the final IFC release through a series of documents like the IFC End User Guide or IFC Object Model Architecture Guide.
8, 9. The conformance class definition and implementation support steps are specifically targeted for software developers. In these steps implementa-tion-related problems are addressed.
7.2.2 IFC Model Architecture
In IFC, building components are represented as entities. Each entity has a variety of attributes that are used to store the information specific to the instances of that entity such as location, color, dimensions, and material. Physical building elements like doors, windows, and columns, alongside abstract concepts like spaces, activi-ties, schedules, and costs, are represented in the model. The final version of an IFC model can include 759 entities on equal number of building components or con-cepts [21].
To identify properties of entities, IFC uses a hierarchical entity structure. Each entity is represented by a class. For instance, the IfcWall class is defined as a sub-type of the IfcBuildingElement class. Similarly, IfcBuildingElement is a subtype of IfcElement class. IfcElement’s super-type is IfcProduct class and its super-type is IfcObject. At the last level, the super-type of the Object entity that is the Root En-tity (IfcRoot) resides. Root Entity is the parent of all entities and it is at the top of the entity hierarchy. In this order, attributes are associated with each type of entity, and the entity inherits the attributes of all of its parent entities. For example some of the properties of the Wall Entity, such as location, ID, and material, are common to all building entities. So they can be defined by the parent entity (IfcElement) and inherited by all child entities [22].
In IFC, it is also possible to represent relationships between different entity types. For example, the IfcRelAggregates class is defined to represent the aggre-gation relationship. With this entity we can bring all structural elements such as columns and beams together to create a building’s structural frame. Similarly, we can use the IfcRelSequence entity to define the progressions through the predeces-sor and successor relationships between tasks of a construction schedule. Specific relationship descriptions are one of the strengths of IFC since they help to build reasoning mechanisms. For example, when the height of a window is changed in a model, the associated windows, walls, and mullions will be modified as well.
IFC’s main architecture is designed in four layers: resource, core, interoperabil-ity, and domain (Figure 7.3). These layers represent levels in the hierarchical model structure that we described earlier, in the IfcWall example. Each level has diverse categories that are composed of individual entities. If we look at the wall example again, we see that the IfcWall class is in the shared building elements category, and
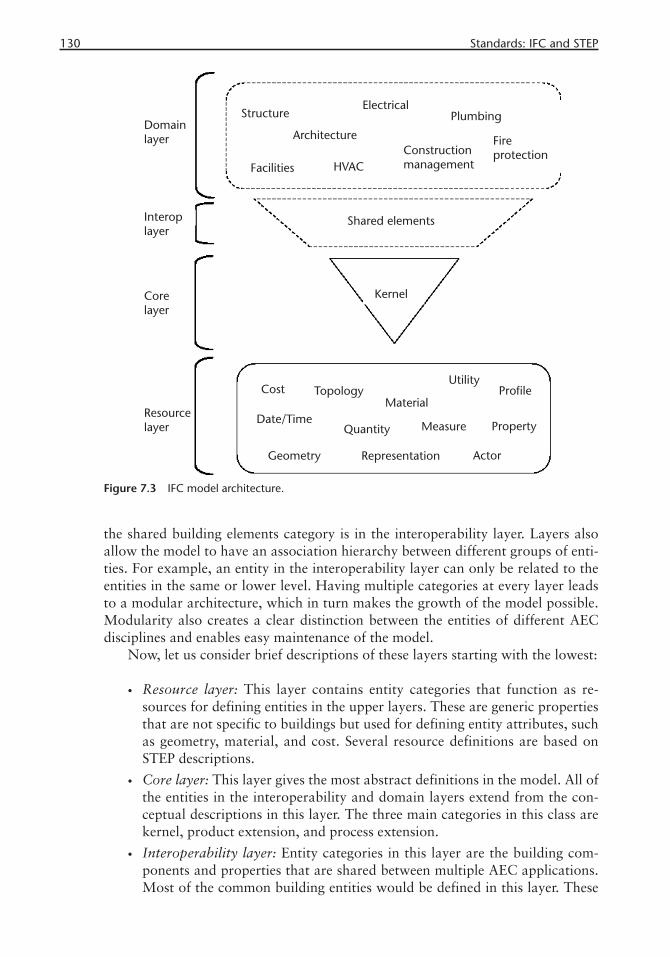
130 Standards: IFC and STEP
the shared building elements category is in the interoperability layer. Layers also allow the model to have an association hierarchy between different groups of enti-ties. For example, an entity in the interoperability layer can only be related to the entities in the same or lower level. Having multiple categories at every layer leads to a modular architecture, which in turn makes the growth of the model possible. Modularity also creates a clear distinction between the entities of different AEC disciplines and enables easy maintenance of the model.
Now, let us consider brief descriptions of these layers starting with the lowest:
• Resource layer: This layer contains entity categories that function as re-sources for defining entities in the upper layers. These are generic properties that are not specific to buildings but used for defining entity attributes, such as geometry, material, and cost. Several resource definitions are based on STEP descriptions.
• Core layer: This layer gives the most abstract definitions in the model. All of the entities in the interoperability and domain layers extend from the con-ceptual descriptions in this layer. The three main categories in this class are kernel, product extension, and process extension.
• Interoperability layer: Entity categories in this layer are the building com-ponents and properties that are shared between multiple AEC applications. Most of the common building entities would be defined in this layer. These
Figure 7.3 IFC model architecture.

7.3 Automating Information Exchange (AEX) Project 131
include wall, beam, furniture type, occupant, flow controller, and sound properties.
• Domain layer: At this layer, the entities have the most detailed representation. The domain layer is at the top of the model architecture and the categories are defined as specific domains such as HVAC, electrical, and construction management. This is the highest level of the IFC model. It represents the en-tity definitions that are specific to individual domains like HVAC, electrical, architecture, construction management, and facilities management.
7.2.3 ifcXML
IFC-XML is an XML format defined by ISO 10303-28 (“STEP-XML”), part 28. The latest version, ifcXML2x3, was released in 2007 to support IFC 2x3 [23]. if-cXML is an effort to establish rules and policies for managing and developing XML schemata that are going to be used as industry standards for e-commerce or AEC web applications. In these applications, software interoperability is primarily based on the format of the messages exchanged among software tools. Messages contain tagged data in standard XML technology. XML schemata are used to validate these files according to a previously defined data format that is agreed on by industry members. Instead of exchanging geometric object descriptions between systems, ifcXML is designed to support business-to-business transactions. The goal is to cre-ate a well-defined business process on the Internet by bringing users, producers, and consumers together for the benefit of a common data format, enabling information flow during different phases of the CPD process. Due to IFC’s comprehensive struc-ture, ifcXML has a larger file size. If a project’s complete information is saved in ifcXML, the file size will be at least doubled. ifcXML is beneficial for encapsulating only a portion of a project, which allows it to reach a broader community of ap-plications for the built environment and related resources [24].
7.3 Automating Information Exchange (AEX) Project
Although not directly related to the building delivery process, we will briefly con-sider AEX as an industry standard development effort for engineered equipment. The AEX project is developed by Fully Integrated and Automated Technology (FI-ATECH) [25]. FIATECH is a nonprofit research organization with members from academia, industry, and government agencies. To provide economic benefit to the industry, this project defines and standardizes the information exchange specifica-tions for the engineered equipment life cycle, including design, delivery, operation, and maintenance. FIATECH defines AEX as being complementary to STEP, ISO 15926 (Industrial automation systems and integration—integration of life-cycle data for process plants including oil and gas production facilities) and IFC.
FIATECH is aware of the interoperability problem that exists in the current capital facility industry, where large amounts of information accumulate during the programming, design, construction, operation, and maintenance phases of capi-tal projects. Most of this information is in the digital domain, and produced and
132 Standards: IFC and STEP
used by incompatible software systems. AEX addresses this problem by defining a common protocol that is accepted by all stakeholders.
Similar to the ifcXML, Extensible Markup Language (XML) is used for devel-oping Capital Facilities Industry Extensible Markup Language (cfiXML) schema. The first phase of the project is completed by delivering XML specifications for centrifugal pumps and shell and tube heat exchangers. In the third edition, which was released in 2009, this work is extended to support additional types of equip-ment and pilot implementations that are developed by participating software and equipment suppliers.
7.3.1 cfi XML Schema Development Process
In an AEX project, 20 information transactions are defined in the in the life cycle of engineered equipment [26]. From the point of view of economic benefits, five of these transactions are identified as having high importance: request for quote, quote, purchase order, as-built, and bill of materials. The main criteria in the selec-tion process is the usage context that cuts across organizational boundaries between owner, engineer, and supplier. Centrifugal pumps and shell and tube exchangers were selected as initial equipment types based on the interest expressed by AEX sponsors.
After defining transaction scenarios, FIATECH conducted a survey on what type of processes and software tools generate and use equipment information over the CPD process. In this survey, two key document types that are used to transmit information between software packages were identified: equipment datasheet and equipment list or bill of materials. Two software information flow diagrams have been prepared to show the selected types of software and engineering information transmittal communication documents.
7.3.2 cfi XML Schema Structure
XML schema provide the rules for the structure and content of an XML document. Development of cfiXML schemata is based on defining equipment type properties and validating the information in XML files. Overall, XML schemata are effective in formulating complex groups of data with rich information content. Although engineering information is suitable for object-oriented data modeling, defining equipment types and physical properties of materials has an inherently complex structure. Accordingly, cfiXML schemata are object-oriented representations of en-gineering information through different XML namespaces, and schema files on a variety of topics. This schema structure is organized into four basic types [27]:
• Core data type: Schema to define additions to basic data types to cover all engineering information for an equipment type;
• Core engineering object: Schema to define common engineering information that is used in more than one engineering domain;
• Subject engineering object: Schema to define individual equipment information;
• Collection container: Schema to define data exchange documents.

7.4 CIS/2 and the CIMsteel Integration Standards 133
7.4 CIS/2 and the CIMsteel Integration Standards
CIS/2 is the information standard in the construction steel domain. The initial work for this standard started as AP 230, a STEP application protocol. But later AP 230 was instigated and the industry used it as a base for the development of CIM-steel. CIMsteel began in 1987 as a collaborative European research endeavor [28, 29, 31]. Since 1998, it has operated under the Eureka framework. The project fo-cuses on building-type steel-framed structures in order “to improve the efficiency and effectiveness of the European Construction Steelwork industry both through harmonization of design codes and specifications, and through the introduction of Computer Integrated Manufacturing techniques for design, analysis, detailing, scheduling, fabrication, erection and management functions” [31].
CIMsteel’s purpose is to build an integrated work pattern in the steel industry by utilizing information technology. By making use of the digital environment, they create internationally accepted standards for technical data exchange. CIMsteel integration standards (CISs) are the output of this approach, which provides flex-ibility for sharing engineering information across the steel framework design and delivery life cycle. CISs are a set of data exchange standards for structural steel frame specifications. Engineering software application vendors use these standards for implementing data exchange. According to a proposed scenario, engineering information can be exported in a logical and standardized data exchange file for-mat that conforms to Part 21 of STEP. CIMsteel Standards act in accordance with STEP technology.
7.4.1 CIMsteel Development Process
CIMsteel integration standards are supported by the Logical Product Model (LPM). The product data used in LPM covers engineering information for a specific steel framework, generated in the design phase. Similar to other models defined ear-lier, LPM is built with entities, attributes representing the characteristics of these entities, and associations between entities. [36, 37] Information is transferred in the form of data exchange files between CIS-compatible applications and, thus, between the project participants. In addition to this, LPM is divided into smaller implementable subgroups that are referred to as Data Exchange Protocols (DEPs). DEPs allow CIS to have a modular structure based on the domain, defining what types of data should be exchanged [31]. The protocols include analysis, member de-sign, connection design, and detailing. Each DEP addresses a particular type of in-formation transfer. For example, DEP1 deals with structural analysis–related data, whereas DEP4 covers structural steelwork detailing. The LPM is used to define the relationship between all four protocols, such as retaining the integrity of a single beam that is subdivided into parts for analysis purposes.
7.4.2 CIS/2
CIS/2 was started in1999. CIS/2 is an expanded version of CIMsteel and it covers the structural steel fabrication aspects that are left out of the CIMsteel LPM. Similar to IFC, CIS/2 is closely associated with STEP and it adopts some of the integrated
134 Standards: IFC and STEP
resource libraries, such as Fundamentals of Product Description and Support, Parts 42, 43 and 45. The main product model of CIS/2 has been formally developed using the EXPRESS language [32].
7.5 Analysis of the Presented State of the Art
In this chapter we looked at some of the major standardization efforts in the AEC domain for interoperability. We started with STEP, which has initiated product modeling ventures in a variety of areas and provided essential modeling tools and techniques. Then, we covered IFC and ifcXML, which are ongoing efforts main-tained by buildingSMART and form the backbone of BIM-based tools in the in-dustry. We also looked at AEX and CIS/2 as two other standardization schemes that specifically target individual domains. This list can be extended considerably by adding other data standards that are in the process of development, such as Building and Construction XML (bcXML), Green Building XML (gbXML), Open Building Information Xchange (oBIX), and Construction Operations Building In-formation Exchange (COBIE). These standards are still in the early phases of indus-try approval and acceptance.
A number of these AEC information standardization attempts confirm that there is a clear need and room for improvement in this area that will surely advance the CPD process. On the other hand, there are also risks in having many standards, which can lead to conflicting requirements and defeat the purpose of standardiza-tion. They can also create confusion in making advances for data exchange and interoperability. From the software development perspective, in order to have fully interoperable tools, a single, universally approved standard is needed. But the chal-lenges in AEC information standardization are that data is intrinsically complex, and the capital facility development process is ill defined. Based on the analysis of the models we reviewed, we can assert the following:
An object-oriented approach is utilized in all models to represent the building-related information. Building elements are defined as entities or classes, and their properties become the attributes in these classes. Expandability of the standard for future additions is one of the most critical topics and we observe this in all models with multiple versions. To address this issue, all models have a modular structure where the data representation is divided into smaller subsets. The scope of these models is one of the most important determinants of how many versions a model will have. The organization of the data is mostly hierarchical where general and domain specific data are separated. The information that is used by other entities is separated into resource levels and linked to other units.
During the model development process, IFC, AEX, and CIMSteel follow a pro-cess-oriented method. They first define the industry process from which the domain information is going to be extracted. None of these models specifically focuses on building evaluation or ECx processes. But they are all capable of modeling HVAC-related data and can be used to carry and transfer partial HVAC information.

7.5 Analysis of the Presented State of the Art 135
References
[1] Construction Specifi cation Institute, http://www.csinet.org/, last accessed April 2011.[2] MasterFormat, http://www.csinet.org/masterformat, last accessed April 2011.[3] GreenFormat, http://www.csinet.org/greenformat, last accessed April 2011.[4] UniFormat, http://www.csinet.org/uniformat, last accessed April 2011.[5] STEP Application Handbook, ISO 10303, Version 3, North Charleston, SC: SCRA, 2006.[6] IAI International Alliance for Interoperability, http://www.iai-tech.org, last accessed April
2011.[7] IAI International Alliance for Interoperability, http://www.iai-tech.org, last accessed April
2011.[8] FIATECH Consortium, http://www.fi atech.org, last accessed April 2011.[9] CIS/2 CIMSteel Integration Standards, Release 2, http://www.cis2.org, last accessed April
2011.[10] STEP Application Handbook, ISO 10303, Version 3, North Charleston, SC: SCRA, 2006.[11] Pratt, M. J., “Introduction to ISO 10303—STEP Standard for Product Data Exchange,”
Transactions of the ASME, Vol. 1, March 2001, pp. 102–103.[12] Patil, L., Dutta, D., and Sriram, R., “Ontology-Based Exchange of Product Data Seman-
tics,” IEEE Transactions on Automation Science and Engineering, Vol. 2, No. 3, July 2005, pp. 213–225. doi: 10.1109/TASE.2005.849087.
[13] Eastman, C. M., Building Product Models: Computer Environments Supporting Design and Construction, Boca Raton, FL: CRC Press, 1999.
[14] STEP Tools AP 225: Building Elements, http://www.steptools.com/support/stdev_docs/ex-press/ap225/, last accessed April 2011.
[15] Froese, T. M., “Industry Foundation Class Modeling for Estimating and Scheduling,” in Durability of Building Materials and Components 8, M. A. Lacasse and D. J. Vanier (Eds.), Ottawa: Institute for Research in Construction, 1999, pp. 2825–2835.
[16] Yu, K., Froese, T., and Grobler, F., “International Alliance For Interoperability: IFCs,” in Computing in Civil Engineering: Proceedings of the International Computing Congress, Boston, MA, 1998, ASCE, pp. 395–406.
[17] Froese, T., Grobler, F., and Yu, K., “Development of Data Standards for Construction—An IAI Perspective,” in The Life-Cycle of Construction IT Innovations-Technology Transfer from research to practice, Proceedings of the W78 Conference, B.-C. Björk and A. Jägbeck (Eds.), Stockholm, Sweden, June 3–5, 1998, KTH, pp. 233–244.
[18] Building Smart Alliance, http://www.buildingsmartalliance.org, last accessed April 2011.[19] National CAD Standards, www.buildingsmartalliance.org/ncs, last accessed April 2011.[20] Liebich, T., and Wix, J., “Highlights of the Development Process of Industry Foundation
Classes,” in Durability of Building Materials and Components 8, M. A. Lacasse and D. J. Vanier (Eds.), Ottawa: Institute for Research in Construction, 1999, pp. 2758–2775.
[21] IFC Specifi cation, http://buildingsmart-tech.org/specifi cations/ifc_specifi cation, last ac-cessed April 2011.
[22] Khemlani, L. “A Look Under the Hood,” AECBytes Feature, http://www.aecbytes.com/feature/2004/IFCmodel.html, last accessed April 2011.
[23] ifcXML, http://buildingsmart-tech.org/downloads/ifcxml, last accessed April 2011.[24] Nisbet, N., and Liebich, T., “ifcXML Implementation Guide,” International Alliance for
Interoperability Modeling Support Group, Version 2.0, June 2007.[25] FIATECH Consortium, http://www.fi atech.org, last accessed April 2011.[26] Teague, T. L., Palmer, M. E., and Jacson, R. H. F., “XML for Capital Facilities,” Journal of
Leadership and Management in Engineering, Vol. 3, No. 2, April 2003, pp. 82–85.[27] AEX Automated Equipment Information Exchange, http://fi atech.org/aex.html, last ac-
cessed April 2011.

136 Standards: IFC and STEP
[28] Crowley, A. J., and Watson, A. S., “CIMsteel Integration Standards,” Release 2, Vols. 1–6, Ascot, UK: Steel Construction Institute, 2000.
[29] Reed, K. A., “The Role of the CIMSteel Integration Standards in Automating the Erection and Surveying of Structural Steelwork,” Proceedings of ISARC, September 2002.
[30] Lipman, R. R., “Mapping Between the CIMSteel Integration Standards and Industry Foun-dation Classes Product Models for Structural Steel,” presented at International Conference on Computing in Civil and Building Engineering, Montreal, Canada, June 14–16, 2006.
[31] CIS/2 CIMSteel Integration Standards, Release 2, http://www.cis2.org, last accessed April 2011.
[32] CIMsteel Project website, http://www.engineering.leeds.ac.uk/civil/research/cae/past/cim-steel/cimsteel.htm, last accessed April 2011.
137
C H A P T E R 8
Mapping Between Process Product Models: Challenges and Opportunities
In Chapter 3, we described a set of motivations and practices applicable to the area of building commissioning (BCx). The leading challenges we identified were standardization, interoperability, and process and product modeling. In Chapter 4, we described the need for process and product models used in BCx and how to codify these models in computable form. In Chapters 5 and 6, we described BIM as a repository of as-designed and as-built data, respectively. In Chapter 7, we in-troduced data representation standards for diverse AEC practices and international standardization efforts like STEP-IFC [1]. In Chapter 9, we will introduce standard protocols, such as BACnet [2], that enable accurate and efficient data accessibility in distributed data networks. And in Chapter 10 we will deal with the challenges of automatic code compliance checking using BIM. This sets the stage for addressing data mapping between process and product models (PPM), an emerging technol-ogy in AEC fields, including diverse applications like structural design, prefabrica-tion, and BCx. In this chapter, we cover these emerging novel technologies. This is essential for fostering greater domain functionality for BCx, while assisting with standardization and interoperability for a variety of capital project delivery (CPD) applications.
8.1 Derivation of Product Models from Process Models
Formal or digital modeling of data in the AEC sector is both essential for improved CPD and unavoidable in the heightened information technology context of AEC participants (Section 3.2). Efforts to standardize data and make information avail-able across proprietary software applications have led to a plethora of tools and re-search programs that deal with product and process models, sometimes separately and at other times in tandem (Section 3.2.1).
When clients buy a product, the process that leads up to the finished product, as ephemeral as it is, determines the quality, budget, and schedule of the product. Thus, modeling both the process and the product data must be done in tandem (Chapter 5). Concurrent engineering practices at Sony and Honda also confirm
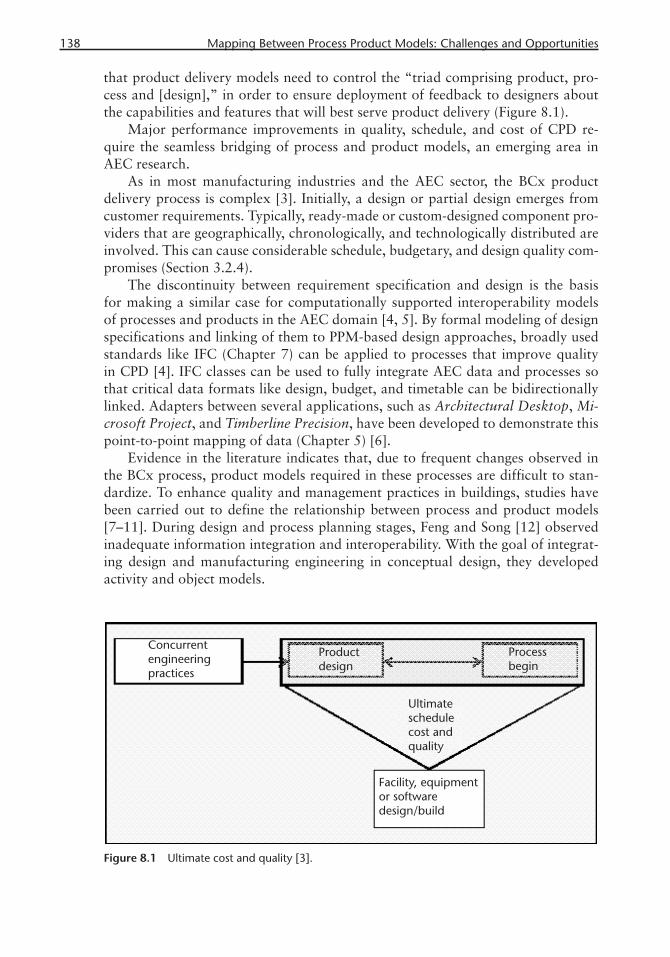
138 Mapping Between Process Product Models: Challenges and Opportunities
that product delivery models need to control the “triad comprising product, pro-cess and [design],” in order to ensure deployment of feedback to designers about the capabilities and features that will best serve product delivery (Figure 8.1).
Major performance improvements in quality, schedule, and cost of CPD re-quire the seamless bridging of process and product models, an emerging area in AEC research.
As in most manufacturing industries and the AEC sector, the BCx product delivery process is complex [3]. Initially, a design or partial design emerges from customer requirements. Typically, ready-made or custom-designed component pro-viders that are geographically, chronologically, and technologically distributed are involved. This can cause considerable schedule, budgetary, and design quality com-promises (Section 3.2.4).
The discontinuity between requirement specification and design is the basis for making a similar case for computationally supported interoperability models of processes and products in the AEC domain [4, 5]. By formal modeling of design specifications and linking of them to PPM-based design approaches, broadly used standards like IFC (Chapter 7) can be applied to processes that improve quality in CPD [4]. IFC classes can be used to fully integrate AEC data and processes so that critical data formats like design, budget, and timetable can be bidirectionally linked. Adapters between several applications, such as Architectural Desktop, Mi-crosoft Project, and Timberline Precision, have been developed to demonstrate this point-to-point mapping of data (Chapter 5) [6].
Evidence in the literature indicates that, due to frequent changes observed in the BCx process, product models required in these processes are difficult to stan-dardize. To enhance quality and management practices in buildings, studies have been carried out to define the relationship between process and product models [7–11]. During design and process planning stages, Feng and Song [12] observed inadequate information integration and interoperability. With the goal of integrat-ing design and manufacturing engineering in conceptual design, they developed activity and object models.
Figure 8.1 Ultimate cost and quality [3].
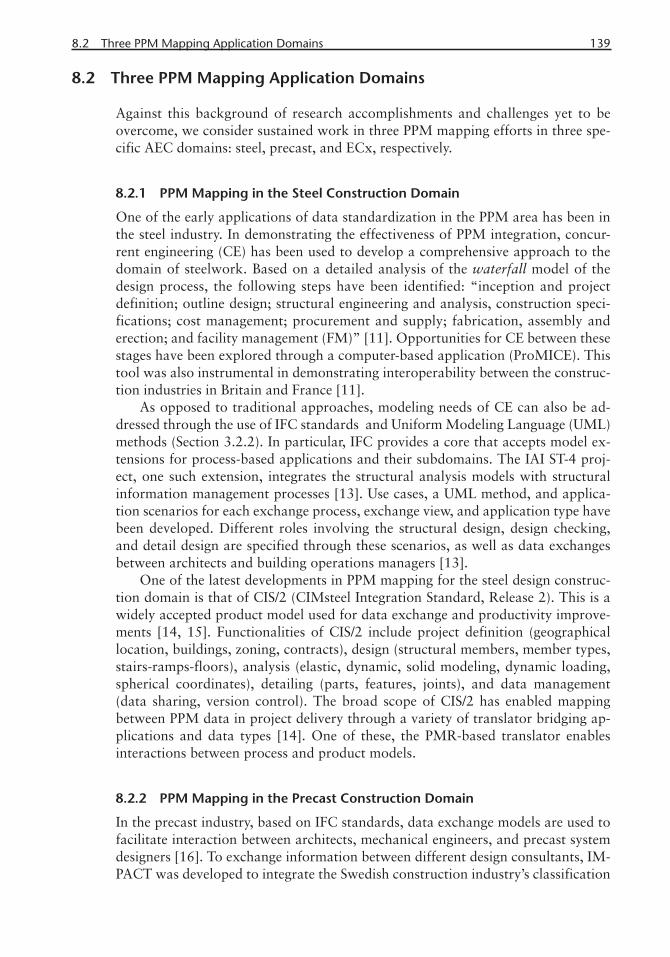
8.2 Three PPM Mapping Application Domains 139
8.2 Three PPM Mapping Application Domains
Against this background of research accomplishments and challenges yet to be overcome, we consider sustained work in three PPM mapping efforts in three spe-cific AEC domains: steel, precast, and ECx, respectively.
8.2.1 PPM Mapping in the Steel Construction Domain
One of the early applications of data standardization in the PPM area has been in the steel industry. In demonstrating the effectiveness of PPM integration, concur-rent engineering (CE) has been used to develop a comprehensive approach to the domain of steelwork. Based on a detailed analysis of the waterfall model of the design process, the following steps have been identified: “inception and project definition; outline design; structural engineering and analysis, construction speci-fications; cost management; procurement and supply; fabrication, assembly and erection; and facility management (FM)” [11]. Opportunities for CE between these stages have been explored through a computer-based application (ProMICE). This tool was also instrumental in demonstrating interoperability between the construc-tion industries in Britain and France [11].
As opposed to traditional approaches, modeling needs of CE can also be ad-dressed through the use of IFC standards and Uniform Modeling Language (UML) methods (Section 3.2.2). In particular, IFC provides a core that accepts model ex-tensions for process-based applications and their subdomains. The IAI ST-4 proj-ect, one such extension, integrates the structural analysis models with structural information management processes [13]. Use cases, a UML method, and applica-tion scenarios for each exchange process, exchange view, and application type have been developed. Different roles involving the structural design, design checking, and detail design are specified through these scenarios, as well as data exchanges between architects and building operations managers [13].
One of the latest developments in PPM mapping for the steel design construc-tion domain is that of CIS/2 (CIMsteel Integration Standard, Release 2). This is a widely accepted product model used for data exchange and productivity improve-ments [14, 15]. Functionalities of CIS/2 include project definition (geographical location, buildings, zoning, contracts), design (structural members, member types, stairs-ramps-floors), analysis (elastic, dynamic, solid modeling, dynamic loading, spherical coordinates), detailing (parts, features, joints), and data management (data sharing, version control). The broad scope of CIS/2 has enabled mapping between PPM data in project delivery through a variety of translator bridging ap-plications and data types [14]. One of these, the PMR-based translator enables interactions between process and product models.
8.2.2 PPM Mapping in the Precast Construction Domain
In the precast industry, based on IFC standards, data exchange models are used to facilitate interaction between architects, mechanical engineers, and precast system designers [16]. To exchange information between different design consultants, IM-PACT was developed to integrate the Swedish construction industry’s classification

140 Mapping Between Process Product Models: Challenges and Opportunities
system (BSAB, Byggandets Samordning AB) with IFC standards. Cost estimation and scheduling programs have been incorporated through this exchange.
In the United States, based on process-model-derived data in the precast con-crete industry, Lee [17] developed methods for deriving product models from pro-cess requirements. This work established the logic and the procedures for sup-porting a formal method for derivation and normalization of product model data. Working with 14 precast producers in North America, Lee analyzed the processes and information flow for precast concrete design and fabrication. The method that emerged, GT-PPM (Georgia Tech Process to Product Modeling), consists of two modules: Requirements Collection and Modeling (RCM) and Logical Product Modeling (LPM) [17, 18].
RCM begins with multiple process models that represent diverse use-case-based information. Using a context-free-grammar (CFG) originally introduced by Chom-sky [19], researchers defined semantic mechanisms, like information constructs (IC), that are formally defined information items representing domain semantics. The LPM process incorporates five steps: (1) union information constructs, (2) decompose information constructs into entities, (3) detect and merge semantically equivalent entities, (4) detect and merge semantically equivalent attributes, and (5) resolve conflicts between attributes of a super-type and its inherited attributes. As a result, specified information items are collected, integrated, normalized, and refined into a formal product model, all semiautomatically [20].
Strengths of the GT-PPM concept (Figure 8.2) include the specification of in-formation needed in a process by domain experts and the availability of a logical and dynamic consistency checking. Through this technique, nym (synonym or homonym) issues are detected and product model ambiguities are resolved. Be-cause the data model is defined in EXPRESS, GT-PPM is able to read it as an information menu.
Utilizing a linguistic approach through CFG, GT-PPM defines precast concrete product information through syntactic rules. Instead of relying on the Backus Naur form (BNF), a context-free grammar notation [21], bracket notation is used to express constituent tree structures. Figure 8.3 shows an example that describes the data “when a beam was cast.” It is based on syntactic rules used in precast concrete manufacturing (e.g., IC[P[DP[building]]M[MA[name]]]).
8.2.3 PPM Mapping in the Building Commissioning Domain
Although many standardization and interoperability problems are addressed by AEC industry-wide specifications, such as IFC and aecXML, effective mapping be-tween process and product models in the BCx field continues to be a challenge. One reason for this is the need for nongraphic building information in ECx, as op-posed to the preponderance of geometric information modeled by most standards. Another problem is the frequent changes in BCx practices that make it difficult to develop common standards.
In spite of this, efforts to develop standards for the entire BCx domain persist. Türkaslan-Bulbul [22] developed a product model for computational support. She attempted to include the broadest scope of data representation by starting with the ASHRAE Commissioning Guideline 0-2005 [23] and then adding to this data har-vested from a diverse set of other repositories (Chapter 4). This is the motivation
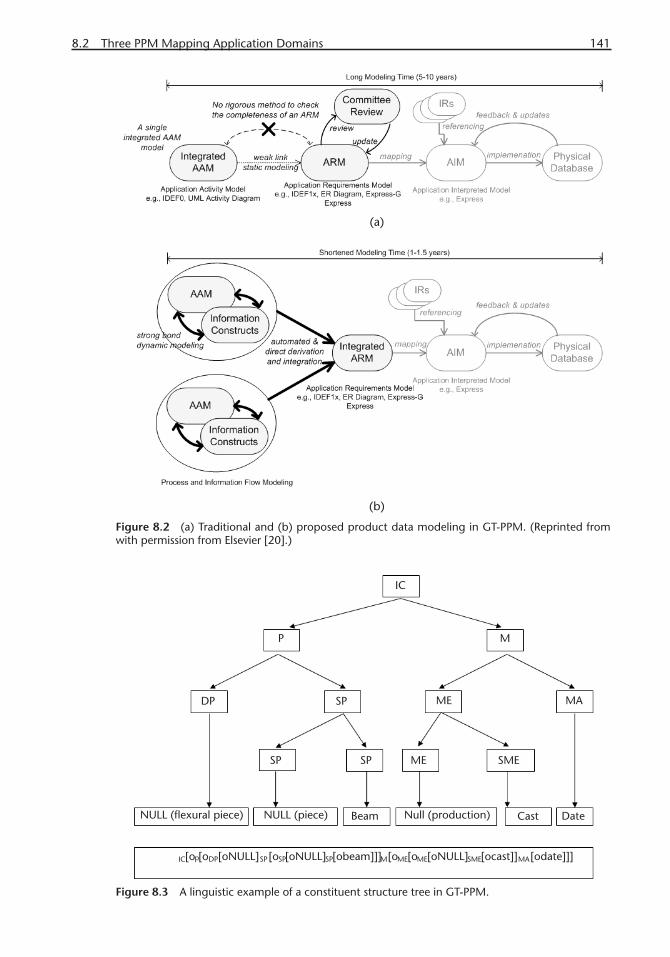
8.2 Three PPM Mapping Application Domains 141
Figure 8.2 (a) Traditional and (b) proposed product data modeling in GT-PPM. (Reprinted from with permission from Elsevier [20].)
Figure 8.3 A linguistic example of a constituent structure tree in GT-PPM.
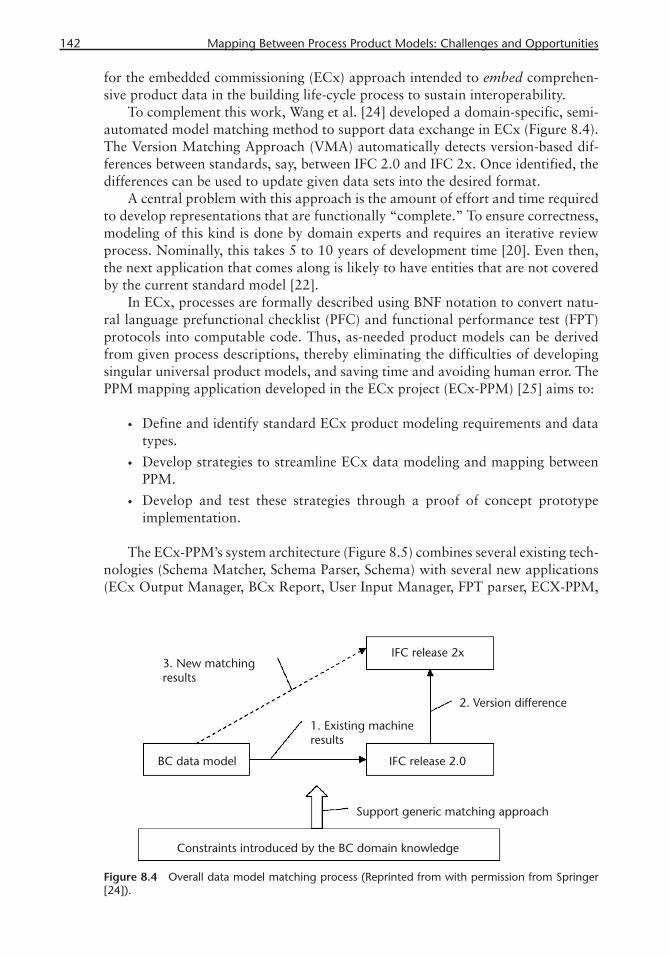
142 Mapping Between Process Product Models: Challenges and Opportunities
for the embedded commissioning (ECx) approach intended to embed comprehen-sive product data in the building life-cycle process to sustain interoperability.
To complement this work, Wang et al. [24] developed a domain-specific, semi-automated model matching method to support data exchange in ECx (Figure 8.4). The Version Matching Approach (VMA) automatically detects version-based dif-ferences between standards, say, between IFC 2.0 and IFC 2x. Once identified, the differences can be used to update given data sets into the desired format.
A central problem with this approach is the amount of effort and time required to develop representations that are functionally “complete.” To ensure correctness, modeling of this kind is done by domain experts and requires an iterative review process. Nominally, this takes 5 to 10 years of development time [20]. Even then, the next application that comes along is likely to have entities that are not covered by the current standard model [22].
In ECx, processes are formally described using BNF notation to convert natu-ral language prefunctional checklist (PFC) and functional performance test (FPT) protocols into computable code. Thus, as-needed product models can be derived from given process descriptions, thereby eliminating the difficulties of developing singular universal product models, and saving time and avoiding human error. The PPM mapping application developed in the ECx project (ECx-PPM) [25] aims to:
• Define and identify standard ECx product modeling requirements and data types.
• Develop strategies to streamline ECx data modeling and mapping between PPM.
• Develop and test these strategies through a proof of concept prototype implementation.
The ECx-PPM’s system architecture (Figure 8.5) combines several existing tech-nologies (Schema Matcher, Schema Parser, Schema) with several new applications (ECx Output Manager, BCx Report, User Input Manager, FPT parser, ECX-PPM,
Figure 8.4 Overall data model matching process (Reprinted from with permission from Springer [24]).

8.3 A Generalized Framework for PPM Mapping 143
Ontology Libraries) designed to create an interactive computational environment for developing product models from process descriptions.
8.3 A Generalized Framework for PPM Mapping
In spite of the recent research efforts in the steel, precast, and BCx fields that con-vincingly demonstrate advances in PPM mapping (Section 8.2), a proper parsing of the generic issues and challenges in this area has not been developed. PPM mapping needs to address several problems that can be organized along two axes: representa-tion (Table 8.1, top row) and process types (Table 8.1, left column) [11, 15, 17, 18].
PPM specifications are intended to conform to central, shared standards like IFC. From the standpoint of coverage, PPM mapping is like a search engine match-ing string values against indexed values. Accuracy problems are related to interop-erability between proprietary representations of digital applications (vertical) and CPD phases (horizontal). Owing to customized representations prevalent in the proprietary realm, mapping between them require the use of formal syntactic lan-guages like CFG. Fidelity problems are related to ontological consistency mainte-nance across role, type, and cardinal representation.
Three technologies are critical in making this mapping between PPM possible: natural language processing, building ontology applications, and just-in-time ac-cessibility. For this, a complete process and product ontology library is needed. In
Figure 8.5 General system architecture of ECx-PPM.

144 Mapping Between Process Product Models: Challenges and Opportunities
each of the PPM mapping approaches we reviewed above, all three of these com-ponents and their relationships are present. Now, let us consider them individually.
8.3.1 Natural Language Processing
Process descriptions that are needed to derive product models in the precast con-crete, steel fabrication, or BCx sectors are obtained from industry-wide protocols, owner project requirements, and system manuals. These are natural language docu-ments from which information can be automatically extracted. There are three primary computational linguistics approaches that can be used to extract mean-ingful semantic and syntactic information from descriptive building information: Treebank, PTB, and CFG.
The Treebank approach is applied in string data prevalent domains like training parsers for newspapers, journals, novels, and technical manuals. To achieve cor-rect parsing, each sentence is annotated with semantic and syntactic tags enabling automatic interpretation and sorting. Terminal nodes are tagged with grammatical categories such as noun, verb, and adjective. Nonterminal nodes in a tree are repre-sented by parts-of-speech tags like NP (noun phrase) and VP (verb phrase).
The Penn Treebank (PTB) approach developed by the University of Pennsyl-vania is the most widely used Treebank application [26]. Penn Treebank II uses additional tags, such as nouns being further categorized as NN (noun, singular or mass), NNS (noun, plural), NNP (proper noun, singular), and NNPS (proper noun, plural). Stanford Language Process Group’s Part-Of-Speech (POS) Tagger also uses PTB. The POS Tagger is able to “read” and parse text input in natural language format and output the text in categories representing common forms of speech like verb, noun, adverb, article, adjective, and pronoun.
Chomsky [19] proposed the CFG notation as a model for describing natural languages, which is used in the GT-PPM project (Figure 8.3). CFG notation creates a formal hierarchy of left-hand/right-hand rules that can nest arbitrarily deep layers of “clauses” within one another. Thus complex syntaxes consisting of clauses made up of “primitive” symbols can be constructed. These syntaxes, often represented in BNF notation, can be used to define well-formed language domains.
8.3.2 Ontology Building in the AEC Industry
An ontology is a “formal explicit specification of a shared conceptualization” of domain knowledge [27]. By assembling information into concept hierarchies,
Table 8.1 Challenges in Mapping between Process and Product Model
M-PPM Problems
CoverageStandardization – shared process and product representations
AccuracyInteroperability – vertical and horizontal infor-mation transfer across representations
FidelityOntology–role, type, and cardinality maintenance across representations
Process specification Central, shared (IFC, etc.) Local and proprietary Ontology input
Mapping between PPM
Index matching Structural, linguistic (BNF, etc.)
Ontology matching
Product specification Central, shared (IFC, etc.) Local and just-in-time Ontology output
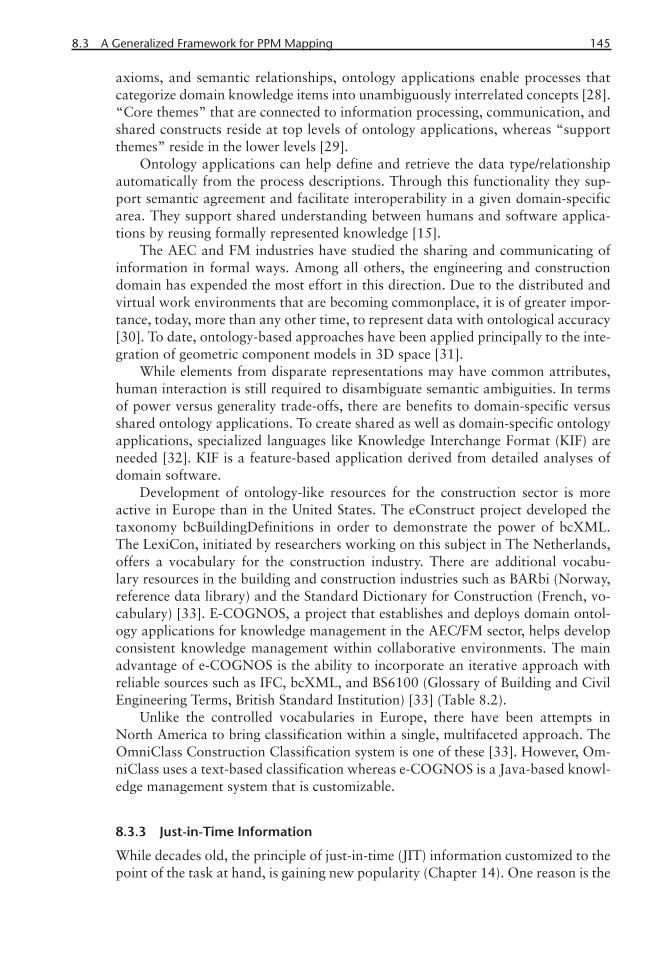
8.3 A Generalized Framework for PPM Mapping 145
axioms, and semantic relationships, ontology applications enable processes that categorize domain knowledge items into unambiguously interrelated concepts [28]. “Core themes” that are connected to information processing, communication, and shared constructs reside at top levels of ontology applications, whereas “support themes” reside in the lower levels [29].
Ontology applications can help define and retrieve the data type/relationship automatically from the process descriptions. Through this functionality they sup-port semantic agreement and facilitate interoperability in a given domain-specific area. They support shared understanding between humans and software applica-tions by reusing formally represented knowledge [15].
The AEC and FM industries have studied the sharing and communicating of information in formal ways. Among all others, the engineering and construction domain has expended the most effort in this direction. Due to the distributed and virtual work environments that are becoming commonplace, it is of greater impor-tance, today, more than any other time, to represent data with ontological accuracy [30]. To date, ontology-based approaches have been applied principally to the inte-gration of geometric component models in 3D space [31].
While elements from disparate representations may have common attributes, human interaction is still required to disambiguate semantic ambiguities. In terms of power versus generality trade-offs, there are benefits to domain-specific versus shared ontology applications. To create shared as well as domain-specific ontology applications, specialized languages like Knowledge Interchange Format (KIF) are needed [32]. KIF is a feature-based application derived from detailed analyses of domain software.
Development of ontology-like resources for the construction sector is more active in Europe than in the United States. The eConstruct project developed the taxonomy bcBuildingDefinitions in order to demonstrate the power of bcXML. The LexiCon, initiated by researchers working on this subject in The Netherlands, offers a vocabulary for the construction industry. There are additional vocabu-lary resources in the building and construction industries such as BARbi (Norway, reference data library) and the Standard Dictionary for Construction (French, vo-cabulary) [33]. E-COGNOS, a project that establishes and deploys domain ontol-ogy applications for knowledge management in the AEC/FM sector, helps develop consistent knowledge management within collaborative environments. The main advantage of e-COGNOS is the ability to incorporate an iterative approach with reliable sources such as IFC, bcXML, and BS6100 (Glossary of Building and Civil Engineering Terms, British Standard Institution) [33] (Table 8.2).
Unlike the controlled vocabularies in Europe, there have been attempts in North America to bring classification within a single, multifaceted approach. The OmniClass Construction Classification system is one of these [33]. However, Om-niClass uses a text-based classification whereas e-COGNOS is a Java-based knowl-edge management system that is customizable.
8.3.3 Just-in-Time Information
While decades old, the principle of just-in-time (JIT) information customized to the point of the task at hand, is gaining new popularity (Chapter 14). One reason is the
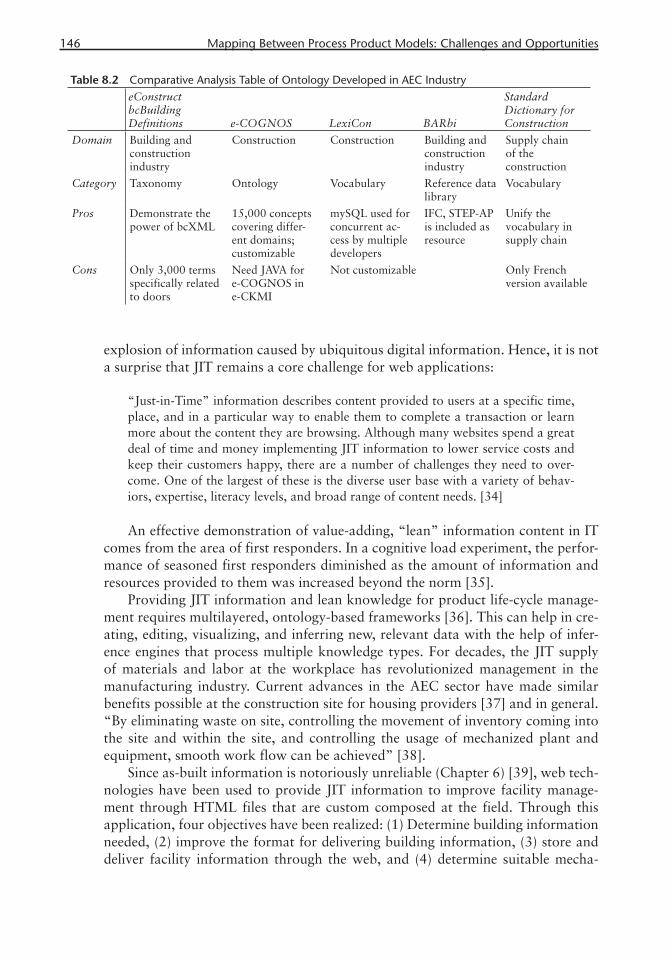
146 Mapping Between Process Product Models: Challenges and Opportunities
explosion of information caused by ubiquitous digital information. Hence, it is not a surprise that JIT remains a core challenge for web applications:
“Just-in-Time” information describes content provided to users at a specific time, place, and in a particular way to enable them to complete a transaction or learn more about the content they are browsing. Although many websites spend a great deal of time and money implementing JIT information to lower service costs and keep their customers happy, there are a number of challenges they need to over-come. One of the largest of these is the diverse user base with a variety of behav-iors, expertise, literacy levels, and broad range of content needs. [34]
An effective demonstration of value-adding, “lean” information content in IT comes from the area of first responders. In a cognitive load experiment, the perfor-mance of seasoned first responders diminished as the amount of information and resources provided to them was increased beyond the norm [35].
Providing JIT information and lean knowledge for product life-cycle manage-ment requires multilayered, ontology-based frameworks [36]. This can help in cre-ating, editing, visualizing, and inferring new, relevant data with the help of infer-ence engines that process multiple knowledge types. For decades, the JIT supply of materials and labor at the workplace has revolutionized management in the manufacturing industry. Current advances in the AEC sector have made similar benefits possible at the construction site for housing providers [37] and in general. “By eliminating waste on site, controlling the movement of inventory coming into the site and within the site, and controlling the usage of mechanized plant and equipment, smooth work flow can be achieved” [38].
Since as-built information is notoriously unreliable (Chapter 6) [39], web tech-nologies have been used to provide JIT information to improve facility manage-ment through HTML files that are custom composed at the field. Through this application, four objectives have been realized: (1) Determine building information needed, (2) improve the format for delivering building information, (3) store and deliver facility information through the web, and (4) determine suitable mecha-
Table 8.2 Comparative Analysis Table of Ontology Developed in AEC IndustryeConstruct bcBuildingDefinitions e-COGNOS LexiCon BARbi
Standard Dictionary for Construction
Domain Building and construction industry
Construction Construction Building and construction industry
Supply chain of theconstruction
Category Taxonomy Ontology Vocabulary Reference data library
Vocabulary
Pros Demonstrate the power of bcXML
15,000 concepts covering differ-ent domains; customizable
mySQL used for concurrent ac-cess by multiple developers
IFC, STEP-AP is included as resource
Unify the vocabulary in supply chain
Cons Only 3,000 terms specifically related to doors
Need JAVA for e-COGNOS in e-CKMI
Not customizable Only French version available

8.4 A Detailed Case Study of PPM Mapping in Embedded Commissioning 147
nisms of documenting building information [40]. Lee [41] also demonstrated that O&M fieldwork can be significantly enhanced through advanced visualization.
We will cover JIT and related technologies for the O&M field in greater detail in Chapter 14.
8.4 A Detailed Case Study of PPM Mapping in Embedded Commissioning
PPM mapping in ECx begins with natural language parsing (FPT Parser in Figure 8.5). The FPT Parser analyzes natural language formatted protocols of ECx that include a PFC and FPT. These industry-defined protocols are imported by the User Input Manager (Figure 8.5) and are mapped into BNF notation. Then, the protocols are parsed by the FPT Parser, paragraph by paragraph, and sentence by sentence, and followed by decomposition into a series of procedures. Each action in the “unit of behavior” (UOB) is parsed further into a word level, a lexicographic representa-tion expressed in IDEF3 diagram format (Figure 8.6).
An ontology-based approach is used to categorize parsed items and define hi-erarchical relationships between them. The FPT Parser verifies the parsed items through the process model-ontology library in order to derive the corresponding product model. In this representation, further semantic interoperability needs to be achieved, by mapping it into standards like IFC. For this derivation, the LPM (Logical Product Modeling) approach of GT-PPM is adopted. After accessing and applying LPM in the ontology library, the parsed ECx item from the FPT Parser follows the ontological entities of the IFC-HVAC schema to structure the product model.
According to ECx’s ontology schemata, items are defined either as classes or attributes (Figure 8.7). Synonyms are checked and matched against corresponding concept(s) and then placed in a hierarchical structure. For example, the FPT item “participants” is a synonym of the item “actor” in the IFC standard. Since these two items are predefined as synonyms, they are automatically matched. This item does not involve multiple levels in the ontology hierarchy, therefore no adjust-ments in the library and its hierarchy are required. If no match were to be found, the unmatched item would be returned to the user for manual processing, which entails selection of an item from potential matches or an entirely new input into the ontology library.
Next, to improve the interoperability of ECx representations, the verified item is matched with a standard schema, as in IFC [1] or AEX [42] schemata. In this matching step of ECx, since there are no common schemata shared by all stan-dards, a single standard based on IFC schemata is used. The final step in the ECx-PPM process is to save the product model in the ECx repository for later use. This product model can be retrieved by the input/output (I/O) manager to record ECx data and generate a BCx report. I/O utilities of the BEMAC (Building Energy Monitoring, Analyzing and Communication) framework [43] are used to input and output data in ECx.

148 Mapping Between Process Product Models: Challenges and Opportunities
Fig
ure
8.6
Dec
omp
ositi
on o
f UO
B D
evic
e C
alib
ratio
n C
heck
s in
IDEF
3 no
tatio
n.

8.4 A Detailed Case Study of PPM Mapping in Embedded Commissioning 149
8.4.1 Natural Language Parsing in ECx PPM Mapping
BNF notation [44] is used in ECx-PPM to construct formal representations of lexi-con; and syntax is used to capture semantic information present in the natural lan-guage protocols of PFC and FPT. Table 8.3 illustrates a BNF developed for formal representation of an FPT protocol .
The descriptions of FPT protocols consist of a list of “Test_procedures”:
“a. With boilers in normal mode and ON, increase space setpoint 20Fof TU- ______ (interlocked to the fi n tube). If OSAT is not > 40F, overwrite it to be > 40F. Overwrite space temp to be 3F below main setpoint (cooling) ______F and observe in BAS that there is heating deck fl ow and cooling fl ow goes to minimum. Observe that the fi n tube or radiant panels remain OFF.
b. Change the space temp. to be 5F below main setpoint (cooling) ______F and observe the radiant panels or fin tubes remain OFF.
c. Change the OSAT to be < 40F. Observe that the radiant panels or fi n tubes start heating. Return all parameters to normal.” [45]
These are followed by a list of corresponding “Expected_results” [45]:
“a. TU goes into heating mode. Fin tube HCV’s remain closed. b. TU remains in heating mode. Fin tube HCV’s remain closed. c. TU remains in heating mode. Fin tube HCV’s open [45].”
“Test_procedures” consists of an “Action” that changes the value of equip-ment attributes. This can involve a “Condition” to set a situation of “Action” or a “Qualifier” to supplement the “Action.” The “Expected_result” verifies the
Figure 8.7 Constituent tree of a fan-coil unit functional performance test statement.
Table 8.3 Functional Performance Tests in BNF Notation [25]ProcessModel ::= {Test_Procedure} {Expected_Result}
Test_Procedure ::= [oCondition],<,>, <Action>, Predicate, [oQualifier] , <.>
Expected_Result ::= [oAction], Predicate, [oCondition]
Condition ::= <Preposition>|<if>|<When>, Predicate
Predicate ::= [oEquipment], [oStatus], {AVP}
AVP ::= {<Attribute>}, <Value>
{ }-repetitive; [o ]-conditional; <>-terminal node
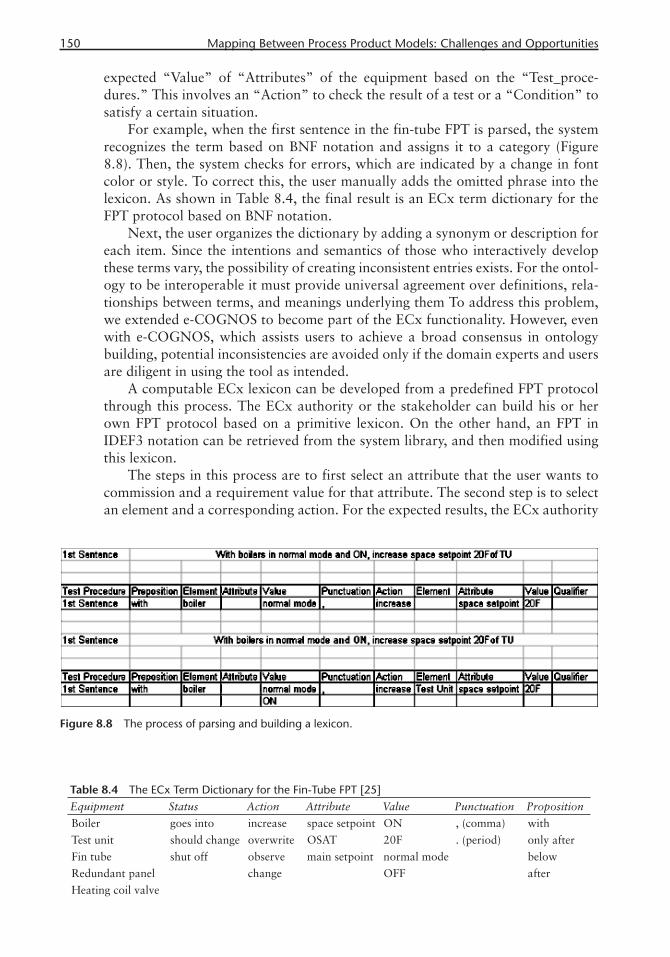
150 Mapping Between Process Product Models: Challenges and Opportunities
expected “Value” of “Attributes” of the equipment based on the “Test_proce-dures.” This involves an “Action” to check the result of a test or a “Condition” to satisfy a certain situation.
For example, when the first sentence in the fin-tube FPT is parsed, the system recognizes the term based on BNF notation and assigns it to a category (Figure 8.8). Then, the system checks for errors, which are indicated by a change in font color or style. To correct this, the user manually adds the omitted phrase into the lexicon. As shown in Table 8.4, the final result is an ECx term dictionary for the FPT protocol based on BNF notation.
Next, the user organizes the dictionary by adding a synonym or description for each item. Since the intentions and semantics of those who interactively develop these terms vary, the possibility of creating inconsistent entries exists. For the ontol-ogy to be interoperable it must provide universal agreement over definitions, rela-tionships between terms, and meanings underlying them To address this problem, we extended e-COGNOS to become part of the ECx functionality. However, even with e-COGNOS, which assists users to achieve a broad consensus in ontology building, potential inconsistencies are avoided only if the domain experts and users are diligent in using the tool as intended.
A computable ECx lexicon can be developed from a predefined FPT protocol through this process. The ECx authority or the stakeholder can build his or her own FPT protocol based on a primitive lexicon. On the other hand, an FPT in IDEF3 notation can be retrieved from the system library, and then modified using this lexicon.
The steps in this process are to first select an attribute that the user wants to commission and a requirement value for that attribute. The second step is to select an element and a corresponding action. For the expected results, the ECx authority
Table 8.4 The ECx Term Dictionary for the Fin-Tube FPT [25]Equipment Status Action Attribute Value Punctuation Proposition
Boiler goes into increase space setpoint ON , (comma) with
Test unit should change overwrite OSAT 20F . (period) only after
Fin tube shut off observe main setpoint normal mode below
Redundant panel change OFF after
Heating coil valve
Figure 8.8 The process of parsing and building a lexicon.
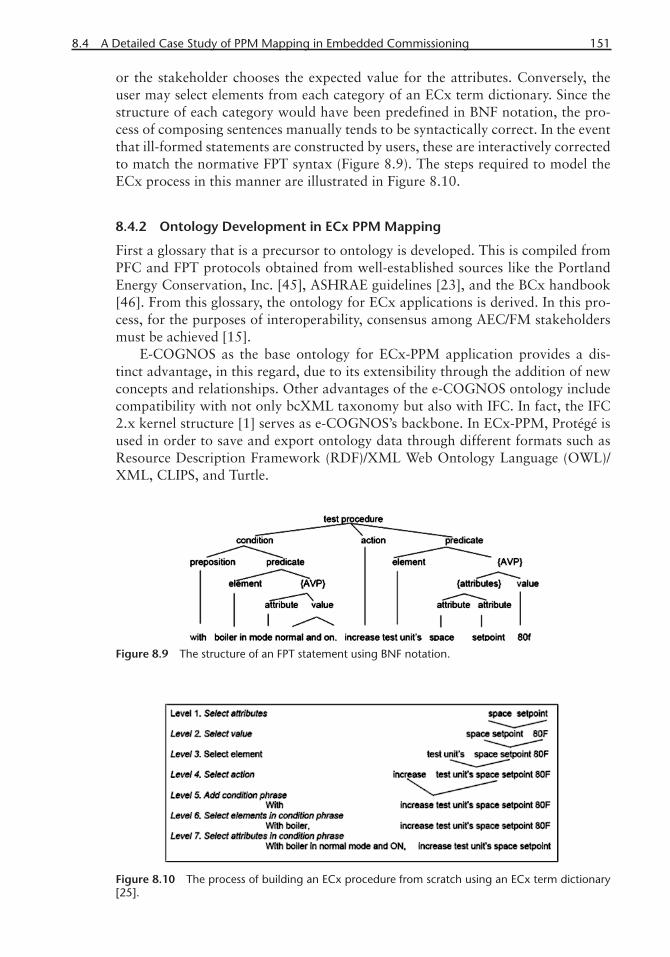
8.4 A Detailed Case Study of PPM Mapping in Embedded Commissioning 151
or the stakeholder chooses the expected value for the attributes. Conversely, the user may select elements from each category of an ECx term dictionary. Since the structure of each category would have been predefined in BNF notation, the pro-cess of composing sentences manually tends to be syntactically correct. In the event that ill-formed statements are constructed by users, these are interactively corrected to match the normative FPT syntax (Figure 8.9). The steps required to model the ECx process in this manner are illustrated in Figure 8.10.
8.4.2 Ontology Development in ECx PPM Mapping
First a glossary that is a precursor to ontology is developed. This is compiled from PFC and FPT protocols obtained from well-established sources like the Portland Energy Conservation, Inc. [45], ASHRAE guidelines [23], and the BCx handbook [46]. From this glossary, the ontology for ECx applications is derived. In this pro-cess, for the purposes of interoperability, consensus among AEC/FM stakeholders must be achieved [15].
E-COGNOS as the base ontology for ECx-PPM application provides a dis-tinct advantage, in this regard, due to its extensibility through the addition of new concepts and relationships. Other advantages of the e-COGNOS ontology include compatibility with not only bcXML taxonomy but also with IFC. In fact, the IFC 2.x kernel structure [1] serves as e-COGNOS’s backbone. In ECx-PPM, Protégé is used in order to save and export ontology data through different formats such as Resource Description Framework (RDF)/XML Web Ontology Language (OWL)/XML, CLIPS, and Turtle.
Figure 8.9 The structure of an FPT statement using BNF notation.
Figure 8.10 The process of building an ECx procedure from scratch using an ECx term dictionary [25].

152 Mapping Between Process Product Models: Challenges and Opportunities
8.4.3 Schema Matcher and Schema Parser in ECx PPM Mapping
In ECx-PPM, HVAC component modeling is done in the IFC schemata format. This is considered to be the best fit with the general ECx process (Figure 8.11). The type concept can express the OPR by defining a normal design condition that is usually determined in the early phase of ECx. The occurrence concept, which shows placement, connectivity of other elements and systems, and interaction with its environment, can represent the status of installation that is checked by PFC im-mediately after construction is completed. The performance history concept in the HVAC component schema is useful for storing FPT information in the IFC format.
In modeling an HVAC component in ECx-PPM, each PFC or FPT protocol is matched to one type, occurrence, and performance history concept. For example, a model verification of pump PFC checks the type of pump installed as to manu-facturer, model, serial number, volts, and GPM. Installation checks of the pump ensure that pumps are in place, while the occurrence concept in IFC checks that grouted vibration isolation devices are installed properly and the devices are func-tional [45]:
“Check [Equipment Tag]:
General Installation
Equipment tag and nameplate permanently affi xed
Pumps in place and properly grouted
Installation of balancing devices allow balancing to be completed following NEBB or AABC procedures & contract documents
Test and balance report reviewed for pump fl ows, head, elec.
Pump environment clean
Adequate access for maintenance
Vibration isolation devices installed and functional
Factory alignment correct (checked by installer)
Field alignment, if required, completed (checked by installer)
Seismic anchoring installed per spec
Temperature, pressure, and fl ow gages and sensors installed per spec.
Figure 8.11 HVAC component modeling concept in the IFC 2X2 data model [25].

8.5 Opportunities for PPM Mapping in ECx 153
Required valves installed & in right direction
No visible leaks
Pump lubricated (checked by installer)
Piping (in vicinity of pump)
Pipe fi ttings complete and pipes properly supported
Air vents, expansion tanks, air separators installed per spec.
Piping type and fl ow direction properly labeled”
FPT protocol for the functional testing of a fan-coil unit and to record its per-formance the following steps must be taken [45]:
“Test Procedure (including special conditions)
1. Adjust the stat set point until it is equal to the space temperature. 2. Adjust the stat set point until it is 4F below the space temperature. 3. Return all changed control parameters and conditions to their pre-test
values.
Expected and Actual Response to these procedures include the following [45]:
1. __Fan starts. __ Heating coil valve opens; __Warm air delivered.2. Fan stops. Heating coil valve closes.3. Check off in Section 2 above when completed.”
This type of information can be captured through the performance history concept in IFC-HVAC modeling. However, IFCs represent only 30% of the parsed ECx information, while the HVAC modeling in IFC (concept, type, occurrence, and performance history) is generally compatible with the entire ECx process [24, 47].
To remedy this apparent shortcoming of coverage by IFC schema, in ECx-PPM, the Property Set object is used to represent detailed properties of HVAC compo-nents. The IFC parser and BC-IFC matcher developed and updated for current use by Wang et al. [24] have been adapted to the ECx-PPM application environment. After deriving the HVAC product model, in order to associate it with PFC and FPT protocol information, they are encoded in EXPRESS-G. For instance, the left box in Figure 8.12 is a fan-coil unit product model derived from the steps of a PFC pro-tocol; and the right box shows the property set needed to capture the information about fan type, flow moving device fan, and fan performance history.
In addition, IfcProject and IfcProcess are used to represent the project informa-tion and the commissioning process, respectively. The relationship between project, process, and the commissioned equipment is defined by using the IFC Relationship entity. Approval regarding the ECx process is represented by IFCApproval con-nected by IFCRelAssociatesApproval.
8.5 Opportunities for PPM Mapping in ECx
In this chapter, we have been primarily concerned with the mapping of data be-tween process and product representations in the interoperable world of shared

154 Mapping Between Process Product Models: Challenges and Opportunities
Fig
ure
8.12
IF
C m
odel
imp
lem
enta
tion
for
a p
art
of F
CU
PFC
with
EX
PRES
S-G
.

8.5 Opportunities for PPM Mapping in ECx 155
standards, like IFC and AEX (Chapter 4). Because building “universal” product models suitable to every occasion has serious drawbacks—including unaffordable modeling time and resources, volatility, rapid obsolescence, and excessive informa-tion content of modeled objects—JIT modeling of products mapped from process descriptions (or protocols) can lead to significant improvements. This can help re-duce the costs of product model building, deployment, and training of their users. Furthermore, such an approach is immune to changes in AEC practices, and will make design and field operations lean, accurate, and efficient.
In this chapter, we reviewed the viability of this approach, particularly through an in-depth discussion of PPM mapping in ECx, and a breadth of applications in other CPD domains like steel and precast concrete systems design. In doing so, we demonstrated the level to which ECx data exchanges can be achieved, with reliability and interoperability, through standards like IFC. Without an accurate understanding of the coverage provided by current standards (Chapter 7), interop-erability in ECx can never be achieved. Evaluating the coverage of data provided by IFC standards and supplementing them to reach full coverage will facilitate the widespread use of these standards to manage ECx information effectively.
The ECx research described in detail, in this chapter and in Chapter 7, propos-es extensions to the IFC standard in the form of new, predefined property sets for HVAC equipment modeling. This will undoubtedly enrich IFC standards and also facilitate the global interoperability required to support the required data exchange applications for ECx.
Finally, in this chapter, we reported on the formal representation of ECx in-formation about type, occurrence, and performance history of HVAC systems. This information will help in the development of guidelines in the proper use of IFC schemata that represent ECx data. Through this, developers can understand how to use IFC standards in the HVAC domain efficiently and encourage software companies to implement their IFC-compatible releases in the domain of building commissioning.
References
[1] STEP: STandard for Exchange of Product Model Data, http://www.apaa.org/step.html.[2] Castro, N. S., Galler, M. A., and Bushby, S. T., “A Test Shell for Developing Automated
Commissioning Tools for BACnet Systems,” in Proceedings of National Conference on Building Commissioning, Las Vegas, NV, February 23–26, 2003.
[3] Whitney, D., , “State of the Art in the United States of CAD Methodologies for Product Development,” Final Report Under Grants from Offi ce of Naval Research and the National Science Foundation, Cambridge, MA: MIT, Center for Technology, Policy and Industrial Development, October 1995.
[4] Kiviniemi, A., “Requirements Management Interface to Building Product Models,” disser-tation submitted to Department of Civil and Environmental Engineering and the Commit-tee of Graduate Studies, Stanford University, Stanford, CA, March 2005.
[5] Özkaya, I., and Akin, Ö, “Tool Support for Computer-Aided Requirement Traceability in Architectural Design: The Case of DesignTrack,” Automation in Construction, Vol. 16, No. 5, 2007, pp. 674–684.
[6] Halfawy, M., and Froese, T., “Integration of Data and Processes of AEC Projects Using the Industry Foundation Classes,” Report No. NRCC-48131; also published in Proceedings of the 6th Construction Specialty Conference, Toronto, Ontario, June 2–4, 2005, pp. 1–10.
156 Mapping Between Process Product Models: Challenges and Opportunities
[7] Lehne, M. G., and Wollert, J., “Integrated Process and Product Modeling in Shipbuilding Industry—Why and How,” Netherlands, 1992, pp. 289–303.
[8] Cutting-Decelle, A. F., et al., “The Application of PSL to Product Design Across Con-struction and Manufacturing,” Concurrent Engineering, Vol. 11, No. 1, March 2003, pp. 65–75.
[9] Tesfagaber, G., et al., “Semantic Process Modeling for Applications Integration in AEC,” American Society of Civil Engineers, 2002, pp. 318–335.
[10] Lee, C. H., Sause, R., and Hong, N. K., “Overview of Entity-Based Integrated Design Prod-uct and Process Models,” in Civil-Comp Press, Edinburgh, UK, 1996, pp. 185–197.
[11] Anumba, C. J., et al., “Integrating Concurrent Engineering Concepts in a Steelwork Con-struction Project,” Concurrent Engineering: Research and Applications, Vol. 8, No. 3, 2000, pp. 199–212.
[12] Feng, S. C., and Song, E. Y., “Information Modeling of Conceptual Design Integrated with Process Planning,” in Proceedings of Symposia on Design for Manufacturability, The 2000 International Mechanical Engineering Congress and Exposition, Orlando, FL, 2000.
[13] Weise, M., et al., “Structural Analysis Extension of the IFC Modeling Framework,” ITcon, Vol. 8, 2003, pp. 181–200.
[14] Crowley, A. J., and Watson, A. S., “CIMsteel Integration Standards, Release 2,” Ascot, UK: Steel Construction Institute, 2000.
[15] Eastman, C., et al., “Deployment of an AEC Industry Sector Product Model,” Computer-Aided Design, Vol. 37, No. 12, October 2005, pp. 1214–1228.
[16] Rönneblad, A., and Olofsson, T., “Application of IFC in Design and Production of Precast Concrete Constructions,” ITcon, Vol. 8, 2003, pp.167–180.
[17] Lee, G., “A New Formal and Analytical Process to Product Modeling (PPM) Method and Its Application to the Precast Concrete Industry,” Atlanta, GA: Georgia Institute of Tech-nology, 2004.
[18] Lee, G., et al., “Grammatical Rules for Specifying Information for Automated Product Data Modeling,” Advanced Engineering Informatics, Vol. 20, No. 2, April 2006, pp. 155–170.
[19] Chomsky, N., “Three Models for the Description of Language,” IEEE Trans. on Informa-tion Theory, Vol. 2, No. 3, September 1956.
[20] Lee, G., Eastman, C. M., and Sacks, R., “Eliciting Information for Product Modeling Us-ing Process Modeling,” Data & Knowledge Engineering, Vol. 62, No. 2, August 2007, pp. 292–307.
[21] Backus, J. W., “The Syntax and Semantics of the Proposed International Algebraic Lan-guage of the Zurich ACM-GAMM Conference,” in Proceedings of the International Con-ference on Information Processing, UNESCO, 1959, pp. 125–132.
[22] Türkaslan-Bulbul, M. T., “Process and Product Modeling for Computational Support of Building Commissioning,” Ph.D. Dissertation, Carnegie Mellon University, Pittsburgh, PA, 2006.
[23] ASHRAE Standards Committee Guideline 0-2005—The Commissioning Process, Atlanta, GA: American Society of Heating, Refrigerating and Air-Conditioning Engineers, 2005.
[24] Wang, H., et al., “Towards Domain-Oriented Semi-Automated Model Matching for Sup-porting Data Exchange,” in Proceedings of the 10th International Conference on Comput-ing in Civil and Building Engineering, Weimar, Germany, 2004.
[25] Akın, Ö., et al., “Product and Process Modeling for Functional Performance Testing in Low-Energy Building Embedded Commissioning Case,” in Proceedings of ICEBO, 2007, San Francisco, CA, November 1–2, 2007.
[26] McCallum, A., “Joint Inference for Natural Language Processing,” in Proceedings of the Joint Inference for Natural Language Processing, held at CoNLL, 2009.
[27] Gruber, T., “A Translation Approach to Portable Ontology Specifi cations,” Technical Re-port KSL 92-71, Knowledge System Laboratory, 1993.
8.5 Opportunities for PPM Mapping in ECx 157
[28] El-Diraby, T. E., and Kashif, K. F., “Distributed Ontology Architecture for Knowledge Management in Highway Construction,” Journal of Construction Engineering and Man-agement, Vol. 131, No. 5, 2005.
[29] Turk, Z., “Construction Informatics: Defi nition and Ontology,” Advanced Engineering Informatics, Vol. 20, No. 2, April 2006, pp. 187–199.
[30] Dutra, M., et al., “A Generic and Synchronous Ontology-Based Architecture for Collab-orative Design,” Concurrent Engineering, Vol. 18, No. 1, March 2010, pp. 65–74.
[31] Park, M., and Fishwick, P. A., “Integrating Dynamic and Geometry Model Components through Ontology-Based Inference,” Simulation, Vol. 81, No. 12, December 2005, pp. 795–813.
[32] Dartigues, C., et al., “CAD/CAPP Integration Using Feature Ontology,” Concurrent Engi-neering, Vol. 15, 2007, p. 237.
[33] Lima, C., et al., “A Historical Perspective on the Evolution of Controlled Vocabularies in Europe,” in Proceedings of the CIB W102 3rd International Conference, Frauenhofer IRB Verlag, Stuttgart, Germany, 2007.
[34] Guerra, J. A., and Cianchette, C., “Just-in-Time Information: A Layered Approach to In-formation Design,” Insight, Avenue A, Razorfi sh, December 2006.
[35] Omodei, M. M., et al., “More Is Better?: Problems of Self-Regulation in Naturalistic Deci-sion Settings,” in How Professionals Make Decisions, R. Montgomery, R. Lipshitz, and B. Brehmer (Eds.), Psychology Press, 2005.
[36] Lee, J.-H., and Suh, H.-W., “Ontology-Based Multi-Layered Knowledge Framework for Product Lifecycle Management,” Concurrent Engineering, Vol. 16, No. 4, December 2008, pp. 301–311.
[37] Bates, M., et al., “JIT in UK House-Building: Feasibility for Partial Implementation Using CAPM,” in Proceedings of the Second International Pan Pacifi c Conference on Construc-tion Industry Development, Singapore, October 27–29, 1999.
[38] Pheng, L. S., and Hui, M. S., “The Application of JIT Philosophy to Construction: A Case Study in Site Layout,” Construction Management & Economics, Vol. 17, No. 5, September 1999, pp. 657–668.
[39] Liu, L. Y., et al., “Capturing As-Built Project Information for Facility Management,” in Proceedings of the First Congress held in conjunction with A/E/C Systems, Washington, DC, 1994, pp. 614–612, ASCE.
[40] Song, Y., Clayton, M. J., and Johnson, R. E., “Anticipating Reuse: Documenting Buildings for Operations Using Web Technology,” Automation in Construction, Vol. 11, No. 2, Feb-ruary 2002, pp. 185–197.
[41] Lee, S. H., “Computational Fieldwork Support for Effi cient Operation and Maintenance of Mechanical, Electrical and Plumbing Systems,” Ph.D. Dissertation, Carnegie Mellon University, Pittsburgh, PA, 2009.
[42] AEX, “Automating Information Equipment Exchange,” December 12, 2004, http://www.fi atech.org/projects/idim/aex.htm.
[43] O’Sullivan, D. T. J., et al., “Improving Building Operation by Tracking Performance Met-rics Throughout the Building Lifecycle (BLC),” Energy and Buildings, Vol. 36, No. 11, 2004, pp. 1075–1090.
[44] Knuth, D. E., “Backus Normal Form vs. Backus Naur Form,” Communications of the ACM 7, Vol. 12, 1964, pp. 735–736.
[45] “Building Commissioning Guidelines,” Portland Energy Conservation, 1992, http://www.peci.org/resources/commissioning.html.
[46] Building Commissioning: The Key to Quality Assurance. Commissioning Retrofi ts and Ex-isting Buildings: Overview, Process and Case Studies, Rebuild America, U.S. Department of Energy and Portland Energy Conservation, Inc., 1998.
[47] Türkaslan-Bulbul, T., and Akin, O., “Computational Support for Building Evaluation: Em-bedded Commissioning Model,” Automation in Construction, Vol. 15, No. 4, July 2006, pp. 438–447.

159
C H A P T E R 9
Communication Protocols and Data Accessibility
9.1 Context
Modern building automation systems (BASs) are an integral part of building system operations and play a critical role in temperature and humidity control, ventilation, lighting control, and life-safety systems. They are also the principal tool for manag-ing the energy efficiency of building operations. Building automation systems are becoming more sophisticated and complex. As the nation moves toward a future “smart grid” electrical generation and distribution system, building automation will play an even more important role. Onsite electrical generation and manage-ment of building electrical loads to reduce peaks and to better match the dynamics of intermittent generation from renewable energy sources, such as wind and solar photovoltaics, will make buildings a critical partner in the national electric grid instead of being a load at the end of a wire.
Past experience has shown that, for a variety of reasons, these systems have not lived up to their potential in buildings, a problem that building commission-ing (BCx) can help to address [1, 2]. As part of the functional performance testing (FPT) phase of a BCx process, BASs provide a rich set of measurement data and tools that can be used to analyze the performance of a building’s mechanical equip-ment and associated controls. Thus, BASs are important both as targets of BCx activities and as tools to assist them.
BASs will have a key role, particularly, in the realization of embedded commis-sioning processes. The communication protocol standards that enable the inter-connection and interoperation of the equipment and controls of building systems provide a way to make the functionality of the component’s network visible and accessible. As this functionality expands to include embedded information and pro-cesses linked to BCx, communication protocols will be one of the key ways to ac-cess and execute this functionality.
160 Communication Protocols and Data Accessibility
9.1.1 What Are Communication Protocols and Why Do They Exist?
Modern building automation and control systems use what is known as direct digi-tal control technology. This terminology is derived from the evolution of building control systems. Historically, pumps, fans, dampers, boilers, and other building mechanical equipment were controlled manually, by pneumatic systems, and even-tually by systems that combined central computers with remotely connected signal multiplexing devices. The development and mass production of microprocessors provided an economical way to distribute the computing power throughout the building. These distributed systems have microprocessor-based controllers that con-trol the mechanical equipment directly, as opposed to remotely from a central loca-tion. They also use digital processing to implement the control algorithms instead of earlier analog systems. Hence the name, direct digital control (DDC).
Although the functionality of DDC systems is distributed, there is a need for the individual controllers to interact and exchange information in order to effi-ciently manage building systems and automate functions such as occupancy sched-uling, nighttime setback, optimization of subsystem components, and other energy efficiency measures. This interaction and information exchange is accomplished by linking the distributed controllers together in a communication network. Today’s building automation systems are specialized computer networks that share many of the characteristics of other kinds of computer networks used for information technology applications.
A communication protocol is a set of rules that govern how computers or microprocessors exchange information. This set of rules governs all of the details of information exchange between connected devices, including the physical charac-teristics of the network, regulating access to the network, and information content and encoding of the messages (Table 9.1). A computer communication protocol is similar to a language. The protocol rules are analogous to vocabulary, alpha-bet, spelling, punctuation, and grammar rules that enable and govern the use of a language.
9.1.2 Standardization of Communication Protocols
Within this context, a standard is defined to be a written document that establishes uniform engineering or technical criteria, methods, processes, or practices set by an authority or by general consensus. There are many national and international orga-nizations that are linked in a formal system to develop standards. The standards de-veloped by these groups can be thought of as de jure standards because they result from formally recognized due process procedures. Other standards become recog-nized by virtue of their widespread use even though they may have been developed by an individual or organization for commercial benefit. These are often called de facto standards. Sometimes a company or trade group will promote something as a “standard” even though it has neither of these features. In effect this is an effort, through marketing, to create a new de facto standard. Blurring of these distinctions is usually intentional and motivated by self-interest. Here, unless stated otherwise, “standard” means something that has been adopted by a recognized national or international authority.
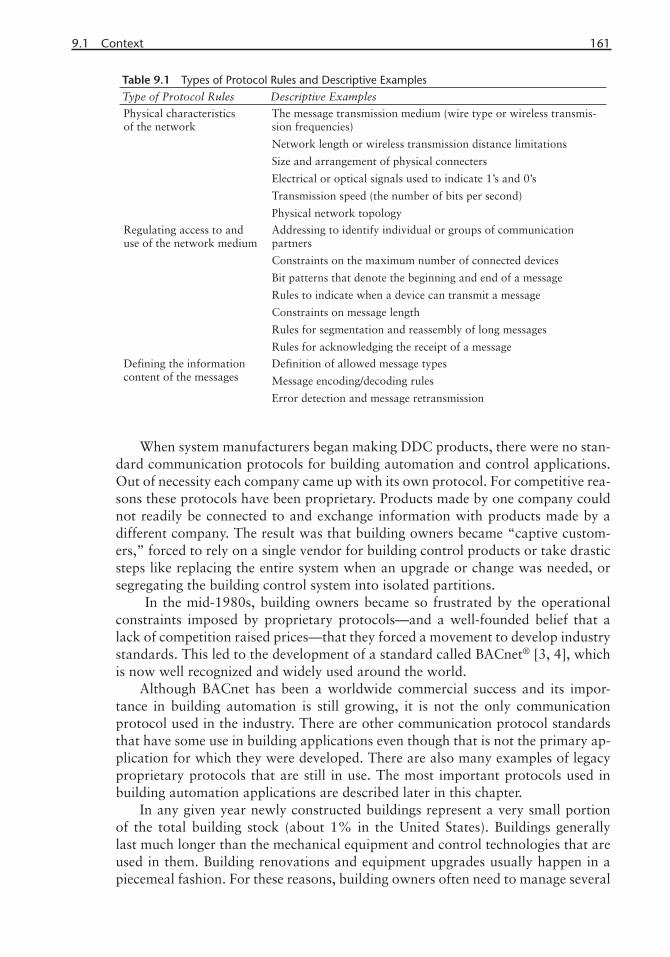
9.1 Context 161
When system manufacturers began making DDC products, there were no stan-dard communication protocols for building automation and control applications. Out of necessity each company came up with its own protocol. For competitive rea-sons these protocols have been proprietary. Products made by one company could not readily be connected to and exchange information with products made by a different company. The result was that building owners became “captive custom-ers,” forced to rely on a single vendor for building control products or take drastic steps like replacing the entire system when an upgrade or change was needed, or segregating the building control system into isolated partitions.
In the mid-1980s, building owners became so frustrated by the operational constraints imposed by proprietary protocols—and a well-founded belief that a lack of competition raised prices—that they forced a movement to develop industry standards. This led to the development of a standard called BACnet® [3, 4], which is now well recognized and widely used around the world.
Although BACnet has been a worldwide commercial success and its impor-tance in building automation is still growing, it is not the only communication protocol used in the industry. There are other communication protocol standards that have some use in building applications even though that is not the primary ap-plication for which they were developed. There are also many examples of legacy proprietary protocols that are still in use. The most important protocols used in building automation applications are described later in this chapter.
In any given year newly constructed buildings represent a very small portion of the total building stock (about 1% in the United States). Buildings generally last much longer than the mechanical equipment and control technologies that are used in them. Building renovations and equipment upgrades usually happen in a piecemeal fashion. For these reasons, building owners often need to manage several
Table 9.1 Types of Protocol Rules and Descriptive ExamplesType of Protocol Rules Descriptive Examples
Physical characteristicsof the network
The message transmission medium (wire type or wireless transmis-sion frequencies)
Network length or wireless transmission distance limitations
Size and arrangement of physical connecters
Electrical or optical signals used to indicate 1’s and 0’s
Transmission speed (the number of bits per second)
Physical network topology
Regulating access to anduse of the network medium
Addressing to identify individual or groups of communication partners
Constraints on the maximum number of connected devices
Bit patterns that denote the beginning and end of a message
Rules to indicate when a device can transmit a message
Constraints on message length
Rules for segmentation and reassembly of long messages
Rules for acknowledging the receipt of a message
Defining the informationcontent of the messages
Definition of allowed message types
Message encoding/decoding rules
Error detection and message retransmission

162 Communication Protocols and Data Accessibility
generations of equipment and technology at the same time. Accomplishing this task sometimes requires the use of communication protocol translators or gateways.
9.1.3 Protocol Gateways or Translators
A communication protocol translator is called a gateway. “Protocol translation, like language translation, is an imperfect art. Concepts that are easily and clearly expressed in one language or protocol may be difficult or even impossible to trans-late into another” [5]. Sometimes a concept is represented in a much more detailed and nuanced way in one protocol than the other. These factors are a significant challenge to gateway designers who must consider the unintended consequences of missing or misinterpreted information. The usual result is a reduction in scope to the simplest and clearest information that can be translated, thereby significantly limiting the connectivity.
Gateways are sometimes confused with routers, which are also used to connect different networks. A router is a simpler device than a gateway. A router’s job is to forward a message to the next network in the path between the source and the destination device. This can involve changes in networking technologies that affect addressing, packet format, electrical signals, transmission speed, error detection, and other communication details but it does not involve translating the message be-cause the application messages are the same on both networks, as illustrated in Fig-ure 9.1. The content of the message does not change even though the addressing, signaling, and framing change. In a gateway the data must also be translated [5].
To make the distinction between a router and a gateway clear, consider “send-ing a letter through an interoffice mail system or through the postal service. The same letter can be sent either way, although the type of envelope, the necessary ad-dressing information” and the transport details are different. “Using this analogy, a router removes the letter from the interoffice envelope, puts it in a postal service envelope, addresses the envelope, and sends it on its way. The content of the letter
Figure 9.1 A BACnet router connecting an Ethernet LAN to an MS/TP LAN.

9.2 An Overview of Communication Protocols Commonly Used in Building Automation 163
itself remains unchanged” [5]. A gateway performs all of the functions of a router but, in addition, must translate the letter from, say, English to Mandarin [5].
Although gateways are sometimes necessary and beneficial, they always add complexity and can be a source of significant problems. Table 9.2 summarizes the benefits and limitations of using gateways. From a BCx perspective gateways pres-ent two distinct challenges. The first is ensuring that a specification is written in a very tight and enforceable way before the system is procured. The second challenge is developing and administering an FPT protocol to verify that the gateway meets all of the details of the specification. A more detailed discussion of gateways for building automation applications can be found in [5].
9.2 An Overview of Communication Protocols Commonly Used in Building Automation
9.2.1 BACnet®
The name BACnet is shorthand for Building Automation and Control networks. It is the only communication protocol standard in the world that was developed spe-cifically for commercial building control applications. It was originally published as an American national standard by the American Society of Heating, Refrigerating, and Air-Conditioning Engineers (ASHRAE) in 1995. Since that time, it has been adopted as a European standard, a world standard, and a national standard in more than 30 countries around the world [3, 4]. It has also been adopted in the United States as part of the suite of standards that will enable a future smart grid [6]. Open-source implementations and protocol analyzer tools are also available [7].
The BACnet standard was designed to evolve with technological advances. ASHRAE maintains a standing committee of building control experts from around the world that oversees maintenance of the standard. Coordination of revisions to the ASHRAE standard with the international versions is done through ISO Tech-nical Committee 205, Building Environment Design. ASHRAE also maintains a companion standard that defines product tests for conformance to BACnet that is also adopted and used throughout the world [8, 9].
BACnet interest groups have formed in various countries around the world to provide education and promote the use of this technology [10]. There is an inter-nationally recognized testing and certification program for BACnet products [11].
Table 9.2 Summary of Gateway Benefits and Limitations [5]Gateway Benefits Gateway Limitations
Provides connectivity that may otherwise be impossible
May expand options for competitive bidding
Provides a point of isolation between two largely independent systems
Permits interconnectivity of legacy systems with newer products
Limited capacity and expandability
Limited ability to translate dissimilar concepts
Configuration and programming of devices through the gateway is generally not possible
Failure results in communication loss between all devices on opposite sides of the gateway
Possible time delay or the return of cashed data that is old
More difficult to troubleshoot problems

164 Communication Protocols and Data Accessibility
All major manufacturers of building automation systems in the world make and sell BACnet products [12]. Increasingly, manufacturers of building equipment and components make their products with embedded BACnet controls for integration into a larger building system. The growth in the number of BACnet vendors over time is shown in Figure 9.2.
The key design feature of BACnet is that the content of the information to be exchanged is distinct from the mechanisms used to deliver the information. BACnet defines an object-oriented model of the information that needs to be exchanged. Each object has a set of attributes or properties that describe the key information that is to be made visible over the network. BACnet defines a rich set of data ob-jects that includes analog inputs and outputs, binary inputs and outputs, trends, schedules, control loops, life-safety system components, electrical load control, and many others.
From the perspective of the communication network, a BACnet device is a collection of BACnet objects. The object model is combined with a set of appli-cation services or messages that enable the properties of these objects to be read or manipulated, indicating and responding to building system alarms and events and various types of system configuration and maintenance. The modular, object-oriented design allows the features and capabilities of BACnet to be extended in a backward-compatible way through the definition of new objects and, when needed, additional application services. BACnet object building blocks can be combined to represent a device as simple as a temperature sensor or as complex as an industrial chiller.
In principle, BACnet messages can be conveyed over any communication net-work. In practice, the standard defines a specific set of networking technologies that offer a range of cost and performance trade-offs. It also provides a way to
Figure 9.2 Growth in registered BACnet vendors.
9.2 An Overview of Communication Protocols Commonly Used in Building Automation 165
interconnect them into a single system. In a typical BACnet system, a high-speed backbone connects operator workstations with supervisory controllers that also function as routers to lower cost networks that link sensors and application-spe-cific controllers. The most commonly used backbone network is called BACnet/IP, which, as the name suggests, is a way to convey BACnet messages across an Inter-net Protocol network. BACnet also offers web service capabilities and sophisticated security features.
This collection of capabilities enables BACnet to be used in very small and simple building applications but also allows the interconnection of multiple large buildings colocated in a campus environment or geographically distributed around the world. Real-world examples of both exist and require the sort of functionality provided by BACnet.
9.2.2 Modbus
Modbus is an example of a de facto communication protocol standard. It was originally developed in 1979 by a company called Modicon, which is today a part of Schneider Electric. Modicon was founded by an entrepreneur named Richard Morley (the name Modicon is derived from Morley Digital Controls), who was an early pioneer in digital control systems. A decade later, Dick Morley became an early member and contributor to the ASHRAE BACnet committee.
Modbus was developed as a simple master–slave protocol to link programma-ble logic controllers (PLCs) used in industrial applications such as factory machin-ery control and assembly lines. PLCs are designed to operate reliably and safely in conditions harsher than typical building control applications and include features such as the ability to operate in extended temperature ranges, immunity to electri-cal noise, resistance to vibration and impacts, and circuitry designed to operate safely in explosion hazard environments. PLCs are also used in “hard-real-time” applications where response to an input condition must be within a bounded time or unintended operations will result.
Modbus is one of the most widely used protocols in industrial manufacturing. It is also used in supervisory control and data acquisition (SCADA) systems for applications such as electrical power generation, water treatment, and oil refining. Its widespread use, even though its origin was a public specification produced by a single company, makes it a clear de facto standard.
Modbus is a character-based, multi-drop serial protocol originally designed for use over simple twisted-pair point-to-point (RS-232) or multi-drop (RS-485) networks [13, 14]. More modern extensions include the use of other networking technology and Modbus TCP/IP (Transmission Control Protocol/Internet Proto-col), which provides a way to convey Modbus messages over IP networks. A mes-sage consists of the receiver’s address, a simple function code, a data block, and an error check value. There are 255 possible function codes but not all devices support all codes.
Modbus defines several types of data registers that are mapped on a device in ways specific to the application. The protocol provides a way to read values from and in some cases write values to these registers. The application meaning of the data is not defined by the standard. Modbus is supported by an industry
166 Communication Protocols and Data Accessibility
organization called the Modbus Association [15]. The specification and various tools and sample implementations are freely available.
Modbus has very limited application in building automation. Because of its simplicity and widespread use, it is primarily used as a way to create a gateway for integrating a specific product into a building’s automation system based on BACnet or some other protocol.
9.2.3 LonTalk
LonTalk is a communication protocol developed for local operating networks by the Echelon Corporation in the 1990s. In order for the technology to benefit from the economies of mass production, its concept is to provide a simple protocol that can be implemented on a custom, microprocessor chip that would be applicable to a wide range of control applications. The chip that implemented the upper layers of the protocol stack could be combined with a range of transceivers to accommo-date different physical media including twisted-pair wiring, power line carrier, and infrared. Originally, the technology required the use of a specific microprocessor chip called a neuron. Over time, the hardware options expanded. Also, over time, a tunneling mechanism was developed to convey LonTalk messages over IP networks in order to link small local networks into a larger system.
The LonTalk protocol was formally adopted as an American national standard by the Electronics Industries Association for home automation applications and today, the standard is maintained by the Consumer Electronics Association (CEA). The CEA 709 series of standards defines the basic protocol [16] and the physical media–specific options [17–19]. CEA 852 defines the associated IP tunneling pro-tocol [20]. In Europe, the CEA 709 standards have been adopted with name and scope changes as the EN 14908 series for building automation applications. The CEA 709 standards are one of several local-area networking options supported in the BACnet standard although this option has not been a commercial success.
The term LonTalk is often confused with the similar terms LonMark and Lon-Works. The LonTalk protocol is a generic networking protocol that is indepen-dent of any particular application. Information is exchanged through the use of a concept called shared network variable types (SNVT). LonMark International is a global industry association that promotes the use of LonTalk technology and devel-ops implementer’s agreements that define profiles of SNVTs for use in that particu-lar application domain. LonWorks is a marketing name used to represent the set of microprocessor chips, development tools, and product configuration tools used to commercialize the LonTalk technology.
LonWorks technology is used in a wide range of commercial and industrial control application areas including automotive, electrical machinery, food process-ing, materials handling, conveying and tracking systems, oil and gas, paper and pulp, semiconductor electronics, wastewater treatment, street lighting, electric me-tering, and building automation. The LonTalk protocol is included as part of the suite of standards that will enable a future smart grid [6].
In the building automation system market, all of the companies who developed LonTalk products have since added a BACnet product line to remain competitive in the face of growing demand for BACnet products. Although this suggests the

9.3 Design Phase Commissioning Considerations for BACnet Systems 167
growing strength of BACnet, it does not necessarily indicate an end to the use of LonTalk in the building automation market. The widespread use of LonTalk prod-ucts in other industries suggest that it will be viable to maintain building automa-ton product lines as long as there is a market demand for them.
9.2.4 KNX
KNX is a communication protocol for home and building electronic systems that was derived in the late 1990s from a combination of three predecessor protocols used in Europe for home automation applications. Those protocols are Batibus, primarily used in France, Italy, and Spain; the European Installations Bus (EIB), primarily used in German-speaking and northern European countries; and Euro-pean Home Systems (EHS), primarily used by manufacturers of white goods. The KNX protocol is based on the communication stack of EIB, which was expanded to include physical layers derived from the other protocols. It includes options for wired twisted-pair, power line carrier, infrared, and an Ethernet-based IP option. The most commonly used physical layer is the wired twisted-pair.
The KNX specification is made up of multiple parts, which were published by the KNX Association in 2002. Over time, the KNX specification and its enhance-ments have been formally adopted as standards. The basic protocol stack and the various media options were adopted as European standards in the CENELEC EN 50090 series [21]. In 2006 these CENELEC standards were adopted as world stan-dards in the ISO/IEC 14543-3 series [22]. In Europe a variation of the KNX stan-dards was adopted specifically for building automation applications by CEN as the EN 13321 series of standards.
The KNX technology is primarily used in Europe for home applications includ-ing lighting control, blind and shutter control, security, and HVAC control. The standards have also been adopted in Canada and China. There is a fuzzy boundary between control technology used in homes and small commercial buildings, and KNX can be found in both. In 2004, the KNX Association, in cooperation with the ASHRAE BACnet committee, developed a gateway mapping specification to enable integration of KNX devices with a BACnet building automation system.
The KNX Association is an industry support group that has affiliated national groups in many European countries. The association has a technical board that oversees maintenance of the protocol and also an independent testing and certifi-cation process for KNX products. The association also has a marketing board for promoting use of the technology.
9.3 Design Phase Commissioning Considerations for BACnet Systems
Commissioning is a quality-oriented process that ideally begins at the inception of a construction process and continues through construction and into the operation of the building. A summary of international commissioning practices is contained in the work of the International Energy Agency Annexes 40 and 47 reviewed in Chapter 3. An early part of that process is documenting the owner’s requirements and ensuring that clear specifications are created that match those requirements.
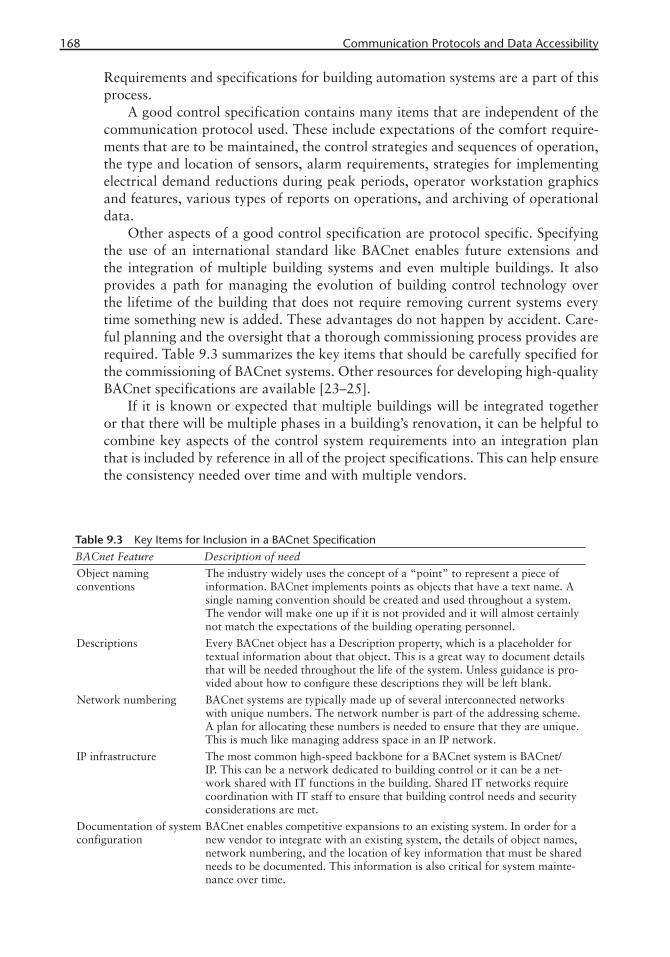
168 Communication Protocols and Data Accessibility
Requirements and specifications for building automation systems are a part of this process.
A good control specification contains many items that are independent of the communication protocol used. These include expectations of the comfort require-ments that are to be maintained, the control strategies and sequences of operation, the type and location of sensors, alarm requirements, strategies for implementing electrical demand reductions during peak periods, operator workstation graphics and features, various types of reports on operations, and archiving of operational data.
Other aspects of a good control specification are protocol specific. Specifying the use of an international standard like BACnet enables future extensions and the integration of multiple building systems and even multiple buildings. It also provides a path for managing the evolution of building control technology over the lifetime of the building that does not require removing current systems every time something new is added. These advantages do not happen by accident. Care-ful planning and the oversight that a thorough commissioning process provides are required. Table 9.3 summarizes the key items that should be carefully specified for the commissioning of BACnet systems. Other resources for developing high-quality BACnet specifications are available [23–25].
If it is known or expected that multiple buildings will be integrated together or that there will be multiple phases in a building’s renovation, it can be helpful to combine key aspects of the control system requirements into an integration plan that is included by reference in all of the project specifications. This can help ensure the consistency needed over time and with multiple vendors.
Table 9.3 Key Items for Inclusion in a BACnet SpecificationBACnet Feature Description of need
Object naming conventions
The industry widely uses the concept of a “point” to represent a piece of information. BACnet implements points as objects that have a text name. A single naming convention should be created and used throughout a system. The vendor will make one up if it is not provided and it will almost certainly not match the expectations of the building operating personnel.
Descriptions Every BACnet object has a Description property, which is a placeholder for textual information about that object. This is a great way to document details that will be needed throughout the life of the system. Unless guidance is pro-vided about how to configure these descriptions they will be left blank.
Network numbering BACnet systems are typically made up of several interconnected networks with unique numbers. The network number is part of the addressing scheme. A plan for allocating these numbers is needed to ensure that they are unique. This is much like managing address space in an IP network.
IP infrastructure The most common high-speed backbone for a BACnet system is BACnet/IP. This can be a network dedicated to building control or it can be a net-work shared with IT functions in the building. Shared IT networks require coordination with IT staff to ensure that building control needs and security considerations are met.
Documentation of system configuration
BACnet enables competitive expansions to an existing system. In order for a new vendor to integrate with an existing system, the details of object names, network numbering, and the location of key information that must be shared needs to be documented. This information is also critical for system mainte-nance over time.
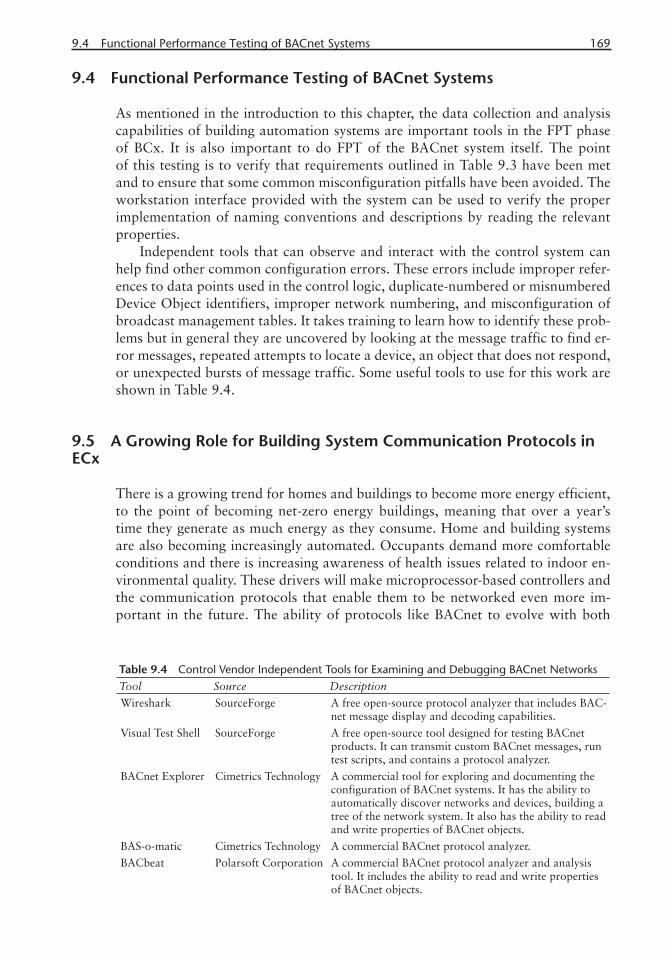
9.4 Functional Performance Testing of BACnet Systems 169
9.4 Functional Performance Testing of BACnet Systems
As mentioned in the introduction to this chapter, the data collection and analysis capabilities of building automation systems are important tools in the FPT phase of BCx. It is also important to do FPT of the BACnet system itself. The point of this testing is to verify that requirements outlined in Table 9.3 have been met and to ensure that some common misconfiguration pitfalls have been avoided. The workstation interface provided with the system can be used to verify the proper implementation of naming conventions and descriptions by reading the relevant properties.
Independent tools that can observe and interact with the control system can help find other common configuration errors. These errors include improper refer-ences to data points used in the control logic, duplicate-numbered or misnumbered Device Object identifiers, improper network numbering, and misconfiguration of broadcast management tables. It takes training to learn how to identify these prob-lems but in general they are uncovered by looking at the message traffic to find er-ror messages, repeated attempts to locate a device, an object that does not respond, or unexpected bursts of message traffic. Some useful tools to use for this work are shown in Table 9.4.
9.5 A Growing Role for Building System Communication Protocols in ECx
There is a growing trend for homes and buildings to become more energy efficient, to the point of becoming net-zero energy buildings, meaning that over a year’s time they generate as much energy as they consume. Home and building systems are also becoming increasingly automated. Occupants demand more comfortable conditions and there is increasing awareness of health issues related to indoor en-vironmental quality. These drivers will make microprocessor-based controllers and the communication protocols that enable them to be networked even more im-portant in the future. The ability of protocols like BACnet to evolve with both
Table 9.4 Control Vendor Independent Tools for Examining and Debugging BACnet NetworksTool Source Description
Wireshark SourceForge A free open-source protocol analyzer that includes BAC-net message display and decoding capabilities.
Visual Test Shell SourceForge A free open-source tool designed for testing BACnet products. It can transmit custom BACnet messages, run test scripts, and contains a protocol analyzer.
BACnet Explorer Cimetrics Technology A commercial tool for exploring and documenting the configuration of BACnet systems. It has the ability to automatically discover networks and devices, building a tree of the network system. It also has the ability to read and write properties of BACnet objects.
BAS-o-matic Cimetrics Technology A commercial BACnet protocol analyzer.
BACbeat Polarsoft Corporation A commercial BACnet protocol analyzer and analysis tool. It includes the ability to read and write properties of BACnet objects.

170 Communication Protocols and Data Accessibility
increasing expectations and advancing computer technology will prove to be criti-cally important.
As intelligence becomes increasingly embedded in automated systems, their role in the ECx process will grow. These systems already provide a primary means for BCx agents to see and understand the performance of building systems. The performance expectations of the future will only be met if BCx processes become part of this embedded intelligence and automated assistance becomes a part of the ECx process.
Historically, building codes standards have primarily been about public safety. They ensure that buildings do not fall down in storms and have reasonable fire protection features. Future code requirements will also establish minimum perfor-mance requirements for energy efficiency and environmental quality. They may even require minimum standards for building automation and ECx.
References
[1] NSTC, Federal Research and Development Agenda for Net-Zero Energy, High-Perfor-mance Green Buildings, Report of the Subcommittee on Buildings and Technology Research and Development, National Science and Technology Council Committee on Technology, 2008.
[2] DOE, “Energy Impact of Commercial Building Controls and Performance Diagnostics: Market Characterization, Energy Impact of Building Faults and Energy Savings Potential,” Report No. D0180, prepared for the DOE Building Technologies Program, 2005.
[3] ANSI/ASHRAE, BACnet: A Data Communication Protocol for Building Automation and Control Networks, ANSI/ASHRAE Standard 135, American Society of Heating, Refriger-ating, and Air-Conditioning Engineers, 2010.
[4] EN/ISO, Building Automation and Control Systems—Part 5: Data Communication Proto-col, EN/ISO 16484-5, International Organization for Standardization, 2010.
[5] Bushby, S. T., “Communication Gateways: Friend or Foe?” ASHRAE Journal, Vol. 40, No. 4, 1998, pp. 50–53.
[6] NIST, “Framework and Roadmap for Smart Grid Interoperability Standards,” Release 1.0, Special Publication 1108, National Institute of Standards and Technology, U.S. Department of Commerce, 2010.
[7] BACnet, “Open Source BACnet Projects,” http://www.bacnet.org/Developer/index.html, 2011.
[8] ANSI/ASHRAE, Method of Test for Conformance to BACnet, ANSI/ASHRAE Standard 135.1, American Society of Heating, Refrigerating, and Air-Conditioning Engineers, 2009.
[9] EN/ISO, Building Automation and Control Systems—Part 6: Data Communication Con-formance Testing, EN/ISO 16484-6, 2009.
[10] SSPC 135, “BACnet Interest Groups,” http://www.bacnet.org/Contact/Groups.htm, 2011. [11] BACnet International, “BACnet Product Testing,” http://www.bacnetinternational.net/btl,
2011.[12] SSPC 135, “BACnet Vendor IDs,” http://www.bacnet.org/VendorID/index.html, 2011[13] EIA/TIA, Interface Between Data Terminal Equipment and Data Circuit-Terminating
Equipment Employing Serial Binary Data Interchange, EIA/TIA Standard 232-E, Elec-tronic Industries Association, 1991.
[14] EIA/TIA, Electrical Characteristics of Generators and Receivers for Use in Balanced Digital Multipoint Systems, EIA/TIA Standard 485, Electronic Industries Association, 2003.
[15] Modbus Association, http://www.modbus.org, 2011.

9.5 A Growing Role for Building System Communication Protocols in ECx 171
[16] ANSI/CEA, Control Network Protocol Specifi cation, ANSI/CEA Standard 709.1-C, Con-sumer Electronics Association, 2010
[17] ANSI/CEA, Fiber-Optic Channel Specifi cation, ANSI/CEA Standard 709.4, Consumer Electronics Association, 1999.
[18] ANSI/CEA, Free-Topology Twisted-Pair Channel Specifi cation, ANSI/CEA Standard 709.3 R2004, Consumer Electronics Association, 2004.
[19] ANSI/CEA, Control Network Power Line (PL) Channel Specifi cation, ANSI/CEA Standard 709.2-A R2006, Consumer Electronics Association, 2006.
[20] ANSI/CEA, Enhanced Protocol for Tunneling Component Network Protocols over Inter-net Protocol Channels, ANSI/CEA Standard CEA-852.1, Consumer Electronics Associa-tion, 2010.
[21] CEN, “Home and Building Electronic Systems (HBES),” EN 50090, Committee for Euro-pean Normalization, 2003.
[22] ISO/IEC, Information Technology—Home Electronic Systems (HES) Architecture—Part 3-1: Communication Layers—Application Layer for Network Based Control of HES Class 1, ISO/IEC 14543-3, International Organization for Standardization, 2006.
[23] Bushby, S. T., Newman, H. M., and Applebaum, M. A., GSA Guide to Specifying Interop-erable Building Automation and Control Systems Using ANSI/ASHRAE Standard 135-1995, BACnet, NISTIR 6392, National Institute of Standards and Technology, 1999.
[24] Haakenstad, L. K., “How to Specify BACnet-Based Systems Engineered Systems,” ASHRAE Journal, Vol. 14, No. 6, pp. 46–55, 1997.
[25] Tom, S., “A Simple Way to Specify BACnet, BACnet Today,” Supplement to ASHRAE Journal, Vol. 47, No. 11, pp. B27–31, 34, 2005.


173
C H A P T E R 1 0
Building Codes
10.1 Introduction to Building Codes and Standards
Building codes and standards specify a minimal set of requirements for buildings to ensure that building designs achieve an acceptable level of safety and quality. Regulatory agencies, which adopt model codes or create their own codes, do so to protect public health and safety and sustain the welfare of the general public by regulating and controlling the design, construction, and use of buildings within their jurisdiction.
The idea of controlling the construction of structures by creating governmental regulations is not a recent phenomenon. Codes evolved from the very early ages of humanity. The body of knowledge in building codes is usually a product of ex-perience gained from disasters and afterthoughts of a tragedy. One of the earliest examples of community-wide requirements was observed in the ancient Babylo-nian Empire in the Code of Hammurabi, which held home builders liable: “If a builder build[s] a house for someone, and does not construct it properly, and the house which he built fall[s] in and kill[s] its owner, then that builder shall be put to death” [1].
Widespread loss of life from natural disasters, such as earthquakes, tsunamis, floods, and hurricanes, and human-made hazards, such as fire and poor design, have led affected communities to research, standardize, and enforce best practices to reduce the impacts of such disasters and hazards. Even though it is not possible to eliminate all of the risks associated with buildings, pervasive utilization of stan-dards can potentially reduce the risks to an acceptable level.
In the first section of this chapter we present some basic knowledge about building codes and standards. The processes in which the codes and standards are created and used are then described in Section 10.2. Some of the earlier efforts related to the computerization of the codes and standards are discussed in Section 10.3, and more recent approaches are described in Section 10.4. We conclude this chapter by describing the remaining challenges related to the digitization of codes and standards.
174 Building Codes
10.1.1 Nature of Codes
Building code documents consist of several parts that focus on different elements of structures. The main body of the documents has a hierarchical nature (e.g., decom-posed into sections, subsections, clauses, and subclauses) reflecting the classification of building elements within the code context. Such structuring enables the reader to identify and parse more easily the specific and relevant parts of the document. However, to do so efficiently requires a familiarization period. Apart from the main body of the code documents, there are sections for clarifying the meanings of do-main terms and abbreviations, as well as sections describing informative references and appendices of more detailed information. The terminology definition sections are of great importance during this familiarization period since users of building codes may not necessarily be familiar with the domain terminology. The magnitude of terminology and the level of detail of the definitions may still be limited for some of the users with less knowledge of the building domain.
As building research progresses, there is a need to update some parts of the building codes according to the new research findings and emerging building tech-nologies. Hence, building codes have a dynamic nature and are subject to frequent changes via addendums or newer versions. Building codes are not self-sufficient documents [2]. Kılıççöte and Garrett classify the knowledge not explicitly expressed in the building codes into three groups: knowledge about the world, knowledge about the domain, and knowledge accumulated in other domain documents, in-cluding other building codes. The first group is the information every person is supposed to know, which is usually referred as “common sense,” for example, concepts of time and space. The second group is the specialized information that is relevant in the building domain. For example, understanding energy-efficiency codes requires knowledge about what components make up a “building envelope” and how “thermal bridges” in the building envelope affect the energy performance of the building. The last group is the regulatory information that is not included in the building code itself, but to which there are references, such as references to other building codes and standards. In addition to the primary content of the build-ing codes, supplements, guidelines, and amendments are also an important part of this kind of regulatory information.
10.1.2 Purpose of Codes
Implementation of building codes yields several advantages. First of all, they pro-tect the health, safety, and welfare of the public by ensuring an acceptable level of safety and quality of buildings. While choosing a building for occupancy, a major-ity of buyers are likely to have neither the knowledge necessary to comprehensively evaluate the design and the future building performance, nor the willingness to hire a consultant possessing such knowledge to conduct the evaluation. Redundant ef-forts would result in unnecessary costs if each potential buyer of a building were to perform this kind of analysis. Building codes provide a degree of risk reduction, and thus increased confidence, to buyers in terms of the safety and quality of buildings. They provide some degree of expected building performance by the construction industry for all buildings and components within those buildings. Such expectations

10.1 Introduction to Building Codes and Standards 175
also enable the members of the construction supply chain to conduct business with each other more effectively.
There is also a liability perspective to building codes. Public and private enti-ties, as well as individuals, can be held accountable when they allow an unsafe situ-ation to persist. Injured individuals will have grounds to file a liability claim against the negligent parties who created a situation that resulted in injury and loss of life or property. Hence, if these entities or individuals adopt and adhere to a standard set of building codes, they will be deemed as being aware of and following known best practices, which may help avoid claims of liability for injuries sustained during building failure.
Adoption of the building codes that reflect the state of the art of research and practice is necessary, but not sufficient, to achieve the full value of these codes. They have little value when not enforced by qualified, trained, and certified plan review-ers and building inspectors. Hence, the building permitting departments in most municipalities have the responsibility of ensuring that the building codes they adopt are current and of enforcing adherence to those codes within their jurisdiction.
10.1.3 Types of Codes and Code Organizations
Some countries separate the development and maintenance of codes and standards from their enactment. In this case, national code and standards organizations de-velop and maintain codes, and local authorities (such as municipal building depart-ments) adopt and enforce compliance with adopted codes and standards. In the United States, the American Society of Heating, Refrigerating and Air-Conditioning Engineers (ASHRAE) and the International Code Council (ICC) are examples of national organizations committed to developing and maintaining national codes and standards, referred to as model building codes. Model building codes are rec-ommended baseline documents made available to local building authorities with jurisdiction for code enforcement and the authority to formally adopt and modify model codes for use in that jurisdiction. States are free to adopt model codes fully or partially, make amendments to model codes, or develop their own codes. In many cases, counties and cities within these states are able to further amend the codes they adopt. Considering the large number of jurisdictions in the United States, uni-formity of codes throughout the nation is important to eliminate redundant time and effort spent on development and maintenance of the codes and on the educa-tion and training of the building inspectors, plan reviewers, designers, and other code users. For a more detailed discussion of the taxonomy of building regulations, we refer the reader to the work of Kılıççöte [37, 38, 40].
To promote innovation and use of new research and technology, there has been a recent move toward performance-based requirements as opposed to the traditional procedural and prescriptive language of codes. Rather than express-ing the objectives of a given requirement within a code, many existing building codes usually either require compliance with outlined procedures in the design of a component or prescribe specific details and dimensions on products and approved processes. This approach significantly increases the volume of the building code documents, restricts change and innovation in design, and requires frequent up-dates to code documents. Performance-based requirements, however, specify a set of performance objectives that all buildings must meet. They do not specify how
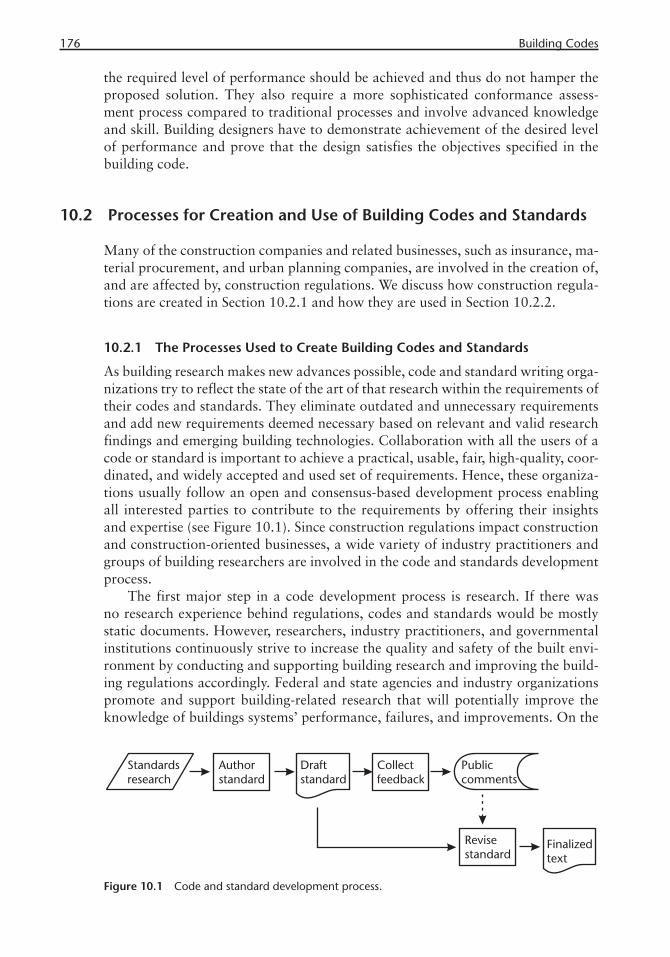
176 Building Codes
the required level of performance should be achieved and thus do not hamper the proposed solution. They also require a more sophisticated conformance assess-ment process compared to traditional processes and involve advanced knowledge and skill. Building designers have to demonstrate achievement of the desired level of performance and prove that the design satisfies the objectives specified in the building code.
10.2 Processes for Creation and Use of Building Codes and Standards
Many of the construction companies and related businesses, such as insurance, ma-terial procurement, and urban planning companies, are involved in the creation of, and are affected by, construction regulations. We discuss how construction regula-tions are created in Section 10.2.1 and how they are used in Section 10.2.2.
10.2.1 The Processes Used to Create Building Codes and Standards
As building research makes new advances possible, code and standard writing orga-nizations try to reflect the state of the art of that research within the requirements of their codes and standards. They eliminate outdated and unnecessary requirements and add new requirements deemed necessary based on relevant and valid research findings and emerging building technologies. Collaboration with all the users of a code or standard is important to achieve a practical, usable, fair, high-quality, coor-dinated, and widely accepted and used set of requirements. Hence, these organiza-tions usually follow an open and consensus-based development process enabling all interested parties to contribute to the requirements by offering their insights and expertise (see Figure 10.1). Since construction regulations impact construction and construction-oriented businesses, a wide variety of industry practitioners and groups of building researchers are involved in the code and standards development process.
The first major step in a code development process is research. If there was no research experience behind regulations, codes and standards would be mostly static documents. However, researchers, industry practitioners, and governmental institutions continuously strive to increase the quality and safety of the built envi-ronment by conducting and supporting building research and improving the build-ing regulations accordingly. Federal and state agencies and industry organizations promote and support building-related research that will potentially improve the knowledge of buildings systems’ performance, failures, and improvements. On the
Figure 10.1 Code and standard development process.

10.2 Processes for Creation and Use of Building Codes and Standards 177
other hand, the role of industry practitioners is to contribute and give feedback to the code development process by applying their knowledge and practical experi-ence in using and maintaining these systems. Gathering feedback from all the users of a code is fundamentally important for ensuring the inclusiveness and usability of the building code or standard.
The second major step is authoring of codes and standards, which is done by code and standards organizations. Authorities with jurisdiction to author their own codes and standards may do so instead of using model codes. The code and standards authoring organizations consist of technical committees that specialize in different subdomains of codes and standards. The deliberations of the technical committees are usually open to the public, but the organizations will usually apply restrictions about voting membership and ability to approve changes to the code. Authoring committees are typically responsible for a certain subdomain, which is typically addressed by a major section in a code. All industry stakeholders are invited to propose new requirements for the technical committees to consider for adoption into the code. After the committees finish writing their respective sec-tions, all the sections are compiled into a full draft, which is then published to elicit public review and commentary.
The final major step is for receiving feedback and revision, in which comments from industry professionals on the published draft version of the code document are sought. After they publish the draft version, code writing organizations typi-cally conduct a public hearing after allowing for some amount of review time [3]. The proposed changes are presented for debate and discussion and during the hear-ing a balanced discussion among representative stakeholders is sought. Then the technical authoring committees decide and make transparent recommendations by considering all views that emerge during the hearing. After the hearing for public review is complete, the results are published in a timely fashion. Finally, a final ac-tion hearing is conducted, where the voting members of the technical committees make their final decisions before promulgating the code. In doing so, the technical committees review the proposed changes as well as the recommendations from the public hearings. Following the action hearings, the proposed changes are incorpo-rated into the new editions of codes and standards, which are then published for adoption and use by the numerous U.S. jurisdictions that regulate buildings.
10.2.2 The Processes in Which These Codes and Standards Are Used
A building code becomes the regulatory law of a state when the authority with ju-risdiction formally adopts and enacts it. At that point, the code becomes an integral part of the permitting, certification, and inspection process. Designers, building officials, building inspectors, and other potential users of the building code must be trained following the adoption of a new model code or a new version of an exist-ing model code. The diversity, complexity, volume, and dynamic nature of building codes add significant challenges to user training.
The major groups of users are designers and capital project reviewing building officials. Typical questions posed by these groups are “Which regulations and which specific provisions apply to the building design we are reviewing?” and “Does the building design comply with the applicable regulations?” [4] Delivering correct and timely answers to these questions, usually called conformance assessment, becomes
178 Building Codes
a challenge given the aforementioned dynamic nature of codes and standards. Apart from the plan review for building permitting, periodically building officials also inspect the construction of permitted buildings and issue occupancy permits after verification of code compliance during the final inspection.
The building code requirements usually enter into the building design process as hard constraints, although some codes also allow trade-offs. Considering code-related constraints, as well as other constraints, such as design specifications, de-signers make detailed decisions about the aspects of their design and then apply to authorities with jurisdiction to obtain a review of proposed building designs and building permits. Building officials perform conformance assessment against the applicable code and then issue building permits upon demonstration of compliance with all applicable requirements in that code. Unfortunately, this process is usually iterative and time consuming due to the complex nature of codes and standards [5–7]. The requirements expressed in the natural language versions typically con-tain ambiguities leading to differing interpretations. Some requirements may be completely missed due to manual checking procedures based on text versions of codes and standards. Hence, what may be considered compliant by a designer may be considered noncompliant by the building officials. These problems cause delays in the permitting process and sometimes result in safety hazards. To address this issue, a great deal of research and development has been carried out on the creation and use of building codes via computer-based approaches.
Because both codes and building commissioning (BCx) protocols ensure that building systems function as intended, building codes also have an impact on BCx. Codes are mandated by governmental organizations to address the building design phase, whereas the BCx process is initiated by building owners to ensure that the design complies with building system function objectives. A building owner works with a BCx authority to prepare commissioning protocols and to document the owner’s project requirements. The detailed procedures of functional performance tests (FPT) in commissioning are derived from sources similar to those in codes of practice, including research specifying performance expectations for buildings, standards, guidelines [8, 9], and manuals describing system start-up procedures and operations. Hence, logical conditions from code provisions (and possibly other sources) appear in BCx protocols. Some codes require tests to be conducted, the results of which are checked by building officials before the approval of occupancy. These tests typically become part of BCx-FPT protocols.
10.3 History of Computer-Based Approaches for Code Creation and Use
To improve building code creation and implementation, computer-based ap-proaches have been explored to provide computerized support to the developers, maintainers, and users of the codes. Several attempts were made by academic re-searchers to improve manual code-related processes, such as finding and retrieving codes and traversing between codes [4, 10 –12]. Earlier code retrieval approaches were based on hypertext modeling of codes, which enables the traversal among codes represented on the same digital platform.
10.3 History of Computer-Based Approaches for Code Creation and Use 179
With the advent of the World Wide Web, researchers moved toward Hypertext Markup Language (HTML) to enable users to search and retrieve relevant parts of building codes using domain-independent Internet search engines. These search engines are based on indexing the web content using keywords/phrases, such as the “bag of words” approach [13], which is necessary considering the large vol-umes of text communicated through the web. This approach provides a shallow understanding of the text and is insufficient for accurately answering queries from code users, including what requirements are relevant and whether those relevant requirements are satisfied. For example, a search engine would require a keyword-based query, like “building, energy efficiency, Pennsylvania” for the query: “What are the energy efficiency requirements for my building in Pennsylvania?” Using this set of keywords to search for a set of relevant code documents would likely result in a set of documents containing many requirements irrelevant to the intended query (false positives) and missing many documents with relevant requirements that con-tain terms like “building envelope” or “U-value” rather than “energy efficiency.” Domain-specific taxonomies and more advanced search methods that provide a deeper understanding of the text are currently being used to improve the code re-quirement retrieval process. [14]
To streamline the policy-making process and increase the awareness and the participation of the public, the U.S. government established a program called elec-tronic rulemaking and began publishing proposed regulations. This has allowed the public to comment electronically via a governmental website (http://regula-tions.gov). Although the electronic rulemaking process substantially decreased the previous amount of paperwork and increased public involvement, it presents technical and political challenges to policy makers who need to analyze large vol-umes of information from a diverse set of industry stakeholders. With the help of the National Science Foundation’s (NSF) Digital Government Research Program (http://digitalgovernment.org), researchers have been investigating novel informa-tion technology approaches to help policy makers address these challenges and help their decision-making process. These novel approaches include categorization of public comments representing different opinions and stakeholders, and sum-marization of these public comments through information retrieval and natural language processing techniques [14–16].
Both code requirement retrieval and electronic rulemaking have been intro-duced to accelerate the manual processes associated with code usage while elimi-nating needless effort from code authors or users. However, they did not funda-mentally change the manner in which codes are created or used. Ideally, computers should understand the code content and facilitate semiautomation of the human participatory procedures in code creation and use. Currently, natural language un-derstanding algorithms do not provide error-free interpretation of requirements expressed in natural language–based codes. To achieve the required level of intel-ligence in the automation of regulatory processes, there is a need for formally rep-resenting the code content in a computer-interpretable form.
Formal representation of code requirements has been investigated for more than 40 years and different approaches have been explored to support a number of digital functionalities, such as automated conformance evaluation systems and automated e-approvals of building designs. So far we have briefly presented some of the earlier approaches that laid the foundation for more advanced approaches;
180 Building Codes
in the following subsections, in particular, in Section 10.4, we will present more re-cent approaches. In the absence of comprehensive taxonomies that classify building codes, a task rarely if ever attempted owing to the diversity of location, purpose, nationality, and scope of building codes, we present the six categories discussed below as an introductory taxonomy of building codes: procedural programming based, decision table based, object oriented, logic programming based, context ori-ented, and standards modeling language.
10.3.1 Procedural Programming–Based Approaches
Though still widely used, the earliest computerized building regulations were im-plemented by hardcoding the procedures of the manual conformance evaluation process into design software. In this approach, design software developers typically read the text-based regulations and tried to capture correctly the intent of the provi-sions. They then embedded their interpretation of code requirements in programs supporting building design using conventional programming languages, such as C and Fortran. Some of the earlier efforts that implemented procedural programming for computerization of building regulations have been reviewed by Vanier [17].
One of the advantages of procedural programming is its expressiveness. It can handle a variety of complex reasoning procedures that frequently appear in the conformance checking process, such as provisions modifying the applicability sta-tus of other provisions. However, an important concern with this approach is that when building codes become coupled with design software, a significant amount of reprogramming effort is required to update the code, a frequent occurrence. Given the dynamic nature of codes, often the design software becomes susceptible to code changes. Therefore, embedded code requirements typically go unverified by code and standard organizations due to the complexity of procedurally represent-ing code requirements and the programming language syntax.
10.3.2 Decision Table–Based Approaches
The problems of coupled representation of codes with software led researchers to investigate generalized code processors that separate the digital representation of code requirements from reasoning with code requirements [18]. With the advent of generalized code processing algorithms, the design software became resistant to changes in codes. The idea of decoupling was first investigated by Fenves [19] and applied to the American Institute of Steel Construction (AISC) Specification [20] by transforming the code requirements into a tabular format called a decision table (DT). A DT consists of a condition stub, which addresses the determination of ap-plicability, and an action stub, which is used to determine a set of actions to perform the requirements of the provision.
DTs enabled precise representations of code requirements that are easy to com-prehend and validate. Mapping the requirements into a tabular form made it pos-sible to easily check the consistency and completeness of the represented require-ments by observing missing columns in the DT (when no action was specified for a given set of conditions), conflicting columns in the DT (when two conflicting actions were given for the same set of conditions), or redundant columns in the DT (when the same action was listed for two related columns of conditions). Sets of
10.3 History of Computer-Based Approaches for Code Creation and Use 181
possible conditions, for which the users are unguided for code compliance, reveal gaps in policy making.
Since it would require a complex maintenance effort, it is not practical to have a singular, comprehensive DT corresponding to a complete code document. The number of conditions in a code increases exponentially with the number of condi-tion variables. In turn, these increase monotonically with the number of provisions to be represented. Hence, one must create an organization scheme for intertable relations and smaller tables. Typically a table is needed for each cluster of require-ments on a specific topic [21 , 22]. Follow-up studies were conducted to find such organizational networks and to develop an environment to assist authors in cre-ating regulation models, called the Standards Analysis, Synthesis and Expression (SASE) system [23]. These studies led to substantial changes in versions of the AISC Specification on Allowable Stress Design (ASD) requirements.
10.3.3 Object-Oriented Approaches
Although the procedural and DT-based approaches were useful and had an impact on the industry, they still required a significant amount of effort to represent the conditions and requirements of codes in DT. As researchers and software develop-ers began to develop domain models and design patterns [24] that captured the characteristics of the application domain and created easily understood and main-tained software, object-oriented programming became a dominant solution.
Garrett and Hakim [25] developed an object-oriented model of building code concepts that filled the representational gap between codes and design software. Effective use of objects for regulation and building concepts increased the reus-ability of code models and streamlined effort in handling updates and new code versions. While the approach was built on the inheritance concept, resulting in an unmanageable bushy classification hierarchy of code concepts, their work inspired subsequent research efforts [26].
10.3.4 Logic Programming–Based Approaches
Application of mathematical logic to software programming, called logic program-ming, had a significant impact on code modeling research. Logic programming has a declarative nature that is similar to the Standard Query Language (SQL) used with relational databases. These applications are suitable for cases where the users have no interest in the procedure used to generate an answer to their question; they just want the answer. For instance, is the building envelope compliant with applicable energy-efficiency code requirements? Logic programming compilers apply general-ized search strategies on a given set of facts and rules. If the rules represent energy-efficiency code requirements and the facts are the specifics of the building envelope, then the generalized search strategies of logic programming determine whether a set of facts satisfy the rules. Although the search strategy employed may be suboptimal for all specific cases compared to optimized procedures, elimination of the need to define these specific procedures for each code requirement is a significant benefit.
The first-order predicate logic approach was applied to modeling code re-quirements by several researchers [27–29]. Once the code requirements have been translated into logical statements, inferences can be made on the conformance of
182 Building Codes
buildings to these requirements using first-order logic inference engines (automated theorem proverbs). Yabuki and Law [30] extended the first generation of logical representations by making the logic representations object oriented, which natu-rally exhibits the same problems as the pure object-oriented approach. Apart from first-order logic, expert system shells were also investigated [6, 31 , 32].
A drawback of the logic-based, object-oriented systems is that nonmonotonic reasoning is required in some parts of codes. An example requirement that man-dates such reasoning would be the following energy-efficiency requirement from ASHRAE’s energy efficiency standard for buildings: “Doors that are more than one-half glass are considered fenestration” (ASHRAE 90.1 2007) [33]. In this ex-ample, a fenestrated part of an object classified as an instance of the Door class is supposed to be reclassified as an instance of the Fenestration class. In logic-based approaches, asserted facts cannot be reclassified as a different fact and instantiated objects cannot be instantiated as an instance of a different class.
Another drawback of these systems is model instability caused by the represen-tations of both the product and code being coupled and a change in the product description requiring changes in the model of the code, and vice versa. Hakim and Garrett [34] suggested a description logic–based [35] and product-oriented model of a code that solves these two problems. Description logic is an object-centered logical reasoning system (as opposed to being class centered) in which the system creates objects without restrictions of class definitions and classifies them as an instance of a class when they satisfy defined membership conditions (when a door needs to be reclassified as fenestration). Description logic provides a significant amount of flexibility and is still widely used today, as in the implementation of the OWL Web Ontology Language (http://www.w3.org/TR/owl-features) of the semantic web [36].
10.3.5 Context-Oriented Approach
Object-oriented systems rely on multiple inheritance for the creation of derived objects from source objects, resulting in deep object hierarchies. These hierarchies increase the difficulty of modeling a specific building because a significant amount of knowledge about the code must be known prior to instantiating the correct ob-ject in the model. To address this issue, Kılıççöte et al. [37] devised a new method, called context orientation, that requires minimal added effort by the user to main-tain object hierarchies. When the user inputs a set of contexts defining an object, objects derived from existing objects, called “Contexts,” are produced automati-cally by the compiler.
Although existing context-oriented systems are limited to using generalization-specialization hierarchies, the approach is also applicable to other relationships and sophisticated mappings, like holonym-meronym (also called member/group or aggregation) relationships. For example, compilers should determine instances that are members of the “Building Envelope” context without explicitly creating an object representing Building Envelopes, when the set of exterior building elements, such as “Roof,” “Foundation,” and “Exterior Wall,” are all specified to be mem-bers of the context for Building Envelope.

10.3 History of Computer-Based Approaches for Code Creation and Use 183
10.3.6 Standards Modeling Language
The systems presented thus far are limited in terms of the level of semantics that can be explicitly represented. In addition to expressiveness, Kılıççöte and Garrett [38] presented the need for isomorphic representations, approximating a one-to-one mapping between the structure of the model and the actual structure of the code (Figure 10.2). The similarity and abstraction of the domain is also important for software engineering and it is studied as a software design pattern, called low repre-sentational gap [24, 36, 39]. The initial code representing systems were also limited because the representation required pieces from different parts of the code to be incorporated into the same representational unit, such as all requirements related to the U-value of a window being represented in a DT (Figure 10.3). It is not only difficult to validate that no parts of a regulation have been missed, but also difficult to determine which parts of the model require changes when the text is updated.
Kılıççöte and Garrett [40] developed an isomorphic and context-oriented do-main-specific language, called the Standards Modeling Language (SML), for creat-ing formal models of the first and higher order logic found in building regulations. SML is basically a semantic network that treats parts of a code and its requirements and term definitions as nodes and edges. This structure allows for the use of seman-tic network reasoning mechanisms, such as graph algorithms.
SML was defined to explicitly represent isomorphically parts of a code; for instance, the SML representation followed the exact same order and structure as the code text, and was also a part of a larger framework, the Standards Process-ing Framework (SPF). SPF was also composed of the Agent Description Language (ADL) [40], which provides design systems with interfaces to a variety of reasoning agents, some of which represent higher order logical constructs, and an applica-tion programming interface, the Standards Usage Language (SUL) [40]. The SPF captures both first-order and higher order logical constructs within an isomorphic
Figure 10.2 Isomorphic approach [40].

184 Building Codes
representation of the code, and then reasons with this representation, checking conformance of a modeled building to the represented code. At that time, there was no standard building model to check for conformance to a code model in SML. Neither further development nor deployment of the SPF-based approach was completed [2].
10.4 More Recent Approaches for Supporting Code Creation and Use
More recently, a complementary and promising research activity on building in-formation modeling has provided standardized product descriptions for buildings, such as the industry foundation classes (IFCs) by buildingSMART [41] and the open Green Building XML (gbXML, Chapter 7). Prior to such efforts, approaches for computerization of building codes suffered from the lack of a standardized building representation utility. Most of the code models were limited in application to only the building model on which they were based. Standardized building descriptions have enabled computer-aided engineering researchers to investigate these problems separately. We will describe some of these approaches in the following subsections.
10.4.1 SMARTcodes Approach
The approaches presented thus far do not incorporate a simple enough syntax that can be easily used by anyone modeling a portion of a code. This is a major deter-rent for code and standards organizations trying to validate and understand these approaches. The SMARTcodes project [42] was initiated by the ICC to enable the authors of regulations to create, test, and maintain the models of their authored regulations.
Figure 10.3 Previous approaches to modeling regulations [40].

10.4 More Recent Approaches for Supporting Code Creation and Use 185
The SMARTcodes group observed that the suitability of code text is a starting point for modeling code content. Thus the model can be built by annotating rel-evant portions of the text using semantic pens to indicate which text is an instance of which code concept classes. Compliance evaluation occurs in two steps: (1) de-termining an applicable set of building components and (2) evaluating compliance with the requirements of the applicable set. The classes are chosen accordingly: the Applicability, Selection, and Exception classes for the first step, and the Require-ment class for the latter step. The Applicability class is used to annotate the set of applicable building components. The Selection class is used to define a more appro-priate group from within the applicable set. The Exception class is the opposite of the Applicability class because it handles conditions of an object’s exemption from the relevant code requirement. Requirements are mandated on the set of building components that are applicable, selected, and not exempted.
All of the semantic classes are treated as logical expressions consisting of four parts: (1) a reference to a term in the underlying dictionary, (2) the specification of a property of the reference term, (3) a comparator, and (4) a value with a speci-fied unit. These logical expressions specify a condition evaluated against a build-ing model and the system determines the set of building components that pass the condition. For example, “Buildings located in climate zone 1” can be modeled us-ing the applicability pen and the condition would refer to the term “Building,” its property “Climate Zone,” the comparator “=” and the value “1.” When the condi-tion is applied to a building in Climate Zone 1, all components of the building pass.
Within the current approach implemented in the SMARTcodes system, the mappings of the dictionary terms to the building model are hardcoded into the system, and hence the code requirement representation is not completely explicit. When additions of new dictionary terms are needed, the program code must be updated.
10.4.2 Other Approaches
Other efforts relevant to computerization of building regulations require mention-ing. CORENET is the web-based conformance evaluation and electronic permitting system of Singapore’s Building and Construction Authority [43]. The system allows the users to submit IFC-based building models and apply for electronic permits when the building conforms to the applicable building codes. CORENET was one of the leading, innovative systems that demonstrated the feasibility of electronic evaluation and permitting, though it lacks explicit code representation (Chapter 5). DesignCheck is an Australian automated compliance checking system, where the Australia Disabled Access Code is encoded as rules using the EXPRESS language. A geometry engine and semantic interpretation are used to check for code compliance of either individual object types or an entire building. It also offers multiple viewing options for interactive reporting [44]. Han et al. [45] proposed a performance-based approach for conformance evaluation of accessibility regulations using simulation of motion planning algorithms in client/server architecture. Lee [46] developed a domain-specific rule-based language for building circulation rules, called Building Environment Rule and Analysis (BERA).
186 Building Codes
10.4.3 An Approach Based on OWL
We have been evaluating the past approaches for computerization of building regu-lations and eliciting requirements to create computable models of building reg-ulations. These major requirements, many of which have been illustrated in the preceding sections of this chapter, include:
• Understandability and testability by the authors of code models;
• Isomorphism (i.e., low representational gap) between code text and code model;
• Ability to leverage standardized building descriptions;
• Explicitness (i.e., separation of code representation and processing);
• Context orientation (i.e., no need to create deep and bushy object hierarchies);
• Expressiveness (i.e., the ability of the code representation and reasoning mechanisms to handle the higher level semantics contained in the codes).
Demir et al. [39] proposed an OWL-based approach for representing and rea-soning with codes inspired from software design patterns; this suggests separation of the vocabulary term descriptions, and the mappings of these terms, from code to standardized building representations. We propose the use of OWL to simplify code representation with the application of the design patterns, such as low cou-pling and high cohesion, and increase the explicitness and expressiveness.
10.5 Remaining Challenges and Opportunities
While developing a representation for codes and standards, the organizations re-sponsible for creating, testing, maintaining, and publishing these documents must be considered [39]. The organizations must understand and test representations before publishing code documents for use by designers. They also must maintain the correctness and coverage of the computer-processible versions of codes and vocabulary as the code is updated and expanded. This is an important requirement, which suggests the need for a simple syntax for the vocabulary and code require-ment representations. However, there is a trade-off between the simplicity of the syntax and the expressiveness of the representation. As the syntax becomes simpler, the representation becomes less powerful. Hence, organizations require assistance maintaining the models of their regulations by providing advanced computerized tools to support the creation, editing, assessment, and verification of the models of codes (note that this set of needs is consistent with the original goals of SASE) [23].
With such formal models of regulations made possible by these editing tools, a variety of analyses and uses of these models can be performed. Such models could be reasoned with to create abstractions of the codes that could be used in the early stages of planning, design, and ECx. This is similar to what Garrett demonstrated with the SPEX system [47], which reasoned with a formal model of a code to create a detailed design optimization problem that when solved resulted in a code-compli-ant detailed design of structural components. To apply this concept to earlier stages of the design process, abstractions of the detailed provisions in a code need to be
10.5 Remaining Challenges and Opportunities 187
created and reasoned with. In later stages of the ECx process, these formal models of regulations will be explored to automatically create FPT from the represented logic found in regulations and design specifications. Finally, to understand these regulations for the different parts of the facility and the implications of making changes to the facility or to changes in the applicable regulations, such formal mod-els of regulations can constitute the basis for effective code reasoning. Thus, formal models of these regulations are critical for delivering computer support for a large number of activities in the life-cycle phases of a facility, including ECx.
References
[1] King, L. W., The Code of Hammurabi, NuVision Publications, 2007.[2] Kılıççöte, H., and Garrett, J. H., Jr., “Obstacles to the Development of Computable Models
of Design Standards,” Modeling of Buildings Through Their Life-Cycle, Proceedings of the CIB, Publication 180, August 1995, pp. 31–39.
[3] International Code Council, Code Development Process: An Introduction to the Develop-ment of International Construction and Fire Codes, International Code Council, http://www.iccsafe.org/AboutICC/Documents/GovtConsensusProcess.pdf.
[4] Turk, Z., and Vanier, D. J., “Tools and Models for the Electronic Delivery of Building Codes and Standards,” Modeling of Buildings Through Their Life-Cycle, M. A. Fischer, K. H. Law, and B. Luiten (Eds.), CIB W78 Workshop, Stanford, CA, 1995.
[5] Fenves, S. J., et al., “Computer Representations of Design Standards and Building Codes: A U.S. Perspective,” International Journal of Construction Information Technology, Vol. 3, No.1, 1995, pp. 13–34.
[6] Delis, E. A., and Delis, A., “Automatic Fire-Code Checking Using Expert-System Technol-ogy,” Journal of Computing in Civil Engineering, Vol. 9, No. 2, 1995, pp. 141–156.
[7] Han, C. S., Kunz, J. C., and Law, K. H., “A Client/Server Framework for On-Line Build-ing Code Checking,” Journal of Computing in Civil Engineering, Vol. 12, No. 4, 1997, pp. 181–194.
[8] ASHRAE Standards Committee Guideline 0-2005—The Commissioning Process, Atlanta, GA: American Society of Heating, Refrigerating and Air-Conditioning Engineers, 2005..
[9] ASHRAE Guideline 1.1-2007—The HVAC Commissioning Process: HVAC&R Technical Requirements for the Commissioning Process, Atlanta, GA: American Society of Heating, Ventilating and Air-Conditioning Engineers, 2007.
[10] Cornick, S. M., “HyperCode: The Building Code as a Hyperdocument,” Engineering with Computers, Vol. 7, No. 1, 1991, pp. 37–46.
[11] Yabuki, N., and Law, K. H., “Hyperdocument Model for Design Standards Documenta-tion,” Journal of Computing in Civil Engineering, Vol. 7, No. 2, 1993, pp. 218–237.
[12] Neilson, A. I., “A Dependency Network Generator for Standards Processing,” Computers & Structures, Vol. 67, No. 5, 1998, pp. 357–366.
[13] Jurafsky, D., and Martin, J. H., Speech and Language Processing, Upper Saddle River, NJ: Prentice Hall, 2008.
[14] Lau, G. T., Law, K. H., and Wiederhold, G., “Legal Information Retrieval and Application to E-Rulemaking,” in Proceedings of the 10th International Conference on Artifi cial Intel-ligence and Law, New York, 2005, pp. 146–154.
[15] Yang, H., and Callan, J., “Near-Duplicate Detection for E-Rulemaking,” in Proceedings of the National Conference on Digital Government Research, pp. 78–86, Digital Government Society of North America, 2005.
[16] Coglianese, C., “E-Rulemaking: Information Technology and the Regulatory Process,” Ad-ministrative Law Review, Vol. 56, 2004, pp. 353–402.

188 Building Codes
[17] Vanier, D. J., “Computerized Building Regulations,” in Proceedings International Confer-ence on Municipal Code Administration, Winnipeg, Canada, 1989.
[18] Rehak, D. R., and Lopez, L. A., “Computer-Aided Engineering Problems and Prospects,” Civil Engineering Systems Laboratory Research Series No. 8, Urbana-Champaign, IL: Uni-versity of Illinois, 1981.
[19] Fenves, S. J., “Tabular Decision Logic for Structural Design,” Journal of the Structural Di-vision, Vol. 92, No. 6, 1966, pp. 473–490.
[20] Fenves, S. J., Gaylord, E. H., and Goel, S. K., “Decision Table Formulation of the 1969 AISC Specifi cation,” Civil Engineering Studies Structural Research Series No. 347, Urbana-Champaign, IL: University of Illinois, 1969.
[21] Nyman, D. J., and Fenves, S. J., “Organizational Model for Design Specifi cations,” Journal of the Structural Division, Vol. 101, No. 4, 1975, pp. 697–716.
[22] Harris, J. R., and Wright, R. N., “Organization of Building Standards: Systematic Tech-niques for Scope and Arrangement,” National Bureau of Standards Building Science Series 136, 1980.
[23] Fenves, S. J., et al., “Introduction to SASE: Standards Analysis, Synthesis, and Expres-sions,” National Bureau of Standards Report No. NBSIR 87-3513, 1987.
[24] Larman, C., Applying UML and Patterns, Upper Saddle River, NJ: Prentice Hall, 2005.[25] Garrett, J. H., Jr., and Hakim, M. M., “An Object-Oriented Model of Engineering Design
Standards,” Journal of Computing in Civil Engineering, Vol. 6, No. 3, 1992, pp. 323–347.[26] Condamin, E., et al., “Context-Oriented Modeling of Eurocodes,” in Proceedings Eu-
ropean Conference on Product and Process Modelling in the Building Industry, Dresden, Germany, 1994.
[27] Jain, D., Law, K. H., and Krawinkler, H. “On Processing Standards with Predicate Cal-culus,” in Proceedings 6th Conference on Computing in Civil Engineering, Atlanta, GA, 1989.
[28] Rasdorf, W. J., and Lakmazaheri, S., “Logic-Based Approach for Modeling Organization of Design Standards,” Journal of Computing in Civil Engineering, Vol. 4, No. 2, 1990, pp. 102–123.
[29] Kerrigan, S., and Law, K., “Logic-Based Regulation Compliance-Assistance,” in Proceed-ings of 9th International Conference on Artifi cial Intelligence and Law, Edinburgh, Scot-land, 2003.
[30] Yabuki, N., and Law, K. H., “An Object-Logic Model for the Representation and Process-ing of Design Standards,” Engineering with Computers, Vol. 9, No. 3, 1993, pp. 133–159.
[31] Rasdorf, W. J., and Wang, T. E., “Generic Design Standards Processing in an Expert System Environment,” Journal of Computing in Civil Engineering, Vol. 2, No. 1, 1988, pp. 68–87.
[32] Heikkila, E. J., and Blewett, E. J., “Using Expert Systems to Check Compliance with Mu-nicipal Building Codes,” Journal of the American Planning Association, Vol. 58, No. 1, 1992, pp. 72–80.
[33] Standard 90.1—Energy Standard for Buildings Except Low-Rise Residential Buildings, Atlanta, GA: American Society of Heating, Ventilating and Air-Conditioning Engineers, 2007.
[34] Hakim, M. M., and Garrett, J. H., Jr., “A Description Logic Approach for Represent-ing Engineering Design Standards,” Engineering with Computers, Vol. 9, No. 2, 1993, pp. 108–124.
[35] Brachman, R., and Schmolze, J., “An Overview of the KL-ONE Knowledge Representation System,” Cognitive Science, Vol. 9, No. 2, 1985, pp. 171–216.
[36] Berners-Lee, T., Hendler, J. and Lassila, O., “The Semantic Web,” Scientifi c American Mag-azine, 2001, http://www.scientifi camerican.com/article.cfm?id=the-semantic-web, last ac-cesssed February 11, 2011.
[37] Kılıççöte, H., “The Context-Oriented Model: An Improved Modeling Approach for Rep-resenting and Processing Design Standards,” M.Sc. Thesis, Carnegie Mellon University, Pittsburgh, PA, 1994.
10.5 Remaining Challenges and Opportunities 189
[38] Kılıççöte, H., and Garrett, J. H., Jr., “Standards Modeling Language,” Journal of Comput-ing in Civil Engineering, Vol. 12, No. 3, 1998, pp. 129–135.
[39] Demir, S., et al., “A Semantic Web-Based Approach for Representing and Reasoning with Vocabulary for Computer-Based Standards Processing,” in Proceedings International Con-ference on Civil and Building Engineering, Nottingham, UK, 2010.
[40] Kılıççöte, H., and Garrett, J. H., Jr., “Standards Usage Language,” Journal of Computing in Civil Engineering, Vol. 15, No. 2, 2001, pp. 118–128.
[41] IFC, “Industry Foundation Classes (IFC) Release 2x3,” Online Specifi cations, 2000, http://www.iai-tech.org/ifc/IFC2x3/TC1/html/index.htm, last accesssed February 11, 2011.
[42] Nisbet, N., Wix, J., and Conover, D., “The Future of Virtual Construction and Regulation Checking,” in Virtual Futures for Design, Construction and Procurement, P. Brandon and T. Kocatürk (Eds.), New York: Wiley-Blackwell, 2008, pp. 241–251.
[43] Sing, T. F., and Zhong, Q., “COnstruction and Real Estate NETwork (CORENET),” Facili-ties, Vol. 19, No. 11–12, 2001, pp. 419–428.
[44] Ding, L., et al., “Automating Code Checking for Building Designs—Designcheck,” in Proceedings 2nd International Conference of the CRC for Construction Innovation, Gold Coast, Australia, 2006.
[45] Han, C. S., et al., “A Performance-Based Approach to Wheelchair Accessible Route Analy-sis,” Advanced Engineering Informatics, Vol. 16, No. 1, 2002, pp. 53–71.
[46] Lee, J. K., “Building Environment Rule and Analysis Language,” Ph.D. Thesis, College of Architecture, Georgia Institute of Technology, Atlanta, GA, 2011.
[47] Garrett, J. H., Jr., and Fenves, S. J., “Knowledge-Based Standard-Independent Member Design,” Journal of Structural Engineering, Vol. 115, No. 6, pp. 1396–1411, June 1989.

191
Part III: The Future
In Part II we described a set of methods and tools that, during the facility manage-ment phase of capital project delivery, enable the effective operation of the embed-ded commissioning (ECx) process (see Figure 2.5). These methods and tools impact the process through inputs and mechanisms that feed into the operations of ECx. In this part, we will consider some of the methods and tools that are good candi-dates for making ECx an even more effective aspect of capital project evaluation in the near future. These include sensors, value-based design evaluation, field tools, AR/VR technology applications, and just-in-time technologies including wearable computers.
Sensors, which were first deployed in capital facilities decades ago, have come of age. The potential impact of sensors in monitoring and improving performance of facilities is not just limited to the functionalities provided by singular sensors; those that reside in systematically installed networks of sensors will have an impact also. This complements the network of local device controls that have micropro-cessors, actuators, sensors, and communicating capabilities (Chapter 9). These net-works enable us to obtain relevant information and effective intervention in facili-ties to achieve high levels of performance. This can be realized both locally, through one or a small number of sensors dedicated to singular, physical features or pieces of equipment, and globally, compiling information from a large number of equip-ment and facility subsystems, based on integrated sensor networks (Chapter 11).
Furthermore, design-added value (DAV) analysis is used to assess the value cre-ated solely through the power of innovation and design of new and advanced tech-nologies—and not just by throwing money and influence behind capital projects (Chapter 12). Through such methods of value prediction we can make the correct decisions that will enable the success of innovative technologies in the marketplace. DAV analysis helps not only in objectively estimating the value of innovation that is effective, but also in weeding out that which is likely to waste resources and en-ergy. A well-known example of such ill-conceived value assessment underlies the substitution of ethanol—a less economical and environmentally beneficial fuel than gasoline—for gasoline [1].
Emerging technologies in the field of computing have all but completely trans-formed the way we represent, communicate, and process information in every con-ceivable realm of daily life. It will not be long before all of what we do in the AEC

192 Part III: The Future
sector will become digital as well (Chapters 5 through 10). Two of the critical areas of development in this direction are (1) field tools and AR/VR technology applica-tions (Chapter 13) and (2) just-in-time technologies including wearable computers (Chapter 14).
Through the use of AR/VR technology, the ECx process will make use of hard-copy documentation obsolete. All ECx activities will be completed at the site, elimi-nating time-consuming travel from field to shop or office in order to test or readjust equipment or control settings. Information needed for reporting and updates will be embedded in devices and systems for later retrieval. These developments will make the ECx process more efficient, robust, and accurate.
Technologies enabling JIT applications and wearable computation are devel-oping faster than any other. Thanks to the popularity of handheld devices used for communication and data transfer in the social realm, hardware is becoming smaller, lighter, and cheaper by orders of magnitude compared to similar devices developed only 3 or 4 years ago. Tablets and cameras are embedded in garments and light accessories that make seamless communication and data transfer at the field a realistic expectation. It is highly likely that a specialized wearable computing system that supports JIT data will revolutionize how we conduct ECx in the near future. In the chapters in this part (Chapters 11 through 15), we will describe in de-tail these emerging new methods and tools that are applicable in the ECx domain.
Reference
[1] Harasanyi, D., “Ethanol Is a Waste of Energy,” Denver Post, April 23, 2007, http://www.denverpost.com/ci_5728436#ixzz1NIWHte54.
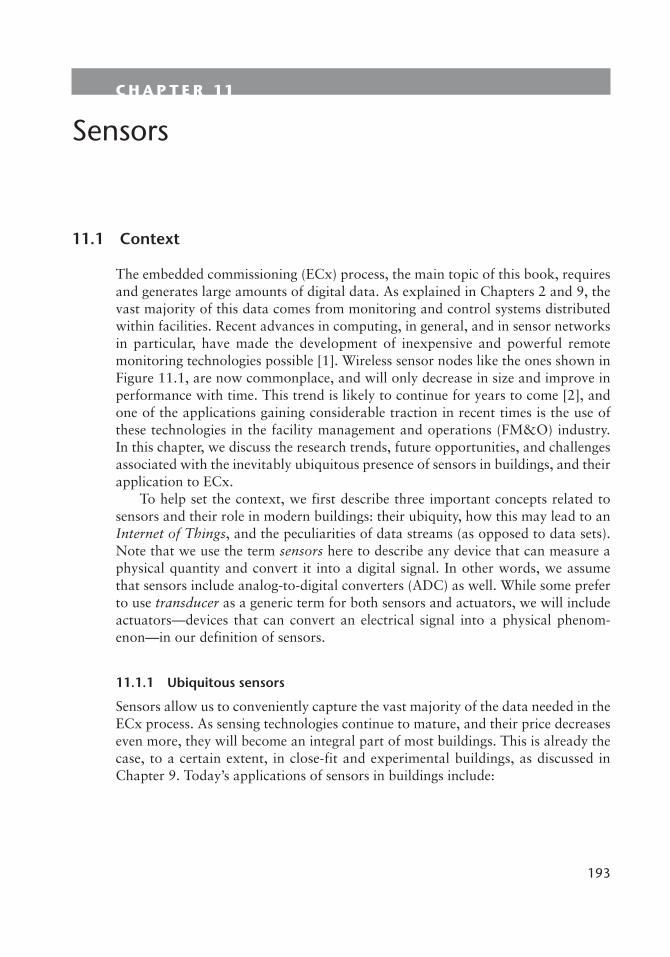
193
C H A P T E R 11
Sensors
11.1 Context
The embedded commissioning (ECx) process, the main topic of this book, requires and generates large amounts of digital data. As explained in Chapters 2 and 9, the vast majority of this data comes from monitoring and control systems distributed within facilities. Recent advances in computing, in general, and in sensor networks in particular, have made the development of inexpensive and powerful remote monitoring technologies possible [1]. Wireless sensor nodes like the ones shown in Figure 11.1, are now commonplace, and will only decrease in size and improve in performance with time. This trend is likely to continue for years to come [2], and one of the applications gaining considerable traction in recent times is the use of these technologies in the facility management and operations (FM&O) industry. In this chapter, we discuss the research trends, future opportunities, and challenges associated with the inevitably ubiquitous presence of sensors in buildings, and their application to ECx.
To help set the context, we first describe three important concepts related to sensors and their role in modern buildings: their ubiquity, how this may lead to an Internet of Things, and the peculiarities of data streams (as opposed to data sets). Note that we use the term sensors here to describe any device that can measure a physical quantity and convert it into a digital signal. In other words, we assume that sensors include analog-to-digital converters (ADC) as well. While some prefer to use transducer as a generic term for both sensors and actuators, we will include actuators—devices that can convert an electrical signal into a physical phenom-enon—in our definition of sensors.
11.1.1 Ubiquitous sensors
Sensors allow us to conveniently capture the vast majority of the data needed in the ECx process. As sensing technologies continue to mature, and their price decreases even more, they will become an integral part of most buildings. This is already the case, to a certain extent, in close-fit and experimental buildings, as discussed in Chapter 9. Today’s applications of sensors in buildings include:
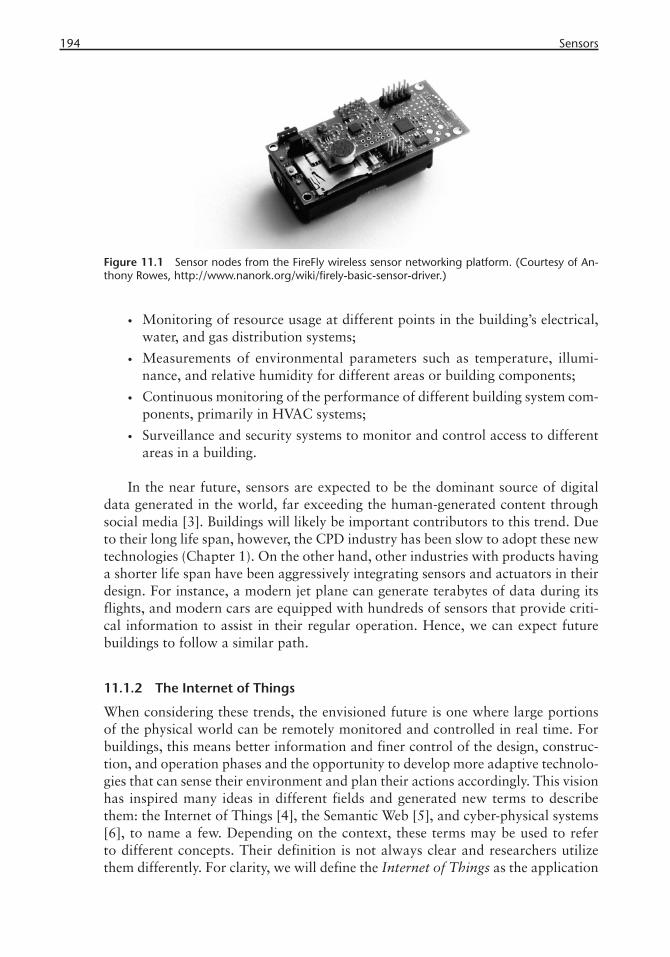
194 Sensors
• Monitoring of resource usage at different points in the building’s electrical, water, and gas distribution systems;
• Measurements of environmental parameters such as temperature, illumi-nance, and relative humidity for different areas or building components;
• Continuous monitoring of the performance of different building system com-ponents, primarily in HVAC systems;
• Surveillance and security systems to monitor and control access to different areas in a building.
In the near future, sensors are expected to be the dominant source of digital data generated in the world, far exceeding the human-generated content through social media [3]. Buildings will likely be important contributors to this trend. Due to their long life span, however, the CPD industry has been slow to adopt these new technologies (Chapter 1). On the other hand, other industries with products having a shorter life span have been aggressively integrating sensors and actuators in their design. For instance, a modern jet plane can generate terabytes of data during its flights, and modern cars are equipped with hundreds of sensors that provide criti-cal information to assist in their regular operation. Hence, we can expect future buildings to follow a similar path.
11.1.2 The Internet of Things
When considering these trends, the envisioned future is one where large portions of the physical world can be remotely monitored and controlled in real time. For buildings, this means better information and finer control of the design, construc-tion, and operation phases and the opportunity to develop more adaptive technolo-gies that can sense their environment and plan their actions accordingly. This vision has inspired many ideas in different fields and generated new terms to describe them: the Internet of Things [4], the Semantic Web [5], and cyber-physical systems [6], to name a few. Depending on the context, these terms may be used to refer to different concepts. Their definition is not always clear and researchers utilize them differently. For clarity, we will define the Internet of Things as the application
Figure 11.1 Sensor nodes from the FireFly wireless sensor networking platform. (Courtesy of An-thony Rowes, http://www.nanork.org/wiki/fi rely-basic-sensor-driver.)
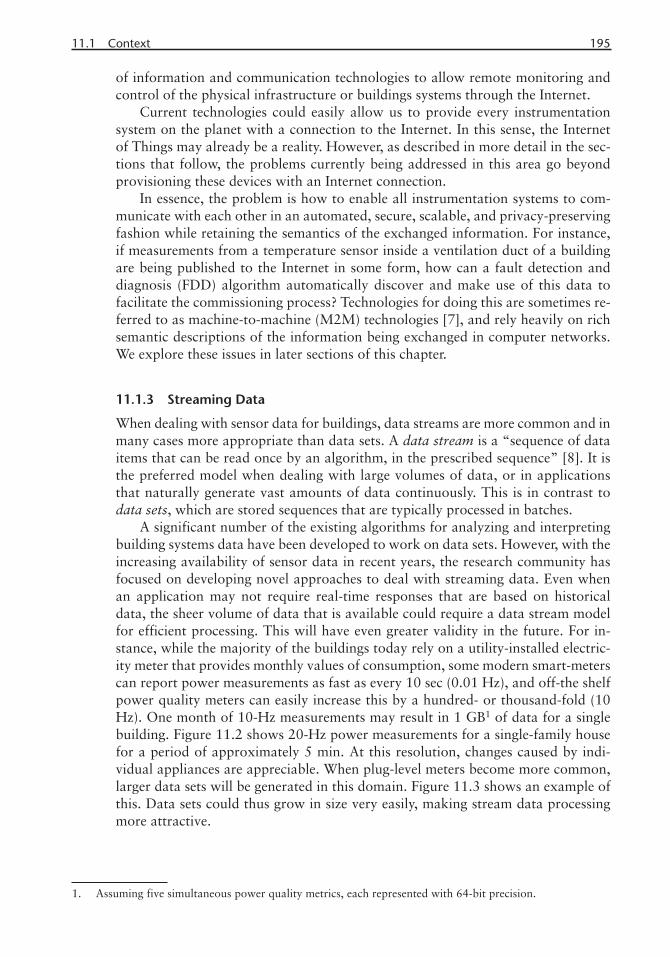
11.1 Context 195
of information and communication technologies to allow remote monitoring and control of the physical infrastructure or buildings systems through the Internet.
Current technologies could easily allow us to provide every instrumentation system on the planet with a connection to the Internet. In this sense, the Internet of Things may already be a reality. However, as described in more detail in the sec-tions that follow, the problems currently being addressed in this area go beyond provisioning these devices with an Internet connection.
In essence, the problem is how to enable all instrumentation systems to com-municate with each other in an automated, secure, scalable, and privacy-preserving fashion while retaining the semantics of the exchanged information. For instance, if measurements from a temperature sensor inside a ventilation duct of a building are being published to the Internet in some form, how can a fault detection and diagnosis (FDD) algorithm automatically discover and make use of this data to facilitate the commissioning process? Technologies for doing this are sometimes re-ferred to as machine-to-machine (M2M) technologies [7], and rely heavily on rich semantic descriptions of the information being exchanged in computer networks. We explore these issues in later sections of this chapter.
11.1.3 Streaming Data
When dealing with sensor data for buildings, data streams are more common and in many cases more appropriate than data sets. A data stream is a “sequence of data items that can be read once by an algorithm, in the prescribed sequence” [8]. It is the preferred model when dealing with large volumes of data, or in applications that naturally generate vast amounts of data continuously. This is in contrast to data sets, which are stored sequences that are typically processed in batches.
A significant number of the existing algorithms for analyzing and interpreting building systems data have been developed to work on data sets. However, with the increasing availability of sensor data in recent years, the research community has focused on developing novel approaches to deal with streaming data. Even when an application may not require real-time responses that are based on historical data, the sheer volume of data that is available could require a data stream model for efficient processing. This will have even greater validity in the future. For in-stance, while the majority of the buildings today rely on a utility-installed electric-ity meter that provides monthly values of consumption, some modern smart-meters can report power measurements as fast as every 10 sec (0.01 Hz), and off-the shelf power quality meters can easily increase this by a hundred- or thousand-fold (10 Hz). One month of 10-Hz measurements may result in 1 GB1 of data for a single building. Figure 11.2 shows 20-Hz power measurements for a single-family house for a period of approximately 5 min. At this resolution, changes caused by indi-vidual appliances are appreciable. When plug-level meters become more common, larger data sets will be generated in this domain. Figure 11.3 shows an example of this. Data sets could thus grow in size very easily, making stream data processing more attractive.
1. Assuming five simultaneous power quality metrics, each represented with 64-bit precision.
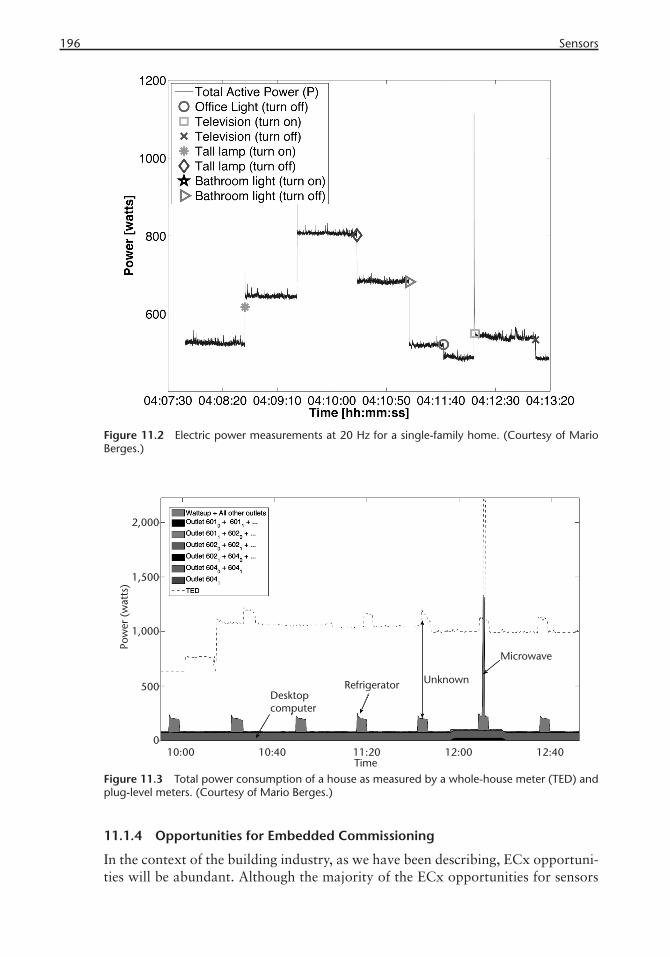
196 Sensors
11.1.4 Opportunities for Embedded Commissioning
In the context of the building industry, as we have been describing, ECx opportuni-ties will be abundant. Although the majority of the ECx opportunities for sensors
Figure 11.2 Electric power measurements at 20 Hz for a single-family home. (Courtesy of Mario Berges.)
Figure 11.3 Total power consumption of a house as measured by a whole-house meter (TED) and plug-level meters. (Courtesy of Mario Berges.)

11.2 Going Beyond Specifi c Protocols and Formats 197
would appear to lie in the operational phase, the same can be said about the other phases. Akin et al. [9] define eight building life-cycle phases, which we group by sensor-specific opportunities that exist in each and provide a short illustrative ex-ample for each group:
• Requirement and design specifications: Historical data from sensors can help refine specifications. Once sensor data becomes ubiquitous, it will be possible to analyze the actual performance of different building components and pro-cesses under various conditions and for extended periods of time. Specifying sensor placement and function in the design stage is one of the innovations that ECx will usher in. Depending on their downstream functions—local harvesting of data, goal-directed broadcasting through communication pro-tocols, or automatic fault detection and diagnosis—sensors will be placed and networked strategically. Opportunistic inclusion of device-specific sen-sors like those in laptops needs to be considered as a creative aspect of this process.
• Facility construction: One of the primary functions of ECx during or at the conclusion of construction is to make sure that sensors are properly installed (PFC) and calibrated to make valid readings (FPT). Naturally, sensors can be used to monitor and control the construction progress. Although still in its infancy, this sector is poised to introduce a variety of reality-capture technolo-gies for automating processes and making them more efficient. This includes automated equipment and inventory tracking and productivity monitoring (Chapter 5).
• Facility management: The main advantage in the future of facility operations will come from the development of intelligent systems that continuously monitor and control facility operations, assist fieldworkers in identifying subsystems and their performance parameters, detecting malfunctions, diag-nosing faults, and actuating change in the settings of equipment components (Chapter 13).
• Facility occupation, re-occupancy, and decommissioning: Sensors can assist in verifying the performance of building systems in each of these stages. Sen-sors can be adapted to the new uses that facilities may acquire over time as well as to changes in the composition or behavior of its occupants.
• Materials recycling: Sensors, some of which may be embedded in the materi-als that make up the facility, can provide information about the condition and status of building components as well as the history of their operation. This information can help determine their remaining lifetime.
11.2 Going Beyond Specifi c Protocols and Formats
As seen in previous chapters, especially in Chapter 9, there are many emerging data exchange and communication standards for sensors. The plurality of standards, many of which are not interoperable, is one of the major challenges that the indus-try will need to face in the following years. In some situations, this problem can
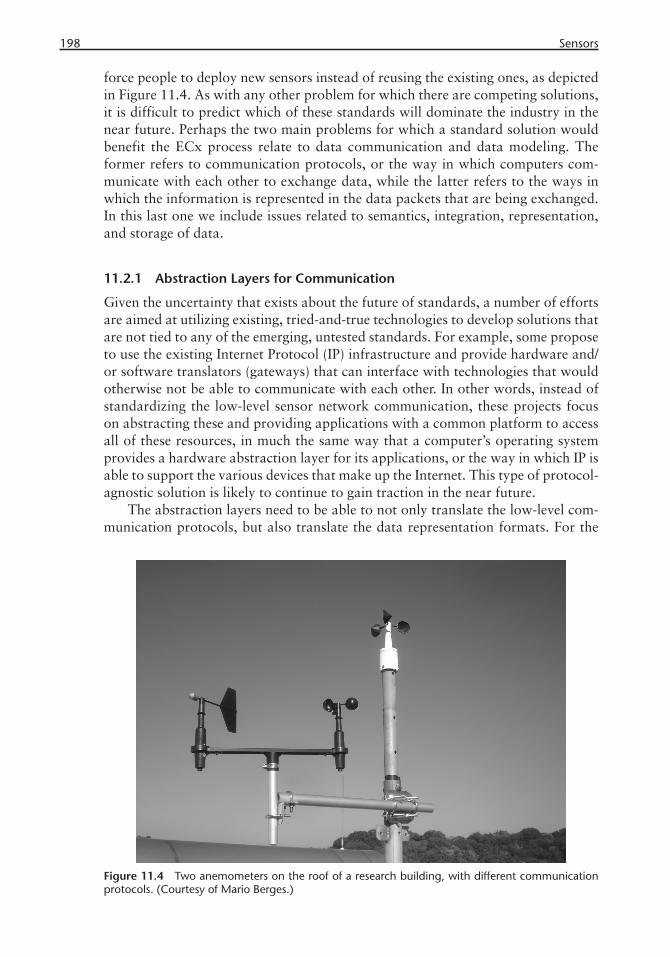
198 Sensors
force people to deploy new sensors instead of reusing the existing ones, as depicted in Figure 11.4. As with any other problem for which there are competing solutions, it is difficult to predict which of these standards will dominate the industry in the near future. Perhaps the two main problems for which a standard solution would benefit the ECx process relate to data communication and data modeling. The former refers to communication protocols, or the way in which computers com-municate with each other to exchange data, while the latter refers to the ways in which the information is represented in the data packets that are being exchanged. In this last one we include issues related to semantics, integration, representation, and storage of data.
11.2.1 Abstraction Layers for Communication
Given the uncertainty that exists about the future of standards, a number of efforts are aimed at utilizing existing, tried-and-true technologies to develop solutions that are not tied to any of the emerging, untested standards. For example, some propose to use the existing Internet Protocol (IP) infrastructure and provide hardware and/or software translators (gateways) that can interface with technologies that would otherwise not be able to communicate with each other. In other words, instead of standardizing the low-level sensor network communication, these projects focus on abstracting these and providing applications with a common platform to access all of these resources, in much the same way that a computer’s operating system provides a hardware abstraction layer for its applications, or the way in which IP is able to support the various devices that make up the Internet. This type of protocol-agnostic solution is likely to continue to gain traction in the near future.
The abstraction layers need to be able to not only translate the low-level com-munication protocols, but also translate the data representation formats. For the
Figure 11.4 Two anemometers on the roof of a research building, with different communication protocols. (Courtesy of Mario Berges.)
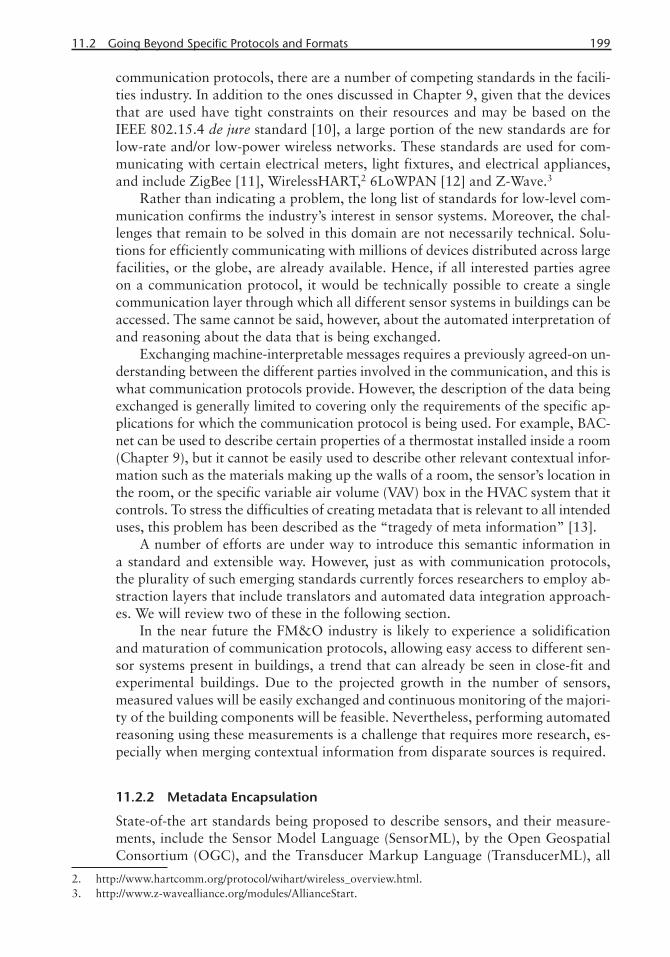
11.2 Going Beyond Specifi c Protocols and Formats 199
communication protocols, there are a number of competing standards in the facili-ties industry. In addition to the ones discussed in Chapter 9, given that the devices that are used have tight constraints on their resources and may be based on the IEEE 802.15.4 de jure standard [10], a large portion of the new standards are for low-rate and/or low-power wireless networks. These standards are used for com-municating with certain electrical meters, light fixtures, and electrical appliances, and include ZigBee [11], WirelessHART,2 6LoWPAN [12] and Z-Wave.3
Rather than indicating a problem, the long list of standards for low-level com-munication confirms the industry’s interest in sensor systems. Moreover, the chal-lenges that remain to be solved in this domain are not necessarily technical. Solu-tions for efficiently communicating with millions of devices distributed across large facilities, or the globe, are already available. Hence, if all interested parties agree on a communication protocol, it would be technically possible to create a single communication layer through which all different sensor systems in buildings can be accessed. The same cannot be said, however, about the automated interpretation of and reasoning about the data that is being exchanged.
Exchanging machine-interpretable messages requires a previously agreed-on un-derstanding between the different parties involved in the communication, and this is what communication protocols provide. However, the description of the data being exchanged is generally limited to covering only the requirements of the specific ap-plications for which the communication protocol is being used. For example, BAC-net can be used to describe certain properties of a thermostat installed inside a room (Chapter 9), but it cannot be easily used to describe other relevant contextual infor-mation such as the materials making up the walls of a room, the sensor’s location in the room, or the specific variable air volume (VAV) box in the HVAC system that it controls. To stress the difficulties of creating metadata that is relevant to all intended uses, this problem has been described as the “tragedy of meta information” [13].
A number of efforts are under way to introduce this semantic information in a standard and extensible way. However, just as with communication protocols, the plurality of such emerging standards currently forces researchers to employ ab-straction layers that include translators and automated data integration approach-es. We will review two of these in the following section.
In the near future the FM&O industry is likely to experience a solidification and maturation of communication protocols, allowing easy access to different sen-sor systems present in buildings, a trend that can already be seen in close-fit and experimental buildings. Due to the projected growth in the number of sensors, measured values will be easily exchanged and continuous monitoring of the majori-ty of the building components will be feasible. Nevertheless, performing automated reasoning using these measurements is a challenge that requires more research, es-pecially when merging contextual information from disparate sources is required.
11.2.2 Metadata Encapsulation
State-of-the art standards being proposed to describe sensors, and their measure-ments, include the Sensor Model Language (SensorML), by the Open Geospatial Consortium (OGC), and the Transducer Markup Language (TransducerML), all
2. http://www.hartcomm.org/protocol/wihart/wireless_overview.html.3. http://www.z-wavealliance.org/modules/AllianceStart.
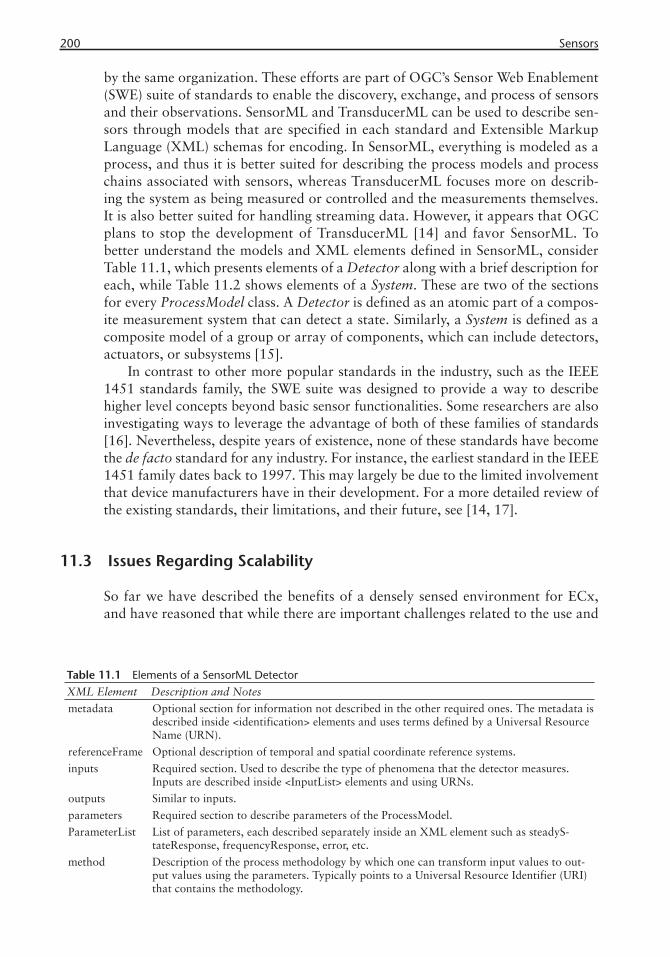
200 Sensors
by the same organization. These efforts are part of OGC’s Sensor Web Enablement (SWE) suite of standards to enable the discovery, exchange, and process of sensors and their observations. SensorML and TransducerML can be used to describe sen-sors through models that are specified in each standard and Extensible Markup Language (XML) schemas for encoding. In SensorML, everything is modeled as a process, and thus it is better suited for describing the process models and process chains associated with sensors, whereas TransducerML focuses more on describ-ing the system as being measured or controlled and the measurements themselves. It is also better suited for handling streaming data. However, it appears that OGC plans to stop the development of TransducerML [14] and favor SensorML. To better understand the models and XML elements defined in SensorML, consider Table 11.1, which presents elements of a Detector along with a brief description for each, while Table 11.2 shows elements of a System. These are two of the sections for every ProcessModel class. A Detector is defined as an atomic part of a compos-ite measurement system that can detect a state. Similarly, a System is defined as a composite model of a group or array of components, which can include detectors, actuators, or subsystems [15].
In contrast to other more popular standards in the industry, such as the IEEE 1451 standards family, the SWE suite was designed to provide a way to describe higher level concepts beyond basic sensor functionalities. Some researchers are also investigating ways to leverage the advantage of both of these families of standards [16]. Nevertheless, despite years of existence, none of these standards have become the de facto standard for any industry. For instance, the earliest standard in the IEEE 1451 family dates back to 1997. This may largely be due to the limited involvement that device manufacturers have in their development. For a more detailed review of the existing standards, their limitations, and their future, see [14, 17].
11.3 Issues Regarding Scalability
So far we have described the benefits of a densely sensed environment for ECx, and have reasoned that while there are important challenges related to the use and
Table 11.1 Elements of a SensorML DetectorXML Element Description and Notes
metadata Optional section for information not described in the other required ones. The metadata is described inside <identification> elements and uses terms defined by a Universal Resource Name (URN).
referenceFrame Optional description of temporal and spatial coordinate reference systems.
inputs Required section. Used to describe the type of phenomena that the detector measures. Inputs are described inside <InputList> elements and using URNs.
outputs Similar to inputs.
parameters Required section to describe parameters of the ProcessModel.
ParameterList List of parameters, each described separately inside an XML element such as steadyS-tateResponse, frequencyResponse, error, etc.
method Description of the process methodology by which one can transform input values to out-put values using the parameters. Typically points to a Universal Resource Identifier (URI) that contains the methodology.
11.3 Issues Regarding Scalability 201
creation of metadata, the underlying communication technologies required for this vision already exist. Next, we explore if solving these metadata challenges would be sufficient to achieve sensor-enabled ECx processes. In other words, if it were possible for a heterogeneous collection of sensors and computers to establish com-munication with each other and understand the semantic meaning of the data being exchanged, would that be all that is necessary?
The answer, although not completely evident at first, is a resounding “no.” It may be possible to support a number of ECx activities with this limited set of func-tionalities, but to ensure that these solutions can scale up to the levels where they become meaningful for the industry (including collection of buildings, city-size fa-cilities, microgrids) and minimize unintended consequences, there are two remain-ing issues that must be addressed: (1) choosing an appropriate system architecture and (2) ensuring privacy, security, and tight access control policies. The first is the topic of this section, while the second is discussed in the next section.
When designing the architecture for a distributed instrumentation system such as the one we are envisioning, the following considerations need to be made: (1) the ability to support a large number of devices and users is of paramount importance, (2) extensions made by a particular application to satisfy new requirements should ideally benefit the entire community, (3) the architecture should be flexible enough to allow for the implementation of different computation paradigms, and (4) it also needs to be able to change over time.
The architecture evolving from this is largely dependent on the requirements of the emerging application, especially the timescales of interest and the timeliness with which the data is required. In the ECx processes, a wide range of timescales is of interest. However, architectures for handling long and medium timescales are very common in modern systems. On the other hand, the rapid timescale is better managed through a push-based or event-driven architecture, and the new land-scape of sensors in buildings will require the use of this approach.
Table 11.2 Elements of a SensorML SystemXML Element
description
identification
classification
contact
documentation
referenceFrame
inputs
outputs
processes
connections
positions
interfaces
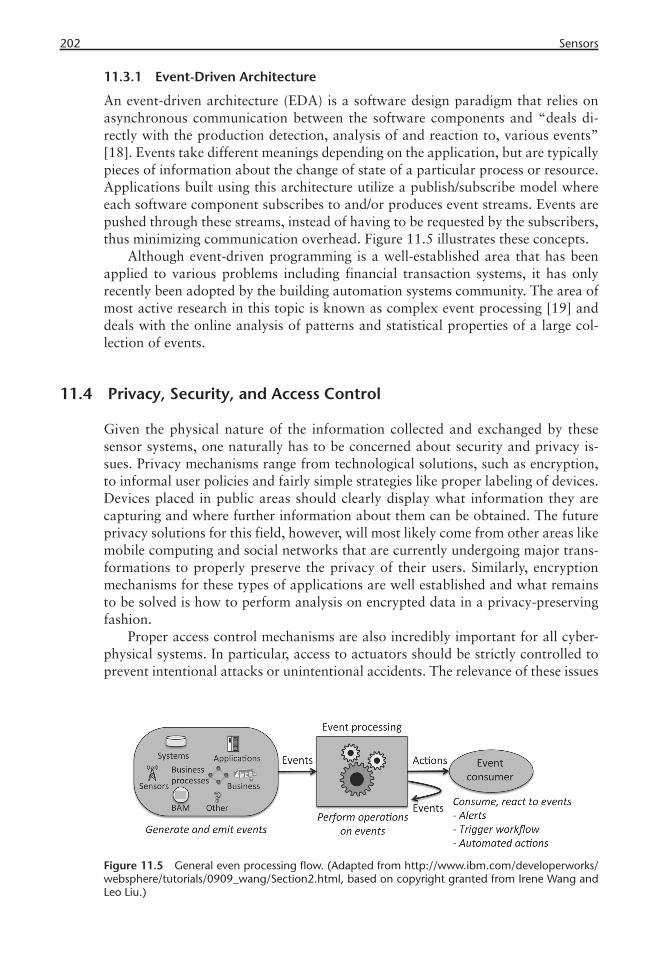
202 Sensors
11.3.1 Event-Driven Architecture
An event-driven architecture (EDA) is a software design paradigm that relies on asynchronous communication between the software components and “deals di-rectly with the production detection, analysis of and reaction to, various events” [18]. Events take different meanings depending on the application, but are typically pieces of information about the change of state of a particular process or resource. Applications built using this architecture utilize a publish/subscribe model where each software component subscribes to and/or produces event streams. Events are pushed through these streams, instead of having to be requested by the subscribers, thus minimizing communication overhead. Figure 11.5 illustrates these concepts.
Although event-driven programming is a well-established area that has been applied to various problems including financial transaction systems, it has only recently been adopted by the building automation systems community. The area of most active research in this topic is known as complex event processing [19] and deals with the online analysis of patterns and statistical properties of a large col-lection of events.
11.4 Privacy, Security, and Access Control
Given the physical nature of the information collected and exchanged by these sensor systems, one naturally has to be concerned about security and privacy is-sues. Privacy mechanisms range from technological solutions, such as encryption, to informal user policies and fairly simple strategies like proper labeling of devices. Devices placed in public areas should clearly display what information they are capturing and where further information about them can be obtained. The future privacy solutions for this field, however, will most likely come from other areas like mobile computing and social networks that are currently undergoing major trans-formations to properly preserve the privacy of their users. Similarly, encryption mechanisms for these types of applications are well established and what remains to be solved is how to perform analysis on encrypted data in a privacy-preserving fashion.
Proper access control mechanisms are also incredibly important for all cyber-physical systems. In particular, access to actuators should be strictly controlled to prevent intentional attacks or unintentional accidents. The relevance of these issues
Figure 11.5 General even processing fl ow. (Adapted from http://www.ibm.com/developerworks/websphere/tutorials/0909_wang/Section2.html, based on copyright granted from Irene Wang and Leo Liu.)

11.5 Future Prospects 203
was recently illustrated in a recent computer virus incident that received worldwide media coverage. The Stuxnet computer worm [20] targeted industrial systems and managed to affect operation in nuclear facilities in Iran. The future of sensor sys-tems in the building industry will depend on being able to minimize these risks to a point in which the benefits outweigh them.
11.5 Future Prospects
Future systems that deal with these problems are already being developed and utilized in research laboratories around the world. Multiple projects have created architectures that benefit ECx—by enabling resource reuse and collaborative Inter-net-scale sensing. For instance, in Global Sensor Networks (GSN) [21], the authors propose a service-oriented architecture in which sensors can be queried using com-mands in the style of Structured Query Language (SQL) and using web services. A peer-to-peer architecture is used for efficiently indexing data. Simple sensor syndi-cation [22] creates a publish/subscribe model for sensor data using Really Simple Syndication (RSS) feeds. A small server located at a sensor gateway preprocesses sensor data and can be configured to publish particular events of interest. This sys-tem does not address issues of access control or resource management, which are important if wide adoption of the technology is sought. In [23], the authors present a system for making sensor data shareable and searchable over the Internet. The system is designed primarily for searching sensor data. It does not focus on man-agement of sensors between different users with different access control rights. The same is true for the system presented in [24].
Multiple research groups have worked on collaborative sensing services like SenseWeb [25] from Microsoft Research, SensorWeb [26], and Sensorpedia.4 These systems are targeted toward visualizing and sharing data with end users. They cur-rently appear to have little support for managing actuators.
11.5.1 Sensor Andrew
We finish this chapter with a description of one of the many research projects that is focused on developing solutions to the problems we have explored so far. In partic-ular, this project is relevant because it was designed to provide support for all trans-ducers (sensors and actuators), leveraging existing technology from Internet chat messaging services. Sensor Andrew is a research project at Carnegie Mellon Uni-versity that aims to develop an infrastructure for Internet-scale sensing and actua-tion across a wide range of heterogeneous devices designed to facilitate application development [27]. The goal of Sensor Andrew is to enable a variety of ubiquitous large-scale monitoring and control applications in a way that is extensible, easy to use and secure, while maintaining privacy. Sensing devices that are used range from cameras and battery-operated wireless sensor nodes to energy-monitoring devices wired into building power supplies.
As discussed earlier, supporting multiple applications and heterogeneous de-vices requires a standardized communication medium capable of scaling to tens of
4. http://www.sensorpedia.com.
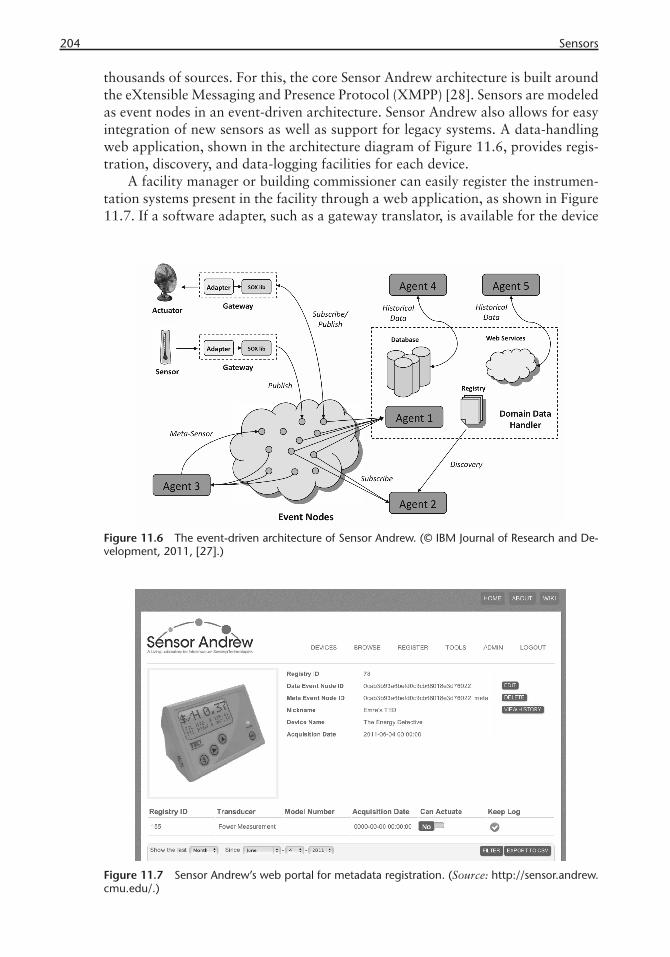
204 Sensors
thousands of sources. For this, the core Sensor Andrew architecture is built around the eXtensible Messaging and Presence Protocol (XMPP) [28]. Sensors are modeled as event nodes in an event-driven architecture. Sensor Andrew also allows for easy integration of new sensors as well as support for legacy systems. A data-handling web application, shown in the architecture diagram of Figure 11.6, provides regis-tration, discovery, and data-logging facilities for each device.
A facility manager or building commissioner can easily register the instrumen-tation systems present in the facility through a web application, as shown in Figure 11.7. If a software adapter, such as a gateway translator, is available for the device
Figure 11.6 The event-driven architecture of Sensor Andrew. (© IBM Journal of Research and De-velopment, 2011, [27].)
Figure 11.7 Sensor Andrew’s web portal for metadata registration. (Source: http://sensor.andrew.cmu.edu/.)
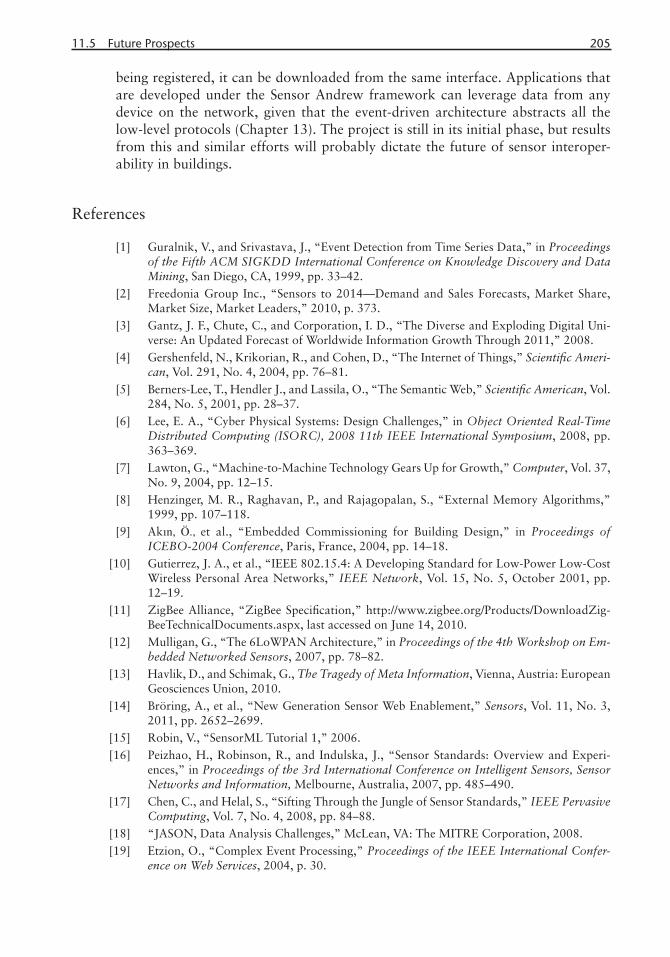
11.5 Future Prospects 205
being registered, it can be downloaded from the same interface. Applications that are developed under the Sensor Andrew framework can leverage data from any device on the network, given that the event-driven architecture abstracts all the low-level protocols (Chapter 13). The project is still in its initial phase, but results from this and similar efforts will probably dictate the future of sensor interoper-ability in buildings.
References
[1] Guralnik, V., and Srivastava, J., “Event Detection from Time Series Data,” in Proceedings of the Fifth ACM SIGKDD International Conference on Knowledge Discovery and Data Mining, San Diego, CA, 1999, pp. 33–42.
[2] Freedonia Group Inc., “Sensors to 2014—Demand and Sales Forecasts, Market Share, Market Size, Market Leaders,” 2010, p. 373.
[3] Gantz, J. F., Chute, C., and Corporation, I. D., “The Diverse and Exploding Digital Uni-verse: An Updated Forecast of Worldwide Information Growth Through 2011,” 2008.
[4] Gershenfeld, N., Krikorian, R., and Cohen, D., “The Internet of Things,” Scientifi c Ameri-can, Vol. 291, No. 4, 2004, pp. 76–81.
[5] Berners-Lee, T., Hendler J., and Lassila, O., “The Semantic Web,” Scientifi c American, Vol. 284, No. 5, 2001, pp. 28–37.
[6] Lee, E. A., “Cyber Physical Systems: Design Challenges,” in Object Oriented Real-Time Distributed Computing (ISORC), 2008 11th IEEE International Symposium, 2008, pp. 363–369.
[7] Lawton, G., “Machine-to-Machine Technology Gears Up for Growth,” Computer, Vol. 37, No. 9, 2004, pp. 12–15.
[8] Henzinger, M. R., Raghavan, P., and Rajagopalan, S., “External Memory Algorithms,” 1999, pp. 107–118.
[9] Akın, Ö., et al., “Embedded Commissioning for Building Design,” in Proceedings of ICEBO-2004 Conference, Paris, France, 2004, pp. 14–18.
[10] Gutierrez, J. A., et al., “IEEE 802.15.4: A Developing Standard for Low-Power Low-Cost Wireless Personal Area Networks,” IEEE Network, Vol. 15, No. 5, October 2001, pp. 12–19.
[11] ZigBee Alliance, “ZigBee Specifi cation,” http://www.zigbee.org/Products/DownloadZig-BeeTechnicalDocuments.aspx, last accessed on June 14, 2010.
[12] Mulligan, G., “The 6LoWPAN Architecture,” in Proceedings of the 4th Workshop on Em-bedded Networked Sensors, 2007, pp. 78–82.
[13] Havlik, D., and Schimak, G., The Tragedy of Meta Information, Vienna, Austria: European Geosciences Union, 2010.
[14] Bröring, A., et al., “New Generation Sensor Web Enablement,” Sensors, Vol. 11, No. 3, 2011, pp. 2652–2699.
[15] Robin, V., “SensorML Tutorial 1,” 2006.[16] Peizhao, H., Robinson, R., and Indulska, J., “Sensor Standards: Overview and Experi-
ences,” in Proceedings of the 3rd International Conference on Intelligent Sensors, Sensor Networks and Information, Melbourne, Australia, 2007, pp. 485–490.
[17] Chen, C., and Helal, S., “Sifting Through the Jungle of Sensor Standards,” IEEE Pervasive Computing, Vol. 7, No. 4, 2008, pp. 84–88.
[18] “JASON, Data Analysis Challenges,” McLean, VA: The MITRE Corporation, 2008.[19] Etzion, O., “Complex Event Processing,” Proceedings of the IEEE International Confer-
ence on Web Services, 2004, p. 30.
206 Sensors
[20] Chen, T., “Stuxnet, the Real Start of Cyber Warfare?” IEEE Network, Vol. 24, No. 6, 2010, pp. 2–3.
[21] Aberer, K., Hauswirth, M., and Salehi, A., “Global Sensor Networks,” School of Computer and Communication Sciences, Ecole Polytechnique Federale de Lausanne, 2006.
[22] Colagrosso, M., Simmons, W., and Graham, M., “Simple Sensor Syndication,” in Proceed-ings of the 4th International Conference on Embedded Networked Sensor Systems, Boul-der, CO, 2006, pp. 377–378.
[23] Reddy, S., et al., “Sensor-Internet Share and Search—Enabling Collaboration of Citizen Scientists,” in Proceedings of the ACM Workshop on Data Sharing and Interoperability on the World Wide Sensor Web, Cambridge, MA, 2007, pp. 11–16.
[24] Priyantha, N B., et al., “Tiny Web Services: Design and Implementation of Interoperable and Evolvable Sensor Networks,” in Proceedings of the 6th ACM Conference on Embed-ded Network Sensor Systems, Raleigh, NC, 2008, pp. 253–266.
[25] Santanche A., et al., “SenseWeb: Browsing the Physical World in Real Time,” in Demo Abstract, Nashville, TN, 2006, pp. 547–548.
[26] Sheth, A., Henson, C., and Sahoo, S. S., “Semantic Sensor Web,” IEEE Internet Comput-ing, Vol. 12, No. 4, 2008, pp. 78–83.
[27] Rowe, A., et al., “Sensor Andrew: Large-Scale Campus-Wide Sensing and Actuation,” IBM Journal of Research and Development, Vol. 55, No. 1.2, 2011, pp. 6:1–6:14.
[28] XMPP Standards Foundation, http://xmpp.org, last accessed on February 22, 2010.
207
C H A P T E R 12
Value-Based Design
A deep-rooted motivation for this book is innovation in the operations and evalu-ation of capital projects. Every important innovation comes with extraordinary costs. Sensor-based operations, product and process modeling, data interoperabil-ity, standardization of BCx, automatic code compliance, BAS communication pro-tocols, augmented reality applications, and wearable computing all have a higher price tag than installations without them. The only reason these innovations are ever realized—if they are—is due to the added value they create [1]. Therefore, we would be remiss if we did not devote at a minimum a chapter to the exploration of yet another innovation, one that estimates the value added by innovative design. We call this design added value or DAV analysis [2].
12.1 Innovation in the AEC Industries
AEC industries are ripe for innovation. Arguably they present a dynamic and at times an unpredictable picture to external observers. Cost, schedule, and design quality, the three indispensible pillars of capital project delivery (CPD), are often compromised beyond standards of acceptability in other industry sectors [3]. The capital project industry is also recognized for its inability to realize these improve-ments [4, 5]. Microlevel studies on change order costs in institutional construction projects place the added cost at 8% to 10% of total cost [6].
Several players in the construction sector have risen to the occasion with new research leading to management strategies to improve CPD performance (Chapter 2), like lean construction [7], Construction Industry Institute sponsored research [8], and fieldworkers’ productivity research [9]. According to Beck, current AEC practices may be responsible for 25% in field inefficiencies through practices like: “incomplete and poorly coordinated contract documents, use of shop drawings and Request For Information (RFI), change orders, outdated manufacturer specifi-cations, value engineering, quality control of drawings, and fixing and document-ing problems” [10]. This indicates a dire need for innovation both in the products and processes of CPD and how we evaluate them. In this chapter, we focus solely on the measurement of the value of innovation in the AEC industries.

208 Value-Based Design
12.1.1 Value in Design
The simplest definition of design added value (DAV) is the prediction of the value that design adds to capital projects, either post facto (measured after completion), or pre facto (predicted during design). Taking an example from industrial design, consider the new iPad by Apple for which third-party vendors have designed touch-and-view screen covers. Most of these covers are leather or vinyl pouches that snug-gly fit the iPad 2. The smart-est cover in the market, developed by Apple, is one that attaches to and detaches from the front of the device magnetically with ease. It turns the iPad 2 on and off through a sensor and folds to prop the lightweight device on its long or short side, which facilitates two different angles, one for viewing and the other for typing. The product description states, “The Smart Cover and iPad 2 were made for each other. Literally, built-in magnets draw the Smart Cover to iPad for a perfect fit that not only protects, but also wakes up, stands up, and brightens up your iPad” (http://www.apple.com/ipad/smart-cover). The costs for materials and fabrication of this cover are at most marginally higher, if at all, than the con-ventional leather or vinyl pouches. However, its slim, practical, and multifunctional aspects make it, as the ad goes, “not just smart ... genius.” We call this value added through design or DAV.
The same principle also applies to capital projects, which is illustrated by count-less buildings of note, such as Frank Lloyd Wright’s Fallingwater, the Sydney Opera House, the Guggenheim at Bilbao, the Brooklyn Bridge, and the Crystal Palace. Their design-features—the cantilevered structure of Fallingwater, the modular iron and glass skin of the Crystal Palace, and the curved, titanium-clad form of the Gug-genheim, to mention a few—have made them not only legendary, but also priceless. Even though these are expensive buildings, value-adding design, not mindless cash expenditures, rendered them of great value to their owners, users, and the general public. The following sections describe DAV analysis, a method just as valuable as other innovative technologies being applied in ECx. DAV is illustrated with ex-amples and a description of its methods.
12.1.2 Value Engineering
Because the conventional value engineering method aims to reduce costs by elimi-nating “unnecessary” design features that support secondary functions, it provides a suitable bookend for DAV analysis, which aims to assign value to features of secondary functions, thus realizing exceptional value (Figure 12.1).
“Value engineering is the systematic application of recognized techniques which identify the function of a product or service, establish a monetary value for
Figure 12.1 The two-part value engineering model [11].

12.2 Design Added Value Engineering 209
that function and provide the necessary reliability for it at the lowest overall cost” [11]. It applies to two central concepts: function and cost. It aims to minimize cost without sacrificing functionality. In value engineering, functionality, whether indis-pensible or incidental to the core purposes of a facility, is the primary objective of any design or facility. Hence, the functions of the facility are analyzed in detail with close attention paid to distinguishing primary and secondary functions. Next, the costs of the design components that correspond to these functions are estimated. By eliminating the components solely responsible for providing inessential secondary functions, the overall cost of the facility can be reduced without adversely affecting the components that serve primary functionality (Figure 12.1).
In value-based design (VBD), there is a third critical ingredient: the design fea-ture. What is tacit in value engineering (VE), that is, the physical design features and components, are explicit in VBD (Figure 12.2). Here, the same VE analysis is performed and the value-adding potential of design components, called design features, is estimated. In VBD, some design features are eliminated through VE, because they are not shown to be of any or of sufficient benefit to the project. However, these features may in fact add to the project value in unexpected ways. Such value is emergent in many creative design proposals; thus, it is justifiable for the two-part VE model to be extended to the three-part DAV analysis model (Figure 12.2).
Observing the universe of value in CPD through the lens of VE has important implications for DAV analysis. DAV resides in the flexible and selling functions and their corresponding features. Flexible functions can be altered without ad-versely affecting the permanent or principal functions; and selling functions can make the product more attractive, beyond that provided by the principal functions [11]. While VE isolates and minimizes costs of flexible and selling functions, DAV elevates their value by predicting their potential value-adding qualities. The DAV “engineer” must look for the value of selling features and the promising design op-tions for flexible functions.
12.2 Design Added Value Engineering
DAV analysis shows how design adds value to the CPD process in both quantita-tive and qualitative terms. Naturally, the field of economics is a principal ally in this mission. No stranger to the building and facility life-cycle fields, real estate
Figure 12.2 The three-part value-based design model.
210 Value-Based Design
economics, design economics, and building economics have been applied to frame this knowledge area. The underlying premise of these approaches is to ensure that the economic value aspects of AEC projects, such as investment and revenue, are managed effectively.
Often the value added to buildings by design goes unnoticed until after most, if not all, financial decisions have been undertaken. This has several deleterious effects that can be remedied through DAV. In conventional analysis, the economic impact of innovative design features cannot be estimated. If unrealized without proper evaluation, the result would be opportunity loss. Conversely, if realized, they may lead to “gold plating.” In either scenario, monetary loss is compounded by loss of reputation and innovation opportunity.
Since there is no widely accepted methodology for carrying out DAV analyses, estimates of potential value could be inaccurate. Developers and financiers assume risks to counteract the lack of methods for recognizing the importance of design features. To demonstrate positive DAV, they use private funds (P. Johnson’s Glass House [12]), inflating the expected value of these design features (the Millennium Dome [13]), and forcing clients to accept their designs on faith (F. L. Wright’s Fallingwater [14]). These practices, even with positive DAV, can damage the CPD process.
We consider DAV decisions as instances of rational choice theory [15] subject to the perceptual and subjective effects of bounded rationality [16] and heuristics [17]. Thus, we start by defining the value (V) added by design features as the prob-ability (ρ) of creating the feature times its utility (μ):
V = ρ * μ (12.1)
The economic utility of commodities like buildings relies on two quantifiable factors: the discount value and gain on investment [18]. Discount value is the es-timate of deductions due to depreciation and maintenance costs that occur over time. Gain on investment is the profit expected in the marketplace. Design features are intended to increase the value of a capital project and are subject to deprecia-tion and maintenance costs. These two factors form the negative and positive com-ponents of µ.
When deciding to invest in a design feature the following decision alternatives exist: (1) spending $X to build a facility without design features, where the dis-count value is –$x and the gain on investment +$x, versus (2) spending $Y to build a facility without design features where the discount value is –$y and the gain on investment +$y. This requires “qualitative economics” modeling to manage the dif-ferential $Y – $X. Bon, in his seminal work Building as an Economic Process [18], outlines the approach adaptable to this problem. Value of real estate economics is assessed as the interaction between the use value and the exchange value of real property. Use value is the value of real property assessed as a function of the ben-efit provided to the occupants or users of a facility, compared to the market value, which is determined by market forces such as supply and demand. Bon [18] defines the value of alternative choices in building construction decisions through the in-teraction of discounted costs to net present value (NPV) of buildings (Figure 12.3).
As the gain on investment of a capital project increases over time, the dis-count value of alternate design features declines over the same period of time. The
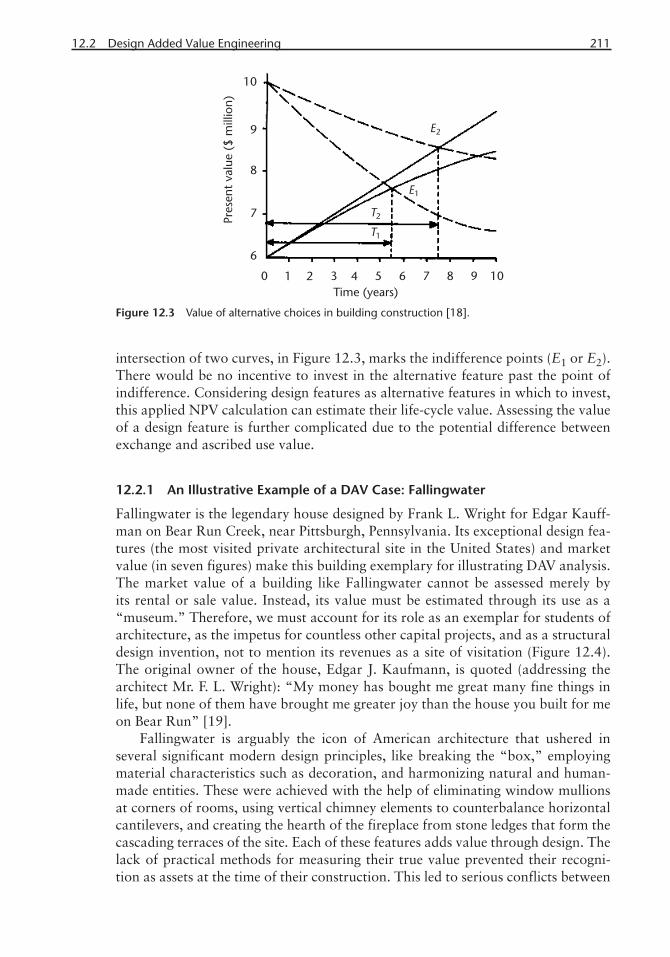
12.2 Design Added Value Engineering 211
intersection of two curves, in Figure 12.3, marks the indifference points (E1 or E2). There would be no incentive to invest in the alternative feature past the point of indifference. Considering design features as alternative features in which to invest, this applied NPV calculation can estimate their life-cycle value. Assessing the value of a design feature is further complicated due to the potential difference between exchange and ascribed use value.
12.2.1 An Illustrative Example of a DAV Case: Fallingwater
Fallingwater is the legendary house designed by Frank L. Wright for Edgar Kauff-man on Bear Run Creek, near Pittsburgh, Pennsylvania. Its exceptional design fea-tures (the most visited private architectural site in the United States) and market value (in seven figures) make this building exemplary for illustrating DAV analysis. The market value of a building like Fallingwater cannot be assessed merely by its rental or sale value. Instead, its value must be estimated through its use as a “museum.” Therefore, we must account for its role as an exemplar for students of architecture, as the impetus for countless other capital projects, and as a structural design invention, not to mention its revenues as a site of visitation (Figure 12.4). The original owner of the house, Edgar J. Kaufmann, is quoted (addressing the architect Mr. F. L. Wright): “My money has bought me great many fine things in life, but none of them have brought me greater joy than the house you built for me on Bear Run” [19].
Fallingwater is arguably the icon of American architecture that ushered in several significant modern design principles, like breaking the “box,” employing material characteristics such as decoration, and harmonizing natural and human-made entities. These were achieved with the help of eliminating window mullions at corners of rooms, using vertical chimney elements to counterbalance horizontal cantilevers, and creating the hearth of the fireplace from stone ledges that form the cascading terraces of the site. Each of these features adds value through design. The lack of practical methods for measuring their true value prevented their recogni-tion as assets at the time of their construction. This led to serious conflicts between
Figure 12.3 Value of alternative choices in building construction [18].
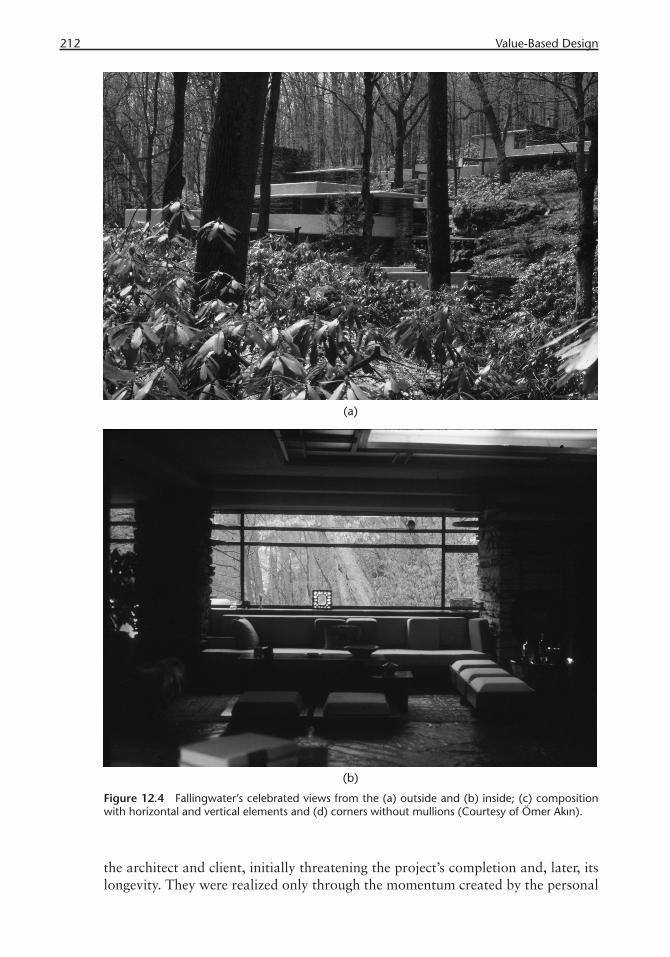
212 Value-Based Design
the architect and client, initially threatening the project’s completion and, later, its longevity. They were realized only through the momentum created by the personal
Figure 12.4 Fallingwater’s celebrated views from the (a) outside and (b) inside; (c) composition with horizontal and vertical elements and (d) corners without mullions (Courtesy of Ömer Akın).

12.2 Design Added Value Engineering 213
stature of Fallingwater’s architect and the equally remarkable staying power of its owner.
In the end, stakeholders besides the architect and the client were also affected by Fallingwater, including the host city and region (the regional economy of the “Bear Run” area), the cultural milieu (architectural industry), related professions (media and commercial products), and commerce (tourism and retail). In DAV cas-es in which the owner is a public entity, additional constituents of interest may be relevant, such as the political establishment, public institutions, and the electorate.
These stakeholders are subject to potential benefits and harms that influence their interests through different levels of impact: immediate, medium, and long term. In Fallingwater, the immediate level of impact encompasses impacts during the first year after realization of its design features. The medium level of impact comprises the next 2 to 4 years of the building’s existence. The long-term impact covers its remaining lifetime. Hence DAV analysis is conducted in a multidimen-sional space (Figure 12.5) consisting of design features, stakeholders pertaining to each feature along the three levels of impact, and the costs and benefits estimates of their utility.
The design features of Fallingwater—the cantilever structure, horizontal bands of windows, stone chimneys, retaining wall anchoring the building over the water-fall, and open corners of rooms—represent potential benefits and costs to all stake-holders. The benefits may impact each stakeholder’s finances, reputation, career,
Figure 12.4 (continued)

214 Value-Based Design
and overall goals differently. The challenge is to accurately estimate these benefits, determine if they can be included in the early stages of the design decision process, and determine if their impact on subsequent design decisions can be measured. Similarly, one should estimate the same with associated costs.
This DAV analysis is considered to be post facto because the building has al-ready been constructed and commissioned, and it does not assist the CPD process during the consideration or design of potentially value-adding features. Impacting the success of a capital project in earnest, the potential costs and benefits must be assessed pre facto at the time of the requirement specification or at the architectural programming phase.
12.2.2 DAV Cost/Benefi t Analysis
12.2.2.1 Costs
During their inception, construction, or use, all design features entail some cost. Mudge [11] decomposes CPD costs into two major categories: first costs and use costs. First costs are further divided into profit and cost of goods. In turn, cost of goods is divided into selling, general administration, and manufacturing goods, which consists of conversion and material costs, and is alternatively parsed into overhead costs that consist of field service and miscellaneous, indirect labor, and
Figure 12.5 Multidimensional space of DAV parameters per design feature.
12.2.2 DAV Cost/Benefi t Analysis 215
indirect material costs and prime costs. These are equivalent to direct labor and material costs. Use costs are divided into maintenance and operating costs (include shipping, receiving, installation, etc.). Operating, or life-cycle, costs are usually re-lated to HVAC, lighting, indoor air quality, and productivity factors. Since this is a significant component in the life of a building, it is treated as a separate item in a cost/benefit with risk (C-BR) analysis. Utility costs, maintenance costs, liability/insurance costs, promotional costs, and the like are part of the operating costs category.
Costs of capital projects are well documented, but these are generally confi-dential records that holders of this information consider private or proprietary. Sometimes the figures published or made available are difficult to classify into these categories. Interpolation of given cost figures and projections based on benchmarks obtained from similar capital projects may be useful in estimating the costs in a DAV analysis. Depending on the level of confidence ascribed to these estimates, a risk component should be assigned to each cost or benefit.
In DAV analysis, in addition to these standard categories, there are other poten-tial costs to consider. A missed deadline or a rejected design may lead to additional work, while an unevaluated or undervalued design feature presents a more serious problem for the entire project, and even the CPD industry. Without an effective means to realize innovation, the entire industry would come to a standstill. It is also important to acknowledge that realizing these innovative design features requires that associated costs must be reduced to acceptable levels.
The odds of affordable innovation improve with the designer’s years of ex-perience, self-selection of clients, and improvements in innovation methods. Fur-thermore, the CPD schedule is equally as important as quality and cost aspects of design. Delays in completion can be estimated as direct costs and opportunity costs. In some extreme cases, the inherent difficulties in realizing innovation lead to fatal design errors (Kansas City Hyatt Regency, [20]) or lengthy fault detection, diagnosis, and retrofit processes (John Hancock Tower, [21]).
12.2.2.2 Benefi ts
Each innovative design feature that requires an investment of time and resources must be assessed for its potential DAV outcome. This includes benefits to stake-holders: professionals, patrons, local institutions, culture, media, commercial es-tablishments, and political institutions (Figure 12.5). These benefits may equate to new commissions, invitations to exhibitions, publications, improved property value, improved reputation, improved tourism, new investments, and the apprecia-tion of nearby properties. While all of these are important factors for DAV analysis, the metrics and tools available to measure qualitative (such as reputation, user satisfaction, and publicity) as well as quantitative factors (such as appreciation of market value, sales receipts, number of patrons, and number of new jobs) are inad-equate. Often the data necessary to make these estimates have not been accurately recorded. Even when they are, it may be difficult to access original data sources. More often than not, creative information elicitation techniques must be used to make reliable estimates, as discussed later in this chapter.
216 Value-Based Design
12.2.2.3 Risks
Whenever innovative design features are included in a design, there are serious risks of failure. Investors and capital project assessors, who control investment decisions, are reluctant to approve unproven features. Even when design features are cleared for implementation, the expectation is that their benefits need to be realized in the short term. To implement them, an extraordinary investment of resources, often disproportionate with the payoffs, may be required. Risk analysis can provide a way to estimate the likelihood of implementation and expected returns on invest-ment. These expected benefits and the probabilities of realization provide the es-sential decision parameters, or independent variables, that must be accounted for while deciding on other dependent variables, such as decision to build, completion time, and fees for services.
The concept of risk in decision making is less associated with the notion of haz-ard and more with the probability of an event occurring. Will wearable computers be cost effective? Will the cost of energy used by the project be sustainable over the amortization period? Will the sensor network be reliable? Will the project reach the anticipated level of notoriety and success? Given alternative designs choices, these are the potential risks, the probabilities of which need to be estimated.
12.2.2.4 Cost/Benefi t Analysis with Risk
For a given design feature and stakeholder, we formulate the net effect of cost plus benefit as follows:
{α(B, t) B(t) − β (C, t) C(t)} (12.2)
where t is time, and α and β are coefficients of conversion into a common unit, for benefit (B), and cost (C), respectively. The entire term is equal to μ in (12.1).
Risk, or likelihood of events, can be measured as a function of past instances. In DAV analysis the probabilities we need to estimate are benchmarks based on past instances, which may occur infrequently. In most cases, innovative designs are one-off projects with a very scarce number of precedents. They require a special-ized reasoning such as Bayesian logic that defines probability, based on previous observations, as the degree to which a proposition is believed to be true. Starting with such an estimate, one can continuously update this “degree of truth,” or prob-ability, in the light of new events that are relevant to that truth. Bayes’ theorem formulates the conditional and marginal probabilities of current, say X, and future, say Y, stochastic events as follows [22]:
“P(X|Y) = P(Y|X) * P(X)/P(Y) (12.3)
where P(X) is the marginal probability of X; P(X|Y) is the conditional probability of X, given Y;
P(Y|X) is the conditional probability of Y given X; and P(Y) is the marginal probability of Y.”
Similar to the formulation in (12.3) based on the cost and benefit of a design feature, one can represent the DAV with risk as follows:
12.2.2 DAV Cost/Benefi t Analysis 217
{α(B, t) B(t) − β(C, t) C(t) | γ (R, t) R(t)} (12.4)
where γ is the coefficient of conversion of risk (R) into a common unit with benefit and cost for a given design feature and stakeholder. Further, the objective function of C-BR analysis for DAV aims at resolving:
max{Σk,l [Σj,i ((Bd − Cd) | Rd)]} (12.5)
where Bd are the benefits subject to risk R of a decision d; Cd are the costs subject to the same risks; Rd represents the risk factor involved in a decision d; k and l define the range of costs; and i and j define the range of benefits that could result from the decisions.
Thus, choosing a design feature intends to improve the total gain achieved after the deduction of costs. This formulation makes an obvious assumption rarely avail-able in complex decision situations: the scalability of all risks, costs, and benefits along the same measurement dimension. The measure of risk of dissatisfaction in a client meeting is very different from that of payments withheld due to change orders. Likewise the cost of human life for insurance companies is not the same as that of loss of reputation or life. Thus, at a minimum, the formulation in (12.4) must be amended to include correction factors:
max{Σ,j [Σ,l ((αBd − βCd) | ΦRd)]} (12.6)
where, α, β, and Φ are correction functions to map Bd, Cd, and Rd, into a common cardinal scale. In reality, of course this remedy is purely a theoretical one that makes an allowance for the possibility of achieving such a mapping rather than ensuring that such mappings are always feasible.
The general strategies in completing a C-BR include, but are not limited to, three methods: zero-risk, as-low-as-reasonably-achievable (ALARA), best-avail-able-control-technology (BACT), and full C-BR analysis. Zero-risk analysis is suit-able when there are no options likely to lead to a proposition K, that is P(K) = 0. These are events commonly considered to be “impossible,” such as the sun not rising, gravity not attracting, or taxes not being collected. ALARA is defined as the risks involved in all “reasonable” occurrences, such as designing a structural span within “normal” physical and monetary limits, arriving at your flight destination, or having lunch. BACT, on the other hand, applies to cases where the risks are governed by the “best” option commercially available at reasonable cost. Options outside of these strategies are subject to full C-BR analysis where one must explic-itly account for the values of risks, costs, and benefits.
Another way to define the scope of C-BR analysis is to view it in terms of certainty. When the probability of a given event is so small that it is negligible or so high that it is unavoidable, we say that there is “certainty.” When the value of risk is somewhere in between, there is uncertainty. Uncertainty implies risk. Risk must be accommodated. This involves reducing or eliminating uncertainty and risk through the acquisition of new information. The context of the risk—that is, the perception of those subject to risk, the criticality of the problem at hand, and the availability of information—is a key determinant to increasing certainty. Some in-dividuals and institutions are so risk averse that even the smallest risk must be
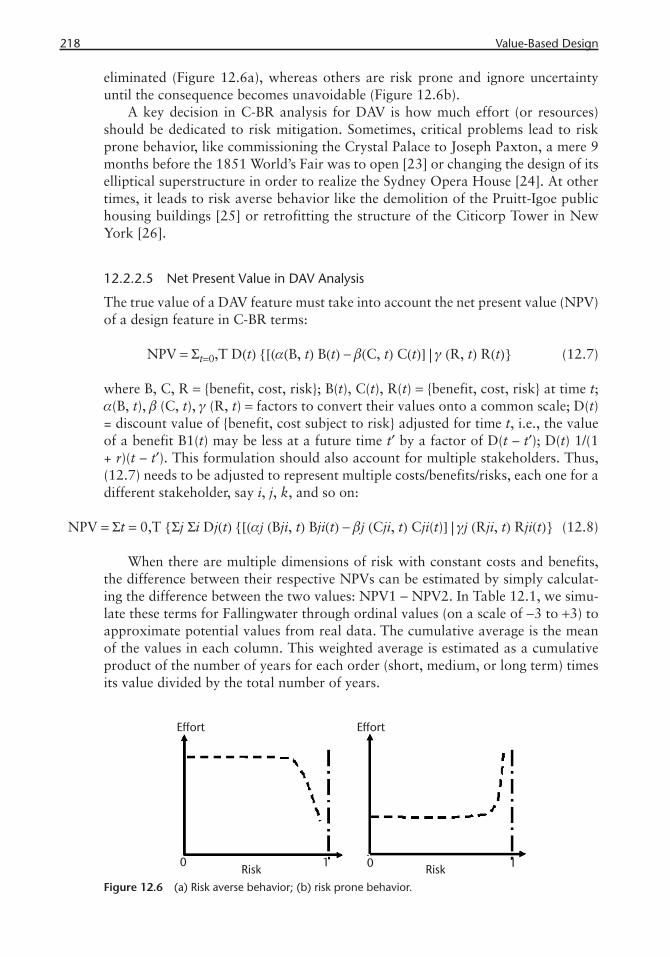
218 Value-Based Design
eliminated (Figure 12.6a), whereas others are risk prone and ignore uncertainty until the consequence becomes unavoidable (Figure 12.6b).
A key decision in C-BR analysis for DAV is how much effort (or resources) should be dedicated to risk mitigation. Sometimes, critical problems lead to risk prone behavior, like commissioning the Crystal Palace to Joseph Paxton, a mere 9 months before the 1851 World’s Fair was to open [23] or changing the design of its elliptical superstructure in order to realize the Sydney Opera House [24]. At other times, it leads to risk averse behavior like the demolition of the Pruitt-Igoe public housing buildings [25] or retrofitting the structure of the Citicorp Tower in New York [26].
12.2.2.5 Net Present Value in DAV Analysis
The true value of a DAV feature must take into account the net present value (NPV) of a design feature in C-BR terms:
NPV = Σt=0,T D(t) {[(α(B, t) B(t) − β(C, t) C(t)] | γ (R, t) R(t)} (12.7)
where B, C, R = {benefit, cost, risk}; B(t), C(t), R(t) = {benefit, cost, risk} at time t; α(B, t), β (C, t), γ (R, t) = factors to convert their values onto a common scale; D(t) = discount value of {benefit, cost subject to risk} adjusted for time t, i.e., the value of a benefit B1(t) may be less at a future time t′ by a factor of D(t – t′); D(t) 1/(1 + r)(t – t′). This formulation should also account for multiple stakeholders. Thus, (12.7) needs to be adjusted to represent multiple costs/benefits/risks, each one for a different stakeholder, say i, j, k, and so on:
NPV = Σt = 0,T {Σj Σi Dj(t) {[(αj (Bji, t) Bji(t) − βj (Cji, t) Cji(t)] | γj (Rji, t) Rji(t)} (12.8)
When there are multiple dimensions of risk with constant costs and benefits, the difference between their respective NPVs can be estimated by simply calculat-ing the difference between the two values: NPV1 − NPV2. In Table 12.1, we simu-late these terms for Fallingwater through ordinal values (on a scale of −3 to +3) to approximate potential values from real data. The cumulative average is the mean of the values in each column. This weighted average is estimated as a cumulative product of the number of years for each order (short, medium, or long term) times its value divided by the total number of years.
Figure 12.6 (a) Risk averse behavior; (b) risk prone behavior.

12.3 A Detailed Example of DAV Analysis: Swiss Re Tower, London 219
The normative sequence of tasks to undertake a DAV analysis of a given design feature includes:
1. Defi ne objectives and goals of the DAV analysis for all stakeholders.2. Identify design features that are assumed to impact the DAV for each
stakeholder.3. Measure (or estimate through benchmarks in the case of an analysis) costs
and associated risks in the realization of design features4. Measure (or estimate through benchmarks in the case of a pre facto analy-
sis) benefits and associated risks of realizing the design features.5. Sort costs and benefits into qualitative and quantitative categories.6. Add costs and benefits with similar units of measurement; aggregate all
into one summary end result.7. Repeat steps 3 through 6 for each stakeholder category.8. Summarize and communicate results to all stakeholders.
12.3 A Detailed Example of DAV Analysis: Swiss Re Tower, London
12.3.1 Introduction
The Swiss Re Tower, designed as the headquarters of the Swiss Reinsurance Com-pany, is situated at the historic core and financial district of the city of London. Designed by the architect Foster and Partners, it is one of the most distinguished and controversial office skyscraper designs in London. Officially named 30 St Mary Axe, and popularly called the “Gherkin,” the Swiss Re Tower adds a distinctive identity to the skyline of the city due to its form (Figure 12.7). In addition, this award-winning building reflects Foster’s ideals about quality of workplace and Swiss Reinsurance Company’s core values of sustainability [27].
The history of the Swiss Re Tower project begins early in the 1990s when the company decided to unite its five London offices in one building at the heart of the insurance district of London in order to incentivize interaction, interexchange of ideas, and creativity [27]. Nevertheless, the process was not straightforward and the project did not become a reality until 13 years later, in 2003. The main facts of the final project are summarized in Table 12.2.
Table 12.1 Fallingwater’s C-BR Estimate for DAV Analysis Using an Ordinal Scale of –3 to +3
CATEGORY (i, j, k, …)
(t1) First-Order Measure of (B – C)|R
(t2) Second-Order Measure of (B – C)|R
(t3) Third-Order Measure of (B – C)|R
Weighted Averageof (B – C)|R During 1936–2010
Architect 0.0 1.0 2.5 2.4
Patron 1.0 1.0 2.5 2.4
Host city and region –1.0 0.0 1.0 0.9
Culture industry and media 1.0 3.0 3.0 2.8
Linked products for sale 0.0 1.0 2.0 1.8
Political establishment 0.0 0.0 0.0 0.0
CUMULATIVE AVERAGE 0.67 1.0 1.83 1.72
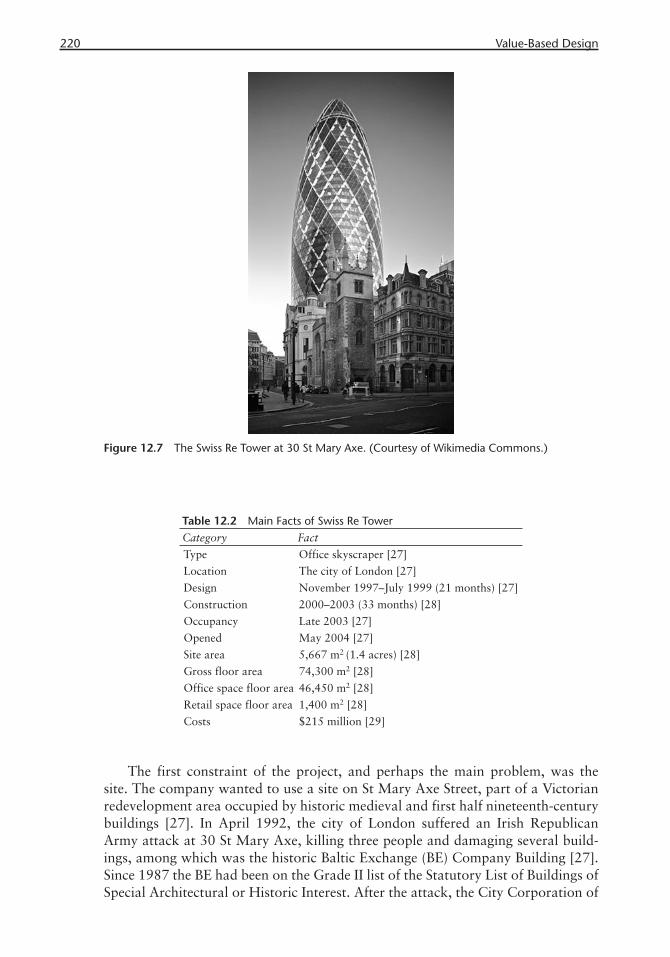
220 Value-Based Design
The first constraint of the project, and perhaps the main problem, was the site. The company wanted to use a site on St Mary Axe Street, part of a Victorian redevelopment area occupied by historic medieval and first half nineteenth-century buildings [27]. In April 1992, the city of London suffered an Irish Republican Army attack at 30 St Mary Axe, killing three people and damaging several build-ings, among which was the historic Baltic Exchange (BE) Company Building [27]. Since 1987 the BE had been on the Grade II list of the Statutory List of Buildings of Special Architectural or Historic Interest. After the attack, the City Corporation of
Table 12.2 Main Facts of Swiss Re TowerCategory Fact
Type Office skyscraper [27]
Location The city of London [27]
Design November 1997–July 1999 (21 months) [27]
Construction 2000–2003 (33 months) [28]
Occupancy Late 2003 [27]
Opened May 2004 [27]
Site area 5,667 m2 (1.4 acres) [28]
Gross floor area 74,300 m2 [28]
Office space floor area 46,450 m2 [28]
Retail space floor area 1,400 m2 [28]
Costs $215 million [29]
Figure 12.7 The Swiss Re Tower at 30 St Mary Axe. (Courtesy of Wikimedia Commons.)

12.3 A Detailed Example of DAV Analysis: Swiss Re Tower, London 221
London and the English Heritage organization ruled that any future development on the site should restore the hall and rebuild the BE façade [27].
When the burden of the historical designation reduced the market value of the property, Trafalgar House bought the site for a mere £12.5 million and started to develop a building for Swiss Re. One year after, the City Corporation allowed Tra-falgar House to explore the option of a “ground scraper” scheme that incorporated the BE façade. In 1996, the English Heritage Head Paul Drury reported that the BE building was in worse condition than expected and a restoration would be a repli-cation rather than a reconstruction. The demolition of the BE building was allowed in return for a high-quality development by a high-status architect—which makes this project a perfect candidate for DAV analysis. Two other factors supported this decision: (1) to keep the “square mile” area as a center of the financial and services activities of London and (2) to develop areas outside of the corridors that protect the view of important historic buildings [27].
Another constraint on the project was to meet the City Corporation and English Heritage’s height and shape restrictions. After several missteps, consensus around a final scheme emerged in 1999. The design evolved from a scheme that called for a 100-m-high building to one that was 180m high that was proposed—surpris-ingly—by the city authorities and their advisers, who argued that a higher building would eliminate the “bulky” appearance of the design. In July 1999, the final solu-tion was presented to the City Corporation Planning Authority for approval [27].
There was a confluence of requirements for this project from several fronts: client, architect, and city planning authorities and their advisers. In the end, these requirements could be summarized under the categories listed in Table 12.3.
12.3.2 DAV Parameters: Stakeholders
We identified 11 stakeholders for the Swiss Re Tower. Planning authorities, authori-ties’ advisers, and citizen organizations played an important role in the development of the final project design. The design process went through 21 months of negotia-tions and proposals dealing mostly with the height and shape of the building. An-other important stakeholder group was the media, which generated the “spin” and “buzz” that made the building well recognized among conservationists and the gen-eral public. All stakeholders were interested in the general impact of the building on the economics, stature, productivity, and environmental quality surrounding its site.
Table 12.3 Final Project RequirementsForty-story building, one basement, second building for services [27]
Icon for city of London [27]
Baltic Exchange site [27]
360-degrees views [27]
500,000 sq. ft. of office space [27]
200,000 sq. ft. for lease (higher rental space) [44]
40% to 50% energy Class A performance specifications
First sustainable building in London [27]
Awards [31]
Light wells (interaction between floors) [27]

222 Value-Based Design
12.3.3 DAV Analysis of the Swiss Re Tower
Based on a review of the planning, design, and execution decisions of the Swiss Re Tower, we identified five potential DAV features in its design: its 3D curved shape, the use of a diagrid structure, the cladding system, the light wells, and the use of building information modeling (BIM). To demonstrate the methods used in our DAV analysis, we will address the first two features in detail. We selected these features because with them we can maximize our coverage of the building’s impact on the stakeholders. The shape is a prime determinant of the building’s impact over the urban environment and the building’s overall cost/benefit picture.
12.3.3.1 DAV Feature: Building Form
The development of the Swiss Re Tower’s form is the result of a synthesis based on a number of criteria that were a direct response to the particular site and client re-quirements. [28] The form was achieved in two ways: First, it was based on a radial plan with a circular perimeter; second, its diameter was different for each floor, that is, it widens as it rises from its base and then tapers towards its peak. This allowed the floors at the middle of the tower to offer more floor space [30].
The radial plan of the tower responds to the constraints of the site: less space on the ground level and the desire to build less of a footprint on the ground floor in order to maximize external public space (Figure 12.8) [31, 32]. The diameter of the tower is reduced at street level, which opens up the areas in front of adjacent buildings. The tapering profile allows the reduction in floor diameter towards the top of the building, culminating in the glazed domed roof that enhances but does not dominate the London skyline [28]. The shape also appears more slender than a rectangular block of equivalent size and allows less of the sky to be obstructed [30, 31].
Figure 12.8 Tapered form of the Swiss Re Tower. It is widest in the middle. (Courtesy of Foster and Partners [27]).

12.3 A Detailed Example of DAV Analysis: Swiss Re Tower, London 223
This unusual form was not only beneficial to the project because of its unusual appearance, but it also achieved the following:
• Reduced the amount of wind deflected to the ground: Due to its aerodynamic tapering profile, there is a reduction in the amount of wind deflected to the ground as compared with rectilinear towers of similar size. This helps to maintain pedestrian comfort and safety at street level and in the plaza [31].
• Maximized the plaza space on the ground level.
• Minimized the wind loads on the structure and cladding: The building form encourages wind to flow around its face, which helps to minimize the wind loads on the structure and cladding [27].
• Assisted the natural ventilation: External wind pressure differentials are gen-erated by the building’s aerodynamic form and this helps in assisting the natural ventilation through the light wells and thus reduces the requirement for conventional air conditioning. This reduced the costs incurred for air conditioning, heating, and lighting [33].
• Enhanced the public environment at street level: The plaza space created by the radial plan opens up new views across the site to the frontages of the adjacent buildings and allows good access to and around the new develop-ment [28].
• Allowed less heat loss and less solar gain: The circular building form of the Swiss Re Tower requires up to 25% less surface area than a rectilinear build-ing, which means less area for heat loss in the winter or solar gain in the summer in addition to reduced construction costs [27, 32].
• Provided better physical and visual interconnectivity: Each floor plate of the tower is rotated by 5 degrees with respect to the floors above and below (cre-ating a light well), this provides better physical and visual interconnectivity for the users on each floor in addition to providing natural ventilation.
Cost/Benefit Analysis: Building Form.We estimated the benefit and cost picture of the building’s form in quantitative and qualitative terms, with respect to its stakeholders: architect/engineers (Norman Fosters and Partners), client (Swiss Re, reinsurance company), city and country (city of London, Britain), and culture and media ( exhibitions, books, publications, mov-ies). Table 12.4 elaborates on these aspects of the analysis.
Building Form Benchmarking.To measure and compare the form and shape of Swiss Re Tower with other build-ings, we used a benchmarking tool developed by the Construction Industry Coun-cil (CIC), the Design Quality Index (DQI). It is used to measure the quality of a building. This benchmarking tool includes simple measures of space usage, construction, engineering, and sustainability. It identifies three aspects of design
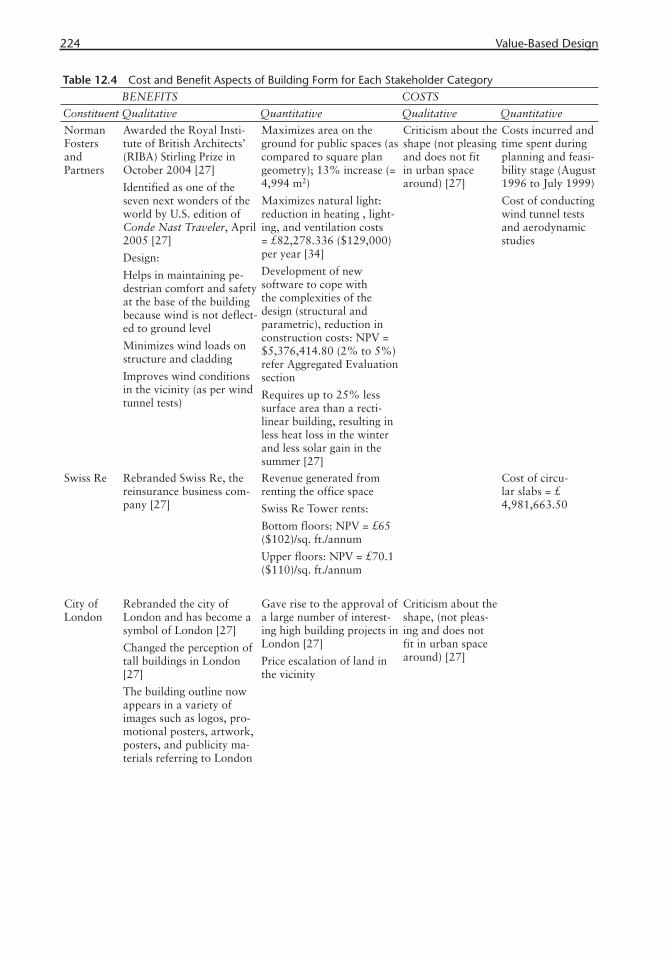
224 Value-Based Design
Table 12.4 Cost and Benefit Aspects of Building Form for Each Stakeholder CategoryBENEFITS COSTS
Constituent Qualitative Quantitative Qualitative Quantitative
Norman Fosters and Partners
Awarded the Royal Insti-tute of British Architects’ (RIBA) Stirling Prize in October 2004 [27]
Identified as one of the seven next wonders of the world by U.S. edition of Conde Nast Traveler, April 2005 [27]
Design:
Helps in maintaining pe-destrian comfort and safety at the base of the building because wind is not deflect-ed to ground level
Minimizes wind loads on structure and cladding
Improves wind conditions in the vicinity (as per wind tunnel tests)
Maximizes area on the ground for public spaces (as compared to square plan geometry); 13% increase (= 4,994 m2)
Maximizes natural light: reduction in heating , light-ing, and ventilation costs = £82,278.336 ($129,000) per year [34]
Development of new software to cope with the complexities of the design (structural and parametric), reduction in construction costs: NPV = $5,376,414.80 (2% to 5%) refer Aggregated Evaluation section
Requires up to 25% less surface area than a recti-linear building, resulting in less heat loss in the winter and less solar gain in the summer [27]
Criticism about the shape (not pleasing and does not fit in urban space around) [27]
Costs incurred and time spent during planning and feasi-bility stage (August 1996 to July 1999)
Cost of conducting wind tunnel tests and aerodynamic studies
Swiss Re Rebranded Swiss Re, the reinsurance business com-pany [27]
Revenue generated from renting the office space
Swiss Re Tower rents:
Bottom floors: NPV = £65 ($102)/sq. ft./annum
Upper floors: NPV = £70.1 ($110)/sq. ft./annum
Cost of circu-lar slabs = £ 4,981,663.50
City of London
Rebranded the city of London and has become a symbol of London [27]
Changed the perception of tall buildings in London [27]
The building outline now appears in a variety of images such as logos, pro-motional posters, artwork, posters, and publicity ma-terials referring to London
Gave rise to the approval of a large number of interest-ing high building projects in London [27]
Price escalation of land in the vicinity
Criticism about the shape, (not pleas-ing and does not fit in urban space around) [27]
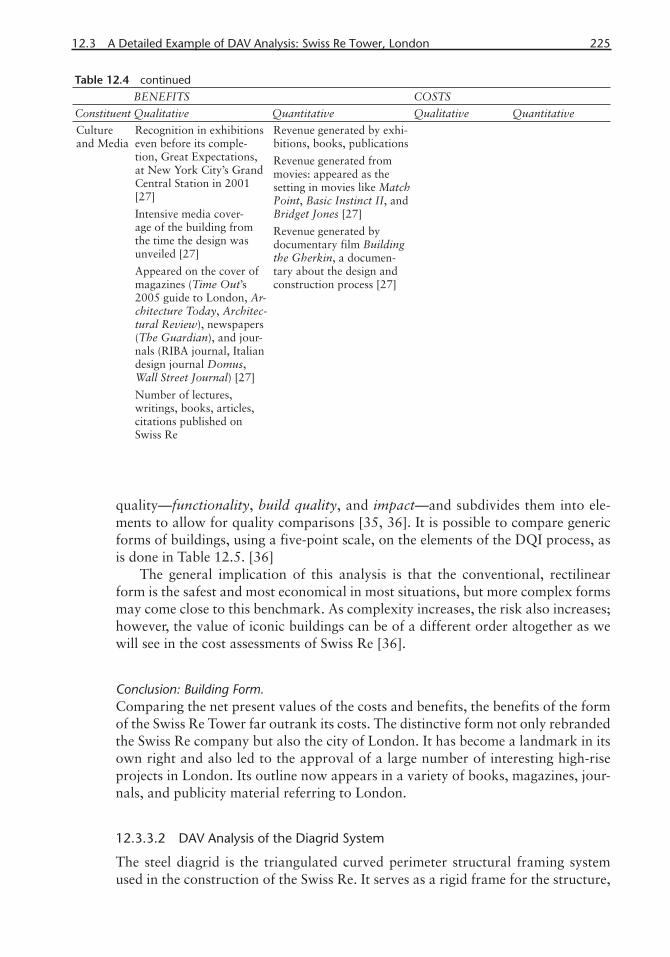
12.3 A Detailed Example of DAV Analysis: Swiss Re Tower, London 225
quality—functionality, build quality, and impact—and subdivides them into ele-ments to allow for quality comparisons [35, 36]. It is possible to compare generic forms of buildings, using a five-point scale, on the elements of the DQI process, as is done in Table 12.5. [36]
The general implication of this analysis is that the conventional, rectilinear form is the safest and most economical in most situations, but more complex forms may come close to this benchmark. As complexity increases, the risk also increases; however, the value of iconic buildings can be of a different order altogether as we will see in the cost assessments of Swiss Re [36].
Conclusion: Building Form.Comparing the net present values of the costs and benefits, the benefits of the form of the Swiss Re Tower far outrank its costs. The distinctive form not only rebranded the Swiss Re company but also the city of London. It has become a landmark in its own right and also led to the approval of a large number of interesting high-rise projects in London. Its outline now appears in a variety of books, magazines, jour-nals, and publicity material referring to London.
12.3.3.2 DAV Analysis of the Diagrid System
The steel diagrid is the triangulated curved perimeter structural framing system used in the construction of the Swiss Re. It serves as a rigid frame for the structure,
Table 12.4 continuedBENEFITS COSTS
Constituent Qualitative Quantitative Qualitative Quantitative
Culture and Media
Recognition in exhibitions even before its comple-tion, Great Expectations, at New York City’s Grand Central Station in 2001 [27]
Intensive media cover-age of the building from the time the design was unveiled [27]
Appeared on the cover of magazines (Time Out’s 2005 guide to London, Ar-chitecture Today, Architec-tural Review), newspapers (The Guardian), and jour-nals (RIBA journal, Italian design journal Domus, Wall Street Journal) [27]
Number of lectures, writings, books, articles, citations published on Swiss Re
Revenue generated by exhi-bitions, books, publications
Revenue generated from movies: appeared as the setting in movies like Match Point, Basic Instinct II, and Bridget Jones [27]
Revenue generated by documentary film Building the Gherkin, a documen-tary about the design and construction process [27]

226 Value-Based Design
apart from providing stability to the tower and vertical support for the slabs. It is a self-reliant structure, such that its service core that can take any loading. It also eliminates the need for perimeter columns as well as columns within the building [28].
The diagrid is composed of straight circular steel sections that are connected by steel nodes/junctions at the intersecting points between the sections, and at points where the geometry of the tower changes. The steel sections form two-story high A-frames, which are placed end to end to form a frame that reads as a pattern of diamonds. The diameter of the A-frame columns varies from 508 mm on the lower floors to 273 mm toward the 36th and 37th floors [28].
Each A-frame measures 9m at its base. The diagonal struts consisting of steel tubes are connected by a horizontal tie 250 mm in diameter. The wide flanged ra-dial floor beams, 540-mm-deep plate girders, span 14m between the diagrid and the central core. Adjacent beams are arranged on plan at 10 degrees so that the slab has a maximum span of 4.5m at the façade. The floor is a composite deck slab creating a horizontal diaphragm that assists in distributing the wind loads [37].
Each of the nodes is 2m high and contains three steel plates, which are welded together at varying angles to address the changing geometry of the structure, avoid-ing the need to fabricate individual end details to suit each location. Steel subcon-tractor Victor Buyck–Hollandia Joint Venture (VB-H) developed the detailed node design to meet a number of defined performance criteria, including these:
• Loading combinations involving primary structural actions, local floor ec-centricities, and cladding loads;
• Robustness tying requirements;
• Movement and restraint requirements between the diagrid structure and the floor slab;
• Erection tolerances and fit within the cladding geometry [28].
Table 12.5 Comparison of Building Forms Using the DQI Process [36]
Aspect Rectilinear2D Circular Curve 2D Spline 3D Curve 3D Spline
Example
John Hancock Tower (Chi-cago, USA)
Commerz-bank Tower (Frankfurt, Germany)
Willis Faber & Dumas office building (Ipswich, UK)
Swiss Re Tower (London)
Guggenheim Bilbao (Spain)
Use 3 2–4 2–4 2–4 2–4
Space 3 2 3 3 2–4
Performance 3 2–4 2–4 2–4 2–4
Construction 4 2–4 2 2 1
Engineering 4 3 2–4 2 1
Character and innovation
2 3 3 4 5
Urban integration 3 2 2 2–4 2–4
Internal environment 3 3 2 1–3 1–3
Form and material 4 3 2 2 1
TOTAL 29 25±2 24±4 24±4 22±5

12.3 A Detailed Example of DAV Analysis: Swiss Re Tower, London 227
At every other floor in line with the nodes, perimeter hoops encircle the build-ing, counteracting horizontal spread of the structure and binding the whole to-gether. The hoops also turn the diagrid into a very stiff triangulated shell, which provides excellent stability for the tower [28]. The diagrid construction happened on two stories at a time. However, specialized steel construction was required on the top three floors of the building (the 38th, 39th, and 40th floors), which has the domed structure. The dome is 22m tall and has eight horizontal hoops of di-minishing diameter. The steelwork required for the dome was partially fabricated in Austria, and the segments were first assembled at ground level after which the final structure was welded at the top. Some of the steel used in the project was from the remains of the Baltic Exchange building that used to exist on the site [28]. Parametric modeling was used to resolve the complex geometry of the diagrid and determine the sizes of the steel frame.
One of the main advantages of the diagrid system is the inherent ability of the members to resist compression and tension, creating a need for less steel in the building. This structural system has been used in many other projects such as the Hong Kong and Shanghai Bank in Hong Kong, the Greater London Authority in London, and Hearst Tower in New York [38]. The amount of steel and details of all of the members used in the building are summarized in Table 12.6.
Cost Benefit Analysis: Diagrid Structure.The benefit and cost picture of the building’s diagrid structure was estimated in quantitative and qualitative terms, from the vantage point of its architect, client/user, city and region, contractors (Skanska Construction), and structural engineer/steel fabricators (ARUP, Victor Buyck–Hollandia Joint Venture Ltd., and Waagner-Biro). Table 12.7 shows the results.
An assessment of the advantages and disadvantages of the diagrid system over other structural types is given in Table 12.8.
Conclusions: Diagrid Structure.It can be concluded that a diagrid structure is a structurally efficient system com-pared to other structural types for heights greater than 40 stories, with fabrication of nodes being the only disadvantage. The material savings in using the diagrid system as opposed to a braced-tube structure is substantial (Table 12.9).
Table 12.6 Steel Used in the Swiss Re Tower [28]Description Number and/or Weight
Total amount of steel used 8,358 tons
Diagrid (29% of total steel) 2,423 tons
Total number of primary steel pieces 8,348
Total length 35 km
Diagrid column size (ground–level 2) 508 mm, 40 mm thick
Diagrid column size (level 36–38) 273 mm, 12.5 mm thick
Number of nodes 360
Top dome—rectangular hollow sections 110 × 150 mm welded
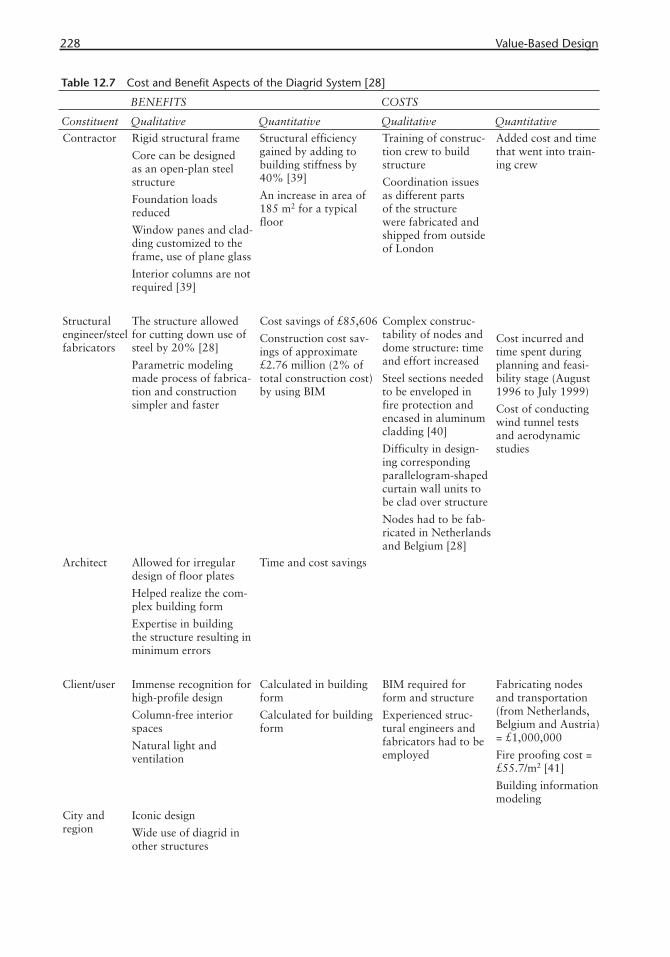
228 Value-Based Design
Table 12.7 Cost and Benefit Aspects of the Diagrid System [28]
BENEFITS COSTS
Constituent Qualitative Quantitative Qualitative Quantitative
Contractor Rigid structural frame
Core can be designed as an open-plan steel structure
Foundation loads reduced
Window panes and clad-ding customized to the frame, use of plane glass
Interior columns are not required [39]
Structural efficiency gained by adding to building stiffness by 40% [39]
An increase in area of 185 m2 for a typical floor
Training of construc-tion crew to build structure
Coordination issues as different parts of the structure were fabricated and shipped from outside of London
Added cost and time that went into train-ing crew
Structural engineer/steel fabricators
The structure allowed for cutting down use of steel by 20% [28]
Parametric modeling made process of fabrica-tion and construction simpler and faster
Cost savings of £85,606
Construction cost sav-ings of approximate £2.76 million (2% of total construction cost) by using BIM
Complex construc-tability of nodes and dome structure: time and effort increased
Steel sections needed to be enveloped in fire protection and encased in aluminum cladding [40]
Difficulty in design-ing corresponding parallelogram-shaped curtain wall units to be clad over structure
Nodes had to be fab-ricated in Netherlands and Belgium [28]
Cost incurred and time spent during planning and feasi-bility stage (August 1996 to July 1999)
Cost of conducting wind tunnel tests and aerodynamic studies
Architect Allowed for irregular design of floor plates
Helped realize the com-plex building form
Expertise in building the structure resulting in minimum errors
Time and cost savings
Client/user Immense recognition for high-profile design
Column-free interior spaces
Natural light and ventilation
Calculated in building form
Calculated for building form
BIM required for form and structure
Experienced struc-tural engineers and fabricators had to be employed
Fabricating nodes and transportation (from Netherlands, Belgium and Austria) = £1,000,000
Fire proofing cost = £55.7/m2 [41]
Building information modeling
City and region
Iconic design
Wide use of diagrid in other structures
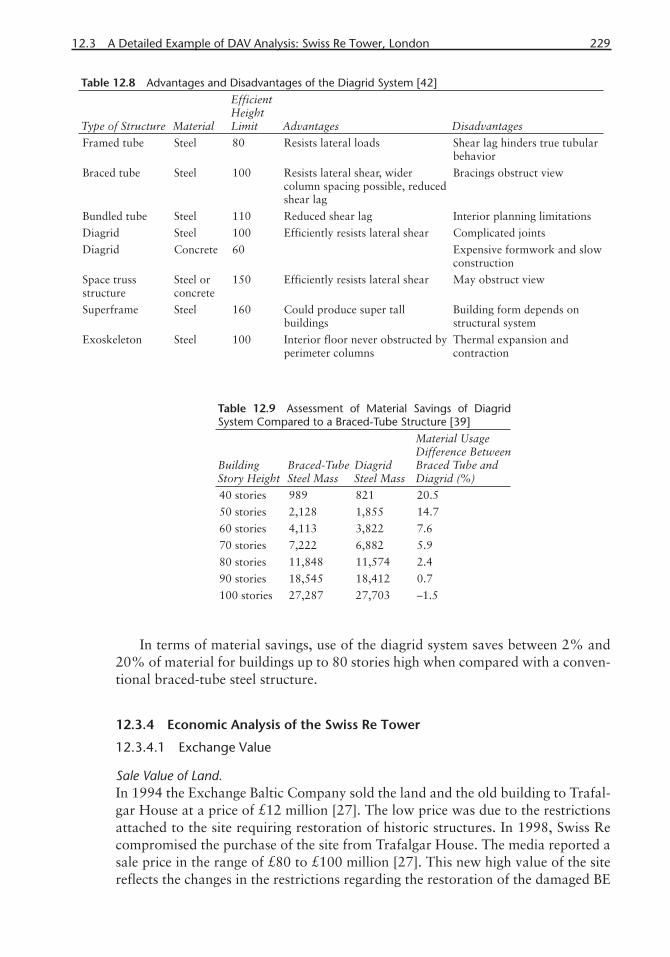
12.3 A Detailed Example of DAV Analysis: Swiss Re Tower, London 229
In terms of material savings, use of the diagrid system saves between 2% and 20% of material for buildings up to 80 stories high when compared with a conven-tional braced-tube steel structure.
12.3.4 Economic Analysis of the Swiss Re Tower
12.3.4.1 Exchange Value
Sale Value of Land.In 1994 the Exchange Baltic Company sold the land and the old building to Trafal-gar House at a price of £12 million [27]. The low price was due to the restrictions attached to the site requiring restoration of historic structures. In 1998, Swiss Re compromised the purchase of the site from Trafalgar House. The media reported a sale price in the range of £80 to £100 million [27]. This new high value of the site reflects the changes in the restrictions regarding the restoration of the damaged BE
Table 12.8 Advantages and Disadvantages of the Diagrid System [42]
Type of Structure Material
Efficient HeightLimit Advantages Disadvantages
Framed tube Steel 80 Resists lateral loads Shear lag hinders true tubular behavior
Braced tube Steel 100 Resists lateral shear, wider column spacing possible, reduced shear lag
Bracings obstruct view
Bundled tube Steel 110 Reduced shear lag Interior planning limitations
Diagrid Steel 100 Efficiently resists lateral shear Complicated joints
Diagrid Concrete 60 Expensive formwork and slow construction
Space truss structure
Steel or concrete
150 Efficiently resists lateral shear May obstruct view
Superframe Steel 160 Could produce super tall buildings
Building form depends on structural system
Exoskeleton Steel 100 Interior floor never obstructed by perimeter columns
Thermal expansion and contraction
Table 12.9 Assessment of Material Savings of Diagrid System Compared to a Braced-Tube Structure [39]
Building Story Height
Braced-Tube Steel Mass
Diagrid Steel Mass
Material Usage Difference Between Braced Tube and Diagrid (%)
40 stories 989 821 20.5
50 stories 2,128 1,855 14.7
60 stories 4,113 3,822 7.6
70 stories 7,222 6,882 5.9
80 stories 11,848 11,574 2.4
90 stories 18,545 18,412 0.7
100 stories 27,287 27,703 –1.5
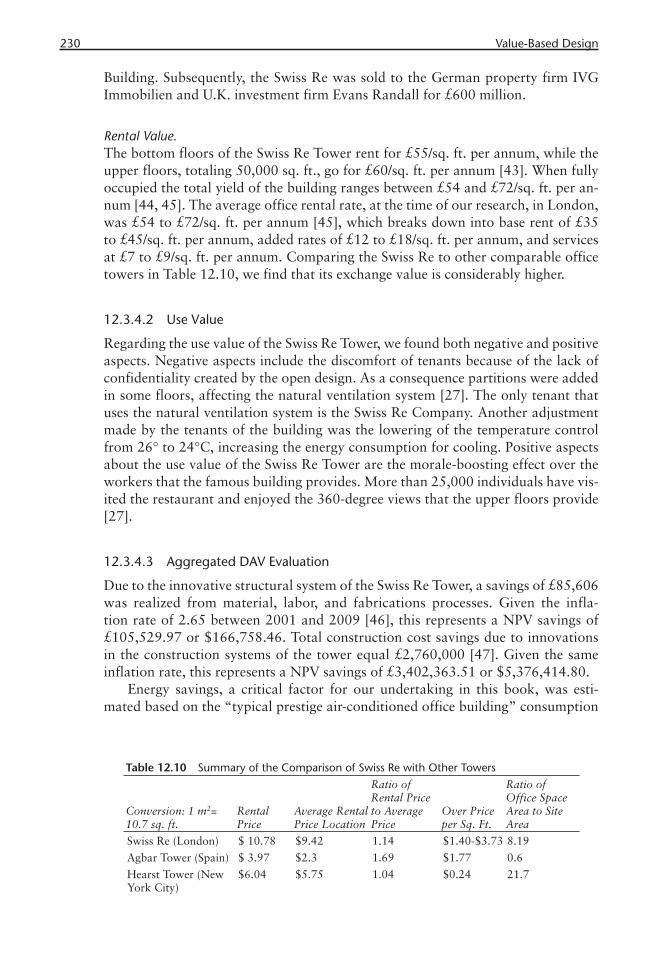
230 Value-Based Design
Building. Subsequently, the Swiss Re was sold to the German property firm IVG Immobilien and U.K. investment firm Evans Randall for £600 million.
Rental Value.The bottom floors of the Swiss Re Tower rent for £55/sq. ft. per annum, while the upper floors, totaling 50,000 sq. ft., go for £60/sq. ft. per annum [43]. When fully occupied the total yield of the building ranges between £54 and £72/sq. ft. per an-num [44, 45]. The average office rental rate, at the time of our research, in London, was £54 to £72/sq. ft. per annum [45], which breaks down into base rent of £35 to £45/sq. ft. per annum, added rates of £12 to £18/sq. ft. per annum, and services at £7 to £9/sq. ft. per annum. Comparing the Swiss Re to other comparable office towers in Table 12.10, we find that its exchange value is considerably higher.
12.3.4.2 Use Value
Regarding the use value of the Swiss Re Tower, we found both negative and positive aspects. Negative aspects include the discomfort of tenants because of the lack of confidentiality created by the open design. As a consequence partitions were added in some floors, affecting the natural ventilation system [27]. The only tenant that uses the natural ventilation system is the Swiss Re Company. Another adjustment made by the tenants of the building was the lowering of the temperature control from 26° to 24°C, increasing the energy consumption for cooling. Positive aspects about the use value of the Swiss Re Tower are the morale-boosting effect over the workers that the famous building provides. More than 25,000 individuals have vis-ited the restaurant and enjoyed the 360-degree views that the upper floors provide [27].
12.3.4.3 Aggregated DAV Evaluation
Due to the innovative structural system of the Swiss Re Tower, a savings of £85,606 was realized from material, labor, and fabrications processes. Given the infla-tion rate of 2.65 between 2001 and 2009 [46], this represents a NPV savings of £105,529.97 or $166,758.46. Total construction cost savings due to innovations in the construction systems of the tower equal £2,760,000 [47]. Given the same inflation rate, this represents a NPV savings of £3,402,363.51 or $5,376,414.80.
Energy savings, a critical factor for our undertaking in this book, was esti-mated based on the “typical prestige air-conditioned office building” consumption
Table 12.10 Summary of the Comparison of Swiss Re with Other Towers
Conversion: 1 m2= 10.7 sq. ft.
Rental Price
Average Rental Price Location
Ratio of Rental Price to Average Price
Over Price per Sq. Ft.
Ratio of Office Space Area to Site Area
Swiss Re (London) $ 10.78 $9.42 1.14 $1.40-$3.73 8.19
Agbar Tower (Spain) $ 3.97 $2.3 1.69 $1.77 0.6
Hearst Tower (New York City)
$6.04 $5.75 1.04 $0.24 21.7

12.4 Methods of DAV Engineering 231
rate of 568 kW/m2 per year. The “good practice” target consumption, based on this standard, is 348 kW/m2 per year. Swiss Re Tower energy consumption turned out to be 215 kW/m2 per year due to the cladding design and because natural ventila-tion is used 40% of the year [48]. Using the aforementioned inflation correction, this represents a NPV savings of £82,278.336 or $129,000/year.
On the other hand, the O&M functions gave rise to substantial costs. Main-tenance costs for the Swiss Re Tower equal £4,402,200 per annum (inflation cor-rected = £5,039,270). There were added maintenance costs due to the special forms and structure: £251,963.50 or $398,152.72 [49].
The total DAV calculation for the Swiss Re Tower based on its form and struc-tural system was estimated with the following assumptions:
• The net cost of finishing and fire protection for the diagrid system could not be quantified.
• Revenues from use of the building or its image in publications, movies, and so on have not been included.
• Additional costs and benefits resulting from other features such as the glass cladding and maintenance, sustainable design features, and so on, have not been included.
With these caveats the aggregate cost/benefit value of the DAV features of the Swiss Re Tower equals $5,341,010.54 to $5,452,501.04 (Table 12.11).
12.4 Methods of DAV Engineering
Let us now review some of the key methods used in the completion of a DAV analysis. These include archival documentation of parameters, carryover from prec-edents, scaling ordinal probabilities, sensitivity analysis, indifference curves, and elicitation methods.
Table 12.11 Aggregate DAV Cost/Benefit Picture for the Swiss Re Tower Based on Its Form and Diagrid Structure Features
Category Benefits–Risks Costs–Risks
Energy savings $129,000
Structural system $166,758.46
Construction cost (parametric modeling) $5,376,414.80
Increase in rental value $66,990–$178,480
Added maintenance costs (due to struc-ture and form)
$398,152.72
TOTAL $5,739,163.26–$5,850,653.76
$398,152.72
NET BENEFITS (form and diagrid structure)
$5,341,010.54– $5,452,501.04
Savings/m2 (rentable area = 47,850/m2) ($111.62–$113.95)/m2
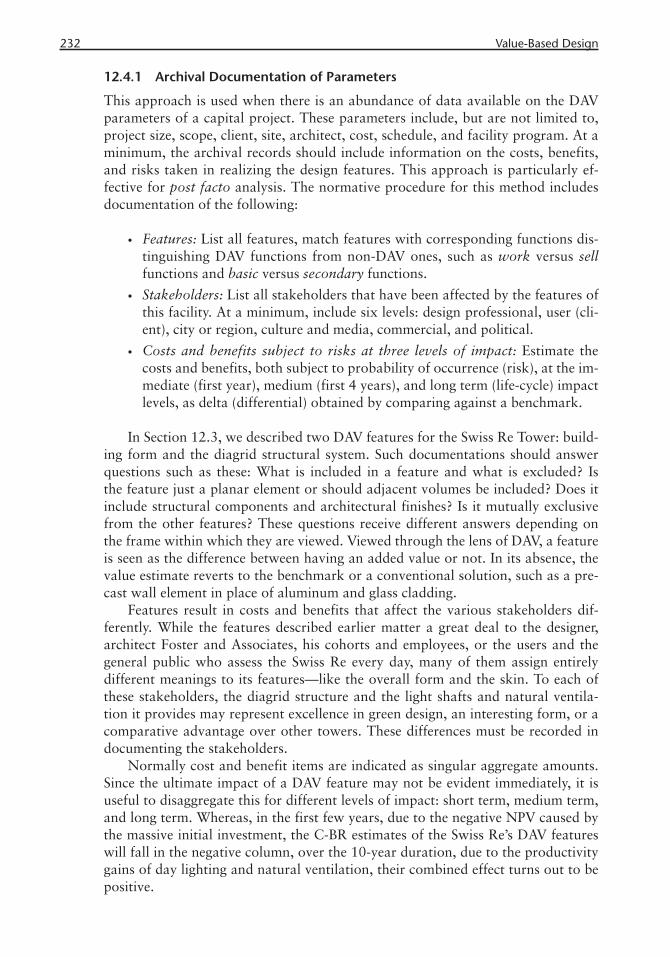
232 Value-Based Design
12.4.1 Archival Documentation of Parameters
This approach is used when there is an abundance of data available on the DAV parameters of a capital project. These parameters include, but are not limited to, project size, scope, client, site, architect, cost, schedule, and facility program. At a minimum, the archival records should include information on the costs, benefits, and risks taken in realizing the design features. This approach is particularly ef-fective for post facto analysis. The normative procedure for this method includes documentation of the following:
• Features: List all features, match features with corresponding functions dis-tinguishing DAV functions from non-DAV ones, such as work versus sell functions and basic versus secondary functions.
• Stakeholders: List all stakeholders that have been affected by the features of this facility. At a minimum, include six levels: design professional, user (cli-ent), city or region, culture and media, commercial, and political.
• Costs and benefits subject to risks at three levels of impact: Estimate the costs and benefits, both subject to probability of occurrence (risk), at the im-mediate (first year), medium (first 4 years), and long term (life-cycle) impact levels, as delta (differential) obtained by comparing against a benchmark.
In Section 12.3, we described two DAV features for the Swiss Re Tower: build-ing form and the diagrid structural system. Such documentations should answer questions such as these: What is included in a feature and what is excluded? Is the feature just a planar element or should adjacent volumes be included? Does it include structural components and architectural finishes? Is it mutually exclusive from the other features? These questions receive different answers depending on the frame within which they are viewed. Viewed through the lens of DAV, a feature is seen as the difference between having an added value or not. In its absence, the value estimate reverts to the benchmark or a conventional solution, such as a pre-cast wall element in place of aluminum and glass cladding.
Features result in costs and benefits that affect the various stakeholders dif-ferently. While the features described earlier matter a great deal to the designer, architect Foster and Associates, his cohorts and employees, or the users and the general public who assess the Swiss Re every day, many of them assign entirely different meanings to its features—like the overall form and the skin. To each of these stakeholders, the diagrid structure and the light shafts and natural ventila-tion it provides may represent excellence in green design, an interesting form, or a comparative advantage over other towers. These differences must be recorded in documenting the stakeholders.
Normally cost and benefit items are indicated as singular aggregate amounts. Since the ultimate impact of a DAV feature may not be evident immediately, it is useful to disaggregate this for different levels of impact: short term, medium term, and long term. Whereas, in the first few years, due to the negative NPV caused by the massive initial investment, the C-BR estimates of the Swiss Re’s DAV features will fall in the negative column, over the 10-year duration, due to the productivity gains of day lighting and natural ventilation, their combined effect turns out to be positive.
12.4 Methods of DAV Engineering 233
12.4.2 Carryover from Precedents
When reliable data is not available for all features of the DAV analysis, data can be carried over from suitable precedents after proper recalibration of value estimates. This method requires that the precedents at hand actually contain data that cor-respond to the categories missing in the case being analyzed. The dimensions along which the DAV project must resemble the precedent include project size, scope, cli-ent, site, architect, costs, schedules, and facility program. At a minimum, the prec-edent must have well-documented design features, costs of realizing these features, and benefits realized because of these features. Judged qualitatively, the similarity between them must be reasonably close—within approximately 10%. When these conditions are met, the procedure outlined in Section 12.3.1 can be applied.
12.4.3 Qualitative and Intervariable Estimates
Other obstacles in adapting C-BR to DAV analysis include mapping costs and ben-efits onto a common scale, quantifying ordinal evaluations, and sensitivity analysis. Ordinal scales can be instrumental in finding commonality between unlike value measurements. For example, by mapping these measurements onto a five-point ordinal scale of high, medium-high, medium, medium-low, and low, we can assign a corresponding cardinal value to each of these points, say 0.95, 0.75, 0.50, 0.25, and 0.05, respectively; thus we can aggregate the two parametric dimensions of cost and benefit, using a qualitative calculus.
The weakness of this approach is that the five-point scale used may create un-tenable sensitivities. What would happen if we assign 0.9 to high and 0.1 to low? Would the aggregated C-BR value for these two dimensions be significantly differ-ent? This is the topic of sensitivity analysis. Sensitivity analysis is the study of how uncertainty in the output of a model (in quantitative or qualitative terms) can be attributed to uncertainties hidden in the inputs to the model.
A quantitative model is defined by a series of equations, input factors, parameters, and variables aimed to characterize the process being investigated. Input is subject to many sources of uncertainty including errors of measurement, absence of infor-mation and poor or partial understanding of the driving forces and mechanisms. This uncertainty imposes a limit on our confidence in the response or output of the model. [50]
In models involving many input variables, sensitivity analysis is an essential ingredient of model building and quality assurance.
12.4.4 DAV Elicitation Methods
As discussed in Section 12.4.1, a post facto analysis, in which we estimate the costs, benefits, and risks associated with DAV features for all stakeholders at different levels of impact, is relatively straightforward. What about designs, however, that are still on the drawing board or the planning stage? How does one estimate these parameters for DAV analysis? In fact, isn’t it even more critical to have accurate estimates of these parameters at a time when the investment in their DAV features is under consideration? The decisions made pre facto, during the early design stages,
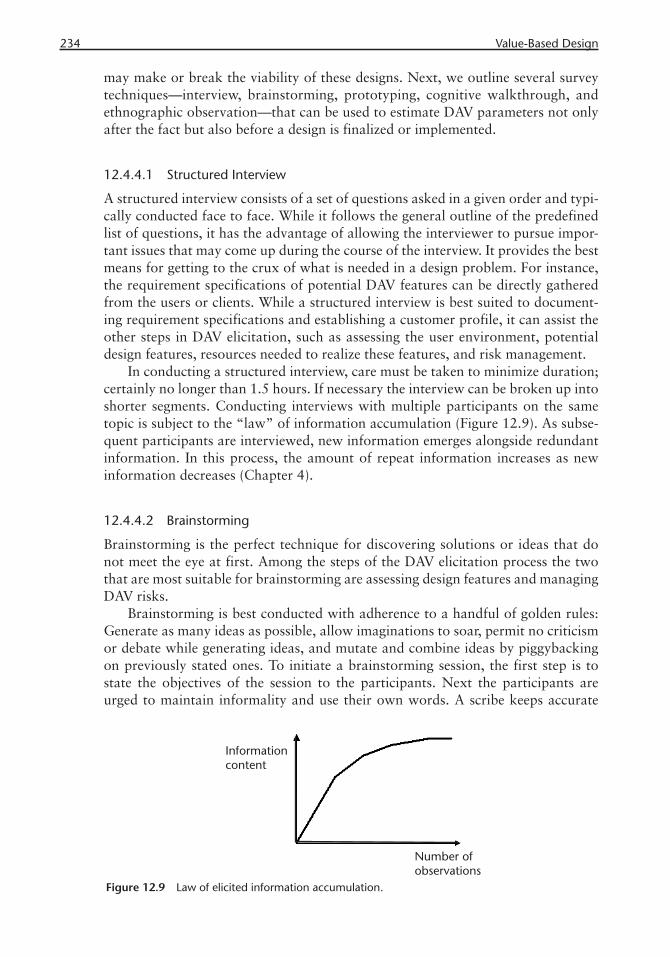
234 Value-Based Design
may make or break the viability of these designs. Next, we outline several survey techniques—interview, brainstorming, prototyping, cognitive walkthrough, and ethnographic observation—that can be used to estimate DAV parameters not only after the fact but also before a design is finalized or implemented.
12.4.4.1 Structured Interview
A structured interview consists of a set of questions asked in a given order and typi-cally conducted face to face. While it follows the general outline of the predefined list of questions, it has the advantage of allowing the interviewer to pursue impor-tant issues that may come up during the course of the interview. It provides the best means for getting to the crux of what is needed in a design problem. For instance, the requirement specifications of potential DAV features can be directly gathered from the users or clients. While a structured interview is best suited to document-ing requirement specifications and establishing a customer profile, it can assist the other steps in DAV elicitation, such as assessing the user environment, potential design features, resources needed to realize these features, and risk management.
In conducting a structured interview, care must be taken to minimize duration; certainly no longer than 1.5 hours. If necessary the interview can be broken up into shorter segments. Conducting interviews with multiple participants on the same topic is subject to the “law” of information accumulation (Figure 12.9). As subse-quent participants are interviewed, new information emerges alongside redundant information. In this process, the amount of repeat information increases as new information decreases (Chapter 4).
12.4.4.2 Brainstorming
Brainstorming is the perfect technique for discovering solutions or ideas that do not meet the eye at first. Among the steps of the DAV elicitation process the two that are most suitable for brainstorming are assessing design features and managing DAV risks.
Brainstorming is best conducted with adherence to a handful of golden rules: Generate as many ideas as possible, allow imaginations to soar, permit no criticism or debate while generating ideas, and mutate and combine ideas by piggybacking on previously stated ones. To initiate a brainstorming session, the first step is to state the objectives of the session to the participants. Next the participants are urged to maintain informality and use their own words. A scribe keeps accurate
Figure 12.9 Law of elicited information accumulation.
12.4 Methods of DAV Engineering 235
notes of keywords that represent ideas generated. Finally, the session should not exceed 1 or 1.5 hours, at most.
Once ideas have been generated, they are then edited and organized into a coherent format. First the list of keywords and clusters of keywords associated through piggybacking are pruned into a shorter list. Here judgment is required to separate ideas into three categories: unworkable ideas, workable ideas, and excep-tional ideas (albeit generated without regard for feasibility). During this stage there should be further elaboration of the key ideas and features. Finally, these ideas must meet the filter of reality. One of the best ways to reduce the scope is to priori-tize the keywords. Creating hierarchical priority schema is a vast area of research. Most approaches are based on pairwise comparison of options by predefined and prioritized criteria such as the analytical hierarchy method [51].
12.4.4.3 Prototyping
Prototyping is an approach that is best suited for assessing design feature possibili-ties in a capital project. It involves the development of an advance model or repre-sentation of the project that allows for visualization and estimates of performance. Prototyping is also helpful in correcting known design pitfalls by revealing them. “Yes, but” responses from potential users to the prototype imply indecision about the priorities associated with design features. “Undiscovered ruins” are emergent features that are hard to identify until a simulation of the design is created as a prototype. And “design biases” can be identified through the creation of visionary prototypes.
Prototypes come in several forms [52]. Some are focused on the user interface aspects of a design, such as the digital tools. Others may be more interested in per-formance issues, such as minimizing energy use in a light fixture. Some prototypes are evolutionary, where work continues on the prototype to enhance it until it closely approximates the final product. Alternatively, a prototype may be designed to be a throwaway. It is used once and then an entirely different prototype is devel-oped thereafter. Finally, prototypes can be vertical, deeply exploring all aspects of a limited section of a large project, say the lobby of a hotel design, or the cleanrooms in a lab building. They can also encompass a broad coverage of all major parts of a project, highlighting the interrelationships between these parts rather than the minute details of each feature.
12.4.4.4 Cognitive Walkthrough
A versatile elicitation method is the cognitive walkthrough. The cognitive walk-through can be used to assess the overall problem, recap the problem for the client or user toward a shared understanding, and assess the resources needed to realize design features. Cognitive walkthroughs are completed by domain experts, indi-viduals most familiar with the building type or technology. They are invited to ex-amine a legacy design or a prototype expressly developed for the problem at hand. A predefined script is followed to assess the system or design under investigation with the purpose of developing a specific, feature-by-feature evaluation. The cogni-tive walkthrough must be managed carefully by someone experienced in facilitat-
236 Value-Based Design
ing workshops. The proceedings of the walkthrough must be recorded and later analyzed for evidence to support evaluative inferences.
12.4.4.5 Ethnographic Observation
This is the most elaborate and resource intense of all elicitation methods in DAV analysis. It is most suitable for understanding the user environment and its limits in their entirety. Ethnographic observation is a structured and systematic way of codifying user behavior as it occurs in its natural context. It uses the actual events and interactions in a facility rather than creating simulations or prototypes, which are abstractions of real conditions. In addition to being naturalistic, ethnographic observations are also unobtrusive. They do not interfere with the behaviors they codify. To achieve these goals, ethnographic observation techniques involve exten-sive data recording either through video documentation or other recording means. Yet they are not limited to such recordings because the process is a multigranulated approach that includes a variety of sources of data: physical products and tools used, written records, databases, and traces of human behavior.
12.5 Analyzing the Value of Designs
In his foreword to the book titled Building Economics: Theory and Practice, Wilson wrote [1]:
The challenge is often how to determine the true costs and the true benefits of alter-native decisions. For example, what is the economic value in electric lighting sav-ings and productivity increases of providing daylight to workplace environments? Or, what is the value of saving historic structures? Alternately, what is the cost of a building integrated photovoltaic system, given that it may replace a conventional roof? The following three overarching principles associated with ensuring cost-effective construction reflect the need to accurately define costs, benefits, and basic economic assumptions:
· Utilize Cost Management and Value Engineering Throughout the Planning, Design, and Development Process: As most projects are authorized or funded without a means of increasing budgets, it is essential that the project require-ments are set by considering life-cycle costs.
· Use Economic Analysis to Evaluate Design Alternatives: In addition to first costs, facility investment decisions typically include projected cost impacts of, energy/utility use, operation and maintenance and future system replacements.
· Consider Non-Monetary Benefits such as Aesthetics, Historic Preservation, Se-curity, and Safety: Most economic models require analysts to place a dollar value on all aspects of a design to generate final results. Nevertheless it is dif-ficult to accurately value certain non-monetary building attributes, such as for-mality (for example, of a federal courthouse) or energy security. In some cases, these non-monetary issues are used as tiebreakers to quantitative analyses. In other instances, non-monetary issues can override quantitatively available cost comparisons. These cost-effectiveness principles serve as driving objectives for
12.5 Analyzing the Value of Designs 237
cost management practices in the planning, design, construction, and operation of facilities that balance cost, scope, and quality.
Wilson illustrates both the difficulty and importance of value assessment for making sound CPD decisions. He points out the importance of recognizing at once the value of photovoltaic technology and saving historic structures, while they may have conflicting end goals. It is essential for us to be able to place the relative value of divergent CPD goals on the same scale and sort out the hype from real value. Also we have to appreciate how an asset can be valuable for one group of stake-holders, but may be a liability for others. Unfortunately, we have at best crude tools to help make such decisions. Value engineering, cynically relabeled “devalue engineering,” provides a chainsaw when a scalpel is needed.
The approach that we have described and illustrated in this chapter, value-based design, will go a long way toward filling the gaps in our CPD decision-making tool case. We believe that design added value (DAV) analysis will enable designers to choose the most value-effective building technologies for the efficient use of energy in building and infrastructure systems.
References
[1] Wilson, R., “Foreword,” in Building Economics: Theory and Practice, R.T. Ruegg and H.E. Marshall, New York: Van Nostrand Reinhold, 1990.
[2] Akın, Ö., “Current Trends and Future Direction in CAD,” Chap. 1 in H. Karimi and B. Akinci (Eds.), CAD/GIS Integration: Existing and Emerging Solutions, New York: Taylor & Francis, 2008
[3] Beck, P., “The AEC Dilemma: Exploring the Barriers to Change,” in Proceedings of Design Intelligence, Greenway Communications and Design Futures Council, Washington, DC, February 1, 2001, http://www.di.net/articles/archive/2046.
[4] Teicholz, P., “Labor Productivity Declines in the Construction Industry: Causes and Rem-edies,” AECbytes Analysis, Research, Reviews, Vol. 4, 2004, http://www.aecbytes.com/viewpoints.html.
[5] LePatner, B. B., “It’s Time to Fix America’s Broken Construction Industry,” Engineering News-Record, McGraw-Hill Construction, March 12, 2008, http://enr.ecnext.com/coms2/article_tebm090429BIMDivisiono.
[6] Akın, Ö, and Anadol Z., “Determining the Impact of CADrafting on the Building Process,” International Journal of Construction Information Technology, Nos. 1–8, Spring 1993.
[7] Ballard, G., “The Lean Project Delivery System: An Update,” Lean Construction Journal, Issue 1, 2008, pp. 1–19, http://www.leanconstruction.org/lcj/paper_2008_issue.html.
[8] CII, Applicability of CII Best Practices by Industry Sector and Project Type, Aus-tin, TX: Construction Industry Institute, 2009, https://www.construction-institute.org/scriptcontent/r-teams-list.cfm?section=res.
[9] Lee, S. H, and Akin O., “Augmented Reality-Based Computational Support for Operations and Maintenance Fieldwork,” Automation in Construction, 2010.
[10] Beck, P., “The AEC Dilemma: Exploring the Barriers to Change,” in Proceedings of Design Intelligence, Greenway Communications and Design Futures Council, Washington, DC, February 1, 2001, http://www.di.net/articles/archive/2046.
[11] Mudge, A., Value Engineering, New York: J. Pohl Associates, 1989.[12] Friedman, A.T., Women and the Making of the Modern House, New Haven, CT: Yale Uni-
versity Press, 2006.

238 Value-Based Design
[13] Page, J., “My Crown of Thorns,” London: The Guardian, 2000. http://www.guardian.co.uk/uk/2000/may/04/dome.millennium1, last accessed April 18, 2011.
[14] Toker, F., Fallingwater Rising, New York: Alfred A Knopf, 2003.[15] von Neumann, J., and Morgenstern O., Theory of Games and Economic Behavior, 3rd ed.,
Princeton, NJ: Princeton University Press, 1953.[16] Simon, H.A., Models of Man: Social and Rational, New York: Wiley, 1957.[17] Kahneman, D., and Tversky A., “Prospect Theory: An Analysis of Decision Under Risk”
Econometrica, Vol. 47, 1979, pp. 263–291.[18] Bon, R., Building as an Economic Process, Upper Saddle River, NJ: Prentice Hall,1989. [19] Millar, C. J., Frank Lloyd Wright Letters to Clients The Press, Fresno: California State
University, 1986.[20] Pfrang, E.O., and Marshall R., “Collapse of the Kansas City Hyatt Regency Walkways,”
Civil Engineering—ASCE, Vol. 52, No. 7, 1982, pp. 65–69.[21] Schwartz, T. A., “Glass and Metal Curtain-Wall Fundamentals,” APT Bulletin, Vol. 32,
No. 1, 2001, pp. 37–45.[22] “Bayes’ Theorem,” Stanford Encyclopedia of Philosophy, June 28, 2003; rev. September
30, 2003, http://plato.stanford.edu/entries/bayes-theorem.[23] Hobhouse, C., 1851 and the Crystal Palace, London: John Murray, 1950.[24] Messent, D., Opera House Act One, Sydney, Australia: David Messent Photography, 1997.[25] Bauman, J. F., From Tenements to the Taylor Homes: In Search of an Urban Housing
Policy in Twentieth-Century America. University Park: Pennsylvania State University Press, 2000.
[26] Delatte, N., Beyond Failure: Forensic Case Studies for Civil Engineers, Reston, VA: ASCE Press, 2009, pp.333–345.
[27] Powell, K., 30 St Mary Axe: A Tower for London. London/New York: Merrell Publishers, 2006.
[28] Munro, D., “Swiss Re’s Building, London,” 2004 Nyheter om Stalbyggnad, NR3. 36–43. http://www.epab.bme.hu/microstation/FreeForm/Examples/SwissRe.pdf, accessed Novem-ber 27, 2010.
[29] Morrin, N. “Sustainable Landmark for Swiss Re in London,” May 2008, http://skanska-sustainability-case-studies.com/index.php/Sustainable-Landmark-for-Swiss-Re-in-London.html, accessed November 29, 2010.
[30] Bridwell, S. G., “Swiss re by Norman Foster,” Studio 489, 200, http://web.utk.edu/~archinfo/a489_f02/Phase1.html, accessed October 2010.
[31] Fosterandpartners.com, “Awards by Project,” 2010, http://www.fosterandpartners.com/Data/Awards/S.aspx, accessed October 2010.
[32] Shen, Y., “Green Design and the City, Buildings: The Gherkin, London,” October 15, 2009, http://www.greendesignetc.net/Buildings_09/Building_Shen_Yuming_paper.pdf, ac-cessed November 2010.
[33] Fedun, W., 30 St. Mary Axe by Foster and Partners, 2005, http://www.daapspace.daap.uc.edu/~larsongr/Larsonline/SkyCaseStu_fi les/SwissRe.pdf.
[34] Lawrence, H. O., and Samuel, H. W., “Purchasing Power of Money in the United States from 1774 to 2010,” MeasuringWorth, 2009.
[35] “Design Quality Indicator,” 2010, http://dqi.org.uk., accessed November 2010.[36] Howard, R., “CAD, Curved Surfaces and Building Quality.” Journal of Information Tech-
nology in Construction, Vol. 11, 2006, pp. 427–436.[37] “Architecture Steel Stahl Acier, Swiss Re London,” 2010, European Convention for Con-
structional Steelwork, http://www.steelconstruct.com.[38] McCain, I., “DiaGrid: Structural Effi ciency & Increasing Popularity,” 2009, http://www.
dsg.fgg.uni-lj.si/dubaj2009/index.php?limitstart=20, accessed November 2010.
12.5 Analyzing the Value of Designs 239
[39] Moon, K., Connor, J. J., and Fernandez, J. E., “Diagrid Structural Systems for Tall Build-ings: Characteristics and Methodology for Preliminary Design,” Structural Design of Tall and Special Buildings, Vol. 16.2, 2007, pp. 205–230.
[40] Victaulic.com, http://www.victaulic.com/content/fi reprotectionsection.htm, accessed No-vember 27, 2010.
[41] Langdon, D., Spon’s Architects’ and Builders’ Price Book, 130th ed., New York: Spon Press, 2005.
[42] Ali, M. M., and Moon, K., “Structural Developments in Tall Buildings: Current Trends and Future Prospects,” Architectural Science Review, Vol. 50.3, 2007, pp. 205–223.
[43] Rossiter, J. “The Gherkin Up for Sale for £600m,” This Is Money, September 15, 2006, http://www.thisismoney.co.uk/markets/article.html?in_article_id=412713&in_page_id=3, accessed November 25, 2010.
[44] Reinke, S. C., “Forms Follow Finances: Twisted, Turned, Tall,” in Public #3 Work Life, J. Calder (Ed.), Woods Bagot, http://www.woodsbagot.com/en/Documents/Public3.pdf.
[45] Find a London Offi ce, http://www.fi ndalondonoffi ce.co.uk/toolbox/rental-guide.[46] Williamson, S. H., “Seven Ways to Compute the Relative Value of a U.S. Dollar Amount,
1774 to present,” MeasuringWorth, 2009, http://www.measuringworth.com/calculators/infl ation/result.php, accessed April 2010.
[47] Reinhardt, J., “Computer-Aided Construction Management,” guest speaker at Course 12-611, Carnegie Mellon University, Pittsburgh, PA, November 30, 2010.
[48] Buchanan, P., “The Tower: An Anachronism Awaiting Rebirth,” Harvard Design Maga-zine, 2007, http://www.gsd.harvard.edu/research/publications/hdm/ back/26_Buchanan.pdf, Accessed November 2010.
[49] “Table 1—Importance of Maintenance and Operational Costs (Based on 2002–3 Typical Cost Figures by BMI),” Whole Life Costing, Consulting Excellence, 2004, http://www.constructingexcellence.org.uk, accessed November 2010.
[50] “Sensitivity Analysis,” Wikipedia the Free Encyclopedia, http://en.wikipedia.org/wiki/Sensitivity_analysis, last modifi ed on May 25, 2011.
[51] Saaty, T., The Analytic Hierarchy Process: Planning, Priority Setting, Resource Allocation, New York: McGraw-Hill, 1980.
[52] Davis, A. M., “Software Prototyping,” in Advances in Computers, Vol. 40, M. C. Yovits (Ed.), New York: Academic Press, 1995, pp. 39–42


241
C H A P T E R 13
Field Tools and Augmented Reality Technology
This chapter describes computational field tools and the use of augmented reality (AR) technology to support embedded commissioning (ECx) activities at the job site. First, computational field applications currently available are briefly summa-rized. Then, the use of AR technology as a means to provide data associated with commissioning activities is discussed in detail.
13.1 Need for Computational Field Tools
Because the term commissioning refers to ensuring that the target equipment is properly installed and that the performance of the equipment meets its specifi-cations, ECx activities require diverse types of data, including 2D/3D geometric models, equipment specifications, and sensor-driven performance data such as tem-perature, humidity, and flow rate readings (Part II). Traditionally, commissioning teams carry 2D blueprint drawings and specifications documents in hardcopy for-mats to the site. More specifically, during verification activities, the commissioning team determines if the equipment is installed properly at the right location and if the equipment satisfies the required performance and design specifications.
In the verification process, the commissioning team use drawings and specifica-tion documents. During the performance tests, the commissioning team determines if the equipment performs as specified by comparing performance data from sensors against specification documents and data obtained from calibrated sensors to see if a piece of equipment and its sensors are performing as intended. This traditional way of using information is inconvenient and inefficient. To facilitate information-related activities as well as the overall ECx process, computational field tools and IT technologies such as AR are helpful for collecting, manipulating, and visualizing data and for inspecting the overall performance of the entire system.
13.2 Existing Commissioning Tools
Several field tools are currently being used to support commissioning field activities. Examples include ENFORMA® Building Diagnostics (EBD), CITE-AHU, PACRAT
242 Field Tools and Augmented Reality Technology
(Performance And Continuous Re-commissioning Analysis Tool), and Whole Build-ing Diagnostician (WBD).
EBD [1] can continuously diagnose equipment and provide meaningful in-formation about the status of the equipment by utilizing data obtained from the building automation system (BAS) that controls the equipment (Chapter 9). In particular, EBD monitors energy-related performance data and reports any inef-ficiencies and their impacts. The input data for EBD includes operating schedules of the target facility, the facility’s HVAC systems information, and performance data from sensors. EBD generates various kinds of plots (e.g., time series) using the performance-related data of building systems, including the actual performance data, setpoints, and energy load profiles. With the data, EBD helps identify poten-tial operations and maintenance problems, resulting in both time and cost savings in terms of developing and executing diagnosis plans. Therefore, EBD is a useful tool for performance tests during the commissioning process because it can reveal inefficient performance on the part of the target equipment.
CITE-AHU [2] is another automated commissioning support tool specialized for air-handling units during retro-commissioning processes (Chapter 2). Through automation, it aims to save time and reduce the skill levels needed for ECx. APAR (AHU Performance Assessment Rules), a set of expert rules designed to assess the performance of AHUs, helps commissioning teams make better decisions. APAR uses operational data, like occupancy information of facilities, setpoints, perfor-mance data from deployed sensors, and design data such as specifications, ob-tained from existing sensors in the building energy management system (BEMS). The tool helps commissioning teams review control logic and sensor placement plans and accuracy, review and verify actual equipment installation in the field, capture equipment-specific information such as the operator’s knowledge and op-eration history, and verify measurements using data from the BEMS. The tool also assists with functional tests such as open-loop tests and closed-loop tests to verify the performance of AHUs by automatically executing various testing scenarios dur-ing occupied and unoccupied periods. When testing systems in occupied periods, performance data from the BEMS may be used. The tool provides interfaces to document effectively the ECx results and automatically save the documents in an HTML format.
Similarly, PACRAT [3], a data-mining tool, aims to diagnose building systems, identify poor performance, and provide the operator with the problem and corre-sponding energy waste data. PACRAT’s core functions are monitoring and verify-ing building systems, efficient data management, visualization, and documentation. PACRAT can also identify and prioritize problems, energy waste, and causes for the waste such as inefficient unoccupied period operation and inadequate setpoints. It suggests solutions; diagnoses malfunctioning system components, incorrectly cali-brated sensors, and unstable control; performs customizable analyses; and provides enterprise, historical, and interoperability data for various automation systems and energy consumption patterns.
For more accurate diagnoses, PACRAT uses NCDC (National Climatic Data Center) weather data. PACRAT calculates and documents various statistical data such as highs, lows, and averages of sensed data, system loads and space load pro-files, energy consumption and costs, and efficiencies of components. PACRAT also provides various visualization functions such as zooming, panning, time slicing,
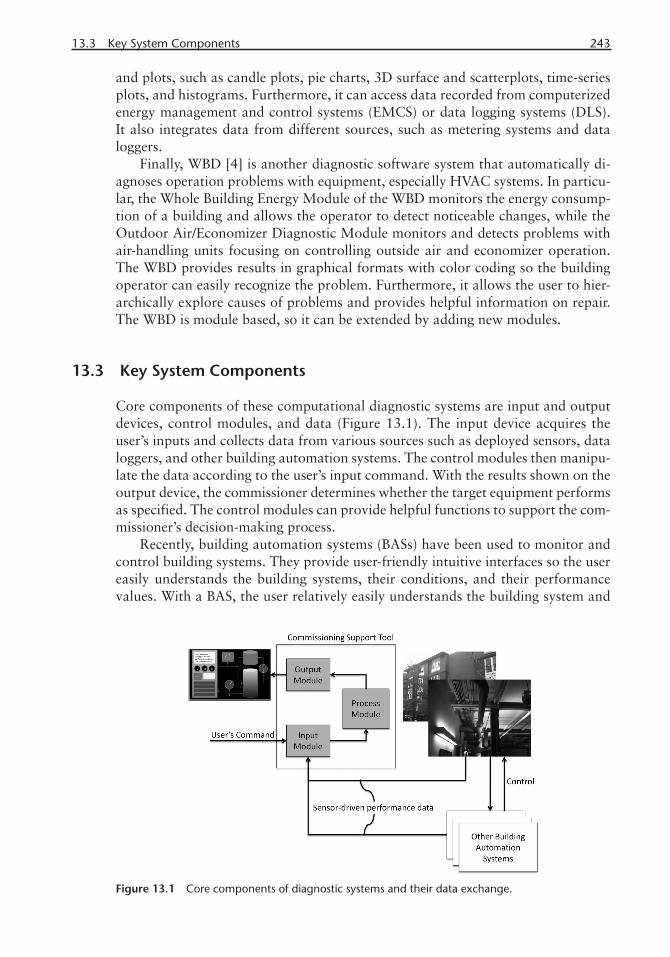
13.3 Key System Components 243
and plots, such as candle plots, pie charts, 3D surface and scatterplots, time-series plots, and histograms. Furthermore, it can access data recorded from computerized energy management and control systems (EMCS) or data logging systems (DLS). It also integrates data from different sources, such as metering systems and data loggers.
Finally, WBD [4] is another diagnostic software system that automatically di-agnoses operation problems with equipment, especially HVAC systems. In particu-lar, the Whole Building Energy Module of the WBD monitors the energy consump-tion of a building and allows the operator to detect noticeable changes, while the Outdoor Air/Economizer Diagnostic Module monitors and detects problems with air-handling units focusing on controlling outside air and economizer operation. The WBD provides results in graphical formats with color coding so the building operator can easily recognize the problem. Furthermore, it allows the user to hier-archically explore causes of problems and provides helpful information on repair. The WBD is module based, so it can be extended by adding new modules.
13.3 Key System Components
Core components of these computational diagnostic systems are input and output devices, control modules, and data (Figure 13.1). The input device acquires the user’s inputs and collects data from various sources such as deployed sensors, data loggers, and other building automation systems. The control modules then manipu-late the data according to the user’s input command. With the results shown on the output device, the commissioner determines whether the target equipment performs as specified. The control modules can provide helpful functions to support the com-missioner’s decision-making process.
Recently, building automation systems (BASs) have been used to monitor and control building systems. They provide user-friendly intuitive interfaces so the user easily understands the building systems, their conditions, and their performance values. With a BAS, the user relatively easily understands the building system and
Figure 13.1 Core components of diagnostic systems and their data exchange.

244 Field Tools and Augmented Reality Technology
can access performance-related data such as setpoints and current sensor values as well as data trends. Once the BAS has been commissioned, it becomes a tool to gauge system performance successfully throughout the entire commissioning pro-cess, especially during execution of ECx processes.
13.4 Limitations of Conventional Field Tools
Contemporary diagnostic field tools can facilitate the ECx process, especially when conducting functional performance tests (FPTs), by enabling commissioning teams to access with ease data related to the performance and condition of equipment and facilities. As described earlier, some tools detect problems and provide pos-sible causes and solutions, a helpful function for the commissioning team to verify whether the target equipment performs as intended.
However, there is a further opportunity to facilitate the ECx process. In tradi-tional commissioning, the commissioning team frequently carries hardcopy docu-ments to the site. Blueprints and equipment specification documents are substantial and weighty. Locating proper data from the documents and mapping the drawings to the actual equipment is no simple task, especially for a commissioning team un-familiar with the particular site. These inefficiencies result in wasted time because they are non-value-adding activities.
Diagrams of the target equipment and associated pieces of equipment are help-ful, but they require additional processes to locate the actual equipment. It may be even more difficult to find equipment hidden within other building elements such as walls, ceilings, and floors. Three-dimensional CAD models can provide better perception of the system for the commissioning team to understand and locate equipment, yet that process is also inefficient due to the additional time and effort needed to interpret these documents and match them against the field equipment.
Furthermore, to commission even just one piece of equipment, the diverse data types mentioned earlier are required. Existing field tools can support only a portion of the entire set of commissioning tasks. For instance, the tools described earlier fo-cus on mainly diagnosing equipment performance. CAD drawings and applications are needed to determine if the target equipment is installed as specified in the draw-ings. To digitize the ECx process, the commissioning team will use applications that allow generation of commissioning templates, open documents, and connections to other building systems.
13.5 Augmented Reality Technology for Commissioning-Support Field Tools
To overcome the limitations and improve the efficiencies of commissioning pro-cesses at the site, augmented reality (AR) technology can be adapted as a user in-terface of commissioning-support field tools. Augmented reality is a technology that recognizes objects in a video stream captured from a camera and superim-poses computer-generated data associated with the object onto the actual physical objects in real time. Head-mounted display (HMD) devices are one of the most

13.6 System Architecture of an AR System 245
popular output devices for AR technology. The user wears the device and views the processed data through its display units.
The technology is used for diverse application areas including interactive books, navigation tools, and sports broadcasting systems. Some systems require substantial computing power, whereas other applications can be executed on aver-age desktops, laptops, and even smartphones. For instance, Junaio [5] developed by Metaio, Inc., is an AR-based mobile application that recognizes the user’s loca-tion and the direction of his or her smartphone and can provide a variety of loca-tion-specific data such as local 3D maps, information on local landmark buildings, and the location of ATMs.
From the perspective of software development, AR technology, especially for smartphones, is in the early development phase, although several development platforms and programming libraries are currently available. The ARToolKit [6], its variants, and its successors comprise one of the most popular AR application de-velopment toolkits. It provides computer vision–based software libraries to detect predefined visual markers and to superimpose computer-generated geometric data. It can also import various geometry types such as OBJ and VRML using additional open-source libraries.
In the AEC/FM industry, several research projects have been conducted to de-velop and evaluate the effectiveness and potential contributions of the technology. For instance, Dunston and Wang [7] developed an AR application to identify de-sign conflicts. Khoury and Kamat [8] developed a mechanism and an application for the mechanism to track the user’s location, with precision, and assist decision-making processes in construction, inspection, maintenance, and emergencies.
As described earlier, the potential for improvement in facilitating ECx process-es by integrating various types of data and providing the data in a unified interface exists. When the target equipment is automatically identified, information-seeking activities can be minimized. The AR technology fits well within these requirements. AR-based applications are object centered, in that all functions begin with object recognition. By adding modules for interaction with other databases, AR-based applications can effectively deliver data associated only with the target equipment.
13.6 System Architecture of an AR System
Figure 13.2 depicts the system architecture of an AR-based commissioning field tool. The object detection module analyzes a video stream fed from the camera and sends the unique ID of the detected pieces of equipment to the process module. The process module then retrieves data associated with the detected equipment using that ID. The module also utilizes the user’s inputs to manipulate the data accord-ingly. Because different kinds of building data are stored in separate systems, mod-ules corresponding to each data type are required for seamless data exchange. The data is then finally displayed through the output device such as a HMD.
Furthermore, the ECx report module provides an interface to open and custom-ize templates used for commissioning the particular target equipment and reporting the results. The data obtained from the BIM database and the BAS database may be used for documentation. Images captured from the video stream can also be included in the report.

246 Field Tools and Augmented Reality Technology
For the successful use of AR technology, the AR-based field tool should have the ability to manage all of the various types of data needed to support diverse ECx activities, especially at the site where accessing data is more difficult and inconve-nient. Three-dimensional geometric models of facilities and pieces of equipment are constructed in CAD applications and specifications of facilities and equipment are stored and maintained in various documents in electronic formats (Chapter 5). The BIM approach can manage these diverse types of data and appropriate sche-mas of building models can transfer BIM data, including the Green Building XML (gbXML) and ifcXML schemas. The BIMserver [9], for instance, is an open-source building information model server that allows project participants to query and selectively retrieve building data from the central database server. The server also enables multiple users to work collaboratively and merge their work into a central database. File formats it supports include IFC 2X3, IFCXML 2X3, WebGL, KMZ (Google Earth file format), and CityGML.
Contemporary BAS manages performance-related data of the building systems they control and supports data exchange in real time. The AR-based field tools should communicate with sensors, data loggers, and BASs in real time so the com-missioning team can verify that the target equipment and facility are performing as specified. To interact with BASs and retrieve performance data, on the other hand, BACnet, LonTalk, and Zigbee are popular example protocols and specifications.
13.7 An Example AR-Based Information Support System
Augmented reality is an emerging technology that requires additional research and development to support ECx activities. Recently, researchers in the AEC/FM indus-try have paid attention to this technology and related research efforts. AR systems have been developed to support diverse activities within the AEC/FM industry. For example, Lee and Akin [10] developed a prototype application of an AR-based in-formation support field tool. The tool saves time when information is being sought and thus facilitates diagnosis and inspection field activities. The core structure of the field tool is similar to the architecture of Figure 13.2. It recognizes equipment and facilities and displays geometric models, performance data, and brief specifica-tions of the detected object.
Lee tested the field tool in a research and educational facility at Carnegie Mel-lon University. Figure 13.3 shows a typical office unit of the facility in which a mul-lion heating/cooling system is used to cool the space in summer and heat the space in winter. Discerning the heating and cooling system from other elements such as walls (architectural elements) and columns and beams (structural elements) is dif-ficult. The elements of the HVAC system such as pipes and valves located under the plenum, shown in the red box in Figure 13.3, are difficult for the commissioning team to locate and to conduct FPT as well as prefunctional checklists (PFCs).
Figures 13.4 and 13.5 show the results of how the AR-based tool supports commissioning activities. In this verification test, the tool identifies the predefined marker attached to the window, displays the name of the identified equipment, and superimposes 3D models of the mullion components of the particular facility. The model was constructed using Autodesk 3D Studio MAX and then loaded into the prototype application in the VRML file format. The user can then choose to

13.7 An Example AR-Based Information Support System 247
display detailed specifications of the equipment and associated performance data obtained from sensors. As shown in Figure 13.5, two colors distinguish equipment components hidden under the floor from those exposed above the floor so the user can intuitively understand the models and match them to the actual equipment.
Figure 13.2 System architecture of an AR-based commissioning fi eld tool.
Figure 13.3 A research and educational facility for testing the AR-based fi eld tool.

248 Field Tools and Augmented Reality Technology
Although the precision of the model superimposition requires further improve-ment, the result is accurate enough for the user to locate equipment.
13.8 Benefi ts of AR Technology
The two essential benefits of AR technology are (1) automatic recognition of ob-jects and (2) the ability to superimpose computer-generated data onto the objects in real time. When coupled with database systems for information retrieval, the user can automatically retrieve information associated only with the target objects. This technology can thus facilitate activities to obtain diverse kinds of data, especially data related to field activities.
Figure 13.4 Upper portion of the facility superimposed with data.
Figure 13.5 Lower portion of the facility superimposed with data.
13.9 Representative Commissioning Procedures Using AR Technology 249
Lee and Akin [10] evaluated the potential improvement in facilitation of infor-mation-related field activities during daily O&M, including locating equipment/fa-cilities and obtaining equipment performance data and facilities condition data by using the AR-based information support. Information-related field activities during commissioning processes are similar to those of O&M activities. Example activities include locating the target equipment and surrounding equipment associated with the target equipment, and obtaining performance data from sensors. These activi-ties are indispensable when conducting verification and performance tests during the commissioning process. Hence, the results of Lee’s experiment show the poten-tial for efficiency improvement in ECx processes.
To identify inefficiencies in traditional O&M field activities due to difficulty seeking information at the site, Lee and Akin [11] shadowed actual fieldworkers and identified inefficiencies in field activities that could be remedied through prop-er information support. On average, the O&M fieldworkers spent 12+% of their total time seeking information to conduct core activities such as diagnosis, repair, and inspection of equipment. The results further show that the potential improve-ment reaches up to 20+% time savings when transit time is included.
Lee and Akin [11] tested their AR-based information support field tool de-scribed earlier through a series of experiments conducted with O&M fieldworkers. They found that the tool saves time during information-seeking activities, resulting in improved overall efficiency. The data and information provided to the field-workers during the experiment can be categorized into three type: fundamental building information such as geometries and specifications, real-time equipment performance data and facility condition data, and maintenance data such as spare parts information and maintenance history. The results show that the AR-based field tool demonstrates potential time savings of about 50% when it locates equip-ment and facilities and an 8% time savings when obtaining sensor-driven perfor-mance data. The difference is due to the fact that current BASs already provide convenient web browser–based interfaces so that the users can easily access the sys-tem and retrieve electronic data in real time. In this particular test environment, the time savings of 8% was obtained from eliminating additional transit time, because the fieldworkers usually visited the local O&M staff’s office with requests for data.
In addition to time savings, the use of data in a fully electronic format elimi-nates the burden of carrying weighty hardcopy documents, which can make field navigation safer, particularly in hazardous settings such as bridges, highways, and high-tension electrical structures. Use of wearable computers, discussed in Chapter 14, may well enhance the benefits of AR technology.
13.9 Representative Commissioning Procedures Using AR Technology
Finally, we describe two representative ECx procedures using the AR-based infor-mation support tool. An example procedure for conducting verification tests with an AR-based information support tool would follow this outline:
1. The commissioner selects the “Verifi cation Test” option and opens a verifi -cation test template designed for the target equipment.
2. The commissioner points the field tool at the target equipment.

250 Field Tools and Augmented Reality Technology
3. The tool detects the target equipment.4. The tool retrieves the geometric model of the equipment from the BIM
server.5. The tool superimposes the geometric model based on the user’s location
and direction data onto the video stream captured through the attached camera.
6. The commissioner verifies that the equipment is installed as specified in the as-designed 3D model.
7. The commissioner selects “Specifications.” 8. The tool retrieves the specification data of the equipment from the BIM
server.9. The tool displays the specification data on an equipment specification
template.10. The commissioner determines if the actual equipment installed is the cor-
rect model specified.11. The commissioner documents the results of the verification tests using the
provided verification template. They can add pictures captured through the camera and superimposed 3D model.
12. The commissioner saves the report to the central commissioning report database.
In addition, an example procedure for conducting performance tests with the tool would include the following:
1. The commissioner selects the “Performance Tests” option and opens a per-formance test template designed for the target equipment.
2. The commissioner points the field tool at the target equipment.3. The field tool detects the target equipment from the video stream captured
through the attached camera.4. The field tool retrieves the geometric model of the equipment from the BIM
server.5. The tool superimposes the geometric model based on the user’s location
and direction data onto the video stream captured through the attached camera.
6. The commissioner selects the “Performance Data” option. 7. The tool displays a list of performance-related data sources.8. The commissioner selects sensors. 9. The tool displays current measurement and, if exists, the setpoint for each
sensor. 10. The commissioner determines if the equipment is performing as specified
with different inputs.11. The commissioner selects the “Report” option.12. The commissioner documents the results of the performance tests using the
provided template. He or she can add measured data and input commands.13. The commissioner saves the report to the central commissioning report
database.

13.9 Representative Commissioning Procedures Using AR Technology 251
The essential differences between these two processes and traditional work-flows are, first, there is no need for hardcopy documents because all documents are electronic; second, ideally all ECx activities can be completed on location without the need to move to other locations for obtaining data, because the commissioner can access all the data remotely at the location in real time. Finally, the report gen-erated is linked to the target equipment for subsequent retrieval.
References
[1] ENFORMA Building Diagnostics, http://www.pierpartnershipdemonstrations.com/docu-ments/EnformaBrochure_BOMv3.pdf .
[2] Castro, N. S., and Vaezi-Nejad, H., “CITE-AHU, An Automated Commissioning Tool for Air-Handling Units,” in Proceedings of the National Conference on Building Commission-ing, 2005.
[3] PACRAT, http://www.facilitydynamics.com/Pacwho.pdf.[4] Whole Building Diagnostician, http://availabletechnologies.pnnl.gov/technology.asp?id=60.[5] Junaio, http://www.junaio.com.[6] ARToolKit, http://www.hitl.washington.edu/artoolkit.[7] Dunston, P. S., and Wang X., “Mixed Reality-Based Visualization Interfaces for Architec-
ture, Engineering, and Construction Industry,” Journal of Construction Engineering and Management, Vol. 131, No. 12, 2005, pp. 1301–1309.
[8] Khoury, H. M., and Kamat, V. R., “High-Precision Identifi cation of Contextual Informa-tion in Location-Aware Engineering Applications,” Advanced Engineering Informatics, Vol. 23, No. 4, 2009, pp. 483–496.
[9] BIMserver, http://bimserver.org.[10] Lee, S., and Akin, Ö., “Augmented Reality-Based Computational Support for Operations
and Maintenance Fieldwork,” Automation in Construction, Vol. 20, No. 4, 2011, pp. 338–352.
[11] Lee, S., and Akin, Ö., “Shadowing Tradespeople: Ineffi ciency in Maintenance Fieldwork.” Automation in Construction, Vol. 18, No. 5, 2009, pp. 536–546.

253
C H A P T E R 1 4
JIT Technology and Wearable Computers
This chapter discusses the just-in-time (JIT) technology and wearable computers to support embedded commissioning (ECx) activities in the field. JIT technology, already popular in many manufacturing industries such as the assembly systems of Toyota and Dell Computer Corporation, reduces waste and improves productivity. As many case studies have shown the benefits of the JIT concept, more companies in diverse industries have tried to adapt the concept. Wearable computers, on the other hand, have been developed to support fieldworker activities computationally when the user’s hands and eyes must engage with the physical environment [1]. Us-ers wear devices that understand the user’s gestures and/or take direct inputs and then respond accordingly. In general, these technologies are helpful when the user needs to use his or her body freely while interacting with computing systems and when only limited computing resources are available in the field.
Currently, almost all building design and construction data are created and maintained in electronic formats throughout the data’s life cycle. It is, thus, natural to maximize the use of the electronic data throughout the entire ECx processes to improve the efficiency and accuracy of each subtask. However, in traditional practice, the commissioning team still uses hardcopy documents frequently during their field tests and then re-inputs the results to their computing systems when they return to the office. To provide effective computing systems for the ECx process at the job site, the JIT concept and wearable computing technology are discussed in this chapter.
14.1 Just-in-Time Technology
14.1.1 Introduction
Traditionally, companies predicted future demands for their products and kept in-ventories well stocked. During manufacturing, companies tried to use the minimum amount of resources to maximize their efficiency while reducing costs. However, it is not easy to accurately predict future demands, so companies often ended up maintaining large inventories to keep their production lines running, resulting in extra costs.
The types of inventories can be categorized into three groups: raw materials, work-in-process, and finished products. Keeping inventories of raw materials al-lows the company to prepare for delays in material deliveries so that the production
254 JIT Technology and Wearable Computers
line does not have to be stopped. Keeping inventories for work-in-process allows the company to continue running the main production line in the event that any particular parts cannot be produced due to unforeseen accidents. Finally, keep-ing inventories of the finished products allows the company to respond properly to unforeseen additional demands from customers. Therefore, the main objective of maintaining these inventories is to create buffers to respond to unanticipated events. However, keeping inventories on hand increases costs due to larger inven-tory spaces required and the additional resources required to maintain them.
As a business term, just in time (JIT) [1] refers to a strategy for product man-agement in which materials, parts, and subassemblies are delivered from the vendor just when they are needed in the manufacturing process. In other words, companies purchase, produce, or ship materials and parts only as needed to meet actual de-mand. The objective of the JIT strategy is to eliminate or minimize product inven-tories from the supply chain and, consequently, associated costs. When a company uses the JIT concept, it purchases enough materials, parts, and subassemblies to last for only that day of production. Products are then shipped immediately to cus-tomers. Consequently, no inventories are needed in this environment, because raw materials are purchased just in time and products are manufactured just in time to be shipped to customers. In successful implementations, such as with Toyota, companies that use the JIT concept have significantly reduced their inventories, resulting in saving costs and more efficient manufacturing.
The JIT concept works as follows: The consumers order products. The product company orders the precise number of parts for its subassembly lines in order to satisfy the needs of the final product assembly. In turn, the subassembly lines order the exact amount of raw materials from the companies that supply the materials needed by the subassembly companies. In this way, the raw materials needed by all links in the chain of part fabrication and delivery are delivered to the appropriate levels of production just in time. In the same fashion, the subassembled parts are delivered to the final assembly line just in time. The final products are delivered to the customers immediately. In this manufacturing process, under ideal conditions, no inventories are necessary.
Benefits of the JIT concept include the following:
• Better flow of raw materials, parts, and subassemblies: Because the size of raw materials to be delivered is smaller than that in traditional methods, thanks to simplified inventory flow and inventory management, the JIT method can diminish delays of material delivery.
• Saved expense of inventory maintenance: Because fewer inventories are re-quired, less expense is incurred maintaining inventories.
• Saved space from reduced inventories: Fewer raw materials, parts, and subas-semblies are stacked in storage, therefore less space is needed.
14.1.2 The JIT Concept of Information Support for Commissioning Processes
When the JIT concept is applied to the field of computational information support for the ECx process, electronic data corresponds to the raw material, parts, or sub-assemblies of the capital project delivery (CPD) sector. The manufacturing process

14.1 Just-in-Time Technology 255
in information technology corresponds to the manipulation of data so that the user can use the data JIT during ECx.
Recently, mobile computing systems, especially web-based systems, have be-come popular for supporting activities in the field. Portable devices such as rugged tablet PCs with electronic building data as well as templates for specific ECx tasks can be used in the field to eliminate hardcopy documents entirely. The ECx results recorded and documented by the field tool at the site are then directly saved to the central database, saving time and reducing errors (Figure 14.1).
The challenge with computational field systems is that portable computers such as rugged tablet PCs and smartphones, for instance, must have powerful graphics performance and large memory caches to visualize complex 3D geometric mod-els. They should also have ample storage space given sizable building models. Al-though contemporary laptops have limited computing resources, they still provide reasonable computing resources both in their screen sizes and battery capacities. Smartphones are much lighter with longer lasting batteries than laptops. They also provide fieldworkers with better usability. However, 3D graphics performance is weaker, since they focus on lightweight and easy-to-use tools. Furthermore, soft-ware applications for smartphones are limited. ECx systems that are currently available focus on providing a set of templates through web-based interfaces so that the commissioning team only needs to mark, select, and write brief comments on laptops and smartphones for maximum usability and efficiency. From this per-spective, these portable devices are a good hardware solution as an ECx field tool if properly supported.
The JIT concept can prove to be an effective solution for better use of building data with the limited computing resources available in ECx fieldwork conditions. Recently, as network infrastructures such as Wi-Fi and mobile telecommunication services have become available and reasonably fast enough to transfer the proper amount of ECx data, anyone can access the network and obtain data needed at the site. Furthermore, it is now possible to maintain electronic data in a central data-base and/or distributed databases and retrieve necessary data at the site, especially in cloud computing environments, as shown in Figure 14.1. Thus, instead of the field tool carrying large quantities of data, the data necessary at the precise place and time can be delivered just in time. Conceptually the field tool only needs to handle data relevant to the particular user’s location and present activities. There-fore, the JIT concept allows the commissioning team to overcome the limitations of
Figure 14.1 Commissioning with portable fi eld tools.
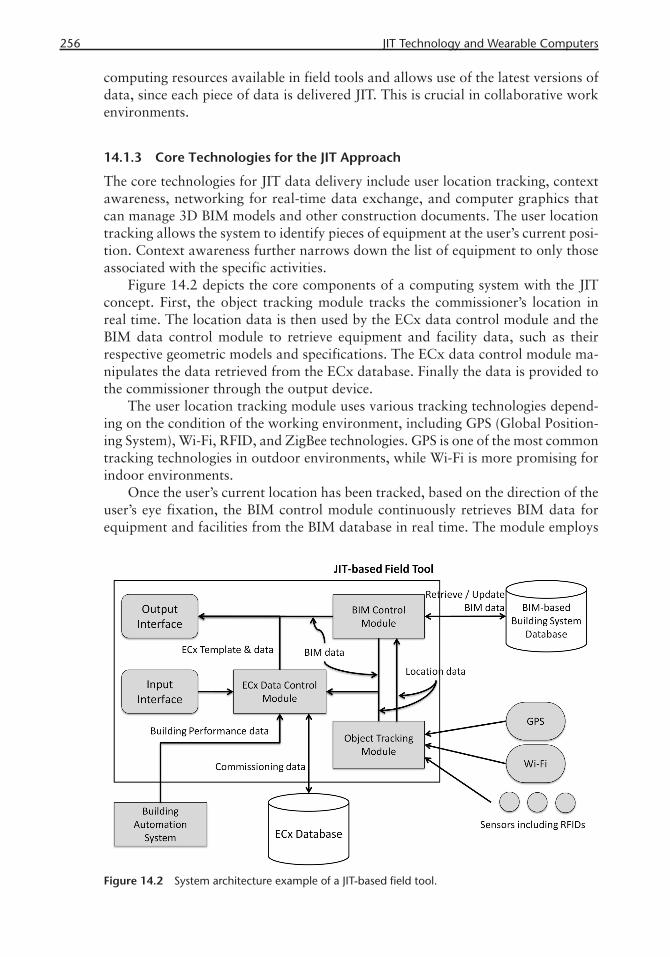
256 JIT Technology and Wearable Computers
computing resources available in field tools and allows use of the latest versions of data, since each piece of data is delivered JIT. This is crucial in collaborative work environments.
14.1.3 Core Technologies for the JIT Approach
The core technologies for JIT data delivery include user location tracking, context awareness, networking for real-time data exchange, and computer graphics that can manage 3D BIM models and other construction documents. The user location tracking allows the system to identify pieces of equipment at the user’s current posi-tion. Context awareness further narrows down the list of equipment to only those associated with the specific activities.
Figure 14.2 depicts the core components of a computing system with the JIT concept. First, the object tracking module tracks the commissioner’s location in real time. The location data is then used by the ECx data control module and the BIM data control module to retrieve equipment and facility data, such as their respective geometric models and specifications. The ECx data control module ma-nipulates the data retrieved from the ECx database. Finally the data is provided to the commissioner through the output device.
The user location tracking module uses various tracking technologies depend-ing on the condition of the working environment, including GPS (Global Position-ing System), Wi-Fi, RFID, and ZigBee technologies. GPS is one of the most common tracking technologies in outdoor environments, while Wi-Fi is more promising for indoor environments.
Once the user’s current location has been tracked, based on the direction of the user’s eye fixation, the BIM control module continuously retrieves BIM data for equipment and facilities from the BIM database in real time. The module employs
Figure 14.2 System architecture example of a JIT-based fi eld tool.

14.2 Wearable Computers 257
two different data sources to determine what equipment and facility data should be retrieved. In the first method the module uses the commissioner’s location data to identify equipment around the area from the BIM database. In the second method the object tracking module detects pieces of equipment directly from their IDs such as RFID tags. The BIM control module then uses the IDs to retrieve data from the BIM database. The retrieved data are then sent to the ECx data control module for further manipulation.
The ECx data control module is the core module that—on the commissioner’s command—manipulates data in response to the command and displays the results on the output device. Three different types of data are supplied to the module: equipment and facility data from the BIM database, equipment performance data from the building automation system (BAS), and commissioning data on templates.
Various input and output devices can be used, including wearable comput-ers, which are discussed in detail in the next section. As previously discussed, AR technology may prove one of the most suitable solutions. This technology properly visualizes 3D models of the target building system where only a portion of the en-tire model is transferred to the field tool. Thus, a proper real-time rendering of the model is generated based on the user’s location.
14.1.4 Just-in-Time Data Delivery
For the JIT concept to become a reality, computational infrastructures that support real-time data exchange must be realized. Contemporary hardware infrastructures are powerful enough to support real-time data transfer between data servers and client field tools. For performance data, BASs provide sensor-driven data in real time for the user to see the performance and the condition of the building system. BAS also alerts the operators with proper signals when it detects any abnormal behavior in the building system.
For geometric models and specifications of architectural elements, a database server such as the BIMserver [2] can provide necessary data to the commissioning team at the site. The BIMserver enables the user to manage the building informa-tion in a central database and exchange BIM data in various file formats such as IFC 2x3, KMZ, and WebGL. The commissioning team members can query, merge, and selectively retrieve the building information. Additionally, wireless communi-cation services allow smartphone users to view video streams in real time.
Therefore, during the commissioning process, once the user’s location is de-tected and target equipment as well as other relevant equipment and facilities have been identified, the field tool collects fundamental data to aid the user in perform-ing ECx activities. As the user proceeds with the ECx process, the field tool re-trieves JIT data toward the next activity.
14.2 Wearable Computers
A wearable computer is a computational device that a user wears when he or she conducts field activities. The fundamental objectives of a wearable computer are to allow users to use both hands, eliminating the need to carry portable computers; to provide an intuitive user interface that has been specially designed to support the

258 JIT Technology and Wearable Computers
particular field activity in which the user is engaged; and to improve the user’s pro-ductivity and safety. In this section, we discuss the needs and benefits of wearable computers for field ECx activities.
14.2.1 Need for Wearable Computers in Commissioning Activities
We now consider wearable computers as a means to maximize the effectiveness of computing environments developed for the ECx processes from the human/com-puter interaction (HCI) perspective. As noted earlier, construction sites may be dan-gerous especially when handling documents and devices, even laptops. Application of electronic data can partially improve the safety of the site and efficiency of ECx activities through superior software applications. In addition, wearable computers can provide viable solutions for this through superior hardware products as well as hardcoded software.
14.2.2 Wearable Computers Being Developed for Inspection
The following two example projects demonstrate different types of wearable com-puters that have been designed to address traditional paper-based inspection prac-tices. Sunkpho et al. [3, 4] developed a wearable computer for bridge inspectors, named the Mobile Inspection Assistance (MIA) device. The device provides field inspectors with mobile devices and a software application to facilitate bridge in-spection tasks by reducing a significant amount of paperwork and redundant data entry in their inspection report database. The inspectors directly input their inspec-tion results using various types of input means such as speech and stylus pens in an inspector-friendly user interface. Consequently, the device allows the inspector to spend more time on the actual inspection.
The application for this type of wearable computers is easily extended by sim-ply replacing the software application because the hardware devices were initially developed for more general applications (Figure 14.3). Boronowsky et al. [5] also address the problems of inefficient, troublesome paper-based documentation and repeated input into their computer system. As a solution, they developed a wear-able computing device, named Winspect, for inspecting steel plants. Unlike MIA, Winspect enables the user to navigate, select, and input data via the user’s gestures,
Figure 14.3 Hardware components (left) and software application (right) for MIA (Journal of Infra-structure Systems by American Society of Civil Engineers. Reproduced with permission of the Society, in the format journal via Copyright Clearance Center).

14.2 Wearable Computers 259
allowing the user free use of the hands and the ability to perform inspections in the rough working environment wearing an input glove. This device, however, was developed for the specific application area by analyzing the behaviors of the target users, and its application area is thus less extensible.
Figures 14.4 through 14.7 show example hardware sets of wearable comput-ers that use the AR technology as their output devices and sample screenshots of their output images produced and projected through their head-mounted displays (HMDs). Their core components include a camera to capture video stream, an
Figure 14.4 The AR-based wearable computer for the construction industry. (Reprinted with per-mission from Elsevier [6].
Figure 14.5 Screenshots of images through the wearable computer. (Reprinted with permission from Elsevier [6].)
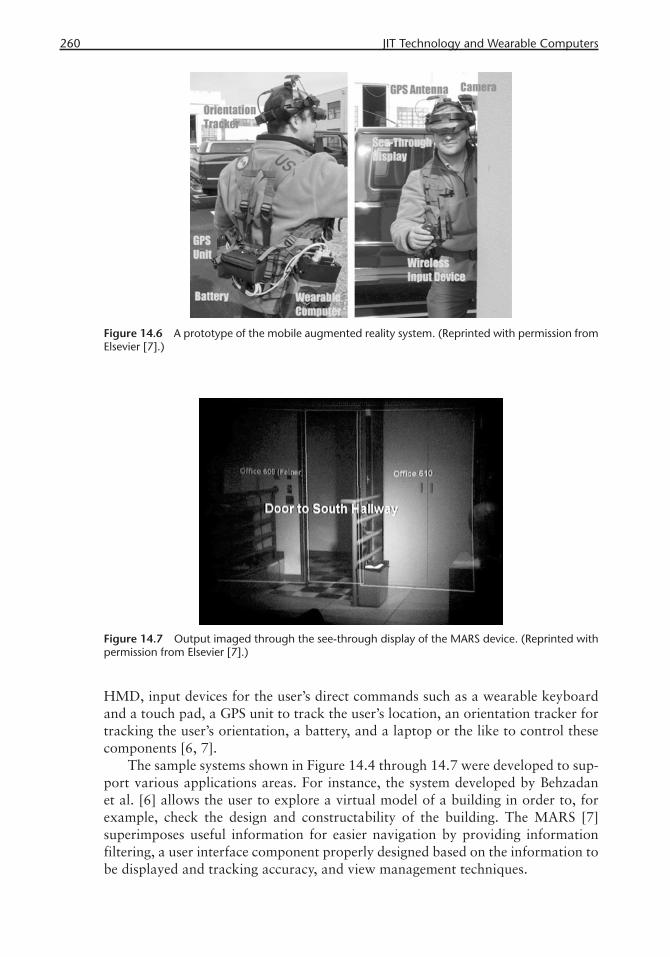
260 JIT Technology and Wearable Computers
HMD, input devices for the user’s direct commands such as a wearable keyboard and a touch pad, a GPS unit to track the user’s location, an orientation tracker for tracking the user’s orientation, a battery, and a laptop or the like to control these components [6, 7].
The sample systems shown in Figure 14.4 through 14.7 were developed to sup-port various applications areas. For instance, the system developed by Behzadan et al. [6] allows the user to explore a virtual model of a building in order to, for example, check the design and constructability of the building. The MARS [7] superimposes useful information for easier navigation by providing information filtering, a user interface component properly designed based on the information to be displayed and tracking accuracy, and view management techniques.
Figure 14.6 A prototype of the mobile augmented reality system. (Reprinted with permission from Elsevier [7].)
Figure 14.7 Output imaged through the see-through display of the MARS device. (Reprinted with permission from Elsevier [7].)

14.2 Wearable Computers 261
14.2.3 Key Components of Wearable Computers and Their Challenges
As shown in Figures 14.4 and 14.6, the core components of wearable computers include a processing unit, storage units, a power unit, input devices such as a key-board, a camera, a microphone, a motion-capturing device, and output devices such as see-through glasses, various types of screens, and speakers. Due to the challenges for each component of wearable computers, their widespread use is still emerging.
An appropriate processing unit is essential for managing 3D geometric models and for controlling diverse input/output interfaces and data exchange between the client application and the database server. Commonly, heavy computing demands and the corresponding power requirements result in heavy power consumption. The use of an appropriate processor is essential for successful wearable computing systems. Naturally, an appropriate amount of power should be available to other devices, especially to the processing units while scheduled field activities are being completed. The size and weight of batteries is an important factor because the user wears them the entire time the wearable computer is being used and the battery is one of the heaviest components. While their size presents a problem for wearable computers, storage units with proper capacity are fundamental for storing data lo-cally to prepare for unexpected network problems.
Input and output devices are the key components of a wearable computer. When developing interfaces for a wearable computer, the most critical factors in-clude size, weight, and ergonomic design. Naturally, reducing the size and weight of devices is important because the user wears all component devices. Ergonomic design provides more comfort to the user, resulting in an improvement in usability. However, because fieldworkers frequently wear gloves or protective equipment, the components of input device such as buttons should be large enough to mitigate potential user mistakes. This also applies to the design of software applications. Input devices for wearable computers include a simplified keyboard that is spe-cialized to the particular tasks, a glove that recognizes the user’s gestures, and a device specially developed for specific tasks. Output devices frequently considered for wearable computers include a small-sized screen and goggles.
If the user requires access to a remote database, the wireless networking mod-ule of the wearable computer should allow access to database servers and data retrieval. For the JIT approach, this communication should occur in real time. Furthermore, as some components of a wearable computing system are distrib-uted on the user’s body, wireless communication among components can minimize cumbersome wiring and provide the user with more comfort. For example, if the user wears input devices on the hands such as gloves or on a wrist, wires to link the central processing module and the input devices may limit the movement of the user’s arm. Another similar example would be a head-mounted display as an output device with a camera mounted on the user’s helmet.
From the perspective of software applications, the application should be devel-oped such that it minimizes power consumption and has a large, simple interface for reasoning similar to hardware interfaces.
Overall, ECx tasks at the site include diverse field inspection and measure-ment activities. Some equipment has limited accessibility and requires special ac-commodations to support ECx activities. To effectively support ECx field activi-ties in harsh environments, wearable computers should be carefully designed to
262 JIT Technology and Wearable Computers
specifically support the particular working environment. For instance, the voice recognition function is harder to implement in noisy environments. Because me-chanical rooms are commonly noisy, voice recognition may not be an appropriate feature for this environment. In this case noise filtering capability gains particular significance.
14.3 An Application Scenario Using the JIT Technology and Wearable Computers
So far, we have learned that wearable computers can help the ECx commissioner conduct key activities at a job site by providing an intuitive user-friendly interface. Given the limitations of the hardware devices discussed earlier, the JIT concept is a good solution for providing the massive amounts of data needed for commission-ing activities. The following is a sequence of activities for a performance test using a wearable computer equipped with a glove as an input device and an AR-based HMD as an output device with JIT data access:
1. The wearable computer detects the current location of the commissioner.2. The wearable computer retrieves a list of equipment and facility names in
the area from the building information database.3. The wearable computer displays the list of equipment in the area.4. The commissioner browses the list and selects the target equipment by per-
forming a series of gestures.5. The wearable computer retrieves the equipment-related data and visualizes
the data by superimposing the data through the HMD. While displaying the data, the wearable computer continues to retrieve data from adjacent equipment. When the commissioners change their direction of eye fixation, the HMD superimposes data about the equipment that is now being viewed by the commissioner. This process continues until the device is turned off.
6. The commissioner opens a template for a performance test.7. The commissioner selects “Set-Point” and inputs a value by scrolling and
selecting the value with the glove.8. The commissioner selects a sensor with gesture inputs to ensure the equip-
ment performs accordingly.9. The wearable computer retrieves current measured data from the BAS and
displays the data stream on the HMD.10. The commissioner documents the results on the template using the input
glove.11. The commissioner turns on speech mode and speaks his comments.12. The wearable computer records the speech and converts it into text.13. The commissioner saves the record as well as the text.14. The wearable computer saves the new report on the local storage space as
well as the central commissioning report database.
This scenario is developed to reflect the use of a wearable computer and JIT data exchange approach, based on the example in the previous chapter. Therefore,
14.3 An Application Scenario Using the JIT Technology and Wearable Computers 263
the overall sequence of the activities is similar, but the methods in this scenario to input the commissioner’s commands and display the outputs are specifically de-scribed to emphasize the implementation of these technologies. However, in spite of the dramatic benefits expected, to date, owing to the newness of this technology, little field experience or statistics are available to back up these claims. Their effica-cy will be verified only in due time. In spite of the speculative nature of our predic-tions, the promise of emerging developments in this area should not go unnoticed.
Hardware devices are becoming smaller, thinner, and thus light enough to carry with ease. Many tablet PCs have embedded cameras that provide video streams and a touchscreen that allows the user to input commands using their fingers. The components of a wearable computer can seamlessly communicate with each other wirelessly using, for instance, the Bluetooth protocol as well as with other systems using the Internet. Therefore, it is likely to expect a wearable computing system specialized to support ECx activities at job sites in the near future.
References
[1] “Wearable Computer,” Wikipedia, http://en.wikipedia.org/wiki/Wearable_computer.[2] BIMserver, http://bimserver.org.[3] Sunkpho, J., Garrett, J., and McNeil, S., “A Framework for Field Inspection Support Sys-
tems Applied to Bridge Inspection,” in Proceedings of the 7th International Conference on the Applications of Advanced Technologies in Transportation, Cambridge MA, August 5–7, pp. 417–424.
[4] Sunkpho, J., Garrett, J. H., Jr., and McNeil, S., “XML-Based Inspection Modeling for Developing Field Inspection Support Systems,” Journal of Infrastructure Systems, Vol. 11, No. 3, 2005, pp. 190–200.
[5] Boronowsky, M., et al., “Winspect: A Case Study for Wearable Computing-Supported In-spection Tasks,” in Proceedings of the 5th International Symposium on Wearable Comput-ers, 2001.
[6] Behzadan, A. H., Timm, B. W., and Kamat, V. R., “General Purpose Modular Hardware and Software Framework for Mobile Outdoor Augmented Reality Applications in Engi-neering,” Advanced Engineering Informatics, No. 22, 2008, pp. 90–105.
[7] Höllerer, T., et al., “User Interface Management Techniques for Collaborative Mobile Aug-mented Reality,” Computers and Graphics, Vol. 25, No. 5, 2001, pp. 799–810.

265
C H A P T E R 15
Future of Embedded Commissioning: What Is Possible in 20 Years?
In the preceding 14 chapters, we described the basic tenets, methods, and tools of embedded commissioning (ECx) and how we envision it will transform capital proj-ect delivery (CPD) and evaluation in the years to come. The primary strategy has been to create an entirely new approach to building evaluation by merging building commissioning methods and information technologies into a new framework of methods called ECx. We began describing this framework through three successive preface sections that also served as an introduction to each of the three parts of this book. Figures 2.4, 2.5, and III.1 are integrated into a single IDEF0 diagram in Figure 15.1 to help the reader visualize the ingredients of this framework and their relationships.
Perhaps more ambitious than any of the preceding ones, the task of this chapter is to envision, based on the ECx framework (Figure 15.1), what should be possible in 20 years’ time. First we explore a vision for what is possible in the physical world of capital projects. Then we envision the future of the world of facility manage-ment. We follow this with a detailed view of the future state of ECx. Next, we shift our focus to visions of information technology futures—product models and digital infrastructures. Finally, we consider a vision of the world of the owners/users of facilities and the marketplace of capital projects.
15.1 What Is Possible in the Physical World of Capital Projects?
Buildings and building infrastructures have come a long way. Historically, building technology has caused significant shifts in the way buildings are constructed. Inno-vations realized during the Renaissance (16th and 18th centuries), Neo-Classicism (18th and 19th centuries), Modernism (19th and 20th centuries), or Post-Modern-ism (20th century) periods were all based on sociocultural shifts enabled by new technology. For instance, the increase of glazing in the Renaissance façade, the flex-ibility of interior planning achieved through the pattern books of Neo-Classicism, the industrial mass production of buildings achieved during the Modern Era, and the diversity of use and technology admitted into the production of buildings during Post-Modernism are all shifts in the CPD process ushered in by revolutionary tech-nologies of the past [1]. Today, by virtue of the merging of building and information
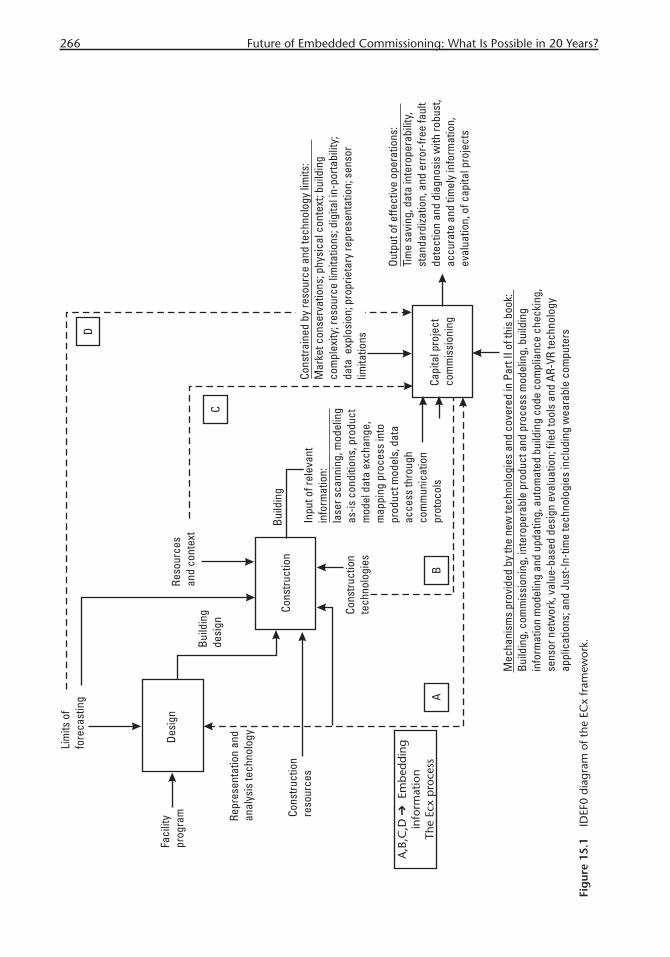
266 Future of Embedded Commissioning: What Is Possible in 20 Years?
Fig
ure
15.1
ID
EF0
diag
ram
of t
he E
Cx
fram
ewor
k.
15.2 Envisioning the Future of the World of Facility Management 267
technologies, including the personal computer, the Internet, handheld and wearable computers, sensors, BIM, BACnet, IFC, and intelligent computer applications that harvest, mine, and package relevant information, we are at the cusp of a new and powerful shift in the way we build and evaluate capital projects.
In a mere two decades from now, we will be able to “dial up” information about manufacturer specifications of equipment and building parts, specific build-ing histories, codes and ordinances applicable to specific situations, and integrated CAD-GIS databases [2], at will, from handheld and wearable devices. In addition, buildings will possess intelligence and initiate self-intervention automatically or through human contact.
We envision that buildings will be equipped with sensors, actuators, gateways, and reasoning mechanisms to be able to send precise alerts when systems fall to undesirable efficiency or performance levels. Live performance tracking that is re-motely adjustable through PDAs or wearable devices will screen false positives and highlight critical fault detection and diagnosis (FDD) results. FDD will be achieved through collaboration among self-regulating building systems and facility manage-ment and operations staff. Minor fixes will be carried out by self-correcting actua-tors and sophisticated, decentralized control systems. On the web, interoperable and standardized communication connections to updated manufacturer specifica-tions and pricing information will facilitate identification, procurement, repair, and replacement of systems.
15.2 Envisioning the Future of the World of Facility Management
The field of facility management will become a true collaboration between man and machine. Sensors in building system components will send alerts to a facility manager when components fatigue or fail. In states of emergency, sensors will di-rectly contact emergency response personnel, before the condition becomes critical. Sensors will become an integral part of building materials and will alert occupants to moisture, termites, and other forms of undesirable penetration in the cladding system [3]. Systems for close-fit buildings will automatically adjust exterior skin to optimize daylight, temperature differentials, and moisture and sound insulation properties. Controls systems will be linked to geographic databases gathering live weather data, self-adjusting systems settings based on local conditions, operational parameters, maintenance histories, and user needs.
Although many of these technologies are available even today, their seamless interconnection is the Achilles heel of current facility management practices. In a case study we conducted in an institutional setting, we discovered useful be-hind-the-scenes information about emergency management practices. In December 2007, a water main burst open, submerging documents, furniture, and desktops in waist-deep water and threatened to do the same to the electrical panels servicing entire wings of an eight-story-high institutional building. As the clock ticked the facility management personnel scrambled to locate the main water valve that could control the pipe rupture. More than 4 hours and several false attempts at fixing the problem later, it was discovered that the faulty water main was merely passing through the building in question, to service a neighboring building, not the current one. Consequently, it was not included in the CAD files of the building but was

268 Future of Embedded Commissioning: What Is Possible in 20 Years?
present only in the GIS files that included the entire campus plan. This case high-lights the lack of coordination that exists in BIM documentation.
In a similar near-catastrophic water-main break case, the same campus expe-rienced the potential impact of incomplete information, this time in the city water authority’s documentation. Several hours passed before facility managers could locate the city employee who knew the location of the valve that he had installed months ago in a retrofit job and never recorded on the blueprints.
We envision a world in which JIT information, such as specifications about newly installed equipment and the locations of all pipes and maintenance items (servicing both local and global destinations), is marked in situ with the help of sensors, RFID tags, and other information capture-and-store devices. Handheld devices including cell phones will be used to grab information from a myriad of radio-frequency threads already present in the space around us.
15.3 A Vision of the Future State of ECx
In principle, ECx is a simple process. It compares the required performance of a capital project against its actual performance. If the desirable temperature setpoint for an indoor space is 68°F throughout the calendar year, then we should measure the temperature in that space and check it against the setpoint value. Complications arise because of difficulties like these:
• Is there an appropriate room to use in the facility of interest?
• What is the best way to measure the ambient temperature in a room?
• During which time(s) should these measurement(s) be taken?
• How can we verify that the setpoint value is satisfied?
• How can we validate that the measured value is adequate for occupant com-fort or productivity?
Once these questions have been satisfied we still face further problems of what to do when the measured and expected values do not agree.
• What magnitude of difference between these values signifies agreement or disagreement?
• If there is disagreement, which value is incorrect?
• If the expected value is incorrect, how can we obtain a correct value?
• If the measured value is off, where in the system is the fault?
• If a fault is detected, how can we correct the system defect?
15.3.1 Locating Rooms and Equipment
Questions of location may seem trivial, but given the complexity of modern facili-ties, finding a particular location or a piece of equipment can be tricky. The reasons behind this include rapid change of equipment and rooms, and the lack of proper updates of information about facilities. In one of our shadowing experiments of
15.3 A Vision of the Future State of ECx 269
an electrician in an institutional setting, we discovered that physically locating an electrical box that is behind other equipment and painted black for architectural reasons can take up to 5 hours (Chapter 13) [4].
We envision a world in which capital projects are accurately modeled in BIM systems that are interoperable with facility maintenance information and docu-ments. These data banks are updated with as-built and as-modified data in a timely and accurate manner (Chapters 5 and 6) [5]. With the help of JIT information ac-cess systems and wearable computers, ECx agents will be able to locate facilities and equipment with ease and accuracy.
15.3.2 Measuring Ambient Temperature
Setpoint information recorded in an HVAC control system is at best approximate. Sometimes it specifies the time frame during which this must be observed. Even then the location of the measurement is dependent on the thermostat location, sensor availability, and the schedule of these readings. Due to variations in time and location, the spot measurements could vary drastically from the “average” or “representative” value gathered by the thermostat.
We envision a world in which rooms are equipped with multiple sensors, some of which would be in garments (laptops also have this capability) [6], where the location and time of data gathered would be most relevant to user needs. Multiple sensors would collect data distributed over periods of time most indicative of the needs of users of the space. Automated data harvesting and distilling algorithms would summarize not only the most appropriate temperature readings but also point to anomalies and variances that matter. With the help of advanced HCI meth-ods, this information can be conveyed to the ECx tools succinctly, accurately, and just in time.
15.3.3 Verifying the Setpoint Value
System controls, in which setpoint data reside, include complex equipment and software components. Furthermore these mechanisms are proprietary, which means that we cannot view, scrutinize, or interfere with their inner workings. In short, the ability to verify the set values for all kinds of variables including temperature, humidity, and change-actuation to the system components as well as to the controls parameters is not available to us.
We envision a world in which proprietary mechanisms can map their internal parameters and procedures to a neutral, standard, and universally shared repre-sentation that can assist us in verifying the correctness and reasons for set values, without having to waste valuable time and budgetary resources of the ECx process (Chapter 9) [7].
15.3.4 Validating User Acceptability of Measured Values
User requirements are volatile. This is due both to changes experienced by the indi-vidual, such as illness, adjustment to diurnal and calendar variations, physiological and psychological state, and to intraindividual variations, such as age, sex, na-tionality, race, and education. These changes can mean significant comfort and
270 Future of Embedded Commissioning: What Is Possible in 20 Years?
productivity deficits or gains depending on the availability of the ambient environ-ment (Chapter 1) [8]. Therefore, validating the acceptability of ambient environ-ments cannot be decided on the basis of simple comparisons between as-designed and as-measured values. It also requires the consideration of relevant and up-to-date (even live) input from users.
We envision a future in which users are connected to the ECx process through updated design intent (Chapter 4) documents that are embedded in the process by virtue of interoperable and standardized data representations and tools.
15.3.5 What Are the Thresholds for Value Comparison?
In this brand new world of ECx, where updated information is broadly available, we still need human judgment and interpretation of data to decide what is sig-nificant. To a brain surgeon, the precision of the electron microscope-driven laser scalpel needs to be measured in micromillimeters, whereas the precision of kicking the ball through the space defined by the goal posts in a football game (or match) would be measured in yards, feet, or inches at best. How do we determine what variance from set values or desirable performance criteria is within an acceptable range?
In doing the fieldwork to determine how to construct correct product and pro-cess models for building commissioning (BCx), we encountered a similar phenom-enon (Chapter 7). BCx reports prepared for the purpose of satisfying LEED (Lead-ership in Energy and Environmental Design) criteria, usually in loose-fit buildings, use a much more lenient criterion for satisfying required performance values than those prepared to assess the performance of critical functions in experimental and close-fit buildings (Chapter 1). For instance, in the former case, a wide variance (order of magnitude difference) in the wattage required in the HVAC system is waved off by the BCx agent, assuming that the amperage in the system will make up for this anomaly. In the latter category, the BCx report for a close-fit building, a medical laboratory, introduced us to several hundred new performance measure-ment criteria not used in the former category.
We envision a future in which data and criteria of evaluation for comparable buildings, live and appropriately packaged, are readily available to fieldworkers and ECx agents. A web-wide B2B database (Chapter 2) can accommodate compre-hensive commissioning guidelines created by owners and users. Interactive check-lists for different sustainability quality points would be maintained and relevant modeling software applications with version updates would be within reach of a palm device via the Internet.
15.3.6 How Do We Know Which Value Is Correct?
In some cases, the as-measured value is off due to equipment malfunction. But, too often, users neglect to update control settings and maintain equipment as required by the protocols designed to operate facilities in the most effective way (i.e., the most economical and suitable way for user needs). Therefore, human judgment and intervention are required. This process is assisted by a plethora of software appli-cations that perform automated fault detection and diagnosis (FDD) (Chapter 8), facilitate BCx (Chapter 13), and even do some self-configuring [9].
15.3 A Vision of the Future State of ECx 271
Therefore, it is not a stretch to imagine a world in which we would have sys-tems possessing sufficient “wisdom” to discriminate between false positives and eminent, catastrophic failures. In one case, we discovered that a loose-fit build-ing that was commissioned for LEED purposes had a power outage that led to a meltdown due to the overheating of the liquid in its heat-exchange equipment. The entire equipment, which was a six-figure installation, had to be replaced. This logi-cal consequence can be reasoned out by knowledge-based expert system (KBES) driven ECx applications. False positives may be more difficult to weed out of such a system since sensor readings can be volatile, subject to miscalibration, and over-responsive to local conditions. Therefore, we envision a future in which sensors systems eliminate local factors when necessary and perform self-reasoning and calibration.
15.3.7 What Does It Mean to Discover Errand As-Measured Value?
In one BCx case study that we undertook, we found that there was no difference in the performance of the system when we changed the settings of a valve in a fin-tube radiant heating system (Chapter 9). Does this mean that the valve was faulty? Or was there something wrong with the control settings? Was there something else in-terfering with the functions of the valve, which could be in perfect shape? It turned out that the actuator of the valve had malfunctioned years ago and it was removed for repair or replacement, neither of which materialized. There was no record of its removal other than the memories of maintenance and operations personnel of the time, who were no longer with the institution. This case illustrates the diversity of reasons that can be the cause of a malfunction or error. Therefore, misdiagnosis is common and the role of human judgment in FDD is critical.
The universal solution for correctly interpreting the meaning and significance of the misalignment of as-designed versus as-measured values is communication. ECx agents conducting field measurements need a complete and correct record of maintenance histories, access to robust and reliable BIM models, best practices in FDD, and plenty of comparable cases at their fingertips. We emphasized the tools and methods particularly applicable to these tasks in Part III and Chapters 13 and 14.
15.3.8 If a Fault Detection Is Confi rmed, What Can We Do About It?
Interventions to correct diagnosed faults range from doing nothing, to readjustment or calibration of the existing system, to readjustment and correction of operating protocols and their implementation, to minor equipment repair and replacement, and, finally, to major equipment or subsystem repair or replacement. Many factors impact the selection of one of these options including available funding, schedule, use type, severity of fault, resource savings, and owner/user motivation.
Once again in our vision of the future, we revert to good communication with experts, sound human/computer interface systems, and accessibility to relevant in-formation sources. JIT modeling linked to a database of “all-buildings” updated by manufacturers can help hone in to best practices in reconfiguring building systems, pricing, and new technologies entering the market.
272 Future of Embedded Commissioning: What Is Possible in 20 Years?
15.4 Visions of Information Technology Futures
The critical technologies that will make all of this possible are digital modeling of AEC products and processes and the digital infrastructures that will make access, retrieval, and storage of information ubiquitous. Current trends indicate that in short order all new buildings, including the ones that were built in the past few decades, will have interoperable representations of their as-built drawings, project manuals, management and operation plans, repair histories, and manufacturer’s specifications. Creation and updating of all of this information will be coordinated with planners, architects, engineers, and other relevant consultants of capital proj-ects. Information will be embedded in their life-cycle process for ongoing evalu-ation to meet optimal performance and energy conservation goals. This process, which we call embedded commissioning (ECx), will be enforced by licensing and certification agencies that finance capital projects, such as the U.S. Green Building Council, U.S. General Services Administration, U.S. Army Corps of Engineers, and U.S. Postal Service.
These advances will not be realized unless several technological and organiza-tional developments in the area of standardization have been realized first. Stan-dards of interoperability must be agreed on and adhered to by major software and hardware houses like Microsoft, Google, IBM, Intel, and Autodesk that control the development and deployment of BIM software and AEC databases including GIS and infrastructure information. We also expect that agencies significantly con-tributing to the development of effective building standards like the U.S. National Institute of Standards and Technology will play a critical role in this process.
15.5 A Vision of the World of Facilities, Owners/Users, and Capital Project Marketplace
Just as the CPD process and its participants operate with entirely different tools, technologies, and procedures, the owners and operators of facilities also have to adapt to this process. This is not a simple, passive adaptation. Owners and op-erators of capital projects have to enable this innovation through their input and continuous participation. This future world will have not only online and live data about the history of facilities and operation/maintenance manuals, it must also have an interactive repository of best practices and troubleshooting queries for equip-ment and building parts. The owners/users are both receivers of and contributors to this information base. As they sort out their operation, maintenance, and ECx issues, the distributed web of information repositories will capture this informa-tion and store it so that, in the future, others will be able to use it. It will provide for less fragmentation of information, increase cooperation, and be linked through standardized modeling software applications. This requires the existence of a very large database of ECx groups with sustainable practices, distributed in the digital cloud, and accessible from laptops and handheld devices. A popular ontology of AEC terms, used and supplemented by users, will support this cloud utility.
15.5 A Vision of the World of Facilities, Owners/Users, and Capital Project Marketplace 273
An online survey utility will have access to different scenarios in order to deter-mine the type of ECx protocol applicable to a given capital project for owners. The latest sensor, laser, modeling, and self-corrective technologies will be available to owners and users of capital projects. Users and their O&M personnel will be able to access, online, standard training and certification programs for ECx. O&M re-quests with links to location and relevant systems within the facility will be linked to efficient interactive troubleshooting applications. With the simple pointing of a device to a RFID tag, or sensor, in the problem area, the users will be able to access the relevant database for uploading useful information and downloading current changes in the form of pictures and models of the local condition.
Urgent requests will be broadcast to roaming facility staff through mobile devices, and nonurgent requests will be queued by an interactive tracking util-ity to monitor the progress of each request. Different aspects of the facility will be accessed for humidity-temperature penetration and termite infestation through sensors and sensor-embedded cladding materials. Through this process, building owners and users will become convinced of the value of embedded commission-ing. Groups like LEED, ASHRAE, NIST, and SHASE will provide presentations, examples of successful case studies, access to entities outside of the building indus-try, comparative analyses by consultants to government and private agencies, tax incentives for life-cycle ECx, and energy-saving opportunities.
Although throughout this book we have emphasized the challenges alongside the opportunities that will propel embedded commissioning to the forefront of digital CPD processes, we remain optimistic. Without a doubt, a future enhanced by improved quality, schedule, and budget management of capital projects awaits those members of the architecture-engineering-construction sector, who are willing and excited about embracing information technologies and all that they have to offer.
References
[1] Akın, Ö., “Keynote Address: I Am Not Rem Koolhaas,” in Proceedings of the Design Communication Conference, Architecture Department, Southern Polytechnic, Atlanta, GA, March 25–29, 2009.
[2] Akın. Ö, “CAD and GIS Integration: Challenges and Opportunities,” in CAD and GIS In-tegration, H. A. Karimi and B. Akinci (Eds.), Boca Raton, FL: CRC Press, 2010.
[3] Yang, B., et al., “Compliant and Low-Cost Humidity Nanosensors Using Nanoporous Polymer Membranes,” Sensors and Actuators B, Vol. 114, (006, pp. 254–262.
[4] Lee, S., and Akin, Ö., “Shadowing Tradespeople: Ineffi ciency in Maintenance Fieldwork,” Automation in Construction, Vol. 18, No. 5, 2009, pp. 536–546.
[5] Böhm, J., Becker, S., and Haala, N., “Model Refi nement by Integrated Processing of Laser Scanning and Photogrammetry,” in Proceedings of 3D Virtual Reconstruction and Visual-ization of Complex Architectures (3D-Arch), Zurich, Switzerland, 2007.
[6] Rowe, A., et al., “Sensor Andrew: Large-Scale Campus-Wide Sensing and Actuation,” IBM Journal of Research and Development, Vol. 55, No. 1, pp. 6:1–6:14.
[7] BACnet: A Data Communication Protocol for Building Automation and Control Net-works, ANSI/ASHRAE Standard 135, American Society of Heating, Refrigerating, and Air-Conditioning Engineers, 2010.

274 Future of Embedded Commissioning: What Is Possible in 20 Years?
[8] Fisk, W. J., “Health and Productivity Gains from Better Indoor Environments and Their Relationship with Building Energy Effi ciency,” in Annual Review of Energy and the Envi-ronment, Vol. 25, November 2000, pp. 537–566.
[9] Akinci, B., Garrett, J., and Akin, Ö., “Identifi cation of Functional Requirements and Possible Approaches for Self-Confi guring Intelligent Building Systems,” NIST Grant 60NANB8D8140, fi nal report submitted to Steven Bushby, National Institute for Stan-dards and Technology.
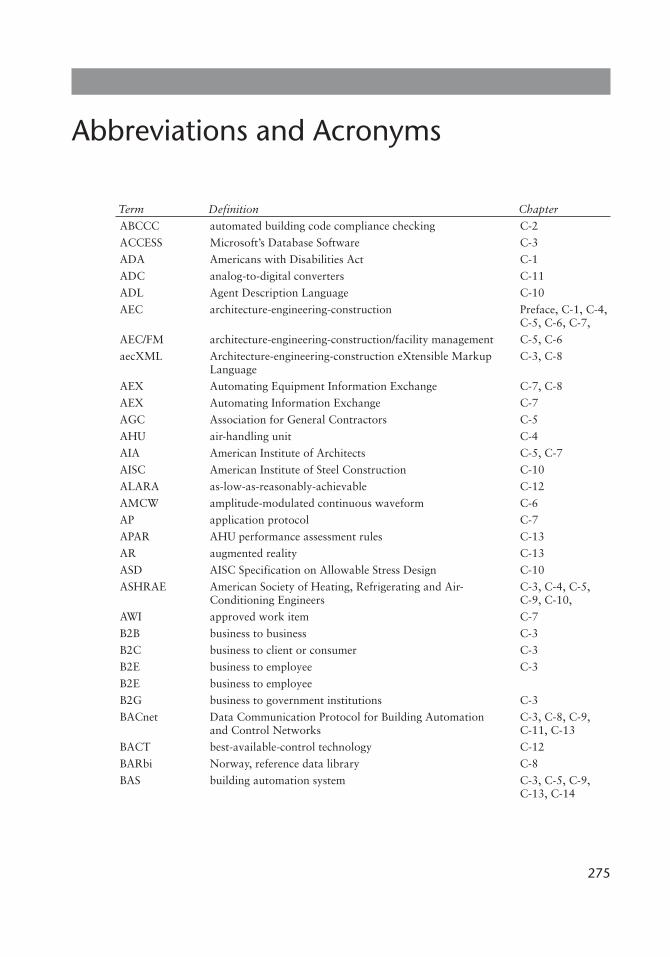
275
Abbreviations and Acronyms
Term Definition Chapter
ABCCC automated building code compliance checking C-2
ACCESS Microsoft’s Database Software C-3
ADA Americans with Disabilities Act C-1
ADC analog-to-digital converters C-11
ADL Agent Description Language C-10
AEC architecture-engineering-construction Preface, C-1, C-4, C-5, C-6, C-7,
AEC/FM architecture-engineering-construction/facility management C-5, C-6
aecXML Architecture-engineering-construction eXtensible Markup Language
C-3, C-8
AEX Automating Equipment Information Exchange C-7, C-8
AEX Automating Information Exchange C-7
AGC Association for General Contractors C-5
AHU air-handling unit C-4
AIA American Institute of Architects C-5, C-7
AISC American Institute of Steel Construction C-10
ALARA as-low-as-reasonably-achievable C-12
AMCW amplitude-modulated continuous waveform C-6
AP application protocol C-7
APAR AHU performance assessment rules C-13
AR augmented reality C-13
ASD AISC Specification on Allowable Stress Design C-10
ASHRAE American Society of Heating, Refrigerating and Air-Conditioning Engineers
C-3, C-4, C-5, C-9, C-10,
AWI approved work item C-7
B2B business to business C-3
B2C business to client or consumer C-3
B2E business to employee C-3
B2E business to employee
B2G business to government institutions C-3
BACnet Data Communication Protocol for Building Automation and Control Networks
C-3, C-8, C-9, C-11, C-13
BACT best-available-control technology C-12
BARbi Norway, reference data library C-8
BAS building automation system C-3, C-5, C-9, C-13, C-14
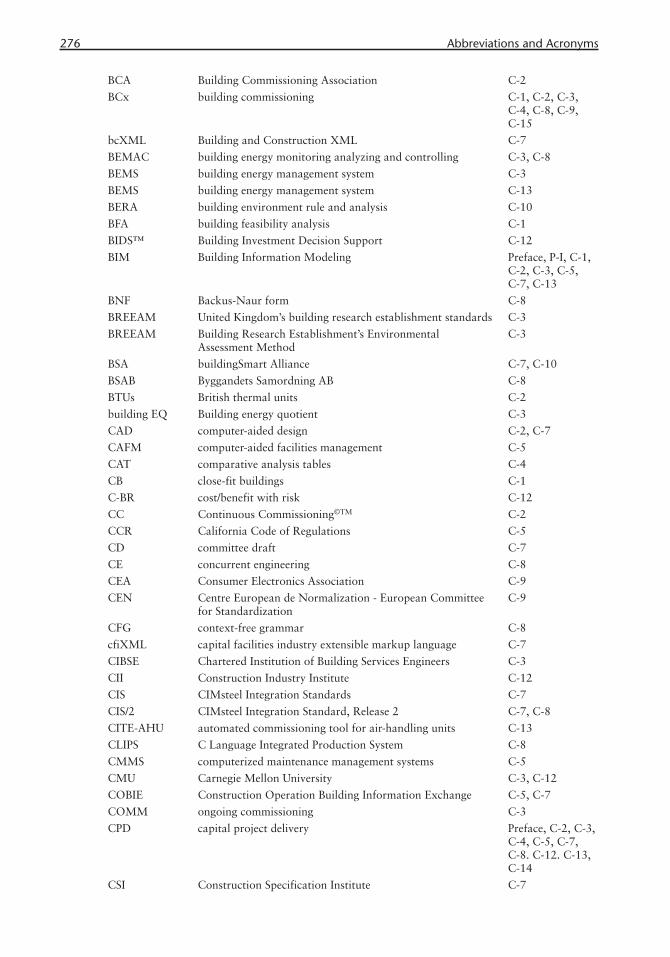
276 Abbreviations and Acronyms
BCA Building Commissioning Association C-2
BCx building commissioning C-1, C-2, C-3, C-4, C-8, C-9, C-15
bcXML Building and Construction XML C-7
BEMAC building energy monitoring analyzing and controlling C-3, C-8
BEMS building energy management system C-3
BEMS building energy management system C-13
BERA building environment rule and analysis C-10
BFA building feasibility analysis C-1
BIDS™ Building Investment Decision Support C-12
BIM Building Information Modeling Preface, P-I, C-1, C-2, C-3, C-5, C-7, C-13
BNF Backus-Naur form C-8
BREEAM United Kingdom’s building research establishment standards C-3
BREEAM Building Research Establishment’s Environmental Assessment Method
C-3
BSA buildingSmart Alliance C-7, C-10
BSAB Byggandets Samordning AB C-8
BTUs British thermal units C-2
building EQ Building energy quotient C-3
CAD computer-aided design C-2, C-7
CAFM computer-aided facilities management C-5
CAT comparative analysis tables C-4
CB close-fit buildings C-1
C-BR cost/benefit with risk C-12
CC Continuous Commissioning©TM C-2
CCR California Code of Regulations C-5
CD committee draft C-7
CE concurrent engineering C-8
CEA Consumer Electronics Association C-9
CEN Centre European de Normalization - European Committee for Standardization
C-9
CFG context-free grammar C-8
cfiXML capital facilities industry extensible markup language C-7
CIBSE Chartered Institution of Building Services Engineers C-3
CII Construction Industry Institute C-12
CIS CIMsteel Integration Standards C-7
CIS/2 CIMsteel Integration Standard, Release 2 C-7, C-8
CITE-AHU automated commissioning tool for air-handling units C-13
CLIPS C Language Integrated Production System C-8
CMMS computerized maintenance management systems C-5
CMU Carnegie Mellon University C-3, C-12
COBIE Construction Operation Building Information Exchange C-5, C-7
COMM ongoing commissioning C-3
CPD capital project delivery Preface, C-2, C-3, C-4, C-5, C-7, C-8. C-12. C-13, C-14
CSI Construction Specification Institute C-7
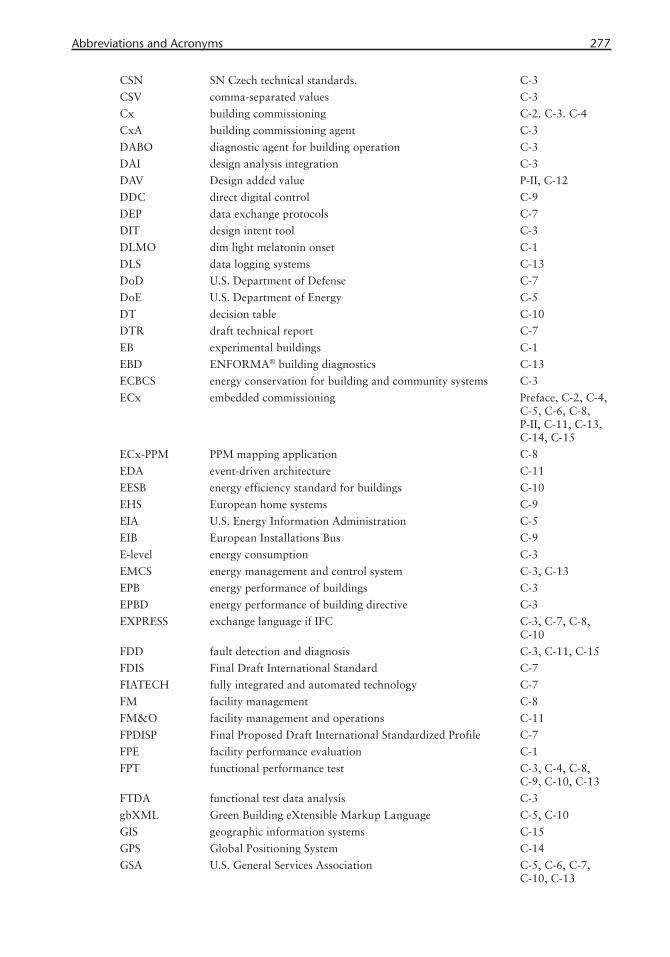
Abbreviations and Acronyms 277
CSN SN Czech technical standards. C-3
CSV comma-separated values C-3
Cx building commissioning C-2. C-3. C-4
CxA building commissioning agent C-3
DABO diagnostic agent for building operation C-3
DAI design analysis integration C-3
DAV Design added value P-II, C-12
DDC direct digital control C-9
DEP data exchange protocols C-7
DIT design intent tool C-3
DLMO dim light melatonin onset C-1
DLS data logging systems C-13
DoD U.S. Department of Defense C-7
DoE U.S. Department of Energy C-5
DT decision table C-10
DTR draft technical report C-7
EB experimental buildings C-1
EBD ENFORMA® building diagnostics C-13
ECBCS energy conservation for building and community systems C-3
ECx embedded commissioning Preface, C-2, C-4, C-5, C-6, C-8, P-II, C-11, C-13, C-14, C-15
ECx-PPM PPM mapping application C-8
EDA event-driven architecture C-11
EESB energy efficiency standard for buildings C-10
EHS European home systems C-9
EIA U.S. Energy Information Administration C-5
EIB European Installations Bus C-9
E-level energy consumption C-3
EMCS energy management and control system C-3, C-13
EPB energy performance of buildings C-3
EPBD energy performance of building directive C-3
EXPRESS exchange language if IFC C-3, C-7, C-8, C-10
FDD fault detection and diagnosis C-3, C-11, C-15
FDIS Final Draft International Standard C-7
FIATECH fully integrated and automated technology C-7
FM facility management C-8
FM&O facility management and operations C-11
FPDISP Final Proposed Draft International Standardized Profile C-7
FPE facility performance evaluation C-1
FPT functional performance test C-3, C-4, C-8, C-9, C-10, C-13
FTDA functional test data analysis C-3
gbXML Green Building eXtensible Markup Language C-5, C-10
GIS geographic information systems C-15
GPS Global Positioning System C-14
GSA U.S. General Services Association C-5, C-6, C-7, C-10, C-13
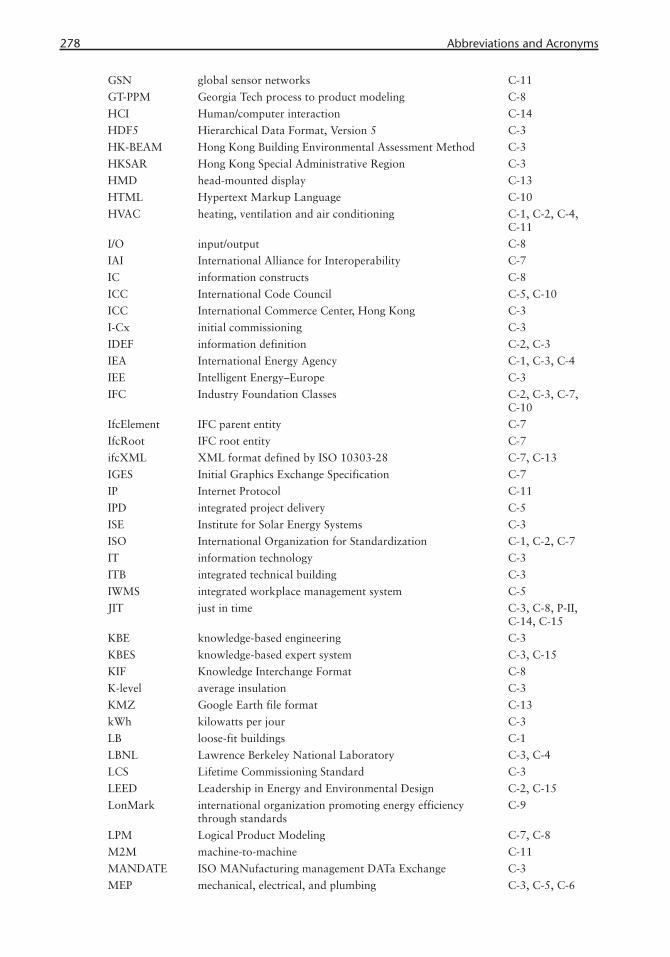
278 Abbreviations and Acronyms
GSN global sensor networks C-11
GT-PPM Georgia Tech process to product modeling C-8
HCI Human/computer interaction C-14
HDF5 Hierarchical Data Format, Version 5 C-3
HK-BEAM Hong Kong Building Environmental Assessment Method C-3
HKSAR Hong Kong Special Administrative Region C-3
HMD head-mounted display C-13
HTML Hypertext Markup Language C-10
HVAC heating, ventilation and air conditioning C-1, C-2, C-4, C-11
I/O input/output C-8
IAI International Alliance for Interoperability C-7
IC information constructs C-8
ICC International Code Council C-5, C-10
ICC International Commerce Center, Hong Kong C-3
I-Cx initial commissioning C-3
IDEF information definition C-2, C-3
IEA International Energy Agency C-1, C-3, C-4
IEE Intelligent Energy–Europe C-3
IFC Industry Foundation Classes C-2, C-3, C-7, C-10
IfcElement IFC parent entity C-7
IfcRoot IFC root entity C-7
ifcXML XML format defined by ISO 10303-28 C-7, C-13
IGES Initial Graphics Exchange Specification C-7
IP Internet Protocol C-11
IPD integrated project delivery C-5
ISE Institute for Solar Energy Systems C-3
ISO International Organization for Standardization C-1, C-2, C-7
IT information technology C-3
ITB integrated technical building C-3
IWMS integrated workplace management system C-5
JIT just in time C-3, C-8, P-II, C-14, C-15
KBE knowledge-based engineering C-3
KBES knowledge-based expert system C-3, C-15
KIF Knowledge Interchange Format C-8
K-level average insulation C-3
KMZ Google Earth file format C-13
kWh kilowatts per jour C-3
LB loose-fit buildings C-1
LBNL Lawrence Berkeley National Laboratory C-3, C-4
LCS Lifetime Commissioning Standard C-3
LEED Leadership in Energy and Environmental Design C-2, C-15
LonMark international organization promoting energy efficiency through standards
C-9
LPM Logical Product Modeling C-7, C-8
M2M machine-to-machine C-11
MANDATE ISO MANufacturing management DATa Exchange C-3
MEP mechanical, electrical, and plumbing C-3, C-5, C-6

Abbreviations and Acronyms 279
MIA mobile inspection assistance C-14
NCDC National Climatic Data Center C-13
NCS U.S. National CAD Standards C-7
NIBS National Institute for Building Sciences C-1, C-5, C-7
NIST National Institute of Standards and Technology C-3, C-4, C-7
NKN Czech national calculation tool C-3
NN noun, singular or mass C-8
NNP proper noun, singular C-8
NNPS proper noun, plural C-8
NNS noun, plural C-8
NP noun phrase C-8
NPV net present value C-12
NRC Natural Resources Canada C-3, C-8
NS Norway standard C-3
NSF National Science Foundation C-10
O&M operations and maintenance C-3, C-8, C-13
oBIX Open Building Information Xchange C-7
OGC Open Geospatial Consortium C-11
OO object oriented C-3
OPR owner’s project requirements C-3
OS operating system C-11
OWL Web Ontology Language C-8, C-10
PACRAT Performance And Continuous Re-commissioning Analysis Tool
C-13
PAE Procedure d’Avis Energetique C-3
PECI Portland Energy Conservation, Inc. C-3, C-4
PFC prefunctional checklist C-3, C-4, C-8, C-13
PHPP PHP passive C-3
PLCs programmable logic controllers C-9
PM4D product models based on four dimensions C-3
POE post-occupancy evaluation C-1
POS part-of-speech C-8
PPM product and process model C-2, C-4, C-8
ProMICE computer-based application to explore between CE stages C-8
PSL process specification language C-3
PTB Penn Treebank C-8
QA quality assurance C-6
RCM requirements collection and modeling C-8
RDBMS relational database management system C-3
RDF resource description framework C-8
ReC Re-Commissioning C-2, C-3
Retro-Cx Retro-Commissioning C-2, C-3
REVIT Autodesk BIM product C-3
RFI request for information C-2
RSS Really Simple Syndication C-11
SASE standards analysis, synthesis and expression C-10
SC subcommittee C-7
SCADA supervisory control and data acquisition C-9
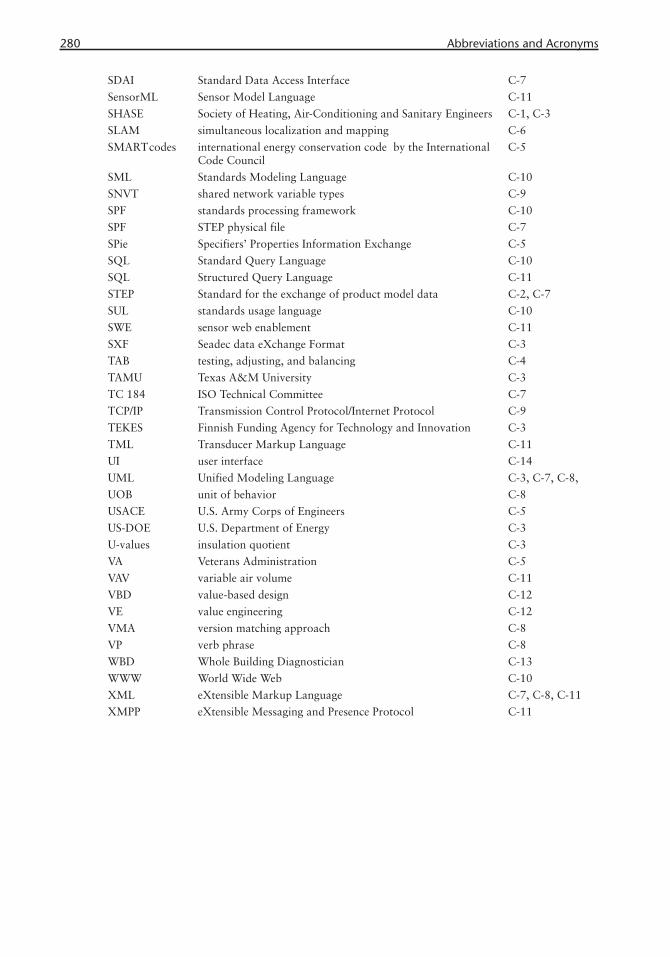
280 Abbreviations and Acronyms
SDAI Standard Data Access Interface C-7
SensorML Sensor Model Language C-11
SHASE Society of Heating, Air-Conditioning and Sanitary Engineers C-1, C-3
SLAM simultaneous localization and mapping C-6
SMARTcodes international energy conservation code by the International Code Council
C-5
SML Standards Modeling Language C-10
SNVT shared network variable types C-9
SPF standards processing framework C-10
SPF STEP physical file C-7
SPie Specifiers’ Properties Information Exchange C-5
SQL Standard Query Language C-10
SQL Structured Query Language C-11
STEP Standard for the exchange of product model data C-2, C-7
SUL standards usage language C-10
SWE sensor web enablement C-11
SXF Seadec data eXchange Format C-3
TAB testing, adjusting, and balancing C-4
TAMU Texas A&M University C-3
TC 184 ISO Technical Committee C-7
TCP/IP Transmission Control Protocol/Internet Protocol C-9
TEKES Finnish Funding Agency for Technology and Innovation C-3
TML Transducer Markup Language C-11
UI user interface C-14
UML Unified Modeling Language C-3, C-7, C-8,
UOB unit of behavior C-8
USACE U.S. Army Corps of Engineers C-5
US-DOE U.S. Department of Energy C-3
U-values insulation quotient C-3
VA Veterans Administration C-5
VAV variable air volume C-11
VBD value-based design C-12
VE value engineering C-12
VMA version matching approach C-8
VP verb phrase C-8
WBD Whole Building Diagnostician C-13
WWW World Wide Web C-10
XML eXtensible Markup Language C-7, C-8, C-11
XMPP eXtensible Messaging and Presence Protocol C-11
281
About the Author
Ömer Akın, professor, School of Architecture, Carnegie Mellon University, is a fre-quently published researcher in the areas of design cognition and computation. His books include Representation and Architecture (1982), Psychology of Architectural Design (1986, 1989) Generative CAD Systems (2005), and A Cartesian Approach to Design Rationality (2006).
Upon completing his bachelors and masters degrees in architecture at the Faculty of Architecture, Middle East Technical University in 1970, he obtained a Fulbright Scholarship for graduate studies in the United States. Subsequently, he earned a master of architecture in environmental systems from Virginia Polytechnic Institute and State University in 1972, and a Ph.D. in architecture from Carnegie Mellon University in 1979.
He has been teaching at Carnegie Mellon University since 1978. He served as the head of the Department of Architecture from 1981 to 1988; and the director of the graduate programs from 1989 to 2000.
His research interests include design cognition, computer-aided design gen-eration, case-based instruction, ethical decision making, design of virtual worlds, building commissioning, and automated requirement management.
Over the past two decades, he has received numerous research grants from external sources, including the National Science Foundation and the National In-stitute of Standards and Technology. In addition to those in the School of Archi-tecture, he has also conducted research with associates in the Psychology, Civil and Environmental Engineering, School of Urban & Public Affairs, and Computer Science departments.
He is a registered architect in the Commonwealth of Pennsylvania and the Republic of Turkey. He has a small, selective practice. He has designed and built residential, commercial, and office buildings in the United States, Turkey, and the Middle East. Currently, he is the architect of record for the Turkish Nationality Room for the Cathedral of Learning at the University of Pittsburgh.

283283
Index
A
A Measure of Everything, 7Abstraction, 50, 106, 183, 186, 198, 199, 236Acceptance Phase, 43, 71, 72, 74, 77, 78, ACCESS, 45, 50, 275Access control, 201-203Acoustical Performance Guidelines for
Schools, 5Actuators, 49, 94, 191, 193, 194, 200, 202,
203, 267aecXML, 54-56, 140, 275Agent Description Language (ADL), 183, 275Aggregate cost approach, 58Air fi lter, 76, 77Air Handling Unit (AHU) , 11, 33, 37, 47, 49,
63, 65, 75, 78, 80, 81, 241, 243, 275 Performance Assessment Rules (PAR), 242,
275Allowable Stress Design (ASD), 181, 275Ambiguity interval, 109Americans for Disabilities Act (ADA), 11American Institute of Architects (AIA), 85, 127,
275American Institute of Steel Construction
(AISC), 181, 275American National Standards Institute (ANSI),
5American Society of Heating Refrigeration
and Air-Conditioning Engineers (ASHRAE), 18, 31, 43, 65, 66, 67, 75, 88, 90, 140, 151, 163, 165, 167, 175, 182, 273, 275
American Standard Code for Information Inter-change (ASCII), 125
Amplitude Modulated Continuous Waveform (AMCW), 109, 275
Analog to Digital Converter (ADC), 193, 275Annual Energy Review, 16, 17
Application Protocol (AP), 125, 127, 133, 275Approved Work Item (AWI), 127, 275ArchiBus, 95Architecture Engineering Construction (AEC),
xv, 63, 85, 123, 273, 275 Domain, 15, 52, 123, 124, 134, 138 Facility Management (AEC/FM), 85-87, 90,
103, 105, 117, 145, 151, 245, 246, 275
eXtensible Markup Language (aecXML), 54-56, 140, 275
ARToolKit, 245As-Built, 13, 28, 74, 87, 92, 103, 121, 132,
137, 146, 269, 272AISCII Specifi cation on Allowable Stress Design
(ASD), 181, 275As-is modeling, 103, 105, 117, 119As-low-as-reasonably-achievable (ALARA),
217, 275Asset Rating, 38Association for General Contractors (AGC),
85, 275Associative drafting, 125Augmented Reality (AR), 45, 207, 241, 244,
246, 259, 260, 275Autodesk , 53, 90, 95, 246, 272 Ecotect, 90 Navisworks, 91 REVIT, 32, 35, 53, 54, 91, 95, 115, 116,
275Automated conformance evaluation, 179Automated target detection algorithm, 112Automating Equipment Information Exchange
(AEX), 124, 131, 132, 134, 147, 155, 275
Automating Information Exchange (AIE), 131, 275
Average insulation, 32

284 Index
B
Backus Naur Form (BNF), 140, 142, 144, 147, 149-151, 275
Building Automation and Control networks (BACnet), 15, 24, 33, 48, 137, 161-169, 199, 246, 167, 275
Basis of Design, 67, 72, 73Batibus, 167Benchmarking, 38, 223Bentley ConstrucSim, 91Best-available-control-technology, 217BIM Data Control Module, 256BIMserver, 246, 257BREEAM, 41, 276British Thermal Units (BTU), 16-18, 276Building and Construction XML (cXML), 134,
145, 146, 151, 276Building Automation System (BAS), 50, 94,
149, 166, 167, 169, 207, 242-246, 257, 275
Building code compliance checking, 88, 90, 98Building codes, 9, 11, 27, 28, 90, 91, 170,
173-186Building Commissioning (BCx), 2, 3, 11, 12,
15-19, 31-58, 63-83, 88, 93, 94, 137, 138, 142-144, 151, 159, 163, 169, 170, 178, 207, 270, 271, 276
Agent (CxA), 46 Building Commissioning Association (BCA),
18, 276Building Energy Management System (BEMS),
33, 39, 48, 49, 242, 276Building Energy Monitoring Analyzing and
Controlling, 55, 276Building envelope, 36, 88, 174, 179, 181, 182Building Environment Rule and Analysis, 185,
276Building Feasibility Analysis, 11, 276Building Information Modeling (BIM), xv, 13,
15, 22, 24-26, 29, 35, 4952, 55, 56, 58, 85-97, 103-106, 110-121, 123, 128, 134, 137, 222, 228, 245, 246, 249, 250, 256, 257, 262-272, 276
Building performance, xv, 2, 3, 6, 32, 37, 41, 45, 46, 49, 54, 56, 64, 174, 194
Building use studies, 3
Building wellness, 3buildingSMART, 54, 55, 124, 127, 128, 134,
184Business to business (B2B), 31, 54, 131, 271,
275Business to client or consumer (B2C), 51, 53,
275Business to employee (B2E), 50, 275Business to government institutions (B2G), 50,
275
C
C Language Integrated Production System (CLIPS), 151, 276
California Code of Regulations (CCR), 90, 276Capital Facilities Industry eXtensible Markup
Language (cfi XML), 132, 276Capital project (CP), xv, 8, 11, 13, 15, 20, 22,
23, 27, 28, 44, 51, 63, 85, 86, 96, 123, 137, 191, 177
Capital project delivery (CPD), xv, 8, 15, 27, 49, 51, 63, 85, 123, 137, 191, 207, 254, 265, 276
Capital project performance, 20Carbon emissions, 11, 12, 20, 25Carnegie Mellon University (CMU), xvii, 43,
203, 246, 276Center for Environmental Design Research , 10Centre Europeen de Normalization (CEN),
167, 276Certifi cate of Readiness, 74Certifi cation, bacNET, 163 Building code agencies, 177 Commissioning, 49 EPBD, 32, 36, 38 LEED, 86 KNX, 167Change orders, 86, 207, 217CIBSE, 31CIMsteel, 124, 133, 134, 139, 276Circadian rhythm, 5CITE-AHU, 33, 241, 242, 250, 276Clash detection, 86, 91, 92, 96, 104, 116, 117Class – PPM, 78, 80, 81, 129, 130, 182, 185,
200, 221Close-fi t Buildings (CB), 4, 11, 267, 270, 276
Index 285
Clutter objects, 113, 120Code enforcement, 175Commissioning (Cx), Authority (CxA), 67, 72, 178 Data Control Module , 256, 257 Plan, 44, 66, 69, 72-75, 77 Protocols, 178Committee Draft (CD), 127, 276Common logical structure, 55Communication Protocols (CP), 13, 28, 48,
159-170, 197-199, 2-7, 275Comparative Analysis Tables (CAT), 76, 81,
276Complex Event Processing, 202Computational fi eld tools, 241Computational information support, 255Computer Aided Design (CAD), 25, 39, 53, 54,
57, 58, 104, 119, 123, 127, 128, 244, 246, 267, 276
Computer Aided Facilities Management (CAFM), 21, 87, 95, 267
Concepts, Building code, 181 Design Added Value, 209 IFC, 54, 70, 72, 73, 129, 145, 146, 151 Sensor, 194, 200, 202Concurrent Engineering (CE), 53, 56, 137, 139,
276Condition-based maintenance, 95Conformance, Assessment, 90, 176, 177, 178 Class, 129 Testing, 125Construction Industry Institute (CII), 207Construction Manager, 64, 67, 73, 74Construction Operation Building Information
Exchange (COBIE), 85, 96, 134, 276Construction regulations, 176Construction Specifi cation Institute (CSI), 123,
127Consumer Electronics Association (CEA), 166Context awareness, 256Context orientation, 182, 186Context Free Grammar (CFE), 140, 143, 144,
276Continuous Commissioning©® (CC), 13, 18,
276
Contract Documents, 9, 71, 73, 74, 152, 207Control logic, 93, 94, 169, 242Control network, 112, 113, 116Core data type, 133Core engineering object, 133Core layer, 133CORENET, 90, 91, 185Cost component approach, 58Cost-benefi t with risk (CBR), 6, 214, 215, 222,
223, 231, 276Cyber-Physical Systems, 194Czech national calculation tool (NKN), 35, 36,
279
D
Data, Abstraction, 50 Communication (DC), 42, 198, 276 Exchange Protocols (DEP), 133, 277 Logging Systems (DLS), 243, 277 Management, 22, 39, 55, 93, 139, 242 Modeling, 51, 55, 56, 123, 127, 132, 141,
142, 198 Registration, 105, 204 Sets, 142, 193, 195, 196 Sharing, 50, 139 Stream, 195, 262 Translation, 58 Warehousing, 52Day lighting, 3, 4, 5, 9, 10, 18, 232De facto standard, 160, 165, 200Decision table, 180, 277Decommissioning, 28, 64, 128, 197Department of Labor, Bureau of Labor Statis-
tics, 7Description logic, 182Description Methods, 123Design Added Value (DAV), 191, 207-237, 277Design, Analysis Integration, 56 Collaboration, 50, 56 Intent (DI), 44, 45, 47, 69, 70, 72, 74, 92,
270, 277 Design Intent Tool (DIT), 45-47, 277 Professional, 67, 232DesignCheck, 185Detector, 200
286 Index
Deviation maps, 117Device Object identifi ers, 169Diagnostic Agent for Building Operation
(DABO), 39, 45, 48, 49, 277Digital Government Research Program , 179Digital mode, 21, 137, 272Dim Light Melatonin Onset, 5, 277Direct Digital Control (DDC), 160, 277DOE-2, 88, 89, 277Domain-specifi c applications , 56 Data, 89, 145 Language, 183, 185 Modeling, 54, 89, 125, 142 Taxonomy, 179Draft Technical Report (DTR), 127, 277
E
Echelon Corporation, 166Electronic rulemaking, 179Electronics Industries Association (EIA), 166Embedded Commissioning (ECx), xv, 2, 13, 15,
19, 22-25, 28, 29, 46, 63-67, 75-81, 87, 91-97, 121, 124, 126, 134, 139, 140, 142, 143, 147, 149-153, 155, 169, 170, 191, 192, 186, 187, 193, 196-198, 200, 201, 203, 208, 241-246, 248-250, 253-258, 261-263, 265-273, 277
Emerging building technologies, 174, 176Encapsulation, 78, 199Energy , Analysis, 88, 89, 96 Consumption, 6, 9, 11, 12, 15, 16, 27, 32,
33, 35, 37, 38, 47, 88, 89, 230, 231, 242, 243
Performance in buildings (EPB), 32, 36, 277 Use, 16, 18, 235Energy Conservation for Building and Commu-
nity Systems (ECBCS), 31, 43, 277Energy Effi ciency Standard for Buildings
(EESB), 182, 277Energy Information Administration (EIA), 17,
88, 277Energy Management and Control System
(EMCS), 47, 48, 243, 277
Energy Performance of Building Directive (EPBD), 32, 35, 38, 277
EnergyPlus, 89ENFORMA® Building Diagnostics (EBD), 241,
277Ethernet, 162, 167European Construction Steelwork (ECS), 133European Home Systems (EHS), 167, 277European Installations Bus (EIB), 167, 277Event Driven Architecture (EDA), 201, 202,
204, 205, 277Experimental Buildings (EB), 4, 6, 8, 31, 199,
277Explicit drafting, 125EXPRESS (IFC exchange language), 50, 55,
125, 128, 134, 140, 152-154, 185, 277
eXtensible Markup Language (XML), 39, 50, 53, 89, 224, 131, 132, 134, 151, 184, 200, 201, 246, 280, 263, 276, 278
eXtensible Messaging and Presence Protocol (XMPP), 204, 280
F
Facility, Construction, 197 Management (FM), 24, 64, 87, 96, 103,
105, 118, 128, 139, 146, 191, 193, 197, 265, 267, 268, 277
Management and Operations (FM&O), 193, 267, 277
Facility Performance Evaluation (FPE), 10, 277Fault Detection and Diagnosis (FDD), 94, 96,
195, 197, 267, 270, 277Final Draft International Standard (FDIS), 127,
277FM:Interact, 95FM:Systems, 95Fully Integrated and Automated Technology
(FIATECH), 124, 131, 132, 277Funai, 8Functional inspection, 80Functional performance test (FPT), 48, 69, 71,
74-76, 78, 142, 147, 149150-153, 159, 163, 169, 178, 187, 197, 246, 277
Index 287
Functional Performance Test Protocol, 149, 150, 152, 153, 163
Functional Test Data Analysis (FTDA), 45, 47, 48, 277
Funding Agency for Technology and Innova-tion, , 52, 277
G
Gateway, 162-164, 167, 203, 204General Services Administration (GSA), 10, 85,
117, 118, 272Geographic Information Systems (GIS), 267,
268, 272, 277Georgia Tech Process to Product Modeling
(GT-PPM), 47, 140, 141, 144, 147, 278
Global Positioning System (GPS), 256, 260, 277
Global Sensor Networks (GSN), 203, 278Glossary of Building and Civil Engineering
Terms (BS6100), 145, 278Google Earth fi le format (KMZ), 246, 278Green Building XML (gbXML), 39, 50, 52, 89,
134, 246, 277
H
Hard-clashes, 92Head-Mounted Display, 244, 261, 278Heating, Ventilation and Air Conditioning
(HVAC), 1, 3, 11, 12, 16, 18, 33, 36, 38, 40-47, 65-67, 73-75, 78, 81, 88-90, 93, 124, 127, 131, 135, 147, 152, 153, 155, 167, 194, 199, 215, 242, 243, 246, 269, 270, 278
Hierarchical Data Format (HDF) version 5, 239, 278
Hong Kong (China) , - Building Environmental Assessment Method
, (HK-BREEAM), 42, 278 General Specifi cations, 41, 277 Special Administrative Region (HKSAR), 41,
278Human-Computer Interaction (HCI), 256, 269,
278HVAC Commissioning, 65, 67, 75, 81Hypertext Markup Language (HML), 49, 66,
246, 179, 202, 242, 278
I
ICOM, 8IEEE, 199, 200Industry Foundation Classes (IFC), 22, 32, 36,
39, 46, 53-56, 90, 9194, 124-134, 137-140, 142, 144-148, 151, 152, 155, 185, 246, 258, 267, 278
Entity (ifcElement, ifcRoot), 54, 129-131, 153, 278
IFC Exchange Language (EXPRESS), 50, 55, 125, 128, 134, 140, 152-154, 185, 277
ifcXML (XML format defi ned by ISO 10303-28), 124, 131, 132, 246, 278
Initial Graphics Exchange Specifi cation (IGES), 124, 278
Implementation support, 129Indoor air quality, 4, 6, 12, 18, 20, 32, 39, 215Information Constructs (IC), 140, 278Information DEFinition (IDEF), 23, 24, 27, 29,
441, 42, 49, 128, 265, 266, 278Initial Commissioning (I-Cx), 18, 44, 45Initial Graphics Exchange Specifi cation (IGES),
124, 278Input/output (I/O), 27, 36, 147, 261, 278Institute for Solar Energy Systems (ISE), 37,
278Institute of Building Sciences, 13, 66Insulation, - E-level, 32, 278 K-level , 32, 278 U-value, 32, 278Integrated Project Delivery (IPD), 85, 96, 278Integrated resources, 125Integrated Technical Building (ITB), 39, 278Integrated Workplace Management System
(IWMS), 95, 278International Alliance for Interoperability (IAI),
54, 124, 127, 128, 135, 278International BuildingSmart Consortium, 54International Code Council (ICC), 90, 175,
184, 278International Energy Agency (IEA), xvii, 13,
75, 167, 278International Organization for Standardization
(ISO), 13, 25, 124, 278
288 Index
Internet of Things, 193, 194, 195Internet Protocol (IP), 165, 198, 278Interoperability, xvii, 22, 32, 33, 39, 45, 50,
51, 54-58, 68, 75, 76, 81, 85, 89, 115, 116, 123, 124, 128, 130, 131, 134, 137-140, 142, 143-145, 147, 151, 155, 205, 207, 242, 272
MANufacturing management DATa Exchange (MANDATE), 56, 278
ISO Technical Committee (TC184), 124, 163, 278
Issue Resolution Database, 129
J
Jurisdiction, building codes, 173, 175, 177, 178Just In Time (JIT), 15, 51, 95, 143, 144-147,
155, 191, 192, 253, 254, 256, 258, 261, 262, 268, 269, 271, 278
K
Kansas City Hyatt Regency, 2, 215Kernel, 130, 151Kilowatts per Hour (kwH), 37, 278Knowledge Based Engineering Systems (KBES),
47, 56, 271, 278
L
Laser scanner, 103, 104, 107, 108, 109, 110Lawrence Berkeley National Laboratory
(LBNL), 45, 47, 55, 76, 278Leadership in Energy and Environmental
Design (LEED), 18, 86, 270, 271, 273, 278
Lean construction, 207Lifetime Commissioning Standard (LCS), 39,
278Lofting, 114Logic programming, 180, 181Logical Product Model, 133LonMark , 166, 278LonTalk, 166, 167, 278LonWorks, 166Loose-fi t Buildings (LB), 4, 8, 37, 51, 58, 270,
278
M
Machine-to-Machine (M2M), 195, 278
Manual data entry, 47, 58Materials Recycling, 197Maximo, 95Mechanical Electrical Plumbing (MEP), 8, 11,
16, 19, 54, 66, 86, 105, 106, 112, 279Mixed pixels, 110Mobile Inspection Assistance (MIA), 258, 279Modbus, 165, 166Modbus Association, 166Model building codes, 175Model-based estimation, 86Modicon, 165Morley Digital Controls, 165
N
National Climatic Data Center, 242, 279National Institute for Building Sciences (NIBS),
13, 66, 85, 127, 128, 279National Science Foundation (NSF), xvii, 179,
279Natural Resources Canada (NRC), 31, 43, 279Net Present Value (NPV), 210, 211, 218, 224,
230-232, 279Neuron, 166Nighttime setback, 160Noise level, 5, 165, 262Norway, reference data library (BARbi), 145,
146, 275Noun phrase (NP), 144, 279
O
Object Oriented (OO), 50, 181, 279Object Tracking Module, 256Object-oriented programming, 181Occupancy scheduling, 160Ontology, 50, 81, 143-147, 150, 151, 182, 272Open Building Information Xchange (oBIX),
134, 279Open Geospatial Consortium (OGC), 199,
200, 279Operating System (OS), 198, 279Operational rating, 38Operations and Maintenance (O&M), 2, 4, 9,
15, 19, 20, 28, 29, 39, 44-46, 56, 57, 63, 64, 95, 96, 147, 231, 242, 248, 249, 273, 279

Index 289
Optimization, 34, 42, 45, 45, 48, 54, 114, 160, 186
Owner’s Program, 70, 72Owner’s Project Requirements (OPR), 39, 43-
45, 152, 178, 279
P
Part of Speech (POS), 144, 279Penn Treebank (PTB), 144, 279Performance And Continuous Re-commission-
ing Analysis Tool (PACRAT), 241, 242, 279
Performance based requirements, 175Performance based specifi cations, 20Pre-functional Test (PFT), 39Phantom surface, 109Phase-based scanner, 109Philip Merrill Environmental Center, 10PHP passive (PHPP), 52, 279Points-to-BIM process, 105Point-to-point mapping, 57, 58, 138, 166Portland Energy Conservation, Inc. (PECI), 43,
66, 76, 151, 279Post Occupancy Evaluation (POE), xv, 9, 278Post-Acceptance phase of Cx, 43, 67, 74, 75,
77Pre-Functional Checklist (PFC), 74-78, 142,
147, 149, 151-154, 197, 279Prescriptive specifi cations, 20Procedural programming, 180Procedure d’Avis Énergetique (PAE), 32, 279Process and product models (PPM), xv, 15, 51,
64, 81, 137-145, 147, 149, 151-156, 277, 278
Process Specifi cation Language (PSL), 55, 279ProcessModel, 151, 200Product models based on 4-dimensional
(PM4D), 53, 279Productivity, 3-7, 11, 18, 20, 25, 55, 139, 197,
207, 215, 222, 233, 236, 253, 257, 268, 270
Programmable logic controllers (PLC), 165, 279
Proprietary protocols, 161Protocol translation, 162
Pulsed scanner, 109Pulsed time of fl ight, 108
Q
Quality assurance (QA), 30, 32, 116, 118, 233, 279
Quality control, 91, 92, 96, 116, 207
R
RATAS, 52Reactive maintenance, 94Really Simple Syndication (RSS), 203, 279Real-time data exchange, 256, 257Re-commissioning, 18, 45, 66, 242Regular Inspection, 38Relational Data Base Management System
(RDBMS), 39, 50, 279Requests for Information (RFI), 207, 279Requirements Collection and Modeling (RCM),
140, 279Resource layer, 131Resource Description Framework (RDF), 151,
279Retro commissioning (Retro-Cx), 18, 45, 67,
242, 279Risk reduction, 174Router, 162, 163, 165
S
SARA, 52Sawtooth Model, 21, 52Scan plan, 110-112Scan-to-BIM workfl ow, 104-106, 116Schemata, 90, 94, 95, 124, 131, 132, 138, 147,
148, 152, 155Seadec data eXchange Format (SXF), 39, 50,
280Search engine, 144, 179Sectioning, 114, 115Semantic Web, 182, 195SenseWeb, 203Sensor Andrew, 203-205Sensor Model Language (SensorML), 19, 200,
201, 280Sensor placement plan, 242Sensor Web Enablement (SWE), 200, 280Sensorpedia, 203

290 Index
Sensors, 13, 28, 29, 34, 39, 39, 41, 47, 48, 76, 94, 95, 108, 119, 164, 191, 193-195, 197-205, 207, 208, 216, 241, 242, 244, 249, 250, 257, 262, 269, 271, 273
SensorWeb, 203Shared network variable types (SNVT), 166,
280Sick building syndrome, 5, 6Silent failures, 3, 5, 6, 24Simple Sensor Syndication, 203Simulation based evaluation, 11Simultaneous localization and mapping
(SLAM), 119, 280SketchUp, 32Smart Grid, 159, 163, 166SMARTcodes , 86, 90, 91, 184, 185, 280Shared network variable types (SNVT), 166,
280Society of Heating Air-Conditioning and Sani-
tary Engineers (SHASE), 13, 31, 39, 43, 273, 280
Soft-clashes, 92Solibri Model Checker, 91SPARK, 48Special purpose rigs, 112Specifi ers’ Properties Information Exchange
(SPie), 96, 280Standard Data Access Interface (SDAI), 125,
280STandard for the Exchange of Product model
data (STEP), 28, 37, 38, 50, 55, 64, 65, 73, 105, 106, 110, 116, 123-126, 128-131, 133, 134, 137, 146, 280
Standardization, 28, 54, 124, 144, 160Standards Analysis, Synthesis and Expression
system (SASE), 181, 186, 279Standard Modeling Language (SML), 180, 183,
184, 280Standards Processing Framework (SPF), 183,
184, 280Standards Usage Language (SUL), 183, 280STEP Physical File (SPF), 125, 183, 184, 280Structured Query Language (SQL), 41, 181,
202, 280Stuxnet, 203
Subject engineering object, 132Submittals, 44, 74Supervisory Control And Data Acquisition
(SCADA), 165Surface fi tting, 114Synchro 4D, 91System context inspection, 78, 80System Manual, 44, 73-75, 77, 144
T
T&C Procedure , 41, 43Tacoma Narrow Bridge, 3Technical authoring committees, 177Finnish Funding Agency for Technology
(TEKES), 52, 280Testing Adjusting and Balancing (TAB), 73, 74,
78, 280Texas A&M University (TAMU), 45, 280Timberline Precision Estimating, 91, 128Total station, 103, 104, 111Trade coordination, 94Transducer, 193, 199Transducer Markup Language (TML), 199,
280Translators, 162, 198, 199Transmission Control Protocol , 163, 280Tririga, 93Tunneling protocol, 166
U
U.S. Department of Defense (DOD), 125, 277U.S. Department of Energy (DOE), 43, 88, 89,
277, 280U.S. Energy Information Administration (IEA),
17, 88, 277U.S. General Services Administration (GSA),
10, 85, 117, 118, 272, 277U.S. National CAD Standards (NCS), 128, 279UC Berkeley, 10Unifi ed Modeling Language (UML), 50, 125,
139, 280Unit of Behavior (UOB), 147, 149, 280United Kingdom’s building research establish-
ment standards (BREEAM), 41, 276US Army Corps of Engineers (US-ACE), 85,
277, 280

Index 291
US Green Building Council, 18, 272User Interface (UI), 41, 52, 235, 244, 257, 258,
260, 280User location tracking, 256Utilities end–use, 18
V
Value Based Design (VBD), xv, 191, 207, 209, 210, 280
Value Engineering (VE), 209, 236, 257, 280Variable Air Volume (VAV), 11, 32, 33, 49, 79,
199, 280VERA, 32Verb phrase, 144, 280Verifi cation Report, 74Version Matching Approach (VMA), 46, 142,
280Veterans Administration (VA), 25, 66, 280Vico Estimator, 91
Visual Digitizer, 40, 41
W
Wearable computer, 257-259, 261-263Web Ontology Language (OWL), 151, 182,
186, 279Whole Building Diagnostician (HBD), 66, 242,
243, 280Winspect, 258WirelessHART, 199World wide web (WWW), 13, 179, 280
X
XML format (defi ned by ISO 10303-28), 131, 278
Z
ZigBee, 199, 256Z-Wave, 199