Elevated Cerebral Blood Flow and Volume in Systemic Lupus Measured by Dynamic Susceptibility...
18
Elevated Cerebral Blood Flow and Volume in Systemic Lupus Measured by Dynamic Susceptibility Contrast Magnetic Resonance Imaging Charles M. Gasparovic, Ph.D. 1,3 , H. Jeremy Bockholt, B.S. 3 , Clifford R. Qualls, Ph.D. 2 , Paul G. Mullins, Ph.D. 4 , Janeen M. Sharrar, B.S.N. 2 , J. Jeremy Yamamoto, M.S. 3 , Wilmer L. Sibbitt Jr., M.D. 2 , and Carlos A. Roldan, M.D. 2 1 Department of Psychology, University of New Mexico, Albuquerque, New Mexico, USA 2 Cardiology and Rheumatology Divisions, Department of Internal Medicine, School of Medicine, University of New Mexico, Albuquerque, New Mexico, USA 3 The Mind Research Network, Albuquerque, New Mexico, USA 4 Bangor Imaging Center, School of Psychology, Bangor University, Gwynedd, UK Abstract Objective—Several studies have examined abnormalities in cerebral blood flow (CBF) in patients with systemic lupus erythematosus (SLE). However, the majority of these studies have reported CBF relative to a region assumed to be normal in the brain. The purpose of the present study was to examine absolute differences in both regional CBF and cerebral blood volume (CBV) between SLE patients and healthy control subjects. Methods—CBF and CBV were measured with dynamic susceptibility contrast (DSC) magnetic resonance imaging (MRI), a technique that provides an alternative to radionuclide perfusion studies and permits quantitative anatomic, CBF, and CBV imaging in a single scanning session. CBF and CBV were measured in both lesions and normal appearing tissue in the major cerebral and subcortical brain regions. Unlike most past perfusion studies on SLE, CBF and CBV values were not normalized to a region of brain assumed to be healthy. Results—As expected, CBF and CBV within MRI-visible lesions were markedly reduced relative to surrounding normal appearing white matter. However, both CBF and CBV in normal appearing tissue were higher in SLE patient groups, with or without lesions, relative to the control group. Conclusion—DSC MRI, without normalization to a region presumed to be healthy, revealed that CBF and CBV in normal appearing tissue in SLE patients is higher than CBF and CBV in control subjects. Since this finding was made in subgroups of patients with and with out lesions, the higher CBF and CBV appears to precede lesion pathology. Key Indexing Terms lupus; brain; cerebral blood flow; cerebral blood volume; magnetic resonance imaging Address for Correspondence: Charles Gasparovic, Ph.D., Pete and Nancy Domenici Hall, University of New Mexico, 1101 Yale Blvd. NE, Albuquerque, NM 87106, [email protected]. Address for Reprint Requests: Charles Gasparovic, Ph.D., Pete and Nancy Domenici Hall, University of New Mexico, 1101 Yale Blvd. NE, Albuquerque, NM 87106, [email protected] NIH Public Access Author Manuscript J Rheumatol. Author manuscript; available in PMC 2013 March 28. Published in final edited form as: J Rheumatol. 2010 September ; 37(9): 1834–1843. doi:10.3899/jrheum.091276. NIH-PA Author Manuscript NIH-PA Author Manuscript NIH-PA Author Manuscript
-
Upload
independent -
Category
Documents
-
view
4 -
download
0
Transcript of Elevated Cerebral Blood Flow and Volume in Systemic Lupus Measured by Dynamic Susceptibility...

Elevated Cerebral Blood Flow and Volume in Systemic LupusMeasured by Dynamic Susceptibility Contrast MagneticResonance Imaging
Charles M. Gasparovic, Ph.D.1,3, H. Jeremy Bockholt, B.S.3, Clifford R. Qualls, Ph.D.2, PaulG. Mullins, Ph.D.4, Janeen M. Sharrar, B.S.N.2, J. Jeremy Yamamoto, M.S.3, Wilmer L.Sibbitt Jr., M.D.2, and Carlos A. Roldan, M.D.21Department of Psychology, University of New Mexico, Albuquerque, New Mexico, USA2Cardiology and Rheumatology Divisions, Department of Internal Medicine, School of Medicine,University of New Mexico, Albuquerque, New Mexico, USA3The Mind Research Network, Albuquerque, New Mexico, USA4Bangor Imaging Center, School of Psychology, Bangor University, Gwynedd, UK
AbstractObjective—Several studies have examined abnormalities in cerebral blood flow (CBF) inpatients with systemic lupus erythematosus (SLE). However, the majority of these studies havereported CBF relative to a region assumed to be normal in the brain. The purpose of the presentstudy was to examine absolute differences in both regional CBF and cerebral blood volume (CBV)between SLE patients and healthy control subjects.
Methods—CBF and CBV were measured with dynamic susceptibility contrast (DSC) magneticresonance imaging (MRI), a technique that provides an alternative to radionuclide perfusionstudies and permits quantitative anatomic, CBF, and CBV imaging in a single scanning session.CBF and CBV were measured in both lesions and normal appearing tissue in the major cerebraland subcortical brain regions. Unlike most past perfusion studies on SLE, CBF and CBV valueswere not normalized to a region of brain assumed to be healthy.
Results—As expected, CBF and CBV within MRI-visible lesions were markedly reducedrelative to surrounding normal appearing white matter. However, both CBF and CBV in normalappearing tissue were higher in SLE patient groups, with or without lesions, relative to the controlgroup.
Conclusion—DSC MRI, without normalization to a region presumed to be healthy, revealedthat CBF and CBV in normal appearing tissue in SLE patients is higher than CBF and CBV incontrol subjects. Since this finding was made in subgroups of patients with and with out lesions,the higher CBF and CBV appears to precede lesion pathology.
Key Indexing Termslupus; brain; cerebral blood flow; cerebral blood volume; magnetic resonance imaging
Address for Correspondence: Charles Gasparovic, Ph.D., Pete and Nancy Domenici Hall, University of New Mexico, 1101 YaleBlvd. NE, Albuquerque, NM 87106, [email protected] for Reprint Requests: Charles Gasparovic, Ph.D., Pete and Nancy Domenici Hall, University of New Mexico, 1101 YaleBlvd. NE, Albuquerque, NM 87106, [email protected]
NIH Public AccessAuthor ManuscriptJ Rheumatol. Author manuscript; available in PMC 2013 March 28.
Published in final edited form as:J Rheumatol. 2010 September ; 37(9): 1834–1843. doi:10.3899/jrheum.091276.
NIH
-PA Author Manuscript
NIH
-PA Author Manuscript
NIH
-PA Author Manuscript

IntroductionSystemic lupus erythematosus (SLE) can produce a wide variety of neurologic andpsychiatric syndromes, including headache, chorea, cognitive dysfunction, and psychosis(1). Histopathologic studies have shown evidence of widespread parenchymal andcerebrovascular injury, including thromboembolic vasculopathy, infarction, gliosis, anddiffuse neuronal and axonal loss with varying degrees of inflammation (2). Evidence ofbrain injury and altered brain physiology in SLE also comes from studies onneurometabolism measured by 18F fluorodeoxyglucose (18FDG) positron emissiontomography (PET) or magnetic resonance spectroscopy (MRS) (3–8), and radionuclidecerebral blood flow (CBF) studies (3, 8–21), the overwhelming majority based on singlephoton emission computed tomography (SPECT). Diffuse patchy areas of regionallyreduced perfusion have been reported in diffuse neuropsychiatric SLE (NPSLE) syndromes,while focal areas of regionally reduced perfusion may occur in focal NPSLE (13, 16–18).These abnormalities may be conspicuous in presumed areas of neurologic impairment andimprove with corticosteroid therapy or clinical resolution (15, 19). However, at least onestudy examining SLE subjects with and without neuropyschiatric symptoms reported norelationship between NPSLE, neurocognitive function, and perfusion abnormalities,suggesting that reduced perfusion may not be a hallmark of NPSLE (11).
In contrast to the many SPECT studies on SLE, far fewer studies have examined CBF usingperfusion methods based on PET or magnetic resonance imaging (MRI). PET, while costlyand exposing the patient to high-energy ionizing radiation, is considered one of the mostaccurate methods for CBF measurement (22). A less costly alternative approach is dynamicsusceptibility contrast (DSC) MRI (23), which can be conveniently performed in the sameexamination as anatomic MRI, is inherently co-registered to the anatomical images, and,most importantly, does not expose the patient or examiner to ionizing radiation orradionuclides. While two early studies using PET found evidence of transient reduced (21)or lower CBF in a single subject (20), a more recent PET study found both higher CBFrelative to control subjects in anaemic, hypertensive patients with chronic renal failure,including one patient with SLE (24). Only one study on SLE using DSC MRI has beenreported (25). In that study both SPECT and DSC MRI were applied and revealed areas ofrelative hypoperfusion in SLE subjects, with SPECT detecting more hypoperfused areasthan DSC MRI. However, CBF differences in these studies were evaluated qualitatively ornormalized relative to CBF in a region of the brain presumed to be unaffected by disease. Toour knowledge, absolute regional differences in CBF between SLE and control subjects havenot been reported. Furthermore, quantitative cerebral blood volume (CBV) abnormalities inSLE, which is not measureable by conventional SPECT, have yet to be reported.
The purpose of the current study was to use DSC MRI to quantitatively measure bothcerebral perfusion and blood volume in SLE patients and healthy control subjects using non-normalized measures of CBF and CBV. Segmentation of the anatomical images acquired inthe same scanning session as the DSC MRI images allowed mean gray and white matterCBV and CBF values in cerebral (occipital, parietal, temporal, and frontal) and subcortical(caudate, putamen, thalamus, and globus pallidus) regions and within brain lesions to becalculated for both patients and healthy controls.
Materials and MethodsSubjects
This study was approved by the University of New Mexico Institutional Review Board andconformed to the Declaration of Helsinki. All subjects underwent informed consent andsigned formal permission for all procedures. Forty-two SLE subjects and 19 age- and
Gasparovic et al. Page 2
J Rheumatol. Author manuscript; available in PMC 2013 March 28.
NIH
-PA Author Manuscript
NIH
-PA Author Manuscript
NIH
-PA Author Manuscript

gender-matched normal control subjects were studied. The diagnosis of SLE was establishedin each subject using the American College of Rheumatology (ACR) 1997 revised criteriafor SLE (26). SLE disease activity was determined with the SLEDAI, SLE associated injurywas measured with SLICC/ACRDI (damage index), and NPSLE activity was determinedwith the neurologic subsets of both neuro-SLEDAI and neuro-SLICC/ACRDI as previouslyreported (27). Past and present neuropsychiatric symptoms and findings were classifiedusing the 1999 ACR Case Definitions for NPSLE (28). Important demographic features ofthe SLE group are shown in Table 1.
MRIAnatomical MRI, DSC MRI, and MR angiography were performed on all subjects using a1.5-T Siemens Sonata scanner with an 8-channel head coil. The total time of the MRIprotocol was approximately 1 hour. Scout images were used to prescribe a series of whole-head T1-weighted, T2-weighted, and fluid attenuated inversion recovery (FLAIR) imagesaligned with the interhemispheric midline and parallel to the anterior commissure-posteriorcommissure (AC-PC) line. T1-weighted images (3D fast low angle shot (FLASH) sequence,TR/TE = 12/4.76 ms, flip angle=20°, field of view (FOV) = 256 × 256 mm, resolution = 1mm × 1 mm, 128 slices, slice thickness = 1.5 mm) and T2-weighted images (Turbo spinecho sequence, TR/TE = 9040/64 ms, turbo factor = 5, FOV = 220 × 220 mm, resolution =1.1 mm × 1.1 mm, 128 slices, slice thickness = 1.5 mm) where acquired for anatomicalsegmentation of normal appearing gray matter (GM), white matter (WM), and cerebrospinalfluid (CSF). The FLAIR image (variable flip, TR/TE/TI = 6000 ms/358 ms/2100 ms,averages = 2, slice thickness = 1.5 mm, FOV = 220 mm, matrix size = 192 × 192) was usedto manually segment lesions. The segmented GM, WM, CSF, and lesion maps were used toidentify these regions in the processed perfusion maps. The DSC MRI images were acquiredwith a perfusion-weighted echo planar imaging (EPI) sequence (TR 1430 ms/TE 46 ms/Flip90°, 20 slices, a time course of 50 sequential acquisitions, FOV=200 mm2, matrix size128*128). Gadopentetate dimeglumine contrast agent (Magnevist®, Bayer HealthCarePharmaceuticals, www.bayerus.com) was injected into an antecubital vein at the standarddose (0.1 ml per Kg body weight) using a power-injector at 5 ml/sec, starting 15 sec after thestart of scan acquisition, followed by 20 ml of saline at the same rate. The central volumeprinciple allows perfusion characteristics (blood flow and volume) to be estimated from thesignal profile generated by the contrast bolus (23). Raw DSC MRI data were analyzed usingthe software package Penguin (NordicImagingLab, Bergen, Norway). The software convertspixel intensity changes due to contrast (gadopentetate) passage over the time series ofimages into pixel-by-pixel tissue contrast concentration curves, C(t). With user supervision,it selects candidate arterial pixels to construct an arterial input function, AIF(t), based on thehigher intensities and narrow time courses of the concentration changes. In this work anattempt was made to locate and use pixels associated with the middle cerebral arteryconsistently for the construction of the AIF(t). A gamma variate function is fit to the rawC(t) and AIF(t) curves to capture just the first pass of the contrast bolus and used torepresent C(t) and AIF(t) in further analyses. The CBV in any pixel is calculated as the ratioof areas under the tissue and artery concentration curves K • ∫C(t) dt / ∫AIF(t) dt. In thepresent work, the constant K was set to 1 rather than to a value based on assumed capillaryand artery hematocrits and tissue density (29). The calculation of CBF is more complex, andinvolves an equation relating C(t) to CBF and the convolution of AIF(t) and the residuefunction R(t), the fraction of contrast agent in the vasculature at any time: C(t) = K • CBF •[AIF(t) ⊗ R(t)], where ⊗ denotes the convolution operator. Various strategies have beenproposed for deconvolving AIF(t) from R(t) in order to solve this equation for CBF (23). Inthis work we applied the circular singular value decomposition method (30) available as anoption in Penguin and shown to provide robust CBF measures in the presence of variabledelays between bolus arrival in the arterial pixels defining the AIF(t) and the tissue pixels
Gasparovic et al. Page 3
J Rheumatol. Author manuscript; available in PMC 2013 March 28.
NIH
-PA Author Manuscript
NIH
-PA Author Manuscript
NIH
-PA Author Manuscript

defining C(t). The CBV and CBF maps constructed with Penguin were co-registered to theT1-weighted images to identify distinct brain regions within gray and white matter. Thisprocedure involved automatically segmenting the T1-weighted image into GM, WM, andCSF and co-registering the lesion map that was manually traced from the FLAIR image tothe T1-weighted image. T1-weighted image was warped into a standard brain template foridentifying the major cortical and subcortical brain regions. Finally, the resulting regionallysegmented map was transformed back into the native space of the CBV and CBF maps.These steps were accomplished with the BRAINS2 software (31). Gray and white mattervalues for 4 cerebral regions (occipital, parietal, temporal, and frontal) and 4 subcorticalregions (caudate, putamen, thalamus, and globus pallidus) for each hemisphere are reported.These regions of interest are shown in a representative T1-weighted image from one subjectin Figure 1. Mean CBV and CBF values in lesions are also reported. In order to resolveCBV and CBF in normal appearing tissue from CBV and CBF in lesions, the mean regionalcerebral or subcortical values of CBV and CBF reported were calculated without the lesionpixels included. This allowed us to observe similarities in normal appearing tissue betweenlupus groups (those with lesions and those without lesions) without the confound of thelower lesion CBV and CBF values reducing the overall mean values for the region.
Statistical AnalysisGroup differences in regional CBV and CBF among SLE subgroups (with and withoutlesions) and the control group were analyzed by repeated measures (RM) analysis ofvariance (ANOVA) with the three groups as the grouping factor and the different brainregions as a repeated factor. This approach was motivated by the fact that CBF and CBV areknown to vary from region to region in the brain and, hence, statistical comparisons basedon CBF or CBV averaged over the whole brain will fail to capture differences in theregional variation of these parameters. RM ANOVA was performed in each of 3 generaltissue types: 1) cerebral gray matter, 2) cerebral white matter, and 3) subcortical gray matter.Post hoc pair-wise comparisons were made using Wald’s t-test. The RM model in eachgeneral region was constructed with brain hemisphere and specific region (e.g., occipital,parietal, temporal, and frontal) as repeated factors (e.g., see Table 3). Correlations betweenCBF and aPL tests were examined with linear regression and Spearman's rank correlationcoefficient. All statistical analyses were performed with SAS® (http://www.sas.com).
ResultsForty-two SLE subjects and 19 controls were studied. The SLE and control groups weresimilar in age (SLE = 38.1±12.4 years; Controls = 34.8±11.9 years; p = 0.33), gender (SLE= 95% female, Controls = 89% females, p = 0.58), weight (SLE = 71.4±14.0 kg; Controls =69.7±11.9 kg; p = 0.63), and body mass index (BMI) (SLE = 26.65±4.7 kg; Controls =25.8±5.0 kg; p = 0.56). Twenty-three (54.8%) of the SLE subjects had focal lesions thatwere detectable on FLAIR images. As expected, the total lesion volume in the group of SLEpatients varied, with a median of 0.70 cm3 and interquartile range of 0.21 to 5.99 cm3.However, regression analysis revealed no significant correlation between lesion volume andCBF or CBV in non-lesion tissue in these subjects. Among patients without hypertension(systolic blood pressure <140 mm Hg, diastolic < 90 mm Hg), 48% (16/33) had lesions andamong those with hypertension 88% (7/8) had lesions. Using Fisher’s Exact test, thecorrelation between the presence of lesion and hypertension was found not to be significant.Subjects with lesions tended to be older (p = 0.051) and have lower levels of anti-DNAantibodies (p = 0.02) than those without lesions. However, subjects with and without lesionswere very similar in all other clinical and laboratory parameters, including anticardiolipinantibodies and lupus-like inhibitor, SLE disease activity (SLEDAI), SLE damage (SLICC-ACR/DAI), NPSLE activity (Neuro-SLEDAI), and damage caused by NPSLE (Neuro-
Gasparovic et al. Page 4
J Rheumatol. Author manuscript; available in PMC 2013 March 28.
NIH
-PA Author Manuscript
NIH
-PA Author Manuscript
NIH
-PA Author Manuscript

SLICC) (Table 1). The lesions were located almost exclusively in white matter regions andpredominantly in the frontal and parietal lobes. Anatomical and perfusion images from onesubject are shown in Fig.1, demonstrating a pronounced reduction in perfusion at the site ofa lesion evident in the FLAIR image. A significant group difference in aPL levels betweenSLE groups with and without lesions was not observed in this sample.
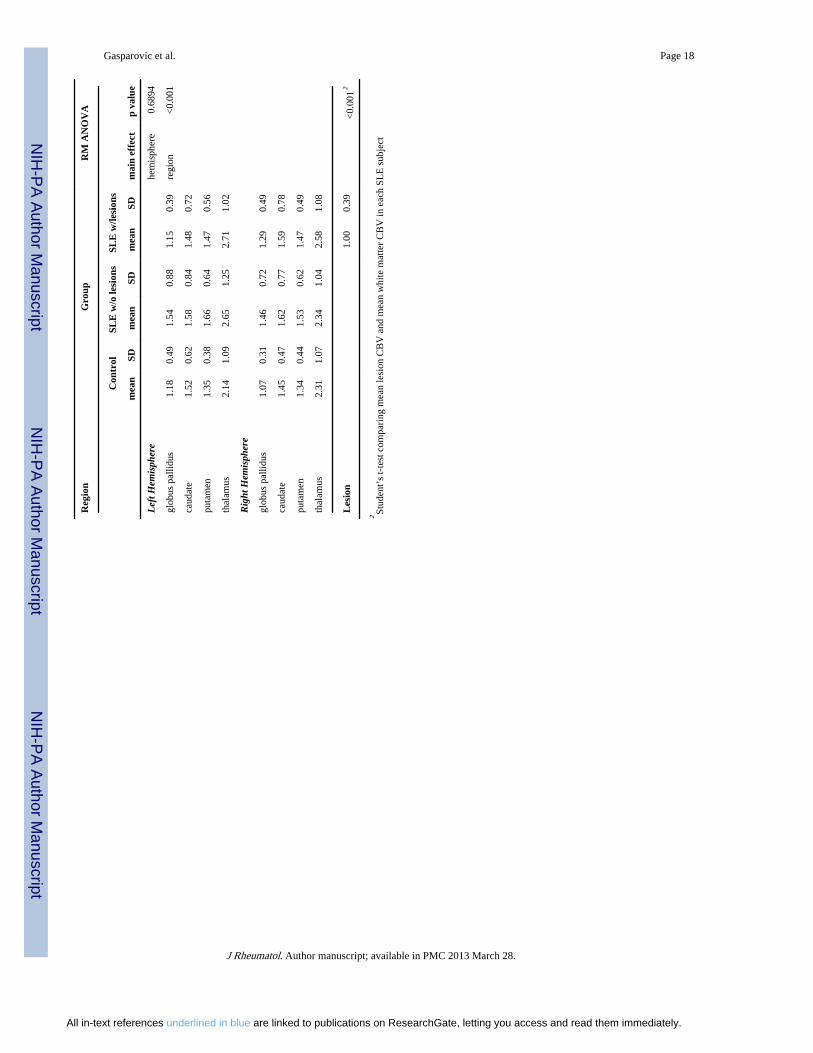
A regional pattern of posterior-to-anterior increase in CBF was observed in all groups of thisstudy (Fig. 2), in agreement with past perfusion studies using other methods (32, 33) andreflected by a similar pattern of CBV across the brain (Fig. 2). Thus, occipital and parietallobes were consistently less perfused than the frontal lobes and, within subcortical regions,the globus pallidus was less perfused than the caudate nucleus in all subject groups. Also, asexpected, both CBF and CBV in MRI-visible lesions were significantly reduced (p<0.001)relative to normal appearing white matter (Tables 2 and 3), indicating a disruption ofvascular-parenchymal integrity in MR-visible lesions. Finally, both CBF and CBV werehigher in the SLE groups (with or without lesions) relative to the control group (Tables 2and 3). RM ANOVA and post hoc pair-wise t-tests, used to examine group differencesacross either all cerebral gray matter, all cerebral white matter, or all subcortical gray matterregions, revealed that both CBV and CBF were significantly higher in SLE subjects than incontrol subjects in all regions except possibly in subcortical gray matter for CBF, where thep value was 0.051. Neither prednisone use or multiple measures of disease activity (i.e.,SLEDAI, Neuro-SLEDAI, SLICC, Neuro-SLICC) correlated significantly with CBF orCBV. A trend toward higher CBV and CBF in SLE subjects without MRI detectable lesionsrelative to those with lesions was also observed, indicating that the underlying cause ofelevated blood volume and perfusion in SLE subjects may be independent of MR-visiblelesions and may precede MRI detectable lesion formation.
DiscussionSeveral studies have found evidence of abnormal cerebral perfusion in SLE patients (3, 8–21). The vast majority of these studies were based on SPECT methods and reported regionaldeficits in CBF relative to brain regions presumed to be normal within the individualsubject. Using quantitative DSC MRI without normalization, we found that CBF wassignificantly reduced within MRI-visible brain lesions in SLE patients, indicating adisruption of vascular-parynchymal integrity consistent with prior SPECT studies. However,the results of the current study indicate that both CBV and CBF were consistently higher innormal appearing tissue in SLE patients than in corresponding tissues in age and gendermatched healthy control subjects (Fig. 2 and Tables 2 and 3). Additionally, no significantgroup differences in CBV or CBF between SLE subjects with lesions and SLE subjectswithout lesions were observed, indicating that the causal factor or factors contributing toelevated cerebral perfusion were not directly related to and may not be caused by lesionload.
The CBF group differences demonstrating increased CBF in SLE observed in the presentstudy are not necessarily in disagreement with prior findings of relative regional reductionsin CBF in SLE patients, including at least one study comparing SPECT findings to DSCMRI findings (25). The group differences in CBF in normal appearing tissue observed inthis study, based on non-normalized measures of CBV and CBF, would have been obscuredby normalization to any particular region, since all brain regions in the SLE group werefound to be elevated relative to those in the control group. Furthermore, the precise co-registration of perfusion and lesion maps inherent in integrated anatomic-perfusion MRI inthe current study allowed us to exclude lesions from the analysis of normal appearing tissueregions. Hence, the use of analysis methods in prior studies that normalize CBF by values inother brain regions and, furthermore, do not exclude obvious anatomic abnormalities could
Gasparovic et al. Page 5
J Rheumatol. Author manuscript; available in PMC 2013 March 28.
NIH
-PA Author Manuscript
NIH
-PA Author Manuscript
NIH
-PA Author Manuscript

account for the absence of findings similar to those reported here. Finally, to our knowledge,this is the first report of direct comparisons of quantitative CBV between SLE and controlgroups. While issues concerning the accuracy of either MRI and SPECT based perfusionmeasurements relative to PET are well known (22, 34), the measurement of CBV by DSCMRI is more straightforward than the calculation of CBF, and derived simply from the ratioof the time courses of the arterial and tissue bolus concentration curves. The CBV groupdifferences observed in this study closely paralleled the CBF group differences.
Cerebral hyperperfusion in SLE has been reported previously, but only in the basal gangliaof SLE patients with Parkinsonian syndrome using relative measures of perfusion withSPECT (35, 36). However, in a study that included at least one patient with SLE,quantitative PET was used to observe higher CBF throughout the brain of patients with renaldisease relative to healthy control subjects (24). Hyperperfusion also has been reported inother neurological disorders, including stroke (37), occlusive sickle-cell disease (38),transient ischemic attack (39), seizures and epilepsy (40), traumatic brain injury (41),metabolic brain disease (42), and migraine (43). Increased CBV can also be observed in thesymptom free interval of a transient ischemic attack, the acute state of a completedinfarction, traumatic brain injury, non-enhancing lesions of multiple sclerosis, and normalappearing tissue in multiple sclerosis (44). The increased CBV reported in stroke mayindicate intact vascular beds with potentially salvageable areas in the penumbra of the lesion(45). Furthermore, increases in CBV can be a sign of vasomotor instability, a compensatorymechanism indicating resolving injury, or a reduction of compensatory capacity in responseto further ischemia or injury (46).
MRI is presently the preferred anatomic neuroimaging modality to evaluate NPSLE (47).While H2
15O PET remains the “gold standard” for cerebral perfusion studies, it is costly,involves the use of a catheter to measure the arterial H2
15O concentration, involves high-energy ionizing radiation, and requires immediate proximity to a cyclotron that can generatethe short-lived 15O radioisotope. SPECT offers a practical alternative to PET, but may havelimitations in accuracy relative to PET and, therefore, is most commonly used to assessrelative CBF differences rather than absolute quantitative measures of CBF (34). While priorstudies have demonstrated that SPECT and DSC MRI are comparable to each other inaccuracy (48), DSC MRI has the advantages of not using radioisotopes, having higherspatial resolution, and allowing the measurement of CBV as well as CBF. The risksinvolved with the use of gadolinium-based contrast agents in DSC MRI are small andidentical to those associated with the use of these agents for routine contrast MRI scans, butinclude an association with nephrogenic systemic fibrosis, possibly due to free gadoliniumtoxicity, in subjects with end stage renal disease (49). Therefore, caution should be exercisedin administering gadolinium-based contrast agents to subjects with highly compromisedrenal function.
Compared to non-MRI methods, DSC MRI allows easy and accurate registration of the CBFand CBV maps to MRI anatomical images acquired in the same scanning session. This latteradvantage, for example, permitted the CBF and CBV maps of this study to undergo accurateregion-of-interest analysis, in which mean CBF and CBV values were specifically assignedto gray matter, white matter, lesions, and the major anatomical regions after co-registrationto high resolution T1-weighted and FLAIR images. This allowed us to observe not only theexpected pattern of regional CBF and CBV differences within the brain, but also lower CBFand CBV in regions of small lesions. By not normalizing CBF and CBV values reported inthis study to values in a region presumed to be “normal”, as has been done in most paststudies on SLE, we were able to observed differences between control and SLE groups.However, it is important to note that uncertainty in the arterial input function measurement(see Methods) has been shown to limit the accuracy of CBF and CBV values obtained with
Gasparovic et al. Page 6
J Rheumatol. Author manuscript; available in PMC 2013 March 28.
NIH
-PA Author Manuscript
NIH
-PA Author Manuscript
NIH
-PA Author Manuscript

DSC MRI (50) and, hence, the values reported here cannot be considered quantitative in theabsolute sense. However, under the assumption that there was no systematic bias in themeasurement of the AIF in either group, these values allow relative differences in both CBFand CBV between groups to be observed. The findings of this study, therefore, suggest thata similar approach of examining non-normalized CBF values, irrespective of themeasurement method, be taken in future perfusion studies on SLE.
In summary, the results of this study demonstrate lower CBF and CBV in lesions but higherCBF and CBV throughout cortical and white matter regions of the brain in SLE patientsrelative to control subjects. The higher global CBF and CBV values do not appear to bedirectly related to the presence of MRI-detectable lesions and may be due to other reactivephysiologic or pathogenic factors underlying SLE, such as vasomotor instability,compensatory mechanisms for resolving injury, low-grade excitotoxcity due to antibodyimpairment of N-methyl D-aspartate (NMDA) receptors, or inflammatory factors (51).Integrated DSC MRI and MRI is a robust method to measure CBF and CBV in specificanatomically defined tissues and may provide new insights into the neuropathology of SLE.
AcknowledgmentsThis research was funded by the grant RO1-HL04722 by the National Institutes of Health/National Heart Lung andBlood Institute and in part by the grant 8UL1-TR000041 by the National Center for Research Resources.
References1. Rhiannon JJ. Systemic lupus erythematosus involving the nervous system: presentation,
pathogenesis, and management. Clin Rev Allergy Immunol. 2008 Jun; 34(3):356–360. [PubMed:18181036]
2. Jennekens FG, Kater L. The central nervous system in systemic lupus erythematosus. Part 1.Clinical syndromes: a literature investigation. Rheumatology (Oxford). 2002 Jun; 41(6):605–618.[PubMed: 12048286]
3. Grunwald F, Schomburg A, Badali A, Ruhlmann J, Pavics L, Biersack HJ. 18FDG PET andacetazolamide-enhanced 99mTc-HMPAO SPET in systemic lupus erythematosus. Eur J Nucl Med.1995 Sep; 22(9):1073–1077. [PubMed: 7588946]
4. Otte A, Weiner SM, Peter HH, Mueller-Brand J, Goetze M, Moser E, et al. Brain glucose utilizationin systemic lupus erythematosus with neuropsychiatric symptoms: a controlled positron emissiontomography study. Eur J Nucl Med. 1997 Jul; 24(7):787–791. [PubMed: 9211766]
5. Sibbitt WL Jr, Haseler LJ, Griffey RR, Friedman SD, Brooks WM. Neurometabolism of activeneuropsychiatric lupus determined with proton MR spectroscopy. AJNR Am J Neuroradiol. 1997Aug; 18(7):1271–1277. [PubMed: 9282854]
6. Weiner SM, Otte A, Schumacher M, Klein R, Gutfleisch J, Brink I, et al. Diagnosis and monitoringof central nervous system involvement in systemic lupus erythematosus: value of F-18fluorodeoxyglucose PET. Ann Rheum Dis. 2000 May; 59(5):377–385. [PubMed: 10784521]
7. Castellino G, Govoni M, Padovan M, Colamussi P, Borrelli M, Trotta F. Proton magnetic resonancespectroscopy may predict future brain lesions in SLE patients: a functional multi-imaging approachand follow up. Ann Rheum Dis. 2005 Jul; 64(7):1022–1027. [PubMed: 15640271]
8. Handa R, Sahota P, Kumar M, Jagannathan NR, Bal CS, Gulati M, et al. In vivo proton magneticresonance spectroscopy (MRS) and single photon emission computerized tomography (SPECT) insystemic lupus erythematosus (SLE). Magn Reson Imaging. 2003 Nov; 21(9):1033–1037.[PubMed: 14684208]
9. Postiglione A, De Chiara S, Soricelli A, Oriente A, Ruocco A, Spadaro G, et al. Alterations ofcerebral blood flow and antiphospholipid antibodies in patients with systemic lupus erythematosus.Int J Clin Lab Res. 1998; 28(1):34–38. [PubMed: 9594361]
Gasparovic et al. Page 7
J Rheumatol. Author manuscript; available in PMC 2013 March 28.
NIH
-PA Author Manuscript
NIH
-PA Author Manuscript
NIH
-PA Author Manuscript

10. Huang JL, Yeh KW, You DL, Hsieh KH. Serial single photon emission computed tomographyimaging in patients with cerebral lupus during acute exacerbation and after treatment. PediatrNeurol. 1997 Jul; 17(1):44–48. [PubMed: 9308975]
11. Waterloo K, Omdal R, Sjoholm H, Koldingsnes W, Jacobsen EA, Sundsfjord JA, et al.Neuropsychological dysfunction in systemic lupus erythematosus is not associated with changes incerebral blood flow. J Neurol. 2001 Jul; 248(7):595–602. [PubMed: 11518002]
12. Kobayashi H, Watanabe H, Seino T, Suzuki S, Sato Y. Quantitative imaging of cerebral blood flowusing SPECT with 123I-iodoamphetamine in neuropsychiatric systemic lupus erythematosus. JRheumatol. 2003 Sep; 30(9):2075–2076. [PubMed: 12966619]
13. Yoshida A, Shishido F, Kato K, Watanabe H, Seino O. Evaluation of cerebral perfusion in patientswith neuropsychiatric systemic lupus erythematosus using 123I-IMP SPECT. Ann Nucl Med.2007 Jun; 21(3):151–158. [PubMed: 17561586]
14. Colamussi P, Trotta F, Ricci R, Cittanti C, Govoni M, Barbarella G, et al. Brain perfusion SPETand proton magnetic resonance spectroscopy in the evaluation of two systemic lupuserythematosus patients with mild neuropsychiatric manifestations. Nucl Med Commun. 1997 Mar;18(3):269–273. [PubMed: 9106782]
15. Emmi L, Bramati M, De Cristofaro MT, Mascalchi M, Dal Pozzo G, Marconi GP, et al. MRI andSPECT investigations of the CNS in SLE patients. Clin Exp Rheumatol. 1993 Jan-Feb;11(1):13–20. [PubMed: 8453792]
16. Kovacs JA, Urowitz MB, Gladman DD, Zeman R. The use of single photon emissioncomputerized tomography in neuropsychiatric SLE: a pilot study. J Rheumatol. 1995 Jul; 22(7):1247–1253. [PubMed: 7562753]
17. Lin WY, Wang SJ, Yen TC, Lan JL. Technetium-99m-HMPAO brain SPECT in systemic lupuserythematosus with CNS involvement. J Nucl Med. 1997 Jul; 38(7):1112–1115. [PubMed:9225800]
18. Russo R, Gilday D, Laxer RM, Eddy A, Silverman ED. Single photon emission computedtomography scanning in childhood systemic lupus erythematosus. J Rheumatol. 1998 Mar; 25(3):576–582. [PubMed: 9517784]
19. Sun SS, Huang WS, Chen JJ, Chang CP, Kao CH, Wang JJ. Evaluation of the effects ofmethylprednisolone pulse therapy in patients with systemic lupus erythematosus with braininvolvement by Tc-99m HMPAO brain SPECT. Eur Radiol. 2004 Jul; 14(7):1311–1315.[PubMed: 14663624]
20. Pinching AJ, Travers RL, Hughes GR, Jones T, Moss S. Oxygen-15 brain scanning for detection ofcerebral involvement in systemic lupus erythematosus. Lancet. 1978 Apr 29; 1(8070):898–900.[PubMed: 76844]
21. Volkow ND, Warner N, McIntyre R, Valentine A, Kulkarni M, Mullani N, et al. Cerebralinvolvement in systemic lupus erythematosus. Am J Physiol Imaging. 1988; 3(2):91–98.[PubMed: 3260788]
22. Latchaw RE, Yonas H, Hunter GJ, Yuh WT, Ueda T, Sorensen AG, et al. Guidelines andrecommendations for perfusion imaging in cerebral ischemia: A scientific statement for healthcareprofessionals by the writing group on perfusion imaging, from the Council on CardiovascularRadiology of the American Heart Association. Stroke. 2003 Apr; 34(4):1084–1104. [PubMed:12677088]
23. Ostergaard L. Principles of cerebral perfusion imaging by bolus tracking. J Magn Reson Imaging.2005 Dec; 22(6):710–717. [PubMed: 16261573]
24. Kuwabara Y, Sasaki M, Hirakata H, Koga H, Nakagawa M, Chen T, et al. Cerebral blood flow andvasodilatory capacity in anemia secondary to chronic renal failure. Kidney Int. 2002 Feb; 61(2):564–569. [PubMed: 11849397]
25. Borrelli M, Tamarozzi R, Colamussi P, Govoni M, Trotta F, Lappi S. Evaluation with MR,perfusion MR and cerebral flowSPECT in NPSLE patients. Radiol Med. 2003 May-Jun;105(5–6):482–489. [PubMed: 12949459]
26. Hochberg MC. Updating the American College of Rheumatology revised criteria for theclassification of systemic lupus erythematosus. Arthritis Rheum. 1997 Sep.40(9):1725. [PubMed:9324032]
Gasparovic et al. Page 8
J Rheumatol. Author manuscript; available in PMC 2013 March 28.
NIH
-PA Author Manuscript
NIH
-PA Author Manuscript
NIH
-PA Author Manuscript

27. Gladman D, Ginzler E, Goldsmith C, Fortin P, Liang M, Urowitz M, et al. The development andinitial validation of the Systemic Lupus International Collaborating Clinics/American College ofRheumatology damage index for systemic lupus erythematosus. Arthritis Rheum. 1996 Mar;39(3):363–369. [PubMed: 8607884]
28. The American College of Rheumatology nomenclature and case definitions for neuropsychiatriclupus syndromes. Arthritis Rheum. 1999 Apr; 42(4):599–608. [PubMed: 10211873]
29. Rempp KA, Brix G, Wenz F, Becker CR, Guckel F, Lorenz WJ. Quantification of regionalcerebral blood flow and volume with dynamic susceptibility contrast-enhanced MR imaging.Radiology. 1994 Dec; 193(3):637–641. [PubMed: 7972800]
30. Wu O, Ostergaard L, Weisskoff RM, Benner T, Rosen BR, Sorensen AG. Tracer arrival timing-insensitive technique for estimating flow in MR perfusion-weighted imaging using singular valuedecomposition with a block-circulant deconvolution matrix. Magn Reson Med. 2003 Jul; 50(1):164–174. [PubMed: 12815691]
31. Magnotta VA, Bockholt HJ, Johnson HJ, Christensen GE, Andreasen NC. Subcortical, cerebellar,and magnetic resonance based consistent brain image registration. Neuroimage. 2003 Jun; 19(2 Pt1):233–245. [PubMed: 12814574]
32. Tanaka F, Vines D, Tsuchida T, Freedman M, Ichise M. Normal patterns on 99mTc-ECD brainSPECT scans in adults. J Nucl Med. 2000 Sep; 41(9):1456–1464. [PubMed: 10994723]
33. Speck O, Chang L, DeSilva NM, Ernst T. Perfusion MRI of the human brain with dynamicsusceptibility contrast: gradient-echo versus spin-echo techniques. J Magn Reson Imaging. 2000Sep; 12(3):381–387. [PubMed: 10992304]
34. Wintermark M, Sesay M, Barbier E, Borbely K, Dillon WP, Eastwood JD, et al. Comparativeoverview of brain perfusion imaging techniques. J Neuroradiol. 2005 Dec; 32(5):294–314.[PubMed: 16424829]
35. Lee PH, Joo US, Bang OY, Seo CH. Basal ganglia hyperperfusion in a patient with systemic lupuserythematosus-related parkinsonism. Neurology. 2004 Jul 27; 63(2):395–396. [PubMed:15277652]
36. Khubchandani RP, Viswanathan V, Desai J. Unusual neurologic manifestations (I): Parkinsonismin juvenile SLE. Lupus. 2007; 16(8):572–575. [PubMed: 17711890]
37. Guadagno JV, Warburton EA, Jones PS, Fryer TD, Day DJ, Gillard JH, et al. The diffusion-weighted lesion in acute stroke: heterogeneous patterns of flow/metabolism uncoupling asassessed by quantitative positron emission tomography. Cerebrovasc Dis. 2005; 19(4):239–246.[PubMed: 15741718]
38. Kim YS, Nur E, van Beers EJ, Truijen J, Davis SC, Biemond BJ, et al. Dynamic cerebralautoregulation in homozygous Sickle cell disease. Stroke. 2009 Mar; 40(3):808–814. [PubMed:19150866]
39. Friberg L, Olsen TS. Cerebrovascular instability in a subset of patients with stroke and transientischemic attack. Arch Neurol. 1991 Oct; 48(10):1026–1031. [PubMed: 1929893]
40. Sagiuchi T, Ishii K, Asano Y, Aoki Y, Kikuchi K, Jinguuji K, et al. Interictal crossed cerebellarhyperperfusion on Tc-99m ECD SPECT. Ann Nucl Med. 2001 Aug; 15(4):369–372. [PubMed:11577763]
41. Cruz J, Nakayama P, Imamura JH, Rosenfeld KG, de Souza HS, Giorgetti GV. Cerebral extractionof oxygen and intracranial hypertension in severe, acute, pediatric brain trauma: preliminary novelmanagement strategies. Neurosurgery. 2002 Apr; 50(4):774–779. discussion 9–80. [PubMed:11904028]
42. Moore DF, Altarescu G, Herscovitch P, Schiffmann R. Enzyme replacement reverses abnormalcerebrovascular responses in Fabry disease. BMC Neurol. 2002 Jun 18.2:4. [PubMed: 12079501]
43. Pollock JM, Deibler AR, Burdette JH, Kraft RA, Tan H, Evans AB, et al. Migraine associatedcerebral hyperperfusion with arterial spin-labeled MR imaging. AJNR Am J Neuroradiol. 2008Sep; 29(8):1494–1497. [PubMed: 18499796]
44. Ge Y, Law M, Johnson G, Herbert J, Babb JS, Mannon LJ, et al. Dynamic susceptibility contrastperfusion MR imaging of multiple sclerosis lesions: characterizing hemodynamic impairment andinflammatory activity. AJNR Am J Neuroradiol. 2005 Jun-Jul;26(6):1539–1547. [PubMed:15956527]
Gasparovic et al. Page 9
J Rheumatol. Author manuscript; available in PMC 2013 March 28.
NIH
-PA Author Manuscript
NIH
-PA Author Manuscript
NIH
-PA Author Manuscript

45. Hatazawa J, Shimosegawa E, Toyoshima H, Ardekani BA, Suzuki A, Okudera T, et al. Cerebralblood volume in acute brain infarction: A combined study with dynamic susceptibility contrastMRI and 99mTc-HMPAO-SPECT. Stroke. 1999 Apr; 30(4):800–806. [PubMed: 10187882]
46. Smith M. Perioperative uses of transcranial perfusion monitoring. Neurosurg Clin N Am. 2008 Jul;19(3):489–502. vii. [PubMed: 18790384]
47. Sibbitt WL Jr, Sibbitt RR, Brooks WM. Neuroimaging in neuropsychiatric systemic lupuserythematosus. Arthritis Rheum. 1999 Oct; 42(10):2026–2038. [PubMed: 10524673]
48. Kikuchi K, Murase K, Miki H, Kikuchi T, Sugawara Y, Mochizuki T, et al. Measurement ofcerebral hemodynamics with perfusion-weighted MR imaging: comparison with pre- and post-acetazolamide 133Xe-SPECT in occlusive carotid disease. AJNR Am J Neuroradiol. 2001 Feb;22(2):248–254. [PubMed: 11156764]
49. Kuo PH, Kanal E, Abu-Alfa AK, Cowper SE. Gadolinium-based MR contrast agents andnephrogenic systemic fibrosis. Radiology. 2007 Mar; 242(3):647–649. [PubMed: 17213364]
50. Calamante F, Gadian DG, Connelly A. Quantification of perfusion using bolus tracking magneticresonance imaging in stroke: assumptions, limitations, and potential implications for clinical use.Stroke. 2002 Apr; 33(4):1146–1151. [PubMed: 11935075]
51. Steup-Beekman G, Steens S, van Buchem M, Huizinga T. Anti-NMDA receptor autoantibodies inpatients with systemic lupus erythematosus and their first-degree relatives. Lupus. 2007; 16(5):329–334. [PubMed: 17576734]
Gasparovic et al. Page 10
J Rheumatol. Author manuscript; available in PMC 2013 March 28.
NIH
-PA Author Manuscript
NIH
-PA Author Manuscript
NIH
-PA Author Manuscript

Figure 1.A) T1-weighted image from one control patient with regions of interest overlaid: F = frontal,P = parietal, T = temporal, O = occipital, G = globus pallidus, C = caudate, Pu = putamen,Th = thalamus.
Gasparovic et al. Page 11
J Rheumatol. Author manuscript; available in PMC 2013 March 28.
NIH
-PA Author Manuscript
NIH
-PA Author Manuscript
NIH
-PA Author Manuscript

Figure 2.A) FLAIR image from one SLE patient, with a white matter lesion indicated by black arrow(lower right quadrant of image). B) CBF map from same subject showing reduced CBF inregion of lesion (white arrow) and AIF time course (insert in upper right corner).
Gasparovic et al. Page 12
J Rheumatol. Author manuscript; available in PMC 2013 March 28.
NIH
-PA Author Manuscript
NIH
-PA Author Manuscript
NIH
-PA Author Manuscript

Figure 3.Plots of mean CBF and CBV values for each tissue class (gray matter, white matter,subcortical gray matter), hemisphere (left = L and right = R) and region (F = frontal, P =parietal, T = temporal, O = occipital, G = globus pallidus, C = caudate, Pu = putamen, Th =thalamus) in controls (circles), SLE subjects with lesions (squares), and SLE subjectswithout lesions (triangles).
Gasparovic et al. Page 13
J Rheumatol. Author manuscript; available in PMC 2013 March 28.
NIH
-PA Author Manuscript
NIH
-PA Author Manuscript
NIH
-PA Author Manuscript

NIH
-PA Author Manuscript
NIH
-PA Author Manuscript
NIH
-PA Author Manuscript
Gasparovic et al. Page 14
Table 1
Demographics and clinical assessments of the SLE subjects.
SLE w/lesions(n =23)
SLE w/o lesions(n = 19)
p value
Age (years) 41.5±11.7 34.0±12.3 0.051
Female Gender 91.3% 94.7% 0.66*
Age of Onset of SLE (years) 31.4±11.1 26.2±14.6 0.21
Disease Duration (years) 11.0±8.0 7.5±5.7 0.11
Prednisone (mg/day) 13.0±41.4 5.8±11.3 0.43
Hydroxychloroquine 47.8% 47.4% 0.99*
Cyclophosphamide 26.1% 36.8% 0.52*
Mycophenylate 17.4% 10.5% 0.67*
SLEDAI (U) 11.9±10.5 10.2±7.7 0.55
SLICC-ACR/DAI (U) 3.7±2.5 3.1±2.3 0.39
Neuro-SLEDAI (U) 4.5±6.7 2.1±4.5 0.17
Neuro-SLICC (U) 1.2±1.3 0.6±0.9 0.08
Antinuclear antibody titer ((d(diluti (inverse) 294±396 360±463 0.62
Anti-ds-DNA antibody Titer (dilutions)(inverse) 14.9±36.9 54.0±59.8 0.02
C3 (mg/dL)) 104±36 100±30 0.70
C4 (mg/dL)) 25±35 16±7 0.27
Erythrocyte Sedimentation Rate (mm/hr)(mm/hr) 29±34 20±14 0.24
C-reactive protein (mg/dL)) 1.2±1.7 1.1±1.5 0.75
aPL IgG (IU) 10.7±10.5 18.2±27.1 0.26
aPL IgM (IU) 12.0±17.7 10.0±14.3 0.70
aPL IgA (IU) 6.5±12.8 6.4±11.9 0.99
Lupus-like Inhibitor 27.3% 42.1% 0.35*
Anti-ribosomal P antibody (dilutions) 1.5±3.0 10.8±32.4 0.24
Satterthwaite’s t-test was used except for binary data* where Fisher’s Exact test was used.
J Rheumatol. Author manuscript; available in PMC 2013 March 28.

NIH
-PA Author Manuscript
NIH
-PA Author Manuscript
NIH
-PA Author Manuscript
Gasparovic et al. Page 15
Tabl
e 2
Reg
iona
l CB
F m
ean
valu
es (
mL
/min
/100
g tis
sue)
and
sta
ndar
d de
viat
ions
(SD
) in
hea
lthy
cont
rol s
ubje
cts,
SL
E s
ubje
cts
with
out l
esio
ns, a
nd S
LE
subj
ects
with
lesi
ons.
Rep
eate
d m
easu
res
AN
OV
A r
esul
ts a
re r
epor
ted
for
the
mai
n ef
fect
s of
gro
up, h
emis
pher
e, a
nd r
egio
n fo
r ea
ch ti
ssue
cla
ss(c
ereb
ral g
ray
mat
ter,
whi
te m
atte
r, s
ubco
rtic
al g
ray)
.
Reg
ion
Gro
upR
M A
NO
VA
Con
trol
SLE
w/o
lesi
ons
SLE
w/le
sion
s
mea
nSD
mea
nSD
mea
nSD
mai
n ef
fect
p va
lue
Cer
ebra
l Gre
y M
atte
rgr
oup
0.00
7
Lef
t Hem
isph
ere
hem
isph
ere
0.39
9
fron
tal
20.0
5.9
22.3
7.5
20.7
5.4
regi
on0.
353
pari
etal
20.7
5.5
23.4
8.4
21.4
5.7
tem
pora
l21
.45.
423
.06.
922
.24.
8
occi
pita
l21
.36.
324
.78.
222
.05.
8
Rig
ht H
emis
pher
e
fron
tal
19.8
5.2
22.4
7.3
20.3
4.8
pari
etal
20.5
5.7
22.4
8.5
21.7
5.4
tem
pora
l21
.55.
423
.47.
022
.44.
7
occi
pita
l19
.75.
921
.67.
521
.55.
3
Cer
ebra
l Whi
te M
atte
rgr
oup
<0.
001
Lef
t Hem
isph
ere
hem
isph
ere
0.80
0
fron
tal
13.2
4.3
14.9
5.4
14.8
4.1
regi
on<
0.00
1
pari
etal
14.2
4.3
17.2
7.1
15.5
4.0
tem
pora
l16
.05.
418
.56.
517
.84.
2
occi
pita
l18
.15.
821
.87.
318
.65.
4
Rig
ht H
emis
pher
e
fron
tal
13.3
3.8
14.8
5.4
14.9
3.9
pari
etal
14.8
4.9
17.1
6.4
16.2
4.3
tem
pora
l17
.15.
519
.56.
818
.74.
5
occi
pita
l17
.25.
519
.77.
518
.74.
9
Subc
orti
algr
oup
0.05
1
J Rheumatol. Author manuscript; available in PMC 2013 March 28.

NIH
-PA Author Manuscript
NIH
-PA Author Manuscript
NIH
-PA Author Manuscript
Gasparovic et al. Page 16
Reg
ion
Gro
upR
M A
NO
VA
Con
trol
SLE
w/o
lesi
ons
SLE
w/le
sion
s
mea
nSD
mea
nSD
mea
nSD
mai
n ef
fect
p va
lue
Lef
t Hem
isph
ere
hem
isph
ere
0.47
1
glob
us p
allid
us14
.15.
016
.08.
613
.35.
4re
gion
<0.
001
caud
ate
14.9
6.4
16.4
10.0
13.7
7.7
puta
men
16.3
4.9
18.4
7.7
16.3
6.7
thal
amus
18.6
7.3
21.9
8.5
21.6
6.7
Rig
ht H
emis
pher
e
glob
us p
allid
us13
.04.
515
.67.
214
.25.
7
caud
ate
13.5
4.7
15.8
8.8
14.4
7.4
puta
men
15.9
5.1
17.1
7.2
16.6
6.2
thal
amus
19.6
7.3
19.8
7.9
20.1
7.2
Les
ion
9.7
4.4
<0.
001†
† Stud
ent’
s t-
test
com
pari
ng m
ean
lesi
on C
BF
and
mea
n w
hite
mat
ter
CB
F in
eac
h SL
E s
ubje
ct.
J Rheumatol. Author manuscript; available in PMC 2013 March 28.

NIH
-PA Author Manuscript
NIH
-PA Author Manuscript
NIH
-PA Author Manuscript
Gasparovic et al. Page 17
Tabl
e 3
Reg
iona
l CV
F m
ean
valu
es (
mL
/100
g tis
sue)
and
sta
ndar
d de
viat
ions
(SD
) in
hea
lthy
cont
rol s
ubje
cts,
SL
E s
ubje
cts
with
out l
esio
ns, a
nd S
LE
sub
ject
sw
ith le
sion
s. R
epea
ted
mea
sure
s A
NO
VA
res
ults
are
rep
orte
d fo
r th
e m
ain
effe
cts
of g
roup
, hem
isph
ere,
and
reg
ion
for
each
tiss
ue c
lass
(ce
rebr
al g
ray
mat
ter,
whi
te m
atte
r, s
ubco
rtic
al g
ray)
.
Reg
ion
Gro
upR
M A
NO
VA
Con
trol
SLE
w/o
lesi
ons
SLE
w/le
sion
s
mea
nSD
mea
nSD
mea
nSD
mai
n ef
fect
p va
lue
Cer
ebra
l Gre
y M
atte
rgr
oup
<0.
001
Lef
t Hem
isph
ere
hem
isph
ere
0.48
1
fron
tal
1.85
0.42
2.16
0.63
2.06
0.46
regi
on0.
290
pari
etal
1.88
0.49
2.23
0.74
2.12
0.55
tem
pora
l2.
030.
442.
280.
642.
300.
47
occi
pita
l2.
010.
542.
480.
952.
290.
61
Rig
ht H
emis
pher
e
fron
tal
1.83
0.42
2.18
0.57
2.04
0.45
pari
etal
1.88
0.47
2.15
0.75
2.19
0.53
tem
pora
l2.
060.
452.
340.
622.
310.
51
occi
pita
l1.
860.
452.
120.
712.
240.
75
Cer
ebra
l Whi
te M
atte
rgr
oup
<0.
001
Lef
t Hem
isph
ere
hem
isph
ere
0.88
7
fron
tal
1.23
0.30
1.48
0.48
1.50
0.41
regi
on<
0.00
1
pari
etal
1.30
0.34
1.66
0.64
1.55
0.36
tem
pora
l1.
510.
401.
880.
661.
850.
43
occi
ptal
1.68
0.49
2.16
0.84
1.86
0.57
Rig
ht H
emis
pher
e
fron
tal
1.25
0.28
1.45
0.45
1.50
0.38
pari
etal
1.37
0.39
1.66
0.57
1.62
0.40
tem
pora
l1.
640.
451.
930.
611.
930.
48
occi
pita
l1.
580.
421.
900.
731.
890.
48
Subc
orti
algr
oup
0.01
5
J Rheumatol. Author manuscript; available in PMC 2013 March 28.
NIH
-PA Author Manuscript
NIH
-PA Author Manuscript
NIH
-PA Author Manuscript
Gasparovic et al. Page 18
Reg
ion
Gro
upR
M A
NO
VA
Con
trol
SLE
w/o
lesi
ons
SLE
w/le
sion
s
mea
nSD
mea
nSD
mea
nSD
mai
n ef
fect
p va
lue
Lef
t Hem
isph
ere
hem
isph
ere
0.68
94
glob
us p
allid
us1.
180.
491.
540.
881.
150.
39re
gion
<0.
001
caud
ate
1.52
0.62
1.58
0.84
1.48
0.72
puta
men
1.35
0.38
1.66
0.64
1.47
0.56
thal
amus
2.14
1.09
2.65
1.25
2.71
1.02
Rig
ht H
emis
pher
e
glob
us p
allid
us1.
070.
311.
460.
721.
290.
49
caud
ate
1.45
0.47
1.62
0.77
1.59
0.78
puta
men
1.34
0.44
1.53
0.62
1.47
0.49
thal
amus
2.31
1.07
2.34
1.04
2.58
1.08
Les
ion
1.00
0.39
<0.
001†
† Stud
ent’
s t-
test
com
pari
ng m
ean
lesi
on C
BV
and
mea
n w
hite
mat
ter
CB
V in
eac
h SL
E s
ubje
ct
J Rheumatol. Author manuscript; available in PMC 2013 March 28.
All in-text references underlined in blue are linked to publications on ResearchGate, letting you access and read them immediately.