Elemental Status in Sediment and American Oyster Collected from Savannah Marsh/Estuarine Ecosystem:...
14
Elemental Status in Sediment and American Oyster Collected from Savannah Marsh/Estuarine Ecosystem: A Preliminary Assessment Kenneth S. Sajwan Kurunthachalam Senthil Kumar Sivapatham Paramasivam Sanya S. Compton Joseph P. Richardson Published online: 18 September 2007 Ó Springer Science+Business Media, LLC 2007 Abstract Sediment and American oyster (Crassostrea virginica) collected from nine selected marsh/estuarine ecosystems in Savannah, Georgia were analyzed for ele- ments such as Al, As, B, Cd, Cr, Cu, Fe, Hg, Mn, Mo, Ni, Pb, Si, and Zn. Sediments were extracted by ammonium acetate (NH 4 OAc), Mehlich-3 (M-3), and water proce- dures, whereas an acid digestion procedure was adopted for oyster tissue. Concentrations of elements were higher in M- 3 extractions followed by NH 4 OAc and water extraction procedures. Calcium and Mg was greater in sediments by any of the extractions, whereas other elements differed depending upon the extraction procedures. There were no significant spatial variations (p \ 0.05) of any of elements analyzed except Mn, in NH 4 OAc/water extraction proce- dure and Fe and Al by water extraction procedure. Contamination of Al, B, Cd, Cr, Cu, Fe, Mn, Mo, Ni, Pb, Si, and Zn in oyster tissue ranged from 399 to 1460, 231 to 254, \ 1.5 to 2.9, \ 1.5 to 8.0, 67 to 121, 232 to 1357, 17 to 54, \ 0.5 to 0.64, \ 1.5 to 2.5, \ 1.5 to 4.0, 241 to 381, and 978 to 2428 lg/g dry weight (dw), respectively. Greatly elevated concentrations of elements such as P, Ca, Mg, K, and S were noticed in oyster tissue. The concentration range of Hg and As in sediment was 1.2–1.9 and 11–55 lg/ g dw, respectively. The concentration range of Hg and As in oyster tissue was 130–908 and 200–912 ng/g dw, respectively. With the exception of As and Hg, other ele- ments are several orders of magnitude greater in oyster tissue. There is no significant (p \ 0.05) contamination variation in target analyses between the nine selected sites. Concentrations of heavy metals in sediment and oyster were either comparable or lower than those of other countries. Greater biota-sediment accumulation factor was noticed for P and Zn. Concentrations of Hg and P in oyster tissue were higher than the threshold limit for human consumption. Overall, the baseline data can be used for regular ecological monitoring, considering the domestic and industrial growth around this important marsh/estua- rine ecosystem. Introduction Trace elements and heavy metals are natural constituents of the earth and are present in varying concentrations in all ecosystems (Kannan et al. 1993, 1995, 1998; Sakai et al. 2000; Ichihashi et al. 2001; Ikemoto et al. 2004; Karadede et al. 2004; Storelli et al. 2005; Amaraneni 2006; Alquezar et al. 2006; Sankar et al. 2006). However, anthropogenic activity has altered elements geochemical cycles, thus generating further cause for environmental concern. Trace elements that exist naturally at background levels in the environment include chromium (Cr), cobalt (Co), copper (Cu), iron (Fe), manganese (Mn), molybdenum (Mo), vanadium (Va), strontium (Sr), and zinc (Zn), which are essential elements in living organisms. However, some trace elements or heavy metals such as mercury (Hg), cadmium (Cd), arsenic (As), chromium (Cr), thallium (Ti), and lead (Pb) are not required for metabolic activity and are toxic. The term heavy metal refers to any metallic chemical element that has a relatively high density and is toxic or poisonous at low concentrations. Therefore, heavy metals have the potential to accumulate in the soils, K. S. Sajwan K. S. Kumar (&) S. Paramasivam S. S. Compton J. P. Richardson Department of Natural Sciences and Mathematics, Savannah State University, 3219 College Street, Savannah, GA 31404, USA e-mail: [email protected] 123 Arch Environ Contam Toxicol (2008) 54:245–258 DOI 10.1007/s00244-007-9033-1
-
Upload
savannahstate -
Category
Documents
-
view
2 -
download
0
Transcript of Elemental Status in Sediment and American Oyster Collected from Savannah Marsh/Estuarine Ecosystem:...

Elemental Status in Sediment and American Oyster Collectedfrom Savannah Marsh/Estuarine Ecosystem: A PreliminaryAssessment
Kenneth S. Sajwan Æ Kurunthachalam Senthil Kumar ÆSivapatham Paramasivam Æ Sanya S. Compton ÆJoseph P. Richardson
Published online: 18 September 2007
� Springer Science+Business Media, LLC 2007
Abstract Sediment and American oyster (Crassostrea
virginica) collected from nine selected marsh/estuarine
ecosystems in Savannah, Georgia were analyzed for ele-
ments such as Al, As, B, Cd, Cr, Cu, Fe, Hg, Mn, Mo, Ni,
Pb, Si, and Zn. Sediments were extracted by ammonium
acetate (NH4OAc), Mehlich-3 (M-3), and water proce-
dures, whereas an acid digestion procedure was adopted for
oyster tissue. Concentrations of elements were higher in M-
3 extractions followed by NH4OAc and water extraction
procedures. Calcium and Mg was greater in sediments by
any of the extractions, whereas other elements differed
depending upon the extraction procedures. There were no
significant spatial variations (p \ 0.05) of any of elements
analyzed except Mn, in NH4OAc/water extraction proce-
dure and Fe and Al by water extraction procedure.
Contamination of Al, B, Cd, Cr, Cu, Fe, Mn, Mo, Ni, Pb,
Si, and Zn in oyster tissue ranged from 399 to 1460, 231 to
254,\1.5 to 2.9,\1.5 to 8.0, 67 to 121, 232 to 1357, 17 to
54,\0.5 to 0.64,\1.5 to 2.5,\1.5 to 4.0, 241 to 381, and
978 to 2428 lg/g dry weight (dw), respectively. Greatly
elevated concentrations of elements such as P, Ca, Mg, K,
and S were noticed in oyster tissue. The concentration
range of Hg and As in sediment was 1.2–1.9 and 11–55 lg/
g dw, respectively. The concentration range of Hg and As
in oyster tissue was 130–908 and 200–912 ng/g dw,
respectively. With the exception of As and Hg, other ele-
ments are several orders of magnitude greater in oyster
tissue. There is no significant (p \ 0.05) contamination
variation in target analyses between the nine selected sites.
Concentrations of heavy metals in sediment and oyster
were either comparable or lower than those of other
countries. Greater biota-sediment accumulation factor was
noticed for P and Zn. Concentrations of Hg and P in oyster
tissue were higher than the threshold limit for human
consumption. Overall, the baseline data can be used for
regular ecological monitoring, considering the domestic
and industrial growth around this important marsh/estua-
rine ecosystem.
Introduction
Trace elements and heavy metals are natural constituents of
the earth and are present in varying concentrations in all
ecosystems (Kannan et al. 1993, 1995, 1998; Sakai et al.
2000; Ichihashi et al. 2001; Ikemoto et al. 2004; Karadede
et al. 2004; Storelli et al. 2005; Amaraneni 2006; Alquezar
et al. 2006; Sankar et al. 2006). However, anthropogenic
activity has altered elements geochemical cycles, thus
generating further cause for environmental concern. Trace
elements that exist naturally at background levels in the
environment include chromium (Cr), cobalt (Co), copper
(Cu), iron (Fe), manganese (Mn), molybdenum (Mo),
vanadium (Va), strontium (Sr), and zinc (Zn), which are
essential elements in living organisms. However, some
trace elements or heavy metals such as mercury (Hg),
cadmium (Cd), arsenic (As), chromium (Cr), thallium (Ti),
and lead (Pb) are not required for metabolic activity and
are toxic. The term heavy metal refers to any metallic
chemical element that has a relatively high density and is
toxic or poisonous at low concentrations. Therefore, heavy
metals have the potential to accumulate in the soils,
K. S. Sajwan � K. S. Kumar (&) � S. Paramasivam �S. S. Compton � J. P. Richardson
Department of Natural Sciences and Mathematics,
Savannah State University, 3219 College Street, Savannah,
GA 31404, USA
e-mail: [email protected]
123
Arch Environ Contam Toxicol (2008) 54:245–258
DOI 10.1007/s00244-007-9033-1

seawater, freshwater, and sediments (Moss and Constanza
1998; Mathew et al. 2003; Chindah et al. 2004; Kongchum
et al. 2006), and tend to bioaccumulate and biomagnify in
living organisms. The main anthropogenic sources of
heavy metals include industries, mining activities, found-
ries and smelters, and diffuse sources such as piping,
constituents of products, combustion byproducts, traffic,
municipal solid waste, urban run-off, domestic waste, and
sewage disposal.
Sediments play a key role in the geochemical and bio-
logical processes of an estuarine ecosystem. In particular,
sediments act as sinks for toxic metals that enter the
estuary. In doing so, they regulate the concentration of
these minerals and compounds in the water column (De
Groot et al. 1976). Sediment also plays a very important
role in the physicochemical and ecological dynamics of
trace metals in aquatic ecosystems. The physicochemical
nature of sediment bound trace metals is important in the
bioaccumulation of aquatic organisms. Heavy metals have
multitude of toxic effects, such as carcinogenic effects,
acute syndrome, neurological dysfunction, that ultimately
cause diseases in the brain, kidney, skin cancer, and such
like places.
Aquatic animals accumulate large quantities of xenobi-
otics, and the accumulation depends upon the intake and
the elimination from the body (Karadede et al. 2004).
Among different aquatic organisms, clams, oyster, and
mussels accumulate large quantities of heavy metals.
Oysters are often used as indicators of marsh and estuary
health. Because oysters are suspension feeders that filter
water, they can retain small particles within their body
(Day et al. 1989). Particularly, American oyster, Crassos-
trea virginica, filters large volumes of seawater and
concentrated metals and other pollutants. Therefore, they
are ideal pollution indicators and are frequently used in
environmental assessment and monitoring (Haye et al.
2006). The ability of the American oyster to accumulate
high concentrations of metals in its soft tissues is well
documented (Machado and Zalmon 2005; Apeti et al.
2005a, 2005b; Elston et al. 2005).
Savannah River estuary receives domestic wastewater
and other contaminants from several industries and mos-
quito control operations along its upstream waters.
Considering the significant quantities of wastes, both of
industrial and domestic origin, being released into the
Savannah River estuary every year, it is of particular
interest to evaluate the presence of pollutants mainly from
anthropogenic source. Considering those facts, in this study
we monitored trace elements and heavy metals including
highly toxic As, Cd, Hg, Ni, and Pb in archived sediments
and American oyster (Crassostrea virginica) tissue col-
lected in nine selected locations along the Savannah River
marsh/estuarine ecosystem. Here harvesting oysters was
found to be significant; also, several industrial activities at
these locations in which they influence toxic metal accu-
mulation by oysters ultimately end up as human
consumption. Another significant objective of this study
was to also identify efficient extraction procedures for
sediment samples, using three newly developed methods,
and to find out robust methods for future analysis.
Materials and Methods
Study Design
The purpose of this research was to acquire baseline
chemical data necessary to provide an evaluation of the
ecological health of the salt marsh estuarine ecosystem.
Specifically, this study was designed to evaluate the levels
of variety of chemical pollutants such as trace elements and
heavy metals, in marsh/estuarine sediment and oyster tis-
sue. For this particular study, nine sampling sites (Fig. 1
and Table 1) were chosen within or along Cockspur Island
and McQueen’s Island and within the Fort Pulaski National
Monument salt marsh ecosystem. These sites are frequently
used by people for intense oyster harvesting for con-
sumption purposes. Three of these sites were within Oyster
Creek (Sites 1, 2, 3), two sites were along Bull River (Sites
4, 9), and one site was at the mouth of the Savannah River
(Site 5) at an inlet opening to the Atlantic Ocean. The
remaining three sites were near the northeastern entrance of
Lazaretto Creek (site 6), whereas the other was along the
north shore of Cockspur Island in the Savannah River (site
7), and the last site was at the western entrance of Lazaretto
Creek on Tybee Island (Site 8). All of these selected sites
were based on the undisclosed industries, factories,
domestic influence, and also were nonpolluted in these
areas.
Sample Collection
At each site, water, sediment, and American oyster (C.
virginica) were collected during a 5–day period in
November 2000 and 2001. For water, approximately 2
liters of water was collected from 1 m below the surface. In
the field, the following water quality parameters were
measured: Secchi disk depth, temperature, salinity, total
dissolved solids, conductivity, dissolved oxygen, and dis-
solved oxygen percent saturation (Table 2). Water samples
were transported back to the laboratory for additional
analysis, which included pH, turbidity, settleable solids,
nitrate (alkaline KMnO4 method), and phosphate (stannous
chloride method) (Table 2). In the case of the sediments, at
each sampling site, five subsamples of sediment from
246 Arch Environ Contam Toxicol (2008) 54:245–258
123

depths of 1–5 m (Table 3) were collected using a bottom-
grab sampler (clamshell type). Clean stainless steel scoops
were used to remove the top 0–5 cm of sediment from the
grab sample. Sediment from each subsample was imme-
diately placed in acetone-washed I-Chem bottles (Ben
Meadows Co., WI, USA), sealed, labeled, and transported
to the laboratory with ice and placed in a deep freezer until
chemical analysis. Sediment moisture content (sediment
dry method) and pH (sediment and water with 1:1 sus-
pension) were analyzed in the laboratory (Table 3) at a
later period. The American oysters were collected by hand
or rake at the same sites, from the mid and lower intertidal
zone. Oysters were immediately opened, and edible tissue
was directly transferred into acetone-washed I-Chem bot-
tles, sealed, labeled, and transported to the laboratory with
ice, and placed in a deep-freezer until chemical analysis.
Edible tissue of 25–36 oysters were collected at each site to
form a single composite oyster sample from each site.
Chemical and Instrumental Analysis
The literature suggests that there are several methods used
for soil and biological tissue extraction. However, for sedi-
ments there is no specific extraction method is
recommended. Therefore, we tried to compare three
extraction methods to compare their extractability of ele-
ments. Collected sediment samples for elemental analysis
were air dried in a greenhouse. The moisture content (%) was
measured. The pH was determined using Fisher Accumet
(Thermo Fisher Scientific Co.) model-15 pH meter (McLean
1982), and then the sediments were subjected to extractable
6
7
43
2
9 1
5
8
FortPulaski
Fig. 1 The map showing
sampling sites
Table 1 Sampling field data
Site No. Date Time Name Latitude Longitude
1 13th Nov 2000 13:30 Morgans Cut 31� 59.780 80� 54.580
2 13th Nov 2000 15:00 Morgans Cut 32� 00.140 80� 55.120
3 14th Nov 2000 14:30 Oyster Creek entrance 32� 00.890 80� 55.440
4 14th Nov 2000 16:00 Bull River 32� 00.890 80� 55.930
5 15th Nov 2000 14:00 Goat Point, Atlantic 32� 01.130 80� 52.930
6 15th Nov 2000 15:30 Screvens Point, SR* 32� 01.630 80� 57.840
7 04th Nov 2001 14:00 Coast Guard Station, SR* 32� 02.110 80� 54.640
8 04th Nov 2001 15:30 Lazaretto Creek 32� 00.560 80� 53.210
9 07th Nov 2001 16:30 Bull River at Lazaretto 31� 59.700 80� 55.550
*Savannah River
Arch Environ Contam Toxicol (2008) 54:245–258 247
123

elements analysis by three extraction procedures, ammo-
nium acetate (NH4OAc) extraction, Mehlich-3 (M-3)
extraction, and water extraction procedures, in order to
understand the robust method for future sediment analysis.
Ammonium Acetate Extraction
Five grams of air-dried sediment sample were placed in a 50-
mL screw-capped polypropylene centrifuge tube, and 40 mL
of 1 M NH4OAc was added and shaken for 30 min (Thomas
1982). The samples were centrifuged and the supernatant
was filtered through Whatman 42 (LabX Whatman Plc.,
Canada) filter paper. The clear supernatant was saved and
analyzed for various metals using the Perkin Elmer RL 3300
(Perkin Elmer Inc., USA) Inductively Coupled Plasma-
Optical Emission Spectrophotometer (ICP-OES).
Mehlich-3 (M-3) Extraction
Two and a half grams of air-dried sediment sample was
placed in a 50-mL screw-capped polypropylene centrifuge
tube, and 25 mL of Mehlich-3 extractant (Mehlich 1984)
was added and shaken for 5 min. The samples were centri-
fuged and the supernatant was filtered through Whatman 42
filter paper. The clear supernatant was saved and analyzed
for various metals using Perkin Elmer RL 3300 (ICP-OES).
Water Extraction
Two and a half grams of air-dried sediment sample was
placed in a 50-mL screw-capped polypropylene centrifuge
tube, and 25 mL of deionized water was added and shaken
for 30 min. The samples were centrifuged and the super-
natant was filtered through Whatman 42 filter paper. The
clear supernatant was saved and analyzed for various
metals using Perkin Elmer RL 3300 (ICP-OES). With all
three extraction procedures, only the total mercury (Hg)
and total arsenic (As) from sediment samples were ana-
lyzed by Instrumental Neutron Activation Analysis.
Chemical and Instrumental Analysis of Oyster
Prior to analysis, the oysters’ edible tissue samples mois-
ture content was determined and then freeze-dried. Lipid
Table 2 Water quality parameters
S No. Water
Temperature
(�C)
Secchi
(cm)
Turbidity
(NTU)
Settleable
Solids ml/l
Salinity
ppt
TDS
mg/l
Conductivity
mS
Dissolved
Oxygen mg/l
Oxygen
Percent
Saturation
pH Nitrate
mg/l
Phosphate
mg/l
1 19.4 97 17 trace 31.2 30,100 48.3 6.13 93 7.66 0.57 0.18
2 19.3 98 14 trace 31.6 30,400 48.8 5.98 91 7.64 0.48 0.04
3 19.1 66 20 trace 30.9 29,700 47.8 6.57 99 7.51 0.44 0.12
4 18.4 80 12 trace 29.5 28,400 45.8 6.21 92 7.49 0.53 0.11
5 18.9 56 27 0.1 27.6 26,500 43.1 7.72 110 7.81 1.06 0.10
6 17.6 57 22 0.1 28.2 27,100 44.0 7.66 110 7.56 0.70 0.07
7 19.8 51 51 0.3 25.2 24,400 39.9 7.73 109 7.79 0.53 0.14
8 19.8 78 24 trace 25.6 24,600 40.2 7.29 104 7.70 0.18 0.07
9 18.6 65 24 0.1 31.2 30,000 48.1 7.65 115 7.80 0.48 0.03
Table 3 Sampling details and some physico-chemical properties of
sediment and oyster
Sample Site Collection Depth (m) Moisture (%) pH Fat (%)
Sediment
Site-1 2.8 (1–5) 73 (71–77) 7.8 (6.7–8.1)
Site-2 3.2 (3–4) 59 (50–71) 7.9 (7.6–8.1)
Site-3 3.0 (2–4) 60 (53–64) 7.8 (7.1–8.2)
Site-4 3.6 (2–5) 47 (34–57) 8.0 (7.6–8.3)
Site-5 2.8 (2–4) 48 (39–53) 8.1 (7.9–8.2)
Site-6 3.8 (2–5) 60 (53–64) 5.0 (3.5–7.6)
Site-7 2.6 (1–4) 61 (57–63) 7.6 (7.3–7.9)
Site-8 3.0 (2–4) 66 (60–72) 7.6 (7.3–7.8)
Site-9 1.4 (1–3) 58 (53–68) 7.9 (7.8–8.0)
Oyster Moisture (%) Fat (%)
Site-1 20.02 1.3
Site-2 20.63 1.4
Site-3 20.69 1.5
Site-4 20.62 1.5
Site-5 20.14 1.2
Site-6 20.19 NA
Site-7 20.61 NA
Site-8 20.70 NA
Site-9 20.62 NA
Values in parentheses indicate range; NA = not analyzed
248 Arch Environ Contam Toxicol (2008) 54:245–258
123

contents were analyzed by gravimetric method during or-
ganohalogen compound analysis (Sajwan et al. 2007;
Senthil Kumar et al. 2007). Heavy metals (except Hg and
As) were analyzed by digesting the homogenized samples
in a mixture of nitric, perchloric, and sulfuric acids (Honda
et al. 1982). One subset of oyster tissue composite was
prepared for analysis of arsenic and mercury by a hot acid
digestion method (Akagi and Nishimura 1991). All ele-
ments were analyzed using ICP-OES with the instrumental
programming being the same as described in Ichihashi
et al. (2001).
Quality Assurance and Quality Control
Chemical analysis was conducted in a clean environment
(in the laboratory with acid-washed glasswares and pure
chemicals/solvents that were purchased from Sigma-
Aldrich Co). For each batch of 5 sediments, 1 blank sample
was analyzed (total 9 blanks). Similarly, 2 blanks were run
for 9 oyster tissue homogenates. None of the blank samples
(n = 11) contained detectable limits of target analytes. All
45 sediment samples were also analyzed in the Nuclear
Reactor Facility (NRF) at University of Florida, for inter-
calibration. The data evolved from our laboratory and NRF
found the same standard deviations within the range of 5–
9%. Similarly, oyster tissue was also analyzed in the
Georgia Soil, Plant and Water Laboratory (GSPWL). The
data evolved from our laboratory, and GSPWL found the
same standard deviations within the range of 3–8%. The
concentrations for all the elements and metals were
expressed as lg/g dry weight (dw), unless specified
otherwise. Statistical analysis was performed using SAS
9.1.3 Software Edition Rev.22 version (SAS Software Inc.,
Luxemburg, Belgium).
Results and Discussion
Water Quality
Water quality parameters (Table 2) were normal and typ-
ical of Georgia salt marsh ecosystems during autumn. At
this location near the Savannah River inlet, and Atlantic
Ocean, salinity would be expected to be relatively high
(mid to high 20s). Water clarity as indicated by Secchi disk
depth was typical of Georgia estuarine river and marsh
creeks. Dissolved oxygen levels were high, which is typical
in autumn and winter conditions in these habitats. Nutri-
ents, particularly nitrate, were slightly elevated. However,
during a previous study (Richardson, unpublished data),
slightly elevated nitrate levels were noticed in water sam-
ples from Savannah River estuary, in comparison to
samples from Wilmington River/Wassaw Sound estuary
further south. Elevated nitrates, nitrites, and phosphates
were also found in water from wetland in India (Amaraneni
2006). Overall, water quality parameters measured during
this study, and taken during the limited time span of
sampling, were typical and normal and met the criteria set
down in the directives in all cases, which is true for Irish
waters (Smyth et al. 1995). Continued water quality mon-
itoring with more frequent sampling should be conducted
in order to reveal any temporal trends in quality. More or
less similar water qualities have been noticed in aquatic
ecosystems in India (Jayaprakash et al. 2005; Amaraneni
2006; Kuppusamy and Giridhar 2006), and typical estua-
rine water qualities from Australia (Alquezar et al. 2006).
Sediment and Oyster
Mean depth of sediment collection varied from 1.4 to 3.8
(average of 5 subsamplings) at the 9 sites (Table 3). Average
sediment moisture content was 47–73% (average of 5 sub-
samplings), whereas pH was between 5.0 and 8.1. The lowest
pH (3.5) was noticed in site 6, whereas the highest (8.3) was
noticed at site 4. Most sediment samples had pH values of
7–8. Site 6 was different from the other sites in having rel-
atively low pH values in 4 of 5 sediment subsamples
collected at the site. Differences in sediment pH may influ-
ence bioavailability of metals; therefore, sites and estuaries
were selected with similar physicochemical parameters to
minimize variability (Peakall and Burger 2003). Sediment
pH ranges of 7.1–9.3 were also noticed from urban wetlands
in Coimbatore, India (Mathew et al. 2003). Most of the
sediment samples were classified as pelite (silt–clay)
(\0.063 mm in diameter of grains), sand (0.063–2 mm), and
gravel ([2 mm). Fat percent in oyster tissue was between 1.2
and 1.5, whereas site 6 oyster showed a very low fat per-
centage of 0.005. Sites 7–9 fat contents were not determined.
Therefore, the fat weight basis of organic compounds should
be ignored for further discussions. Moisture content in oyster
tissue was between 20 and 21% (Table 3).
Trace Elements in Sediment
Trace elements such as calcium (Ca) were high followed
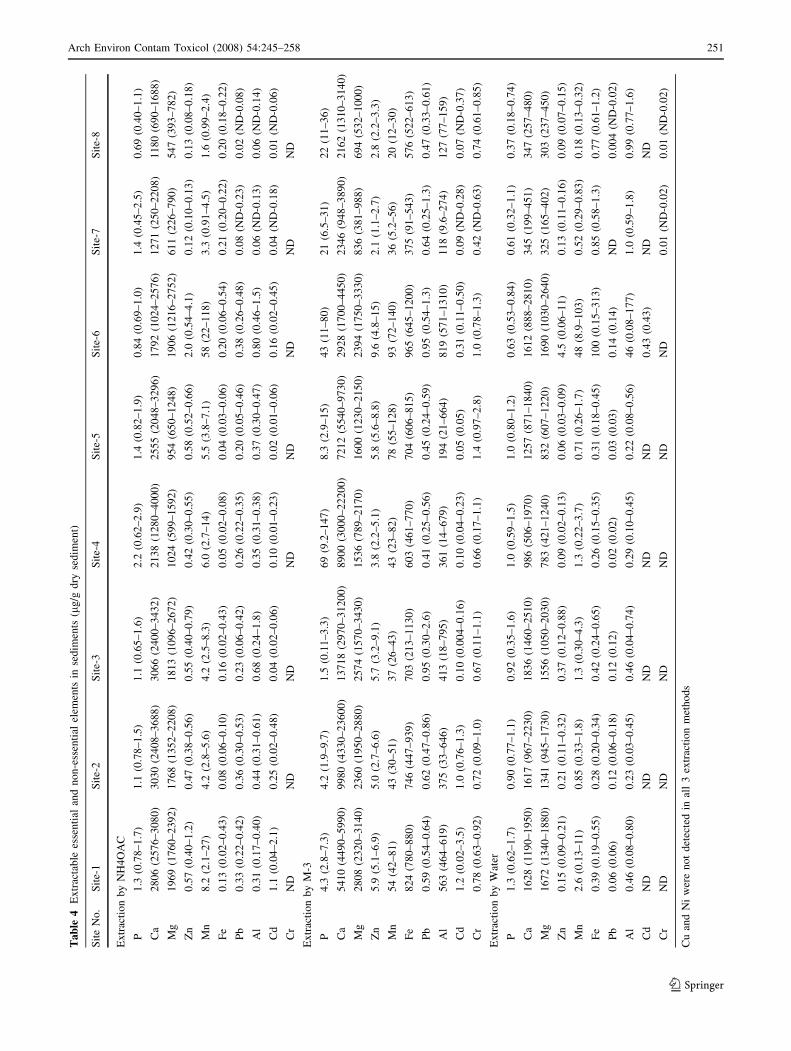
by magnesium (Mg) and phosphorus (P) (Table 4). The
potassium (K) and sulfur (S) were not analyzed in sedi-
ment. Extraction by M-3 method yielded greater Ca (948–
31,200 lg/g dw) followed by NH4OAc (250–4000 lg/g
dw) extraction and water extraction (199–2810 lg/g dw)
procedures (Fig. 2). Similarly, Mg was in the range of 381–
3430, 226–2752, and 165–2640 lg/g dw using M-3,
NH4Oac, and water extraction methods, respectively
Arch Environ Contam Toxicol (2008) 54:245–258 249
123

(Table 4). Percentage contributions of elements were
higher in the M-3 extraction procedure (Fig. 2). Phospho-
rus was very low with 0.11–147 lg/g dw using all 3
extraction procedures. However, p was significantly
(p [ 0.01) higher in sites 4 and 6 by the M-3 method.
Phosphorus in the sediments from a marine environment
(Cochin, India) showed more elevated levels than those in
this study (Ashraf et al. 2006). Considering the robust
results of elements by M-3 extraction methods in the
present study, we consider only these data for further
interpretations unless otherwise specified. Overall, con-
centrations of elements were slightly higher in sites 1–5.
However, this is not statistically significant (p [ 0.05).
Among other elements, boron (B), copper (Cu), iron
(Fe), manganese (Mn), molybdenum (Mo), and zinc (Zn)
are of particular interest. Basically, in sediments, B and Mo
were not analyzed, Cu and Ni were below the detection
limit through any of the three extraction procedures,
whereas Fe (91–1200), Mn (5.2–140), and Zn (1.1–15)
were detected greatly by M-3 extraction, followed by the
water extraction procedure [Fe (0.15–313), Mn (0.03–103),
and Zn (0.02–11)], and NH4OAc Fe [(0.02–0.54), Mn
(0.91–118) and Zn (0.07–4.1)] (Table 4 and Fig. 2) pro-
cedure on lg/g dw. Significantly (p = 0.001) greater
concentrations of Fe, Mn, and Zn were observed in site 6
when compared to other sites, particularly by water
extraction procedure. Similarly, Mn was significantly
higher (p = 0.003) in site 6 by NH4OAc extraction
procedure.
Concentrations of Zn (data of M-3) observed in sedi-
ments in this study were several orders of magnitude less
than industrial regions of New Zealand; India; Brazil
(Deely et al. 1992; Baptista et al. 2000; Crapez et al. 2003;
Mathew et al. 2003; Amaraneni 2006); Apalachicola Bay,
Florida; Chesapeake Bay; and Mississippi Bay (Frazier
1975; Rodrigo 1989; Apeti et al. 2005b; Elston et al. 2005),
but similar to sediments from Nigeria (Chindah et al.
2004). Similarly, Mn was several orders of magnitude
lower than soil from urban wetland in India (Mathew et al.
2003), but similar to or, slightly higher than, that of those
from Chesapeake Bay (Frazier 1975), whereas Fe was very
low in India and at Chesapeake Bay (Frazier 1975; Mathew
et al. 2003).
Trace Elements in Oyster
Elements in oyster tissue were in the following order: Ca ‡S[K[P[Mg (Table 5). It is worth indicating that S, K
were analyzed only from sites 7, 8, and 9. Overall, Ca was
predominant (19, 920–986, 970), followed by a decreasing
order of Na (32, 210–244, 260)[S (15, 500–517, 450)[K
(9951–9912, 060)[P (2836–7868) ‡ Mg (2752–6440) on
lg/g dw. Concentrations of the selected elements in oyster
tissues were 3 to 4 orders of magnitude higher than the
concentrations in the sediment, suggesting efficient tissue
bioaccumulation. Correlations between oyster and sedi-
ment, though positive, were significantly low Ca (r2 = 0.13)
and Mg (r2 = 0.11) (Fig. 3), and these results suggest that
oyster may accumulate elements not only from sediment,
but also from the water column. Earlier studies demon-
strated that heavy metal bioaccumulation in filter feeders
such as American oyster is the net result of uptake, and
elimination of the metals in ambient water (Apeti et al.
2005a, 2005b).
Elements such as Cu, Fe, Mn, and Zn in oyster tissue
were analyzed in all 9 sites, whereas B and Mo were
analyzed only from sites 7, 8, and 9. Concentrations of
essential elements in oyster tissue were in increasing order
from Mo (\0.5–0.64), Mn (17–52), Cu (67–121), B (231–
254), Fe (232–1357), and Zn (978–2428), on lg/g dw
(Table 5). There was no apparent site-specific bioaccu-
mulation of elements noticed in oysters. Zn, Mn, and Cu
were greater in site 4, whereas Fe was slightly high in site
8. Overall, concentrations of trace elements were several
folds greater in oyster when compared to sediment. Par-
ticularly, Zn was highly bioaccumulated in oyster when
compared to sediment. The well-known element Zn, which
easily accumulates in oysters, by far surpasses the maxi-
mum limit of tolerance (MLT). The results confirm this
trend showing the capacity of oysters to metabolically
control high Zn concentrations (Frias-Espericueta et al.
1999). As mentioned earlier, living organisms require trace
amounts of some elements, including Co, Cu, Fe, Mn, Mo,
Va, Sr, and Zn. Many of these heavy metals exist naturally,
at background levels in the environment. Zn, Fe, Cu, and
Mn are biologically essential and play an important role as
cofactors in enzymatic processes (Singh and Steinnes
1994).
Zn is well documented as an essential trace metal in the
physiology of bivalves. This suggests that physiologically,
Zn should have higher assimilation efficiency as compared
to that of other elements. Differences in efflux rate could
also be the cause of the difference between levels of the
concentrations of other elements and Zn in oysters. Zn
efflux rate being slightly smaller than that of other ele-
ments, the bioaccumulation rate of Zn is consequently
greater. The second argument that explains the difference
is based on the presence in bivalve tissues of low molecule
sulphur-rich metal binding proteins such as metallothionein
(MT). MT is known to selectively complex certain heavy
metals such as Cu and Zn, making these elements the most
abundant in oyster tissue. Finally, the selective retention of
Zn to a different degree is caused by the chemistry of the
characteristics of a metal, and is the octanol/water partition
coefficient Kow. The partition coefficient is an important
250 Arch Environ Contam Toxicol (2008) 54:245–258
123
Ta
ble
4E
xtr
acta
ble
esse
nti
alan
dn
on
-ess
enti
alel
emen
tsin
sed
imen
ts(l
g/g
dry
sed
imen
t)
Sit
eN
o.
Sit
e-1
Sit
e-2
Sit
e-3
Sit
e-4
Sit
e-5
Sit
e-6
Sit
e-7
Sit
e-8
Ex
trac
tio
nb
yN
H4
OA
C
P1
.3(0
.78
–1
.7)
1.1
(0.7
8–
1.5
)1
.1(0
.65
–1
.6)
2.2
(0.6
2–
2.9
)1
.4(0
.82
–1
.9)
0.8
4(0
.69
–1
.0)
1.4
(0.4
5–
2.5
)0
.69
(0.4
0–
1.1
)
Ca
28
06
(25
76
–3
08
0)
30
30
(24
08
–3
68
8)
30
66
(24
00
–3
43
2)
21
38
(12
80
–4
00
0)
25
55
(20
48
–3
29
6)
17
92
(10
24
–2
57
6)
12
71
(25
0–
22
08
)1
18
0(6
90
–1
68
8)
Mg
19
69
(17
60
–2
39
2)
17
68
(13
52
–2
20
8)
18
13
(10
96
–2
67
2)
10
24
(59
9–
15
92
)9
54
(65
0–
12
48
)1
90
6(1
21
6–
27
52
)6
11
(22
6–
79
0)
54
7(3
93
–7
82
)
Zn
0.5
7(0
.40
–1
.2)
0.4
7(0
.38
–0
.56
)0
.55
(0.4
0–
0.7
9)
0.4
2(0
.30
–0
.55
)0
.58
(0.5
2–
0.6
6)
2.0
(0.5
4–
4.1
)0
.12
(0.1
0–
0.1
3)
0.1
3(0
.08
–0
.18
)
Mn
8.2
(2.1
–2
7)
4.2
(2.8
–5
.6)
4.2
(2.5
–8
.3)
6.0
(2.7
–1
4)
5.5
(3.8
–7
.1)
58
(22
–1
18
)3
.3(0
.91
–4
.5)
1.6
(0.9
9–
2.4
)
Fe
0.1
3(0
.02
–0
.43
)0
.08
(0.0
6–
0.1
0)
0.1
6(0
.02
–0
.43
)0
.05
(0.0
2–
0.0
8)
0.0
4(0
.03
–0
.06
)0
.20
(0.0
6–
0.5
4)
0.2
1(0
.20
–0
.22
)0
.20
(0.1
8–
0.2
2)
Pb
0.3
3(0
.22
–0
.42
)0
.36
(0.3
0–
0.5
3)
0.2
3(0
.06
–0
.42
)0
.26
(0.2
2–
0.3
5)
0.2
0(0
.05
–0
.46
)0
.38
(0.2
6–
0.4
8)
0.0
8(N
D-0
.23
)0
.02
(ND
-0.0
8)
Al
0.3
1(0
.17
–0
.40
)0
.44
(0.3
1–
0.6
1)
0.6
8(0
.24
–1
.8)
0.3
5(0
.31
–0
.38
)0
.37
(0.3
0–
0.4
7)
0.8
0(0
.46
–1
.5)
0.0
6(N
D-0
.13
)0
.06
(ND
-0.1
4)
Cd
1.1
(0.0
4–
2.1
)0
.25
(0.0
2–
0.4
8)
0.0
4(0
.02
–0
.06
)0
.10
(0.0
1–
0.2
3)
0.0
2(0
.01
–0
.06
)0
.16
(0.0
2–
0.4
5)
0.0
4(N
D-0
.18
)0
.01
(ND
-0.0
6)
Cr
ND
ND
ND
ND
ND
ND
ND
ND
Ex
trac
tio
nb
yM
-3
P4
.3(2
.8–
7.3
)4
.2(1
.9–
9.7
)1
.5(0
.11
–3
.3)
69
(9.2
–1
47
)8
.3(2
.9–
15
)4
3(1
1–
80
)2
1(6
.5–
31
)2
2(1
1–
36
)
Ca
54
10
(44
90
–5
99
0)
99
80
(43
30
–2
36
00
)1
37
18
(29
70
–3
12
00
)8
90
0(3
00
0–
22
20
0)
72
12
(55
40
–9
73
0)
29
28
(17
00
–4
45
0)
23
46
(94
8–
38
90
)2
16
2(1
31
0–
31
40
)
Mg
28
08
(23
20
–3
14
0)
23
60
(19
50
–2
88
0)
25
74
(15
70
–3
43
0)
15
36
(78
9–
21
70
)1
60
0(1
23
0–
21
50
)2
39
4(1
75
0–
33
30
)8
36
(38
1–
98
8)
69
4(5
32
–1
00
0)
Zn
5.9
(5.1
–6
.9)
5.0
(2.7
–6
.6)
5.7
(3.2
–9
.1)
3.8
(2.2
–5
.1)
5.8
(5.6
–8
.8)
9.6
(4.8
–1
5)
2.1
(1.1
–2
.7)
2.8
(2.2
–3
.3)
Mn
54
(42
–8
1)
43
(30
–5
1)
37
(26
–4
3)
43
(23
–8
2)
78
(55
–1
28
)9
3(7
2–
14
0)
36
(5.2
–5
6)
20
(12
–3
0)
Fe
82
4(7
80
–8
80
)7
46
(44
7–
93
9)
70
3(2
13
–1
13
0)
60
3(4
61
–7
70
)7
04
(60
6–
81
5)
96
5(6
45
–1
20
0)
37
5(9
1–
54
3)
57
6(5
22
–6
13
)
Pb
0.5
9(0
.54
–0
.64
)0
.62
(0.4
7–
0.8
6)
0.9
5(0
.30
–2
.6)
0.4
1(0
.25
–0
.56
)0
.45
(0.2
4–
0.5
9)
0.9
5(0
.54
–1
.3)
0.6
4(0
.25
–1
.3)
0.4
7(0
.33
–0
.61
)
Al
56
3(4
64
–6
19
)3
75
(33
–6
46
)4
13
(18
–7
95
)3
61
(14
–6
79
)1
94
(21
–6
64
)8
19
(57
1–
13
10
)1
18
(9.6
–2
74
)1
27
(77
–1
59
)
Cd
1.2
(0.0
2–
3.5
)1
.0(0
.76
–1
.3)
0.1
0(0
.00
4–
0.1
6)
0.1
0(0
.04
–0
.23
)0
.05
(0.0
5)
0.3
1(0
.11
–0
.50
)0
.09
(ND
-0.2
8)
0.0
7(N
D-0
.37
)
Cr
0.7
8(0
.63
–0
.92
)0
.72
(0.0
9–
1.0
)0
.67
(0.1
1–
1.1
)0
.66
(0.1
7–
1.1
)1
.4(0
.97
–2
.8)
1.0
(0.7
8–
1.3
)0
.42
(ND
-0.6
3)
0.7
4(0
.61
–0
.85
)
Ex
trac
tio
nb
yW
ater
P1
.3(0
.62
–1
.7)
0.9
0(0
.77
–1
.1)
0.9
2(0
.35
–1
.6)
1.0
(0.5
9–
1.5
)1
.0(0
.80
–1
.2)
0.6
3(0
.53
–0
.84
)0
.61
(0.3
2–
1.1
)0
.37
(0.1
8–
0.7
4)
Ca
16
28
(11
90
–1
95
0)
16
17
(96
7–
22
30
)1
83
6(1
46
0–
25
10
)9
86
(50
6–
19
70
)1
25
7(8
71
–1
84
0)
16
12
(88
8–
28
10
)3
45
(19
9–
45
1)
34
7(2
57
–4
80
)
Mg
16
72
(13
40
–1
88
0)
13
41
(94
5–
17
30
)1
55
6(1
05
0–
20
30
)7
83
(42
1–
12
40
)8
32
(60
7–
12
20
)1
69
0(1
03
0–
26
40
)3
25
(16
5–
40
2)
30
3(2
37
–4
50
)
Zn
0.1
5(0
.09
–0
.21
)0
.21
(0.1
1–
0.3
2)
0.3
7(0
.12
–0
.88
)0
.09
(0.0
2–
0.1
3)
0.0
6(0
.03
–0
.09
)4
.5(0
.06
–1
1)
0.1
3(0
.11
–0
.16
)0
.09
(0.0
7–
0.1
5)
Mn
2.6
(0.1
3–
11
)0
.85
(0.3
3–
1.8
)1
.3(0
.30
–4
.3)
1.3
(0.2
2–
3.7
)0
.71
(0.2
6–
1.7
)4
8(8
.9–
10
3)
0.5
2(0
.29
–0
.83
)0
.18
(0.1
3–
0.3
2)
Fe
0.3
9(0
.19
–0
.55
)0
.28
(0.2
0–
0.3
4)
0.4
2(0
.24
–0
.65
)0
.26
(0.1
5–
0.3
5)
0.3
1(0
.18
–0
.45
)1
00
(0.1
5–
31
3)
0.8
5(0
.58
–1
.3)
0.7
7(0
.61
–1
.2)
Pb
0.0
6(0
.06
)0
.12
(0.0
6–
0.1
8)
0.1
2(0
.12
)0
.02
(0.0
2)
0.0
3(0
.03
)0
.14
(0.1
4)
ND
0.0
04
(ND
-0.0
2)
Al
0.4
6(0
.08
–0
.80
)0
.23
(0.0
3–
0.4
5)
0.4
6(0
.04
–0
.74
)0
.29
(0.1
0–
0.4
5)
0.2
2(0
.08
–0
.56
)4
6(0
.08
–1
77
)1
.0(0
.59
–1
.8)
0.9
9(0
.77
–1
.6)
Cd
ND
ND
ND
ND
ND
0.4
3(0
.43
)N
DN
D
Cr
ND
ND
ND
ND
ND
ND
0.0
1(N
D-0
.02
)0
.01
(ND
-0.0
2)
Cu
and
Ni
wer
en
ot
det
ecte
din
all
3ex
trac
tio
nm
eth
od
s
Arch Environ Contam Toxicol (2008) 54:245–258 251
123

parameter that determines the bioavailability of metal in
ingested food and water.
Concentrations of Zn and Cu observed in oyster tissue in
this study were less than those in Chesapeake Bay (Frazier
1975), but similar to or greater than those in Ireland,
Mexico, Brazil, and other U.S. estuaries (Goldberg et al.
1983; Phelps and Mihursky 1986; Smyth et al. 1995;
Bloxham et al. 1998; Frias-Espericueta et al. 1999;
Machado and Zalmon 2005; Apeti et al. 2005a, 2005b;
Elston et al. 2005). Likewise, Mn and Fe concentrations
were greater in the present study when compared to those
in Chesapeake Bay, Gulf Coast, Irish Coast, and Brazil
Coast (Frazier 1975; Frias-Espericueta et al. 1999; Mach-
ado and Zalmon 2005). It has been well documented that
0% 20% 40% 60% 80% 100%
P
Mn
Mg
NH4OAc
M-3
Water
Fe
Ca
Zn
Percentage ContributionE
ssen
tial E
lem
ents
Fig. 2 Efficiency of 3 different
extraction procedure of essential
elements
Table 5 Concentration of trace elements in oyster (lg/g dry wt) analyzed by ICP-OES
Site No. P Ca Mg Zn Mn Fe Cu Pb Al Cd Cr Ni K B Mo S Si
1 3704 29,520 3552 1316 32 400 93 \1.5 412 \1.5 \1.5 \1.5 NA NA NA NA NA
2 5600 27,480 6440 2036 52 736 101 \1.5 884 \1.5 \1.5 \1.5 NA NA NA NA NA
3 2836 19,920 2752 1376 17 306 87 4.0 399 \1.5 8.0 \1.5 NA NA NA NA NA
4 6840 52,800 6160 2428 54 232 121 1.6 1304 \1.5 \1.5 \1.5 NA NA NA NA NA
5 5920 27,640 3944 1344 23 460 82 2.4 744 \1.5 \1.5 \1.5 NA NA NA NA NA
6 3832 39,320 4080 1772 29 448 93 \1.5 636 \1.5 \1.5 \1.5 NA NA NA NA NA
7 6515 86,970 5116 1139 25 501 79 \1.5 609 2.4 1.6 1.8 9951 231 0.61 15,500 241
8 7868 22,830 6118 1593 38 1357 90 \1.5 805 2.9 2.1 2.5 12,060 254 \0.5 17,450 255
9 6510 43,650 5575 978 38 933 67 \1.5 1460 2.2 1.8 2.3 10,480 254 0.64 17,140 381
NA = not analyzed
Con
cent
ratio
n in
Oys
ter
µg/g
dw
)
Concentration in Sediment (µg/g dw) Concentration in Sediment (µg/g dw)
y = 162.9x + 4045.2
R2
= 0.1142
y = 162.9x + 4045.2
R2
= 0.1142
0
2000
4000
6000
8000y = 2719.8x + 25304
R2
= 0.1272
y = 2719.8x + 25304
R2
= 0.1272
0
25000
50000
75000
100000
0 5 10 0 5 10
Ca MgFig. 3 Correlation of Ca and
Mg between sediment and
oyster
252 Arch Environ Contam Toxicol (2008) 54:245–258
123

the American oyster is capable of bioaccumulating heavy
metals in its soft tissue, to levels that are greater than in its
corresponding environment.
Heavy Metals in Sediment
Among nonessential trace elements or heavy metals, alu-
minum (Al), arsenic (As), cadmium (Cd), cobalt (Co),
chromium (Cr), lead (Pb), mercury (Hg), nickel (Ni), and
silicon (Si) are of major concern. In sediment, Co and Si
were not analyzed; Ni was not detected in all 3 extraction
procedures. As and Hg were exempted from NH4OAC and
water extraction procedures because they were only
extracted by the M-3 procedure. Excluding As and Hg,
analysis of sediment by the NH4OAC extraction procedure
yielded below the detection limit of Cr, whereas contami-
nation status of other elements was in the decreasing order
Cd (ND-2.1), Al (ND–1.8), Pb (ND–0.53) on lg/g dw
(Table 4). There is no significant (p \ 0.04) difference of
contamination of any of these elements at the 9 studied
sites. The M-3 extraction procedure in general showed the
following decreasing order: Al (9.6–1310)[[As (ND–98)
[ Hg (0.10–3.6) ‡ Cd (ND–3.5) [ Pb (0.24–2.6) ‡ Cr
(ND–2.8) on lg/g dw (Tables 4 and 6). Water extraction
procedure yielded the following decreasing order Al (0.03–
177), Cd (ND–0.43), Pb (ND–0.18), and Cr (ND–0.02) on
lg/g dw (Table 4). Mean Al in site 6 showed significantly
higher (p \ 0.010) concentration than other sites. Because
the M-3 extraction method yielded higher element con-
centrations than NH4OAC and water extraction methods,
the data from M-3 was considered for further discussions.
When considering M-3 data, in general, there is no sig-
nificant difference in concentrations between sites, and
therefore mean concentrations (average of 45 sediment
samples) of Al, Cd, and Pb by different extraction method
is illustrated by Fig. 4, because As and Hg were analyzed
only by the M-3 method, and Ni was below the detection
limit. It is apparent that the M-3 extraction procedure is
considered ideal for sediment analysis. The mercury con-
centration in sediments is a good indication of
contamination of an ecosystem, because sediments often
behave as a sink of this heavy metal. Although there is no
legislation concerning mercury pollution in sediments, a
site can be considered contaminated when the mercury
content exceeds its natural level (20–100 ng/g). High
concentration of Hg (1220–1860 ng/g dw) in sediment is of
major concern.
Metals in contaminated sediments may persist and
impact upon estuaries for decades. Sediments are important
substrates for heavy metal attachment in any aquatic
environment (Ackermann et al. 1983; Horowitz 1985;
Forstner 1989). Sediments are composed of oxides of Fe
and Mn, minerals, terrigenic material, and organic matter.
Heavy metals ions accumulate in estuarine sediments as a
result of either the deposition of metal-enriched allochth-
onous particles, or the adsorption of dissolved heavy-metal
ions from the water column (Rodrigo 1989). Adsorption of
heavy-metal ions on sediment particles is, in general, a
function of 2 factors: total surface area per unit weight of
sediment, and the adsorption potential of sediment mate-
rials. In addition, the degree to which water systems
withstand heavy-metal pollution is frequently dependent on
the concentration of suspended sediment in the water col-
umn. Suspended sediment, particularly clays (\4 lm), act
as sponges adsorbing metals directly from the dissolved
phase (Deely et al. 1992). Sediment is composed of a
combination of lithogenic, authigenic, and biogenic com-
ponents such as mineral grains, organic matter, Fe and Mn
oxides, sulphides, and carbonates. Heavy metals may be
attached to any of these phases in proportions that depend
on the physicochemical conditions prevailing in the sedi-
ment and associated water (Deely et al. 1992). Generally,
as grain size decreases, the concentration of metals
adsorbed onto sediment component increases, particularly
across the transition zone from silt (4–63 lm) to clay
(\4 lm). The flat platy structures of clay minerals have
high surface areas, surface charges, and cation exchange
capacities that readily attract metals and metal-carrying
substances (Forstner and Wittmann 1981; Horowitz 1985;
Cauwet 1987).
Chromium and Pb analyzed in sediment from the pres-
ent study were slightly higher than Nigerian sediment
(Chindah et al. 2004). On the other hand, several other
estuaries in the United States, Brazil, New Zealand, and
India had elevated levels (Frazier 1975; Rodrigo 1989;
Deely et al. 1992; Baptista et al. 2000; Crapez et al. 2003;
Mathew et al. 2003; Elston et al. 2005; Apeti et al. 2005b;
Amaraneni 2006). Data on Al in sediment from other areas
is not available, and therefore comparisons cannot be made
for Al. Nickel in this study was not detected, whereas other
studies showed concentrations from 1 to 168 parts per
million (Frazier 1975; Rodrigo 1989; Crapez et al. 2003;
Mathew et al. 2003; Elston et al. 2005; Amaraneni 2006).
Cadmium analyzed in this study was greater than concen-
trations in Chesapeake Bay, India, Nigeria, Mississippi
Bay, and Apalachicola Bay in Florida (Frazier 1975; Ma-
thew et al. 2003; Chindah et al. 2004; Elston et al. 2005;
Apeti et al. 2005b; Amaraneni 2006). Mercury and As
concentrations in this study were greater than studies from
New Zealand, Thousand Islands Florida and Mississippi
(Magalhaes et al. 1997; Baptista et al. 2000; Burton 2002;
Elston et al. 2005; Kongchum et al. 2006).
Adriano (2001) indicated a normal soil concentration of
mercury ranging from 20 to 250 ng/g. Kannan et al. (1998)
reported total mercury concentrations in sediments from
Arch Environ Contam Toxicol (2008) 54:245–258 253
123

Table 6 Mercury and arsenic concentrations (lg/g dry wt) in sediment and (lg/g dry wt) oyster samples
Site No. Sediment
Sample #
Hg Concentration
in sediment
Arsenic Concentration
in sediment
Hg Concentration
in oyster
Arsenic
Concentration
in oyster
1 1 1.88 78
2 1.96 30
3 1.30 32 169 478
4 2.35 53
5 1.83 45
Mean 1.86 48
2 6 1.38 26
7 1.49 51
8 1.35 7.8 130 200
9 0.36 22
10 1.54 35
Mean 1.22 28
3 11 1.43 6.7
12 1.19 8.4
13 1.49 15 164 830
14 1.52 10
15 1.50 13
Mean 1.43 11
4 16 3.44 52
17 1.99 18
18 1.34 13 707 600
19 1.75 33
20 0.10 ND
Mean 1.72 29
5 21 2.79 9.2
22 0.58 14
23 0.17 9.0 93 722
24 2.53 50
25 0.57 20
Mean 1.33 21
6 26 1.25 30
27 0.14 98
28 3.57 84 908 912
29 2.46 25
30 1.14 36
Mean 1.71 55
7 Mean NA NA 245 3042
8 Mean NA NA 122 1905
9 Mean NA NA 140 350
NA = not analyzed
254 Arch Environ Contam Toxicol (2008) 54:245–258
123

south Florida estuaries ranging from 1 to 219 ng/g dw.
These comparisons show that mercury concentration in
Savannah estuary is much higher than Florida coast. Mean
arsenic concentrations in sediment (sites 1–6) ranged from
11 to 55 lg/g dw (Table 6). By comparison, Adriano
(2001) reported noncontaminated U.S. soils having an
average arsenic concentration of 7.4 lg/g, and ocean sed-
iments as having average arsenic concentration of 33.7 lg/
g (with a range from\0.40 to 455 lg/g). Arsenic is often a
component of pesticides, and the highest sediment con-
centration found during this study was from site 6, which is
the site closest to residential development areas. The higher
sediment arsenic concentrations at this site might be related
to non-point-source pollution origins of arsenic into
Savannah River and its tributaries. However, geographical
comparison for Hg and As is not withstanding due to no
data for sites 7, 8, and 9.
Heavy Metals in Oyster
Concentrations of heavy metals in oyster were in the
following order: Si (241–381) [ B (231–254) [[ Pb
(\1.5–4.0) [ As (0.20–3.0) [ Cd (\1.5–2.9) [ Ni (\1.5–
2.5) [ Mo (\0.5–0.64) [ Hg (0.09–0.91) (Table 5 and 6)
lg/g dry wt basis. Except for As and Hg, nonessential
elements in oyster tissue were greater than sediments. The
results indicate that bioaccumulation of heavy metals in
oyster varies depending upon their chemical properties and
logKow efficiency.
International comparison of heavy metals in oyster tis-
sue comprehended that Savannah coastal waters had higher
Pb, Al, Cd, Cr, Ni, Hg, and As when compared to Irish
Coast UK, Mexico, Brazil, and some U.S. estuaries (Smyth
et al. 1995; Bloxham et al. 1998; Frias-Espericueta et al.
1999; Machado and Zalmon 2005; Elston et al. 2005).
Overall, no statistically significant (p \ 0.05) results
were obtained when comparing trace elements and heavy
metals between sites. Only sites 1–5 contained slightly
higher trace elements than sites 6–9. Comparison of trace
elements between sites should be ignored. Nevertheless,
statistically significant (p = 0.01 and p = 0.05) results were
obtained when comparing the M-3 extraction to water
extraction and M-3 extraction to NH4OAC method. Con-
sequently, the M-3 extraction method should be adopted
for sediment analysis.
Tolerable Intake of Trace Elements and Heavy Metals
The World Health Organization (WHO) has established a
provisional tolerable weekly intake (PTWI) for Cd at 7 lg/
kg of body weight. This PTWI weekly value corresponds to
a daily tolerable intake level of 70 lg of Cd per day for the
average 70-kg man and 60 lg of Cd per day for the average
60-kg woman. Clearly, the daily Cd intake for the general
population from oyster, which is by far the dominant
source of Cd, is well below the guidelines established by
WHO. The United States Food and Drug Administration
(USFDA 1993) set an estimated safe and adequate daily
dietary intake for Cr 200 lg/person/day as an allowed
consumption level, and for Ni 1200 lg/person/day as an
allowed consumption level. Concentrations of Cr and Ni in
oyster tissues were \1.5–8.0 lg/g and \1.5–2.5 lg/g on a
dw basis, respectively. The observed Cr and Ni values do
not have any significant effect on humans. The tolerable
daily intake of Pb was 25 lg/kg body weight, which is well
below the concentration observed in this study. United
States Environmental Protection Agency (USEPA) has
established an interim reference dose for methylmercury
(MeHg) of 1 · 10–4 lg per kg body weight/day. Although
the EPA recommends that the conservative assumption be
made that all mercury is present as MeHg, in order to be
most protective of human health, the EPA indicates that the
typical U.S. consumer, eating less than 10 g of fish and
shellfish per day, having average mercury concentrations
between 100 and 150 ng/g, may have an adverse impact.
Concentrations of Hg in 1 g oyster were between 93 and
908 ng/g, and therefore oyster collected from sites 1, 3, 4,
6, and 7 were above the 150 ng/g limit, and were consid-
ered to pose adverse effects. However, with limited
samples we cannot derive any final conclusion. Arsenic
was detected in all oyster tissue samples to a greater degree
than Hg, with a range from 200 to 3042 ng/g dw (Table 6).
Based on WHO data, the lethal dose of arsenic trioxide is
10–180 lg, and for arsenide is 70–210 lg, which is much
higher than the observed As concentration in oyster tissue
analyzed in this study. Further studies are needed to
NH4OAcM-3
Water
0
150
300
450
600
750
Pb Cd Al
Con
cent
ratio
n (µ
g/g
dw)
Fig. 4 Efficiency of three different extraction procedure of nones-
sential elements
Arch Environ Contam Toxicol (2008) 54:245–258 255
123

delineate the degree of mercury problems in Savannah
coastal waters.
Biota-Sediment Accumulation Factors
Biota-sediment accumulation factors (BSAF) have been
proposed as a simple model for predicting the bioaccu-
mulation of sediment-associated contaminants by infaunal
invertebrates (Kannan 1999). BSAF can be estimated based
on the dry weight normalized concentrations of contami-
nants in oyster divided by dry weight concentrations of
contaminants in sediment, basically using BSAF = Oyster
dw/Sediment dw formula. This simple construct of con-
taminant partitioning in infaunal organisms–sediment
systems was based on the assumption that no kinetic or
structural barriers to the establishment of equilibrium are
present. BSAFs varied depending on the species (both
chemical and biological), sediment organic carbon, and
contaminant concentrations, which suggested the need for
site-specific evaluation of BSAFs.
Based on the sediment data from the M–3 extraction
procedure, BASF calculation can be made for elements
such as P, Ca, Mg, Zn, Mn, Fe, and Al (for 9 sampling
locations) and for As and Hg (for 6 sampling locations). The
BSAF were in the range of 89–1891 (P), 1.5–37 (Ca), 1.1–
8.8 (Mg), 185–639 (Zn), 0.3–1.9 (Mn), 0.4–2.4 (Fe), 0.7–86
(Al), 0.004–0.02 (As), and 0.007–0.07 (Hg), respectively.
Greater bioaccumulation potential of P and Zn by oyster
deserves a specific interpretation. These results imply
specific accumulation of zinc in oyster in the Savannah
estuarine ecosystem. On the other hand, lower BSAF of
toxic elements such as Al, As, and Hg were noticed. Rec-
ommended Dietary Allowance (RDA) for Zn is 15 mg a day
for men (15 mg/day); 12 mg/day for women; 10 mg/day for
children; and 5 mg/day for infants. Based on this informa-
tion, consumption of oyster from Savannah coastal waters
may present less than RDA levels. MLT for P from oyster is
4000 lg/day (Dietary Reference Intake ‘‘DRI’’ 1997).
Concentrations of P in oysters in sites 2, 4, 5, 7, 8, and 9
were [4000 mg/g, and thus consumption of even 1 g of
oyster may lead to high accumulation of P in humans.
Although BSAF was found to be [1 for all elements,
correlation of sediment to oyster showed nonsignificant
correlation (Fig. 5) for 3 essential and 3 nonessential ele-
ments. In particular, Mn, Fe, and Al showed negative
correlation with r2 values of 0.0716, 0.0819, and 0.2179,
respectively, while Hg, Zn, and As showed positive but
very weak correlation of 0.3061, 0.0572, and 0.0003,
respectively. Because it was already discussed that oysters
may intake elements and heavy metals mainly by water
column rather than sediment. Consequently, studies should
be conducted with waters collected from several areas of
Savannah coast along with sediment.
Conclusions
Water quality parameters from all sampling locations were
according to proposed directives for estuarine water.
y = 46.698x + 1330
R2 = 0.0572
y = 46.698x + 1330
R2 = 0.0572R2 = 0.0572
0
1000
2000
3000
0 5 10 15
Zn
y = -0.5941x + 995.3
R2
= 0.0819
y = -0.5941x + 995.3
R2
= 0.0819R2
= 0.0819
0
500
1000
1500
0 500 1000 1500
y = 0.7672x - 0.8247
R2
= 0.3061
y = 0.7672x - 0.8247
R2
= 0.3061R2
= 0.3061
0
0.4
0.8
1.2
0 0.7 1.4 2.1
y = -0.1422x + 41.126
R2
= 0.0716
y = -0.1422x + 41.126
R2
= 0.0716R2
= 0.0716
0
20
40
60
0 40 80 120
Mn
y = -0.6803x + 1032
R2
= 0.2179
y = -0.6803x + 1032
R2
= 0.2179R2
= 0.2179
0
750
1500
2250
0 400 800 1200
y = 0.0003x + 0.614
R2
= 0.0003
y = 0.0003x + 0.614
R2
= 0.0003R2
= 0.0003
0
0.4
0.8
1.2Con
cent
ratio
n in
oys
ter
(µg/
g dw
)
Concentration in sediment (µg/g dw)
AlFe
AsHg
0 20 40 60
Fig. 5 Correlation of Zn, Mn,
Fe, Al, As and Hg between
sediment and oyster
256 Arch Environ Contam Toxicol (2008) 54:245–258
123
Sediment pH in sediments was similar to that of several
estuarine ecosystems. Among the three extraction proce-
dures, the Mehlich–3 (Mehlich 1984) extraction procedure
should be adopted for future sediment extraction. Con-
centrations of trace elements and heavy metals (except Hg
and As) were lower in sediment. Higher concentrations of
Al, As, Cd, Cr, Pb, and Zn in oyster tissue than sediment
suggests their efficient bioaccumulation characteristics.
Greater bioaccumulation of Zn and P in oyster especially
has been noticed. The bioaccumulation of elements and
metals comes mainly from water rather than the sediments,
which we found weakly correlated. International and geo-
graphical comparison of concentrations was either
comparable, lower, or higher for sediments and oyster.
Intake of oyster was found to be unsafe as far as mercury
and phosphorus concentrations and guidelines set by WHO
and DRI, respectively. Continued monitoring is needed at
the Savannah River because of rapid development of
industries in this river basin and dumping of all domestic
sewage and industrial effluents.
Acknowledgments Part of this study was financially supported by
the U.S. National Park Service, Department of Interior (grant/order
number P5420050005). Part of this research was performed under the
auspices of contract number DE-FG09-96SR18558, United States
Department of Energy and Environmental Protection Agency. We wish
to thank the management and staff of Bull River Marina for allowing us
to use space at their marina for overnight boat docking and for allowing
us to load and unload equipment and personnel during the field sam-
pling period. We thank Captain Jay Rosenzweig, Savannah State
University, for his cooperation and skill during boat sampling trips.
References
Ackermann F, Bergmann H, Schliechert U (1983) Monitoring of
heavy metals in coastal and estuarine sediments-a question of
grain size: \20 lm versus \60 lm. Environ Sci Technol Lett
4:317–328
Adriano DC (2001) Trace elements in terrestrial environments:
Biogeochemistry, bioavailability, and risk of metals, second
edition. Springer-Verlag, New York
Akagi H, Nishimura H (1991) Speciation of mercury in the
environment. In: Suzuki T, Imura N, Clarkson TW (eds)
Speciation of mercury in the environment. Plenum Press, New
York, pp 53–76
Alquezar R, Markich SJ, Booth DJ (2006) Metal accumulation in the
smooth toadfish, Tetractenos glaber, in estuaries around Sydney,
Australia. Environ Pollut 142:123–131
Amaraneni SR (2006) Distribution of pesticides, PAHs and heavy
metals in prawn ponds near Kolleru lake wetland, India. Env Int
32:294–302
Apeti DA, Johnson E, Robinson L (2005a) A model for bioaccumu-
lation of metals in Crassostrea virginica from Apalachicola Bay,
Florida. Am J Environ Sci 1:239–248
Apeti DA, Robinson L, Johnson E (2005b) Relationship between
heavy metal concentrations in the American oyster (Crassostreavirginica) and metal levels in the water column and sediment in
Apalachicola Bay, Florida. Am J Environ Sci 1:179–186
Ashraf MP, Edwin L, Meenakumari B (2006) Studies on the seasonal
changes of phosphorus in the marine environment off Cochin.
Env Int 32:159–164
Baptista NJA, Smith BJ, McAlister JJ (2000) Heavy metal concen-
trations in surface sediments in a nearshore environment,
Jurujuba Sound, SE Brazil. Environ Pollut 109:1–9
Bloxham M, Rowe A, McGovern E, Smyth M, Nixon E (1998) Trace
metal and chlorinated hydrocarbon concentrations in shellfish
and finfish from Irish waters—1996. Marine environmental
series 2/98, fishery leaflet 179, Marine Institute: 1–18
Burton M (2002) Copper and mercury in an oyster reef system,
Ten Thousand Islands, Southwest Florida. http://www.
216.109.125.130/search/cache?ei=UTF-8&fr=slv8-yie7&p=
BURTON+MARGO++Geology+Dept&u=keck.wooster.edu/
archives/symposium/02/Florida01_pdfs/burtonabs.pdf&w=
burton+margo+geology+dept&d=fRUmFBIeOSGi&icp=1&.
intl=us
Cauwet G (1987) Influence of sedimentological features on the
distribution of trace metals in marine sediments. Marine
Chemistry 22:221–234
Chindah AC, Braide AS, Sibeudu OC (2004) Distribution of
hydrocarbons and heavy metals in sediment and crustacean
(Shrimps-Penaeus notialis) from the Bonny/New Calabar River
Estuary, Niger Delta. AJEAM-RAGEE 9:1–17
Crapez M, Neto JAB, Bispo MGS (2003) Bacterial enzymatic activity
and bioavailability of heavy metals in sediments from Boa
Viagem Beach (Guanabara Bay). Anuario Inst Geociencias
UFRJ 26:60–68
Day JW, Hall CAS, Kemp WM, Alejandro YA (1989) Estuarine
ecology. John Wiley & Sons, New York, 558 p
Deely JM, Tunnicliff JC, Orange CJ, Edgerley WHL (1992) Heavy
metals in surface sediments of Waiwhetu Stream, Lower Hutt,
New Zealand. N Z J Marine Freshwater Res 26:417–427
De Groot AJ, Salmons W, Allersma E (1976) Processes affecting
heavy metals in estuarine sediments. In: Burton JD, Liss PS
(eds). Estuarine chemistry. Academic Press, London, pp 131–
157
DRI (1997) http://www.en.wikipedia.org/wiki/Dietary_Reference_
Intake
Elston R, Cake EW Jr, Humphrey K, Isphording WC, Rensel JE
(2005) Dioxin and heavy-metal contamination of shellfish and
sediments in St. Louis Bay, Mississippi and adjacent marine
waters. J Shellfish Res 24:227–241
Forstner U (1989) Contaminated sediments: Lectures on environ-
mental aspects of particle-associated chemicals in aquatic
systems. Springer-Verlag, Berlin, Heidelberg, New York, 157 p
Forstner U, Wittmann GTW (1981) Metal pollution in the aquatic
environment. 2nd edition. Springer-Verlag, Berlin, Heidelberg,
New York, p 486
Frazier JM (1975) The dynamics of metals in the American oyster,
Crassostrea virginica. I. Seasonal effects. Chesapeake Sci
16:162–171
Frias-Espericueta MG, Ortiz-Arellano MA, Osuna-Lopez JI, Ronson-
Paulin YJA (1999) Heavy metals in the rock oyster Crassostreairidescens (Filibranchia: Ostreidae) from Mazatlan, Sinaloa,
Mexico. Rev Biol Trop 47:843–849
Goldberg ED, Koide M, Holdge V, Flegal AR, Martin J (1983) U.S.
mussel watch: 1977–1978 results on trace metals and radionuc-
lides. Estuarine Coastal Shellfish Sci 16:69–93
Haye JM, Santschi PH, Roberts KA, Ray S (2006) Protective role of
alginic acid against metal uptake by American oyster (Crassos-trea virginica). Environ Chem 3:172–183
Honda K, Tatsukawa R, Fujiyama T (1982) Distribution character-
istics of heavy metals in the organs and tissues of striped
dolphin, Stenella coeruleoalba. Agric Biol Chem 46:3011–3021
Arch Environ Contam Toxicol (2008) 54:245–258 257
123

Horowitz AJ (1985) A primer on trace element-sediment chemistry.
US Geological Survey Water Supply Paper 2277, 67 p
Ichihashi H, Nakamura Y, Kannan K, Tsumura A, Yamasaki S (2001)
Multi-elemental concentrations in tissues of Japanese common
squid (Todarodes pacificus). Arch Environ Contam Toxicol
41:483–490
Ikemoto T, Kunito T, Watanbe I, Yasunaga G, Baba N, Miyazaki N,
Petrov EA, Tanabe S (2004) Comparison of trace element
accumulation in Baikal seals (Pusa sibirica), Caspian seals
(Pusa caspica) and northern fur seals (Callorhinus ursinus).
Environ Pollut 127:83–97
Jayaprakash M, Srinivasalu S, Jonathan MP, Ram Mohan V (2005) A
baseline study of physico-chemical parameters and trace metals
in waters of Ennore Creek, Chennai, India. Mar Pollut Bull
50:583–608
Kannan K (1999) Clam-sediment accumulation factors for polychlo-
rinated biphenyl congeners at a contaminated estuarine marsh.
Toxicol Environ Chem 68:159–167
Kannan K, Sinha RK, Tanabe S, Ichihashi H, Tatsukawa R (1993)
Heavy metals and organochlorine residues in Ganges River
dolphins from India. Mar Pollut Bull 26:159–162
Kannan K, Smith RG Jr, Lee RF, Windom HL, Heitmuller PT,
Macauley JM, Summers JK (1998) Distribution of total mercury
and methyl mercury in water, sediment, and fish from south
Florida estuaries. Arch Environ Contam Toxicol 34:109–118
Kannan K, Yasunaga Y, Iwata H, Ichihashi H, Tanabe S, Tatsukawa
R (1995) Concentrations of heavy metals, organochlorines, and
organotins in horseshoe crab, Tachypleus tridentatus, from
Japanese coastal waters. Arch Environ Contam Toxicol 28:40–
47
Karadede H, Oymak SA, Unlu E (2004) Heavy metals in mullet, Lizaabu, and catfish, Silurus triostegus, from the Ataturk Dam Lake
(Euphrates), Turkey. Env Int 30:183–188
Kongchum M, Devai I, DeLaune RD, Jugsujinda A (2006) Total
mercury and methylmercury in freshwater and salt marsh soils
of the Mississippi river deltaic plain. Chemosphere 63:1300–
1303
Kuppusamy MR, Giridhar VV (2006) Factor analysis of water quality
characteristics including trace metal speciation in the coastal
environmental system of Chennai Ennore. Env Int 32:174–179
Machado FAG, Zalmon IR (2005) Temporal and spatial variation on
heavy metal concentrations in the oyster Ostrea equestris on the
Northern Coast of Rio De Janeiro State, Brazil. Brazil J Biol
65:67–76
Magalhaes CC, Krug FJ, Fostier AH, Berndt H (1997) Dietary
determination of mercury in sediments by atomic adsorption
spectrometry. J Anal Atomic Spectrometry 12:1231–1234
Mathew M, Mohanraj R, Azeez PA, Pattabhi S (2003) Speciation of
heavy metals in bed sediments of wetlands in Urban Coimbatore,
India. Bull Environ Contam Toxicol 70:800–808
McLean GW (1982) Hydrogen-ion activity. In: Page AL et al. (ed.)
Methods of soil analysis. Part II, 2nd ed. Agronomy 9:159–164
Mehlich A (1984) Mehlich 3 soil test extractant: A modification of
Mehlich 2 extractant. Comm Soil Sci Plant Ana 15:1409–1416
Moss A, Constanza S (1998) Levels of heavy metals in the sediments
of Queensland rivers, estuaries and coastal waters. Environmen-
tal technical report no. 20- ISSN 1037-4671, Queensland
Government, Australia
Peakall D, Burger J (2003) Methodologies for assessing exposure to
metals: speciation, bioavailability of metals and ecological host
factors. Ecotoxicol Environ Safety 56:110–121
Phelps HL, Mihursky JA (1986) Oyster (Crassostrea virginica,
Gmelin) spat settlement and copper in aufwuchs. Estuaries
9:127–132
Rodrigo AG (1989) Surfacial sediment-heavy metal associations in
the Avon-Heathcote Estuary, New Zealand. N Z J Marine
Freshwater Res 23:255–262
Sajwan KS, Senthil Kumar K, Suresh N, Fowler A, Richardson JP,
Loganathan BG (2007) Persistent -organochlorine pesticides, -
polychlorinated biphenyls and -polybrominated diphenyl ethers
in fish from coastal waters off Savannah, Georgia, USA. Toxicol
Env Chem (DOI: 10.1080/02772240701270047)
Sakai H, Saeki K, Ichihashi H, Kamezaki N, Tanabe S, Tatsukawa R
(2000) Growth-related changes in heavy metal accumulation in
green turtle (Chelonia mydas) from Yaeyama Islands, Okinawa,
Japan. Arch Environ Contam Toxicol 39:378–385
Sankar TV, Zynudheen AA, Anandan R, Viswanathan Nair PG
(2006) Distribution of organochlorine pesticides and heavy metal
residues in fish and shellfish from Calicut region, Kerela, India.
Chemosphere 65:583–590
Senthil Kumar K, Sajwan KS, Richardson J (2007) A baseline
monitoring of heavy metals, organochlorine pesticides, polycy-
clic aromatic hydrocarbons and alkylphenols in sediment and
oyster collected from marsh/estuarine Savannah, GA. Mar Pollut
Bull (in press)
Singh BR, Steinnes E (1994) Soil and water contamination by heavy
metals. In: Lal R, Stewart BA (eds) Soil processes and water
quality. Lewis, Boca Raton, Florida, pp 233–272
Smyth M, Rowe A, McGovern E, Nixon E (1995) Monitoring of
shellfish growing areas—1995. Marine environmental series 1/
97, fishery leaflet 174, Marine Institute, pp 1–11
Storelli MM, Storelli A, D’Addabbo R, Marano C, Bruno R,
Marcotrigiano GO (2005) Trace elements in loggerhead turtles
(Caretta caretta) from the eastern Mediterranean Sea. Overview
and evaluation. Environ Pollut 135:163–170
Thomas GW (1982) Exchangeable cations: In: Page AL (ed) Methods
of soil analysis, part 2, 2nd ed. Agronomy 9:159–164
USFDA (1993) Guidance document for arsenic, chromium, nickel in
shellfish. Center for Food Safety and Applied Nutrition. United
States Food and Drug Administration, Washington, DC
258 Arch Environ Contam Toxicol (2008) 54:245–258
123