Californian Salt-Marsh Vegetation: An Improved Model of Spatial Pattern
17
Californian Salt-Marsh Vegetation: An Improved Model of Spatial Pattern Joy B. Zedler, 1 * John C. Callaway, 1 Julie S. Desmond, 1 Gabrielle Vivian-Smith, 1 Gregory D. Williams, 1 Gary Sullivan, 1 Alice E. Brewster, 2 and Brian K. Bradshaw 2 1 Pacific Estuarine Research Laboratory and 2 Department of Geography, San Diego State University, San Diego, California 92182, USA ABSTRACT Although tidal wetland vegetation patterns are typi- cally related to elevation, we hypothesized that the vertical range of a species may shift where the topography is more heterogeneous. We examined plant species occurrences in relation to elevation, proximity to the bay, and proximity to tidal creeks at a near-pristine wetland in San Quintı ´n Bay, Baja California, Mexico. At the whole-wetland scale, most species occurred primarily within a 30-cm elevation band (the marsh plain). However, Spartina foliosa occurred only at the bayward margin, even though ‘‘suitable’’ elevations were present further inland. A similar pattern was found in San Diego Bay. At the microtopographic scale, three species on the marsh plain were strongly influenced by eleva- tion, whereas four species responded to both eleva- tion and proximity to tidal creeks. The latter species tended to ‘‘avoid’’ the lower 10 cm of the marsh plain except near a tidal creek. Species richness was thus greater (by 0.6 species at the lowest 10-cm class) at the tidal creek margin. Better drainage near creeks is the hypothesized cause. Our results help explain why species that are transplanted to con- structed wetlands do not always grow at the full range of elevations they occupy in natural wetlands. We recommend that species be introduced to their modal elevation (determined from nearby reference marshes) and that salt-marsh construction designs include topographic heterogeneity (complex tidal creek networks). The analysis of broad-scale and fine-scale patterns of occurrence also suggests new habitat nomenclature. Elevation-based terms (‘‘low,’’ ‘‘middle,’’ and ‘‘high’’ marsh) should be replaced by a system that considers elevation, landscape posi- tion, and conspicuous species. We suggest three habitat designations: (a) the high marsh—a 30- to 70-cm elevation range with Salicornia subterminalis; (b) the marsh plain—a 30-cm elevation range with heterogeneous topography and up to nine common species; and (c) cordgrass habitat—the bayward por- tion of the marsh plain and lower elevations, all occupied by Spartina foliosa. Although these habitats do not have discrete boundaries, separate terms are needed for wetland restoration plans and these designations will improve recognition that vegeta- tion patterns respond to horizontal, as well as vertical, position. Key words: coastal wetland; intertidal elevation; landscape position; scale; species composition; tidal creeks; topographic heterogeneity. INTRODUCTION Gradient analysis has contributed substantially to the understanding of environmental factors that influence plant and animal distributions (Curtis 1959; Whittaker 1967, 1975). In many of these Received 2 June 1998; accepted 30 September 1998. *Corresponding author’s current address: Botany Department and Arbore- tum, University of Wisconsin, Madison, Wisconsin 53706, USA; e-mail: jbzedler@ facstaff.wisc.edu Ecosystems (1999) 2: 19–35 ECOSYSTEMS r 1999 Springer-Verlag 19
Transcript of Californian Salt-Marsh Vegetation: An Improved Model of Spatial Pattern
Californian Salt-Marsh Vegetation:An Improved Model
of Spatial Pattern
Joy B. Zedler,1* John C. Callaway,1 Julie S. Desmond,1Gabrielle Vivian-Smith,1 Gregory D. Williams,1 Gary Sullivan,1
Alice E. Brewster,2 and Brian K. Bradshaw2
1Pacific Estuarine Research Laboratory and 2Department of Geography, San Diego State University, San Diego, California 92182, USA
ABSTRACTAlthough tidal wetland vegetation patterns are typi-cally related to elevation, we hypothesized that thevertical range of a species may shift where thetopography is more heterogeneous. We examinedplant species occurrences in relation to elevation,proximity to the bay, and proximity to tidal creeks ata near-pristine wetland in San Quintın Bay, BajaCalifornia, Mexico. At the whole-wetland scale,most species occurred primarily within a 30-cmelevation band (the marsh plain). However, Spartinafoliosa occurred only at the bayward margin, eventhough ‘‘suitable’’ elevations were present furtherinland. A similar pattern was found in San DiegoBay. At the microtopographic scale, three species onthe marsh plain were strongly influenced by eleva-tion, whereas four species responded to both eleva-tion and proximity to tidal creeks. The latter speciestended to ‘‘avoid’’ the lower 10 cm of the marshplain except near a tidal creek. Species richness wasthus greater (by 0.6 species at the lowest 10-cmclass) at the tidal creek margin. Better drainage nearcreeks is the hypothesized cause. Our results helpexplain why species that are transplanted to con-structed wetlands do not always grow at the fullrange of elevations they occupy in natural wetlands.We recommend that species be introduced to their
modal elevation (determined from nearby referencemarshes) and that salt-marsh construction designsinclude topographic heterogeneity (complex tidalcreek networks). The analysis of broad-scale andfine-scale patterns of occurrence also suggests newhabitat nomenclature. Elevation-based terms (‘‘low,’’‘‘middle,’’ and ‘‘high’’ marsh) should be replaced bya system that considers elevation, landscape posi-tion, and conspicuous species. We suggest threehabitat designations: (a) the high marsh—a 30- to70-cm elevation range with Salicornia subterminalis;(b) the marsh plain—a 30-cm elevation range withheterogeneous topography and up to nine commonspecies; and (c) cordgrass habitat—the bayward por-tion of the marsh plain and lower elevations, alloccupied by Spartina foliosa. Although these habitatsdo not have discrete boundaries, separate terms areneeded for wetland restoration plans and thesedesignations will improve recognition that vegeta-tion patterns respond to horizontal, as well asvertical, position.
Key words: coastal wetland; intertidal elevation;landscape position; scale; species composition; tidalcreeks; topographic heterogeneity.
INTRODUCTION
Gradient analysis has contributed substantially tothe understanding of environmental factors thatinfluence plant and animal distributions (Curtis1959; Whittaker 1967, 1975). In many of these
Received 2 June 1998; accepted 30 September 1998.*Corresponding author’s current address: Botany Department and Arbore-tum, University of Wisconsin, Madison, Wisconsin 53706, USA;e-mail: jbzedler@ facstaff.wisc.edu
Ecosystems (1999) 2: 19–35 ECOSYSTEMSr 1999 Springer-Verlag
19
studies, elevation is used as a surrogate for environ-mental conditions, for example, Beals’s (1969) studyof Ethiopian scrub vegetation; Terborgh’s (1971)work on Andean birds; rocky intertidal descriptionsby Connell (1961), Ricketts and Calvin (1968), andStephenson and Stephenson (1972); and studies ofsalt marshes by Hinde (1954), Adams (1963), Vogl(1966), Zedler (1977), Adam (1981), Vince andSnow (1984), Zedler and Cox (1984), Ibarra-Obando and Poumian-Tapia (1992), and Sanchezand others (1996). The earlier gradient studies useelevation ranges for conspicuous species [for ex-ample, the presence of shrubs within a grasslandgradient (Daubenmire 1966)] to describe plant com-munities as discrete zones, rather than continua.
The elevation-based zonation model persists insalt-marsh ecology [for example, see Nixon (1982),Vince and Snow (1984), Odum (1988), Adam(1990), Wiegert and Freeman (1990), Bertness(1991a, 1991b), Pennings and Callaway (1992),Sanchez and others (1996), and Clewell (1997)]. Intidal marshes, several hydrologic and edaphic fac-tors are presumed to correlate with elevation: fre-quency and duration of tidal inundation, soil salin-ity, soil moisture and waterlogging, organic content,depth to water table, soil redox, and soil sulfideconcentrations (Adams 1963; Earle and Kershaw1989). Very small differences in elevation are suffi-cient to alter the intertidal environment. For ex-ample, a 4-cm elevation difference in a Dutch saltmarsh caused 15- to 20-min changes in the durationof tidal submergence and shifted competitive inter-actions between two dominant species (Scholtenand Rozema 1990). The wide range of environmen-tal conditions in 1–2 m of elevation may lead tomore discrete assemblages or, alternatively, the lowspecies richness of tidal marshes may facilitate thecharacterization of zones by their conspicuous spe-cies.
The broad-scale patterns or zones have beennamed low and high marsh. A third, midmarsh zonehas also been described for marshes with a mixtureof succulents between the high-marsh and low-marsh vegetation (Vogl 1966). Along the Atlanticand Gulf Coasts, single-species marshes (Spartinaalterniflora) are often subdivided as creekside andback-marsh habitats, but most of this literatureconcerns height forms rather than community com-position. In the species-rich wetlands of the PacificCoast, it is obvious that the upland–wetland marginsupports different species than the bayward edge,but the degree of differentiation and the finer-scalepatterns have largely been ignored. The lack ofhigh-precision survey data, the pooling of species
distributional data from multiple transects, and theconfining of samples to ‘‘homogeneous stands’’ [forexample, see Wilson and Whittaker (1995)] havemasked fine-scale patterns in previous studies. Ourprevious sampling approaches [for example, n 5357 quadrats along three transects in Zedler (1977),and n 5 153 in Callaway and others (1990)] werenot adequate for detecting patterns related to topo-graphic heterogeneity.
Salt-marsh researchers have noted that the eleva-tion limits of a species differ from marsh to marsh,and complex biological explanations have beendeveloped: Pielou and Routledge (1976) concludedthat marsh zones were broader and species bound-aries more coincident with increasing latitude, com-paring Canadian marshes on the Atlantic Coast(44°N) and in James Bay (58°N). Lacking data oneither elevation or tidal conditions, they reasonedthat higher latitudes would have less stable climate,leading to greater genetic heterozygosity withinspecies, and resulting in increased species’ toleranceranges and greater ‘‘edaphic amplitude.’’ In a studyof two English marshes, Russell and colleagues(1985) found that species’ elevation ranges hadlower overlap in the marsh near the sea (which had16 species) and higher overlap in the marsh thatwas 8 km upstream (with 11 species). Mean eleva-tions of occurrence also differed for several species.Russell and colleagues explained the reduced over-lap as resulting from competition, reasoning thatthe higher number of species would reduce overlap.Ellison (1987), Adam (1990), Gray (1992), Pen-nings and Callaway (1992), Bertness (1991a, 1991b,1994), Bertness and Yeh (1994), and Brewer andcolleagues (1997) have also suggested that interspe-cific interactions (competition and/or facilitation)help explain variations in species distribution.
The more parsimonious arguments concern physi-cal factors. Randerson (1979) explained a shift inthe seaward limit of marsh vegetation on the basisof substrate texture—some species (for example,Suaeda maritima and Halimione portulacoides) wereable to grow at lower elevations on well-drainedsand than on silt. Gray and colleagues (1991; Gray1992) recognized the importance of different tidalinundation patterns in British marshes and ex-plained up to 89% of the variation in species limitson the basis of tidal range. Frenkel and colleagues(1981) tested the ability of separate research teamsto identify the upper elevation of intertidal wetlandsin Oregon and found disagreements, which theyattributed to freshwater influence (species occurredat lower elevation near an inflow), physiologicaldifferences (populations in different wetlands mighthave different tolerance ranges), distance from the
20 J. B. Zedler and others
mouth (tidal effect), and errors in measuring eleva-tion and tidal conditions. In reviewing the litera-ture, we found little mention of other confoundingvariables, such as differences in topographic hetero-geneity.
Our interest in topographic heterogeneity derivesfrom experience with salt-marsh restoration andcreation projects where smooth slopes and straightedges are the rule (Haltiner and others 1997), andwhere marsh vegetation is planted according toelevation ranges in natural wetlands. Two basicquestions extend to restoration of upland and aquatichabitats as well: Can communities that normallyoccur in heterogeneous habitats be re-created onmore homogeneous land forms? How are elevationsof occurrence modified by topographic heterogene-ity?
Four attributes of Californian salt marshes makethem useful for testing the adequacy of elevation asa predictor of species occurrences: (a) Major environ-mental changes occur within relatively short dis-tances due to the effects of tidal inundation on soilsalinity and moisture. (b) The tidal marshes areriddled with creeks, which deliver water, improvedrainage, and provide microtopographic complex-ity. (c) Plant species composition is relatively con-stant in time. (d) Patch disturbances, such as icescouring, herbivory by geese, or digging by smallmammals, are not obvious; indeed, there is no frostor use by geese, and small mammal burrows areconfined to marsh edges (J. Zedler personal observa-tion). Burrowing invertebrates, for example, crabsand worms, do not create canopy openings largeenough for substantial seedling recruitment (G.Vivian-Smith unpublished). Wrack deposition, al-though present and occasionally a factor in creatingcanopy openings, is not a widespread cause ofrecruitment (Valiela and Rietsma 1995). AlthoughCalifornian salt marshes are not static systems, largeshifts in composition occur only following majordisturbances, such as closure to tidal flushing (Ibarra-Obando and Poumian-Tapia 1992; Zedler and oth-ers 1992) or prolonged flooding (Zedler and Beare1986).
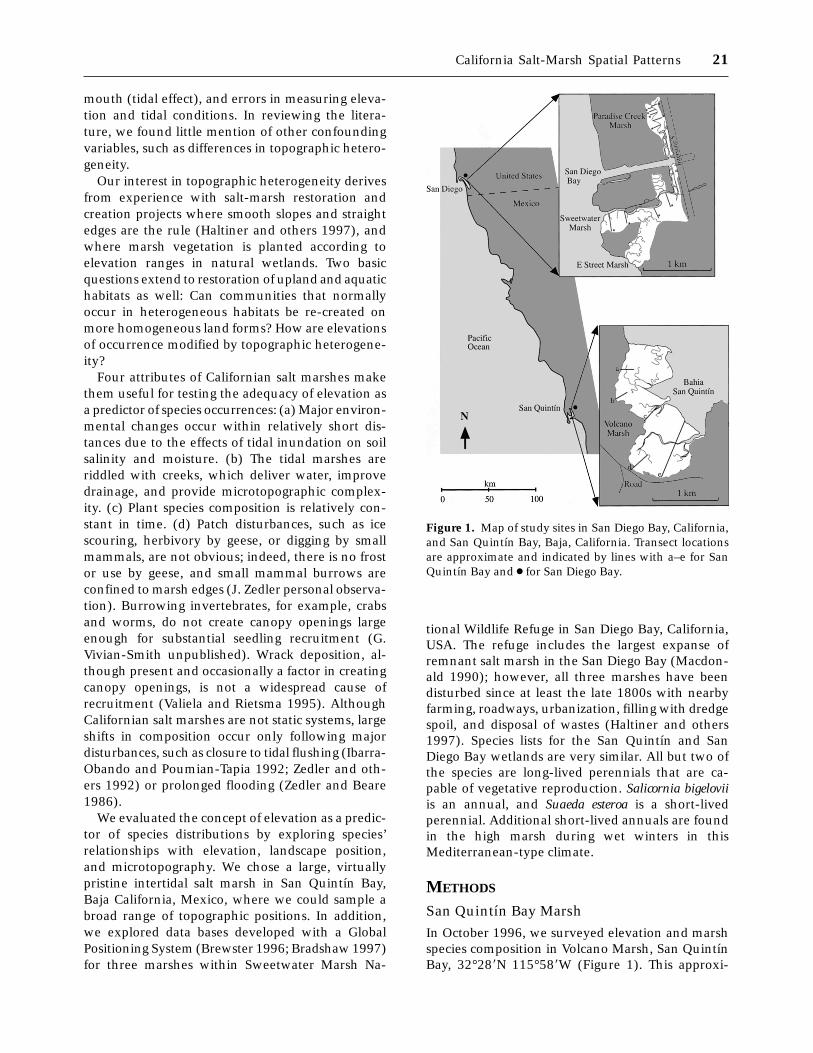
We evaluated the concept of elevation as a predic-tor of species distributions by exploring species’relationships with elevation, landscape position,and microtopography. We chose a large, virtuallypristine intertidal salt marsh in San Quintın Bay,Baja California, Mexico, where we could sample abroad range of topographic positions. In addition,we explored data bases developed with a GlobalPositioning System (Brewster 1996; Bradshaw 1997)for three marshes within Sweetwater Marsh Na-
tional Wildlife Refuge in San Diego Bay, California,USA. The refuge includes the largest expanse ofremnant salt marsh in the San Diego Bay (Macdon-ald 1990); however, all three marshes have beendisturbed since at least the late 1800s with nearbyfarming, roadways, urbanization, filling with dredgespoil, and disposal of wastes (Haltiner and others1997). Species lists for the San Quintın and SanDiego Bay wetlands are very similar. All but two ofthe species are long-lived perennials that are ca-pable of vegetative reproduction. Salicornia bigeloviiis an annual, and Suaeda esteroa is a short-livedperennial. Additional short-lived annuals are foundin the high marsh during wet winters in thisMediterranean-type climate.
METHODS
San Quintın Bay MarshIn October 1996, we surveyed elevation and marshspecies composition in Volcano Marsh, San QuintınBay, 32°288N 115°588W (Figure 1). This approxi-
Figure 1. Map of study sites in San Diego Bay, California,and San Quintın Bay, Baja, California. Transect locationsare approximate and indicated by lines with a–e for SanQuintın Bay and ● for San Diego Bay.
California Salt-Marsh Spatial Patterns 21
mately 100-ha marsh is the least altered of the bay’sseven marshes, although a dirt road parallels themarsh perimeter. Five transects were located acrossthe marsh by dividing the inland perimeter of themarsh into five approximately 600-m sections, deter-mined by pacing. Within each of the five sections, atransect was initiated at a randomly chosen loca-tion. All transects began in the upland–wetlandtransition, inland of the uppermost occurrence ofSalicornia subterminalis [the nomenclature followsthat of Hickman (1993)]. Transects extended to-ward the bay and varied in length from 150 to 900m. Transect E reached the bay, whereas the otherfour terminated at the edge of major channels or onthe marsh plain (the 30-cm range of elevations thatwere most commonly encountered). The position ofeach transect was marked with at least two rebarrods at the inland edge of the marsh. Transects a–ewere about 327, 896, 1378, 2218, and 2527 m fromthe northeastern limit of the marsh, respectively(Figure 1).
We measured elevation frequently along tran-sects in order to characterize both inland and sea-ward portions of the marsh; this required increasingintervals between measurements once an elevationand species mixture was obviously well sampled.Using a Wild auto level and stadia rod, we sampledat 2-m intervals except for the end of transect a (thelast 50 m sampled at 10-m intervals), transect d(4-m intervals), and transect e (4-m intervals whereplain was most uniform). In cases where there wasmore than a 10-cm difference in elevation within aninterval, we also sampled the elevation at themidpoint of the interval. At each surveyed point, werecorded plant species present within a 0.25-m2
circular quadrat frame centered on the point. Wealso recorded the presence of all tidal creeks orchannels within 1 m of each point. The permanentrebar rods at the inland edge of each transect werethen surveyed and elevations of all five transectscalculated relative to the average elevation of thelowest occurrences of Spartina foliosa at the bay edgeof transect e.
In August 1997, we relocated our rebar markersand verified the accuracy of our elevation measuresby using a Sokkia Total Station System 4B-II toremeasure the relative elevations of the permanentrebar benchmarks. Based on the laser-level read-ings, our initial surveying error was less than 5 cmover a 1500-m distance, and we corrected eleva-tions on each transect based on the laser-levelelevations (error less than 0.5 cm/km) at the rebarmarkers.
San Diego Bay MarshesAt San Diego Bay, data were available for E StreetMarsh (9.3 ha), Sweetwater Marsh (35.1 ha), andParadise Creek Marsh (12.8 ha), all within theSweetwater Marsh National Wildlife Refuge(32°408N 117°058W). Kinematic Global PositioningSystems (GPS) surveying of the marshes was con-ducted with a Trimble 4000SE Land Surveyor. Thisis a form of continuous differential carrier-phase GPSwith an accuracy of within 5 cm (Brewster 1996). AtSweetwater and Paradise Creek marshes, surveyingwas conducted during November 1995 along transectsplaced perpendicular to the main tidal channel ateach site. These two sites were sampled by BrianBradshaw and Alice Brewster, with measurementstaken approximately every 4–6 m along transectsspread throughout the marsh (Bradshaw 1997)[data presented are derived from four transects atSweetwater (n 5 228 points) and 11 transects atParadise Creek Marsh (n 5 192 points)]. At E StreetMarsh, data were collected during September andOctober 1995 with points every 2–5 m along morethan 90 transects spaced 3–5 m apart, resulting inextensive coverage of the site (n 5 4172) (Brewster1996). For each of these three marshes, the horizon-tal coordinates and elevation were quantified ateach measurement point along the transect, andspecies present were recorded within a 1-m2 area(estimated by eye). The data bases for this studywere developed using Trimvec Plus GPS (TrimbleNavigation 1991), ARC/INFO and ArcView Geo-graphic Information System (ESRI 1997), andERDAS (ERDAS 1991) software packages.
Data AnalysisElevation data from species occurrences from Vol-cano Marsh and E Street Marsh were used toproduce box and whisker plots showing the eleva-tion of occurrence of all species encountered. It isimportant to keep in mind that the elevation datafor San Diego Bay are relative to the NationalGeodetic Vertical Datum (NGVD), whereas thosefrom Volcano Marsh are relative to the lower limitof the vegetated marsh.
Topographic heterogeneity was explored by com-paring slopes between adjacent points along tran-sects. At Volcano Marsh, this was straightforward, aselevations were measured along straight lines. Seg-ments of each transect were classified as on, above,or below the marsh plain. Segments on the marshplain included elevations for channel bottoms, asthis was the heterogeneity we sought to character-ize. Segments above the plain were at the inlandend, except for one volcanic outcrop on transect c.Segments below the plain were at the bayward end.
22 J. B. Zedler and others
At San Diego Bay, topographic and vegetation datawere collected at a coarser scale. As a result, we didnot explore the same fine-scale patterns of topo-graphic heterogeneity as we did for Volcano Marsh,but we used the data to depict the topography ofeach site and species distribution patterns at a 2- to6-m scale.
We performed a cluster analysis on the 817quadrats containing vegetation at Volcano Marsh.To determine the similarity of occurrence betweeneach species pair, we used Jaccard’s index, calcu-lated as
CJ 5 j/(a 1 b 2 j)
where j is number of quadrats containing bothspecies, a is the number of quadrats with species A,and b is the number of quadrats with species B. Theresulting similarity matrix was clustered using theunweighted group means averaging method. Theanalysis was conducted using SYSTAT version 5.2.1(SYSTAT, Evanston, IL, USA).
We used a G test (Sokal and Rohlf 1995) tocompare inland occurrences of S. foliosa at E StreetMarsh with those within 200 m of the bay. Analysisof covariance was used to test for the effect ofelevation (continuous), proximity to tidal creek(class variable), and their interaction on speciesrichness. To help understand the interaction term,quadrats were also divided into 10-cm elevationalincrements, with one t test for differences in meanspecies richness per class.
To determine whether species distributions withinthe 30-cm marsh plain were influenced by microto-
pography, we used logistic regression analysis withoccurrence (presence or absence) as the dependentvariable and elevation (continuous data) and prox-imity to creeks (two classes, greater or less than 1 m)as independent variables (SAS Institute 1990). Thenumbers of presences and absences for 10-cm eleva-tion ranges for creek margins and points more than1 m from a creek were then plotted and assessed tointerpret the interaction terms.
RESULTS
Topography
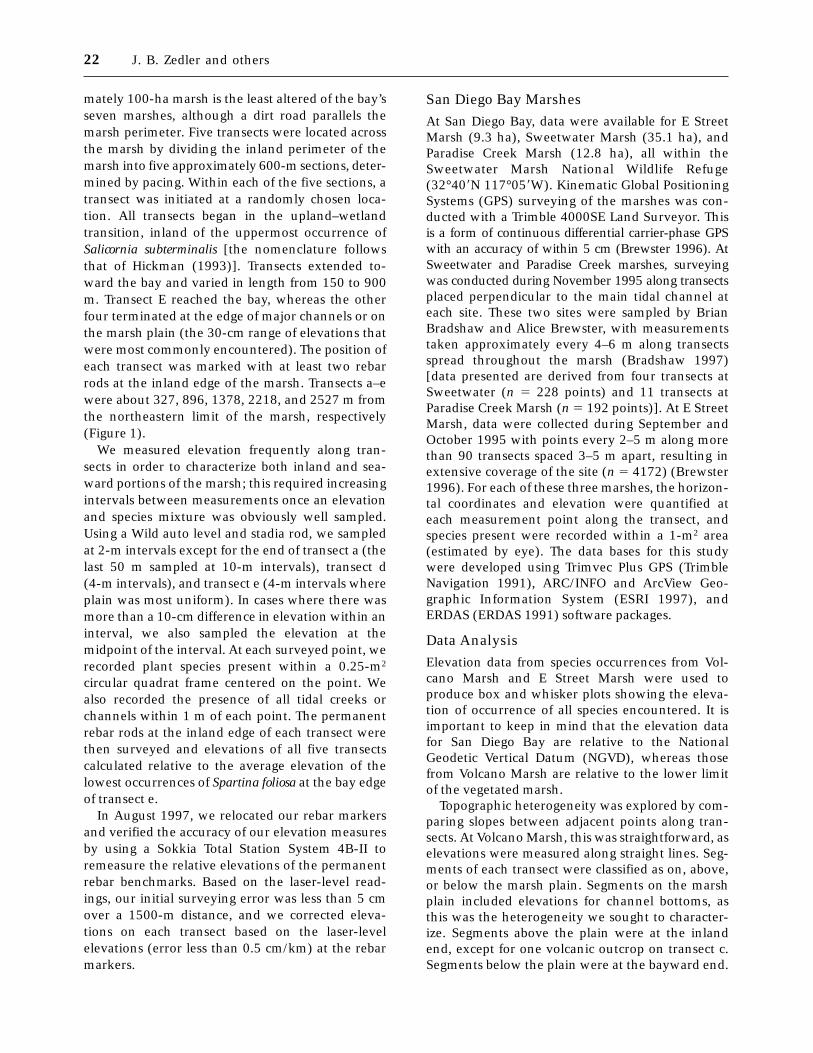
Volcano Marsh, San Quintın Bay. In all, 848 pointswere surveyed for elevation (Figure 2), and 817 ofthe corresponding 0.25-m2 circular quadrats werevegetated. The most common of these elevationsdefined a contiguous elevational band that wedesignated as the marsh plain. To identify thiselevational band, we grouped surveyed points (Fig-ure 2) by 10-cm elevation class and plotted afrequency histogram of points 3 elevation class.Peaks were at 0.9–1.0 m (171 points) and 1.0–1.1 m(170 points) above the reference elevation, with alesser peak at 1.1–1.2 m (131 points). This combined30-cm elevation range included 472 of the 848points (55.7% of the total) and was designated asthe marsh plain. Of these 472 marsh-plain points,one was unvegetated, nine were tidal ponds or pondmargins, and four were creek bottoms. Our analysisof marsh-plain composition focused on the quadratsat these remaining 458 points, of which 382 were
Figure 2. Transect elevationprofiles at Volcano Marsh,San Quintın Bay, showingoccurrences of Salicorniasubterminalis (1), Salicorniavirginica (3), and Spartinafoliosa (●). Elevations arerelative to the lowest occur-rences of Spartina foliosa.Note that the x-axis scalevaries.
California Salt-Marsh Spatial Patterns 23
more than 1 m from a creek and 76 were within 1 mof a creek (creek margin).
For the most part, creeks lacked levees, which aresometimes common along tidal creeks, especiallywhere tidal amplitudes are large (Wiegert and Free-man 1990). At San Quintın Bay (30°298N,115°598W), the tidal amplitude is under 3 m (maxi-mum on 1990 tide table, 2.7 m). Only 24 of the 76creek-margin points were higher than the adjacentplain, and their elevations (1.1–1.27 m above thereference datum) were near those of the marshplain (0.9–1.2 m above datum).
The wetland areas above and on the marsh plaindiffered in topographic complexity, as measured bythe number of tidal creeks. The intertidal area abovethe marsh plain (hereafter referred to as the highmarsh) lacked tidal creeks (Figure 2). Our transectsencountered 41 creek segments within the marshplain. Fourteen creeks were more than 0.5 m deep;the remaining 27 were shallower.
Although we found a 30-cm elevational rangewithin the marsh plain, there was no gradual slopetoward the bay. The marsh plain is flat overall butbumpy at the fine scale (Figure 2). We counted 256slope reversals between survey points over a 1342-mdistance along the marsh-plain transects.
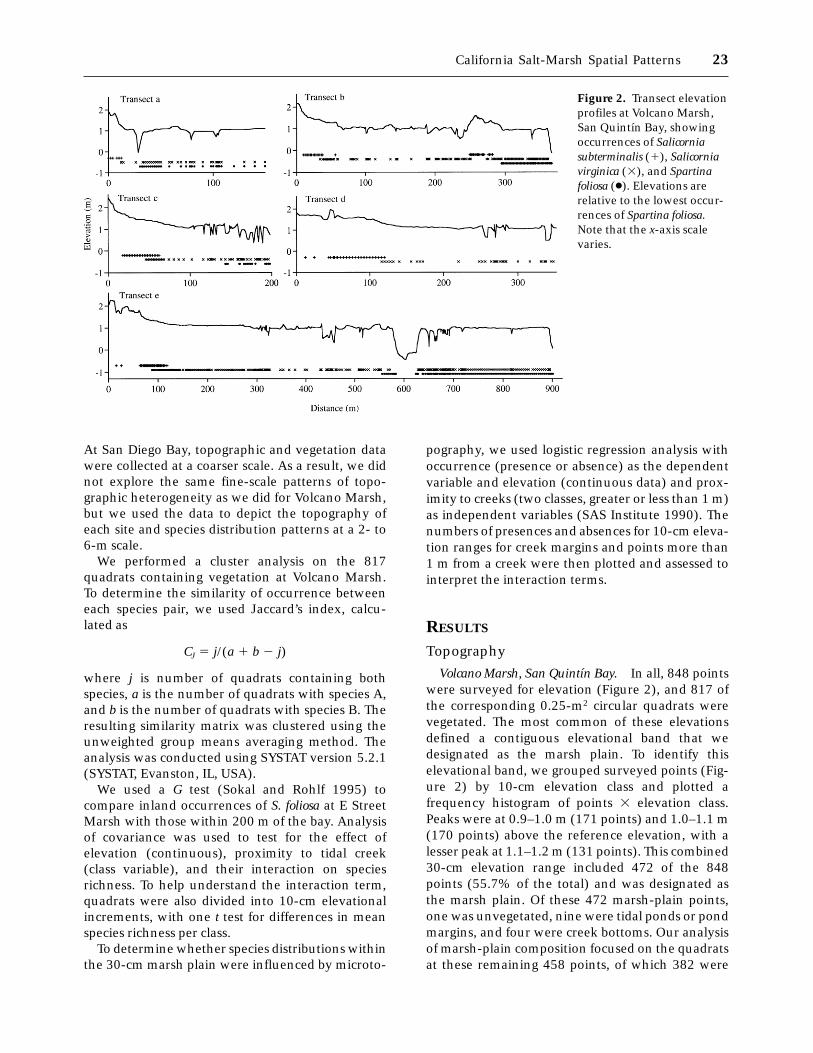
San Diego Bay marshes. All data available fromSweetwater Marsh (Figure 1) were used to charac-terize its marsh plain. The marsh cross-sections(Figure 3) show that Sweetwater Marsh and Para-dise Creek Marsh are predominantly flat with topo-graphic variation due mostly to tidal channels. As atVolcano Marsh, we identified 30-cm bands as therespective marsh plains. At Sweetwater Marsh,53.1% of the points sampled occurred with a 0.7- to1.0-m NGVD elevation range, and at Paradise Creek90.3% of the points occurred within a 0.6- to 0.9-mNGVD elevation range, whereas at E Street Marsh,66.6% of the survey points occurred within a 40-cmband from 0.7 to 1.1 m NGVD. Using the majority ofpoints to define a marsh plain is somewhat artificialwhen different elevation ranges are sampled (SanDiego Bay points are mostly within the marsh,whereas Volcano Marsh points include upland);however, these numbers document that large areasof relatively flat topography occur in all marshesstudied. Also, recall that elevations at Volcano Marshare not tied to sea level, but rather to the lower limitof S. foliosa.
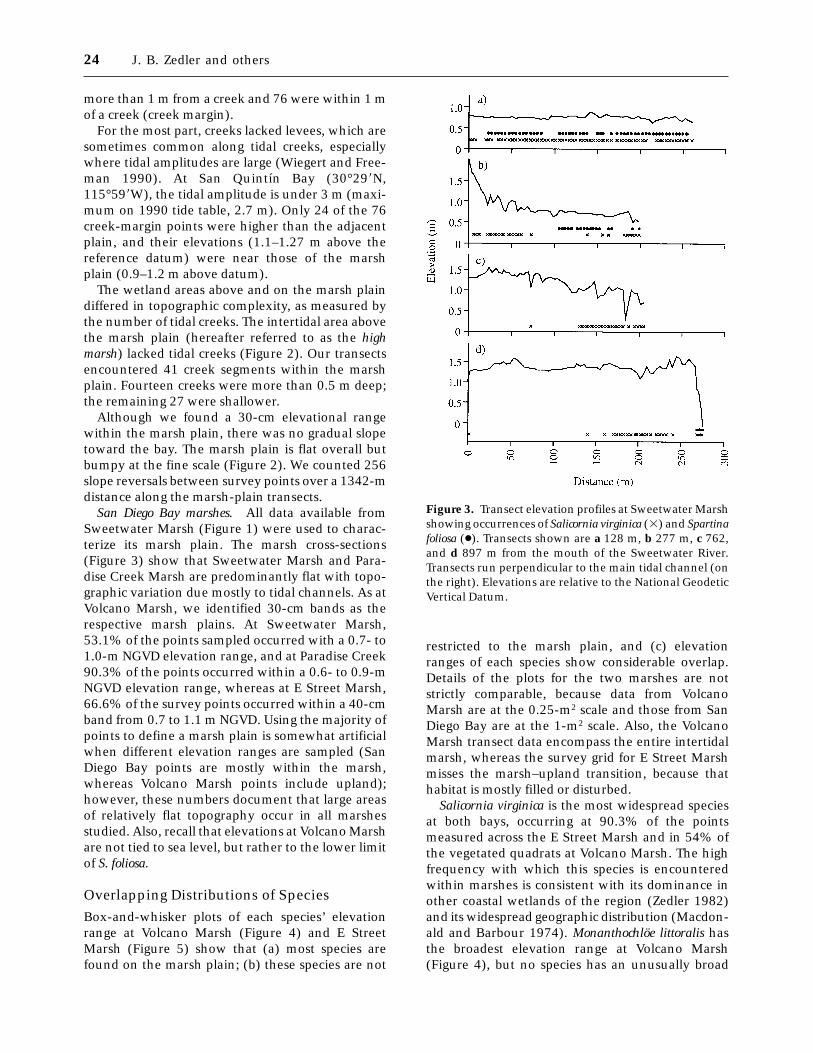
Overlapping Distributions of SpeciesBox-and-whisker plots of each species’ elevationrange at Volcano Marsh (Figure 4) and E StreetMarsh (Figure 5) show that (a) most species arefound on the marsh plain; (b) these species are not
restricted to the marsh plain, and (c) elevationranges of each species show considerable overlap.Details of the plots for the two marshes are notstrictly comparable, because data from VolcanoMarsh are at the 0.25-m2 scale and those from SanDiego Bay are at the 1-m2 scale. Also, the VolcanoMarsh transect data encompass the entire intertidalmarsh, whereas the survey grid for E Street Marshmisses the marsh–upland transition, because thathabitat is mostly filled or disturbed.
Salicornia virginica is the most widespread speciesat both bays, occurring at 90.3% of the pointsmeasured across the E Street Marsh and in 54% ofthe vegetated quadrats at Volcano Marsh. The highfrequency with which this species is encounteredwithin marshes is consistent with its dominance inother coastal wetlands of the region (Zedler 1982)and its widespread geographic distribution (Macdon-ald and Barbour 1974). Monanthochloe littoralis hasthe broadest elevation range at Volcano Marsh(Figure 4), but no species has an unusually broad
Figure 3. Transect elevation profiles at Sweetwater Marshshowing occurrences of Salicornia virginica (3) and Spartinafoliosa (●). Transects shown are a 128 m, b 277 m, c 762,and d 897 m from the mouth of the Sweetwater River.Transects run perpendicular to the main tidal channel (onthe right). Elevations are relative to the National GeodeticVertical Datum.
24 J. B. Zedler and others
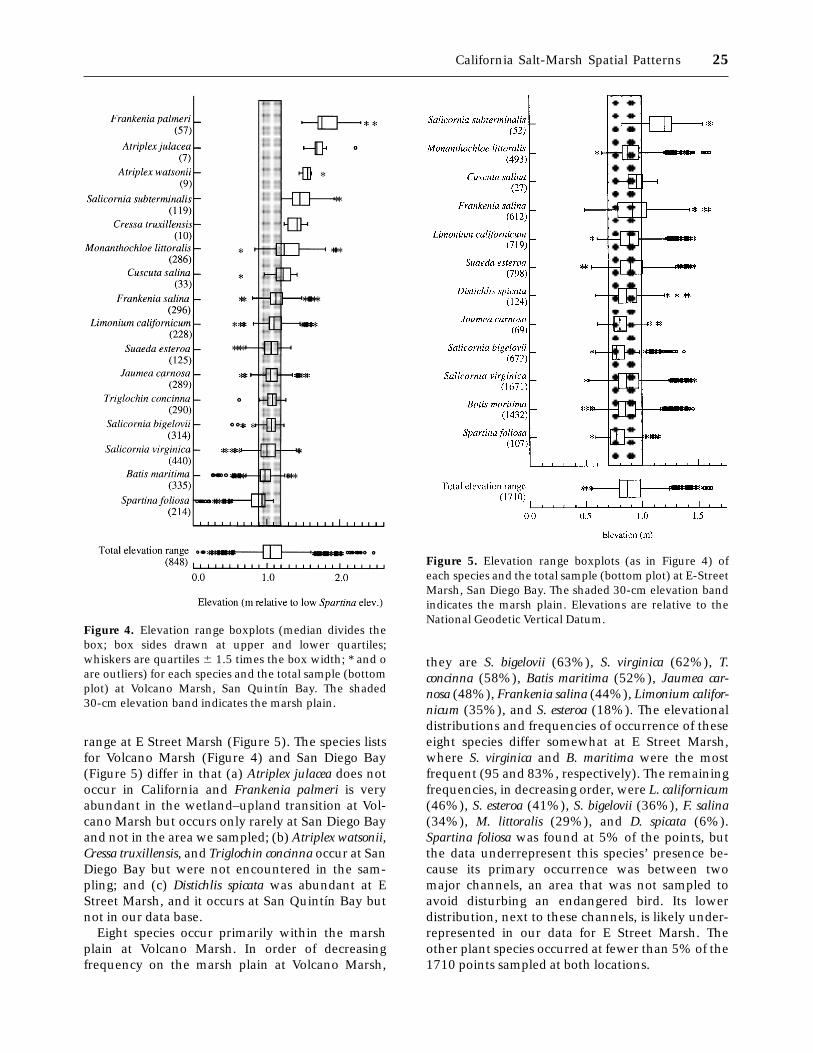
range at E Street Marsh (Figure 5). The species listsfor Volcano Marsh (Figure 4) and San Diego Bay(Figure 5) differ in that (a) Atriplex julacea does notoccur in California and Frankenia palmeri is veryabundant in the wetland–upland transition at Vol-cano Marsh but occurs only rarely at San Diego Bayand not in the area we sampled; (b) Atriplex watsonii,Cressa truxillensis, and Triglochin concinna occur at SanDiego Bay but were not encountered in the sam-pling; and (c) Distichlis spicata was abundant at EStreet Marsh, and it occurs at San Quintın Bay butnot in our data base.
Eight species occur primarily within the marshplain at Volcano Marsh. In order of decreasingfrequency on the marsh plain at Volcano Marsh,
they are S. bigelovii (63%), S. virginica (62%), T.concinna (58%), Batis maritima (52%), Jaumea car-nosa (48%), Frankenia salina (44%), Limonium califor-nicum (35%), and S. esteroa (18%). The elevationaldistributions and frequencies of occurrence of theseeight species differ somewhat at E Street Marsh,where S. virginica and B. maritima were the mostfrequent (95 and 83%, respectively). The remainingfrequencies, in decreasing order, were L. californicum(46%), S. esteroa (41%), S. bigelovii (36%), F. salina(34%), M. littoralis (29%), and D. spicata (6%).Spartina foliosa was found at 5% of the points, butthe data underrepresent this species’ presence be-cause its primary occurrence was between twomajor channels, an area that was not sampled toavoid disturbing an endangered bird. Its lowerdistribution, next to these channels, is likely under-represented in our data for E Street Marsh. Theother plant species occurred at fewer than 5% of the1710 points sampled at both locations.
Figure 4. Elevation range boxplots (median divides thebox; box sides drawn at upper and lower quartiles;whiskers are quartiles 6 1.5 times the box width; * and oare outliers) for each species and the total sample (bottomplot) at Volcano Marsh, San Quintın Bay. The shaded30-cm elevation band indicates the marsh plain.
Figure 5. Elevation range boxplots (as in Figure 4) ofeach species and the total sample (bottom plot) at E-StreetMarsh, San Diego Bay. The shaded 30-cm elevation bandindicates the marsh plain. Elevations are relative to theNational Geodetic Vertical Datum.
California Salt-Marsh Spatial Patterns 25
The vertical distribution patterns of Figures 4 and5 suggest a gradient or continuum model ratherthan discrete associations, as species did not sort outby elevation. The strongest vertical pattern is therestriction of S. subterminalis to the high marsh andthe extension of S. foliosa occurrences beyond thoseof other species. Spartina foliosa occurred by itselfwithin 0.25-m2 quadrats only once on the marshplain; all other pure quadrats of S. foliosa were below0.9-m elevation.
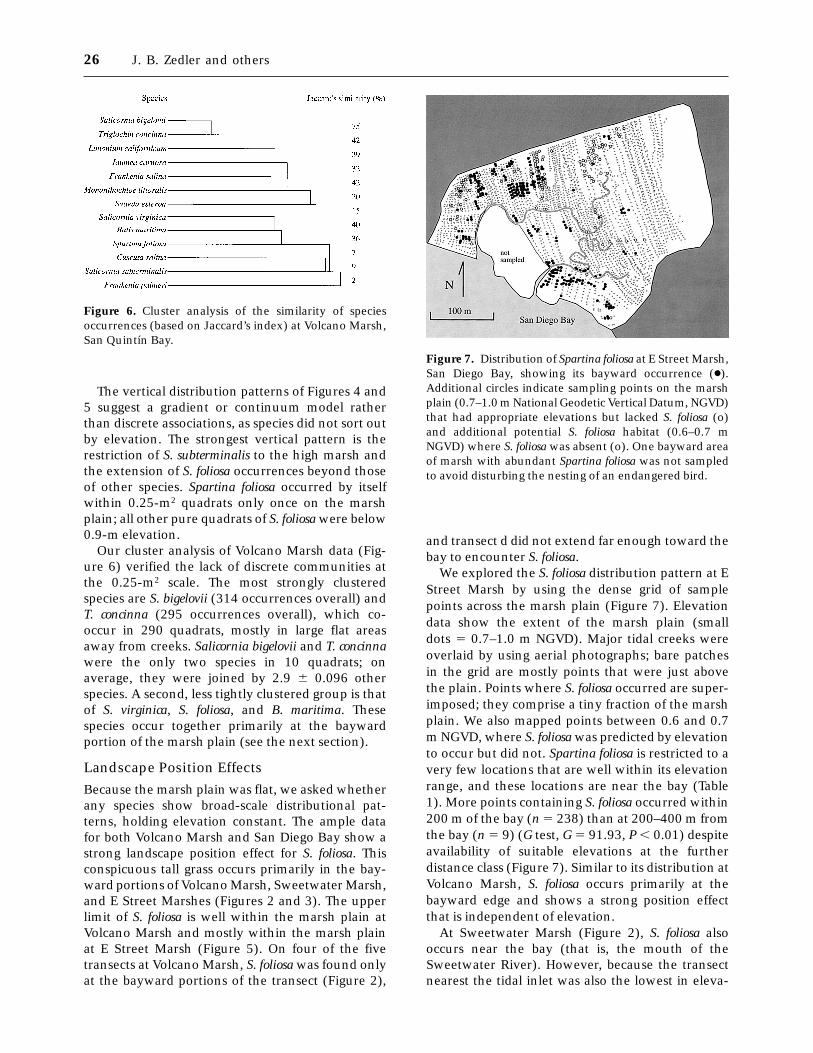
Our cluster analysis of Volcano Marsh data (Fig-ure 6) verified the lack of discrete communities atthe 0.25-m2 scale. The most strongly clusteredspecies are S. bigelovii (314 occurrences overall) andT. concinna (295 occurrences overall), which co-occur in 290 quadrats, mostly in large flat areasaway from creeks. Salicornia bigelovii and T. concinnawere the only two species in 10 quadrats; onaverage, they were joined by 2.9 6 0.096 otherspecies. A second, less tightly clustered group is thatof S. virginica, S. foliosa, and B. maritima. Thesespecies occur together primarily at the baywardportion of the marsh plain (see the next section).
Landscape Position EffectsBecause the marsh plain was flat, we asked whetherany species show broad-scale distributional pat-terns, holding elevation constant. The ample datafor both Volcano Marsh and San Diego Bay show astrong landscape position effect for S. foliosa. Thisconspicuous tall grass occurs primarily in the bay-ward portions of Volcano Marsh, Sweetwater Marsh,and E Street Marshes (Figures 2 and 3). The upperlimit of S. foliosa is well within the marsh plain atVolcano Marsh and mostly within the marsh plainat E Street Marsh (Figure 5). On four of the fivetransects at Volcano Marsh, S. foliosa was found onlyat the bayward portions of the transect (Figure 2),
and transect d did not extend far enough toward thebay to encounter S. foliosa.
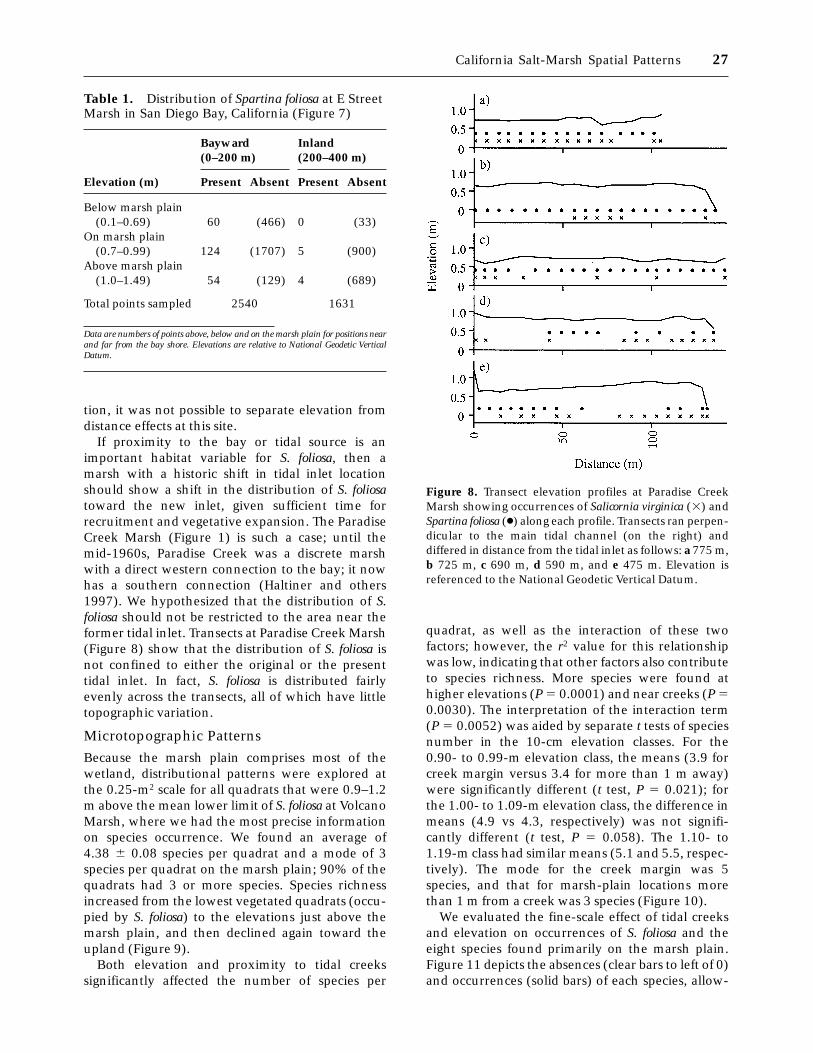
We explored the S. foliosa distribution pattern at EStreet Marsh by using the dense grid of samplepoints across the marsh plain (Figure 7). Elevationdata show the extent of the marsh plain (smalldots 5 0.7–1.0 m NGVD). Major tidal creeks wereoverlaid by using aerial photographs; bare patchesin the grid are mostly points that were just abovethe plain. Points where S. foliosa occurred are super-imposed; they comprise a tiny fraction of the marshplain. We also mapped points between 0.6 and 0.7m NGVD, where S. foliosa was predicted by elevationto occur but did not. Spartina foliosa is restricted to avery few locations that are well within its elevationrange, and these locations are near the bay (Table1). More points containing S. foliosa occurred within200 m of the bay (n 5 238) than at 200–400 m fromthe bay (n 5 9) (G test, G 5 91.93, P , 0.01) despiteavailability of suitable elevations at the furtherdistance class (Figure 7). Similar to its distribution atVolcano Marsh, S. foliosa occurs primarily at thebayward edge and shows a strong position effectthat is independent of elevation.
At Sweetwater Marsh (Figure 2), S. foliosa alsooccurs near the bay (that is, the mouth of theSweetwater River). However, because the transectnearest the tidal inlet was also the lowest in eleva-
Figure 6. Cluster analysis of the similarity of speciesoccurrences (based on Jaccard’s index) at Volcano Marsh,San Quintın Bay.
Figure 7. Distribution of Spartina foliosa at E Street Marsh,San Diego Bay, showing its bayward occurrence (●).Additional circles indicate sampling points on the marshplain (0.7–1.0 m National Geodetic Vertical Datum, NGVD)that had appropriate elevations but lacked S. foliosa (o)and additional potential S. foliosa habitat (0.6–0.7 mNGVD) where S. foliosa was absent (o). One bayward areaof marsh with abundant Spartina foliosa was not sampledto avoid disturbing the nesting of an endangered bird.
26 J. B. Zedler and others
tion, it was not possible to separate elevation fromdistance effects at this site.
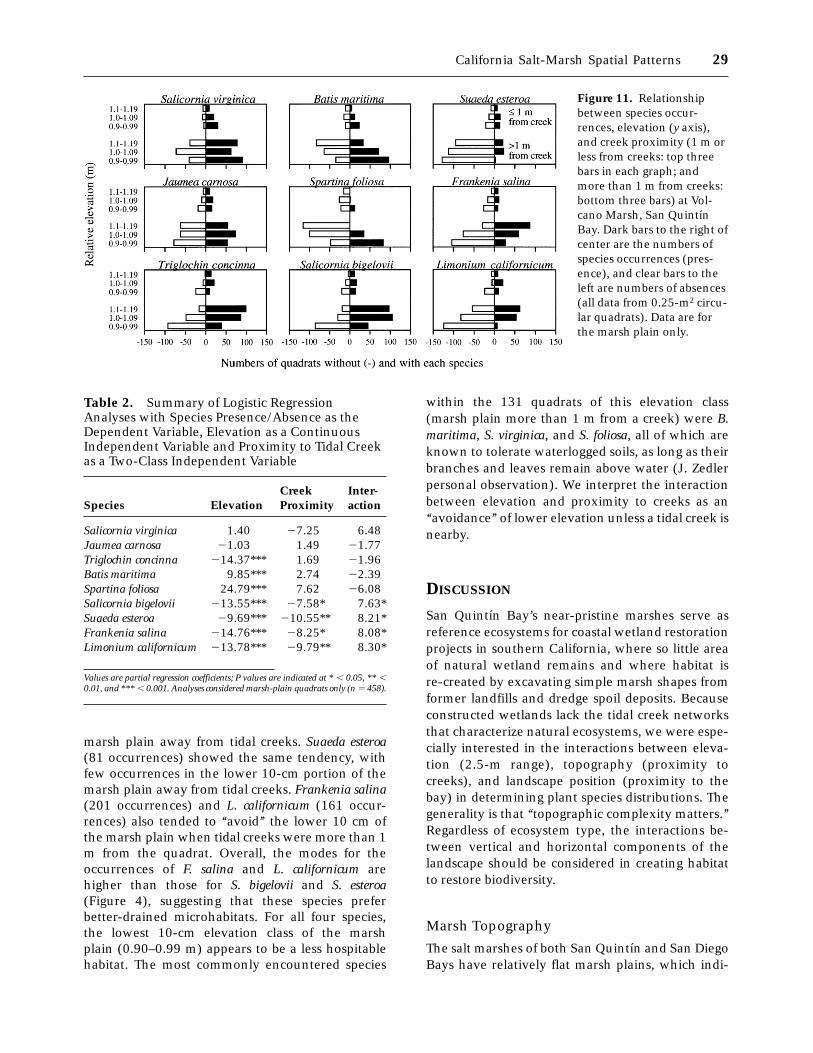
If proximity to the bay or tidal source is animportant habitat variable for S. foliosa, then amarsh with a historic shift in tidal inlet locationshould show a shift in the distribution of S. foliosatoward the new inlet, given sufficient time forrecruitment and vegetative expansion. The ParadiseCreek Marsh (Figure 1) is such a case; until themid-1960s, Paradise Creek was a discrete marshwith a direct western connection to the bay; it nowhas a southern connection (Haltiner and others1997). We hypothesized that the distribution of S.foliosa should not be restricted to the area near theformer tidal inlet. Transects at Paradise Creek Marsh(Figure 8) show that the distribution of S. foliosa isnot confined to either the original or the presenttidal inlet. In fact, S. foliosa is distributed fairlyevenly across the transects, all of which have littletopographic variation.
Microtopographic PatternsBecause the marsh plain comprises most of thewetland, distributional patterns were explored atthe 0.25-m2 scale for all quadrats that were 0.9–1.2m above the mean lower limit of S. foliosa at VolcanoMarsh, where we had the most precise informationon species occurrence. We found an average of4.38 6 0.08 species per quadrat and a mode of 3species per quadrat on the marsh plain; 90% of thequadrats had 3 or more species. Species richnessincreased from the lowest vegetated quadrats (occu-pied by S. foliosa) to the elevations just above themarsh plain, and then declined again toward theupland (Figure 9).
Both elevation and proximity to tidal creekssignificantly affected the number of species per
quadrat, as well as the interaction of these twofactors; however, the r2 value for this relationshipwas low, indicating that other factors also contributeto species richness. More species were found athigher elevations (P 5 0.0001) and near creeks (P 50.0030). The interpretation of the interaction term(P 5 0.0052) was aided by separate t tests of speciesnumber in the 10-cm elevation classes. For the0.90- to 0.99-m elevation class, the means (3.9 forcreek margin versus 3.4 for more than 1 m away)were significantly different (t test, P 5 0.021); forthe 1.00- to 1.09-m elevation class, the difference inmeans (4.9 vs 4.3, respectively) was not signifi-cantly different (t test, P 5 0.058). The 1.10- to1.19-m class had similar means (5.1 and 5.5, respec-tively). The mode for the creek margin was 5species, and that for marsh-plain locations morethan 1 m from a creek was 3 species (Figure 10).
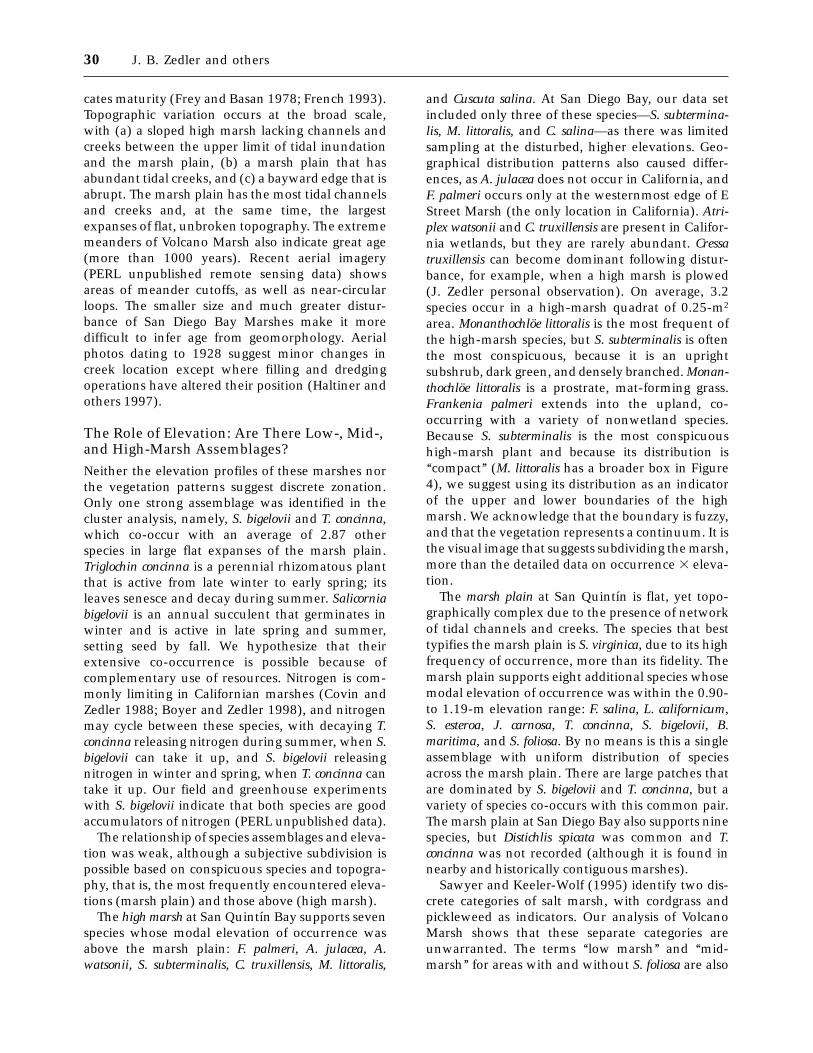
We evaluated the fine-scale effect of tidal creeksand elevation on occurrences of S. foliosa and theeight species found primarily on the marsh plain.Figure 11 depicts the absences (clear bars to left of 0)and occurrences (solid bars) of each species, allow-
Table 1. Distribution of Spartina foliosa at E StreetMarsh in San Diego Bay, California (Figure 7)
Elevation (m)
Bayward(0–200 m)
Inland(200–400 m)
Present Absent Present Absent
Below marsh plain(0.1–0.69) 60 (466) 0 (33)
On marsh plain(0.7–0.99) 124 (1707) 5 (900)
Above marsh plain(1.0–1.49) 54 (129) 4 (689)
Total points sampled 2540 1631
Data are numbers of points above, below and on the marsh plain for positions nearand far from the bay shore. Elevations are relative to National Geodetic VerticalDatum.
Figure 8. Transect elevation profiles at Paradise CreekMarsh showing occurrences of Salicornia virginica (3) andSpartina foliosa (●) along each profile. Transects ran perpen-dicular to the main tidal channel (on the right) anddiffered in distance from the tidal inlet as follows: a 775 m,b 725 m, c 690 m, d 590 m, and e 475 m. Elevation isreferenced to the National Geodetic Vertical Datum.
California Salt-Marsh Spatial Patterns 27

ing a clear view of sample size and proportion ofquadrats occupied. Data are separated for quadratswithin 1 m of a creek (top three bars) and furtheraway (bottom three bars) and within three eleva-tion classes. Displaying occurrences by both proxim-ity to creeks and elevation suggested patterns witheach factor, as well as interactions between them.The interaction between elevation and creek prox-imity was of particular interest to the restorationissue of where to plant species in sites that lacktopographic heterogeneity and whether restorationprojects should incorporate fine-scale heterogene-ity.
We hypothesized that species would shift theirdistributions downslope near creeks, based on in-creased species richness in the 0.90- to 0.99-melevation class. Logistic regressions on these data(Table 2) identified four patterns: (a) Two species (S.virginica and J. carnosa) lacked pattern with eleva-tion and/or proximity to tidal creeks. Both speciesare widespread across the region (PERL 1990) andwere two of the most common species at theVolcano Marsh (285 occurrences out of 458 quad-rats for S. virginica and 221 occurrences for J.carnosa). (b) No species was influenced by creekmargin independently of elevation. (c) Three spe-
cies (T. concinna, B. maritima, and S. foliosa) wereinfluenced by elevation and not position (Figure 11and Table 2). Triglochin concinna (265 occurrences)and B. maritima (238 occurrences) were both abun-dant. Batis maritima may be more tolerant of water-logging than T. concinna, as it was more frequentlyencountered lower on the marsh plain (Figure 4),while T. concinna shows the opposite trend. (d)Spartina foliosa (131 occurrences) occurred belowthe marsh plain (Figure 4), where it often wasthe only species present. In the logistic regressionanalysis of marsh-plain quadrats, it occurred mostoften in the lower third of the 30-cm elevationrange.
Four species (S. bigelovii, S. esteroa, F. salina, and L.californicum) had distributions related to both eleva-tion and creek margin, with significant interactionsbetween these two factors (Figure 11). Salicorniabigelovii (289 occurrences) was the most commonlyencountered species on the marsh plain, and itsdistribution was strongly influenced by both eleva-tion and microtopographic position (Table 2). Itoccurred more often in the upper 20 cm of the
Figure 9. Relationship between species richness andelevation at Volcano Marsh. Marsh-plain elevations aremidpoints of 10-cm elevation classes, relative to the meanlower limit of Spartina foliosa. The marsh plain includesclasses labeled 0.95–1.15; high marsh includes 1.25–2.05;the higher elevations are upland.
Figure 10. Frequency distribution of species richnessoccurring near (1 m or less) and away from (more than 1m) tidal creeks on the 30-cm marsh plain. Means weresimilar: 4.5 6 0.2 (n 5 76) and 4.4 6 0.08 (n 5 382),respectively, but not when quadrats were sorted by 10-cmelevation class (see the text).
28 J. B. Zedler and others
marsh plain away from tidal creeks. Suaeda esteroa(81 occurrences) showed the same tendency, withfew occurrences in the lower 10-cm portion of themarsh plain away from tidal creeks. Frankenia salina(201 occurrences) and L. californicum (161 occur-rences) also tended to ‘‘avoid’’ the lower 10 cm ofthe marsh plain when tidal creeks were more than 1m from the quadrat. Overall, the modes for theoccurrences of F. salina and L. californicum arehigher than those for S. bigelovii and S. esteroa(Figure 4), suggesting that these species preferbetter-drained microhabitats. For all four species,the lowest 10-cm elevation class of the marshplain (0.90–0.99 m) appears to be a less hospitablehabitat. The most commonly encountered species
within the 131 quadrats of this elevation class(marsh plain more than 1 m from a creek) were B.maritima, S. virginica, and S. foliosa, all of which areknown to tolerate waterlogged soils, as long as theirbranches and leaves remain above water (J. Zedlerpersonal observation). We interpret the interactionbetween elevation and proximity to creeks as an‘‘avoidance’’ of lower elevation unless a tidal creek isnearby.
DISCUSSION
San Quintın Bay’s near-pristine marshes serve asreference ecosystems for coastal wetland restorationprojects in southern California, where so little areaof natural wetland remains and where habitat isre-created by excavating simple marsh shapes fromformer landfills and dredge spoil deposits. Becauseconstructed wetlands lack the tidal creek networksthat characterize natural ecosystems, we were espe-cially interested in the interactions between eleva-tion (2.5-m range), topography (proximity tocreeks), and landscape position (proximity to thebay) in determining plant species distributions. Thegenerality is that ‘‘topographic complexity matters.’’Regardless of ecosystem type, the interactions be-tween vertical and horizontal components of thelandscape should be considered in creating habitatto restore biodiversity.
Marsh Topography
The salt marshes of both San Quintın and San DiegoBays have relatively flat marsh plains, which indi-
Figure 11. Relationshipbetween species occur-rences, elevation (y axis),and creek proximity (1 m orless from creeks: top threebars in each graph; andmore than 1 m from creeks:bottom three bars) at Vol-cano Marsh, San QuintınBay. Dark bars to the right ofcenter are the numbers ofspecies occurrences (pres-ence), and clear bars to theleft are numbers of absences(all data from 0.25-m2 circu-lar quadrats). Data are forthe marsh plain only.
Table 2. Summary of Logistic RegressionAnalyses with Species Presence/Absence as theDependent Variable, Elevation as a ContinuousIndependent Variable and Proximity to Tidal Creekas a Two-Class Independent Variable
Species ElevationCreekProximity
Inter-action
Salicornia virginica 1.40 27.25 6.48Jaumea carnosa 21.03 1.49 21.77Triglochin concinna 214.37*** 1.69 21.96Batis maritima 9.85*** 2.74 22.39Spartina foliosa 24.79*** 7.62 26.08Salicornia bigelovii 213.55*** 27.58* 7.63*Suaeda esteroa 29.69*** 210.55** 8.21*Frankenia salina 214.76*** 28.25* 8.08*Limonium californicum 213.78*** 29.79** 8.30*
Values are partial regression coefficients; P values are indicated at * , 0.05, ** ,0.01, and *** , 0.001. Analyses considered marsh-plain quadrats only (n 5 458).
California Salt-Marsh Spatial Patterns 29
cates maturity (Frey and Basan 1978; French 1993).Topographic variation occurs at the broad scale,with (a) a sloped high marsh lacking channels andcreeks between the upper limit of tidal inundationand the marsh plain, (b) a marsh plain that hasabundant tidal creeks, and (c) a bayward edge that isabrupt. The marsh plain has the most tidal channelsand creeks and, at the same time, the largestexpanses of flat, unbroken topography. The extrememeanders of Volcano Marsh also indicate great age(more than 1000 years). Recent aerial imagery(PERL unpublished remote sensing data) showsareas of meander cutoffs, as well as near-circularloops. The smaller size and much greater distur-bance of San Diego Bay Marshes make it moredifficult to infer age from geomorphology. Aerialphotos dating to 1928 suggest minor changes increek location except where filling and dredgingoperations have altered their position (Haltiner andothers 1997).
The Role of Elevation: Are There Low-, Mid-,and High-Marsh Assemblages?Neither the elevation profiles of these marshes northe vegetation patterns suggest discrete zonation.Only one strong assemblage was identified in thecluster analysis, namely, S. bigelovii and T. concinna,which co-occur with an average of 2.87 otherspecies in large flat expanses of the marsh plain.Triglochin concinna is a perennial rhizomatous plantthat is active from late winter to early spring; itsleaves senesce and decay during summer. Salicorniabigelovii is an annual succulent that germinates inwinter and is active in late spring and summer,setting seed by fall. We hypothesize that theirextensive co-occurrence is possible because ofcomplementary use of resources. Nitrogen is com-monly limiting in Californian marshes (Covin andZedler 1988; Boyer and Zedler 1998), and nitrogenmay cycle between these species, with decaying T.concinna releasing nitrogen during summer, when S.bigelovii can take it up, and S. bigelovii releasingnitrogen in winter and spring, when T. concinna cantake it up. Our field and greenhouse experimentswith S. bigelovii indicate that both species are goodaccumulators of nitrogen (PERL unpublished data).
The relationship of species assemblages and eleva-tion was weak, although a subjective subdivision ispossible based on conspicuous species and topogra-phy, that is, the most frequently encountered eleva-tions (marsh plain) and those above (high marsh).
The high marsh at San Quintın Bay supports sevenspecies whose modal elevation of occurrence wasabove the marsh plain: F. palmeri, A. julacea, A.watsonii, S. subterminalis, C. truxillensis, M. littoralis,
and Cuscuta salina. At San Diego Bay, our data setincluded only three of these species—S. subtermina-lis, M. littoralis, and C. salina—as there was limitedsampling at the disturbed, higher elevations. Geo-graphical distribution patterns also caused differ-ences, as A. julacea does not occur in California, andF. palmeri occurs only at the westernmost edge of EStreet Marsh (the only location in California). Atri-plex watsonii and C. truxillensis are present in Califor-nia wetlands, but they are rarely abundant. Cressatruxillensis can become dominant following distur-bance, for example, when a high marsh is plowed(J. Zedler personal observation). On average, 3.2species occur in a high-marsh quadrat of 0.25-m2
area. Monanthochloe littoralis is the most frequent ofthe high-marsh species, but S. subterminalis is oftenthe most conspicuous, because it is an uprightsubshrub, dark green, and densely branched. Monan-thochloe littoralis is a prostrate, mat-forming grass.Frankenia palmeri extends into the upland, co-occurring with a variety of nonwetland species.Because S. subterminalis is the most conspicuoushigh-marsh plant and because its distribution is‘‘compact’’ (M. littoralis has a broader box in Figure4), we suggest using its distribution as an indicatorof the upper and lower boundaries of the highmarsh. We acknowledge that the boundary is fuzzy,and that the vegetation represents a continuum. It isthe visual image that suggests subdividing the marsh,more than the detailed data on occurrence 3 eleva-tion.
The marsh plain at San Quintın is flat, yet topo-graphically complex due to the presence of networkof tidal channels and creeks. The species that besttypifies the marsh plain is S. virginica, due to its highfrequency of occurrence, more than its fidelity. Themarsh plain supports eight additional species whosemodal elevation of occurrence was within the 0.90-to 1.19-m elevation range: F. salina, L. californicum,S. esteroa, J. carnosa, T. concinna, S. bigelovii, B.maritima, and S. foliosa. By no means is this a singleassemblage with uniform distribution of speciesacross the marsh plain. There are large patches thatare dominated by S. bigelovii and T. concinna, but avariety of species co-occurs with this common pair.The marsh plain at San Diego Bay also supports ninespecies, but Distichlis spicata was common and T.concinna was not recorded (although it is found innearby and historically contiguous marshes).
Sawyer and Keeler-Wolf (1995) identify two dis-crete categories of salt marsh, with cordgrass andpickleweed as indicators. Our analysis of VolcanoMarsh shows that these separate categories areunwarranted. The terms ‘‘low marsh’’ and ‘‘mid-marsh’’ for areas with and without S. foliosa are also
30 J. B. Zedler and others

inappropriate, because (a) S. foliosa rarely occurs byitself; rather it overlaps with S. virginica and B.maritima, both of which extend across the marshplain; and (b) areas with and without S. foliosa arenot fully differentiated by elevation. Rather, S.foliosa shows a position effect: it occurs near the bay,a pattern that is seen throughout California. Werecognize that S. foliosa is a very conspicuous speciesand that its boundaries can sometimes be discrete,owing to its vegetative growth via rhizomes. Thedistribution and characterization of habitat occu-pied by S. foliosa are also of interest, because this tallgrass provides suitable nesting habitat for an endan-gered bird, the light-footed clapper rail (Zedler1993). Managers charged with recovering nestingpopulations need information on the extent of thishabitat, as well as an appropriate name. We suggesta subjective name as an alternative to ‘‘low marsh’’ forareas with S. foliosa, namely, cordgrass habitat. If aterm is needed for the areas of pure S. foliosa (whichare relatively rare), we suggest pure cordgrass. Spartinafoliosa occurs by itself only on creek banks, baymargins, and deeper tidal pools. Our proposed termsdecouple the vegetation from elevation, as ouranalysis suggests.
The Role of Landscape PositionOne species, S. foliosa, displayed a strong spatialpattern at both Volcano Marsh and San Diego Bay.Although the distribution of S. foliosa is stronglyinfluenced by elevation (Figure 11), its occurrencecannot be predicted by elevation alone. At bothlocations, S. foliosa is restricted to the baywardportion of the marsh. Several factors probably con-tribute to the restriction of S. foliosa to the baywardportion. We propose two hypotheses that mayoperate simultaneously: (a) slow-expansion hypoth-esis and (b) environmental-restriction hypothesis.
In the slow-expansion hypothesis, S. foliosa distri-butions are primarily due to establishment patterns.Spartina foliosa establishes best at creek banks or bayedges and then grows inland, impeded by the highlycompetitive S. virginica (Covin and Zedler 1988;Zedler and others 1992). Spartina foliosa spreadseffectively by rhizomes but rarely reproduces fromseed in southern California; it recruits episodicallyfollowing flooding that lowers soil salinity (Zedler1986). In the environmental-restriction hypothesis,S. foliosa distribution patterns are due to the species’low tolerance for environmental conditions of theinterior portion of the marsh plain. This habitat mayexperience reduced tidal influence (tidal attenua-tion), as water movement across the marsh surfaceis slowed by vegetation (Van der Molen 1997) andmore waterlogging, due to slow drainage. We favor
the hypothesis that the species is establishmentlimited and dispersal limited, with seeds more abun-dant along the shore and rare recruitment eventslimited to the bayward edge of the marsh. Clonalgrowth proceeds slowly in the face of competitionwith S. virginica and other marsh-plain dominants.
The distribution of S. foliosa at Paradise Creek will,in time, help test these models. If the restriction of S.foliosa to bayward locations is a function of creek-bank establishment and slow vegetative spread, thebroad spatial distribution of S. foliosa at ParadiseCreek Marsh should persist. If the bayward patternrelates to inhospitable environment, S. foliosa occur-rences at the former inlet to Paradise Creek shoulddecline as the creek-bank habitat continues to fill inand shift to a marsh plain. Experimental tests aredifficult, because S. foliosa establishment events arerare (Zedler 1986), vegetative spread is slow inmature marshes (Zedler and others 1992), andclearing of vegetation is discouraged in southernCalifornia’s highly managed wetlands.
The Role of Tidal CreeksTidal creek networks are of significance to marshvegetation. In our study at Volcano Marsh, creekmargins tended to have more species at the lowestelevation (0.90–0.99 m; Figure 10). This was due tothe extension of several species to these lowerelevations rather than the effect of any singlespecies. No species is confined to, or completelyavoids, creek margins. In San Pablo Bay marshes(northern San Francisco Bay), Zhang and colleagues(1997) found higher species diversity closer tochannels and at sites with low salinity. However,these authors differentiate zones dominated by S.foliosa and S. virginica, and they relate zones to majordifferences in tidal inundation (daily and monthly,respectively). The broader-scale environmental dif-ferences they document do not explain the fine-scale patterns of occurrence that we found withinthe marsh plain.
Plant distribution patterns at Volcano Marsh mayrelate to greater recruitment near creeks. This maybe due to increased tidal deposition of seeds nearcreek margins, an idea supported by Hopkins andParker (1984) who found increased seed-bank diver-sity along tidal channels in a northern San FranciscoBay marsh. Additional factors that may contributeto increased recruitment of species along creekmargins include greater wrack deposition alongcreeks, creating canopy gaps that increase chancesof seedling establishment. Better drainage near creekmargins may also lead to increased recruitment.Other comparisons of marsh vegetation and creekproximity suggest that creeks reduce environmental
California Salt-Marsh Spatial Patterns 31
stress. Balling and Resh (1983) studied two marshesin San Francisco Bay and found greater seasonalincreases in biomass of S. virginica next to mosquitoditches in Petaluma Marsh and more species next tomosquito ditches in Suisin Marsh. Using groundwa-ter wells, they showed that ditching lowered soilsalinity, which helped explain the vegetation differ-ences (Balling and Resh 1983). However, the distri-butional patterns are not quantified. They did findJuncus species displacing S. virginica next to creeks.Elsewhere, creekside habitats of Atlantic Coastmarshes have more robust S. alterniflora than nearbymarsh plains (Howes and others 1981; Chalmers1982), and crabs, which are most abundant neartidal creeks, have been reported to improve thegrowth of S. alterniflora by aerating the soil (Bertness1985). A few studies show environmental differ-ences adjacent to creeks. Nestler (1977) calls atten-tion to salinity differences; others emphasize aera-tion or nitrogen, and Chalmers (1982) relatesimproved S. alterniflora growth to several factors.
Our analysis of marsh-plain microhabitats away(more than 1 m) from creeks showed that fourspecies tend to avoid the lower portion of this 30-cmelevation range: F. salina, L. californicum, S. esteroa,and S. bigelovii. We hypothesize that this is due tophysiologically stressful conditions related to water-logging in these microtopographic depressions. Stud-ies of freshwater wetland vegetation have shownthat small differences in microtopography result indistinct differences in vegetation composition [forexample, see Collins and others (1982), Titus (1990),and Vivian-Smith (1997)], with a complex of factorsthat include drought incidence, redox potential, andmoisture levels, differing with microtopographicposition (Ehrenfeld 1995). These differences arealso likely in salt-marsh habitats, along with varia-tion in salinity, due to differential waterlogging anddrainage patterns. Sedimentation rates and sedi-ment characteristics may also vary with microtopo-graphic location [see Adam (1990)]. It is likely thatlower elevations on the marsh-plain experience thecombined stresses of increased waterlogging (andlower redox potentials) and continuous hypersalin-ity, thus altering the elevational distribution ofspecies on the marsh plain. Predictions of speciesoccurrence must take into account both elevationand proximity to tidal creeks.
Landscape position and topographic complexityare not necessarily independent factors. Two scalesof heterogeneity interact to explain one species’distribution in British marshes: Puccinellia is gener-ally found in hollows and Festuca on hummocks, butAgrostis occurs on the edges of humps at lowerelevations and in hollows at high elevation (Gray
and Scott 1977). Interactions between broad-scaleand fine-scale patterns are also known for riversystems, where Osborne and Wiley (1992) haveshown that the location of a small stream within atributary system explains more of the variability infreshwater fish species richness than stream order(and drainage area). First-order streams locatedlower in a drainage network and feeding into a mainchannel had significantly more species than first-order streams located in the headwaters of thenetwork. Rather than following the ‘‘river con-tinuum’’ (Vannote and others 1980), species distri-butions in some freshwater streams and tidalmarshes suggest that a particular habitat type (streamorder or intertidal elevation) will have differentspecies composition depending on where it is lo-cated within the landscape.
CONCLUSIONS
We propose that three terms be used to describehabitats within southern Californian marshes. (a)The high marsh is the relatively narrow wetlandmargin with S. subterminalis as an indicator species.The upper and lower boundaries of this habitat arefuzzy, because the vegetation changes along a con-tinuum. (b) The marsh plain is the extensive 30-cmelevation band that is virtually flat, except wheredissected by tidal channels and creeks. Salicorniavirginica is the most widespread species of the marshplain. (c) Cordgrass habitat is a better term than ‘‘lowmarsh’’ for the areas dominated by Spartina foliosa.The distribution of S. foliosa is related to elevation,but the species occurs only within the bayward edgeof the marsh, that is, there is a strong landscapeposition effect. Spartina foliosa co-occurs with otherspecies on the marsh plain; hence, areas with S.foliosa should not be named by elevation. Only thepure patches of S. foliosa are distinguishable byelevation.
Frankenia salina, L. californicum, S. esteroa, and S.bigelovii have reduced frequency of occurrence inthe lowest 10-cm elevation class of the marsh plainwhere tidal creeks are more than 1 m away. Thereare significant interactions between their occur-rence with elevation and proximity to tidal creeks.We hypothesize that waterlogging is responsible,and that better-drained creek margins can supportthese species more effectively, leading to increasedspecies richness.
We conclude that elevation is a useful, but incom-plete, surrogate for environmental conditions. Land-scape position and microtopographic heterogeneityare important confounding variables. Differences inspatial occurrence of salt-marsh halophytes are thus
32 J. B. Zedler and others
to be expected among tidal wetlands that are ofdifferent size, shape, and age.
Management Implications
Information on how topographic complexity (atboth the broad and fine scales) affects species distri-butions needs to be applied to restoration sites.Recent wetland construction designs call for smooth,sloping topography from high marsh to channel (forexample, the recently constructed Oneonta TidalLinkage at Tijuana Estuary), whereas planting rec-ommendations are based on data from the eleva-tional distributions of marsh plants averaged overlarge areas of natural, heterogeneous salt marshes.
This study indicates that elevation ranges in natu-ral marshes overestimate the positions where salt-marsh species are likely to grow in constructedhabitats that lack dense networks of tidal creeks. Werecommend planting species based on their modalelevation of occurrence, rather than the full range ofelevations where the plants can be found in naturalmarshes. Transplantation is often a costly process,because many sites have limited propagule availabil-ity or limitations on establishment. To maximize thegains from plantings, the bulk of the propagulesshould be allocated to the locations where speciesare most likely to survive and where reproduction ismore likely to be robust. Distributions can thenexpand to other microhabitats via seeds or rhi-zomes.
Dense tidal creek networks should be included indesigns for marsh construction, in order to providethe habitat complexity that favors species richness.This recommendation would produce multiple ben-efits in southern California, where tidal creeks arevalued for their support of crabs as food for thelight-footed clapper rail (Jorgensen 1975), as well asfor their support of juvenile killifish (Fundulus parvip-innus) (Desmond 1996).
ACKNOWLEDGMENTS
We are grateful for the help of Dr. Douglas Deut-schman, who assisted with the logistic regressionanalysis, members of pro esteros (S. Ibarra-Obando,C. Sepulvida, P. Flanagan, and B. Massey); whoencouraged and facilitated our study of San QuintınBay wetlands; several students (G. Noe, M. Fellows,J. Johnson, and G. Keer); who helped with fieldsampling; Bruce Nyden, who helped us analyze thedigital data sets; and Dr. Douglas Stow, who super-vised the thesis research that produced the SanDiego Bay data sets.
REFERENCES
Adam P. 1981. The vegetation of British saltmarshes. New Phytol88:143–96.
Adam P. 1990. Saltmarsh ecology. Cambridge: Cambridge Univer-sity Press
Adams DA. 1963. Factors influencing vascular plant zonation inNorth Carolina salt marshes. Ecology 44:445–56.
Balling SS, Resh VH. 1983. The influence of mosquito controlrecirculation ditches on plant biomass, production and compo-sition in two San Francisco Bay salt marshes. Estuarine CoastalShelf Sci 16:151–61.
Beals EW. 1969. Vegetational change along altitudinal gradients.Science 165:981–5.
Bertness MD. 1985. Fiddler crab regulation of Spartina alternifloraproduction on a New England salt marsh. Ecology 66:1042–55.
Bertness MD. 1991a. Interspecific interactions among high marshperennials in a New England salt marsh. Ecology 72:125–37.
Bertness MD. 1991b. Zonation of Spartina patens and Spartinaalterniflora in a New England salt marsh. Ecology 72:138–48.
Bertness MD. 1994. Cooperative and competitive interactions inthe recruitment of marsh elders. Ecology 75:2416–29.
Bertness MD, Yeh SM. 1994. Cooperative and competitiveinteractions in the recruitment of marsh elders. Ecology 75:2416–29.
Boyer KE, Zedler JB. 1998. Effects of nitrogen additions on thevertical structure of a constructed cordgrass marsh. Ecol Appl8:692–705.
Bradshaw BK. 1997. Integrating high resolution digital imageryand digital terrain data for mapping restored salt marsh habitat[MS thesis]. San Diego: San Diego State University.
Brewer JW, Levine JM, Bertness MD. 1997. Effects of biomassremoval and elevation on species richness in a New Englandsalt marsh. Oikos 80:333–41.
Brewster AE. 1996. Utilizing geographic technologies to analyzethe nesting habitat preferences of the Belding’s Savannahsparrow [MS thesis]. San Diego: San Diego State University.
Callaway RM, Jones S, Ferren Jr WR, Parikh A. 1990. Ecology ofa Mediterranean-climate estuarine wetland at Carpinteria,California: plant distributions and soil salinity in the uppermarsh. Can J Bot 68:1139–46.
Chalmers AG. 1982. Soil dynamics and the productivity ofSpartina alterniflora. In: Kennedy VS, editor. Estuarine compari-sons. New York: Academic. p 231–43.
Clewell AF. 1997. Vegetation. In: Coultas CL, Hsieh Y-P, editors.Ecology and management of tidal marshes: a model from theGulf of Mexico. Delray Beach (FL): St Lucie. p 77–109.
Collins SL, Perino JV, Vankat JL. 1982. Woody vegetation andmicrotopography in the bog meadow association of Cedar Bog,a west central Ohio USA fen. Am Midl Nat 108:245–9.
Connell JH. 1961. The effects of competition, predation by Thaislapillus, and other factors on natural populations of the bar-nacle, Balanus balanoides. Ecol Monogr 31:61–104.
Covin JD, Zedler JB. 1988. Nitrogen effects on Spartina foliosa andS. virginica in the salt marsh at Tijuana Estuary, California.Wetlands 8:51–65.
Curtis JT. 1959. The vegetation of Wisconsin. Madison: Univer-sity of Wisconsin Press.
Daubenmire R. 1966. Vegetation: identification of typal commu-nities. Science 151:291–98.
California Salt-Marsh Spatial Patterns 33
Desmond JS. 1996. Species composition and size structure of fishassemblages in relation to tidal creek size in southern Califor-nia coastal wetlands [MS Thesis]. San Diego: San Diego StateUniversity.
Earle JC, Kershaw KA. 1989. Vegetation patterns in James Baycoastal marshes. III. Salinity and elevation as factors influenc-ing plant zonation. Can J Bot 67:2967–74.
Ehrenfeld JG. 1995. Microsite differences in surface substratecharacteristics in Chamaecyparis swamps of the New JerseyPinelands. Wetlands 15:183–9.
Ellison AM. 1987. Effects of competition, disturbance, andherbivory on Salicornia europaea. Ecology 68:576–86.
ERDAS. 1991. ERDAS field guide. Atlanta: ERDAS.
[ESRI] Environmental Systems Research Institute Inc. 1997.ArcView Version 3a. Redlands (CA): ESRI.
French JR. 1993. Numerical simulation of vertical marsh growthand adjustment to accelerated sea-level rise, North Norfolk,U.K. Earth Surface Processes Landforms 18:63–81.
Frenkel RE, Eilers HP, Jefferson CA. 1981. Oregon coastal saltmarsh upper limits and tidal datums. Estuaries 4:198–205.
Frey RW, Basan PB. 1978. Coastal salt marshes. In: Davis Jr RA,editor. Coastal sedimentary environments. New York: Springer-Verlag. p 101–69.
Gray AJ. 1992. Saltmarsh plant ecology: zonation and successionrevisited. In: Allen JR, Pye K, editors. Saltmarshes: morphody-namics, conservation and engineering significance. Cam-bridge: Cambridge University Press. p 63–79.
Gray AJ, Marshall DF, Raybould AF. 1991. A century of evolutionin Spartina anglica. Adv Ecol Res 21:1–62.
Gray AJ, Scott R. 1977. The ecology of Morecambe Bay. VII. Thedistribution of Puccinellia maritima, Festuca rubra and Agrostisstolonifera in the saltmarshes. J Appl Ecol 14:229–41.
Haltiner J, Zedler JB, Boyer KE, Williams GD, Callaway JC. 1997.Influence of physical processes on the design, functioning andevolution of restored tidal wetlands in California (USA).Wetlands Ecol Manage 4:73–91.
Hickman JC, editor. 1993. The Jepson manual: higher plants ofCalifornia. Berkeley: University of California Press.
Hinde HP. 1954. The vertical distribution of salt marsh phanero-gams in relation to tide levels. Ecol Monogr 24:209–25.
Hopkins DR, Parker VT. 1984. A study of the seed bank of a saltmarsh in Northern San Francisco Bay. Am J Bot 71:348–55.
Howes BL, Howarth RW, Teal JM, Valiela I. 1981. Oxidation-reduction potentials in a salt marsh: spatial patterns andinteractions with primary production. Limnol Oceanogr 26:350–60.
Ibarra-Obando S, Poumian-Tapia M. 1992. The saltmarsh vegeta-tion of Punta Banda Estuary, Baja California, Mexico. In:Seeliger U, editor. Coastal plant communities of Latin America.San Diego: Academic. p 201–11.
Jorgensen PD. 1975. Habitat preferences of the light-footedclapper rail in Tijuana Estuary Marsh [MS thesis]. San Diego:San Diego State University.
Macdonald KB. 1990. South San Diego Bay enhancement plan,volume 1/ resource atlas: marine ecological characterization,bay history, and physical environment. San Diego: San DiegoUnified Port District.
Macdonald KB, Barbour M. 1974. Beach and salt marsh vegeta-tion of the North American Pacific coast. In: Reimold R, QueenW, editors. Ecology of halophytes. New York: Academic. p175–233.
Nestler J. 1977. Interstitial salinity as a cause of ecophenicvariation in Spartina alterniflora. Estuarine Coastal Mar Sci5:707–14.
Nixon S. 1982. The ecology of New England high salt marshes: acommunity profile. Washington (DC): Biological Services Pro-gram, US Department of Interior, Fish and Wildlife Service;FWS/OBS-81/55.
Odum WE. 1988. Comparative ecology of tidal freshwater andsalt marshes. Annu Rev Ecol Syst 19:147–76.
Osborne LL, Wiley MJ. 1992. Influence of tributary spatialposition on the structure of warmwater fish communities. CanJ Fish Aquat Sci 49:671–81.
Pennings SC, Callaway RM. 1992. Salt marsh plant zonation: therelative importance of competition and physical factors. Ecol-ogy 73:681–90.
[PERL] Pacific Estuarine Research Laboratory. 1990. A manualfor assessing restored and natural coastal wetlands with ex-amples from southern California. La Jolla (CA): Report T-CSGCP-021, California Sea Grant.
Pielou EC, Routledge RD. 1976. Salt marsh vegetation: latitudi-nal gradients in the zonation patterns. Oecologia (Berl) 24:311–21.
Randerson PF. 1979. A simulation model of salt-marsh develop-ment and plant ecology. In: Knights B, Phillips AJ, editors.Estuarine and coastal land reclamation and water storage.Farnborough (UK): Saxon House. p 48–67.
Ricketts EF, Calvin J. 1968. Between Pacific tides. Stanford:Stanford University Press.
Russell PJ, Flowers TJ, Hutchings MJ. 1985. Comparison of nichebreadths and overlaps of halophytes in salt marshes of differingdiversity. Vegetatio 61:171–8.
Sanchez JM, Izco J, Medrano M. 1996. Relationships betweenvegetation zonation and altitude in a salt-marsh system innorthwest Spain. J Veg Sci 7:695–702.
SAS Institute. 1990. SAS/STAT User’s Guide Version 6, FourthEdition. Cary (NC): SAS Institute.
Sawyer JO, Keeler-Wolf T. 1995. A manual of California vegeta-tion. Sacramento (CA): California Native Plant Society.
Scholten M, Rozema J. 1990. The competitive ability of Spartinaanglica on Dutch saltmarshes. In: Gray AJ, Benham PEM,editors. Spartina anglica: a research review. London: HMSO;Institute of Terrestrial Ecology Research Publication 2. p 39–47.
Sokal RR, Rohlf FJ. 1995. Biometry: the principles and practice ofstatistics in biological research. New York: WH Freeman.
Stephenson TA, Stephenson A. 1972. Life between tidemarks onrocky shores. San Francisco: WH Freeman.
Terborgh J. 1971. Distribution on environmental gradients:theory and a preliminary interpretation of distributional pat-terns in the avifauna of the Cordillera Vilcabamba, Peru.Ecology 52:23–40.
Titus JH. 1990. Microtopography and woody plant regenerationin a hardwood floodplain swamp in Florida. Bull Torrey BotClub 117:429–37.
Trimble Navigation. 1991. Trimvec software manual. Sunnyvale(CA): Trimble Navigation.
Valiela I, Rietsma CS. 1995. Disturbance of salt marsh vegetationby wrack mats in Great Sippewissett Marsh. Oecologia (Berl)102:106–12.
Van der Molen J. 1997. Tidal distortion and spatial differences insurface flooding characteristics in a salt marsh: implications forsea-level reconstruction. Estuarine Coastal Shelf Sci 45:221–33.
34 J. B. Zedler and others
Vannote RL, Minshall G, Cummins KW, Sedell JR, Cushing CE.1980. The river continuum concept. Can J Fish Aquat Sci37:130–7.
Vince SW, Snow AA. 1984. Plant zonation in an Alaskan saltmarsh. I. Distribution, abundance and environmental factors. JEcol 72:651–67.
Vivian-Smith G. 1997. Microtopographic heterogeneity and flo-ristic diversity in experimental wetland communities. J Ecol85:71–82.
Vogl RJ. 1966. Salt-marsh vegetation of upper Newport Bay,California. Ecology 47:80–7.
Whittaker RH. 1967. Gradient analysis of vegetation. Biol Rev42:207–64.
Whittaker RH. 1975. Communities and ecosystems. New York:Macmillan.
Wiegert RG, Freeman BJ. 1990. Tidal salt marshes of thesoutheast Atlantic coast: a community profile. Washington(DC): US Fish and Wildlife Service; Biological Report 85(7.29).
Wilson JB, Whittaker RJ. 1995. Assembly rules demonstrated ina saltmarsh community. J Ecol 83:801–7.
Zedler JB. 1977. Salt marsh community structure in the TijuanaEstuary, California. Estuarine Coastal Mar Sci 5:39–53.
Zedler JB. 1982. The ecology of southern California coastal saltmarshes: a community profile. Washington (DC): US Fish andWildlife Service; FWS/OBS-81/54.
Zedler JB. 1986. Catastrophic flooding and distributional patternsof Pacific cordgrass (Spartina foliosa Trin.). Bull South CalifAcad Sci 85:74–86.
Zedler JB. 1993. Canopy architecture of natural and plantedcordgrass marshes: selecting habitat evaluation criteria. EcolAppl 3:123–38.
Zedler JB, Cox GW. 1984. Characterizing wetland boundaries: aPacific coast example. Wetlands 4:43–55.
Zedler JB, Nordby CS, Kus BE. 1992. The ecology of TijuanaEstuary: a National Estuarine Research Reserve. Washington(DC): NOAA Office of Coastal Resource Management, Sanctu-aries and Reserves Division.
Zhang M, Ustin SL, Rejmankova E, Sanderson EW. 1997. Moni-toring Pacific coast salt marshes using remote sensing. EcolAppl 7:1039–53.
California Salt-Marsh Spatial Patterns 35