The Asymptotics of Wilkinson's Shift: Loss of Cubic Convergence
Upload
independentCategory
view
0download
0
Q1
123456789
101112131415161718192021222324252627282930313233343536373839404142434445464748495051525354555657585960616263646566
Physica B ∎ (∎∎∎∎) ∎∎∎–∎∎∎
Contents lists available at SciVerse ScienceDirect
Physica B
0921-45http://d
n CorrE-m
cbcao@b
Pleas
journal homepage: www.elsevier.com/locate/physb
Electronic, elastic, acoustic and optical properties of cubic TiO2:A DFT approach
Tariq Mahmood a,b, Chuanbao Cao a,n, Muhammad Tahir a, Faryal Idrees a, Maqsood Ahmed b, M. Tanveer a,Imran Aslam a, Zahid Usman a, Zulfiqar Ali a, Sajad Hussain a
a Research Center of Materials Science, School of Material Science and Engineering, Beijing Institute of Technology, Beijing 100081, People's Republic of Chinab Centre for High Energy Physics, University of the Punjab, Lahore 54590, Pakistan
a r t i c l e i n f o
Article history:Received 29 December 2012Received in revised form12 March 2013Accepted 27 March 2013
Keywords:Cubic-TiO2
Band structureShear modulusMean sound velocityDebye temperatureRefractive index
67
26/$ - see front matter & 2013 Published by Ex.doi.org/10.1016/j.physb.2013.03.039
esponding author. Tel.: +86 10 68913792; fax:ail addresses: [email protected] (C. Cao).
e cite this article as: T. Mahmood, e
a b s t r a c t
The electronic, elastic, acoustic and optical properties of cubic phases TiO2 fluorite and pyrite areinvestigated using the first principles calculations. We have employed five different exchange–correla-tion functions within the local density and generalized gradient approximations using the ultrasoft planewave pseudopotential method. The calculated band structures of cubic-TiO2 elucidate that the TiO2
fluorite and pyrite are direct and indirect semiconductors in contrast to the previous findings. From ourstudied properties such as bulk and shear moduli, elastic constants C44 and Debye temperature for TiO2
fluorite and pyrite, we infer that both the cubic phases are not superhard materials and the pyrite phaseis harder than fluorite. The longitudinal and transversal acoustic wave speeds for both phases in thedirections [100], [110] and [111] are determined using the pre-calculated elastic constants. In addition,we also calculate the optical properties such as dielectric function, absorption spectrum, refractive indexand energy loss function using the pre-optimized structure. On the observation of optical properties TiO2
fluorite phase turn out to be more photocatalytic than pyrite.& 2013 Published by Elsevier B.V.
Q2
686970717273747576777879808182838485868788899091
1. Introduction
Titanium dioxide (TiO2) has many polymorphs such as anatase,rutile, brookite, cotunnite, columbite and baddeleyite phases [1–6].It has many potential applications in industry such as dynamicrandom access memory modules, high efficiency solar cells, super-hard materials and photocatalysis [1,4,5,7–17], and incomparablechemical and physical properties [18–20]. Owing to many impor-tant structures, industrial applications, physical and chemical prop-erties, it has been a central theme of research for many authors. Forthe future solar cells technology, cubic TiO2 emerges as an impor-tant material [7,16]. In 2004 Mattesini et al. synthesized cubic TiO2
by heating anatase phase inside a diamond-anvil cell in thetemperature range of 1900–2100 K at pressure of 48 GPa in orderto study the fluorite structure [15]. Swamy et al. have found TiO2
fluorite as a ultra-hard material with shear modulus 230 GPa andbulk modulus 395 GPa, under ambient conditions of stabilization[17]. They have used the linear combination of the atomic orbital(LCAO) method to calculate the structural properties of cubic TiO2
(fluorite and pyrite). Their observations for pyrite were found to be
9293949596
lsevier B.V.
+86 10 68912001.(T. Mahmood),
t al., Physica B (2013), http:
in good agreement with the experimental results. Xiang-Feng Zhouet al. performed first principles calculations of columbite TiO2 underpressure and obtained fluorite TiO2 at ∼43 GPa, in good agreementwith the experiment [21]. To date, the exact structure of cubic TiO2
(fluorite (Fm3m), pyrite (Pa-3)) using x-ray diffraction is not wellidentified experimentally. Kim et al. have reported fluorite phase asmore stable than pyrite phase of cubic TiO2 under high pressure range(0–114 GPa) [16]. Recently, Miloua et al. studied the structural,mechanical and thermal properties of fluorite cubic TiO2 theoreticallyby using the full potential linearized augmented plane wave method[22]. Besides, Yongcheng Liang et al. performed theoretical calculationson elastic and structural properties of cubic TiO2 by the plane wavebasis pseudopotential method [23]. They have found that the fluoritephase is closer to the experimental synthesized cubic TiO2, a contra-diction to the results of Zhou et al. [21]. The structural, mechanical andthermal properties of cubic (fluorite and pyrite) phases of TiO2 are notstudied theoretically by many authors, which inspire us to investigatethe electronic, elastic and optical properties of TiO2 fluorite and pyritetogether.
In our work we have performed calculations using the ultrasoftplane wave pseudopotential method to determine the electronic,elastic, acoustic and optical properties of TiO2 fluorite pyrite phases.The structure of this paper is as follows. Computational details arepresented in Section 2. Electronic properties are explained in Section3.1. The elastic properties and acoustic velocities are discussed in
9798
//dx.doi.org/10.1016/j.physb.2013.03.039i

123456789
101112131415161718192021222324252627282930313233343536373839404142434445464748495051525354555657585960616263646566
6768
T. Mahmood et al. / Physica B ∎ (∎∎∎∎) ∎∎∎–∎∎∎2
Section 3.2. The detailed optical properties are explained in Section3.3. In Section 4, we provide the conclusion of our study.
Q3
6970717273747576777879808182838485868788899091
2. Computational method
We carried out ground state computations of TiO2 fluorite andpyrite by using the ultrasoft plane wave pseudopotential method(PP) [24] in the frame work of the density functional theory (DFT)[25]. We have used both the generalized gradient approximations(GGA) [26] and local density approximations (LDA) [27,28] up to fivedifferent exchange–correlation (XC) functions as incorporated in theCASTEP code [29]. The exchange–correlation functions CA–PZ (Ceper-ley and Alder as parametrized by Perdew and Zunger) [30] for LDAand PW91 (Perdew-Wang 91) [31], WC (Wu and Cohen) [32], RPBE(Revised Perdew–Burke–Ernzerhof) [33] and PBESOL (Perdew–
Burke–Ernzerhof for solid) [34] for GGA are used for electron–electron interaction. The ultrasoft pseudopotentials are used in thevenderbuilt form for ion–electron interaction [24]. For the planewave expansion the cut-off energy 650 eV and the mesh of 6�6�6k-points for electronic and elastic properties and mesh 8�8�8 k-points for optical properties are used for the c-fluorite and c-pyriteTiO2. Most favorable ionic positions are obtained at the maximumforce (0.01 eV per Å), maximum change of energy (1�10−6 eV peratom) and maximum displacement (1�10−4 Å).
9293949596979899
100
3. Results and discussion
3.1. Electronic properties
Third order Birch Murnaghan equation is employed from Ref.[21]to obtain the equilibrium volume (V0), bulk modulus (B) andits pressure derivative (B0
0 ). Table 1 represents our obtained results
Table 1Calculated equilibrium structural parameters and bandgaps for cubic TiO2.
Phase Method a (Å) V0 (Å3)
Fluorite LDA–CAPZ 4.739 106.4GGA–PW91 4.828 112.5GGA–WC 4.786 110GGA–PBESOL 4.782 109GGA–RPBE 4.865 115APW+lo-Wein2kCrystal–GGA 112.75B3LYP 112.13VASP–GGA 112.70SC–LDA 4.742SC–GGA 4.840BSTATE–LDA 112.11BSTATE–GGA 105.75VASP–LDA 107.08CASTEP–LDA 106.46LDA–CASTEP 4.749 107.1Experiment 4.87 115.50
Pyrite LDA–CAPZ 4.807 111.1GGA–PW91 4.891 117GGA–WC 4.851 114.2GGA–PBESOL 4.849 114GGA–RPBE 4.927 119.6APW+lo-Wein2kCrystal–GGA 118.62B3LYP 117.26VASP–GGA 117.73BSTATE–LDA 116.65BSTATE–GGA 110.36VASP–LDA 112.10CASTEP–LDA 110.95
Please cite this article as: T. Mahmood, et al., Physica B (2013), http:
of lattice constant, equilibrium volume, bulk modulus, pressurederivative of bulk modulus and energy bandgap for the fluoriteand pyrite c-TiO2 with existing experimental and theoretical datafor comparison. First we discuss TiO2 fluorite results. It can be seenfrom Table 1 that LDA (CA–PZ) direct to the contradiction withGGA (PW91, WC, PBESOL and RPBE) of the bulk modulus by 13%,5.6%, 5.3% and 19.3%. The contradiction results due to the differentformalism of exchange correlation functions and the dissimilarityof the equilibrium volume because bulk modulus, pressure deri-vative and equilibrium volume are interrelated with each other. Byconsidering the errors in numerical procedures of LDA and GGAapproximations, our five calculations yield realistic lattice con-stants (4.739, 4.828, 4.786, 4.782 and 4.865 in units Å), equilibriumvolumes (106.4, 112.5, 110, 109 and 115 in units Å3), bulk moduli(285, 248, 269, 270 and 230 in units GPa) and their respectivepressure derivatives (4.6, 3.7, 4.0, 3.4 and 4.1), which are consistentwith the previous theoretical findings [7,21–23,35] but a littlehigher than the experimental [15] results. On the other hand, theearlier calculated bulk moduli (395, 390, 324 and 309 GPa) in Refs.[17] [23] deviate from our data as shown in Table 1 for fluoritec-TiO2, while their equilibrium volumes match with ours. Ourcalculated values (4.6, 3.7, 4.0, 3.4 and 4.1) of B0
0 are consistentwith some theoretical values (4.07, 4.30, 4.63, 4.66, 4.68, 4.46 and4.19) [21–23] but in average the calculated values (1.75 and 2.06)by Gai et al. [17] are 55.8% and 47.98% respectively are less thanours. Our obtained values of lattice constant (a¼4.865 Å), volume(115
Âe3
) and bulk modulus (230 GPa) by using GGA–RPBE for thefluorite TiO2 are in good agreement with the experimental results(a¼4.87 Å, V¼112.5 Å3 and B¼202 GPa) [15]. In case of pyritephase, the investigated bulk moduli (276.43, 248.28, 258.35,262.11 and 228.24 GPa) match the earlier findings (220, 258, 258and 272 GPa) [17,21,23] with consideration of LDA and GGAnumerical errors. However, the reported values of bulk moduli(320, 298 and 304 GPa) in Ref. [23] overestimated our values in
101102103104105106107108109110111112113114115116117118119120121122123124125126127128129130131132
B0 (GPa) B00 Eg Reference
285 4.6 1.065 (D) This Study248 3.7 1.136 (D) This Study269 4.0 1.123 (D) This Study270 3.4 1.120 (D) This Study230 4.1 1.151 (D) This Study
1.79(D), 1.04(ID) [7]395 1.75 [17]390 2.06 [17]277 4.07 [21]288.7 4.30 [22]247.1 4.63 [22]272 4.66 [23]324 4.68 [23]309 4.46 [23]289 4.19 [23]266 1.08 (D) [35]202 1.3 [15]
276.43 4.0 1.451 (ID) This Study248.28 3.6 1.466 (ID) This Study258.35 4.2 1.472 (ID) This Study262.11 4.8 1.474 (ID) This Study228.24 4.5 1.457 (ID) This Study
1.44 (ID), 1.81 (D) [7]220 4.86 [17]258 4.35 [17]258 4.27 [21]272 4.58 [23]320 4.61 [23]298 4.15 [23]304 4.32 [23]
//dx.doi.org/10.1016/j.physb.2013.03.039i

123456789
101112131415161718192021222324252627282930313233343536373839404142434445464748495051525354555657585960616263646566
676869707172737475767778798081828384858687888990919293949596979899
100101102103104105106107108109110111112113Fig. 2. Density of states for fluorite (a) and pyrite (b) of c-TiO2.
T. Mahmood et al. / Physica B ∎ (∎∎∎∎) ∎∎∎–∎∎∎ 3
average 20.7%. The calculated values (4.0, 3.6, 4.2, 4.8 and 4.5) ofB00 of pyrite phase are in good agreement with previous theoretical
values (4.86, 4.35, 4.27, 4.58, 4.61, 4.15 and 4.32) [7,21–23]. Forhard materials, the theory suggests that the value of B0
0 should beclose to 4.0 [36] and Birch Murnaghan formalism is also valid forclosely to 4.0 [37]. Our calculated values of B0
0 fulfill these requiredconditions.
The investigated band structures of f-TiO2 and p-TiO2 by usingLDA (CA–PZ) and GGA (PBEWC, PBESOL, PW91 and RPBE) approx-imations are displayed in Fig. 1(a and b). Fig. 1(a) yields a directtransition from the valence band maximum to the conductionband minimum at the symmetry point G. The investigated bandstructures of f-TiO2 employing the obtained lattice parameters of4.786, 4.782, 4.739, 4.828 and 4.865 Å at zero pressure showminimum bandgaps of 1.123, 1.120, 1.065, 1.136 and 1.151 eV(Fig. 1(a)). By making a comparison, the LDA based calculationsemploying the plane wave pseudopotential (PWP) and full-potential linearized augmented plane wave methods (FPLAPW),give direct bandgap 1.08 eV [35], 1.79 eV [7] and indirect band gap1.04 eV [7] for f-TiO2.
Fig. 1(b) yields indirect transitions from the valence bandmaximum at symmetry point G to the conduction band minimumat symmetry point R. By using the calculated lattice parameters(4.851, 4.849, 4.807, 4.891 and 4.927 Å) at zero pressure, weobtained the indirect bandgaps (1.472, 1.474, 1.451, 1.466 and1.457 eV), using the prior mentioned LDA and GGA approximationsas shown in Fig. 1(b). However, previous calculated values of bandgap, using the full-potential linearized augmented plane wave(FPLAPW) method, depicts an indirect bandgap 1.44 eV and directbandgap 1.81 eV for p-TiO2. All obtained band structures of f-TiO2
and p-TiO2 define as direct and indirect semiconductors, which areconsistent with Kuo et al. [35] and Mattesini et al. [7]. Further-more, the structural properties of both cubic (fluorite and pyrite)phases of TiO2 are underestimated by using LDA exchange correla-tion function as compared to GGA functions. As a well known factthe LDA functional usually underestimates while the GGA func-tional usually overestimates the structural parameters, it is due tothe lake of discontinuity of energy derivative with respect to thenumber of electrons [38–40].
In Fig. 2(a and b), we depict the investigated density of states(DOS) for TiO2 fluorite and pyrite structures respectively. From Fig. 2(a), the lower valence bands for fluorite phase at energies −17.04 eV(LDA), −17.18 eV (GGA–PW91), −17.24 eV (GGA–WC), −17.3 eV(GGA–RPBE) and −17.27 eV (GGA–PBESOL) are composed of O-sstates and at energies –33.36 eV (LDA), −33.74 eV (GGA–PW91),−33.63 eV (GGA–WC), −33.88 eV (GGA–RPBE) and −33.59 eV (GGA–PBESOL) are composed of p states of Ti. Furthermore, at energies
Fig. 1. Band structures of fluorite (a)
Please cite this article as: T. Mahmood, et al., Physica B (2013), http:
−56.81 eV (LDA), −57.57 eV (GGA–PW91), −57.39 (GGA–WC),−57.69 eV (GGA–RPBE) and −57.36 eV (GGA–PBESOL) are composedof Ti-s states dominantly. In the upper part of the valence band from−7.5 to 0 eV, the O 2p states are dominant, which hybridize usuallywith the Ti 3d states and the minimum of the conduction band overthe Fermi level which is composed of Ti 3d state. Similarly, fromFig. 2(b), valance bands at energies −56.39 eV (LDA), −57.17 eV(GGA–PW91), −56.97 (GGA–WC), −57.34 eV (GGA–RPBE) and−56.94 eV (GGA–PBESOL) are composed of Ti-s states and atenergies –32.96 eV (LDA), −33.38 eV (GGA–PW91), −33.23 eV(GGA–WC), −33.53 eV (GGA–RPBE) and −33.20 eV (GGA–PBESOL)Ti-p states are dominant. Also at energies −16.38 eV (LDA),−16.61 eV (GGA–PW91), −16.66 eV (GGA–WC), −16.59 eV (GGA–RPBE) and −16.66 eV (GGA–PBESOL) are composed of O-s statesmainly. The top of the valence bands from −6 to 0 eV, the O 2pstates are the governing states, and the bottom of the conductionbands above the Fermi level, is determined by the Ti 3d statesdominantly. Our calculated density of states of O 2s, O 2p and Ti 3dfor fluorite TiO2 are in good agreement with Mattesini et al. [7].
Fig. 2(a and b) also showed that the widths of the uppervalence bands are −7.65 eV (LDA), −7.2 eV (GGA–PW91), −7.45 eV(GGA–WC), −6.9 eV (GGA–RPBE) and −7.45 eV (GGA–PBESOL) for
114115116117118119120121122123124125126127128129130131132and pyrite (b) phases of c-TiO2.
//dx.doi.org/10.1016/j.physb.2013.03.039i
Q4
Q5
123456789
101112131415161718192021222324252627282930313233343536373839404142434445464748495051525354555657585960616263646566
676869707172737475767778798081828384858687888990919293949596979899
100101102
T. Mahmood et al. / Physica B ∎ (∎∎∎∎) ∎∎∎–∎∎∎4
fluorite–TiO2 and −6.4 eV (LDA), −5.9 eV (GGA–PW91), −6.2 eV(GGA–WC), −5.7 eV (GGA–RPBE) and −6.2 eV (GGA–PBESOL) forthe pyrite phase. The widths of lower O 2s (Fig. 2(a and b)) valencebands are 4.0 eV (LDA), −3.55 eV (GGA–PW91), −3.65 eV (GGA–WC), −3.4 eV (GGA–RPBE) and −3.65 eV (GGA–PBESOL) for pyriteTiO2 and 4.70 eV (LDA), 4.25 eV (GGA–PW91), 4.45 eV (GGA–WC),4.10 eV (GGA–RPBE) and 4.45 eV (GGA–PBESOL) for fluorite TiO2.On the other hand, the obtained gaps from O 2 s states to thebottom of the conduction bands for f-TiO2 are 16.115 eV (LDA),16.486 eV (GGA–PW91), 16.473 eV (GGA–WC), 16.501 eV (GGA–RPBE) and 16.47 eV (GGA–PBESOL) and for p-TiO2 are 16.251 eV(LDA), 16.666 eV (GGA–PW91), 16.672 eV (GGA–WC), 16.657 eV(GGA–RPBE) and 16.674 eV (GGA–PBESOL), which are lower thanthe other phases of TiO2 with a lower coordination number (CN).Our calculated widths of upper valence bands for fluorite TiO2,lower O 2s and the gaps from O 2s to the bottom of the conductionbands are in good agreement with Kuo et al. (7.54, 4.18 and16.6 eV) [35]. The density of states of both phases is similar withthe small differences of energies.
3.2. Elastic properties
To investigate more about the mechanical properties of fluoriteand pyrite TiO2, we have calculated parameters such as elasticconstants, shear moduli, Young's moduli, Poisson ratio, meansound velocity, Debye temperature and density using the firstprinciples method. The calculated elastic constants, presented inTable 2, validate the study of the mechanical stability of both cubicphases of TiO2 by verifying the Born–Huang criterion [41].
C4440; C114 jC12j; and C11þ2C1240
Apply the above mentioned conditions to our calculated elasticconstants (Cij) for TiO2 fluorite and pyrite; both the phases turn outto be mechanically stable. Our calculated elastic constants Cij fromLDA and GGA for fluorite and pyrite TiO2 are in good agreementwith the reported theoretical data [22,23,42,43]. The shear moduli
Table 2Calculated elastic constants (GPa), shear modulus (GPa), Young's modulus (GPa), Poissonzero pressure for fluorite and pyrite c-TiO2.
Method C11 C12 C44 G
Fluorite LDA–CAPZ 665 94 37.5 57GGA–PW91 597 73 30 46GGA–WC 632 88 34 52GGA–PBESOL 634 87.5 36 55GGA–RPBE 565 62 29 44.4Crystal–GGA 244B3LYP 234SC–LDA 665.5 105.7 59.4 280SC–GGA 610.7 70.1 46.3 270BSTATE–LDA 687 143 52 128BSTATE–GGA 604 107 73 104VASP–LDA 671 128 40 97CASTEP–LDA 670 99 53 112GGA–PW91 603 75 43 131LDA 670.3 103.5 68.6 154.5GGA 589.9 79.6 48.5 131.2Ave 630.1 91.6 58.6 142.9
Pyrite LDA–CAPZ 447 191 95.85 106.6GGA–PW91 421 162 96.61 107.6GGA–WC 428 174 97.55 107.6GGA–PBESOL 427 177 93.26 103.4GGA–RPBE 398 144 94.74 105.5BSTATE–LDA 545 201 133 130BSTATE–GGA 467 174 115 127VASP–LDA 454 198 100 110CASTEP–LDA 491 199 113 125GGA–PW91 413 159 96 108
Please cite this article as: T. Mahmood, et al., Physica B (2013), http:
(G), Young's moduli (Y) and Poisson ratio (v) have been deter-mined by employing the equations from Ref. [22]. From Table 2, inaverage, C11 of the pyrite phase is about 31.4% less than that of thefluorite, whereas C12 and C44 of the pyrite phase are about 52.3%and 65.2% larger than fluorite phase. Young's moduli and Poissonratio of fluorite phase are 45.5% and 60% larger than pyrite phasein contrast to the results of Liang, Zhang and Zhao [23], thedifference of our calculated elastic constants Cij, shear moduli,Young's moduli and Poisson ratio for fluorite and pyrite TiO2 arehigher. Our calculated results of elastic constants Cij, Young'smoduli and Poisson ratio are in good agreement with the resultsof Miloua et al. [22].
In principal, the elastic constant C44 and the shear modulusplay vital role to understand the intrinsic hardness of any material.Our calculated shear moduli for fluorite TiO2 are in the range 44.4–57 GPa which are less than half of the value reported by Swamyand Muddle [20] and almost half of that given by Liang et al. [23].Furthermore, the obtained values of C44 for fluorite TiO2 also liewithin the range 29–37.5 GPa, less than Liang et al. [23]. As asuperhard material, the values of shear modulus and elasticconstant should be like c-BN (G¼403 GPa, C44¼479 GPa),diamond (G¼550 GPa, C44¼604 GPa) and ReB2 (G¼310 GPa,C44¼290 GPa) [44]. For this reason, our investigations elucidatethat fluorite TiO2 is not a suitable candidate for superhardmaterial, as reported by Liang el al. [23] but in contrast to theconcluding remarks of Gai et al. [17]. Conversely, the calculationsof shear modulus (103.4–107.6 GPa) and elastic constant C44(93.26–97.55 GPa) for pyrite TiO2 indicate it as a more hardmaterial than fluorite TiO2, but not a superhard material. Debyetemperature provides information about the temperature scale ofatomic vibrations for solids and is related to mean sound velocity.It also shows the stiffness of the material. Therefore, we havecalculated the Debye temperature and mean sound velocity byusing the equations presented in Ref. [45].
In addition, the acoustic wave velocities for fluorite and pyriteTiO2 along the [100], [110] and [111] directions have been worked
103104105106107108109110111112113114115116117118119120121122123124125126127128129130131132
ratio, mean sound velocity (ms−1), Debye temperature (K) and density (g/cm3) at
Y v Vm ΘD Ρ Reference
642 0.124 3831 965.8 4.9 This Study581 0.109 3542 876.5 4.71 This Study611 0.122 3808 935.1 4.6 This Study612 0.121 3814 952.8 4.85 This Study553 0.10 3518 864 4.6 This Study601.8 0.24 [17]577.7 0.25 [17]636.6 0.14 [22]596.3 0.10 [22]339 0.326 [23]276 0.331 [23]263 0.358 [23]298 0.328 [23]336 0.277 [42]394.1 0.275 [43]334.9 0.276 [43]364.5 0.276 [43]
333 0.30 6116.45 1381 3.6 This Study331 0.28 6291.68 1396 3.4 This Study328 0.29 6366.60 1403 3.3 This Study320 0.30 6100.28 1365 3.5 This Study321.5 0.27 6290.12 1386 3.3 This Study344 0.318 [23]329 0.298 [23]292 0.328 [23]328 0.315 [23]283 0.306 [42]
//dx.doi.org/10.1016/j.physb.2013.03.039i
123456789
101112131415161718192021222324252627282930313233343536373839404142434445464748495051525354555657585960616263646566
6768697071727374757677
Table 3Acoustic velocities of the longitudinal and transversal waves along [100], [110] and[111] directions for c-TiO2 (in km/s).
WavepropagationDirection
PhysicalQuantity
Present study ( in 105 m/s) Ref.[22]
LDA GGA
CA–PZ
PW91 WC PBESOL RPBE
Fluorite[100] vl 11.6 11.9 11.71 11.43 11.07 11.541
vt 2.75 2.52 2.72 2.72 2.51 3.321[110] vt 2.75 2.52 2.72 2.72 2.51 3.321
vl 9.18 8.80 9.25 9.04 8.62 9.317vtl 7.60 7.46 7.68 7.51 7.39 7.578
[111] vl 8.22 7.81 8.26 8.09 7.63 8.447vt 6.41 6.26 6.47 6.33 6.20 6.478
Pyrite[100] vl 11.17 11.47 11.34 11.06 10.93
vt 5.17 5.33 5.41 5.17 5.33[110] vt 5.17 5.33 5.41 5.17 5.33
vl 10.76 10.69 10.94 10.64 10.48vtl 5.98 6.17 6.17 5.98 6.17
[111] vl 10.62 10.53 10.80 10.50 10.32vt 5.72 5.91 5.93 5.72 5.91
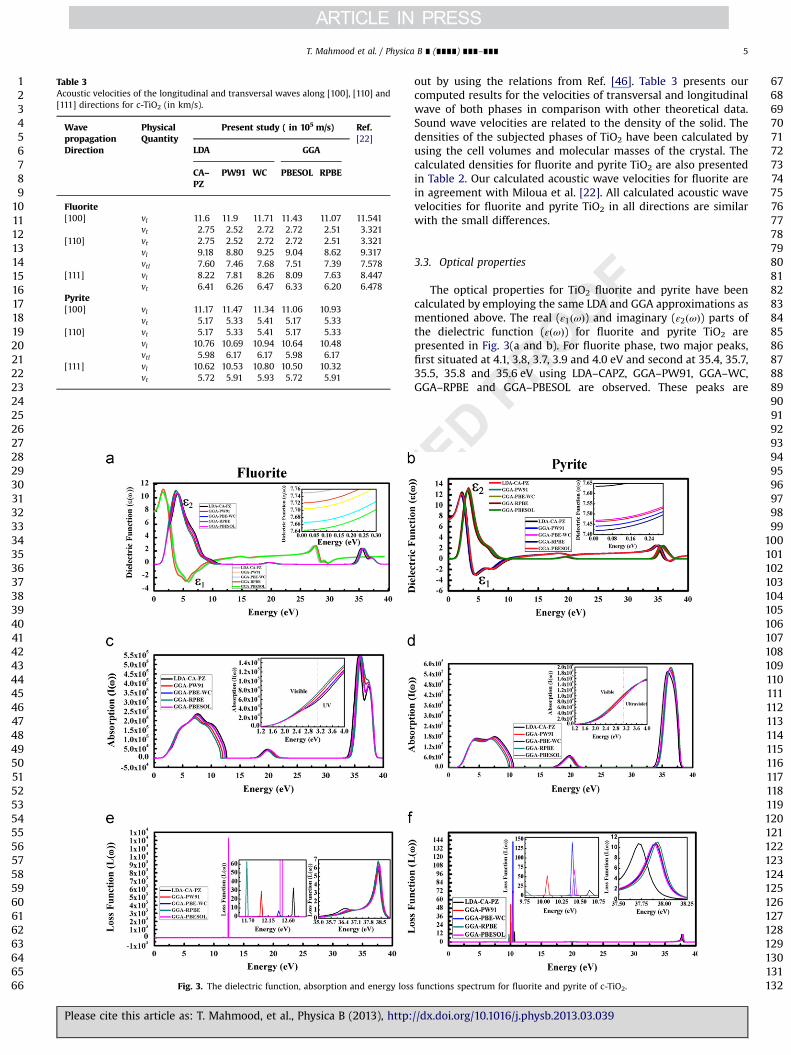
Fig. 3. The dielectric function, absorption and energy loss
T. Mahmood et al. / Physica B ∎ (∎∎∎∎) ∎∎∎–∎∎∎ 5
Please cite this article as: T. Mahmood, et al., Physica B (2013), http:
out by using the relations from Ref. [46]. Table 3 presents ourcomputed results for the velocities of transversal and longitudinalwave of both phases in comparison with other theoretical data.Sound wave velocities are related to the density of the solid. Thedensities of the subjected phases of TiO2 have been calculated byusing the cell volumes and molecular masses of the crystal. Thecalculated densities for fluorite and pyrite TiO2 are also presentedin Table 2. Our calculated acoustic wave velocities for fluorite arein agreement with Miloua et al. [22]. All calculated acoustic wavevelocities for fluorite and pyrite TiO2 in all directions are similarwith the small differences.
787980818283848586878889
3.3. Optical properties
The optical properties for TiO2 fluorite and pyrite have beencalculated by employing the same LDA and GGA approximations asmentioned above. The real (ε1ðωÞ) and imaginary (ε2ðωÞ) parts ofthe dielectric function (εðωÞ) for fluorite and pyrite TiO2 arepresented in Fig. 3(a and b). For fluorite phase, two major peaks,first situated at 4.1, 3.8, 3.7, 3.9 and 4.0 eV and second at 35.4, 35.7,35.5, 35.8 and 35.6 eV using LDA–CAPZ, GGA–PW91, GGA–WC,GGA–RPBE and GGA–PBESOL are observed. These peaks are
90919293949596979899
100101102103104105106107108109110111112113114115116117118119120121122123124125126127128129130131132functions spectrum for fluorite and pyrite of c-TiO2.
//dx.doi.org/10.1016/j.physb.2013.03.039i

123456789
101112131415161718192021222324252627282930313233343536373839404142434445464748495051525354555657585960616263646566
676869707172737475767778798081828384858687888990919293949596979899
100101102103104105106107108109110
T. Mahmood et al. / Physica B ∎ (∎∎∎∎) ∎∎∎–∎∎∎6
corresponding to the first peak at 7.6, 7.2, 7.5, 7.1 and 7.5 eV and thesecond peak at 35.7, 36.1, 36.0, 36.2 and 36.1 eV by considering theabove mentioned exchange–correlation formulations in absorptionspectra. The peaks at 4.1 (LDA–CAPZ), 3.8 (GGA–PW91), 3.7 (GGA–WC), 3.9 (GGA–RPBE) and 4.0 (GGA–PBESOL) eV initiate from theelectron transition among the Ti 3d states in the conduction bandminimum and O 2p states in valence band maximum (Fig. 3(c)). Thesecond peak is weak and corresponds to relevant exchange–correla-tion functions at 35.4, 35.7, 35.5, 35.8 and 35.6 eV possibly caused bythe transition between Ti 3p and O 2s states in the lower valenceband. Besides, from Fig. 3(c), it can be seen that the main absorptionpart is located in ultraviolet region and a small part is located in thevisible region (inset figure). Fig. 3(e) presents the energy loss spectrumof the fluorite TiO2. The energy of the electrons that passes throughthe material is defined as an energy loss function. The range of energyfrom 11.6 to 12.75 eV (Fig. 3(e), inset-top) shows the major energyloss, while from 35.0 to 39 eV (Fig. 3(e) inset-below) represents theless energy loss of electrons.
Fig. 3(b) represents the real and imaginary parts of the dielectricfunction for pyrite phase of TiO2, the first major peak of imaginarypart is situated at 3.36, 3.23, 3.32, 3.1 and 3.32 eV and the secondmajor peak lies at 35.5, 35.8, 35.6, 35.9 and 35.6 eV by using LDA–CAPZ, GGA–PW91, GGA–WC, GGA–RPBE and GGA–PBESOL exchange–correlation functions. The corresponding peaks in the absorptionspectrum are located within the ranges 1.4–10.6 eV and 33.2–38.6 eV with respect to previously used exchange–correlation func-tions (Fig. 3(d)). The first major peak in the imaginary part is due tothe electrons transition of Ti 3d states from bottom of the conductionband and O 2p states from top of the valence band. On the other handthe second major peak is because of the transition of Ti 3p and O 2sstates in lower valence band. The major peaks of the energy loss forpyrite TiO2 located in the range of 9.6–10.7 eV and the small peaks arepositioned in the range 36.6–38.2 eV as shown in Fig. 3(f). From Fig. 3(c and d), it can be seen that the fluorite phase is a more photo-catalytic material for visible light as compared to the pyrite phase ofTiO2, which is in excellent agreement with Mattesini et al. [7].
Table 4 illustrates our predicted results of the dielectric con-stant and refractive index for the fluorite and pyrite TiO2. Thecalculated dielectric constants for the fluorite phase are bit higherthan pyrite TiO2, while the calculated refractive index for bothcubic phase look like same by employing LDA and four differentGGA based exchange–correlation functions.
Our calculated results of dielectric constant are higher thanrutile (6.81, 6.693) [47] and anatase TiO2 (5.62, 5.82, 6.55) [48–50].
111112113114115116117
4. Conclusion
The electronic, elastic, acoustic and optical properties of thepyrite and fluorite TiO2 have been studied in detail using the first-
Table 4Predicted values of dielectric constant (ε1) and refractive index (n).
Method Dielectric constant (ε1) Refractive index (n)
Fluorite LDA–CAPZ 7.75 2.78GGA–PW91 7.70 2.77GGA–WC 7.67 2.77GGA–PBESOL 7.64 2.76GGA–RPBE 7.72 2.78
Pyrite LDA–CAPZ 7.64 2.76GGA–PW91 7.44 2.73GGA–WC 7.46 2.73GGA–PBESOL 7.46 2.73GGA–RPBE 7.42 2.72
Please cite this article as: T. Mahmood, et al., Physica B (2013), http:
principles calculations. Our calculated lattice constant (4.865 Å),volume (115 Å3) and bulk modulus (230 GPa) by using GGA–RPBEfor the fluorite TiO2 are in good agreement with the experimentalresults (4.87 Å, 112.5 Å3 and 202 GPa) [15]. The calculated values ofbulk moduli (285, 248, 269, 270 and 230 GPa), shear moduli (57,46, 52, 55 and 44.4 GPa) and elastic constants C44 (37.5, 30, 34, 36and 29 GPa) for the fluorite TiO2 are in good agreement with Lianget al. [23] but in contrast to Gai et al. [17]. The calculated values ofthe same physical quantities for pyrite TiO2 are higher thanfluorite, which shows that the pyrite phase is harder than fluoriteTiO2. Our investigated band structures for TiO2 fluorite (Fig. 1(a))and pyrite (Fig. 1(b)) inferred as direct and indirect semiconduc-tors respectively. Furthermore, the investigated density of states(DOS) for both the phases shows similar transition of electronswith small energy differences. Additionally, the mean soundvelocities, Debye temperatures and densities have been calculatedfor fluorite and pyrite TiO2. The mean sound velocities and Debyetemperatures for pyrite are larger than the fluorite TiO2. Moreover,the investigated longitudinal and transversal acoustic wave velo-cities for both phases in the directions [100], [110] and [111] arealmost same. From the analysis of the optical properties we haveobserved that the fluorite phase has more absorptive transitions inthe visible region than pyrite TiO2. The dielectric constants andrefractive indices for fluorite and pyrite TiO2 are calculated for thefirst time. The calculated values of dielectric constants for pyriteare bit smaller than fluorite phase, while the values of refractiveindices are almost same.
Q6
118119120121122123124125126127128129130131132
Acknowledgment
This work was supported by the National Natural Science Founda-tion of China (20471007,0972017) and the Research Fund for theDoctoral Program of Higher Education of China (20101101110026).
References
[1] L.S. Dubrovinsky, et al., Nature (London) 410 (2001) 653.[2] S.L.H. Wang, et al., Science 288 (2000) 321.[3] A.E. Goresy, et al., Science 293 (2001) 1467.[4] N.A. Dubrovinskaia, et al., Phys. Rev. Lett. 87 (2001) 275501.[5] J. Muscat, et al., Phys. Rev. B 65 (2002) 224112.[6] Y. Al-Khatatbeh, et al., Phys. Rev. B 79 (2009) 134114.[7] M. Mattesini, et al., Phys. Rev. B 70 (2004) 115101.[8] B.H. Park, et al., Appl. Phys. Lett. 80 (2002) 1174.[9] V. Swamy, et al., Appl. Phys. Lett. 89 (2006) 163118.[10] J.K. Dewhurst, J.E. Lowther, Phys. Rev. B 54 (1996) R3673.[11] R. Ahuja, L.S. Dubrovinsky, J. Phys. Condens. Matter 14 (2002) 10995.[12] Y. Matsumoto, M. Murakami, T. Shono, T. Hasegawa, T. Fukumura,
M. Kawasaki, P. Ahmet, T. Chikyow, S. Koshihara, H. Koinuma, Science 291(2001) 854.
[13] Z. Zhang, Q. Ge, S.C. Li, B.D. Kay, J.M. White, Z. Dohnalek, Phys. Rev. Lett. 99(2007) 126105.
[14] F. Fresno, D. Tudela, A.J. Maira, F. Rivera, J.M. Coronado, J. Soria, Appl.Organomet. Chem. 20 (2006) 220.
[15] R. Asahi, et al., Science 293 (2001) 269.[16] H.G. Yang, et al., Nature (London) 453 (2008) 638.[17] Y. Gai, et al., Phys. Rev. Lett. 102 (2009) 036402.[18] M. Mattesini, J.S. de Almeida, L. Dubrovinsky, N. Dubrovinskaia, B. Johansson,
R. Ahuja, Phys. Rev. B 70 (2004) 212101.[19] D.Y. Kim, J.S. Almeida, L. Koci, R. Ahuja, Appl. Phys. Lett. 90 (2007) 171903.[20] V. Swamy, B.C. Muddle, Phys. Rev. Lett. 98 (2007) 035502.[21] Xiang-Feng Zhou, Xiao Dong, Guang-Rui Qian, Lixin Zhang, YonjunTian,
Hui-Tian Wang, Phys. Rev. B 82 (2010) 060102.[22] R. Miloua, Z. Kebbab, N. Benramdane, M. Khadraoui, F. Chiker, Comput. Mater.
Sci. 50 (2011) 2142.[23] Yongcheng Liang, Bin Zhang, Jianzhi Zhao, Phys. Rev. B 77 (2008) 094126.[24] D. Vanderbilt, Phys. Rev. B 41 (1990) 7892.[25] W. Kohn, L.J. Sham, Phys. Rev. A 140 (1965) 1133.[26] J.P. Perdew, Y. Wang, Phys. Rev. B 45 (1992) 13244.[27] D.M. Ceperley, B.J. Alder, Phys. Rev. Lett. 45 (1980) 566.[28] J.P. Perdew, A. Zunger, Phys. Rev. B 23 (1981) 5048.[29] S.J. Clark, M.D. Segall, C.J. Pickard, P.J. Hasnip, M.J. Probert, K. Refson,
M.C. Payne, Kristallogr. 220 (5–6) (2005) 567.
//dx.doi.org/10.1016/j.physb.2013.03.039i
123456789
101112131415
1617181920212223242526
T. Mahmood et al. / Physica B ∎ (∎∎∎∎) ∎∎∎–∎∎∎ 7
[30] J.P. Perdew, A. Zunger, Phys. Rev. B 23 (1981) 5048.[31] J.P. Perdew, Y. Wang, Phys. Rev. B 45 (1992) 13244.[32] Z. Wu, R.E. Cohen, Phys. Rev. B 73 (2006) 235116.[33] B. Hammer, L.B. Hansen, J.K. Norskov, Phys. Rev. B 59 (1999) 7413.[34] J.P. Perdew, et al., Phys. Rev. Lett. 100 (2008) 136406.[35] Ming-Yu Kuo, Cheng-Lung Chen, Chih-Yu Hua, Hsiao-Ching Yang,
Pouyan Shen, J. Phys. Chem. B 109 (2005) 8693.[36] J.P. Poirier, Introduction to the Physics of the Earth's Interior, Cambridge
University Press, Cambridge, 1991.[37] F. Occelli, D.L. Farber, J. Badro, C.M. Aracne, D.M. Teter, M. Hanfland, B. Canny,
B. Couzinet, Phys. Rev. Lett. 93 (2004) 095502.[38] C. Stampfl, C.G. Van de Wall, Phys. Rev. B 59 (1999) 5521.[39] J.P. Perdew, M. Levy, Phys. Rev. Lett. 51 (1983) 1884.[40] L.J. Sham, M. Schluter, Phys. Rev. Lett. 51 (1983) 1888–1891.
Please cite this article as: T. Mahmood, et al., Physica B (2013), http:
[41] M. Born, K. Huang, Dynamical Theory of Crystal Lattices, ClarendonOxford, 1956.[42] X.G. Ma, P. Liang, L. Miao, S.W. Bie, C.K. Zhang, L. Xu, J.J. Jiang, Phys. Status
Solidi B 246 (9) (2009) 2132.[43] Wei Lu, Hai Wang, Yongming Hua, Haitao Huang, Haoshuang Gu, Physica B
404 (2009) 79.[44] Y. Liang, B. Zhang, Phys. Rev. B 76 (2007) 132101.[45] M.A. Caravaca, J.C. Mino, V.J. Perez, R.A. Casali, C.A. Ponce, J. Phys. Condens.
Matter 21 (2009) 015501.[46] S. Adachi, Properties of Group-IV, III–V and II–VI Semiconductors, John Wiley
& Sons Ltd., England, 2005.[47] T. Mahmood, et al., Physica B 407 (2012) 958.[48] S.H. Wemple, J. Chem. Phys. 67 (1977) 2151.[49] R.J. Gonzalez, R. Zallen, H. Berger, Phys. Rev. B 55 (1997) 7014.[50] D.R. Lide (Ed.), CRC Press, Boca Raton, 2000.
27
2829//dx.doi.org/10.1016/j.physb.2013.03.039i
Copyright © 2022 FDOKUMEN