Electromagnetic treatment-doubled electrocoagulation of humic acid in continuous mode using response...
19
Desalination and Water Treatment www.deswater.com 1944-3994 / 1944-3986 © 2010 Desalination Publications. All rights reserved. doi: 10.5004/dwt.2010.1120 22 (2010) 311–329 October Electromagnetic treatment-doubled electrocoagulation of humic acid in continuous mode using response surface method for its optimisation and application on two surface waters Djamel Ghernaout a *, Abdelkader Mariche a , Badiaa Ghernaout b , Amara Kellil a a Chemical Engineering Department, Saad Dahlab University of Blida, Blida 09000, Algeria Tel./Fax +213 (25) 43 36 31; email: [email protected] b Algerian Waters, Medea Area, Medea 26000, Algeria Received 29 August 2008; Accepted in revised form 27 April 2010 abstract This study concerns electromagnetic treatment-doubled electrocoagulation of humic acid (HA) us- ing response surface method and raw waters of two Dams (Ghrib and Boukerdene). This paper has two principal aims to achieve: firstly, enhance the efficiency of removal of HA by electrocoagulation (EC) adopting the following approach: EC in series using two electrocoagulators (BI-EC, doubled EC) and BI-EC assisted by electromagnetic (EM) field or in other words EM treatment (EMT) fol- lowed by EC in series (EMT-BIEC); secondly, substitute coagulation process (which is used in water treatment chain) with BI-EC or EMT-BIEC process in performing tests on raw waters (Boukerdene and Ghrib Dam’s, Algeria) using different electrodes (Al, Fe and stainless steel). According to the obtained results, BI-EC and EMT-BIEC processes are globally efficient in HA removal and water treatment. Indeed, removal of microorganisms and reduction of turbidity, conductivity and or- ganic maer (OM) suggest that these processes would be used on an industrial scale for drinking water treatment especially for EMT-BIEC process using Al electrodes. EMT contribution does not seem constantly efficient for these two raw waters especially for their OM removal. However, for HA solution, EMT alone achieve a medium reduction (52% at pH 3, 25% at 12 and 30% at 7) and behaves similarly to EC. Keywords: Humic acid; Electrocoagulation; Electromagnetic; Drinking water; Response surface method; Moses effect 1. Introduction Natural organic maer (NOM) present in soils is basically a mixture of compounds in different stages of decomposition due to the biological degradation of vegetable and animal residues as well as of the synthetic activity of microorganisms. These compounds can be conveniently divided into two groups: non-humic and humic substances (HS). The first group includes those substances with well-defined chemical characteristics (carbohydrates, proteins, amino acids, and low molecular weight (MW) organic acids) which are easily aacked by microorganisms [1]. On the other hand, HS are com- posed of aliphatic and aromatic acids, presenting a dark colour, complex chemical structure with no defined physicochemical properties, hydrophilic character and high MW, presenting a high stability, i.e. being more refractive to the aack by microorganisms [1]. HS are * Corresponding author.
Transcript of Electromagnetic treatment-doubled electrocoagulation of humic acid in continuous mode using response...
Desalination and Water Treatmentwww.deswater.com1944-3994 / 1944-3986 © 2010 Desalination Publications. All rights reserved.doi: 10.5004/dwt.2010.1120
22 (2010) 311–329 October
Electromagnetic treatment-doubled electrocoagulation of humic acid in continuous mode using response surface method for its optimisation and application on two surface waters
Djamel Ghernaouta*, Abdelkader Marichea, Badiaa Ghernaoutb, Amara Kellila
aChemical Engineering Department, Saad Dahlab University of Blida, Blida 09000, AlgeriaTel./Fax +213 (25) 43 36 31; email: [email protected] Waters, Medea Area, Medea 26000, Algeria
Received 29 August 2008; Accepted in revised form 27 April 2010
abstractThis study concerns electromagnetic treatment-doubled electrocoagulation of humic acid (HA) us-ing response surface method and raw waters of two Dams (Ghrib and Boukerdene). This paper has two principal aims to achieve: firstly, enhance the efficiency of removal of HA by electrocoagulation (EC) adopting the following approach: EC in series using two electrocoagulators (BI-EC, doubled EC) and BI-EC assisted by electromagnetic (EM) field or in other words EM treatment (EMT) fol-lowed by EC in series (EMT-BIEC); secondly, substitute coagulation process (which is used in water treatment chain) with BI-EC or EMT-BIEC process in performing tests on raw waters (Boukerdene and Ghrib Dam’s, Algeria) using different electrodes (Al, Fe and stainless steel). According to the obtained results, BI-EC and EMT-BIEC processes are globally efficient in HA removal and water treatment. Indeed, removal of microorganisms and reduction of turbidity, conductivity and or-ganic matter (OM) suggest that these processes would be used on an industrial scale for drinking water treatment especially for EMT-BIEC process using Al electrodes. EMT contribution does not seem constantly efficient for these two raw waters especially for their OM removal. However, for HA solution, EMT alone achieve a medium reduction (52% at pH 3, 25% at 12 and 30% at 7) and behaves similarly to EC.
Keywords: Humic acid; Electrocoagulation; Electromagnetic; Drinking water; Response surface method; Moses effect
1. Introduction
Natural organic matter (NOM) present in soils is basically a mixture of compounds in different stages of decomposition due to the biological degradation of vegetable and animal residues as well as of the synthetic activity of microorganisms. These compounds can be conveniently divided into two groups: non-humic and
humic substances (HS). The first group includes those substances with well-defined chemical characteristics (carbohydrates, proteins, amino acids, and low molecular weight (MW) organic acids) which are easily attacked by microorganisms [1]. On the other hand, HS are com-posed of aliphatic and aromatic acids, presenting a dark colour, complex chemical structure with no defined physicochemical properties, hydrophilic character and high MW, presenting a high stability, i.e. being more refractive to the attack by microorganisms [1]. HS are * Corresponding author.
312 D. Ghernaout et al. / Desalination and Water Treatment 22 (2010) 311–329
structurally complex large macromolecules (weak anionic polyelectrolytes) which occur in soil and natural waters as a consequence of the breakdown of plant and animal residues by microbial activity and a major portion ap-proximately, 50%, of the earth’s carbon is in the form of HS [2]. They are heterogeneous in structure as well as in their chemical and biochemical reactivity and carry weakly acidic functional groups such as carboxylic and phenolic groups, thus they can be aggregated by charge neutralisation (CN) [2,3]. Most NOM characterisation studies seeking to relate NOM properties, with its re-moval by enhanced coagulation (EnC) process, involve fractionation of NOM into several semi-homogeneous compound classes. A comprehensive method for NOM fractionation using the isolation-fractionation approach is the procedure outlined by [4]; by which, NOM can be fractionated into eight compound classes: fulvic acid (FA), humic acid (HA), weak hydrophobic acids, hydro-philic acids (HAA), hydrophobic neutrals, hydrophilic neutrals, hydrophobic bases, and hydrophilic bases [5]. Many researchers have carried out studies on removal of isolated NOM fractions by coagulation, based on which conclusions were drawn regarding NOM removal from natural waters by EnC. Edzwald [6] reported that a water rich in HS will probably show a dissolved organic carbon removal of 70% or more, while a water dominated by non-humic organics will show considerably lower removals [5]. Other researchers investigated removal of NOM by chemical coagulation (CC) treatment using both bulk and fractionated NOM, and reported over 70% removal of the hydrophobic and HAA fractions, while only 16% of the hydrophilic non-acid fraction was removed [5]. It was observed that approximately 95% of high molar mass organic substances were removed in the coagulation process with both Fe and Al salts, while on average, only 10% of NOM with molar mass less than 1000 g mol–1 was removed [5]. Interaction of HS with dissolved and particulate matter in the waters affects the quality of the water and the treatment leads to formation of dis-infection by-products which are suspected carcinogenic compounds; due to these harmful effects, HS should be removed from water [2].
CC process, used to treat several types of waters/wastewaters, involves three stages: in the first stage, chemical reagents are added to the water producing the destabilisation of the pollutants; the aim of the second step is achieving the formation of solids with bigger size, and it is attained by a soft mix that allows the col-lision between particles and their aggregation; the last stage consists of the separation of the solids by settling or dissolved air flotation [7–9]. An alternative to the CC process is electrocoagulation (EC), which consists of the in situ generation of coagulants by the electrodissolution of a sacrificial anode of Al or Fe [10–14]. In this process, a proper design of the EC cell allows carrying out the tree stages previously mentioned in a single compartment.
Thus, the electrodissolution of the sacrificial anode to the water leads to the formation of hydrolysis products (hydroxo-metal species) that are effective in the destabi-lisation of pollutants and/or in the formation of particles with reduced solubility that entrap the pollutants [15,16]. As well, the electrochemical reduction of water in the cathode produces the formation of hydrogen bubbles that promote a soft turbulence in the system and bond with the pollutants decreasing their relative specific weight and enhancing the flocculation process and the separa-tion of the flocculated pollutants by flotation [17–21]. In both coagulation processes (CC and EC), it is common the use of Al or Fe reagents as coagulants. When these reagents are added to the wastewater, different hydrolysis species are formed and the main parameters influencing the speciation are the pH and the metal concentration: the formation of monomeric hydroxometallic ions co-exist with the metallic hydroxide precipitates [22–24]. These hydrolysis metal species can interact with differ-ent types of pollutants, achieving their removal from the wastewaters: the metallic ionic monomeric species can neutralise the charge of the pollutants by adsorption on their surfaces; the metallic ionic polymeric species can bind to several particles (or molecules) of pollutant at a time; the pollutants can be enmeshed into growing metal-lic hydroxide precipitates, or can be adsorbed onto their surfaces [8,25,26].
On the other hand, the search for more efficient and economical water treatment methods is primordial. A possibility may be the use of a constant magnetic field (CMF) induced by magnetisers, for instance magnetic liquid activators (MLA), which could be used as a water-conditioning appliance, in a closed system. The intensity of the magnetic field (MF) of the basic element of MLA does not decrease in time. The construction of MLA is ex-ceptionally simple and it can be easily installed [27]. The method of water flowing through magnetisers was recom-mended for systems where boiler scales were observed due to water flow, heating, exchange heat or internal tank or installation corrosion. It has been observed that a CMF intensity in the range from 0.4 to 0.6 T (Tesla) could cause a reduction in pollutants in the water [27]. Further, magnetic separation can be one of the promising ways for a novel environmental purification technique because of producing no contaminants such as flocculants and having capability of treating large amount of wastewater within a short time [28,29]. Magnetic treatment (MT) of water is an attractively simple approach by which the water to be treated flows through a MF, and consequently changes some of its physicochemical properties [29]. A continuous electromagnetic (EM) sedimentation tank in wastewater treatment to enhance the settling veloc-ity of suspended particles is developed [29]. A MF can improve technological characteristics of the water, i.e. better salt solubility, kinetic changes in salt crystallisa-tion and accelerated colloidal coagulation [29]. Indeed, a
D. Ghernaout et al. / Desalination and Water Treatment 22 (2010) 311–329 313
MF is known to create the asymmetry of hydrated shells due to its effect on water molecules situated around the charged particles: exposure to MF would lead to higher electro-kinetic movement among the colloid increasing definitely the probability of attracting particles to cloak with one another [29].
Optimising the EC process implies determination of the experimental conditions for separation of HA mac-romolecules. In conventional multifactor experiments, optimisation is usually carried out by varying a single factor while keeping all other factors fixed at a specific set of conditions. It is not only time-consuming, but also usually incapable of reaching the true optimum due to ignoring the interactions among variables [30]. For this purpose, response surface method (RSM) was proposed to determine the influences of individual factors and their interactive influences. RSM is a statistical technique for designing experiments, building models, evaluating the effects of several factors, and searching optimum condi-tions for desirable responses [30]. The main advantage of this method of other statistical experimental design meth-ods is the reduced number of experiments trials needed to evaluate multiple parameters and their interactions [30]. Recently, this method has been used to determine optimum parameters in different processes [30].
In this study, EC using Fe, Al, and stainless steel (SS) electrodes was used for the treatment of HA acid solu-tion. In order to evaluate the decrease of UV absorbance at 254 nm (UV254) three important electrochemical fac-tors were investigated: current density, initial pH, and EC time. A RSM was used to obtain the best parameters for the optimum process design with the least number of experiments.
2. Experimental
2.1. Experimental set-ups
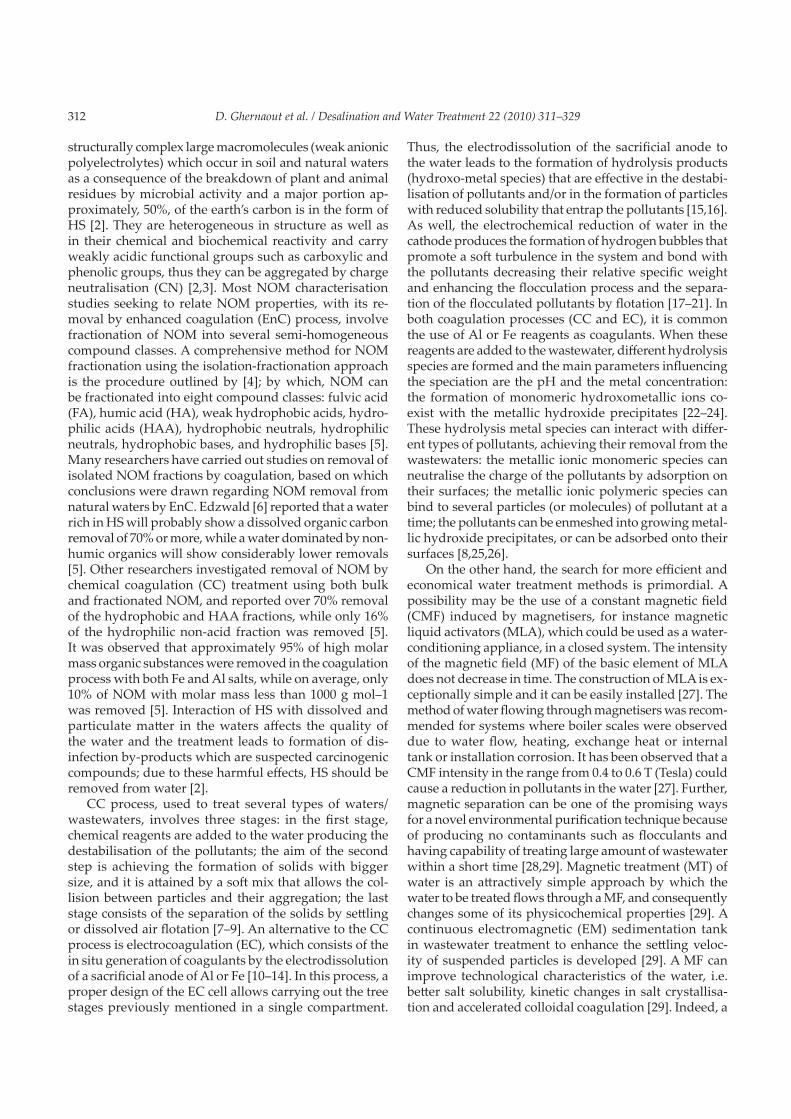
Doubled electrocoagulation (BI-EC) and electromag-netic treatment-doubled electrocoagulation (EMT-BIEC) tests have been performed using two set-ups as shown in Fig. 1. Two power supplies were used DC (Elektrolyser
Fig. 1. Experimental set-up for the EMT-BIEC process.
Elyn 1) and AC (Stell Trafo/power-supply) for EC and EMT processes, respectively. Ammeters and voltmeters were used to measure voltage and current intensity in the set-ups. Two magnetic agitators were used (MLW-R3T) to create agitation in some experiments and a Büchner filtra-tion set-up was used to increase solid-liquid separation after experiments. A 30 L tank for raw water is connected to a tap and two PVC reactors (500 and 1000 mL) are used. The electrodes (Al, Fe, and SS) are plunged in water with 72 cm2 as active surface with d = 1 cm as distance between them. The EM field which is created by the coil — which is connected to the AC supply — is measured using a Phywe Teslameter. For an average AC intensity 25 mA, the EM density is ~27 mT (milliTesla); however, the order of magnitude of the used EM field in the literature is at least 150 mT [31]. As shown in Fig. 1, in the inner part of the coil the liquid passage may be in direct pipe (direct passage: DP) or in helical pipe (helical passage: HP).
2.2. Electrodes
Three types of electrodes are used: Fe (ordinary steel: 99.7% iron and 0.3% carbone), Al (commercialised alu-minium) and SS. Before each EC test, electrodes must be cleaned as follows:
• For Fe electrodes: polishing with abrasive paper (for the removal of passivation layer after each EC test); rinsing with distilled water; cleaning in a composed solution (NaOH: 25 g, Na2CO3: 25 g, K2CO3: 25 g, filling with distilled water until 1 L); rinsing with distilled water; stripping in sulphuric acid solution (H2SO4 20%) during 10–20 min; and rinsing with distilled water.
• For SS and Al electrodes: rinsing with distilled water; rinsing in sodium hydroxide solution (NaOH 10%); and rinsing in distilled water.
2.3. Humic acid solutions and UV absorbance measure
The HA used are a commercialised product from Across Organics (USA). This product is like a brown powder. A concentrated solution at 1 g L–1 is prepared
314 D. Ghernaout et al. / Desalination and Water Treatment 22 (2010) 311–329
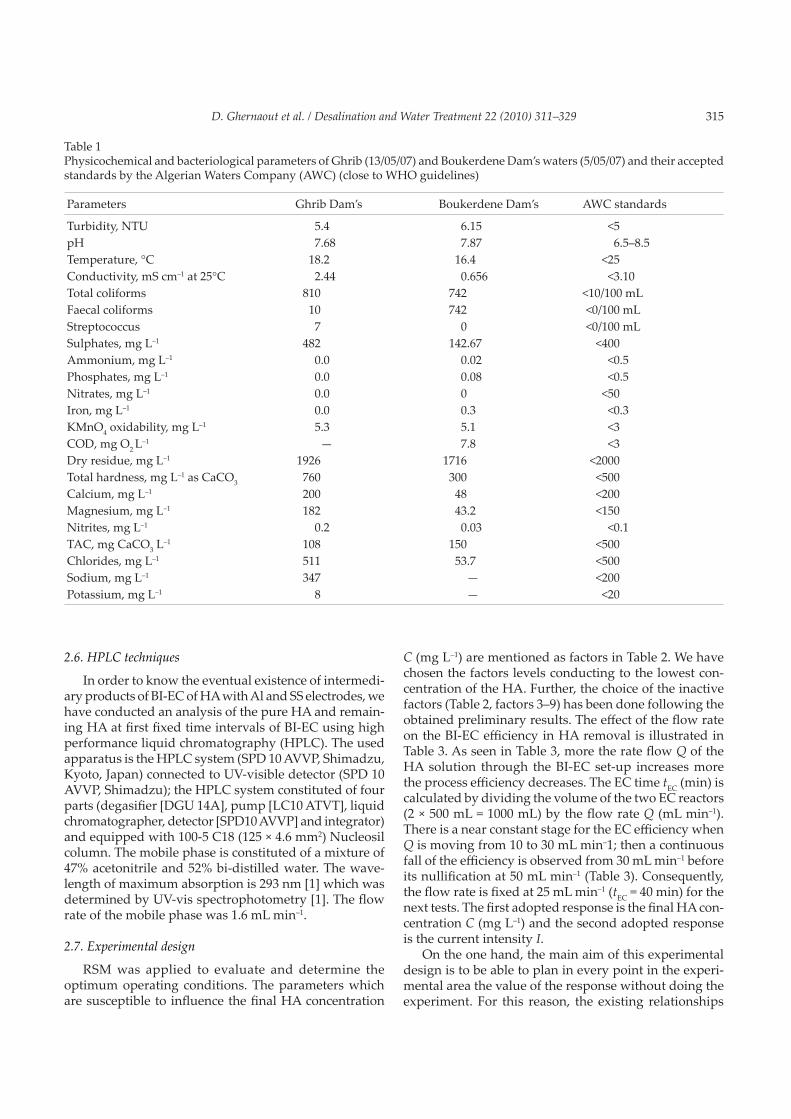
by dissolving 1 g of HA in 62.5 mL of NaOH (2N) solu-tion and then completed to 1 L with distilled water (with 10 μS cm–1 at 25°C as conductivity) in a 1 L vial. This solution is submitted to magnetic agitation during 48 h and then conserved at 4°C in the absence of light. From this solution, diluted solutions (15 and 20 mg L–1) are pre-pared for the BI-EC and EMT-BIEC tests. Further, UV254 absorbance of HA solution is measured using a Shimadzu 1601 spectrophotometer with 1 cm cell quartz. The pH of the solutions is adjusted to 12 prior to the absorbance measurement to enhance HA absorbance (where the best dissolution of humic macromolecules is obtained than in neutral or acidic pH). The removal of HA is calculated using the following relation:
( )(%) / 100i f iR Ab Ab Ab= − × (1)
where Abi and Abf are initial and final UV absorbances, respectively. Two calibration curves expressing UV ab-sorbance as a function of HA concentration C0 (mg L–1) were performed (Fig. 2) for pH 12 and 3. The pH effect on UV absorbance is clearly displayed showing why pH is adjusted at 12 before measure. When pH decreases, H+
ions neutralise the negative functional groups (carboxylic, phenolic and hydroxyls) of the organic macromolecules decreasing thus their solubility in water. This decreased solubility facilitates their colloidalisation before their agglomeration. In fact, this is the key step of coagulation which has given birth to the concept of EnC [5]. According to Yildiz et al. [2], the most probable structures in HS are residues of phenolic structures in their core, and func-tional groups such as phenolic hydroxyl groups, carboxyl groups, and amino groups. Recent studies have shown that carboxylic and phenolic groups in HS are most ac-tive and they complex and reduce metal ions at different pH values. These groups in HS affect the charge of HS, due to the distinct behaviours at different pH values [2].
Fig. 2. Calibration curves of HA at pH 3 (a) and 12 (b) illustrating the effect of pH on UV absorbance of HA showing the neces-sity to adjust pH at 12 before any UV absorbance measure.
2.4. Raw waters
Two raw waters were used for the application of the BI-EC and EMT-BIEC processes. Raw waters were taken from Boukerdene (Tipaza) and Ghrib (Ain Defla) Dam’s in Algeria. Analyses of different parameters were per-formed by Central Laboratories in Tipaza and Medea. The physicochemical and bacteriological results (Table 1) show that Ghrib Dam’s presents very high hardness with microbial pollution and OM presence. Globally, the Ghrib Dam’s water is harder than the Boukerdene Dam’s water (760 vs. 300 mg L–1 as CaCO3) and richer in dissolved salts (2440 vs. 656 μS cm–1 at 25°C).
2.5. Procedure
After introduction of HA solution to treat with a known concentration in the EC reactor (when only one reactor is used, and the first reactor when two reactors are used), pH is adjusted at its initial chosen value using acid or alkaline solutions [H2SO4 or NaOH (2N)]. After cleaning, drying and weighing of the electrodes, they are plunged in the reactors. The electrodes are then connected to the DC power supply using electric wires through an ammeter. Once the electric current is applied, the agitator is started at a high agitation. At the end of the test, a 50 mL sample is taken. The pH and conductivity measures are immediately performed; for UV254 absorbance, pH must be adjusted at 12. Some experiments were realised in two PVC reactors which are placed in series to determine the effect of different conditions on EC process. Two ordinary steel plates are placed in each reactor (the first one with 6.5 cm as length, 4.5 cm as width, and 1 mm as thickness; and the last with 6.5 cm as length, 7 cm as width, and 1 mm as thickness) serving as a pair parallel electrodes. The plates have 72 cm2 as a surface area. During experiments, the solution is under agitation and the electric current is maintained constant at 5 V.
D. Ghernaout et al. / Desalination and Water Treatment 22 (2010) 311–329 315
2.6. HPLC techniques
In order to know the eventual existence of intermedi-ary products of BI-EC of HA with Al and SS electrodes, we have conducted an analysis of the pure HA and remain-ing HA at first fixed time intervals of BI-EC using high performance liquid chromatography (HPLC). The used apparatus is the HPLC system (SPD 10 AVVP, Shimadzu, Kyoto, Japan) connected to UV-visible detector (SPD 10 AVVP, Shimadzu); the HPLC system constituted of four parts (degasifier [DGU 14A], pump [LC10 ATVT], liquid chromatographer, detector [SPD10 AVVP] and integrator) and equipped with 100-5 C18 (125 × 4.6 mm2) Nucleosil column. The mobile phase is constituted of a mixture of 47% acetonitrile and 52% bi-distilled water. The wave-length of maximum absorption is 293 nm [1] which was determined by UV-vis spectrophotometry [1]. The flow rate of the mobile phase was 1.6 mL min–1.
2.7. Experimental design
RSM was applied to evaluate and determine the optimum operating conditions. The parameters which are susceptible to influence the final HA concentration
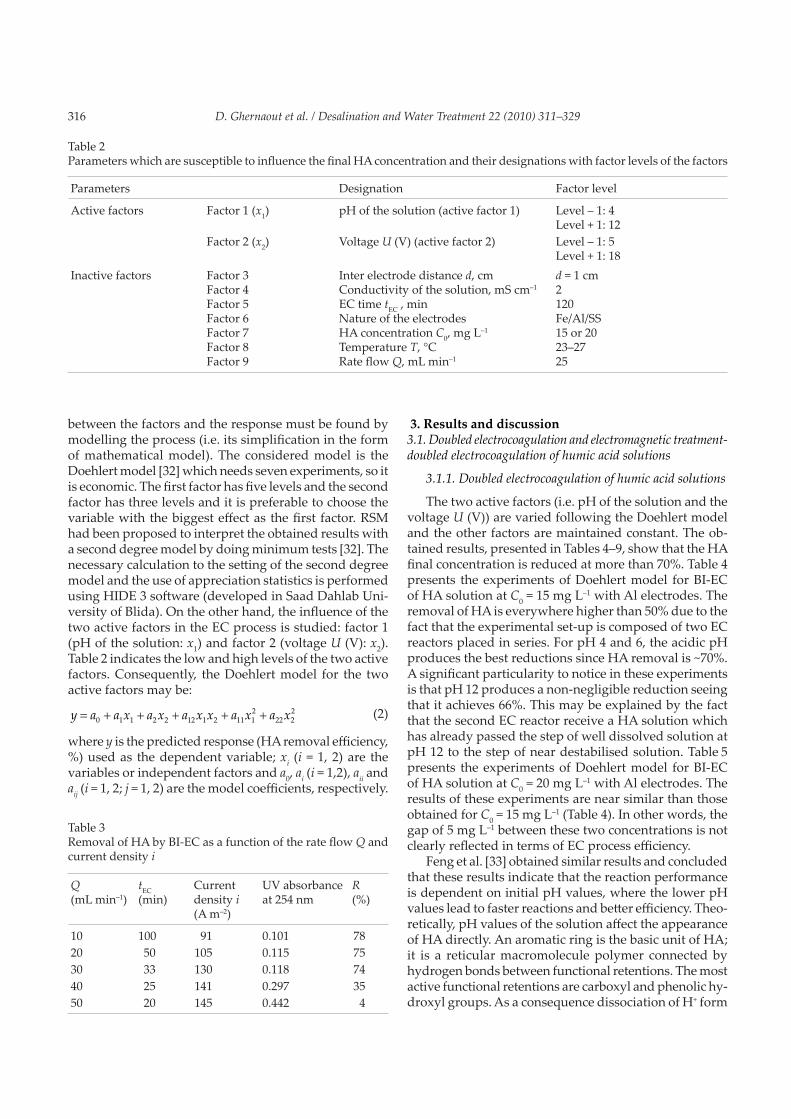
Table 1Physicochemical and bacteriological parameters of Ghrib (13/05/07) and Boukerdene Dam’s waters (5/05/07) and their accepted standards by the Algerian Waters Company (AWC) (close to WHO guidelines)
Parameters Ghrib Dam’s Boukerdene Dam’s AWC standards
Turbidity, NTU 5.4 6.15 <5pH 7.68 7.87 6.5–8.5Temperature, °C 18.2 16.4 <25Conductivity, mS cm–1 at 25°C 2.44 0.656 <3.10Total coliforms 810 742 <10/100 mLFaecal coliforms 10 742 <0/100 mLStreptococcus 7 0 <0/100 mLSulphates, mg L–1 482 142.67 <400Ammonium, mg L–1 0.0 0.02 <0.5Phosphates, mg L–1 0.0 0.08 <0.5Nitrates, mg L–1 0.0 0 <50Iron, mg L–1 0.0 0.3 <0.3KMnO4 oxidability, mg L–1 5.3 5.1 <3COD, mg O2 L–1 — 7.8 <3Dry residue, mg L–1 1926 1716 <2000Total hardness, mg L–1 as CaCO3 760 300 <500Calcium, mg L–1 200 48 <200Magnesium, mg L–1 182 43.2 <150Nitrites, mg L–1 0.2 0.03 <0.1TAC, mg CaCO3 L–1 108 150 <500Chlorides, mg L–1 511 53.7 <500Sodium, mg L–1 347 — <200Potassium, mg L–1 8 — <20
C (mg L–1) are mentioned as factors in Table 2. We have chosen the factors levels conducting to the lowest con-centration of the HA. Further, the choice of the inactive factors (Table 2, factors 3–9) has been done following the obtained preliminary results. The effect of the flow rate on the BI-EC efficiency in HA removal is illustrated in Table 3. As seen in Table 3, more the rate flow Q of the HA solution through the BI-EC set-up increases more the process efficiency decreases. The EC time tEC (min) is calculated by dividing the volume of the two EC reactors (2 × 500 mL = 1000 mL) by the flow rate Q (mL min–1). There is a near constant stage for the EC efficiency when Q is moving from 10 to 30 mL min–1; then a continuous fall of the efficiency is observed from 30 mL min–1 before its nullification at 50 mL min–1 (Table 3). Consequently, the flow rate is fixed at 25 mL min–1 (tEC = 40 min) for the next tests. The first adopted response is the final HA con-centration C (mg L–1) and the second adopted response is the current intensity I.
On the one hand, the main aim of this experimental design is to be able to plan in every point in the experi-mental area the value of the response without doing the experiment. For this reason, the existing relationships
316 D. Ghernaout et al. / Desalination and Water Treatment 22 (2010) 311–329
between the factors and the response must be found by modelling the process (i.e. its simplification in the form of mathematical model). The considered model is the Doehlert model [32] which needs seven experiments, so it is economic. The first factor has five levels and the second factor has three levels and it is preferable to choose the variable with the biggest effect as the first factor. RSM had been proposed to interpret the obtained results with a second degree model by doing minimum tests [32]. The necessary calculation to the setting of the second degree model and the use of appreciation statistics is performed using HIDE 3 software (developed in Saad Dahlab Uni-versity of Blida). On the other hand, the influence of the two active factors in the EC process is studied: factor 1 (pH of the solution: x1) and factor 2 (voltage U (V): x2). Table 2 indicates the low and high levels of the two active factors. Consequently, the Doehlert model for the two active factors may be:
2 20 1 1 2 2 12 1 2 11 1 22 2y a a x a x a x x a x a x= + + + + + (2)
where y is the predicted response (HA removal efficiency, %) used as the dependent variable; xi (i = 1, 2) are the variables or independent factors and a0, ai (i = 1,2), aii and aij (i = 1, 2; j = 1, 2) are the model coefficients, respectively.
Table 2Parameters which are susceptible to influence the final HA concentration and their designations with factor levels of the factors
Parameters Designation Factor level
Active factors Factor 1 (x1) pH of the solution (active factor 1) Level – 1: 4Level + 1: 12
Factor 2 (x2) Voltage U (V) (active factor 2) Level – 1: 5Level + 1: 18
Inactive factors Factor 3Factor 4Factor 5Factor 6Factor 7Factor 8Factor 9
Inter electrode distance d, cmConductivity of the solution, mS cm–1
EC time tEC , minNature of the electrodesHA concentration C0, mg L–1
Temperature T, °CRate flow Q, mL min–1
d = 1 cm2 120 Fe/Al/SS15 or 2023–2725
3. Results and discussion3.1. Doubled electrocoagulation and electromagnetic treatment-doubled electrocoagulation of humic acid solutions
3.1.1. Doubled electrocoagulation of humic acid solutions
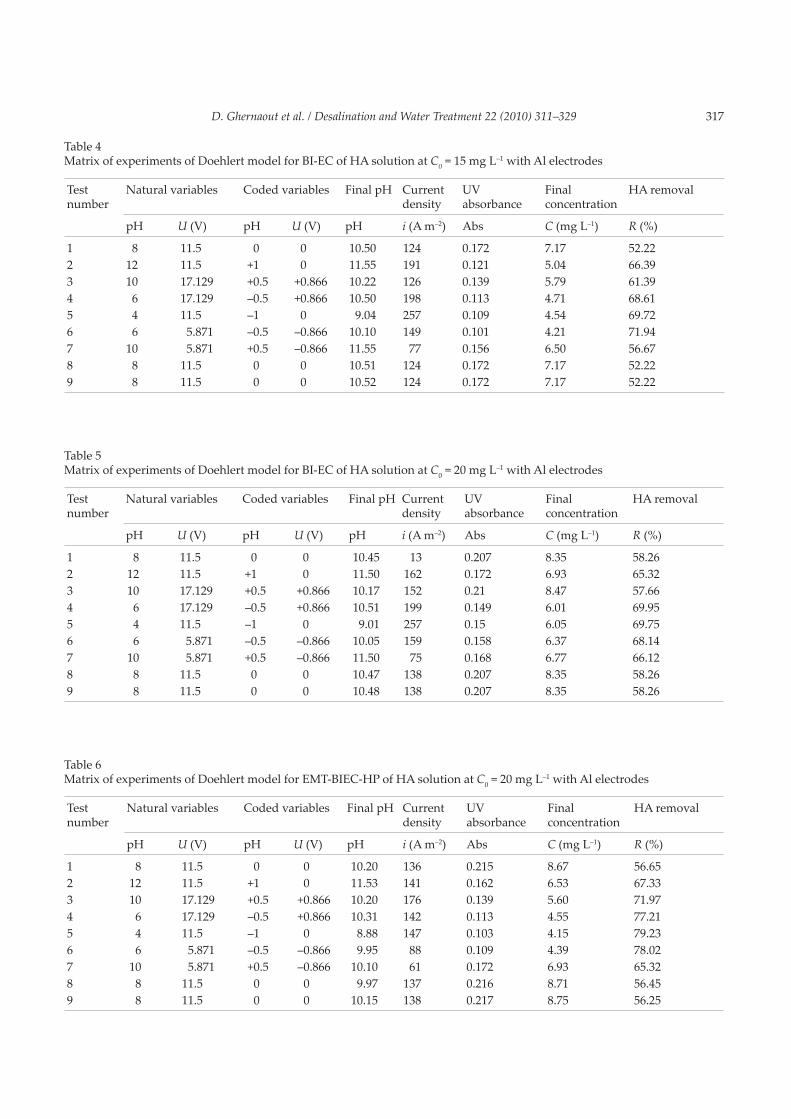
The two active factors (i.e. pH of the solution and the voltage U (V)) are varied following the Doehlert model and the other factors are maintained constant. The ob-tained results, presented in Tables 4–9, show that the HA final concentration is reduced at more than 70%. Table 4 presents the experiments of Doehlert model for BI-EC of HA solution at C0 = 15 mg L–1 with Al electrodes. The removal of HA is everywhere higher than 50% due to the fact that the experimental set-up is composed of two EC reactors placed in series. For pH 4 and 6, the acidic pH produces the best reductions since HA removal is ~70%. A significant particularity to notice in these experiments is that pH 12 produces a non-negligible reduction seeing that it achieves 66%. This may be explained by the fact that the second EC reactor receive a HA solution which has already passed the step of well dissolved solution at pH 12 to the step of near destabilised solution. Table 5 presents the experiments of Doehlert model for BI-EC of HA solution at C0 = 20 mg L–1 with Al electrodes. The results of these experiments are near similar than those obtained for C0 = 15 mg L–1 (Table 4). In other words, the gap of 5 mg L–1 between these two concentrations is not clearly reflected in terms of EC process efficiency.
Feng et al. [33] obtained similar results and concluded that these results indicate that the reaction performance is dependent on initial pH values, where the lower pH values lead to faster reactions and better efficiency. Theo-retically, pH values of the solution affect the appearance of HA directly. An aromatic ring is the basic unit of HA; it is a reticular macromolecule polymer connected by hydrogen bonds between functional retentions. The most active functional retentions are carboxyl and phenolic hy-droxyl groups. As a consequence dissociation of H+ form
Table 3Removal of HA by BI-EC as a function of the rate flow Q and current density i
Q (mL min–1)
tEC (min)
Current density i (A m–2)
UV absorbance at 254 nm
R (%)
10 100 91 0.101 7820 50 105 0.115 7530 33 130 0.118 7440 25 141 0.297 3550 20 145 0.442 4
D. Ghernaout et al. / Desalination and Water Treatment 22 (2010) 311–329 317
Table 4Matrix of experiments of Doehlert model for BI-EC of HA solution at C0 = 15 mg L–1 with Al electrodes
Test number
Natural variables Coded variables Final pH Current density
UV absorbance
Final concentration
HA removal
pH U (V) pH U (V) pH i (A m–2) Abs C (mg L–1) R (%)
1 8 11.5 0 0 10.50 124 0.172 7.17 52.222 12 11.5 +1 0 11.55 191 0.121 5.04 66.393 10 17.129 +0.5 +0.866 10.22 126 0.139 5.79 61.394 6 17.129 –0.5 +0.866 10.50 198 0.113 4.71 68.615 4 11.5 –1 0 9.04 257 0.109 4.54 69.726 6 5.871 –0.5 –0.866 10.10 149 0.101 4.21 71.947 10 5.871 +0.5 –0.866 11.55 77 0.156 6.50 56.678 8 11.5 0 0 10.51 124 0.172 7.17 52.229 8 11.5 0 0 10.52 124 0.172 7.17 52.22
Table 5Matrix of experiments of Doehlert model for BI-EC of HA solution at C0 = 20 mg L–1 with Al electrodes
Test number
Natural variables Coded variables Final pH Current density
UV absorbance
Final concentration
HA removal
pH U (V) pH U (V) pH i (A m–2) Abs C (mg L–1) R (%)
1 8 11.5 0 0 10.45 13 0.207 8.35 58.262 12 11.5 +1 0 11.50 162 0.172 6.93 65.323 10 17.129 +0.5 +0.866 10.17 152 0.21 8.47 57.664 6 17.129 –0.5 +0.866 10.51 199 0.149 6.01 69.955 4 11.5 –1 0 9.01 257 0.15 6.05 69.756 6 5.871 –0.5 –0.866 10.05 159 0.158 6.37 68.147 10 5.871 +0.5 –0.866 11.50 75 0.168 6.77 66.128 8 11.5 0 0 10.47 138 0.207 8.35 58.269 8 11.5 0 0 10.48 138 0.207 8.35 58.26
Table 6Matrix of experiments of Doehlert model for EMT-BIEC-HP of HA solution at C0 = 20 mg L–1 with Al electrodes
Test number
Natural variables Coded variables Final pH Current density
UV absorbance
Final concentration
HA removal
pH U (V) pH U (V) pH i (A m–2) Abs C (mg L–1) R (%)
1 8 11.5 0 0 10.20 136 0.215 8.67 56.652 12 11.5 +1 0 11.53 141 0.162 6.53 67.333 10 17.129 +0.5 +0.866 10.20 176 0.139 5.60 71.974 6 17.129 –0.5 +0.866 10.31 142 0.113 4.55 77.215 4 11.5 –1 0 8.88 147 0.103 4.15 79.236 6 5.871 –0.5 –0.866 9.95 88 0.109 4.39 78.027 10 5.871 +0.5 –0.866 10.10 61 0.172 6.93 65.328 8 11.5 0 0 9.97 137 0.216 8.71 56.459 8 11.5 0 0 10.15 138 0.217 8.75 56.25
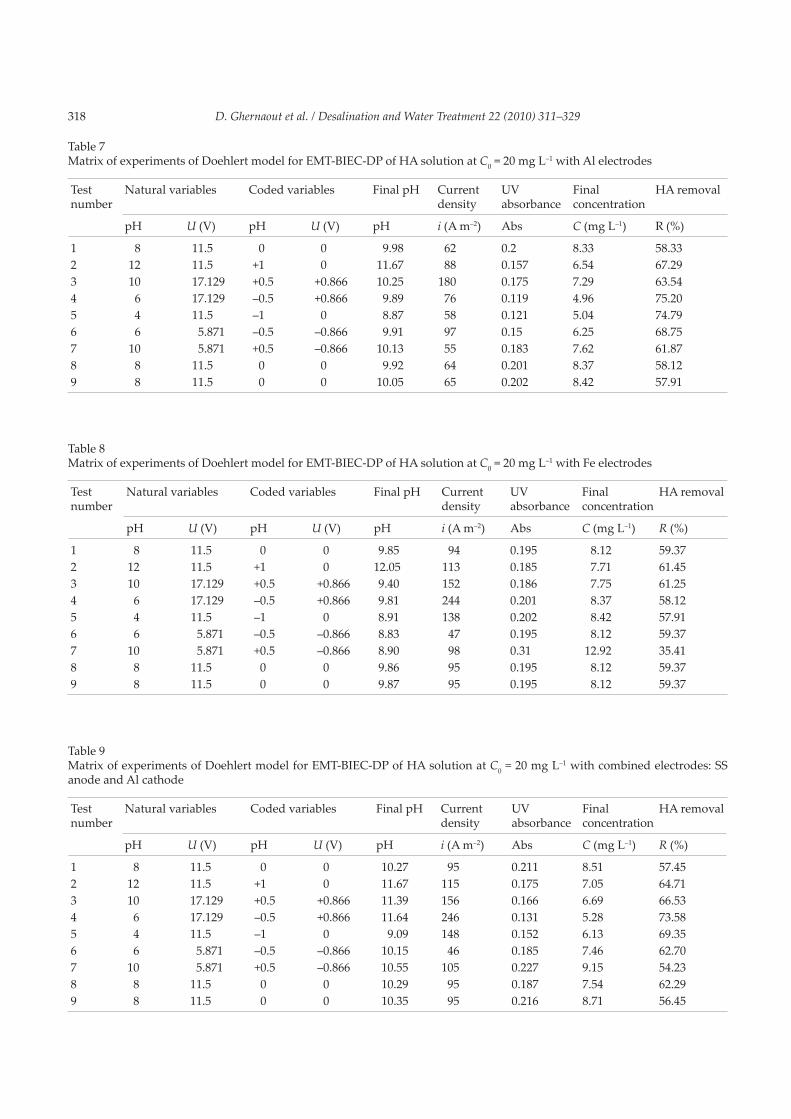
318 D. Ghernaout et al. / Desalination and Water Treatment 22 (2010) 311–329
Table 7Matrix of experiments of Doehlert model for EMT-BIEC-DP of HA solution at C0 = 20 mg L–1 with Al electrodes
Test number
Natural variables Coded variables Final pH Current density
UV absorbance
Final concentration
HA removal
pH U (V) pH U (V) pH i (A m–2) Abs C (mg L–1) R (%)
1 8 11.5 0 0 9.98 62 0.2 8.33 58.332 12 11.5 +1 0 11.67 88 0.157 6.54 67.293 10 17.129 +0.5 +0.866 10.25 180 0.175 7.29 63.544 6 17.129 –0.5 +0.866 9.89 76 0.119 4.96 75.205 4 11.5 –1 0 8.87 58 0.121 5.04 74.796 6 5.871 –0.5 –0.866 9.91 97 0.15 6.25 68.757 10 5.871 +0.5 –0.866 10.13 55 0.183 7.62 61.878 8 11.5 0 0 9.92 64 0.201 8.37 58.129 8 11.5 0 0 10.05 65 0.202 8.42 57.91
Table 8Matrix of experiments of Doehlert model for EMT-BIEC-DP of HA solution at C0 = 20 mg L–1 with Fe electrodes
Test number
Natural variables Coded variables Final pH Current density
UV absorbance
Final concentration
HA removal
pH U (V) pH U (V) pH i (A m–2) Abs C (mg L–1) R (%)
1 8 11.5 0 0 9.85 94 0.195 8.12 59.372 12 11.5 +1 0 12.05 113 0.185 7.71 61.453 10 17.129 +0.5 +0.866 9.40 152 0.186 7.75 61.254 6 17.129 –0.5 +0.866 9.81 244 0.201 8.37 58.125 4 11.5 –1 0 8.91 138 0.202 8.42 57.916 6 5.871 –0.5 –0.866 8.83 47 0.195 8.12 59.377 10 5.871 +0.5 –0.866 8.90 98 0.31 12.92 35.418 8 11.5 0 0 9.86 95 0.195 8.12 59.379 8 11.5 0 0 9.87 95 0.195 8.12 59.37
Table 9Matrix of experiments of Doehlert model for EMT-BIEC-DP of HA solution at C0 = 20 mg L–1 with combined electrodes: SS anode and Al cathode
Test number
Natural variables Coded variables Final pH Current density
UV absorbance
Final concentration
HA removal
pH U (V) pH U (V) pH i (A m–2) Abs C (mg L–1) R (%)
1 8 11.5 0 0 10.27 95 0.211 8.51 57.452 12 11.5 +1 0 11.67 115 0.175 7.05 64.713 10 17.129 +0.5 +0.866 11.39 156 0.166 6.69 66.534 6 17.129 –0.5 +0.866 11.64 246 0.131 5.28 73.585 4 11.5 –1 0 9.09 148 0.152 6.13 69.356 6 5.871 –0.5 –0.866 10.15 46 0.185 7.46 62.707 10 5.871 +0.5 –0.866 10.55 105 0.227 9.15 54.238 8 11.5 0 0 10.29 95 0.187 7.54 62.299 8 11.5 0 0 10.35 95 0.216 8.71 56.45
D. Ghernaout et al. / Desalination and Water Treatment 22 (2010) 311–329 319
carboxyl or hydroxyl relates to the pH value of the solu-tion. When the pH value is lower, carboxyl and hydroxyl radicals exist in the chemical form of –COOH and –OH respectively. When pH values are higher, they exist in the form of –COO– and –O–. Obviously, under conditions of a higher pH, HA takes on a more negative charge and more positive charge is consumed to neutralise the negative charge. Therefore, the treatment efficiency will decrease under higher pH values [33]. According to Escobar et al. [15], the EC technologies are essentially electrolytic processes that involve the destabilisation of suspended, emulsified or dissolved pollutants in an aqueous medium, by the application of an electric current. In EC (a process similar to CC), there is a reduction of the net surface charge to a point where the colloidal particles can ap-proach closely enough for Van der Waal’s forces to hold them together and allow aggregation to take place. The surface charge reduction is a consequence of the decrease of the repulsive potential of the electrical double layer by the presence of an electrolyte having an opposite charge. This mechanism corresponds to the destabilisation of colloidal particles [15].
3.1.2. Electromagnetic treatment-doubled electrocoagula-tion of humic acid solutions
Table 6 presents the experiments of Doehlert model for EMT-BIEC-HP (helical passage: HP) of HA solution at C0 = 20 mg L–1 with Al electrodes. In these experiments, EMT process is introduced before the EC reactors by passing the HA solution in a helical reactor which is surrounded by EM field. An amelioration of 10% is brought by EMT at pH 4 and 6 while in other values of pH, the effect of EMT is nearly non-existent (Table 6). Table 7 presents the experiments of Doehlert model for EMT-BIEC-DP (direct passage: DP) of HA solution at C0 = 20 mg L–1 with Al electrodes. The contribution of EMT in the conditions of DP (where the HA solution arriving from the storage tank remains in the 500 mL flask which is surrounded by EM field) seems less important as reported by literature and our previous work [34]. Table 8 presents the experiments of Doehlert model for EMT-BIEC-DP of HA solution at C0 = 20 mg L–1 with Fe electrodes. What is astonishing in these results is firstly the fact that HA removal tends to globally decrease in comparison with Al electrodes and secondly the maximum of absorbance abatement moves to pH 12:
For HA solution, where is the matter of organic macro-molecules, the key mechanism of HA removal is above all the passage from the dissolved state to the colloidal state by CN with H+ (when pH is acidified) and metallic cat-ionic species (when Fe2+ or Al3+ are injected) by formation of humic–metallic complexes. These colloids adsorb each other to constitute flocs. The colloids and flocs undergo either flotation (by hanging on hydrogen bubbles which are produced at the cathode) or settling. Since humic
macromolecule is light (in relation to clay particles) and Al is also light (in relation to Fe), the mechanism of flota-tion with Al electrodes seems to be more effective than the mechanism of settling with Fe electrodes.
On the other hand, the maximum of absorbance abate-ment moves to pH 12 with Fe electrodes (Table 8): when pH is alkaline, EC process produces more Fe(OH)3(s) than Fe(OH)2(s).
Table 9 presents the experiments of Doehlert model for EMT-BIEC-DP of HA solution at C0 = 20 mg L–1 with combined electrodes: SS anode and Al cathode. The re-placement of Al anode with SS anode does not seem to highly influence the EMT-BIEC efficiency. Indeed, when anode is in SS (i.e. Al3+ is not injected by the anode), the electric field acts always by its oxidative effect on humic macromolecules (Table 9). However, a known fact must be reported here is the Al cathode can produce Al(OH)4
–(aq)
which produce Al(OH)3(s) white-grey flocs to adsorb hu-mic macromolecules [3].
3.2. Modelling of doubled electrocoagulation and electromag-netic-doubled electrocoagulation processes
The HA concentration is the key of the process ef-ficiency. The mathematical modelling is accomplished using the following steps: calculation of coefficients and their standard deviations; statistic tests (validity test) – R2 and diagram of residues; plot of response surfaces and iso-response curves.
3.2.1. Setting of the models
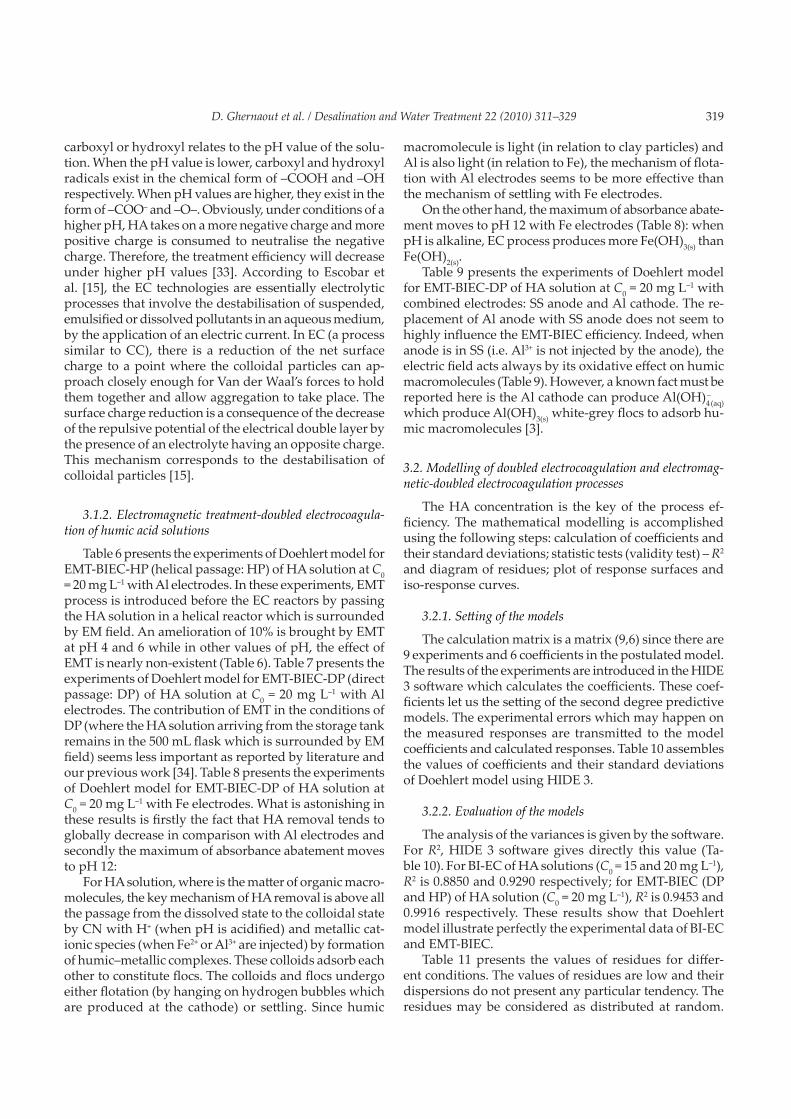
The calculation matrix is a matrix (9,6) since there are 9 experiments and 6 coefficients in the postulated model. The results of the experiments are introduced in the HIDE 3 software which calculates the coefficients. These coef-ficients let us the setting of the second degree predictive models. The experimental errors which may happen on the measured responses are transmitted to the model coefficients and calculated responses. Table 10 assembles the values of coefficients and their standard deviations of Doehlert model using HIDE 3.
3.2.2. Evaluation of the models
The analysis of the variances is given by the software. For R2, HIDE 3 software gives directly this value (Ta-ble 10). For BI-EC of HA solutions (C0 = 15 and 20 mg L–1), R2 is 0.8850 and 0.9290 respectively; for EMT-BIEC (DP and HP) of HA solution (C0 = 20 mg L–1), R2 is 0.9453 and 0.9916 respectively. These results show that Doehlert model illustrate perfectly the experimental data of BI-EC and EMT-BIEC.
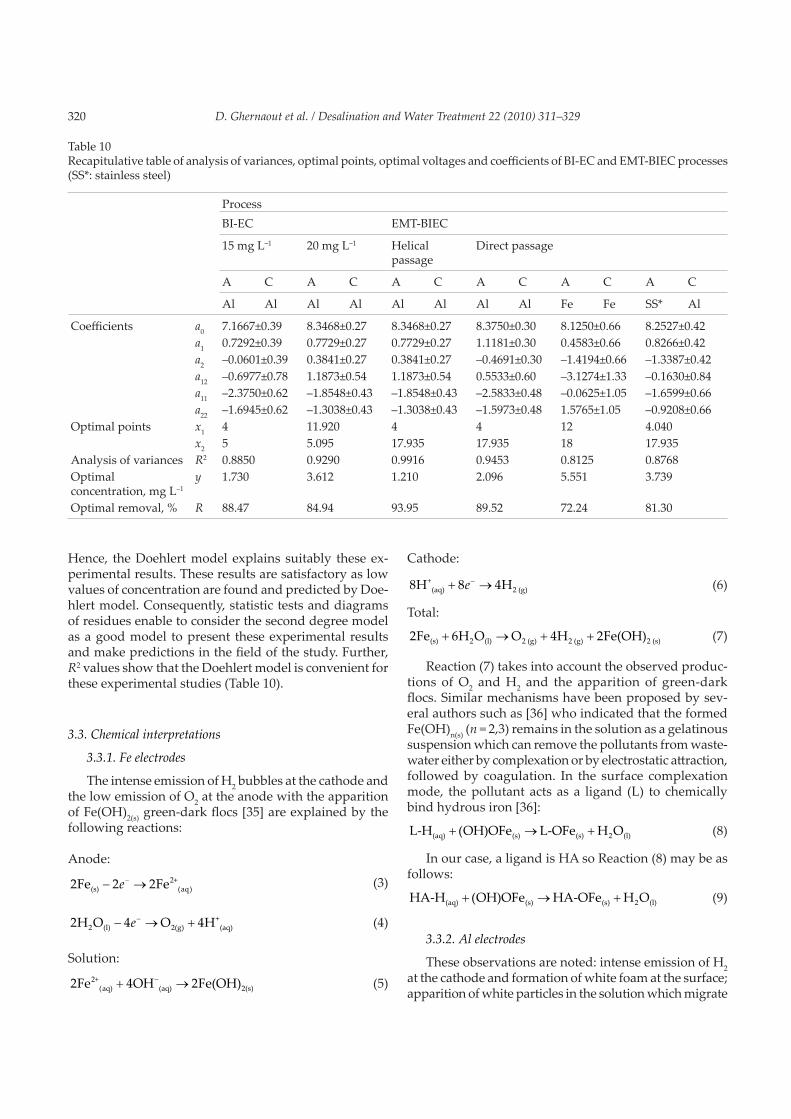
Table 11 presents the values of residues for differ-ent conditions. The values of residues are low and their dispersions do not present any particular tendency. The residues may be considered as distributed at random.
320 D. Ghernaout et al. / Desalination and Water Treatment 22 (2010) 311–329
Hence, the Doehlert model explains suitably these ex-perimental results. These results are satisfactory as low values of concentration are found and predicted by Doe-hlert model. Consequently, statistic tests and diagrams of residues enable to consider the second degree model as a good model to present these experimental results and make predictions in the field of the study. Further, R2 values show that the Doehlert model is convenient for these experimental studies (Table 10).
3.3. Chemical interpretations
3.3.1. Fe electrodes
The intense emission of H2 bubbles at the cathode and the low emission of O2 at the anode with the apparition of Fe(OH)2(s) green-dark flocs [35] are explained by the following reactions:
Anode:2+
(s) (aq)2Fe 2 2Fee−− → (3)
+2 (l) 2(g) (aq)2H O 4 O 4He−− → + (4)
Solution:2+
(aq) (aq) 2(s)2Fe 4OH 2Fe(OH)−+ → (5)
Table 10Recapitulative table of analysis of variances, optimal points, optimal voltages and coefficients of BI-EC and EMT-BIEC processes (SS*: stainless steel)
ProcessBI-EC EMT-BIEC
15 mg L–1 20 mg L–1 Helical passage
Direct passage
A C A C A C A C A C A C
Al Al Al Al Al Al Al Al Fe Fe SS* Al
Coefficients a0 7.1667±0.39 8.3468±0.27 8.3468±0.27 8.3750±0.30 8.1250±0.66 8.2527±0.42a1 0.7292±0.39 0.7729±0.27 0.7729±0.27 1.1181±0.30 0.4583±0.66 0.8266±0.42a2 –0.0601±0.39 0.3841±0.27 0.3841±0.27 –0.4691±0.30 –1.4194±0.66 –1.3387±0.42a12 –0.6977±0.78 1.1873±0.54 1.1873±0.54 0.5533±0.60 –3.1274±1.33 –0.1630±0.84a11 –2.3750±0.62 –1.8548±0.43 –1.8548±0.43 –2.5833±0.48 –0.0625±1.05 –1.6599±0.66a22 –1.6945±0.62 –1.3038±0.43 –1.3038±0.43 –1.5973±0.48 1.5765±1.05 –0.9208±0.66
Optimal points x1 4 11.920 4 4 12 4.040x2 5 5.095 17.935 17.935 18 17.935
Analysis of variances R2 0.8850 0.9290 0.9916 0.9453 0.8125 0.8768Optimal concentration, mg L–1
y 1.730 3.612 1.210 2.096 5.551 3.739
Optimal removal, % R 88.47 84.94 93.95 89.52 72.24 81.30
Cathode:+
(aq) 2 (g)8H 8 4He−+ → (6)
Total:
(s) 2 (l) 2 (g) 2 (g) 2 (s)2Fe 6H O O 4H 2Fe(OH)+ → + + (7)
Reaction (7) takes into account the observed produc-tions of O2 and H2 and the apparition of green-dark flocs. Similar mechanisms have been proposed by sev-eral authors such as [36] who indicated that the formed Fe(OH)n(s) (n = 2,3) remains in the solution as a gelatinous suspension which can remove the pollutants from waste-water either by complexation or by electrostatic attraction, followed by coagulation. In the surface complexation mode, the pollutant acts as a ligand (L) to chemically bind hydrous iron [36]:
(aq) (s) (s) 2 (l)L-H (OH)OFe L-OFe H O+ → + (8)
In our case, a ligand is HA so Reaction (8) may be as follows:
(aq) (s) (s) 2 (l)HA-H (OH)OFe HA-OFe H O+ → + (9)
3.3.2. Al electrodes
These observations are noted: intense emission of H2 at the cathode and formation of white foam at the surface; apparition of white particles in the solution which migrate
D. Ghernaout et al. / Desalination and Water Treatment 22 (2010) 311–329 321
Tabl
e 11
Resi
dues
for:
BI-E
C (C
0 = 1
5; 2
0 m
g L–1
), EM
T-BI
EC-D
P us
ing
Al e
lect
rode
s (C
0 = 2
0 m
g L–1
), an
d EM
T-BI
EC-H
P us
ing
Al e
lect
rode
s (C
0 = 2
0 m
g L–1
)
BI-E
C (C
0 = 1
5 m
g L–1
)BI
-EC
(C0 =
20
mg
L–1)
EMT-
BIEC
-DP
usin
g A
l ele
ctro
des
(C0 =
20
mg
L–1)
EMT-
BIEC
-HP
usin
g A
l ele
ctro
des
(C0 =
20
mg
L–1)
Yy
Resi
due
Yy
Resi
due
Yy
Resi
due
Yy
Resi
due
Test
17.
167
7.16
70.
000
8.34
78.
347
0.00
08.
333
8.37
5–0
.042
8.66
98.
710
–0.0
40Te
st 2
5.04
25.
521
–0.4
796.
935
7.26
5–0
.329
6.54
76.
910
–0.3
686.
532
6.73
4–0
.202
Test
35.
792
5.31
30.
479
8.46
88.
138
0.32
97.
292
6.92
40.
368
5.60
55.
403
0.20
2Te
st 4
4.70
85.
187
–0.4
796.
008
6.33
7–0
.329
4.95
85.
326
–0.3
684.
556
4.75
8–0
.202
Test
54.
542
4.06
30.
497
6.04
85.
719
0.32
95.
042
4.67
40.
368
4.15
33.
952
0.20
2Te
st 6
4.20
84.
687
–0.4
796.
371
6.70
0–0
.329
6.25
06.
618
–0.3
684.
395
4.59
7–0
.202
Test
76.
500
6.02
1
0.47
96.
774
6.44
50.
329
7.62
57.
257
0.36
86.
935
6.73
40.
202
Test
87.
167
7.16
70.
000
138.
360
138.
360.
000
8.37
58.
375
0.00
08.
710
8.71
00.
000
Test
97.
167
7.16
70.
000
138.
370
138.
360.
010
8.41
78.
375
0.04
28.
750
8.71
00.
040
322 D. Ghernaout et al. / Desalination and Water Treatment 22 (2010) 311–329
to the anode where they form white depositing; foam formation increases with the time; depositing volume in-creases at the surface and beside of the anode. Further, the maximum of the HA removal which was obtained at pH 4 can be explained as follows: dissolved OM is removed by CN; when pH >4, Al(OH)3(s) is the predominant form of Al: HA adsorption on Al hydroxide prevail over. The BI-EC effect is consequently remarkable: once the flocs are formed, they are carried away by H2 bubbles to the surface.
3.3.3. Stainless steel electrodes
These observations are noted: emission of H2 at the cathode and O2 at the anode and formation of white foam at the surface; the solution becomes yellow; apparition of brown particles in the solution which migrate to the anode where they form brown depositing; foam forma-tion increases with the time; depositing volume increases at the surface and beside of the anode.3.4. Comparison between the three electrodes
Globally for BI-EC and EMT-BIEC processes, Al is the most efficient in the UV absorbance reduction of HA solution: Al electrodes produce Al3+ while Fe electrodes produce Fe2+ (which can pass as Fe3+ in some conditions such as oxygen presence). Therefore, the +3 valence is an advantage for Al. Besides, Al in flocs form is more float-able than Fe (Fe is three times denser than Al). On the other hand, HA macromolecules as they are negatively charged attract Al3+/Fe2+ which are liberated from the
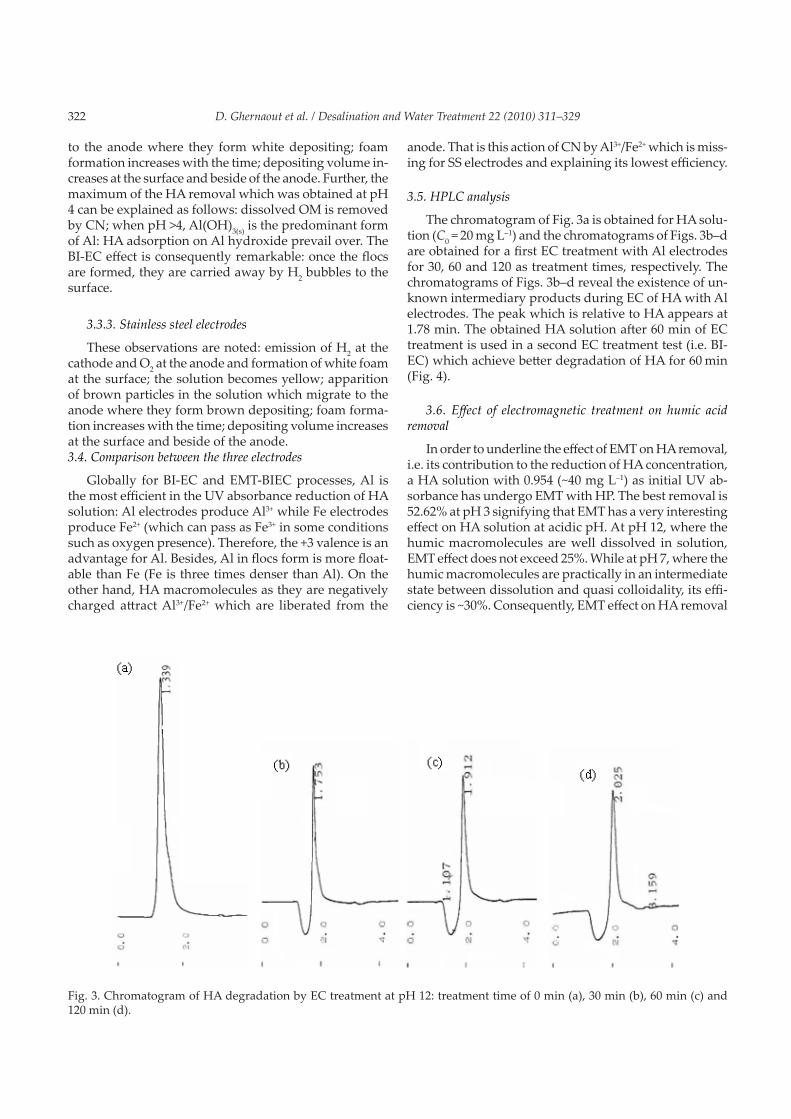
Fig. 3. Chromatogram of HA degradation by EC treatment at pH 12: treatment time of 0 min (a), 30 min (b), 60 min (c) and 120 min (d).
anode. That is this action of CN by Al3+/Fe2+ which is miss-ing for SS electrodes and explaining its lowest efficiency.
3.5. HPLC analysis
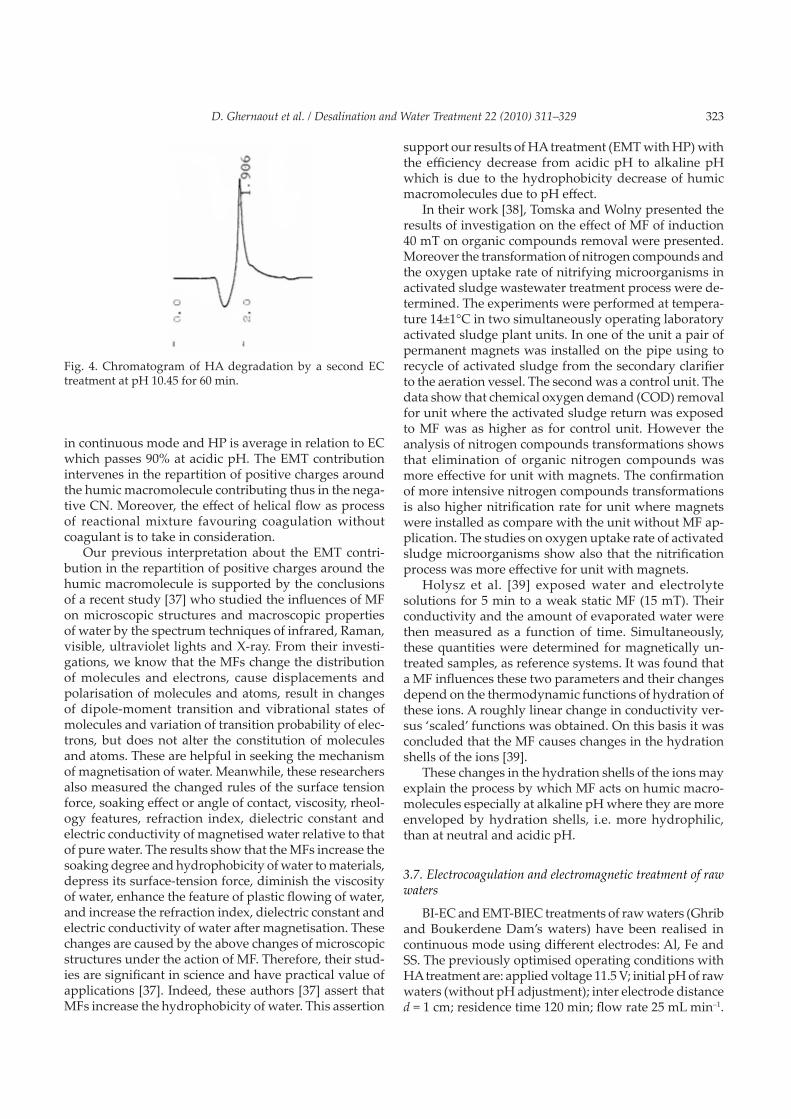
The chromatogram of Fig. 3a is obtained for HA solu-tion (C0 = 20 mg L–1) and the chromatograms of Figs. 3b–d are obtained for a first EC treatment with Al electrodes for 30, 60 and 120 as treatment times, respectively. The chromatograms of Figs. 3b–d reveal the existence of un-known intermediary products during EC of HA with Al electrodes. The peak which is relative to HA appears at 1.78 min. The obtained HA solution after 60 min of EC treatment is used in a second EC treatment test (i.e. BI-EC) which achieve better degradation of HA for 60 min (Fig. 4).
3.6. Effect of electromagnetic treatment on humic acid removal
In order to underline the effect of EMT on HA removal, i.e. its contribution to the reduction of HA concentration, a HA solution with 0.954 (~40 mg L–1) as initial UV ab-sorbance has undergo EMT with HP. The best removal is 52.62% at pH 3 signifying that EMT has a very interesting effect on HA solution at acidic pH. At pH 12, where the humic macromolecules are well dissolved in solution, EMT effect does not exceed 25%. While at pH 7, where the humic macromolecules are practically in an intermediate state between dissolution and quasi colloidality, its effi-ciency is ~30%. Consequently, EMT effect on HA removal
D. Ghernaout et al. / Desalination and Water Treatment 22 (2010) 311–329 323
in continuous mode and HP is average in relation to EC which passes 90% at acidic pH. The EMT contribution intervenes in the repartition of positive charges around the humic macromolecule contributing thus in the nega-tive CN. Moreover, the effect of helical flow as process of reactional mixture favouring coagulation without coagulant is to take in consideration.
Our previous interpretation about the EMT contri-bution in the repartition of positive charges around the humic macromolecule is supported by the conclusions of a recent study [37] who studied the influences of MF on microscopic structures and macroscopic properties of water by the spectrum techniques of infrared, Raman, visible, ultraviolet lights and X-ray. From their investi-gations, we know that the MFs change the distribution of molecules and electrons, cause displacements and polarisation of molecules and atoms, result in changes of dipole-moment transition and vibrational states of molecules and variation of transition probability of elec-trons, but does not alter the constitution of molecules and atoms. These are helpful in seeking the mechanism of magnetisation of water. Meanwhile, these researchers also measured the changed rules of the surface tension force, soaking effect or angle of contact, viscosity, rheol-ogy features, refraction index, dielectric constant and electric conductivity of magnetised water relative to that of pure water. The results show that the MFs increase the soaking degree and hydrophobicity of water to materials, depress its surface-tension force, diminish the viscosity of water, enhance the feature of plastic flowing of water, and increase the refraction index, dielectric constant and electric conductivity of water after magnetisation. These changes are caused by the above changes of microscopic structures under the action of MF. Therefore, their stud-ies are significant in science and have practical value of applications [37]. Indeed, these authors [37] assert that MFs increase the hydrophobicity of water. This assertion
Fig. 4. Chromatogram of HA degradation by a second EC treatment at pH 10.45 for 60 min.
support our results of HA treatment (EMT with HP) with the efficiency decrease from acidic pH to alkaline pH which is due to the hydrophobicity decrease of humic macromolecules due to pH effect.
In their work [38], Tomska and Wolny presented the results of investigation on the effect of MF of induction 40 mT on organic compounds removal were presented. Moreover the transformation of nitrogen compounds and the oxygen uptake rate of nitrifying microorganisms in activated sludge wastewater treatment process were de-termined. The experiments were performed at tempera-ture 14±1°C in two simultaneously operating laboratory activated sludge plant units. In one of the unit a pair of permanent magnets was installed on the pipe using to recycle of activated sludge from the secondary clarifier to the aeration vessel. The second was a control unit. The data show that chemical oxygen demand (COD) removal for unit where the activated sludge return was exposed to MF was as higher as for control unit. However the analysis of nitrogen compounds transformations shows that elimination of organic nitrogen compounds was more effective for unit with magnets. The confirmation of more intensive nitrogen compounds transformations is also higher nitrification rate for unit where magnets were installed as compare with the unit without MF ap-plication. The studies on oxygen uptake rate of activated sludge microorganisms show also that the nitrification process was more effective for unit with magnets.
Holysz et al. [39] exposed water and electrolyte solutions for 5 min to a weak static MF (15 mT). Their conductivity and the amount of evaporated water were then measured as a function of time. Simultaneously, these quantities were determined for magnetically un-treated samples, as reference systems. It was found that a MF influences these two parameters and their changes depend on the thermodynamic functions of hydration of these ions. A roughly linear change in conductivity ver-sus ‘scaled’ functions was obtained. On this basis it was concluded that the MF causes changes in the hydration shells of the ions [39].
These changes in the hydration shells of the ions may explain the process by which MF acts on humic macro-molecules especially at alkaline pH where they are more enveloped by hydration shells, i.e. more hydrophilic, than at neutral and acidic pH.
3.7. Electrocoagulation and electromagnetic treatment of raw waters
BI-EC and EMT-BIEC treatments of raw waters (Ghrib and Boukerdene Dam’s waters) have been realised in continuous mode using different electrodes: Al, Fe and SS. The previously optimised operating conditions with HA treatment are: applied voltage 11.5 V; initial pH of raw waters (without pH adjustment); inter electrode distance d = 1 cm; residence time 120 min; flow rate 25 mL min–1.

324 D. Ghernaout et al. / Desalination and Water Treatment 22 (2010) 311–329
Table 12 presents physicochemical and bacteriological parameters of Boukerdene Dam’s water, treated water in Sidi-Amar Station, and treated waters by BI-EC, EMT-BIEC-HP, EMT-BIEC-DP and their accepted standards by the Algerian Waters Company (AWC) (close to WHO guidelines) and Table 13 presents physicochemical and bacteriological parameters of Ghrib and treated water by EMT-BIEC. First, EC efficiency in terms of microorgan-isms’ removal is confirmed [40–43] as microbiological tests relative to total and faecal coliforms and Strepto-coccus show the absence of these microorganisms after electrochemical treatment [44]. Recently, Jeong et al. [41] have demonstrated that the electrochemical inactivation of Escherichia coli (E. coli) without chlorine production was demonstrated to occur in two distinct stages. The first stage inactivation takes place rapidly at the begin-ning of electrolysis, which appears to be achieved by the electrosorption of negatively charged E. coli cells to the anode surface, followed by a direct electron transfer reaction. As the electrolysis continues further, the inacti-vation becomes slower but steady, in contrast to the first stage of inactivation. This was attributed to the action of reactive oxidants generated from water discharge, such as hydroxyl radical [41]. Table 14 presents the removal of
Table 12Physicochemical and bacteriological parameters of: Boukerdene Dam’s (BD) water (13/05/07), treated water in Sidi-Amar Sta-tion (SAS), and treated waters by BI-EC (BI-EC1: Al-Al, BI-EC2: SS-Al), EMT-BIEC-HP (Al-Al), EMT-BIEC-DP (DP1: Fe-Fe, DP2: Al-Al, DP3: Fe-Al) and their accepted standards by the Algerian Waters Company (AWC) (close to WHO guidelines)
Parameters BD SAS BI-EC1 BI-EC2 HP DP1 DP2 DP3 AWC standards
Turbidity, NTU 6.15 0.84 0.72 0.48 0.69 3.5 1.2 0.8 <5pH 7.87 7.67 8.09 7.31 7.92 8.8 7.2 7.8 6.5–8.5Temperature, °C 16.4 17.7 27 27 27 27 27 26 <25Conductivity, mS cm–1 at 25°C 0.656 0.667 0.58 0.62 0.27 0.38 0.67 0.38 <3.10Total coliforms 742 0 0 0 0 0 0 0 <10/100 mLFaecal coliforms 742 0 0 0 0 0 0 0 <0/100 mLStreptococcus 0 0 0 0 0 0 0 0 <0/100 mLSulphates, mg L–1 143 — — — — — — — <400Ammonium, mg L–1 0.02 0.01 0.08 4 0.8 1.2 2.4 1.5 <0.5Phosphates, mg L–1 0.08 0.06 — — — — — — <0.5Nitrates, mg L–1 0 — — — — — — — <50Iron, mg L–1 0.3 — — — — — — — <0.3KMnO4 oxidability, mg L–1 5.1 0.32 0.08 4 0.8 1.2 2.4 1.5 <3COD, mg O2 L–1 7.8 — — — — — — — <3Dry residue, mg L–1 1716 — — — — — — — <2000Total hardness, mg L–1 as CaCO3 300 260 160 180 140 40 221 120 <500Calcium, mg L–1 48 56 40 56 48 16 56 32 <200Magnesium, mg L–1 43.2 29 14 10 5 0 19 10 <150Nitrites, mg L–1 0.03 0.01 — — — — — — <0.1TAC, mg CaCO3 L–1 150 130 100 60 80 125 45 70 <500Chlorides, mg L–1 54 60 68 80 64 48 72 64 <500HCO3
–, mg L–1 183 159 122 73 98 153 55 85 <98
turbidity as function of type of treatment for Boukerdene Dam’s water; pH, conductivity, total hardness and KMnO4 oxidability of treated water (data of Table 12). Table 14 illustrates the influence of treatment type on turbidity removal. A best turbidity removal is achieved at 92% by BI-EC with combined electrodes (anode: SS, cathode: Al). However, turbidity is less reduced when Fe electrodes are used for EMT-BIEC-DP treatment. This may be explained by the fact that the turbidity of Boukerdene Dam’s water being relatively low (6.15 NTU) is better removed by Al species than Fe species (as Al is less dense than Fe). Fur-ther, treatment type influences final pH and conductivity: all pH values are in the range 6.5–8.5 with the exception of EMT-BIEC-DP treatment using Fe electrodes where pH is 8.8, conductivity is best reduced at 94% for EMT-BIEC-DP treatment using Fe as anode and Al as cathode.
On one hand, total hardness is best reduced (87%) for EMT-BIEC-DP with Fe electrodes while it is less reduced (26%) for BI-EC with Al electrodes (Table 14). Indeed, white depositing (CaCO3(s)) was observed on Fe elec-trodes. When anode is Fe and cathode Al, total hardness is reduced at 60% for EMT-BIEC-DP. On the other hand, OM in the form of KMnO4 oxidability (mg L–1) is best removed (98%) for BI-EC using Al electrodes (Table 14).
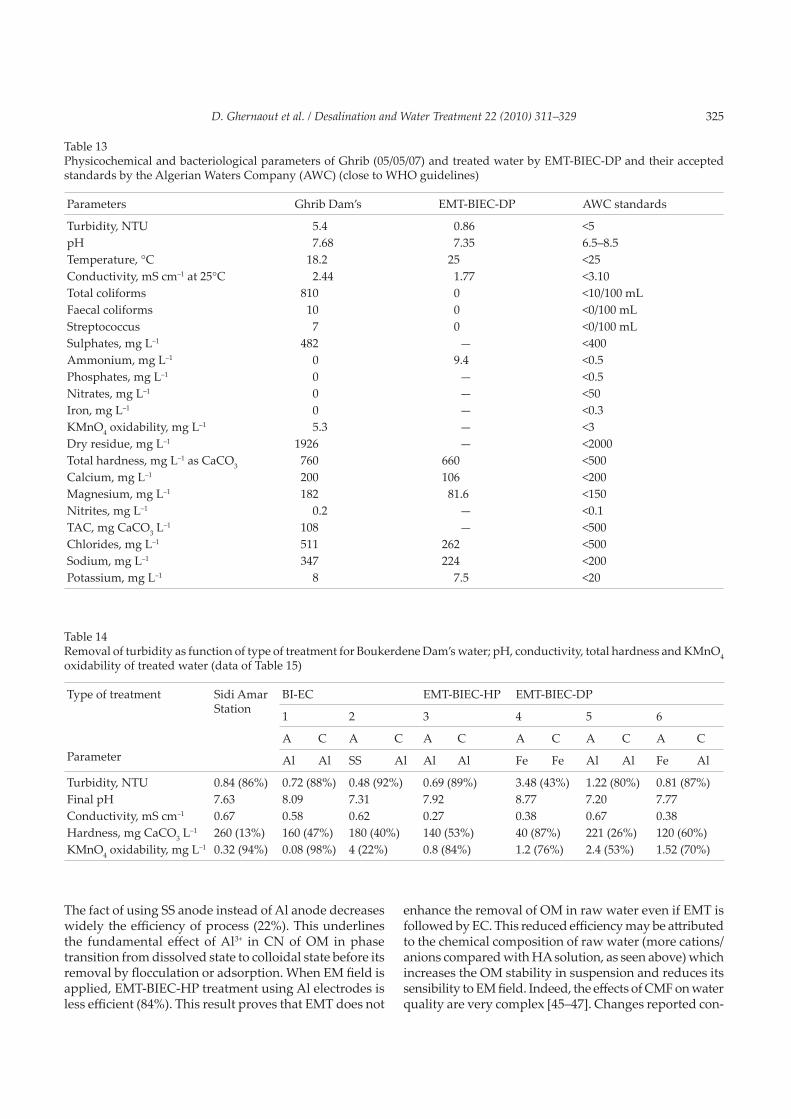
D. Ghernaout et al. / Desalination and Water Treatment 22 (2010) 311–329 325
Table 13Physicochemical and bacteriological parameters of Ghrib (05/05/07) and treated water by EMT-BIEC-DP and their accepted standards by the Algerian Waters Company (AWC) (close to WHO guidelines)
Parameters Ghrib Dam’s EMT-BIEC-DP AWC standards
Turbidity, NTU 5.4 0.86 <5pH 7.68 7.35 6.5–8.5Temperature, °C 18.2 25 <25Conductivity, mS cm–1 at 25°C 2.44 1.77 <3.10Total coliforms 810 0 <10/100 mLFaecal coliforms 10 0 <0/100 mLStreptococcus 7 0 <0/100 mLSulphates, mg L–1 482 — <400Ammonium, mg L–1 0 9.4 <0.5Phosphates, mg L–1 0 — <0.5Nitrates, mg L–1 0 — <50Iron, mg L–1 0 — <0.3KMnO4 oxidability, mg L–1 5.3 — <3Dry residue, mg L–1 1926 — <2000Total hardness, mg L–1 as CaCO3 760 660 <500Calcium, mg L–1 200 106 <200Magnesium, mg L–1 182 81.6 <150Nitrites, mg L–1 0.2 — <0.1TAC, mg CaCO3 L–1 108 — <500Chlorides, mg L–1 511 262 <500Sodium, mg L–1 347 224 <200Potassium, mg L–1 8 7.5 <20
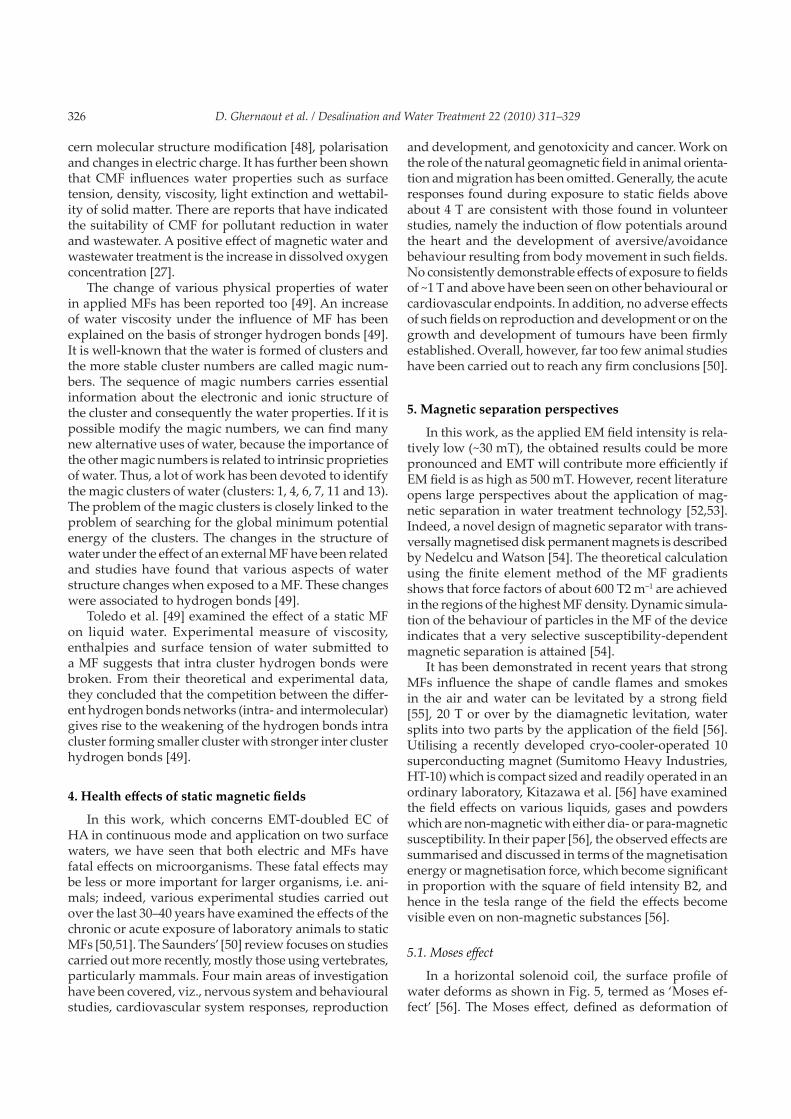
Table 14Removal of turbidity as function of type of treatment for Boukerdene Dam’s water; pH, conductivity, total hardness and KMnO4 oxidability of treated water (data of Table 15)
Type of treatment
Parameter
Sidi Amar Station
BI-EC EMT-BIEC-HP EMT-BIEC-DP
1 2 3 4 5 6
A C A C A C A C A C A C
Al Al SS Al Al Al Fe Fe Al Al Fe Al
Turbidity, NTU 0.84 (86%) 0.72 (88%) 0.48 (92%) 0.69 (89%) 3.48 (43%) 1.22 (80%) 0.81 (87%)Final pH 7.63 8.09 7.31 7.92 8.77 7.20 7.77Conductivity, mS cm–1 0.67 0.58 0.62 0.27 0.38 0.67 0.38Hardness, mg CaCO3 L–1 260 (13%) 160 (47%) 180 (40%) 140 (53%) 40 (87%) 221 (26%) 120 (60%)KMnO4 oxidability, mg L–1 0.32 (94%) 0.08 (98%) 4 (22%) 0.8 (84%) 1.2 (76%) 2.4 (53%) 1.52 (70%)
The fact of using SS anode instead of Al anode decreases widely the efficiency of process (22%). This underlines the fundamental effect of Al3+ in CN of OM in phase transition from dissolved state to colloidal state before its removal by flocculation or adsorption. When EM field is applied, EMT-BIEC-HP treatment using Al electrodes is less efficient (84%). This result proves that EMT does not
enhance the removal of OM in raw water even if EMT is followed by EC. This reduced efficiency may be attributed to the chemical composition of raw water (more cations/anions compared with HA solution, as seen above) which increases the OM stability in suspension and reduces its sensibility to EM field. Indeed, the effects of CMF on water quality are very complex [45–47]. Changes reported con-
326 D. Ghernaout et al. / Desalination and Water Treatment 22 (2010) 311–329
cern molecular structure modification [48], polarisation and changes in electric charge. It has further been shown that CMF influences water properties such as surface tension, density, viscosity, light extinction and wettabil-ity of solid matter. There are reports that have indicated the suitability of CMF for pollutant reduction in water and wastewater. A positive effect of magnetic water and wastewater treatment is the increase in dissolved oxygen concentration [27].
The change of various physical properties of water in applied MFs has been reported too [49]. An increase of water viscosity under the influence of MF has been explained on the basis of stronger hydrogen bonds [49]. It is well-known that the water is formed of clusters and the more stable cluster numbers are called magic num-bers. The sequence of magic numbers carries essential information about the electronic and ionic structure of the cluster and consequently the water properties. If it is possible modify the magic numbers, we can find many new alternative uses of water, because the importance of the other magic numbers is related to intrinsic proprieties of water. Thus, a lot of work has been devoted to identify the magic clusters of water (clusters: 1, 4, 6, 7, 11 and 13). The problem of the magic clusters is closely linked to the problem of searching for the global minimum potential energy of the clusters. The changes in the structure of water under the effect of an external MF have been related and studies have found that various aspects of water structure changes when exposed to a MF. These changes were associated to hydrogen bonds [49].
Toledo et al. [49] examined the effect of a static MF on liquid water. Experimental measure of viscosity, enthalpies and surface tension of water submitted to a MF suggests that intra cluster hydrogen bonds were broken. From their theoretical and experimental data, they concluded that the competition between the differ-ent hydrogen bonds networks (intra- and intermolecular) gives rise to the weakening of the hydrogen bonds intra cluster forming smaller cluster with stronger inter cluster hydrogen bonds [49].
4. Health effects of static magnetic fields
In this work, which concerns EMT-doubled EC of HA in continuous mode and application on two surface waters, we have seen that both electric and MFs have fatal effects on microorganisms. These fatal effects may be less or more important for larger organisms, i.e. ani-mals; indeed, various experimental studies carried out over the last 30–40 years have examined the effects of the chronic or acute exposure of laboratory animals to static MFs [50,51]. The Saunders’ [50] review focuses on studies carried out more recently, mostly those using vertebrates, particularly mammals. Four main areas of investigation have been covered, viz., nervous system and behavioural studies, cardiovascular system responses, reproduction
and development, and genotoxicity and cancer. Work on the role of the natural geomagnetic field in animal orienta-tion and migration has been omitted. Generally, the acute responses found during exposure to static fields above about 4 T are consistent with those found in volunteer studies, namely the induction of flow potentials around the heart and the development of aversive/avoidance behaviour resulting from body movement in such fields. No consistently demonstrable effects of exposure to fields of ~1 T and above have been seen on other behavioural or cardiovascular endpoints. In addition, no adverse effects of such fields on reproduction and development or on the growth and development of tumours have been firmly established. Overall, however, far too few animal studies have been carried out to reach any firm conclusions [50].
5. Magnetic separation perspectives
In this work, as the applied EM field intensity is rela-tively low (~30 mT), the obtained results could be more pronounced and EMT will contribute more efficiently if EM field is as high as 500 mT. However, recent literature opens large perspectives about the application of mag-netic separation in water treatment technology [52,53]. Indeed, a novel design of magnetic separator with trans-versally magnetised disk permanent magnets is described by Nedelcu and Watson [54]. The theoretical calculation using the finite element method of the MF gradients shows that force factors of about 600 T2 m–1 are achieved in the regions of the highest MF density. Dynamic simula-tion of the behaviour of particles in the MF of the device indicates that a very selective susceptibility-dependent magnetic separation is attained [54].
It has been demonstrated in recent years that strong MFs influence the shape of candle flames and smokes in the air and water can be levitated by a strong field [55], 20 T or over by the diamagnetic levitation, water splits into two parts by the application of the field [56]. Utilising a recently developed cryo-cooler-operated 10 superconducting magnet (Sumitomo Heavy Industries, HT-10) which is compact sized and readily operated in an ordinary laboratory, Kitazawa et al. [56] have examined the field effects on various liquids, gases and powders which are non-magnetic with either dia- or para-magnetic susceptibility. In their paper [56], the observed effects are summarised and discussed in terms of the magnetisation energy or magnetisation force, which become significant in proportion with the square of field intensity B2, and hence in the tesla range of the field the effects become visible even on non-magnetic substances [56].
5.1. Moses effect
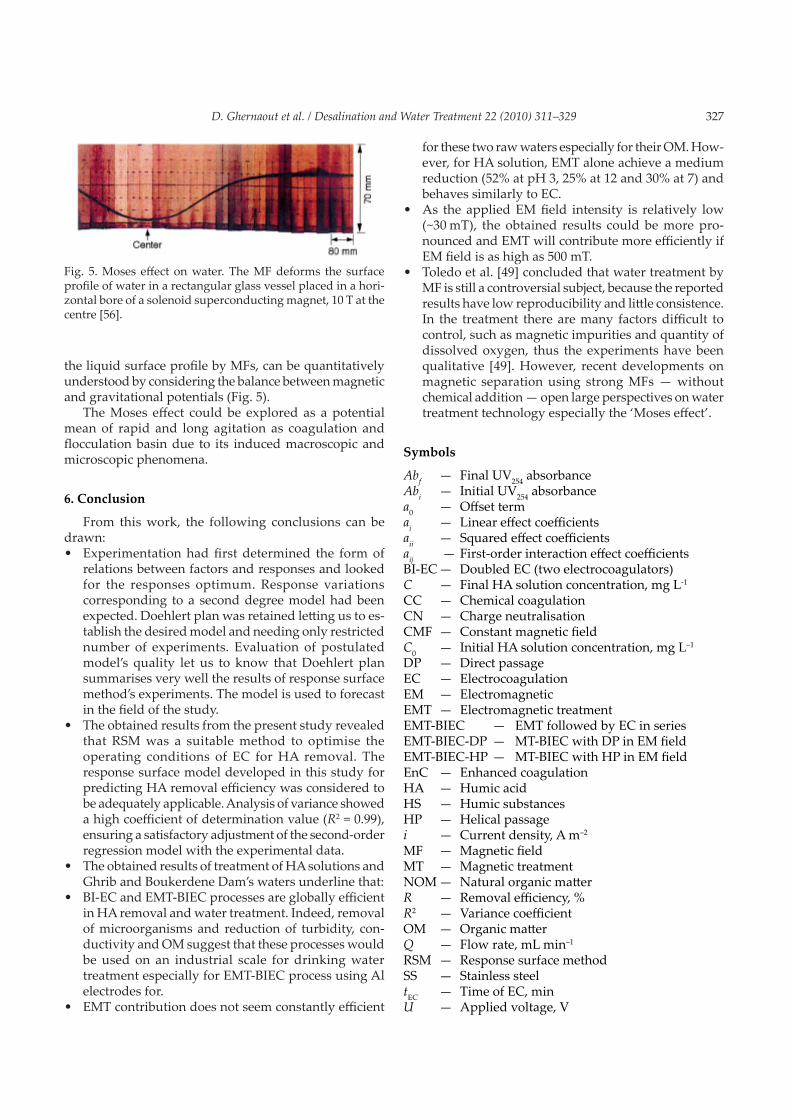
In a horizontal solenoid coil, the surface profile of water deforms as shown in Fig. 5, termed as ‘Moses ef-fect’ [56]. The Moses effect, defined as deformation of
D. Ghernaout et al. / Desalination and Water Treatment 22 (2010) 311–329 327
the liquid surface profile by MFs, can be quantitatively understood by considering the balance between magnetic and gravitational potentials (Fig. 5).
The Moses effect could be explored as a potential mean of rapid and long agitation as coagulation and flocculation basin due to its induced macroscopic and microscopic phenomena.
6. Conclusion
From this work, the following conclusions can be drawn:
• Experimentation had first determined the form of relations between factors and responses and looked for the responses optimum. Response variations corresponding to a second degree model had been expected. Doehlert plan was retained letting us to es-tablish the desired model and needing only restricted number of experiments. Evaluation of postulated model’s quality let us to know that Doehlert plan summarises very well the results of response surface method’s experiments. The model is used to forecast in the field of the study.
• The obtained results from the present study revealed that RSM was a suitable method to optimise the operating conditions of EC for HA removal. The response surface model developed in this study for predicting HA removal efficiency was considered to be adequately applicable. Analysis of variance showed a high coefficient of determination value (R2 = 0.99), ensuring a satisfactory adjustment of the second-order regression model with the experimental data.
• The obtained results of treatment of HA solutions and Ghrib and Boukerdene Dam’s waters underline that:
• BI-EC and EMT-BIEC processes are globally efficient in HA removal and water treatment. Indeed, removal of microorganisms and reduction of turbidity, con-ductivity and OM suggest that these processes would be used on an industrial scale for drinking water treatment especially for EMT-BIEC process using Al electrodes for.
• EMT contribution does not seem constantly efficient
Fig. 5. Moses effect on water. The MF deforms the surface profile of water in a rectangular glass vessel placed in a hori-zontal bore of a solenoid superconducting magnet, 10 T at the centre [56].
for these two raw waters especially for their OM. How-ever, for HA solution, EMT alone achieve a medium reduction (52% at pH 3, 25% at 12 and 30% at 7) and behaves similarly to EC.
• As the applied EM field intensity is relatively low (~30 mT), the obtained results could be more pro-nounced and EMT will contribute more efficiently if EM field is as high as 500 mT.
• Toledo et al. [49] concluded that water treatment by MF is still a controversial subject, because the reported results have low reproducibility and little consistence. In the treatment there are many factors difficult to control, such as magnetic impurities and quantity of dissolved oxygen, thus the experiments have been qualitative [49]. However, recent developments on magnetic separation using strong MFs — without chemical addition — open large perspectives on water treatment technology especially the ‘Moses effect’.
Symbols
Abf — Final UV254 absorbance Abi — Initial UV254 absorbance a0 — Offset termai — Linear effect coefficientsaii — Squared effect coefficientsaij — First-order interaction effect coefficientsBI-EC — Doubled EC (two electrocoagulators)C — Final HA solution concentration, mg L-1
CC — Chemical coagulationCN — Charge neutralisationCMF — Constant magnetic field C0 — Initial HA solution concentration, mg L–1
DP — Direct passageEC — ElectrocoagulationEM — ElectromagneticEMT — Electromagnetic treatment EMT-BIEC — EMT followed by EC in seriesEMT-BIEC-DP — MT-BIEC with DP in EM fieldEMT-BIEC-HP — MT-BIEC with HP in EM fieldEnC — Enhanced coagulationHA — Humic acidHS — Humic substancesHP — Helical passagei — Current density, A m–2
MF — Magnetic fieldMT — Magnetic treatmentNOM — Natural organic matterR — Removal efficiency, %R2 — Variance coefficientOM — Organic matterQ — Flow rate, mL min–1
RSM — Response surface methodSS — Stainless steeltEC — Time of EC, minU — Applied voltage, V

328 D. Ghernaout et al. / Desalination and Water Treatment 22 (2010) 311–329
x1 — Factor 1 (pH of the solution)x2 — Factor 2 (voltage U, V)y — Predicted response (HA removal efficiency, %)
Acknowledgements
The authors wish to acknowledge the financial sup-port made by the National Agency of University Research Development (ANDRU) (JO 901/01/06/04 project in 2004). The authors would like to address great thanks to the Reviewers for their constructive comments which effec-tively helped to refine this paper; really, if there is a final quality of this manuscript that is thanks to there precious minutes during three long review processes.
References[1] A.J. Motheo and L. Pinhedo, Electrochemical degradation of HA,
Sci. Total Environ., 256 (2000) 67–76.[2] Y.Ş. Yildiz, A.S. Koparal and B. Keskinler, Effect of initial pH
and supporting electrolyte on the treatment of water containing high concentration of humic substances by electrocoagulation, Chem. Eng. J., 138 (2008) 63–72.
[3] (a) A.S. Koparal, Y.Ş. Yildiz, B. Keskinler, N. Demircioğlu, Effect of initial pH on the removal of humic substances from wastewa-ter by electrocoagulation, Sep. Purif. Technol. 59 (2008) 175–182; (b) M. Vepsäläinen, J. Selin, M. Pulliainen and M. Sillanpää, Combined electrocoagulation and chemical coagulation of pa-per mill mechanically cleaned water, J. Pulp Pap. Sci., 33 (2007) 233–239; (c) M. Vepsäläinen, M. Ghiasvand, J. Selin, J. Pienimaa, E. Repo, M. Pulliainen and M. Sillanpää, Investigations of the effects of temperature and initial sample pH on natural organic matter (NOM) removal with electrocoagulation using response surface method (RSM), Sep. Purif. Technol., 69 (2009) 255–261.
[4] J.A Leenheer and T.I. Noyes, A filtration and column adsorption system for onsite concentration and fractionation of organic substances from large volumes of water, US Geological Survey Water Supply, 1984, Paper 2230.
[5] P. Bose and D.A. Reckhow, The effect of ozonation on natural organic matter removal by alum coagulation, Water Res., 41 (2007) 1516–1524.
[6] J.K. Edzwald, Coagulation in drinking water treatment: particles, organics and coagulants, Water Sci. Technol., 27 (1993) 21–25.
[7] Q. Xiangli, Z. Zhenjia, W. Nongcun, V. Wee, M. Low, C.S. Loh and N.T. Hing, Coagulation pretreatment for a large-scale ultrafiltra-tion process treating water from the Taihu River, Desalination, 230 (2008) 305–313.
[8] P. Cañizares, C. Jiménez, F. Martínez, M.A. Rodrigo and C. Sáez, The pH as a key parameter in the choice between coagulation and electrocoagulation for the treatment of wastewaters, J. Hazard. Mater., 163 (2009) 158–164.
[9] K. Bensadok, S. Benammar, F. Lapicque and G. Nezzal, Elec-trocoagulation of cutting oil emulsions using aluminium plate electrodes, J. Hazard. Mater., 152 (2008) 423–430.
[10] K. Jumpatong, W. Phutdhawong and D. Buddhasukh, Dechloro-phyllation by electrocoagulation, Molecules, 11 (2006) 156–162.
[11] Y. Yavuz, EC and EF processes for the treatment of alcohol distillery wastewater, Separ. Purif. Technol., 53 (2007) 135–140.
[12] T. Ölmez, The optimization of Cr(VI) reduction and removal by electrocoagulation using response surface methodology, J. Hazard. Mater., 162 (2009) 1371–1378.
[13] F. Zidane, P. Drogui, B. Lekhlif, J. Bensaid, J.-F. Blais, S. Belcadi and K. El Kacemi, Decolourization of dye-containing effluent using mineral coagulants produced by electrocoagulation, J. Hazard. Mater., 155 (2008) 153–163.
[14] C.-Y. Hu, S.-L. Lo, W.-H. Kuan and Y.-D. Lee, Treatment of high fluoride-content wastewater by continuous electrocoagulation–flotation system with bipolar aluminum electrodes, Separ. Purif. Technol., 60 (2008) 1–5.
[15] C. Escobar, C. Soto-Salazar and M.I. Toral, Optimization of the electrocoagulation process for the removal of copper, lead and cadmium in natural waters and simulated wastewater, J. Environ. Manage., 81 (2006) 384–391.
[16] Y.Ş. Yildiz, Optimization of Bomaplex Red CR-L dye removal from aqueous solution by electrocoagulation using aluminum electrodes, J. Hazard. Mater., 153 (2008) 194–200.
[17] M. Khemis, G. Tanguy, J.P. Leclerc, G. Valentin and F. Lapique, Electrocoagulation for the treatment of oil suspensions. Rela-tion between the rates of electrode reactions and the efficiency of waste removal, Trans. IChE, Part B, Process Safety Environ. Protection, 83 (2005) 50–57.
[18] I. Heidmann and W. Calmano, Removal of Zn(II), Cu(II), Ni(II), Ag(I) and Cr(VI) present in aqueous solutions by aluminium electrocoagulation, J. Hazard. Mater., 152 (2008) 934–941.
[19] G.H. Azarian, A.R. Mesdaghinia, F. Vaezi, R. Nabizadeh and D. Nematollahi, Algae removal by electro-coagulation process, application for treatment of the effluent from an industrial waste-water treatment plant, Iranian J. Publ. Health, 36 (2007) 57–64.
[20] G. Sayiner, F. Kandemirli and A. Dimoglo, Evaluation of boron removal by electrocoagulation using iron and aluminum elec-trodes, Desalination, 230 (2008) 205–212.
[21] C.-T. Wang, W.-L. Chou and Y.-M. Kuo, Removal of COD from laundry wastewater by electrocoagulation/electroflotation, J. Hazard. Mater., 164 (2009) 81–86.
[22] M. Asselin, P. Drogui, H. Benmoussa and J.-F. Blais, Effectiveness of electrocoagulation process in removing organic compounds from slaughterhouse wastewater using monopolar and bipolar electrolytic cells, Chemosphere, 72 (2008) 1727–1733.
[23] A. Bagga, S. Chellam and D.A. Clifford, Evaluation of iron chemical coagulation and electrocoagulation pretreatment for surface water microfiltration, J. Membr. Sci., 309 (2008) 82–93.
[24] D. Ghosh, H. Solanki and M.K. Purkait, Removal of Fe(II) from tap water by electrocoagulation technique, J. Hazard. Mater., 155 (2008) 135–143.
[25] N. Daneshvar, A.R. Khataee and N. Djafarzadeh, The use of artificial neural networks (ANN) for modeling of decolorization of textile dye solution containing C.I. Basic Yellow 28 by electro-coagulation process, J. Hazard. Mater., B137 (2006) 1788–1795.
[26] M.M. Emamjomeh and M. Sivakumar, Fluoride removal by a continuous flow electrocoagulation reactor, J. Environ. Manage., 90 (2009) 1204–1212.
[27] M. Krzemieniewski, M. Teodorowicz, M. Debowski and J. Pesta, Effect of a constant magnetic field on water quality and rearing of European sheatfish Silurus glanis L. larvae, Aquaculture Res., 35 (2004) 568–573.
[28] V. Rocher, J.-M. Siaugue, V. Cabuil and A. Bee, Removal of organic dyes by magnetic alginate beads, Water Res., 42 (2008) 1290–1298.
[29] M.F. Ni’am, F. Othman, J. Sohaili and Z. Fauzia, Combined mag-netic field and electrocoagulation process for suspended solid removal from wastewater, Proc. 1st International Conference on Natural Resources Engineering and Technology, Putrajaya, Malaysia, 2006, pp. 384–393.
[30] M. Tir and N. Moulai-Mostefa, Optimization of oil removal from oily wastewater by electrocoagulation using response surface method, J. Hazard. Mater., 158 (2008) 107–115.
[31] S. Kobe, G. Drazic, P.J. McGuiness and J. Strazisar, The influ-ence of the magnetic field on the crystallization form of calcium carbonate and the testing of a magnetic water-treatment device, J. Magn. Mater., 236 (2001) 71–76.
[32] J. Goupy, Pratiquer les plans d’expériences, Dunod, France, 2005.[33] Q.-Y. Feng, X.-D. Li, Y.-J. Cheng, L. Meng and Q.-J. Meng, Re-
moval of humic acid from groundwater by electrocoagulation,
D. Ghernaout et al. / Desalination and Water Treatment 22 (2010) 311–329 329
J. China Univ. Mining Technol., 17 (2007) 513–515.[34] D. Ghernaout, B. Ghernaout, A. Saiba, A. Boucherit, A. Boucherit
and A. Kellil, Removal of humic acids by continuous electromag-netic treatment followed by electrocoagulation in batch using aluminium electrodes, Desalination, 239 (2009) 295–308.
[35] M. Pourbaix, Atlas d’équilibres électrochimiques, Gauthiers Villard, France, 1963.
[36] A. Aleboyeh, N. Daneshvar and M.B. Kasiri, Optimization of C.I. Acid Red 14 azo dye removal by electrocoagulation batch process with response surface methodology, Chem. Eng. Pro-cess., 47 (2008) 827–832.
[37] P. Xiao-Feng and D. Bo, The changes of macroscopic features and microscopic structures of water under influence of magnetic field, Physica, B403 (2008) 3571–3577.
[38] A. Tomska and L. Wolny, Enhancement of biological wastewater treatment by magnetic field exposure, Desalination, 222 (2008) 368–373.
[39] L. Holysz, A. Szczes and E. Chibowski, Effects of a static mag-netic field on water and electrolyte solutions, J. Colloid Interf. Sci., 316 (2007) 996–1002.
[40] D.-Q. Chen, S.-S. Huang and Y.-J. Lu, Efficient transformation of Legionella pneumophila by high-voltage electroporation, Micro-biol. Res., 161 (2006) 246–251.
[41] J. Jeong, J. Y. Kim, M. Cho, W. Choi and J. Yoon, Inactivation of Escherichia coli in the electrochemical disinfection process using a Pt anode, Chemosphere, 67 (2007) 652–659.
[42] Y. Delaedt, A. Daneels, P. Declerck, J. Behets, J. Ryckeboer, E. Peters and F. Ollevier, The impact of electrochemical disinfec-tion on Escherichia coli and Legionella pneumophila in tap water, Microbiol. Res., 163 (2008) 192–199.
[43] D. Ghernaout, A. Badis, A. Kellil and B. Ghernaout, Application of electrocoagulation in Escherichia coli culture and two surface waters, Desalination, 219 (2008) 118–125.
[44] S. Yi, Y. Ma, X. Wang and Y. Jia, Green chemistry: Pretreatment of seawater by a one-step electrochemical method, Desalination,
239 (2009) 247–256.[45] F. Alimi, M. Tlili, M. Ben Amor, C. Gabrielli and G. Maurin,
Influence of magnetic field on calcium carbonate precipitation, Desalination, 206 (2007) 163–168.
[46] L.C. Lipus and D. Dobersek, Influence of magnetic field on the aragonite precipitation, Chem. Eng. Sci., 62 (2007) 2089–2095.
[47] M. Colic and D. Morse, The elusive mechanism of the magnetic ‘memory’ of water, Colloids Surf. A: Physicochem. Eng. Aspects, 154 (1999) 167–174.
[48] V. Bashtovoi, M. Kovalev and A. Reks, Separation of bubbles from solid surfaces in magnetic fluids, J. Magn. Magn. Mater., 289 (2005) 382–384.
[49] E.J.L. Toledo, T.C. Ramalho and Z.M. Magriotis, Influence of magnetic field on physical–chemical properties of the liquid water: Insights from experimental and theoretical models, J. Molec. Struct., 888 (2008) 409–415.
[50] R. Saunders, Static magnetic fields: animal studies, Prog. Bio-phys. Mol. Biol., 87 (2005) 225–239.
[51] M. Feychting, Health effects of static magnetic fields — A review of the epidemiological evidence, Prog. Biophys. Mol. Biol., 87 (2005) 241–246.
[52] C.V. Vedavyasan, Potential use of magnetic fields — a perspec-tive, Desalination, 134 (2001) 105–108.
[53] W. Gong and K. Pi, Magnetic field coupled with electrochemi-cal process for enhancing Al13 formation, Desal. Wat. Treat., 2 (2009) 272–277.
[54] S. Nedelcu and J.H.P. Watson, Magnetic separator with trans-versally magnetised disk permanent magnets, Minerals Eng., 15 (2002) 355–359.
[55] M. Tagami, M. Hamai, I. Mogi, K. Watanabe and M. Motokawa, Solidification of levitating water in a gradient strong magnetic field, J. Cryst. Growth, 203 (1999) 594–598.
[56] K. Kitazawa, Y. Ikezoe, H. Uetake and N. Hirota, Magnetic field effects on water, air and powders, Physica, B294–295 (2001) 709–714.