Main and interactive effects of warming, clipping, and doubled precipitation on soil CO2 efflux in a...
12
Main and interactive effects of warming, clipping, and doubled precipitation on soil CO 2 efflux in a grassland ecosystem Xuhui Zhou, Rebecca A. Sherry, Yuan An, 1 Linda L. Wallace, and Yiqi Luo Department of Botany and Microbiology, University of Oklahoma, Norman, Oklahoma, USA Received 4 April 2005; revised 23 August 2005; accepted 7 November 2005; published 14 January 2006. [1] We conducted two experiments, one long term with a 2°C increase (Experiment 1) and one short term with a 4.4°C increase (Experiment 2), to investigate main and interactive effects of warming, clipping, and doubled precipitation on soil CO 2 efflux and its temperature sensitivity in a U.S. tallgrass prairie. On average, warming increased soil CO 2 efflux by 13.0% (p < 0.01) in Experiment 1, by 22.9% (p < 0.0001) in Experiment 2, and by 26.6% (p < 0.0001) in the transient study of Experiment 2. Doubled precipitation resulted in an increase of 9.0% (p < 0.05) in soil CO 2 efflux in Experiment 2. Yearly clipping did not significantly affect soil CO 2 efflux (p = 0.66) in Experiment 1, while clipping decreased soil CO 2 efflux by 16.1% (p < 0.05) in the transient study. Temperature sensitivity of soil CO 2 efflux significantly decreased from an apparent Q 10 value of 2.51 in unwarmed plots to 2.02 in warmed plots without extra precipitation and from 2.57 to 2.23 with doubled precipitation in Experiment 2. No significant interactive effects among the experimental factors were statistically found on soil CO 2 efflux or their temperature sensitivities except for the warming clipping interaction (p < 0.05) in the transient study. Our observed minor interactive effects relative to main ones suggest that results from single-factor experiments are useful in informing us of potential responses of soil CO 2 efflux to multifactor global change, at least in our ecosystem. Citation: Zhou, X., R. A. Sherry, Y. An, L. L. Wallace, and Y. Luo (2006), Main and interactive effects of warming, clipping, and doubled precipitation on soil CO 2 efflux in a grassland ecosystem, Global Biogeochem. Cycles, 20, GB1003, doi:10.1029/2005GB002526. 1. Introduction [2] Global warming resulting from CO 2 and other green- house gases is expected to increase the mean global tem- perature by 1.4 5.8°C by the end of this century [Intergovernmental Panel on Climate Change (IPCC), 2001]. In the US Great Plains, air temperature is predicted to increase by 2° to 4°C with doubling of current CO 2 concentration [Long and Hutchin, 1991]. In addition, an- thropogenic climate change likely will result in increasingly altered precipitation regimes. The anticipated increase in precipitation is about 0.5 to 1% per decade in this century globally [IPCC, 2001] and may occur in heavy rainfall events by 16–22% per decade in the southern Great Plains, United States [Kunkel et al., 1999]. Warmer temperature and increased precipitation would likely alter the fluxes of carbon from soil to the atmosphere (i.e., soil CO 2 efflux). [3] Soil CO 2 efflux, commonly referred to as soil respi- ration, represents CO 2 release at the soil surface from microbial respiration during organic matter decomposition and rhizosphere respiration by live roots and their sym- bionts [Boone et al., 1998; Ho ¨gberg et al., 2001, Wan and Luo, 2003]. This flux is the largest terrestrial source of CO 2 to the atmosphere, which is about 68 to 80 Pg C yr 1 on a global scale [Raich and Schlesinger, 1992; Raich and Potter, 1995]. Global modeling studies have demonstrated that even a small change in soil CO 2 emissions could significantly exacerbate or mitigate the buildup of this greenhouse gas in the atmosphere [Cramer et al., 2001], with consequent feedbacks to climate change [Woodwell et al., 1998; Cox et al., 2000]. Therefore understanding regulations of soil CO 2 efflux by major environmental factors is a critical step toward projecting climate change in the future. [4] Past research has demonstrated that the rate of CO 2 production in the soil varies strongly with temperature [Peterjohn et al., 1993; Rustad et al., 2001], moisture availability [Liu et al., 2002; Xu et al., 2004], and substrate supply [Bremer et al., 1998; Craine et al., 1999]. The majority of the studies that investigated responses of soil CO 2 efflux to the above-mentioned variables have been carried out in single-factor experiments. These single-factor experiments have considerably advanced our understanding of ecosystem responses to climate change. For example, GLOBAL BIOGEOCHEMICAL CYCLES, VOL. 20, GB1003, doi:10.1029/2005GB002526, 2006 1 Now at College of Agriculture and Biology, Shanghai Jiaotong University, Shanghai, China. Copyright 2006 by the American Geophysical Union. 0886-6236/06/2005GB002526$12.00 GB1003 1 of 12
Transcript of Main and interactive effects of warming, clipping, and doubled precipitation on soil CO2 efflux in a...
Main and interactive effects of warming, clipping, and doubled
precipitation on soil CO2 efflux in a grassland ecosystem
Xuhui Zhou, Rebecca A. Sherry, Yuan An,1 Linda L. Wallace, and Yiqi LuoDepartment of Botany and Microbiology, University of Oklahoma, Norman, Oklahoma, USA
Received 4 April 2005; revised 23 August 2005; accepted 7 November 2005; published 14 January 2006.
[1] We conducted two experiments, one long term with a 2�C increase (Experiment 1)and one short term with a 4.4�C increase (Experiment 2), to investigate main andinteractive effects of warming, clipping, and doubled precipitation on soil CO2 efflux andits temperature sensitivity in a U.S. tallgrass prairie. On average, warming increasedsoil CO2 efflux by 13.0% (p < 0.01) in Experiment 1, by 22.9% (p < 0.0001) inExperiment 2, and by 26.6% (p < 0.0001) in the transient study of Experiment 2. Doubledprecipitation resulted in an increase of 9.0% (p < 0.05) in soil CO2 efflux in Experiment 2.Yearly clipping did not significantly affect soil CO2 efflux (p = 0.66) in Experiment 1,while clipping decreased soil CO2 efflux by 16.1% (p < 0.05) in the transient study.Temperature sensitivity of soil CO2 efflux significantly decreased from an apparent Q10
value of 2.51 in unwarmed plots to 2.02 in warmed plots without extra precipitation andfrom 2.57 to 2.23 with doubled precipitation in Experiment 2. No significantinteractive effects among the experimental factors were statistically found on soil CO2
efflux or their temperature sensitivities except for the warming � clipping interaction(p < 0.05) in the transient study. Our observed minor interactive effects relative to mainones suggest that results from single-factor experiments are useful in informing us ofpotential responses of soil CO2 efflux to multifactor global change, at least in ourecosystem.
Citation: Zhou, X., R. A. Sherry, Y. An, L. L. Wallace, and Y. Luo (2006), Main and interactive effects of warming, clipping, and
doubled precipitation on soil CO2 efflux in a grassland ecosystem, Global Biogeochem. Cycles, 20, GB1003,
doi:10.1029/2005GB002526.
1. Introduction
[2] Global warming resulting from CO2 and other green-house gases is expected to increase the mean global tem-perature by 1.4 � 5.8�C by the end of this century[Intergovernmental Panel on Climate Change (IPCC),2001]. In the US Great Plains, air temperature is predictedto increase by 2� to 4�C with doubling of current CO2
concentration [Long and Hutchin, 1991]. In addition, an-thropogenic climate change likely will result in increasinglyaltered precipitation regimes. The anticipated increase inprecipitation is about 0.5 to 1% per decade in this centuryglobally [IPCC, 2001] and may occur in heavy rainfallevents by 16–22% per decade in the southern Great Plains,United States [Kunkel et al., 1999]. Warmer temperatureand increased precipitation would likely alter the fluxes ofcarbon from soil to the atmosphere (i.e., soil CO2 efflux).[3] Soil CO2 efflux, commonly referred to as soil respi-
ration, represents CO2 release at the soil surface from
microbial respiration during organic matter decompositionand rhizosphere respiration by live roots and their sym-bionts [Boone et al., 1998; Hogberg et al., 2001, Wan andLuo, 2003]. This flux is the largest terrestrial source of CO2
to the atmosphere, which is about 68 to 80 Pg C yr�1 on aglobal scale [Raich and Schlesinger, 1992; Raich andPotter, 1995]. Global modeling studies have demonstratedthat even a small change in soil CO2 emissions couldsignificantly exacerbate or mitigate the buildup of thisgreenhouse gas in the atmosphere [Cramer et al., 2001],with consequent feedbacks to climate change [Woodwell etal., 1998; Cox et al., 2000]. Therefore understandingregulations of soil CO2 efflux by major environmentalfactors is a critical step toward projecting climate changein the future.[4] Past research has demonstrated that the rate of CO2
production in the soil varies strongly with temperature[Peterjohn et al., 1993; Rustad et al., 2001], moistureavailability [Liu et al., 2002; Xu et al., 2004], and substratesupply [Bremer et al., 1998; Craine et al., 1999]. Themajority of the studies that investigated responses of soilCO2 efflux to the above-mentioned variables have beencarried out in single-factor experiments. These single-factorexperiments have considerably advanced our understandingof ecosystem responses to climate change. For example,
GLOBAL BIOGEOCHEMICAL CYCLES, VOL. 20, GB1003, doi:10.1029/2005GB002526, 2006
1Now at College of Agriculture and Biology, Shanghai JiaotongUniversity, Shanghai, China.
Copyright 2006 by the American Geophysical Union.0886-6236/06/2005GB002526$12.00
GB1003 1 of 12
warming experiments have indicated average increases of20% in soil CO2 efflux across a range of temperatureincreases, with greater increases in the first few years[Rustad et al., 2001]. Clipping, instead, significantlyreduces soil CO2 efflux by 19–49% [Bremer et al., 1998;Wan and Luo, 2003]. Increased rainfall variability and/orreduced rainfall amount usually decrease soil CO2 efflux[Harper et al., 2005].[5] Unlike common single-factor experiments, global
change involves simultaneous changes in multiple factors,which could potentially have complex interactive influenceson ecosystem structure and processes. For example, datafrom a grassland site in California showed that elevatedCO2 suppressed the effects of increased temperature, pre-cipitation, and N deposition on net primary production(NPP) in the third year of manipulations (2000–2001). Thatresult indicates that the multifactor responses to globalchanges differed greatly from simple combinations ofsingle-factor responses [Shaw et al., 2002]. Conversely,interactive effects of warming with elevated atmosphericCO2 on soil CO2 efflux were not observed in other studies[Edwards and Norby, 1998; Lin et al., 2001; Niinisto et al.,2004]. Thus evaluating multifactor interactions in influenc-ing ecosystem structure and processes is critical to under-standing their response to global change in the real world.Indeed, when interactive effects dominate over the maineffects of individual factors, results from single-factorexperiments become less useful for understanding ecosys-tem changes. In the case that interactive effects are minorrelative to main effects, results from single-factor experi-ments may become useful in informing us of potentialchanges of ecosystems in response to multifactor globalchange.[6] In this study, we took advantage of two ongoing
experiments to evaluate main and interactive effects of threefactors, warming, clipping, and doubled precipitation, onsoil CO2 efflux and its temperature sensitivity in a grasslandecosystem. Experiment 1 was designed to examine effectsof long-term warming plus yearly clipping on communitystructure and ecosystem processes [Luo et al., 2001; Wan etal., 2005]. Experiment 2 was to examine ecosystemresponses to short-term (i.e., 1 year) warming and doubledprecipitation. To examine transient responses of soil CO2
efflux to substrate supply, we also clipped abovegroundbiomass in autumn of 2003 in Experiment 2. We hypoth-esized that warming and doubled precipitation would
increase soil CO2 efflux and clipping would decrease it. Wealso hypothesized that interactive effects of the three factorswould occur on soil CO2 efflux and its temperature sensitiv-ity. To test these hypotheses, we measured soil CO2 efflux atmonthly intervals and derived basal respiration rates andtemperature sensitivity coefficients by fitting an exponentialequation to measured soil CO2 efflux and soil temperature.Repeated measures analysis of variance (RM-ANOVA) wasapplied for significance tests of treatment effects on soil CO2
efflux. T-tests of regression coefficients were performed toexamine adjustments in temperature-respiration relationshipsunder different treatments.
2. Materials and Methods
2.1. Site Description
[7] The experiments were conducted at the Great PlainsApiaries in McClain County, Oklahoma (34�590N,97�310W), approximately 40 km southwest of the Normancampus of the University of Oklahoma. It is a 137.6-ha farmlocated in the Central Redbed Plains of Oklahoma [Tarr etal., 1980]. The study site is an upland tallgrass prairiedominated by four C4 grasses (Schizachyrium scoparium,Sorghastrum nutans, Andropogon gerardii, and Panicumvirgatum), two C3 forbs (Ambrosia psilostachyia andXanthocephalum texanum), and one winter-dominant C3
grass (Bromus japonicus). The four C4 grasses representapproximately 75% of the total plant biomass (R. Sherryand Y. Luo, unpublished data, 2003). Mean annual temper-ature is 16.3�C, with monthly air temperature rangingfrom 3.3�C in January to 28.1�C in July. Mean annualprecipitation is 915 mm, with monthly precipitation rangingfrom 30 mm in January to 135 mm in May (average valuesfrom 1948 to 1998, Oklahoma Climatological Survey). Asilt loam soil in the grassland includes 35.3% sand, 55.0%silt, and 9.7% clay (A. Subedar and Y. Luo, unpublisheddata, 2003). Soil carbon content is 1.42% on a mass basis[Luo et al., 2001]. The soil belongs to part of the Nash-Lucien complex with neutral pH, high available watercapacity, and a deep, moderately penetrable root zone[U.S. Department of Agriculture (USDA), 1979].
2.2. Experimental Design
[8] We used two ongoing experiments to examine mainand interactive effects of warming, clipping, and doubledprecipitation on soil CO2 efflux and its temperature sensi-
Table 1. Comparison of Experiment 1, Experiment 2, and the Transient Studya
Experiment 1b Experiment 2c Transient Studyd
Treatments warming and yearly clipping warming and doubled precipitation clipping, warming, and doubled precipitationWarming period 21 November 1999 to present 20 February 2003 to 20 February 2004 20 February 2003 to 20 February 2004Warming effects on soil temperature
Monthly measurement 1.48�C (5 cm) 2.73�C (5 cm) 2.63�C (5 cm)Hourly record 2.0�C (2.5 cm) 4.4�C (2 cm) 4.3�C (2 cm)
Warming effects on soil moistureMonthly measurement �1.24% (0–15 cm) – �2.47% (0–15 cm)Hourly record – �5.68% (0–15 cm) –
aMeasurement depths of soil temperature and moisture given in parentheses.bLong-term experiment with warming and yearly clipping treatments.cShort-term (1 year) experiment with warming and doubled precipitation treatments.dConducted in Experiment 2 from 16 September to 21 November 2003.
GB1003 ZHOU ET AL.: MAIN AND INTERACTIVE EFFECTS ON SOIL CO2 EFFLUX
2 of 12
GB1003
tivity. Experiment 1 examined the long-term warming/yearly clipping effects on ecosystem processes, whereasExperiment 2 investigated ecosystem responses to one-yearwarming/doubled precipitation and subsequent-year lageffects on biogeochemical processes (Table 1). In addition,the transient responses to clipping in Experiment 2 werestudied in contrast with yearly clipping in Experiment 1.The two experiments and the transient study are describedbelow.
2.2.1. Experiment 1[9] The experiment was conducted at a site of old-field
tallgrass prairie abandoned from crop field 30 years agowithout grazing for 27 years. The field experiment used apaired, nested design with warming as the main factor andclipping as a secondary factor. Twelve 2 � 2 m plots weredivided into six pairs of control (i.e., unwarmed) andwarmed plots. In each warmed plot, one 165 � 15 cminfrared heater (Kalglo Electronics Inc., Bethlehem, Penn-sylvania) has a radiation output of 100 Watts m�2 and wassuspended in the middle of each plot at the height of 1.5mabove the ground. The height of 1.5 m was determined byconsiderations of vegetation height and radiative energyoutput. The heating is on year around, 24 hours per day and365 days per year in the field. To simulate shading effects ofheaters, we installed one ‘‘dummy’’ heater made of metalflashing with the same shape and size as the heating deviceover each control plot. A previous study by Wan et al.[2002] has documented that warming increased daily meanair temperature at 25 cm above the ground by 1.1�C and soiltemperature at the 2.5-cm depth by 2.0�C. Each 2 � 2 mplot was divided into four 1 � 1 m subplots. Plants in twodiagonal subplots were clipped at the height of 10 cm abovethe ground yearly, usually in July. The other two were theunclipped control. Usually farmers and ranchers in thesouthern Great Plains mow grass pasture once to twiceper year, depending on rainfall. Our study site is ratherxeric, yearly clipping mimic hay mowing once a year. Eachtreatment, control (C), warmed (W), clipped (CL), andwarmed plus clipped (W + CL), had six replicates.2.2.2. Experiment 2[10] The experiment was situated approximately 500 m
away from Experiment 1. Twenty 3 � 2 m plots wereestablished in two rows that were separated by approxi-mately 3 m. Within one row, the distance between plots was1.5 m. Half of the plots were randomly selected for warmingtreatments with two infrared heaters suspended in themiddle of the plots at the height of 1.5 m above the ground.The other 10 plots had ‘‘dummy’’ heaters suspended at thesame height as in the warmed plots. Five of both thewarmed and unwarmed plots were randomly selected toreceive doubled precipitation using a ‘‘rainfall collectionpan’’ device, which is an angled catchment with the samesize and shape as the plot. One rainfall collection pan wasinstalled about 40 cm above the ground with a slope lowernear the plot and 30 cm away from each doubled precipi-tation plot to funnel water onto these plots so that theamount of rainfall was doubled. The pan was connected tothree 1.8-cm (inner diameter) polyvinyl chloride (PVC)pipes with 3.0-mm holes to distribute the collected waterevenly over the plots. We also installed the PVC pipes in
those plots without extra precipitation to have uniformeffects of pipes if any. Thus, four treatments, control (C),warmed (W), doubled precipitation (PPT), and warmed plusdoubled precipitation (W + PPT), had five replicates.2.2.3. The Transient Study[11] We studied transient responses of soil CO2 efflux
to abrupt reduction in substrate supply by clipping inExperiment 2. A half of each plot was clipped at 10 cmabove the ground on 16 September 2003. Thus there wereeight treatments, control (C), warmed (W), doubled precip-itation (PPT), warmed plus doubled precipitation (W + PPT);clipped (CL), clipped plus warmed (CL + W), clipped plusdoubled precipitation (CL + PPT), and clipped plus warmedplus doubled precipitation (CL + W + PPT), with fivereplicates.
2.3. Measurement Protocols
[12] To measure soil CO2 efflux, PVC collars (80 cm2 inarea and 5 cm in height) were inserted 2–3 cm into theground at the center of each subplot or quarter at thebeginning of the experiments. Living plants inside the soilcollars were clipped at the soil surface at least 1 day beforethe measurement to eliminate aboveground plant respira-tion. The clipped plant materials were left in the collars.Measurements of soil CO2 efflux were taken monthlybetween 1000 and 1500 (local time), using a LI-COR6400 portable photosynthesis system attached to a 6400-09 soil CO2 flux chamber (LI-COR. Inc., Lincoln,Nebraska). Standard procedures recommended by LI-CORwere applied to measure soil CO2 efflux. Data wererecorded at a 5-s interval by the data logger in LI-COR6400 console. Each of the measurements usually took 1–3 min after placing the chamber over the collar.[13] Soil temperature at the depth of 5 cm was monitored
adjacent to each PVC collar using a thermocouple probe(LI-COR 6000-09TC) connected to the LI-COR 6400 at thesame time when we measured soil CO2 efflux. Data werealso logged at a 5-s interval.[14] In Experiment 1 and the transient study, volumetric
soil water content (%V) was measured using manual TimeDomain Reflectometry (TDR) equipment (SoilmoistureEquipment Corp., Santa Barbara, California) at the depthinterval of 0–15 cm. In Experiment 2, TDR probes (ESIEnvironmental Sensor Inc., Victoria, British Columbia,Canada) were used to automatically monitor soil moistureat depths of 0–15 cm, 15–30 cm, 30–60 cm, 60–90 cm,and 90–120 cm. Soil moisture data were logged hourlythrough a CR10X data logger (Campbell scientific, Inc.,Logan, Utah). However, owing to shrinking and swelling ofsoils, nine TDR probes were partially damaged or malfunc-tioned in the middle of the study. Complete data sets of soilmoisture were available only in 11 of the 20 plots. In thisstudy, the readings at the depth of 0–15 cm were usedbecause this depth is more closely associated with soilsurface CO2 efflux.[15] In Experiment 1, soil CO2 efflux, soil temperature,
and soil moisture were monthly measured in one clipped andone unclipped subplot of each plot in 2003. In Experiment 2,each plot was divided into four quarters, and monthlymeasurements of soil CO2 efflux and soil temperature were
GB1003 ZHOU ET AL.: MAIN AND INTERACTIVE EFFECTS ON SOIL CO2 EFFLUX
3 of 12
GB1003
performed in the southwest and northeast quarters fromJanuary 2002 to February 2004 except February and March2003 (3 times per month), while soil moisture was moni-tored hourly at the center of each plot. In the transient study,soil CO2 efflux, soil temperature, and soil water content(%V) were intensively measured at days 3, 9, 17, 27, 37, 49,58, 66 after clipping until 21 November 2003 in both theclipped and unclipped half plots.
2.4. Estimation of Annual Soil CO2 Efflux
[16] Annual soil CO2 efflux for each treatment wasestimated by summing the products of monthly mean soilCO2 efflux and the number of days between samples. It wascorrected further for diurnal patterns in fluxes. Our measure-ments, collected between 1000 and 1500 local time, wereassumed to represent daytime averages based on diurnal
patterns observed by Wan and Luo [2003] at a similar site.The calculated average daily efflux was 96.5% of theobserved daytime average. The corrected daily flux wasthen multiplied by the number of days between measure-ments to compute the cumulative flux over the period[Bremer et al., 1998].
2.5. Data Analysis
[17] In Experiment 2, each plot was an experimental unit,so replicate measurements were averaged by plot for anal-ysis. In addition, means of soil CO2 efflux and soiltemperature in February and March 2003 were applied tokeep monthly consistent in statistical analysis. The main andinteractive effects and temporal changes of warming, pre-cipitation, and clipping treatments on soil CO2 efflux, soiltemperature, and soil moisture were determined with arepeated measures analysis of variance (RM-ANOVA).The statistical analyses were performed in SPSS 11.0.1for windows (SPSS Inc., Chicago, 2001).[18] We assessed the sensitivity of soil CO2 efflux to soil
temperature by fitting exponential functions to the data fromindividual treatments.
Rs ¼ aebT ; ð1Þ
where Rs is soil CO2 efflux (mmol m�2 s�1), T is soiltemperature (�C) at the depth of 5 cm, a is the intercept ofsoil CO2 efflux when temperature is zero (i.e., basalrespiration rate), and b represents the temperature sensitivityof soil CO2 efflux. The b values were used to calculate arespiration quotient (Q10), which describes the change influxes over a 10�C increase in soil temperature, by
Q10 ¼ e10b: ð2Þ
Values of parameters (i.e., a, b, and Q10) derived fromseasonal data sets reflect effects of temperature and otherco-varying factors on soil CO2 efflux [Boone et al., 1998;Hogberg et al., 2001]. Thus an apparent Q10 value is used todenote the derived temperature sensitivity of soil respirationhereafter.[19] A T-test was used to assess the significance of main
and interactive effects of regression coefficients a and bamong the treatments as presented in Appendix A. Themain and interactive effects were considered to be signifi-cantly different if p < 0.05.
3. Results
3.1. Warming and Yearly Clipping Effects inExperiment 1
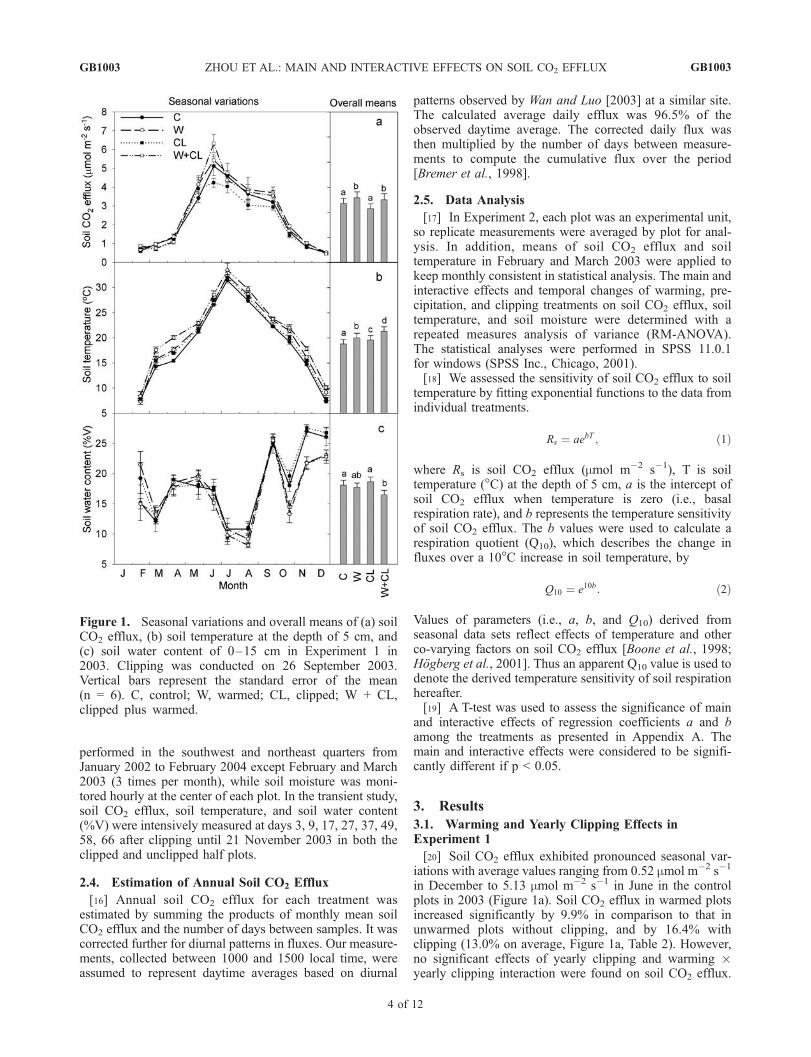
[20] Soil CO2 efflux exhibited pronounced seasonal var-iations with average values ranging from 0.52 mmol m�2 s�1
in December to 5.13 mmol m�2 s�1 in June in the controlplots in 2003 (Figure 1a). Soil CO2 efflux in warmed plotsincreased significantly by 9.9% in comparison to that inunwarmed plots without clipping, and by 16.4% withclipping (13.0% on average, Figure 1a, Table 2). However,no significant effects of yearly clipping and warming �yearly clipping interaction were found on soil CO2 efflux.
Figure 1. Seasonal variations and overall means of (a) soilCO2 efflux, (b) soil temperature at the depth of 5 cm, and(c) soil water content of 0–15 cm in Experiment 1 in2003. Clipping was conducted on 26 September 2003.Vertical bars represent the standard error of the mean(n = 6). C, control; W, warmed; CL, clipped; W + CL,clipped plus warmed.
GB1003 ZHOU ET AL.: MAIN AND INTERACTIVE EFFECTS ON SOIL CO2 EFFLUX
4 of 12
GB1003
Significant interactions occurred between warming andsampling dates and between yearly clipping and samplingdates (W � D and CL � D, Table 2).[21] Soil temperature at the depth of 5 cm showed a
similar seasonal trend as soil CO2 efflux (Figure 1b).Warming increased soil temperature by 1.23�C over thewhole year in unclipped plots and by 1.73�C in clippedplots based on monthly daytime measurements (p <0.0001, Figure 1 and Table 1). Yearly clipping increasedsoil temperature by 0.80�C relative to that in the controlplots in the daytime (p< 0.001, Figure 1b). Soil moisture (0–15 cm) fluctuated greatly over the season (Figure 1c). Thelowest soil moisture was observed in summer (July andAugust) and the highest in winter. Warming had a mar-ginally significant negative effect on soil moisture (p =0.06), while yearly clipping did not affect soil moisture(p = 0.6, Figure 1c).[22] Our analysis with equation (1) showed that soil
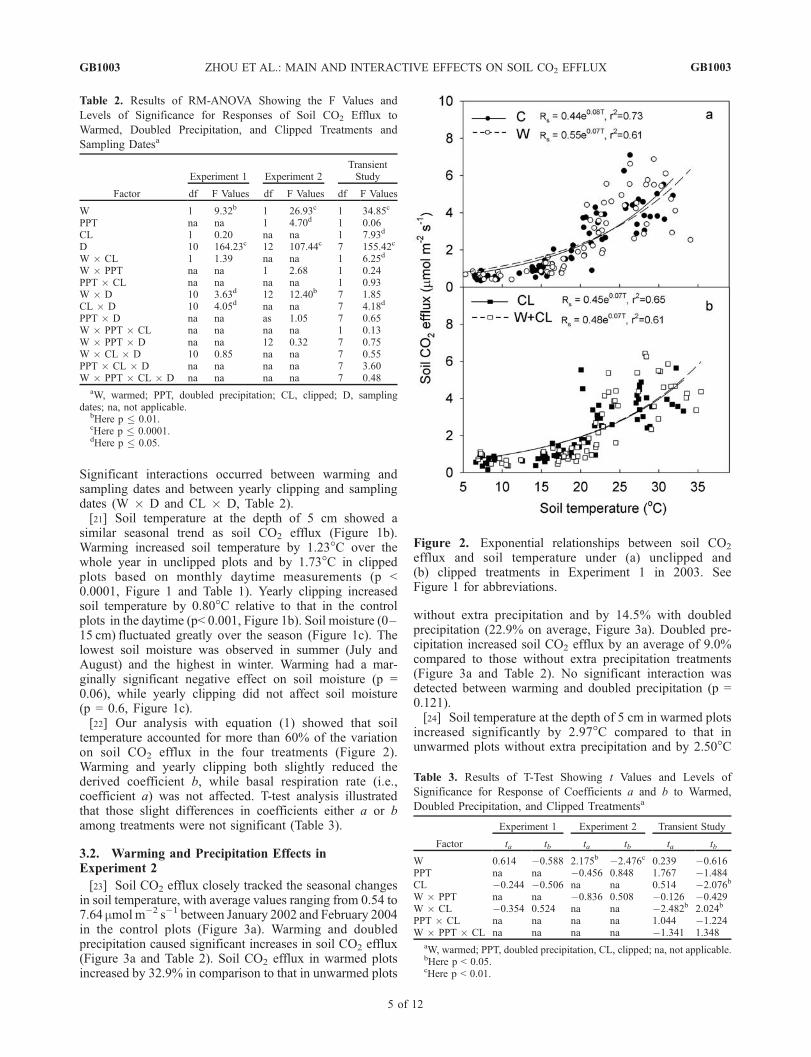
temperature accounted for more than 60% of the variationon soil CO2 efflux in the four treatments (Figure 2).Warming and yearly clipping both slightly reduced thederived coefficient b, while basal respiration rate (i.e.,coefficient a) was not affected. T-test analysis illustratedthat those slight differences in coefficients either a or bamong treatments were not significant (Table 3).
3.2. Warming and Precipitation Effects inExperiment 2
[23] Soil CO2 efflux closely tracked the seasonal changesin soil temperature, with average values ranging from 0.54 to7.64 mmol m�2 s�1 between January 2002 and February 2004in the control plots (Figure 3a). Warming and doubledprecipitation caused significant increases in soil CO2 efflux(Figure 3a and Table 2). Soil CO2 efflux in warmed plotsincreased by 32.9% in comparison to that in unwarmed plots
without extra precipitation and by 14.5% with doubledprecipitation (22.9% on average, Figure 3a). Doubled pre-cipitation increased soil CO2 efflux by an average of 9.0%compared to those without extra precipitation treatments(Figure 3a and Table 2). No significant interaction wasdetected between warming and doubled precipitation (p =0.121).[24] Soil temperature at the depth of 5 cm in warmed plots
increased significantly by 2.97�C compared to that inunwarmed plots without extra precipitation and by 2.50�C
Table 2. Results of RM-ANOVA Showing the F Values and
Levels of Significance for Responses of Soil CO2 Efflux to
Warmed, Doubled Precipitation, and Clipped Treatments and
Sampling Datesa
Factor
Experiment 1 Experiment 2TransientStudy
df F Values df F Values df F Values
W 1 9.32b 1 26.93c 1 34.85c
PPT na na 1 4.70d 1 0.06CL 1 0.20 na na 1 7.93d
D 10 164.23c 12 107.44c 7 155.42c
W � CL 1 1.39 na na 1 6.25d
W � PPT na na 1 2.68 1 0.24PPT � CL na na na na 1 0.93W � D 10 3.63d 12 12.40b 7 1.85CL � D 10 4.05d na na 7 4.18d
PPT � D na na as 1.05 7 0.65W � PPT � CL na na na na 1 0.13W � PPT � D na na 12 0.32 7 0.75W � CL � D 10 0.85 na na 7 0.55PPT � CL � D na na na na 7 3.60W � PPT � CL � D na na na na 7 0.48
aW, warmed; PPT, doubled precipitation; CL, clipped; D, samplingdates; na, not applicable.
bHere p � 0.01.cHere p � 0.0001.dHere p � 0.05.
Figure 2. Exponential relationships between soil CO2
efflux and soil temperature under (a) unclipped and(b) clipped treatments in Experiment 1 in 2003. SeeFigure 1 for abbreviations.
Table 3. Results of T-Test Showing t Values and Levels of
Significance for Response of Coefficients a and b to Warmed,
Doubled Precipitation, and Clipped Treatmentsa
Factor
Experiment 1 Experiment 2 Transient Study
ta tb ta tb ta tb
W 0.614 �0.588 2.175b �2.476c 0.239 �0.616PPT na na �0.456 0.848 1.767 �1.484CL �0.244 �0.506 na na 0.514 �2.076b
W � PPT na na �0.836 0.508 �0.126 �0.429W � CL �0.354 0.524 na na �2.482b 2.024b
PPT � CL na na na na 1.044 �1.224W � PPT � CL na na na na �1.341 1.348
aW, warmed; PPT, doubled precipitation, CL, clipped; na, not applicable.bHere p < 0.05.cHere p < 0.01.
GB1003 ZHOU ET AL.: MAIN AND INTERACTIVE EFFECTS ON SOIL CO2 EFFLUX
5 of 12
GB1003
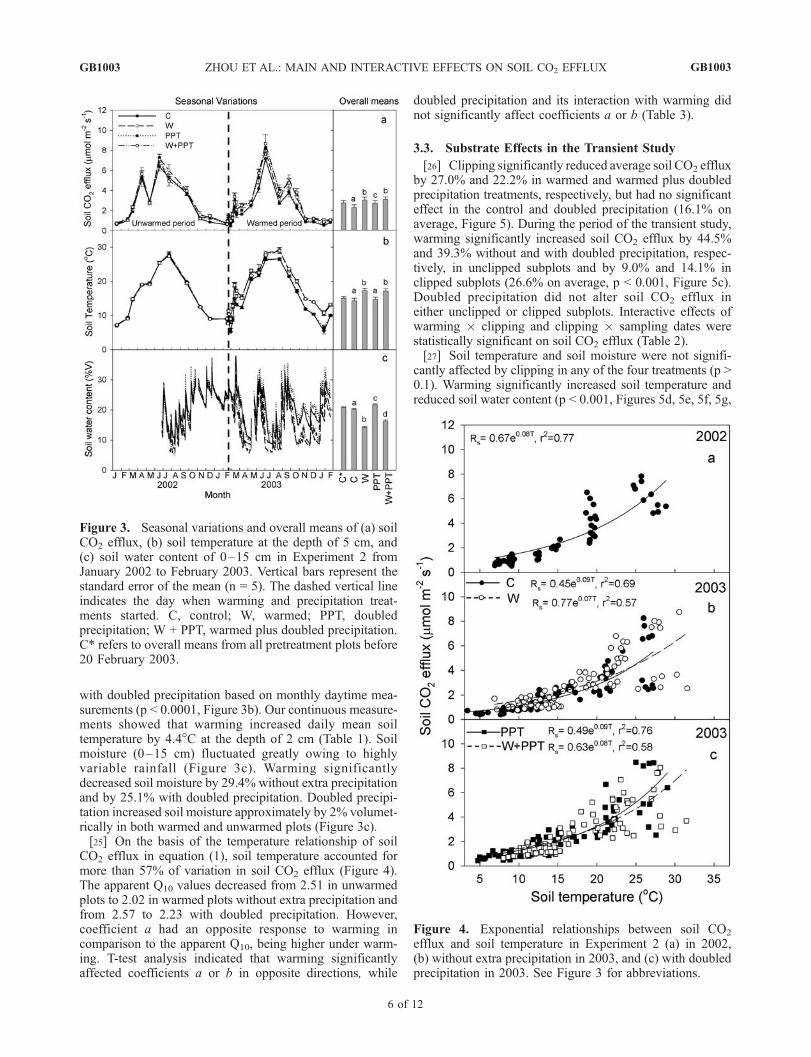
with doubled precipitation based on monthly daytime mea-surements (p < 0.0001, Figure 3b). Our continuous measure-ments showed that warming increased daily mean soiltemperature by 4.4�C at the depth of 2 cm (Table 1). Soilmoisture (0–15 cm) fluctuated greatly owing to highlyvariable rainfall (Figure 3c). Warming significantlydecreased soil moisture by 29.4% without extra precipitationand by 25.1% with doubled precipitation. Doubled precipi-tation increased soil moisture approximately by 2% volumet-rically in both warmed and unwarmed plots (Figure 3c).[25] On the basis of the temperature relationship of soil
CO2 efflux in equation (1), soil temperature accounted formore than 57% of variation in soil CO2 efflux (Figure 4).The apparent Q10 values decreased from 2.51 in unwarmedplots to 2.02 in warmed plots without extra precipitation andfrom 2.57 to 2.23 with doubled precipitation. However,coefficient a had an opposite response to warming incomparison to the apparent Q10, being higher under warm-ing. T-test analysis indicated that warming significantlyaffected coefficients a or b in opposite directions, while
doubled precipitation and its interaction with warming didnot significantly affect coefficients a or b (Table 3).
3.3. Substrate Effects in the Transient Study
[26] Clipping significantly reduced average soil CO2 effluxby 27.0% and 22.2% in warmed and warmed plus doubledprecipitation treatments, respectively, but had no significanteffect in the control and doubled precipitation (16.1% onaverage, Figure 5). During the period of the transient study,warming significantly increased soil CO2 efflux by 44.5%and 39.3% without and with doubled precipitation, respec-tively, in unclipped subplots and by 9.0% and 14.1% inclipped subplots (26.6% on average, p < 0.001, Figure 5c).Doubled precipitation did not alter soil CO2 efflux ineither unclipped or clipped subplots. Interactive effects ofwarming � clipping and clipping � sampling dates werestatistically significant on soil CO2 efflux (Table 2).[27] Soil temperature and soil moisture were not signifi-
cantly affected by clipping in any of the four treatments (p >0.1). Warming significantly increased soil temperature andreduced soil water content (p < 0.001, Figures 5d, 5e, 5f, 5g,
Figure 3. Seasonal variations and overall means of (a) soilCO2 efflux, (b) soil temperature at the depth of 5 cm, and(c) soil water content of 0–15 cm in Experiment 2 fromJanuary 2002 to February 2003. Vertical bars represent thestandard error of the mean (n = 5). The dashed vertical lineindicates the day when warming and precipitation treat-ments started. C, control; W, warmed; PPT, doubledprecipitation; W + PPT, warmed plus doubled precipitation.C* refers to overall means from all pretreatment plots before20 February 2003.
Figure 4. Exponential relationships between soil CO2
efflux and soil temperature in Experiment 2 (a) in 2002,(b) without extra precipitation in 2003, and (c) with doubledprecipitation in 2003. See Figure 3 for abbreviations.
GB1003 ZHOU ET AL.: MAIN AND INTERACTIVE EFFECTS ON SOIL CO2 EFFLUX
6 of 12
GB1003
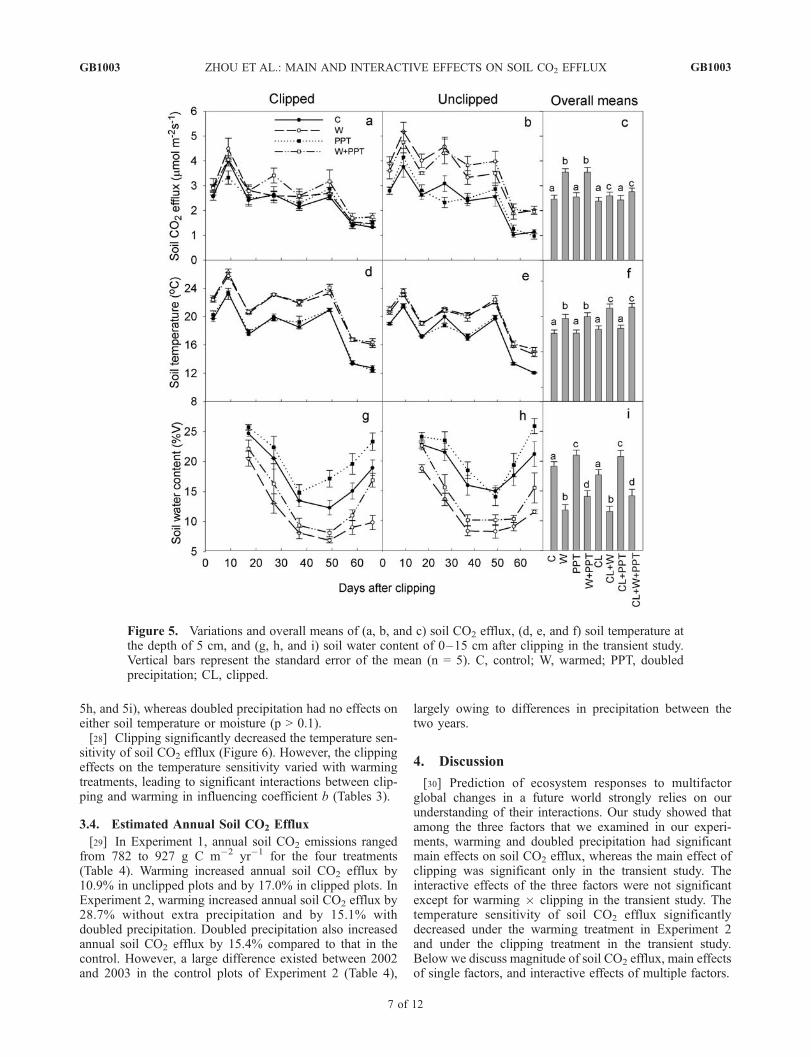
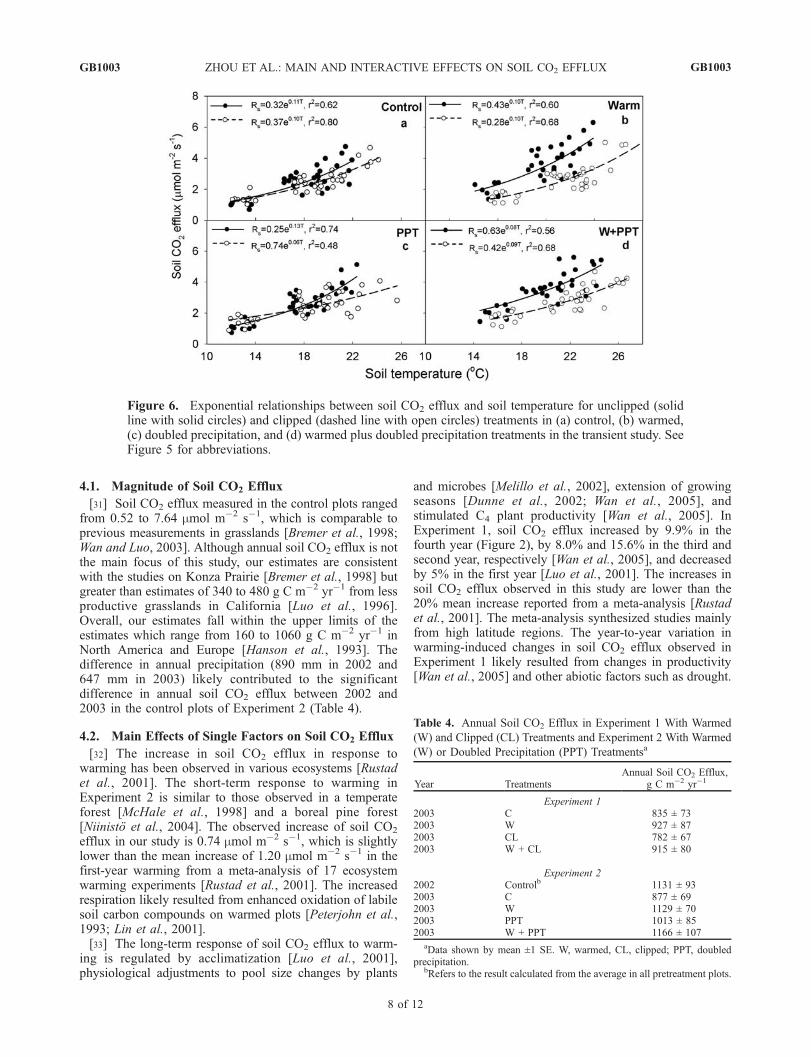
5h, and 5i), whereas doubled precipitation had no effects oneither soil temperature or moisture (p > 0.1).[28] Clipping significantly decreased the temperature sen-
sitivity of soil CO2 efflux (Figure 6). However, the clippingeffects on the temperature sensitivity varied with warmingtreatments, leading to significant interactions between clip-ping and warming in influencing coefficient b (Tables 3).
3.4. Estimated Annual Soil CO2 Efflux
[29] In Experiment 1, annual soil CO2 emissions rangedfrom 782 to 927 g C m�2 yr�1 for the four treatments(Table 4). Warming increased annual soil CO2 efflux by10.9% in unclipped plots and by 17.0% in clipped plots. InExperiment 2, warming increased annual soil CO2 efflux by28.7% without extra precipitation and by 15.1% withdoubled precipitation. Doubled precipitation also increasedannual soil CO2 efflux by 15.4% compared to that in thecontrol. However, a large difference existed between 2002and 2003 in the control plots of Experiment 2 (Table 4),
largely owing to differences in precipitation between thetwo years.
4. Discussion
[30] Prediction of ecosystem responses to multifactorglobal changes in a future world strongly relies on ourunderstanding of their interactions. Our study showed thatamong the three factors that we examined in our experi-ments, warming and doubled precipitation had significantmain effects on soil CO2 efflux, whereas the main effect ofclipping was significant only in the transient study. Theinteractive effects of the three factors were not significantexcept for warming � clipping in the transient study. Thetemperature sensitivity of soil CO2 efflux significantlydecreased under the warming treatment in Experiment 2and under the clipping treatment in the transient study.Below we discuss magnitude of soil CO2 efflux, main effectsof single factors, and interactive effects of multiple factors.
Figure 5. Variations and overall means of (a, b, and c) soil CO2 efflux, (d, e, and f) soil temperature atthe depth of 5 cm, and (g, h, and i) soil water content of 0–15 cm after clipping in the transient study.Vertical bars represent the standard error of the mean (n = 5). C, control; W, warmed; PPT, doubledprecipitation; CL, clipped.
GB1003 ZHOU ET AL.: MAIN AND INTERACTIVE EFFECTS ON SOIL CO2 EFFLUX
7 of 12
GB1003
4.1. Magnitude of Soil CO2 Efflux
[31] Soil CO2 efflux measured in the control plots rangedfrom 0.52 to 7.64 mmol m�2 s�1, which is comparable toprevious measurements in grasslands [Bremer et al., 1998;Wan and Luo, 2003]. Although annual soil CO2 efflux is notthe main focus of this study, our estimates are consistentwith the studies on Konza Prairie [Bremer et al., 1998] butgreater than estimates of 340 to 480 g C m�2 yr�1 from lessproductive grasslands in California [Luo et al., 1996].Overall, our estimates fall within the upper limits of theestimates which range from 160 to 1060 g C m�2 yr�1 inNorth America and Europe [Hanson et al., 1993]. Thedifference in annual precipitation (890 mm in 2002 and647 mm in 2003) likely contributed to the significantdifference in annual soil CO2 efflux between 2002 and2003 in the control plots of Experiment 2 (Table 4).
4.2. Main Effects of Single Factors on Soil CO2 Efflux
[32] The increase in soil CO2 efflux in response towarming has been observed in various ecosystems [Rustadet al., 2001]. The short-term response to warming inExperiment 2 is similar to those observed in a temperateforest [McHale et al., 1998] and a boreal pine forest[Niinisto et al., 2004]. The observed increase of soil CO2
efflux in our study is 0.74 mmol m�2 s�1, which is slightlylower than the mean increase of 1.20 mmol m�2 s�1 in thefirst-year warming from a meta-analysis of 17 ecosystemwarming experiments [Rustad et al., 2001]. The increasedrespiration likely resulted from enhanced oxidation of labilesoil carbon compounds on warmed plots [Peterjohn et al.,1993; Lin et al., 2001].[33] The long-term response of soil CO2 efflux to warm-
ing is regulated by acclimatization [Luo et al., 2001],physiological adjustments to pool size changes by plants
and microbes [Melillo et al., 2002], extension of growingseasons [Dunne et al., 2002; Wan et al., 2005], andstimulated C4 plant productivity [Wan et al., 2005]. InExperiment 1, soil CO2 efflux increased by 9.9% in thefourth year (Figure 2), by 8.0% and 15.6% in the third andsecond year, respectively [Wan et al., 2005], and decreasedby 5% in the first year [Luo et al., 2001]. The increases insoil CO2 efflux observed in this study are lower than the20% mean increase reported from a meta-analysis [Rustadet al., 2001]. The meta-analysis synthesized studies mainlyfrom high latitude regions. The year-to-year variation inwarming-induced changes in soil CO2 efflux observed inExperiment 1 likely resulted from changes in productivity[Wan et al., 2005] and other abiotic factors such as drought.
Figure 6. Exponential relationships between soil CO2 efflux and soil temperature for unclipped (solidline with solid circles) and clipped (dashed line with open circles) treatments in (a) control, (b) warmed,(c) doubled precipitation, and (d) warmed plus doubled precipitation treatments in the transient study. SeeFigure 5 for abbreviations.
Table 4. Annual Soil CO2 Efflux in Experiment 1 With Warmed
(W) and Clipped (CL) Treatments and Experiment 2 With Warmed
(W) or Doubled Precipitation (PPT) Treatmentsa
Year TreatmentsAnnual Soil CO2 Efflux,
g C m�2 yr�1
Experiment 12003 C 835 ± 732003 W 927 ± 872003 CL 782 ± 672003 W + CL 915 ± 80
Experiment 22002 Controlb 1131 ± 932003 C 877 ± 692003 W 1129 ± 702003 PPT 1013 ± 852003 W + PPT 1166 ± 107
aData shown by mean ±1 SE. W, warmed, CL, clipped; PPT, doubledprecipitation.
bRefers to the result calculated from the average in all pretreatment plots.
GB1003 ZHOU ET AL.: MAIN AND INTERACTIVE EFFECTS ON SOIL CO2 EFFLUX
8 of 12
GB1003
The lower response of soil CO2 efflux to warming observedin our experiments is likely related to the fact that ourgrassland has lower soil organic C content than otherecosystems [Luo et al., 2001].[34] This study demonstrated that warming significantly
increased basal respiration rate (coefficients a) and de-creased temperature sensitivity of soil CO2 efflux (coeffi-cient b) in Experiment 2, whereas neither of the parameterswas significantly altered by warming in Experiment 1(Table 3). The different responses of the two parametersto warming between the experiments may be due to a fewreasons. First, the temperature increase was � 2�C inExperiment 1 and 4.4�C in Experiment 2. Thus the exper-imental forcing was stronger in Experiment 2 than inExperiment 1. Second, Experiment 1 was in the fourth year.Ecosystem processes may adjust to warming treatmentover time [Melillo et al., 2002]. After 3-year warming inExperiment 1, labile carbon could be in a steady statebetween supply and depletion (A. Tedla and Y. Luo,unpublished data, 2003). In addition, the shift in soilmicrobial community structure toward more fungi [Zhanget al., 2005] likely resulted in lower sensitivity of soil CO2
efflux to temperature because fungi are more tolerant ofhigher soil temperature and drying owing to their filamen-tous nature. The opposite responses of coefficients a and bto warming could result from changes in root phenologyand acclimation of roots and microbes to climate [Janssensand Pilegaard, 2003].[35] Doubled precipitation significantly increased soil
CO2 efflux in Experiment 2 (Table 2), greatly owing tostimulation of soil CO2 efflux in the dry growing season of2003 (Figure 3). Similar effects of additional water on soilCO2 efflux have been observed in other experiments[Laporte et al., 2002; Liu et al., 2002]. During the periodof the transient study, CO2 efflux from soils was notsignificantly affected by doubled precipitation owing tothe absence of water stress. Although the basal respirationrate and temperature sensitivity were not affected by dou-bled precipitation (Table 3), the apparent Q10 value in thecontrol was significantly higher in 2003 than 2002 (p <0.05), largely resulting from differences in precipitation.Dorr and Munnich [1987] found that the apparent Q10
values were low in the wet years and high in the dry yearsin a multiyear study of a grassland and a beech-spruce forestin Germany. However, others found that the apparent Q10
values were lower in the well-drained sites than the wettersites [Davidson et al., 1998; Xu and Qi, 2001]. Complexinteractions between soil water and temperature, whichinfluence CO2/O2 diffusion, root and microbial activities,could result in these diverse responses of the temperaturesensitivity of soil CO2 efflux to water availability.[36] A large portion of soil CO2 efflux is derived from
recently fixed carbon, thus making it responsive to changesin carbon supply due to clipping, girdling, and shading[Craine et al., 1999; Hogberg et al., 2001; Wan and Luo,2003]. Clipping reduces soil CO2 efflux by 19% to 49% ingrassland ecosystems [Bremer et al., 1998; Craine et al.,1999; Wan and Luo, 2003]. Our study showed that yearlyclipping had no significant effects on soil CO2 efflux in thefourth year of Experiment 1 and clipping significantly
reduced soil CO2 efflux in the transient study within twomonths (Figures 1 and 5 and Table 2). In Experiment 1, weevaluated the effect of yearly clipping against monthlymeasurements of soil CO2 efflux over a whole year. Thetreatment of yearly clipping in our study likely has lessimpact on soil CO2 efflux than mowing several times peryear. However, the transient effects of clipping were exam-ined within 2 months in the transient study. In addition, Wanand Luo [2003] kept clipping aboveground biomass tomaintain bare ground in the clipped plots during the wholestudy period of one year, leading to a 33% decrease in meansoil CO2 efflux. Thus frequency of clipping and durations ofstudy can be sources of variable results. Our transient studyshowed that clipping significantly reduced respiratory sen-sitivity to temperature (Table 3), similar to the results inother studies both from the laboratory [Townsend et al.,1997] and field experiments [Boone et al., 1998; Wan andLuo, 2003].
4.3. Interactive Effects of Warming, Precipitation,and Clipping
[37] Global climate change in the real world involveschanges in multiple factors [Shaw et al., 2002; Norby andLuo, 2004]. Therefore the effects of warming on terrestrialecosystems must be evaluated in combination with otherfactors. In this study, we found that interactive effects ofwarming, precipitation, and clipping on soil CO2 effluxwere minor except for the warming � clipping interaction inthe transient study. Minor interactive effects among multipleglobal change factors on soil CO2 efflux have been reportedin the literature. For example, Edwards and Norby [1998]and Niinisto et al. [2004] did not find interactive effects ofelevated CO2 and temperature on soil CO2 efflux statisti-cally significant. Similarly, there were no significant inter-actions among elevated CO2, nitrogen supply, and plantdiversity on soil CO2 efflux [Craine et al., 2001] andbetween elevated CO2 and O3 [Kasurinen et al., 2004].However, significant interactive effects of elevated CO2 andwarming were found on ‘‘old’’ pool C decomposition in awarming-CO2-N experiment in tunnels with ryegrassswards [Loiseau and Soussana, 1999]. The interactionwas largely regulated by N supply.[38] The lack of significant interactive effects in
Experiment 1 suggest that soil CO2 efflux was determinedby warming and yearly clipping treatments in a statisticallyindependent manner. Warming increased soil CO2 effluxwhile yearly clipping decreased it. The effect size of thewarming plus yearly clipping treatment was between that ofthe warming treatment and the one of the yearly clippingtreatment. The insignificant interaction between warmingand doubled precipitation in Experiment 2 resulted largelyfrom the anomalously low precipitation in 2003. Precipita-tion was 647 mm, which was 29.3% less than the average(915 mm). The long period of drought in June and July(34 days without rain) negated the doubled precipitationtreatment. A heavy rain of 108.0 mm in two days on 30–31 August 2003 resulted in substantial water loss throughsurface runoff. Although doubled precipitation increasedsoil water content by 10.6% and soil CO2 efflux by 9.0%relative to those without extra precipitation treatments, high
GB1003 ZHOU ET AL.: MAIN AND INTERACTIVE EFFECTS ON SOIL CO2 EFFLUX
9 of 12
GB1003
variability in rainfall events in our ecosystem did notgenerate statistically significant interaction. In addition,our monthly measurements may not detect fast transientresponses of soil CO2 efflux to individual rainfall events[Liu et al., 2002]. Thus we do expect that soil water contentand temperature interactively regulate soil CO2 efflux underdifferent circumstances in spite of the fact that we did notdetect significant interactions between them in this partic-ular study.[39] An interactive response to warming and clipping was
observed on soil CO2 efflux and its temperature sensitivityin the transient study (Tables 2 and 3). Clipping immedi-ately reallocated assimilate to regrowth of shoots [Bremer etal., 1998; Craine et al., 1999] and reduced supply of currentphotosynthates to roots and their mycorrhizal fungi [Hogberget al., 2001]. As a consequence, soil respiration decreases.However, experimental warming accelerated plant regrowthin comparison with that in unwarmed plots after clippingeither with or without doubled precipitation. Thus warmingmade soil CO2 efflux more responsive to clipping, contribut-ing to the observed significant interaction during the transientperiod. In addition, complex and unpredictable interactionsdo occur in regulating soil CO2 efflux in other ecosystems[Loiseau and Soussana, 1999] or other ecosystem attributessuch as biomass growth [Shaw et al., 2002]. A mechanisticunderstanding of interactions of warming and other globalchange factors on soil CO2 efflux also requires study of rootand microbial processes, which may have different sensitiv-ities to temperature and other factors in complex soil physicaland chemical environments.
5. Conclusions
[40] This study investigated the main and interactiveeffects of warming, doubled precipitation, and clipping on
soil CO2 efflux and its temperature sensitivity in a tallgrassprairie of central Oklahoma. The main effects of warmingand doubled precipitation were significant on soil CO2
efflux. Clipping significantly decreased soil CO2 efflux inthe transient study but not in the long-term warmingexperiment. Our statistical analysis showed no significantinteractive effects of the three factors on soil CO2 efflux orits temperature sensitivity except for the warming � clip-ping in the transient study. The minor interactive effectsobserved in this study suggest that results from single-factorexperiments are useful in informing us of potentialresponses of soil CO2 efflux to multifactor global change,at least in our ecosystem. It is yet to be examined whetherour conclusion on minor interactive effects could be gener-alized across ecosystems. Regardless, this study posedtestable hypotheses, which can be examined in other eco-systems. Furthermore, the statistical methods used in thisstudy to rigorously detect interactive effects of globalchange factors are useful for other multifactor experiments.
Appendix A: Statistical Tests of RegressionCoefficients
[41] We tested the significance of coefficients a and b ofequation (1) in the temperature-respiration relationshipprimarily according to methods presented by Toutenburg[2002]. Table A1 is an array of coefficients a or b andstandard errors for calculating t values of main and inter-active effects between two factors: warming versus precip-itation and warming versus clipping.[42] The t value of the main effects was calculated for
factor 1 by
t ¼ x2: � x1:ffiffiffiffiffiffiffiffiffiffiffiPS2ij
4
s i; j ¼ 1; 2ð Þ: ðA1Þ
Similarly, the t values for factor 2 was also calculated byequation (A1) with x:1 and x:2. The t value of the interactiveeffects of factor 1 and factor 2 on coefficients a and b wascalculated by
t ¼
x11 þ x22 � x12 � x21
2ffiffiffiffiffiffiffiffiffiffiffiPS2ij
4
s i; j ¼ 1; 2ð Þ: ðA2Þ
[43] For the three-way factorial experiment with warming,precipitation (ppt), and clipping, coefficients a or b and
Table A1. Coefficient a or b and Their Standard Errors for
Calculating t Values of Main and Interactive Effects Between Two
Factorsa
TreatmentLevel 1
of Factor 1
TreatmentLevel 2
of Factor 2Average:Factor 2
Treatment level 1 of factor 2 x11 ± S11 x21 ± S21 x:1Treatment level 2 of factor 2 x12 ± S12 x22 ± S22 x:2Average: factor 1 x1: x2:
aTerms: xijk, values of coefficients a or b (i, j = 1, 2); Sij, standard errorsof coefficients a or b in different treatments; xi::, a mean of treatment level iof factor 1; x:j:, a mean of treatment level j of factor 2.
Table A2. Coefficient a or b and Their Standard Errors for Calculating t Values of Main and Interactive Effects Between Three Factorsa
Treatment Level 1 of Factor 1: Unclipped Treatment Level 2 of Factor 1: Clipped
Average:Factor 3
TreatmentLevel 1 of Factor 2:
Ambient, ppt
TreatmentLevel 2 of Factor 2:
Double, ppt
TreatmentLevel 1 of Factor 2:
Ambient, ppt
TreatmentLevel 2 of Factor 2:
Double, ppt
Treatment level 1 of factor 3: Unwarmed x111 ± S111 x121 ± S121 x211 ± S211 X221 ± S221 x::1Treatment level 2 of factor 3: Warmed x112 ± S112 x122 ± S122 x212 ± S212 X222 ± S222 x::2Average: factor 1 x1:: x2::Average: factor 2 x:1: x:2:
aTerms: xijk, values of coefficients a or b (i, j, k = 1, 2); Sijk, standard errors of coefficients a or b in different treatments; xi::, a mean of treatment level iof clipping; x:j:, a mean of treatment level j of precipitation; x:k:, a mean of treatment level k of warming.
GB1003 ZHOU ET AL.: MAIN AND INTERACTIVE EFFECTS ON SOIL CO2 EFFLUX
10 of 12
GB1003
their standard errors can be arranged as follows to calculate tvalues of main and interactive effects, as shown in Table A2.[44] The t values of the main effects of clipping, precip-
itation, and warming were calculated by equation (A1) with
xi::, x:j:, or x::k, and
ffiffiffiffiffiffiffiffiffiffiffiPS2ijk
16
q. The t value of the 2-way
interactive effect of factor 1 (clipping) and factor 2 (precip-itation) was calculated by
t ¼
Px11k þ
Px22k �
Px12k �
Px21k
4ffiffiffiffiffiffiffiffiffiffiffiffiffiPS2ijk
16
s i; j; k ¼ 1; 2ð Þ:
ðA3Þ
Similarly, the t values of the interactive effects of clippingand warming, or of precipitation and warming were calcu-lated by equation (A3) with
Px1j1 +
Px2j2 �
Px1j2 �P
x2j1 orP
xi11 +P
xi22 �P
xi12 �P
xi21, respectively.[45] The t value of the 3-way interactive effects of
clipping, precipitation, and warming on coefficients a or bwas calculated by
t ¼
x112 þ x121 þ x211 þ x222 � x111 � x122 � x212 � x221
4ffiffiffiffiffiffiffiffiffiffiffiffiffiPS2ijk
16
s
i; j; k ¼ 1; 2ð Þ: ðA4Þ
[46] Acknowledgments. The authors thank the two anonymousreviewers for their insightful comments, Nancy A. Zehrbach for maintain-ing the experimental infrastructure and for assistance with field measure-ments; and Jesse Bell for help with soil moisture data. This research wasfinancially supported by US National Science Foundation (NSF) underDEB 0078325 and by the Terrestrial Carbon Program at the Office ofScience, US Department of Energy, under DE-FG03-99ER62800.
ReferencesBoone, R. D., K. J. Nadelhoffer, J. D. Canary, and J. P. Kaye (1998), Rootsexert a strong influence on the temperature sensitivity of soil respiration,Nature, 396, 570–572.
Bremer, J. D., J. M. Ham, C. E. Owensby, and A. K. Knapp (1998),Responses of soil respiration to clipping and grazing in a tallgrass prairie,J. Environ. Qual., 27, 1539–1548.
Cox, P. M., R. A. Betts, C. D. Jones, S. A. Spall, and I. J. Totterdell (2000),Acceleration of global warming due to carbon-cycle feedbacks in acoupled model, Nature, 408, 184–187.
Craine, F. M., D. A. Wedin, and F. S. Chapin III (1999), Predominance ofecophysiological controls on soil CO2 flux in a Minnesota grassland,Plant Soil, 207, 77–86.
Cramer, W., et al. (2001), Global response of terrestrial ecosystem structureand function to CO2 and climate change: Results from six dynamic globalvegetation models, Global Change Biol., 7, 357–374.
Davidson, E. A., E. Belk, and R. D. Boone (1998), Soil water content andtemperature as independent or confound factors controlling soil respira-tion in a temperature mixed hardwood forest, Global Change Biol., 4,217–227.
Dorr, H., and K. O. Munnich (1987), Annual variation in soil respiration inselected areas of the temperate zone, Tellus, Ser. B, 39, 114–121.
Dunne, J., J. Harte, and K. Taylor (2002), Response of subalpine meadowplant reproductive phenology to manipulated climate change and naturalclimate variability, Ecol. Monogr., 73, 69–86.
Edwards, N. T., and R. J. Norby (1998), Below-ground respiratoryresponses of sugar maple and red maple saplings to atmospheric CO2
enrichment and elevated air temperature, Plant Soil, 206, 85–97.
Hanson, P. J., S. D. Wullschleger, S. A. Bohlman, and D. E. Todd (1993),Seasonal and topographic patterns of forest floor CO2 efflux from anupland oak forest, Tree Physiol., 13, 1–15.
Harper, C. W., J. M. Blair, P. A. Fay, A. K. Knapp, and J. D. Carlisle(2005), Increased rainfall variability and reduced rainfall amountdecreases soil CO2 efflux in a grassland ecosystem, Global Change Biol.,11, 322–334.
Hogberg, P., A. Nordgren, N. Buchmann, A. F. S. Taylor, A. Ekblad, M. N.Hogberg, G. Nyberg, M. Ottosson-Lofvenius, and D. J. Read (2001),Large-scale forest girdling shows that current photosynthesis drives soilrespiration, Nature, 411, 789–792.
Intergovernmental Panel on Climate Change (2001), Climate Change 2001:The Scientific Basis, edited by H. T. Houghton et al., Cambridge Univ.Press, New York, USA.
Janssens, I. A., and K. Pilegaard (2003), Large seasonal changes in Q10
of soil respiration in a beech forest, Global Change Boil., 9, 911–918.
Kasurinen, A., P. Kokko-Gonzales, J. Riikonen, E. Vapaavuori, andT. Holopainen (2004), Soil CO2 efflux of two silver birch clones exposedto elevated CO2 and O3 levels during three growing seasons, GlobalChange Biol., 10, 1654–1665.
Kunkel, K. E., K. Andsager, and D. R. Easterling (1999), Long-term trendsin extreme precipitation events over the conterminous United States andCanada, J. Clim., 12, 2515–2527.
Laporte, M. F., L. C. Duchesne, and S. Wetzel (2002), Effect of rainfallpatterns on soil surface CO2 efflux, soil moisture, soil temperature andplant growth in a grassland ecosystem of northern Ontario, Canada:Implications for climate change, BMC Ecol., 2(10), 1–6.
Lin, G., P. T. Rygiewicz, J. R. Ehleringer, M. G. Johnson, and D. T. Tingey(2001), Time-dependent responses of soil CO2 efflux componentsto elevated atmospheric [CO2] and temperature in experimental forestmesocosms, Plant Soil, 229, 259–270.
Liu, X., S. Wan, B. Su, D. Hui, and Y. Luo (2002), Response of soil CO2
efflux to water manipulation in a tallgrass prairie ecosystem, Plant Soil,240, 213–223.
Loiseau, P., and J. F. Soussana (1999), Elevated CO2, temperature increaseand N supply effects on the turnover of belowground carbon in a tempe-rate grassland ecosystem, Plant Soil, 210, 233–247.
Long, S. P., and P. R. Hutchin (1991), Primary production in grasslands andconiferous forests with climate change: An overview, Ecol. Appl., 1,139–156.
Luo, Y., R. B. Jackson, C. B. Field, and H. A. Mooney (1996), ElevatedCO2 increases belowground respiration in California grasslands,Oecologia, 108, 130–137.
Luo, Y., S. Wan, D. Hui, and L. Wallace (2001), Acclimatizationof soil respiration to warming in a tall grass prairie, Nature, 413, 622–625.
McHale, P. J., M. J. Mitchell, and F. P. Bowles (1998), Soil warming in anorthern hardwood forest: Trace gas fluxes and leaf litter decomposition,Can. J. For. Res., 28, 1365–1372.
Melillo, J. M., et al. (2002), Soil warming and carbon-cycle feedbacks tothe climate system, Science, 298, 2173–2176.
Niinisto, S. M., J. Silvola, and S. Kellomaki (2004), Soil CO2 efflux in aboreal pine forest under atmospheric CO2 enrichment and air warming,Global Change Biol., 10, 1363–1376.
Norby, R. J., and Y. Luo (2004), Evaluating ecosystem responses torising atmospheric CO2 and global warming in a multi-factor world,New Phytol., 162, 281–293.
Peterjohn, W. T., J. M. Melillo, and S. T. Bowles (1993), Soil warmingand trace gas fluxes: Experimental design and preliminary flux results,Oecologia, 93, 18–24.
Raich, J. W., and C. S. Potter (1995), Global patterns of carbon dioxideemissions from soils, Global Biogeochem. Cycles, 9, 23–36.
Raich, J. W., and W. H. Schlesinger (1992), The global carbon dioxide fluxin soil respiration and its relationship to vegetation and climate, Tellus,Ser. B, 44, 81–99.
Rustad, L. E., J. L. Campbell, G.M.Marion, R. J. Norby,M. J.Mitchell, A. E.Hartley, and J. Gurevitch (2001), A meta-analysis of the response of soilrespiration, net nitrogen mineralization, and aboveground plant growth toexperimental ecosystem warming, Oecologia, 126, 543–562.
Shaw, M. R., E. S. Zavaleta, and N. R. Chiariello (2002), Grasslandresponses to global environmental changes suppressed by elevatedCO2, Science, 298, 1987–1990.
Tarr, E., J. G. Botkin, E. L. Rice, E. Carpenter, and M. Hart (1980), A broadanalysis of fifteen sites in the tall-grass prairie of Oklahoma, Proc. Okla.Acad. Sci., 60, 39–42.
Toutenburg, H. (2002), Statistical Analysis of Designed Experiments,Springer, New York.
GB1003 ZHOU ET AL.: MAIN AND INTERACTIVE EFFECTS ON SOIL CO2 EFFLUX
11 of 12
GB1003
Townsend, A. R., P. M. Vitousek, D. J. Desmarais, and A. Tharpe (1997),Soil carbon pool structure and temperature sensitivity inferred using CO2
and 13CO2 incubation fluxes from five Hawaiian soils, Biogeochemistry,38, 1–17.
U.S. Department of Agriculture (1979), Soil survey of McClain County,Oklahoma, report, Okla. Agric. Exp. Stn., Stillwater.
Wan, S., and Y. Luo (2003), Substrate regulation of soil respiration in atallgrass prairie: Results of a clipping and shading experiment, GlobalBiogeochem. Cycles, 17(2), 1054, doi:10.1029/2002GB001971.
Wan, S., Y. Luo, and L. L. Wallace (2002), Changes in microclimate inducedby experimental warming and clipping in tallgrass prairie, Global ChangeBiol., 8, 754–768.
Wan, S., D. Hui, L. L. Wallace, and Y. Luo (2005), Direct and indirectwarming effects on ecosystem carbon processes in a tallgrass prairie,Global Biogeochem. Cycles, 19, GB2014, doi:10.1029/2004GB002315.
Woodwell, G. M., F. T. Mackenzie, R. A. Houghton, M. Apps, E. Gorham,and E. Davidson (1998), Biotic feedback in the warming of the earth,Clim. Change, 40, 495–518.
Xu, L., D. D. Baldocchi, and J. Tang (2004), How soil moisture, rainpulses, and growth alter the response of ecosystem respiration to tem-perature, Global Biogeochem. Cycles, 18, GB4002, doi:10.1029/2004GB002281.
Xu, M., and Y. Qi (2001), Soil-surface CO2 efflux and its spatial andtemporal variations in a young ponderosa pine plantation in northernCalifornia, Global Change Biol., 7, 667–677.
Zhang, W., K. Parker, Y. Luo, L. Wallace, and S. Hu (2005), Soil microbialresponses to experimental atmospheric warming and clipping in a tall-grass prairie, Global Change Biol., 11, 266–277.
�������������������������Y. An, College of Agriculture and Biology, Shanghai Jiaotong University,
Shanghai 201101, China.Y. Luo, R. A. Sherry, L. L. Wallace, and X. Zhou, Department of Botany
and Microbiology, University of Oklahoma, Norman, OK 73019, USA.([email protected])
GB1003 ZHOU ET AL.: MAIN AND INTERACTIVE EFFECTS ON SOIL CO2 EFFLUX
12 of 12
GB1003


![Multi-year simulations using a regional-climate model over the Iberian Peninsula: Current climate and doubled CO] scenario](https://static.fdokumen.com/doc/165x107/631eed287509c0131f0955fa/multi-year-simulations-using-a-regional-climate-model-over-the-iberian-peninsula.jpg)