![1-[(3-Aryloxy-3-aryl)propyl]-1 H -imidazoles, New Imidazoles with Potent Activity against Candida albicans and Dermatophytes. Synthesis, Structure−Activity Relationship, and Molecular](https://static.fdokumen.com/doc/165x107/63334487b94d623842021cec/1-3-aryloxy-3-arylpropyl-1-h-imidazoles-new-imidazoles-with-potent-activity.jpg)
Electrodermal activity during napping and its relationship with ...
39
Electrodermal activity during napping and its relationship with performances on a reaction time task Bachelor Thesis Daphne Analbers University of Twente Behavioural Sciences Cognitive Psychology and Ergonomics Examination Committee First Supervisor: Dr. Matthijs Noordzij Second Supervisor: Dr. Martin Schmettow 14-01-2013
-
Upload
khangminh22 -
Category
Documents
-
view
1 -
download
0
Transcript of Electrodermal activity during napping and its relationship with ...

Electrodermal activity during napping and its
relationship with performances on a reaction time
task
Bachelor Thesis
Daphne Analbers
University of Twente
Behavioural Sciences
Cognitive Psychology and Ergonomics
Examination Committee
First Supervisor: Dr. Matthijs Noordzij
Second Supervisor: Dr. Martin Schmettow
14-01-2013

Abstract
The aim of this study was to measure and clarify electrodermal activity around and during the
powernap and the benefits and disadvantages of the powernap relative to reaction time on a
task. It was expected that the number of skin conductance responses (SCRs), and the
amplitude thereof, were lowest of the day during the powernap. This was measured by a Q-
sensor for five days from 10.00 am to 17.00 pm. Also, the participants had to perform a
reaction time task every half hour. It was expected that the reaction time scores directly after a
power nap were lengthened by "sleep inertia." This term meant that a person is still dull or
drowsy when the person wakes up. This could be a disadvantage for taking a powernap.
Further, it was expected that the alertness of the five participants was improved by the
powernap. 10 Randomly chosen reaction time scores before the powernap were compared
with 10 random reaction time scores after the powernap. It was expected that the reaction time
scores of the participants after a powernap were shortened, compared with all reaction time
scores before the powernap.
The results of the study confirmed the hypothesis that the number SCRs was lowest
during the powernap for the five individuals in this study. The statistical tests were based on
randomization tests suitable for small-n samples (Dugard, File & Todman, 2011). The results
showed a marginal difference emerged with regard to the amplitude of SCRs. The amplitude
during powernap was slightly lower than the amplitude at other times where the participants
took no powernap. The reaction test showed that there were no differences between the
response times around the powernap and the reaction directly after the power nap. There was
no evidence that the participants suffered from sleep inertia. We did find that the reaction time
scores after a powernap were improved, as compared to the reaction time scores before the
powernap.
For future research, electrodermal lability and stability are interesting concepts. There
were differences between the participants in the amplitude and number of SCRs. Some
participants had many variations in the number and amplitude, which could have to do with
electrodermal lability. Others scored very stable. Also, the effects of a powernap could be
measured on employees during working hours. Both employers and employees may benefit
from it, because a powernap can cause an improved alertness and can thereby reduce errors
and accidents at the workplace.

Samenvatting
Het doel van deze studie was om elektrodermale activiteit te meten en te verduidelijken
tijdens en rond de powernap en de effecten zichtbaar te maken van een powernap ten opzichte
van de reactie tijd scores op een taak. Er werd verwacht dat het aantal
huidgeleidingsresponsen, en de amplitude hiervan, tijdens de powernap het laagst van de dag
waren. Dit werd gemeten door een Q-sensor gedurende vijf dagen van 10 uur ’s ochtends tot
17.00 uur ’s avonds. Ook moesten de participanten elk half uur een reactietijd taak uitvoeren.
Er werd verwacht dat de reactietijd direct na een powernap langzamer was door ‘slaap
inertie’. Deze term houdt in dat een persoon zich nog duf of ‘slaapdronken’ voelt wanneer de
persoon wakker wordt. Dit kan een nadeel zijn aan het nemen van een powernap. Verder werd
er verwacht dat de alertheid van de vijf participanten was verbeterd. 10 random gekozen
reactietijd scores voor de powernap werden vergeleken met 10 random reactietijd scores na de
powernap. Er werd verwacht dat de reactietijd scores van de participanten na een powernap
verkort waren, vergeleken met de reactietijd scores voor de powernap.
De resultaten van het onderzoek bevestigde de hypothese dat het aantal
huidgeleidingsresponsen het laagst was tijdens de powernap. De statistische testen waren
gebaseerd op randomizatie testen die pasten bij een small-n design (Dugard, File en Todman,
2011). Uit de resultaten kwam een marginaal verschil naar voren wat betreft de amplitude van
huidgeleidingsresponsen. De amplitude tijdens de powernap bleek iets lager te liggen dan de
amplitude op andere momenten wanneer de persoon geen powernap nam. De reactietijd test
wees uit dat er geen verschil was tussen de reactietijden rondom de powernap en de reactietijd
direct na de powernap. Er was dus geen bewijs gevonden dat de participanten last hadden van
slaap inertie. We vonden wel dat de reactietijden na een powernap verbeterd waren ten
opzichte van de reactietijden voor de powernap.
Voor toekomstig onderzoek zijn elektrodermale labiliteit en stabiliteit interessante
concepten. Er bleken verschillen te zijn tussen de participanten in amplitude en aantal
huidgeleidingsresponsen. Sommige participanten hadden veel schommelingen in dit aantal en
amplitude, die te maken zou kunnen hebben met elektrodermale labiliteit. Anderen scoorden
erg stabiel. Verder zou er ook gekeken kunnen worden naar de effecten van een powernap op
werknemers tijdens werktijd. Zowel werkgevers als werknemers kunnen hiervan profiteren,
omdat een powernap kan zorgen voor een verbeterde alertheid en daardoor een reductie aan
fouten en ongevallen.

Table of Contents
Introduction .............................................................................................................................. 5
Electrodermal activity ............................................................................................................. 6
Sleep & Electrodermal activity ........................................................................................... 7
Ambulatory research .................................................................................................... 10
Hypotheses ........................................................................................................... 11
Method ..................................................................................................................................... 13
Participants ........................................................................................................................... 13
Instruments & Procedure .................................................................................................. 13
Design .......................................................................................................................... 15
Data analysis ......................................................................................................... 15
Results .................................................................................................................................... 18
Discussion & Conclusion ...................................................................................................... 24
Hypotheses ........................................................................................................................... 24
Complications ................................................................................................................... 26
Future research ............................................................................................................. 27
References .............................................................................................................................. 28
Appendices ............................................................................................................................. 32
Appendix 1 ........................................................................................................................... 32
Appendix 2 ...................................................................................................................... 38

| 5
Introduction
The world has turned into a 24-hours society. This could cause sleep deprivation and
disruption (Takahashi, 2003). For this reason, napping received more and more attention and
a ‘powernap’ had become a worldwide known term. This ‘power nap’ is known as a method
that works as a countermeasure for sleepiness and fatigue (Pilcher, Michalowski & Carrigan,
2001). A powernap is a very short nap for less than 20 minutes, which is long enough to
experience its benefits and short enough to avoid drowsiness. It has positive effects on
behavioral, subjective and physiological parameters (Hayashi & Hori, 1998). Takahashi
(2003) showed that young adults, between the age of 20 and 30, were sleeping less hours
during the night than other people (elderly people and shift workers for example). 33% of the
young adults had problems with sleepiness during the day and the influence of sleepiness on
daily performances. A powernap could be a solution to this problem. The present study
focused on a powernap with the aim to clarify the effects around and during a powernap. It
was measured on students, because of their suggested problems with sleepiness (Takahashi,
2003). The present study assumed that the students feel great benefit of powernapping. The
effects of a powernap was measured by ‘electrodermal activity’ (EDA), an important concept
that will be explained below. Besides EDA, reaction time was measured to clarify the effects
of a powernap on reaction time scores of the students.
According to Debarnot, Castellani, Valenza, Sebastiani and Guillot (2011) there are
two kinds of naps: long naps and short naps. Long naps will take 60-90 minutes and include
slow wave sleep and rapid eye movement sleep (REM sleep). In a short nap the person will
reach sleep stage 1 and sleep stage 2 (below these sleep stages are explained in further detail).
They are suggesting that a person need to sleep 10 minutes in stage 2 to feel the benefits and
that it will take 19.4 minutes to reach 10 minutes of sleep stage 2. The authors also argue that
the benefits underlying the brief naps are not related to sleep stage 1, but they are related to
sleep stage 2. For the enhancement of cognitive performance, sleep stage 2 is required. This
can suggest that sleep stage 2 will have an effect on the reaction time scores of the students. If
sleep stage 2 was not reached, this can mean that the powernap have no effect on cognitive
performance. To reach the 10 minutes of sleep stage 2, the students in the present study took a
powernap of 20 minutes. According to the results of the study by Debarnot et al. (2011), this
is enough to feel the benefits of a powernap.
| 6
The effects of a powernap may be linked to the time a person takes a nap. According
to Takahashi, Fukuda and Arito (1998), a nap after lunch (around 12:30 h) is most likely
related to an improvement of alertness for daytime employees. Besides this argument, one can
suggest a nap around 14:00 h. The circadian rhythm can cause the alertness of a person lowest
at this time of day in wake state, approximately from 14:00 until 17:00 hours (Van Dongen &
Dinges, 2005). A shortened P300 represents increased alertness and results show that a nap at
14:00 h causes a shortened P300 (Takahashi et al. 1998). This thus improves the alertness of a
person and the cognitive performance. Shortening of P300 only applies to 15-minute naps,
compared with naps of 45 minutes or no naps. The effects of napping on alertness are visible
after 7.3 minutes of sleep.
Despite of all these positive effects of taking a nap, there is a problem. Most people
are not able to take a nap, because of their work or school. There are only a few companies
who are offering their employees a place where they can take a nap. In the USA and Canada
only 15% of the companies permit their employees to take a nap during lunch time
(Takahashi, 2003). According to Baxter and Kroll-Smith (2005) the powernap improves
safety and performance and reinforces the work ethic of a committed workforce. In their
study, they focus on the workplace nap and how this can be achieved by employers. They
discuss the ‘Xiuixi’ in China, a traditional three-hour midday closing of offices during
summer and the two-and-a-half-hour midday closing in winter to take a nap and to improve
family and society. In 1985 the Chinese State Council ended the traditional ‘Xiuixi’, because
this time could be used more efficient. The powernap was abolished, but with the present 24-
hours society, the powernap can be used for other purposes instead of family improvement.
Many researchers showed positive effects of a powernap on behavior (Takahashi, 2003;
Baxter & Kroll-Smith ,2005; Hayashi & Hori, 1998) and it will only take about 20 minutes.
Electrodermal activity
Electrodermal activity (EDA) was used in the present study to observe individuals around and
during the powernap. An useful definition of EDA is one by Johnson and Lubin (1996):
“Electrodermal activity is a common term for all electrical phenomena in skin, including all
active and passive electrical properties which can be traced back to the skin and its
appendages.” EDA measurements can be used in a wide variety of research, such as
examining emotions, attention and arousal. Central to this measure is electrodermal response.
Boucsein (2012) argues that the term ‘response’ suggests that there is a relationship between
the stimulus and electrodermal responses (EDRs). Still, there are often parts of EDA which

| 7
cannot be related to a specific stimulation. These parts are called ‘spontaneous’ EDA. Direct
current recording of EDA is the most frequently used method for obtaining electrodermal
measures. This came within the ‘exosomatic method’. Here, the electrodermal system is
supported with electrical energy from an external source, using either a constant voltage or a
constant current. Direct current recording means that EDA can be recorded directly in skin
conductance units when voltage is kept constant and skin resistance units can be obtained
when current is kept constant (Boucsein, 2012). The exosomatic method measures skin
conductance. Skin conductance level (SCL) is the absolute level of conductance at a given
moment in the absence of a measurable response (Dawson, Schell & Fillion, 2000). There are
2 other concepts related to EDA and are important in understanding the data of EDA. (1) SCR
‘frequency’ means the number of EDRs in a given time window, (2) SCR ‘amplitude’ is
referring to the height of a single response (Boucsein, 2012).
Lykken and Venables (1971) suggest a linear relationship between SCL and the rate of
secretion of sweat. Sweat glands are involved by the homeostatic process of thermoregulation.
These mechanisms have indirect influences on EDA. Boucsein (2012) argue that the sweat
glands at palmar and plantar sites are most interesting for measuring EDA, because there is
sufficient evidence that these sites are linked to emotional rather than thermoregulatory sweat
gland activity. He also argues that reduced sweating will lead to reduced EDA and increased
sweating will lead to increased EDA. According to Schliack and Shiffter (1979) there exist
different kinds of sweating, including ‘emotional sweating’. This means increased sweat
gland activity when psychological and emotional states appear, like high arousal or under
stress. In the present study, EDA was measured on palmar site.
Sleep & Electrodermal Activity
Sleep is a fundamental biological regulation system and is related to mental health. For
example, poor sleep quality is associated with child adjustment problems, including
externalizing behaviors, such as depression and anxiety (El-Sheikh & Arsiwalla, 2011). This
means that good sleep quality is significant for proper development and mental health.
However, sleep deprivation has become a common problem. There are many employers who
suffer from this problem through their work, because of the 24-hours society (Takahashi,
2003). Examples of these jobs are night shift workers, doctors and truck drivers. There are
several studies on the effects of sleep deprivation. The problem of sleep deprivation and
sleepiness can be solved by taking a nap sometime during the day. A powernap may become a
| 8
daily phenomenon in the future and that is why research on this topic is important. A power
nap during the day can also contribute to a better night's sleep.
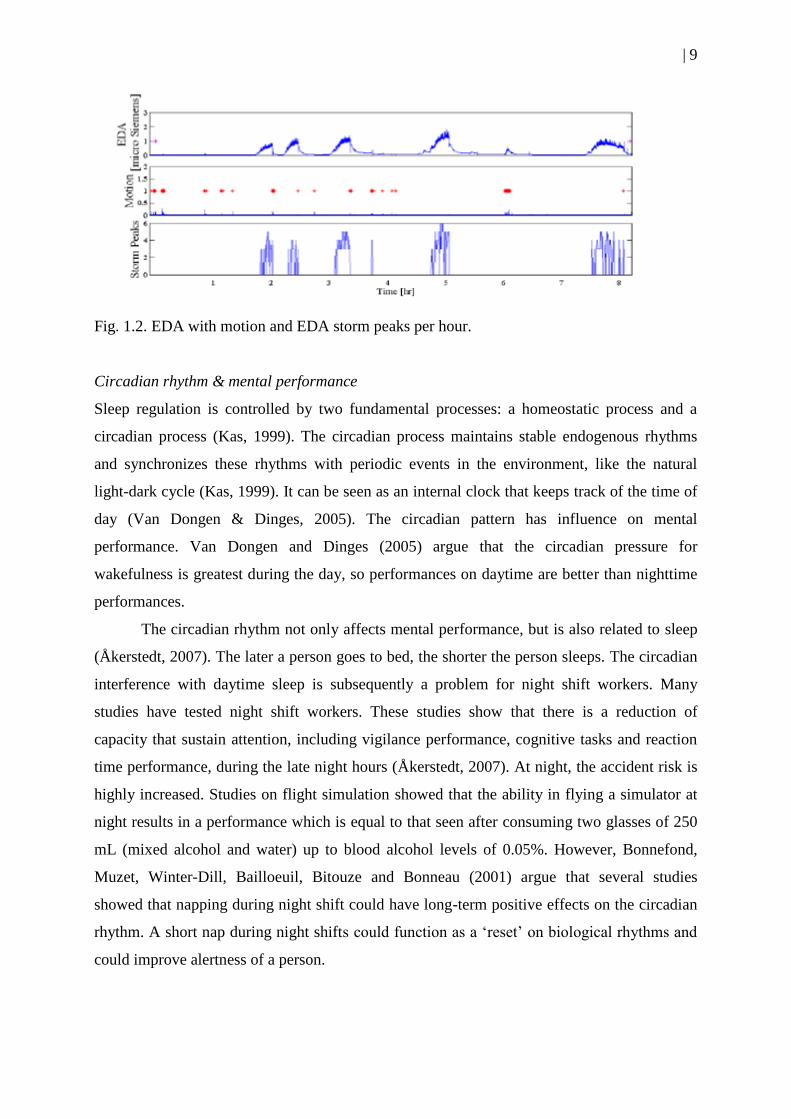
Humans have 4 stages of sleep (Knuistingh Neven, de Jongh & Schimsheimer, 2004).
Non-REM sleep can be divided into two groups: light and deep sleep. Light sleep consists of
stage 1, which is drowsy sleep, and stage 2, dormant sleep. A person, who’s taking a nap of
20 minutes, will reach only these two stages. Deep sleep and slow wave sleep (SWS), consists
of stage 3 and stage 4. In REM sleep breathing and heart rate will be faster and irregular,
while blood pressure will show strong fluctuations. In REM sleep there is a total muscle
relaxation. Non-REM sleep and REM sleep are shifting four to five times during a normal
night (Javaheri & Redline, 2012). Figure 1.1. shows an example of a typical night of sleep for
a healthy individual. Only 3 sleeping stages will be used in this figure. Sleep stage 1 and sleep
stage 2 are united and together they form sleep stage 1.
Fig. 1.1. Example of a sleep pattern and blood pressure in a healthy individual throughout a
typical night of sleep.
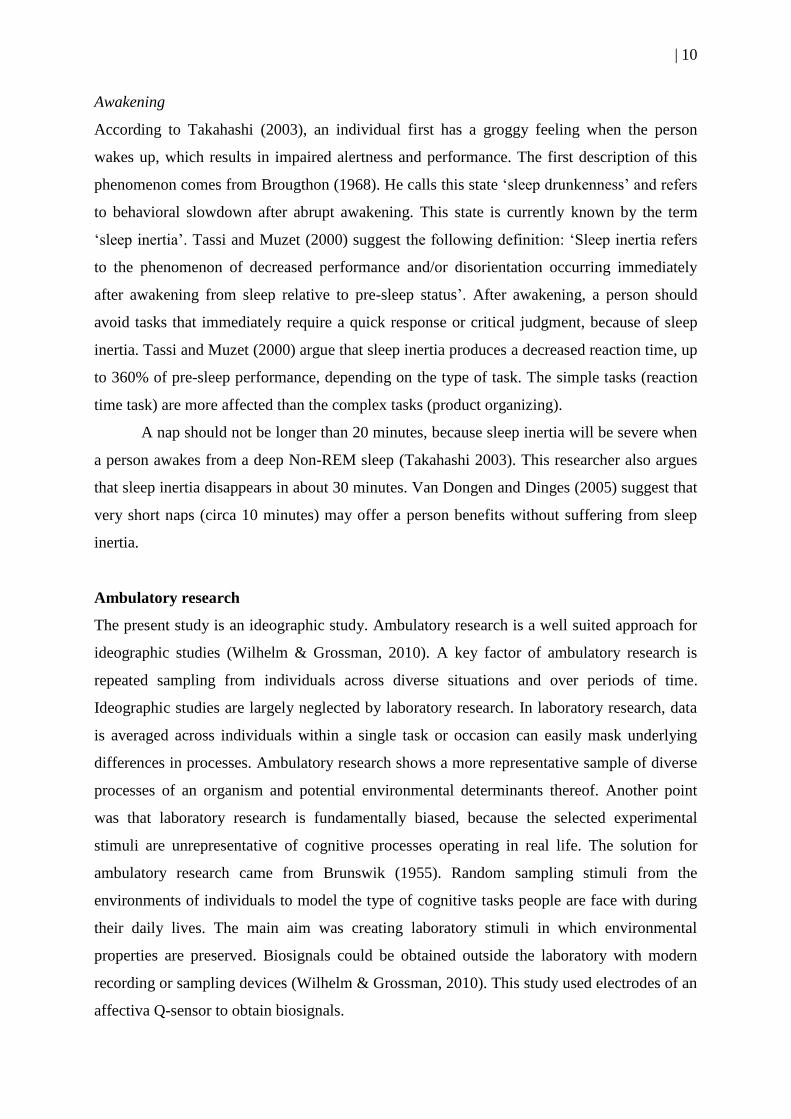
Studies on sleep shows that (1) EDA likely appears with high frequency ‘storm’
patterns during sleep, that (2) EDA can distinguish wake and sleep and (3) EDA is able to
show sleep onset (Sano & Picard, 2011). Figure 1.2. shows EDA with motion and these EDA
‘storm patterns’ of a healthy individual during sleep at night. Sleep is a process with several
semi-independent, interactive changes. It does not initiate from 1 second upon the other. It is a
process of decline in control over mental activity and changes in perceived state of
consciousness, which comes with a decrease in arousal (Wuyts et al., 2012).
| 9
Fig. 1.2. EDA with motion and EDA storm peaks per hour.
Circadian rhythm & mental performance
Sleep regulation is controlled by two fundamental processes: a homeostatic process and a
circadian process (Kas, 1999). The circadian process maintains stable endogenous rhythms
and synchronizes these rhythms with periodic events in the environment, like the natural
light-dark cycle (Kas, 1999). It can be seen as an internal clock that keeps track of the time of
day (Van Dongen & Dinges, 2005). The circadian pattern has influence on mental
performance. Van Dongen and Dinges (2005) argue that the circadian pressure for
wakefulness is greatest during the day, so performances on daytime are better than nighttime
performances.
The circadian rhythm not only affects mental performance, but is also related to sleep
(Åkerstedt, 2007). The later a person goes to bed, the shorter the person sleeps. The circadian
interference with daytime sleep is subsequently a problem for night shift workers. Many
studies have tested night shift workers. These studies show that there is a reduction of
capacity that sustain attention, including vigilance performance, cognitive tasks and reaction
time performance, during the late night hours (Åkerstedt, 2007). At night, the accident risk is
highly increased. Studies on flight simulation showed that the ability in flying a simulator at
night results in a performance which is equal to that seen after consuming two glasses of 250
mL (mixed alcohol and water) up to blood alcohol levels of 0.05%. However, Bonnefond,
Muzet, Winter-Dill, Bailloeuil, Bitouze and Bonneau (2001) argue that several studies
showed that napping during night shift could have long-term positive effects on the circadian
rhythm. A short nap during night shifts could function as a ‘reset’ on biological rhythms and
could improve alertness of a person.
| 10
Awakening
According to Takahashi (2003), an individual first has a groggy feeling when the person
wakes up, which results in impaired alertness and performance. The first description of this
phenomenon comes from Brougthon (1968). He calls this state ‘sleep drunkenness’ and refers
to behavioral slowdown after abrupt awakening. This state is currently known by the term
‘sleep inertia’. Tassi and Muzet (2000) suggest the following definition: ‘Sleep inertia refers
to the phenomenon of decreased performance and/or disorientation occurring immediately
after awakening from sleep relative to pre-sleep status’. After awakening, a person should
avoid tasks that immediately require a quick response or critical judgment, because of sleep
inertia. Tassi and Muzet (2000) argue that sleep inertia produces a decreased reaction time, up
to 360% of pre-sleep performance, depending on the type of task. The simple tasks (reaction
time task) are more affected than the complex tasks (product organizing).
A nap should not be longer than 20 minutes, because sleep inertia will be severe when
a person awakes from a deep Non-REM sleep (Takahashi 2003). This researcher also argues
that sleep inertia disappears in about 30 minutes. Van Dongen and Dinges (2005) suggest that
very short naps (circa 10 minutes) may offer a person benefits without suffering from sleep
inertia.
Ambulatory research
The present study is an ideographic study. Ambulatory research is a well suited approach for
ideographic studies (Wilhelm & Grossman, 2010). A key factor of ambulatory research is
repeated sampling from individuals across diverse situations and over periods of time.
Ideographic studies are largely neglected by laboratory research. In laboratory research, data
is averaged across individuals within a single task or occasion can easily mask underlying
differences in processes. Ambulatory research shows a more representative sample of diverse
processes of an organism and potential environmental determinants thereof. Another point
was that laboratory research is fundamentally biased, because the selected experimental
stimuli are unrepresentative of cognitive processes operating in real life. The solution for
ambulatory research came from Brunswik (1955). Random sampling stimuli from the
environments of individuals to model the type of cognitive tasks people are face with during
their daily lives. The main aim was creating laboratory stimuli in which environmental
properties are preserved. Biosignals could be obtained outside the laboratory with modern
recording or sampling devices (Wilhelm & Grossman, 2010). This study used electrodes of an
affectiva Q-sensor to obtain biosignals.

| 11
Ambulatory research can overcome limitations of laboratory research. Because of this
small number of intensively studied individuals, many scientific insights have been derived.
This type of study could provide an important contribution to the study of differences among
individuals and their environments and could provide help and/or support laboratory research.
Hypotheses
Napping and electrodermal activity are the central themes in the present study. Literature
shows that there has been research on napping, but little or none in combination with
electrodermal activity. Most of the studies on napping use EEG or self-report measurements.
This study measures electrodermal activity around and during the powernap. Sano and Picard
(2011) show EDA storm patterns. The first storm seems to appear around 2 hours after falling
asleep of an individual during sleep at night. This means that a person, who is taking a nap,
will have no sleep storm. Another important result comes from the study by Malmo (1959).
This researcher argues that the SCR, reflecting overall degree of arousal, decreased with
physiological relaxation such as rest and sleep. This assumes that there will be less SCRs
during sleep and relaxation than at other moments of the day. The present study took this
assumption and the assumption that the person would have no sleep storm during the
powernap, along in the first hypothesis about SCRs during the powernap. The first hypothesis
is: H1) the number of SCRs at the day was lowest during the powernap. Because of this
hypothesis and these results, the second hypothesis arose. The number of SCRs was assumed
to be lowest during the powernap, so the amplitude of these SCRs are also assumed to be
lowest. H2) the amplitude of SCRs at a day was lowest during the powernap.
Literature shows that the phenomenon sleep inertia occurs directly after awakening
(Takahashi, 2003; Tassi & Muzet, 2000). Sleep inertia produces a decreased reaction time and
that made this phenomenon an interesting point for this study. Tassi & Muzet (2000) suggest
namely, that there has not been much research on sleep inertia after taking a nap, especially
with EDA measurement. The present study measures the performance of an individual on a
task that requires a quick response. Davies and Krkovic (1965) have given the impetus for the
second hypothesis. These researchers show that skin conductance decreased during sleep and
they expect that this decrease will also occur during vigilance tasks (reaction time task), in
which reports of drowsiness are common. However, this is only an assumption and they did
not measure this assumption. To measure if this assumption is true, the present study shows
the third hypothesis: H3) Reaction time was lengthened directly after the powernap.

| 12
The main purpose to take a powernap is because it brings so many benefits. According
to Hayashi and Hori (1998), the powernap has positive effects on behavioral, subjective and
physiological parameters. Takahashi et al. (1998) argue that a powernap is related to an
improvement of alertness. Improvement of cognitive performance is related to sleep stage 2
(Debarnot et al., 2011). Since a person reaches sleep stage 2 in a powernap, it is assumed that
cognitive performance is improved by the powernap. In the present study, cognitive
performance is linked to scores of subjects on a reaction time task. Because of these results,
the last hypothesis is: H4) Reaction time scores were shortened after a powernap.

| 13
Method
Participants
The 5 participants of the present study were students aged between the 19 and 24 years (M =
21.6, SD = 2.51). 2 participants were male and 3 participants were female. 1 female
participant was studying at the University of Twente and 4 participants were studying at the
Saxion Hogeschool Enschede. 4 of the participants were roommates of the researcher and 1
participant was an acquaintance. All participants had a Dutch nationality. Participation was
voluntary en they received no financial contributions. Every participant performed the same
procedure and reaction time task.
Instruments & Procedure
Instruments
The areas for application of EDA have been steadily widened and ambulatory monitoring has
come into use more frequently during the last two decades. Ambulatory monitoring
techniques are electrodermal recording techniques which are robust enough for the use in
various field settings outside the laboratory. An example for ambulatory measurement is the
affective Q-sensor (www.affectiva.com), used in this study. A Q-sensor is a wristband for SC-
recording to be worn like a wristwatch. Two metal electrodes were placed side by side for
contacting the volar surface of the wrist, since it does not contain hairs. Besides skin
conductance, the Q-sensor also measures body temperature and it has an accelerometer for
physical activity measurements. An accelerometer is low-cost, flexible and accurate for the
analysis of posture and movement. The analog samples are sampled at 32 Hz. The battery has
a nominal voltage of 3.7 V and can be recharged from a universal serial bus (USB) port. The
Q-sensor contains a microSD card of 2gb, which provides enough storage capacity for 28
days of continuous measurements with a sampling rate of 32 Hz. The Q-sensor is one of the
few comfortable sensors that could be worn outside the clinical environment and into the
daily activities. The Q-sensor measured skin conductance during physical, cognitive and
emotional stressors at palmar sites (Poh, Swenson & Picard, 2010).

| 14
Procedure
Before the participants started, they received a paper with information about the study and had
to sign an informed consent. They were informed about the Q-sensor and when they had to
wear the Q-sensor. The participants wore the Q-sensor from 10.00 a.m. until 17.00 p.m on the
left distal forearm, for 5 days. This time period was divided by the researcher into 14
moments of a half an hour. The powernap was taken at one of these 14 moments in a day.
This powernap moment was randomly chosen for each day, as described in Appendix 1. The
participants wore the Q-sensor all the time, except when they did an activity whereby the Q-
sensor could not be worn (during a shower, for example). When a moment of the day needed
special attention, according to a participant, he or she could press the round button once.
When this button was pressed, the text file with EDA data showed a complete white line. At
17.00 p.m. the Q-sensor was removed and the data was saved on a laptop.
Besides wearing the Q-sensors, the participants also had to perform a reaction time
task every half an hour so their reaction time of a day became clear. The participants already
performed the reaction time task a few times before they started the experiment. The reason
was that there could be a learning curve by performing the reaction time task. If the
participants performed the reaction time task a few times before the experiment started, than
the scores were more consistent and the study achieved a more realistic view at the reaction
time of a participant. The reaction time task, which was performed by the participants, was
developed by the BBC (http://www.bbc.co.uk/science/humanbody/sleep/sheep/). The BBC
created the task with the aim to show the effect of caffeine on the alertness of a person.
According to this website, tiredness can affect a person’s reaction time and a cup of coffee/tea
could have an impact on a person’s performance on the reaction time task. The reaction time
task was a task where the participant had to press the tranquilizer button as fast as possible,
when a sheep was leaving the flock and running for freedom. There were 5 sheep to stop.
After the participants stopped the 5 sheep, their reaction time scores were shown and listed.
When the person pushed the button to fast, they received a penalty of 3 seconds. These scores
were excluded from the data for the study. The participant performed the reaction time task 2
times in sequence. This meant that the participant had 10 reaction time scores for every half
an hour.

| 15
Design
The design was chosen based on the book by Dugard, File and Todman (2011). The present
study was the closest to the ‘small-n repeated measures design with replicates’. There were a
few conditions for this design. First, the study should have at least two participants, this
present study had 5 subjects. Second, the study should have two conditions to compare. This
present study had two conditions, ‘no powernap’ and ‘powernap’. Third, each participant
should receive each of the conditions on at least two occasions and it should be possible to
assign conditions in random order to each participant. Also, each participant should act as his
or her own control. That was the case in the present study.
In a study, internal validity is an important concept. Dugard, File and Todman (2011)
are suggesting that internal validity eliminates alternative explanations for any treatment
effect observed. These researchers argued an important tool for internal validity, namely
randomization. Randomization is not the same as random sampling. Random sampling means
choosing a sample from a well-defined population by using random numbers. Randomization
means the method of allocating different treatments, conditions or interventions. It was
impossible to randomly assign participants in this small-n study, but instead it was possible to
randomly assign treatments to observation occasions. This meant randomly assign powernap
moments for the subjects. In this study, the subjects wore the Q-sensor from 10.00 a.m. until
17.00 p.m. This period was divided into 14 blocks of half an hour. At one of these blocks the
subject took a powernap. This was randomly chosen, according to the method of Dugard, File
and Todman (2011). This method is described in Appendix 1.
Data analysis
Randomization test and t-test
The present study used randomization tests, based on the book by Dugard, File and Todman
(2011). These researchers showed differences between a t-test and a randomization test. With
a t-test, one would calculate the t from a measurement made on the two conditions (no
powernap or powernap) and then compare the t with its table of probabilities to see whether
the obtained t value would have a less than 5% chance of occurring if the null hypothesis is
true. In this present research, a very simple measurement was used. There was just recorded
whether condition 1 or condition 2 is correct for each test period. Then the number correct
was compared with all the other possible arrangements of condition 1 and condition 2. This
present study used randomization tests that had an experimental setup like analysis of
| 16
variance (or t tests if there are only two conditions). This design of the test was referred as
analog of ANOVA.
Random selection
With the aid of the book by Dugard, File and Todman (2011), ‘small-n repeated measures
design with replicates’ was chosen as design. The only problem was that this design needed
an equal number of observations in each condition. That was not the case in the present study.
Of the 14 blocks in a day, there was 1 block with a powernap and 13 blocks without a
powernap. Over 5 days, there were 5 blocks with a powernap and 65 blocks without a
powernap. These blocks could not be compared in this way. The data had to be classified in
the file, so that it fitted within the design. It was also not convenient to take average scores
and standard deviations, because the condition without a powernap had many more
observations. This led to the decision to randomly select 1 block for each day and to compare
these 5 blocks with the 5 powernap blocks. The random selection was done by the manner of
Appendix 1. Only this time, a day was divided in 13 blocks, because the powernap block was
not taken into account. Finally there arose 5 observation moments per condition, with a total
of 10 observations per subject.
Data processing with a macro
When a design was chosen that suited the study, then Dugard, File and Todman (2011)
showed exactly how to implement it by using macros. A macro is a way to automate a task
that you perform repeatedly and the macro of the present study is shown in Appendix 2. In the
present study, the macro was used as a task that creates pseudo datasets for every possible
block for a powernap. The macro calculated the differences in averages. The dataset had to be
arranged for the macro. The first number in ‘limits’ column was the number of participants;
the second was the number of observations per participant. The second column contained the
dataset per condition, per subject. The third column was the column with the two conditions
and the fourth column contained the different subjects. An example of a dataset can be found
in Appendix 2.
In this present research, there were three different dataset. One dataset for reaction
times, one for the number of skin conductance responses per block and one for the amplitude
of the SCRs per block. In the case of the reaction time dataset, the penalties were removed.
Subjects received a penalty when they pressed the button too early and this led to a
lengthened reaction time. This affected the average reaction time, so they were removed by

| 17
the researcher. For the other the other hypothesis on reaction time, there were 20 random
scores selected. Here, 10 scores of all reaction times before the powernap were randomly
chosen and 10 of all reaction times after the powernap, per participant for all days together.
This meant that there were 20 observations per participant, 10 in condition 1 (reaction times
before the powernap) and 10 in condition 2 (reaction times after the powernap). In this way,
any differences between the reaction times before the powernap and the reaction times after
the powernap could be measured. For determining frequency and amplitude of SCR’s, the
data was processed in MATLAB. Here, the EDA and stimuli data were synchronized by
coupling the registered unix timestamps. For determining SCR’s the data was filtered with a
Butterworth filter (cut-off frequency = 1/32 Hertz). Then, the first derivative was calculated
to find speed changes above .000004 microSiemens for finding the ascent of the SCR. There
had to be a minimum gap of 700 ms between peaks, otherwise the detected peaks (SCR’s)
were combined to one. An amplitude criterion of .01 microSiemens was used.
Self report
In the present study, there was also a self report question for the participants. The participants
were asked if the participant thought he or she slept during the powernap. There were two
conditions here and five observation moments (powernap moments). When the participant
thought he or she slept during the powernap, this was processed in condition ´yes´. Sometimes
a participant indicated that the participant was not sure whether he or she had slept, this was
marked as the condition ‘maybe’. There was no participant who indicated to be sure that he
or she had not slept during the powernap.
For processing of the data, two observation moments were randomly chosen per
participant. One of the observation moments in condition ‘yes’ was randomly chosen and
there was also one moment taken in condition 2 ‘maybe’. This means that there were the same
number of observation moments per condition: 1 score in condition ‘yes’ and 1 score in
condition ‘maybe’. In these moments, the skin conductance responses were taken to see if
there were any differences between the two conditions.
| 18
Results
Skin conductance responses
The first hypothesis was about the number of SCR’s during the powernap. The expectation
was that the number of SCRs at the day was lowest during the powernap. The number of
SCRs was noted in the file in blocks of a half an hour. Because the researcher expected a
greater mean number SCRs on the condition without a powernap, this was taken as condition
2. This meant that condition 1 became the condition were the participant took a powernap.
The test statistic of the randomization test was the mean of condition 2 minus the mean of
condition 2, so 67.84-32.88=34.96 and p = .045. This meant that in this randomization test
(one-tailed) of the prediction that the mean number of SCRs in condition 1 was lower than the
mean number SCRs in condition 2, 4.5% of a random sample of 2000 rearrangement statistics
were at least as large as the experiment value. Because this was quite close to our significance
level of 5% (a = .05), the researcher took 3 more random samples of 2000 rearrangement
statistics and found p = .035, p = .036 and p = .043. This showed that p < .05, so the null
hypothesis was rejected. There is significant evidence that the number of SCRs at the day
were lowest during the powernap.
Table 3.1. Number of observations, means and standard deviations of SCR’s per condition.
Table 3.1. shows the mean, standard deviation and the number of SCRs per condition. There
was a large discrepancy in mean and standard deviation per condition. This made it interesting
to look at the differences in mean number SCRs per condition between the participants. This
was shown in figure 1. It was remarkable that participant 2 clearly scored lower on the mean
number of SCRs than the rest of the participants and participant 4 scored higher than the other
participants. Figure 3.2. shows an example of the difference between participant 2 and
participant 3 and their EDA around and during the powernap of. All participants had fewer
N Mean Standard
deviation
Powernap 25 32.88 55.94
No Powernap 25 67.84 83.28

| 19
SCRs in condition 1 than in condition 2 and this also confirmed that the mean number SCRs
was lowest in condition 1 compared with condition 2. The individual differences were clearly
visible in figure 3.1.
Figure 3.1. Mean number of SCR’s per participant, per condition.
Figure 3.2. Example of a time of day with a powernap from participant 3 (top) and participant
2 (bottom). The blue graph shows EDA in microsiemens (μS) and the arrow indicates when
the powernap was taken. On top, the time of day and the date can be seen.

| 20
Amplitude of SCRs
Besides SCRs, amplitude was also an important concept. The second hypothesis was that the
amplitude of SCRs at a day was lowest during the powernap. Condition 1 was the condition
where the participant took a powernap and condition 2 was the condition without a powernap.
As table 3.2. showed, the mean score of condition 1 (M = 4.07) was lower than the mean
score of condition 2 (M = 15.03) on the amplitude of SCRs. The standard deviation of
condition 2 was remarkable high (SD = 42.48). The test statistic of the randomization test was
10.96 and p = .083. These results showed that in this randomization test of the prediction that
the amplitude of SCRs at a day was lowest during the powernap, 8.3% of the rearrangement
statistics were at least as large as the experimental value. This was not less than the
significance level of 5% (a = 0.05), but it was close to it. For that reason, the researcher took
3 more random samples of 2000 rearrangement statistics and found p = .070, p = .076 and p =
.077. According to these findings, the experiment provided marginal evidence that the
amplitude of SCRs at a day was lowest during the powernap.
Table 3.2. Number of observations, means and standard deviations of amplitude per
condition.
N Mean Standard
deviation
Powernap 25 4.07 9.17
No Powernap 25 15.03 42.48
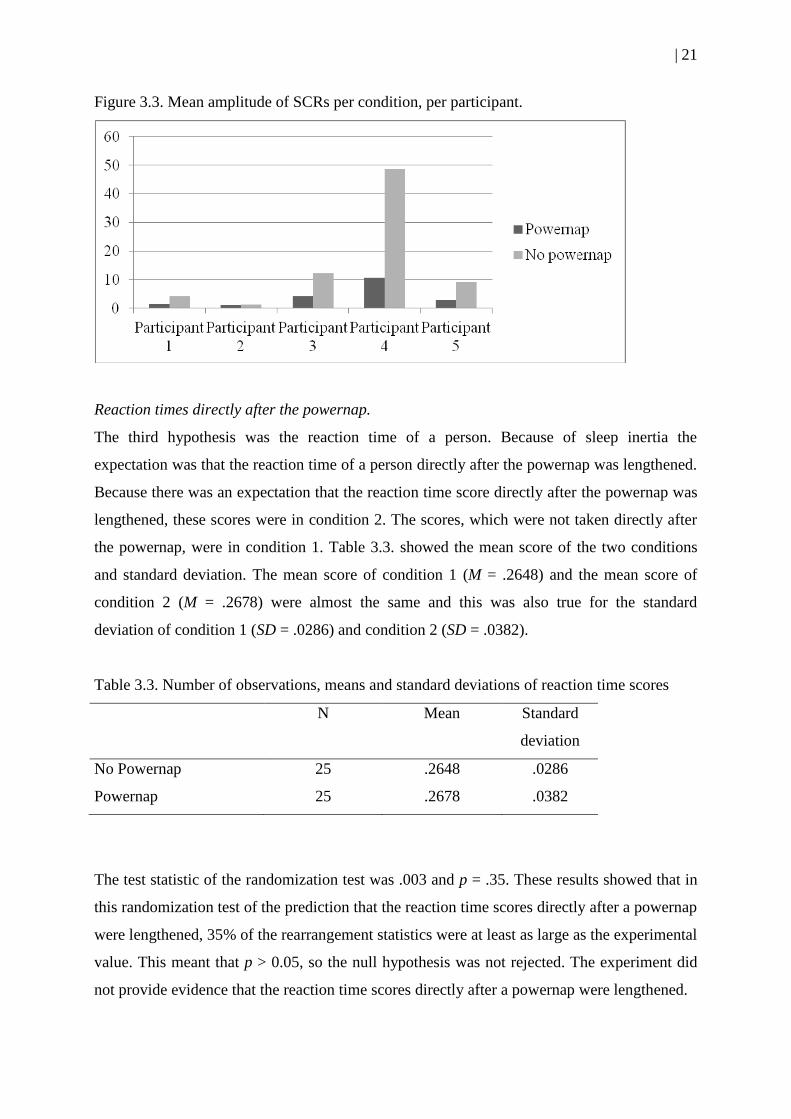
In figure 3.3. the mean amplitude of SCRs per condition, per participant was shown, to take a
look at the individual differences. Participant 4 had a remarkably high amplitude of SCRs at
condition 2 and showed a great difference between condition 1 en condition 2. This explained
the high score on standard deviation in condition 2. The other participants had higher
amplitude of SCRs at condition 2.
| 21
Figure 3.3. Mean amplitude of SCRs per condition, per participant.
Reaction times directly after the powernap.
The third hypothesis was the reaction time of a person. Because of sleep inertia the
expectation was that the reaction time of a person directly after the powernap was lengthened.
Because there was an expectation that the reaction time score directly after the powernap was
lengthened, these scores were in condition 2. The scores, which were not taken directly after
the powernap, were in condition 1. Table 3.3. showed the mean score of the two conditions
and standard deviation. The mean score of condition 1 (M = .2648) and the mean score of
condition 2 (M = .2678) were almost the same and this was also true for the standard
deviation of condition 1 (SD = .0286) and condition 2 (SD = .0382).
Table 3.3. Number of observations, means and standard deviations of reaction time scores
N Mean Standard
deviation
No Powernap 25 .2648 .0286
Powernap 25 .2678 .0382
The test statistic of the randomization test was .003 and p = .35. These results showed that in
this randomization test of the prediction that the reaction time scores directly after a powernap
were lengthened, 35% of the rearrangement statistics were at least as large as the experimental
value. This meant that p > 0.05, so the null hypothesis was not rejected. The experiment did
not provide evidence that the reaction time scores directly after a powernap were lengthened.

| 22
Comparison between reaction times
The last hypothesis was that the reaction time of a person was shortened after a powernap,
because of the powernap. 10 randomly chosen reaction time scores before the powernap were
taken and also 10 randomly chosen reaction time scores after the powernap. These scores
were compared. Condition 1 was the condition where the participants took a powernap and
condition 2 was the condition without the powernap. Table 3.4. showed the mean score on the
reaction time task in condition 1 (M = .2686) was slightly lower than the mean score in
condition 2 (M = .2781). This also applied for the standard deviation in condition 1 (SD =
.0272) and condition 2 (SD = .0318).
Table 3.4. Number of observations, means and standard deviations of reaction time scores
N Mean Standard
deviation
Powernap 5 .2686 .0272
No Powernap 5 .2781 .0318
The test statistic of the randomization test was 9.54 and p = .031. These results showed that in
this randomization test of the prediction that the reaction time scores after a powernap were
shortened, 3.1% of the rearrangement statistics were at least as large as the experimental
value. This is less than the significance level of 5% (a = 0.05), so the researcher took 3 more
random samples of 2000 rearrangement statistics to be sure and found p = .036, p = .040 and
p = .035. The experiment did provide evidence that the reaction time scores after a powernap
were shortened, compared with the scores before the powernap. However, there were no
major differences between the two conditions.
Self report
The self report question was about the question if the participant thought he or she slept
during the powernap. The two conditions were ‘yes’ and ‘maybe’. The answers are shown in
table 3.5.
Table 3.5. Answers of participants to the self report question: ‘Did you sleep during the
powernap?’
| 23
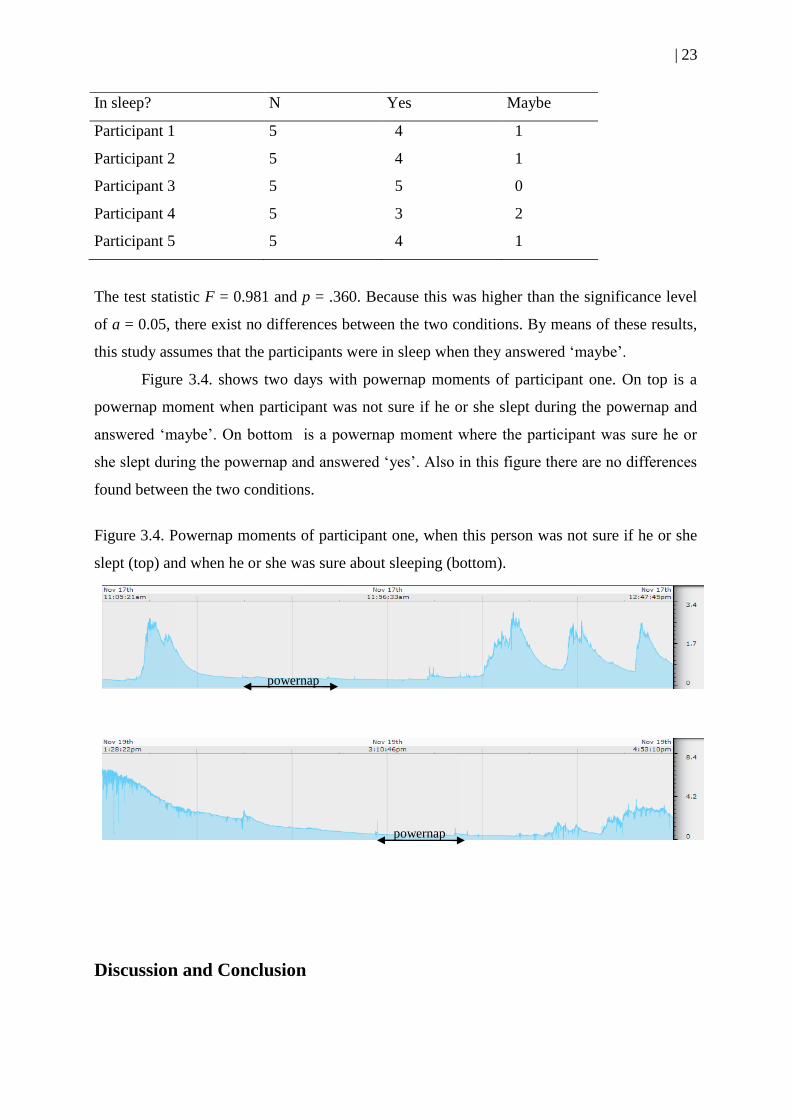
In sleep? N Yes Maybe
Participant 1 5 4 1
Participant 2
Participant 3
Participant 4
Participant 5
5
5
5
5
4
5
3
4
1
0
2
1
The test statistic F = 0.981 and p = .360. Because this was higher than the significance level
of a = 0.05, there exist no differences between the two conditions. By means of these results,
this study assumes that the participants were in sleep when they answered ‘maybe’.
Figure 3.4. shows two days with powernap moments of participant one. On top is a
powernap moment when participant was not sure if he or she slept during the powernap and
answered ‘maybe’. On bottom is a powernap moment where the participant was sure he or
she slept during the powernap and answered ‘yes’. Also in this figure there are no differences
found between the two conditions.
Figure 3.4. Powernap moments of participant one, when this person was not sure if he or she
slept (top) and when he or she was sure about sleeping (bottom).
powernap
powernap
Discussion and Conclusion
| 24
Hypotheses
The aim of the present study was to analyze EDA around and during a powernap and its
relationship to reaction time on a task. In order to analyze this aim, four hypotheses were
tested. Sano and Picard (2011) showed that individuals have different sleep stages and that a
person will only reach stage 2 during a powernap. Wuyts et al. (2012) argued that sleep comes
with a decrease in arousal. Based on these results, it was expected in the present study that
EDA will decrease during the powernap. The first hypothesis was that the number SCRs at
the day was lowest during the powernap. The results showed a difference between the number
of SCRs in the condition with powernap and in the condition without powernap. The number
of SCRs proved to be lower when the participants took a powernap, compared with the
condition where the participants had not taken a powernap. A comment on these results was
that not every observation of the condition without powernap was included in the
measurement, because otherwise the condition without powernap had far more measurements
than the condition with powernap. This ensured that one observation of the condition without
powernap was randomly chosen per day. Remarkable in these results was participant 2. This
participant had a low number of SCRs during the days and had a very small difference
between the condition with powernap and the condition without powernap, compared to the
other participants. This can have several causes. This person can be an electrodermal stabile
subject. According to Wilson (1987) electrodermal labile subjects show frequent ‘non
specific’ fluctuations in their skin conductance and have consistently demonstrated superior
signal detection performance as compared to ‘stabile’ subjects. This person did not show
many fluctuations, as seen in figure 3.2, and this may mean that he was a stabile subject. The
differences between labile and stabile subjects are an interesting point for future study.
In the second hypothesis was assumed that the amplitude of SCRs at a day was lowest
during the powernap. It was expected that the participants had a decreased arousal and the
lowest number of SCRs of a day during the powernap and this hypothesis ditch that view.
According to the results there were no differences between the mean amplitude of SCRs when
the participants took a powernap and the mean amplitude of SCRs when they did not. This did
not match with the hypothesis. Still, the test statistic (0.083) was close to the significance
level (a = 0.05). This meant that there were marginal differences between in the condition
with powernap and the condition without powernap, for the present participants. For example,
a remarkable result was the high mean amplitude of SCRs on condition without powernap of
participant 4. This participant had also the most number of SCRs according to the results of

| 25
the first hypothesis. This too may be explained by electrodermal lability, as discussed in the
discussion of the first hypothesis, or the activities this subject did.
For the third hypothesis, the reaction times of participants were measured. Tassi &
Muzet (2000) introduced the term of sleep inertia, which referred to a behavioral slowdown
after awakening. The person may still be in a state of sleep. Because of this phenomenon, the
expectation of this study was that the reaction time of a person was lengthened directly after
the powernap. It was possible that the person still suffered from the sleep inertia. The results
of the present study were however not in line with the hypothesis, because there was no
difference found between the reaction times in the two conditions. According to the study of
Tassi & Muzet (2000), there were researchers that proved no decrement on subsequent
performance after a powernap of 20 minutes. However these results were based on memory
tasks and this study used a reaction time task. Still, because of the results, it seemed to be that
the participants did not suffer from sleep inertia, because the reaction times directly after the
powernap were not lengthened compared with the reaction times before or after the powernap.
An explanation could be that a person only suffers from sleep inertia when the person will
reach the slow wave sleep. Many researchers showed maximum sleep inertia after awakening
a slow wave sleep episode. Tassi & Muzet (2000) argued also that sleep inertia produced a
decreased reaction time, up to 360% of pre-sleep performance, depending on the type of task.
It is possible that this task was not accurate enough to measure reaction time. Still, van
Dongen and Dinges (2005) were suggesting that very short naps (circa 10 minutes) may offer
a person benefits without suffering from sleep inertia. The results of the present study were in
line with this assumption, and showed another advantage for taken a powernap: a powernap
will not cause sleep inertia and a person will not suffer from it.
A power nap is taken because there are several positive effects. A powernap improves
alertness (Takahashi et al. 1998). A nap causes a shortened P300 and a shortened P300
represents increased alertness and this improves the cognitive performance. To measure this,
the last hypothesis was tested. Because of the results with improved alertness, this study
expected shortened reaction times after the powernap compared with reaction time before the
powernap. The results showed a difference for the participants between the condition with a
powernap and condition without a powernap. The reaction time scores of the subjects were
shortened after a powernap in comparison with the scores before the powernap. This meant
that power nap caused improved cognitive ability and thus a shortened reaction time. The
results of the present study are in line with the earlier findings by Takahashi, Fukuda and
Arito (1998).
| 26
Limitations
The present study had to do with some limitations. First of all the number of participants. The
present study was a small-n study. It is difficult to randomize the participants. This overcome
in the manner of Dugard, File and Todman (2011) described previously, but there were some
complications. The participants could not always perform on the reaction time task, because
of their daily activities. They had college or went sporting, for example. Participant 1 and
participant 2 both had no EDA signal for about a half an hour on day 3. The reason was that
participant 1 went sporting and participant 2 took a shower. They had to take the Q-sensor off
for these activities. There was also a problem at day one for participant 2. Instead of taking a
powernap of 20 minutes, this participant took a nap of 3 hours. The participant said he was
not awakened by the alarm.
Generalization was another problem in this study. It is hard to generalize in a small-n
study, because of the few participants. Dugard, File and Todman (2011) therefore argue: ‘It is
virtually unheard of for experiments with people to meet the random sampling assumption
underlying the significance tables that are used to draw interference about populations.
Generalization almost invariably depends upon replication and non statistical reasoning.’
According to Lucas (2003) however, generalization of research findings refer to external
validity, either from a sample to a larger population or to settings and populations other than
those studied. This study used only students between 19 and 24 from Enschede. To ensure
generalization, measures in any study must relate to each other consistently with theoretically
derived hypotheses for the study to have external validity. Measures in any study must relate
to each other consistently with theoretically derived hypotheses for the study to have external
validity. For future studies, there should be selected more wide for participants. For example
participants with other ages or in different settings.
The reaction time task was another point that could be improved in future research.
Because the participants had to perform a reaction time task every half hour, it was
convenient to choose a task that they could perform on their mobile phones. The participants
carried their mobile phones always with them and so they could perform the reaction time
task anywhere. The reaction time task was found on the site of BBC. The only comment here
is that this task was not scientifically examined. Sometimes scores were exactly the same for
some participants. It was also suggested that the participants were given a penalty of 3
seconds when they pushed too early. This means that sometimes a delayed reaction time had

| 27
because of the penalty. These scores had to be removed and therefore remained less reaction
time scores. For future research it is recommended to use a scientific reaction time task.
Future research
Electrodermal lability and stability are an interesting concept for future research (Wilson,
1987), as discussed above in paragraph 4.1. Stabile subjects showed a rapid habituation to
tasks and had few non specific fluctuations, compared with labile subjects. However, labile
subjects tended to have faster reaction time scores overall and they were better able to
maintain a state of optimal preparation over longer periods. The interesting point here is that
these findings were measured in experimental setting and with a Q-sensor this could be
measured in the normal, daily life of a subject. Future studies could measure whether a labile
subject reacts fiercer to activities than a stabile subject and if the powernap has different
effects on labile and stable people. These studies could also measure if labile subjects also
score faster reaction times on time tasks during their daily life instead of an experimental
environment.
In the study of Takahashi, Fukuda & Arito (1998), a nap after lunch is most likely
related to an improvement of alertness for daytime employees. Still, there are only a few
companies who offer a place where their employees can take a nap. A powernap can greatly
improve the work performance of employees and it will only take about 20 minutes. For
future studies, it might be an option to measure in a different setting such as a workplace. If
the powernap show a positive effect, employers may introduce the powernap more often to
their employees. This could provide more quality of work and less mistakes employees make.
Acknowledgement
I would like to thank everyone who were part of my bachelor thesis and supported me.
Special thanks go to my supervisor Dr. Matthijs Noordzij for his guidance. He made sure I
was always excited to work on my thesis and inspired me with his own ideas. Other special
thanks go to my roommates and friends for their participation and Dr. Martin Schmettow for
assessing my thesis.
References

| 28
Åkerstedt, T. (2007). Altered sleep/wake patterns and mental performance. Physiology &
Behavior, 90, 209-218.
Baxter, V. & Kroll-Smith, S. (2005). Normalizing the Workplace Nap: Blurring the
Boundaries between Public and Private Space and Time. Current Sociology, 53,
33-55.
Boucsein, W. (2012). Electrodermal activity. New York: Springer.
Broughton, R.J. (1968). Sleep disorders: disorders of arousal? Science, 159, 1070-1078.
Bonnefond, A., Muzet, A., Winter-Dill, A.S., Bailloeuil, C., Bitouze, F. & Bonneau, A.
(2001). Innovative working schedule: introducing one short nap during the night shift.
Ergonomics, 44, 10, 937-945.
Burgess, H.J., Legasto, C.S., Fogg, L.F. & Smith, M.R. (2013). Can small shifts in circadian
phase affect performance? Applied Ergonomics, 44, 1, 109-111.
Chennu, S. & Bekinschtein, T.A. (2012). Arousal modulates auditory attention and
awareness: insights from sleep, sedation, and disorders of consciousness. Frontiers in
psychology, 3, 1-9.
Davies, D.R. & Krkovic, A. (1965). Skin-Conductance, Alpha-Activity, and Vigilance. The
American Journal of Psychology, 78, 304-306
Dawson, M. E., Schell, A. M. & Filion, D. L. (2000). The electrodermal system. Handbook
of Psychophysiology. Cambridge University Press.
Debarnot, U., Castellani, E., Valenza, G., Sebastiani, L. & Guillot, A. (2011). Daytime naps
improve motor imagery learning. Cognitive Affect Behavavioral Neuroscience, 11,
541–550.

| 29
Dongen, van, H.P.A. & Dinges, D.F. (2005). Sleep, Circadian Rhythms, and Psychomotor
Vigilance. Clinics in Sports Medicine, 24, 237– 249.
Dugard, P., File, P. & Todman, J. (2011). Single-case and small-n experimental designs.
New York: Taylor & Francis Group.
El-Sheikh, M. & Arsiwalla, D.D. (2011). Children’s sleep, skin conductance level and mental
health. Journal of Sleep Research, 20, 326–337.
Haslam, D.R. (1985). Sleep deprivation and naps. Behavior research methods, 17, 46-54.
Hayashi, M. & Hori, T (1998). The effects of a 20-min nap before post-lunch dip. Psychiatry
and Clinical Neuroscience, 52, 203-204.
Javaheri, S. & Redline, S. (2012). Sleep, Slow-Wave Sleep, and Blood Pressure. Current
Hypertension Reports, 14, 442–448.
Johnson, L. C. & Lubin, A. (1966). Spontaneous electrodermal activity during waking and
sleeping. Psychophysiology, 3, 8–177.
Kas, M. J. H. (1999). Sleep and circadian timekeeping in octodon degus. Behavioral and
photic determinants of activity phase preference. Groningen: University of
Groningen.
Klemm, W.R. (2011). Why does REM sleep occur? A wake-up hypothesis. Frontiers in
systems neuroscience, 5, 1-12.
Knuistingh Neven, A., de Jongh, T.O.H. & Schimsheimer, R.J. (2004). Slaapklachten.
Diagnostiek van alledaagse klachten, 7, 751-762.
Malmo, R.B. (1959). Activation: a neurophysiological dimension. Psychol.
Rev., 66, 367 – 386.
| 30
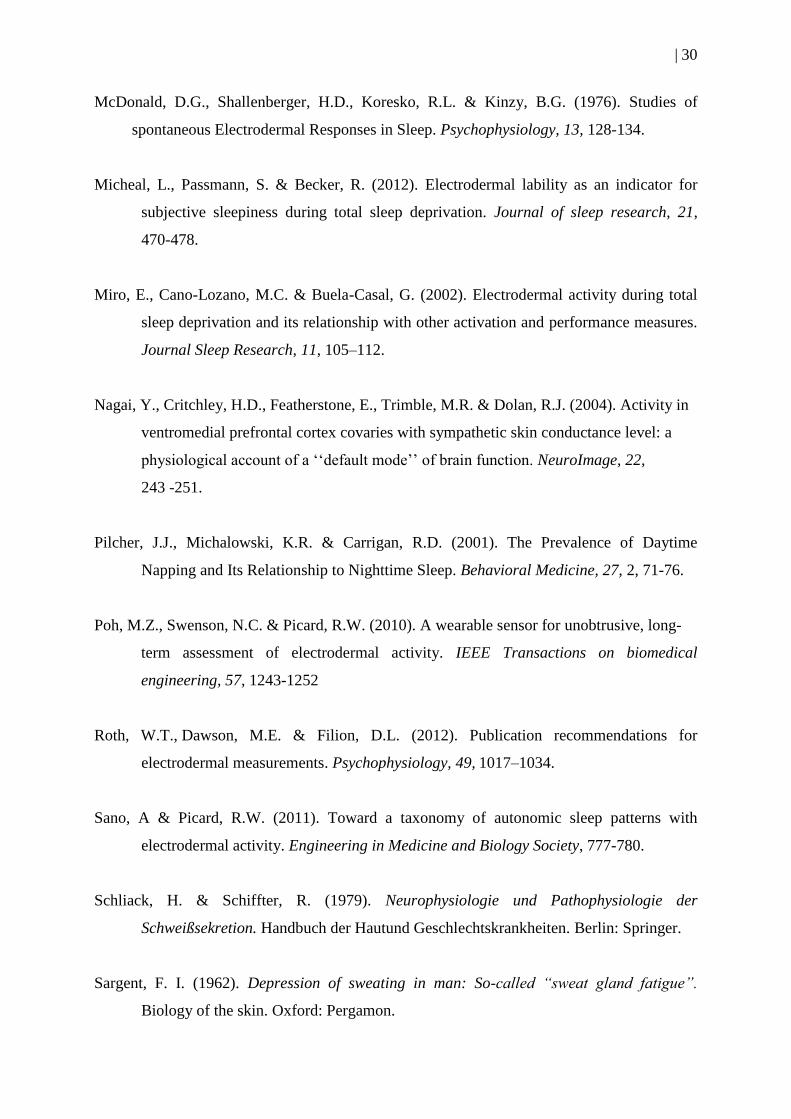
McDonald, D.G., Shallenberger, H.D., Koresko, R.L. & Kinzy, B.G. (1976). Studies of
spontaneous Electrodermal Responses in Sleep. Psychophysiology, 13, 128-134.
Micheal, L., Passmann, S. & Becker, R. (2012). Electrodermal lability as an indicator for
subjective sleepiness during total sleep deprivation. Journal of sleep research, 21,
470-478.
Miro, E., Cano-Lozano, M.C. & Buela-Casal, G. (2002). Electrodermal activity during total
sleep deprivation and its relationship with other activation and performance measures.
Journal Sleep Research, 11, 105–112.
Nagai, Y., Critchley, H.D., Featherstone, E., Trimble, M.R. & Dolan, R.J. (2004). Activity in
ventromedial prefrontal cortex covaries with sympathetic skin conductance level: a
physiological account of a ‘‘default mode’’ of brain function. NeuroImage, 22,
243 -251.
Pilcher, J.J., Michalowski, K.R. & Carrigan, R.D. (2001). The Prevalence of Daytime
Napping and Its Relationship to Nighttime Sleep. Behavioral Medicine, 27, 2, 71-76.
Poh, M.Z., Swenson, N.C. & Picard, R.W. (2010). A wearable sensor for unobtrusive, long-
term assessment of electrodermal activity. IEEE Transactions on biomedical
engineering, 57, 1243-1252
Roth, W.T., Dawson, M.E. & Filion, D.L. (2012). Publication recommendations for
electrodermal measurements. Psychophysiology, 49, 1017–1034.
Sano, A & Picard, R.W. (2011). Toward a taxonomy of autonomic sleep patterns with
electrodermal activity. Engineering in Medicine and Biology Society, 777-780.
Schliack, H. & Schiffter, R. (1979). Neurophysiologie und Pathophysiologie der
Schweißsekretion. Handbuch der Hautund Geschlechtskrankheiten. Berlin: Springer.
Sargent, F. I. (1962). Depression of sweating in man: So-called “sweat gland fatigue”.
Biology of the skin. Oxford: Pergamon.

| 31
Takahashi, M. (2003). The role of prescribed napping in sleep medicine. Sleep Medicine
Reviews, 227-235.
Takahashi, M., Fukuda, H. & Arito, H. (1998). Brief naps during post-lunch rest: effects on
alertness, performance, and autonomic balance. European Journal Applied
Physiololgy, 78, 93-98.
Tassi, P. & Muzet, A. (2000). Sleep inertia. Sleep Medicine Reviews, 341–353.
Vilches, J.J., Wynick, D., Kofler, B., Lang, R. & Navarro, X. (2012). Sudomotor function and
sweat gland innervation in galanin knockout mice. Neuropeptides, 46, 151-155.
Wilhelm, F. & Grossman, P. (2010). Emotions beyond the laboratory: Theoretical
fundaments, study design, and analytic strategies for advanced ambulatory assessment.
Biological psychology, 84, 552-569.
Wilson, K. G. (1987). Electrodermal lability and simple reaction time. Biological
Psychology, 24, 275-289
Wuyts, J., De Valck, E. & Vandekerckhove, M. et al. (2012). The influence of pre-sleep
cognitive arousal on sleep onset processes. International journal of psychophysiology:
official journal of the International Organization of Psychophysiology, 83, 8-15.
| 32
Appendices
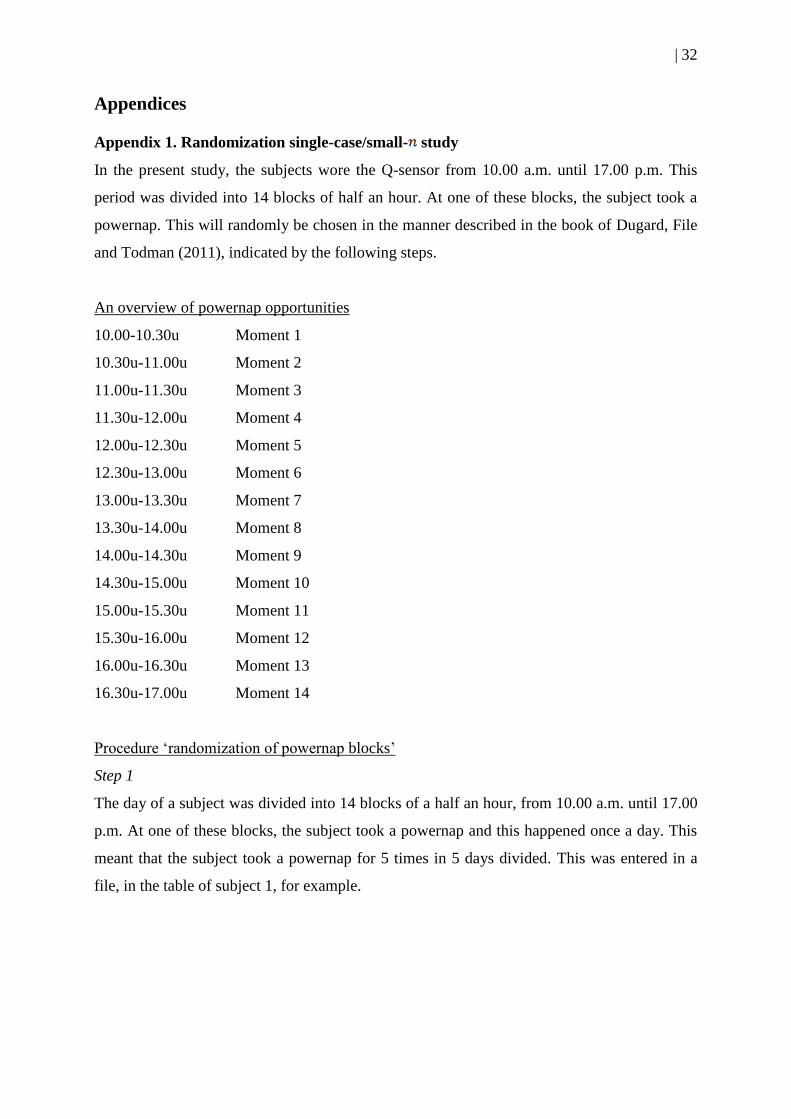
Appendix 1. Randomization single-case/small- study
In the present study, the subjects wore the Q-sensor from 10.00 a.m. until 17.00 p.m. This
period was divided into 14 blocks of half an hour. At one of these blocks, the subject took a
powernap. This will randomly be chosen in the manner described in the book of Dugard, File
and Todman (2011), indicated by the following steps.
An overview of powernap opportunities
10.00-10.30u Moment 1
10.30u-11.00u Moment 2
11.00u-11.30u Moment 3
11.30u-12.00u Moment 4
12.00u-12.30u Moment 5
12.30u-13.00u Moment 6
13.00u-13.30u Moment 7
13.30u-14.00u Moment 8
14.00u-14.30u Moment 9
14.30u-15.00u Moment 10
15.00u-15.30u Moment 11
15.30u-16.00u Moment 12
16.00u-16.30u Moment 13
16.30u-17.00u Moment 14
Procedure ‘randomization of powernap blocks’
Step 1
The day of a subject was divided into 14 blocks of a half an hour, from 10.00 a.m. until 17.00
p.m. At one of these blocks, the subject took a powernap and this happened once a day. This
meant that the subject took a powernap for 5 times in 5 days divided. This was entered in a
file, in the table of subject 1, for example.
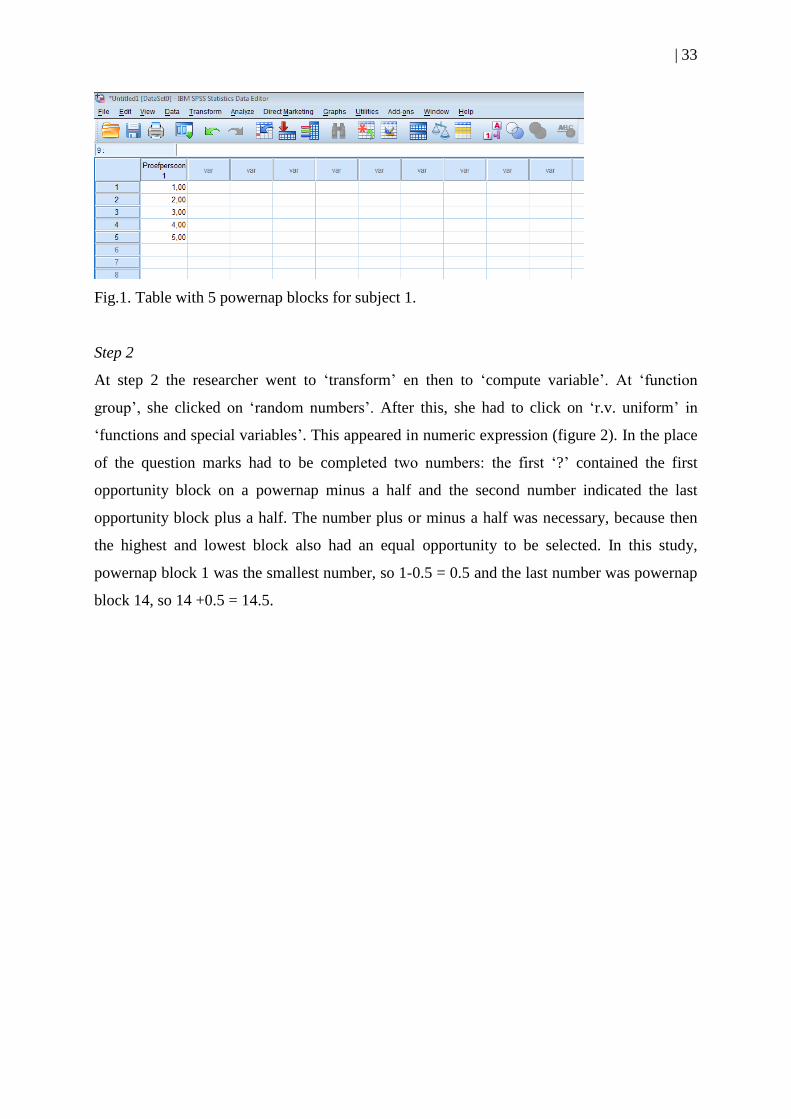
| 33
Fig.1. Table with 5 powernap blocks for subject 1.
Step 2
At step 2 the researcher went to ‘transform’ en then to ‘compute variable’. At ‘function
group’, she clicked on ‘random numbers’. After this, she had to click on ‘r.v. uniform’ in
‘functions and special variables’. This appeared in numeric expression (figure 2). In the place
of the question marks had to be completed two numbers: the first ‘?’ contained the first
opportunity block on a powernap minus a half and the second number indicated the last
opportunity block plus a half. The number plus or minus a half was necessary, because then
the highest and lowest block also had an equal opportunity to be selected. In this study,
powernap block 1 was the smallest number, so 1-0.5 = 0.5 and the last number was powernap
block 14, so 14 +0.5 = 14.5.

| 34
Fig.2. SPSS screen when following the instructions of step 2.
Step 3
On the question marks, the numbers 0.5 and 14.5 were filled in as described in step 2. The
target variable was given a name, in this case ‘NapMoment’. Then the researcher had to click
on ‘ok’.
| 35
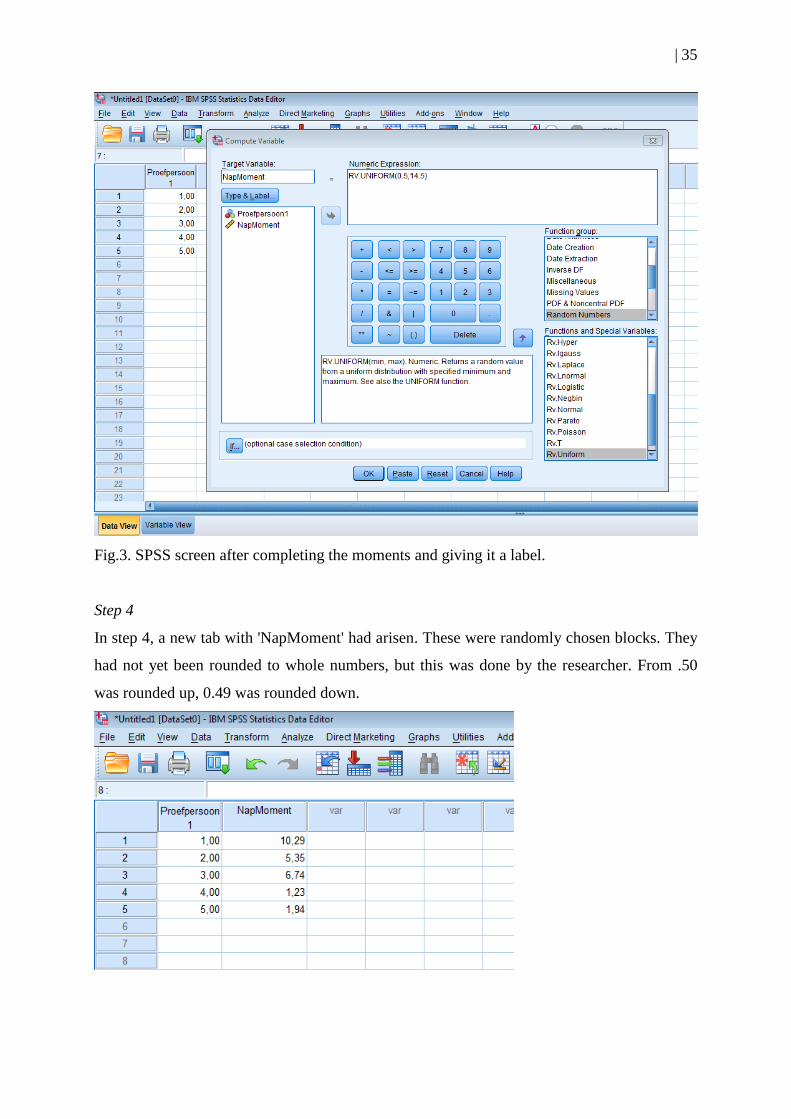
Fig.3. SPSS screen after completing the moments and giving it a label.
Step 4
In step 4, a new tab with 'NapMoment' had arisen. These were randomly chosen blocks. They
had not yet been rounded to whole numbers, but this was done by the researcher. From .50
was rounded up, 0.49 was rounded down.

| 36
According to this table subject 1 had to take the powernap at the following blocks:
Day 1: on nap moment 10 (this means from 14.30 p.m. until 15.00 p.m.)
Day 2: on nap moment 5 (from 12.00 p.m. until 12.30 p.m.)
Day 3: on nap moment 7 (from 13.00 p.m. until 13.30 p.m.)
Day 4: on nap moment 1 (from 10.00 a.m. until 10.30 a.m.)
Day 5: on nap moment 2 (from 10.30 a.m. until 11.00 a.m.)
If the subject could not take a nap at one of these times of the day, the researcher could
choose separately another random block by following the previous steps. At that time, only
one time was entered into the file.
These steps had to be followed by the researcher for every subject separately.
Powernap moments after following these steps:

| 37
Reaction time
The reaction time test had to be done every half an hour, 2 times in a row. The subject
recorded the results of the reaction times itself in a file. There were, per half an hour, 10
reaction times of the subject. Every half an hour the reaction of a subject (from 10.00 a.m.
until 17.00 p.m.) was measured.
An example of the reaction time task:

| 38
Appendix 2. Macro and Dataset
Macro
set mxloops 5000.
matrix.
get limits/variables=limits/missing=omit.
get data/variables data condition participant/missing omit.
compute ncase=limits(1).
compute nswaps=limits(2).
compute nobs=ncase*nswaps.
compute total={0,0}.
loop obs=1 to nobs.
compute total(data(obs,2))=total(data(obs,2))+data(obs,1).
end loop.
compute test1=(total(2)-total(1))/(nobs/2).
print test1/title="test statistic".
compute nperm=2001.
compute results=uniform(nperm,1).
compute results(1,1)=test1-test1/1000000.
loop perm=2 to nperm.
loop case = 1 to ncase.
loop n= 1 to nswaps.
compute k=trunc(uniform(1,1)*(nswaps-n+1))+n+nswaps*(case-1).
compute obs=n+nswaps*(case-1).
compute temp=data(obs,1).
compute data(obs,1)=data(k,1).
compute data(k,1)=temp.
end loop.
end loop.
compute total={0,0}.
loop obs=1 to nobs.
compute total(data(obs,2))=total(data(obs,2))+data(obs,1).
end loop.
compute test1=(total(2)-total(1))/(nobs/2).
compute results(perm,1)=test1.
end loop.
compute absres=abs(results).
compute pos1=0.
compute pos2=0.
loop k=2 to nperm.
do if results(k,1)>=results(1,1).
compute pos1=pos1+1.
end if.
do if absres(k,1)>=absres(1,1).
compute pos2=pos2+1.
end if.
end loop.
print pos1/title="count of arrangement statistics at least as large".
compute prob1=(pos1+1)/nperm.

| 39
This macro was used as syntax in SPSS. The macro was used on the different datasets with
the number of skin conductance, amplitude and reaction time scores. Below, you can find an
example of a data set.
Dataset
An example of a dataset that used the macro above. This dataset belongs to the first hypothese
about the number of SCRs per condition, per participant.