Exploring mental effort and nausea via electrodermal activity within scenario-based tasks
85
Exploring mental effort and nausea via electrodermal activity within scenario-based tasks by Chase Rubin Meusel A thesis submitted to the graduate faculty in partial fulfillment of the requirements for the degree of MASTER OF SCIENCE Major: Human Computer Interaction Program of Study Committee: Stephen Gilbert, Major Professor Michael Dorneich Richard Stone Iowa State University Ames, Iowa 2014 Copyright Chase Rubin Meusel, 2014. All rights reserved.
Transcript of Exploring mental effort and nausea via electrodermal activity within scenario-based tasks
Exploring mental effort and nausea via electrodermal activity within
scenario-based tasks
by
Chase Rubin Meusel
A thesis submitted to the graduate faculty
in partial fulfillment of the requirements for the degree of
MASTER OF SCIENCE
Major:
Human Computer Interaction
Program of Study Committee:Stephen Gilbert, Major Professor
Michael DorneichRichard Stone
Iowa State University
Ames, Iowa
2014
Copyright © Chase Rubin Meusel, 2014. All rights reserved.

ii
DEDICATION
I dedicate this thesis to my wife Sarah and my daughter Aubrey. Without them, I wouldn’t
be here today. So say we all.
iii
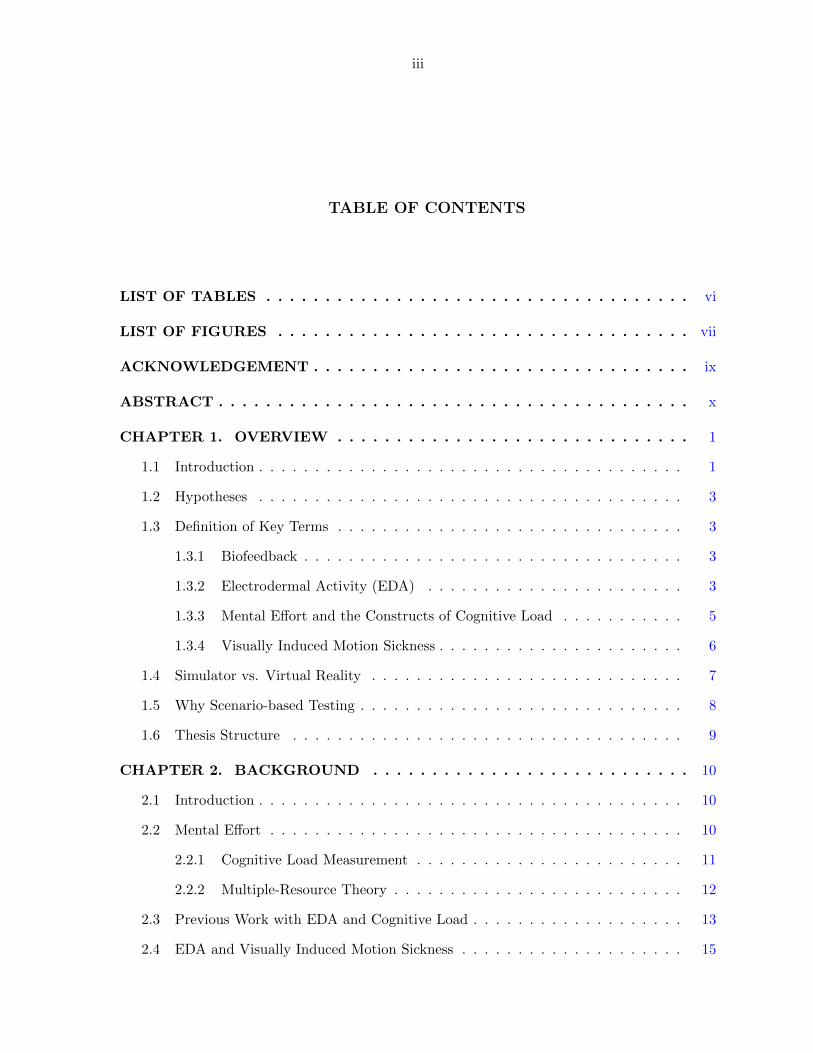
TABLE OF CONTENTS
LIST OF TABLES . . . . . . . . . . . . . . . . . . . . . . . . . . . . . . . . . . . . vi
LIST OF FIGURES . . . . . . . . . . . . . . . . . . . . . . . . . . . . . . . . . . . vii
ACKNOWLEDGEMENT . . . . . . . . . . . . . . . . . . . . . . . . . . . . . . . . ix
ABSTRACT . . . . . . . . . . . . . . . . . . . . . . . . . . . . . . . . . . . . . . . . x
CHAPTER 1. OVERVIEW . . . . . . . . . . . . . . . . . . . . . . . . . . . . . . 1
1.1 Introduction . . . . . . . . . . . . . . . . . . . . . . . . . . . . . . . . . . . . . . 1
1.2 Hypotheses . . . . . . . . . . . . . . . . . . . . . . . . . . . . . . . . . . . . . . 3
1.3 Definition of Key Terms . . . . . . . . . . . . . . . . . . . . . . . . . . . . . . . 3
1.3.1 Biofeedback . . . . . . . . . . . . . . . . . . . . . . . . . . . . . . . . . . 3
1.3.2 Electrodermal Activity (EDA) . . . . . . . . . . . . . . . . . . . . . . . 3
1.3.3 Mental Effort and the Constructs of Cognitive Load . . . . . . . . . . . 5
1.3.4 Visually Induced Motion Sickness . . . . . . . . . . . . . . . . . . . . . . 6
1.4 Simulator vs. Virtual Reality . . . . . . . . . . . . . . . . . . . . . . . . . . . . 7
1.5 Why Scenario-based Testing . . . . . . . . . . . . . . . . . . . . . . . . . . . . . 8
1.6 Thesis Structure . . . . . . . . . . . . . . . . . . . . . . . . . . . . . . . . . . . 9
CHAPTER 2. BACKGROUND . . . . . . . . . . . . . . . . . . . . . . . . . . . 10
2.1 Introduction . . . . . . . . . . . . . . . . . . . . . . . . . . . . . . . . . . . . . . 10
2.2 Mental Effort . . . . . . . . . . . . . . . . . . . . . . . . . . . . . . . . . . . . . 10
2.2.1 Cognitive Load Measurement . . . . . . . . . . . . . . . . . . . . . . . . 11
2.2.2 Multiple-Resource Theory . . . . . . . . . . . . . . . . . . . . . . . . . . 12
2.3 Previous Work with EDA and Cognitive Load . . . . . . . . . . . . . . . . . . . 13
2.4 EDA and Visually Induced Motion Sickness . . . . . . . . . . . . . . . . . . . . 15
iv
2.4.1 EDA Indexing Visually Induced Motion Sickness in Real Environments 15
2.4.2 EDA Indexing Visually Induced Motion Sickness in Virtual Environments 16
2.5 Cognitive Load within Controlled Movement Tasks . . . . . . . . . . . . . . . . 16
2.6 EDA within Controlled Movement Tasks . . . . . . . . . . . . . . . . . . . . . . 18
2.7 Cognitive Load and Visually Induced Motion Sickness . . . . . . . . . . . . . . 19
2.8 Motivation and Predictions . . . . . . . . . . . . . . . . . . . . . . . . . . . . . 19
CHAPTER 3. METHODS AND PROCEDURES . . . . . . . . . . . . . . . . . 21
3.1 Introduction . . . . . . . . . . . . . . . . . . . . . . . . . . . . . . . . . . . . . . 21
3.2 Study One: Combine Simulator . . . . . . . . . . . . . . . . . . . . . . . . . . . 22
3.2.1 Methods . . . . . . . . . . . . . . . . . . . . . . . . . . . . . . . . . . . . 22
3.2.2 Procedures . . . . . . . . . . . . . . . . . . . . . . . . . . . . . . . . . . 23
3.2.3 Measures . . . . . . . . . . . . . . . . . . . . . . . . . . . . . . . . . . . 25
3.3 Study Two: Visually Induced Motion Sickness (VIMS) Mitigation . . . . . . . 27
3.3.1 Methods . . . . . . . . . . . . . . . . . . . . . . . . . . . . . . . . . . . . 27
3.3.2 Procedures . . . . . . . . . . . . . . . . . . . . . . . . . . . . . . . . . . 29
3.3.3 Study Process . . . . . . . . . . . . . . . . . . . . . . . . . . . . . . . . . 32
3.3.4 Measures . . . . . . . . . . . . . . . . . . . . . . . . . . . . . . . . . . . 34
3.4 Thesis-Specific Work . . . . . . . . . . . . . . . . . . . . . . . . . . . . . . . . . 36
3.4.1 Methods . . . . . . . . . . . . . . . . . . . . . . . . . . . . . . . . . . . . 36
3.4.2 Procedures . . . . . . . . . . . . . . . . . . . . . . . . . . . . . . . . . . 37
CHAPTER 4. RESULTS . . . . . . . . . . . . . . . . . . . . . . . . . . . . . . . . 38
4.1 Introduction . . . . . . . . . . . . . . . . . . . . . . . . . . . . . . . . . . . . . . 38
4.2 Study One: Combine Simulator . . . . . . . . . . . . . . . . . . . . . . . . . . . 39
4.2.1 EDA CT1 vs. CT2 . . . . . . . . . . . . . . . . . . . . . . . . . . . . . . 40
4.2.2 EDA and SEQ Correlation . . . . . . . . . . . . . . . . . . . . . . . . . 42
4.2.3 CT1 EDA and SEQ Correlation . . . . . . . . . . . . . . . . . . . . . . 43
4.2.4 CT2 EDA and SEQ Correlation . . . . . . . . . . . . . . . . . . . . . . 44
4.2.5 EDA Expert vs. Novice . . . . . . . . . . . . . . . . . . . . . . . . . . . 45

v
4.3 Study Two: VIMS . . . . . . . . . . . . . . . . . . . . . . . . . . . . . . . . . . 47
4.3.1 EDA and Nausea Correlation . . . . . . . . . . . . . . . . . . . . . . . . 48
4.3.2 EDA as a Predictor of Nausea . . . . . . . . . . . . . . . . . . . . . . . 48
4.3.3 EDA and NASA-TLX correlation . . . . . . . . . . . . . . . . . . . . . . 48
4.3.4 EDA Gamers vs. Non-gamers . . . . . . . . . . . . . . . . . . . . . . . . 49
4.3.5 VIMS and Mental Effort . . . . . . . . . . . . . . . . . . . . . . . . . . . 50
CHAPTER 5. SUMMARY AND DISCUSSION . . . . . . . . . . . . . . . . . 51
5.1 Introduction . . . . . . . . . . . . . . . . . . . . . . . . . . . . . . . . . . . . . . 51
5.2 Combine Study . . . . . . . . . . . . . . . . . . . . . . . . . . . . . . . . . . . . 51
5.2.1 EDA CT1 vs. CT2 . . . . . . . . . . . . . . . . . . . . . . . . . . . . . . 52
5.2.2 EDA and SEQ Correlation . . . . . . . . . . . . . . . . . . . . . . . . . 53
5.2.3 Expert vs. Novice EDA . . . . . . . . . . . . . . . . . . . . . . . . . . . 54
5.3 VIMS . . . . . . . . . . . . . . . . . . . . . . . . . . . . . . . . . . . . . . . . . 54
5.3.1 EDA and Nausea Correlation . . . . . . . . . . . . . . . . . . . . . . . . 55
5.3.2 EDA as a Predictor of Nausea . . . . . . . . . . . . . . . . . . . . . . . 56
5.3.3 EDA and Mental Effort Correlation . . . . . . . . . . . . . . . . . . . . 56
5.3.4 EDA Gamers vs. Non-gamers . . . . . . . . . . . . . . . . . . . . . . . . 57
5.3.5 VIMS and Mental Effort . . . . . . . . . . . . . . . . . . . . . . . . . . . 59
5.4 Limitations . . . . . . . . . . . . . . . . . . . . . . . . . . . . . . . . . . . . . . 59
5.5 Related Work . . . . . . . . . . . . . . . . . . . . . . . . . . . . . . . . . . . . . 60
5.6 Conclusions . . . . . . . . . . . . . . . . . . . . . . . . . . . . . . . . . . . . . . 61
5.7 Future Research . . . . . . . . . . . . . . . . . . . . . . . . . . . . . . . . . . . 62
APPENDIX A. Study Materials . . . . . . . . . . . . . . . . . . . . . . . . . . . 63
A.1 Simulator Sickness Questionnaire . . . . . . . . . . . . . . . . . . . . . . . . . . 63
A.2 NASA Task Load Index . . . . . . . . . . . . . . . . . . . . . . . . . . . . . . . 66
REFERENCES . . . . . . . . . . . . . . . . . . . . . . . . . . . . . . . . . . . . . . 69
vi
LIST OF TABLES
Table 4.1 Evans Correlation Strengths . . . . . . . . . . . . . . . . . . . . . . . . 38
Table 4.2 Cohen Effect Size . . . . . . . . . . . . . . . . . . . . . . . . . . . . . . 39
Table 4.3 Nausea levels and EDA correlation values per SSQ. . . . . . . . . . . . 48
Table 4.4 Mental effort and EDA correlation strengths. . . . . . . . . . . . . . . 49
Table 5.1 Nausea levels and EDA correlation strengths . . . . . . . . . . . . . . . 55

vii
LIST OF FIGURES
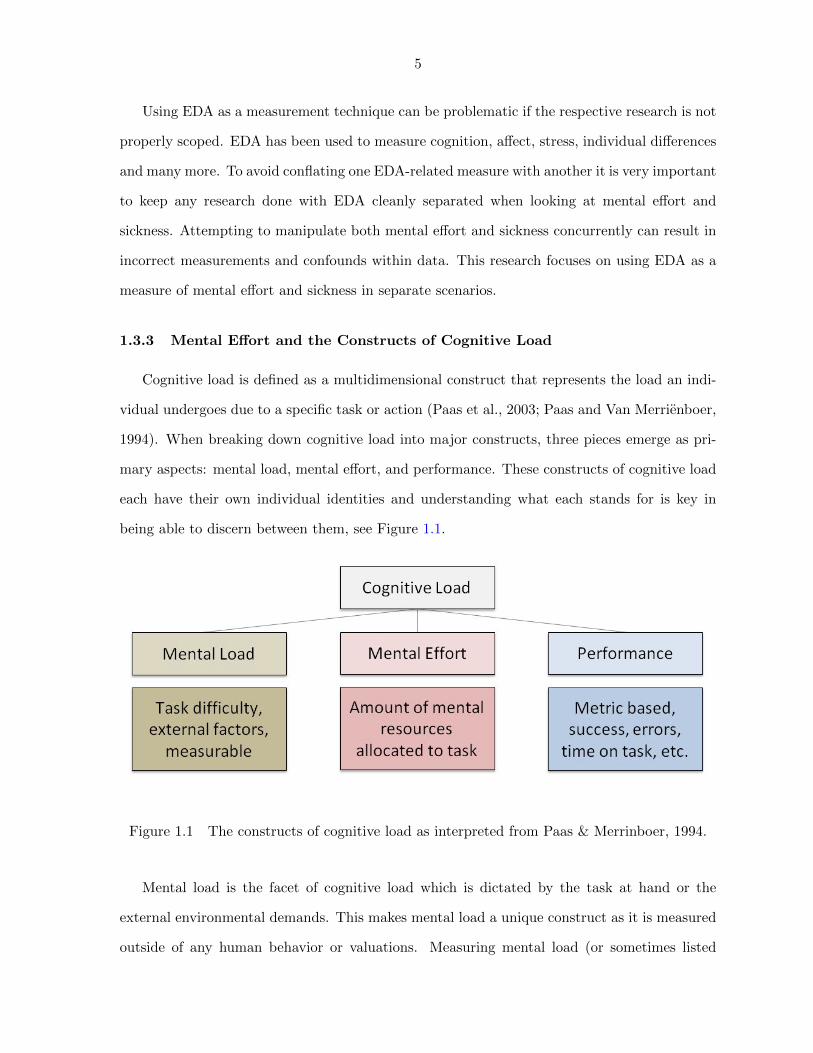
Figure 1.1 The constructs of cognitive load as interpreted from Paas & Merrinboer,
1994. . . . . . . . . . . . . . . . . . . . . . . . . . . . . . . . . . . . . . 5
Figure 3.1 An over-the-shoulder view of the combine simulator. . . . . . . . . . . 23
Figure 3.2 Top-down view of the virtual field, 12 acres in size. . . . . . . . . . . . 25
Figure 3.3 Logitech gamepad used to control movement within the virtual environ-
ment. . . . . . . . . . . . . . . . . . . . . . . . . . . . . . . . . . . . . . 28
Figure 3.4 Razer Hydra controller used to control object movement within the vir-
tual environment. . . . . . . . . . . . . . . . . . . . . . . . . . . . . . . 28
Figure 3.5 View from within the optokinetic (spinning) drum in the maze scenario. 30
Figure 3.6 A top down view of the entire virtual maze. . . . . . . . . . . . . . . . 31
Figure 3.7 Potential conditions participants could experience. The first half of the
study occurred within the virtual maze while the second half included
the mitigation scenario. . . . . . . . . . . . . . . . . . . . . . . . . . . . 32
Figure 3.8 On left, the physical peg-in-hole board and on right, the virtual peg-in-
hole board into which participants sequentially placed narrow dowels. . 34
Figure 4.1 CT1 requires more interaction than CT2, box plot whiskers represent
standard deviation, n = 28. . . . . . . . . . . . . . . . . . . . . . . . . 41
Figure 4.2 Decrease in EDA using CT2 from Event 2 to Event 4, p <.0005. Box
plot whiskers represent standard error, n = 10 for Event 1 and n = 22
for Events 2-4. . . . . . . . . . . . . . . . . . . . . . . . . . . . . . . . . 42
Figure 4.3 Small negative correlation between SEQ and EDA for all participants,
n = 22. . . . . . . . . . . . . . . . . . . . . . . . . . . . . . . . . . . . . 43
viii
Figure 4.4 Moderate negative correlation between SEQ and EDA for all partici-
pants, n = 22. . . . . . . . . . . . . . . . . . . . . . . . . . . . . . . . . 44
Figure 4.5 All participants split into low (blue), medium (red), and high (green)
knowledge groups, n = 28. . . . . . . . . . . . . . . . . . . . . . . . . . 45
Figure 4.6 Greater variation in EDA within low knowledge group, n = 7 for both
groups. . . . . . . . . . . . . . . . . . . . . . . . . . . . . . . . . . . . . 46
Figure 4.7 Participant timeline for Visually Induced Motion Sickness study. . . . 47
Figure 5.1 Raw SSQ and EDA values averaged for all participants, n = 57. . . . . 56
Figure 5.2 Average effort ratings paired with EDA in the same time frames, n =
57. . . . . . . . . . . . . . . . . . . . . . . . . . . . . . . . . . . . . . . 57
Figure 5.3 Lower mean EDA values for gamers in all scenarios, n = 37. . . . . . . 58
ix
ACKNOWLEDGEMENT
First and foremost, thank you to my advisor, Stephen Gilbert. For your hours of coun-
sel, words of encouragement, and trust in me. I am indebted to you. A special thanks to
my committee members, Michael Dorneich and Rick Stone for their encouragement and pos-
itive reinforcement as both mentors and teachers. Additionally, thank you to my teammates
Michael Curtis and Xin Wang for building an ambitious and enjoyable study within our VIMS
research. Thank you to the REU cybersickness team from 2013 (Kayla Dawson, Kelli Jackson,
Liat Litwin); your initial study design shaped the final VIMS project. Lastly, to John Deere
for its continued support of innovative research methods and enthusiasm toward improving
agricultural technology and practices.

x
ABSTRACT
Conducting research within virtual environments poses unique challenges when trying to
measure mental effort and visually induced motion sickness. Determining how much mental
effort an individual is exerting at any given point has historically been reserved for a human
factors expert review and self-report such as NASA-TLX. When using an objective measure of
mental effort via electrodermal activity (EDA), the subjective piece of this measure no longer
carries the entire burden of proof. This research explores whether electrodermal activity (EDA)
can be used as a successful indicator of mental effort for a single user in a controlled environ-
ment while performing scenario-based tasks. Additionally, EDA will be explored as a potential
predictive measure of visually induced motion sickness within virtual environments. Two stud-
ies were conducted to contribute to this research. The first study observed 28 participants in a
combine vehicle simulator and showed there is a decrease in EDA levels over time as familiarity
with the system increases. The second study included 57 participants who navigated a visually
disruptive virtual maze using a 3D head-mounted display. This study demonstrated a positive
correlation between EDA and reported sickness in the first half of the study and a positive cor-
relation between EDA and mental effort in the second half of the study. This research supports
that EDA can be used as a measure of mental effort and visually induced motion sickness for
a single user performing scenario-based tasks.
1
CHAPTER 1. OVERVIEW
Measuring mental effort and nausea within the constraints of virtual environments is pri-
marily done by either calculating performance metrics or asking self-report questions after the
event has taken place. Existing biofeedback measures are successfully used in other domains as
measures of arousal, stress, and cognitive load. The question becomes whether these biofeed-
back measures can be successfully used as measures within virtual environments.
This research aims to address two primary questions:
1) How does mental effort affect electrodermal activity (EDA) for a single user within a con-
trolled environment, performing scenario-based tasks?
2) How does visually induced motion sickness (VIMS) affect electrodermal activity for a sin-
gle user within a controlled environment, performing a scenario-based task? Additionally, can
EDA be used to predict oncoming sickness events?
This research was entirely conducted within virtual environments, including stereoscopic
3D environments and vehicle simulators at the Virtual Reality Application Center (VRAC) of
Iowa State University.
1.1 Introduction
The goal of almost every system, regardless of whether it is based on a desktop, simulator,
virtual reality or any other platform, is to enhance performance, increase safety, and improve
user satisfaction (Wickens et al., 2003). Whether you are driving your car, making a call on
your phone, or even looking for a movie via an Internet streaming service, the call for your
attention is quite frequent. When working within the world of user research or user experience
research though, you are able to strip many of these factors out and begin to look at how
2
an individual interacts with a single system on their terms. As user experience is how people
interact with, think of, and utilize a system or service (Law et al., 2008), this type of research
is extremely relevant when focusing on the individual. These testing scenarios give powerful
insight as to how much (or how little) an individual really can process at any given time.
Whether a user is dealing with multiple simple systems or a single complex system, allocating
limited mental resources will vary based on both the quality of the system and the motivation
of the individual (Paas and Van Merrienboer, 1994).
Humans have limited processing power and must select where to place their attention and
effort (Kahneman, 1973). In light of this fact, this research suggests taking a new look at
how mental effort is currently measured within user centered scenarios. When measuring user
performance within the context of a user experience scenario, there are variety of metrics
available to researchers. Within usability testing, the most widely used metrics which are
quantifiable are items such as efficiency, effectiveness, and satisfaction (Tullis and Albert, 2010).
On the same note, measuring performance within a virtual environment is essential to make
meaningful comparisons and claims that translate to a broader population. Many applications
tested within virtual scenarios utilize the same metrics, e.g., success rate, errors, and time on
task as standard user experience research and additionally include variations for more specific
insight. When the user experience performance metrics are paired with the current standing
metrics of cognitive load (e.g. self-report) the issue of subjective self-report forces consideration
of what happens when the user perception of cognitive load differs from what they are actually
experiencing physiologically. Considering EDA is an objective measure in which one can collect
data continuously and unobtrusively during the traditional scenario-based tasks, this makes the
option of pairing EDA with existing cognitive load and performance data very attractive. This
objective physiological data of EDA can be combined with the traditional self-report metrics
such as the NASA-TLX for mental effort (Hart and Staveland, 1988) and Simulator Sickness
Questionnaire for overall health in virtual environments (Kennedy et al., 1993). EDA offers
an option of investigating real time mental effort levels or sickness while still being able to
have them complete performance tasks within a controlled environment, but further research is
required to validate its use within immersive 3D environments and within novel domains such

3
as high cognitive load simulations. If EDA can be used as a measure of both cognitive load
and sickness then these hypotheses will be true.
1.2 Hypotheses
An increase in self-reported levels of mental effort will result in an increase of observed
electrodermal activity for a single user, within a controlled environment performing a scenario-
based task.
An increase in self-reported levels of visually induced motion sickness (VIMS) will result in
an increase of observed electrodermal activity for a single user, within a controlled environment
performing a scenario-based task.
1.3 Definition of Key Terms
1.3.1 Biofeedback
Using biofeedback as a method of measuring performance has had multiple incarnations with
procedures including the monitoring of skin conductance, heart rate, pupillometry, blink rate,
facial affect, eye-tracking and others (Schwartz and Andrasik, 2012). Biofeedback has been used
to suggest a variety of different cognitive measures in the past and each have their place within
different research domains. Specific to this research, biofeedback is used to measure mental
effort within scenario-based tasks. Electrodermal activity (EDA) is one of these measures of
biofeedback (Boucsein, 2012).
1.3.2 Electrodermal Activity (EDA)
The primary concern of this research investigates the metric of electrodermal activity
(EDA), which is measured as skin conductance, typically in microsiemens (µS). EDA is a
form of physiological feedback which delivers continuous, involuntary data on the level of con-
ductance that is present across two points of contact on the skin. This skin conductance level
translates into an individual’s arousal level in real time as the skin is solely innervated by the
sympathetic nervous system, the “fight or flight” system. This is advantageous when compared

4
to heart rate variability as the heart is innervated by both the sympathetic and parasympa-
thetic nervous system, which is the “rest and digest” system (Marieb, 2003). By focusing on the
sympathetic response alone, a clearer picture as to what an individual’s true state of arousal
is can be seen. EDA can provide this window into the activity of the sympathetic nervous
system by manipulating how many sweat glands are “turning on” naturally and in response
to a stimuli. Skin conductance has an extremely strong, positive correlation with sweat gland
activity and as such EDA can be used as an indirect measure of sympathetic nervous system
activity (Schwartz and Andrasik, 2012).
The initial work of EDA being linked to psychological effects began in the late 19th century
(Neumann and Blanton, 1970). Fere (1888) is credited with officially making the claim that
external electrical response was related to nervous system activity. Modern EDA is measured
using exosomatic (external) sensors on the skin to run a small current from point to point and
then measure the conductance (not resistance) between the two points (Fowles et al., 1981;
Boucsein, 2012). It is this principle of linking an external measurement (EDA) to an internal
(psychological) state which makes it a measure of interest.
Throughout the years though, “galvanic skin reflex” or “galvanic skin response” (GSR)
has been the term of choice for much of the research involving electrical activity within the
integumentary (skin) system, but this can be misleading (Boucsein, 2012). There are three
main reasons why the term GSR should not be used to speak about EDA specifically. First,
skin is not a galvanic element, nor does it behave like one. Second, it forces EDA to be looked at
as a type of reflex, but that would not account for any spontaneous skin conductance responses
(SCR) or for any psychologically elicited EDA. Lastly, GSR has been used to describe a wide
variety of that involves electricity and skin.
In addition to EDA having a potential correlation with cognitive load, it also has been used
to measure sickness levels, specifically visually induced sickness levels. Warwick-Evans (1987)
showed this relationship between EDA and sickness within a flight simulator and Chung et al.
(2006) displayed the EDA and sickness relationship within a driving simulator. Other work has
been done which explores this connection and is highlighted in the background section, “EDA
and sickness.”
5
Using EDA as a measurement technique can be problematic if the respective research is not
properly scoped. EDA has been used to measure cognition, affect, stress, individual differences
and many more. To avoid conflating one EDA-related measure with another it is very important
to keep any research done with EDA cleanly separated when looking at mental effort and
sickness. Attempting to manipulate both mental effort and sickness concurrently can result in
incorrect measurements and confounds within data. This research focuses on using EDA as a
measure of mental effort and sickness in separate scenarios.
1.3.3 Mental Effort and the Constructs of Cognitive Load
Cognitive load is defined as a multidimensional construct that represents the load an indi-
vidual undergoes due to a specific task or action (Paas et al., 2003; Paas and Van Merrienboer,
1994). When breaking down cognitive load into major constructs, three pieces emerge as pri-
mary aspects: mental load, mental effort, and performance. These constructs of cognitive load
each have their own individual identities and understanding what each stands for is key in
being able to discern between them, see Figure 1.1.
Figure 1.1 The constructs of cognitive load as interpreted from Paas & Merrinboer, 1994.
Mental load is the facet of cognitive load which is dictated by the task at hand or the
external environmental demands. This makes mental load a unique construct as it is measured
outside of any human behavior or valuations. Measuring mental load (or sometimes listed
6
as mental workload) can be done by performing a task review or task analysis with existing
human factors measures. This analysis will yield objective data on how much mental load a
given task will produce independent of the person performing the task. Mental load also gives
a rudimentary way of beginning to predict full values of cognitive load as it can be determined
prior to task completion (Wickens et al., 2003). Mental load is important to this research
specifically as it is the construct of cognitive load, which can be manipulated by design. An
example of increasing mental load would be to give a more complex math problem, display a
more complicated interface, or require the memorization of more disparate pieces of information.
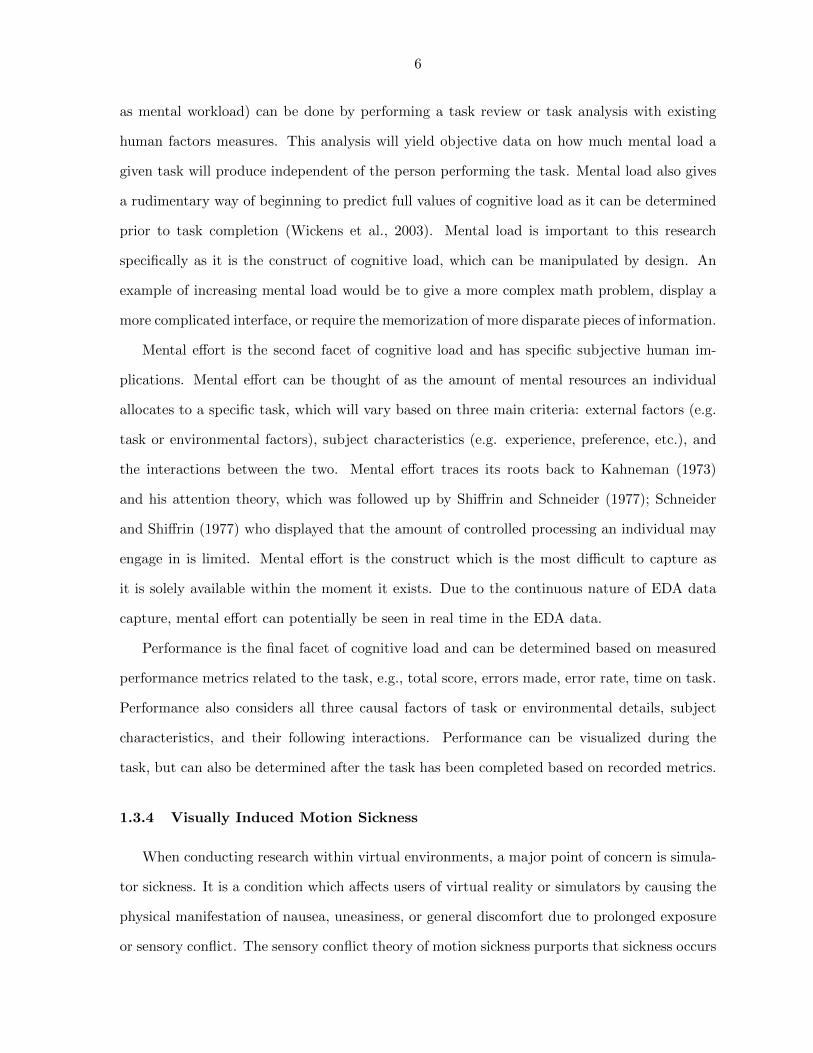
Mental effort is the second facet of cognitive load and has specific subjective human im-
plications. Mental effort can be thought of as the amount of mental resources an individual
allocates to a specific task, which will vary based on three main criteria: external factors (e.g.
task or environmental factors), subject characteristics (e.g. experience, preference, etc.), and
the interactions between the two. Mental effort traces its roots back to Kahneman (1973)
and his attention theory, which was followed up by Shiffrin and Schneider (1977); Schneider
and Shiffrin (1977) who displayed that the amount of controlled processing an individual may
engage in is limited. Mental effort is the construct which is the most difficult to capture as
it is solely available within the moment it exists. Due to the continuous nature of EDA data
capture, mental effort can potentially be seen in real time in the EDA data.
Performance is the final facet of cognitive load and can be determined based on measured
performance metrics related to the task, e.g., total score, errors made, error rate, time on task.
Performance also considers all three causal factors of task or environmental details, subject
characteristics, and their following interactions. Performance can be visualized during the
task, but can also be determined after the task has been completed based on recorded metrics.
1.3.4 Visually Induced Motion Sickness
When conducting research within virtual environments, a major point of concern is simula-
tor sickness. It is a condition which affects users of virtual reality or simulators by causing the
physical manifestation of nausea, uneasiness, or general discomfort due to prolonged exposure
or sensory conflict. The sensory conflict theory of motion sickness purports that sickness occurs

7
due to disagreements among the vestibular, ocular and proprioceptive senses (Warwick-Evans
et al., 1998). Simulator sickness, or more generally known as visually induced motion sickness
or VIMS, (Kennedy et al., 2010) can have unexpected and devastating results on any study
which uses any type of movement within a virtual environment. Not only can VIMS damage a
study, but it is a serious safety risk to the participant if they are to become physically ill which
could cause damage to equipment, researchers, and even participants. The problem of VIMS
is both well documented and well known within the virtual reality space of causing physical
discomfort in virtual reality and simulator settings (Brooks et al., 2010; Kolasinski, 1995). EDA
has been used to measure sickness levels outside of immersive virtual reality and this research
looks to connect EDA as a measure of VIMS within virtual environments.
1.4 Simulator vs. Virtual Reality
This study utilizes both simulators and virtual reality, each with their own properties.
Virtual reality is comprised of four main elements which in total help set it apart from simulators
and other virtual mediums (Sherman and Craig, 2003). First, it requires a virtual world which
means that the location of activity is not a physical space but rather an imaginary space
displayed through a medium which has objects governed by rules. Secondly, there must be
enough immersion, or level of sensory fidelity, to give a sense of presence, the user’s subjective
psychological response, within the virtual world (Bowman and McMahan, 2007). Third, sensory
feedback is present which can be presented visually, audibly, or even via haptics. Lastly,
there needs to be an element of interactivity which realizes changes in the virtual world have
consequences, instead of the user being on the outside looking in. When all four of these
elements are used in their entirety, you are looking at a scenario which utilizes virtual reality.
A simulator may utilize pieces of what makes a system a virtual reality system, but it is not
required to. The simulator only requires a control schema mimicking that of a real system
which follows rules and can be manipulated by realistic controls. A simulator can take place
in virtual reality, but it does not have to.
8
1.5 Why Scenario-based Testing
As computer models and simulations were initially created to evaluate and improve skills
within their domain, (e.g. flight simulator used for improving pilots skills in flight) they now
display additional value by placing users within a contextualized or scenario-based setting to
perform additional tasks. The advantage of using scenario-based testing in the flight simulator
example, now allows more than simply focusing on the skills required to fly. When testing
within a context-rich scenario you can begin to explore the surrounding actions that take
place, such as mapping and measuring all stimuli and activity a pilot attends to for the entire
process of flying.
Although originally framed by Carroll (1999) in the context of design and usability testing,
scenario-based testing allows for other areas to take advantage of many of the same elements.
This context rich approach allows for the evaluation of an entire process as opposed to simply
looking at a single dimension. This concept is also prevalent within the education world as the
concept of part-task, whole-task. When individuals learn and practice a skill as a standalone
activity, it is considered a part-task approach. Those who perform the whole-task approach are
able to transfer their skill sets more efficiently and perform better on skill tests themselves (Lim
et al., 2008). Both Carroll’s scenario-based testing and the part-task whole-task idea promote
a scenario where a wider experience can be conveyed and incorporated into learning.
In the case of the flight simulator, a test may reveal that a particular control of a plane is
functionally sound, but when used within the entire process of flight, it may be discovered that
the same control now is much harder to operate when used in conjunction with an unrelated
additional control. From Carroll’s argument for scenario-based testing, the highest value within
the context of this research lies with the scenario’s ability to evoke reflection as what happens
in the moment is a close analog to looking at how someone would react within a real world
scenario.
9
1.6 Thesis Structure
Chapter 1 of this work states the concepts to be explored, outlines the research questions
that will be answered, and provides relevant background information on EDA, cognitive load,
VIMS and scenario-based testing. Chapter 2 synthesizes previous work done within the area
of EDA, cognitive load, and VIMS while additionally addressing specific gaps in that literature
which this research will address. Chapter 3 highlights the processes and methods followed to
conduct two separate studies within virtual environments which seek to address the research
questions, highlight what assumptions and limitations are present, and predict outcomes based
on previous work.
The fourth chapter presents all the relevant data and results collected from the two research
studies. The final chapter interprets the data collected, answers the research questions posed
earlier, and addresses any shortcomings this approach had. Additionally the final chapter
summarizes this research overall and also highlights future work to be done to better clarify
answers and begin to explore new research questions.
10
CHAPTER 2. BACKGROUND
2.1 Introduction
To understand whether EDA is a reliable measure of mental effort or visually induced motion
sickness (VIMS), it is important to understand each of these concepts and what previous work
has been done with them. This chapter summarizes work done within these areas and highlights
existing gaps of interest.
2.2 Mental Effort
As described in Chapter 1, cognitive load is a complex concept with multiple constructs
that contribute to an overall effect. Mental effort is the key construct of cognitive load to be
considered for the subject of this research (see Figure 1.1 for cognitive load construct visual).
To correctly frame how mental effort fits into the greater model of cognitive load, all three
constructs are reviewed. Beginning with mental workload, the construct of cognitive load that
dictates how hard a specific task is should briefly be reviewed. Where mental workload is
the potential work to be done, mental effort is the amount of resources an individual actively
commits to that work. This raises the concept of limited processing capacity and resource dele-
gation to the forefront (Waard, 1996). Multiple researchers have touched on limited processing,
(e.g. (Broadbent, 1958; Kahneman, 1973; Posner, 1980; Wickens et al., 2003)) and use limited
processing to explain how humans are not able to devote the entirety of their mental resources
to every issue that presents itself. Some specifically denote the distinction between capacity
and resource such as Wickens et al. (2003), who puts capacity as the maximum threshold of
human processing while resources are the amount of mental effort an individual chooses to use.
Norman and Bobrow (1975) also talks about the amount of processing effort someone uses in
11
terms of resources. Norman & Bobrow also describe the relationship between resources and
performance as a linear one until the processing capacity is met and then performance plateaus.
These examples of resource-limited tasks are in opposition to data-limited tasks where maxi-
mum resources can be applied but do to the low quality or lack of data, task performance will
suffer. This research will impose tasks which are resource-limited.
2.2.1 Cognitive Load Measurement
The measurement of cognitive load is the core topic within this research. Therefore it is fit-
ting to understand what existing measures are available and why a lesser known measure, EDA,
should be validated on its own merit and within the novel setting of 3D virtual environments.
There are a variety of measures to assess cognitive load, but no single measure has been
used universally to determine it. Popular methods of measuring cognitive load include: self-
report on Likert scales, secondary task technique evaluation, heart rate variability, pupillary
response, and EDA (Paas et al., 2003). Of these multiple methods for measuring cognitive load,
self-report scales such as the NASA-TLX are the most common, but there are often varying
forms of human factors task review or task analysis used to evaluate the performance aspect
of a task after it is complete. This opportunity allows both mental load and performance can
be evaluated in a more objective manner, but mental effort is limited to subjective evaluation.
Due to the restricted measurement techniques available there is an opportunity to use specific
biofeedback measures, such as EDA, to determine mental effort. Mental effort can be described
as the instantaneous view of how many mental resources an individual is assigning to a specific
task. Other forms of biofeedback such as heart rate variability and pupillometry have been
used previously measuring cognitive load with varying levels of success, but this research will
investigate only EDA with respect to its role in measuring mental effort. EDA, while it has
been used outside of virtual environments to evaluate cognitive load, it has not been validated
within a single user task-based scenario in immersive virtual environments. Due to its phys-
ical affordances of minimal invasion with continuous data gathering, it stands out as strong
candidate to measure cognitive load, and more specifically mental effort.
12
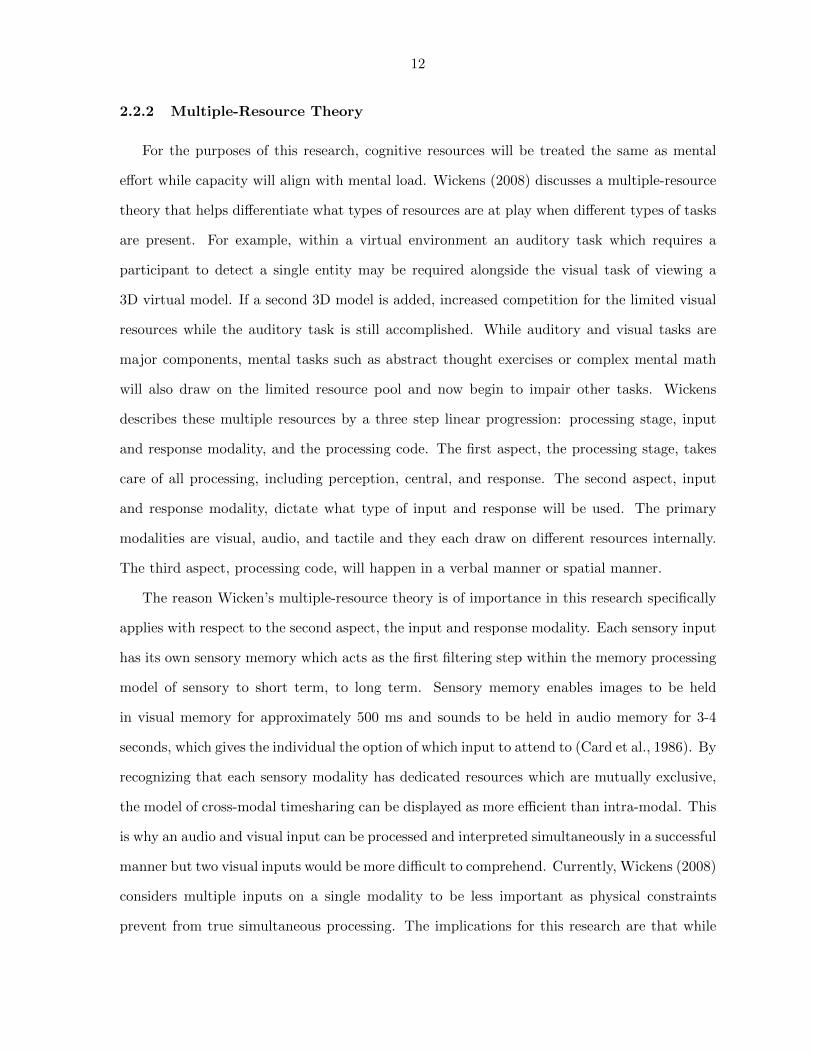
2.2.2 Multiple-Resource Theory
For the purposes of this research, cognitive resources will be treated the same as mental
effort while capacity will align with mental load. Wickens (2008) discusses a multiple-resource
theory that helps differentiate what types of resources are at play when different types of tasks
are present. For example, within a virtual environment an auditory task which requires a
participant to detect a single entity may be required alongside the visual task of viewing a
3D virtual model. If a second 3D model is added, increased competition for the limited visual
resources while the auditory task is still accomplished. While auditory and visual tasks are
major components, mental tasks such as abstract thought exercises or complex mental math
will also draw on the limited resource pool and now begin to impair other tasks. Wickens
describes these multiple resources by a three step linear progression: processing stage, input
and response modality, and the processing code. The first aspect, the processing stage, takes
care of all processing, including perception, central, and response. The second aspect, input
and response modality, dictate what type of input and response will be used. The primary
modalities are visual, audio, and tactile and they each draw on different resources internally.
The third aspect, processing code, will happen in a verbal manner or spatial manner.
The reason Wicken’s multiple-resource theory is of importance in this research specifically
applies with respect to the second aspect, the input and response modality. Each sensory input
has its own sensory memory which acts as the first filtering step within the memory processing
model of sensory to short term, to long term. Sensory memory enables images to be held
in visual memory for approximately 500 ms and sounds to be held in audio memory for 3-4
seconds, which gives the individual the option of which input to attend to (Card et al., 1986). By
recognizing that each sensory modality has dedicated resources which are mutually exclusive,
the model of cross-modal timesharing can be displayed as more efficient than intra-modal. This
is why an audio and visual input can be processed and interpreted simultaneously in a successful
manner but two visual inputs would be more difficult to comprehend. Currently, Wickens (2008)
considers multiple inputs on a single modality to be less important as physical constraints
prevent from true simultaneous processing. The implications for this research are that while
13
participants complete visual tasks, the interruption of asking auditory based questions should
minimize impact as they are two distinct modalities.
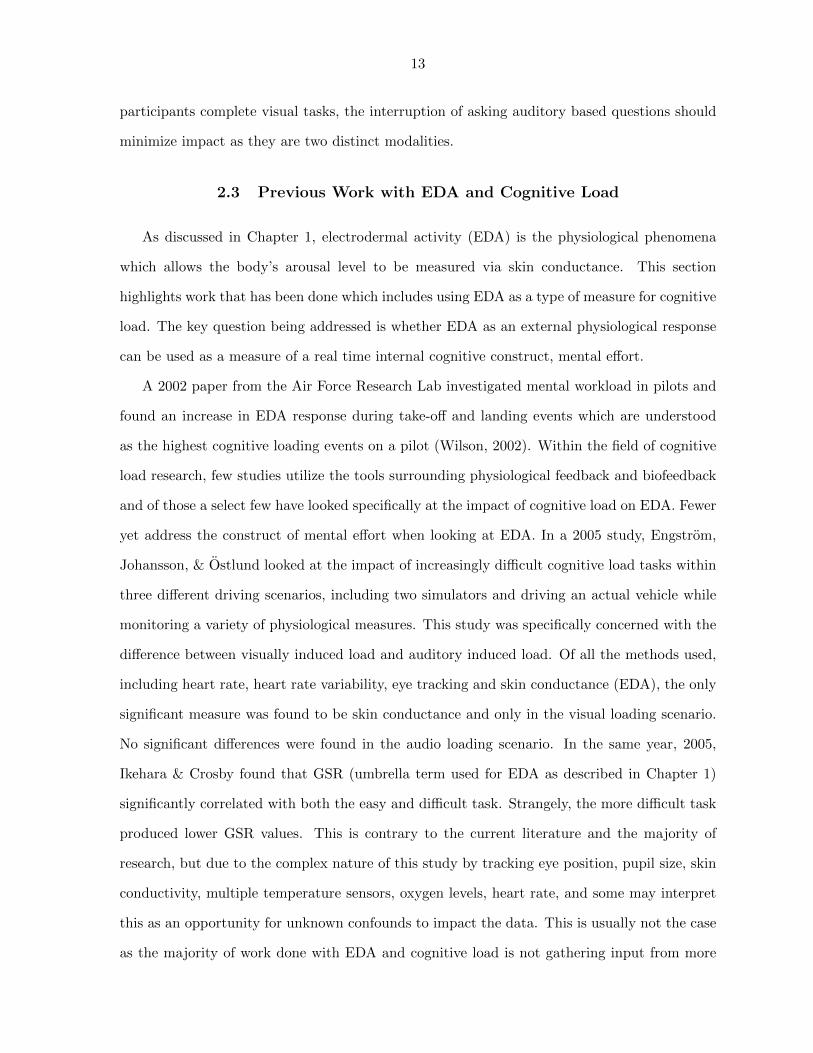
2.3 Previous Work with EDA and Cognitive Load
As discussed in Chapter 1, electrodermal activity (EDA) is the physiological phenomena
which allows the body’s arousal level to be measured via skin conductance. This section
highlights work that has been done which includes using EDA as a type of measure for cognitive
load. The key question being addressed is whether EDA as an external physiological response
can be used as a measure of a real time internal cognitive construct, mental effort.
A 2002 paper from the Air Force Research Lab investigated mental workload in pilots and
found an increase in EDA response during take-off and landing events which are understood
as the highest cognitive loading events on a pilot (Wilson, 2002). Within the field of cognitive
load research, few studies utilize the tools surrounding physiological feedback and biofeedback
and of those a select few have looked specifically at the impact of cognitive load on EDA. Fewer
yet address the construct of mental effort when looking at EDA. In a 2005 study, Engstrom,
Johansson, & Ostlund looked at the impact of increasingly difficult cognitive load tasks within
three different driving scenarios, including two simulators and driving an actual vehicle while
monitoring a variety of physiological measures. This study was specifically concerned with the
difference between visually induced load and auditory induced load. Of all the methods used,
including heart rate, heart rate variability, eye tracking and skin conductance (EDA), the only
significant measure was found to be skin conductance and only in the visual loading scenario.
No significant differences were found in the audio loading scenario. In the same year, 2005,
Ikehara & Crosby found that GSR (umbrella term used for EDA as described in Chapter 1)
significantly correlated with both the easy and difficult task. Strangely, the more difficult task
produced lower GSR values. This is contrary to the current literature and the majority of
research, but due to the complex nature of this study by tracking eye position, pupil size, skin
conductivity, multiple temperature sensors, oxygen levels, heart rate, and some may interpret
this as an opportunity for unknown confounds to impact the data. This is usually not the case
as the majority of work done with EDA and cognitive load is not gathering input from more
14
than a single sensor.
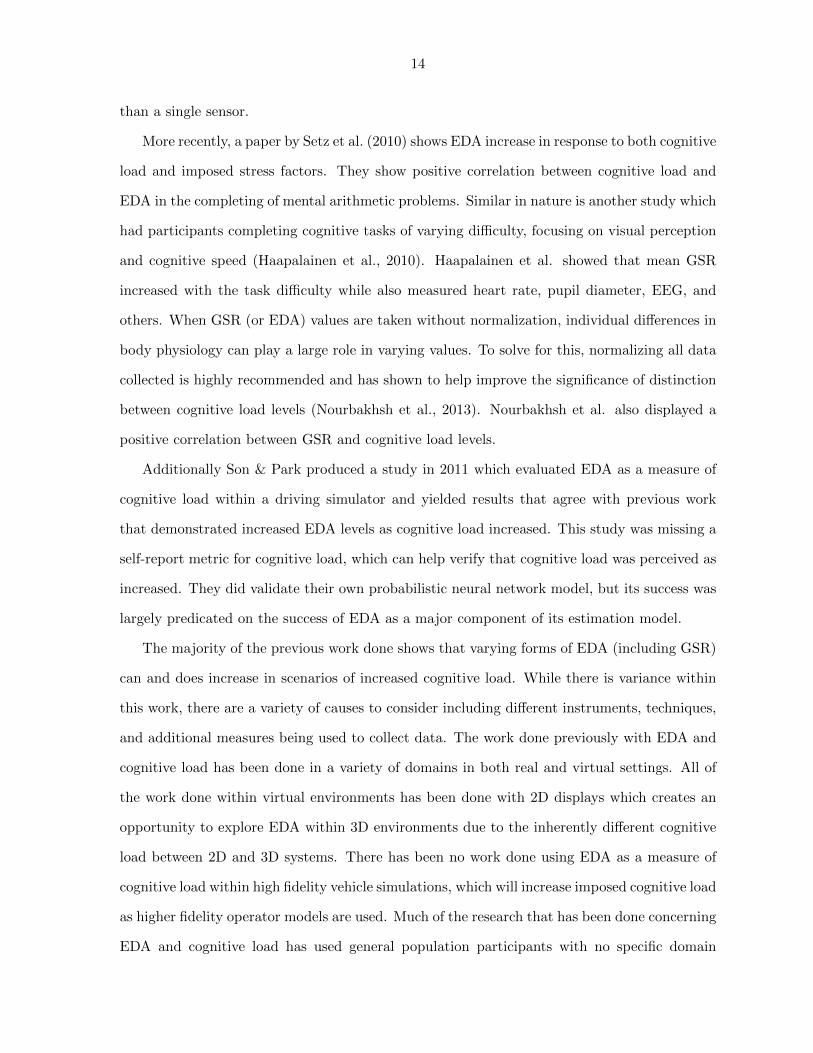
More recently, a paper by Setz et al. (2010) shows EDA increase in response to both cognitive
load and imposed stress factors. They show positive correlation between cognitive load and
EDA in the completing of mental arithmetic problems. Similar in nature is another study which
had participants completing cognitive tasks of varying difficulty, focusing on visual perception
and cognitive speed (Haapalainen et al., 2010). Haapalainen et al. showed that mean GSR
increased with the task difficulty while also measured heart rate, pupil diameter, EEG, and
others. When GSR (or EDA) values are taken without normalization, individual differences in
body physiology can play a large role in varying values. To solve for this, normalizing all data
collected is highly recommended and has shown to help improve the significance of distinction
between cognitive load levels (Nourbakhsh et al., 2013). Nourbakhsh et al. also displayed a
positive correlation between GSR and cognitive load levels.
Additionally Son & Park produced a study in 2011 which evaluated EDA as a measure of
cognitive load within a driving simulator and yielded results that agree with previous work
that demonstrated increased EDA levels as cognitive load increased. This study was missing a
self-report metric for cognitive load, which can help verify that cognitive load was perceived as
increased. They did validate their own probabilistic neural network model, but its success was
largely predicated on the success of EDA as a major component of its estimation model.
The majority of the previous work done shows that varying forms of EDA (including GSR)
can and does increase in scenarios of increased cognitive load. While there is variance within
this work, there are a variety of causes to consider including different instruments, techniques,
and additional measures being used to collect data. The work done previously with EDA and
cognitive load has been done in a variety of domains in both real and virtual settings. All of
the work done within virtual environments has been done with 2D displays which creates an
opportunity to explore EDA within 3D environments due to the inherently different cognitive
load between 2D and 3D systems. There has been no work done using EDA as a measure of
cognitive load within high fidelity vehicle simulations, which will increase imposed cognitive load
as higher fidelity operator models are used. Much of the research that has been done concerning
EDA and cognitive load has used general population participants with no specific domain
15
knowledge requirements. This research explores using EDA with experienced combine operators
within a high fidelity combine simulator in addition to general population participants.
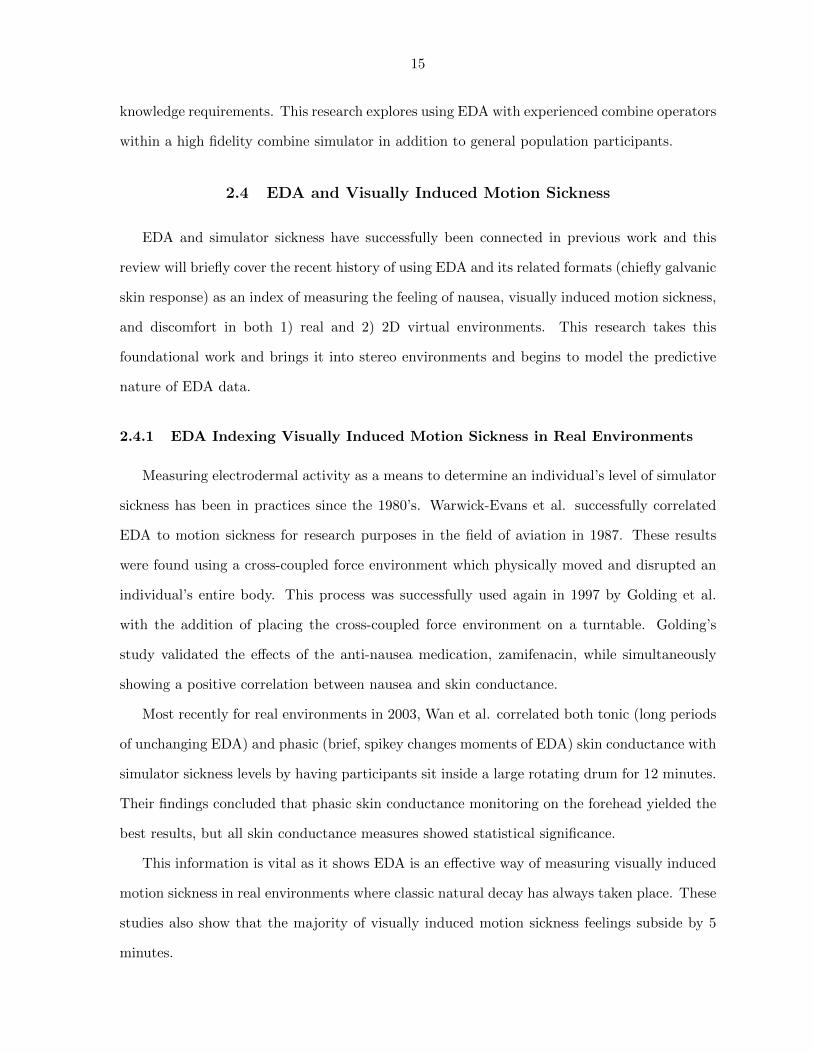
2.4 EDA and Visually Induced Motion Sickness
EDA and simulator sickness have successfully been connected in previous work and this
review will briefly cover the recent history of using EDA and its related formats (chiefly galvanic
skin response) as an index of measuring the feeling of nausea, visually induced motion sickness,
and discomfort in both 1) real and 2) 2D virtual environments. This research takes this
foundational work and brings it into stereo environments and begins to model the predictive
nature of EDA data.
2.4.1 EDA Indexing Visually Induced Motion Sickness in Real Environments
Measuring electrodermal activity as a means to determine an individual’s level of simulator
sickness has been in practices since the 1980’s. Warwick-Evans et al. successfully correlated
EDA to motion sickness for research purposes in the field of aviation in 1987. These results
were found using a cross-coupled force environment which physically moved and disrupted an
individual’s entire body. This process was successfully used again in 1997 by Golding et al.
with the addition of placing the cross-coupled force environment on a turntable. Golding’s
study validated the effects of the anti-nausea medication, zamifenacin, while simultaneously
showing a positive correlation between nausea and skin conductance.
Most recently for real environments in 2003, Wan et al. correlated both tonic (long periods
of unchanging EDA) and phasic (brief, spikey changes moments of EDA) skin conductance with
simulator sickness levels by having participants sit inside a large rotating drum for 12 minutes.
Their findings concluded that phasic skin conductance monitoring on the forehead yielded the
best results, but all skin conductance measures showed statistical significance.
This information is vital as it shows EDA is an effective way of measuring visually induced
motion sickness in real environments where classic natural decay has always taken place. These
studies also show that the majority of visually induced motion sickness feelings subside by 5
minutes.
16
2.4.2 EDA Indexing Visually Induced Motion Sickness in Virtual Environments
As the purpose of this work is to look at visually induced motion sickness which is provoked
within a virtual environment, it is important to identify that using EDA as an index of visually
induced motion sickness carries over to the virtual realm. Nam et al. attempted to create
an artificial neural network (ANN), in 2001 to determine an individual’s level of simulator
sickness in real time. While they were unable to make the real time argument, their recorded
data supported the work that EDA provides a measure of visually induced motion sickness
within virtual environments. Meehan et al. (2003) successfully displayed that latency in virtual
environments impacts an individual’s level of presence and feelings of visually induced motion
sickness. EDA was again validated as a tool to identify visually induced motion sickness levels.
Chung et al. also validated EDA as a measure of visually induced motion sickness within
a driving simulator in 2007. This work also displayed that verbally delivering and receiving
answers for an SSQ (simulator sickness questionnaire) does not distract individuals who are
engaged within a virtual environment.
EDA has been shown to be a successful indicator of visually induced motion sickness in
both real and some virtual environments, but not all virtual environments. This research aims
to validate EDA as a measure of visually induced motion sickness in domains that have not
been fully investigated. High fidelity virtual environments (such as the combine simulator)
and immersive virtual environments (such as the virtual navigation task used in the visually
induced motion sickness study) each pose their own unique challenges and offer an opportunity
to investigate how visually induced motion sickness levels change when virtual environments
are presented in novel ways. By capturing EDA in the visually induced motion sickness study,
the novel visual presentation of an immersive 3D head-mounted display provides insight into
how a higher fidelity visual medium impacts sickness levels and the body’s response.
2.5 Cognitive Load within Controlled Movement Tasks
Many research domains use controlled movement tasks as a basis for study. Controlled
movement tasks have participants literally controlling the movement of themselves or vehicles
17
which they control within an environment that conforms to a set of expectations (e.g. gravity,
friction, etc). Examples include research within the domains of vehicle controls, navigation
tasks, first-person video games, and more. For this reason, the two studies included in this
research are both examples of controlled movement tasks, one a combine vehicle simulator and
the other a first-person navigation environment.
There has been a resurgence of research investigating attention and cognitive load within
the context of driving in recent years as mobile devices and in-car technology (such as nav-
igation systems, advanced audio systems, and touch screen control schemas), have increased
dramatically. This work has largely been done under the goal of improving driving safety, which
is both important and necessary as the demand for mental resources while driving continues
to grow.
In 1984, there was concern that driver behavior research was coming to a close as there
had been little to no progress in the field at that time in over 10 years (Michon, 1986). This
period of stagnation was about to end as in-car technology began to rise and continues to
play an increasingly important role today. In 1991 Brookhuis, Vries, and Waard argued that
there was no significant decrease in performance during verbal-only phone use, but all other
interactions displayed decreases in performance, such as dialing at the time (Brookhuis et al.,
1991). In contrast, John Lee, a leading name in driver distraction research, began publishing
on this topic in 1999 and continues to look into emerging technologies and their repercussions
on driver performance. Lee argued that speech based systems could be safe only if drivers
could recognize the interference while driving and if they could modulate their attention to
minimize the consequence of using a voice based interface (Lee et al., 2001). A 2005 study
highlighted how drivers are highly aware of their inadequacies related to detecting change in
normal driving scenarios, but when cognitive load is increased that relationship loses strength
and drivers can retain a false sense of security (Lee et al., 2005). More recently, Lee, Lee, &
Boyle have shown that increased cognitive load has delayed driver’s responses and reduced the
amount of time drivers spent fixating in pedestrian areas within their field of view (Lee et al.,
2009). This research shows that changes in cognitive load have a significant impact on a variety
of performance metrics within the scope of driving and other controlled movement tasks.
18
Measuring cognitive load within controlled movement tasks is relevant to this research since
cognitive load was evaluated during a controlled movement task within the visually induced
motion sickness study. Exploring new metrics to evaluate cognitive load within controlled
movement tasks is an important next step, as additional research within this space considering
the increased demand for mental resources among today’s drivers.
2.6 EDA within Controlled Movement Tasks
Using physiological measures within controlled movement has been done in lesser and
greater capacities for years. In the 1960s researchers had drivers physically wired up to a
variety of physiological sensors while navigating real traffic on public roads to determine stress
levels through normal driving routines. Michaels (1962) reported an increase in EDA amplitude
when traffic density increased and although Taylor (1964) didn’t produce a significant corre-
lation between GSR and risk (evaluated post exercise for each drive) there was a qualitative
relationship between driving events and GSR, as researchers noted that increased GSR levels
matched with notable driving events such as high traffic population and near accident events.
Later Brown & Huffman showed an increase in EDA with increased levels of traffic (number of
cars) and traffic lanes (Brown and Huffman, 1972).
Helander would show a significant correlation between brake pressure and EDA from drivers
who also were wired to physiological sensors within a real vehicle driving on a 15 miles stretch
of real road. EDA was also associated successfully with higher stress situations which were
evaluated by the researcher during and post exercise (Helander, 1978). A year later, Zeier
(1979) used electrodes on the inner foot of drivers in three conditions, driving a manual trans-
mission car, an automatic transmission car, and riding as a passenger. Zeier found GSR levels
(specifically SCRs or skin conductance responses) were the highest in driving a manual and
lowest when riding as a passenger without control.
While EDA has been used to evaluate a variety of situations in past driving scenarios, these
scenarios were exploratory and non-repeatable, and did not focus on measuring cognitive load.
This research aims to measure cognitive load with EDA within controlled movement tasks, such
as driving, a highly repeatable scenario. Ideally, EDA could be used as an indicator of rising
19
cognitive load levels (e.g., cognitive load levels rise in traffic, and the car knows to reduce the
volume of your radio to help focus attention on external stimuli).
2.7 Cognitive Load and Visually Induced Motion Sickness
Little to research has been done specifically looking at the relationship between cognitive
load and visually induced motion sickness. It has been shown that experts can be under higher
cognitive load than novices due to having to spend mental resources on schema search and
selection, while a novice does not have existing schemas and can focus all resources on the task
at hand (Sweller, 1988). Complementary to this is the work from Chase and Simon (1973)
which describes how experts outperform novices due to their ability to incorporate existing
schemas quickly into play. Both Sweller and Chase & Simon indicate experts will perform
at higher levels while also being under higher levels of load. This concept is relevant when
looking at cognitive load and simulator sickness specifically. In a review of simulator sickness
levels in flight simulators relative to expertise, Pausch and Crea (1992) reiterated that the more
experience individuals have, the more likely they are to report symptoms of visually induced
motion sickness. Pausch & Crea specifically define expertise in this case as aircraft pilots who
have over 1500 hours of flight experience as their domain is military flight simulators (also
relevant to the controlled movement tasks used within this research). Thus experts who are
under higher cognitive load also report higher levels of simulator sickness. This relationship
raises the question of whether an increase in cognitive load can lead to higher levels of simulator
sickness. The expectation is that when cognitive load levels increase, visually induced motion
sickness levels will also increase. This question is explored further within the constraints of this
research.
2.8 Motivation and Predictions
The motivation for this work lies within the facility in which it was conducted. The Virtual
Reality Applications Center (VRAC) is the research facility at Iowa State University which
housed all research conducted within this work. Due to the nature of virtual reality and the long
20
standing issue of simulator sickness, more methods of measurement for both simulator sickness
and cognitive load are both useful and required for some research within enclosed virtual
environments. This leads to two prime areas for potential improvement using biofeedback.
The first being mental effort, determining how hard the participant is trying. The second is
visually induced motion sickness, determining how sick the participant is feeling.
These areas need improvement for three primary reasons. Self-report scales, a current
measure, are subject to interpretation, bias, and will. This comes into play especially when
participants attempt to give you the data they think you want to see (Mayo and Dooley,
1968). Secondly, constrained user scenarios may limit the amount of participant interaction
possible, e.g., when in a flight simulator performing flight tasks, a researcher would not want
to interrupt to ask a question. Lastly, future technology is incorporating an increasing amount
of physiological data, and the foundation for literature on this topic should be as robust as
possible prior to individuals or companies relying on limited research.
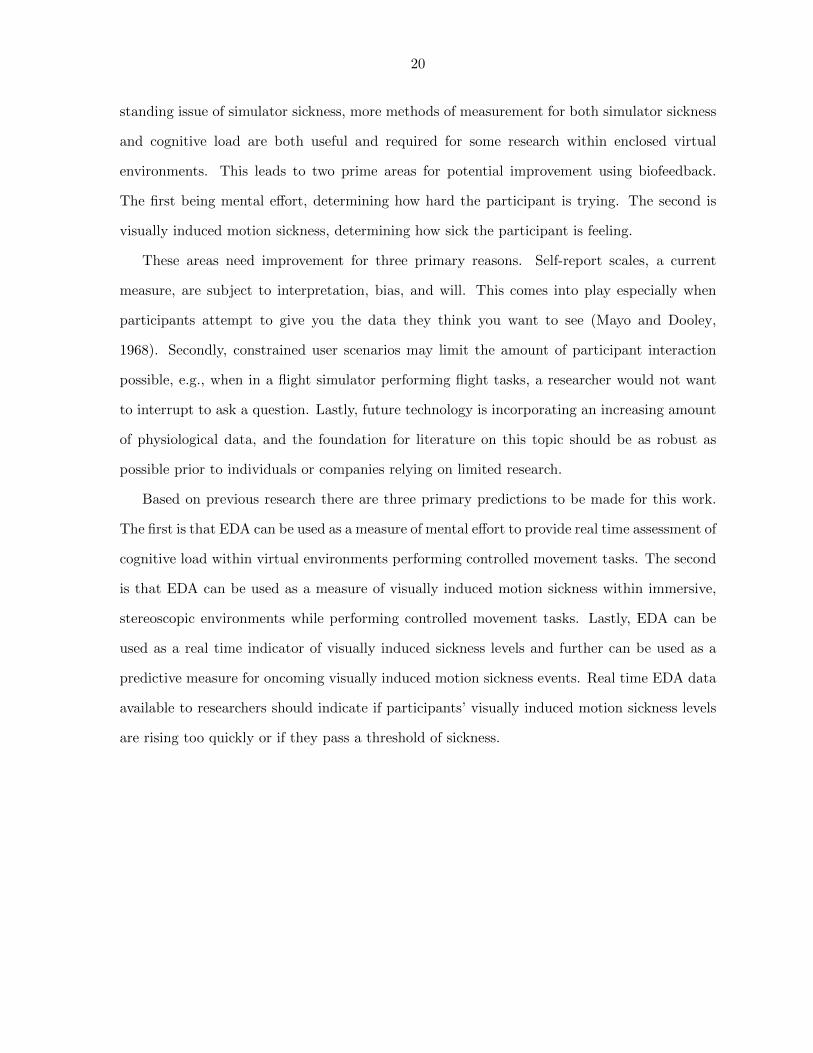
Based on previous research there are three primary predictions to be made for this work.
The first is that EDA can be used as a measure of mental effort to provide real time assessment of
cognitive load within virtual environments performing controlled movement tasks. The second
is that EDA can be used as a measure of visually induced motion sickness within immersive,
stereoscopic environments while performing controlled movement tasks. Lastly, EDA can be
used as a real time indicator of visually induced sickness levels and further can be used as a
predictive measure for oncoming visually induced motion sickness events. Real time EDA data
available to researchers should indicate if participants’ visually induced motion sickness levels
are rising too quickly or if they pass a threshold of sickness.

21
CHAPTER 3. METHODS AND PROCEDURES
3.1 Introduction
This chapter outlines the details of the participants recruited, experimental design process,
and final implementation for both studies of interest. Both studies utilize EDA with partic-
ipants within virtual environments. Study one, the combine simulator, is evaluating novel
agricultural technology and a novel user interface within a combine harvester simulator with
real farmers. The second study, visually induced motion sickness (VIMS), looks at how par-
ticipants react to a visually disruptive environment in stereoscopic 3D while self-rating their
mental workload and simulator sickness levels. EDA data were gathered from all participants
in both studies. While the overall goals of these studies was not related to EDA, EDA were
one dependent variable evaluated, and the EDA data from these studies can be used to answer
the primary research questions:
1) How does mental effort affect electrodermal activity (EDA) for a single user within a con-
trolled environment, performing scenario-based tasks?
2) How does visually induced motion sickness (VIMS) affect electrodermal activity for a sin-
gle user within a controlled environment, performing a scenario-based task? Additionally, can
EDA be used to predict oncoming sickness events?
The final section of this chapter highlights the specific methodology used to extract elements
from both of the aforementioned studies and arrive at the results and analysis.
22
3.2 Study One: Combine Simulator
3.2.1 Methods
3.2.1.1 Participants
28 farmers with at least 2 years’ experience in the past 4 years as full time combine operators
were recruited to participate in the first study evaluating novel technology within a combine
simulator. The participants from the combine simulator were compensated $150 for their time.
All participants were over 18 years old; the most represented age category being 41-50 years
old.
3.2.1.2 Hardware and Software
The combine simulator featured a modified John Deere 9770 STS interior, with displays
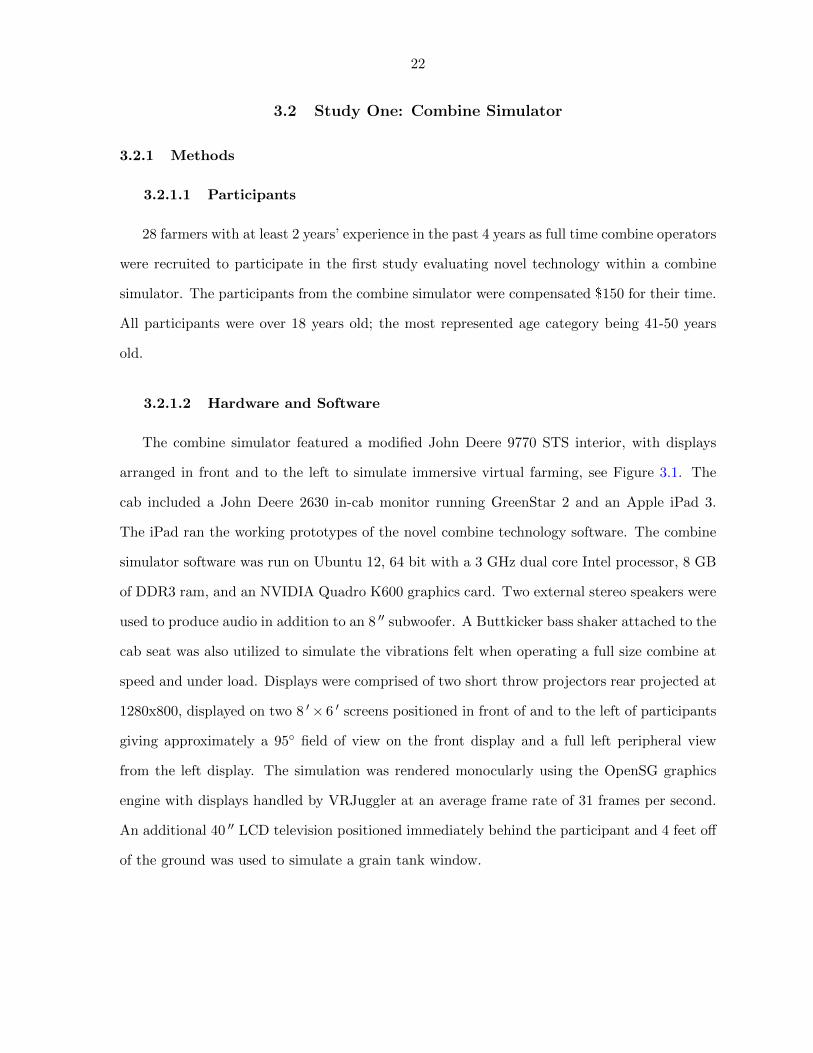
arranged in front and to the left to simulate immersive virtual farming, see Figure 3.1. The
cab included a John Deere 2630 in-cab monitor running GreenStar 2 and an Apple iPad 3.
The iPad ran the working prototypes of the novel combine technology software. The combine
simulator software was run on Ubuntu 12, 64 bit with a 3 GHz dual core Intel processor, 8 GB
of DDR3 ram, and an NVIDIA Quadro K600 graphics card. Two external stereo speakers were
used to produce audio in addition to an 8 ′′ subwoofer. A Buttkicker bass shaker attached to the
cab seat was also utilized to simulate the vibrations felt when operating a full size combine at
speed and under load. Displays were comprised of two short throw projectors rear projected at
1280x800, displayed on two 8 ′× 6 ′ screens positioned in front of and to the left of participants
giving approximately a 95◦ field of view on the front display and a full left peripheral view
from the left display. The simulation was rendered monocularly using the OpenSG graphics
engine with displays handled by VRJuggler at an average frame rate of 31 frames per second.
An additional 40 ′′ LCD television positioned immediately behind the participant and 4 feet off
of the ground was used to simulate a grain tank window.
23
Figure 3.1 An over-the-shoulder view of the combine simulator.
3.2.2 Procedures
3.2.2.1 Study Overview
The overall goal of this study was to measure the perceived usefulness of a novel harvest
technology, ascertain participant feedback, and measure user experience (UX) metrics to high-
light pain points and areas for improvement. All participants completed the same harvest
scenarios, regardless of crop, within the combine simulator which included two phases. Be-
fore the simulation section of the study, participants answered demographics questions, system
knowledge questions, and technical experience questions.

24
3.2.2.2 Independent Variables
The independent variables relevant to this research were the crop type to be harvested,
the crop density, crop moisture, and crop quality. The crop type was determined by the
participant’s experience as recruitment was selecting for real world experience for a specific
crop, corn or wheat. Crop density and crop moisture were both displayed via visual changes in
the graphics and by changes in the simulator controllers. Crop quality was perceived via the
information available on simulator controllers and via visual representations via the simulated
grain tank window.
3.2.2.3 Dependent Variables
The dependent variables of note were participant ratings for the usefulness of the novel
technology via the single ease question (SEQ) and continuous measures of EDA throughout
the entire exercise.
3.2.2.4 Experimental Design
Depending on the farmer’s experience, either the corn or wheat variation of the simulation
was set to run. Both crops were identical in size and field variation (e.g., going from dry to wet
crop). Participants harvested a 12-acre field (see Figure 3.2) from left to right. Participants
interacted with the the novel harvest technology that was being evaluated while completely
harvesting the 12-acre field. After completing the first field (task one), participants then
repeated the field (task two) under a different scenario. Total time in the simulator lasted 102
minutes on average and the entire experience lasted approximately 3 hours.
A researcher was seated next to the participants for the entirety of the simulator operation
to ask questions throughout the session and troubleshoot any problems encountered. The
participants were informed that the field would be made up of multiple varieties and to expect
a high number of changes. Participants were also informed to ignore unloading measures as the
virtual grain tank was set to never reach a full state. The first pass of the field had no harvest
events and allowed the participant to acclimate to the combine simulator. The participants
25
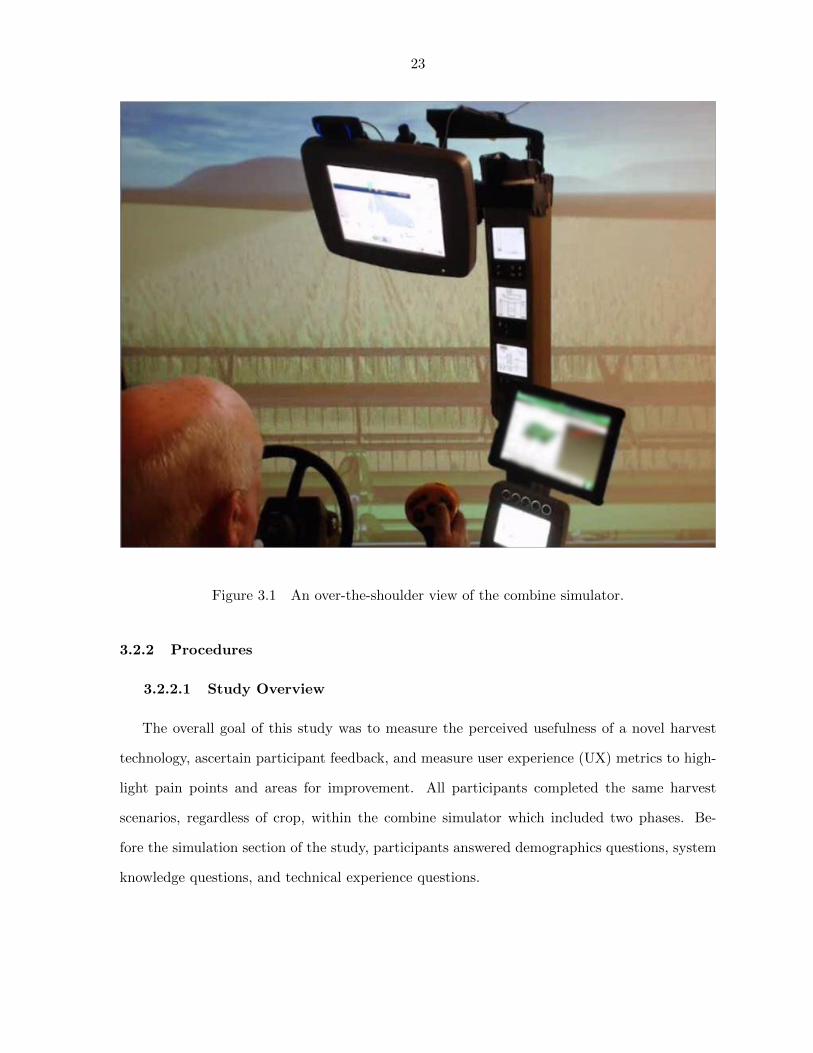
Figure 3.2 Top-down view of the virtual field, 12 acres in size.
were then allowed to begin harvesting as they would in their own combine. Four harvest events
took place with the use of Combine Technology 1 in the first field and four harvest events took
place using Combine Technology 2 in the second field. The participants were then instructed
to use the novel technology, but not taught how to use it. This was done with respect to
UX testing best practice measures as to assess the organic success and pain points within the
novel technology (Krug, 2009). During each harvest event a series of observations were made
to determine if a participant’s use of the new technology was successful and if not, note where
issues occurred. Additionally, after each harvest event was complete, participants were asked
a brief question to determine their subjective feelings toward the combine technology used.
3.2.3 Measures
3.2.3.1 EDA
EDA data from the combine simulator study was matched with specific times in the field
during which participants were experiencing individual harvest events. The EDA data were
then averaged over the entire duration of that individual event to give a single EDA mean per
event, of which there were 8 potential events a participant could experience. The mean EDA
value for each event was then used as a basis for comparison when evaluating differences in EDA
26
between different harvest events, combine technologies, or participant groups. As mentioned in
Chapter 1, EDA is a form of physiological feedback which delivers quick, involuntary data on
an individual’s skin conductance level which translates into arousal level in real time. This is all
due to the fact that the skin is solely innervated by the sympathetic nervous system (Marieb,
2003).
3.2.3.2 Single Ease Question (SEQ) Modified
When observing and moderating an exercise in real time, condensed versions of more com-
plex questions may be advantageous to both keep participants engaged and minimize distrac-
tion. This study utilized a modified version of Sauro’s Single Ease Question (SEQ), which is
typically administered electronically or with pen and paper by asking overall task difficulty
with a seven-point Likert scale spreading between “very difficult” to “very easy” (Sauro and
Dumas, 2009). For this study, the SEQ was asked verbally on a five-point likert scale with
the exact wording, “How did you feel about the last adjustment overall? One to five. One
being poor, five being ideal.” The spirit of the SEQ is to capture the participant’s feeling in
the moment immediately following the event stimulus.
3.2.3.3 Operator Knowledge Questionnaire
An eight question pre-survey was designed to test the combine operator’s technical knowl-
edge of more advanced combine harvest functions. Specific scenarios were described and a list
of all relevant combine controls were offered as options to adjust. The results from this survey
were then used to break the participants into low, medium, and high knowledge groups for
further analysis. This questionnaire can be seen in section A.2 of the appendix.

27
3.3 Study Two: Visually Induced Motion Sickness (VIMS) Mitigation
3.3.1 Methods
3.3.1.1 Participants
57 participants completed at least a single session for the second study looking at visually
induced motion sickness. Participants were recruited from general flyer advertisements and
from an undergraduate course, applied ergonomics and work design, as an extra credit incentive.
Participants were cautioned against participation if they had a known heart condition, used a
pacemaker, or had a seizure disorder. Participants from the VIMS study were compensated
with either extra credit or $20. All participants for both studies were at least 18 years old and
consented to the study conditions prior to their participation.
3.3.1.2 Hardware and Software
The VIMS study was run on Windows 7, 32 bit with an AMD Phenom X4 945 quad-core
CPU, 8 GB of DDR2, and an NVIDIA GeForce 460 GTX graphics card. All virtual interactions
were displayed on an immersive stereoscopic head-mounted display (HMD), the Oculus Rift
Development Kit 1. The Oculus Rift is a 1280x800, 32-bit color LCD matrix measuring 7 ′′
diagonally that measures and updates the picture shown based on accelerometers, gyroscopes,
and magnetometers. The Oculus Rift has a 100◦ field of view. The virtual environment used
in this study was built with the Unity graphics engine and rendered in stereoscopic 3D. All
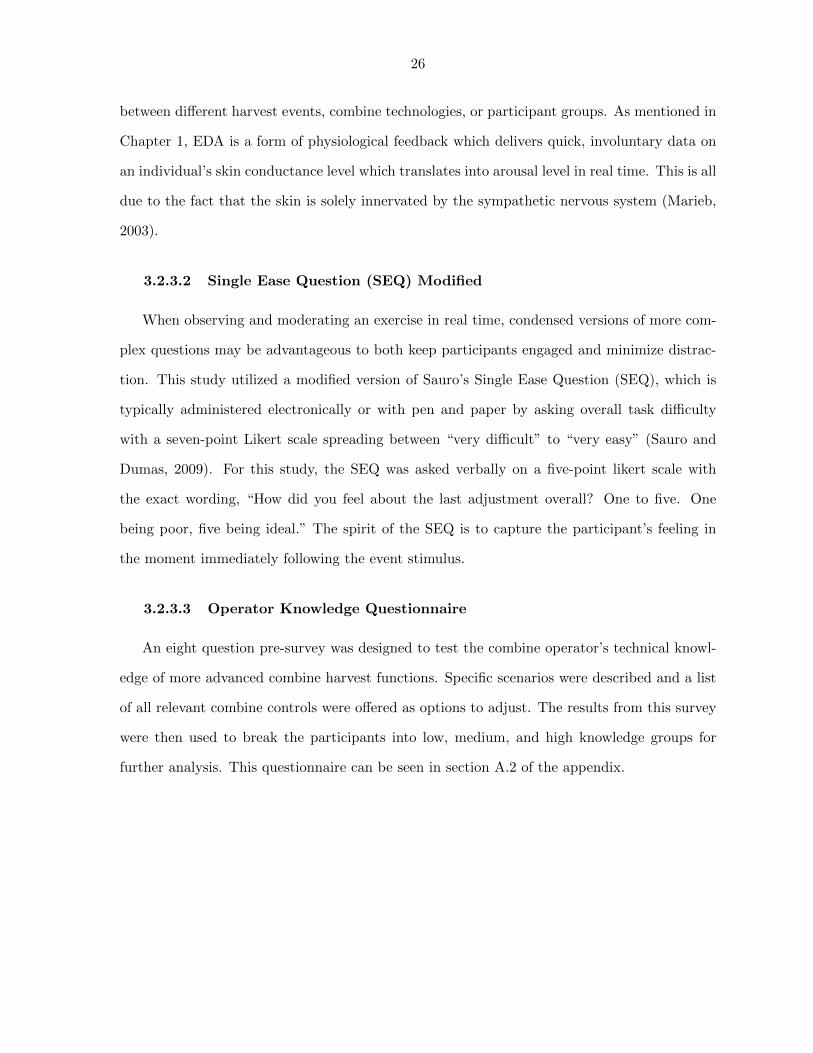
virtual interactions within the maze condition were controlled with a gamepad, see Figure 3.3.
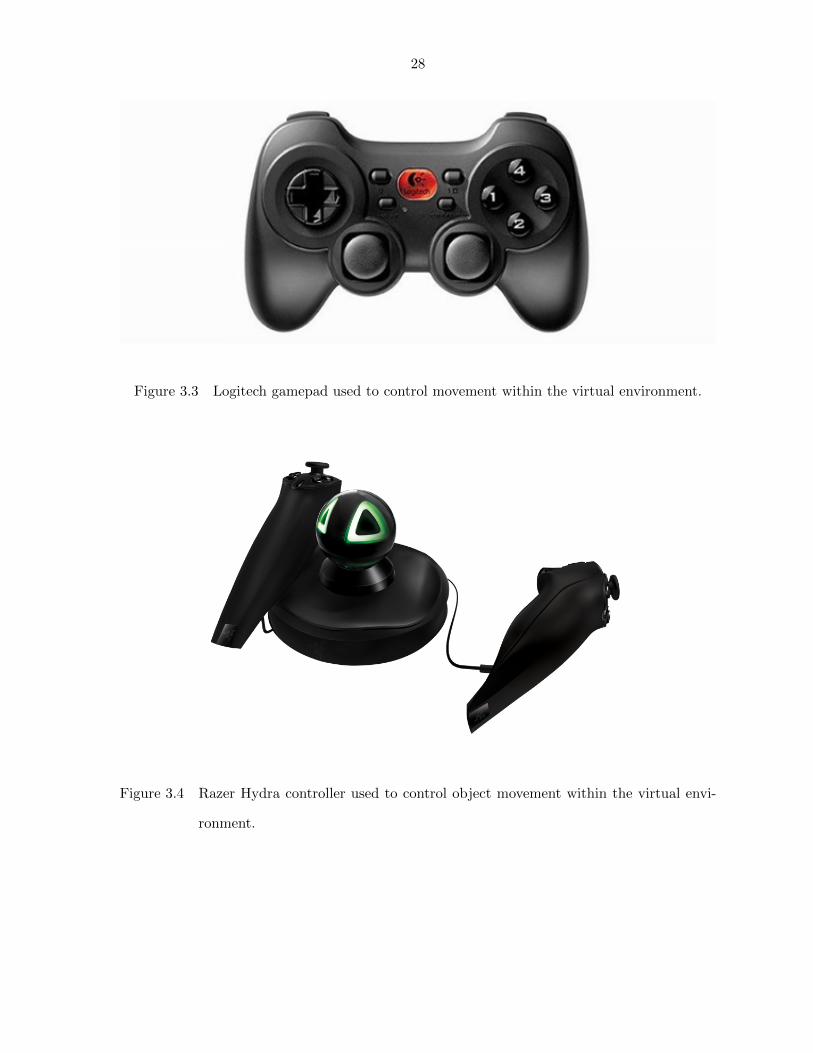
All interactions within the virtual peg-in-hole were controlled via the Razer Hydra, a magnetic
movement tracking controller, see Figure 3.4.
28
Figure 3.3 Logitech gamepad used to control movement within the virtual environment.
Figure 3.4 Razer Hydra controller used to control object movement within the virtual envi-
ronment.
29
3.3.2 Procedures
3.3.2.1 Study Overview
The primary focus of this study was to determine if a hand-eye coordination task could be
as effective at mitigating visually induced motion sickness as natural decay (sitting calmly with
eyes closed). The secondary component was to determine whether the virtual counterparts to
these mitigation tasks were as effective as their real world versions.
Participants navigated through a maze designed to induce visually-induced motion sickness.
The main sections of the maze were based on tasks from the Virtual Environment Performance
Assessment Battery (VEPAB; Lampton et al., 1994). One of these tasks, called “Turns”
consisted of many left and right 90◦ turns and had a significant correlation with the simulator
sickness questionnaire (SSQ) total severity (TS) score. The SSQ is a series of Likert questions
designed to determine how sick an individual is at a given point in time. Trampolines and
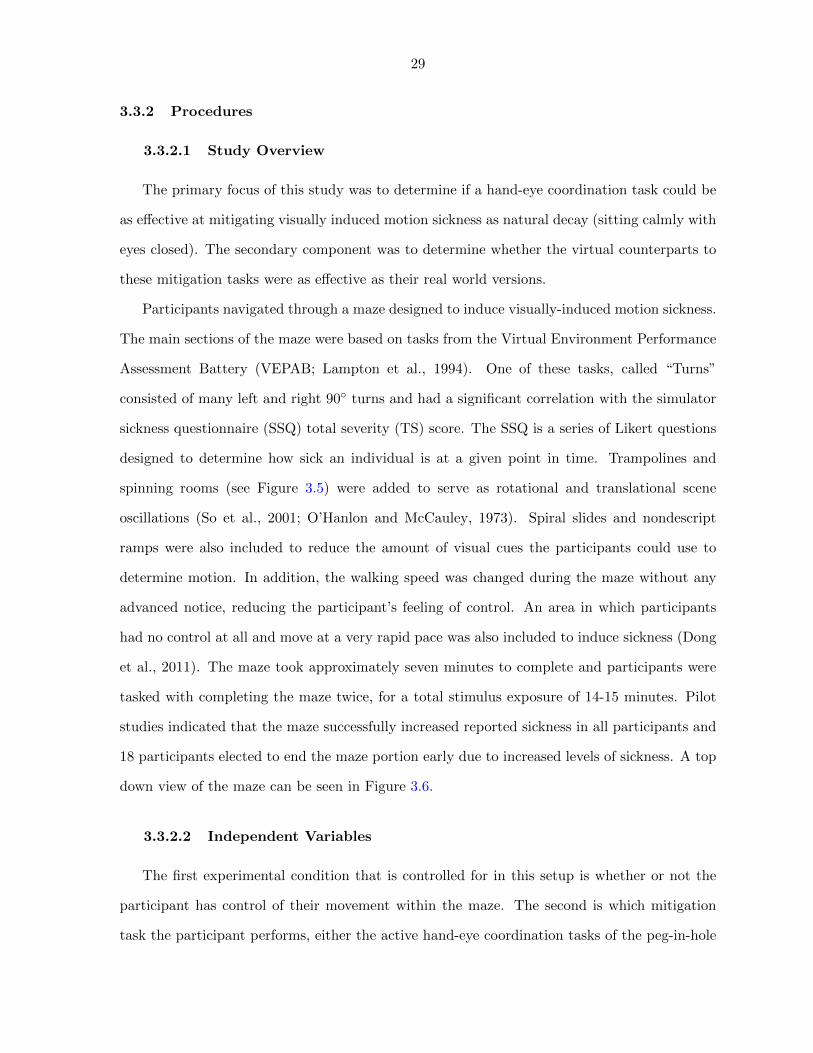
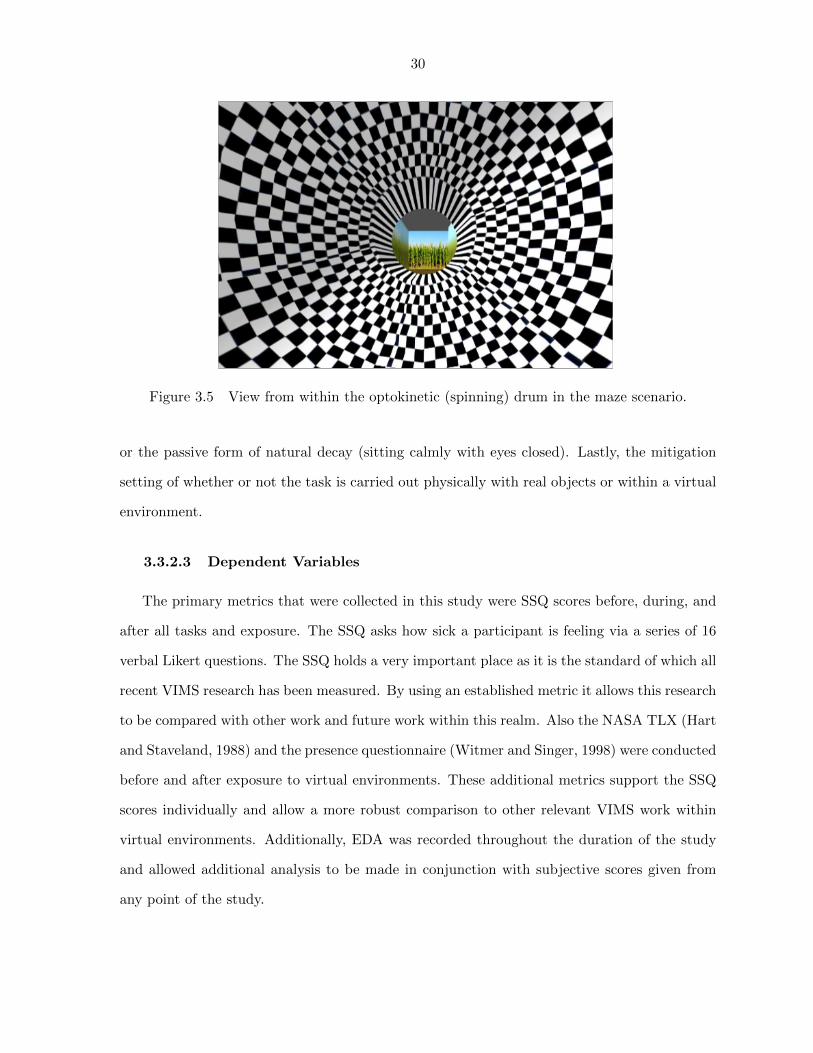
spinning rooms (see Figure 3.5) were added to serve as rotational and translational scene
oscillations (So et al., 2001; O’Hanlon and McCauley, 1973). Spiral slides and nondescript
ramps were also included to reduce the amount of visual cues the participants could use to
determine motion. In addition, the walking speed was changed during the maze without any
advanced notice, reducing the participant’s feeling of control. An area in which participants
had no control at all and move at a very rapid pace was also included to induce sickness (Dong
et al., 2011). The maze took approximately seven minutes to complete and participants were
tasked with completing the maze twice, for a total stimulus exposure of 14-15 minutes. Pilot
studies indicated that the maze successfully increased reported sickness in all participants and
18 participants elected to end the maze portion early due to increased levels of sickness. A top
down view of the maze can be seen in Figure 3.6.
3.3.2.2 Independent Variables
The first experimental condition that is controlled for in this setup is whether or not the
participant has control of their movement within the maze. The second is which mitigation
task the participant performs, either the active hand-eye coordination tasks of the peg-in-hole
30
Figure 3.5 View from within the optokinetic (spinning) drum in the maze scenario.
or the passive form of natural decay (sitting calmly with eyes closed). Lastly, the mitigation
setting of whether or not the task is carried out physically with real objects or within a virtual
environment.
3.3.2.3 Dependent Variables
The primary metrics that were collected in this study were SSQ scores before, during, and
after all tasks and exposure. The SSQ asks how sick a participant is feeling via a series of 16
verbal Likert questions. The SSQ holds a very important place as it is the standard of which all
recent VIMS research has been measured. By using an established metric it allows this research
to be compared with other work and future work within this realm. Also the NASA TLX (Hart
and Staveland, 1988) and the presence questionnaire (Witmer and Singer, 1998) were conducted
before and after exposure to virtual environments. These additional metrics support the SSQ
scores individually and allow a more robust comparison to other relevant VIMS work within
virtual environments. Additionally, EDA was recorded throughout the duration of the study
and allowed additional analysis to be made in conjunction with subjective scores given from
any point of the study.
31
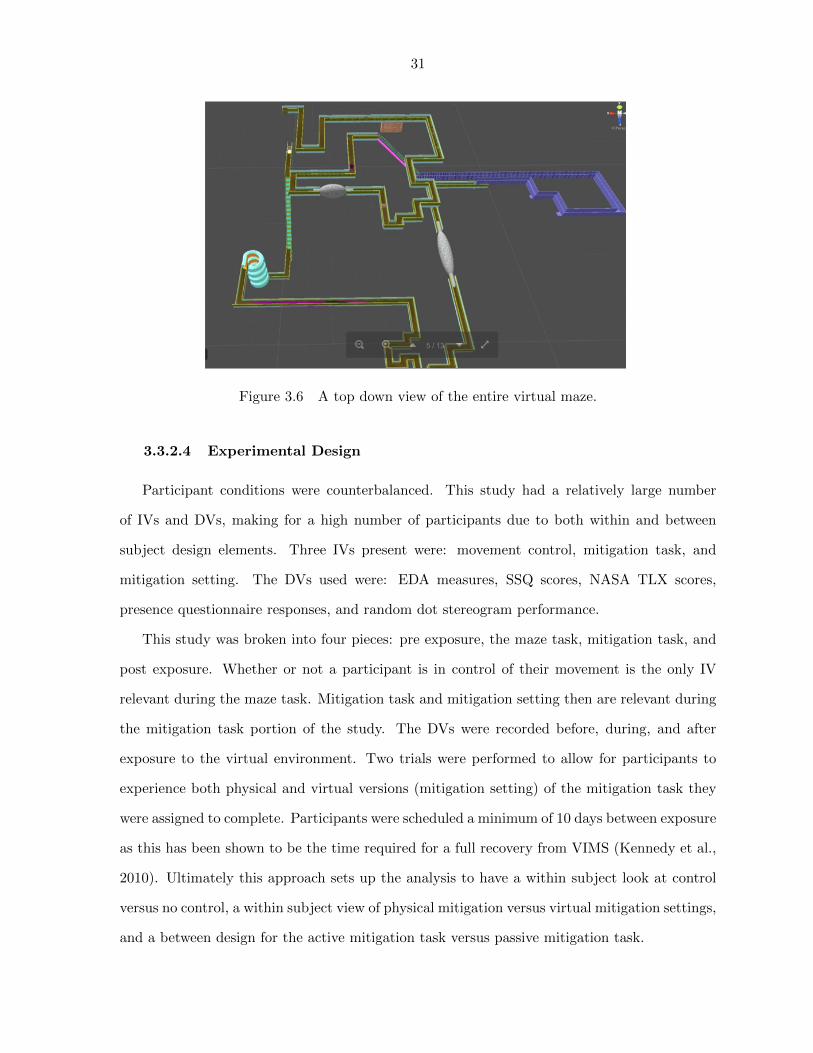
Figure 3.6 A top down view of the entire virtual maze.
3.3.2.4 Experimental Design
Participant conditions were counterbalanced. This study had a relatively large number
of IVs and DVs, making for a high number of participants due to both within and between
subject design elements. Three IVs present were: movement control, mitigation task, and
mitigation setting. The DVs used were: EDA measures, SSQ scores, NASA TLX scores,
presence questionnaire responses, and random dot stereogram performance.
This study was broken into four pieces: pre exposure, the maze task, mitigation task, and
post exposure. Whether or not a participant is in control of their movement is the only IV
relevant during the maze task. Mitigation task and mitigation setting then are relevant during
the mitigation task portion of the study. The DVs were recorded before, during, and after
exposure to the virtual environment. Two trials were performed to allow for participants to
experience both physical and virtual versions (mitigation setting) of the mitigation task they
were assigned to complete. Participants were scheduled a minimum of 10 days between exposure
as this has been shown to be the time required for a full recovery from VIMS (Kennedy et al.,
2010). Ultimately this approach sets up the analysis to have a within subject look at control
versus no control, a within subject view of physical mitigation versus virtual mitigation settings,
and a between design for the active mitigation task versus passive mitigation task.
32
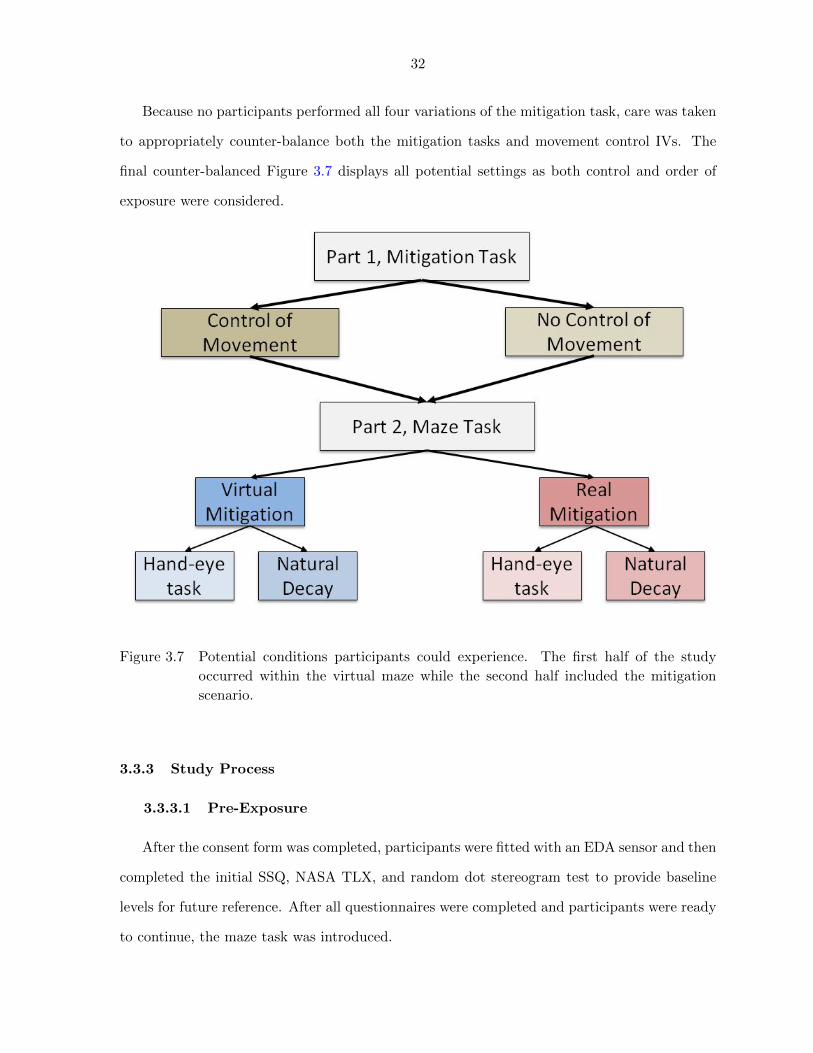
Because no participants performed all four variations of the mitigation task, care was taken
to appropriately counter-balance both the mitigation tasks and movement control IVs. The
final counter-balanced Figure 3.7 displays all potential settings as both control and order of
exposure were considered.
Figure 3.7 Potential conditions participants could experience. The first half of the study
occurred within the virtual maze while the second half included the mitigation
scenario.
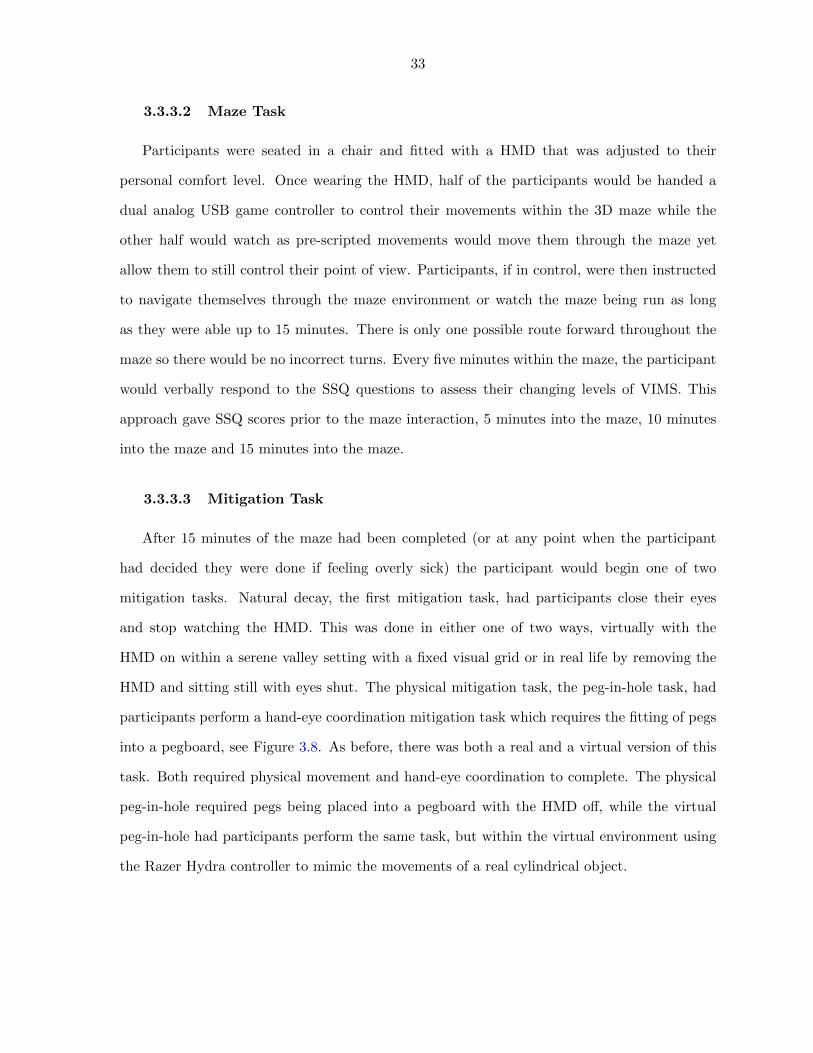
3.3.3 Study Process
3.3.3.1 Pre-Exposure
After the consent form was completed, participants were fitted with an EDA sensor and then
completed the initial SSQ, NASA TLX, and random dot stereogram test to provide baseline
levels for future reference. After all questionnaires were completed and participants were ready
to continue, the maze task was introduced.
33
3.3.3.2 Maze Task
Participants were seated in a chair and fitted with a HMD that was adjusted to their
personal comfort level. Once wearing the HMD, half of the participants would be handed a
dual analog USB game controller to control their movements within the 3D maze while the
other half would watch as pre-scripted movements would move them through the maze yet
allow them to still control their point of view. Participants, if in control, were then instructed
to navigate themselves through the maze environment or watch the maze being run as long
as they were able up to 15 minutes. There is only one possible route forward throughout the
maze so there would be no incorrect turns. Every five minutes within the maze, the participant
would verbally respond to the SSQ questions to assess their changing levels of VIMS. This
approach gave SSQ scores prior to the maze interaction, 5 minutes into the maze, 10 minutes
into the maze and 15 minutes into the maze.
3.3.3.3 Mitigation Task
After 15 minutes of the maze had been completed (or at any point when the participant
had decided they were done if feeling overly sick) the participant would begin one of two
mitigation tasks. Natural decay, the first mitigation task, had participants close their eyes
and stop watching the HMD. This was done in either one of two ways, virtually with the
HMD on within a serene valley setting with a fixed visual grid or in real life by removing the
HMD and sitting still with eyes shut. The physical mitigation task, the peg-in-hole task, had
participants perform a hand-eye coordination mitigation task which requires the fitting of pegs
into a pegboard, see Figure 3.8. As before, there was both a real and a virtual version of this
task. Both required physical movement and hand-eye coordination to complete. The physical
peg-in-hole required pegs being placed into a pegboard with the HMD off, while the virtual
peg-in-hole had participants perform the same task, but within the virtual environment using
the Razer Hydra controller to mimic the movements of a real cylindrical object.
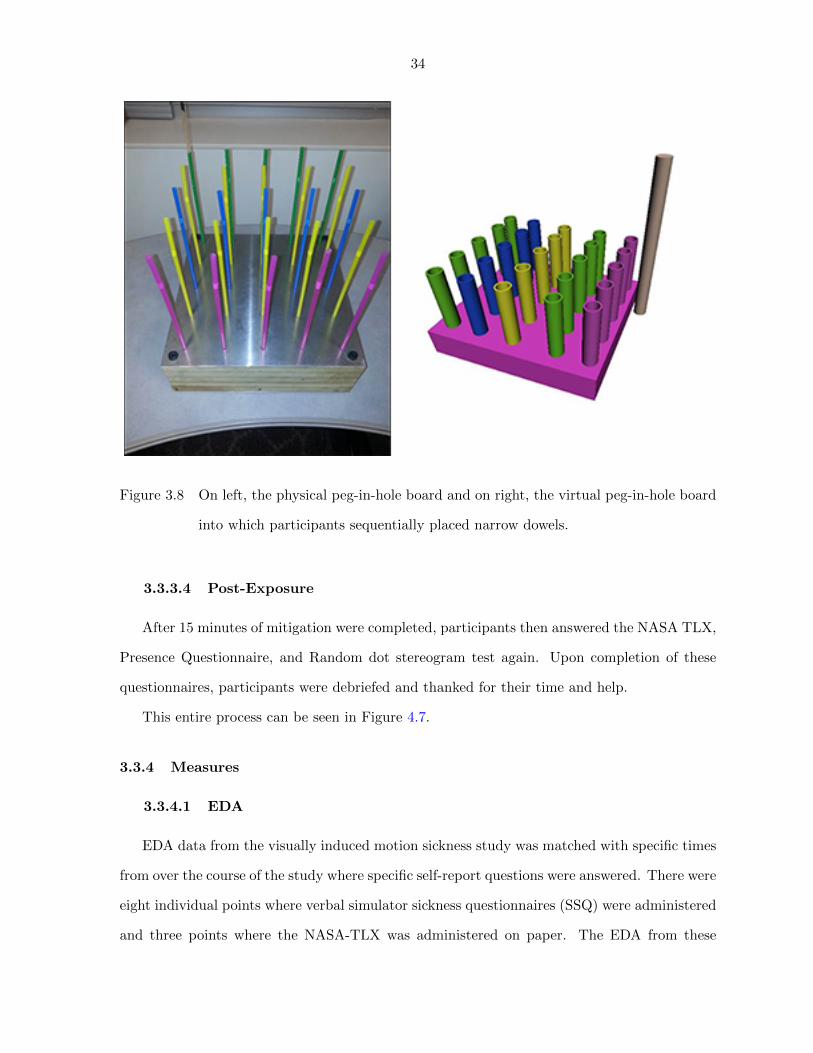
34
Figure 3.8 On left, the physical peg-in-hole board and on right, the virtual peg-in-hole board
into which participants sequentially placed narrow dowels.
3.3.3.4 Post-Exposure
After 15 minutes of mitigation were completed, participants then answered the NASA TLX,
Presence Questionnaire, and Random dot stereogram test again. Upon completion of these
questionnaires, participants were debriefed and thanked for their time and help.
This entire process can be seen in Figure 4.7.
3.3.4 Measures
3.3.4.1 EDA
EDA data from the visually induced motion sickness study was matched with specific times
from over the course of the study where specific self-report questions were answered. There were
eight individual points where verbal simulator sickness questionnaires (SSQ) were administered
and three points where the NASA-TLX was administered on paper. The EDA from these

35
events averaged over a 20 second smoothing window, which comes from similar practices in
electromyography (Merletti and Parker, 2004) and electroencephalography (Tzallas, 2009). The
smoothing window was designated as the 20 seconds immediately proceeding the administration
of the self-report questions (either SSQ or TLX). This timing was selected to mitigate any
physiological effect the questions themselves may have had on participant’s observed EDA.
The mean EDA value determined from the smoothing window is then used as a basis for
comparison for analysis between events, times, or participant’s groups (e.g. control groups,
mitigation groups).
3.3.4.2 Simulator Sickness Questionnaire (SSQ)
Kennedy’s Simulator Sickness Questionnaire (SSQ) has become the standard survey tool
when assessing visually induced motion sickness within simulator, virtual reality, or any other
non-movement environments (Kennedy et al., 1993). This study had participants fully im-
mersed in their virtual environment while wearing an HMD, which required the SSQ to be
asked verbally. Participants were asked each of the 16 items and would respond with an integer
between zero to three, (four-point Likert scale) with zero being no symptoms and 3 being severe.
The 16 items were then scored by weighting responses to give an overall sickness score, read as
total severity. Additionally, the SSQ can further be broken down into three separate sub-scales
including oculomotor, nausea, and disorientation. The scoring systems for these subscales, the
total severity score, and the complete questionnaire can be see in section A.3 of the appendix,
all of which come from Kennedy et al. (1993).
3.3.4.3 NASA-Task Load Index (TLX)
The NASA-TLX is a subjective six question survey which has participants rank themselves
after performing a specific task (Hart and Staveland, 1988). Each question is asked on a
segmented seven-point Likert scale which is then scored to deliver a total single score. The six
questions consider these factors: mental demand, physical demand, temporal demand, effort,
performance, and frustration. This research focused on the mental demand and effort ratings.
There is also no weighting procedure used in determining the aggregate TLX score as outlined
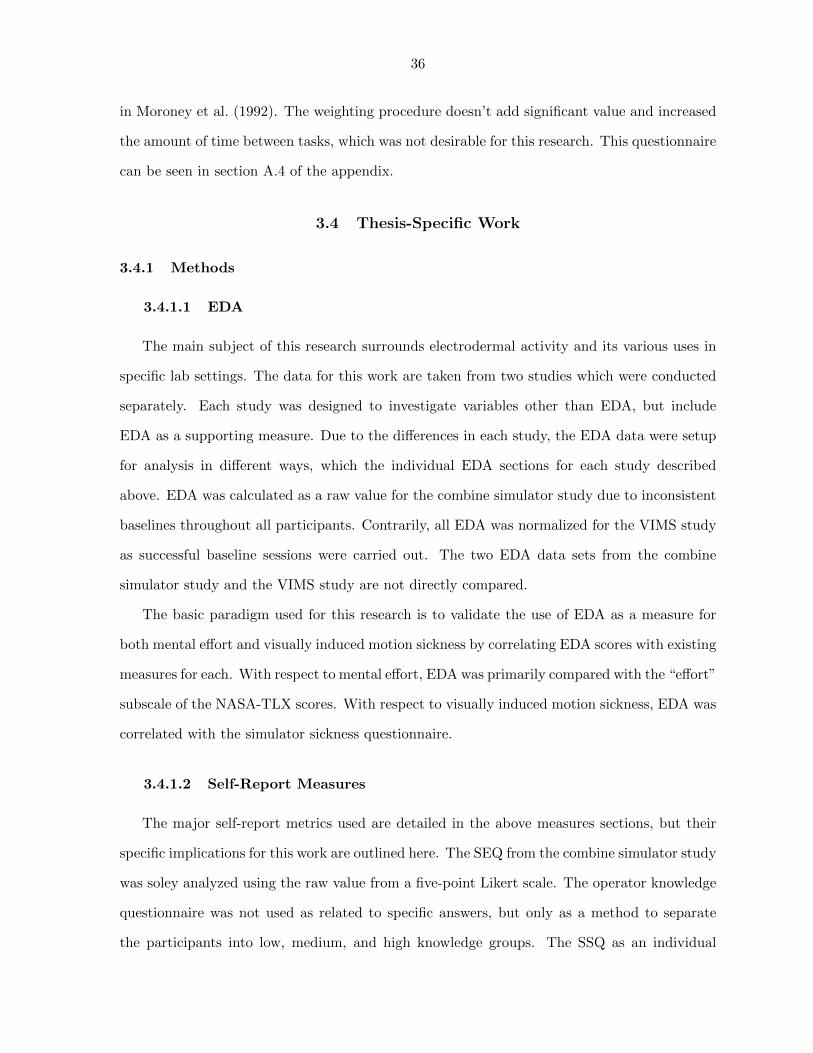
36
in Moroney et al. (1992). The weighting procedure doesn’t add significant value and increased
the amount of time between tasks, which was not desirable for this research. This questionnaire
can be seen in section A.4 of the appendix.
3.4 Thesis-Specific Work
3.4.1 Methods
3.4.1.1 EDA
The main subject of this research surrounds electrodermal activity and its various uses in
specific lab settings. The data for this work are taken from two studies which were conducted
separately. Each study was designed to investigate variables other than EDA, but include
EDA as a supporting measure. Due to the differences in each study, the EDA data were setup
for analysis in different ways, which the individual EDA sections for each study described
above. EDA was calculated as a raw value for the combine simulator study due to inconsistent
baselines throughout all participants. Contrarily, all EDA was normalized for the VIMS study
as successful baseline sessions were carried out. The two EDA data sets from the combine
simulator study and the VIMS study are not directly compared.
The basic paradigm used for this research is to validate the use of EDA as a measure for
both mental effort and visually induced motion sickness by correlating EDA scores with existing
measures for each. With respect to mental effort, EDA was primarily compared with the “effort”
subscale of the NASA-TLX scores. With respect to visually induced motion sickness, EDA was
correlated with the simulator sickness questionnaire.
3.4.1.2 Self-Report Measures
The major self-report metrics used are detailed in the above measures sections, but their
specific implications for this work are outlined here. The SEQ from the combine simulator study
was soley analyzed using the raw value from a five-point Likert scale. The operator knowledge
questionnaire was not used as related to specific answers, but only as a method to separate
the participants into low, medium, and high knowledge groups. The SSQ as an individual
37
questionnaire is 16 items asked on a four-point likert scale, but for analysis the primary scores
used were those of the nausea subscale, which totaled individual symptom scores and multiplied
them by a factor of 9.54 per the Kennedy et al. (1993) guidelines. The NASA-TLX was used
from only the effort subscale, and raw values from the 21-point likert scale were used in analysis
for this work.
3.4.2 Procedures
3.4.2.1 EDA Physical Preparation
Each participant was briefed on the function of the EDA sensor prior to their consent. The
EDA sensor was then placed on the left wrist on the anterior side (van Dooren et al., 2012).
3.4.2.2 EDA Normalization
EDA data was normalized for the VIMS study using the following equation:
(signaldatapoint−meanofbaseline)
meanofbaseline(3.1)
This allows data from different participants to be compared without having to attribute dis-
crepancies to individual differences. An example would be Participant A exhibits an EDA level
of 12 microsiemens while Participant B exhibits an EDA level of 6. Both Participant A and
Participant B have a baseline of 3 microsiemens. In this scenario it would appear Participant
A has twice the response of Participant B, but after normalization is performed, Participant A
now displays three times the response of Participant B.
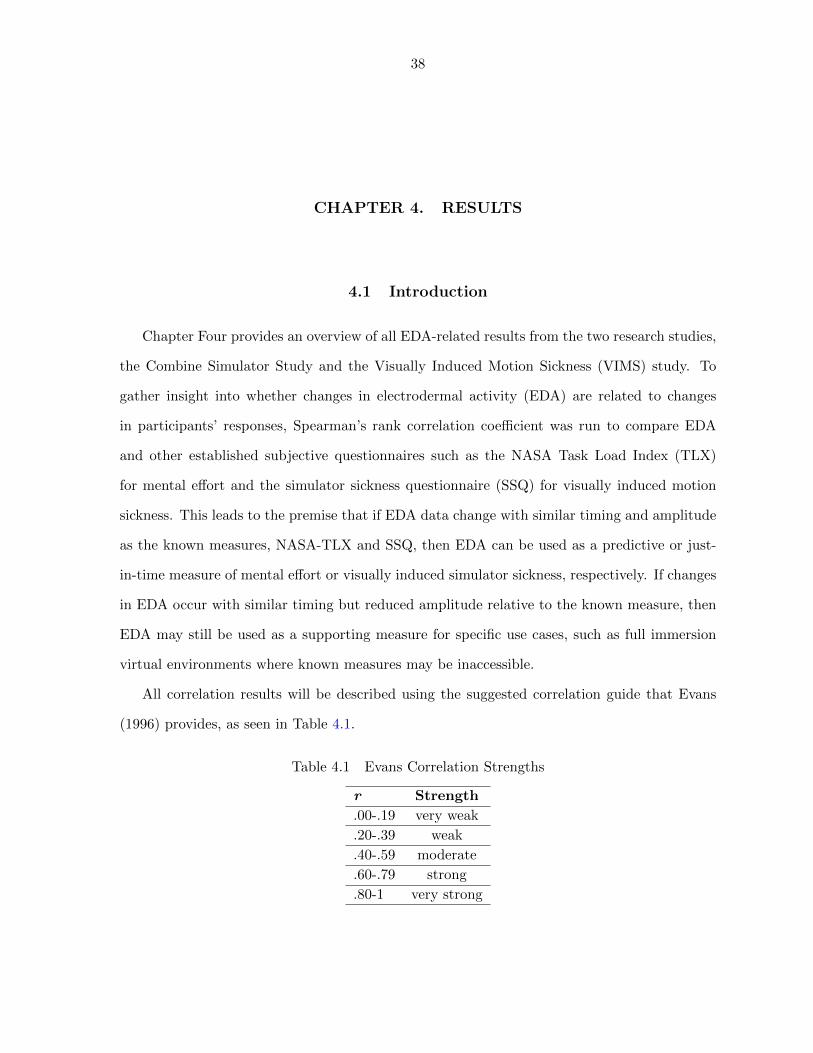
38
CHAPTER 4. RESULTS
4.1 Introduction
Chapter Four provides an overview of all EDA-related results from the two research studies,
the Combine Simulator Study and the Visually Induced Motion Sickness (VIMS) study. To
gather insight into whether changes in electrodermal activity (EDA) are related to changes
in participants’ responses, Spearman’s rank correlation coefficient was run to compare EDA
and other established subjective questionnaires such as the NASA Task Load Index (TLX)
for mental effort and the simulator sickness questionnaire (SSQ) for visually induced motion
sickness. This leads to the premise that if EDA data change with similar timing and amplitude
as the known measures, NASA-TLX and SSQ, then EDA can be used as a predictive or just-
in-time measure of mental effort or visually induced simulator sickness, respectively. If changes
in EDA occur with similar timing but reduced amplitude relative to the known measure, then
EDA may still be used as a supporting measure for specific use cases, such as full immersion
virtual environments where known measures may be inaccessible.
All correlation results will be described using the suggested correlation guide that Evans
(1996) provides, as seen in Table 4.1.
Table 4.1 Evans Correlation Strengths
r Strength
.00-.19 very weak
.20-.39 weak
.40-.59 moderate
.60-.79 strong
.80-1 very strong
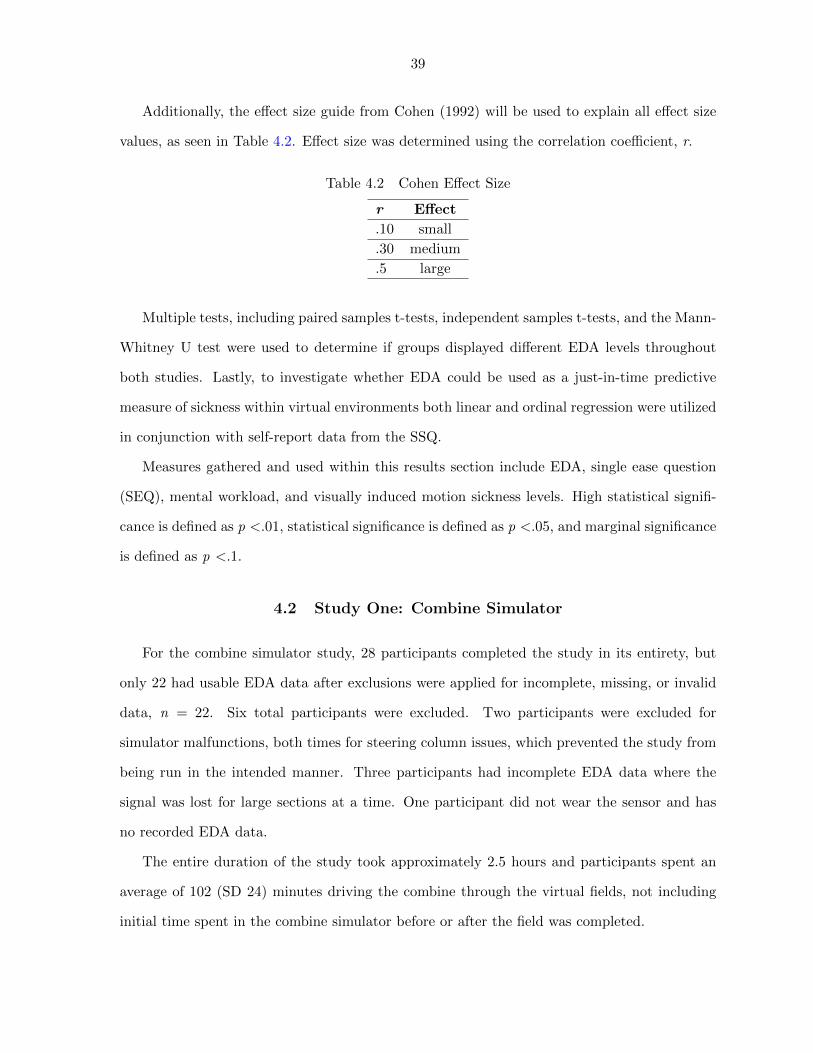
39
Additionally, the effect size guide from Cohen (1992) will be used to explain all effect size
values, as seen in Table 4.2. Effect size was determined using the correlation coefficient, r.
Table 4.2 Cohen Effect Size
r Effect
.10 small
.30 medium
.5 large
Multiple tests, including paired samples t-tests, independent samples t-tests, and the Mann-
Whitney U test were used to determine if groups displayed different EDA levels throughout
both studies. Lastly, to investigate whether EDA could be used as a just-in-time predictive
measure of sickness within virtual environments both linear and ordinal regression were utilized
in conjunction with self-report data from the SSQ.
Measures gathered and used within this results section include EDA, single ease question
(SEQ), mental workload, and visually induced motion sickness levels. High statistical signifi-
cance is defined as p <.01, statistical significance is defined as p <.05, and marginal significance
is defined as p <.1.
4.2 Study One: Combine Simulator
For the combine simulator study, 28 participants completed the study in its entirety, but
only 22 had usable EDA data after exclusions were applied for incomplete, missing, or invalid
data, n = 22. Six total participants were excluded. Two participants were excluded for
simulator malfunctions, both times for steering column issues, which prevented the study from
being run in the intended manner. Three participants had incomplete EDA data where the
signal was lost for large sections at a time. One participant did not wear the sensor and has
no recorded EDA data.
The entire duration of the study took approximately 2.5 hours and participants spent an
average of 102 (SD 24) minutes driving the combine through the virtual fields, not including
initial time spent in the combine simulator before or after the field was completed.
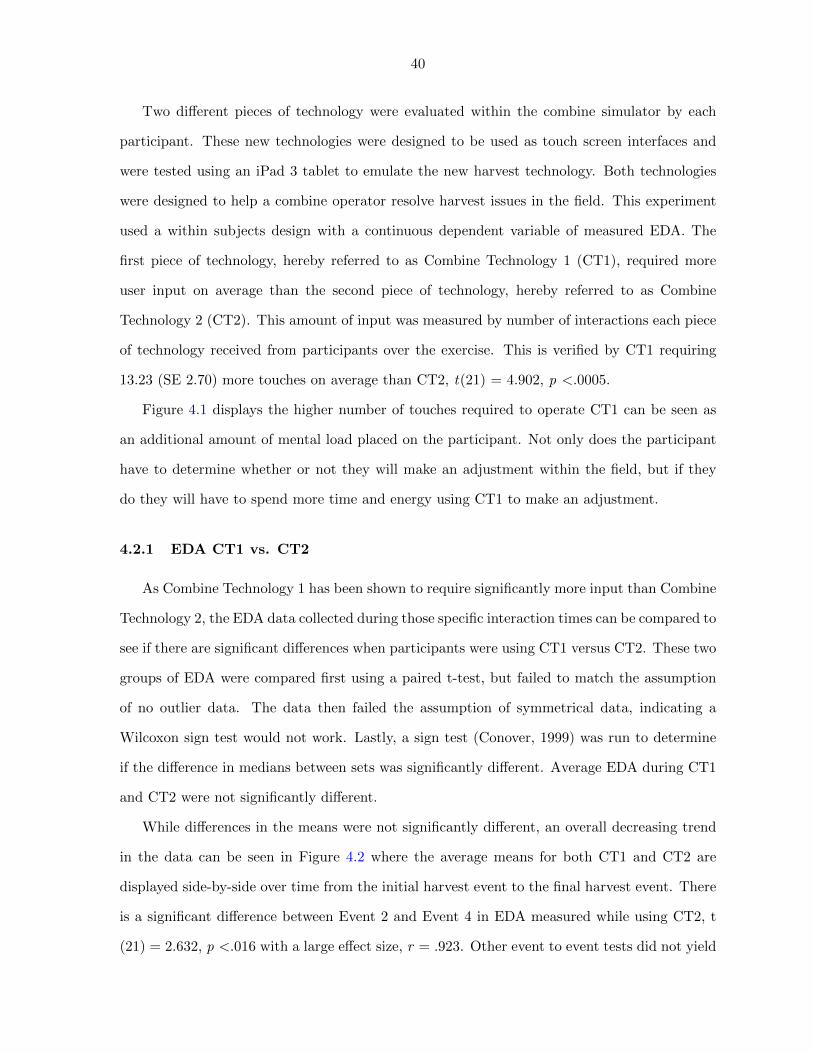
40
Two different pieces of technology were evaluated within the combine simulator by each
participant. These new technologies were designed to be used as touch screen interfaces and
were tested using an iPad 3 tablet to emulate the new harvest technology. Both technologies
were designed to help a combine operator resolve harvest issues in the field. This experiment
used a within subjects design with a continuous dependent variable of measured EDA. The
first piece of technology, hereby referred to as Combine Technology 1 (CT1), required more
user input on average than the second piece of technology, hereby referred to as Combine
Technology 2 (CT2). This amount of input was measured by number of interactions each piece
of technology received from participants over the exercise. This is verified by CT1 requiring
13.23 (SE 2.70) more touches on average than CT2, t(21) = 4.902, p <.0005.
Figure 4.1 displays the higher number of touches required to operate CT1 can be seen as
an additional amount of mental load placed on the participant. Not only does the participant
have to determine whether or not they will make an adjustment within the field, but if they
do they will have to spend more time and energy using CT1 to make an adjustment.
4.2.1 EDA CT1 vs. CT2
As Combine Technology 1 has been shown to require significantly more input than Combine
Technology 2, the EDA data collected during those specific interaction times can be compared to
see if there are significant differences when participants were using CT1 versus CT2. These two
groups of EDA were compared first using a paired t-test, but failed to match the assumption
of no outlier data. The data then failed the assumption of symmetrical data, indicating a
Wilcoxon sign test would not work. Lastly, a sign test (Conover, 1999) was run to determine
if the difference in medians between sets was significantly different. Average EDA during CT1
and CT2 were not significantly different.
While differences in the means were not significantly different, an overall decreasing trend
in the data can be seen in Figure 4.2 where the average means for both CT1 and CT2 are
displayed side-by-side over time from the initial harvest event to the final harvest event. There
is a significant difference between Event 2 and Event 4 in EDA measured while using CT2, t
(21) = 2.632, p <.016 with a large effect size, r = .923. Other event to event tests did not yield

41
Figure 4.1 CT1 requires more interaction than CT2, box plot whiskers represent standard
deviation, n = 28.
significant results due to low sample size (n = 10, 12 of 22 participants did not participate in
Event 1 due to study design). While there was a decrease in EDA measured from Event 1 to
Event 4, the decrease was non-significant.
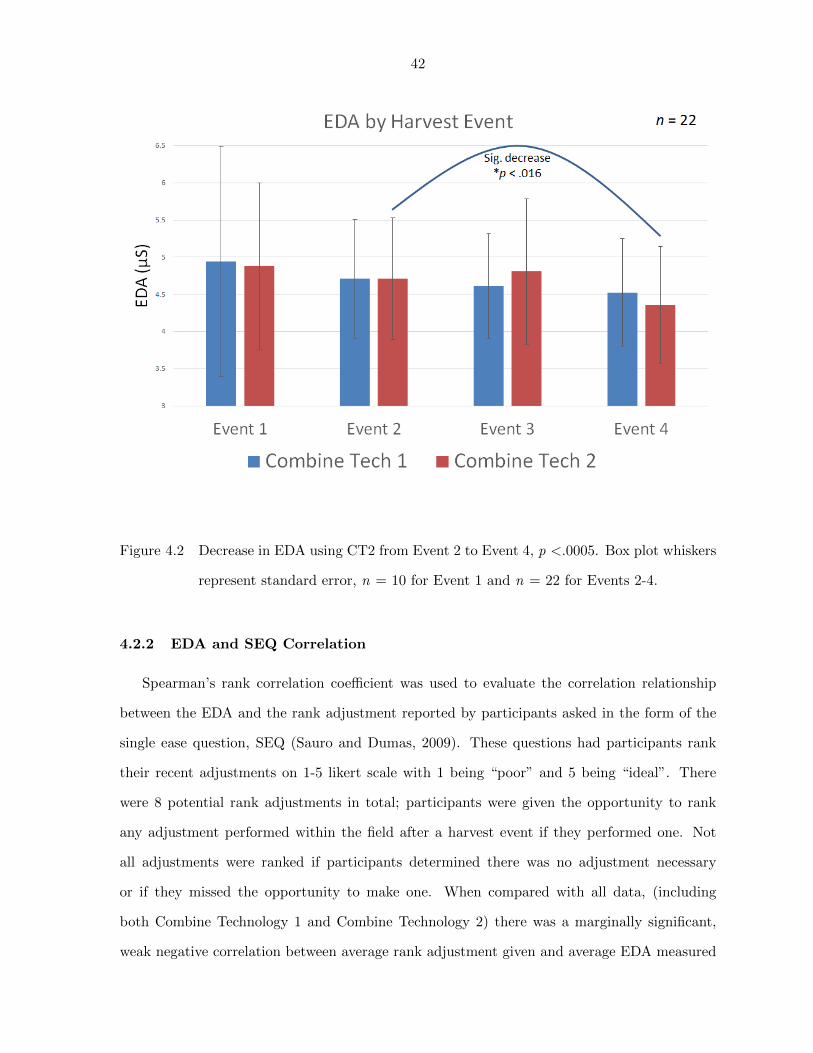
42
Figure 4.2 Decrease in EDA using CT2 from Event 2 to Event 4, p <.0005. Box plot whiskers
represent standard error, n = 10 for Event 1 and n = 22 for Events 2-4.
4.2.2 EDA and SEQ Correlation
Spearman’s rank correlation coefficient was used to evaluate the correlation relationship
between the EDA and the rank adjustment reported by participants asked in the form of the
single ease question, SEQ (Sauro and Dumas, 2009). These questions had participants rank
their recent adjustments on 1-5 likert scale with 1 being “poor” and 5 being “ideal”. There
were 8 potential rank adjustments in total; participants were given the opportunity to rank
any adjustment performed within the field after a harvest event if they performed one. Not
all adjustments were ranked if participants determined there was no adjustment necessary
or if they missed the opportunity to make one. When compared with all data, (including
both Combine Technology 1 and Combine Technology 2) there was a marginally significant,
weak negative correlation between average rank adjustment given and average EDA measured
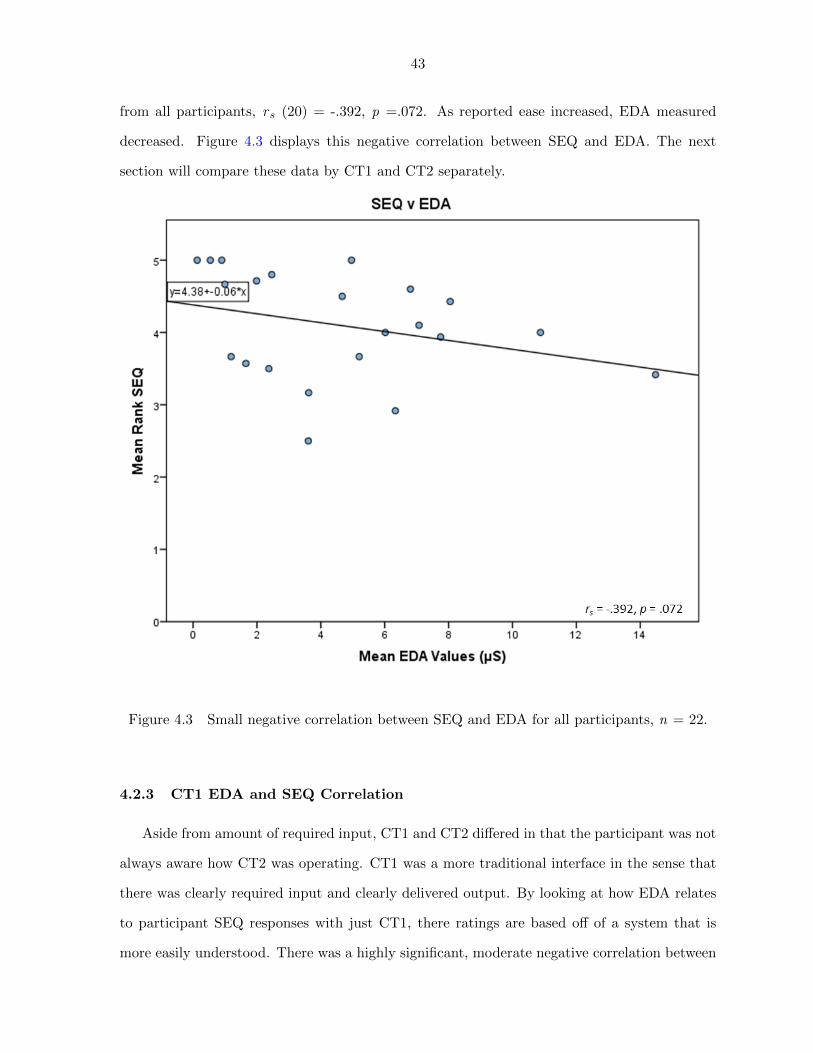
43
from all participants, rs (20) = -.392, p =.072. As reported ease increased, EDA measured
decreased. Figure 4.3 displays this negative correlation between SEQ and EDA. The next
section will compare these data by CT1 and CT2 separately.
Figure 4.3 Small negative correlation between SEQ and EDA for all participants, n = 22.
4.2.3 CT1 EDA and SEQ Correlation
Aside from amount of required input, CT1 and CT2 differed in that the participant was not
always aware how CT2 was operating. CT1 was a more traditional interface in the sense that
there was clearly required input and clearly delivered output. By looking at how EDA relates
to participant SEQ responses with just CT1, there ratings are based off of a system that is
more easily understood. There was a highly significant, moderate negative correlation between

44
average rank adjustment given and average EDA measured from all participants from the first
half of the study using Combine Technology 1, rs (20) = -0.523, p =.0012. As reported ease
increased, EDA measured decreased visible in Figure 4.4.
Figure 4.4 Moderate negative correlation between SEQ and EDA for all participants, n = 22.
4.2.4 CT2 EDA and SEQ Correlation
As previously stated, participants were not always aware as to how CT2 was operating.
This is reinforced again here as the greater variance of SEQ ratings for CT2 interactions led to
a weak, insignificant correlation with EDA. There was no significant correlation found between
the average rank adjustment given and average EDA measured while using CT2.
45
Expert vs. Knowledge Split All participants answered a series of questions de-
signed to test their harvest knowledge by asking what changes should be made within the
combine for a specific scenario. By evaluating their answers against other experts and each
other, a scoring system was developed which had a potential perfect score of 16 points. The
distribution of these scores is outlined in Figure 4.5. The low knowledge group scored between
3-10, medium knowledge scored between 11-12, and high knowledge was 13-16. An average
score of 11.21 was observed across all participants, n = 28.
Figure 4.5 All participants split into low (blue), medium (red), and high (green) knowledge
groups, n = 28.
4.2.5 EDA Expert vs. Novice
We expect that the higher knowledge group will have less difficulty using the new technology
and addressing the harvest issues presented to them, resulting in lower mental load and by
extension lower EDA levels. As expected, the low knowledge group, on average displayed 1.396
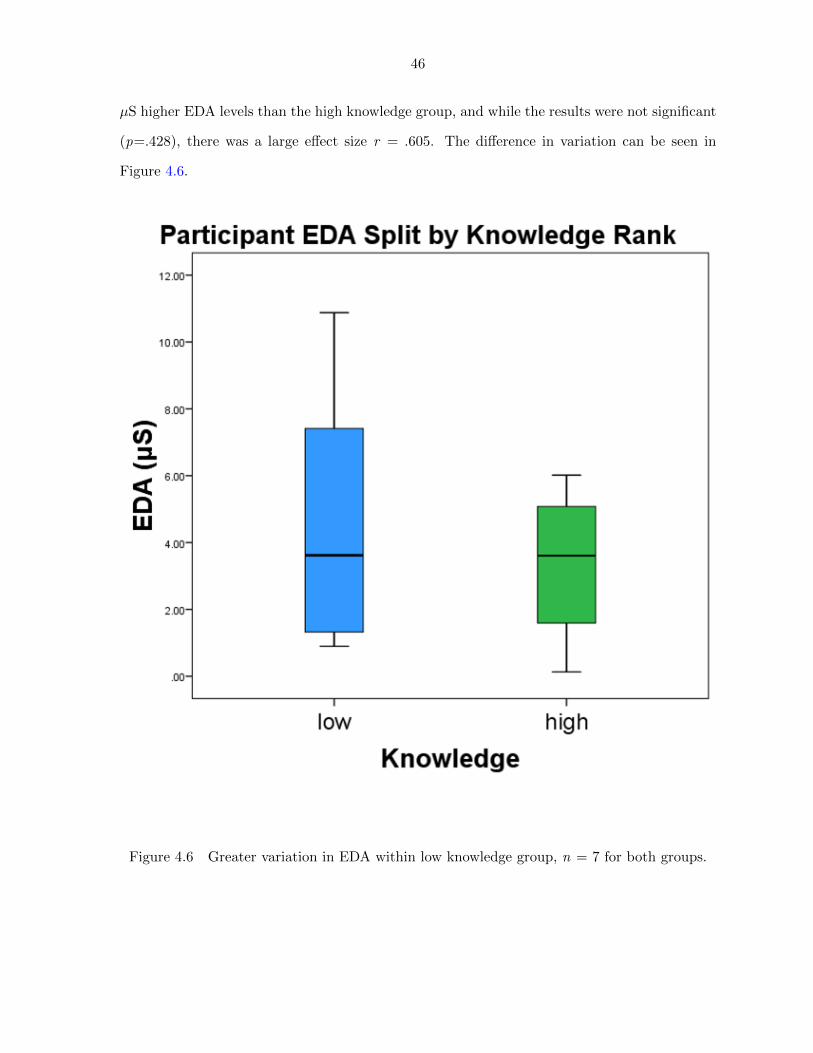
46
µS higher EDA levels than the high knowledge group, and while the results were not significant
(p=.428), there was a large effect size r = .605. The difference in variation can be seen in
Figure 4.6.
Figure 4.6 Greater variation in EDA within low knowledge group, n = 7 for both groups.
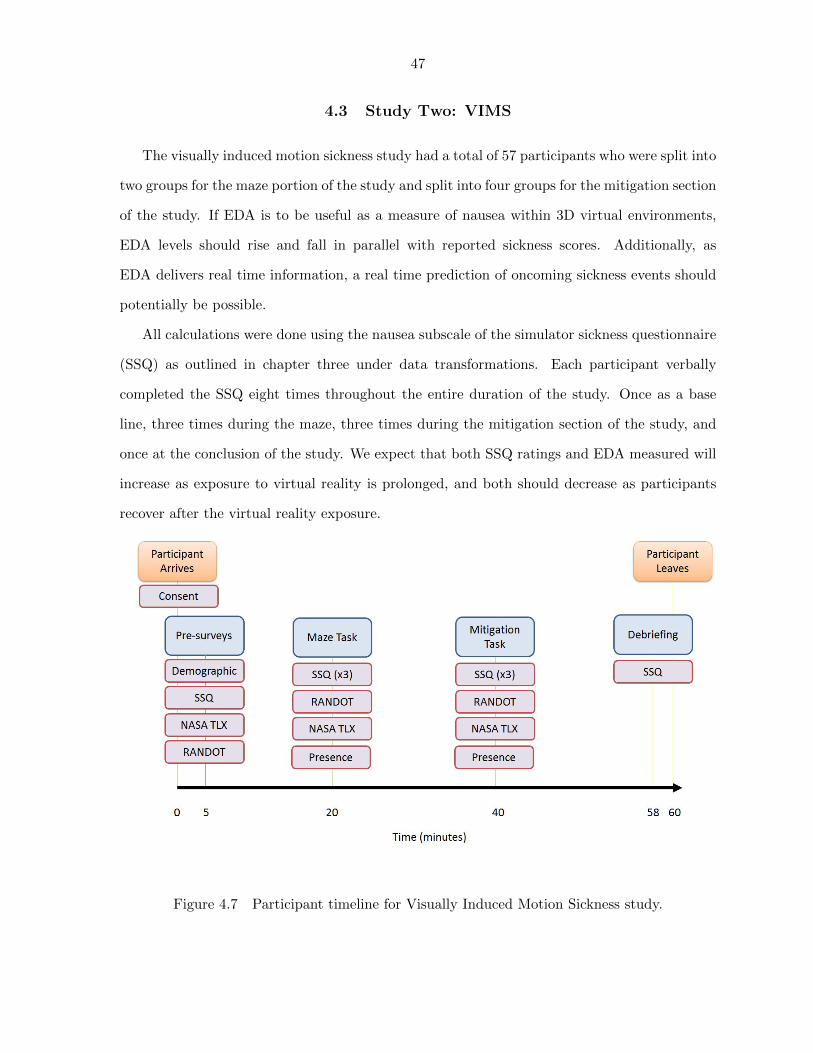
47
4.3 Study Two: VIMS
The visually induced motion sickness study had a total of 57 participants who were split into
two groups for the maze portion of the study and split into four groups for the mitigation section
of the study. If EDA is to be useful as a measure of nausea within 3D virtual environments,
EDA levels should rise and fall in parallel with reported sickness scores. Additionally, as
EDA delivers real time information, a real time prediction of oncoming sickness events should
potentially be possible.
All calculations were done using the nausea subscale of the simulator sickness questionnaire
(SSQ) as outlined in chapter three under data transformations. Each participant verbally
completed the SSQ eight times throughout the entire duration of the study. Once as a base
line, three times during the maze, three times during the mitigation section of the study, and
once at the conclusion of the study. We expect that both SSQ ratings and EDA measured will
increase as exposure to virtual reality is prolonged, and both should decrease as participants
recover after the virtual reality exposure.
Figure 4.7 Participant timeline for Visually Induced Motion Sickness study.
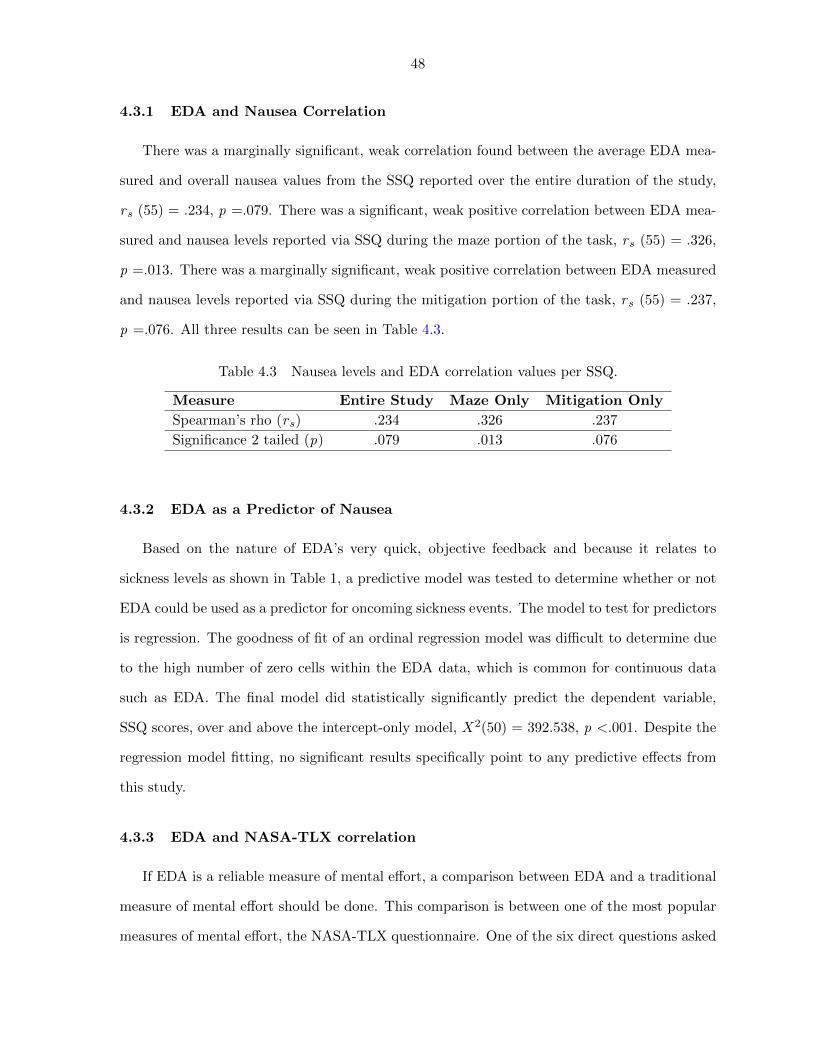
48
4.3.1 EDA and Nausea Correlation
There was a marginally significant, weak correlation found between the average EDA mea-
sured and overall nausea values from the SSQ reported over the entire duration of the study,
rs (55) = .234, p =.079. There was a significant, weak positive correlation between EDA mea-
sured and nausea levels reported via SSQ during the maze portion of the task, rs (55) = .326,
p =.013. There was a marginally significant, weak positive correlation between EDA measured
and nausea levels reported via SSQ during the mitigation portion of the task, rs (55) = .237,
p =.076. All three results can be seen in Table 4.3.
Table 4.3 Nausea levels and EDA correlation values per SSQ.
Measure Entire Study Maze Only Mitigation Only
Spearman’s rho (rs) .234 .326 .237
Significance 2 tailed (p) .079 .013 .076
4.3.2 EDA as a Predictor of Nausea
Based on the nature of EDA’s very quick, objective feedback and because it relates to
sickness levels as shown in Table 1, a predictive model was tested to determine whether or not
EDA could be used as a predictor for oncoming sickness events. The model to test for predictors
is regression. The goodness of fit of an ordinal regression model was difficult to determine due
to the high number of zero cells within the EDA data, which is common for continuous data
such as EDA. The final model did statistically significantly predict the dependent variable,
SSQ scores, over and above the intercept-only model, X2(50) = 392.538, p <.001. Despite the
regression model fitting, no significant results specifically point to any predictive effects from
this study.
4.3.3 EDA and NASA-TLX correlation
If EDA is a reliable measure of mental effort, a comparison between EDA and a traditional
measure of mental effort should be done. This comparison is between one of the most popular
measures of mental effort, the NASA-TLX questionnaire. One of the six direct questions asked
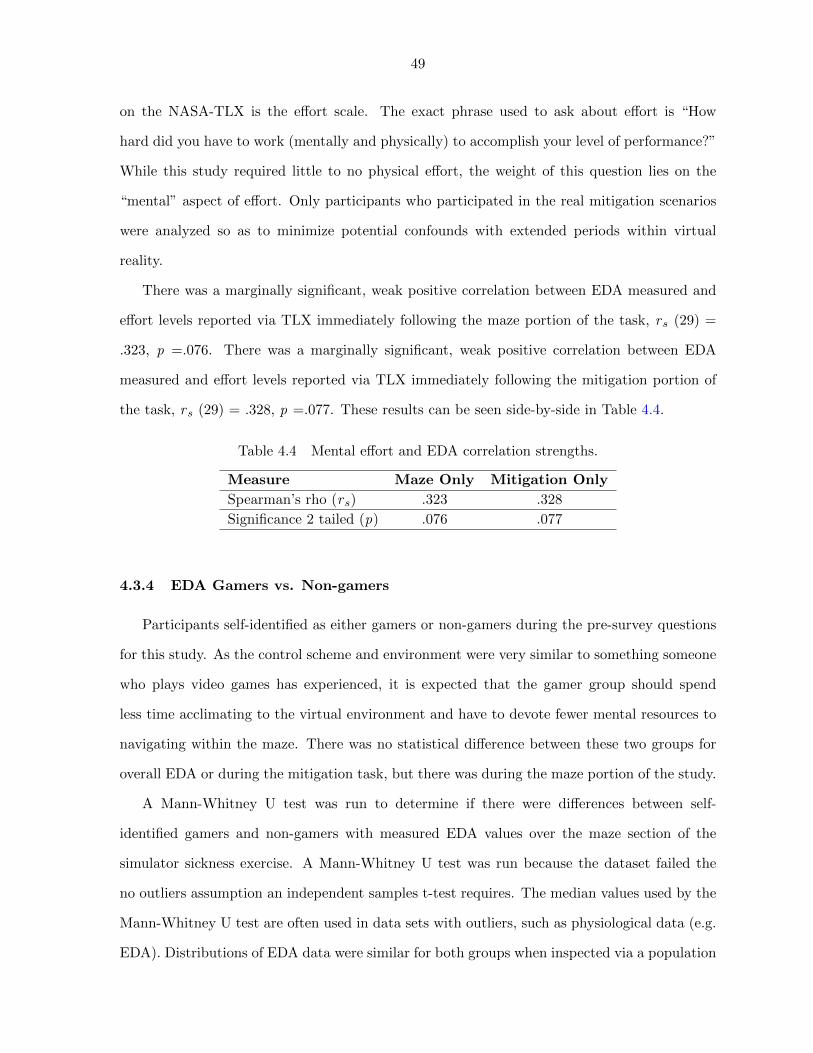
49
on the NASA-TLX is the effort scale. The exact phrase used to ask about effort is “How
hard did you have to work (mentally and physically) to accomplish your level of performance?”
While this study required little to no physical effort, the weight of this question lies on the
“mental” aspect of effort. Only participants who participated in the real mitigation scenarios
were analyzed so as to minimize potential confounds with extended periods within virtual
reality.
There was a marginally significant, weak positive correlation between EDA measured and
effort levels reported via TLX immediately following the maze portion of the task, rs (29) =
.323, p =.076. There was a marginally significant, weak positive correlation between EDA
measured and effort levels reported via TLX immediately following the mitigation portion of
the task, rs (29) = .328, p =.077. These results can be seen side-by-side in Table 4.4.
Table 4.4 Mental effort and EDA correlation strengths.
Measure Maze Only Mitigation Only
Spearman’s rho (rs) .323 .328
Significance 2 tailed (p) .076 .077
4.3.4 EDA Gamers vs. Non-gamers
Participants self-identified as either gamers or non-gamers during the pre-survey questions
for this study. As the control scheme and environment were very similar to something someone
who plays video games has experienced, it is expected that the gamer group should spend
less time acclimating to the virtual environment and have to devote fewer mental resources to
navigating within the maze. There was no statistical difference between these two groups for
overall EDA or during the mitigation task, but there was during the maze portion of the study.
A Mann-Whitney U test was run to determine if there were differences between self-
identified gamers and non-gamers with measured EDA values over the maze section of the
simulator sickness exercise. A Mann-Whitney U test was run because the dataset failed the
no outliers assumption an independent samples t-test requires. The median values used by the
Mann-Whitney U test are often used in data sets with outliers, such as physiological data (e.g.
EDA). Distributions of EDA data were similar for both groups when inspected via a population
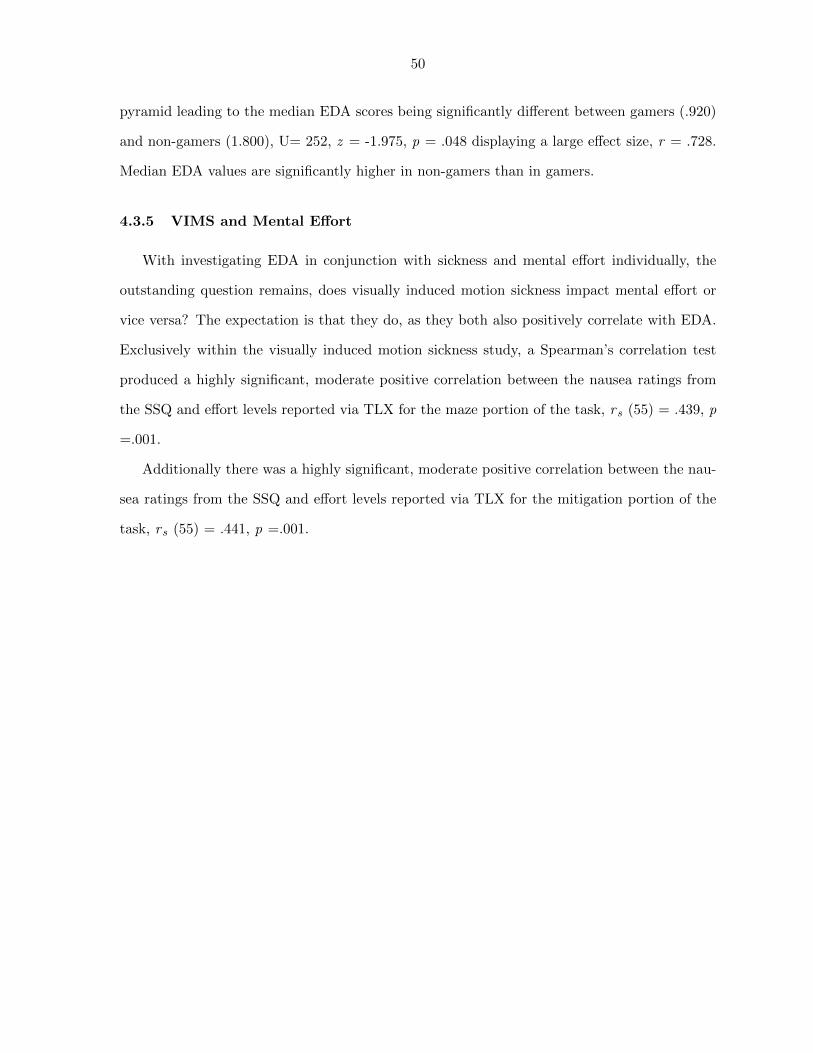
50
pyramid leading to the median EDA scores being significantly different between gamers (.920)
and non-gamers (1.800), U= 252, z = -1.975, p = .048 displaying a large effect size, r = .728.
Median EDA values are significantly higher in non-gamers than in gamers.
4.3.5 VIMS and Mental Effort
With investigating EDA in conjunction with sickness and mental effort individually, the
outstanding question remains, does visually induced motion sickness impact mental effort or
vice versa? The expectation is that they do, as they both also positively correlate with EDA.
Exclusively within the visually induced motion sickness study, a Spearman’s correlation test
produced a highly significant, moderate positive correlation between the nausea ratings from
the SSQ and effort levels reported via TLX for the maze portion of the task, rs (55) = .439, p
=.001.
Additionally there was a highly significant, moderate positive correlation between the nau-
sea ratings from the SSQ and effort levels reported via TLX for the mitigation portion of the
task, rs (55) = .441, p =.001.
51
CHAPTER 5. SUMMARY AND DISCUSSION
5.1 Introduction
This section will interpret the findings in Chapter 4, describe how they relate to existing
research, and note future steps can be taken to further benefit the scientific community. The
first section will follow the results format for ease of reading.
The primary research questions will be addressed:
1) How does mental effort affect electrodermal activity (EDA) for a single user within a con-
trolled environment, performing scenario-based tasks?
2) How does visually induced motion sickness (VIMS) affect electrodermal activity for a sin-
gle user within a controlled environment, performing a scenario-based task? Additionally, can
EDA be used to predict oncoming sickness events?
5.2 Combine Study
The difference in required user input between the more complex Combine Technology 1
(CT1) and less complex Combine Technology 2 (CT2) is visible with CT1 requiring an average
of 13.23 (SE 2.70) more touches on average than CT2 per harvest event. There were 8 potential
harvest events in total. The study was designed in such a way that if a participant determined
that there was no need for adjustment or failed to recognize the cue at the harvest event, no
adjustment would be made. We manipulated overall cognitive load by requiring more input
from the participant with CT1. This type of manipulation is similar to scenarios seen in aviation
training where more complex tasks display higher levels of EDA and have a higher imposed
cognitive load (Wilson, 2002).
52
5.2.1 EDA CT1 vs. CT2
We anticipated that increased mental loading from the increased touch requirements of CT1
would show increased EDA relative to CT2. When EDA is compared between the same harvest
events for both CT1 and CT2, no significant results were found. However, with the exception
of harvest Event 3, participants did display slightly lower EDA values while using CT2. While
results were not significant, an overall decreasing trend in the data can be seen when the average
means for both CT1 and CT2 are displayed side-by-side over time from the initial harvest
event to the final harvest event in Figure 4.2. This decrease in EDA over time represents the
participants increasing comfort with the novel combine technology as participant’s perceived
workload is decreasing (they are repeating similar harvest events). While using CT2, there is
a significant decrease in EDA from Event 2 to Event 4, t (21) = 2.632, p <.016. While other
event-versus-event tests did not yield significant results due to participant numbers (only 10 of
22 participants participated in Event 1 based on the experimental design), the overall trend is
visible in Figure 4.2.
Only Event 1 and Event 4 show a decrease from CT1 to CT2, and this decrease wasn’t
significant. Event 3 specifically had two large outliers which caused an unusually large increase
IC2 EDA data, which is part of the danger of a smaller sample set (n = 22) combined with
potentially high individual differences with biofeedback. A greater discussion surrounding
sample size with respect to biofeedback is addressed in the limitations section.
An explanation for the increase in CT2 EDA for Event 3 may be that CT2 was reacting to
the harvest event in a way that could be perceived by participants as making decisions without
their input. For some participants, there was an “a-ha” moment of recognition of what CT2
actually does after Event 3. This moment of recognition was evidenced by spoken exclamation
and post-survey responses. This initial feeling of lack of control may have led to the higher
Event 3 CT2 EDA and then lower EDA levels for CT2 Event 4.
53
5.2.2 EDA and SEQ Correlation
When EDA is compared with the single ease question (SEQ), higher SEQ values are pre-
dicted to yield lower EDA results. This prediction is based on the assumption that as par-
ticipants gained a better understanding of the technology they were using and rated it higher
(more favorably), their EDA should decrease. The results show that EDA does have this statis-
tical power when related to the SEQ. The SEQ specifically is the subjective Likert scale which
probed the participants’ feelings about the previous harvest event. On a scale of 1-5, with 1
being poor and 5 being ideal, participants’ EDA did decrease as their SEQ ratings increased.
This inverse correlation was strongest (rs (20) = -0.523, p =.0012) within the time participants
were using CT1. This makes sense given the study parameters, while CT1 required more input,
participants had a greater sense of control as the system would respond to their input relatively
quickly. This leads to a stronger correlation of EDA and SEQ ratings.
EDA showed no significant correlation with SEQ responses during the CT2 portion of the
study, but that is to be expected given the nature of CT2. As mentioned before, CT2 required
less (and ideally no) direct input as it was operating primarily without operator interaction. As
the participants were then asked to rate subsequent harvest events, scores were not consistent
given many participants did not realize CT2 was operating without their input until later on
in the study, during or post Event 3.
These results demonstrate a key limitation of using a subjective scale to rate satisfaction.
If participants are not aware of how a system is operating, such as CT2 operating without
their awareness, they will not be able to correctly identify their satisfaction as they may not
appreciate the work that is going on. On the contrary, EDA remains accurate to physiological
behavior with or without the knowledge of one’s surroundings. The obvious downside, as also
seen in this data, is that the confusion and lack of transparency can result in increased levels
of EDA, even when mental effort (and overall cognitive load) has been decreased, such is in
the case of Event 3 with CT2. This still allows the base premise of EDA reflecting mental
effort levels to exist as participants did have higher mental effort levels in those moments of
uncertainty. The primary difficulty then is pinpointing where that mental workload is coming
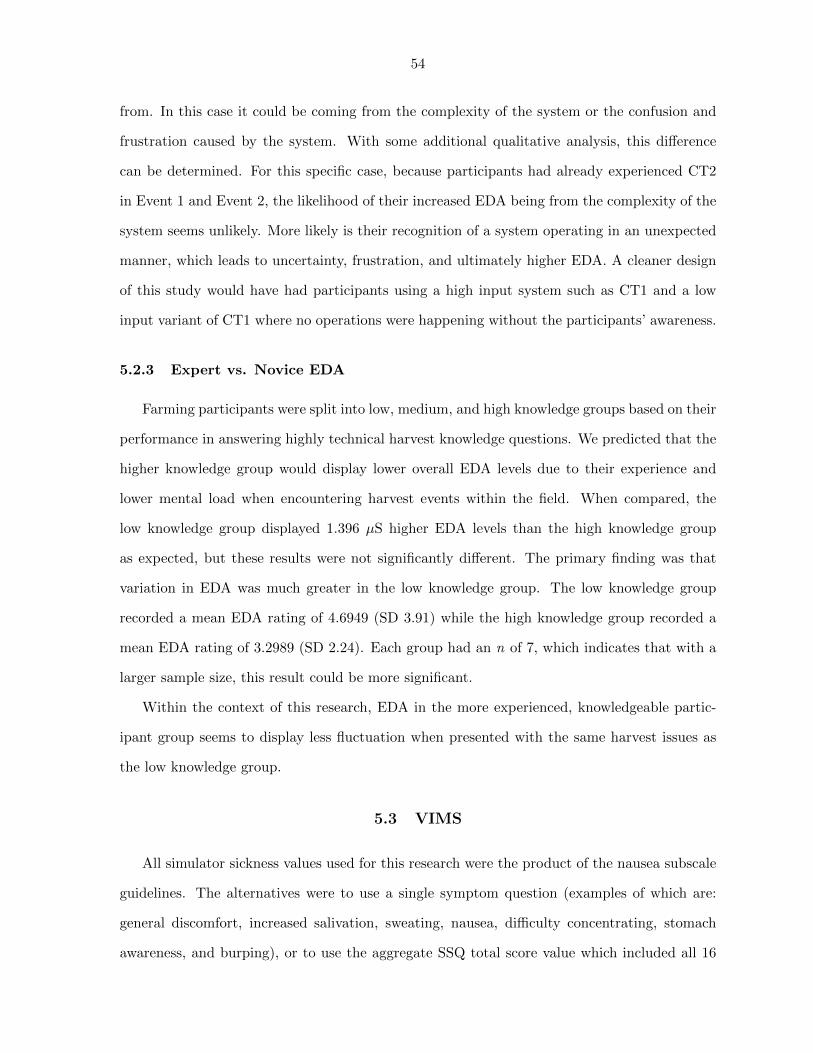
54
from. In this case it could be coming from the complexity of the system or the confusion and
frustration caused by the system. With some additional qualitative analysis, this difference
can be determined. For this specific case, because participants had already experienced CT2
in Event 1 and Event 2, the likelihood of their increased EDA being from the complexity of the
system seems unlikely. More likely is their recognition of a system operating in an unexpected
manner, which leads to uncertainty, frustration, and ultimately higher EDA. A cleaner design
of this study would have had participants using a high input system such as CT1 and a low
input variant of CT1 where no operations were happening without the participants’ awareness.
5.2.3 Expert vs. Novice EDA
Farming participants were split into low, medium, and high knowledge groups based on their
performance in answering highly technical harvest knowledge questions. We predicted that the
higher knowledge group would display lower overall EDA levels due to their experience and
lower mental load when encountering harvest events within the field. When compared, the
low knowledge group displayed 1.396 µS higher EDA levels than the high knowledge group
as expected, but these results were not significantly different. The primary finding was that
variation in EDA was much greater in the low knowledge group. The low knowledge group
recorded a mean EDA rating of 4.6949 (SD 3.91) while the high knowledge group recorded a
mean EDA rating of 3.2989 (SD 2.24). Each group had an n of 7, which indicates that with a
larger sample size, this result could be more significant.
Within the context of this research, EDA in the more experienced, knowledgeable partic-
ipant group seems to display less fluctuation when presented with the same harvest issues as
the low knowledge group.
5.3 VIMS
All simulator sickness values used for this research were the product of the nausea subscale
guidelines. The alternatives were to use a single symptom question (examples of which are:
general discomfort, increased salivation, sweating, nausea, difficulty concentrating, stomach
awareness, and burping), or to use the aggregate SSQ total score value which included all 16
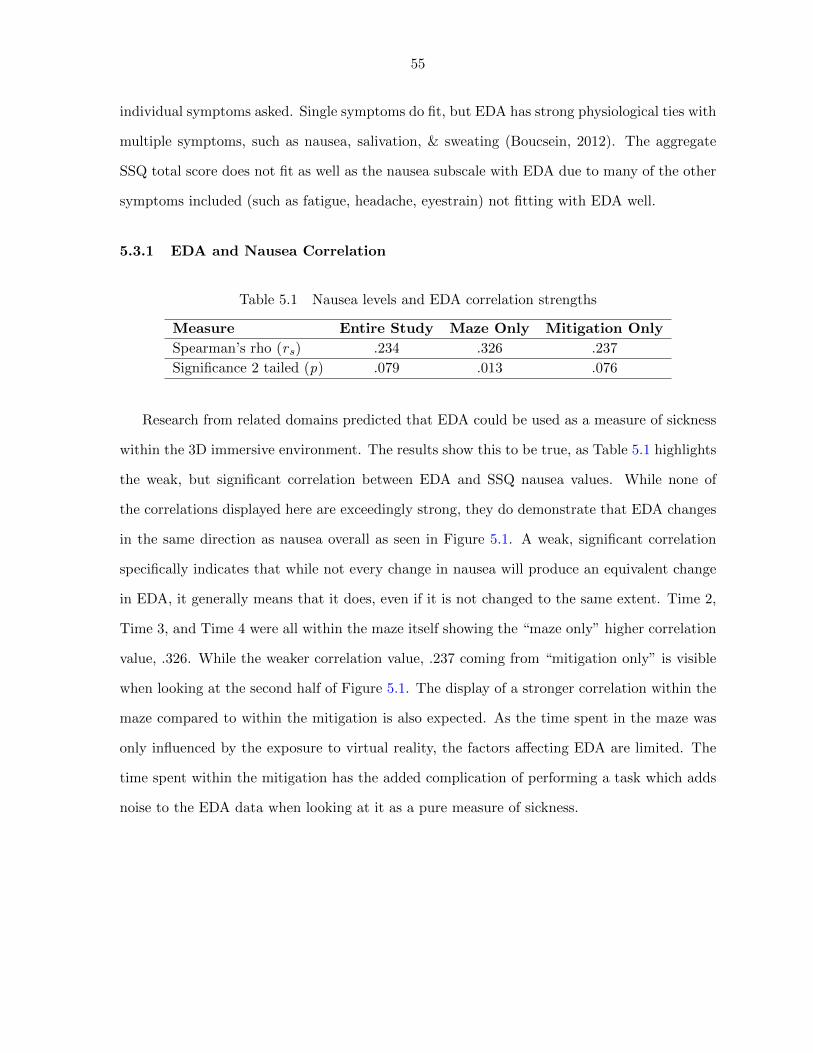
55
individual symptoms asked. Single symptoms do fit, but EDA has strong physiological ties with
multiple symptoms, such as nausea, salivation, & sweating (Boucsein, 2012). The aggregate
SSQ total score does not fit as well as the nausea subscale with EDA due to many of the other
symptoms included (such as fatigue, headache, eyestrain) not fitting with EDA well.
5.3.1 EDA and Nausea Correlation
Table 5.1 Nausea levels and EDA correlation strengths
Measure Entire Study Maze Only Mitigation Only
Spearman’s rho (rs) .234 .326 .237
Significance 2 tailed (p) .079 .013 .076
Research from related domains predicted that EDA could be used as a measure of sickness
within the 3D immersive environment. The results show this to be true, as Table 5.1 highlights
the weak, but significant correlation between EDA and SSQ nausea values. While none of
the correlations displayed here are exceedingly strong, they do demonstrate that EDA changes
in the same direction as nausea overall as seen in Figure 5.1. A weak, significant correlation
specifically indicates that while not every change in nausea will produce an equivalent change
in EDA, it generally means that it does, even if it is not changed to the same extent. Time 2,
Time 3, and Time 4 were all within the maze itself showing the “maze only” higher correlation
value, .326. While the weaker correlation value, .237 coming from “mitigation only” is visible
when looking at the second half of Figure 5.1. The display of a stronger correlation within the
maze compared to within the mitigation is also expected. As the time spent in the maze was
only influenced by the exposure to virtual reality, the factors affecting EDA are limited. The
time spent within the mitigation has the added complication of performing a task which adds
noise to the EDA data when looking at it as a pure measure of sickness.
56
Figure 5.1 Raw SSQ and EDA values averaged for all participants, n = 57.
5.3.2 EDA as a Predictor of Nausea
In addition to investigating EDA as a measure of sickness, it is expected that EDA should
be able to be used as a potential predictor of high sickness and potentially even preemptively
stop an oncoming sickness event during a virtual reality experience. When EDA was compared
with the nausea ratings given from the SSQ in an ordinal regression model, the model did not
fit, so results displayed were unreliable. Despite not having a predictive model, EDA can still
be monitored in real time and could be used as an indicator for researchers of their participants’
health status if they are not voluntarily giving that information.
5.3.3 EDA and Mental Effort Correlation
If EDA is to be seen as a reliable measure of mental effort, the comparison to be made is
between EDA and a traditional measure of effort, such as the NASA TLX. Specifically using
57
the effort subscale from the TLX, it can be expected that as reported effort levels increase,
there will also be an increase in EDA. This section of the analysis ignored participants who
completed the virtual variations of mitigation as prolonged exposure to virtual environments
causes increased sickness and EDA levels. Of the 31 participants who completed the physical
mitigation scenario, there was a weak positive correlations between reported effort and EDA.
Looking at the shape of the data in Figure 5.2, the means do show an slight decrease in EDA
as effort decreases from maze to mitigation, as the significant correlation previously suggested.
Figure 5.2 Average effort ratings paired with EDA in the same time frames, n = 57.
5.3.4 EDA Gamers vs. Non-gamers
Similar to the expert vs. novice split for the participants in the combine simulator study,
the visually induced motion sickness study had potential differences based on the grouping
variable of “gamers” vs. “non-gamers.” Gamers were expected to exhibit lower overall EDA
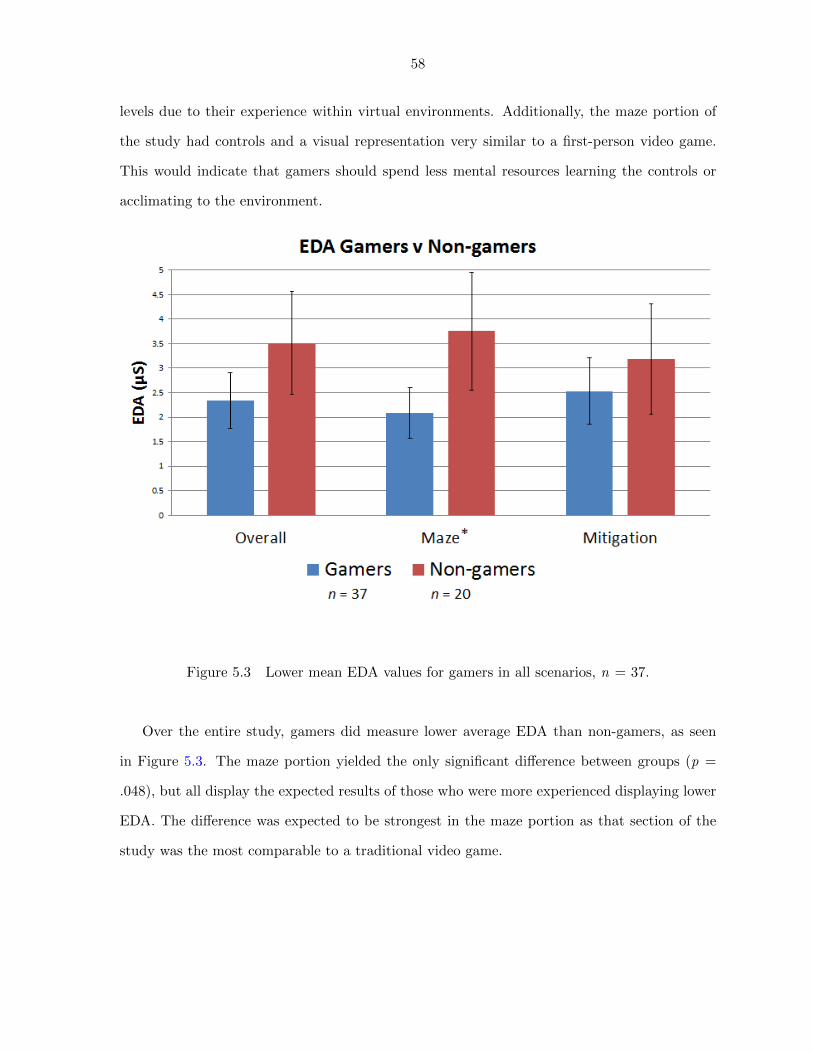
58
levels due to their experience within virtual environments. Additionally, the maze portion of
the study had controls and a visual representation very similar to a first-person video game.
This would indicate that gamers should spend less mental resources learning the controls or
acclimating to the environment.
Figure 5.3 Lower mean EDA values for gamers in all scenarios, n = 37.
Over the entire study, gamers did measure lower average EDA than non-gamers, as seen
in Figure 5.3. The maze portion yielded the only significant difference between groups (p =
.048), but all display the expected results of those who were more experienced displaying lower
EDA. The difference was expected to be strongest in the maze portion as that section of the
study was the most comparable to a traditional video game.
59
5.3.5 VIMS and Mental Effort
After investigating whether EDA had a meaningful relationship with both VIMS and mental
effort, the last leg in that triangle would naturally be to compare whether sickness and mental
effort have a meaningful relationship to each other. We expected that sickness and mental
effort would also have a positive relationship based on the previous results that both aspects
individually positively correlate with EDA. This turns out to be true in the VIMS study, as
both reported nausea levels and reported effort levels displayed highly significant, moderate
correlations for both maze, rs (55) = .439, p =.001 and mitigation, rs (55) = .441, p =.001.
This information can be used to help inform future virtual environment design to balance
between difficulty (mental load) and visually induced sickness factors to create a scenario which
never pushes a user over their limits, as participants seem to be more prone to sickness if they are
already mentally loaded. An example of applying this design principle would be to not require
much mental effort on the part of the player when experiencing drastic graphical changes, or
to limit mentally difficult challenges to areas which have little excessive visual stimuli.
5.4 Limitations
The primary limitation of this research was in determining what measure EDA is going to
provide. EDA can be used to measure multiple phenomena at one time, but it likely will not
provide any of those measures well or reliably if done simultaneously. A specific example of what
not to do would be to manipulate both mental load and visually induced motion sickness within
the same study at the same time and then claim EDA as a measure of each individually. To
most effectively use EDA (and other biofeedback), consideration must be taken when deciding
what construct it will be used to measure.
An additional area of concern is whether external factors to the study at hand can influence
biofeedback data collected, such as whether or not a participant was nervous and displayed
uncharacteristically high data. When looking at EDA data specifically, a natural return to
baseline happens in most participant data, which indicates most people become comfortable
with the research scenario to a greater or lesser degree. In the case of the combine simulator
60
study, only one participant out of 22 had an abnormally high EDA level that never fully
returned to baseline; this participant was an outlier.
Key limitations of the research in the combine simulator were the low sample size used
based on a small population of farmers with requisite experience and additionally the lack of
a direct mental effort subjective scale question. Key limitations of the research in the visually
induced motion sickness study were a high number of independent variables, which ultimately
gave lower than ideal sample sizes to investigate very specific subgroups of the participant
body. Also, this study would have benefited from a low and high mental load condition which
did not immediately follow a sickness event. However, the results provide an opportunity for
future work to continue working toward a clearer picture of how EDA and other biofeedback
measures can be used.
A limitation of any biofeedback research is sample size, as human biofeedback very high
individual differences. Higher sample sizes help combat that issue. A second limitation of
biofeedback research is also the baseline process. It can be a limitation of research if participants
give poor baseline numbers due to the fact that they have increased arousal rates purely from
being involved in a research study. A potential solution would be help participants feel more
relaxed by way of entertainment (television, reading) or perhaps increase the length of the
baseline period to give an opportunity for relaxation.
5.5 Related Work
EDA has been used in related biofeedback work and shares some of the same affordances
of Electroencephalography (EEG) specifically. EEG has been successfully used to measure
cognitive load in research applications alongside EDA (Wilson, 2002; Gevins et al., 1998; Haa-
palainen et al., 2010). While both measures have been used successfully, the primary points
of differentiation are threefold. First, EEG studies are generally more constrained due to the
fact that the EEG hardware is physically cumbersome and reduces physical movement options
because of its design relative to wearing an EDA wristband. The second point of differentiation
is that EEG requires additional work to setup, calibrate, and interpret the data after the study.
Lastly, EEG potentially offers higher levels of data complexity and detail which can result in
61
additional findings, but at the cost of the first two items. Within this work, the cost of EEG
outweighs the benefits and needs of the research objectives.
5.6 Conclusions
This research aimed to address two primary questions:
1) How does mental effort affect electrodermal activity (EDA) for a single user within a con-
trolled environment, performing scenario-based tasks?
2) How does visually induced motion sickness (VIMS) affect electrodermal activity for a sin-
gle user within a controlled environment, performing a scenario-based task? Additionally, can
EDA be used to predict oncoming sickness events?
For the first question, mental effort did affect EDA for an individual. While the correlation
values were very weak to moderate, they did show that EDA changes matched the overall
valence of change of the respective self-report metric, the NASA-TLX. For the second question,
visually induced motion sickness also impacted EDA for an individual. Again, the correlation
values were very weak to moderate, and they did match the overall change in valence as sickness
levels rose and fell with respect to the self-report metric, the SSQ. Additionally, EDA was not
determined to be a successful predictor of oncoming sickness events with this data set.
The overall conclusion from this research is that EDA is a useful secondary measure of
both mental effort and visually induced motion sickness within their respective environments.
A secondary measure being defined as a valid measure of a particular metric (such as mental
effort), but not the most used or most reliable for general use. The reason this is promoted
as a secondary measure is threefold. 1) While EDA does have a meaningful relationship with
mental effort and sickness, the results shown here and in other research indicates a moderate,
but not strong relationship. 2) All existing work within these respective domains has primarily
been done using self-report scales such as the SSQ and NASA TLX. To be able to directly
compare future work to past work, these scales will continue to see use when applicable. 3)
Biofeedback data require additional analysis and benefits from larger sample sizes more than
self-report based on the nature of the data itself, (e.g. self-report may be a 5-point scale so
variance is constrained where EDA is on an continuous spectrum and has the potential for

62
outliers). These three reasons support EDA as a useful measure, but acknowledge that it has
specific limitations.
Three primary reasons for using EDA in related research: 1) There are many research
scenarios in which interrupting a participant to ask a self-report question during a task is not
only disruptive, but impossible. These scenarios greatly benefit from the background data
collection process at which EDA excels by not interrupting or impeding participant actions. 2)
EDA and other biofeedback can be used to validate self-report metrics. Due to the subjective
nature of self-report, a small sample size pilot study has the potential to give you false initial
findings if participants are giving you the results you wish to see, knowingly or not. EDA helps
circumvent perceived individual differences by providing data which is much less prone to the
Hawthorne effect (Mayo and Dooley, 1968). 3) Last, yet most importantly, future behavioral
and biofeedback tracking technology is rapidly advancing and therefore it merits careful study
in order to use it properly. As more and more individuals begin to track their physiological data
and want to make meaning from their numbers, this research will shape how that interpretation
takes place.
5.7 Future Research
Future work includes constructing a template for the “process of biofeedback use in research”
so that others can begin to include biofeedback, specifically EDA, in their research where
applicable. This template would be designed to 1) determine if biofeedback is a fit for one’s
study, 2) outline what steps need to be taken to properly take advantage of biofeedback, and 3)
provide rationale as to why procedures exist the way they do and point to resources available
for additional information. This template could then be adapted to other forms of biofeedback
or specified for other research domains.
The proper next step to continue improving EDA as a measure of both mental effort and
sickness would be to perform a study with a 2x2 design which investigated both low and high
sickness inducing environments in tandem with low and high mental load tasks. This would
give a cleaner picture as to how the effects of both mental effort and sickness interact in addition
to giving improved EDA measurements.
63
APPENDIX A. Study Materials
A.1 Simulator Sickness Questionnaire
SSQ questions and scoring from Kennedy et al. (1993).
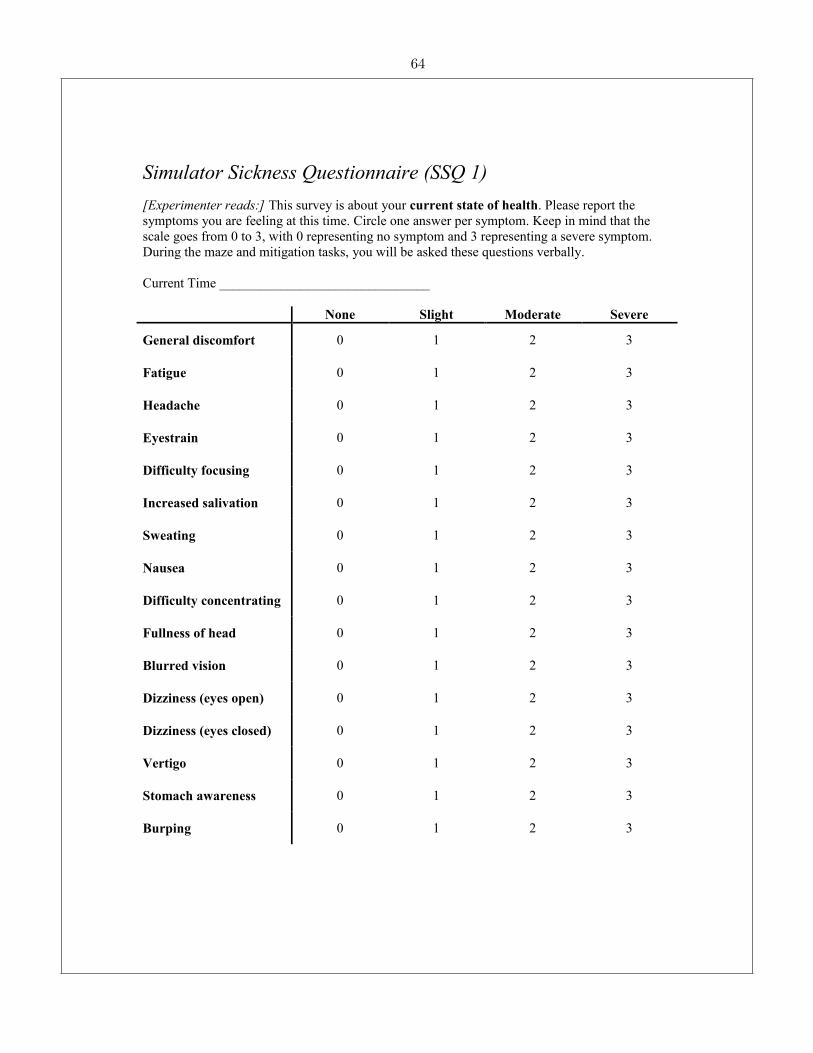
Simulator Sickness Questionnaire (SSQ 1)
[Experimenter reads:] This survey is about your current state of health. Please report the
symptoms you are feeling at this time. Circle one answer per symptom. Keep in mind that the
scale goes from 0 to 3, with 0 representing no symptom and 3 representing a severe symptom.
During the maze and mitigation tasks, you will be asked these questions verbally.
Current Time _______________________________
None Slight Moderate Severe
General discomfort 0 1 2 3
Fatigue 0 1 2 3
Headache 0 1 2 3
Eyestrain 0 1 2 3
Difficulty focusing 0 1 2 3
Increased salivation 0 1 2 3
Sweating 0 1 2 3
Nausea 0 1 2 3
Difficulty concentrating 0 1 2 3
Fullness of head 0 1 2 3
Blurred vision 0 1 2 3
Dizziness (eyes open) 0 1 2 3
Dizziness (eyes closed) 0 1 2 3
Vertigo 0 1 2 3
Stomach awareness 0 1 2 3
Burping 0 1 2 3
64
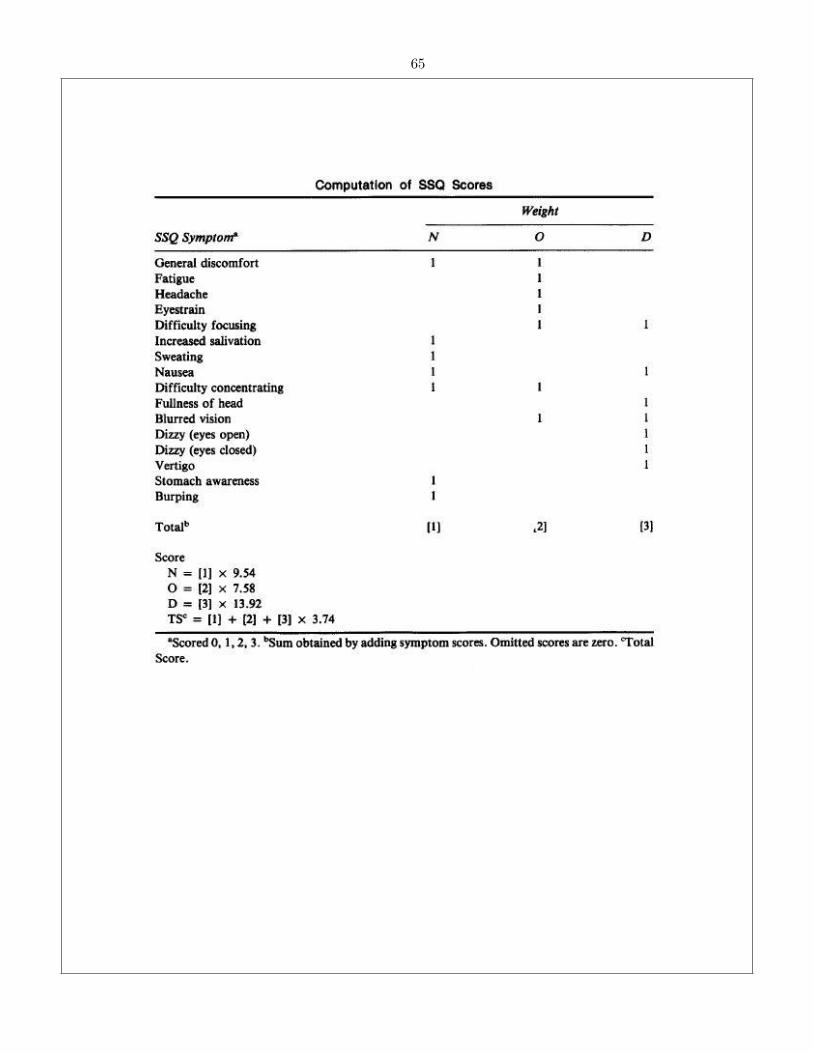
65

66
A.2 NASA Task Load Index
NASA-TLX questionnaire from Hart and Staveland (1988).

NASA Task Load Index (TLX)
[Experimenter reads:] The NASA-TLX consists of six rating scales. Each scale represents an
individual workload descriptor: mental demand, physical demand, temporal demand, performance,
effort, and frustration. Place an ‘X’ along each of the six scales indicating the place along the
index that best describes your workload for the trial immediately preceding the
administration of the rating scales. Be sure to note the descriptions associated with each of the
scales. Performance has “good” on the left and “poor” on the right, while the rest of the scales
have “low” and high” as endpoints. Accompanying the ratings scales is a description of each of
the measures. Read the descriptions in order to familiarize yourself with the meanings of the
workload descriptors.
Mental Demand – how much mental effort is required to perform the task (e.g., thinking,
deciding, remembering)
Physical Demand – how much physical effort is required to perform the task (e.g., pushing,
pulling, reaching, stretching)
Temporal Demand – how much time pressure you feel to complete the task (e.g., relaxed
pace or fast and furious?)
Performance – how successful you feel you are in completing the task
Effort – how hard you work to complete the task
Frustration – how aggravated or annoyed versus secure or content you feel about
accomplishing the task.
67

Please complete this task load index, keeping in mind that you are rating the workload of sitting
here.
Current Time _______________________________
Mental Demand Low High
Physical Demand Low High
Temporal Demand Low High
Performance Good Poor
Effort Low High
Frustration Low High
68

69
REFERENCES
Boucsein, W. (2012). Electrodermal Activity. Springer, Wuppertal, Germany, 2nd edition.
Bowman, D. A. and McMahan, R. P. (2007). Virtual reality: how much immersion is enough?
Computer, 40(7):36–43.
Broadbent, D. E. (1958). Perception and communication. Pergamon Press, Inc, Elmsford, New
York.
Brookhuis, K., de Vries, G., and de Waard, D. (1991). The effects of mobile telephoning on
driving performance. Accident Analysis & Prevention, 23(4):309–316.
Brooks, J. O., Goodenough, R. R., Crisler, M. C., Klein, N. D., Alley, R. L., Koon, B. L.,
Logan, W. C., Ogle, J. H., Tyrrell, R. a., and Wills, R. F. (2010). Simulator sickness during
driving simulation studies. Accident; analysis and prevention, 42(3):788–96.
Brown, J. D. and Huffman, W. J. (1972). Psychophysiological measures of drivers under actual
driving conditions. Journal of Safety Research, 4(4):172–178.
Card, S. K., Moran, T. P., and Newell, A. (1986). The model human processor: an engineering
model for human performance. In Boff, K. K. L. and Thomas, J., editors, Handbook of
perception and human performance, volume 2, chapter 45, pages 1–35. Wiley and Sons, New
York, New York.
Chase, W. and Simon, H. (1973). Perception in chess. Cognitive psychology, 61:55–61.
Chung, S. C., You, J. H., Kwon, J. H., Lee, B., Tack, G. R., Yi, J. H., and Lee, S. Y. (2006).
Differences in psychophysiological responses due to simulator sickness sensitivity. In World
Congress on Medical Physics and Biomedical Engineering, pages 1218–1221.
70
Cohen, J. (1992). A power primer. Psychological bulletin, 112(1):155–159.
Conover, W. J. (1999). Practical Nonparametric Statistics. Wiley and Sons, New York, New
York, 3rd edition.
Dong, X., Yoshida, K., and Stoffregen, T. A. (2011). Control of a virtual vehicle influences pos-
tural activity and motion sickness. Journal of experimental psychology. Applied, 17(2):128–38.
Evans, J. D. (1996). Straightforward Statistics for the Behavioral Sciences. Brooks/Cole Pub-
lishing Company, Pacific Grove, California.
Fere, C. (1888). Note sur les modifications de la resistance electrique sous l’influence des
excitations sensorielles et des emotions. CR Soc. Biol, 5:217–219.
Fowles, D. C., Christie, M. J., Edelberg, R., Grings, W. W., Lykken, D. T., and Venables, P. H.
(1981). Committee report. Publication recommendations for electrodermal measurements.
Psychophysiology, 18(3):232–9.
Gevins, A., Smith, M. E., Leong, H., McEvoy, L., Whitfield, S., Du, R., and Rush, G. (1998).
Monitoring Working Memory Load during Computer-Based Tasks with EEG Pattern Recog-
nition Methods. Human Factors: The Journal of the Human Factors and Ergonomics Society,
40(1):79–91.
Haapalainen, E., Kim, S., Forlizzi, J. F., and Dey, A. K. (2010). Psycho-physiological mea-
sures for assessing cognitive load. Proceedings of the 12th ACM international conference on
Ubiquitous computing - Ubicomp ’10, page 301.
Hart, S. G. and Staveland, L. E. (1988). Development of NASA-TLX (Task Load Index):
Results of empirical and theoretical research. Human mental workload, 1:139–183.
Helander, M. (1978). Applicability of drivers’ electrodermal response to the design of the traffic
environment. Journal of applied Psychology, 63(4):481.
Kahneman, D. (1973). Attention and Effort, volume 88. Prentice Hall, Englewood Cliffs, New
Jersey.

71
Kennedy, R. S., Drexler, J., and Kennedy, R. C. (2010). Research in visually induced motion
sickness. Applied ergonomics, 41(4):494–503.
Kennedy, R. S., Lane, N. E., Berbaum, K. S., and Lilienthal, M. G. (1993). Simulator Sickness
Questionnaire: An Enhanced Method for Quantifying Simulator Sickness. The International
Journal of Aviation Psychology, 3(3):203–220.
Kolasinski, E. (1995). Simulator Sickness in Virtual Environments. Technical report, United
States Army Research Institute for the Behavioral and Social Sciences, Orlando, FL.
Krug, S. (2009). Rocket Surgery Made Easy. New Riders, Berkeley, California.
Law, E., Roto, V., Kort, J., Technology, C., Hassenzahl, M., and Psychology, E. (2008). To-
wards a Shared Definition of User Experience. pages 2395–2398.
Lee, J. D., Caven, B., Haake, S., and Brown, T. L. (2001). Speech-Based Interaction with
In-Vehicle Computers: The Effect of Speech-Based E-Mail on Drivers’ Attention to the
Roadway. Human Factors: The Journal of the Human Factors and Ergonomics Society,
43(4):631–640.
Lee, Y.-c., Lee, J. D., and Boyle, L. N. (2005). Change detection performance under divided
attention with dynamic driving scenarios. In Proceedings of the Third International Driving
Symposium on Human Factors in Driver Assessment, Training and Vehicle Design, pages
195–201.
Lee, Y.-C., Lee, J. D., and Ng Boyle, L. (2009). The Interaction of Cognitive Load and
Attention-Directing Cues in Driving. Human Factors: The Journal of the Human Factors
and Ergonomics Society, 51(3):271–280.
Lim, J., Reiser, R. a., and Olina, Z. (2008). The effects of part-task and whole-task instructional
approaches on acquisition and transfer of a complex cognitive skill. Educational Technology
Research and Development, 57(1):61–77.
Marieb, E. (2003). Human Anatomy and Physiology. Pearson Education, New York, New York,
sixth edition.
72
Mayo, S. T. and Dooley, R. J. (1968). Book Reviews : Desmond L. Cook. The Impact of
the Hawthorne Effect in Experimental Designs in Educational Research. U.S. Department
of Health, Education, and Welfare, Office of Education, Project No. 1757. Columbus, Ohio:
Ohio State University, 1967. Pp. . Educational and Psychological Measurement, 28(4):1255–
1259.
Meehan, M., Razzaque, S., Whitton, M., and Brooks, F. (2003). Effect of latency on presence in
stressful virtual environments. In IEEE Virtual Reality, 2003. Proceedings., pages 141–148.
IEEE Comput. Soc.
Merletti, R. and Parker, P. J. (2004). Electromyography: Physiology, Engineering, and Non-
Invasive Applications. Wiley-IEEE Press, Hoboken, New Jersey.
Michaels, R. M. (1962). Effect of expressway design on driver tension responses. Highway
Research Board Bulletin, 31:107–112.
Michon, J. (1986). Human Behavior and Traffic Safety. Springer US, Boston, MA.
Moroney, W., Biers, D., Eggemeier, F., and Mitchell, J. (1992). A comparison of two scoring
procedures with the NASA task load index in a simulated flight task. Proceedings of the
IEEE 1992 National Aerospace and Electronics Conference@m NAECON 1992.
Neumann, E. and Blanton, R. (1970). The early history of electrodermal research. Psychophys-
iology, 6(4):453–475.
Norman, D. A. and Bobrow, D. G. (1975). On data-limited and resource-limited processes.
Cognitive Psychology, 7(1):44–64.
Nourbakhsh, N., Wang, Y., and Chen, F. (2013). Human-Computer Interaction INTERACT
2013, volume 8117 of Lecture Notes in Computer Science. Springer Berlin Heidelberg, Berlin,
Heidelberg.
O’Hanlon, J. and McCauley, M. (1973). Motion sickness incidence as a function of the frequency
and acceleration of vertical sinusoidal motion. Journal of Sound and Vibration, 41(4):521.
73
Paas, F., Tuovinen, J. E., Tabbers, H., and Van Gerven, P. W. M. (2003). Cognitive Load
Measurement as a Means to Advance Cognitive Load Theory. Educational Psychologist,
38(1):63–71.
Paas, F. G. W. C. and Van Merrienboer, J. J. G. (1994). Variability of worked examples
and transfer of geometrical problem-solving skills: A cognitive-load approach. Journal of
Educational Psychology, 86(1):122–133.
Pausch, R. and Crea, T. (1992). A Literature Survey for Virtual Environments: Military Flight
Simulator Visual Systems and Simulator Sickness. Presence, 1(3):344–363.
Posner, M. I. (1980). Orienting of attention. The Quarterly journal of experimental psychology,
32(1):3–25.
Sauro, J. and Dumas, J. S. (2009). Comparison of three one-question, post-task usability
questionnaires. In Proceedings of the 27th international conference on Human factors in
computing systems - CHI 09, page 1599, New York, New York, USA. ACM Press.
Schneider, W. and Shiffrin, R. M. (1977). Controlled and automatic human information pro-
cessing: I. Detection, search, and attention. Psychological Review, 84(1):1–66.
Schwartz, M. S. and Andrasik, F. E. (2012). Biofeedback: A Practitioner’s Guide. Guilford
Press, New York, New York.
Setz, C., Arnrich, B., Schumm, J., La Marca, R., Troster, G., and Ehlert, U. (2010). Dis-
criminating stress from cognitive load using a wearable EDA device. IEEE transactions on
information technology in biomedicine : a publication of the IEEE Engineering in Medicine
and Biology Society, 14(2):410–7.
Sherman, W. R. and Craig, A. B. (2003). Understanding Virtual Reality. Morgan Kaufmann,
San Francisco, California.
Shiffrin, R. and Schneider, W. (1977). Controlled and automatic human information processing:
II. Perceptual learning, automatic attending and a general theory. Psychological review,
84(2):127–190.
74
So, R. H. Y., Lo, W. T., and Ho, A. T. K. (2001). Effects of Navigation Speed on Motion
Sickness Caused by an Immersive Virtual Environment. Human Factors: The Journal of the
Human Factors and Ergonomics Society, 43(3):452–461.
Sweller, J. (1988). Cognitive load during problem solving: Effects on learning. Cognitive
Science, 12(2):257–285.
Taylor, D. H. (1964). Drivers’ galvanic skin response and the risk of accident. Ergonomics,
7(4):439–451.
Tullis, T. and Albert, B. (2010). Measuring the user experience: collecting, analyzing, and
presenting usability metrics. Morgan Kaufmann, Burlington, Massachusetts.
Tzallas, A. (2009). Epileptic seizure detection in EEGs using timefrequency analysis. Infor-
mation Technology in . . . , 13(5):703–10.
van Dooren, M., de Vries, J. J. G. G.-J., and Janssen, J. H. (2012). Emotional sweating across
the body: comparing 16 different skin conductance measurement locations. Physiology &
behavior, 106(2):298–304.
Waard, D. D. (1996). The measurement of drivers’ mental workload. Dissertation, RIJKSUNI-
VERSITEIT GRONINGEN, Oxford.
Warwick-Evans, L. A. (1987). Electrodermal activity as an index of motion sickness. Aviat
Space Environ Med, 58(5):417–23.
Warwick-Evans, L. A., Symons, N., Fitch, T., and Burrows, L. (1998). Evaluating sensory
conflict and postural instability. Theories of motion sickness. 1Brain research bulletin, 47:465–
469.
Wickens, C. D. (2008). Multiple Resources and Mental Workload. Human Factors: The Journal
of the Human Factors and Ergonomics Society, 50(3):449–455.
Wickens, C. D., Lee, J. D., Liu, Y., and Gordon Becker, S. E. (2003). Human Factors Engi-
neering. Prentice Hall, Upper Saddle River, New Jersey, 2nd edition.

75
Wilson, G. F. (2002). An Analysis of Mental Workload in Pilots During Flight Using Multiple
Psychophysiological Measures. The International Journal of Aviation Psychology, 12(1):3–18.
Witmer, B. G. and Singer, M. J. (1998). Measuring Presence in Virtual Environments : A
Presence Questionnaire. Presence, 7(3):225–240.
Zeier, H. (1979). Concurrent physiological activity of driver and passenger when driving with
and without automatic transmission in heavy city traffic. Ergonomics, 22(7):799–810.