An effort and time based measure of usability
6
Accepted to 6 th Workshop on Software Quality, 30th International Conference on Software Engineering, 2008. An Effort and Time Based Measure of Usability Dan Tamir Texas State University San Marcos, TX 78666 01-512-245-7528 [email protected] Oleg Komogortsev Texas State University San Marcos, TX 78666 01-512-245-0349 [email protected] Carl J. Mueller Texas State University San Marcos, TX 78666 01-512-245-8344 [email protected] ABSTRACT The hypothesis of this research is that usability relates to the physical effort that is required in order to use software in the accomplishment of interactive tasks. The implications of this hypothesis are significant since effort is an objective quantity that can be measured efficiently in a relatively non-expensive and non-invasive fashion. Based on this hypothesis, this work proposes metrics for measuring operability, learnability, and understandability. Usability testing is an essential element of a robust validation process. Nevertheless, evaluating software usability is an expensive and time consuming activity, frustrating both developers and managers. Developers are frustrated because it is a critical part of their work; yet, they do not have solid information on how to address it. Managerial frustration lies in the fact that correcting usability defects is an iterative process, and the amount of preparation required can significantly delay a project. Hence, wider utilization of usability testing requires reducing the cost and simplifying the approach. This paper proposes a framework for measuring effort and using the effort measurements to assess usability. The framework has two main components: One, bases effort on keystrokes and mouse usage; the second uses a model of the eye muscles along with eye-movement tracking to estimate eye effort. The two components are independent, but they could be used in tandem. Tracking time and effort may not be as precise an evaluation of usability. Nevertheless, it can provide a good screening tool to reduce development cost. CATEGORIES AND SUBJECT DESCRIPTORS D.2.4 [Software/Program Verification]: Software/Program Verification - Validation GENERAL TERMS Measurement, Human Factors, Verification, Testing KEYWORDS Quality, Metrics, Validation, Usability, Operability, Learnability, Understandability 1. INTRODUCTION Anyone who has ever used a computer can provide a “top ten list” of web sites and programs that are not user-friendly. Poor software usability not only causes user dissatisfaction but also can lead to substantial development cost overruns [10]. Software developers can use a wide variety of tools (prototyping, inspection, usability testing, iterative processes, etc. [11]) to assure the software they produce has good usability. The fact that so many systems present poor usability may point to the conclusion that these techniques do not address the problem efficiently. Furthermore, the challenges presented by usability issues may not lie solely in the tools and techniques used in the development process. Software usability is perceived as a highly subjective attribute of software quality since physiological and psychological characteristics and sociological conditioning heavily influences it. This quality attribute is heavily affected by factors that many software engineers are not familiar with can make them uncomfortable with the entire topic. Our work proposes an objective methodology that can lead to efficient and relatively non- expensive assessment of usability. Because it includes a subjective quality attribute, an evaluation of software usability requires observing a number of human subjects using the system. Interpreting these observations necessitates the need of adding a psychologist to the testing team. Some developers do not view usability testing as productive evaluation, because these evaluations usually indicates general area where the subjects had problems and does not necessarily point to a specific solution. This can make developers and managers extremely frustrated, especially when faced with short project deadlines and no way to determine how much time and effort are required to increase the usability. Because of the uncertainty and expense of usability evaluations, some managers are reluctant to include formal usability testing in the development plan. Instead of using testing, these managers prefer to rely on best practices, templates, and inspection to establish software usability.
Transcript of An effort and time based measure of usability

Accepted to 6th Workshop on Software Quality, 30th International Conference on Software Engineering, 2008.
An Effort and Time Based Measure of Usability
Dan Tamir Texas State University
San Marcos, TX 78666
01-512-245-7528
Oleg Komogortsev Texas State University
San Marcos, TX 78666
01-512-245-0349
Carl J. Mueller Texas State University
San Marcos, TX 78666
01-512-245-8344
ABSTRACT The hypothesis of this research is that usability relates to the
physical effort that is required in order to use software in the
accomplishment of interactive tasks. The implications of this
hypothesis are significant since effort is an objective quantity
that can be measured efficiently in a relatively non-expensive
and non-invasive fashion. Based on this hypothesis, this work
proposes metrics for measuring operability, learnability, and
understandability.
Usability testing is an essential element of a robust validation
process. Nevertheless, evaluating software usability is an
expensive and time consuming activity, frustrating both
developers and managers. Developers are frustrated because it
is a critical part of their work; yet, they do not have solid
information on how to address it. Managerial frustration lies in
the fact that correcting usability defects is an iterative process,
and the amount of preparation required can significantly delay a
project. Hence, wider utilization of usability testing requires
reducing the cost and simplifying the approach.
This paper proposes a framework for measuring effort and using
the effort measurements to assess usability. The framework has
two main components: One, bases effort on keystrokes and
mouse usage; the second uses a model of the eye muscles along
with eye-movement tracking to estimate eye effort. The two
components are independent, but they could be used in tandem.
Tracking time and effort may not be as precise an evaluation of
usability. Nevertheless, it can provide a good screening tool to
reduce development cost.
CATEGORIES AND SUBJECT
DESCRIPTORS D.2.4 [Software/Program Verification]: Software/Program
Verification - Validation
GENERAL TERMS Measurement, Human Factors, Verification, Testing
KEYWORDS Quality, Metrics, Validation, Usability, Operability,
Learnability, Understandability
1. INTRODUCTION Anyone who has ever used a computer can provide a “top ten
list” of web sites and programs that are not user-friendly. Poor
software usability not only causes user dissatisfaction but also
can lead to substantial development cost overruns [10].
Software developers can use a wide variety of tools
(prototyping, inspection, usability testing, iterative processes,
etc. [11]) to assure the software they produce has good usability.
The fact that so many systems present poor usability may point
to the conclusion that these techniques do not address the
problem efficiently. Furthermore, the challenges presented by
usability issues may not lie solely in the tools and techniques
used in the development process. Software usability is
perceived as a highly subjective attribute of software quality
since physiological and psychological characteristics and
sociological conditioning heavily influences it. This quality
attribute is heavily affected by factors that many software
engineers are not familiar with can make them uncomfortable
with the entire topic. Our work proposes an objective
methodology that can lead to efficient and relatively non-
expensive assessment of usability.
Because it includes a subjective quality attribute, an evaluation
of software usability requires observing a number of human
subjects using the system. Interpreting these observations
necessitates the need of adding a psychologist to the testing
team. Some developers do not view usability testing as
productive evaluation, because these evaluations usually
indicates general area where the subjects had problems and does
not necessarily point to a specific solution. This can make
developers and managers extremely frustrated, especially when
faced with short project deadlines and no way to determine how
much time and effort are required to increase the usability.
Because of the uncertainty and expense of usability evaluations,
some managers are reluctant to include formal usability testing
in the development plan. Instead of using testing, these
managers prefer to rely on best practices, templates, and
inspection to establish software usability.

The actual challenge of developing usable software may lie in
the lack of a clear and concise understanding of what too many
software engineers view as a fuzzy concept. Not all authorities
on software quality provide a definition of usability. Some
authorities recommend usability testing but only provide a
check-list of things to investigate [6, 9, 2]; and these authorities
are, for the most part, balancing the line between systems with
“card input” and interactive systems. Most quality models [4,
10, 3, 2, 8] provide a relatively consistent and concise definition
of usability, but the attributes used to characterize the many
facets of usability are not consistent. This research uses the
characterization of usability provided in the ISO/IEC 9126
because it is one of the more recent quality models, it is an
industry standard, and it provides a set of measurements and
metrics for each quality sub characteristic. Usability in the
ISO/IEC 9126 standard is defined as “the capability of the
software product to be understood, learned, used, and attractive
to the user when used under specified conditions” [4]. The
standard also provides the following usability characteristics:
Understandability, Learnability; Operability, Attractiveness, and
Compliance.
Understandability is the ability of a user to understand the
capabilities of the software and if it is suited to accomplish
specific goals. It is measured by providing the user with a
tutorial or software documentation and then evaluating the
users‟ knowledge to determine the users‟ level of understanding
of the software‟s functionality, operation, and data input and
output [5]. It also recommends using cognitive monitoring
techniques to evaluate the user response. Cognitive monitoring
techniques are using one-way mirrors or concealed cameras to
record the subject‟s behavior along with evaluation of the
findings by a psychology professional.
Learnability describes how easy it is for a user to learn to use the
software. For this characteristic, the standard measures how
long it takes to the user to learn and perform a task, the number
of functions used correctly, and the utility of the help facility
[5]. In addition to the measurements, the standard proposes
cognitive monitoring techniques.
Operability is the capability of a user to use the software to
accomplish a specific goal. To assess operability requires
measuring the following characteristics: Operational
consistency; Error correction; Error correction in use; Default
value availability in use; Message understandability; Self-
explanatory error messages; Operational error recoverability in
use; Time between human error operation in use; Undoability;
Customizability; Operation procedure reduction; and, Physical
accessibility [5]. Some of these metrics are objective
measurements, but many require cognitive monitoring
techniques to evaluate.
As the name implies, attractiveness is the appeal of the software
to a user. Attractiveness is possibly the most subjective of all
the usability characteristics, involving not only sociological and
psychological issues but gender and personal taste issues. The
ISO/IEC 9126 standard characterize attractiveness by providing
subjects with a questionnaire to evaluate the interface and by
observing subjects customizing the appearance to their
satisfaction [5].
Compliance measure how well the software adheres to external
and internal rules relating to usability. It is also the most
straightforward characteristic to evaluate. Developers compile a
list of the required standards, conventions, style guides, and
regulations, as well as, through functional testing, verify which
standards are meet [5].
Even from this short description of the metrics necessary to
evaluate usability, it is apparent that designing a usability test
would be an extremely time consuming and thereby expensive
task. This is also a test with potentially very high cost which
may not identify any specific design or implementation defects.
Reducing the high cost of usability testing is difficult because
each of the measures proposed by the ISO/IEC standard are
good and identify specific problems, and it is not possible to
eliminate the use of human test subjects. Another problem with
the number of measurements is how to create objective
specifications for so many diverse characteristics. Setting
objective measurements for all of these metrics would definitely
increase the time necessary to specify requirements. What may
be possible is to take a slightly different approach to usability
testing using techniques that developers and testers are more
comfortable with and could administer without requiring
cognitive evaluation techniques.
One possible approach to usability testing might be to set a
series of goals and to measure the effort and time necessary for a
subject to accomplish each goal. If developers estimate the
effort and time necessary to complete each goal, then it would
be possible to compare the observed effort with the estimated
effort. If the observed effort is greater than the estimated effort,
then there is a problem requiring further investigation. After
identifying the existence of a problem, developers could trace
the observation logs to find where the subjects experienced a
problem causing the expenditure of additional effort. Trying to
evaluate usability from effort and time to complete a goal may
be a bit overreaching, but understandability, operability, and
learnability should be within the scope of these measurements.
Effo
rt
Goals
Eexp
Eavg
LT
t
U
1 n
L
Figure 1 Hypothetical Learning Curve
Using effort to measure operability assumes that software is
more operable the less effort it requires to accomplish a specific
goal. Consider the following example. Assume a set of 𝑛
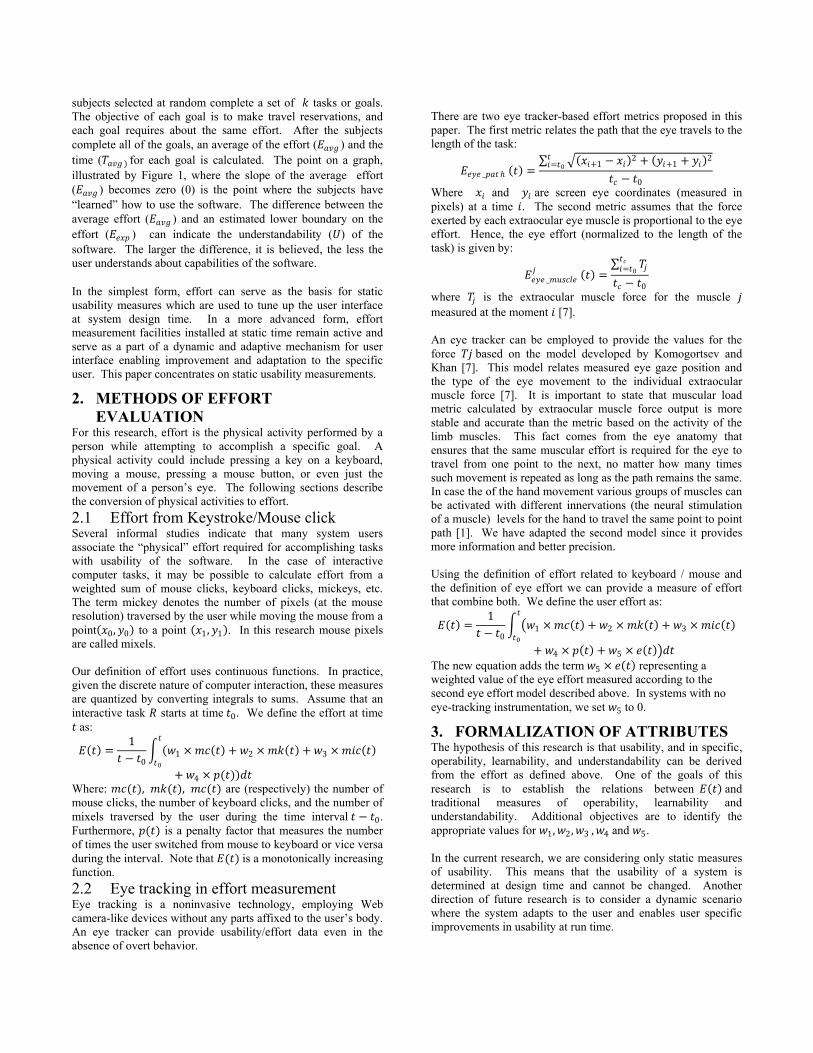
subjects selected at random complete a set of 𝑘 tasks or goals.
The objective of each goal is to make travel reservations, and
each goal requires about the same effort. After the subjects
complete all of the goals, an average of the effort (𝐸𝑎𝑣𝑔 ) and the
time (𝑇𝑎𝑣𝑔 ) for each goal is calculated. The point on a graph,
illustrated by Figure 1, where the slope of the average effort
(𝐸𝑎𝑣𝑔 ) becomes zero (0) is the point where the subjects have
“learned” how to use the software. The difference between the
average effort (𝐸𝑎𝑣𝑔 ) and an estimated lower boundary on the
effort (𝐸𝑒𝑥𝑝 ) can indicate the understandability (𝑈) of the
software. The larger the difference, it is believed, the less the
user understands about capabilities of the software.
In the simplest form, effort can serve as the basis for static
usability measures which are used to tune up the user interface
at system design time. In a more advanced form, effort
measurement facilities installed at static time remain active and
serve as a part of a dynamic and adaptive mechanism for user
interface enabling improvement and adaptation to the specific
user. This paper concentrates on static usability measurements.
2. METHODS OF EFFORT
EVALUATION For this research, effort is the physical activity performed by a
person while attempting to accomplish a specific goal. A
physical activity could include pressing a key on a keyboard,
moving a mouse, pressing a mouse button, or even just the
movement of a person‟s eye. The following sections describe
the conversion of physical activities to effort.
2.1 Effort from Keystroke/Mouse click Several informal studies indicate that many system users
associate the “physical” effort required for accomplishing tasks
with usability of the software. In the case of interactive
computer tasks, it may be possible to calculate effort from a
weighted sum of mouse clicks, keyboard clicks, mickeys, etc.
The term mickey denotes the number of pixels (at the mouse
resolution) traversed by the user while moving the mouse from a
point 𝑥0, 𝑦0 to a point 𝑥1, 𝑦1 . In this research mouse pixels
are called mixels.
Our definition of effort uses continuous functions. In practice,
given the discrete nature of computer interaction, these measures
are quantized by converting integrals to sums. Assume that an
interactive task 𝑅 starts at time 𝑡0. We define the effort at time
𝑡 as:
𝐸 𝑡 =1
𝑡 − 𝑡0 𝑤1 × 𝑚𝑐 𝑡 + 𝑤2 × 𝑚𝑘 𝑡 + 𝑤3 × 𝑚𝑖𝑐 𝑡
𝑡
𝑡0
+ 𝑤4 × 𝑝(𝑡) 𝑑𝑡 Where: 𝑚𝑐(𝑡), 𝑚𝑘(𝑡), 𝑚𝑐(𝑡) are (respectively) the number of
mouse clicks, the number of keyboard clicks, and the number of
mixels traversed by the user during the time interval 𝑡 − 𝑡0.
Furthermore, 𝑝(𝑡) is a penalty factor that measures the number
of times the user switched from mouse to keyboard or vice versa
during the interval. Note that 𝐸(𝑡) is a monotonically increasing
function.
2.2 Eye tracking in effort measurement Eye tracking is a noninvasive technology, employing Web
camera-like devices without any parts affixed to the user‟s body.
An eye tracker can provide usability/effort data even in the
absence of overt behavior.
There are two eye tracker-based effort metrics proposed in this
paper. The first metric relates the path that the eye travels to the
length of the task:
𝐸𝑒𝑦𝑒 _𝑝𝑎𝑡 𝑡 = 𝑥𝑖+1 − 𝑥𝑖
2 + 𝑦𝑖+1 + 𝑦𝑖 2𝑡
𝑖=𝑡0
𝑡𝑐 − 𝑡0
Where 𝑥𝑖 and 𝑦𝑖 are screen eye coordinates (measured in
pixels) at a time 𝑖. The second metric assumes that the force
exerted by each extraocular eye muscle is proportional to the eye
effort. Hence, the eye effort (normalized to the length of the
task) is given by:
𝐸𝑒𝑦𝑒 _𝑚𝑢𝑠𝑐𝑙𝑒𝑗 𝑡 =
𝑇𝑗𝑡𝑐𝑖=𝑡0
𝑡𝑐 − 𝑡0
where 𝑇𝑗 is the extraocular muscle force for the muscle 𝑗
measured at the moment 𝑖 [7].
An eye tracker can be employed to provide the values for the
force 𝑇𝑗 based on the model developed by Komogortsev and
Khan [7]. This model relates measured eye gaze position and
the type of the eye movement to the individual extraocular
muscle force [7]. It is important to state that muscular load
metric calculated by extraocular muscle force output is more
stable and accurate than the metric based on the activity of the
limb muscles. This fact comes from the eye anatomy that
ensures that the same muscular effort is required for the eye to
travel from one point to the next, no matter how many times
such movement is repeated as long as the path remains the same.
In case the of the hand movement various groups of muscles can
be activated with different innervations (the neural stimulation
of a muscle) levels for the hand to travel the same point to point
path [1]. We have adapted the second model since it provides
more information and better precision.
Using the definition of effort related to keyboard / mouse and
the definition of eye effort we can provide a measure of effort
that combine both. We define the user effort as:
𝐸 𝑡 =1
𝑡 − 𝑡0 𝑤1 × 𝑚𝑐 𝑡 + 𝑤2 × 𝑚𝑘 𝑡 + 𝑤3 × 𝑚𝑖𝑐 𝑡
𝑡
𝑡0
+ 𝑤4 × 𝑝 𝑡 + 𝑤5 × 𝑒 𝑡 𝑑𝑡
The new equation adds the term 𝑤5 × 𝑒 𝑡 representing a
weighted value of the eye effort measured according to the
second eye effort model described above. In systems with no
eye-tracking instrumentation, we set 𝑤5
to 0.
3. FORMALIZATION OF ATTRIBUTES The hypothesis of this research is that usability, and in specific,
operability, learnability, and understandability can be derived
from the effort as defined above. One of the goals of this
research is to establish the relations between 𝐸 𝑡 and
traditional measures of operability, learnability and
understandability. Additional objectives are to identify the
appropriate values for 𝑤1, 𝑤2, 𝑤3 , 𝑤4
and 𝑤5.
In the current research, we are considering only static measures
of usability. This means that the usability of a system is
determined at design time and cannot be changed. Another
direction of future research is to consider a dynamic scenario
where the system adapts to the user and enables user specific
improvements in usability at run time.

Under the assumption of static usability we can ignore the
“shape” of the curve of )(tE , and only use the “final” effort;
that is, the accumulated effort at time of completion of tasks.
Let R be a given interactive task. In order to derive the relation
between )(tE and static usability, we define the effort
associated with a task R in the following way:
𝐸𝑅 𝑡 =
1
𝑡𝑐 − 𝑡0 𝑤1 × 𝑚𝑐 𝑡 + 𝑤2 × 𝑚𝑘 𝑡 + 𝑤3
𝑡𝑐
𝑡0
× 𝑚𝑖𝑐 𝑡 + 𝑤4 × 𝑝 𝑡 + 𝑤5 × 𝑒 𝑡 𝑑𝑡
where 𝑡𝑐 is the time of task completion for the task 𝑅. Note that
the division by the factor 𝑡𝑐 − 𝑡0 eliminates the dependency of
𝐸𝑅
in the „time to completion‟ factor.
In addition, we assume that 𝑚𝑐 𝑡0 = 𝑚𝑘 𝑡0 = 𝑚𝑖𝑐 𝑡𝑡0 =𝑝 𝑡0 = 𝑒 𝑡0 = 0 and define the total effort associated with 𝑅,
to be:
𝐸𝑅 =
1
𝑡𝑐 − 𝑡0× 𝑤1 × 𝑚𝑐 𝑡𝑐 + 𝑤2 × 𝑚𝑘 𝑡𝑐 + 𝑤3 × 𝑚𝑖𝑐 𝑡𝑐
+ 𝑤4 × 𝑝 𝑡𝑐 + 𝑤5 × 𝑒 𝑡𝑐
We normalize 𝐸𝑅 , and define 𝐸𝑅 (the normalized effort
associated with R ) by setting 𝑡𝑐 = 0 and 𝑡0 = 1. At this stage
of the research, we assume that 𝑤1 = 𝑤2 = 𝑤3 = 𝑤4 = 𝑤5 =1. Finally, we denote 𝑓(1) by 𝑓 to obtain:
𝐸𝑅 = 𝑚𝑐 + 𝑚𝑘 + 𝑚𝑖𝑐 + 𝑝 + 𝑒
where 𝑚𝑐, 𝑚𝑘, 𝑚𝑖𝑐, and 𝑝 denote the total number of mouse
clicks, keyboard clicks, mickeys, and switches from mouse to
keyboard and keyboard to mouse throughout the process of
completing the task 𝑅.
3.1 Designer expected effort In order to associate 𝐸𝑅 with operability, learnability, and
understandability we define the term: „the designer expected
effort‟. Let 𝑅 𝑥 be a task with a parameter vector 𝑥 and let 𝑆
be a sequence of user interactions that can accomplish
𝑅 𝑥 from scratch. For example, 𝑅 𝑎, 𝑏 can denote the task of
reserving a flight from a city 𝑎 to a city 𝑏, then 𝑆 can include
interactions related to subtasks such as checking prices for
different airlines, at slightly different arrival / departure times, or
from different airports within the cities. The designer expected
effort for 𝑅 𝑥 is defined to be:
𝐸𝑒𝑥𝑝 = 𝐸𝑅 𝑥 𝑠∈𝑆𝑚𝑖𝑛
We assume that when the system is released, the system
designer knows 𝐸𝑒𝑥𝑝 . In fact, we would like to assume that the
system designer is designing the system in a way that provides
the best 𝐸𝑒𝑥𝑝 over several possible designs. Thus, the designer
expected effort is a single number that represents the “ideal”
(with respect to minimum effort) way to interact with the system
in order to accomplish 𝑅 𝑥 . We now define operability, learnability, and understandability in
terms of 𝐸𝑒𝑥𝑝 .
3.2 Operability The operability of a system is measured by 𝐸𝑒𝑥𝑝 of the system.
To elaborate, consider two possible designs (𝐷(1) and 𝐷(2)) of
an interactive system for flight reservation enabling the
task 𝑅(𝑎, 𝑏). Let 𝐸𝑒𝑥𝑝(1)
and 𝐸𝑒𝑥𝑝(2)
denote the designer expected
effort for the designs 𝐷(1) and 𝐷(2) respectively and assume
that 𝐸𝑒𝑥𝑝(1)
< 𝐸𝑒𝑥𝑝(2)
. Then, per our definition of operability, the
operability of design 𝐷(1) is better than the operability of
design 𝐷(2).
3.3 Learnability Learnability is measured by the rate of convergence of user
effort to 𝐸𝑒𝑥𝑝 (see Figure 1). To measure learnability, we
consider a large set of tasks of the form 𝑅 𝑥 . In the flight
reservation system, two of these tasks can be 𝑅(𝑎, 𝑏) and
𝑅(𝑐, 𝑑) (reserving a flight from 𝑎 to 𝑏 and from 𝑐 to 𝑑). To
simplify the discussion, we assume that the cities are similar and
hence, that 𝐸𝑒𝑥𝑝 is independent of the actual cities. We focus
our attention on a user that performs the task 𝑅(𝑢, 𝑣)
repeatedly for many cities 𝑢 and 𝑣. We expect that in the
beginning of the process the effort related to completing a task
),( vuR will be higher than 𝐸𝑒𝑥𝑝 . As the user repeats 𝑅(𝑢, 𝑣)
(with different cities 𝑢 and 𝑣), and learns the system, we expect
that his effort would converge to 𝐸𝑒𝑥𝑝 .
Figure 1 illustrates the process through a hypothetical learning
curve. The figure shows the result of measuring effort made by
the user while completing a set of very similar tasks (e.g., flight
reservation for many pairs of cities). The figure shows a
hypothetical exponential learning curve where the user
performance improves along with repeating the task (or with
time).
Hence, we can measure learnability as the rate of convergence
of the actual user effort 𝐸 to the ideal effort 𝐸𝑒𝑥𝑝 . Alternatively,
we can define learnability in terms of the root mean square error
where the error is measured as the difference between the user
effort and the designer expected effort at a given task. Yet,
another (and similar) measure can be the area of the difference
between the learning curve and the curve formed by the fixed
line at 𝑦 = 𝐸𝑒𝑥𝑝 . Figure 2 depicts the learnability (and
understandability) curve.
Due to understandability deficiencies, it is possible that the user
learning curve does not converge to 𝐸𝑒𝑥𝑝 . Hence, the area is
measured up to the point where the user learning curve flattens. 3.4 Understandability Lack of understandability may result in non-efficient usage of
the system or using the system for a task that is different than
any task defined at design time. In this case, the user effort may
converge to a value that is higher than 𝐸𝑒𝑥𝑝 . The difference
between the minimal effort value, achieved by the user,
and 𝐸𝑒𝑥𝑝 may be a useful measure for understandability. This is
depicted in Figure 2. We will check this assumption through the
planned experiments.

Figure 2 System's Learnability and Understandability
4. PROPOSED EXPERIMENTS We are developing an infrastructure for instrumenting
measurement of user effort related to interactive tasks. At the
low level, the infrastructure enables keyboard, mouse, and eye
tracking. Raw data collected is interpreted accordingly to reflect
effort, operability, learnability, and understandability. In
addition, a limited number of informal studies collecting effort
data is currently ongoing.
We have selected a travel planning system as the underlying
application. The application enables the user to perform four
main tasks:
1. One way and round trip flight reservation
2. Hotel reservation
3. Rental car reservation
4. Scheduling of visits to attractions and purchasing
tickets if applicable
Each of these tasks requires a multitude of user input parameters
such as destination cities, dates, number of travelers, their
respective ages, etc. The system interacts with the user,
provides a list of “recommendations” (e.g., a list of flights that
complies with the user parameters), enables sorting the list,
allows changing input parameters, and facilitates selecting list
elements. Overall, the system includes numerous options.
Generally, specific tasks (for example round trip reservation)
can be accomplished through several different interactions
sequences, each requiring a different effort.
The system is developed by students as a part of a team project
administrated in the “Graphical User Interface” course. The
students receive a set of requirements for the reservation
capabilities of the system along with requirements for
instrumenting the tracking of user activities (mouse clicks,
mickey‟s, etc.). The system requirements include general
usability requirements. They do not include specific
requirements for “reducing the user effort.” Nevertheless, we
assume that as a result of the requirement for instrumentation,
the students are aware of issues related to user effort and may be
taking them into account when they design and implement their
system.
The system enables collecting data related to the following
events:
Keyboard click: key clicked, time stamp, relevant
widget, and relevant interaction module
Mouse click: mouse button, time stamp, mixel,
relevant widget, and relevant interaction module
Mouse dragging: A “dense” time sequence of mouse
mixels, mapping of mixels to widgets, and to
interaction modules performed at the time instances.
Eye movement: A “dense” time sequence of eye
location coordinates, mapping of eye locations to
widgets, and to interaction modules performed at the
time instances.
The effort has started this semester, and more than one team is
working on the project. We expect several implementations of
the instrumented reservation system in current and future
semesters.
After completing the design and implementation of the travel
reservation system, students and instructors operate the
developed systems and run a large set of interactive tasks. Raw
data related to user activities, described above, is collected, and
stored.
The data collected is processed in order to supply higher levels
of information including effort, learnability, etc. The data and
information gathered are visualized through graphs and tables.
We expect to collect information to support and quantify our
hypothesis as well as data to be used to calibrate parameters of
our models (e.g., the weights associated with the effort
function).
5. CONCLUSIONS AND FUTURE
RESEARCH We have performed a number of informal studies to assess the
hypothesis that usability is a function of effort and time.
Clearly, an elaborate set of experiments is required in order to
assess the specific nature of the relationships between effort and
usability. The research has matured to a level where peer
reviews can produce beneficial feedback to make further
research more effective.
This paper provides various metrics that describe effort,
understandability, learnability and operability. These metrics are
defined in terms of basic user input actions such as key strokes,
mouse dragging, eye movements, and extraocular muscle force
output. Several experiments are proposed for the accurate
assessment of metric validity. Successful estimation will allow
measuring software operability as a function of physical effort,
opening new opportunities for investigation in this domain. We
feel that the impact of the proposed research will touch such
areas as automated effort estimation, goal design templates,
interface quality assessment and others.
There are several directions that the research can take. First, a
facility to measure the amount of information that the system
provides to the user (i.e., system output) as a function of the user
effort can be instrumented. This facility can be used as an
additional or alternative operability measure. Another direction
for future research includes dynamic and adaptive usable
systems. Under this framework, effort-measurement facilities
installed at static time remain active and serve as a part of a
dynamic and adaptive mechanism for user interface
improvement and adaptation to a specific user.
A user pattern of interaction is a sequence of the form
{(𝑢1, 𝑠1), (𝑢2, 𝑠2), … (𝑢𝑛 , 𝑠𝑛)} where 𝑢𝑖 is a user activity (e.g.,
clicking on a push button widget), and 𝑠𝑖 is a system activity
(e.g., producing a list of flights). Under the dynamic model, the
system utilizes pattern recognition techniques to identify the
repetitive sequences / patterns of interaction. This can be used
to set system defaults, reduce required effort, and improve
consistency.
Two modes of dynamic systems can be considered. In mode
one, referred to as the off-line mode, usability information
collected at run time from the current software release is used by
the system designers to modify and improve the next software
release. In the second mode, referred to as the adaptive mode,
the user interface is designed with redundant (extra) widgets.

These widgets assume the role of dynamically simplifying user
interface and reducing user effort. Default values and frequent
sequences of interaction are assigned in run time to the extra-
widgets in a way that better utilizes default values and converts
a sequence of user interaction activities into a single user
interaction activity
Using the traditional methods to evaluate usability, there are
dozens of indirect measurements requiring analysis. Even with
all of these measurements, Tom DeMarco‟s famous quote: “You
can‟t control what you can‟t measure”, may actually apply to
usability with a slight modification “You can‟t control what you
can‟t directly measure”.
6. REFERENCES [1] Bahill, A. T. Development, validation and sensitivity
analyses of human eye movement models. CRC
Critical Reviews in Bioengineering , 4, 1980.
[2] Boehm, B., et al, Characteristics of Software Quality,
North Holland Publishing Co., NY, 1978.
[3] Robert Grady, Practical Software Metrics for Project
Management and Process Improvement. Prentice-Hall,
1992.
[4] Anonymous, Software Engineering-Product Quality-
Part 1: Quality Model. International Standards
Organization, Geneva Switzerland, 2001
[5] Anonymous, Software Engineering-Product Quality-
Part 2: External Metrics. International Standards
Organization, Geneva Switzerland, 2001
[6] Kit, E., Software Testing in the Real World, Addison-
Wesley, Reading, MA. 1995
[7] Komogortsev, O., & Khan, J. Eye Movement
Prediction by Kalman Filter with Integrated Linear
Horizontal Oculomotor Plant Mechanical Model. To
appear in Eye Tracking Research & Applications
Symposium 2008. at the moment paper accesible at
http://www.cs.txstate.edu/~ok11/ETRA08KoKh.pdf.Sa
vannah, GA, 2008.
[8] McCall, J.; Richards, P.; Walters, G., “Factors in
Software Quality,” three volumes, NTIS AD-A049-
OI4, AD-A049-OI5, AD-A049-055, November 1977.
[9] Myers, G., The Art of Software Testing, John Wiley &
Sons, New York, NY, 1979.
[10] Nielsen, J., Usability Engineering, Academic Press,
Inc., San Diego, CA. 1993.
[11] Pressman, R., Software Engineering A Practitioner‟s
Approach, 6th Edition, McGraw-Hill, New York, NY.,
2005.