Enhancing Usability and Security through Alternative ...
130
W&M ScholarWorks W&M ScholarWorks Dissertations, Theses, and Masters Projects Theses, Dissertations, & Master Projects 2017 Enhancing Usability and Security through Alternative Enhancing Usability and Security through Alternative Authentication Methods Authentication Methods Nicolas Jorge Van Balen College of William and Mary, [email protected] Follow this and additional works at: https://scholarworks.wm.edu/etd Part of the Computer Sciences Commons Recommended Citation Recommended Citation Van Balen, Nicolas Jorge, "Enhancing Usability and Security through Alternative Authentication Methods" (2017). Dissertations, Theses, and Masters Projects. Paper 1516639579. http://dx.doi.org/doi:10.21220/S26M2W This Dissertation is brought to you for free and open access by the Theses, Dissertations, & Master Projects at W&M ScholarWorks. It has been accepted for inclusion in Dissertations, Theses, and Masters Projects by an authorized administrator of W&M ScholarWorks. For more information, please contact [email protected].
-
Upload
khangminh22 -
Category
Documents
-
view
3 -
download
0
Transcript of Enhancing Usability and Security through Alternative ...

W&M ScholarWorks W&M ScholarWorks
Dissertations, Theses, and Masters Projects Theses, Dissertations, & Master Projects
2017
Enhancing Usability and Security through Alternative Enhancing Usability and Security through Alternative
Authentication Methods Authentication Methods
Nicolas Jorge Van Balen College of William and Mary, [email protected]
Follow this and additional works at: https://scholarworks.wm.edu/etd
Part of the Computer Sciences Commons
Recommended Citation Recommended Citation Van Balen, Nicolas Jorge, "Enhancing Usability and Security through Alternative Authentication Methods" (2017). Dissertations, Theses, and Masters Projects. Paper 1516639579. http://dx.doi.org/doi:10.21220/S26M2W
This Dissertation is brought to you for free and open access by the Theses, Dissertations, & Master Projects at W&M ScholarWorks. It has been accepted for inclusion in Dissertations, Theses, and Masters Projects by an authorized administrator of W&M ScholarWorks. For more information, please contact [email protected].
Enhancing Usability and Security Through Alternative Authentication Methods
Nicolas Van Balen
Williamsburg, VA
Bachelor of Science, Geneva College, 2009Master of Science, College of William & Mary, 2012
A Dissertation presented to the Graduate Facultyof The College of William & Mary in Candidacy for the Degree of
Doctor of Philosophy
Department of Computer Science
College of William & MaryAugust 2017

COMPLIANCE PAGE
Research approved by
Protection of Human Subjects Committee
Protocol number(s): PHSC-2013-08-05-8864-ctball
Date(s) of approval: 08/09/13

ABSTRACT
With the expanding popularity of various Internet services, online users havebecome more vulnerable to malicious attacks as more of their private information isaccessible on the Internet. The primary defense protecting private information isuser authentication, which currently relies on less than ideal methods such as textpasswords and PIN. Alternative methods such as graphical passwords andbehavioral biometrics have been proposed, but with too many limitations to replacecurrent methods. However, with enhancements to overcome these limitations andharden existing methods, alternative authentications may become viable for futureuse. This dissertation aims to enhance the viability of alternative authenticationsystems. In particular, our research focuses on graphical passwords, biometrics thatdepend, directly or indirectly, on anthropometric data, and user authenticationenhancements using touch screen features on mobile devices.
In the study of graphical passwords, we develop a new cued-recall graphicalpassword system called GridMap by exploring (1) the use of grids with variableinput entered through the keyboard, and (2) the use of maps as background images.As a result, GridMap is able to achieve high key space and resistance to shouldersurfing attacks. To validate the efficacy of GridMap in practice, we conduct a userstudy with 50 participants. Our experimental results show that GridMap workswell in domains in which a user logs in on a regular basis, and provides amemorability benefit if the chosen map has a personal significance to the user.
In the study of anthropometric based biometrics through the use of mousedynamics, we present a method for choosing metrics based on empirical evidence ofnatural difference in the genders. In particular, we develop a novel genderclassification model and evaluate the model’s accuracy based on the data collectedfrom a group of 94 users. Temporal, spatial, and accuracy metrics are recordedfrom kinematic and spatial analyses of 256 mouse movements performed by eachuser. The effectiveness of our model is validated through the use of binary logisticregressions.
Finally, we propose enhanced authentication schemes through redesigned input,along with the use of anthropometric biometrics on mobile devices. We design anovel scheme called Triple Touch PIN (TTP) that improves traditional PIN basedauthentication with highly enlarged keyspace. We evaluate TTP on a group of 25participants. Our evaluation results show that TTP is robust against dictionaryattacks and achieves usability at acceptable levels for users. We also assess

anthropometric based biometrics by attempting to differentiate user fingers throughthe readings of the sensors in the touch screen. We validate the viability of thisbiometric approach on 33 users, and observe that it is feasible for distinguishing thefingers with the largest anthropometric differences, the thumb and pinkie fingers.
TABLE OF CONTENTS
Acknowledgments v
Dedication vi
List of Tables vii
List of Figures viii
1 Introduction 2
1.1 Graphical Passwords . . . . . . . . . . . . . . . . . . . . . . . . . . . 4
1.2 Behavioral Biometrics . . . . . . . . . . . . . . . . . . . . . . . . . . . 7
1.3 Touch Screen Features . . . . . . . . . . . . . . . . . . . . . . . . . . . 8
1.4 Overview . . . . . . . . . . . . . . . . . . . . . . . . . . . . . . . . . . 10
2 GridMap: Enhancing security in cued-recall graphical passwords 11
2.1 Background . . . . . . . . . . . . . . . . . . . . . . . . . . . . . . . . 12
2.2 Design . . . . . . . . . . . . . . . . . . . . . . . . . . . . . . . . . . . 14
2.2.1 Basic Design . . . . . . . . . . . . . . . . . . . . . . . . . . . . 15
2.2.2 Design Choices . . . . . . . . . . . . . . . . . . . . . . . . . . . 16
2.2.3 Password Creation and Confirmation . . . . . . . . . . . . . . . 20
2.2.4 Password Login . . . . . . . . . . . . . . . . . . . . . . . . . . . 21
i

2.3 Security Analysis . . . . . . . . . . . . . . . . . . . . . . . . . . . . . 21
2.4 Implementation . . . . . . . . . . . . . . . . . . . . . . . . . . . . . . 24
2.5 Evaluation . . . . . . . . . . . . . . . . . . . . . . . . . . . . . . . . . 27
2.5.1 Success Rates . . . . . . . . . . . . . . . . . . . . . . . . . . . . 30
2.5.2 Timing . . . . . . . . . . . . . . . . . . . . . . . . . . . . . . . 31
2.5.3 User Predictability . . . . . . . . . . . . . . . . . . . . . . . . . 33
2.5.4 Other Observations . . . . . . . . . . . . . . . . . . . . . . . . 34
2.6 Limitations . . . . . . . . . . . . . . . . . . . . . . . . . . . . . . . . . 35
2.7 Conclusion . . . . . . . . . . . . . . . . . . . . . . . . . . . . . . . . . 36
3 A Naturalistic Approach to Gender Classification
With Mouse Biometrics 37
3.1 Background . . . . . . . . . . . . . . . . . . . . . . . . . . . . . . . . 39
3.1.1 Behavioral Biometrics . . . . . . . . . . . . . . . . . . . . . . . 39
3.1.2 Gender and Anthropometric Differences . . . . . . . . . . . . . 41
3.2 Methodology . . . . . . . . . . . . . . . . . . . . . . . . . . . . . . . . 44
3.2.1 Data Collection . . . . . . . . . . . . . . . . . . . . . . . . . . . 44
3.2.2 Movement Metrics . . . . . . . . . . . . . . . . . . . . . . . . . 46
3.2.2.1 Profiles . . . . . . . . . . . . . . . . . . . . . . . . . . 47
3.2.2.2 Temporal Movement and Button Press Metrics . . . . 48
3.2.2.3 Spatial movement metrics . . . . . . . . . . . . . . . . 50
3.2.2.4 Movement accuracy metrics . . . . . . . . . . . . . . . 50
3.2.3 Data filtering . . . . . . . . . . . . . . . . . . . . . . . . . . . . 52
3.3 Model design . . . . . . . . . . . . . . . . . . . . . . . . . . . . . . . . 52
3.3.1 Mouse signatures . . . . . . . . . . . . . . . . . . . . . . . . . . 53
ii

3.3.2 Gender prediction model . . . . . . . . . . . . . . . . . . . . . 55
3.4 Evaluation . . . . . . . . . . . . . . . . . . . . . . . . . . . . . . . . . 56
3.4.1 Labeled Data Analysis . . . . . . . . . . . . . . . . . . . . . . . 57
3.4.2 Unlabeled Data Analysis . . . . . . . . . . . . . . . . . . . . . 58
3.5 Discussion . . . . . . . . . . . . . . . . . . . . . . . . . . . . . . . . . 59
3.6 Conclusion . . . . . . . . . . . . . . . . . . . . . . . . . . . . . . . . . 61
4 Feasibility of Multi-Finger Authentication with Touch Screen Devices 63
4.1 Background . . . . . . . . . . . . . . . . . . . . . . . . . . . . . . . . 64
4.2 Design . . . . . . . . . . . . . . . . . . . . . . . . . . . . . . . . . . . 68
4.2.1 TTP Design . . . . . . . . . . . . . . . . . . . . . . . . . . . . 69
4.2.2 MFA Experimental Design . . . . . . . . . . . . . . . . . . . . 72
4.2.2.1 Preliminary Observations . . . . . . . . . . . . . . . . 73
4.2.2.2 App Design . . . . . . . . . . . . . . . . . . . . . . . . 74
4.3 Implementation . . . . . . . . . . . . . . . . . . . . . . . . . . . . . . 76
4.3.1 TTP Implementation . . . . . . . . . . . . . . . . . . . . . . . 77
4.3.2 MFA Implementation . . . . . . . . . . . . . . . . . . . . . . . 78
4.4 Evaluation . . . . . . . . . . . . . . . . . . . . . . . . . . . . . . . . . 80
4.4.1 TTP Evaluation . . . . . . . . . . . . . . . . . . . . . . . . . . 80
4.4.1.1 Security Analysis . . . . . . . . . . . . . . . . . . . . . 80
4.4.1.2 User Study . . . . . . . . . . . . . . . . . . . . . . . . 82
Timing. . . . . . . . . . . . . . . . . . . . . . . . . . . 82
Predictability. . . . . . . . . . . . . . . . . . . . . . . . 83
Other Feedback. . . . . . . . . . . . . . . . . . . . . . . 85
4.4.2 MFA Evaluation . . . . . . . . . . . . . . . . . . . . . . . . . . 86
iii

4.4.2.1 Single-User Finger Differentiation . . . . . . . . . . . . 87
Classification model . . . . . . . . . . . . . . . . . . . . . 87
Results. . . . . . . . . . . . . . . . . . . . . . . . . . . 88
4.4.2.2 Finger Type Differentiation . . . . . . . . . . . . . . . 91
Classifier Model. . . . . . . . . . . . . . . . . . . . . . 92
Results. . . . . . . . . . . . . . . . . . . . . . . . . . . 93
4.4.2.3 Other Observations . . . . . . . . . . . . . . . . . . . . 94
4.5 Summary . . . . . . . . . . . . . . . . . . . . . . . . . . . . . . . . . . 96
5 Conclusion and Future Work 98
5.1 Conclusion . . . . . . . . . . . . . . . . . . . . . . . . . . . . . . . . . 98
5.2 Future work . . . . . . . . . . . . . . . . . . . . . . . . . . . . . . . . 101
5.2.1 Behavioral Biometrics . . . . . . . . . . . . . . . . . . . . . . . 101
5.2.2 Touch Screen Features . . . . . . . . . . . . . . . . . . . . . . . 103
iv

ACKNOWLEDGMENTS
I would first like to express my gratitude to my PhD advisor Dr. Haining Wang forhis guidance and advice. His excellent insights and research approach have greatlyimpacted me and my career. I especially thank him for the patience and confidencehe has shown in me.
I would like to thank my committee members Dr. Gang Zhou, Dr. Qun Li, Dr. KunSun, and Dr. Justin Brunelle for their valuable insight and directions. I also extendmy gratitude to all the faculty members, staff, and fellow students at the College ofWilliam and Mary for helping me through my years as a student and making it awonderful time.
I also thank my collaborators Christopher Ball and Nan Zheng who have providedme with mentorship and resources during my research.
In addition I thank the Agile Engineering and Innovation department at The MITRECorporation for the support, mentorship, and friendship throughout my doctoral pur-suits.
Finally, I give my deepest thanks to my parents, family, and friends whose uncondi-tional love and support have helped me through all the difficult times in my doctoralstudies and inspired me through all the good ones.
v

To my parents, family, and friends
vi
LIST OF TABLES
2.1 A comparison of GridMap and the two most similar schemes, Pass-
points and grIDsure. . . . . . . . . . . . . . . . . . . . . . . . . . . . 23
2.2 The number of successful logins in 3 and 5 attempts and unsuccessful
logins for participants who waited 1 day, 1 week, and 2 weeks between
creation and login. . . . . . . . . . . . . . . . . . . . . . . . . . . . . 29
2.3 The number of successful and failed logins of users with 4 and 5 or
more cells for all 50 participants involved in the study. . . . . . . . 30
2.4 Password creation and login times displayed in seconds. . . . . . . . 30
3.1 Significant main effects and interactions found for 4-way ANOVAs
(Gender × Distance × Angle of approach × Target size) conducted
for each metric. . . . . . . . . . . . . . . . . . . . . . . . . . . . . . 55
3.2 Accuracy of predicted results. Labeled set refers to the full data set
used in Section 4.1. Labeled 70% and unlabeled 30% refer to the
training set and test set used in Section 4.2, respectively. . . . . . . 56
vii

LIST OF FIGURES
2.1 On the left, sub-figure (a) shows what a grid would look like during
the password creation phase. Sub-figure (b) on the right shows an
example of the text used in the grid for verification and login. Note
that the numbers remain constant while the letters change for different
login sessions. Here the user’s chosen cell is the top right one with the
number of 0, highlighted in red, the letters from that cell would be
entered as the password as seen in the text boxes in the example. . . 14
2.2 A portion of a map showing the state of Florida with the grid super-
imposed. . . . . . . . . . . . . . . . . . . . . . . . . . . . . . . . . . 18
2.3 Password creation and confirmation processes. . . . . . . . . . . . . 20
2.4 A screen shot of GridMap. . . . . . . . . . . . . . . . . . . . . . . . 24
2.5 Image options provided to users. The U.S. map on the left is set as
default, and the World map to the right could be switched to if desired
by users. . . . . . . . . . . . . . . . . . . . . . . . . . . . . . . . . . 27
2.6 The distribution of login times. The x-axis shows the time in ten
second intervals, and the y-axis shows the number of users who logged
in with that time interval. . . . . . . . . . . . . . . . . . . . . . . . 33
2.7 Distributions of distances between cells in passwords. . . . . . . . . 34
viii

3.1 Differences in arm length and hand size between genders as recorded
by the United States Census Bureau. . . . . . . . . . . . . . . . . . 42
3.2 Anatomical terms for motions of upper limb, wrist, and joints. . . . 42
3.3 Illustration of screen target positions for movements of mouse cursor.
Home target is shown in blue, and all endpoint targets in red. . . . . 45
3.4 Example of a velocity profile with various temporal metrics illustrated. 48
3.5 Example of a mouse trajectory to illustrate differences between three
movement change metrics with task axis drawn in a dashed line. . . 49
3.6 Graphical depiction of movement accuracy metrics. . . . . . . . . . . 51
4.1 Input type-1 . . . . . . . . . . . . . . . . . . . . . . . . . . . . . . . . 69
4.2 Input type-2a . . . . . . . . . . . . . . . . . . . . . . . . . . . . . . . 69
4.3 Input type-2b . . . . . . . . . . . . . . . . . . . . . . . . . . . . . . . 69
4.4 Input type-3 . . . . . . . . . . . . . . . . . . . . . . . . . . . . . . . . 69
4.5 Different ways users touch the screen . . . . . . . . . . . . . . . . . . 69
4.6 A touch with the tip of the finger . . . . . . . . . . . . . . . . . . . . 72
4.7 A touch with only part of the finger pad . . . . . . . . . . . . . . . . . 72
4.8 A touch with the finger pad . . . . . . . . . . . . . . . . . . . . . . . . 72
4.9 This graph shows the age distribution of the participants of the TTP
user study. . . . . . . . . . . . . . . . . . . . . . . . . . . . . . . . . 82
4.10 This graph shows the age distribution of input types that users in-
cluded in their PINs. . . . . . . . . . . . . . . . . . . . . . . . . . . 84
4.11 This graph shows the age distribution of the participants of the MFA
experiment. . . . . . . . . . . . . . . . . . . . . . . . . . . . . . . . 86
ix

4.12 Number of users based on the accuracy of their most accurate finger.
For example, there are 7 users whose most accurate finger had 100%
accuracy, and 7 users whose most accurate finger had a 60% accuracy. 88
4.13 The number of users based on which finger was most accurate. The
highest value is 19 users whose most accurate finger was the thumb,
and the second highest value was the 9 users whose most accurate
finger was the pinkie. . . . . . . . . . . . . . . . . . . . . . . . . . . 89
4.14 Thumb . . . . . . . . . . . . . . . . . . . . . . . . . . . . . . . . . . . 91
4.15 Index finger . . . . . . . . . . . . . . . . . . . . . . . . . . . . . . . . 91
4.16 Middle finger . . . . . . . . . . . . . . . . . . . . . . . . . . . . . . . . 91
4.17 Ring finger . . . . . . . . . . . . . . . . . . . . . . . . . . . . . . . . . 91
4.18 Pinkie finger . . . . . . . . . . . . . . . . . . . . . . . . . . . . . . . . 91
4.19 Distribution of true-positive and false-negative rates per finger. The
column with the same name as the finger in the graph represents the
true-positive rate for that finger. The other columns show how often
the given finger was falsely classified as the finger in the column. . . 91
4.20 Finger type identification results using Linear SVM. each bar shows
the accuracy of idenitfying which type of finger any user used when
touching the screen . . . . . . . . . . . . . . . . . . . . . . . . . . . . 93
4.21 Finger type identification results using K-Neirest Neighbors. each bar
shows the accuracy of idenitifying which type of finger was used when
touching the screen . . . . . . . . . . . . . . . . . . . . . . . . . . . . 94
x

Enhancing Usability and Security Through Alternative
Authentication Methods

Chapter 1
Introduction
User authentication has become ubiquitous to life in modern society, as numerous online
services have been widely used by human users and their private information is protected by
user authentication. Internet services such as online retailers, online banking, and monetary
exchange (e.g. Google wallet or PayPal) include financial information of users. Other
services such as email, cloud storage, and social media contain personal information of users.
Access to such information can also be done through mobile devices like smartphones.
These devices are usually store the information locally or maintain permanently open
sessions with the services that provide the data after the initial service login. In these cases,
the only authentication needed to access a user’s data is the device unlock mechanism.
Global retail sales through online markets have reached values between $3.3 trillion
and $4.8 trillion, and smartphone subscriptions are estimated at 2.6 billion globally with
estimation of 6.1 billion by 2020. The volume of money and user information involved in
these services and devices is tremendous and becomes a valuable target to malicious attack-
ers. Illegitimate access to data and services can result in monetary losses, identity fraud,
personal data leakages, use of unaware third parties as vectors for malware distribution,
or illegal activities hidden with identity theft. Forecasts place monetary losses from cyber
2
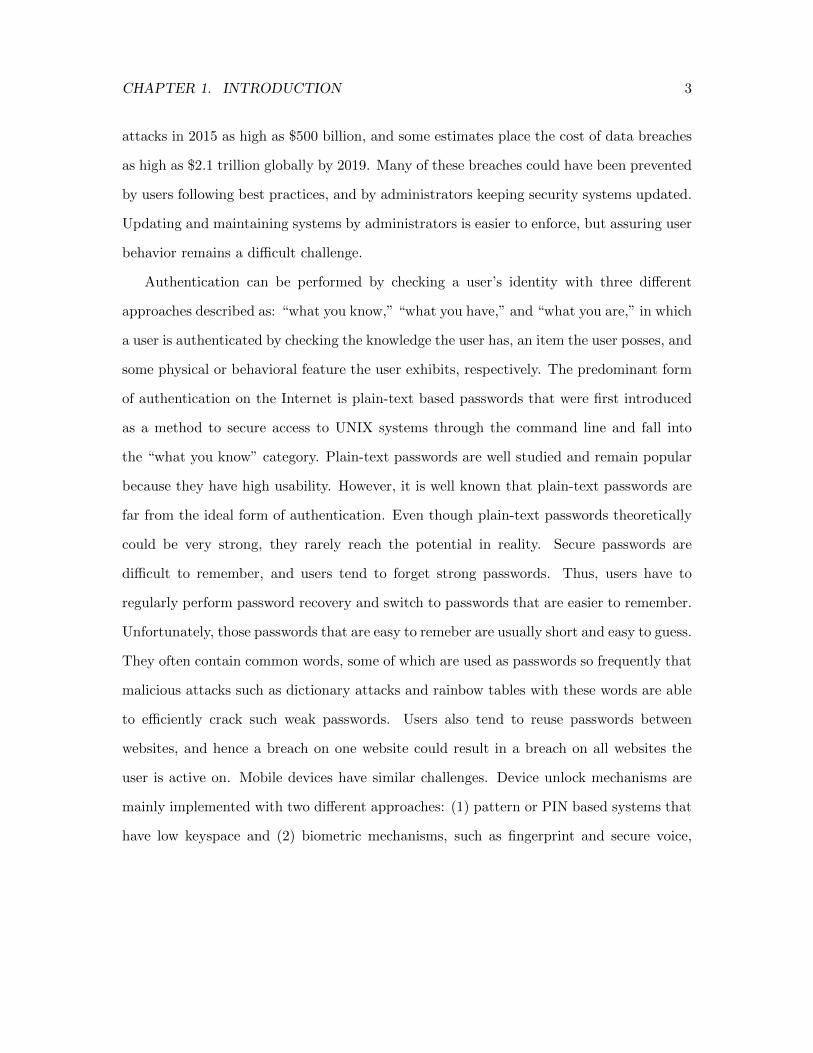
CHAPTER 1. INTRODUCTION 3
attacks in 2015 as high as $500 billion, and some estimates place the cost of data breaches
as high as $2.1 trillion globally by 2019. Many of these breaches could have been prevented
by users following best practices, and by administrators keeping security systems updated.
Updating and maintaining systems by administrators is easier to enforce, but assuring user
behavior remains a difficult challenge.
Authentication can be performed by checking a user’s identity with three different
approaches described as: “what you know,” “what you have,” and “what you are,” in which
a user is authenticated by checking the knowledge the user has, an item the user posses, and
some physical or behavioral feature the user exhibits, respectively. The predominant form
of authentication on the Internet is plain-text based passwords that were first introduced
as a method to secure access to UNIX systems through the command line and fall into
the “what you know” category. Plain-text passwords are well studied and remain popular
because they have high usability. However, it is well known that plain-text passwords are
far from the ideal form of authentication. Even though plain-text passwords theoretically
could be very strong, they rarely reach the potential in reality. Secure passwords are
difficult to remember, and users tend to forget strong passwords. Thus, users have to
regularly perform password recovery and switch to passwords that are easier to remember.
Unfortunately, those passwords that are easy to remeber are usually short and easy to guess.
They often contain common words, some of which are used as passwords so frequently that
malicious attacks such as dictionary attacks and rainbow tables with these words are able
to efficiently crack such weak passwords. Users also tend to reuse passwords between
websites, and hence a breach on one website could result in a breach on all websites the
user is active on. Mobile devices have similar challenges. Device unlock mechanisms are
mainly implemented with two different approaches: (1) pattern or PIN based systems that
have low keyspace and (2) biometric mechanisms, such as fingerprint and secure voice,

CHAPTER 1. INTRODUCTION 4
which can be easily copied.
New and innovative methods of user authentication integrate user behavior as a design
constraint. The current model for designing authentication systems assumes that users
will take the path of least resistance when creating a password. This model also assumes
a trade-off between security and usability where increases in security will decrease the us-
ability of a system. Therefore, an authentication system should be designed such that the
most secure use of the system is the path of least resistance, or the system is agnostic to
user behaviors entirely. The proposed solutions include graphical passwords, behavioral
biometrics, physical biometrics, and in the case of mobile devices, touch screen features.
These systems present advancements and improvements over existing ones, but still have
limitations that prevent their wide deployments in practice. In this dissertation, we ex-
plore to enhance these newly proposed authentication systems with the goal of addressing
their shortcomings in security and usability. In particualr, our work focuses on the use of
graphical passwords, behavioral and anthopometrics based biometrics, and touch screen
features on mobile devices.
1.1 Graphical Passwords
Passwords have been widely used for decades as the most common method for user authen-
tication. It is estimated that an average person normally uses passwords for authentica-
tion 7.5 times every day [27] in order to accesses information ranging from emails to bank
accounts. Whereas the text-based passwords are the dominant method of online authen-
tication for these daily scenarios, their security depends on creating strong passwords and
protecting them from being stolen. A strong password should be sufficiently long, random,
and hard to discover by crackers, while a weak password is usually short, common, easy
to guess, and susceptible to brute-force and dictionary attacks. However, the dilemma

CHAPTER 1. INTRODUCTION 5
in a text-based password system is that a strong password is hard for a human user to
remember—and more often than not,users tend to choose to create weak passwords sim-
ply because they are easier to remember than strong ones. Attempts to have users employ
more secure passwords by either forcing them to follow certain rules when creating them or
randomly assigning passwords, have not successfully addressed the problem because users
experience more trouble remembering these passwords.
Psychological research [2, 42, 58] suggests that humans can remember visual information
with more ease than textual information. This has led researchers to study the use of
graphical passwords as replacements for text passwords with the assumption that the use of
visual information will reduce the memory burden placed on users when using more secure
passwords. Moreover, three different memory retrieval approaches have been proposed for
graphical passwords. The first approach, called recall-based, requires a user to retrieve
his password directly from memory, usually in the form of a drawn picture or pattern.
The second approach, called recognition-based, relies on a user’s ability to recognize visual
information that has been seen before. This approach generally gives a user a portfolio of
images as his password and asks him to choose these given images from amongst a set of
decoys as the password entry process. The third approach, called cued-recall-based, relies
on a user’s ability to retrieve information from memory given a cue. This approach usually
has a user create a password using the image as some sort of direct or indirect guide. In
some cases the password is contained within the image itself, and in others it is simply
based on the image.
Graphical passwords, while improving on text based passwords in many ways, have also
introduced new problems unique to them. Most graphical password schemes are vulnerable
to shoulder surfing attacks, in which a password is stolen by observation or recording during
a login session. When a user inputs a password, it usually must remain visible on the screen

CHAPTER 1. INTRODUCTION 6
leaving it vulnerable to observation. In this case, the ease of visual memory actually works
against the password security. Since images have high memorability, an observer may be
able to recreate to password after as little as a single sight. Even when a password is
too complex to remember by observation alone, it is still vulnerable to recording with
a camera, video capable mobile device, or screen capture malware. Many cued-recall
systems also suffer from a problem known as hotspots, which stems from the fact that
some parts of an image are more likely to be selected by users than others. Attackers can
use hotspots to create dictionary attacks against cued-recall schemes. In addition, many
graphical password systems have difficulty attaining a large theoretical keyspace.
In this first project, we study the potential improvements to memorability due to the
use of images in which a user can find personal significance, and the impacts that grid
based input systems have on security and usability in a password system. In our design,
geopolitical maps are used to test the memorability improvement since a very wide range
of users can find personal significance in them, and test the grid based input system with
the maps as the background image. The grid divides the images into cells, each of which
has text that is randomly chosen at a login session. A user’s password is comprised by
a combination of these cells and input by typing the text from each cell into a password
input field. The method allows us to study the memory cuing benefits that the maps may
provide for cued recall type password schemes, as well as the security benefits and usability
impacts induced by the randomly changing text input.
We develop a prototype of the proposed graphical password system, called GridMap,
and validate its efficacy by running a user study involving 50 participants who create
passwords and then log in again after varying periods of time. From this user study, we
observe that GridMap works well in scenarios where users log in on a daily basis, but
has the drawback that users tend to take longer to log in and, if left on their own, will

CHAPTER 1. INTRODUCTION 7
often choose predictable passwords. We also observe that the users who can find higher
significance in an image will perform better at recalling their passwords than the users to
whom the image is less significant.
1.2 Behavioral Biometrics
The use of biometrics is an attractive option for user authentication since it is inherently
based on “who you are,” and unlike other conventional methods cannot be lost, forgotten,
or stolen. A large variety of user characteristics are used in biometric identification with
some involving physiological recording, such as iris scanning, fingerprint scanning, facial
recognition, and pulse recording [52]1; and some involving behavioral recording, such as
keystroke and mouse dynamics [75]. The behavioral biometric systems, however, have the
distinct advantage of not requiring specialized hardware to record the user behaviors. The
most common forms of behavioral biometrics are keystroke dynamics and mouse dynamics.
Keystroke dynamics refer to the measure of timing and rhythm of a user’s key presses
while typing. This type of effect was first noticed by telegraph operators in the 1860s
who could identify other operators by the rhythm with which they tapped out messages.
The same principal has since been studied in typing patterns on typewriters and later
with keyboards. In keystroke dynamics, users are identified by training a machine learning
classifier on a set of features made up of the timing between pressing keys down and
releasing them and other keys. Keystroke dynamics schemes have high accuracy with most
methods gaining 95% or higher. However, they do not have a high enough Equal Error Rate
(EER) to be used as a standalone solution. Most schemes are used as password hardening
for text passwords, continuous authentication, or as a piece in multi-factor system.
1It records the response at the palm of the hand while sending a low voltage electrical current throughthe body from the other palm.

CHAPTER 1. INTRODUCTION 8
Mouse dynamics contains various properties of mouse movements recorded during a
user is performing tasks with a computer mouse. Normally the tasks involve some form
of targeted movements, and the classifiers are built with the values taken from Fitts’ law
[26]. This law states that movement will change based on the distance from the target and
the size of the target. Other studies of mouse movements have also examined properties
of the traversed path, the velocity and acceleration of movement, and the movement accu-
racy. The primary focus of mouse dynamics is usually on continuous authentication or on
methods specifically designed to capture these types of features.
In our second project, we present a new naturalistic approach to using behavioral
biometrics for verifying an online user’s demographics. We will illustrate the effectiveness of
this approach by applying mouse biometrics to discriminate a user’s gender. Our approach
takes advantage of intra-user variability in mouse movements, and has the potential to
overcome generalizability issues when using mouse biometrics for user verification. The
proposed model was validated with mouse movement data collected from 94 participants
(45 male and 49 female) who each performed 256 movement trials. The model’s accuracy
was tested on both labeled and unlabeled data with a maximum accuracy of 89.4% for the
full labeled data set (100% after removing outliers) and 72.4% for the unlabeled data set
(75.9% after removing outliers).
1.3 Touch Screen Features
The increasing popularity of smartphones has brought new challenges into the field of
user authentication. These devices also introduce new opportunities with the use of touch
screens as their primary source of input and the sensors used for screen orientation. These
features are not available on regular desktop systems and can be leveraged to enhance
authentication methods. Primarily these enhancements utilize the multi-touch features of

CHAPTER 1. INTRODUCTION 9
the touch screen to enable simultaneous input, and touch dynamics can be used to identify
a user by its behaviors.
Multi-touch schemes usually revolve around using multiple simultaneous inputs to in-
crease the keyspce of some form of user authenticaiton, or in order to provide more sources
of data to perform biometric analysis, e.g., an individual finger provides another element
that the system can use to identify a user. Utilizing this approach has the potential to
avoid increasing memorability complexity that is imposed on the user by increasing the
password length for substantial increase in security.
Touch dynamics is a form of biometrics unique to mobile devices with touch screens.
It lies somewhere between behavioral biometrics and physical biometrics, using elements
from both. Touch dynamics is generated when keystroke dynamics was applied to soft
keyboard on mobile devices. The researchers designing such systems began to use the
output from sensors in mobile devices, such as the pressure and size sensor in the touch
screen, the accelerometer, and the gyroscope. These sensors not only simply measure the
features affected by the user’s behavior, but also the features affected by a user’s physique.
The use of these sensors has allowed the development of new techniques to measure user
characteristics that were previously not achievable with traditional systems.
The field of touch dynamics is still evolving with many systems applying the methods
in different ways. In addition to using biometrics to measure user behaviors with typing
patterns on soft keyboards, the techniques have also been applied to movements where
a finger is dragged across the touch screen such as the Android pattern unlock screen.
These techniques have been applied in both single entry authentication and continuous
authentication methods. This field is still relatively new and will undoubtedly mature as
the market for mobile devices continues to expand.
In our third project, we explore the use of touch screen features to improve the security

CHAPTER 1. INTRODUCTION 10
of PIN number unlock schemes on mobile devices. We propose two enhancements: Triple
Touch PIN (TTP) and Multi-Finger Authentications (MFA). In TTP, users enter a more
secure version of a PIN number by always using three fingers to press one, two, or three
digits at the same time for each value in the authentication key. We test TTP on a group of
25 participants and find that it offers much higher security than traditional PIN numbers
while causing a very low impact on usability. In MFA, we propose using touch screen
sensors to improve the keyspace of PIN numbers. We collect data from 33 participants and
test three machine learning classifiers to distinguish between fingers of the same user, and
to identify the type of finger used in a screen touch. We find that accuracy is only high
enough to perform this task with the thumb and pinkie fingers. As a result, MFA is not
suited for enhancement to PIN numbers, but still presents interesting results that may be
used in other applications.
1.4 Overview
This dissertation is organized into the following chapters. In Chapter 2, we present our
work on graphical passwords with GridMap. In Chapter 3, we present our work in behav-
ioral biometrics where we perform gender classification using mouse dynamics. Chapter
4 presents our work of leveraing touch screen features for enhancements to PIN number
schemes on mobile devices. Finally, we conclude this dissertation in Chapter 5.
Chapter 2
GridMap: Enhancing security in
cued-recall graphical passwords
Cued recall graphical passwords show the most promise for use as replacements to text
passwords. This is due to these schemes having the best balance of security and usability.
However, they suffer greatly from problems such as shoulder surfing, where a malicious
individual can steal a users password by observing or recording the input session, and
hot spots, where user tend to choose certain password with much higher probability than
others. This chapter explores the enhancement of sued recall systems by the use of text
based input instead of mouse click input with a new scheme called GridMap. We also
test the use of images of maps for the purposes of authentication. Section 2.1 presents a
background into graphical passwords. Section 2.2 describes the design of GridMap. Section
2.3 presents an analysis of the security enhancements in Gridmap. Section 2.4 describes
the implementation of the proposed scheme. Section 2.5 presents the results of a user study
to evaluate the usability of GridMap. Section 2.6 describes the limitations of the propose
system. Finally, Section 2.7 presents our conclusions about the work in this chapter.
11

CHAPTER 2. GRAPHICAL PASSWORDS 12
2.1 Background
In the area of recall-based schemes, the most known system is Draw-A-Secret (DAS) [38].
Originally designed for Personal Digital Assistants, DAS has a user draw a picture on a
grid and records the password as a series of pen-up, pen-down, and edge-crossing events.
However, users of DAS were found to choose very symmetric patterns for their passwords,
and to address this, Dunphy, et al. proposed an enhanced system called Background Draw-
A-Secret (BDAS) [22], in which an image is used as a background to the grid resulting in
a reduction of symmetric patterns. Zakaria, et al. [77] developed a variant of DAS used
on smartphones, and they proposed different methods, including the use of decoy lines and
snaking lines to provide shoulder surfing resistance.
Designed as an alternative to PIN numbers, a commercial recall-based system called
grIDsure [34] uses a 5x5 grid of randomized single digit numbers combined with keyboard
input. Such a design of grIDsure makes it difficult for a malicious observer to capture the
PIN, leading to shoulder surfing resistance. An overview of security concerns of grIDsure
is presented by Bond [9].
Research into shoulder surfing resistant systems has also been done with recognition
based systems, in particular Passfaces [17] is the best known scheme in this category. The
proposed idea is to have each user choose or be assigned a portfolio of images consisting
of portraits of peoples faces. In order to authenticate, a user would go through multiple
rounds, in each of which he would be displayed a set of nine images, one from his portfolio
and the others as decoys, and need to click on the image belonging to his portfolio. One
shoulder surfing resistant variation is studied in previous research [63], in which the shoulder
surfing resistance of graphical passwords is compared to that of text-based passwords. In
particular, the original Passfaces scheme is compared to alphanumeric text-based passwords
and a variation of Passfaces which uses the number pad on the keyboard, instead of the
CHAPTER 2. GRAPHICAL PASSWORDS 13
mouse, for input. We observe that the Passfaces variation outperforms both the original
Passfaces scheme and the text-based passwords alike in terms of shoulder surfing resistance.
Another variation of Passfaces has been proposed by Dunphy, et al. [23], which uses eye
tracking technology to determine a user’s choice by tracking where his gaze is on the screen.
In the cued-recall area, the most well known password scheme is PassPoints [72, 70].
This scheme stores a password as a series of points on an image, in which a user needs
to click on. A variation of this scheme called Cued-Click-Points (CCP) [16] was propose
by Chiasson, et al. In CCP, a user chooses one point on each of five different images
rather than five points on a single image. As each point progressively maps to a different
image, a user’s password constitutes a path of images determined by the choices of points
the user makes. However, both systems have been shown to have a problem known as
hotspots, where certain points in an image are more likely to be chosen by a user than
others. To tackle the hotspot problem, a variant CCP called Persuasive Cued-Click-Points
(PCCP) [15] has been proposed, in which a user could only choose points from inside a
given viewport that is randomly located on the image. The location of this viewport could
be changed with a shuffle button. A recent variation called Cued-Gaze-Points (CGP) [28],
similarly to Dunphy’s variation on Passfaces, uses eye tracking hardware for the input of the
users points in order to avoid shoulder surfing. Another cued-recall system is called Inkblot
[61] in which a user is shown a series of images and asked to think of a phrase that describes
each image and use the first and last letters of each phrase to form a password. This system,
although much less vulnerable to dictionary attacks, has a considerable amount in common
with text-based passwords than other graphical passwords.
CHAPTER 2. GRAPHICAL PASSWORDS 14
kj
1
32
0 1
32
0 1
32
0
rm
r m l a
b nf e
k j x m
b cf t
(a) Creation (b) Log-in
One log-in Another log-in
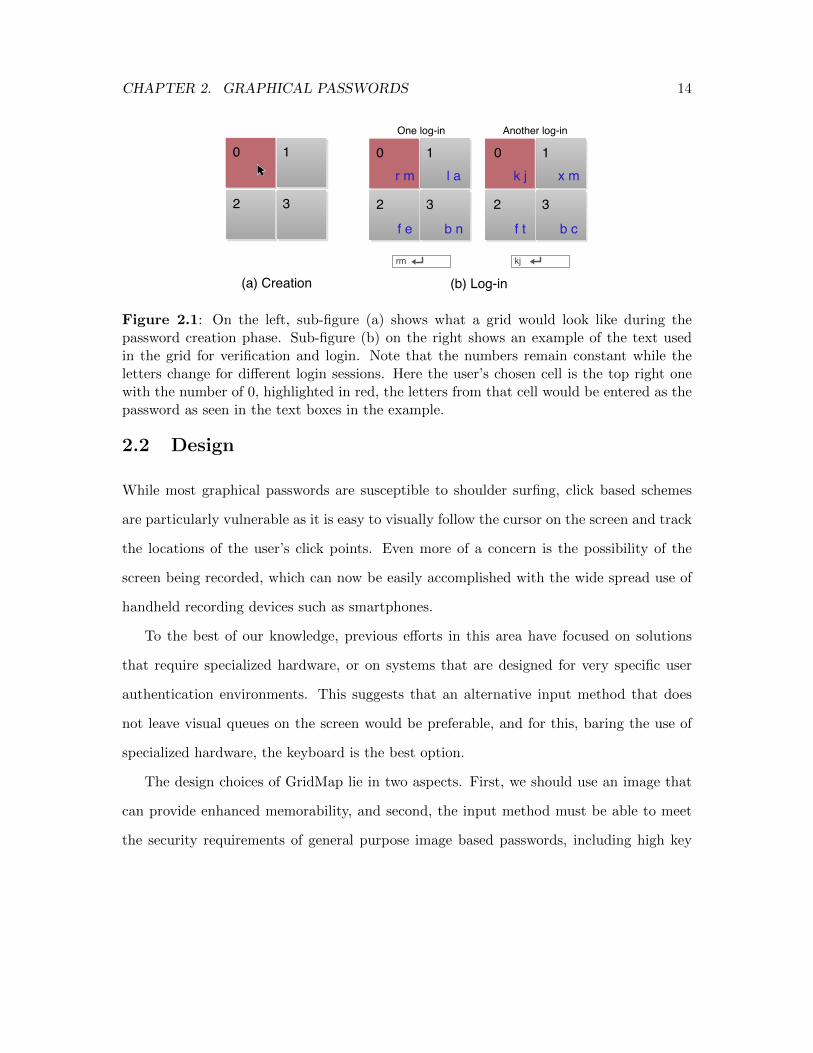
Figure 2.1: On the left, sub-figure (a) shows what a grid would look like during thepassword creation phase. Sub-figure (b) on the right shows an example of the text usedin the grid for verification and login. Note that the numbers remain constant while theletters change for different login sessions. Here the user’s chosen cell is the top right onewith the number of 0, highlighted in red, the letters from that cell would be entered as thepassword as seen in the text boxes in the example.
2.2 Design
While most graphical passwords are susceptible to shoulder surfing, click based schemes
are particularly vulnerable as it is easy to visually follow the cursor on the screen and track
the locations of the user’s click points. Even more of a concern is the possibility of the
screen being recorded, which can now be easily accomplished with the wide spread use of
handheld recording devices such as smartphones.
To the best of our knowledge, previous efforts in this area have focused on solutions
that require specialized hardware, or on systems that are designed for very specific user
authentication environments. This suggests that an alternative input method that does
not leave visual queues on the screen would be preferable, and for this, baring the use of
specialized hardware, the keyboard is the best option.
The design choices of GridMap lie in two aspects. First, we should use an image that
can provide enhanced memorability, and second, the input method must be able to meet
the security requirements of general purpose image based passwords, including high key

CHAPTER 2. GRAPHICAL PASSWORDS 15
space requirements, resistance to phishing and shoulder surfing attacks, which are the
security problems that plague many graphical password schemes. GridMap meets these
design guidelines by (1) using geopolitical maps as the memorability enhanced image and
(2) creating an adaptation of the grid input system to address the security and usability
concerns of a graphical password system. In general GridMap is capable of providing more
secure user authentication, especially greater resistance to shoulder surfing. Meanwhile,
GridMap is able to provide similar, if not much improved, usability as the existing click-
based schemes.
2.2.1 Basic Design
The basic working mechanism of GridMap is to superimpose a grid on top of the image of a
map dividing it into cells. Each of these cells contains two forms of text. One is a variable
(changes every session) text used to input the password, and the other is a fixed form of
text used to aid in remembering the password. During the password creation phase, a user
chooses a series of cells from the image as his password by simply clicking these cells via
the mouse. And for the purpose future logins, the user needs to remember the location and
related features, including the fixed number, for each selected cell. During a regular login
session, the user recalls the chosen cells and types in the variable text inside each of these
cells into a password field, which hides the typed text like it does for a text password. Once
the entire string is typed into the password field, it is converted to the coordinates of the
cells, which are the input to the system for user authentication. Note that the password
comprises the cells chosen by the user, not the text that is entered into the password field.
The text that the user inputs is dependent on what is displayed in those cells an will change
with each login session. Figure 2.1 shows a very simple example of how this input method
works with a 2x2 grid and one selected cell. For the presentation purpose, the variable text
CHAPTER 2. GRAPHICAL PASSWORDS 16
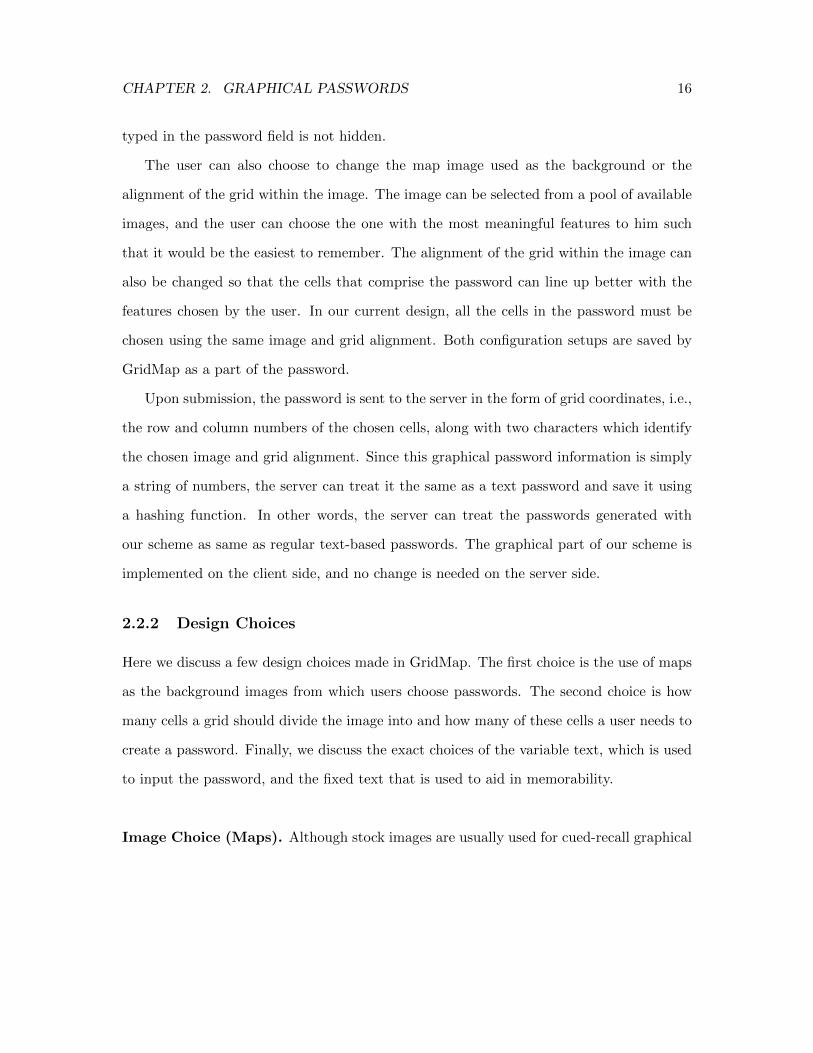
typed in the password field is not hidden.
The user can also choose to change the map image used as the background or the
alignment of the grid within the image. The image can be selected from a pool of available
images, and the user can choose the one with the most meaningful features to him such
that it would be the easiest to remember. The alignment of the grid within the image can
also be changed so that the cells that comprise the password can line up better with the
features chosen by the user. In our current design, all the cells in the password must be
chosen using the same image and grid alignment. Both configuration setups are saved by
GridMap as a part of the password.
Upon submission, the password is sent to the server in the form of grid coordinates, i.e.,
the row and column numbers of the chosen cells, along with two characters which identify
the chosen image and grid alignment. Since this graphical password information is simply
a string of numbers, the server can treat it the same as a text password and save it using
a hashing function. In other words, the server can treat the passwords generated with
our scheme as same as regular text-based passwords. The graphical part of our scheme is
implemented on the client side, and no change is needed on the server side.
2.2.2 Design Choices
Here we discuss a few design choices made in GridMap. The first choice is the use of maps
as the background images from which users choose passwords. The second choice is how
many cells a grid should divide the image into and how many of these cells a user needs to
create a password. Finally, we discuss the exact choices of the variable text, which is used
to input the password, and the fixed text that is used to aid in memorability.
Image Choice (Maps). Although stock images are usually used for cued-recall graphical

CHAPTER 2. GRAPHICAL PASSWORDS 17
password systems, we choose to use maps instead. We believe that although, in a generic
sense, there is no benefit to one image over another [71], images that have more significance
or are more personally meaningful to a user would result in passwords that are easier to
remember. For this reason, maps are chosen to be used as the images in GridMap since
many users may give a personal significance to the location portrayed in a map. Users
could then choose these locations as the password making it easier to remember. One
concern with this design is that an attacker with intimate knowledge of a user could use
his personal information to guess the password, however, gaining this type of personal
information is costly and only affects one target rather than a large password corpus.
The particular maps we use are geopolitical maps or ones portraying commonly known
landmarks and other characteristic of the region portrayed in them. A landmark or a state
may hold more significance to a user than a specific address, so that this type of map is
preferable to a street map. This also helps in the sense that with a street map a user is
likely to choose an address of his own home, which would make it easier to guess than
a vacation location or place where relatives live for example. A street map also poses a
larger problem for implementation since it requires less detail or a smaller area, which is
less likely to contain something significant to a user to be displayed, and, for this reason,
we choose not to use them. An example map with a corresponding grid is illustrated in
Figure 2.2, showing the “key” state of Florida with a grid superimposed.
Number of Cells in Image and Password. We also decide on how many cells to divide
the grid into. The problem comes with the difficulty of leaving the image uncluttered and
the text visible. For this reason, the image needs to be very large taking up most of the
screen. Taking low resolution screens, such as those on many laptops, into consideration
we set the grid to have no more than 500 cells in it. We observe that much more than

CHAPTER 2. GRAPHICAL PASSWORDS 18
Figure 2.2: A portion of a map showing the state of Florida with the grid superimposed.
this number leaves the image too cluttered and it is hard to focus on the text in individual
cells. If a larger keyspace is desired, we suggest to increase the number of grid alignment
options or the number of maps available for a user to choose from, instead of the number of
cells in an image. On the other hand, we do not recommend the use of less than 300 cells
in an image as the keyspace becomes too small and too many features of the image end up
in each cell. We make three different grid alignments available for a user to select from,
which is consistent with existing systems, and recommend that the sum of the cells among
all three grid alignments be no less than 1200 cells in total. The default grid contains 500
cells, but the user has the option of using a grid with 400 cells or a grid with 300 cells
instead.
GridMap uses a minimum of five cells per password, which is consistent with most of
the existing cued-recall schemes [72, 16]. If a loss of theoretical keyspace is acceptable,
the number of cells in a password can be lowered to four to achieve better usability; how-
ever, we recommend that no lower than five cells per password be used in scenarios where
keyspace is a concern.
Variable Text. The variable text, which the user types into a password field as input, is

CHAPTER 2. GRAPHICAL PASSWORDS 19
comprised of two lower-case letters. Both numbers and symbols are avoided because most
users are more used to typing from the alphabetical part of the keyboard rather than the
numerical portion, given the fact that most of the typing done by a user is for writing
natural language. We also avoid using upper-case letters to eliminate the need for a user
to press the shift key, especially given that the text in the password field is hidden and it
will very hard for a user to see if he made a mistake by typing a lower-case letter where a
capital should be or vice versa.
We set two letters per cell to minimize the amount of typing that a user needs to do
when inputting the text. Using a single letter should be avoided. This is because there are
not enough letters in the alphabet list to give each cell a unique letter, making it easier
for an attacker to guess a password in a brute force attempt where guessing a single letter
would cover multiple cells at once. Each cell could include three letters, which has the
advantage of using actual English words in cells; however, we feel that the advantage of
being able to use words is not significant enough to justify the extra typing time necessary
to input them. We do not recommend the use of more than three letters as it leads to have
the grid getting too cluttered with text and takes considerably longer to input.
Fixed Text. Each cell additionally has a single digit number in it. These numbers do
not change between sessions and are organized in such a way that two cells with the same
number will not be closer than 4 cells away. We use numbers here for two reasons. One is
to avoid having users confuse this text with the variable text which does not use numbers,
and more importantly the other is to help a user to create a meaningful sequence, like
a zip code, to aid in memorability. Sometimes a user may remember the general area,
in which a cell in the password is located, but not the exact location of the cell. Thus,
with the help of numbers, the user can pinpoint the exact cells in the password. And,

CHAPTER 2. GRAPHICAL PASSWORDS 20
Change image
Change grid alignment
Click desired cells
Proceed to verification
Type in text from chosen
cellsSubmit
Figure 2.3: Password creation and confirmation processes.
since the two numbers with the same value are far enough away from each other, it is
unlikely that the same number will show up twice in the same area. This will aid a user in
remembering the order of the chosen cells, which can be of concern as shown in previous
research [43]. Komanduri, et al. [43] compared the memorability of text passwords with
that of passwords strictly based on images and they observed that most users have more
trouble remembering the order of the items of their password than the exact contents.
2.2.3 Password Creation and Confirmation
The password creation procedure of GridMap is very different from the login procedure.
We assume that the password is created in a private environment like a home or office
with the user having a mouse and keyboard available for input. The image is presented to
the user with the fixed number in each cell, but without the variable text used for input.
Then he just moves the mouse and clicks on the chosen cells rather than typing in text
from them. Before that, the user needs to make a decision on the choices of image and grid
alignment. Such a creation process allows the user to concentrate on the image without
the text and prevents the user from attempting to form a password based on the variable
text which would change every login session. Note that although GridMap is vulnerable
to shoulder surfing attacks during the password creation phase, as it is expected to be
conducted in a private environment, and only once per user account, we believe that the
security risk is low. Meanwhile, users will simply be warned of the risk and use discretion
when creating a password.
Once the password is created, a user will be asked to re-input the password in a confir-

CHAPTER 2. GRAPHICAL PASSWORDS 21
mation step. During the confirmation phase, the image with both numbers and letters is
shown to the user, and the user resorts to the regular input method (i.e.. typing the letters
into the password field). The purpose of the confirmation is to help the user be familiar
with how GridMap works and memorize the password. Figure 2.3 illustrates the password
creation and confirmation processes.
2.2.4 Password Login
During a regular login session, GridMap acts the same as in its confirmation process. A
user has to use the text from the cells as input via the keyboard. For user convenience,
GridMap could give a user the option of choosing to either type the text from the keyboard
or simply click the cells via the mouse. If users are in a private environment like home, they
may choose this more user friendly clicking method for input. However, in a general case,
users should use the default input device —keyboard— to type the text into the password
field.
2.3 Security Analysis
The theoretical keyspace for GridMap is dependent on the number of images available, the
number of grid alignment options available, the number of cells in a given grid alignment,
and the number of cells in a user’s password. The following equation is used to calculate
the keyspace measured in bits:
log2
(K
∑i=1
m(
ni!(ni− r)!
)),
where m is the number of images available, r is the number of cells in a password, K
is the number of grid alignment options available, and ni is the number of cells in a grid
alignment i. In our design, m could range from one to three, r could range from four to five,
CHAPTER 2. GRAPHICAL PASSWORDS 22
while K is set to three and then the value of ni, corresponding to individual grid alignments,
will be 300, 400, and 500, respectively. Note that although our implementation provides
two-image options, in this analysis we set the value of m to one for ease of comparison with
existing systems whose keyspace calculation assumes only one image. Below we show the
theoretical keyspace in bits for GridMap.
log2
((500!
(500−5)!
)+(
400!(400−5)!
)+(
300!(300−5)!
))= 45.28 bits
It is clear that the keyspace of GridMap is within the range of 40-60 bits that accounts
for the average keyspace of text passwords. This value may increase depending on how
many image choices are available in the deployment and how the images are used.
The combination of a grid and random input text enables GridMap with a higher
shoulder surfing resistance than either click-based graphical passwords or traditional text-
based passwords. An attacker trying to shoulder surf would need to keep track of every
letter combination a user types in as well as locate the cells in the grid that match the
typed letters before the user submits the password. This makes it very difficult to steal the
password since both the letters typed by the user and the text filling the grid must come
from the same session, and memorizing one ahead of time would not give any advantage.
It would still be possible to capture the password with a recording device, but it would be
much more difficult due to the need of recording both the screen and the keyboard. This
would make it impractical to use a handheld device such as a smartphone for recording,
since only the screen can be easily seen from a distance and getting close enough to record
the keyboard would likely make the attacker’s intention obvious. Mounting an attack with
recording devices would require very discrete cameras that can see both the screen and the
keyboard well enough to distinguish what the user is typing, which can only be achieved
under very limited circumstances.

CHAPTER 2. GRAPHICAL PASSWORDS 23
grid input system Passpoints grIDsure
Theoretical keyspace 45 43 18
User choice resilience None None None
Variant response Yes No Yes
Server probes 0 - 1 1 0
Table 2.1: A comparison of GridMap and the two most similar schemes, Passpoints andgrIDsure.
This resistance is also able to defend against malware like keyloggers. Even though the
input is done via the keyboard, a keylogger alone would not suffice to capture a password.
The random variant nature of the text would require an attacker to capture the screen as
well as the keyboard input to actually recover the password.
Resistance to phishing attacks can be built into GridMap, but its effectiveness depends
on how GridMap is implemented. A strong resistance against phishing attacks can be
gained by eliminating the need for a user to select the image at the login time. With this
method, when a password is created, the user would still choose, or be assigned automat-
ically, an image to use as the background for the grid; however, when the user returns
to login, the chosen image will always be shown as the background automatically so that
there is no need for the user to choose the correct image for login. Without knowing the
right background image for login, a phisher cannot create a close to real phishing page to
deceive a user. The drawback to this method, however, is that the keyspace is reduced to
the case in which m is set to 1.
Compared with previous schemes, GridMap has no obvious advantages on the issues
of hotspots and user predictability. The grid is conducive to predictable patterns, such
as five cells in a row, and the map image is still just as likely to have hotspots as in an
existing click based system. However, we theorize that GridMap will have an increase in
patterns due to the grid and a decrease in hot spots because (1) the grid lines split many
of the images features and (2) the maps used are more likely to have different features

CHAPTER 2. GRAPHICAL PASSWORDS 24
Figure 2.4: A screen shot of GridMap.
be significant to different users. It is possible to further reduce the problems by applying
persuasive technology such as that used in PCCP, which will be explored in our future
work.
In Table 2.1, we can see a side by side comparison of GridMap with the two most
similar schemes, Passpoints and grIDsure. The data on these two existing systems is taken
from the graphical password survey by Biddle, et al. [7].
2.4 Implementation
A prototype implementation of GridMap is developed for this study. This prototype mainly
consists of two web-based user interfaces: one used to create a new password, and the other
used as a login page. Both user interfaces are written using HTML, CSS, and Javascript,
and each of them has a corresponding PHP script on the server.
The grid portion is created using an HTML table, in which each table data element
corresponds to a cell and the image is set as its background. The table is generated using
a javascript loop, and every table data element is divided with two < div > elements. The
first < div > contains the static number, which is generated using the pattern described
before and displayed on the top left corner of the cell. The second < div > contains a two-

CHAPTER 2. GRAPHICAL PASSWORDS 25
letter string (i.e., two lower-case randomly changed letters) displayed at the bottom right
corner. These strings are read into an array from a file containing all possible combinations
of two lower-case letters. The array is then shuffled and used to fill in the cells by order of
index. The array is re-shuffled on every page refresh. Since the number of strings in the
file is larger than the number of cells in any single grid alignment, it is possible that two
sessions will have different sets of strings filling the grid.
For all these numbers and letters in the grid, bold font is used for visibility. Opposing
corners are used so as to cover up the least amount of the image displayed in each cell
as possible. Upon implementation, we noted that if the space given to the table is too
small, it is not easy to view the image over the text, and in some cases, there is even
not enough space for the text. To deal with this problem, large images are used and the
table is set to automatically take up as much visible space as possible. This entails taking
up the entire vertical space that the browser allows a webpage, while taking up whatever
horizontal space is left by the authentication form.
To simulate the scenarios where three grid alignments line up differently, we choose to
change the number of cells and divide the image into 500, 400, and 300 cells, respectively.
When the number of cells changes, the size of each cell changes as well to accommodate
filling the image. This makes a grid alignment with less cells have bigger cells, resulting in
the cell borders to locate in different parts of the image.
The authentication form contains two text fields: one for username and the other for
password, like those used in text-based passwords. To input a password using the typing
method, the user would simply need to type the two letter strings from the bottom right
corners of the chosen cells into the password field. For the click input method, each table
data element is given a onclick event handler. When a user clicks a cell, a JavaScript
function identifies the two-letter string for that particular cell and appends it to the end
CHAPTER 2. GRAPHICAL PASSWORDS 26
of the current content of the password field. In both cases, the user can simply erase the
string in the password field and start over if the user thinks he may have made a mistake.
The form also contains two sets of radio buttons: one set allows the user to change the grid
alignment, and the other set allows the user to change the background image. When one of
the radio buttons with a grid alignment option is pressed, a JavaScript function regenerates
the table with the new number of cells. The radio buttons with the image options each
show a thumbnail of the image and also call a JavaScript function which changes the image
and, in some cases, the color of the font to create enough contrast with the image. In some
cases, it is even necessary to reduce the brightness of the image to draw enough contrast
and see the characters.
When the user clicks the submit button, a JavaScript function is called. This function
reads the content of the password field and replaces each pair of letters with the indexes
of the row and column of the chosen cell. This step is necessary because the pair of letters
in each cell randomly changes with every session, GridMap cannot store the password as
those letters. Instead, it must store the coordinates of the chosen cells. This is done on the
client side to avoid the overhead of sending all the mappings between text and coordinates
of cells to the server.
The function also performs error checking, such as ”passwords are too short” or ”text
does not match with the letters in the corresponding cells.” If a problem is detected, the
form is not submitted and the user is given an alert indicating the error. Should no error
be found, two numbers, one identifying the image and one identifying the grid alignment
are appended to the end of the text in the password field. Then, the form is submitted to
the server. A PHP script on the server checks if the username exists and the password is
correct. It then gives the user feedback by either notifying a successful submission, or by
displaying an error message indicating that either the username does not exist or the the

CHAPTER 2. GRAPHICAL PASSWORDS 27
Figure 2.5: Image options provided to users. The U.S. map on the left is set as default,and the World map to the right could be switched to if desired by users.
password is wrong, and provides a link back to the authentication page.
In this prototype system, no password hashing is implemented for two reasons. The first
reason is that it would not allow for certain types of analysis, such as hotspot analysis,
to be performed; and the second is that hashing is not directly related to what we are
attempting to address and would only be an additional step that requires implementation.
We assume that in a real deployment the passwords should have been hashed.
2.5 Evaluation
We conducted a usability and user predictability study involving 50 participants with age
from 18 to 36. The majority of participants are college undergraduate students from a
variety of majors. The rest are grad students in Computer Science, except for two who
are professional software developers, and one who is an office manager. All participants
are regular computer users. 21 of the users completed the study as part of a class while
the rest did the study over the Internet at their leisure. The methodology used in this
study has been approved by The College of William & Mary’s board of ethics for testing
on human subjects.

CHAPTER 2. GRAPHICAL PASSWORDS 28
Each of the users is directed to a webpage with instructions on how to use GridMap.
The instructions are presented using hypertext as recommended by Forget, et al. [29].
The participants from the class session are also given a demonstration by an instructor,
while the remaining participants only have the provided instructions. There are no other
differences in the experimental methodology between the two groups. During the first
session, the users are asked to create a password and then re-enter it as a confirmation.
As mentioned in the design section of this chapter, in the creation of the password, the
users are shown the grid with the static numbers in the cells only, and users click on the
chosen cells via mouse to form the password. The participants are able to choose between
a map of the United State and a map of the World, as shown in Figure 2.5, with the U.S.
map set as default. Some users create passwords with four cells and some create passwords
with five or more cells. For the confirmation step, given the grid with both numbers and
letters, the users are asked to re-input their passwords by typing the random text into the
password field via the keyboard.
Certain rules that the participants are not aware of have been applied at password
creation. These rules disallow the use of more than two consecutive cells in the same row,
more than two consecutive cells in the same column, more than two consecutive cells in the
same diagonal line, and the use of more than two corners. These represent the patterns
observed in previous trials of the similar input system [10]. If a user violates one of these
rules when creating his password, an alert box will be displayed to make the user aware
of the rule being violated. The violation of a rule is recorded. The password field is then
reset to empty and the participant has to create a new password.
During the second session, the users are asked to attempt to log in within five trials after
either one day, one week, or two weeks. If a user is unable to log in within the five attempts,
then the system simply informs him that he is done and does not ask for the password

CHAPTER 2. GRAPHICAL PASSWORDS 29
User Group 3 attempts 5 attempts Unsuccessful
1day 18/21 18/21 3/21
1week 14/23 14/23 9/23
2week 3/6 5/6 1/6
Table 2.2: The number of successful logins in 3 and 5 attempts and unsuccessful loginsfor participants who waited 1 day, 1 week, and 2 weeks between creation and login.
to be input anymore. A group of 21 participants, called the 1day group, completed the
login portion of the study after at least 12 hour but less than 48 hours. Another group
of 23 participants, called the 1week group, completed the login portion of the study after
waiting at least 7 days, but less than 14 days. Finally, a group of 6 participants completed
the login task after waiting more than 14 days. We refer to this final group as the 2week
group.
An additional survey is also filled out by 42 of the participants, asking the following
questions:
• How many years have you lived in the United States? Please give an answer as a
whole number rounded down, e.g., use 0 if less than one year.
• How many states within the U.S. have you visited/lived in?
• How many countries have you visited/lived in?
This survey is made available as we theorize that the amount of travel done by users
can effect their passwords and image choices.
In rest of this section, we summarize our data analysis and findings with regard to the
usability and predictability of user choice of GridMap.

CHAPTER 2. GRAPHICAL PASSWORDS 30
User Group4 cells 5 cells
Succeeded Failed Succeeded Failed
1day 7/7 0/7 11/14 3/14
1week 6/9 3/9 8/14 6/14
2week 3/4 1/4 2/2 0/2
Table 2.3: The number of successful and failed logins of users with 4 and 5 or more cellsfor all 50 participants involved in the study.
Creation (second) Log in (second)
Mean 136.6 51.8
Max 514.0 223.0
Min 18.0 4.0
Table 2.4: Password creation and login times displayed in seconds.2.5.1 Success Rates
We record two success rates for each of the groups 1day, 1week, and 2weeks, respectively.
The first one records the number of users who are able to correctly reproduce their pass-
words within 3 attempts, and the second one records the number of users who are able to
correctly reproduce their passwords within 5 attempts. Across all three groups, we achieve
a 70% success rate within 3 attempts and a 74% success rate within 5 attempts.
Table 2.2 shows in detail how many users are able to successfully log in after 3 and 5
attempts as well as how many are unable to remember their passwords. We note that after
1 day 86% of users are able to remember their passwords, but after one and two weeks only
61% and 83% of users remember their passwords, respectively.
It is also worth mentioning that the 2week group was originally comprised of much
more than six participants. However, out of this larger group only the six participants
shown in Table 2.2 were able to remember their usernames at login time. As such, the
others are excluded from this study since we are only interested in participants who can
at least correctly recall their usernames. This accounts for the higher success rate after
two weeks than after one week in our data. Note that all the users in the 1day and 1week

CHAPTER 2. GRAPHICAL PASSWORDS 31
groups were able to remember their usernames.
We also compare the success rates of users who used 4 cells in their passwords with
those who used 5 or more cells. After one day, 79% of users who with 5 cells and 100% of
users with 4 cells were able to log in, but in the cases of the groups who logged in after
one and two weeks, only 63% of users with 5 cells and 69% of users who used 4 cells were
able to successfully log in. These results suggest that using a password length of 4 cells,
instead of 5, can improve a user’s ability to remember his password when login is done
on a regular basis; however, as the time lapsed between logins increases, the memorability
benefit provided by the shorter password decreases and is no longer justifiable due to the
loss in security. The detailed results are listed in Table 2.3.
2.5.2 Timing
There are two timing metrics we are interested: (1) the amount of time taken by the
participants to create a password and (2) the amount of time taken to input the password
during a login session.
The time a participant spent for creating a password is measured by taking a time stamp
when the page has been fully loaded and a second time stamp when the user successfully
submits a password to the server. The measured time of a participant for creating a
password is reflective of the entire process since a failed submission attempt, such as one
that violates a rule by having too many cells in a row, will not cause the second time stamp
to be taken. For the login process, we use a similar method, but every password submission
to the server, correct or incorrect, is logged separately. In other words, if a participant
makes three attempts to get the correct password, three separate times would be recorded.
This is because we are interested in how long it takes a password to be input but not how
long an entire login process would take.

CHAPTER 2. GRAPHICAL PASSWORDS 32
The means along with the maximum and minimum values for the creation and login
times are listed in Table 2.4. We believe that all the values for password creation and
the mean for login times are accurate; however, it is not likely that the maximum and
minimum values from the login column would be observed often in practice. In the case
of the lower end, it is observed that all the values but two under 20 seconds are caused by
those users who are unable to log in. It is likely that most of these users give up trying to
remember their passwords and simply enter the easiest password possible to use up all five
tries. In the case of these two users who are able to log in, one of them uses the same cell
multiple times in the password, and the other has two cells in a row followed by two cells
immediately below the first two. The rules for creating a password in our implementation
simply disallow a user to have more than two cells next to each other in a row, column, or
diagonal, but does not put any restriction on repetition. Thus, none of the cases mentioned
above are in violation of these rules.
Figure 2.6 illustrates the distribution of login times, i.e., the times taken by the users
to enter their passwords. The values at the two extremes, i.e., less than 10 or higher than
70 seconds, are not likely to be observed in practice. There are instances of users who
were distracted while the login page was open or who forgot their passwords and simply
tried to complete the five trials as fast as possible, which likely account for the values at
the two extremes. There are also cases in which the users had typos leading to the letters
not matching with those in the grid. In these cases, the form fails to submit and the user
needs to reenter the password with the correct characters, resulting in a longer login time.
Due to this observation, we believe that in practice most users would display login times
between 18 and 35 seconds, but this would require more extensive testing to confirm.
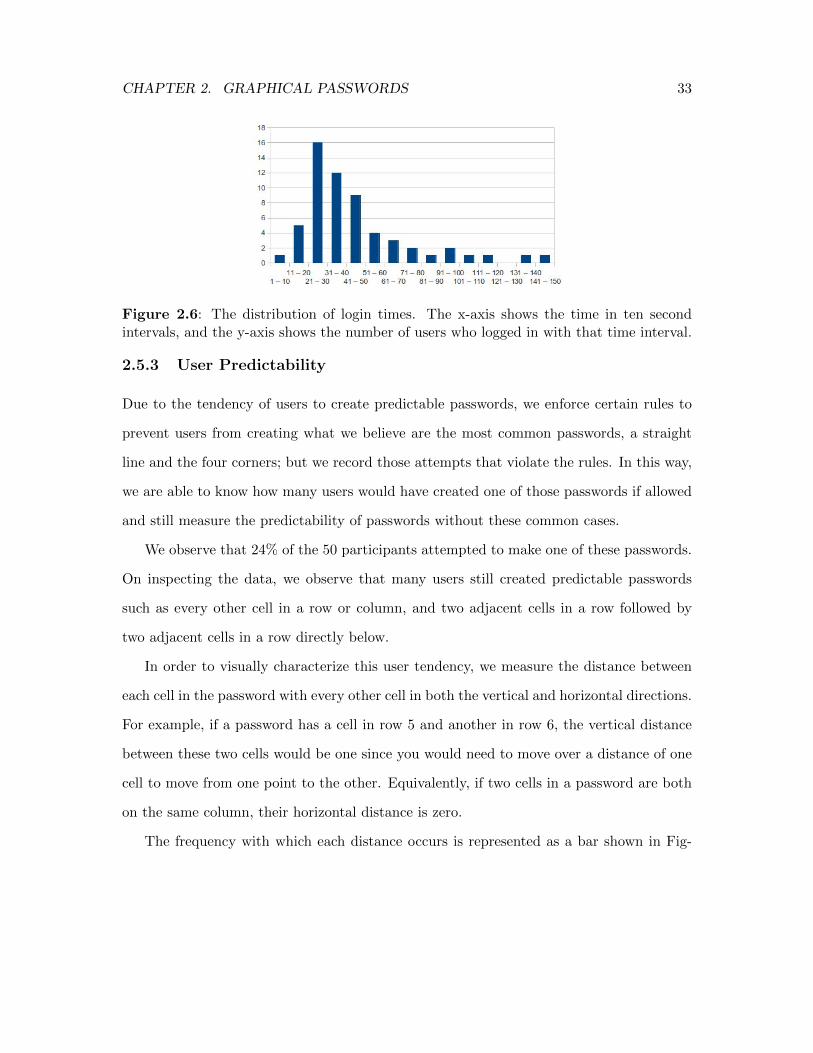
CHAPTER 2. GRAPHICAL PASSWORDS 33
Figure 2.6: The distribution of login times. The x-axis shows the time in ten secondintervals, and the y-axis shows the number of users who logged in with that time interval.
2.5.3 User Predictability
Due to the tendency of users to create predictable passwords, we enforce certain rules to
prevent users from creating what we believe are the most common passwords, a straight
line and the four corners; but we record those attempts that violate the rules. In this way,
we are able to know how many users would have created one of those passwords if allowed
and still measure the predictability of passwords without these common cases.
We observe that 24% of the 50 participants attempted to make one of these passwords.
On inspecting the data, we observe that many users still created predictable passwords
such as every other cell in a row or column, and two adjacent cells in a row followed by
two adjacent cells in a row directly below.
In order to visually characterize this user tendency, we measure the distance between
each cell in the password with every other cell in both the vertical and horizontal directions.
For example, if a password has a cell in row 5 and another in row 6, the vertical distance
between these two cells would be one since you would need to move over a distance of one
cell to move from one point to the other. Equivalently, if two cells in a password are both
on the same column, their horizontal distance is zero.
The frequency with which each distance occurs is represented as a bar shown in Fig-

CHAPTER 2. GRAPHICAL PASSWORDS 34
Figure 2.7: Distributions of distances between cells in passwords.
ure 2.7. The x axis represents a distance and the y axis represents the number of pairs
of cells that are found to have that distance from each other. The top graph displays the
calculated vertical distances (i.e., the number of rows between cells) and the bottom graph
displays the horizontal distances (i.e., the number of columns between cells). As a whole,
each of these graphs can be viewed as a probability distribution of the distance between
cells.
Both graphs have the very similar shape with the higher frequencies in the lower dis-
tances and the highest frequency occurred in the distance of one cell. This implies that
users are more likely to choose cells that are close to each other rather than those cells that
are farther away, with the most probable distance of being one.
2.5.4 Other Observations
We also study whether a user’s history of travel and residence can affect his performance
under GridMap, which uses geopolitical maps as the background image, using the data
gathered from the survey.
We observe that users who are able to successfully remember their passwords have
traveled, on average, more than those who could not remember their passwords, with an
average of 10.48 states and 4.24 countries visited for the former group, and 5.88 states and
2.66 countries in the latter. We also observe that among users who choose the U.S. map,
the ones who are able to successfully log in have lived in the United States with an average

CHAPTER 2. GRAPHICAL PASSWORDS 35
of 17.53 years as opposed to 10.66 years for those who cannot remember their passwords.
We think that these results are due to the fact that users who travel more and spend a
longer time in the locations depicted in the map have a higher familiarity with the locations
in cells on it. This would mean that there are more cells that are significant to such a user
available as choices in a password making it easier to remember later. This would suggest
that providing a user with a map of an area that is familiar and significant to him will
increase the chances of remembering his password.
2.6 Limitations
One drawback of GripMap is the amount of time it takes for a user to input a password.
This is expected because the user must perform the task of visually locating his cells on
the image first and then typing those cells’ text into the password field. This procedure,
for most users, involves looking from side to side across the screen with intermittent typing
in between. In consequence, the resulting times recorded during login sessions are slightly
slower than desired. However, we feel that many of these numbers are skewed towards one
of the extreme cases: some users either spend a lot of time trying to recall their passwords
or perform other tasks while the webpage is already up and has started to count time;
while other users simply submit blank or bogus passwords to fulfill the five tries as fast
as possible. We believe that in a real deployment, for those users who are familiar with
GridMap, the time will be between 18 and 30 seconds, but more research is required to
verify whether this is true or not.
Another problem of GripMap is the tendency of users to choose passwords with pre-
dictable patterns. About one quarter of the users in our study attempt to create highly
predictable passwords. Given the restricted rules for creating a password, we can still see a
high degree of clustering among the created passwords, which could be exploited to mount

CHAPTER 2. GRAPHICAL PASSWORDS 36
a dictionary attack. However, this security threat can be greatly reduced by employing
persuasive technology similar to that used in PCCP [15]. A number of cells in the grid
would be randomly chosen and grayed out, forcing the user to choose from the cells that
are still clear. A shuffle button would allow the user to gray out a different set of cells if
the current selection is not to his preference. This issue will be investigated in our future
work.
2.7 Conclusion
Based on grid input and geopolitical maps, we have proposed a new cued-recall graphical
password system called GridMap, which is more secure than the existing graphical password
schemes in terms of keyspace and shoulder surfing resistance. In addition, the robust
design of GridMap defends against malware like keylogger and phishing attacks.We have
developed a prototype of GridMap and conducted a user study involving 50 participants.
Our experimental results show that GridMap works well for user authentication on a daily
basis. Moreover, we have observed that those users who are more familiar with the map
images have less difficulty recalling their passwords. This observation implies that we can
further improve the memorability of GridMap by providing map images that are more
significant to users. In our future work, we will investigate how to shorten the password
input time and will apply the persuasive techniques for GridMap to reduce user password
predictability.

Chapter 3
A Naturalistic Approach to
Gender Classification
With Mouse Biometrics
The popularity of online social networks, online forums, and various online dating sites has
significantly increased the visibility of online users’ personal information. However, these
online sites also allow a great deal of anonymity in the sense that a user’s identity is tied
to the user’s account but not personally to the user. This anonymity has been exploited
by impostors, such as sexual predators, who lie about their gender or age for malicious
purposes, while a victim user has little way of verifying that the provided information is
valid. To date, very little has been done to address this problem of fake online personal
identity. A strict registration policy, such as providing legal documents, is just not feasible
for regulating this problem.
One promising alternative involves the use of physical or behavioral biometrics, such as
keystroke dynamics or mouse dynamics, to enhance user authentication. These biometrics
37

CHAPTER 3. GENDER CLASSIFICATION 38
are non-invasive and can be used actively as a confirmation step or passively through con-
tinuous re-authentication to determine the demographic characteristics of a user. However,
previous soft biometric systems tend to take a very data driven approach based on simple
aggregate measures (e.g., averages) of behavioral metrics. In this chapter, we present a new
naturalistic approach to using behavioral biometrics for verifying an online user’s gender.
The proposed approach is mainly based on two important assumptions regarding natu-
rally occurring mouse movements: (1) Gender differences naturally exist when performing
two-dimensional aiming movements of a hand held device. The support for this assumption
comes from a variety of basic and applied research domains, which include occupational
health, physical therapy, public health, ergonomics, human anatomy, and perceptual-motor
control theory. (2) The gender differences alluded to in the first assumption can be fur-
ther elaborated by tracking the changes to naturally occurring mouse movements that are
imposed by different target parameters. These target parameters are defined by the hori-
zontal and vertical distances between the start and endpoint target locations, and by the
size of the endpoint target. All three task parameters are known to affect aiming move-
ments [26, 59, 67] while recent research in perceptual-motor control has highlighted that
gender can also mediate these effects [6, 54, 55].
As a result of these two assumptions, this approach incorporates a much wider array
of mouse movement metrics than those used in previous security applications of mouse
biometrics. Consequently, the data analysis of these metrics required a different statistical
approach from that used in traditional investigations of mouse biometrics. Twenty one
different mouse movement metrics (temporal, spatial, and accuracy) were extracted from
the movements recorded, and then each metric was expressed as a vector of four variables.
The four variables correspond to the intercept and three unstandardized regression coef-
ficients that are obtained from a multiple regression equation formulated to predict each

CHAPTER 3. GENDER CLASSIFICATION 39
metric using the three target parameters (vertical distance, horizontal distance, and target
size). Binary logistic regressions were then employed to predict each participant’s gender
using an optimal subset of the multiple regression coefficients.
In the remainder of this chapter, we first give an overview of the background work in
mouse dynamics and the anthropometric differences between genders in Section 3.1. Section
3.2 describes the methodology followed for data collection and classification. Section 3.4
describes the evaluation of the system and the achieved results. Section 3.5 presents a
discussion of the results. Finally, Section 3.6 presents our conclusions.
3.1 Background
In this section we will cover the background in two areas related to our work: Behavioral
Biometrics, and Gender and anthropometric differences.
3.1.1 Behavioral Biometrics
Research interest in behavioral biometrics started in the 1990s with the study of keystroke
dynamics [46] that eventually led to research involving keystroke dynamics combined with
mouse dynamics [3].
Keystroke dynamics was originally noticed by telegraph operators in the 1860s who
wee able to identify other operators by the rhythm in which they tapped out messages[11].
Prior research, such as that performed by Monrose et al. [48, 49, 47] utilizes keystroke
dynamics for improved authentication and password hardening on systems with physical
keyboards. Further information on keystroke dynamics can be found in survey papers by
Crawford [18] and Teh, et al. [65].
In the study of mouse dynamics, although steady improvement have been seen with this
approach it has not achieved the same level of success as keyboard dynamics [40]. Mouse

CHAPTER 3. GENDER CLASSIFICATION 40
dynamics have been employed as a means of reauthentication to discriminate the identities
of web browser users [51]. Ahmed, et al. [4] used neural networks to learn a user’s mouse
dynamics in a specific environment while performing continuous identity authentication.
Hamdy and Traore [35] combined mouse dynamics with cognitive measures of visual search
capability and short term memory to create a static user verification system. These studies
highlight the utility of using mouse biometrics in user re-authentication; however their
findings are limited to identity authentication and have not been generalized to other
purposes. To the best of our knowledge, no previous studies have reported the use of
mouse biometrics to classify users’ gender.
Other uses besides identification of users have also been studied by researches. Be-
havioral biometrics have been used in the past to predict the gender of a user, but these
studies have primarily focused on keystroke dynamics. Fairhurst and Da Costa-Abreu [25]
conducted a study using a multiclassifier system on the GREYC-keystroke database [32],
and achieved an accuracy for gender prediction of 95%. Giot, et al. [33] conducted a similar
study using fixed-text input for gender prediction and reported an accuracy of 91%. They
also reported that traditional keystroke authentication systems had an accuracy increase
of 20% when combined with the user’s gender prediction model. These studies achieve
impressive accuracy for gender classification, but further research is required to determine
if these results can be generalized to different sets of keyboard data that are not fixed,
as well as to different types of keyboard interfaces. In addition, authentication systems
based on keyboard dynamics may not be suited to new graphical password interfaces (see
Biddle, et al. for a survey of these interfaces [8]). Another study in keystroke dynamics
shows that it is possible to protect against bot attacks that attempt to mimic human be-
haviours [60]. There is, however, still merit to studying the use of mouse biometrics for
use in gender prediction. There are certain systems and application in which the mouse

CHAPTER 3. GENDER CLASSIFICATION 41
is the predominant source of input as opposed to the keyboard. Should one wish to per-
form continuous authentication with a behavioral biometrics component on such system
or application, it would be better to use the mouse input. Additionally, the movement
profiles derived from targeted mouse movements allow for the extraction of a richer set of
features than a keyboard. These features could be used to compliment a keyboard system
and increase its accuracy by capturing characteristics of the user that were not apparent
in keyboard features.
3.1.2 Gender and Anthropometric Differences
Men and women clearly differ in their physical dimensions as described by anthropometric
data recorded in many countries for the purposes of monitoring public health and designing
ergonomically sound work environments. Figure 3.1 illustrates the important anthropo-
metric attributes of an individual working with a typical computer system. Maneuvering a
computer mouse across a 2-Dimensional work space requires the complex coordination of
the upper and lower arms in combination with the wrist and fingers. As shown in Figure
3.1, the anthropometric data for the upper arm length (reported by the United States
Health Department [1]) reveals large consistent gender differences in the physical dimen-
sions of a key limb component for moving a mouse on a table top. Physical differences like
these arguably underlie many of the movement and grip differences that will be described
in the remainder of this section [41].
Moving a computer mouse is classified as an aiming movement by researchers in the field
of motor behavior, and aiming movements are generally composed of consistent temporal
and spatial characteristics. An aiming movement typically includes a ballistic component
(single phase of acceleration followed by deceleration) that corresponds to the main move-
ment of the hand into the general area of the target location. The ballistic component is

CHAPTER 3. GENDER CLASSIFICATION 42
Figure 3.1: Differences in arm length and hand size between genders as recorded by theUnited States Census Bureau.
Figure 3.2: Anatomical terms for motions of upper limb, wrist, and joints.
followed by a sequence of sub-movements (multiple phases of acceleration and deceleration)
that consist of small spatial corrections of the hand to reach the final target destination [50].
The field of motor behavior suggests that men and women differ in their aiming movements
with men tending to move faster than women and with less accuracy [6, 54, 12, 24, 64]. It
was also reported that the location of the target in relation to the hand being used affected
the accuracy of movements made by men, but showed no significant effect on women’s
movements [54]. These results not only highlight gender differences in movement behavior,
but also stress the importance of incorporating target parameter effects when investigat-
ing these gender differences. Here the target parameters include target size, horizontal
distance, and vertical distance.
Research in physical therapy that has examined the effects of mouse use on wrist and

CHAPTER 3. GENDER CLASSIFICATION 43
arm pain in computer users has shown gender differences in hand and arm postures when
performing movements with a mouse. A study on the finger postures of mouse users showed
that men more frequently had a finger posture, in which the finger used for mouse clicking
had a lifted finger posture where the middle portion of the finger was not in contact with
the mouse [44]. Male participants in this study were also more likely to show an extended
finger posture with a flexion angle of less than 15 degrees when gripping the mouse (refer to
Figure 3.2 for an illustration of relevant movement terms). These different grip postures
may not only affect mouse movement characteristics, but also influence mouse button
presses that can also be an important component of mouse biometrics. Johnson, et al.
[39] found that women exerted more relative force on the mouse when gripping it, while
Wahlstrom, et al. [69] reported that women exerted more force on the mouse button while
pressing it. Johnson and colleagues also revealed different wrist postures between men and
women when moving the mouse with women showing higher wrist extensions, larger ulnar
deviations (refer to Figure 3.2), a larger range of motion in the wrist, and higher wrist
velocities. A similar study by Yang and Cho [76] reported larger elbow flexion angles in
men as well as different ulnar deviations, but in this study it was the men who exhibited
the larger ulnar deviation angles. All of these different grip postures have the potential to
affect mouse movement characteristics, including mouse button presses that can also be an
important component of mouse biometrics. The results of these studies suggest that mouse
biometrics should not only consider movement characteristics of aiming movements, but
also consider movement characteristics unique to the physical manipulation of gripping a
computer mouse.

CHAPTER 3. GENDER CLASSIFICATION 44
3.2 Methodology
This section describes the apparatus and method used for data collection, as well as the
data analysis procedures.
3.2.1 Data Collection
There are 94 participants (45 men and 49 women) aged between 17 and 48 years par-
ticipated in this study. The participants consist of students, faculty, and staff who were
all experienced computer mouse users. The male and female participants did not differ
statistically with respect to prior computer use experience or age.
All participants were seated in a static non-reclining chair in front of a computer monitor
with the right hand resting comfortably on the same mouse and table surface used by all
participants. Participants were instructed to find a seating location and arm posture in
which moving the mouse would feel the most natural to them. They were requested to
maintain this posture while conducting all experiment trials.
Raw mouse movement data were collected using an application implemented with the
processing programing language. The same home (starting point) target was used on all
trials and was displayed within an application window. Once a participant positioned the
cursor on the home target and clicked the mouse button, this target was hidden and a
new endpoint target was displayed. The screen position of the mouse was recorded at a
rate of approximately 100Hz with each data point consisting of a timestamp, the x screen
coordinate, the y screen coordinate, and a tag that identified what type of a movement
event was recorded. The movement events consisted of a standard movement event (mouse
stationary or in motion without the left button being depressed), a target click event (left
mouse button depressed while the mouse cursor is located inside the target area), a click
event (left mouse button depressed while the cursor is outside of the target area), and a new

CHAPTER 3. GENDER CLASSIFICATION 45
Figure 3.3: Illustration of screen target positions for movements of mouse cursor. Hometarget is shown in blue, and all endpoint targets in red.
target event (a new target displayed and the location and size of the target are recorded,
instead of the mouse location).
The display window consisted of a rectangular frame (1680 px × 1050 px) displayed
on a 45 × 30 cm computer monitor. As Figure 3.3 shows, the home target consisted of a
blue 30 px radius circle located in the center of the display window. All endpoint targets
were displayed as red circles and consisted of one of two possible target sizes (30 px or 60
px radius) located at one of 16 possible locations. The endpoint target locations varied in
their direction of approach and in their distance from the starting target position.
Each participant was instructed to move the mouse cursor from the home target to the
endpoint target. Once the participants had located the cursor in the home target circle,
they were requested to click the mouse button to start the trial. The participants were
instructed to only pick up the mouse when readjusting the starting position of their hands
on the table, during which they were moving the screen cursor back to the home target.
Each participant conducted a sequence of 32 practice trials that consisted of all 32 possible
combinations of target size, target distance, and angle of approach as describe above. After

CHAPTER 3. GENDER CLASSIFICATION 46
successfully completing the practice trials, each participant then performed four blocks of
64 movement trials with each block of trials consisting of a random sequence of two trials
for each combination of the 16 target locations and two target sizes. The participants were
allowed to take a short rest after completing each block of movement trials.
3.2.2 Movement Metrics
The profiles of distance and velocity were extracted from the raw data of each movement
trial. These profiles were used to calculate 10 temporal metrics that distinguish aiming
movements and button presses. The each movement was smoothed, and then 6 spatial
metrics were calculated to highlight differences in the trajectory. Five accuracy metrics
were also calculated for each mouse movement. Following the naturalistic approach, the
choices of these metrics were guided by previous empirical research on gender differences
in aiming movements that have used the same or similar metrics [6, 54, 55, 12, 36, 64, 24].
For example, researchers have reported that men are quicker at perceiving object location,
faster in their movements, rely less on visual guidance of the ballistic component of the
movement, perform less visual corrections towards the endpoint of the movement, and are
less accurate when they reach the endpoint of the movement. Some additional metrics were
calculated, because prior empirical research would imply gender differences are possible for
these mouse metrics even if they were not reported in the actual studies. For example,
males and females differ in their grip postures of the mouse and positioning of the finger
over the mouse button [39, 44, 76], implying that gender differences could exist for metrics
influenced by these grip postures.
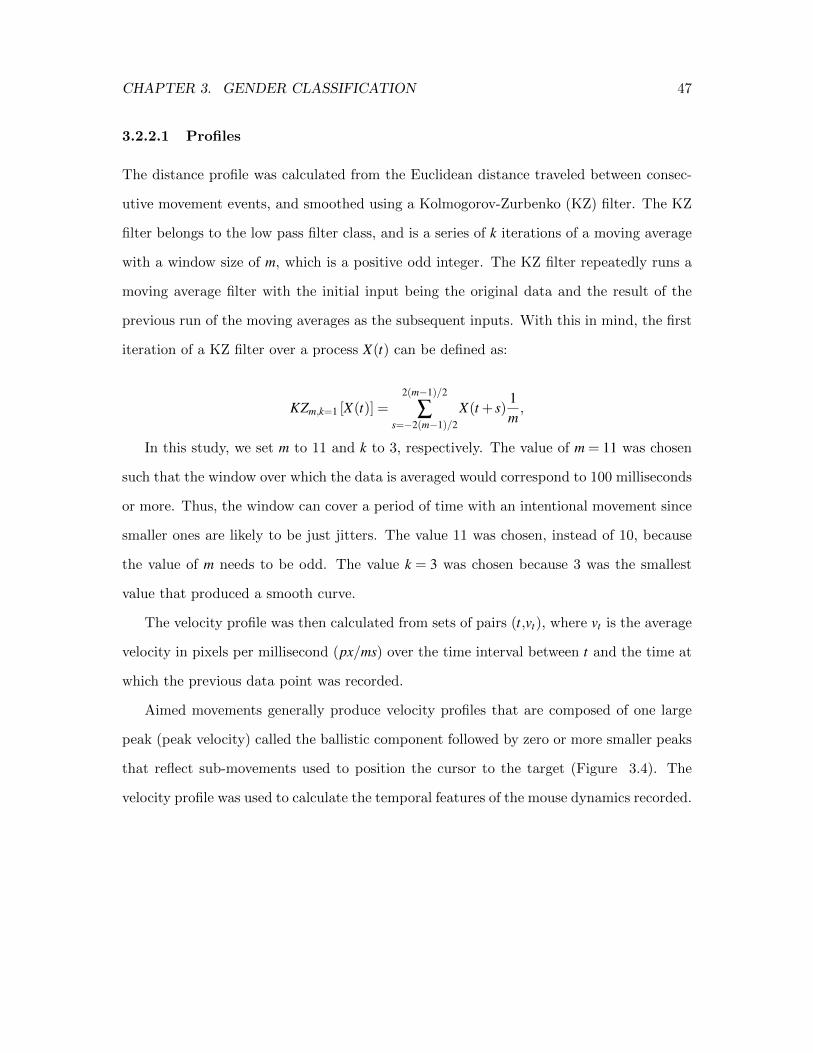
CHAPTER 3. GENDER CLASSIFICATION 47
3.2.2.1 Profiles
The distance profile was calculated from the Euclidean distance traveled between consec-
utive movement events, and smoothed using a Kolmogorov-Zurbenko (KZ) filter. The KZ
filter belongs to the low pass filter class, and is a series of k iterations of a moving average
with a window size of m, which is a positive odd integer. The KZ filter repeatedly runs a
moving average filter with the initial input being the original data and the result of the
previous run of the moving averages as the subsequent inputs. With this in mind, the first
iteration of a KZ filter over a process X(t) can be defined as:
KZm,k=1 [X(t)] =2(m−1)/2
∑s=−2(m−1)/2
X(t + s)1m,
In this study, we set m to 11 and k to 3, respectively. The value of m = 11 was chosen
such that the window over which the data is averaged would correspond to 100 milliseconds
or more. Thus, the window can cover a period of time with an intentional movement since
smaller ones are likely to be just jitters. The value 11 was chosen, instead of 10, because
the value of m needs to be odd. The value k = 3 was chosen because 3 was the smallest
value that produced a smooth curve.
The velocity profile was then calculated from sets of pairs (t,vt), where vt is the average
velocity in pixels per millisecond (px/ms) over the time interval between t and the time at
which the previous data point was recorded.
Aimed movements generally produce velocity profiles that are composed of one large
peak (peak velocity) called the ballistic component followed by zero or more smaller peaks
that reflect sub-movements used to position the cursor to the target (Figure 3.4). The
velocity profile was used to calculate the temporal features of the mouse dynamics recorded.

CHAPTER 3. GENDER CLASSIFICATION 48
Figure 3.4: Example of a velocity profile with various temporal metrics illustrated.
3.2.2.2 Temporal Movement and Button Press Metrics
• Reaction time (RT): the time from when the endpoint appears on screen until the
movement towards it is initiated. The onset of the movement was determined to
begin at the point when movement velocity exceeded 7% of the peak velocity (Figure
3.4). Various methods were tested for determining the beginning point of movements
using a visual inspection of a randomly selected group of trials and a set of known
edge cases. Through this testing, we found that using the percentage of peak velocity
exceeded with a value of 7% was the most effective solution.
• Peak velocity (PV): the maximum velocity in the movement (Figure 3.4).
• Time to peak velocity (TPV): the time interval from the beginning of the movement
until the peak velocity was reached (Figure 3.4).
• Duration of ballistic component (DB): time until first local minima after peak velocity
(Figure 3.4).

CHAPTER 3. GENDER CLASSIFICATION 49
• Shape of the velocity profile (SV): a symetry measure where peak velocity duration
is divided by ballistic component duration (Figure 3.4).
• Proportion of the ballistic component (PB): The duration of the ballistic component
divided by the movement time(Figure 3.4).
• Number of movement corrections (NC): total number of local maxima in the velocity
profile after the ballistic component (Figure 3.4).
• Time to click (TC): the time interval between the arrival at the endpoint of the
movement and the pressing of the mouse button.
• Hold time (HT): the amount of time the user held the mouse button down after the
endpoint of the movement was reached.
• Movement time (MT): the time interval from the beginning of the movement until
the endpoint of the movement.
Figure 3.5: Example of a mouse trajectory to illustrate differences between three move-ment change metrics with task axis drawn in a dashed line.
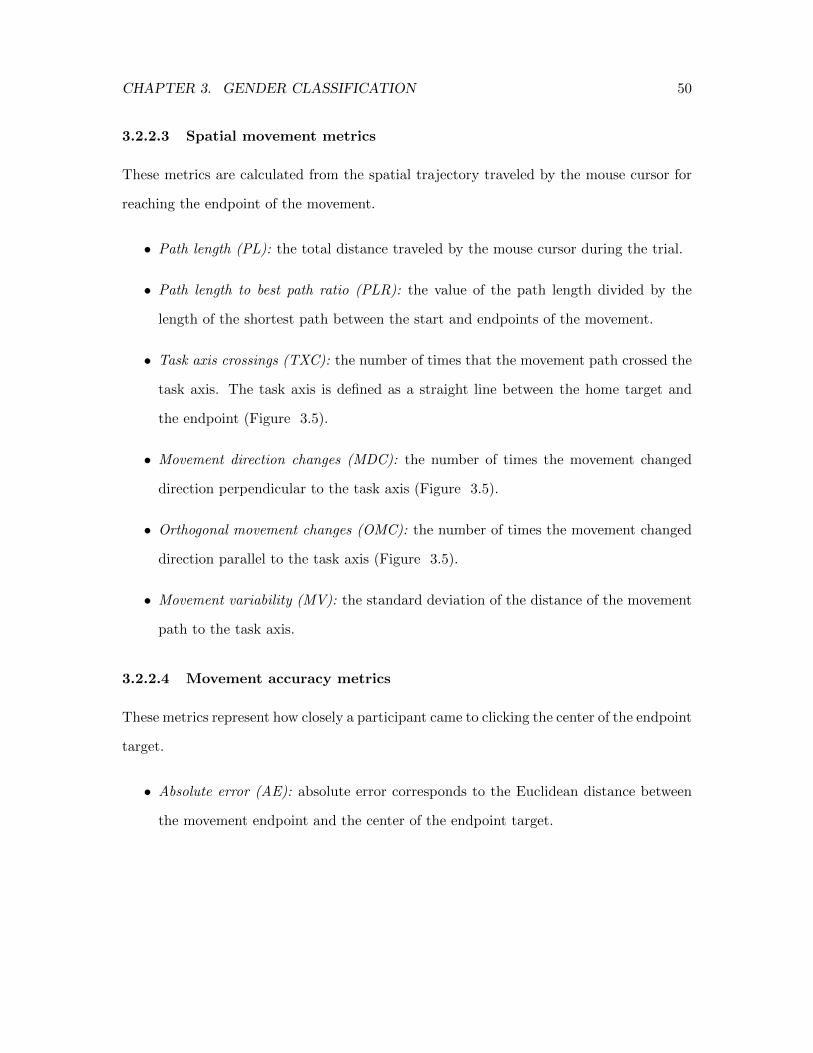
CHAPTER 3. GENDER CLASSIFICATION 50
3.2.2.3 Spatial movement metrics
These metrics are calculated from the spatial trajectory traveled by the mouse cursor for
reaching the endpoint of the movement.
• Path length (PL): the total distance traveled by the mouse cursor during the trial.
• Path length to best path ratio (PLR): the value of the path length divided by the
length of the shortest path between the start and endpoints of the movement.
• Task axis crossings (TXC): the number of times that the movement path crossed the
task axis. The task axis is defined as a straight line between the home target and
the endpoint (Figure 3.5).
• Movement direction changes (MDC): the number of times the movement changed
direction perpendicular to the task axis (Figure 3.5).
• Orthogonal movement changes (OMC): the number of times the movement changed
direction parallel to the task axis (Figure 3.5).
• Movement variability (MV): the standard deviation of the distance of the movement
path to the task axis.
3.2.2.4 Movement accuracy metrics
These metrics represent how closely a participant came to clicking the center of the endpoint
target.
• Absolute error (AE): absolute error corresponds to the Euclidean distance between
the movement endpoint and the center of the endpoint target.

CHAPTER 3. GENDER CLASSIFICATION 51
Figure 3.6: Graphical depiction of movement accuracy metrics.
• Horizontal error (HE): the difference in the horizontal (x) coordinates between the
movemnet endpoint and the center of the endpoint target. Negative errors reflect
undershooting the target.
• Vertical error (VE): the difference in the vertical (y) coordinates between the end-
point of the movement and the center of the end position target. Negative errors
reflect undershooting the target.
• Absolute horizontal error (AHE): the absolute value of the difference in the horizontal
coordinates between the movement endpoint and the center of the endpoint target.
• Absolute vertical error (AVE): the absolute value of the difference in the vertical
coordinates between the movement endpoint and the center of the endpoint target.
These defined errors are illustrated in Figure 3.6, where an absolute error consists of
Euclidean distance between the end of a movement and the center of an endpoint target.
The horizontal error corresponds to the difference in the x coordinates of the movement
endpoint and the center of the endpoint target. The vertical error corresponds to the
difference in the y coordinates of the movement endpoint and the center of the endpoint

CHAPTER 3. GENDER CLASSIFICATION 52
target. In both cases, a negative value depicts undershooting and a positive value depicts
overshooting.
3.2.3 Data filtering
Before calculating the movement metrics for each participant as described above, the move-
ment data were filtered to remove invalid trials where mouse movements did not fall within
the acceptable criteria for successful movement recording. The trials in which mouse move-
ments clearly left the designated screen window were rejected, as well as the trials where
the reaction times were less than 150 ms. This value of 150 ms was chosen because the
lower end of human reaction time is 100 ms. However, the method of determining the start
of the movement is not perfect and causes some false positives. The same visual testing
for determining the movement onset was used here, and we found that the value of 150
ms made a good balance between the false positive ratio and the false negative ratio while
determining if the reaction time value was realistic. Only 4% of data points were rejected
for these reasons across those more than 24,000 trials recorded.
3.3 Model design
The gender classification model results from a two-step procedure of statistical analyses.
The first step involves conducting least-squares multiple regressions to determine the effects
of target parameters (target size, horizontal distance, and vertical distance) on movement
metrics for each participant. The resulting unstandardized regression coefficients provide a
movement signature for each participant, which will be used to distinguish the correspond-
ing participant’s gender. The second step involves conducting logistic regressions to select
the statistical model that most accurately classifies participants by gender.
CHAPTER 3. GENDER CLASSIFICATION 53
3.3.1 Mouse signatures
Traditional analyses of mouse biometrics usually rely on a single aggregate indicator (e.g.,
average) for each metric. Unfortunately, previous studies have shown that this approach
may be ineffective. For example, in the study conducted by Rohr [54], men were shown
to have their accuracy reduced as a target was made smaller and placed further away,
whereas women were more consistent with their accuracy. By simply taking the average
accuracy, the effect that the size and distance of the target had on men represented in the
data will be diminished or lost since the lower values would counteract the higher values.
To counteract this it is necessary to find a way to produce features which capture not
only the actual values observed in the data, but also the amount of change that the target
parameters caused. Our approach involves a more detailed analysis that incorporates the
effects of target parameters on these mouse metrics. The effects of target parameters on
the mouse metrics were quantified by unstandardized regression coefficients obtained from
a multiple linear regression analysis with least squares fitting conducted for each metric.
Multiple regression analyses predict the scores of a dependent variable y by fitting a straight
line defined by a set of independent variables {x1,x2,x3, ...} to a set of known data points
(yi,x1,i,x2,i, ...).
The least squares fitting method estimates the values of a and bk by reducing the squares
of the residuals such that the following equation is minimized:
r
∑i=1
ε2i =
r
∑i=1
[yi− (a + β1x1,i + b2x2,i + ...+ bnxn,i)]2 .
Three target parameters were chosen as predictor variables for these multiple regres-
sions: the size of the endpoint target, the vertical distance between the home and endpoint
targets, and the horizontal distance between the home and endpoint targets. The target
distance was measured in separate horizontal and vertical components, because prior re-

CHAPTER 3. GENDER CLASSIFICATION 54
search suggests that these components should be the most influential on aiming movements
rather than more complex combinations of the angle of approach and distance moved [68].
Absolute values were used for the distances traversed because previous research also sug-
gests that the direction of movement (left vs. right and up vs. down) does not affect
movement metrics as much as whether it is just a vertical movement or a horizontal move-
ment [21, 20]. Consequently, the size and sign of the regression coefficients for the distance
variables simply represent how much of an effect, moving vertically or moving horizontally,
had on the predictability of a metric.
For each metric recorded, three regression coefficients and the intercept value were
provided to highlight the effect of these target parameters on the metric. For example,
if the peak velocity (PV ) was used as the dependent variable, four values were provided
for this metric (intercept value PVconst , regression coefficient for horizontal distance moved
PVhorz, regression coefficient for vertical distance moved PVvert , and regression coefficient
for target size PVsize). This results in a metric vector for the peak velocity that specifies
the following equation:
PV = PVconst + PVsize(size)+ PVvertD(vertD)+ PVhorzD(horzD).
It was expected that these regression variables would better reveal gender differences
in the metrics. This assumption is supported by 4-way ANOVAs (gender × target size ×
distance × angle of approach) that were conducted for each metric. The significant results
of these ANOVAs are summarized in Table 3.1. These results clearly show that many of the
metrics revealed consistent target parameter effects, and these effects could be mediated
by gender.

CHAPTER 3. GENDER CLASSIFICATION 55
Variable Significant effectsReaction time Gender, Distance, Size, Angle, Distance × Angle,
Gender × Distance × Size × AngleMovement time Distance, Size, AngleHold time Gender, Size, AngleTime to Peak V Distance, Size, Angle, Distance × Angle, Gender × Size × AnglePeak velocity Distance, Size, Angle, Distance × AngleT ballistic comp Distance, AngleShape of velocity profile Distance, Angle, Distance × AngleBallistic prop Distance, Size, Angle, Gender × Size, Distance × Size, Distance × Angle,
Size × AngleN of corrections Distance, Size, Angle, Distance × Size, Distance × Angle, Size × AngleTime to press Size, AnglePath length Distance, Size, Angle, Gender × Size, Distance × Angle,
Gender × Size × AnglePath L best ratio Distance, Size, Angle, Size × AngleAxis crossings Distance, Angle, Distance × AngleDirection changes Distance, Size, AngleOrthog changes Distance, Size, Angle, Distance × Angle, Size × AngleMovement var Distance, Angle, Distance × Gender, Distance × Angle,
Gender × Distance × AngleIndex of DIff Distance, Size, Angle, Distance × Size, Distance × Angle, Size × Angle,
Distance × Size × AngleIndex of Performance Distance, Size, Angle, Size × AngleHorizontal error Size, Angle, Size × Angle, Gender × Distance × AngleVertical error Size, Angle, Size × AngleAbsolute error Distance, Size, Angle, Size × Angle
Table 3.1: Significant main effects and interactions found for 4-way ANOVAs (Gender ×Distance × Angle of approach × Target size) conducted for each metric.
3.3.2 Gender prediction model
The second step in developing a gender prediction model involves with the input of the
metric variables obtained from each participant in a logistic regression to predict the gender
of a participant. The logistic regression is often used for classification when dependent
variables have binary values. The curve used in this type of regression is an S shaped curve
asymptotically tapered between 0 and 1 and is derived from the following linear relation:
logit(P) = α + β1x1 + β2x2 + ...,
where logit(P) refers to the natural logarithm of the odds function This function can then
be substituted into the original linear relation and be solved for P giving the formula:

CHAPTER 3. GENDER CLASSIFICATION 56
Full set Outliers removed
Set Labeled Labeled 70% Unlabeled 30% Labeled Labeled 70% Unlabeled 30%
Male 91.1% 83.9% 57.1% 100% 100% 71.4%
Female 87.8 % 91.2% 86.7% 100% 100% 80.0%
Total 89.4% 87.7% 72.4% 100% 100% 75.9%
Table 3.2: Accuracy of predicted results. Labeled set refers to the full data set used inSection 4.1. Labeled 70% and unlabeled 30% refer to the training set and test set used inSection 4.2, respectively.
P =eα+β1x1+β2x2+...
1 + eα+β1x1+β2x2+...,
where P is the probability that the dependent variable has the outcome coded as 1 given
the values of xi.
The values of constant α and coefficients βi are determined by maximizing the condi-
tional probability of the observed data, given the parameters used as predictors. An initial
model is constructed with arbitrary values for the coefficients, and the conditional proba-
bility is evaluated. The coefficients are then modified in order to increase this probability,
and the procedure is repeated until the model converges or a maximum number of itera-
tions are reached. A maximum of 20 iterations were allowed to determine the values of the
coefficients, and the results lead to a threshold value of 0.5 (i.e., whose values above 0.5
were considered as male and whose values no larger than 0.5 were considered as female).
3.4 Evaluation
The accuracy of the proposed approach for classifying a user’ gender was evaluated on
both labeled and unlabeled data. The labeled data consisted of the full data set, while the
unlabeled data test was performed with 70% of the participants used as the training set
and the remaining 30% of participants used as the test set.
CHAPTER 3. GENDER CLASSIFICATION 57
3.4.1 Labeled Data Analysis
In this section, we verify how well a model may be fit the data and the accuracy of such a
model on users who have been sighted before. We also use this step to identify any users
with unusual characteristics as outliers. The logistic regression model was tested on all
94 participants, but given the very large number of predictor variables (21 metrics × 4
metric features = 84 predictor variables) only smaller sub-sets of predictor variables were
actually tested. The first subset of predictor variables was determined by testing each
metric separately. The four features of each metric were tested as a single group separate
from the features of the other metrics. The statistical significances (p < 0.05) of each
metric’s variables for predicting gender determined if these variables were included in the
first sub-set of predictor variables. The significant predictors included in this subset were:
{HTconst , PVhorz, PBsize, TCconst , TChorz, MDCconst , MDChorz, MDCsize, AEconst}. To improve the
overall accuracy of this model, additional predictor variables were included while providing
a moderate level of statistical significance (p < 0.1) in predicting gender when each metric
was tested separately. Two additional variables were included to this sub-set of predictor
variables: PBconst and PLRvert . The amount of explained variance in gender classification
using these two subsets of variables was 0.532 according to the Nagelkerke pseudo r-squared
measure, and the classification accuracy based on this model was 75.5%.
The first subset of predictor variables was reduced from a total number of 84 to 9
by examining each metric’s predictive power one metric at a time. However, a better
subset of predictors may be possible if multiple metrics are included in the initial logistic
regression model. One way to reduce the number of tested metrics is to only include those
metrics that can characterize significant gender effects from the previously conducted 4-
way ANOVAs. These findings highlight the metrics that show consistent gender differences
or interactions of gender with target parameters. We also included those metrics published
CHAPTER 3. GENDER CLASSIFICATION 58
by other researchers with significant gender effects. The logistic regression model was
tested again with a new subset of predictors that included the four variables for each of
these metrics: {RT , HT , T PV , PB, PL, MV , AE, HE, TC, PV , AHE, AV E, V E}. The 52
predictor variables in this subset were added to the original subset with a stepwise method,
and the following 10 new variables were revealed as significant predictors: {RTsize, RThorz,
RTvert , T PVvert , MVconst , MVvert , MVhorz, PVconst , PVvert , V Econst}. The amount of explained
variance after the addition of these variables to the final model was 0.676, and the resulting
classification accuracy was 89.4%.
We now test the effects that outliers had on the model. Five users were identified as
having scores that were more than two standard deviations away from the mean. These
are likely users with mouse movement characteristics that do not entirely fit the average
for their gender, since there can be an overlap of physical characteristics between the two
populations and such an overlap affects the features being used. After the removal of these
outliers, our model can discriminate the gender of the remaining 89 participants with an
accuracy of 100%. It is difficult to uncover the actual causes for these outliers, and they can
occur for a variety of reasons including, but not limited to, distraction or injury. In a real
application, one would likely test for outliers at input time, and if an outlier is detected,
the user would be asked to re-do the input trials in the case of a one time authentication.
3.4.2 Unlabeled Data Analysis
To evaluate the accuracy of our approach on unlabeled data, the movement data from 65
randomly selected participants were used as the training set to create the logistic regression
model. And the model was then tested on the movement data from the remaining 29
participants who comprised the test set. The same variable selection procedure was followed
with the unlabeled data as the one used for the labeled data, except that substantially fewer

CHAPTER 3. GENDER CLASSIFICATION 59
participants were involved in these selections.
The statistically significant predictors determined for subset one were: HTconst , TChorz,
MDCconst , MDCsize, MDChorz, AEconst , AHEconst , AHEhorz, RTconst , PBsize, and V Evert . Six of
these predictor variables were consistent with the selections based on the full data set
(labeled data). The fit of this model was tested on the training set and accounted for
0.449 of the explained variance in predicting gender with a correct classification of 76.9%
of the participants in the set. The second subset included the following predictor variables:
{PVconst , PVvert , PVhorz, MVvert , RTsize, RTvert , RThorz}. All seven variables were included in
the subset of the predictors obtained previously with the full data set (labeled data). This
overlap shows that this feature selection method produces a set of features close to what is
expected based on research in other fields. On the other hand, what can be observed over
the entire set may still have sensitivity to the training set, which one should be careful of
when fitting the model. The fitness of this model with the combined subsets was tested
on the training set and accounted for 0.579 of the explained variance in predicting gender.
This final model was tested on the test set and was able to achieve a gender classification
accuracy of 72.4%. After removing the outliers identified previously in the labeled data
analysis, the test set was then classified with a 75.9% accuracy. These results suggest that
outliers have a visible effect on the classifier, but the negative impact is relatively small.
3.5 Discussion
Men and women differ naturally, both physically and psychologically. The development
of computer security tools can take advantage of these natural differences by focusing
authentication procedures on these differences. This study used the naturalistic approach
to successfully classify male and female participants by measuring the temporal, spatial,
and accuracy characteristics of their mouse movements while evaluating how these mouse

CHAPTER 3. GENDER CLASSIFICATION 60
metrics were affected by target parameters.
The measurement of one such metric, movement accuracy, will be used to exemplify
this approach to the biometric analysis of mouse dynamics. Previous research with aiming
movements has revealed gender differences in the spatial accuracy of these movements with
women being on average more accurate than men [6, 54]. However, this gender difference
is actually more complicated than one suggested by simply comparing average errors, be-
cause target parameters (target size, distance moved, and direction of movement) can also
differentially affect the movement accuracy of men and women [54]. In support of this
premise, our study also found complex interaction effects of gender and target parameters
on spatial error. Consequently, rather than just recording the mean accuracy of each par-
ticipant’s movements, a multiple regression analysis was conducted to predict spatial error
using target parameters (size, horizontal distance, vertical distance) as predictor variables.
This novel approach to biometric analysis comes with some cost, because there are now
four variables representing each metric’s potential contribution to the prediction model.
Given the relatively large number of movement features already required by our approach,
a large number of predictor variables could be introduced to discriminate the gender of a
participant using logistic regressions. Therefore, two criteria were followed to reduce the
set of predictor variables for testing: (1) each metric was tested individually and only those
variables that were significant predictors of gender in these tests were included in the first
subset of predictors, (2) all the metrics that produced significant ANOVA gender effects
and those with gender effects suggested in prior research were included in a second subset.
Our logistic regressions produced correct classification of a participant’s gender at a rate of
89.4 - 100% for the labeled data and 72.4 - 75.9% for the unlabeled data. These results are
very promising given the limited range of values provided for each target parameter in this
study. These values are an improvement when compared to the base in which one simply
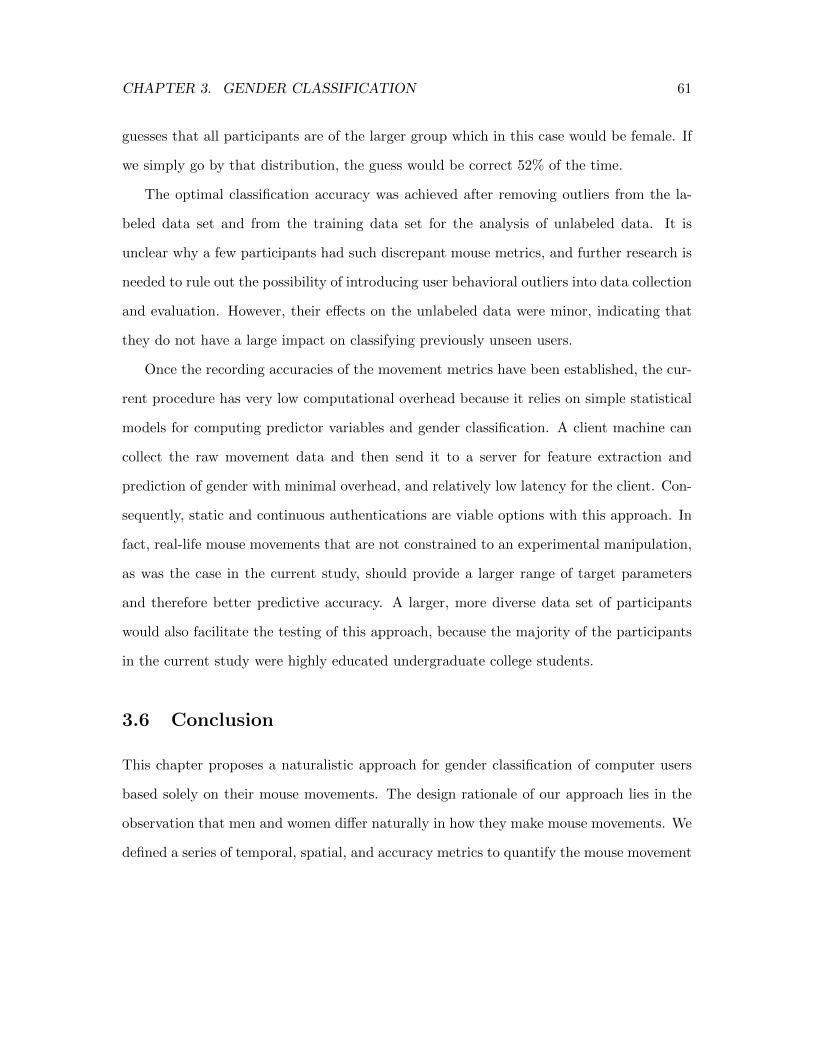
CHAPTER 3. GENDER CLASSIFICATION 61
guesses that all participants are of the larger group which in this case would be female. If
we simply go by that distribution, the guess would be correct 52% of the time.
The optimal classification accuracy was achieved after removing outliers from the la-
beled data set and from the training data set for the analysis of unlabeled data. It is
unclear why a few participants had such discrepant mouse metrics, and further research is
needed to rule out the possibility of introducing user behavioral outliers into data collection
and evaluation. However, their effects on the unlabeled data were minor, indicating that
they do not have a large impact on classifying previously unseen users.
Once the recording accuracies of the movement metrics have been established, the cur-
rent procedure has very low computational overhead because it relies on simple statistical
models for computing predictor variables and gender classification. A client machine can
collect the raw movement data and then send it to a server for feature extraction and
prediction of gender with minimal overhead, and relatively low latency for the client. Con-
sequently, static and continuous authentications are viable options with this approach. In
fact, real-life mouse movements that are not constrained to an experimental manipulation,
as was the case in the current study, should provide a larger range of target parameters
and therefore better predictive accuracy. A larger, more diverse data set of participants
would also facilitate the testing of this approach, because the majority of the participants
in the current study were highly educated undergraduate college students.
3.6 Conclusion
This chapter proposes a naturalistic approach for gender classification of computer users
based solely on their mouse movements. The design rationale of our approach lies in the
observation that men and women differ naturally in how they make mouse movements. We
defined a series of temporal, spatial, and accuracy metrics to quantify the mouse movement

CHAPTER 3. GENDER CLASSIFICATION 62
differences between male and female users. In particular, we identified the metrics related
to peak velocity, length of the deceleration phase, target accuracy, finger posture, and
reaction time are relevant to gender classification. There were 94 volunteers participated
in this study, and a mouse signature was created for each participant. We evaluated the
efficacy of our approach for gender classification by conducting binary logistic regression
tests, and achieved promising results.

Chapter 4
Feasibility of Multi-Finger
Authentication with Touch Screen
Devices
In this chapter, we explore two forms of security enhancements to authentication on mobile
devices using touch screen features. First, we present a novel scheme called Triple Touch
PINs (TTP), which makes use of the multi-touch features of touch screens. Second, we
explore the use of touch screen sensors in touch dynamics to perform Multi-Finger Authen-
tication (MFA), in which the user may create PINs and passwords using different fingers
to increase security.
In TTP, we propose a novel enhancement to the traditional PIN based authentication.
In this new scheme, users always use three fingers to press one, two, or three digits at the
same time to create logins. Security analysis shows that this scheme has a considerably
larger keyspace than traditional PIN systems and offers some advantages for shoulder surf-
ing resistance. In a user study carried out with 25 participants, we show that participants
63

CHAPTER 4. MULTI-FINGER AUTHENTICATION 64
were willing to use the system to access sensitive data. Although participants had trou-
ble in the beginning, they were able to perform well on entering their logins with some
practices, and did not show any major predictable patterns when creating their logins.
For MFA, we explore the viability of finger identification with use of touch screens on
mobile devices. Classifiers were built based only on features derived from the force and size
of touch events on the screen. Several classifiers were tested and the best was chosen to run
on the final data set collected from 33 participants. Our results show that it is possible to
build systems that perform finger differentiation, but with limitations. The systems need
to be limited to the thumb and pinkie fingers, although it may be possible to include the
index finger too. Additionally there are requirements for the way users interact with the
screen, which limit the use to harden existing authentication systems and are not ideal for
continuous authentication.
This chapter is structured as follows. Section 4.1 reviews the background and related
work on touch dynamics and multi-finger authentication schemes. Section 4.2 describes the
design of TTP and the experiment used to test MFA. Section 4.3 describes the implemen-
tation of the application used to evaluate the schemes proposed in this chapter. Section 4.4
presents our evaluation results of the schemes proposed in this chapter. Finally, Section
4.5 summarizes this work.
4.1 Background
As mobile devices have become more common and new security concerns, such as shoulder
surfing or device theft, arise from nature of the mobile environment, many solutions have
been proposed to address the emerging security problems. Much of the research effort has
focused on improving or hardening existing systems such as the PIN unlock or pattern
unlock screen. Some of these solutions use an adaptation of keystroke dynamics called

CHAPTER 4. MULTI-FINGER AUTHENTICATION 65
touch dynamics.
Keystroke dynamics refers to the use of typing rhythm and timing to distinguish be-
tween two individuals. These systems generally measure the time between key presses and
the amount of time keys are held down by a user. Applying keystroke dynamics concepts
to soft keyboards on mobile devices presents different challenges than on regular systems.
Users normally only use one or two fingers to interact with soft keyboards, and the par-
ticular fingers or even hand used may vary. However, mobile devices have the advantage
of providing output from various sensors such as the accelerometer and gyroscope. The
process of applying these features to authentication is referred to as touch dynamics.
Saevanee et al. [57] performed a study by applying keystroke dynamics to the dial pad
on a mobile device with a touch screen for users entering phone numbers. The researchers
extracted features related to traditional timing metrics and pressure values. The Equal
Error Rate (EER) was calculated for each feature separately, and the lowest value found
was 1% using Probabilistic Neural Networks and K-Nearest Neighbor models. Zheng et
al. [78] conducted a study in which keystroke dynamics was applied to 4-digit and 8-digit
PINs entered by users on an unlock screen style input. The system used the acceleration,
pressure, and size of the touch inputs as well as the traditional timing features. This
system achieved an EER between 3.65% and 4.45% using distance metrics between feature
vectors that were used as inputs for an SVM classifier. A survey of the touch dynamics field
is available from Teh et al. [66]. Touch dynamics was also applied to graphical password
systems that had similar inputs as key pads for PIN entry. Chang et. al. [13] applied touch
dynamics to a recognition based graphical password system where images were chosen by
a user, and then were transparently divided into thumbnails. A user’s input would be
entered by touching the thumbnails with the end result functioning similar to a PIN. This
system also used distances between feature vectors and achieved an EER of 12.2%.

CHAPTER 4. MULTI-FINGER AUTHENTICATION 66
Research has also applied touch dynamics to finger movements on touch screens, such as
those from the pattern unlock on android systems or variants of the swipe unlock on iPhone
systems. De Luca et al. [19] created proof of concept systems in which the viability of
implicit authentication through touch dynamics was verified with Android unlock patterns
and with variations of the swipe unlock screen. The systems used Dynamic Time Warping
on the movements and reported a 77% accuracy on the swipe unlock tests and 91% -
96% on the Android pattern unlock. Angulo et al. [5] also applied touch dynamics to
the pattern unlock on Android systems for two-factor authentication. Their study used
two features for classification, the time a finger spent paused on a dot in the pattern and
the time a finger was in motion between dots. User models were created with a Random
Forrest classifier and achieved an EER of 10.39%.
Other research has focused on applying touch dynamics for continuous authentication.
Frank et al. [30] proposed a system for continuous authentication, and tested it by having
users read documents on a mobile device and recording the finger swipes they used to
scroll the documents. Several ballistic movement features were extracted from the user
tracks and used in two classifiers: KNN and SVM. They reported EER of 4% or lower.
Gascon et al. [31] presented a different method of continuous authentication through text
entry. Their method extracted time based features from the user’s typing behaviors and
used an SVM classifier to achieve a true positive rate (TPR) of 92% and a false positive
rate (FPR) of 1%. A comprehensive comparison of different input methods for continuous
authentication with touch dynamics was provided by Xu et al. [74]. The work compares
authentication accuracy of using keystroke, slide, pinch and handwriting input methods.
Different schemes have been proposed to use modified versions of touch dynamics, such
as finger identification or the inclusion of multiple fingers, in the input system in order
to enhance mobile authentication systems on touchscreens. These systems seek to either

CHAPTER 4. MULTI-FINGER AUTHENTICATION 67
increase accuracy of touch dynamics by measuring additional features that increase the
effectiveness of classifiers, or increase security by adding features that are difficult to mimic
by a malicious user, or allow additional input methods (such as the use of multiple fingers)
to increase the keyspace. These methods are appealing because they can be combined with
many of the traditional touch based systems. One such system proposed by Sae-Bae et
al. [56] suggested using multi-finger gestures for authentication on touchscreens. In the
proposed system, a user would place all five fingers on the screen and perform gestures for
authentication. Other systems have applied the concept to graphical passwords such as
TouchIn by Sun et al. [62]. The system is also gesture based and authenticates users by
having them draw geometric shapes or curves on the screen with one or more fingers. The
work by Ritter et al. [53] also used multi-touch to build an authentication system called
Multi-touch Image-Based Authentication (MIBA). In this case, the authors adapted the
desktop graphical password Cued-Click Points (CCP) [16] to mobile devices. CCP has users
click on points in an image, taking them to subsequent images in order to authenticate.
When adapting the method to mobile devices, a large portion of keyspace was lost due
to the smaller screen sizes. In order to compensate, multiple parts of the image could be
touched at the same time.
On the approach of finger identification, there is a patent held by Google, Inc. on
identifying fingers on a touch screen [73]. It describes a system that uses finger pressure,
touch area, position of hands, and phone orientation to determine the type of finger that
touched the screen. The patent describes the system as being used to produce different
effects when a button or other touch area, is pressed with a different finger. For example, a
user could press a thumbnail of an image with her index finger to open the full size image,
or press it with her pinkie finger to share the image. However, it does not contain any
experimental results or accuracy measurements.

CHAPTER 4. MULTI-FINGER AUTHENTICATION 68
A different work by Ma et al. [45] presents a method of finger identification in order
to use different fingers to input a PIN on a touch screen. The system uses a specialized
touch screen with an integrated antenna. The user places special RFID covers on her
fingers and then the covers are read when the screen is touched to identify the finger being
used. Although this system can provide 100% accuracy, it requires the use of specialized
hardware that is provided with touch screen devices. Another system called TapSense built
by Harrison et al. [37] studied the ability to differentiate if a user touched a touch screen
with a finger or a stylus, and what part of the finger (tip, nail, knuckle, or pad) if the
former was the case. The system can achieve 99% accuracy when differentiating between
the pad of the finger and a stylus, but had lower accuracy when differentiating between all
five input types. With all input types, the overall accuracy was 88.3% with the finger tip
accounting for almost half the missclassifications. When the finger tip data was removed,
the system was able to achieve a classification accuracy of 94.7%. A final system of interest
was proposed by Cheng et al. [14], and it uses photos of the back part of the knuckle to
authenticate users. The system does act as a “finger identification system,” but functions
more closely to a fingerprint scanner than a touch system. The authors reported results
with an EER of 9%.
4.2 Design
This section describes the design of the TTP system and the MFA experiment. The TTP
subsection describes the design of a prototype-used for user authentication, while the MFA
subsection describes the design of an experiment intended to collect data and test the
viability of the proposed MFA approach.
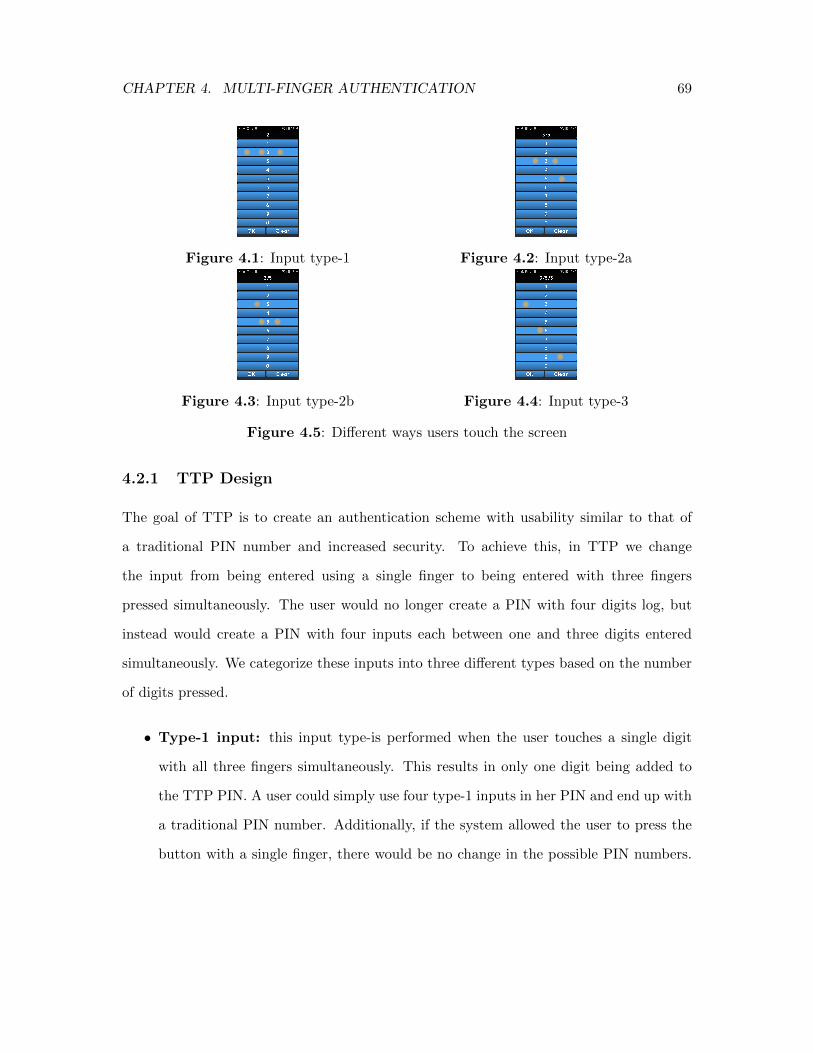
CHAPTER 4. MULTI-FINGER AUTHENTICATION 69
Figure 4.1: Input type-1 Figure 4.2: Input type-2a
Figure 4.3: Input type-2b Figure 4.4: Input type-3
Figure 4.5: Different ways users touch the screen
4.2.1 TTP Design
The goal of TTP is to create an authentication scheme with usability similar to that of
a traditional PIN number and increased security. To achieve this, in TTP we change
the input from being entered using a single finger to being entered with three fingers
pressed simultaneously. The user would no longer create a PIN with four digits log, but
instead would create a PIN with four inputs each between one and three digits entered
simultaneously. We categorize these inputs into three different types based on the number
of digits pressed.
• Type-1 input: this input type-is performed when the user touches a single digit
with all three fingers simultaneously. This results in only one digit being added to
the TTP PIN. A user could simply use four type-1 inputs in her PIN and end up with
a traditional PIN number. Additionally, if the system allowed the user to press the
button with a single finger, there would be no change in the possible PIN numbers.

CHAPTER 4. MULTI-FINGER AUTHENTICATION 70
However, single finger input is disallowed in order to prevent it from becoming the
path of least resistance. By requiring all three fingers to be used to touch a single
digit, the type-1 input as shown in Figure 4.1 becomes no more or less complex
to enter than any other type-of input, preventing it from becoming the most likely
outcome.
• Type-2 input: in this input type, a user presses two digits with three fingers: two
fingers on one digit, and the third finger on the other digit. Although the full input
requires that the user should hold all three fingers down simultaneously, the order
in which the digits were pressed matters. For example, a user pressing the button
for 3 and the button for 5 at the same time will create a type-2 input. If the user
first pressed the 3 button and then pressed the 5 button, the resulting input would
be 3/5; but if the user first pressed the 5 button and then pressed the 3 button, the
resulting input would be 5/3. Note that the first digit must remain held down while
the second digit is pressed. The system also keeps track of which digit was pressed
with two fingers and which with one. We define two sub-types of type-2 input based
on the number of fingers used on each digit:
– Type-2a input: this input sub-type, as shown in Figure 4.2, describes when
a user presses two digits at the same time and use two fingers to press the first
digit and one to press the second digit.
– Type-2b input: this input sub-type, as shown in Figure 4.3, describes when a
user presses two digits at the same time and use two fingers to press the second
digit and one to press the first digit.
If a user were to input as described in the previous example, where she presses first
the 3 and then the 5 (3/5), she would create a type-2a input if she pressed 3 with two

CHAPTER 4. MULTI-FINGER AUTHENTICATION 71
fingers and 5 with one finger. On the other hand, a type-2b input would be created
if she pressed the 3 with one finger and the 5 with two fingers instead. It should
also be brought to attention that this input type-cannot have a repeated digit in the
input. In other words, an input such as 5/5 would not be valid as it would result in
a type-1 input instead.
• Type-3 input: The third input type, as shown in Figure 4.4, describes the case in
which the user presses three digits at the same time. The order in which the digits are
pressed matters. They must also all be held down at the same time before releasing
similarly to type-2 input. For example, if a user presses 3, then 6, and then 9, it
would result in the input 3/6/9. However, if the user pressed 6, then 3, and then 9,
the resulting input would be 6/3/9. It is also worth noting that this input type-does
not allow for duplicated digits. An input like 3/3/6 would result in the type-2a input
3/6 and 3/3/3 would result in a type-1 input.
The system has no requirement to use any particular type-of input or a minimum
complexity. The user is free to use as many or as few input types in her PIN. This means
that a user could create a login with all inputs of a single type, e.g., only type-1 inputs that
include four digits in total, or only type-3 resulting in twelve digits in total. Alternatively,
a user could create a login with any two types or all three types of input. This allows for
the largest keyspace. This approach will have no drawbacks if users do not heavily favor
any type-of input over the others and have a relatively equal distribution among all the
input types being used.
Due to the difficulty of placing multiple fingers on a button at the same time, the buttons
cannot be the same size as those in the traditional PIN interface, where the buttons are too
small to fit three fingers simultaneously and some are just barely large enough for a single
finger to fit. To address this problem, the buttons of TTP for each digit are made the

CHAPTER 4. MULTI-FINGER AUTHENTICATION 72
entire width of the screen and stacked vertically. This allows a user to see all the buttons
and fit all three fingers on a single button when held in portrait orientation. The downside
of this is that it takes up a lot of space on the screen. However, most login screens that use
a PIN, such as the unlock screen, do not show other information. Thus, it is an acceptable
compromise to fill the entire screen with the input buttons and text field for PINs since
the only real loss is an aesthetic one.
4.2.2 MFA Experimental Design
The goal of the MFA experiment described in this section is to test the viability of utilizing
finger distinction (differentiating a user’s fingers when interacting with a touch screen) to
enhance user authentication on mobile devices. Our design relies on detecting the anthro-
pometric differences between a user’s fingers in order to classify individual fingers. To
measure these differences, we rely on the size and pressure sensors built into the touch-
screens of mobile devices. We then design an experiment to test if the differences in the
size between fingers is sufficient to differentiate them. In this subsection, we first list the
challenges of performing finger differentiation learned in preliminary testings. Then we
describe the design of the experiment used to test the viability of our approach.
Figure 4.6: A touch withthe tip of the finger
Figure 4.7: A touch withonly part of the finger pad
Figure 4.8: A touch withthe finger pad

CHAPTER 4. MULTI-FINGER AUTHENTICATION 73
4.2.2.1 Preliminary Observations
Before running a full scale study, several small preliminary tests were conducted with very
small groups of participants to identify challenges and shortcomings in the approach. Our
preliminary findings reveal several aspects of user behaviors that make finger identification
difficult, and identify the criteria necessary to achieve accurate finger differentiation given
current hardware. The tests were performed by having a user perform touches on the screen
of an Android device. The values of pressure and size were observed by using getevent
with adb and the android developer tool that displays the values on a screen overlay. We
run these tests iteratively to refine the process with each iteration. No formal results from
these tests are recorded in this dissertation.
The problem in user behavior revealed by the preliminary tests is that users will natu-
rally touch a touchscreen with the tip of their fingers using the smallest amount of pressure
and lasting the shortest time possible. This approach is an efficient way to navigate through
the interface of a touchscreen device since each touch is fast and requires little effort. When
users were performing simple touches, such as opening an app or pressing a button, the
observed force values were very low (bellow 1) and the size values for each finger were
very similar. However, when users performed long touches, such as holding their fingers
on the screen to bring up a menu or highlight text to copy, the touch pressure was much
higher (above 2) and the relation of size to pressure showed observable patterns that varied
between fingers. The patterns were particularly distinct for the thumb and pinkie fingers
when compared to the other three fingers.
The preference of users for using the tip of their finger also posed a problem for per-
forming finger distinction, since the tip is the smallest part of a finger. Users display such
a behavior likely because it is the best way to assure that they do not accidentally press
more than one UI element on the screen. The result of this behavior is that most of the
CHAPTER 4. MULTI-FINGER AUTHENTICATION 74
fingers appear to have a similar size with the exception of the thumb, and even the relative
size of thumbs varied between participants. When the touches were performed with the flat
part of a finger that contains the fingerprint, i.e. the pad, this problem was less evident.
The differences in size of fingers were observable more consistently, although this result
still varied between users.
4.2.2.2 App Design
To test the viability of utilizing finger distinction for security enhancement in real systems,
we design a formal experiment using an app that reads the values of pressure and size of
presses on a touchscreen. The experiment captures touch events using the Android API
since the capture methods used in the preliminary testing are neither accessible by apps
nor have their output configured. The app presents the user with numbered buttons to
press in numerical order, and displays the pressed digits on the screen similar to a PIN
loging screen. In order to prevent the problem where users did not press on the screen
with enough pressure to distinguish fingers, a pressure threshold was set for each button.
The app does not consider the button to have been pressed successfully unless the pressure
threshold is exceeded and discards all button presses where the pressure remains bellow
the threshold. Preliminary testing showed that the threshold values that were too low
(such as 0.2) resulted in inaccurate results so that fingers cannot be distinguished, but the
pressure values that were too high (such as 0.3) were too difficult for many users to reach
consistently. The value of 0.27 was chosen because our tests revealed it was high enough
for the differences in the size and pressure patterns to be observable, but low enough that
users can still reach the required pressure without much difficulty.
For the input gathering mechanism, five horizontal digit buttons are arranged vertically
down the screen. The digit buttons are numbered 1 to 5 in consecutive order, and “OK”
CHAPTER 4. MULTI-FINGER AUTHENTICATION 75
and “clear” buttons are placed underneath the digit buttons. Each digit button is placed
as high as possible while still allowing the other elements to fit on the screen without a
scroll bar, and is made wide enough to extend completely across the screen horizontally.
The digit buttons were sized this way for two reasons. First, they were made higher than
usual so that users would not accidentally touch multiple buttons at the same time and
would be more likely to use their full finger pads, instead of the finger tips. Second, each
button extended from one side of the screen to the other horizontally because it is easier
to touch with the pad of a finger at the edge of the screen than in the middle of the screen.
Moreover, extending the button all the way to the edge of the screen allows it to be touched
with the pad of a finger and prevents the rest of the finger from touching the screen by
accident and triggering unwanted touch events. The number of buttons was limited to 5
because, for this experiment, only the viability of distinguishing fingers was tested. We do
not test the interactions between our methods and full authentication systems since these
systems can make it difficult to control those variables that can affect the results. With
this in mind, one button per finger is shown to the participants to reduce their confusion
as to which button they should touch with which finger.
When a touch event is detected for one of the digit buttons, the system records the
pressure, the size, and the timestamp for the event. The system tracks the highest pressure
value recorded for the duration of the touch event, and compares it to the threshold once
the event has completed. If the maximum recorded pressure was higher than the threshold,
all the recorded pressure and size values are labeled with the digit button that produced
them and the buffer is cleared. If the maximum value of pressure does not exceed the
threshold, the buffer is cleared discarding all the recorded data points as if the digit had
never been pressed.
Seven features are extracted from the recorded data. These seven features include:

CHAPTER 4. MULTI-FINGER AUTHENTICATION 76
• Average pressure: this feature is the mean of all the pressure values recorded
during a touch event.
• Average size: this feature is the mean of all the size values recorded during a touch
event.
• Size at threshold: this feature represents the value of the size of the touch event
recorded at the lowest of the pressure values that are greater than or equal to the
threshold.
• Minimum pressure at maximum size: this feature is the lowest pressure value
associated with the largest size value recorded during a touch event.
• Minimum pressure at maximum size ratio: This feature is calculated by finding
the minimum pressure associated with the maximum size value recorded during a
touch event and then dividing the pressure value by the size value.
• Ratio of averages: this feature is calculated by dividing the average pressure by
the average size.
• Average of ratios: this feature is calculated by first dividing the recorded pressure
by the recorded size for each data point. Then the mean of the ratios is computed.
These features are used to train and test several machine learning classifiers to per-
form the finger differentiation. A detailed description of this process can be found in the
evaluation section of this chapter.
4.3 Implementation
This section describes how the TTP prototype and the MFA data gathering app were
implemented.

CHAPTER 4. MULTI-FINGER AUTHENTICATION 77
4.3.1 TTP Implementation
We developed a prototype app of TTP for Android 4.4.4 and deploy it on a Motorola Droid
Turbo. The app uses the interface design described in section 4.2. Ten buttons with digits
0 through 9 were stacked vertically on the screen. At the top of the screen, a text view is
displayed to show the user entered the input, and at the bottom of the screen, submit and
clear buttons are displayed.
The app uses a general counter variable to track the number of the number of digits
simultaneously pressed. Every time a down touch event is captured on a digit the counter
is increased by an increment of 1, and every time an up event is captured for a digit, the
counter is decreased by 1. Events that interact with other portions of the interface are
ignored by the counter. An ArrayList is used to track touches on individual digits. Each
time a touch event occurs on a digit button, an integer held at that digits index in the
ArrayList is increased by 1 when pressed, and decreased by 1 when the digit is released. A
temporary string buffer is used to track the order in which the digits are pressed by storing
the digits seperated by forward slashes. When the general counter reaches 3, the temporary
string buffer is written to the text view using the input the user entered. The input is then
appended to an internal buffer that stores the input in a delimited format. The delimited
format uses different delimiters to separate the digits pressed during the same input and
digits pressed during different inputs. For example, a type-2 input followed by a type-1
would be stored as two digits separated by a forward slash, followed by a pipe and the single
digit of the type-1 input. Each digit in this buffer is also accompanied by the number of
fingers used to press it. After the counter reaches 3 touches, any further touches are ignored
until the general counter is reset to zero. This means that the user cannot enter inputs
with 4 touches, and for inputs with three touches, one was removed and replaced without
removing the previously ignored touches. The length of the TTP PIN is also limited to 4

CHAPTER 4. MULTI-FINGER AUTHENTICATION 78
inputs by this implementation.
4.3.2 MFA Implementation
This subsection contains the description of the implementation used in the MFA app that is
used for data gathering in the MFA experiment discussed in this chapter. The implementa-
tion is not meant to represent of a scheme to make use of multiple fingers for authentication.
Instead, the app is gathering data used in testing the accuracy of the proposed MFA clas-
sifier. However, should an authentication system be implemented, many elements of this
app would be present. The MFA app allows the user to enter an expected preset number
over the course of several trials. The interface implements the features described in the
design section of this chapter.
The app was deployed on the same Motorola Droid Turbo running Android 4.4.4 KitKat
device that was used for the TTP prototype. The app used the paramMotionEvent.getPressure()
and paramMotionEvent.getSize() calls from the Android API. Although the raw sensor out-
put received from getevent may have provided a more accurate sensor reading (depending
on the specific device and version of Android running), the output differences between
devices make this method hard to generalize for multiple devices. App developers would
need to create a version for every type of target hardware, which is not a feasible require-
ment. The getevent output also provides no method to differentiate between which screen
elements were touched, making it difficult to determine which digit the event interacted
with and which event each data point is referred to. The raw sensor output also takes
longer to process than output from the API call, making it less useful for applications in
which the processing happens in parallel to the input being received. For these reasons,
we evaluate the viability of MFA using the Android API rather than the raw sensor data.
The app implemented the digit input system to collect data using the ontouch callback.

CHAPTER 4. MULTI-FINGER AUTHENTICATION 79
Every time a down or move event was captured on a digit button, the force, size, and times-
tamp of the touch event were recorded to a string variable associated with that particular
touch event. Using this method, we compared the timestamps of more than 300 touch
events and calculated the interarrival times between down and move events. We found
that, on average, a down or move event occurs every 58 milliseconds, and we observed
some interval times to be as high as 158 milliseconds. Many systems that measure based
on movement prefer sampling input every 10 to 30 milliseconds, but in this case, the slower
update times are acceptable because the sensors update values at a much slower rate than
the interarrival times of touch events. Further analysis showed that sensor output for both
pressure and size updated on average every 348 milliseconds, or every 6 recorded down and
move events. Faster event read rates would simply result in redundant data.
When a user touches a digit, the maximum pressure value is monitored. Once this
value exceeds 2.7, the digit is written to a text view displaying the user’s input. When
an up event occurs, the maximum pressure value for the full touch event associated with
the digit generating the event is checked. If the maximum pressure exceeds the 2.7 value,
the string is appended to a final results string for the number sequence being entered.
Strings recording the sensor output of touch events that ended without exceeding the 2.7
value threshold are discarded. When the user presses the proceed button, all digits in the
sequence are checked against the systems expectations. When the entered digit sequence
matches the expected input, the final string of sensor readings is written to a file in XML
format and is discarded if the digit sequence does not match. A case where the digit
sequence is incorrect will result in the user being shown an error and requested to re-enter
the digit sequence.

CHAPTER 4. MULTI-FINGER AUTHENTICATION 80
4.4 Evaluation
In this section, we discuss the evaluations of TTP and MFA. For TTP, a prototype is
built and tested with a user study. For MFA, a lab-style study was performed to test the
viability of the technique itself.
4.4.1 TTP Evaluation
We evaluate TTP by first performing a security analysis where we discuss the resistance of
the system to brute-force methods and other forms of attack such as shoulder surfing. Then
we present the results of a user study where the scheme’s susceptibility to dictionary-style
attacks is analyzed based on user predictability, and user feedback is gathered to analyze
the scheme’s usability.
4.4.1.1 Security Analysis
We analyze the theoretical keyspace of TTP in order to determine its resistance to brute-
force attacks. For this particular case, we assume brute-force attacks do not use heuristics,
dictionaries, or rainbow tables to assist with password cracking. Enhanced guessing attacks
such as these will be addressed later in this section. Since there are three types of inputs,
we will first look at the possible values for each one individually. Type-1 input use only
one digit (same as a traditional PIN number) and therefore has only 10 possible values per
input. Type-2 inputs use two digits, which can be combined 100 possible ways. However,
10 of those combinations contain duplicate digits, so only 90 of these values can be formed
in TTP. Since type-2 inputs can each be created two separate ways depending on which
digit is pressed with two fingers, we can double the total possible values for type-2 inputs
obtaining 180 possible values. Finally, type-3 inputs use three digits, which creates a total
of 1000 possible combinations. Out of these combinations, 280 contain duplicate digits,

CHAPTER 4. MULTI-FINGER AUTHENTICATION 81
resulting in a total of 720 usable values for type-3 inputs. We then calculate the bits of
entropy for a TTP PIN with 3 inputs as follows:
(10 + 180 + 720)4 = 9104 = 685749610000 (4.1)
log2(685749610000) = 39.3bits (4.2)
The total key space is comparable to the keyspace of a six character ASCII password.
However, TTP does have several advantages over text passwords for authentication specific
to mobile devices, such as unlocking the screen. First, TTP only requires 10 buttons to
represent the available digits. Buttons are easier to place on the screen of a mobile device
and more convenient to press than an ASCII keyboard. This provides a similar usability
advantage over text input that traditional PIN schemes provide since text passwords can be
awkward to enter on soft keyboards. The 4 inputs in TTP also allow memory chunking to
increase memorability of logins without a pattern. Memory chunking is the technique used
to remember dates and phone numbers. Large amounts of information are divided into
“chunks,” letting the user remember the same amount of information as if it were shorter.
This technique allows users to remember less meaningful combinations of information, such
as random digit sequences.
TTP also gives a small advantage against shoulder surfing attacks. Using multiple
fingers on the screen at the same time makes it more difficult for an attacker to discern
what type of input is being entered. This does not make the scheme impervious to shoulder
surfing attacks. Passwords which use only type-1 inputs are still equally vulnerable to these
attacks, and attacks can be recorded with a sufficient view of the device. However, TTP

CHAPTER 4. MULTI-FINGER AUTHENTICATION 82
passwords that use type-2 and type-3 inputs provide higher resistance.
4.4.1.2 User Study
We performed a study involving 25 participants. Of the participants, 17 were male and
8 were female. The age distribution of the participants can be found in Figure 4.9. Par-
ticipants were asked to perform a creation step and login step. The creation step requires
users to enter an initial secret and then confirm it by re-entering the information using the
prototype-described in the implementation section of this chapter. The login step simply
involves having participants enter the secret again as if logging in to a device. After com-
pleting the study, each user was provided the opportunity to give verbal feedback to the
researcher. Approximately two thirds of participants provided feedback on the system.
Figure 4.9: This graph shows the age distribution of the participants of the TTP userstudy.
Timing. The average time taken to create a TTP login was 76.8 seconds, with the
longest time being 274 seconds and the lowest being 19 seconds. Many users needed
to call the researcher back to ask for clarification on how the scheme actually worked,
causing creation times to increase. Several users spent significant time thinking about the
actual combination of digits to use for their PIN. Some users also had trouble remembering

CHAPTER 4. MULTI-FINGER AUTHENTICATION 83
the order in which they had input digits and had to continually clear their password in
the confirmation step due to mistakes. Most users who had difficulty had at least two
issues during this step. These users skewed the creation time toward larger values. Users
who understood the scheme after the initial explanation and quickly decided on a digit
combination to use as their PIN had much shorter login creation times.
The average time for inputting the loging after creation was 15.4 seconds. The longest
time needed to login was 50 seconds, and the shortest was 5 seconds. The longer input
times were mostly caused by users who made mistakes in their number order and repeatedly
pressed the clear button to reenter the PIN. Users who were middle aged or older or had
trembling hands also took more time to enter their secret than younger users. One trend
that remained consistent among all users was the ability to get faster with each entry. It
is likely that most users who enter PINs with TTP on a regular basis, such as unlocking a
phone, could enter the secret in 5 seconds or less.
Predictability. Overall, TTP performs well with regard to predictability. Users did
not favor any single input type over others, and each type of input was used by multiple
users where the most common form of creating PINs combined two input types. Users
expressed that they opted to use the input type-that felt most physically comfortable, and
preferences varied from user to user. For example, one user had webbed fingers and used
only type-1 inputs because it was harder for him to separate his fingers enough to press
multiple buttons. Other users with large fingers may also opt for type-3 inputs since it may
be harder for them to keep their fingers together while seeing the screen. A distributions
of input types in PINs can be seen in Figure 4.10.
No PINs were created using simple numerical sequences, such as consecutive numbers
or the same input value repeated four times. When providing feedback, some users said
they created their PIN using a date, such as a birthday, or a combinations of multiple

CHAPTER 4. MULTI-FINGER AUTHENTICATION 84
dates, such as birthdays of family members. Other users created PINs using part of an
identification number, such as a student ID, and others used completely random sequences
of numbers. Users that created PINs with personal information will be more vulnerable
to attacks by someone who knows them and is privy to such information, but there is
no way to determine the actual percentage of users who would be vulnerable since the
researchers were not privy to the participants’ personal information. TTP also benefits
from users using different input combinations to represent numbers with repeated digits.
For example, one user may interpret the number 757 as a type-2 input with two fingers on
7 and one on 5, where as a different user may interpret it as three separate type-1 inputs. If
the information contains duplicate digits, this increases the number of possible PINs that
need to be tested, even when a user’s personal information is known.
Figure 4.10: This graph shows the age distribution of input types that users included intheir PINs.
Some users did show predictable patterns. Three users created PINs with a pattern in
which two values are entered for the first two inputs and then the same values are repeated
for the third and fourth inputs. Another observed pattern was that users would not mix the
sub-types of type-2 inputs. Users who used a type-2a (two fingers on the first digit pressed)
for one of their type-2 inputs used the type-2a for all other type-2 inputs. Similarly, users
who used type-2b for at least one of their type-2 inputs used type-2b for all other inputs.

CHAPTER 4. MULTI-FINGER AUTHENTICATION 85
A type-2a was also far more likely to be used. Out of all the users who had one or more
type-2 inputs in their PIN, only two used type-2b. All other users with type-2 inputs used
a type-2a. This does not negate the usefulness of having both sub-types of a type-2 input;
however, it does reduce their value to keyspace when confronted with a guessing attack
that accounts for this pattern.
Other Feedback. Many users expressed that the scheme was complicated and confusing
when they first attempted to create a PIN. However, all users who provided feedback
expressed that it was not very difficult once they actually understood how the scheme
worked. All of them expressed a willingness to use the scheme if it were to be deployed to
their devices as long as the complexity matched the use case. Some users also expressed
that could get a login speed close to that of a traditional PIN with practice. The exceptions
to this were a few users who had difficulty pressing buttons due to physical impairments
such as trembling hands.
Other noteworthy feedback was given by three users who provided the same suggestion
independently from one another and without prompting. These users expressed that four
inputs was too complex for a phone unlock scheme. They each suggested that the number
of inputs be reduced to two in this case. When questioned further, they said they would be
willing to use four inputs when the PIN guards more sensitive data, such as a bank PIN.
The suggested change still provides an improvement to security since TTP PINs with two
inputs have a theoretical keyspace of 19.6 bits of entropy, which is larger than the 13.2 bits
provided by regular PINs. This feedback suggests that this scheme could be successful if
the number of inputs is varied to produce the complexity appropriate for the frequency of
login and sensitivity of the data being protected.

CHAPTER 4. MULTI-FINGER AUTHENTICATION 86
4.4.2 MFA Evaluation
We performed an evaluation with a group of 33 participants, including 20 male and 13
female. An age distribution of the participants can be seen in Figure 4.11. The participants
were instructed to use the app to input the sequence 1-2-3-4-5 using their thumb to press
the 1 digit, their index finger to press the 2 digit, their middle finger to press the 3 digit,
their ring finger to press the 4 digit, and their pinkie finger to press the 5 digit. They
were also asked to repeat the sequence 10 times, pressing the OK button when done. The
instructions stated that participants should press each digit with the pad of their finger
and bend their knuckle such that it becomes concave. The researcher administering the
experiment remained with the participants to observe the experiment and ensure that the
proper fingers were used to press each digit. Any participant that pressed the digit with
the wrong finger or entered part of the sequence incorrectly was instructed to clear any
previously entered digits and redo the trial.
Figure 4.11: This graph shows the age distribution of the participants of the MFA ex-periment.

CHAPTER 4. MULTI-FINGER AUTHENTICATION 87
4.4.2.1 Single-User Finger Differentiation
First, we ran a self-to-self evaluation, in which data from one participant is compared to
data from the same participant. All the trials of a single user were used to build a classifier.
Each trial contained all touches from the input sequence with one touch from each finger
type. The classifier was then used to attempt to distinguish between any two fingers that
belong to the same user.
Classification model The finger distinction was done using machine learning with clas-
sifiers provided in the scikit-learn module for Python. During preliminary testing, several
classifiers were used, including Naive Bayes, KNN, Decision Trees, linear and non-linear
SVMs, and neural networks. The two classifiers with the highest accuracy for the single-
user finger distinction model were the Decision Tree and SVM with one-vs-rest shaped
decision function. Ensemble models were also tested using the highest accuracy classifiers,
including boosting and bagging methods, random forests and voting classifiers, but these
models showed no improvement over stand alone classifiers. Only the linear SVM will be
discussed in this chapter because it slightly outperformed the Decision Tree classifier, and
the results did not differ significantly enough to merit discussion.
Features were extracted and stored in feature vectors, with each vector containing
the features from a single-digit press, starting with a down event and ending with an up
event. The feature vectors for each participant were ordered such that the feature vectors
for each of the 10 trials were at adjacent indexes in a Python list. Feature selection was
performed using the scikit-learn Recursive Feature Selection with cross-validation function.
The estimator used in the feature selection was an SVM with a linear kernel, and the cross-
validation folds were set to 10. Due to the order of the feature vectors, using the same
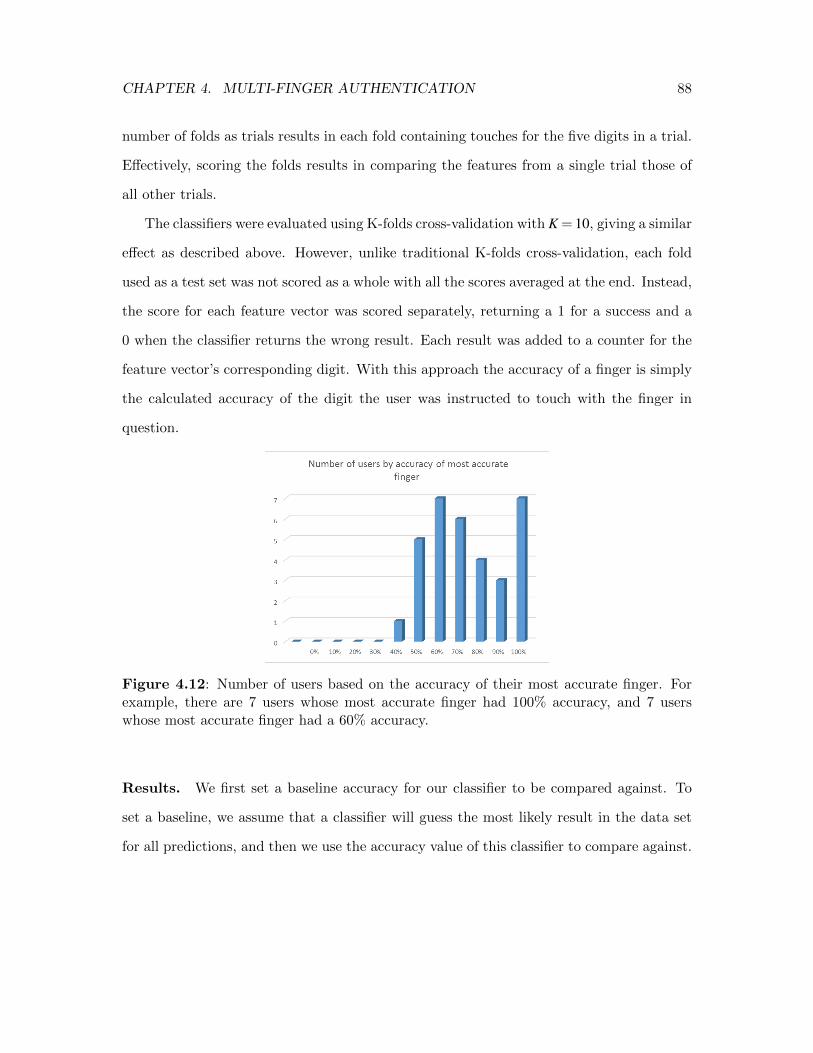
CHAPTER 4. MULTI-FINGER AUTHENTICATION 88
number of folds as trials results in each fold containing touches for the five digits in a trial.
Effectively, scoring the folds results in comparing the features from a single trial those of
all other trials.
The classifiers were evaluated using K-folds cross-validation with K = 10, giving a similar
effect as described above. However, unlike traditional K-folds cross-validation, each fold
used as a test set was not scored as a whole with all the scores averaged at the end. Instead,
the score for each feature vector was scored separately, returning a 1 for a success and a
0 when the classifier returns the wrong result. Each result was added to a counter for the
feature vector’s corresponding digit. With this approach the accuracy of a finger is simply
the calculated accuracy of the digit the user was instructed to touch with the finger in
question.
Figure 4.12: Number of users based on the accuracy of their most accurate finger. Forexample, there are 7 users whose most accurate finger had 100% accuracy, and 7 userswhose most accurate finger had a 60% accuracy.
Results. We first set a baseline accuracy for our classifier to be compared against. To
set a baseline, we assume that a classifier will guess the most likely result in the data set
for all predictions, and then we use the accuracy value of this classifier to compare against.

CHAPTER 4. MULTI-FINGER AUTHENTICATION 89
The accuracy of this assumed classifier is equal to the percentage of the data set that
corresponds to the most likely result. Our data set had five possible outcomes that are
equally distributed; therefore, our baseline accuracy is 20%. Our proposed system achieved
above baseline accuracy with overall accuracy (across all fingers) between 40% and 60%
for most participants. This suggests that it is not viable to use this system to determine
the difference between any two arbitrary fingers of a user. Instead, the system gives more
useful results on a per-finger basis.
We observed that most users had one finger that was classified with much higher accu-
racy than their other fingers. The thumb and pinkie finger of a user were the most likely
to be accurately classified. This is to be expected, since both of those fingers have a more
prominent difference in size from the other fingers. Only five users had a different finger
with accuracy above the thumb or pinkie. The distribution of user count by most accurate
finger can be seen in Figure 4.12.
Figure 4.13: The number of users based on which finger was most accurate. The highestvalue is 19 users whose most accurate finger was the thumb, and the second highest valuewas the 9 users whose most accurate finger was the pinkie.
We aggregate the classification scores of all users by finger and then analyze their true-
negative and false-negative rates. When a false-negative result is given by a classifier, we

CHAPTER 4. MULTI-FINGER AUTHENTICATION 90
record which finger was returned as the result. To visualize these results, refer to Figure
4.13), which allows us to determine which fingers are considered similar or different by
the classifier. The thumb was the most accurate finger to classify, returning a 55.4% true-
positive rate; it was also the least likely to be classified as a pinkie finger, with only 7.5%
of the results being false-negatives classified as the pinkie finger. The next most accurate
finger was the pinkie, with a 48.1% true-positive rate, and only 4.2% of the results were
deemed false-negatives where the pinkie was classified as a thumb.
The other fingers showed less promising results. The middle and ring fingers had low
true-positive rates and an even distribution between their false-negatives rates. In both
cases, there was only a difference of 2% or 3% between the first and second most likely
classification results, and in the case of the ring finger, the classifier was more likely to give
a false-negative result as the middle finger than it was to give a true-positive result. The
index finger had more interesting results, with a true-positive rate of 30.9%. However, the
most likely false-negative result was a pinkie finger occurring 21.2% of the time. this is to
note because the pinkie finger had a higher false-negative incidence with the index finger
than with any other finger at a rate of 21.8%. These results suggest that the index and
pinkie fingers produce similar sensor readings despite being different sizes. A visualization
of these results is provided in Figure 4.19.
These results suggest that it is possible to build a highly accurate classifier if the only
fingers used as input are the thumb and pinkie finger, and that it may even be possible if
the other three fingers are placed in a single category for the classifier. The middle and
ring fingers can be ignored since they have low true-positive rates, but the index finger
poses a particular challenge since it has a high amount of false-negative results in which it
is classified as a pinkie finger. This suggests that a system that only differentiates between
those two fingers is the most feasible since it eliminates the interaction with the pinkie
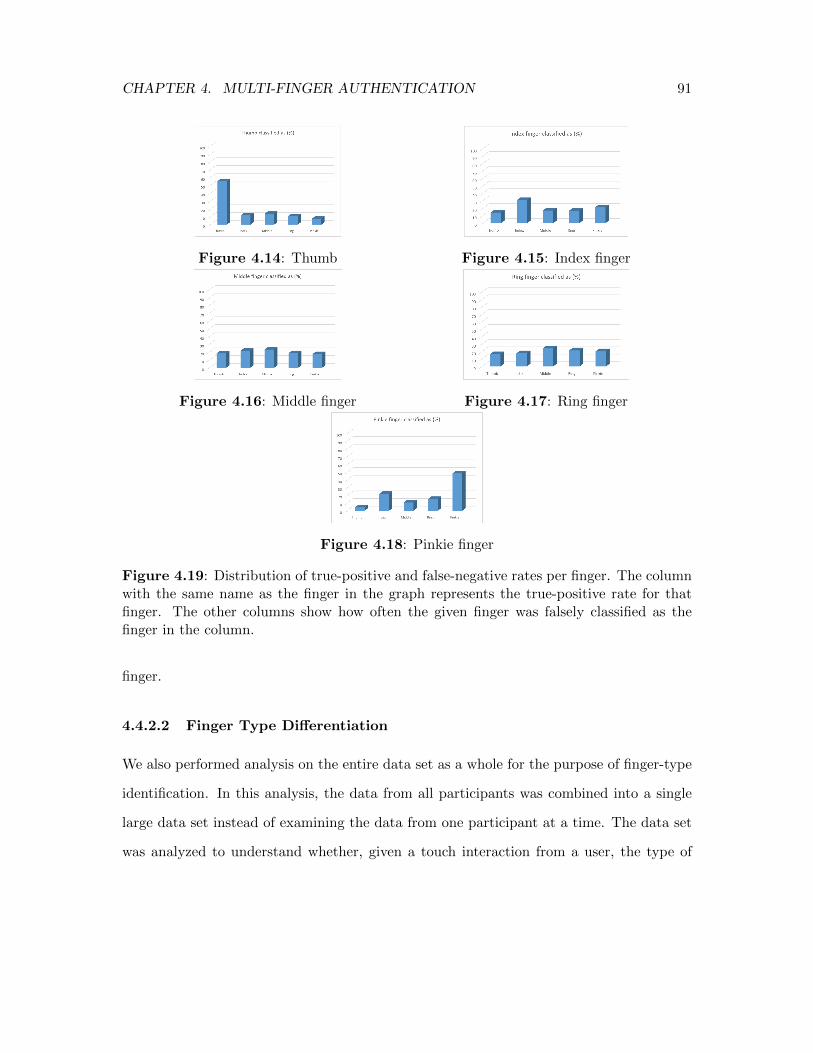
CHAPTER 4. MULTI-FINGER AUTHENTICATION 91
Figure 4.14: Thumb Figure 4.15: Index finger
Figure 4.16: Middle finger Figure 4.17: Ring finger
Figure 4.18: Pinkie finger
Figure 4.19: Distribution of true-positive and false-negative rates per finger. The columnwith the same name as the finger in the graph represents the true-positive rate for thatfinger. The other columns show how often the given finger was falsely classified as thefinger in the column.
finger.
4.4.2.2 Finger Type Differentiation
We also performed analysis on the entire data set as a whole for the purpose of finger-type
identification. In this analysis, the data from all participants was combined into a single
large data set instead of examining the data from one participant at a time. The data set
was analyzed to understand whether, given a touch interaction from a user, the type of

CHAPTER 4. MULTI-FINGER AUTHENTICATION 92
finger (e.g., thumb vs, index finger) be determined. Unlike in the single-user finger differ-
entiation analysis, here we do not seek to distinguish between two fingers that belong to
the same user. Instead, we seek to classify the fingers of any user into common categories
divided by finger type.
Classifier Model. Several classifiers were tested for this analysis including Decision Tree
classifiers, SVM, KNN, and Naive Bayes. Feature selection was run on the data set using
the same Recursive Feature Selection provided by the scikit-learn library. As before, the
feature selection method used a linear kernel SVM as the classifier for feature selection.
Ensemble models were tested, but they did not offer any accuracy advantage over single
classifiers.
Similar to the method used previously, the classifier was tested using K-folds cross val-
idation. In this case, K was set to be equal to the number of participants multiplied by 10,
and data were arranged so that all the data from each trial would be at adjacent indexes
in the list of feature vectors. When the data set is divided this way, each test fold contains
exactly one touch from each finger type that belongs to the same participant. This method
was chosen because it most closely resembles how data would be received in a real-world
application of this system.

CHAPTER 4. MULTI-FINGER AUTHENTICATION 93
Figure 4.20: Finger type identification results using Linear SVM. each bar shows theaccuracy of idenitfying which type of finger any user used when touching the screen
Results. Out of the tested classifiers, two showed interesting results. The first is the SVM
with the linear kernel function, which had the highest overall accuracy of 29.4%. Most of
the other classifiers had the accuracy distributed rather evenly over all the finger types,
causing them to be useless since no single finger can be classified accurately. However,
the SVM had a much higher accuracy for the thumb and pinkie finger, with 67.8% and
59.6%, respectively, and the index, middle, and ring fingers had much lower accuracies of
8.1%, 0.6%, and 10.9%, respectively. These results indicate that focusing exclusively on the
thumb and pinkie finger, or by categorizing the other three fingers in to a single category
may lead to much higher accuracies. Figure 4.20 shows a visualization of these results.
The other classifier with interesting results was the KNN, which has neighbors deter-
mined by a radius provided by the RadiusNeighborsClassi f ier function in the scikit-learn
library. The radius value that determines the parameter space for the function was set to
4.0 since this was the lowest value at which all data categories found neighbors. The overall
accuracy was one of the lowest at 26.02%, but it gives more interesting results when exam-
ined on a category-by-category basis. When examined this way, we notice that the thumb
had an 83.9% accuracy, and the index, middle, ring, and pinkie fingers had accuracies of
10.9%, 9.6%, 0.6%, and 25.1%, respectively. The thumb’s accuracy could be improved by
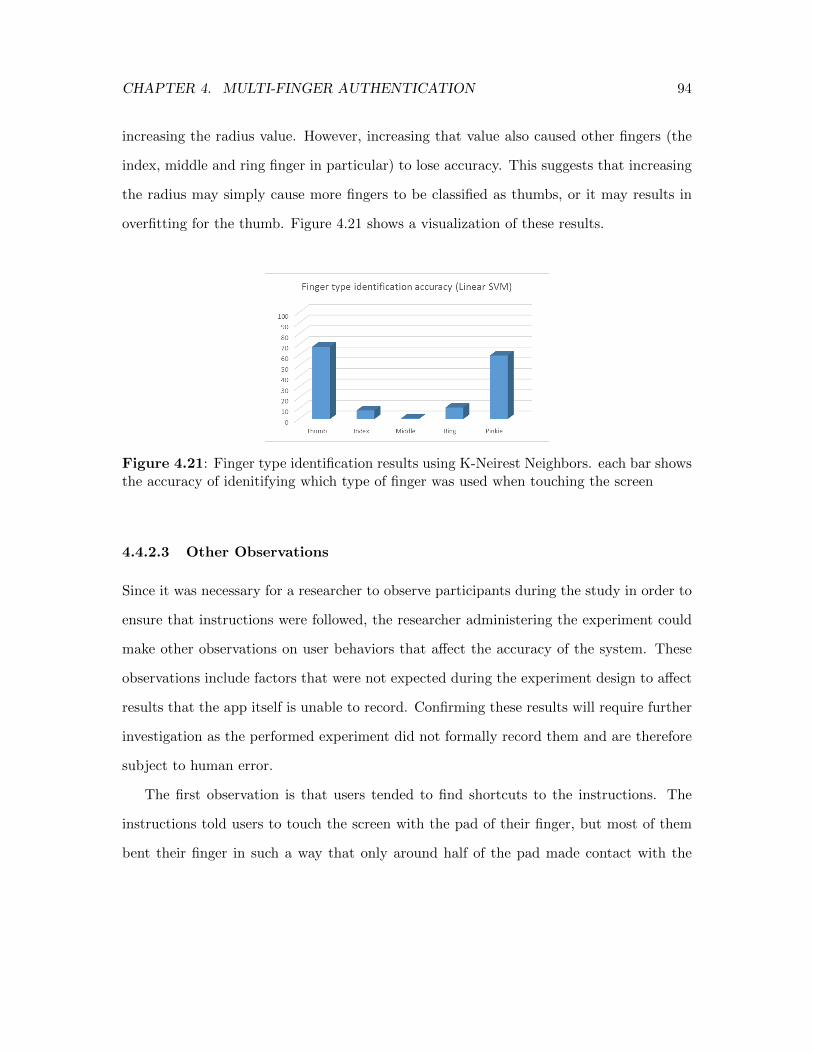
CHAPTER 4. MULTI-FINGER AUTHENTICATION 94
increasing the radius value. However, increasing that value also caused other fingers (the
index, middle and ring finger in particular) to lose accuracy. This suggests that increasing
the radius may simply cause more fingers to be classified as thumbs, or it may results in
overfitting for the thumb. Figure 4.21 shows a visualization of these results.
Figure 4.21: Finger type identification results using K-Neirest Neighbors. each bar showsthe accuracy of idenitifying which type of finger was used when touching the screen
4.4.2.3 Other Observations
Since it was necessary for a researcher to observe participants during the study in order to
ensure that instructions were followed, the researcher administering the experiment could
make other observations on user behaviors that affect the accuracy of the system. These
observations include factors that were not expected during the experiment design to affect
results that the app itself is unable to record. Confirming these results will require further
investigation as the performed experiment did not formally record them and are therefore
subject to human error.
The first observation is that users tended to find shortcuts to the instructions. The
instructions told users to touch the screen with the pad of their finger, but most of them
bent their finger in such a way that only around half of the pad made contact with the

CHAPTER 4. MULTI-FINGER AUTHENTICATION 95
screen, performing more of a partial touch by using both the tip of the finger and the pad.
Users were also instructed to hold the finger on the screen for one second after the digit
they were pressing appeared on the screen, but most users disregarded this instruction.
This method allowed users to touch the screen faster, but it is suspected that this provided
less accurate results. Three of the participants did follow these instructions and touched
the screen with the full pad of their finger, holding it down for one second after the touch
registered. This small group had considerably higher accuracy results on all fingers than
the larger group of participants who disregarded the instructions. However, this trend was
not true of all individuals as several participants that used the shortcut had high accuracy
results. This leads to the conclusion that using the full pad of the finger in a longer touch
results in a higher accuracy across all fingers, whereas using shorter touches with only part
of the finger increases the probability of low accuracy results but does not guarantee it.
Another factor that was observed to affect the results was hand size. Participants
with larger hands were more likely to have their thumb be the finger with the highest
true-positive rate, and participants with small hands were more likely to have the pinkie
finger be the one with the highest true-positive rate. The trend did not hold in all cases,
and is not applicable to participant low accuracy across all fingers. The ability to guess a
user’s hand size can have many benefits, from authentication hardening to improving the
detection of other soft biometrics.
The final problem that may have affected results is the inconsistency with which users
touched the screen. Participants sometimes had difficulty getting the mobile device to rec-
ognize touches as exceeding the pressure threshold. In these cases, the participants needed
to continually press the button until the threshold was reached. These individuals ended
up touching the button on different parts of the screen (each side of the screen and the
middle), and with different angles. These individuals usually had a lower accuracy than

CHAPTER 4. MULTI-FINGER AUTHENTICATION 96
individuals who did not have trouble getting the device to register their touch. If this
problem can be solved, it is possible to increase the accuracy even more.
4.5 Summary
In summary, we find that TTP is a promising scheme with potential for use on real systems.
From a security standpoint, it provides a much higher keyspace than a regular PIN and
has no major vulnerability to dictionary attacks. However, some patterns do exist in users-
generated TTP PINs. The system has a steep learning curve at the beginning, but most
users expressed that after understanding the input process, it became much easier. User
speeds of entry also improved with subsequent attempts.
Some users expressed in their verbal feedback that they did not wish to use the full
complexity of the system for frequent tasks such as unlocking a mobile device. To address
this concern it may be best to use a PIN two inputs long instead of four inputs long in cases
such as unlocking a device, and use a higher number of inputs for situations requiring more
security such as a bank PIN. Users sometimes had remember the in which order they had
pressed buttons or knowing whether they had pressed a button correctly until the input was
complete. These issues can be addressed by redesigning the interface. The buttons could
be resized to make it easier for users to touch them with three fingers. Additionally, the
interface could be further improved by having the buttons change color depending on how
many fingers were touching that button. This feature may, however, increase vulnerability
to shoulder surfing attacks. We propose keeping the buttons the same color but adjusting
the shade, making the button continually darker or lighter with each subsequent touch.
This may still allow the user to see when an additional touch is triggered, but it still make
it difficult for an attacker to observe the input.
CHAPTER 4. MULTI-FINGER AUTHENTICATION 97
With MFA, we find that the results are not compatible with regular authentication
schemes. Our results indicate that differentiating between an individual’s fingers and de-
termining the type of fingers used to press the screen is likely not possible for general
use since the middle and ring fingers are difficult to identify, and the index finger is often
misclassified as a pinkie finger. The thumb and pinkie finger, display higher accuracy with
opportunities for increased accuracy if the other fingers are not considered.
The primary difficulty posed by finger identification is user behavior. For the system
to work, the user needs to touch the screen in specific ways. If users do not hold the
touch with enough pressure or failed to use the pad of their finger, it becomes infeasible to
identify the fingers. Some of these challenges, such as the pressure, can be controlled by
the device, but it is still necessary to rely on the user to use the correct part of the fingers.
The results show that classification accuracy is only high enough to feasibly create a
system that differentiates fingers if they are restricted to the thumb and pinkie finger. In
most authentication schemes, users interact with the touch screen using the index finger
or a combination of the three central fingers. It is also hard to force users to touch the
screen correctly to achieve the consistency necessary for authentication. It may be possible
to create a useful system by restricting inputs to the thumb and index finger. It may be
possible to achieve a high accuracy with the index finger if the pinkie finger is remove since
most of the false-negative results for the index finger were classified as a pinkie finger.
However, the overall accuracy of the index finger is not as high as the pinkie finger, and
more study is required to determine if this is a viable approach. These results can still be
useful in other situations. For example, systems that wish for an application to behave
differently depending on the finger used for input [73] could benefit from keeping these
results in mind when designing the application. Data on how users interact with their
phones may also be gathered using this system.
Chapter 5
Conclusion and Future Work
In this chapter, we will summarize the results, impacts, and limitation of our work. Then
we describe our plans to expand our work in the future.
5.1 Conclusion
Authentication continues to be a major challenge in computer security. A newly proposed
authentication system is required to be resilient to increasingly complex attacks while keep-
ing usability within the expectations of users. In this dissertation, we address this challenge
by presenting novel research on enhancing user authentication through alternative methods.
In our research, we first explore increasing shoulder surfing resistance and memorability in
cued recall graphical passwords. We use a grid input system and map images in order to
achieve this goal. Second, we create a system for classifying users by gender using mouse
biometrics and a novel method to generate features. Gender classification can be used
to perform identity assurance where a system assures that a user is who he/she claims
to be, or to be used as a hardening mechanism for authentication systems that use the
mouse for input. Third and finally, we explore the use of touch screen features to enhance
98

CHAPTER 5. CONCLUSION AND FUTURE WORK 99
authentication systems on mobile devices. We use the multi-touch capabilities to design
an alternative PIN unlock system that uses three fingers to greatly increase keyspace. We
also leverage sensors in the touch screen to explore the viability of differentiating fingers
to increase keyspace in authentication systems used on mobile devices.
In our first work, described in Chapter 2 of this dissertation, we evaluate the secu-
rity benefits and usability impacts of grid based input on cued-recall graphical password
schemes. In that chapter, we present the design for a new scheme called GridMap. Grid
inputs allow the user to enter a graphical password using the keyboard, instead of the
mouse. We combine this input method with variable inputs to create a system, which
is more resilient to shoulder surfing than text based passwords and is also more resilient
to malware attacks than both text passwords and graphical passwords with mouse input
methods. We evaluate the scheme in a user study with 50 participants and find that users
tend to take longer time to input their passwords with this scheme. Although hotspots
were not observed with GridMap, users had a tendency to create passwords that were
close to straight lines or contained in all four corners of the grid. Additionally, we test the
improvement to memorability that map images provide to cued-recall graphical passwords.
We find that maps are able to improve the memorability of graphical password system,
because users who have familiarity with the map or attribute significance to elements in it
can increase their memorability for passwords created on it.
Our second work, described in Chapter 3 of this dissertation, explores the viability of
performing gender classification based on mouse dynamics. We design a system that uses
a naturalistic approach to capture the behavioral and anthropometric differences between
men and women using mouse movements. We propose a novel method of feature generation
by running multiple regressions on the metrics collected from mouse movements and use the
regression coefficients as features in the final classifier. This method allows us to capture the
CHAPTER 5. CONCLUSION AND FUTURE WORK 100
effects of different movement parameters, such as the target size, distance, and direction, of
the user’s movement. We then use logistic regression to perform the gender classification.
We test this system on 94 participants and find that it can achieve a maximum accuracy
of 72.4% with the removal of outliers. Although this result does not allow for the creation
of a standalone system for gender classification, it is a significant improvement over the
baseline accuracy of 50% that would be achieved from guessing. With the current accuracy,
the system is able to be used to harden other authentication systems.
In our final work described in Chapter 4, we use touch screen features to enhance
authentication on mobile devices. We first develop an alternative unlock system called TT
which improves the PIN unlock scheme commonly used on mobile devices. TTP requires
users to touch the screen with three fingers at the same time in order to enter their PINs.
One, two, or three digits can be touched simultaneously using the three fingers, resulting
in an increase of the theoretical keyspace from 13.2 bits with traditional PIN inputs to
39.3 bits with 4 TTP inputs. We evaluate the system on 25 users and find that users
do perform some predictable patterns in their inputs (repeating a sequence of numbers
and only using on sub-type of type 2 input), but overall users do not create logins that are
vulnerable to dictionary attacks. Some users were able to log in with time cost as low as five
seconds and general feedback collected showed that users felt they could become faster with
practice and would be willing to use the system to unlock a phone with a reduced number
of inputs. We also explore the viability of using a system we call MFA. In this system, we
propose detecting the differences between the fingers, with which a user touch the screen
while logging in, to increase keyspace. We run a user study with 33 participants, where
a prototype app was used to collect size and force readings from the touch screen when
users interacted with buttons. The data is then used to build a classifier to differentiate
between fingers based on their anthropometric differences. We find that when users use

CHAPTER 5. CONCLUSION AND FUTURE WORK 101
the full pad of their finger to touch the screen the system can differentiate the thumb and
pinkie fingers from other fingers with accuracy considerably higher than the baseline of
20% . This system is not found to be suited for authentication since most users interact
with the screen using their index or middle fingers when not using their thumb. However,
these results can still be helpful to other fields of research.
5.2 Future work
In our future work, we will further improve and extend our current work in behavioral
biometrics and authentication on devices with touch screens.
5.2.1 Behavioral Biometrics
We plan to extend our work in behavioral biometrics shown in Chapter 3, where we use
mouse dynamics to determine a user’s gender. First, we seek to improve the accuracy of the
system. Mouse dynamics is speculated to have lower accuracy than comparable systems,
such as keystroke dynamics, because of the variability in the data it produces. We seek
to address this problem by improving the identification of outliers and the resilience of
the system to the outliers’ effects. To achieve this, a new data collection method would
be developed, where more target sizes and distances could be measured over a shorter
period of time. The new data collection method, instead of having the user move between
only two circles per trial, would have the user pass sequentially through a set of circles
with varying distances and sizes shown on a straight line. This would give more data
points per trial, and diminish the effect of outliers by increasing the size of the overall data
available for classification. Additionally, less trials would be required to gain enough data
to perform classification. The multiple regression step where features are generated would
be altered to be more resilient to outliers by either identifying and removing trials with

CHAPTER 5. CONCLUSION AND FUTURE WORK 102
extreme values, or using regression models that are less affected by outliers. With these
methods, we hope to reduce the affects of data variability and increase the accuracy of the
system.
Second, we plan to extend the use of behavioral biometrics to classify users by other
characteristics such as age or handedness. Being able to determine a user’s age can be very
valuable to assure a user’s identity, and can also be applied to other cases, such as pre-
venting access to restricted content from underaged users, or to dynamically modify a user
interface to better suit the needs of a specific age group, such as the elderly. Both age and
handedness classification can also contribute to hardening existing forms of authentication
by providing extra data to use in the authentication process.
Third, we also plan to apply this research to other platforms. We theorize that many
of the observed gender differences will also apply to targeted movements in other input
methods. One platform we plan to experiment with is on mobile devices with touchscreens.
The classifier could extract all applicable features from an authentication method, such
as the Android pattern unlock, and extend the feature set to include the data gathred
from touch screen sensors. This research may also provide the benefit of identifying new
differences between the populations being studied. Additionally, this research could also
be applied to virtual reality devices such as the Oculus Rift or the Vive. These devices can
capture movements in three dimensions and are even able to calculate the distance between
the arms and the head if used properly. These devices could provide a much richer set of
feature data by capturing the effect of muscles and depth perception, as well as being able
to make more accurate estimation on the length of a user’s arm.

CHAPTER 5. CONCLUSION AND FUTURE WORK 103
5.2.2 Touch Screen Features
Our work in touch screen features can be extended with a usability study on the PIN style
unlock schemes. A field study would be run with many users over a period of days, and
users would need to log into their mobile devices periodically with different input methods.
It would then be possible to learn how quickly users can adapt to a new input method
and what the limitations on the speed of input would be. The study would also be able to
determine the memorability impacts that each of these methods would have on a user. The
results could then be analyzed to identify the best elements of each method and incorporate
them into the design of new unlock schemes.

Bibliography
[1] Anthropometric Reference Data for Children and Adults: United States, 2007-2010.
Number 252 in 11. U.S. Dept. of Healt, 2012.
[2] T. Rogers A. Paivio and P. C. Smythe. Why are pictures easier to recall than
words? Psychonomic Science, 11(4):137–138, 1968.
[3] A.A.E. Ahmed and I. Traore. Anomaly intrusion detection based on biometrics. In
Information Assurance Workshop, 2005. IAW ’05. Proceedings from the Sixth Annual
IEEE SMC, pages 452–453, June 2005.
[4] A.A.E. Ahmed and I. Traore. A new biometric technology based on mouse dy-
namics. Dependable and Secure Computing, IEEE Transactions on, 4(3):165–179, July
2007.
[5] Julio Angulo and Erik Wastlund. Exploring touch-screen biometrics for user
identification on smart phones. In IFIP PrimeLife International Summer School on
Privacy and Identity Management for Life, pages 130–143. Springer, 2011.
[6] Jrme Barral and Deb Bettina. Aiming in adults: sex and laterality effects.
Laterality, 9(3):299–312, 2004.
104

BIBLIOGRAPHY 105
[7] Robert Biddle, Sonia Chiasson, and P. C. Van Oorschot. Graphical pass-
words: Learning from the first twelve years, 2011.
[8] Robert Biddle, Sonia Chiasson, and P.C. Van Oorschot. Graphical pass-
words: Learning from the first twelve years. ACM Comput. Surv., 44(4):19:1–19:41,
sep 2012.
[9] M. Bond. Comments on gridsure authentication. March 2008.
[10] Sacha Brostoff, Philip Inglesant, and M. Angela Sasse. Evaluating the
usability and security of a graphical one-time pin system. In Proceedings of the 24th
BCS Interaction Specialist Group Conference, BCS ’10, pages 88–97. British Computer
Society, 2010.
[11] William Lowe Bryan and Noble Harter. Studies in the physiology and psy-
chology of the telegraphic language. Psychological Review, 4(1):27, 1897.
[12] A S Buchman, S Leurgans, G L Gottlieb, C H Chen, G L Almeida, and
D M Corcos. Effect of age and gender in the control of elbow flexion movements. J
Mot Behav, 32(4):391–9, 2000.
[13] Ting-Yi Chang, Cheng-Jung Tsai, and Jyun-Hao Lin. A graphical-based pass-
word keystroke dynamic authentication system for touch screen handheld mobile de-
vices. Journal of Systems and Software, 85(5):1157–1165, 2012.
[14] KamYuen Cheng and Ajay Kumar. Contactless finger knuckle identification us-
ing smartphones. In Biometrics Special Interest Group (BIOSIG), 2012 BIOSIG-
Proceedings of the International Conference of the, pages 1–6. IEEE, 2012.
BIBLIOGRAPHY 106
[15] Sonia Chiasson, Alain Forget, Robert Biddle, and Paul C. van Oorschot.
Influencing users towards better passwords: persuasive cued click-points. In BCS HCI
(1), David England, editor, pages 121–130. BCS, 2008.
[16] Sonia Chiasson, P. C. Van Oorschot, and Robert Biddle. Graphical password
authentication using cued click-points. In Proceedings of ESORICS 2007. Springer-
Verlag, 2007.
[17] Passfaces Corportion. The science behind passfaces, Last accessed June 2013.
[18] H. Crawford. Keystroke dynamics: Characteristics and opportunities. In 2010
Eighth International Conference on Privacy, Security and Trust, pages 205–212, Aug
2010.
[19] Alexander De Luca, Alina Hang, Frederik Brudy, Christian Lindner, and
Heinrich Hussmann. Touch me once and i know it’s you!: implicit authentication
based on touch screen patterns. In Proceedings of the SIGCHI Conference on Human
Factors in Computing Systems, pages 987–996. ACM, 2012.
[20] N V Dounskaia, S P Swinnen, C B Walter, A J Spaepen, and S M Ver-
schueren. Hierarchical control of different elbow-wrist coordination patterns. Exp
Brain Res, 121(3):239–54, 1998.
[21] Natalia V Dounskaia, Caroline J Ketcham, and George E Stelmach. In-
fluence of biomechanical constraints on horizontal arm movements. Motor Control,
6(4):366–87, 2002.
[22] P. Dunphy and J. Yan. Do images improve ”draw a secret” graphical passwords?
14th ACM Conference on Computer and Communications Security (CCS), October
2007.

BIBLIOGRAPHY 107
[23] Paul Dunphy, Andrew Fitch, and Patrick Olivier. Gaze-contingent passwords
at the atm. In In 4th Conference on Communication by Gaze Interaction (COGAIN,
2008.
[24] Flix Javier Jimnez-Jimnez et. al. Influence of age and gender in motor per-
formance in healthy subjects. Journal of the Neurological Sciences, 302(12):72 – 80,
2011.
[25] Michael Fairhurst and Marjory Da Costa-Abreu. Using keystroke dynamics
for gender identification in social network environment. In Imaging for Crime Detec-
tion and Prevention 2011 (ICDP 2011), 4th International Conference on, pages 1–6,
Nov 2011.
[26] P. M. Fitts. The information capacity of the human motor system in controlling the
amplitude of movement. Journal of Experimental PSychology, 74:381–391, 1954.
[27] Dinei Florencio and Cormac Herley. A large-scale study of web password
habits. In Proceedings of WWW 2007, pages 657–666, 2007.
[28] Alain Forget, Sonia Chiasson, and Robert Biddle. Shoulder-surfing resistance
with eye-gaze entry in cued-recall graphical passwords. In Proceedings of CHI 2010,
pages 1107–1110, 2010.
[29] Alain Forget, Sonia Chiasson, and Robert Biddle. Supporting learning of an
unfamiliar authentication scheme. In AACE E-Learn, E-Learn’12. AACE, 2012.
[30] Mario Frank, Ralf Biedert, Eugene Ma, Ivan Martinovic, and Dawn
Song. Touchalytics: On the applicability of touchscreen input as a behavioral bio-
metric for continuous authentication. IEEE transactions on information forensics and
security, 8(1):136–148, 2013.

BIBLIOGRAPHY 108
[31] Hugo Gascon, Sebastian Uellenbeck, Christopher Wolf, and Konrad
Rieck. Continuous authentication on mobile devices by analysis of typing motion
behavior. In Sicherheit, pages 1–12. Citeseer, 2014.
[32] Romain Giot, Mohamad El-Abed, and Christophe Rosenberger. Greyc
keystroke: A benchmark for keystroke dynamics biometric systems. In Proceedings
of the 3rd IEEE International Conference on Biometrics: Theory, Applications and
Systems, BTAS’09, pages 419–424, Piscataway, NJ, USA, 2009. IEEE Press.
[33] Romain Giot and Christophe Rosenberger. A new soft biometric approach
for keystroke dynamics based on gender recognition. Int. J. Inf. Technol. Manage.,
11(1/2):35–49, dec 2012.
[34] GrIDsure. Gridsure coparate website. Last accessed May 2013.
[35] Omar Hamdy and Issa Traore. Homogeneous physio-behavioral visual and mouse-
based biometric. ACM Trans. Comput.-Hum. Interact., 18(3):12:1–12:30, aug 2011.
[36] Steve Hansen and Digby Elliott. Three-dimensional manual responses to unex-
pected target perturbations during rapid aiming. J Mot Behav, 41(1):16–29, 2009.
[37] Chris Harrison, Julia Schwarz, and Scott E Hudson. Tapsense: enhancing
finger interaction on touch surfaces. In Proceedings of the 24th annual ACM symposium
on User interface software and technology, pages 627–636. ACM, 2011.
[38] Ian Jermyn, Alain Mayer, Fabian Monrose, Michael K. Reiter, and
Aviel D. Rubin. The design and analysis of graphical passwords. In Proceedings
of USENIX Security Symposium 1999, 1999.

BIBLIOGRAPHY 109
[39] P W Johnson, M Hagberg, E W Hjelm, and D Rempel. Measuring and char-
acterizing force exposures during computer mouse use. Scand J Work Environ Health,
26(5):398–405, 2000.
[40] Zach Jorgensen and Ting Yu. On mouse dynamics as a behavioral biometric for
authentication. In Proceedings of the 6th ACM Symposium on Information, Computer
and Communications Security, ASIACCS ’11, pages 476–482, New York, NY, USA,
2011. ACM.
[41] L. K. Karlqvist, E Bernmark, L Ekenvall, M Hagberg, A Isaksson, and
T Rost. Computer mouse position as a determinant of posture, muscular load and
perceived exertion. Scand J Work Environ Health, pages 62–73, 2012.
[42] E. A. Kirkpatrick. An experimental study of memory. Psychological Review, 1:602–
609, 1894.
[43] Saranga Komanduri and Dugald R. Hutchings. Order and entropy in picture
passwords. In Proceedings of graphics interface 2008, GI ’08. Canadian Information
Processing Society, 2008.
[44] David L Lee, Hugh McLoone, and Jack T Dennerlein. Observed finger be-
haviour during computer mouse use. Appl Ergon, 39(1):107–13, 2008.
[45] Kexu Ma, Jiangchen Li, Junpei Han, Yu Hu, and Wenyao Xu. Enhancing
touchscreen input via finger identification. In Semiconductor Technology International
Conference (CSTIC), 2016 China, pages 1–3. IEEE, 2016.
[46] Fabian Monrose, Michael K. Reiter, and Susanne Wetzel. Password hard-
ening based on keystroke dynamics. In Proceedings of the 6th ACM Conference on
BIBLIOGRAPHY 110
Computer and Communications Security, CCS ’99, pages 73–82, New York, NY, USA,
1999. ACM.
[47] Fabian Monrose, Michael K Reiter, and Susanne Wetzel. Password hard-
ening based on keystroke dynamics. International Journal of Information Security,
1(2):69–83, 2002.
[48] Fabian Monrose and Aviel Rubin. Authentication via keystroke dynamics. In
Proceedings of the 4th ACM conference on Computer and communications security,
pages 48–56. ACM, 1997.
[49] Fabian Monrose and Aviel D Rubin. Keystroke dynamics as a biometric for
authentication. Future Generation computer systems, 16(4):351–359, 2000.
[50] James G. Phillips and Thomas J. Triggs. Characteristics of cursor trajecto-
ries controlled by the computer mouse. Ergonomics, 44(5):527–536, 2001. PMID:
11345495.
[51] Maja Pusara and Carla E. Brodley. User re-authentication via mouse move-
ments. In Proceedings of the 2004 ACM Workshop on Visualization and Data Mining
for Computer Security, VizSEC/DMSEC ’04, pages 1–8, New York, NY, USA, 2004.
ACM.
[52] Kasper Bonne Rasmussen, Marc Roeschlin, Ivan Martinovic, and Gene
Tsudik. Authentication using pulse-response biometrics. In The Network and Dis-
tributed System Security Symposium (NDSS), 2 2014.
[53] Daniel Ritter, Florian Schaub, Marcel Walch, and Michael Weber.
Miba: Multitouch image-based authentication on smartphones. In CHI’13 Extended
Abstracts on Human Factors in Computing Systems, pages 787–792. ACM, 2013.
BIBLIOGRAPHY 111
[54] Linda E Rohr. Gender-specific movement strategies using a computer-pointing task.
J Mot Behav, 38(6):431–7, 2006.
[55] Linda E. Rohr. Upper and lower limb reciprocal tapping: Evidence for gender biases.
Journal of Motor Behavior, 38(1):15–17, 2006. PMID: 16436359.
[56] Napa Sae-Bae, Kowsar Ahmed, Katherine Isbister, and Nasir Memon.
Biometric-rich gestures: a novel approach to authentication on multi-touch devices.
In Proceedings of the SIGCHI Conference on Human Factors in Computing Systems,
pages 977–986. ACM, 2012.
[57] H Saevanee and P Bhattarakosol. Authenticating user using keystroke dynamics
and finger pressure. In Consumer Communications and Networking Conference, 2009.
CCNC 2009. 6th IEEE, pages 1–2. IEEE, 2009.
[58] R. Shepard. Recognition memory for words, sentences, and pictures. Journal of
Verbal Learning and Verbal Behavior, 6:156–163, 1967.
[59] R. William Soukoreff and I. Scott MacKenzie. Towards a standard for point-
ing device evaluation, perspectives on 27 years of fitts’ law research in hci. Int. J.
Hum.-Comput. Stud., 61(6):751–789, dec 2004.
[60] Deian Stefan, Xiaokui Shu, and Danfeng (Daphne) Yao. Robustness of
keystroke-dynamics based biometrics against synthetic forgeries. Computers & Se-
curity, 31(1):109 – 121, 2012.
[61] Adam Stubblefield and Dan Simon. Inkblot authentication. Technical report,
Microsoft Research, August 2004.

BIBLIOGRAPHY 112
[62] Jingchao Sun, Rui Zhang, Jinxue Zhang, and Yanchao Zhang. Touchin:
Sightless two-factor authentication on multi-touch mobile devices. In Communications
and Network Security (CNS), 2014 IEEE Conference on, pages 436–444. IEEE, 2014.
[63] Furkan Tari, A. Ant Ozok, and Stephen H. Holden. A comparison of perceived
and real shoulder-surfing risks between alphanumeric and graphical passwords. In
Proceedings of SOUPS 2006. ACM, 2006.
[64] J C Teeken, J J Adam, F G Paas, M P van Boxtel, P J Houx, and J Jolles.
Effects of age and gender on discrete and reciprocal aiming movements. Psychol Aging,
11(2):195–8, 1996.
[65] Pin Shen Teh, Andrew Beng Jin Teoh, and Shigang Yue. A survey of
keystroke dynamics biometrics. The Scientific World Journal, 2013, 2013.
[66] Pin Shen Teh, Ning Zhang, Andrew Beng Jin Teoh, and Ke Chen. A survey
on touch dynamics authentication in mobile devices. Computers & Security, 59:210–
235, 2016.
[67] Namal Thibbotuwawa, Errol R. Hoffmann, and Ravindra S.
Goonetilleke. Open-loop and feedback-controlled mouse cursor movements
in linear paths. Ergonomics : an international journal of research and practice in
human factors and ergonomics, 2012.
[68] Shelby G. Thompson, Daniel S. McConnell, Jeremy S. Slocum, and
Michael Bohan. Kinematic analysis of multiple constraints on a pointing task.
Human Movement Science, 26(1):11 – 26, 2007.

BIBLIOGRAPHY 113
[69] J Wahlstrm, J Svensson, M Hagberg, and P W Johnson. Differences between
work methods and gender in computer mouse use. Scand J Work Environ Health,
26(5):390–397, 2000.
[70] Susan Wiedenbeck, Jim Waters, Jean-Camille Birget, Alex Brodskiy, and
Nasir Memon. Authentication using graphical passwords: effects of tolerance and
image choice. In Proceedings of SOUPS 2005. ACM, 2005.
[71] Susan Wiedenbeck, Jim Waters, Jean-Camille Birget, Alex Brodskiy, and
Nasir Memon. Authentication using graphical passwords: effects of tolerance and
image choice. In Proceedings of SOUPS 2005, 2005.
[72] Susan Wiedenbeck, Jim Waters, Jean-Camille Birget, Alex Brodskiy, and
Nasir Memon. Passpoints: design and longitudinal evaluation of a graphical pass-
word system. Int. J. Hum.-Comput. Stud., 63:102–127, July 2005.
[73] G. Wu and H. Su. Finger identification on a touchscreen, August 8 2013. US Patent
App. 13/816,675.
[74] Hui Xu, Yangfan Zhou, and Michael R Lyu. Towards continuous and passive
authentication via touch biometrics: An experimental study on smartphones. In Sym-
posium On Usable Privacy and Security, SOUPS, volume 14, pages 187–198, 2014.
[75] Roman V. Yampolskiy and Venu Govindaraju. Behavioural biometrics: a sur-
vey and classification. Int. J. Biometrics, 1(1):81–113, jun 2008.
[76] Jeng-Feng Yang and Chiung-Yu Cho. Comparison of posture and muscle control
pattern between male and female computer users with musculoskeletal symptoms. Appl
Ergon, 2011.

BIBLIOGRAPHY 114
[77] Nur Haryani Zakaria, David Griffiths, Sacha Brostoff, and Jeff Yan.
Shoulder surfing defence for recall-based graphical passwords. In Proceedings of
SOUPS 2011, 2011.
[78] Nan Zheng, Kun Bai, Hai Huang, and Haining Wang. You are how you touch:
User verification on smartphones via tapping behaviors. In Network Protocols (ICNP),
2014 IEEE 22nd International Conference on, pages 221–232. IEEE, 2014.