Electrodeless electrohydrodynamic drop-on-demand encapsulation of drugs into porous polymer films...
11
Electrodeless Electrohydrodynamic Drop-on-Demand Encapsulation of Drugs into Porous Polymer Films for Fabrication of Personalized Dosage Units EZINWA ELELE, 1 YUEYANG SHEN, 1 RAMANA SUSARLA, 1 BORIS KHUSID, 1 GOLSHID KEYVAN, 2 BOZENA MICHNIAK-KOHN 2 1 Department of Chemical, Biological, and Pharmaceutical Engineering, New Jersey Institute of Technology, Newark, New Jersey 07102 2 Department of Pharmaceutics, Ernest Mario School of Pharmacy, Rutgers, The State University of New Jersey, Piscataway, New Jersey 08854 Received 5 December 2011; revised 26 March 2012; accepted 4 April 2012 Published online 23 April 2012 in Wiley Online Library (wileyonlinelibrary.com). DOI 10.1002/jps.23165 ABSTRACT: Noncontact drop-on-demand (DOD) dosing is a promising strategy for manu- facturing of personalized dosage units. However, current DOD methods developed for printing chemically and thermally stable, low-viscosity inks are of limited use for pharmaceuticals due to fundamentally different functional requirements. To overcome their deficiency, we developed a novel electrohydrodynamic (EHD) DOD (Appl, Phys, Lett. 97, 233501, 2010) that operates on fluids of up to 30 Pa·s in viscosity over a wide range of droplet sizes and provides a precise control over the droplet volume. We now evaluate the EHD DOD as a method for fabrication of dosage units by printing drug solutions on porous polymer films prepared by freeze-drying. Experiments were carried out on ibuprofen and griseofulvin, as model poorly water-soluble drugs, polyethylene glycol 400, as a drug carrier, and hydroxypropyl methylcellulose films. The similarities between drug release profiles from different dosage units were assessed by model- independent difference, f 1 , and similarity, f 2 , factors. The results presented show that EHD DOD offers a powerful tool for the evolving field of small-scale pharmaceutical technologies for tailoring medicines to individual patient’s needs by printing a vast array of predefined amounts of therapeutics arranged in a specific pattern on a porous film. © 2012 Wiley Periodicals, Inc. and the American Pharmacists Association J Pharm Sci 101:2523–2533, 2012 Keywords: Processing; solid dosage form; drug delivery systems; encapsulation; freeze- drying; dissolution rate INTRODUCTION Studies conducted over the past two decades indicate that a substantial portion of drug response variabil- ity is genetically determined. 1–3 These observations have given rise to the concept of personalized therapy whose ultimate goal is to develop medicinal agents designed for each niche of the population and/or in- dividual patients according to the vagaries and vari- ance of their genes. 1–3 Under a personalized medicine scheme, drug prescribing and dosing should be care- fully tailored to a patient’s genetic background. How- Additional Supporting Information may be found in the online version of this article. Supporting Information Correspondence to: Boris Khusid (Telephone: 1-973-596-3316; Fax: 1-973-596-8436; E-mail: [email protected]) Journal of Pharmaceutical Sciences, Vol. 101, 2523–2533 (2012) © 2012 Wiley Periodicals, Inc. and the American Pharmacists Association ever, the existing pharmaceutical technologies for dosage unit production, which have evolved around large-scale manufacturing of solid dosage forms, can- not address needs of individual patients. Noncon- tact drop-on-demand (DOD) dosing (i.e., droplets are formed only as required) is considered as a promis- ing strategy for the development of novel technolo- gies to make small-scale manufacturing of personal- ized medicines to be economically viable. DOD print- ing, which is commonly used in graphic arts, has re- cently drawn great scientific and industrial interest as a rapid and low-cost fabrication technique for a wide range of novel applications, 4 such as transis- tor circuits, functional ceramics, cell patterns, scaf- folds, and pharmaceutical dosage forms. As a digital technology, computer-controlled DOD dosing is able to form a personalized dosage unit and reduce drug waste by printing a vast array of predefined amounts JOURNAL OF PHARMACEUTICAL SCIENCES, VOL. 101, NO. 7, JULY 2012 2523
-
Upload
independent -
Category
Documents
-
view
4 -
download
0
Transcript of Electrodeless electrohydrodynamic drop-on-demand encapsulation of drugs into porous polymer films...

Electrodeless Electrohydrodynamic Drop-on-DemandEncapsulation of Drugs into Porous Polymer Films for Fabricationof Personalized Dosage Units
EZINWA ELELE,1 YUEYANG SHEN,1 RAMANA SUSARLA,1 BORIS KHUSID,1 GOLSHID KEYVAN,2 BOZENA MICHNIAK-KOHN2
1Department of Chemical, Biological, and Pharmaceutical Engineering, New Jersey Institute of Technology, Newark,New Jersey 07102
2Department of Pharmaceutics, Ernest Mario School of Pharmacy, Rutgers, The State University of New Jersey, Piscataway,New Jersey 08854
Received 5 December 2011; revised 26 March 2012; accepted 4 April 2012
Published online 23 April 2012 in Wiley Online Library (wileyonlinelibrary.com). DOI 10.1002/jps.23165
ABSTRACT: Noncontact drop-on-demand (DOD) dosing is a promising strategy for manu-facturing of personalized dosage units. However, current DOD methods developed for printingchemically and thermally stable, low-viscosity inks are of limited use for pharmaceuticals dueto fundamentally different functional requirements. To overcome their deficiency, we developeda novel electrohydrodynamic (EHD) DOD (Appl, Phys, Lett. 97, 233501, 2010) that operates onfluids of up to 30 Pa·s in viscosity over a wide range of droplet sizes and provides a precisecontrol over the droplet volume. We now evaluate the EHD DOD as a method for fabricationof dosage units by printing drug solutions on porous polymer films prepared by freeze-drying.Experiments were carried out on ibuprofen and griseofulvin, as model poorly water-solubledrugs, polyethylene glycol 400, as a drug carrier, and hydroxypropyl methylcellulose films. Thesimilarities between drug release profiles from different dosage units were assessed by model-independent difference, f1, and similarity, f2, factors. The results presented show that EHDDOD offers a powerful tool for the evolving field of small-scale pharmaceutical technologies fortailoring medicines to individual patient’s needs by printing a vast array of predefined amountsof therapeutics arranged in a specific pattern on a porous film. © 2012 Wiley Periodicals, Inc.and the American Pharmacists Association J Pharm Sci 101:2523–2533, 2012Keywords: Processing; solid dosage form; drug delivery systems; encapsulation; freeze-drying; dissolution rate
INTRODUCTION
Studies conducted over the past two decades indicatethat a substantial portion of drug response variabil-ity is genetically determined.1–3 These observationshave given rise to the concept of personalized therapywhose ultimate goal is to develop medicinal agentsdesigned for each niche of the population and/or in-dividual patients according to the vagaries and vari-ance of their genes.1–3 Under a personalized medicinescheme, drug prescribing and dosing should be care-fully tailored to a patient’s genetic background. How-
Additional Supporting Information may be found in the onlineversion of this article. Supporting Information
Correspondence to: Boris Khusid (Telephone: 1-973-596-3316;Fax: 1-973-596-8436; E-mail: [email protected])Journal of Pharmaceutical Sciences, Vol. 101, 2523–2533 (2012)© 2012 Wiley Periodicals, Inc. and the American Pharmacists Association
ever, the existing pharmaceutical technologies fordosage unit production, which have evolved aroundlarge-scale manufacturing of solid dosage forms, can-not address needs of individual patients. Noncon-tact drop-on-demand (DOD) dosing (i.e., droplets areformed only as required) is considered as a promis-ing strategy for the development of novel technolo-gies to make small-scale manufacturing of personal-ized medicines to be economically viable. DOD print-ing, which is commonly used in graphic arts, has re-cently drawn great scientific and industrial interestas a rapid and low-cost fabrication technique for awide range of novel applications,4 such as transis-tor circuits, functional ceramics, cell patterns, scaf-folds, and pharmaceutical dosage forms. As a digitaltechnology, computer-controlled DOD dosing is ableto form a personalized dosage unit and reduce drugwaste by printing a vast array of predefined amounts
JOURNAL OF PHARMACEUTICAL SCIENCES, VOL. 101, NO. 7, JULY 2012 2523

2524 ELELE ET AL.
Figure 1. Schematics of the printing process and the design of a dosage unit: (a) porous film,(b) pattern of individual droplets deposited on the film, (c) cover with nonporous barrier film,and (d) basic dosage unit.
of therapeutics arranged in a specific pattern on acarrier substrate to achieve a desired drug releaseprofile.
Inkjet printing is currently the dominant techniquefor DOD dosing in biomedical and pharmaceuticalapplications.5–17 Commercially available inkjet printheads employ a short pressure pulse generated ther-mally or piezoelectrically or mechanically to expela fluid droplet out of a nozzle.18 A thermal methoduses a heater to vaporize a small volume of fluid byheating up to 200–300C, so that the resulting bubblewill expand and impart the energy required to eject adroplet. In piezoelectric and electrostatic methods, arapid change in the shape of a piezoelectric crystal oran electrically driven mechanical displacement is uti-lized to apply a strong pressure impulse directly to afluid-filled nozzle to eject a droplet by exposing a fluidto shear rates up to 105 s−1. As these working princi-ples of print heads have been developed for chemicallyand thermally stable, low-viscosity inks (below about20–30 cP because of pressure pulse limitation18), theyappear to be of limited use for pharmaceuticals dueto fundamentally different functional requirements.A pharmaceutical product is a unique, delicate for-mulation composed of active therapeutic ingredientsand inactive substances to ensure a desired absorp-tion rate in the human body and stability over long-term storage. It has to be protected against chemicalchanges that can occur in conventional print headsdue to excessive heating or high shear stress duringdroplet deposition. Next, conventional print heads aredesigned for a particular ink to produce droplets witha narrow size distribution.18 The droplet size dependson the characteristics of a printing regime and the inkviscosity and surface tension. The same print headcannot be therefore used for dosing pharmaceuticalformulations with widely different properties or viadroplets of different sizes.
In Ref. 19, we presented a novel electrodeless elec-trohydrodynamic (EHD) DOD method for gentle dos-ing of pharmaceuticals that overcomes the critical de-ficiency of existing inkjet technologies. The methodversatility was proven on fluids spanning over threeorders of magnitude in viscosity (1–3112 cP) and elec-tric conductivity (0.02–290 :S/cm) over the dropletsize range from 0.1 to 2 :L. A nozzle heater was used
for printing specimens with a melting point aboveroom temperature, such as PEG 3350. This DODmethod was demonstrated to provide a precise con-trol over deposited fluid volume as the droplet vol-ume equals the fluid volume infused into a nozzleregardless of the fluid properties and characteristicsof a deposition regime. Theoretical analysis of dropdynamics19 indicates that there are no physical lim-itations on the extent to which one can increase thefluid viscosity and the droplet size. The purpose ofthe present study was to evaluate the EHD DOD asa method for fabrication of personalized dosage formsby encapsulating active pharmaceutical ingredients(APIs) into a porous polymer film prepared by freeze-drying. Schematics of the process for fabrication of adosage unit are shown in Figure 1. First, an API isdissolved in a carrier liquid with optimal properties.Next, a desired spatial pattern of the API is formed byejecting individual droplets of the API solution froma nozzle on the film in specific locations (Figs. 1a and1b). The droplets then spread over and imbibe intothe film (Fig. 1b). The dosage unit consists of theporous film with the encapsulated API optionally cov-ered with a nonporous barrier film on one or two sides(Figs. 1c and 1d). A personalized delivery system canbe composed of a large number of such units withthe same or different APIs to carefully tailor individ-ual patient’s needs. These drug-loaded films may beeither scored or cut to fit the required dose for a pa-tient allowing flexible dosing regimens. In addition,porous films with encapsulated APIs can be placedinto capsule shells or folded and sealed together toform therapeutic dosage forms.
MATERIALS AND METHOD
Drug Substances and Excipients
Ibuprofen (a nonsteroidal anti-inflammatory drug)and griseofulvin (an antifungal drug), both Biophar-maceutics Classification System class-II compounds,were selected as model API compounds for this study.Polyethylene glycol (PEG) 400 was used as the drugcarrier for both drugs. Biocompatible and hydrophilicPEG was chosen as it is a key component of var-ious delivery systems. Solutions of ibuprofen and
JOURNAL OF PHARMACEUTICAL SCIENCES, VOL. 101, NO. 7, JULY 2012 DOI 10.1002/jps

ELECTRODELESS ELECTROHYDRODYNAMIC DROP-ON-DEMAND ENCAPSULATION OF DRUGS 2525
griseofulvin in PEG 400 were printed on poroushydroxypropyl methylcellulose (HPMC) films pre-pared by freeze-drying (Figs. 1a and 1b). The porousfilm was covered on one side with a nonporousbarrier film (Figs. 1c and 1d) also prepared usingHPMC. HPMC was taken as a hydrophilic mate-rial commonly utilized for the preparation of drugdelivery systems. It is also known for its goodfilm-forming property and biocompatibility. Further-more, PEGs are widely used as plasticizers to im-prove mechanical properties of HPMC films andcoatings. HPMC Methocel E15LV powder was pur-chased from the Dow Chemical(Midland, Michi-gan) . PEG 400 and sodium dodecyl sulfate (SDS)needed for preparing griseofulvin solutions werepurchased from Sigma-Aldrich (St Louis, Missouri).Ibuprofen was purchased from BASF (Florham Park,New Jersey).
Drug Solutions
To prepare drug solutions for printing, ibuprofen andgriseofulvin were dissolved in PEG 400. A 20% (w/wsolution of ibuprofen in PEG 400 was prepared bymixing a weighed amount of ibuprofen with PEG 400.All weight measurements were carried out with aMettler Toledo AL204 laboratory balance with speci-fication of 210 g × 0.0001 g. The mixture was main-tained at 50◦C for 30 min to form a visually homoge-neous, transparent liquid and then left to cool downto room temperature. The solution remained stablefor more than a month. This observation is consistentwith Refs. 20 and 21 that the ibuprofen solubility inPEG 400 is 26.7% (w/w) at 25◦C. As the griseofulvinsolubility in PEG 400 was found to be relatively low,SDS was added to increase its solubility.22,23 A solu-tion of 20% (w/w) griseofulvin and 2% (w/w) SDS inPEG 400 was prepared by mixing weighed amounts ofgriseofulvin and SDS with PEG 400. The mixture wasmaintained at 80◦C for 24 h to form a transparent liq-uid and then left to cool down to room temperature.Likewise, the griseofulvin solution remained stablefor more than a month. Both solutions were packedin airtight containers as PEG 400 is hygroscopic.
Properties of the ibuprofen and griseofulvin so-lutions are listed in Table 1. Their density, vis-cosity, and surface tension were measured usinggraduated cylinders, a Cannon–Fenske tube vis-cometer, and a surface tension apparatus (all fromFisher Scientific, Waltham, Massachusetts ). The elec-tric conductivity and dielectric constant were mea-sured using impedance spectroscopy on a broadbanddielectric spectrometer BDS-80 (Novocontrol, Hund-sangen, Germany ). As can be seen from Table 1, vis-cosities of these solutions substantially exceed the op-erating range of commercially available inkjet printheads.18
Table 1. Fluid Properties at 21◦C and Characteristics ofDeposition Regimes
Solution Composition
20% (w/w) ofIbuprofen in
PEG 400
20% (w/w) ofGriseofulvin and2% (w/w) of SDS
in PEG 400
Density (g/cm3) 1.10 ± 0.02 1.15 ± 0.01Viscosity (cP) 136 ± 5 443 ± 8Surface tension (dyn/cm) 42 ± 2 48 ± 1Conductivity (:S/cm) 0.20 ± 0.04 8.0 ± 0.5Dielectric constant 16.0 ± 1.0 21.0 ± 1.0tc (ms) 1.2 1.1Be 0.9 0.8Oh 1.0 3.0Ip 1.2 1.1
Polymer Films
Polymer films were fabricated from HPMC solutionsin deionized (DI) water. Following the Dow Chemicalprotocol,24 an HPMC solution was prepared by mix-ing a weighed amount of HPMC powder with hot DIwater to form a visually homogeneous, transparentliquid and then slowly cooled down to room temper-ature while stirring. To prepare a 95% porous poly-mer film, a 5% (w/w) HPMC solution was poured intoa well formed by a rubber ring of 0.5 mm in thick-ness (McMaster-Carr, Robbinsville, New Jersey ) thatwas placed on a glass slide coated with a flouropoly-mer release liner (3M, St. Paul, Minnesota). The wellwas covered with another glass slide (coated with thesame liner) and kept in a freezer for 12 h. Then it wastransferred to a freeze drier (Labconco, Kansas City,Missouri) and kept for 24 h to sublimate water, leav-ing a porous film. The film porosity is determined bythe HPMC concentration as N= nwDp
/(nwDp + npDw
),
where Dp = 1290 kg/m3 and Dw = 1000 kg/m3 are, re-spectively, the bulk densities of HPMC and water, np
and nw = 1 − np are, respectively, the weight fractionsof HPMC and water. A nonporous barrier film wasprepared by casting a 5% (w/w) HPMC solution ontoa steel plate with a film-casting knife (BYK-Gardner,Columbia, Maryland) set at 1-mm gap and then driedin a laboratory convection oven at 40◦C for 3 h to forma film of about 40 :m in thickness.
Processing Regimes and Experimental Setup
Figure 2 illustrates the concept of our EHD DODmethod.19 To eliminate adverse effects of electrochem-ical reactions at the fluid–electrode interface in thecourse of deposition, a fluid specimen does not di-rectly come in contact with electrodes. It is thereforeinfused into an electrically insulating nozzle with anenergized electrode mounted externally to form a pen-dant droplet that is then printed on a polymer film(also electrically insulating) placed on a ground elec-trode. The main idea behind our method is to producea sessile droplet by applying an electric force to a
DOI 10.1002/jps JOURNAL OF PHARMACEUTICAL SCIENCES, VOL. 101, NO. 7, JULY 2012

2526 ELELE ET AL.
Figure 2. Three-step printing process: (1) a fluid volumevi is infused into the nozzle to form a pendant droplet, (2) anelectric force generated by an applied voltage stretches thedroplet to form a liquid bridge anchored to the nozzle exitand the film, and (3) the liquid bridge breaks up, creating adroplet on the film and the other hanging from the nozzle.
pendant droplet via capacitive coupling to the elec-trodes during a voltage pulse. Contrary to conven-tional printing methods, droplet deposition is there-fore not accompanied by fluid flow through the nozzle.This feature provides the ability to deposit highly vis-cous fluids.
Printing consists of three key steps shown schemat-ically in Figure 2. Step 1: A predefined volume, vi, of afluid specimen is infused into a nozzle under a gentlepressure to form a pendant droplet, which is smallerthan the critical size for dripping.4,25 A micromanipu-lator is used to position the nozzle over a desired filmlocation. Step 2: A voltage pulse is applied to the upperelectrode to stretch the pendant droplet by an electricforce until it touches the polymer film and forms a liq-uid bridge anchored by capillary forces to the nozzleexit and the film. During the pulse, the droplet servesas a floating electrode capacitively coupled to the ex-ternal electrodes. The pulse consists of two symmet-ric, phase-alternating short signals to suppress unde-
sirable electric field effects on the fluid. Step 3: As theliquid bridge is intentionally formed in an unstableconfiguration, it breaks up, creating two droplets, oneon the film and the other hanging from the nozzle.Once formed, the sessile droplet spreads over the filmand also imbibes into, if the film is porous. The fieldpresence is not required during this period. Produc-ing a single sessile droplet per pulse provides a precisecontrol over its volume as it equals vi for steady-stateoperation.19
Figure 3a illustrates the basic characteristics of aprinting device and a voltage pulse applied to the elec-trodes in step 2 in Figure 2: the nozzle outer diameter2ROD, the porous film thickness h, the separation be-tween the energized and ground electrodes H, vary-ing within ∼ (2 − 4)ROD to reduce the applied voltage,and the voltage pulse length tp and peak Up. The di-agram presented in Figure 3b enables one to choosethe pulse parameters required to stretch a pendantdroplet until it touches the polymer film and formsa liquid bridge. This diagram is expressed in termsof the following nondimensional parameters that de-pend on the fluid density Df, surface tension (f, viscos-ity 0f, and the printing device characteristics (Fig. 3a):the pulse electric Bond number Be = g0U2
pROD
/2(f H2
with g0 = 8.85 × 10 − 12F/m being the vacuum per-mittivity, the Ohnesorge number Oh = 0f
/√Df ROD(f ,
the pulse impulse Ip = (Be/tc)tp∫0
(Ue (t)
/Up
)2 d t with the
capillary time tc =√Df R3
OD
/(f , and Ue (t)
/Up repre-
senting the pulse shape (Ip = Betp/
3tc for triangularpulses used in our experiments; Fig. 3). Region 1 inFigure 3b corresponds to relatively weak pulses. Inthis case, a pendant droplet elongates following theapplication of voltage, but does not touch the film and
Figure 3. Printing device. (a) Schematic: 1, infused fluid volume vi; 2, insulating nozzle; 3,energized electrode; 4, porous polymer film; 5, ground electrode; 6, insulator; 2ROD, the nozzleouter diameter; H, the separation between the energized and ground electrodes; h, the filmthickness and Up, tp are the peak and length of a voltage pulse applied to the electrodes. (b)Modes of droplet deposition: 1, droplet elongates and relaxes back; 2, single sessile dropletformed; 3, multiple sessile droplets formed. Solid lines show the critical line asymptotics Ip ≈0.2 for Oh < 1 and Ip/Oh ≈ 1.2 for Oh > 10.19
JOURNAL OF PHARMACEUTICAL SCIENCES, VOL. 101, NO. 7, JULY 2012 DOI 10.1002/jps

ELECTRODELESS ELECTROHYDRODYNAMIC DROP-ON-DEMAND ENCAPSULATION OF DRUGS 2527
relaxes back to the initial state. For excessively strongpulses (region 3 in Fig. 3b), a droplet is stretchedforming an unstable liquid bridge that breaks up toproduce a sessile drop and a pendant drop, while anelectric field is still on. The process then repeats itselfseveral times, creating several sessile droplets. Suchpulses are inappropriate for controlled deposition asthe sessile droplets have different volumes. Region 2in Figure 3b is attributed to pulses creating a singlesessile droplet. This regime is employed by our EHDDOD method for step 2 in Figure 2. To deposit dropletson an impermeable film, the infused fluid volume, vi,and the separation between two electrodes, H, shouldbe chosen such that a liquid bridge formed in step2 in Figure 2 is unstable and, therefore, will breakup (step 3 in Fig. 2). As was demonstrated in Ref.19, the minimum-volume stability limit of an equi-librium liquid bridge anchored by capillary forces tounequal coaxial disks at negligible gravity provides areasonable estimate of vi and H to form an unstablebridge in step 2 in Figure 2. However, larger dropletscan be printed on a porous film at the same H sincea liquid bridge will become unstable when its volumedecreases below the minimum volume stability limitdue to fluid imbibition into the film.
Photographs of the basic components of the print-ing device listed in Figure 3a are presented in Sup-plementary Figure 1 published online as Support-ing Information. The device included a Teflon nozzle(outer diameter 0.76 mm and inner diameter 0.56 mm(SmallParts, Amazon.com) a micromanipulator com-posed of two independently adjustable stages having3◦ of translation freedom, a programmable microsy-ringe pump (PHD 2000; Harvard Apparatus, Hollis-ton, Massachusetts) and a microscope (Nikon SMZ-2,Garden City, New York) equipped a with a high-sensitivity charge-coupled device (CCD) camera (ahigh-resolution CoolSNAP HQ 2 or a high-speed Cas-cade 128+; both from Photometrics, Tucson, Arizona).The upper electrode (mounted externally on the noz-zle was connected to the positive pole of a high-voltageamplifier (model 10/40; Trek, Medina, New York) con-trolled by a programmable function generator (Agi-lent 33220a, Santa Clara, California The lower elec-trode was mounted on the upper translation stage ofthe micromanipulator and grounded. A film on whichdroplets were printed was placed on the lower elec-trode. A pendant drop was formed by infusing a fluidspecimen into the nozzle with the flow rate and vol-ume controlled by the pump (step 1 in Fig. 2). Thedroplet adopted the shape of a sphere segment withthe contact line along the nozzle outer edge as thegravity force exerted on it was relatively small com-pared to the capillary force under our experimentalconditions. A voltage pulse applied to the electrodes(step 2 in Fig. 2) was produced by the function gen-erator and amplified by the high-voltage amplifier.
Deposition of droplets was recorded by a CCD cam-era through the microscope with image processingcarried out using Nikon NIS-Elements advanced re-search software, Melville, New York .
Droplets of drug solutions were printed one by oneon a porous HPMC film of 35 mm in length, 20 mm inwidth, and 0.5 mm in thickness (weight 30 mg) to forman 8 × 14 array. To prevent overlap of the depositeddroplets, the infused volume and the separation be-tween centers of adjacent droplets were selected tobe 0.2 :L and 2.5 mm, respectively. The film thick-ness was chosen such that droplets were completelyabsorbed. The separation between the energized andground electrodes was maintained at 1.5 mm. Usingthe diagram in Figure 3b, a triangular pulse withthe peak voltage 7 kV and length 5 ms was selectedfor printing droplets. The nondimensional parame-ters of the deposition regime are listed in Table 1.Once droplets were printed, a dosage unit was assem-bled by gluing a cast nonporous HPMC film to coverthe surface of the porous film over which the dropletswere deposited (Fig. 1d). For gluing, several micro-droplets of a 5% (w/w) HPMC solution were pipet-ted onto the nonporous film. Dosage units were fabri-cated by printing 112 droplets of a drug solution thatyielded 4.92 mg of ibuprofen and 5.12 mg of griseoful-vin, thereby corresponding to drug loading of about9.4% per assembled unit. The repeatability of fabri-cating a dosage unit was tested by calculating theweight of a deposited drug solution as a differencebetween the film weights measured before and afterdeposition. The relative standard deviation (%RSD)of the mean weight of ibuprofen and griseofulvin so-lutions deposited to form a dosage unit was found tobe about 0.78% over six dosage units printed in suc-cession.
Characterization of Drugs Encapsulated in PorousPolymer Films
Differential Scanning Calorimetry
The differential scanning calorimetry (DSC) curvesof all specimens were recorded on a Mettler ToledoPolymer DSC thermosystem, Columbus, Ohio. Thecalibration of the instrument was carried out with astandard indium sample provided by Mettler Toledo(ME-119442 no. WE-7936). Thermal behavior wasstudied by heating specimens in 40-:L sealed alu-minum pans, using an empty sealed pan as a refer-ence, to temperatures in excess of the melting pointof the as-received drug powders at a rate of 5◦C/min.To fit into a pan, measurements were conducted on1.2-mg porous HPMC films loaded with 10 dropletsof the drug solutions that yielded a drug loading ofabout 0.5 mg. For comparison, measurements werealso carried out on specimens of a porous HPMC film(1.2 mg) and as-received drug powders (0.5 mg).
DOI 10.1002/jps JOURNAL OF PHARMACEUTICAL SCIENCES, VOL. 101, NO. 7, JULY 2012

2528 ELELE ET AL.
X-Ray Diffractometry
X-ray diffractograms of all specimens were collectedon a Philips PW3040 X-ray diffractometer equippedwith a Cu K" X-ray source, Westborough, Mas-sachusetts . The angular range (22) from 4◦ to 40◦
was recorded with a step-width of 0.03◦ and a scanspeed of 0.015◦ per second. The data were analyzedusing the ibuprofen and griseofulvin X-ray diffrac-tometry (XRD) patterns stored in the instrumentlibrary (X’Pert HighScore, Version 2.2b (2.2.2) 01/11/2006, PANalytical, Westborough, Massachusetts).Measurements were carried out on specimens ofporous HPMC films (15 mg) loaded with 56 dropletsof the drug solutions that yielded a drug loading ofabout 2.5 mg. Comparison was made with measure-ments on a porous HPMC film (15 mg) and as-receiveddrug powders (0.5 mg).
Tests of Dose-to-Dose Variability
Dose-to-dose variability is mainly governed by theaccuracy of controlling the placement and volumeof liquid droplets. The droplet placement error wastested by printing 0.2-:L droplets of a 20% (w/w)griseofulvin solution to form a 4 × 4 square arraywith 2.5-mm center-to-center separation between ad-jacent droplets. Droplets were printed on a tape (3MScotch Super 33+) poorly wettable by that solution.The grayscale top view image of the array was ana-lyzed with a public domain image-processing softwareScion Image, Nashua, Utah to find coordinates of thedroplet centers and then the distances between 24neigboring droplets: 2.47 ± 0.01 mm (mean ± stan-dard deviation).
To test the content uniformity of dosage units asa function of the number of droplets and the associ-ated film surface area, specimens were prepared byprinting 0.2-:L droplets of 20% (w/w) drug solutionson porous HPMC films to form arrays 1 × 5, 2 × 5,2 × 10, 3 × 10, and 4 × 10 with 2.5-mm center-to-center separation between adjacent droplets. Threespecimens at each number of droplets were printedin succession and then analyzed. Two methods wereemployed to find the drug content of a specimen. Oneof them is by calculation from the weight of a de-posited drug solution as a difference between the filmweights measured before and after deposition. Theother is through ultraviolet (UV) spectrophotometry.In this case, a specimen was dissolved in the 5.4-mg/mL SDS solution in DI water. The drug concentrationin a solution was then determined by measuring UVabsorption on an Evolution 300 UV–vis spectropho-tometer (Thermo Fisher Scientific, Waltham, Mas-sachusetts) in 3.5-mL quartz cuvettes (Cole-Parmer,Vernon Hills, Illinois) at a wavelength of 221 nm foribuprofen and of 291 nm for griseofulvin. Solutionswith griseofulvin concentrations of 0.00046, 0.0023,
0.0046, 0.0092, 0.0138, and 0.0184 mg/mL and ibupro-fen concentrations of 0.00044, 0.0022, 0.0044, 0.0088,0.0132 mg/mL were prepared to construct calibrationcurves. Plots of absorbance versus drug concentrationdemonstrated the linearity over the range of expectedconcentrations with nonzero intercepts and the deter-mination coefficients R2 equal to 0.9913 for ibuprofenand 0.9990 for griseofulvin. Preliminary experimentsindicated that the presence of HPMC and SDS in so-lutions over the range of compositions formed by dis-solution of the specimens did not affect the UV ab-sorbance at these wavelengths.
Dissolution Tests
Dissolution tests of assembled dosage units of ibupro-fen and griseofulvin were conducted using the UnitedStates Pharmacopeia (USP) basket method in a disso-lution apparatus Varian VK 7010 equipped with au-tomatic sampling from dissolution vessels for onlineanalysis on a Cary 50 UV–vis spectrophotometer (Var-ian, Palo Alto, California). The dissolution medium,0.2 M phosphate buffer solution at pH 7.2, was pre-pared based on the USP method. The temperature ofthe buffer solution was maintained at 37 ± 0.5◦C. Bas-kets were rotated at 100 rpm. Sink conditions weremaintained. The drug concentration was determinedby measuring UV absorption at a wavelength of 221.5nm for ibuprofen and of 293 nm for griseofulvin. Thefrequency of sampling was 3 min. All tests were runfor 4 h to reach the steady-state value of the UV ab-sorption peak. Following the USP General Chapter<711> Dissolution protocol, six dosage units weretested simultaneously, each placed into a 900-mLvessel filled with the buffer solution. As completedissolution of a drug in 900 mL of the buffer solu-tion corresponded to a concentration of about 0.0055mg/mL, buffer solutions with ibuprofen concentra-tions of 0.011, 0.0055, 0.00275, and 0.001375 mg/mLand griseofulvin concentrations of 0.01466, 0.00733,0.00367, and 0.00183 mg/mL were prepared to con-struct calibration curves. Plots of absorbance versusdrug concentration, which included the absorbancevalue of the blank buffer solution demonstrated thelinearity over the range of expected concentrationswith the determination coefficients R2 equal to 0.9986for ibuprofen and 0.9997 for griseofulvin. Preliminaryexperiments indicated that the presence of PEG 400and SDS in the buffer solution did not affect the ab-sorbance values at wavelengths of 221.5 and 293 nm.
The release profiles were constructed by plottingthe percentage of a dissolved drug as a function oftime. Following the Food and Drug Administration(FDA) guidance,26 release profiles of different dosageunits were compared using the model-independentparameters f1 and f2, referred to as difference and
JOURNAL OF PHARMACEUTICAL SCIENCES, VOL. 101, NO. 7, JULY 2012 DOI 10.1002/jps

ELECTRODELESS ELECTROHYDRODYNAMIC DROP-ON-DEMAND ENCAPSULATION OF DRUGS 2529
similarity factors, respectively27:
f 1 = 100 ·⎡⎣ n∑
j=1
∣∣Yj − Tj∣∣/ n∑
j=1
Yj
⎤⎦ (1)
f 2 = 50 · log
⎡⎢⎣
⎛⎝1 + 1
n
n∑j=1
(Yj − Tj
)2
⎞⎠
−1/2
· 100
⎤⎥⎦ (2)
where n is the number of time points, Yj and Tj are thevalues of two drug release profiles at time tj. The fac-tor f1 expressed in percentage measures the relativedifference between these profiles over all time points.The factor f2 also expressed in percentage measurestheir closeness by characterizing the sum of squareddifferences between them with emphasis on the largerdifference among all time points. For identical pro-files, f1 = 0 and f2 = 100. Drug release profiles areconsidered similar when the calculated values of f1fall between 0 and 15 and values of f2 lie within therange 50–100.
To elucidate the effects of the HPMC films on thedrug release profile, dissolution tests were also con-ducted on specimens of the ibuprofen and griseofulvinsolutions utilized for printing on porous films. In thiscase, a proper amount of a drug solution was weighedout on an impermeable plastic plate and then care-fully placed into baskets of the dissolution apparatus.Testing was carried out using the same protocol asthat for assembled dosage units.
RESULTS AND DISCUSSION
Printing and Characterization of Encapsulated Drugs
Photographs presented in Figure 4a show deposition,spreading, and imbibition of a droplet of the grise-ofulvin solution printed on a porous HPMC film. Aphotograph in Figure 4b illustrates the ability of ourmethod to arrange deposited droplets into variouspatterns on a porous film. Droplets of griseofulvinsolutions shown in this photograph were colored byadding fluorescent dyes PF-38 Tropical Sunlight Or-ange and PF–14 Blue Tang (all from Risk Reactor,Santa Ana, California). A photograph of an assembleddosage unit of 5.12 mg of griseofulvin is presented inFigure 4c. The accuracy of positioning liquid dropletsis about 1.2%.
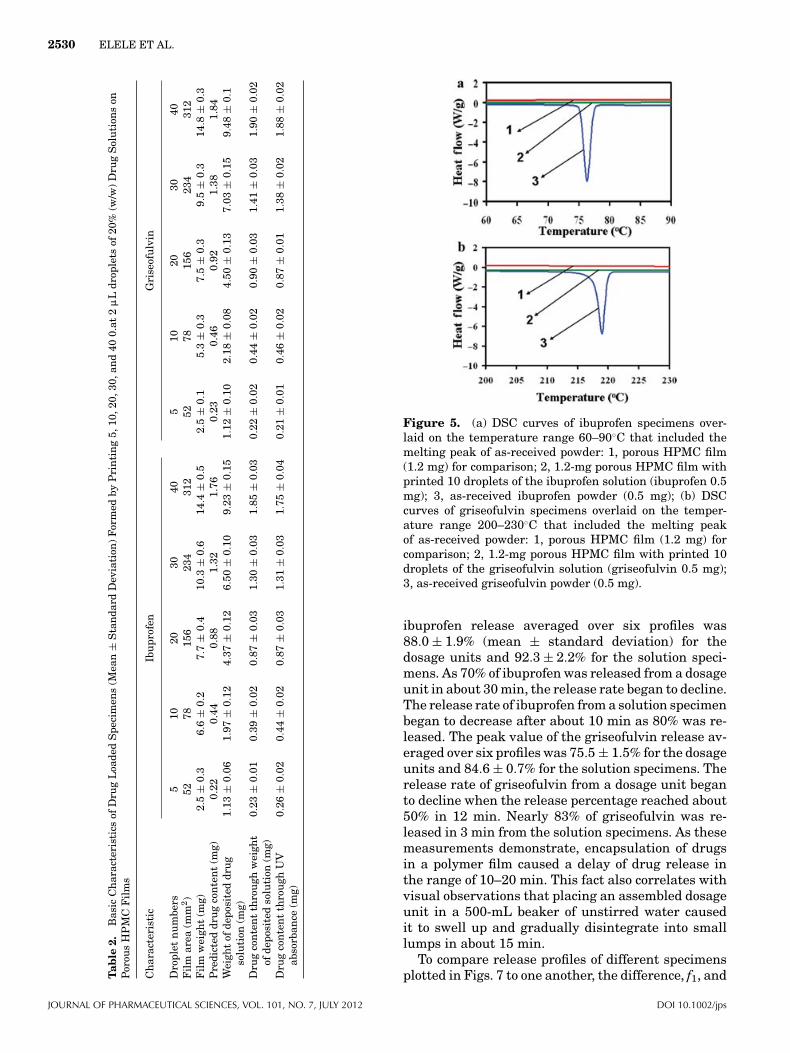
Table 2 shows basic characteristics of a drug-loadedfilm (mean ± standard deviation over three speci-mens) as a function of the number of printed 0.2-:Ldroplets of 20% (w/w) drug solutions and the associ-ated film surface area. For comparison, the drug con-tent of a film predicted based on the number of printeddroplets and the solution density (Table 1) is also pre-
Figure 4. (a) Deposition, spreading, and imbibition of a0.2-:L droplet of griseofulvin solution printed on a 95%porous HPMC film; pulse peak 7 kV and length 5 ms; (b)14 × 8 array of 0.2-:L droplets of griseofulvin solutions withorange and blue dyes printed on a 95% porous HPMC film;and (c) assembled dosage unit of 5.12 mg of griseofulvin;pulse peak 7 kV, and length 5 ms.
sented in Table 2. The reported data sets demonstratethe effectiveness of both methods for measuring thedrug content of films. Furthermore, a difference be-tween the measured and predicted drug contents offilms was found to be less than about 10% and de-crease as the number of droplets increases from 5 to40. %RSD of the drug content in a film measured byboth methods also decreases with increasing the num-ber of droplets from 4%–9% for 5 droplets to 1%–2.4%for 40 droplets.
Plots of DSC curves of 1.2-mg porous HPMC filmswith printed 10 droplets of the drug solutions and,for comparison, DSC curves of 1.2-mg porous HPMCfilms and 0.5-mg as-received powders are shown inFigure 5. Melting peaks appear only on the DSCcurves of the as-received powders. The onset of melt-ing temperatures and the value of the heat of fusionfound for the as-received powders (75.20 ± 0.03◦C,122.5 ± 3.6 J/g for ibuprofen and 218.4 ± 0.6◦C,131.7 ± 7.8 J/g for griseofulvin) are consistent withthe data reported in the literature on a crystallinestate of these drugs. X-ray diffractograms of 15-mgporous HPMC films with printed 56 droplets of drugsolutions (a drug loading of 2.5 mg) and, for com-parison, reference patterns of the drugs in the in-strument library and diffractograms of 15-mg porousHPMC films and 0.5-mg as-received drug powders areshown in Figure 6. Characteristic peaks of crystallineibuprofen and griseofulvin appear only for as-receivedpowders. Observations that drugs encapsulated intoHPMC films did not form crystalline precipitates areconsistent with the DSC curves of such specimensplotted in Figure 5.
Drug Release Profiles
The release profiles of ibuprofen and griseofulvin fromsix assembled dosage units and six solution speci-mens are plotted in Figure 7. The peak value of the
DOI 10.1002/jps JOURNAL OF PHARMACEUTICAL SCIENCES, VOL. 101, NO. 7, JULY 2012
2530 ELELE ET AL.
Tab
le2.
Bas
icC
har
acte
rist
ics
ofD
rug
Loa
ded
Spe
cim
ens
(Mea
n±
Sta
nda
rdD
evia
tion
)F
orm
edby
Pri
nti
ng
5,10
,20,
30,a
nd
400.
at2:
Ldr
ople
tsof
20%
(w/w
)D
rug
Sol
uti
ons
onP
orou
sH
PM
CF
ilm
s
Ch
arac
teri
stic
Ibu
prof
enG
rise
ofu
lvin
Dro
plet
nu
mbe
rs5
1020
3040
510
2030
40F
ilm
area
(mm
2)
5278
156
234
312
5278
156
234
312
Fil
mw
eigh
t(m
g)2.
5±
0.3
6.6
±0.
27.
7±
0.4
10.3
±0.
614
.4±
0.5
2.5
±0.
15.
3±
0.3
7.5
±0.
39.
5±
0.3
14.8
±0.
3P
redi
cted
dru
gco
nte
nt
(mg)
0.22
0.44
0.88
1.32
1.76
0.23
0.46
0.92
1.38
1.84
Wei
ght
ofde
posi
ted
dru
gso
luti
on(m
g)1.
13±
0.06
1.97
±0.
124.
37±
0.12
6.50
±0.
109.
23±
0.15
1.12
±0.
102 .
18±
0.08
4.50
±0.
137.
03±
0.15
9.48
±0.
1
Dru
gco
nte
nt
thro
ugh
wei
ght
ofde
posi
ted
solu
tion
(mg)
0.23
±0.
010.
39±
0.02
0.87
±0.
031.
30±
0.03
1.85
±0.
030.
22±
0.02
0.44
±0.
020.
90±
0.03
1.41
±0.
031.
90±
0.02
Dru
gco
nte
nt
thro
ugh
UV
abso
rban
ce(m
g)0.
26±
0.02
0.44
±0.
020.
87±
0.03
1.31
±0.
031.
75±
0.04
0.21
±0.
010.
46±
0.02
0.87
±0.
011.
38±
0.02
1.88
±0.
02
Figure 5. (a) DSC curves of ibuprofen specimens over-laid on the temperature range 60–90◦C that included themelting peak of as-received powder: 1, porous HPMC film(1.2 mg) for comparison; 2, 1.2-mg porous HPMC film withprinted 10 droplets of the ibuprofen solution (ibuprofen 0.5mg); 3, as-received ibuprofen powder (0.5 mg); (b) DSCcurves of griseofulvin specimens overlaid on the temper-ature range 200–230◦C that included the melting peakof as-received powder: 1, porous HPMC film (1.2 mg) forcomparison; 2, 1.2-mg porous HPMC film with printed 10droplets of the griseofulvin solution (griseofulvin 0.5 mg);3, as-received griseofulvin powder (0.5 mg).
ibuprofen release averaged over six profiles was88.0 ± 1.9% (mean ± standard deviation) for thedosage units and 92.3 ± 2.2% for the solution speci-mens. As 70% of ibuprofen was released from a dosageunit in about 30 min, the release rate began to decline.The release rate of ibuprofen from a solution specimenbegan to decrease after about 10 min as 80% was re-leased. The peak value of the griseofulvin release av-eraged over six profiles was 75.5 ± 1.5% for the dosageunits and 84.6 ± 0.7% for the solution specimens. Therelease rate of griseofulvin from a dosage unit beganto decline when the release percentage reached about50% in 12 min. Nearly 83% of griseofulvin was re-leased in 3 min from the solution specimens. As thesemeasurements demonstrate, encapsulation of drugsin a polymer film caused a delay of drug release inthe range of 10–20 min. This fact also correlates withvisual observations that placing an assembled dosageunit in a 500-mL beaker of unstirred water causedit to swell up and gradually disintegrate into smalllumps in about 15 min.
To compare release profiles of different specimensplotted in Figs. 7 to one another, the difference, f1, and
JOURNAL OF PHARMACEUTICAL SCIENCES, VOL. 101, NO. 7, JULY 2012 DOI 10.1002/jps

ELECTRODELESS ELECTROHYDRODYNAMIC DROP-ON-DEMAND ENCAPSULATION OF DRUGS 2531
Figure 6. X-ray diffractograms: (a) 1, ibuprofen referencepattern in the instrument library; 2, as-received ibuprofenpowder (0.5 mg); 3, 15-mg porous HPMC film with printed56 droplets of the ibuprofen solution (ibuprofen 2.5 mg); 4,porous HPMC film (15 mg); (b) 1, griseofulvin reference pat-tern in the instrument library; 2, as-received griseofulvinpowder (0.5 mg); 3, 15-mg porous HPMC film with printed56 droplets of the griseofulvin solution (griseofulvin 2.5 mg);4, porous HPMC film (15 mg).
similarity, f2, factors were computed for each pair ofthe dosage units and solution specimens of the samedrug. Calculation results are summarized in Supple-mentary Table 1 published online as the SupportingInformation. As can be seen in Supplementary Table1, mean values of both factors averaged over 15 pairsof release profiles fall within the limits (f1 < 15 and f2> 50) required for two profiles to be considered sim-ilar. Even release profiles of pairs whose values of f2are slightly smaller than 50 cannot be interpreted asdifferent because values of f1 for them are smallerthan 15.
Common models28,29 were tested to describe therelease profiles of assembled dosage units plotted inFig. 7. The Korsmeyer–Peppas equation Qt
/Q∞ =
KKPtn with Qt being the cumulative amount of drug re-
leased at moment t was found to provide the best fit toQt
/Q∞ up to 60% with the determination coefficients
R2 ≈ 0.93. The calculated release exponents were n= 0.58 ± 0.16 (mean ± standard deviation averagedover six profiles) for ibuprofen and n = 0.34 ± 0.06for griseofulvin. The values of n suggest that the su-perposition of diffusion (n = 0.5) and swelling (n =1.0) mechanisms controlled the release of ibuprofen,whereas a diffusion-controlled mechanism dominatedin the release of griseofulvin.29 These findings appearto be consistent with a delay in drug release fromdosage units compared with that from specimens ofdrug solutions in Fig. 7 and visual observations madeduring disintegration of HPMC films.
CONCLUSIONS
We have demonstrated that the EHD DOD method19
can be used to fabricate dosage units by encapsulatingdrugs into porous polymer films prepared by freeze-drying. To eliminate adverse effects of electrochemicalreactions at the fluid–electrode interface in the courseof deposition, a fluid specimen did not directly comein contact with electrodes. Once deposited, a dropletspread over and imbibed into a porous film. Comparedto inkjet technologies, droplet deposition was not ac-companied by fluid flow through the nozzle. Owing tothis feature, the EHD DOD method provided a pre-cise control over the deposited droplet volume andthe ability to deposit highly viscous fluids. To test themethod feasibility, experiments were carried out onpoorly water-soluble ibuprofen and griseofulvin andHPMC films. To prepare drug solutions for printing,ibuprofen and griseofulvin were dissolved in PEG 400.Viscosities of these solutions exceeded the operatingrange of commercially available inkjet print heads bya factor of 15–20. An assembled dosage unit consistedof a porous film loaded with 112 droplets of a drugsolution and covered with a thin nonporous HPMCfilm over the surface on which the droplets were de-posited. The positioning accuracy of liquid dropletswas about 1.2%. The drug loading was about 9.4%(w/w) per assembled unit. The relative standard de-viation of the mean weight of a drug solution printedto fabricate a dosage unit was about 0.78%. Dose-to-dose variability decreases rapidly with increasing thenumber of printed droplets from 4%–9% for 5 dropletsto 1%–2.4% for 40 droplets. Drugs encapsulated intoHPMC films did not form crystalline precipitates. Dis-solution tests of assembled dosage units were con-ducted using the USP basket method in phosphatebuffer solution. The drug release profiles of differ-ent dosage units were compared with one anotherusing the model-independent difference, f1, and sim-ilarity, f2, factors. Analysis of these factors showedthat release profiles of ibuprofen and griseofulvinfrom different dosage units can be considered similar.
DOI 10.1002/jps JOURNAL OF PHARMACEUTICAL SCIENCES, VOL. 101, NO. 7, JULY 2012

2532 ELELE ET AL.
Figure 7. Release profiles of ibuprofen from (a) six assembled dosage units and (b) six solutionspecimens and griseofulvin from (c) six assembled dosage units and (d) six solution specimens.
The Korsmeyer–Peppas equation was found to pro-vide the best fit to the release profiles of drugs fromassembled dosage units up to 60%. Computed valuesof the release exponent in this model indicate that re-lease of ibuprofen was presumably controlled by thesuperposition of diffusion and swelling mechanisms,whereas a diffusion-controlled mechanism dominatedfor griseofulvin. This prediction is consistent withdata on drug release from specimens of drug solutionsutilized for printing and visual observations madeduring disintegration of HPMC films.
The results presented show clearly that the EHDDOD method provides a powerful tool for the evolvingfield of small-scale pharmaceutical technologies formanufacturing of personalized medicines. Contraryto conventional inkjet technologies, it offers the abil-ity to print fluids of up to 30 Pa·s in viscosity over awide range of droplet sizes with a precise control overthe droplet volume. The EHD DOD can be used tocarefully tailor individual patient’s needs by printinga vast array of predefined amounts of therapeutics ar-ranged in a specific pattern on a porous film to achievea desired drug release profile.
ACKNOWLEDGMENTS
Authors thank Dr. Mirko Schoenitz, NJIT, for collabo-ration in DSC and X-ray diffraction analysis and Ra-jyalakshmi Boppana, NJIT, for collaboration in test-ing the content uniformity of dosage units. The workwas supported by the NSF Engineering ResearchCenter on Structured Organic Particulate Systems,NSF grant EEC-0540855.
REFERENCES
1. Ma Q, Lu AYH, Sibley DR. 2011. Pharmacogenetics, phar-macogenomics, and individualized medicine. Pharmacol Rev63:437–459.
2. Katsanis SH, Javitt G, Hudson K. 2008. A case study of per-sonalized medicine. Science 320:53–54.
3. Hood L, Heath JR, Phelps ME, Lin B. 2004. Systems biol-ogy and new technologies enable predictive and preventativemedicine. Science 306:640–643.
4. Basaran OA. 2002. Small-scale free surface flows withbreakup: drop formation and emerging applications. AIChEJ 48:1843–1848.
5. Yeo Y, Basaran OA, Park K. 2003. A new process for mak-ing reservoir-type microcapsules using inkjet technology andinterfacial phase separation, J Control Release 93:161–173.
6. Roth EA, Xu T, Das M, Gregory C, Hickman JJ, Boland T.2004. Inkjet printing for high-throughtput cell patterning. Bio-materials 25:3707–3715.
7. Xu T, Joyce Jin J, Gregory C, Hickman JJ, Boland T.2005. Inkjet printing of viable mammalian cells. Biomateri-als 26:93–99.
8. Gustavsson P, Johansson F, Kanje M, Wallman L, Lins-meier CE. 2007. Neurite guidance on protein micropatternsgenerated by a piezoelectric microdispenser. Biomaterials28:1141–1151.
9. Tarcha P, Verlee D, Hui H, Setesak J, Antohe B, Radulescu D,Wallace D. 2007. The application of ink-jet technology for thecoating and loading of drug-eluting stents. Ann Biomed Eng35:1791–1799.
10. Ilkhanizadeh S, Teixeira AI, Hermanson O. 2007. Inkjet print-ing of macromolecules on hydrogels to steer neural stem celldifferentiation. Biomaterials 28:3936–3943.
11. Saunders RE, Gough JE, Derby B. 2008. Delivery of human fi-broblast cells by piezoelectric drop-on-demand inkjet printing.Biomaterials 29:193–203.
12. Zhang C, Wen X, Vyavahare NR, Boland T. 2008. Syn-thesis and characterization of biodegradable elastomericpolyurethane scaffolds fabricated by the inkjet technique. Bio-materials 29:3781–3791.
JOURNAL OF PHARMACEUTICAL SCIENCES, VOL. 101, NO. 7, JULY 2012 DOI 10.1002/jps

ELECTRODELESS ELECTROHYDRODYNAMIC DROP-ON-DEMAND ENCAPSULATION OF DRUGS 2533
13. Yu DG, Zhu LM, Branford-White CJ, Yang XL. 2008. Three-dimensional printing in pharmaceutics: promises and prob-lems. J Pharm Sci 97(9):3666–3690.
14. Cui X, Thomas Boland T. 2009. Human microvasculature fab-rication using thermal inkjet printing technology. Biomateri-als 30:6221–6227.
15. Buanz ABM, Saunders MH, Basit AW, Gaisford S.2011. Preparation of personalized-dose salbutamol sul-phate oral films with thermal ink-jet printing. Pharm Res28(10):2386–2392.
16. Sandler N, Maattanen A, Ihalainen P, Kronberg L,Meierjohann A, Viitala T, Peltonen J. 2011. Inkjet printingof drug substances and use of porous substrates-towards indi-vidualized dosing. J Pharm Sci 100(8):3386–3395.
17. Pardeike J, Strohmeier DM, Schrodl N, Voura C, Gruber M,Khinast JG, Zimmer A. 2011. Nanosuspensions as advancedprinting ink for accurate dosing of poorly soluble drugs in per-sonalized medicines. Int J Pharm 420(1):93–100.
18. Kipphan H. (Ed.): 2001. Handbook of print media: Technolo-gies and production methods. Berlin, Germany: Springer.
19. Elele E, Shen Y, Khusid B. 2010. Electrodeless electro-hydrodynamic printing of personalized medicines. Appl PhysLett 97:233501.
20. Haddadin R, Qian F, Desikan S, Hussain M, Smith RL. 2009.Estimation of drug solubility in polymers via differential scan-ning calorimetry and utilization of the Fox equation. PharmDev Technol 14(1):18–26.
21. Rytting E, Lentz KA, Chen X-Q, Qian F, Venkatesh S. 2005.Aqueous and cosolvent solubility data for drug-like organiccompounds. AAPS J 7(1):E78–E105.
22. Wulff M, Alden M. 1995. Phase equilibria in drug-polymer-surfactant systems. Thermochim Acta 256:151–165.
23. Wulff M, Alden M, Craig DQM. 1996. An investigation intothe critical surfactant concentration for solid solubility of hy-drophobic drug in different polyethylene glycols. Int J Pharm142(2):189–198.
24. The Dow Chemical Company, USA. 2002. METHOCELcellulose ethers: Technical handbook. Accessed April 15,2012 at: http://www.dow.com/PublishedLiterature/dh 004f/0901b8038004fa1b.pdf
25. Eggers J. 1997. Nonlinear dynamics and breakup of free-surface flows. Rev Mod Phys 69:865–929.
26. U.S. Department of Health and Human Services, Foodand Drug Administration, Center for Drug Evaluation andResearch. 1997. Guidance for industry: Dissolution testingof immediate-release solid oral dosage forms. Food andDrug Administration Food and Drug Administration, Cen-ter for Drug Evaluation and Research (CDER). AccessedApril 15, 2012 at: http://www.fda.gov/downloads/Drugs/GuidanceComplianceRegulatoryInformation/Guidances/ucm070237.pdf April 15, 2012.
27. Moore JW, Flanner HH. 1996. Mathematical comparison ofcurves with an emphasis on in vitro dissolution profiles. PharmTech 20(6):64–74.
28. Costa P. 2001. An alternative method to the evaluation ofsimilarity factor in dissolution testing. Int J Pharm 220:77–83.
29. Siepmann J, Peppas NA. 2001. Modeling of drug releasefrom delivery systems based on hydroxypropyl methylcellu-lose (HPMC). Adv Drug Deliver Rev 48(2–3):139–157.
DOI 10.1002/jps JOURNAL OF PHARMACEUTICAL SCIENCES, VOL. 101, NO. 7, JULY 2012