Electrocardiographic changes with the onset of diabetes and the impact of aerobic exercise training...
10
ORIGINAL INVESTIGATION Open Access Electrocardiographic changes with the onset of diabetes and the impact of aerobic exercise training in the Zucker Diabetic Fatty (ZDF) rat Lisa VanHoose 1 , Youssef Sawers 2 , Rajprasad Loganathan 1 , James L Vacek 2 , Lisa Stehno-Bittel 1 , Lesya Novikova 1 , Muhammed Al-Jarrah 3 , Irina V Smirnova 1* Abstract Background: Early markers of diabetic autonomic neuropathy (DAN) in an electrocardiogram (ECG) include elevated R wave amplitudes, widening of QT c intervals and decreased heart rate variability (HRV). The severity of DAN has a direct relationship with mortality risk. Aerobic exercise training is a common recommendation for the delay and possible reversal of cardiac dysfunction. Limited research exists on ECG measures for the evaluation of aerobic exercise training in Zucker Diabetic Fatty (ZDF) rat, a model of type 2 diabetes. The objective of this study was to assess whether aerobic exercise training may attenuate diabetes induced ECG changes. Methods: Male ZDF (obese fa/fa) and control Zucker (lean fa/+) rats were assigned to 4 groups: sedentary control (SC), sedentary diabetic (SD), exercised control (EC) and exercised diabetic (ED). The exercised groups began 7 weeks of treadmill training after the development of diabetes in the ED group. Baseline (prior to the training) and termination measurements included body weight, heart weight, blood glucose and glycated hemoglobin levels and ECG parameters. One way repeated measures ANOVA (group) analyzed within and between subject differences and interactions. Pearson coefficients and descriptive statistics described variable relationships and animal characteristics. Results: Diabetes caused crucial changes in R wave amplitudes (p < 0.001), heart rate variability (p < 0.01), QT intervals (p < 0.001) and QT c intervals (p < 0.001). R wave amplitude augmentation in SD rats from baseline to termination was ameliorated by exercise, resulting in R wave amplitude changes in ED animals similar to control rats. Aerobic exercise training neither attenuated QT or QT c interval prolongation nor restored decreases in HRV in diabetic rats. Conclusion: This study revealed alterations in R wave amplitudes, HRV, QT and QT c intervals in ZDF rats. Of these changes, aerobic exercise training was able to correct R wave amplitude changes. In addition, exercise has beneficial effect in this diabetic rat model in regards to ECG correlates of left ventricular mass. Background Cardiovascular disease (CVD) accounts for the majority of deaths for people with type 2 diabetes mellitus. CVD is a broad term which includes any condition causing pathological changes in blood vessels, cardiac muscle or valves and cardiac rhythm. The electrocardiogram (ECG) offers a quick, non-invasive clinical and research screen for the early detection of CVD. Electrocardiographic changes in raw and corrected QT intervals and R wave amplitudes are early indicators of evolving CVD and increased cardiovascular risk. Pro- longed QT and QT c intervals are considered reliable predictors of heart disease and fatal ventricular arrhyth- mias [1-3]. A positive linear relationship exists between QT c interval prolongation and diabetic cardiac auto- nomic neuropathy (DAN) severity in diabetic population [4]. Heart rate variability (HRV), one indicator of DAN, * Correspondence: [email protected] 1 Department of Physical Therapy and Rehabilitation Science, University of Kansas Medical Center, MS 2002, 3901 Rainbow Blvd, Kansas City, KS 66160, USA Full list of author information is available at the end of the article VanHoose et al. Cardiovascular Diabetology 2010, 9:56 http://www.cardiab.com/content/9/1/56 CARDIO VASCULAR DIABETOLOGY © 2010 VanHoose et al; licensee BioMed Central Ltd. This is an Open Access article distributed under the terms of the Creative Commons Attribution License (http://creativecommons.org/licenses/by/2.0), which permits unrestricted use, distribution, and reproduction in any medium, provided the original work is properly cited.
Transcript of Electrocardiographic changes with the onset of diabetes and the impact of aerobic exercise training...

ORIGINAL INVESTIGATION Open Access
Electrocardiographic changes with the onset ofdiabetes and the impact of aerobic exercisetraining in the Zucker Diabetic Fatty (ZDF) ratLisa VanHoose1, Youssef Sawers2, Rajprasad Loganathan1, James L Vacek2, Lisa Stehno-Bittel1, Lesya Novikova1,Muhammed Al-Jarrah3, Irina V Smirnova1*
Abstract
Background: Early markers of diabetic autonomic neuropathy (DAN) in an electrocardiogram (ECG) includeelevated R wave amplitudes, widening of QTc intervals and decreased heart rate variability (HRV). The severity ofDAN has a direct relationship with mortality risk. Aerobic exercise training is a common recommendation for thedelay and possible reversal of cardiac dysfunction. Limited research exists on ECG measures for the evaluation ofaerobic exercise training in Zucker Diabetic Fatty (ZDF) rat, a model of type 2 diabetes. The objective of this studywas to assess whether aerobic exercise training may attenuate diabetes induced ECG changes.
Methods: Male ZDF (obese fa/fa) and control Zucker (lean fa/+) rats were assigned to 4 groups: sedentary control(SC), sedentary diabetic (SD), exercised control (EC) and exercised diabetic (ED). The exercised groups began 7weeks of treadmill training after the development of diabetes in the ED group. Baseline (prior to the training) andtermination measurements included body weight, heart weight, blood glucose and glycated hemoglobin levelsand ECG parameters. One way repeated measures ANOVA (group) analyzed within and between subjectdifferences and interactions. Pearson coefficients and descriptive statistics described variable relationships andanimal characteristics.
Results: Diabetes caused crucial changes in R wave amplitudes (p < 0.001), heart rate variability (p < 0.01), QTintervals (p < 0.001) and QTc intervals (p < 0.001). R wave amplitude augmentation in SD rats from baseline totermination was ameliorated by exercise, resulting in R wave amplitude changes in ED animals similar to controlrats. Aerobic exercise training neither attenuated QT or QTc interval prolongation nor restored decreases in HRV indiabetic rats.
Conclusion: This study revealed alterations in R wave amplitudes, HRV, QT and QTc intervals in ZDF rats. Of thesechanges, aerobic exercise training was able to correct R wave amplitude changes. In addition, exercise hasbeneficial effect in this diabetic rat model in regards to ECG correlates of left ventricular mass.
BackgroundCardiovascular disease (CVD) accounts for the majorityof deaths for people with type 2 diabetes mellitus. CVDis a broad term which includes any condition causingpathological changes in blood vessels, cardiac muscle orvalves and cardiac rhythm. The electrocardiogram
(ECG) offers a quick, non-invasive clinical and researchscreen for the early detection of CVD.Electrocardiographic changes in raw and corrected QT
intervals and R wave amplitudes are early indicators ofevolving CVD and increased cardiovascular risk. Pro-longed QT and QTc intervals are considered reliablepredictors of heart disease and fatal ventricular arrhyth-mias [1-3]. A positive linear relationship exists betweenQTc interval prolongation and diabetic cardiac auto-nomic neuropathy (DAN) severity in diabetic population[4]. Heart rate variability (HRV), one indicator of DAN,
* Correspondence: [email protected] of Physical Therapy and Rehabilitation Science, University ofKansas Medical Center, MS 2002, 3901 Rainbow Blvd, Kansas City, KS 66160,USAFull list of author information is available at the end of the article
VanHoose et al. Cardiovascular Diabetology 2010, 9:56http://www.cardiab.com/content/9/1/56
CARDIOVASCULAR DIABETOLOGY
© 2010 VanHoose et al; licensee BioMed Central Ltd. This is an Open Access article distributed under the terms of the CreativeCommons Attribution License (http://creativecommons.org/licenses/by/2.0), which permits unrestricted use, distribution, andreproduction in any medium, provided the original work is properly cited.

decreases with diabetes which indicates increased mor-tality risk [5]. QT and QTc interval abnormalities reflectchanges in cardiac architecture. A positive correlationbetween QT or QTc interval prolongation and left ven-tricular (LV) mass has been reported [6-8]. LV hypertro-phy presents as exaggerated R wave amplitudes on ECGrecordings. Elevated R wave amplitudes are an indepen-dent risk factor for cardiovascular events [9]. LV hyper-trophy and QT interval alterations coupled withdecreased cardiac function are commonly observed withdiabetes related CVD [10].Non pharmacological interventions for CVD focus pri-
marily on lifestyle changes with physical activity as theprimary focus and a risk reduction strategy. Physicalactivity reduces QTc interval prolongation and cardiacdysfunction in healthy subjects [11,12]. Exercise lowersheart rate and increases HRV in healthy and diseasedpopulations [13,14]. Physical activity can serve as potentprescription in the delay and attenuation of the CVDcomplications for persons with type 2 diabetes but addi-tional comparative studies are needed regarding the car-diac response to exercise under diabetic conditions atvarious time points of the disease.The Zucker Diabetic Fatty (ZDF) rat is a model of
type 2 diabetes. The ZDF rat develops hyperglycemiaand hyperlipidemia by week 8 and overt diabetes byweek 12. The progression mimics the obesity-relatedinsulin resistance and inflammation seen in humans[15,16]. The ZDF rat is commonly used to investigateprevention of diabetes; however, research related to thediabetic heart disease including ECG studies with thisanimal model is limited. We hypothesized that ECGchanges occur in ZDF rats early in the disease processand aerobic exercise training is able to alleviate thechanges. We detected changes in ECG parameters thatwere partially corrected by exercise training. Our find-ings add to the characterization of the ZDF model forstudying type 2 diabetes effects on the heart and explorethe benefits of an early exercise intervention in the pre-sentation and progression of diabetes related CVD.
MethodsAnimalsMale Zucker Diabetic Fatty (fa/fa) rats of 11 weeks wereutilized for the study. Male lean, age-matched Zucker(fa/+) rats (both from Charles River Laboratory, SaintLouis, MO) served as non-diabetic controls. The animalswere allowed food and water ad libitum and were placedon a 12:12 light-dark cycle. As per vendor’s recommen-dations, the animals were fed Purina 5008 diet duringthe entire study for the development of a disease pro-cess resembling type 2 diabetes and its complications.All animal procedures were performed according to theUniversity of Kansas Medical Center Institutional
Animal Care and Use Committee guidelines and anapproved Animal Care and Use Protocol.
MeasurementsBody weights and blood glucose levels were measuredweekly on all animals. Blood glucose levels were mea-sured from rat tail using Accu-Check Active meter(Roche Diagnostics, Indianapolis, IN). Glycated hemo-globin (HbA1c) levels were measured at the end of theexperiment using antibody-based A1cNow meter(Metrika, Sunnyvale, CA). When rats had blood glucoseor HbA1c levels higher than detectable by the methodused, we used the highest detectable value (600 mmol/Lor 13%, respectively) for statistical purposes. Animalswere killed within 36 hours of the last exercise trainingepisode.
Aerobic exercise trainingThe rats started a treadmill exercise program at12 weeks of age, immediately after the onset of diabetes,and continued exercising for 7 weeks. Four groups ofrats were used: sedentary control (SC, n = 12), sedentarydiabetic (SD, n = 10), exercised control (EC, n = 10) andexercised diabetic (ED, n = 12). This training protocolhas been published by our group previously for a ratmodel of type 1 diabetes [17] and was adapted for theobese diabetic rats as they were unable to perform atthat intensity level. During the first week of training theanimals ran at 10 m/min with time increased from10 min per day to 40 min per day at the end of theweek. The progression allowed the rats to acclimate tothe treadmill. Starting at week two and until the com-pletion of the training session the rats ran at 15 m/min,for 40 minutes, 5 days per week. In order to accommo-date for the disease progression in the diabetic rats, anyanimals showing signs of fatigue were allowed breaks ofa few minutes until they were able to continue, for atotal run time of 40 min per day. All rats assigned tothe exercise groups completed the exercise trainingprotocol.
Electrocardiogram (ECG) assessmentAnimals received ketamine (60 mg/kg) and xylazine(7 mg/kg) prior to the resting ECG recording. ECGleads I, II, III, aVR, aVL, aVF were recorded with surfaceelectrodes (ADInstruments, Colorado Springs, CO).Measurements were collected at baseline, prior to train-ing and after 7 weeks of exercise training. The meanvalue for each rat was obtained from four values consist-ing of four consecutive cardiac cycles using LabChartsoftware (ADInstruments, Colorado Springs, CO).Corrected QT (QTC) was calculated with mean valuesand the Bazett’s Formula (QTc = QT Interval/√ (RRinterval) [18]. The heart rate (bpm) for each animal was
VanHoose et al. Cardiovascular Diabetology 2010, 9:56http://www.cardiab.com/content/9/1/56
Page 2 of 10
calculated by dividing 60 by the mean RR interval. Heartrate variability (HRV) was measured as the standarddeviation of the RR intervals.
Statistical analysisDescriptive statistics was performed on animals’ meansfor each group. One way repeated measures ANOVA(group) analyzed within and between subject differencesand interactions. Single time point measurements orchange scores were completed with one way ANOVA(group) with Least Significant Difference (LSD) post-hocanalysis. Pearson correlations were utilized for relation-ship values. Partial eta squared values are reported forthe proportion of total variability attributed to a factor.Statistics were conducted with PASW Version 17 soft-ware (SPSS Inc, Chicago, IL, USA). Significance wasmeasured at p < 0.05. Results are presented as means ±standard errors. The effect size of baseline body weightswas large with Cohen’s d = 2.8 and power was greaterthan 90% with sample sizes of 10-12 per group.
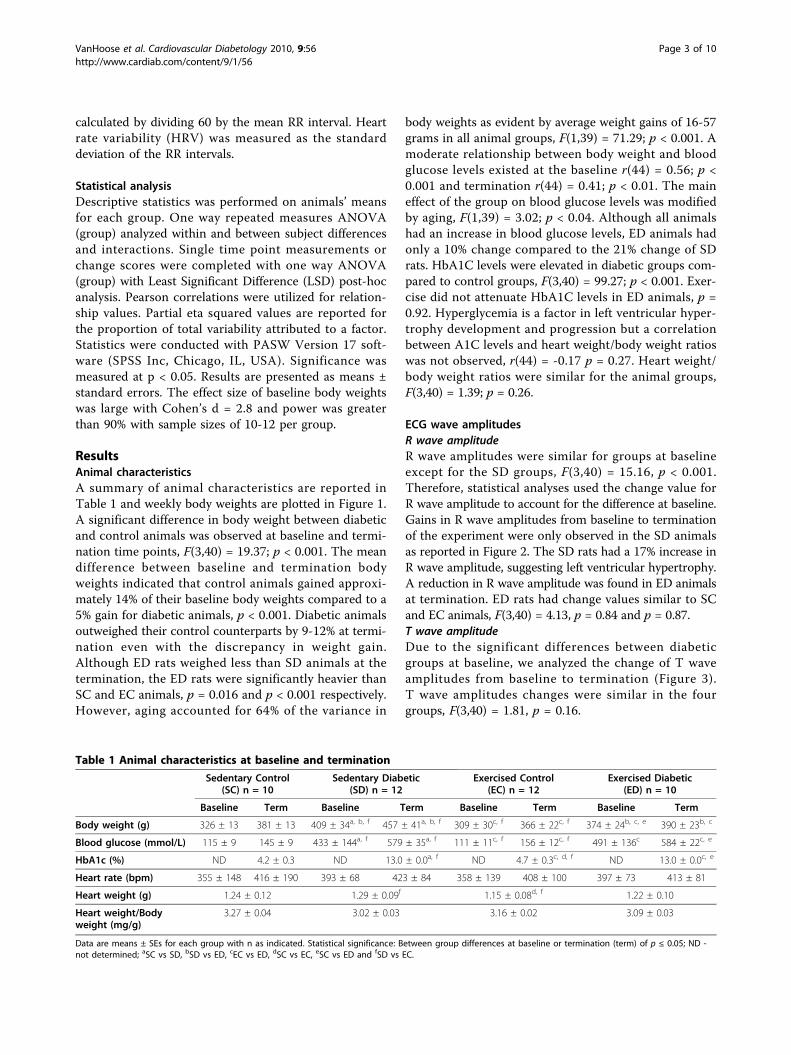
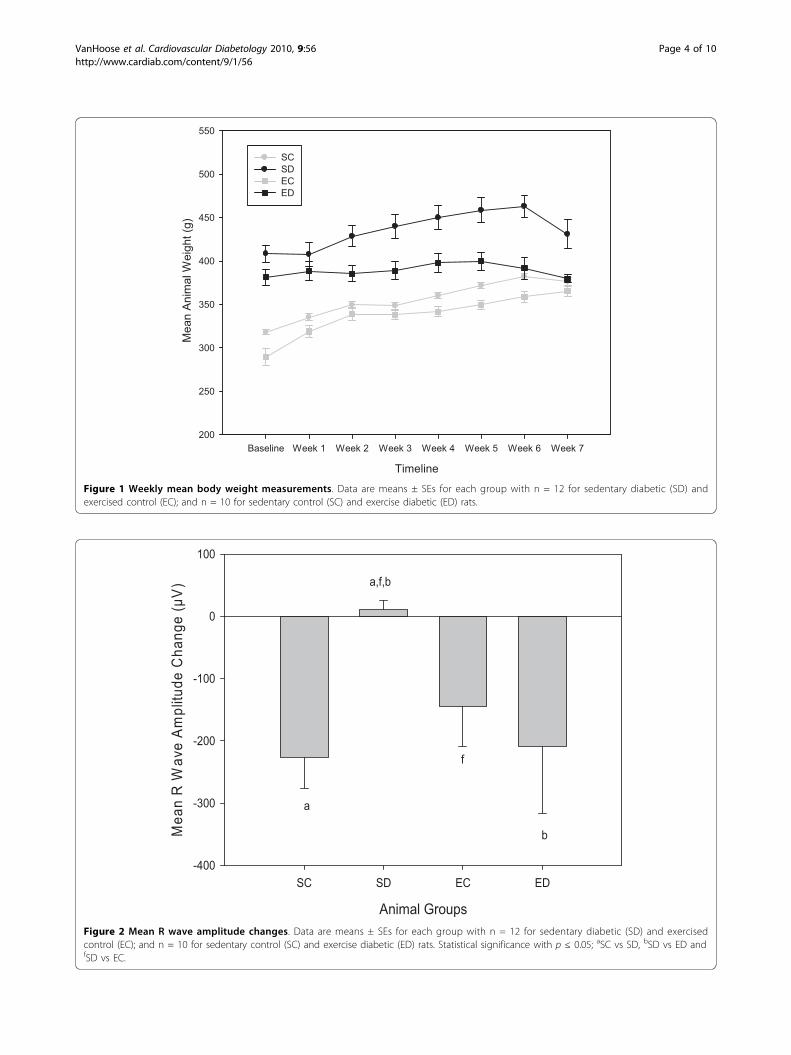
ResultsAnimal characteristicsA summary of animal characteristics are reported inTable 1 and weekly body weights are plotted in Figure 1.A significant difference in body weight between diabeticand control animals was observed at baseline and termi-nation time points, F(3,40) = 19.37; p < 0.001. The meandifference between baseline and termination bodyweights indicated that control animals gained approxi-mately 14% of their baseline body weights compared to a5% gain for diabetic animals, p < 0.001. Diabetic animalsoutweighed their control counterparts by 9-12% at termi-nation even with the discrepancy in weight gain.Although ED rats weighed less than SD animals at thetermination, the ED rats were significantly heavier thanSC and EC animals, p = 0.016 and p < 0.001 respectively.However, aging accounted for 64% of the variance in
body weights as evident by average weight gains of 16-57grams in all animal groups, F(1,39) = 71.29; p < 0.001. Amoderate relationship between body weight and bloodglucose levels existed at the baseline r(44) = 0.56; p <0.001 and termination r(44) = 0.41; p < 0.01. The maineffect of the group on blood glucose levels was modifiedby aging, F(1,39) = 3.02; p < 0.04. Although all animalshad an increase in blood glucose levels, ED animals hadonly a 10% change compared to the 21% change of SDrats. HbA1C levels were elevated in diabetic groups com-pared to control groups, F(3,40) = 99.27; p < 0.001. Exer-cise did not attenuate HbA1C levels in ED animals, p =0.92. Hyperglycemia is a factor in left ventricular hyper-trophy development and progression but a correlationbetween A1C levels and heart weight/body weight ratioswas not observed, r(44) = -0.17 p = 0.27. Heart weight/body weight ratios were similar for the animal groups,F(3,40) = 1.39; p = 0.26.
ECG wave amplitudesR wave amplitudeR wave amplitudes were similar for groups at baselineexcept for the SD groups, F(3,40) = 15.16, p < 0.001.Therefore, statistical analyses used the change value forR wave amplitude to account for the difference at baseline.Gains in R wave amplitudes from baseline to terminationof the experiment were only observed in the SD animalsas reported in Figure 2. The SD rats had a 17% increase inR wave amplitude, suggesting left ventricular hypertrophy.A reduction in R wave amplitude was found in ED animalsat termination. ED rats had change values similar to SCand EC animals, F(3,40) = 4.13, p = 0.84 and p = 0.87.T wave amplitudeDue to the significant differences between diabeticgroups at baseline, we analyzed the change of T waveamplitudes from baseline to termination (Figure 3).T wave amplitudes changes were similar in the fourgroups, F(3,40) = 1.81, p = 0.16.
Table 1 Animal characteristics at baseline and termination
Sedentary Control(SC) n = 10
Sedentary Diabetic(SD) n = 12
Exercised Control(EC) n = 12
Exercised Diabetic(ED) n = 10
Baseline Term Baseline Term Baseline Term Baseline Term
Body weight (g) 326 ± 13 381 ± 13 409 ± 34a, b, f 457 ± 41a, b, f 309 ± 30c, f 366 ± 22c, f 374 ± 24b, c, e 390 ± 23b, c
Blood glucose (mmol/L) 115 ± 9 145 ± 9 433 ± 144a, f 579 ± 35a, f 111 ± 11c, f 156 ± 12c, f 491 ± 136c 584 ± 22c, e
HbA1c (%) ND 4.2 ± 0.3 ND 13.0 ± 0.0a, f ND 4.7 ± 0.3c, d, f ND 13.0 ± 0.0c, e
Heart rate (bpm) 355 ± 148 416 ± 190 393 ± 68 423 ± 84 358 ± 139 408 ± 100 397 ± 73 413 ± 81
Heart weight (g) 1.24 ± 0.12 1.29 ± 0.09f 1.15 ± 0.08d, f 1.22 ± 0.10
Heart weight/Bodyweight (mg/g)
3.27 ± 0.04 3.02 ± 0.03 3.16 ± 0.02 3.09 ± 0.03
Data are means ± SEs for each group with n as indicated. Statistical significance: Between group differences at baseline or termination (term) of p ≤ 0.05; ND -not determined; aSC vs SD, bSD vs ED, cEC vs ED, dSC vs EC, eSC vs ED and fSD vs EC.
VanHoose et al. Cardiovascular Diabetology 2010, 9:56http://www.cardiab.com/content/9/1/56
Page 3 of 10
Timeline
Baseline Week 1 Week 2 Week 3 Week 4 Week 5 Week 6 Week 7
Mean A
nim
al W
eig
ht
(g)
200
250
300
350
400
450
500
550
SC
SD
EC
ED
Figure 1 Weekly mean body weight measurements. Data are means ± SEs for each group with n = 12 for sedentary diabetic (SD) andexercised control (EC); and n = 10 for sedentary control (SC) and exercise diabetic (ED) rats.
Animal Groups
SC SD EC ED
Me
an
R W
ave
Am
plit
ud
e C
ha
ng
e (
µV
)
-400
-300
-200
-100
0
100
a
f
b
a,f,b
Figure 2 Mean R wave amplitude changes. Data are means ± SEs for each group with n = 12 for sedentary diabetic (SD) and exercisedcontrol (EC); and n = 10 for sedentary control (SC) and exercise diabetic (ED) rats. Statistical significance with p ≤ 0.05; aSC vs SD, bSD vs ED andfSD vs EC.
VanHoose et al. Cardiovascular Diabetology 2010, 9:56http://www.cardiab.com/content/9/1/56
Page 4 of 10
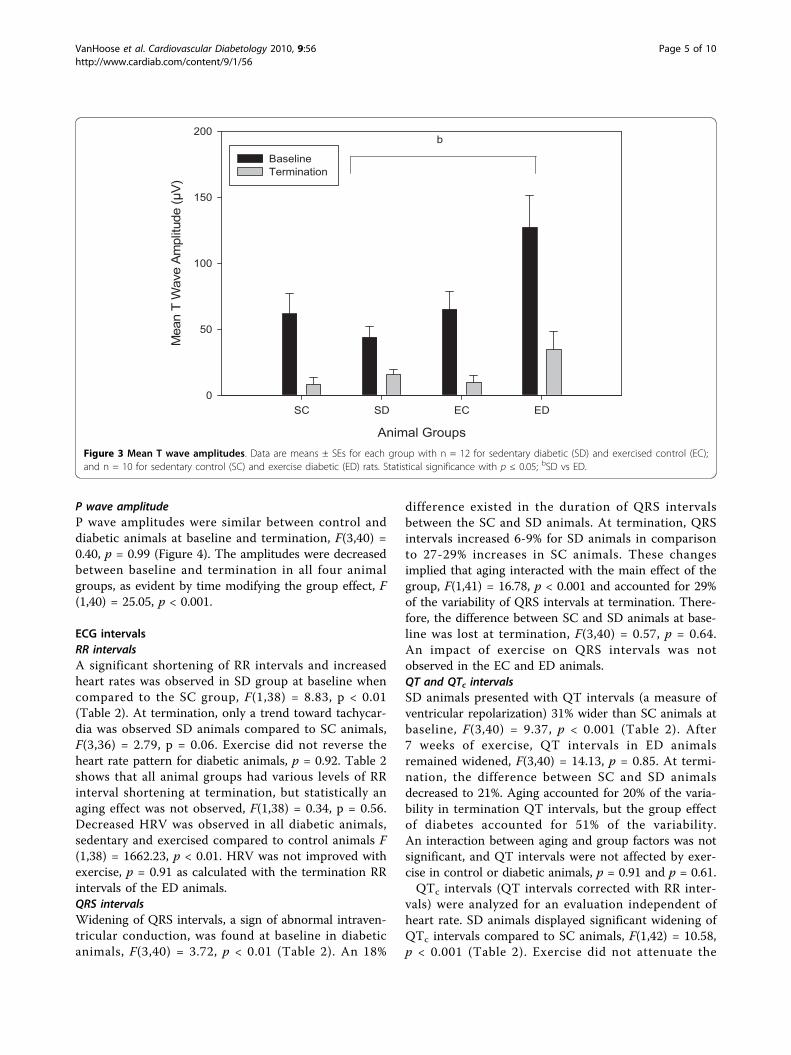
P wave amplitudeP wave amplitudes were similar between control anddiabetic animals at baseline and termination, F(3,40) =0.40, p = 0.99 (Figure 4). The amplitudes were decreasedbetween baseline and termination in all four animalgroups, as evident by time modifying the group effect, F(1,40) = 25.05, p < 0.001.
ECG intervalsRR intervalsA significant shortening of RR intervals and increasedheart rates was observed in SD group at baseline whencompared to the SC group, F(1,38) = 8.83, p < 0.01(Table 2). At termination, only a trend toward tachycar-dia was observed SD animals compared to SC animals,F(3,36) = 2.79, p = 0.06. Exercise did not reverse theheart rate pattern for diabetic animals, p = 0.92. Table 2shows that all animal groups had various levels of RRinterval shortening at termination, but statistically anaging effect was not observed, F(1,38) = 0.34, p = 0.56.Decreased HRV was observed in all diabetic animals,sedentary and exercised compared to control animals F(1,38) = 1662.23, p < 0.01. HRV was not improved withexercise, p = 0.91 as calculated with the termination RRintervals of the ED animals.QRS intervalsWidening of QRS intervals, a sign of abnormal intraven-tricular conduction, was found at baseline in diabeticanimals, F(3,40) = 3.72, p < 0.01 (Table 2). An 18%
difference existed in the duration of QRS intervalsbetween the SC and SD animals. At termination, QRSintervals increased 6-9% for SD animals in comparisonto 27-29% increases in SC animals. These changesimplied that aging interacted with the main effect of thegroup, F(1,41) = 16.78, p < 0.001 and accounted for 29%of the variability of QRS intervals at termination. There-fore, the difference between SC and SD animals at base-line was lost at termination, F(3,40) = 0.57, p = 0.64.An impact of exercise on QRS intervals was notobserved in the EC and ED animals.QT and QTc intervalsSD animals presented with QT intervals (a measure ofventricular repolarization) 31% wider than SC animals atbaseline, F(3,40) = 9.37, p < 0.001 (Table 2). After7 weeks of exercise, QT intervals in ED animalsremained widened, F(3,40) = 14.13, p = 0.85. At termi-nation, the difference between SC and SD animalsdecreased to 21%. Aging accounted for 20% of the varia-bility in termination QT intervals, but the group effectof diabetes accounted for 51% of the variability.An interaction between aging and group factors was notsignificant, and QT intervals were not affected by exer-cise in control or diabetic animals, p = 0.91 and p = 0.61.QTc intervals (QT intervals corrected with RR inter-
vals) were analyzed for an evaluation independent ofheart rate. SD animals displayed significant widening ofQTc intervals compared to SC animals, F(1,42) = 10.58,p < 0.001 (Table 2). Exercise did not attenuate the
Animal Groups
SC SD EC ED
Mean T
Wave A
mplit
ude (
µV
)
0
50
100
150
200
Baseline
Termination
b
Figure 3 Mean T wave amplitudes. Data are means ± SEs for each group with n = 12 for sedentary diabetic (SD) and exercised control (EC);and n = 10 for sedentary control (SC) and exercise diabetic (ED) rats. Statistical significance with p ≤ 0.05; bSD vs ED.
VanHoose et al. Cardiovascular Diabetology 2010, 9:56http://www.cardiab.com/content/9/1/56
Page 5 of 10

widening of QTc intervals in ED animals, p = 0.66.Compared to QT intervals, aging accounted for 85% ofthe variability in QTc intervals and 43% was due togroup effects at termination. The interaction betweentime and group was significant, F(3,40) = 4.54, p < 0.01.PR intervalsBaseline measurements revealed significant prolongationof PR intervals in SD animals compared to SC animals,F(1,39) = 5.40, p < 0.01 (Table 2). At termination, thedifference between groups was not observed, p = 0.34.Exercise did not impact PR intervals in EC and EDanimals.
DiscussionCVD risk is increased up to four-fold in people with dia-betes compared with their nondiabetic counterparts [19].Researchers are aggressively trying to identify early detec-tion methods and explore the factors contributing todiabetes related heart disease. The ZDF rat model is rou-tinely used to investigate physiological and molecularhypotheses regarding diabetes and its related complica-tions. Reports are available indicating cardiac dysfunctionin the ZDF rat established primarily with hemodynamicor echocardiographic measurements or through experi-ments on the isolated heart [20-23]. However, limitedinformation exists about the ECG changes that occur inthe ZDF rat and its response to physical activity, specifi-cally to aerobic exercise that is commonly recommended
for those at risk or diagnosed with diabetes related heartdisease [24,25]. Our project aimed to address this gap inthe current literature.Although we did not measure autonomic function
directly, ECG indicators of autonomic dysfunction wereobserved in the ZDF rats at baseline with HRV altera-tions, tachycardia and QT interval prolongation. Auto-nomic innervations control HRV and cardiac functionthrough a delicate balance of sympathetic and parasym-pathetic responses. Diabetes stimulates the sympatheticnervous system initially but prolonged exposure tohyperglycemia and elevated catecholamine levels cause adecrease in adrenergic receptors [26]. As diabetescreates a sympathetic predominance, it also produces acorresponding parasympathetic imbalance by denerva-tion of the vagus nerve. Subclinical symptoms of DAN,primarily decreased HRV, are believed to appear inhumans within one year of type 2 diabetes diagnosisand clinical presentations may not emerge until yearsinto the diagnosis [27]. Bergstrom et al identified symp-toms of DAN in type 1 diabetic patients with durationsof diabetes as low as two months [28]. In our animalstudy, diminished HRV was noted in ECG recordings asearly as within one week of diabetes onset for the ZDF.Clinical DAN symptoms include resting tachycardia,
exercise intolerance and orthostatic hypotension andheart rate syndromes [29]. Tachycardia was observed indiabetic animals at baseline, within a week of diabetes
Animal Groups
SC SD EC ED
Mean P
Wave A
mplit
ude (
µV
)
0
20
40
60
80
100
Baseline
Termination
Figure 4 Mean P wave amplitudes. Data are means ± SEs for each group with n = 12 for sedentary diabetic (SD) and exercised control (EC);and n = 10 for sedentary control (SC) and exercise diabetic (ED) rats. Statistical significance (p < 0.001) between baseline and termination valueswas found in all four animal groups.
VanHoose et al. Cardiovascular Diabetology 2010, 9:56http://www.cardiab.com/content/9/1/56
Page 6 of 10
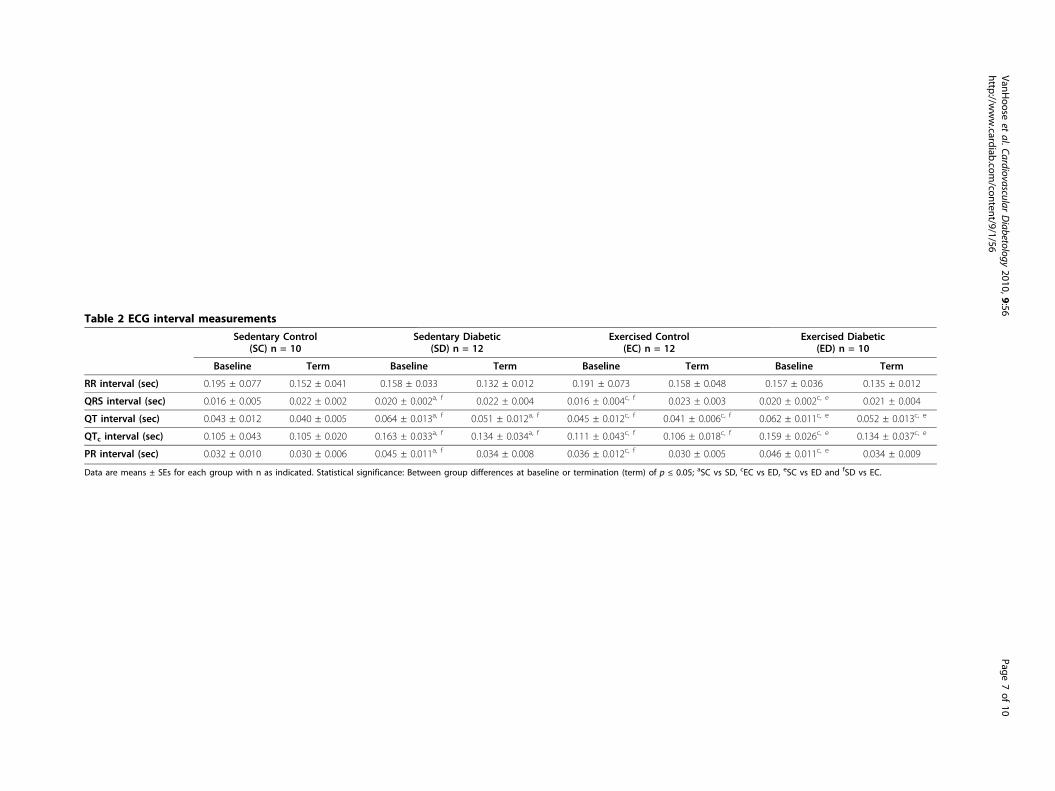
Table 2 ECG interval measurements
Sedentary Control(SC) n = 10
Sedentary Diabetic(SD) n = 12
Exercised Control(EC) n = 12
Exercised Diabetic(ED) n = 10
Baseline Term Baseline Term Baseline Term Baseline Term
RR interval (sec) 0.195 ± 0.077 0.152 ± 0.041 0.158 ± 0.033 0.132 ± 0.012 0.191 ± 0.073 0.158 ± 0.048 0.157 ± 0.036 0.135 ± 0.012
QRS interval (sec) 0.016 ± 0.005 0.022 ± 0.002 0.020 ± 0.002a, f 0.022 ± 0.004 0.016 ± 0.004c, f 0.023 ± 0.003 0.020 ± 0.002c, e 0.021 ± 0.004
QT interval (sec) 0.043 ± 0.012 0.040 ± 0.005 0.064 ± 0.013a, f 0.051 ± 0.012a, f 0.045 ± 0.012c, f 0.041 ± 0.006c, f 0.062 ± 0.011c, e 0.052 ± 0.013c, e
QTc interval (sec) 0.105 ± 0.043 0.105 ± 0.020 0.163 ± 0.033a, f 0.134 ± 0.034a, f 0.111 ± 0.043c, f 0.106 ± 0.018c, f 0.159 ± 0.026c, e 0.134 ± 0.037c, e
PR interval (sec) 0.032 ± 0.010 0.030 ± 0.006 0.045 ± 0.011a, f 0.034 ± 0.008 0.036 ± 0.012c, f 0.030 ± 0.005 0.046 ± 0.011c, e 0.034 ± 0.009
Data are means ± SEs for each group with n as indicated. Statistical significance: Between group differences at baseline or termination (term) of p ≤ 0.05; aSC vs SD, cEC vs ED, eSC vs ED and fSD vs EC.
VanHoose
etal.Cardiovascular
Diabetology
2010,9:56http://w
ww.cardiab.com
/content/9/1/56Page
7of
10
onset. Tachycardia is also a common finding in humanswith uncontrolled diabetes [30]. Similarly, our animalswere not treated for their hyperglycemia as evident byblood glucose and HbA1C levels. The role of tachycar-dia is controversial because research indicates that itmay be a diabetic complication or a causative factor ofdiabetes. Nagaya et al argue that elevated resting heartrates and systolic blood pressure increase the risk fortype 2 diabetes [31]. Another work by the same groupindicated that prolonged QTc intervals were also anindependent risk factor for the development of diabetes[32]. Our analysis indicates that widening of QTc inter-vals was present with the onset of diabetes at twelveweeks of age in ZDF rats. Thus abnormalities of ventri-cular repolarization are present at an early stage of dia-betes in this model. An earlier time study would beuseful to verify the presence of tachycardia and QTc
interval prolongation during a pre-diabetic state. Ofinterest, several ECG parameters in our study showedan impact of aging, in agreement with findings by others[33] indicating cardiac and renal changes in the ZDF ratmodel with aging, up to 36 months.P wave amplitudes were unaffected with the onset of
diabetes. Future studies need to investigate the relation-ship between the dispersion of the P wave and the onsetof diabetes. Obesity is commonly linked to diabetes andis reported to increase the dispersion of the P wave [34].PR intervals were widened in diabetic animals at base-line, but normalized at termination. PR intervals arecommonly associated with atrial fibrillation [35,36];however our ECG assessments of diabetic animals didnot indicate atrial dysfunction. Diabetes and exerciseappeared to have no effect on T wave amplitudes.T wave amplitudes were skewed at baseline and there-fore change scores were used for analysis. However, themorphology of the T wave has shown to have prognos-tic value for CVD, not amplitude changes [37,38].After seven weeks of aerobic exercise, ED animals
showed R wave amplitudes comparable to control ani-mals. Only SD animals had an increase in R wave ampli-tude. Hyperglycemia is associated with left ventricularhypertrophy in type 2 diabetes [39]. The increase in Rwave amplitude may indicate a change in left ventricularmass. With diabetes, pathological hypertrophy resultsfrom myocardial damage and fibrosis [40-42]. Fibrosisaffects the filling and contractility of the ventricles. Sub-sequently, cardiac dysfunction presents as decreasedactivity tolerance, ejection fraction, cardiac output andheart failure [43]. However, other factors can alter Rwave amplitudes, including electrical axis deviations,altered electrodes position and differences in chest wallthickness. Ideally, the ECG should be correlated with anechocardiography. Unfortunately, we were unable to useechocardiography approach, thus we recognize this as a
limitation of this study. In analyzing other indications ofheart hypertrophy, we found no difference in the heartweight/body weight ratio in our study. Alternatively, theLV weight/tibial length ratio has been validated as anindex of cardiac hypertrophy in mature rats [44]. Due tothe fact that the onset of diabetes in the ZDF rat occursearly in their age, we were restricted to using relativelyyoung animals that were in the latter stages of theirgrowth phase. Thus, normalizing heart size to the chan-ging tibial bone length during growth may not have pro-vided an accurate estimation in our study. Darmellah etal reported that normalization of the heart weight perbody weight or tibial length resulted in similar measure-ments of cardiac hypertrophy in Goto-Kakizaki animals,another rat model of type 2 diabetes [45].Aerobic exercise did not impact the hyperglycemia.
Exercise is postulated to improve glucose uptake anddecrease lipid accumulation in persons with controlleddiabetes but the protective mechanism of exercise is lostif hyperglycemia persist [46]. A comparative study offenobirate and metformin validated the role of lipid oxi-dation in the development and progression of diabetesrelated heart disease, with fenobirate decreasing trigly-cerides content and fibrosis in diabetic myocardium[47]. The switch in myocardial substrate from glucose tofatty acids has been shown to result in systolic and dia-stolic dysfunction in the ZDF model [48]. Exercise train-ing has also been suggested to improve microcirculationthrough enhanced endothelial function [49] throughnormalizing glycemic levels. However, the severity ofdiabetes will determine if the body can adapt to thedemands of exercise or regional flow has already beencompromised beyond recovery [50]. Microcirculatorydisturbances or small vessel disease may lead to declinesin myocardial blood flow which could influence ECGparameters [51].A 31% difference in QT intervals was reported
between SC and SD animals at baseline. We hypothesizethat cardiac remodeling was already in the process inthe SD rats when we were taking the baseline measures,prior to any training, due to animals already displayinghyperglycemia and obesity associated with the genotype,in contrast to the SC rat. QTc intervals did not respondto exercise, but the chronic tachycardia shortened theintervals as a compensatory effect. Commonly, exercisemay cause a decrease in heart rate and increased ventri-cular relaxation which presents as longer QT intervals.A study investigating the effects of a seven monthendurance training program in dogs revealed an increasein QT intervals [52]. An acute resistance exerciseresulted in a similar effect on QTc intervals [53]. Sinceour obese, diabetic animals were showing early signs ofautonomic disturbance, exercise tolerance was loweredand animals required frequent rest breaks during our
VanHoose et al. Cardiovascular Diabetology 2010, 9:56http://www.cardiab.com/content/9/1/56
Page 8 of 10

training program. The mode and duration of exercisemight not have been sufficient for QTc interval adapta-tion. In a future study we will investigate longer dura-tions of exercise training to see whether it may returndiabetic animals to normal heart rates or restore HRV.Pagkalos et al reported improvements in cardiac auto-nomic function with six months of aerobic exercisetraining [54]. Another alternative is the evaluation ofHRV during post-exercise recovery. Training may notaffect resting HRV, but the benefits may be evident withthe post-exercise recovery. This conclusion is supportedby a study investigating cardiac autonomic function inwomen with and without diabetes [55].
ConclusionsIn summary, our investigation proved that ECG altera-tions do occur with diabetes in the ZDF rat. The altera-tions include prolongation of the QTc interval andtachycardia which constitute important electrophysiolo-gic alterations in this animal model of diabetes. Thesemodifications coupled with high R wave amplitude illus-trate the early cardiac anatomic and electrophysiologicalterations in this diabetic model. After seven weeks ofexercise training, R wave amplitude changes in diabeteswere similar to control animals from baseline to termi-nation. However, aging may have an impact on severalECG parameters and the ZDF model showed changes inatrial and ventricular conduction possibly due to aninteraction of aging and group effects. Future studies areneeded to investigate ECG changes in the ZDF modelbefore the onset of diabetes which will provide addi-tional information about the use of QTc intervals andHRV in the early detection of DAN.
AcknowledgementsWe thank Aziz Shaibekov and Purvi Patel for helping with animal exercisetraining.National Institutes of Health Grant Number P20 RR016475 from the INBREProgram of the National Center for Research Resources (IVS) providedresources for conducting the study. The U.S. Department of Health andHuman Service through a National Research Service Award from theNational Heart, Lung, and Blood Institute (LVH) supported analysis andinterpretation of data and manuscript development. National Institute ofChild Health and Human Development Grant Number HD02528 supportedcore facility services.
Author details1Department of Physical Therapy and Rehabilitation Science, University ofKansas Medical Center, MS 2002, 3901 Rainbow Blvd, Kansas City, KS 66160,USA. 2Mid America Cardiology, University of Kansas Hospital, MS 4023, 3901Rainbow Blvd, Kansas City, KS 66160, USA. 3Department of Allied MedicalSciences, Faculty of Applied Medical Sciences, Jordan University of Scienceand Technology, Irbid 22110, Jordan.
Authors’ contributionsLVH performed data analysis and interpretation and drafted the manuscript.YS performed data analysis and interpretation. RL handled the animals,completed the electrocardiograms and participated in data analysis. JVparticipated in data analysis and interpretation and revision of the
manuscript draft. LSB participated in the design of the study and animalhandling, contributed to the interpretation of results and revision of themanuscript draft. LN participated in exercise training, data collection andcoordination of the study. MAJ participated with the exercise training of theanimals and data collection. IVS conceived the study, participated in thedesign, oversaw all the work, handled animals, performed data collectionand revised the manuscript draft. All authors approved of the finalmanuscript.
Competing interestsThe authors declare that they have no competing interests.
Received: 5 August 2010 Accepted: 22 September 2010Published: 22 September 2010
References1. Gorodeski EZ, Ishwaran H, Blackstone EH, Lauer MS: Quantitative
electrocardiographic measures and long-term mortality in exercise testpatients with clinically normal resting electrocardiograms. Am Heart J2009, 158(1):61-70.
2. Cardoso CR, Salles GF, Deccache W: QTc interval prolongation is apredictor of future strokes in patients with type 2 diabetes mellitus.Stroke 2003, 34(9):2187-2194.
3. Christensen PK, Gall MA, Major-Pedersen A, Sato A, Rossing P, Breum L,Pietersen A, Kastrup J, Parving HH: QTc interval length and QT dispersionas predictors of mortality in patients with non-insulin-dependentdiabetes. Scand J Clin Lab Invest 2000, 60(4):323-332.
4. Mathur C, Gupta D: QTc prolongation in diabetes mellitus-An indicator ofcardiac autonomic neuropathy. Journal, Indian Academy Clinical Medicine2006, 7(2):130-132.
5. Schroeder EB, Chambless LE, Liao D, Prineas RJ, Evans GW, Rosamond WD,Heiss G: Diabetes, glucose, insulin, and heart rate variability: theAtherosclerosis Risk in Communities (ARIC) study. Diabetes Care 2005,28(3):668-674.
6. Oikarinen L, Nieminen MS, Viitasalo M, Toivonen L, Wachtell K,Papademetriou V, Jern S, Dahlof B, Devereux RB, Okin PM: Relation of QTinterval and QT dispersion to echocardiographic left ventricularhypertrophy and geometric pattern in hypertensive patients. The LIFEstudy. The Losartan Intervention For Endpoint Reduction. J Hypertens2001, 19(10):1883-1891.
7. Davey PP, Barlow C, Hart G: Prolongation of the QT interval in heartfailure occurs at low but not at high heart rates. Clin Sci (Lond) 2000,98(5):603-610.
8. Pshenichnikov I, Shipilova T, Kaik J, Volozh O, Abina J, Lass J, Karai D: QTdispersion in relation to left ventricular geometry and hypertension in apopulation study. Scand Cardiovasc J 2003, 37(2):87-90.
9. Nakamura K, Okamura T, Hayakawa T, Kadowaki T, Kita Y, Okayama A,Ueshima H: Electrocardiogram screening for left high R-wave predictscardiovascular death in a Japanese community-based population:NIPPON DATA90. Hypertens Res 2006, 29(5):353-360.
10. Zhang X, Wang X, Li L, Zhang G, Gao Y, Cui J: An analysis of factorsinfluencing electrocardiogram stress test for detecting coronary heartdisease. Chin Med J (Engl) 1999, 112(7):590-592.
11. Perhonen MA, Haapalahti P, Kivisto S, Hekkala AM, Vaananen H, Swan H,Toivonen L: Effect of physical training on ventricular repolarization intype 1 long QT syndrome: a pilot study in asymptomatic carriers of theG589 D KCNQ1 mutation. Europace 2006, 8(10):894-898.
12. Genovesi S, Zaccaria D, Rossi E, Valsecchi MG, Stella A, Stramba-Badiale M:Effects of exercise training on heart rate and QT interval in healthyyoung individuals: are there gender differences? Europace 2007,9(1):55-60.
13. Tuomainen P, Peuhkurinen K, Kettunen R, Rauramaa R: Regular physicalexercise, heart rate variability and turbulence in a 6-year randomizedcontrolled trial in middle-aged men: the DNASCO study. Life Sci 2005,77(21):2723-2734.
14. Sandercock GR, Bromley PD, Brodie DA: Effects of exercise on heart ratevariability: inferences from meta-analysis. Med Sci Sports Exerc 2005,37(3):433-439.
15. Schmidt RE, Dorsey DA, Beaudet LN, Peterson RG: Analysis of the ZuckerDiabetic Fatty (ZDF) type 2 diabetic rat model suggests a neurotrophic
VanHoose et al. Cardiovascular Diabetology 2010, 9:56http://www.cardiab.com/content/9/1/56
Page 9 of 10
role for insulin/IGF-I in diabetic autonomic neuropathy. Am J Pathol 2003,163(1):21-28.
16. Leonard BL, Watson RN, Loomes KM, Phillips AR, Cooper GJ: Insulinresistance in the Zucker diabetic fatty rat: a metabolic characterisationof obese and lean phenotypes. Acta Diabetol 2005, 42(4):162-170.
17. Searls YM, Smirnova IV, Fegley BR, Stehno-Bittel L: Exercise attenuatesdiabetes-induced ultrastructural changes in rat cardiac tissue. Med SciSports Exerc 2004, 36(11):1863-1870.
18. Heffernan KS, Jae SY, Fernhall B: Heart rate recovery after exercise isassociated with resting QTc interval in young men. Clin Auton Res 2007,17(6):356-363.
19. Preis SR, Hwang SJ, Coady S, Pencina MJ, D’Agostino RB Sr, Savage PJ,Levy D, Fox CS: Trends in all-cause and cardiovascular disease mortalityamong women and men with and without diabetes mellitus in theFramingham Heart Study, 1950 to 2005. Circulation 2009,119(13):1728-1735.
20. Boudina S, Abel ED: Diabetic cardiomyopathy revisited. Circulation 2007,115(25):3213-3223.
21. Baynes JW, Murray DB: The metal chelators, trientine and citrate, inhibitthe development of cardiac pathology in the Zucker diabetic rat. ExpDiabetes Res 2009, 2009:696378.
22. Radovits T, Korkmaz S, Loganathan S, Barnucz E, Bomicke T, Arif R, Karck M,Szabo G: Comparative investigation of the left ventricular pressure-volume relationship in rat models of type 1 and type 2 diabetesmellitus. Am J Physiol Heart Circ Physiol 2009, 297(1):H125-133.
23. van den Brom CE, Bosmans JW, Vlasblom R, Handoko LM, Huisman MC,Lubberink M, Molthoff CF, Lammertsma AA, Ouwens MD, Diamant M, et al:Diabetic cardiomyopathy in Zucker diabetic fatty rats: the forgottenright ventricle. Cardiovasc Diabetol 2010, 9:25.
24. Mizuno R, Fujimoto S, Saito Y, Nakamura S: Exercise-induced delayedonset of left ventricular early relaxation in association with coronarymicrocirculatory dysfunction in patients with diabetes mellitus. J CardFail 2010, 16(3):211-217.
25. Chipkin SR, Klugh SA, Chasan-Taber L: Exercise and diabetes. Cardiol Clin2001, 19(3):489-505.
26. Scott LA, Kench PL: Cardiac autonomic neuropathy in the diabeticpatient: does 123I-MIBG imaging have a role to play in early diagnosis?J Nucl Med Technol 2004, 32(2):66-71.
27. Vinik AI, Maser RE, Mitchell BD, Freeman R: Diabetic autonomicneuropathy. Diabetes Care 2003, 26(5):1553-1579.
28. Bergstrom B, Lilja B, Osterlin S, Sundkvist : Autonomic neuropathy in type1 diabetes: influence of diabetes and other complications. Acta MedScand 2009, 222(2):147-154.
29. Vinik AI, Ziegler D: Diabetic cardiovascular autonomic neuropathy.Circulation 2007, 115(3):387-397.
30. Kitabchi AE, Umpierrez GE, Murphy MB, Kreisberg RA: Hyperglycemic crisesin adult patients with diabetes: a consensus statement from theAmerican Diabetes Association. Diabetes Care 2006, 29(12):2739-2748.
31. Nagaya T, Yoshida H, Takahashi H, Kawai M: Resting heart rate and bloodpressure, independent of each other, proportionally raise the risk fortype-2 diabetes mellitus. Int J Epidemiol 2010, 39(1):215-222.
32. Nagaya T, Yoshida H, Takahashi H, Kawai M: Heart rate-corrected QTinterval in resting ECG predicts the risk for development of type-2diabetes mellitus. Eur J Epidemiol 2010, 25(3):195-202.
33. Baynes J, Murray DB: Cardiac and renal function are progressivelyimpaired with aging in Zucker diabetic fatty type II diabetic rats. OxidMed Cell Longev 2009, 2(5):328-334.
34. Seyfeli E, Duru M, Kuvandik G, Kaya H, Yalcin F: Effect of obesity on P-wave dispersion and QT dispersion in women. Int J Obes (Lond) 2006,30(6):957-961.
35. Homoud MK: ACP Journal Club: Prolonged PR intervals were associatedwith increased risk for atrial fibrillation, pacemaker implantation, andmortality. Ann Intern Med 2009, 151(10):JC5-13 [http://www.annals.org/content/151/10/JC5-13.long].
36. Lorsheyd A, de Lange DW, Hijmering ML, Cramer MJ, van de Wiel A: PRand OTc interval prolongation on the electrocardiogram after bingedrinking in healthy individuals. Neth J Med 2005, 63(2):59-63.
37. Nair D, Tan SY, Gan HW, Lim SF, Tan J, Zhu M, Gao H, Chua NH, Peh WL,Mak KH: The use of ambulatory tonometric radial arterial wave captureto measure ambulatory blood pressure: the validation of a novel wrist-bound device in adults. J Hum Hypertens 2008, 22(3):220-222.
38. Huang HC, Lin LY, Yu HY, Ho YL: Risk stratification by T-wave morphologyfor cardiovascular mortality in patients with systolic heart failure.Europace 2009, 11(11):1522-1528.
39. Goraksha-Hicks P, Rathmell JC: TGF-beta: a new role for an old AktTOR.Dev Cell 2009, 17(1):6-8.
40. Fukui S, Fukumoto Y, Suzuki J, Saji K, Nawata J, Shinozaki T, Kagaya Y,Watanabe J, Shimokawa H: Diabetes mellitus accelerates left ventriculardiastolic dysfunction through activation of the renin-angiotensin systemin hypertensive rats. Hypertens Res 2009, 32(6):472-480.
41. Kannel WB: Prevalence and natural history of electrocardiographic leftventricular hypertrophy. Am J Med 1983, 75(3A):4-11.
42. Seferovic PM, Lalic NM, Seferovic JP, Jotic A, Lalic K, Ristic AD,Simeunovic D, Radovanovic G, Vujisic-Tesic B, Ostajic MU: [Diabeticcardiomyopathy: old disease or new entity?]. Srp Arh Celok Lek 2007,135(9-10):576-582.
43. Kannel WB, Levy D, Cupples LA: Left ventricular hypertrophy and risk ofcardiac failure: insights from the Framingham Study. J CardiovascPharmacol 1987, 10(Suppl 6):S135-140.
44. Yin FC, Spurgeon HA, Rakusan K, Weisfeldt ML, Lakatta EG: Use of tibiallength to quantify cardiac hypertrophy: application in the aging rat. AmJ Physiol 1982, 243(6):H941-947.
45. Darmellah A, Baetz D, Prunier F, Tamareille S, Rucker-Martin C, Feuvray D:Enhanced activity of the myocardial Na+/H+ exchanger contributes toleft ventricular hypertrophy in the Goto-Kakizaki rat model of type 2diabetes: critical role of Akt. Diabetologia 2007, 50(6):1335-1344.
46. Sato Y: Diabetes and life-styles: role of physical exercise for primaryprevention. Br J Nutr 2000, 84(Suppl 2):S187-190.
47. Forcheron F, Basset A, Abdallah P, Del Carmine P, Gadot N, Beylot M:Diabetic cardiomyopathy: effects of fenofibrate and metformin in anexperimental model–the Zucker diabetic rat. Cardiovasc Diabetol 2009,8:16.
48. van den Brom CE, Huisman MC, Vlasblom R, Boontje NM, Duijst S,Lubberink M, Molthoff CF, Lammertsma AA, van der Velden J, Boer C, et al:Altered myocardial substrate metabolism is associated with myocardialdysfunction in early diabetic cardiomyopathy in rats: studies usingpositron emission tomography. Cardiovasc Diabetol 2009, 8:39.
49. Erbs S, Hollriegel R, Linke A, Beck EB, Adams V, Gielen S, Mobius-Winkler S,Sandri M, Krankel N, Hambrecht R, et al: Exercise training in patients withadvanced chronic heart failure (NYHA IIIb) promotes restoration ofperipheral vasomotor function, induction of endogenous regeneration,and improvement of left ventricular function. Circ Heart Fail 2010,3(4):486-494.
50. Joshi D, Shiwalkar A, Cross MR, Sharma SK, Vachhani A, Dutt C: Continuous,non-invasive measurement of the haemodynamic response tosubmaximal exercise in patients with diabetes mellitus: evidence ofimpaired cardiac reserve and peripheral vascular response. Heart 2010,96(1):36-41.
51. Cosyns B, Droogmans S, Hernot S, Degaillier C, Garbar C, Weytjens C,Roosens B, Schoors D, Lahoutte T, Franken PR, et al: Effect ofstreptozotocin-induced diabetes on myocardial blood flow reserveassessed by myocardial contrast echocardiography in rats. CardiovascDiabetol 2008, 7:26.
52. Constable PD, Hinchcliff KW, Olson JL, Stepien RL: Effects of endurancetraining on standard and signal-averaged electrocardiograms of sleddogs. Am J Vet Res 2000, 61(5):582-588.
53. Heffernan KS, Sosnoff JJ, Jae SY, Gates GJ, Fernhall B: Acute resistanceexercise reduces heart rate complexity and increases QTc interval. Int JSports Med 2008, 29(4):289-293.
54. Pagkalos M, Koutlianos N, Kouidi E, Pagkalos E, Mandroukas K, Deligiannis A:Heart rate variability modifications following exercise training in type 2diabetic patients with definite cardiac autonomic neuropathy. Br J SportsMed 2008, 42(1):47-54.
55. Figueroa A, Baynard T, Fernhall B, Carhart R, Kanaley JA: Endurance trainingimproves post-exercise cardiac autonomic modulation in obese womenwith and without type 2 diabetes. Eur J Appl Physiol 2007, 100(4):437-444.
doi:10.1186/1475-2840-9-56Cite this article as: VanHoose et al.: Electrocardiographic changes withthe onset of diabetes and the impact of aerobic exercise training in theZucker Diabetic Fatty (ZDF) rat. Cardiovascular Diabetology 2010 9:56.
VanHoose et al. Cardiovascular Diabetology 2010, 9:56http://www.cardiab.com/content/9/1/56
Page 10 of 10