assessing aerobic capacity: a comparison of five step-test ...
111
ASSESSING AEROBIC CAPACITY: A COMPARISON OF FIVE STEP-TEST METHODS by LEANNE MARIE DRUSKINS, B.S. A THESIS IN INDUSTRIAL ENGINEERING Submitted to the Graduate Faculty of Texas Tech University in Partial Fulfillment of the Requirements for the Degree of MASTER OF SCIENCE IN INDUSTRIAL ENGINEERING Approved Accepted August, 1993
-
Upload
khangminh22 -
Category
Documents
-
view
0 -
download
0
Transcript of assessing aerobic capacity: a comparison of five step-test ...

ASSESSING AEROBIC CAPACITY: A COMPARISON
OF FIVE STEP-TEST METHODS
by
LEANNE MARIE DRUSKINS, B.S.
A THESIS
IN
INDUSTRIAL ENGINEERING
Submitted to the Graduate Faculty of Texas Tech University in
Partial Fulfillment of the Requirements for
the Degree of
MASTER OF SCIENCE
IN
INDUSTRIAL ENGINEERING
Approved
Accepted
August, 1993

ACKNOWLEDGEMENTS
The author would like to acknowledge the many individuals that contributed to the
completion of this study. Special recognition goes to Dr. James L. Smith, the chairman of
the committee, for his advice, guidance, patience and encouragement throughout the study.
I would also like to thank Drs. M. M. Ayoub and William J. Kolarik for participating on
the committee.
Special thanks to the subjects who took part in the study; their motivation and
enthusiasm was greatly appreciated.
In addition, I would like to thank my parents, Donna and Jim Woods and Craig and
Linda Druskins, for their continual support and encouragement. Finally, my most sincere
appreciation goes to Matthew Bishop for his participation, reassurance and endless patience
throughout my graduate studies.
11
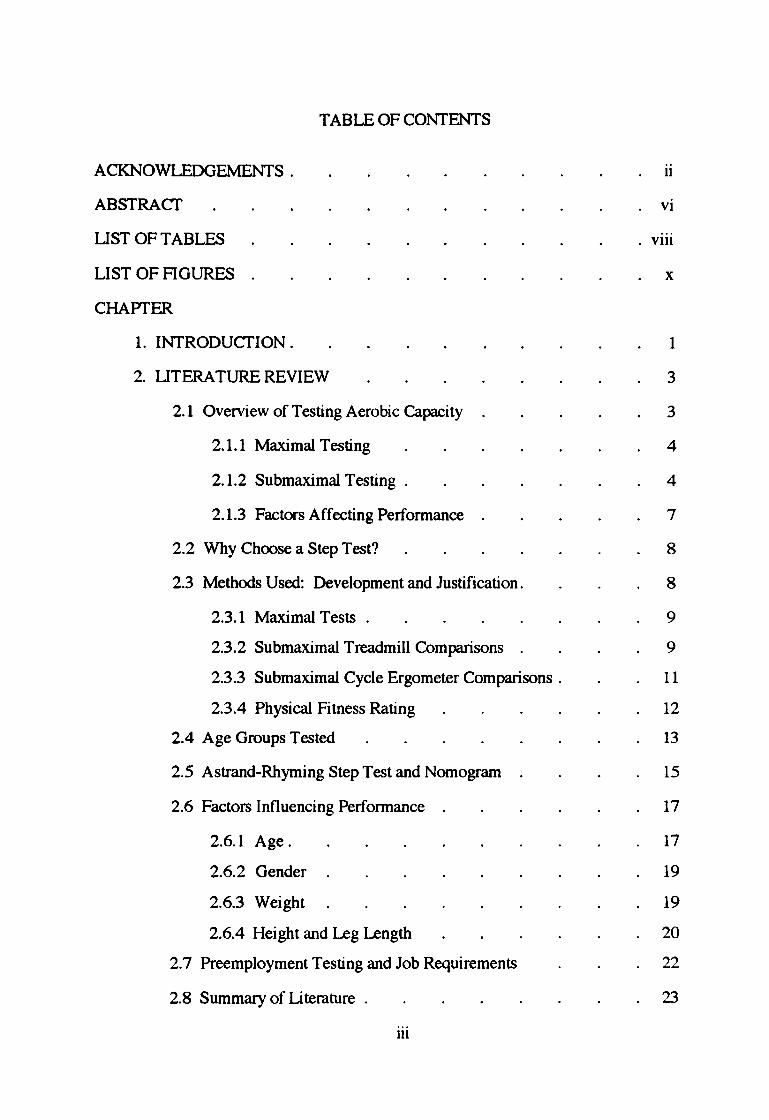
TABLE OF CONTENTS
ACKNOWLEDGEMENTS .
ABSTRACT
UST OFT ABLES
LIST OF AGURES
CHAPfER
1. INTRODUCTION.
2. LITERATURE REVIEW
2.1 Overview of Testing Aerobic Capacity
2.1.1 Maximal Testing
2.1.2 Submaximal Testing .
2.1.3 Factors Affecting Performance
2.2 Why Choose a Step Test?
2.3 Methods Used: Development and Justification.
2.3.1 Maximal Tests .
2.3.2 Submaximal Treadmill Comparisons
2.3.3 Submaximal Cycle Ergometer Comparisons .
2.3.4 Physical Fitness Rating
2.4 Age Groups Tested
2.5 Astrand-Rhyming Step Test and Nomogram
2.6 Factors Influencing Performance
2.6.1 Age.
2.6.2 Gender
2.6.3 Weight
2.6.4 Height and Leg Length
2.7 Preemployment Testing and Job Requirements
2.8 Summary of Literature .
Ill
11
vi
Vlll
X
1
3
3
4
4
7
8
8
9
9
11
12
13
15
17
17
19
19
20
22
23

3. DESCRIPTION OF TESTS . 25
3.1 Bruce Treadmill Protocol 25
3.2 Cycle Ergometer Test--YMCA Protocol 26
3.3 Step Tests . 28
3.3.1 Sharkey's Method 28
3.3.2 Siconolfi's Method 29
3.3.3 Queen's College Test. 30
3.3.4 Astrand-Rhyming Method . 31
3.3.5 Cotten Step Test --Heyward's Equations 32
4. EXPERIMENTAL DESIGN 33
4.1 Overview . 33
4.2 Anticipated Conclusions and Design Setup 35
4.2.1 Differences in the Means of the Seven Tests . 35
4.2.2 Evaluation of Actual Versus Estimated 02 Consumption 36
4.2.3 Astrand Versus Sharkey 38
5. ~HODSANDPROCEDURES ~
5.1 Subjects ~
5.2 Methods and Equipment 41
5.2.1 Metabolic Cart . 43
5.3 Procedures . 46
5.3.1 Step Tests 46
5.3.2 Treadmill Test 47
5.3.3 Cycle Ergometer Test. 47
6. EXPERIMlliNTALDATA ~
6.1 General Introduction ~
6.2 Data from the Seven Submaximal Tests ~
6.3 Actual and Estimated Oxygen Consumption ~
IV

6.4 Astrand-Rhyming Step Test Versus Sharkey's Step Test 52
7. STATISTICS AND RESULTS 53
7.1 ANOV A for Comparison of Seven Tests 53
7.1.1 Test Means 53
7.1.2 Gender . 54
7.2 Comparison of Metabolic Cart V02 Values 56 and Estimated V02 Values
7.2.1 Bruce Protocol . 56
7.2.2 YMCA Cycle Ergometer Protocol 57
7.2.3 Siconolfi's Step Test Protocol 58
7.3 Astrand-Rhyming Versus Sharkey . 59
8. CONCLUSIONS AND DISCUSSION 60
8.1 Conclusions 60
8.2 Discussion of Conclusions 60
8.2.1 Step Tests 60
8.2.2 Evaluation of Step, Treadmill and Cycle Ergometer Tests 63
8.2.3 Gender Performance .
8.2.4 Estimated 02 Uptake Versus Actual 02 Uptake
64
65
8.2.5 Comparison of Astrand-Rhyming and Sharkey's Methods 67
8.3 Recommendations
REFERENCES .
APPENDICES .
A--LIST OF SUBMAXIMAL STEP TEST PRafOCOLS
B--SAMPLE OF DATA COLLECTION SHEEr . AND CALCULATIONS
C--INFORMA TION SHEEr AND CONSENT FORM
D--NafES ON SUBJECTS' PHYSICAL CONDITION
E--SAMPLE OF MMC PRINTOUT
F--RA W DATA FROM SUBJECTS
v
68
69
73
73
77
82
86
89
91
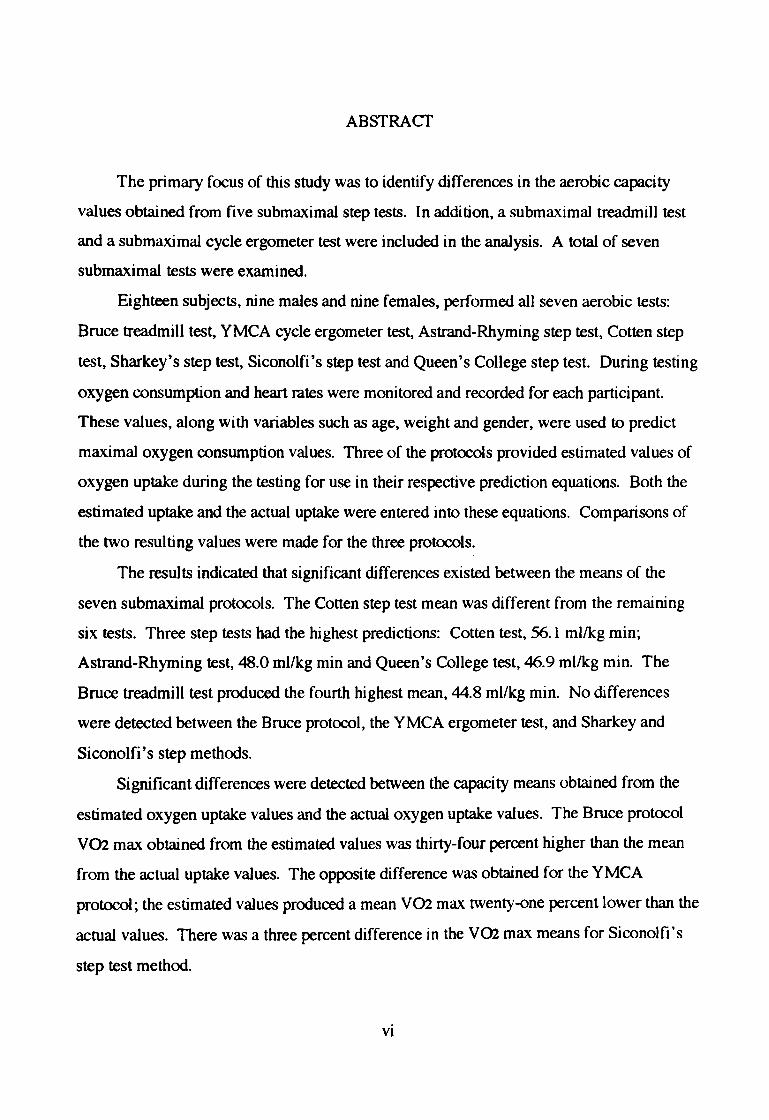
ABSTRACT
The primary focus of this study was to identify differences in the aerobic capacity
values obtained from five submaximal step tests. In addition, a submaximal treadmill test
and a submaximal cycle ergometer test were included in the analysis. A total of seven
submaximal tests were examined.
Eighteen subjects, nine males and nine females, performed all seven aerobic tests:
Bruce treadmill test, YMCA cycle ergometer test, Astrand-Rhyming step test, Cotten step
test, Sharkey's step test, Siconolfi's step test and Queen's College step test. During testing
oxygen consumption and heart rates were monitored and recorded for each participant.
These values, along with variables such as age, weight and gender, were used to predict
maximal oxygen consumption values. Three of the protocols provided estimated values of
oxygen uptake during the testing for use in their respective prediction equations. Both the
estimated uptake and the actual uptake were entered into these equations. Comparisons of
the two resulting values were made for the three protocols.
The results indicated that significant differences existed between the means of the
seven submaximal protocols. The Cotten step test mean was different from the remaining
six tests. Three step tests had the highest predictions: Cotten test, 56.1 ml/kg min;
Astrand-Rhyming test, 48.0 mllkg min and Queen's College test, 46.9 mllkg min. The
Bruce treadmill test produced the fourth highest mean, 44.8 mllkg min. No differences
were detected between the Bruce protocol, the YMCA ergometer test, and Sharkey and
Siconolfi's step methods.
Significant differences were detected between the capacity means obtained from the
estimated oxygen uptake values and the actual oxygen uptake values. The Bruce protocol
V02 max obtained from the estimated values was thirty-four percent higher than the mean
from the actual uptake values. The opposite difference was obtained for the YMCA
protocol; the estimated values produced a mean V02 max twenty-one percent lower than the
actual values. There was a three percent difference in the V02 max means for Siconolfi's
step test method.
VI
The aerobic capacity value obtained from the Astrand-Rhyming step test method was
reasonable for the population tested in this study. Also, the procedure for estimating
maximal oxygen uptake included subjects' ages, weights, gender and heart rates. None of
the other tests included all these variables which appear to affect the performance values.
Based on this information the Astrand-Rhyming step method was recommended, but made
without knowledge of the subjects' actual aerobic capacities.
Vll

UST OF TABLES
2.1 Percent maximal uptake for various exercise 5
2.2 Comparison of three step test methods 10
2.3 Comparison of two step test methods . 11
2.4 Comparison of four fitness rating step test methods 12
2.5 Astrand-Rhyming age correction factor 14
3.1 Bruce Protocol 25
3.2 YMCA Protocol 27
3.3 Approximate Values of Oxygen Consumption 27
3.4 Sharkey's Protocol 28
3.5 Siconolfi's Method 29
3.6 Queen's College Test 30
3.7 Cotten Step Test Procedures 32
4.1 Random Assignment of Protocols 34
4.2 ANOV A--RCB for Seven Tests. 36
4.3 ANOVA--RCB for Estimated Versus Actual. 37 Oxygen Consumption Values
4.4 ANOVA--RCB for Astrand-Rhyming Versus Sharkey . 39
5.1 Subject Physical Characteristics . 40
5.2 Averages of Subject Characteristics 41
6.1 Performance Values for Each Subject. 49
6.2 Oxygen Consumption Values for Subject #14 50
7.1 RCB ANOV A for Seven Tests 53
7.2 Duncan's Multiple Range Test Results 54
7.3 ANOV A for Bruce 56
7.4 ANOVA for YMCA . 57
Vlll

7.5 ANOV A for Siconolfi 58
7.6 ANOV A for Astrand-Rhyming Versus Sharkey 59
A.l Partial List of Available Submaximal Step Tests 73
D.l Physical Condition of Each Subject 87
F.l Values for Bruce Protocol . 95
F.2 Values for YMCA Protocol 96
F.3 Values for Siconolfi's Protocol 96
F.4 V02 max Values for Bruce Protocol 97
F.5 V02 max from YMCA Protocol. 97
F.6 V02 max Values for Siconolfi's Protocol 98
F.7 V02 max Values for Astrand-Rhyming and Sharkey's Methods 98
F.8 Mean Values for Each Protocol 99
F.9 Mean Values for Gender 99
F.lO Performance Means by Gender 99
F.ll Performance Values for Each Subject. 100
IX

LIST OFAGURES
2.1 The decline in maximal heart rate with age, and 18 heart rate during a submaximal work rate
2.2 Mean values for maximal oxygen uptake measured during exercise on treadmill or cycle ergometer
18
2.3 Changes in maximal isometric strength with age in women and men
18
3.1 Astrand-Rhyming Nomogram 31
5.1 Equipment For Treadmill Test 42
5.2 Equipment For Cycle Ergometer Test . 44
5.3 Equipment For Step Tests . 45
6.1 Bruce Treadmill- Actual Versus Predicted Oxygen Consumption 50
6.2 YMCA Cycle Test- Actual Versus Predicted Oxygen Consumption 51
6.3 Siconolfi Step Test- Actual Versus Predicted Oxygen Consumption 51
6.4 Astrand-Rhyming Step Test Versus Sharkey's Step Test 52
7.1 Mean V02 max Values from Each Protocol . 54
7.2 Mean Capacity Values for Males and Females 55
7.3 Interaction Between Genders and Test Protocols . 55
7.4 Comparison of V02 max Prediction Methods for Bruce Protocol 56
7.5 Comparison of V02 Prediction Methods for YMCA Protocol. 57
7.6 Comparison of V02 Prediction Methods for Siconolfi's Protocol 58
7.7 Means of Astrand-Rhyming and Sharkey's Methods 59
F.1 Capacity Values for Subject 1 92
F.2 Capacity Values for Subject 2 92
F.3 Capacity Values for Subject 3 92
F.4 Capacity Values for Subject 4 92
F.5 Capacity Values for Subject 5 92
X
F.6 Capacity Values for Subject 6 93
F.7 Capacity Values for Subject 7 93
F.8 Capacity Values for Subject 8 93
F.9 Capacity Values for Subject 9 93
F.10 Capacity Values for Subject 10 93
F.11 Capacity Values for Subject 11 93
F.12 Capacity Values for Subject 12 94
F.13 Capacity Values for Subject 13 94
F.14 Capacity Values for Subject 14 . 94
F.15 Capacity Values for Subject 15 94
F.16 Capacity Values for Subject 16 94
F.17 Capacity Values for Subject 17 94
F.18 Capacity Values for Subject 18 95
XI

CHAPfER 1
INTRODUCfiON
Measurement of aerobic capacity is important in such areas as industry, sports and
medicine. The VOl. max value is used as an evaluator of a person's ability to work, ability
to perform in an athletic event and/or current health condition. It is usually determined
using maximal or submaximal exercise tests with treadmills, cycle ergometers or step tests.
Other less popular methods exist--swim tests, walk tests and run tests, but these are not
frequently used. Numerous tests exist making the choice of which method to use a tedious
task.
The literature concerning methods of evaluation is full of mixed opinions, results
and suggestions pertaining to aerobic capacity measurements. Most researchers are
determined to develop a "new improved" method for evaluation and are eager to discredit
another method or claim their method is equally correct.
Currently, choosing a single method of evaluation and using this test only is the
best approach to assure consistency in evaluating large numbers of people. Comparing two
different tests may not be a safe practice for those concerned with selecting one person over
another for a job, position on a team or as a comparison for improved health.
In industry preemployment testing is important because of the need to determine a
person's ability to perform a manual materials handling job. Submaximal aerobic capacity
tests are used to reduce the risk of overexertion and to protect the subject if he/she has any
unknown health problems. Fatiguing a human can be dangerous and is usually only done
with a physician present. Submaximal step testing is commonly used due to the ease of
performing these tests, minimal use of equipment, low cost and short duration. These tests
do not need to be performed in a lab and the evaluator needs only a bench, stop watch and
the ability to measure pulse rate. This also eliminates the need for a physician due to
reduced risk.
However, the number of step test methods available is large and the choice is not
always obvious. No literature could be found comparing several different methods of step
tests. New methods and revised methods are usually compared to a maximal cycle test or
1

treadmill test in order to prove the test's validity in predicting aerobic capacity. Therefore,
there is a need to evaluate some of the step test methods suggested to see if significant
variation exists between the values of aerobic capacity obtained. One goal of this study
would be to suggest/recommend a single method that is the optimal method for accurately
predicating a prospective employee's V02 max for proper placement in a job. That is not
always possible due to human variation and limited time. Instead, an evaluation of several
step test methods will be performed to determine if the values obtained from the tests are
statistically equivalent. Possible factors of consideration with respect to the subject are:
age, weight, gender, leg length and height. Not all tests available consider or correct for
these factors. Also, specific aspects of the step test methods, bench height and cadence,
were considered.
Although the emphasis of this research was placed on the use of step tests, a
submaximal treadmill test (Bruce Protocol) and a submaximal cycle ergometer test (YMCA)
were performed for the purpose of comparing V02 max predictions based on the three
methods of evaluation. The step test methods evaluated were Sharkey's method,
Siconolfi's method, Queens College Test, OSU Test (revised by Heyward) and the
Astrand-Rhyming step test and nomogram. A total of seven methods of predicting V 02
max were performed. A full description of the experimental design is given following the
discussion of literature
2

CHAPfER2
UTERA TURE REVIEW
2.1 Overview of Testing Aerobic Capacity
Assessment of an individual's fitness level requires exposure to prolonged physical
activity that involves large muscle groups (Astrand, 1986). Several methods for
determining physical fitness have been developed and most of these involve measurement
of maximum oxygen consumption. Because the increase in oxygen consumed and the
increase in heart rate are assumed to be linearly related during activity, maximum V02
consumption is fairly easy to evaluate.
Maximum oxygen consumption is a measure of physical work capacity; the peak
level at which a person can perform. Of course, the best way to assess this peak would be
to conduct a maximal test However, these tests can be dangerous, especially to persons
with health problems and/or elderly persons. In addition, maximal tests require expensive
equipment and are time consuming. Several submaximum methods of measuring aerobic
capacity have been suggested including step tests, cycle ergometer tests, short and long
distance track running, and walk/run tests on treadmills. These submaximal tests provide
an easier, less stressful method for testing aerobic capacity.
One question needing an answer is which of the tests provides the "most accurate"
prediction of aerobic capacity. This question also applies to actual maximum tests as well;
different tests provide different values of maximum oxygen consumption (McArdle et al.,
1972; Astrand, 1986). It is important to determine which method(s) best predicts aerobic
capacity because the values attained are often compared between tests. One method may
provide a higher value than a second method, leading the person interpreting tests to falsely
conclude that one person is more "fit" or capable than another.
This discussion of literature focuses on the differences in the mean values of
maximal oxygen consumption obtained using maximal and submaximal tests. It is
necessary to attempt an answer to the question concerning accuracy of these predictions and
measurements. Numerous studies have investigated various methods of aerobic testing
3

with respect to accuracy and variation. Their results and conclusions are provided and
reviewed.
2.1.1 Maximal Testing
Comparison of submaximum tests for accuracy of prediction often involves
comparison to a maximum test as well. Previous studies (Astrand, 1986; McArdle et aL,
1972) noted similar differences in the values of max V02 obtained when using different
tests. In other words, there is a tendency for each form of exercise to produce different
values of aerobic capacity. For example, treadmill aerobic capacity is approximately seven
percent higher than cycle ergometer values.
Results of a study involving three maximal tests using treadmill, step tests and cycle
ergometer tests (Keren et al., 1980) showed that the maximal treadmill tests provided the
greatest maximum oxygen consumption: six percent higher than maximal step or ergometer
tests. No significant differences were noted with respect to maximal step and cycle tests.
As stated previously, maximum VOl using a cycle ergometer tends to produce a lower V02
max than a treadmill (McArdle et al., 1972). This difference applies to cycle ergometer and
track running as well (Astrand, 1986). Astrand also noted differences between maximal
treadmill tests depending on the protocol used; mainly dependent on the incline differences
(see Table 2.1). It is obvious to see that determining aerobic capacity using max tests is a
dependent measurement; dependent on which method is used.
2.1.2 Submaximal Testing
Submaximal prediction of aerobic capacity is not any easier than actual maximum
tests. There appears to be significant variability between methods as seen in several
studies. In 1991, Zwiren et al. conducted an experiment, comparing predictive values of
five submaximal tests: a 1.5 mile run, a one mile walk, a step test, and two cycle
ergometer tests (Astrand-Rhyming and the YMCA extrapolation). The authors found
significant differences, p < 0.05, between maximal test values on a cycle ergometer and
submax test values on cycle ergometers. Both submaximal cycle methods, Astrand
Rhyming and YMCA, overestimated the maximal V02 value. Zwiren noted that the step
4

test had the lowest correlation with the measured V02 max value, it was actually higher,
over predicting aerobic capacity. This was also true of a test conducted by Siconolfi et al.
( 1985). These authors found that the submaximal step test estimate of aerobic capacity was
twelve percent higher than the actual V01. max value. Of course, the max test used was a
cycle test (modified Astrand-Rhyming) which, as previously stated, provides a lower
maximal oxygen consumption than other methods.
Table 2.1.
Percent maximal uptake for various exercises. (From Astrand and Rodahl, 1986. Table 8-1)
Type of exercise Ordinary subjects Specially trained
Running uphill 100 100 Arms and legs 100 100-115 Running horizontally 95-98 Cycling, upright 92-96 100-108 Cycling, supine 82-85 One leg, upright 65-70 75-80 Arms 65-70 105-115 Step test 97 Rowing 100 100-115 Skiing 100 100-112 Swimming 85 100
Zwiren et al. (1991) noted no significant differences between max treadmill tests
and submax running tests. This may be the key in developing reasonable submax
predictors--use the same form of exercise for validation studies. However, Montoye et al.
( 1986) demonstrated that the correlation between max and submax V02 values depends on
the submaximal method used. The authors performed a maximal treadmill test and
correlated it to two submax treadmill methods commonly used. Only one method (plotting
heart rate versus workload and extrapolating to predicted maximal heart rate) correlated.
5

Some factors influencing submaximal testing must be mentioned, most importantly,
the assumptions made. The relationship between heart rate and oxygen uptake as work is
increased is often questioned. Zwiren et al. (1991) mention the fact that this relationship
becomes curvilinear at heavy workloads. This is also supported in an experiment done by
Balke ( 1963) which indicated that the linear relationship was not valid once a heart rate of
160 beats per minute was achieved. Of course, the linear relationship does not apply up to
maximum abilities, but many submaximal tests rely on this relationship for prediction.
This limits the accuracy of tests using the approximated or "age-predicted" maximal heart
rate value. The YMCA cycle ergometer tests and methods using linear regression follow
this relationship in predicting aerobic capacity. According to Maritz et al. (1961), the
maximum oxygen consumption may be underestimated by approximately 0.3 liters per
minute when following this assumption. The significance of this value was not stated.
The authors caution future evaluators to avoid prediction based on a single workload
because of large elements of random error. Other assumptions, such as constant
mechanical efficiency and maximum heart rate equations, are a necessary part of
submaximal testing. They reduce the accuracy of predictions, but normally also reduce the
testing time and simplify procedures as compared to maximal tests performed in labs.
With regard to maximum tests, how do examiners know if an individual actually
achieved maximum? The physiological indications (heart rate, RER, 02 plateau) may be
present, but if a subject stopped even thirty seconds short of his/her maximum, the V02
max may be underestimated by approximately 2 ml/kg min. (Bolter and Coutts, 1987).
This could be the difference between labeling someone as being in average condition versus
fair or poor and could possibly eliminate a prospective employee.
It is often difficult to have a person perform to their maximum because quite often
this can involve uncomfortableness and severe pain (Astrand, 1986). This is especially
true in maximal step tests, in which subjects frequently complain of cramping in the large
leg muscles (Kurucz et al., 1967). Subjects participating in max and submax tests using
cycle ergometers (McArdle et al., 1972) complained of intense local pain in the upper
thighs and stated this limited their performance. Storer et al. (1989) noted that lack of
required maximum effort in submaximal tests may reduce the predicted value by ten to
6

twenty-seven percent in cycle ergometer tests. Each of the above mentioned factors limit
the ability to predict or even accurately measure a person's aerobic capacity.
2.1.3 Factors Affecting Performance
Population size is a factor affecting the validity of submax and max tests. Several
methods currently used--Astrand-Rhyming, derived equations (Storer et al., 1989),
Cooper's Run (Cooper, 1968), etc.--tested small population sizes to derive their respective
methods and/or test previous methods. The result is that these methods possibly apply
only to the small population studied and using them outside of that group may produce
incorrect values. The time required to test a "suitable" number of persons is not available to
most researchers, but may be necessary to accurately predict aerobic capacity. Most
importantly, researchers must be aware of the age ranges (workloads and heart rates as
well) at which these submaximal tests are valid and consider this factor in the validation of
their own studies.
Many test methods available are age, gender or exercise specific. The best step in
correcting prediction is simply to not make comparisons between methods. Coaches,
athletes, industry workers and researchers need to be aware of the discrepancies and avoid
incorrectly assessing a person's aerobic capacity. Due to variation within and between max
and submax tests it is too difficult to assess which, if any test, provides the best measure of
maximum oxygen consumption. One possible solution is already practiced in industry
when evaluating a job or selecting an employee. In industry, the tests used to evaluate a
person or job are similar to the task performed. Tests must be similar to or appropriate for
the task to be carried out. Step tests are a reasonable form of evaluation for most people
because they are a familiar, comfortable motion. Using this suggested method of testing
may remove some of the discrepancies, and is an advantage to the person being evaluated
because they are familiar with and comfortable with the exercise used. This practice will
not eliminate the differences in predicted values of oxygen consumption, it is only a partial
answer to the problem.
7

2.2 Why Choose a Step Test?
Most often the decision to utilize a step test is based on cost and simplicity
(Anderson, 1988~ Kasch et al., 1965). Kasch et al. compared maximal step and treadmill
tests finding a negligible difference in the oxygen uptake and stated the results obtained
from the two methods were similar. However, the authors recommended using a step test
because of ease, low cost and safety. This opinion is also shared by Heyward (1991)
when stating that field tests--with reference to bench stepping--are inexpensive, less-time
consuming and easy to administer. The low cost stems from the lack of required
equipment. All an experimenter needs for step testing is a bench, a stop watch and time.
The ability to test large groups at one time (Marley, 1975~ Cotten, 1971 ~ Katch and
McArdle, 1983) also emphasizes the ease in conducting these tests.
Familiarity is another factor encouraging the use of a step test. Most people
ascend/descend stairs as a daily task and are familiar with the movements (Anderson,
1988). This reduces the time necessary to teach subjects how to perform the task. For this
reason, learning curves will be minimized in step test evaluations (Shephard, 1966).
Often the literature reveals that step tests correlate highly with cycle ergometer and
treadmill tests (Keren et al., 1980~ Kasch et al., 1965; Shapiro et al., 1976--to name a
few). Currently it seems that cycle and treadmill tests are the accepted norms for V02
evaluation and step testing is on its way to being an equally acceptable method. Although
the test method has been used for more than forty years it is normally validated based on
comparisons to the other testing methods (treadmill and ergometer). The reduced cost,
simplicity and time are useful for field tests which are a necessary part of job evaluations
and employee testing. But as far as exercise physiologists and medical examiners, the
treadmill and cycle protocols are more widely used. This may be due partially to the fact
that it is difficult to monitor heart rate, EKG and VOl during step testing because of the
vertical motions (Siconolfi et al., 1985). However, in this study the focus is on step tests;
encouraging their use in preemployment testing by stating the method's correlation to
treadmill and cycle tests, and more importantly, evaluating several protocols for their
applicability in predicting V02 max.
8
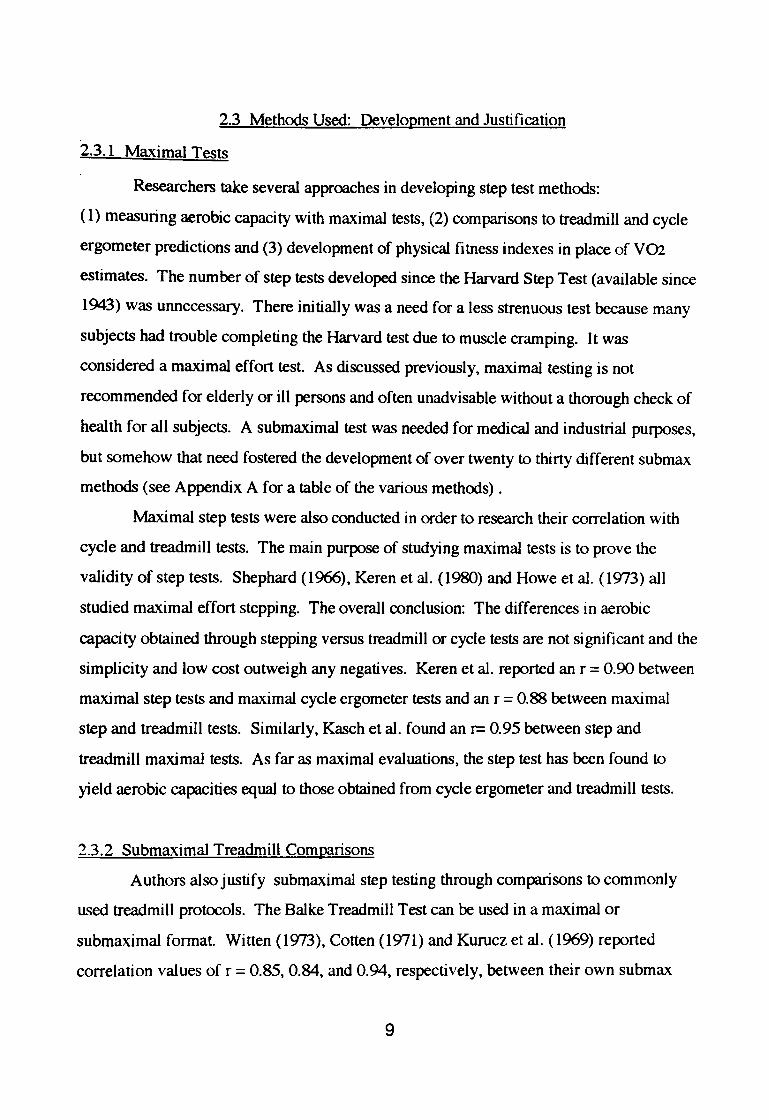
2.3 Methods Used: Development and Justification
2.3.1 Maximal Tests
Researchers take several approaches in developing step test methods:
(1) measuring aerobic capacity with maximal tests, (2) comparisons to treadmill and cycle
ergometer predictions and (3) development of physical fitness indexes in place of V02
estimates. The number of step tests developed since the Harvard Step Test (available since
1943) was unnecessary. There initially was a need for a less strenuous test because many
subjects had trouble completing the Harvard test due to muscle cramping. It was
considered a maximal effort test. As discussed previously, maximal testing is not
recommended for elderly or ill persons and often unadvisable without a thorough check of
health for all subjects. A submaximal test was needed for medical and industrial purposes,
but somehow that need fostered the development of over twenty to thirty different submax
methods (see Appendix A for a table of the various methods) .
Maximal step tests were also conducted in order to research their correlation with
cycle and treadmill tests. The main purpose of studying maximal tests is to prove the
validity of step tests. Shephard (1966), Keren et al. (1980) and Howe et al. (1973) all
studied maximal effort stepping. The overall conclusion: The differences in aerobic
capacity obtained through stepping versus treadmill or cycle tests are not significant and the
simplicity and low cost outweigh any negatives. Keren et al. reported an r = 0.90 between
maximal step tests and maximal cycle ergometer tests and an r = 0.88 between maximal
step and treadmill tests. Similarly, Kasch et al. found an r= 0.95 between step and
treadmill maximal tests. As far as maximal evaluations, the step test has been found to
yield aerobic capacities equal to those obtained from cycle ergometer and treadmill tests.
2.3.2 Submaximal Treadmill Comparisons
Authors also justify submaximal step testing through comparisons to commonly
used treadmill protocols. The Balke Treadmill Test can be used in a maximal or
submaximal f onnat. Witten ( 1973), Cotten ( 1971) and Kurucz et al. ( 1969) reported
correlation values of r = 0.85, 0.84, and 0.94, respectively, between their own submax
9

step test and the Balke submax protocol. Once again. each author believes their respective
method is equally correct in predicting a person's level of fitness and supports the use of
stepping. The validity of these submax methods is strictly based on the inherent validity of
the Balke Treadmill Test. Each method is different as seen in Table 2.2. For example,
Kurucz, Cotten and Witten each use "innings" of 30 seconds of work (stepping) followed
by 20 seconds of rest during which the subject's heart rate was measured. However,
Cotten used one step height and cadences of 24, 30 and 36 steps per minute. Witten's
(1973) method involved three step heights and two cadences. Kurucz (1969) included two
step heights and two cadences plus subjects holding a bar at eye level to involve the upper
body in the test.
Table 2.2
Comparison of three step test methods.
Method Cadence Ste~ Hei2ht Scorin2
Witten 24&30 14, 17 & 20 20 innings of 30 sec work & inches 20 sec rest, HR taken during rest
Cotten 24,30 &36 17 inch 18 innings of 30 sec of work & 20 sec of rest, 6 innings at each cadence, HR taken during rest
Kurucz 24&30 15 & 20 inches 18 innings of 30 sec of work & 20 sec of rest, 6 minutes at each cadence(24 step/min. on 15 and 20 inch bench & 30 on 20 inch bench)
There are slight modifications in each method, but what is lacking is the justification for
these modifications. Some authors claim that their method is shorter, it reduces testing
time, or is better for group testing, but this is not enough reason for changing a test which
was quick and simple from the beginning. Comparisons between these three methods were
not investigated and it is questionable whether there is any difference between these three
protocols.
10

2.3.3 Submaximal Cycle Ergometer Comparisons
Predicted values of aerobic capacity from ergometer and step tests are usually
studied for differences/correlations, with each author proving the validity of one more
method. One example is a study by Shapiro et al. ( 1976) which attempts to standardize a
new step test by correlating maximal V02 values predicted using an Astrand cycle test, with
heart rates taken during three separate step tests. The authors chose three bench heights
based on preliminary tests, and used a height range that would produce mild to maximal
workloads (see Table 2.3). All three heart rates were correlated to Astrand and a 32.5
centimeter bench height with a 25 step per minute cadence was reported as the appropriate
method for evaluating aerobic capacity. Astrand had a step test and a nomogram for
predicting V02 max. This method involves a higher bench (33 em for women and 40 em
for men) and lower cadence of 22.5 steps per minute.
Table 2.3.
Comparison of two step test methods.
Method Cadence Stel! Heia:;ht Scorina:;
A strand 22.5 33 em for women Nomogram using HR and body steps/min. 40cm for men weight, 5-6 minute test
Shapiro 25.0 32.5cm Astrand-Rhyming Nomogram or step/min. heart rate standards, 5-6 minute test
The purpose of Shapiro's study was to develop a "new simple bench step test for mass
field testing." A simple test already existed in a slightly different form. The authors could
have established heart rate standards using Astrand's method without adding to the
growing list of step methods. This introduces an issue to be discussed concerning possible
misuse of the Astrand-Rhyming Nomogram. First, another form of step test, not
predicting V02, but assigning a fitness rating will be reviewed.
11
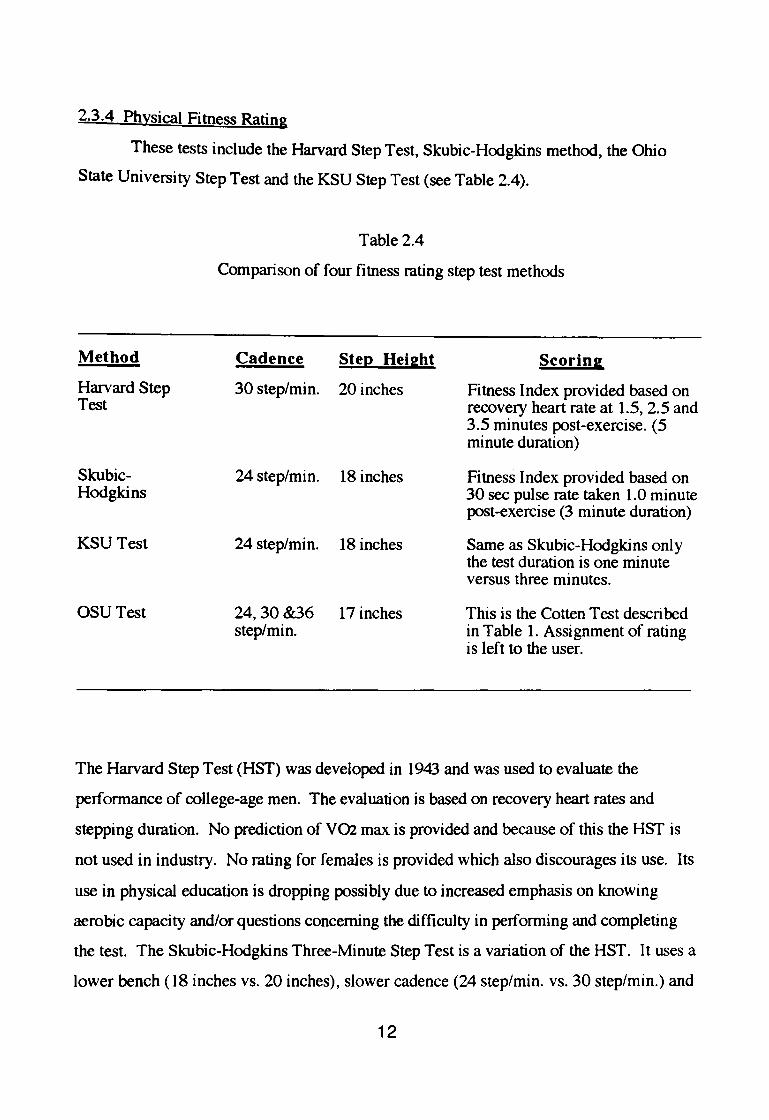
2.3.4 Physical Fitness Rating
These tests include the Harvard Step Test, Skubic-Hodgkins method, the Ohio
State University Step Test and the KSU Step Test (see Table 2.4).
Table 2.4
Comparison of four fitness rating step test methods
Method Cadence Step Height Scoring
Harvard Step 30 step/min. 20 inches Fitness Index provided based on Test recovery heart rate at 1.5, 2.5 and
3.5 minutes post-exercise. (5 minute duration)
Skubic- 24 step/min. 18 inches Fitness Index provided based on Hodgkins 30 sec pulse rate taken 1.0 minute
post-exercise (3 minute duration)
KSU Test 24 step/min. 18 inches Same as Skubic-Hodgkins only the test duration is one minute versus three minutes.
OSUTest 24,30 &36 17 inches This is the Cotten Test described step/min. in Table 1. Assignment of rating
is left to the user.
The Harvard Step Test (HST) was developed in 1943 and was used to evaluate the
performance of college-age men. The evaluation is based on recovery heart rates and
stepping duration. No prediction of VOl. max is provided and because of this the HST is
not used in industry. No rating for females is provided which also discourages its use. Its
use in physical education is dropping possibly due to increased emphasis on knowing
aerobic capacity and/or questions concerning the difficulty in performing and completing
the test. The Skubic-Hodgkins Three-Minute Step Test is a variation of the HST. It uses a
lower bench ( 18 inches vs. 20 inches), slower cadence (24 step/min. vs. 30 step/min.) and
12
shorter duration (3 minutes vs. 5 minutes). This method applies only to females-- high
school and college aged. Again, limited applicability eliminates this method as a form of
pre-employment testing. The KSU Test is simply a one-minute version of the Skubic
Hodgkins Test (Harvey and Scott, 1970). The validity of this test is based on a correlation
of r = 0.71 with the Skubic-Hodgkins method. Finally, the OSU Step Test is scored based
on completion time (exhaustion) or when the heart rate reaches 1.50 beats per minute.
Fitness assignment is left to the user. The primary use for the OSU test involves group
evaluation and applies only to males. None of these methods are applicable to industry
because of gender specificity, age groups tested and lack of obtaining a predicted value of
V02 max. It is necessary to include them in the literature discussion to point out other
existing evaluations of physical work capacity.
2.4 Age Groups Tested
Age groups, as mentioned above, are an important factor to consider in choosing a
method of evaluating aerobic capacity. The age ranges used in the validation of most
methods are provided to warn users that the test may not be valid outside this range. In
athletics that may not be a problem due to the young ages of athletes. However, in an
industrial setting the age range of applicants is varied, but may include a majority of "older"
persons. Older being outside of the common college-aged subject, 18 to 27 years old. A
few examples were mentioned earlier: The Harvard Step Test; college-aged men and
Skubic-Hodgkins; high school- and college-aged women. Keren et al. (1980) compared
three methods of determining VOl max with the average age of their subjects being
approximately 20 years old. This is true of most studies involving aerobic capacity because
a majority of the research occurs at universities. It is important to know the reliability of a
method when testing a 40-year-old applicant (or 30, 35, 55, etc.) to accurately assess that
individual when compared to a "college-aged" applicant. Recent studies, including the
Astrand-Rhyming Nomogram, recognizing the need for larger age range, include either an
age correction factor or use age in the calculation of VOl max. Astrand and Rodahl (1986)
include a table containing a correction factor for age and maximal heart rate with the
nomogram. Multiplying the VOl value obtained from the nomogram by the respective
13

factor gives the correct value for people between 15 and 65 years. This range is excellent
for industrial testing.
Age
15 25 35 40 45 50 55 60 65
Table 2.5
Astrand-Rhyming age correction factor. (From Astrand and Rodahl, 1986. P. 376.)
Factor Max heart rate
1.10 210 1.00 200 0.87 190 0.83 180 0.78 170 0.75 160 0.71 150 0.68 0.65
Factor
1.12 1.00 0.93
0.83 0.75 0.69 0.64
Siconolfi et al. (1985) include age as a factor in their equations calculating aerobic capacity:
Males: Y (Umin) = 0.348(XI) - 0.035 (X2) + 3.011
Females: Y (Umin) = 0.302(XI)- 0.019(X2) + 1.593,
(2.1)
(2.2)
where XI is V02 (Umin) calculated from the Astrand-Rhyming nomogram and X2 is the
subject's age in years. The authors suggested these equations as a modification of the
nomogram. The importance stressed here is the applicability for a wide age range, 19 to 70
years old. The OSU test (Kurucz et al., 1969) only assigns scores for a physical fitness
index and does not provide any evaluation of VOl. max. But the test was validated over a
large age range, 19 to 56 years--men only. It is difficult to obtain subjects from all age
groups, especially for short term studies at universities. It is important to be aware of the
test's age range before using it to avoid miscalculating aerobic capacity of people outside of
the age range and to allow for age compensation if possible.
14

2.5 Astrand-Rhyming Step Test and Nomogram
Since much mention has been made of the A strand-Rhyming nomogram, a short
discussion and overview of its use/misuse is necessary. The nomogram predicts aerobic
capacity using either a step test or cycle ergometer test. Relative to the step test, a specific
method was used in the validation study: 33 em step for women, 40 em step for men with
a 22.5 step per minute cadence for 5 to 6 minutes. This is a constant workload test. The
prediction is based on subject's body weight (kilograms) and a heart rate measurement
(beats per minute) obtained during the final minute of exercise. Best results are obtained
for heart rates between 125 to 170 beats per minute. One problem evident in the literature
is modified use of the nomogram. One such example is a varied workload maximal step
test (Shephard, 1966) which suggests using the nomogram when a submaximal form of
this test is performed. The method of heart rate measurement is similar as is the test
duration, but the validity of the nomogram at workloads other than the specific one used for
development is not known. The study (Shephard, 1966) does not involve a comparison
with the original method recommended by Astrand, which may be necessary to truly
validate this test. A similar method was used by Shapiro et al. (1976). The authors
attempted to develop a simple step test, but used the Astrand-Rhyming nomogram as a V02
max predictor. Again, no direct comparison was made with the step test used in the
nomogram development. The Astrand-Rhyming Step Test has also been modified for use
in field tests. One modification simply involved measuring heart rate at fifteen to thirty
seconds post-exercise instead of during the last minute of exercise (Sharkey, 1974). This
also led to the development of physical fitness slide rule calculators based on the modified
Astrand-Rhyming Test. The slide rules use body weight (kilograms) and recovery heart
rate (beats per minute) to predict aerobic capacity. These "calculators" are similar to the
idea of the nomogram. Sharkey's study was validated for subjects aged 18 to 59 and
included equations for predicting aerobic capacity which are used for the slide rules. The
equations are as follows:
15
Maximal Pulse (men)
Maximum Pulse (women)
~. Umin (men)
~. Umin (women)
= 64.83 + 0.662*(postexercise pulse I minute)
= 51.33 + 0.750*{postexercise pulse I minute)
= 3.744 * (W+51 P- 62)
= 3.750 * (W-3 I P- 65).
(2.3)
(2.4)
(2.5)
(2.6)
where ~ is the maximal oxygen consumption in Umin, W is the body weight in kilograms
and Pis the estimated maximum pulse. Sharkey checked the validity of a postexercise
heart rate versus the normal heart rate taken during exercise and found that the 15 to 30
second post value correlated well.
Marley and Linnerud (1975) used Sharkey's method to evaluate nearly seven
thousand students. These authors also used Astrand's recommended age correction factor
to obtain the final VOl. max value and concluded that the modified Astrand-Rhyming Step
Test (Sharkey's Method) is usable as a means of evaluating physical fitness. This modified
approach is a more acceptable form (versus Shapiro et al. and Shephard et al.) because it
was validated using the original method. It was only an attempt to further limit the
equipment needed for aerobic testing--no heart rate monitor is used for post-exercise
measurements.
Some researchers have been critical of the original Astrand-Rhyming step test and
nomogram (Maritz et al., 1961), questioning some of the accepted assumptions used: ( 1)
Linear relationship of heart rate and 02 consumption up to maximum, (2) Individual
deviations from the mean population heart rates are small, (3) At basal rate males have a
common heart rate of 60 bpm and (4) Individual 02 intake deviates little from the straight
line relating oxygen intake and rate of work for a population. However, in 1986 Astrand
addressed these issues with respect to all forms of submaximal testing. The linear
relationship of heart rate and oxygen consumption is a necessary assumption in
submaximal testing. It is the closest approximation of that relationship and most
researchers are aware that it fails at high workloads and can cause a low
prediction of V02 max. As far as the heart rate variability the standard deviations for
maximal heart rate in an age group is usually± 10 bpm and day to day variation is± 5 bpm
16

for an individual or group. By assuming a resting heart rate of 60 beats per minute the
actual range covered in this assumption if 50 to 70 beats per minute. What is most
important to note in this area is that most researchers acknowledge that these assumptions
do not cover the entire population, but are necessary to make predictions worthwhile by
saving time, need for equipment and money.
2.6 Factors Influencing Performance
Several factors which may influence a person's performance during a step test need
further research due to mixed conclusions in literature. Age, gender, weight, height and
leg length have each been investigated as possible factors in determining performance in a
step test. In general, researchers have found that most of these factors do not play an
important role in determining individual aerobic capacity with submax step testing.
2.6.1 Age
Age has already been discussed to some extent, but will be included now as well.
The importance of including age in aerobic capacity is demonstrated by the drop in
maximal heart rate as age increases as shown in Figure 2.1. If the drop is not accounted
for the V02 max can be over predicted or a person performing a submaximal test may
actually be closer to maximum than predicted and may be under a great deal of strain. No
literature was found specifically comparing performance in a test with respect to age
groups, but general inferences can be made. As a person ages their maximal V02 drops,
muscle strength diminishes and the maximum achievable heart rate drops (see Figures 2.2
and 2.3).
The decreasing muscle strength plays a big part in muscular performance which is
needed to carry out a step test The loss in strength, caused by reduced muscle mass,
slows and reduces power output of older individuals (Astrand and Rodahl, 1986).
Inferring that the performance would diminish due to these factors does not seem
unreasonable. This may also be true for young children (prepuberty) who are still in the
process of developing muscle mass and have normally not peaked in their aerobic capacity.
17

I ! p - ~ 700
! I I ---..::] I
- I-ISO .
I --· 100
I 9 c:! I . • = MJ•,mal e ae rc•se so
I • ~ 50°o ol m,:u,mal 0
I O• ygen uo lake
0 10 20 JG 40 so 60 Age
Figure 2.1.
The decline in maximal heart rate with age, and heart rate during a submaximal work rate. (From Astrand and Rodahl, 1986, Fig. 4-24).
9 ~ o • Cross secr•onal
c 50 E o • Longlludu'\a l
" '0 ,;
~ :;
~ > X 0 -:;; ; X
~
10 20 )0 50 60
Years
Figure 2.2. Mean values for maximal oxygen uptake measured during exercise
(From Astrand and Rodahl, 1986. Fig. 7-13).
s SL:
i~ > v. c:"' o:..u ~ £! :i g I 1 I I I I I I
10 . :c 30 40 :.~\ l1 ..
Age vea·s
Figure 2.3
Changes in maximal isometric strength with age in women and men. (From Astrand and Rodahl, 1986. Fig. 7-18).
18
One possibility for lack of information concerning effects of age on performance may be
the age range normally used in testing , college-aged 18 to 27 years old. An individual's
peak in performance usually occurs during the 18- to 27-year-old range. Astrand
Rhyming, Siconolfi et al. and Rockport Walking Institute (see Heyward, 1991) each
include age as a factor in calculating aerobic capacity. The issue needs further investigation
to determine its validity in V02 max calculations.
2.6.2 Gender
The literature reviewed does not include specific comparisons of performance as a
function of gender. As previously noted most studies are gender specific, women only or
men only. The Harvard Step Test and the Skubic-Hodgkins Test are two examples. Other
literature involving both sexes makes no evaluation based on differences in the
ability/performances of males versus females. With respect to preemployment strength
testing, Chaffin et al. (1978) found that gender correlated weakly with subject strength.
The authors recommended that gender differences be considered when selecting personnel,
but that the strength tests do not need to be modified for females. Figures 2.2 and 2.3,
demonstrate a difference in strength and maximal oxygen consumption between males and
females, but the significance of this difference was not provided.
A woman's maximal aerobic power is usually about sixty-five to seventy-five
percent the power of a man (Astrand and Rodahl, 1986). Women have always been behind
men (on average) in performance of athletics: 10 percent less in running events, 8 percent
in skating, 12 percent in bicycling and 6 to 10 percent in swimming (Astrand and Rodahl,
1986). It is not known if these differences are biological (anthropometry, biomechanics) or
sociological (cultural biases, training). It appears safe to assume that on average females
would lag behind males in step test performance as well. This factor needs further
investigation into the necessity of its inclusion for maximal 02 consumption evaluations.
2.6.3 Weight
The influence of weight on step test performance is the third factor to discuss. The
obvious disadvantage with weight is that heavier individuals are doing more work in a step
19

test: step height* txxly weight* cadence= work. But this difference may be negligible.
Restricted movement and poor flexibility are also disadvantages for extremely overweight
persons. The only literature examining the influence of weight was Chaffin et al. 's ( 1978)
study of strength testing. In the authors' summary, it is stated that txxly weight is not
correlated to strength. The Astrand-Rhyming nomogram and Siconolfi's equation utilize
the txxly weight for calculating max VOl. for step tests. Body weight was included in the
evaluation because of its part in calculating the workload. In the validation of the UVic step
test (Howe et al., 1973) no relationship between body weight and performance was found.
Similar results were obtained in an investigation of the Harvard Step Test (Keen and Sloan,
1958). These authors noted a study in which lighter men attained significantly higher
scores than heavier men (Reedy and Saiger, 1954). Again, very little specific research
based on performance effects of body weight with respect to step tests was found. Body
weight is another area open for further investigation.
2.6.4 Height and Leg Length
Finally, height and leg length are discussed together, focusing mainly on leg length
because it has been investigated frequently with regard to stepping performance.
Culpepper and Francis ( 1987) have developed a model to determine the proper step height
to be used for aerobic testing by stepping. The authors believe that performance in a step
test is determined by step height because of its influence on the work rate and
biomechanical efficiency, and suggest that accommodation of step height to a person's
stature would provide better aerobic capacity estimations. An angle of 73.3 degrees at the
hip was found to correlate best with actual maximal oxygen consumption and led to the
development of two equations for determining step height:
Females: Hf (em) = 0.189 * lh (2. 7)
Males: Hf (em)= 0.192 * lh, (2.8)
where Hf is the step height and lh is the statute height of the subject. Culpepper and
Francis obviously felt that height influenced performance in step tests and tried to obtain the
best performance by adjusting step height according to stature. Keen and Sloan's (1958)
20

findings and Howe et al. 's (1973) findings did not support the influence of height on step
test performance. In the investigation of the HST (Keen and Sloan), stature showed no
correlation to step test results. The authors concluded that there was no justification in
changing step heights for shorter individuals. Howe et al. made a similar conclusion when
investigating stature effects in performing the UVic step test.
Howe et al. and Keen and Sloan also made conclusions regarding the effects of leg
length on performance. Again, both studies failed to identify any correlation of leg length
and step test performance. Ricci et al. (1966) studied the HST with respect to influence on
leg length and found it was not a factor in performance. The authors concluded that
performance in the HST is mainly effected by the level of motivation and discomfort
tolerance levels of the individual being tested. It was noted that many researchers use a
lower bench height for women, but fail to justify its use. Some literature disagrees with
this statement. In a study using an adjustable bench height and a 25 step/minute cadence
(Shahnawaz, 1978) the findings suggest that any step test's validity is enhanced by
adjusting the bench height in relation to a subject's limb length (top of the greater trochanter
to the floor). Shahnawaz found that a relationship between oxygen consumption and bench
height exists with the lowest consumption occurring at a bench height near fifty percent of a
subject's limb length (lowest oxygen consumption, but best maximal VOl. prediction). The
author concludes that optimal performance may be obtained through a compromise between
stepping rate and a bench height between forty to fifty-five percent of a subject's leg length.
This compromise leads to the best approximation of maximal oxygen consumption using
this method. Further investigation in this area was encouraged.
In another investigation of the Harvard Step Test (Ariel, 1969) an attempt to
discover any significant effects that knee joint angle has on HST performance was made.
The study indicated that the larger knee joint angles were (i.e., higher bench or shorter
legs) the more difficult it was to perform the test as indicated by lower fitness index scores.
Ariel suggested adjusting the knee joint angle such that each subject is competing on an
equal basis, otherwise comparisons are biased. The literature is not in agreement as to the
influence of limb length on performance and further investigation into this area is
encouraged to make a conclusion that can be incorporated into testing procedures.
21

2.7 Preemployment Testing and Job Requirements
The importance of preemployment testing cannot be stressed enough. It calls for an
evaluation of all job requirements in order to properly choose a prospective employee. A
study done for Advanced Ergonomics, Inc., by Charles Anderson (1990) emphasizes the
value of preemployment placement testing. Isometric strength tests and endurance tests
(using Siconolfi et al. 's step test method) were performed by 665 prospective new hires at
a grocery warehouse. The study investigated productivity, injury rates and employee
retention. It was concluded that this type of preemployment testing, strength and
endurance testing, has the potential to increase productivity and retention and reduce
overexertion on the job. In another study by Anderson and Catterall ( 1989) similar results
were stated. Productivity of employees increased four to twenty-three percent depending
on the difficulty of the preemployment evaluation.
According to Kraemer (1976), a preemployment "test should be designed to allow
judgment about the match between a person's capabilities .... and the actual demands on the
job" (p. 65). The author lists several models, methods and techniques for testing
personnel: physiological and biomechanical models, physiological or biomechanical
examinations and static or dynamic techniques. The Work Practices Guide for Manual
Lifting (NIOSH, 1981) recommends that the energy expenditure on the job does not
exceed thirty-three percent of an employee's maximal oxygen consumption value.
Working over fifty percent for prolonged periods will cause muscle fatigue and disrupt
normal performance and productivity. The corresponding heart rate (at 33% V02 max) is
expected to be between 110 to 115 beats per minute. The NIOSH guidelines also state that
due to variability of aerobic capacities in the work force, persons being hired into
physically demanding jobs should be tested before employment. The advice makes perfect
sense because an overexerted employee is not an asset The likelihood for injury increases
as does the probability for mistakes.
The simplest way to conduct a physiological job evaluation is to monitor the heart
rate of an employee actually doing his/her daily work. This gives a basis for energy
expenditure throughout the day and can be used to calculate oxygen consumption.
22

What must be kept in mind is that an employee should be working at no more than one
third of his or her aerobic capacity.
2.8 Summary
Problems with the various step test methods have been discussed. The use of cycle
tests and treadmill tests in validation of step tests was questioned and a final suggestion of
validating using the same form of exercise was made (i.e., maximal treadmill test to
validate a submaximal treadmill test). Comparisons between methods is not advisable due
to differences in maximal values obtained. Treadmill tests are normally approximately four
to eight percent higher than cycle tests and three percent higher than step methods (as
shown in Table 2.1).
The simplicity, low cost and short time were emphasized as reasons for choosing
stepping as a method of aerobic testing versus treadmill and cycle ergometers. The biggest
problem surrounding step testing is choosing a single method. Several methods were
introduced and discussed, but no recommendation can be made due to the large number of
step tests available. No literature was found strictly comparing various step methods. It is
not known if any single method stands out as a better predictor than the others or if there is
any significant differences between the maximal V02 prediction values obtained from
various submaximal step methods.
Some factors that other authors have investigated were discussed: age, gender,
weight, height and leg length. The literature is very diverse in terms of whether or not
these factors influence an individual's performance during a step test. Most researchers
recommended and encouraged further research of all factors.
The purpose of this literature review was to discuss the numerous step test methods
available and mention some of the problems occurring during their development A
comparison of each method to an actual maximal oxygen consumption value obtained from
a maximal step test would reveal which submaximal method(s) is the best predictor.
However, maximal testing is discouraged which limits the ability to recommend one
method over others. For this reason, the need for testing and comparing several different
methods is apparent.
23
The best possible solution to this problem is a study comparing various submax
step test methods, checking for differences in the predicted values of oxygen consumption.
To further investigate submaximal step tests the factors mentioned could be included, in
particular, the effects of leg length. This factor is closely related to the step method
variation. Each method uses a different step height and if leg length is truly a factor in
performance, changes in the bench height should reflect this. A single study will not clear
up all questions and discrepancies, but it is a beginning and may encourage more research
in this area
The following study evaluates several step test methods to identify any significant
differences in the V02 values obtained. A treadmill test and cycle ergometer test will also
be performed to identify correlations of each method with the step methods used.
24

CHAPTER3
DESCRIPTION OF TESTS
3.1 Bruce Treadmill Protocol
The Bruce protocol was developed in 1971 and was used extensively for diagnostic
purposes. The speed and slope of the treadmill are changed every three minutes as shown
in Table 3.1. The subjects heart rate must be monitored throughout the test because the
calculation is based on heart rates and oxygen consumption. If oxygen consumption is not
monitored, an equation is provided to predict the subject's consumption at the various
stages of testing. Equation 3.1 can be used to calculate the work done during each stage
(work can be converted to oxygen consumption) or equation 3.4 can be used for a direct
calculation of the estimated oxygen consumption during the test.
Stage
1.
2.
3.
Time
1-3 min
4-6
7-9
Table 3.1
Bruce Protocol
Speed
1.7 mph
2.5
3.4
%Grade
10%
12%
14%
Predicted V02
13.4 ml/kg min
21.4
31.5
Treadmill Work= Body Weight (kg) X 9.8 m/s2 X Sin eX (speed(m/min)) X time (3.1)
TAN -1(%grade of treadmill) =degrees (8)
1 mile per hr = 26.67 meters per minute
V02 (mllkg min)= [(75 + (6 x% grade))x(mph/60)] x 3.5.
25
(3.2)
(3.3)
(3.4)

A sample calculation of the workloads is given in Appendix B. The prediction of
maximal oxygen consumption is based on the assumption that the heart rate and oxygen
consumption increase linearly as the workload of the treadmill is increased. A linear
regression was performed to predict the maximal oxygen consumption. Up to four sets of
points were used in the regression equations, depending on the number of stages completed
by the subjects. The maximum heart rate was estimated using the formula 220- age. The
heart rate was measured for 30 seconds in the second and third minutes of each stage and if
the difference from minute two to three was greater than five beats per minute the stage was
extended for one minute to stabilize the heart rate. Since the actual oxygen consumption
was monitored during this testing, two values were calculated for each subject; one using
the predicted oxygen consumption from equation 3.4 and a second using the oxygen values
obtained from the metabolic cart recordings (see Chapter 4).
3.2 Cycle Ergometer Test--YMCA Protocol
The YMCA cycle ergometer protocol is also based on the linear relationship
between heart rate and oxygen consumption. During the test the subjects pedals at 50 rpm
throughout the test. To increase the workload the resistance on the bike was changed
according to the subject's heart rate in the previous workload. Table 3.2 describes the
procedures used. At least two stages were performed by each subject and heart rates
greater than 110 beats per minute were used in the calculations. As in the Bruce protocol
the heart rate was recorded during the second and third minute of each stage and the stage
was extended for one minute if the difference in the values was greater than five beats per
minute. A linear regression was used to calculate the predicted maximum oxygen
consumption. The oxygen consumed during the cycle test was obtained in two ways: (1)
Actual values obtained from a metabolic cart or (2) Approximate values found using the
workload for each stage of the test. The approximate values are based on the resistance
used during the respective stage.
26

Stage Time
1. 1-3 min
2. 4-6
3. 7-9
Table3.2
YMCA Protocol
Resistance Revolutions
0.5 kg 50 rpm
depends HR 50 <80: 2.5 80-90: 2.0 90-100: 1.5 >100: 1.0
depends on 50 previous resistance
2.5: 3.0
2.0: 2.5
1.5: 2.0 1.0: 1.5
per minute
Table 3.3 provides the approximate value of oxygen consumption for given values of
resistance. Since the oxygen consumption was monitored during this testing two
calculations predicting the aerobic capacity were performed for each subject. The results of
these equations were analyzed for statistical differences. This was also done for the Bruce
protocol.
Table3.3
Approximate Values of Oxygen Consumption
Resistance
0.5 1.0 1.5 2.0 2.5
VOl (L/min)
0.6 0.9 1.2 1.5 1.8
27

3.3 Step Tests
3.3.1 Sharkey's Method
Sharkey's step test method is a modification of the Astrand-Rhyming step test
method. The procedure was the same for both tests, however, Sharkey's method records
the subject's heart rate fifteen to thirty seconds after the step exercising is done while the
Astrand-Rhyming method uses the heart rate from the last minute of exercise in its
calculations. Table 3.4 gives a description of the bench height, testing time and the cadence
used.
Time
5min
Table3.4
Sharkey's Protocol
Bench Height
33 em -women 40cm -men
Cadence
22.5 steps per minute
In place of the nomogram developed by Astrand and Rhyming, Sharkey's test uses
equations 3.5-3.8 to calculate the predicted aerobic capacity. 02 is aerobic capacity in liters
per minute, W is weight in kilograms and P is the maximal pulse estimate in beats per
minute. Because the procedures of Sharkey's method and the Astrand-Rhyming test are
the same, two values of maximal oxygen consumption were calculated for each method:
one value using the heart rates from the Astrand-Rhyming procedure and one value using
the heart rates from Sharkey's procedure.
Maximal Pulse (men)
Maximal Pulse (women)
02, Umin (men)
02, Umin (women)
= 64.83 + 0.662 x (postexercise pulse/min.)
= 51.33 + 0.750 x (postexercise pulse/min.)
= 3.744 X [(W+S)/(P-62)]
= 3.750 X [(W-3)/(P-65)].
28
(3.5)
(3.6)
(3.7)
(3.8)

3.3.2 Siconolfi's Method
This procedure was developed for use in epidemiologic studies and is suitable for
estimating maximal oxygen consumption for individuals aged 19 to 70 years. The test
consists of stepping on a 10 inch bench at three different cadences for three minute stages.
A one minute rest follows each workload (see Table 3.5).
Table 3.5
Siconolfi's Method
Stage Time Bench Height Cadence
1. 1-3 min 10 inches 17 steps per minute 2. 3-4 rest 3. 4-7 10 26 4. 7-8 rest 5. 8-11 10 34
During this test, the heart rate was recorded three times in the last minute of each
workload: at 2:30, 2:45 and 3:00 minutes. These values were averaged to find the
approximate heart rate during the respective stage. Equations 3.9-3.11 are provided for
calculating the approximated oxygen consumption during the test
Stage 1: VOl (1/min) = 16.287 x Wt(kg)/1000
Stage 2: VOl (1/min) = 24.910 x Wt(kg)/1000
Stage 3: VOl (1/min) = 33.533 x Wt(kg)/1000.
(3.9)
(3.10)
(3.11)
The value from the last stage was used with the average heart rate of that stage to obtain a
predicted maximal consumption from the Astrand-Rhyming Nomogram (see 3.3.4). The
value resulting from these procedures was then used in equation 3.12 or 3.13 depending on
the gender of the participant. X 1 is VOl. submax in liters per minute from
29
Astrand-Rhyming and X2 is the age in years. These equations resulted in the final
predicted capacity for Siconolfi's protocol.
Males: V02 max (Umin) = 0.348(Xl)- 0.035(X2) + 3.011
Females: V02 max (Umin) = 0.302(X1)- 0.019(X2) + 1.593.
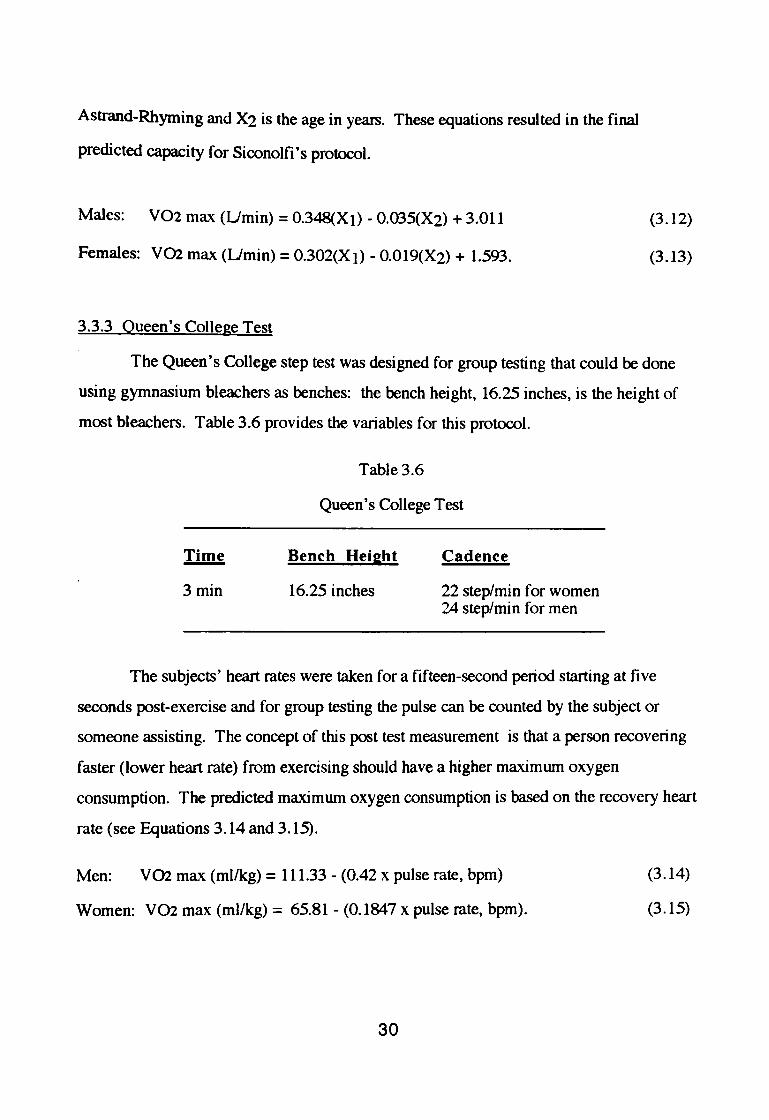
3.3.3 Queen's College Test
(3.12)
(3.13)
The Queen's College step test was designed for group testing that could be done
using gymnasium bleachers as benches: the bench height, 16.25 inches, is the height of
most bleachers. Table 3.6 provides the variables for this protocol.
Time
3 min
Table3.6
Queen's College Test
Bench Height
16.25 inches
Cadence
22 step/min for women 24 step/min for men
The subjects' heart rates were taken for a fifteen-second period starting at five
seconds post-exercise and for group testing the pulse can be counted by the subject or
someone assisting. The concept of this post test measurement is that a person recovering
faster (lower heart rate) from exercising should have a higher maximum oxygen
consumption. The predicted maximum oxygen consumption is based on the recovery heart
rate (see Equations 3.14 and 3.15).
Men: V02 max (ml/kg) = 111.33 - (0.42 x pulse rate, bpm)
Women: V02 max (ml/kg) = 65.81- (0.1847 x pulse rate, bpm).
30
(3.14)
(3.15)

3.3.4 Astrand-Rhyming Step Test and Nomogram
The procedures for the Astrand-Rhyming test are the same as those discussed in the
section on Sharkey's method. As previously mentioned, the difference in the tests exist in
the methods used to obtain the predicted aerobic capacity. Astrand and Rhyming provided
a nomogram for use with their step test (see Figure 3.1). Plotting the heart rate recorded
during the last minute of exercise (bpm) and the subject's body weight (kg) gives a
predicted value for physical work capacity. The authors suggested that the heart rate lie
within a range of 125-170 beats per minute for the best results. An age correction factor is
provided for ages 15 through 65 (see Table 2.5).
,.Is• , ...
cf' ~ 170
"' 1U 172
I Sl 16 I
IH 164
ISO 160
"' 156
141 Sl
Ill "'
IH 144
IU ll6
112 Ill
20
maaimol ' oaygen intake lftwtin
body weight step teat
·'
'"ll '\o •nen cnt'c intake
~d'l.O 40-: 1/min llg : 1.1
1.2
5o;4o : kg u
1.4
1.5
u
1.7
1.1
-1o-= 2.0
..,., .. hwet
- 400 : llgm/ ~ min
:- 500
:- 500
:- 700
~ 100
-:1o 2'1
: too 2.2
2.)
2.4 :-1000
2.5 -
2.5 :-1100
:-1200
10 :.uoo
) , I
Figure 3.1
Astrand-Rhyming Nomogram
31

3.3.5 Cotten Step Test--Heyward Equations
The Cotten step test was also developed for group testing on gymnasium bleachers
approximately seventeen inches high. The test consists of eighteen innings of 30 seconds
of work alternated with 20 seconds of rest with the cadence increasing following the sixth
and twelfth innings. During the resting period the heart rate was monitored and recorded.
The test was terminated once the subject's heart rate reached 150 beats per minute. Table
3.7 describes the bench height, cadence and timing for this protocol.
Stage
1.
2.
3.
Table 3.7
Cotten Step Test Procedures
Innings
1-6
7-12
13-18
Bench Height
17 inches
17
17
Cadence
24 steps per minute
30
36
Originally the Cotten test did not include calculations for predicting physical work
capacity; the only value assigned to the test corresponded to the inning in which a
participant's heart rate reached or exceeded 150 beats per minute. Persons conducting the
test were instructed to develop norms based on the group's performance in order to give a
fitness rating or assigned fitness category to the subjects. In 1984, Heyward developed an
equation for predicting maximum oxygen consumption when utilizing the Cotten test
(Equation 3.16). This equations uses the step test score (last inning completed) and the
subject's body weight.
V02 max (ml/ kg min)=[ (1.69978 x step test score)- (0.06252 x weight in lbs)] (3.16)
+ 47.12525.
32

CHAPTER4
EXPERIMENTAL DESIGN
4.1 Overview
Male and female subjects aged 18-45 were recruited from the university and
community population. It was proposed that eighteen (9 females and 9 males) subjects
would each perform the seven test methods described above. The tests were randomly
assigned (see Table 4.1) and conducted on consecutive days if possible. Not all subjects
were willing to participate in seven separate sessions due to the time commitment required
and instead completed multiple tests in each session. For those subjects completing more
than one test per session, their heart rate was monitored and the subjects rested until the
heart rate was within five beats per minute of their original resting HR before the next test
was conducted. In no case did a subject participate in more than three tests on any given
day. The testing sessions lasted approximately thirty minutes for each test, requiring a total
time of two and one half hours. An initial session was needed for the purpose of
introducing subjects to the protocols and gathering information concerning general health,
age, weight, height, etc. A sample of the information sheet and consent form are given in
Appendix C.
During all testing actual V 02 measurements were taken and heart rate
monitored and recorded. Where appropriate the actual measurements were inserted into
equations for comparison with the values approximated through heart rate. The Bruce
protocol, YMCA protocol, and Siconolfi's method each use estimated values of V02 in
their respective prediction equations. The experimental design was divided into three areas
of interest: ( 1) To examine differences in the means of the seven submaximal tests, (2) To
examine differences in the test means when actual oxygen consumption values are used
versus estimated values, and (3) To examine differences in the means of the Astrand
Rhyming step test and Sharkey's step test.
33

Table 4.1
Random Assignment of Protocols
Subjects Testing Session
Session 1 Session 2 Session 3 Session 4 Session 5 Session 6 Sesn. 7
1 Siconolfi Cotten A strand TR* Queens CE* Sharkey 2 CE A strand Queens Cotten TR Siconolfi Sharkey 3 Queens TR Cotten Sharkey CE A strand Siconolfi 4 TR Sharkey A strand Siconolfi CE Cotten Queens 5 Cotten CE A strand Siconolfi Queens TR Sharkey 6 Sharkey Siconolfi Queens A strand CE TR Cotten 7 Cotten A strand Sharkey TR CE Siconolfi Queens 8 Sharkey A strand Cotten Queens TR Siconolfi CE 9 Cotten Siconolfi Queens A strand Sharkey CE TR 10 A strand Siconolfi TR Cotten CE Queens Sharkey 11 Queens Cotten TR Sharkey CE Siconolfi A strand 12 A strand Siconolfi Cotten Sharkey Queens CE TR 13 Sharkey A strand Siconolfi CE Cotten Queens TR
14 Cotten Sharkey A strand CE Siconolfi TR Queens 15 CE Siconolfi Queens Cotten Sharkey TR A strand 16 Sharkey Siconolfi TR CE Cotten A strand Queens
17 Sharkey Cotten Queens CE Siconolfi TR A strand
18 Queens CE Cotten Siconolfi A strand Sharkey TR
*In the above table, CE represents the YMCA cycle ergometer protocol, TR represents the Bruce treadmill protocol, and all others are step test protocols.
34

4.2 Anticipated Conclusions and Design Setup
4.2.1 Differences in the Means of the Seven Tests
4.2.1.1 Anticipated Conclusions
1. Differences between predicted values of step test methods are significant.
2. Differences between predicted values of treadmill and step tests, and cycle and step tests are negligible.
The first conclusion was based on the findings in the review of literature. Most
submaximal and maximal step tests were developed without any comparison to the step test
being modified (whether that be the Harvard Step Test or the Astrand-Rhyming Step Test).
Due to this finding, it was proposed that the means of the respective step test would be
statistically different. The second conclusion was necessary in order to state that step tests
are an equally accurate method of calculating aerobic capacity. Most step tests are justified
by showing a high correlation to a treadmill or cycle ergometer test.
4.2.1.2 Design Setup
A randomized complete block (RCB) analysis of variance was used to analyze the
differences in test means. The ANOVA blocked by subjects. The statistical model is as
follows:
(4.1)
where Ti is the test protocol, and Sj is the subject. Table 4.2 is the ANOV A table for this
area of the research design.
35

Table4.2
ANOV A--RCB for Seven Tests
Source Degrees of Freedom Sum of Squares Mean Square F-test
Total 125 T.Yij2- Y .. 2tab
Tests 6 T.Yi.2/b- Y .. 2tab SST/(a-1) MST/MSE
Subjects 17 T.Y.j2/ab- Y .. 2tab SSbikl (b-1)
Error 102 SST - SSa - SSb SSE/(a-l)(b-1)
The following information is the hypothesis developed from the above experimental
design. A fixed effects model was used because the test protocols were specifically chosen
due to the provision of prediction equations. Also the subjects were volunteers; self
selection eliminated the randomness of the subject population. Duncan's multiple range test
was also used to look for significant differences between the test protocol means.
1. Ho: All J4i are equal, H 1: At least one J4i not equal to the others,
4.2.2 Evaluation of Actual Versus Estimated Oxygen Consumption
This hypothesis is looking for significant differences among test means.
As explained previously the Bruce Protocol, the YMCA Protocol and Siconolfi's
Step Test all provided estimated values of oxygen consumed during the test and the actual
volume of oxygen consumed was monitored and recorded during testing of these three
protocols. Therefore, two values of predicted aerobic capacity were obtained for each of
these tests and it was necessary to investigate possible discrepancies between these values.
36
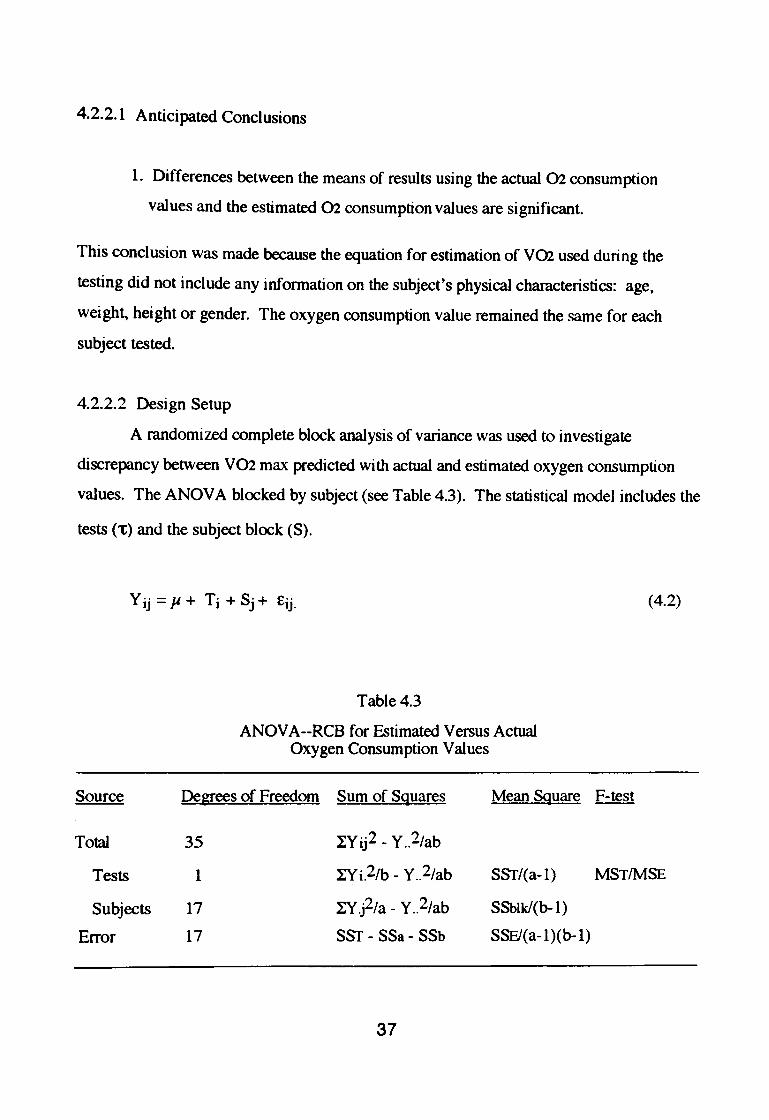
4.2.2.1 Anticipated Conclusions
1. Differences between the means of results using the actual 02 consumption
values and the estimated 02 consumption values are significant.
This conclusion was made because the equation for estimation of VOl used during the
testing did not include any information on the subject's physical characteristics: age,
weight, height or gender. The oxygen consumption value remained the same for each
subject tested.
4.2.2.2 Design Setup
A randomized complete block analysis of variance was used to investigate
discrepancy between V02 max predicted with actual and estimated oxygen consumption
values. The ANOVA blocked by subject (see Table 4.3). The statistical model includes the
tests (1:) and the subject block (S).
Source
Total
Tests
Subjects
Error
Table 4.3
ANOVA--RCB for Estimated Versus Actual Oxygen Consumption Values
(4.2)
Degrees of Freedom Sum of Squares Mean Square F-test
35 IYij2- Y .. 2/ab
1 ITi.2/b- Y .. 2/ab SSf/(a-1) MST/MSE
17 IY.Pia- Y .. 2/ab SSblkl(b-1)
17 SSf - SSa - SSb SSFJ(a-1)(b-1)
37

This model uses fixed effects for the same reasons mentioned above. Duncan's
Multiple Range test was used to determine if significant differences existed. Only one
hypothesis was tested for this section.
1. Ho: All Ti are equal, Hl: At least one Ti not equal to the others,
4.2.3 Astrand Versus Sharkey
4.2.3.1 Anticipated Conclusions
This hypothesis examines significant differences in the two means for V02max.
Sharkey's method is a modification of the Astrand-Rhyming step test; however, no
comparison was ever made between the two tests to check for statistical differences. The
idea behind the development of Sharkey's test was to simplify step testing, but the
procedures of the test were not altered--it only eliminated the use of the Nomogram. There
is only one conclusion for this design:
1. Differences between the means of the predicted V02 max for Astrand-Rhyming
and Sharkey are significant
4.2.3.2 Design Setup
The design used was a randomized complete block. Subjects were blocked and the
two protocols were the treatments used. Table 4.4 defines the ANOV A procedure. The
statistical model follows:
Y ij = Jl + Ti + Sj + Eij. (4.3)
38
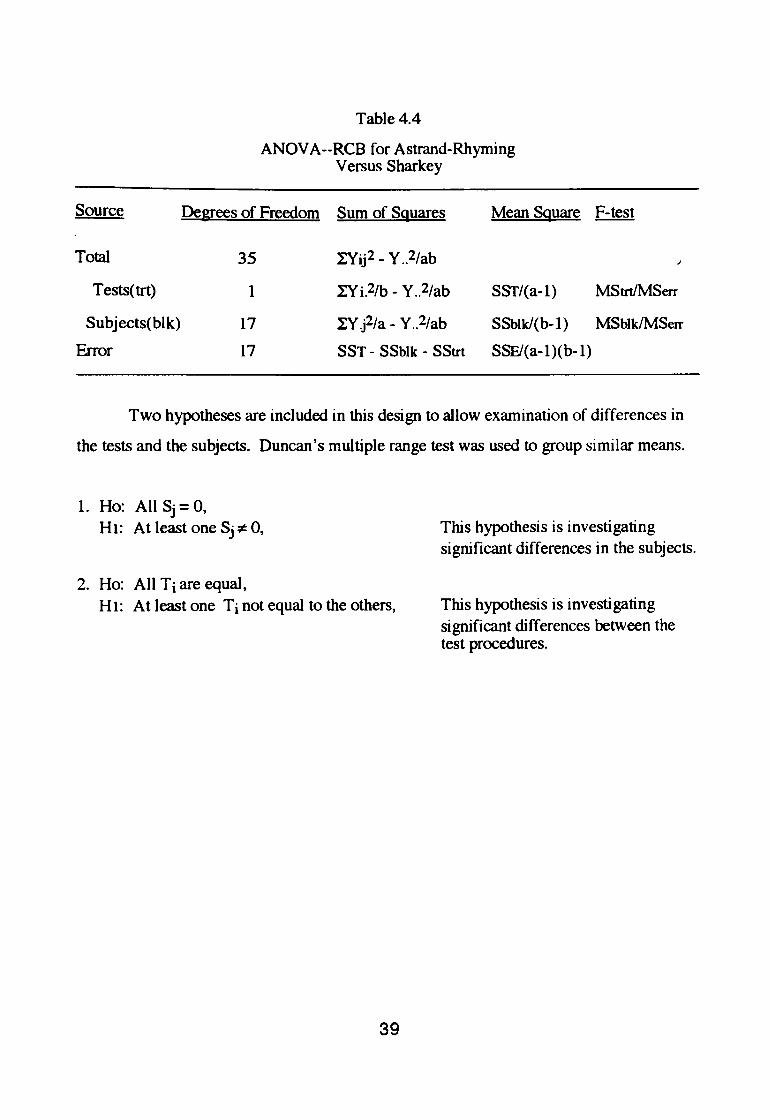
Table4.4
ANOV A--RCB for Astrand-Rhyming Versus Sharkey
Source Degrees of Freedom Sum of Sguares Mean Sguare F-test
Total
Tests(trt)
Subjects(blk)
Error
35
1
17
17
l:Yij2 - Y .. 2/ab .)
IYi.2/b- Y .. 2/ab SSf/(a-1) MStrtiMSerr
l:Y.j2/a- Y .. 2fab SSblkl(b-1) MSblkiMSerr
SST - SSblk - SStrt SSFJ(a-1)(b-1)
Two hypotheses are included in this design to allow examination of differences in
the tests and the subjects. Duncan's multiple range test was used to group similar means.
1. Ho: All Sj = 0, Hl: At least one Sj ~ 0,
2. Ho: All T i are equal, Hl: At least one Ti not equal to the others,
39
This hypothesis is investigating significant differences in the subjects.
This hypothesis is investigating significant differences between the test procedures.
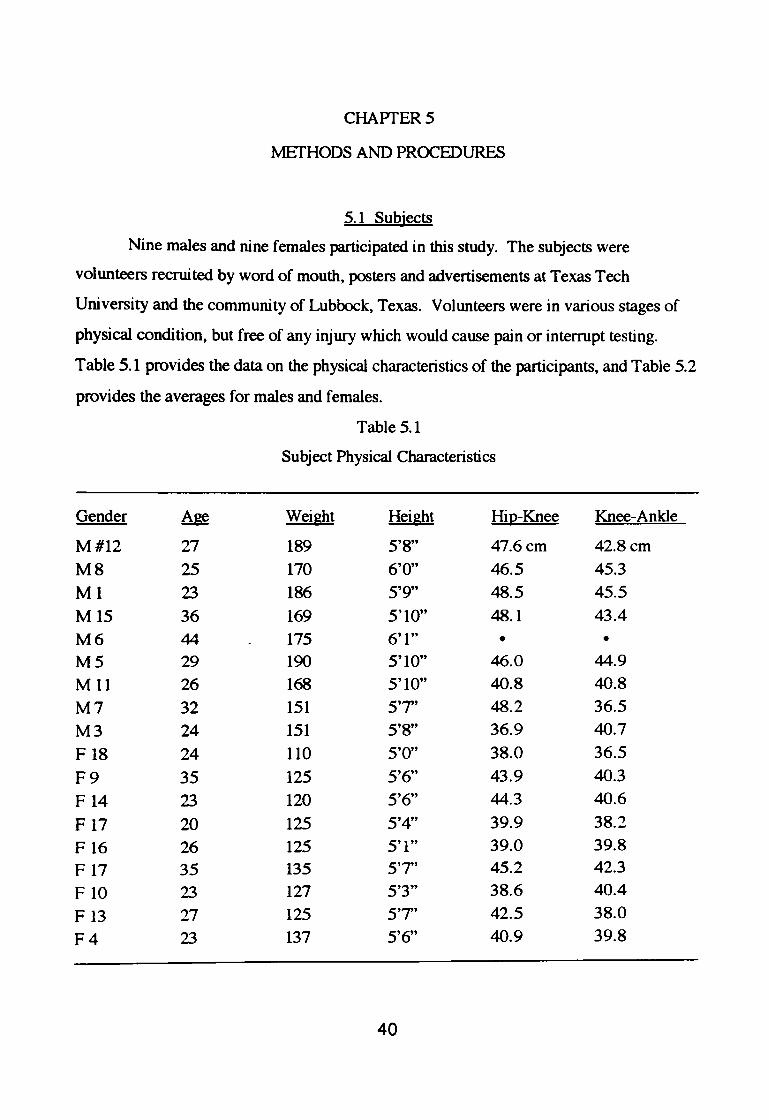
CHAPTERS
~HODSANDPROCED~
5.1 Subjects
Nine males and nine females participated in this study. The subjects were
volunteers recruited by word of mouth, posters and advertisements at Texas Tech
University and the community of Lubbock, Texas. Volunteers were in various stages of
physical condition, but free of any injury which would cause pain or interrupt testing.
Table 5.1 provides the data on the physical characteristics of the participants, and Table 5.2
provides the averages for males and females.
Table 5.1
Subject Physical Characteristics
Gender Age Weight Height Hip-Knee Knee-Ankle
M#12 27 189 5'8" 47.6cm 42.8cm
M8 25 170 6'0" 46.5 45.3
M1 23 186 5'9" 48.5 45.5
M 15 36 169 5'10" 48.1 43.4
M6 44 175 6' 1" • • M5 29 190 5'10" 46.0 44.9
Mll 26 168 5' 10" 40.8 40.8
M7 32 151 5'7" 48.2 36.5
M3 24 151 5'8" 36.9 40.7
F 18 24 110 5'0" 38.0 36.5
F9 35 125 5'6" 43.9 40.3
F 14 23 120 5'6" 44.3 40.6
F 17 20 125 5'4" 39.9 38.2
F 16 26 125 5' 1" 39.0 39.8
F 17 35 135 5'7" 45.2 42.3
F 10 23 127 5'3" 38.6 40.4
F13 27 125 5'7'' 42.5 38.0
F4 23 137 5'6" 40.9 39.8
40

Gender M
F
Age 29.5 yrs
26.2
Table 5.2
Averages of Subject Characteristics
Weight 172.1 lbs
125.4
Height 5'10"
5'4"
Hip-Knee 45.3 em
41.4
Knee-Ankle 42.4cm
39.5
All subjects were questioned about their physical condition prior to testing.
Appendix C is a sample of the infonnation sheet that each participant completed.
Appendix D contains infonnation regarding the physical condition of each participant.
Disqualification would have occurred if the potential subject had a known cardiovascular
disease or any physical ailment that would prevent them from perfonning the test protocols
safely. All persons inquiring were infonned of the purpose of the research and the
procedures used. In addition, subjects were infonned that a minimal risk for heart
problems and/or muscle soreness existed and that testing would be tenninated if a subject
experienced chest pain, dizziness, shortness of breath or any discomfort.
5.2 Methods and Eguipment
During the first session with each subject the infonnation sheet was completed and
information regarding age, weight and height was obtained. An anthropometric
measurement device was used to measure subjects' heights and leg lengths (greater
trochanter to lateral condyle and lateral condyle to lateral maleolous). Weights were
obtained using an ordinary bathroom scale. It was also during this initial session that
subjects signed consent forms which explained the purpose of this research and the
procedures used. Following this the equipment used during each test was explained. In
total, seven submaximal aerobic capacity testing protocols were performed by each subject:
five step tests, a treadmill test and a cycle ergometer test.
The treadmill test was perfonned on a CardioExercise Treadmill from Quinton
Instruments. Figure 5.1 shows the laboratory setup while the treadmill test was being
41

Figure 5.1
Equipment For Treadmill Test
42

carried out by a male subject The Bruce Submaximal Testing Protocol was used and
lasted between 9-15 minutes depending on the subjects' heart rates. A full description of
the test protocols used was given in Chapter 4. The BodyGuard Ergometer 990 was used
for the YMCA cycle ergometer test (see Figure 5.2). This test lasted between 9-15 minutes
also. The five step tests were performed on wood and plastic benches of various heights.
The heights were changed by stacking the benches (see Figure 5.3). Prior to each test the
subject was told the bench height, cadence of the protocol and any special instructions
relative to that protocol. The step test cadences were on a tape recording of a metronome to
insure that the pace was consistent from subject to subject
A Sensor Medics Metabolic Measurement Cart (MMC) was used to record the
oxygen consumed during the tests. A two-way valve was used as the mouthpiece and was
supported by the head gear shown in Figures 5.1 through 5.3. Subjects also wore a nose
clip to prevent breathing through the nose. Subjects' heart rates were monitored using a
UNIQ CIC Heart Watch by Computer Instrument Corp. which sends a signal to a wrist
watch giving the heart rate in beats per minute. The watch can be worn by the subject (as
seen in the previous figures) or the watch can be placed near the subject for private
monitoring. The heart rate was recorded at the end of each minute of exercise and during
recovery for some of the protocols. The Heart Watch was also used to monitor the heart
rate between tests to insure that a subject was fully recovered before starting the next test
protocol--heart rate back to resting. A Casio stop watch was used to monitor testing time.
5.2.1 Metabolic Cart
Prior to each test a subject file was opened on the MMC's IBM PC. These files
contained the subject's name, gender, age, weight, height and the test being performed.
Other information concerning room temperature, pressure and humidity was also entered.
After the file was opened and saved, a calibration of the MMC Aowmeter and calibration
gases was performed. This was necessary to check the MMC for fluctuations in the
volume measurement and gas percentages. Once finished this calibration became part of
the subject file. The files were used to record the oxygen consumption during the testing.
43
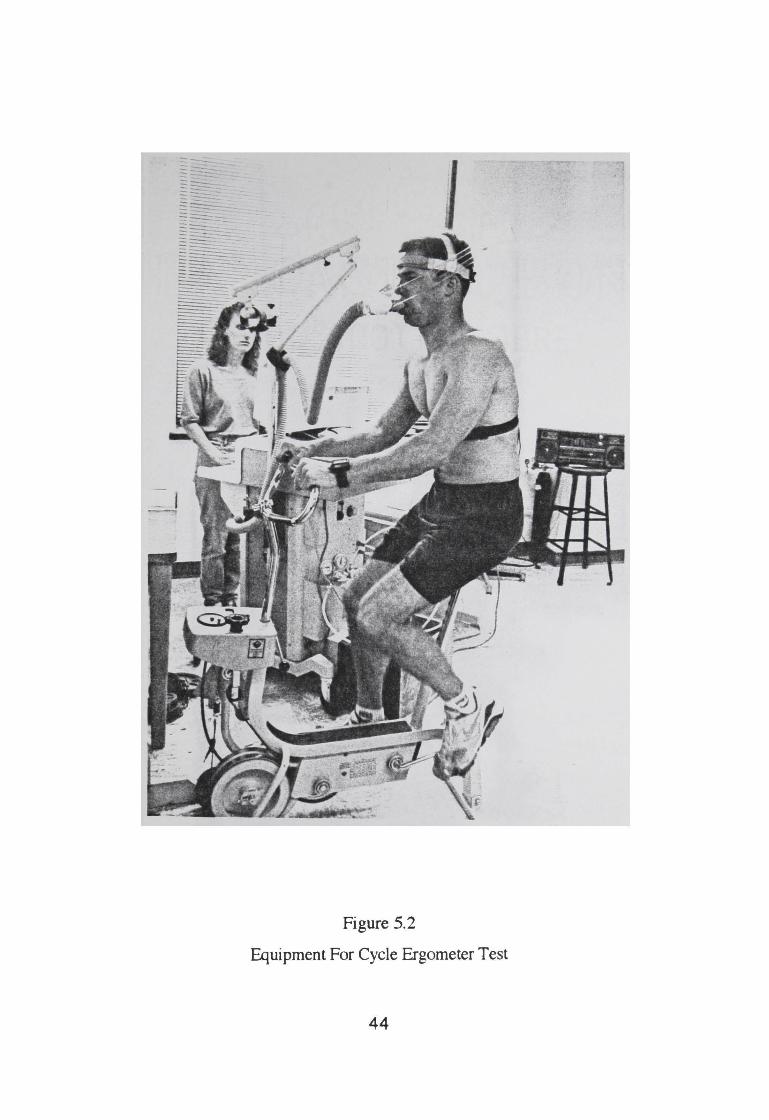
Figure 5.2
Equipment For Cycle Ergometer Test
44
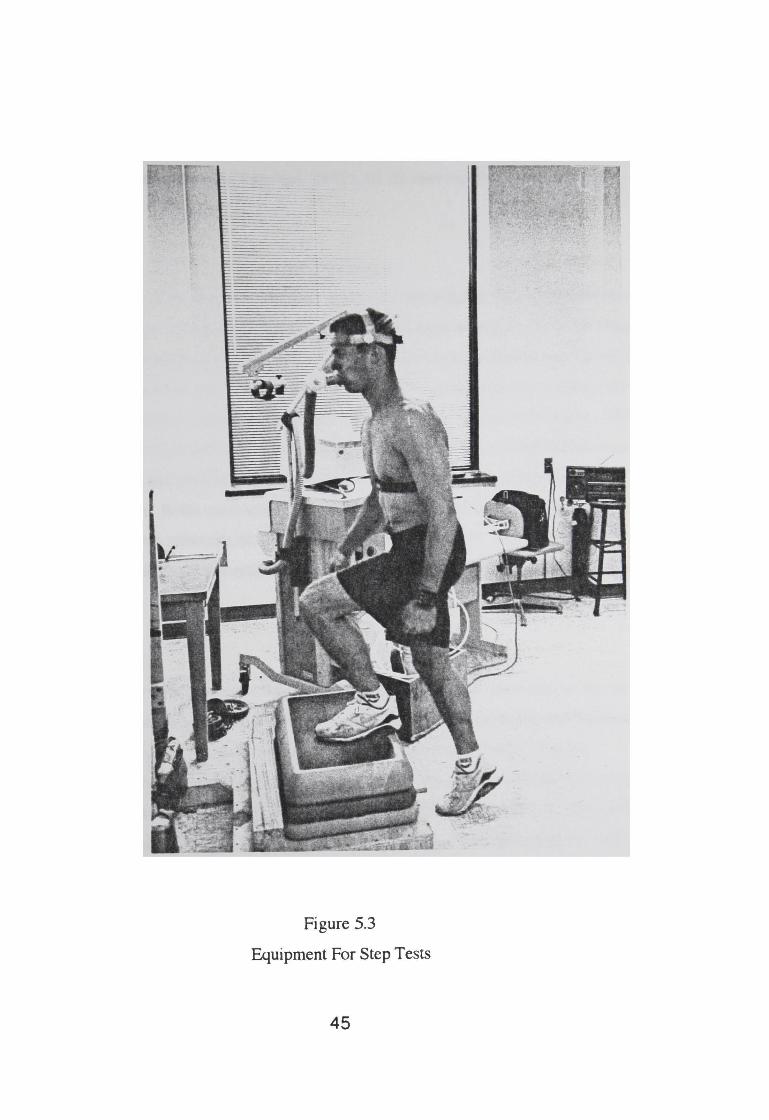
Figure 5.3
Equipment For Step Tests
45

When opened to the Exercise Protocols section the MMC records oxygen consumption in
milliliters per kilogram of body weight every twenty seconds (see sample of data in
Appendix E). These 02 values were later used in the calculations for predicted aerobic
capacity.
5.3 Procedures
The order of the tests was randomly assigned to the subjects. All of the tests were
submaximal. Upon arrival at the Ergonomics Research Lab, the subjects put on the Heart
Watch to begin monitoring the heart rate. At this time, the MMC calibration was complete
and the individual's file was ready for data collection. The mouthpiece was inserted and
head gear was placed on the subject and adjusted to support the weight of the valve. The
nose clip was not worn until the exercise began. Some subjects came to the lab for seven
consecutive days and performed one test a day. For others this was not possible due to
time constrictions. In the cases where multiple tests were performed in one day the
subjects rested for a minimum of fifteen minutes between each test. No one began a
second test until the heart rate returned to the resting value recorded when the subject first
came to the lab.
5.3.1 Step Tests
If the test to be performed was a step test, the subjects were instructed to step up
and down a few times to become familiar with the height while wearing the mouthpiece and
head gear. Subjects were told to step up on the bench whenever a "beep" from the
recorded metronome was heard and to switch the leading leg as often as possible to avoid
muscle soreness in the legs. When the subject was prepared the metabolic cart was started
and the tape recording began. The stopwatch was coordinated with the recorder in order to
monitor heart rate after each minute. Subjects were also told to stop if dizzy, losing balance
or experiencing pain. It was more important to be comfortable than to finish the test.
When the test was completed the MMC was stopped and subjects sat down to rest. The
subjects left the HeartWatch on at this time unless more than one participant was
performing tests.
46
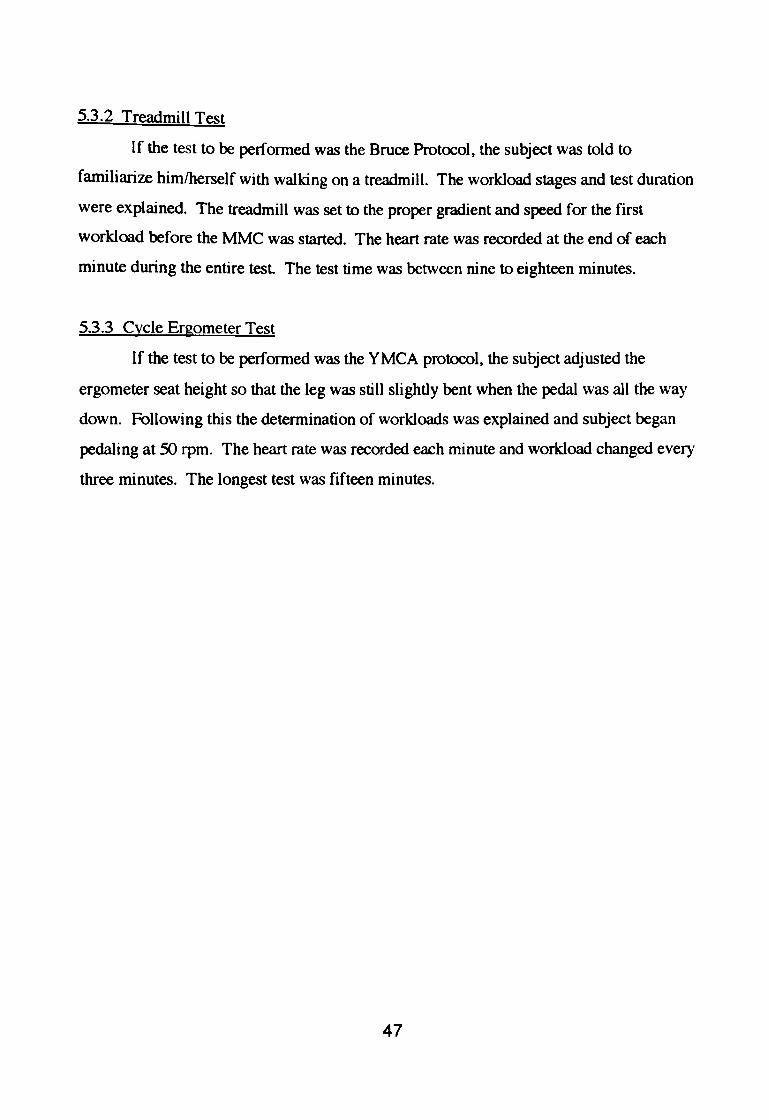
5.3.2 Treadmill Test
If the test to be performed was the Bruce Protocol, the subject was told to
familiarize him/herself with walking on a treadmill. The workload stages and test duration
were explained. The treadmill was set to the proper gradient and speed for the first
workload before the MMC was started. The heart rate was recorded at the end of each
minute during the entire test The test time was between nine to eighteen minutes.
5.3.3 Cycle Ergometer Test
If the test to be performed was the YMCA protocol, the subject adjusted the
ergometer seat height so that the leg was still slightly bent when the pedal was all the way
down. Following this the determination of workloads was explained and subject began
pedaling at 50 rpm. The heart rate was recorded each minute and workload changed every
three minutes. The longest test was fifteen minutes.
47

CHAPTER6
EXPERIMENTAL DATA
6.1 General Introduction
This chapter provides the raw data collected during the testing period of this
research. The data was listed in the following order: (1) Comparison of seven tests, (2)
Comparison of actual versus estimated VOl, and (3) Astrand-Rhyming step test versus
Sharkey's method. Tables of the data are listed in Appendix F.
6.2 Data from the Seven Submaximal Tests
The performance data (aerobic capacity in milliliters of 02 consumed per kilogram
of body weight) for each test were plotted for all eighteen subjects (Figures F.1-F.18 in
Appendix F). These graphs allowed a quick visual overview of the trends for each test
before a statistical analysis was performed. The key provided in Figure F.1 applies to each
graph. Note that the scales of each graph are not the same. As stated, the figures are
provided for overview of the trends and not for comparing subject performance. The
averages and comparisons are provided in Chapter 7 with the statistics and results. Table
6.1 provides the results for each subject. Bruce is the treadmill test, YMCA is the cycle test
and all others are step tests.
6.3 Actual and Estimated Oxygen Consumption
Three of the protocols, Bruce Treadmill Test, YMCA Cycle Test and Siconolfi's
Step Test, provided estimates of the oxygen consumed during their respective testing
period (see Table 3.1 for Bruce, Table 3.3 for YMCA and Equations 3.9-3.11 for
Siconolfi). Consumption values from two to four stages were then used in a linear
regression to calculate the predicted maximal oxygen consumption value for each subject.
Only stages in which the subjects' heart rates exceeded 110 bpm were used in the
calculations.
A second maximum value was calculated for each test (and subject) using the actual
value of oxygen consumed as recorded by the MMC. These oxygen values corresponded
48

Table 6.1
Performance Values for Each Subject (mllkg min)*
SUBJECf ASTRAND BRUCE COTTEN QUEEN SHARKEY SICONOLH YMCA
1 35.5 31.6 45.7 44.6 34.3 37.6 32.6 2 59.7 53.6 64.9 58.0 43.3 50.9 44.6 3 54.6 43.5 62.4 40.1 44.0 35.5 39.2 4 55.6 88.5 50.5 49.0 39.6 48.1 55.0 5 44.7 52.3 61.7 57.9 46.5 38.6 40.0 6 52.5 50.7 68.3 63.7 46.1 45.8 46.5 7 38.8 37.4 51.8 43.0 39.8 43.0 33.5 8 63.4 45.2 64.8 45.7 51.8 38.1 48.3 9 32.9 30.9 42.6 33.5 30.9 31.7 29.0
10 48.5 45.6 62.1 56.9 44.9 48.0 45.4 11 34.9 33.1 42.1 49.3 36.3 38.2 35.7 12 49.3 41.1 56.3 42.8 45.8 34.4 48.7 13 78.8 50.6 70.2 48.2 64.3 52.2 72.4 14 54.7 67.4 60.4 61.8 43.6 43.2 40.3 15 38.7 33.3 54.6 38.5 39.0 33.7 29.1 16 45.6 33.9 57.4 40.0 40.6 29.9 38.0 17 35.2 36.7 47.8 35.8 33.6 34.1 39.5 18 38.0 31.2 47.0 35.7 34.3 36.0 34.3
*Actual oxygen uptake values were used in the predictions for Bruce and YMCA
to the last minute of the stages (i.e., the third, sixth, ninth minutes, etc.) used in the
regression. Since the metabolic cart prints the oxygen consumption every twenty seconds,
the oxygen values used in the calculation were chosen from the last minute of each
workload. The example given (see Table 6.2) demonstrates the values used for each
prediction calculation. The sample printout from the metabolic cart (see Appendix E) can
be used to compare the numbers used in the Bruce protocol sample because it is from
subject fourteen. The numbers provided in the example are entered into a regression
equation to obtain the capacity estimates.
Figures 6.1 through 6.3 are plots of maximum V02 calculated from actual and
estimated oxygen consumption values for these three protocols. The values for each
subject are given in the plots and were used to demonstrate the differences obtained when
the two methods were used.
49

Table 6.2 Oxygen Consumption Values for Subject #14
Stage 02 uptake (mllkg) 02 uptake (ml/kg) HR Estimated
Bruce Protocol
3 4
YMCA Protocol
2 3 4
Siconolfi's
3
100
90
80
70
60
50
40
30
Actual from MMC
from Table 3.1
31.5 30.8 117 41.9 37.0 142
from Table 3.3
11.0 27.4 116 27.5 35.0 130 33 .0 44.1 146
from Eq. 3.12-3.14
33.0 31.2 114
BRUCE PROTOCOL-Actual vs Predicted (ml/kg min)
SUBJECTS
Figure 6.1
• ACTUAL
PREDICTED
Comparison of V02 max Obtained with Actual and Estimated 02 Uptake
50

YMCA PROTOCOL-Actual vs Predicted (ml/kg min)
80
70
60
so • ACTUAL
40 • PREDICTED
30
20
SUBJECTS
Figure 6.2
Comparison of VOl max Obtained with Actual and Estimated 02. Uptake
SICONOLFI PROTOCOL--Actual vs Predicted (ml/kg min)
so~---------------------------
50+-~--------------~.--------
40+4~~~~~~~~~--~-----
30+---~------~L-------~~L--
SUBJECTS
Figure 6.3
• ACTUAL
• PREDICTED
Comparison of VOl. Obtained with Actual and Estimated 02. Uptake
51
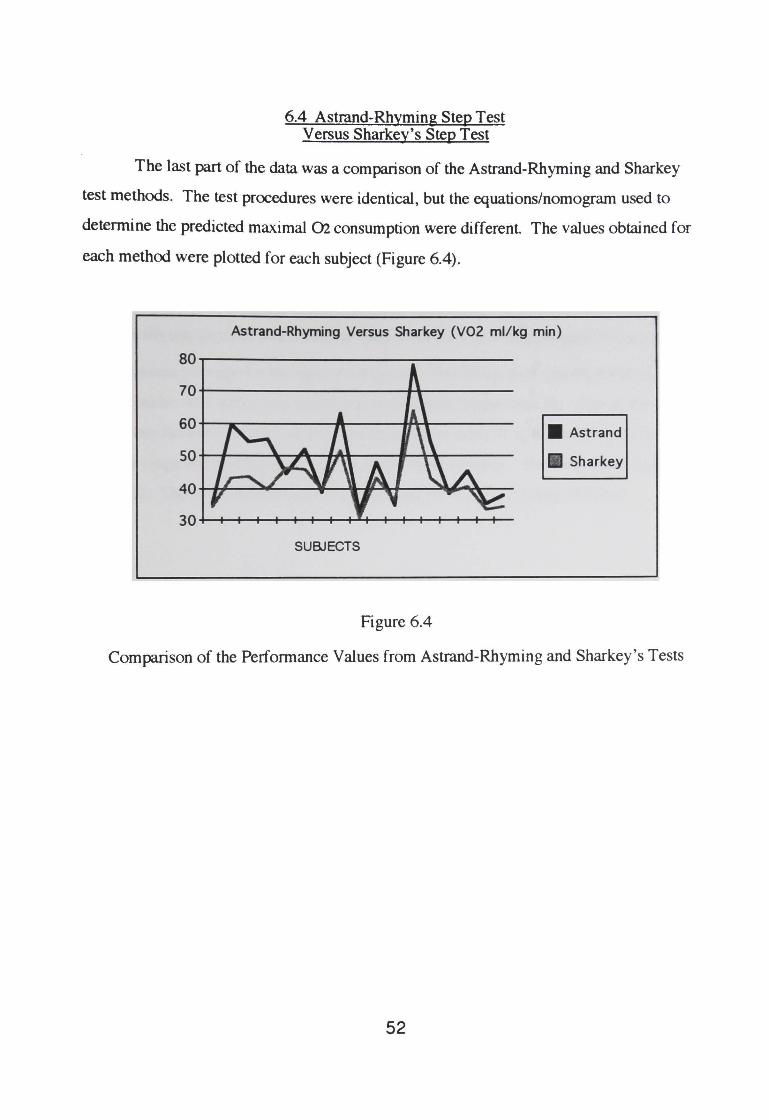
6.4 Astrand-Rhyming Step Test Versus Sharkey's Step Test
The last part of the data was a comparison of the Astrand-Rhyming and Sharkey
test methods. The test procedures were identical, but the equations/nomogram used to
determine the predicted maximal 02 consumption were different. The values obtained for
each method were plotted for each subject (Figure 6.4).
Astrand-Rhyming Versus Sharkey (V02 ml/kg min)
so~------------------~---------
70+-------------------~---------
60+---~------~A-----~~--------
50+-~--~~~~~----~~r-------
40~~--~----.--1~~~--~~~--
30+-+-~~~~-+-+~~~+-+-+-~~
SUBJECTS
Figure 6.4
• Astrand
• Sharkey
Comparison of the Performance Values from Astrand-Rhyming and Sharkey's Tests
52

7.1.1 Test Means
CHAPTER7
STATISTICS AND RESULTS
7.1 ANOV A for Comparison of Seven Tests
The ANOV A used to analyze the means of the seven tests was a randomized
complete block, blocking by subject (Table 7.1). Significant differences were noted
between the test protocol means and the subject means at a= 0.01. Figure 7.1 is a plot of
the test means (average for the eighteen subjects). The Cotten Step Test Protocol had the
highest mean, 56.1 mllkg min, which was forty percent higher than the value of the lowest
mean from Siconolfi's Step Test (40.0 mllkg min). In addition to the AN OVA, a Duncan's
multiple range test was run and the same results were obtained. These results are given in
Table 7.2. The means labeled with the same letter are not significantly different.
Table 7.1
RCB ANOV A for Seven Tests
Source df Sum Sguares Mean Sguare F-value P-value Total 125 15876.60
Test 6 3201.78 533.63 11.47 .0001
Subject 17 7931.35 466.55 10.03 .0001
Error 102 4743.47 46.50
53

60
so 40
V02 30
20
10
0
7.1.2 Gender
Mean Capacity Values (ml/kg min)
• Cotten
• Astrand
IIQJeen
IZJ Bruce
• Sharkey
mil YMCA
TESTS 1111 Siconolfi
Figure 7.1 Mean V02 max Values from Each Protocol
Table 7.2 Duncan's Multiple Range Test Results
Duncan's
A 8 8
CB CB CB c
Test Protocol
Cotten Step Astrand Step Queen Step Bruce Treadmill Sharkey Step YMCA Cycle Siconolfi Step
Figure 7.2 is a gender plot of the overall averages from the combined test values.
The males' capacity was 47.9 ml/kg min and the females' capacity was 43.5 ml/kg min, or
10% lower than the males. A plot of gender and test protocol interaction was completed
and demonstrates that interaction exists. Figure 7.3 shows that females performed better
on the cycle test, the Astrand-Rhyming step test and the Sharkey step test.
54

Gender Means (ml/kg min)
so
40
30 • Males V02
20 • Females
10
0
GENDER
Figure 7.2
Mean Capacity Values for Males and Females
Gender and Test Interaction (ml/kg min)
Bruce YMCA Shark Scc:nolfi Q.Jeen A.stra1d Cotten
TESTS
Figure 7.3
• Males
Females
Interaction Between Genders and Test Protocols
55

7.2.1 Bruce Protocol
7.2 Comparison of Metabolic Cart V02 Values and Estimated V 02 Values
A Randomized Complete Block was used to analyze the difference in the means of
maximal V02 obtained using the two methods described in Section 6.3. Table 7.3
provides the results from this ANOVA. The ANOVA and results from Duncan's test
showed significant differences, a= 0.01, between the two methods of obtaining predicted
maximal oxygen consumption. Figure 7.4 is a plot of the two means. The mean obtained
using the estimated value of 02 consumption was higher than the mean from actual uptake
values.
Source
Total Test Subject
Error
Table 7.3
ANOV A for Bruce
df Sum Sguares Mean Sguare F-value
35 11044.68 1 2062.67 2062.67 21.66
17 7362.76 433.10 4.55 17 1619.24 95.25
Bruce Protocol Comparison of V02 Prediction Methods (ml/kg min)
60
so 40
30 • Estimated Value
20 • Actual Value
10
0
METHOD
Figure 7.4
Comparison of V02 max Prediction Methods for Bruce Protocol
56
P-value
.0002
.0016
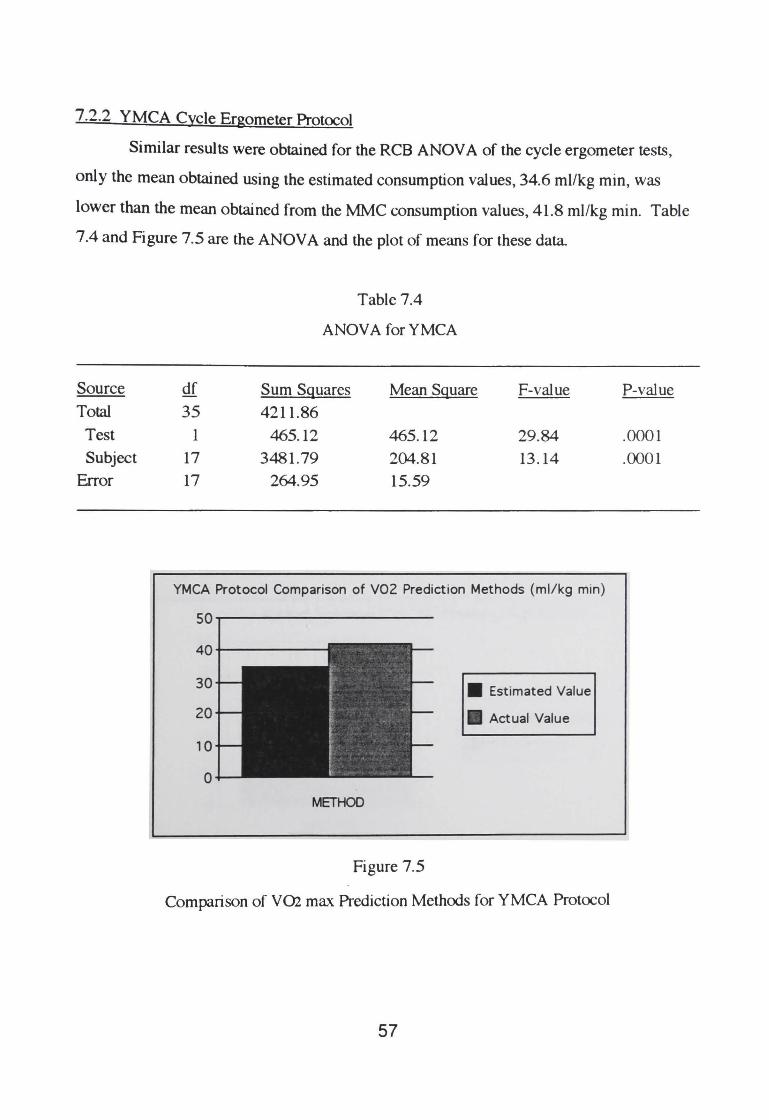
7.2.2 YMCA Cycle Ergometer Protocol
Similar results were obtained for the RCB ANOVA of the cycle ergometer tests,
only the mean obtained using the estimated consumption values, 34.6 ml/kg min, was
lower than the mean obtained from the MMC consumption values, 41.8 ml/kg min. Table
7.4 and Figure 7.5 are the ANOV A and the plot of means for these data
Source
Total
Test Subject
Error
df
35 1
17 17
Table 7.4
ANOV A for YMCA
Sum Sguares Mean Sguare 4211.86
465.12 465.12 3481.79 204.81
264.95 15.59
F-value
29.84 13.14
YMCA Protocol Comparison of VOZ Prediction Methods (ml/kg min)
I
• I
30
20
10
0
I I I
,,
I ~
• Estimated Value
t • Actual Value
I ' k
METHOD
Figure 7.5
Comparison of V02 max Prediction Methods for YMCA Protocol
57
P-value
.0001
.0001
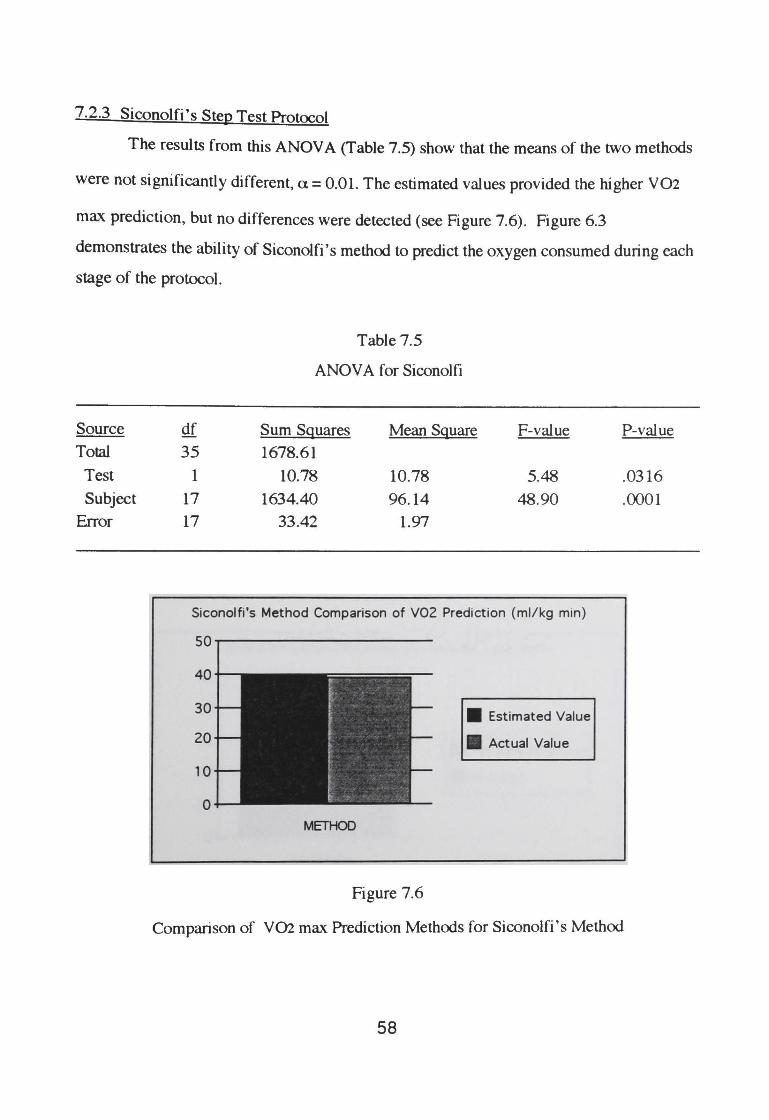
7.2.3 Siconolfi's Step Test Protocol
The results from this ANOVA (Table 7.5) show that the means of the two methods
were not significantly different, a= 0.01. The estimated values provided the higher V02
max prediction, but no differences were detected (see Figure 7.6). Figure 6.3
demonstrates the ability of Siconolfi's method to predict the oxygen consumed during each
stage of the protocol.
Source Total
Test
Subject Error
df 35
1 17 17
Table 7.5
ANOV A for Siconolfi
Sum Sguares Mean Sguare 1678.61
10.78 10.78 1634.40 96.14
33.42 1.97
F-value
5.48 48.90
Siconolfi's Method Comparison of V02 Prediction (ml/kg min)
40
30
20
10
0
• Estimated Value
• Actual Value
METHOD
Figure 7.6
P-value
.0316
.0001
Comparison of V02 max Prediction Methods for Siconolfi's Method
58

7.3 Astrand-Rhyming versus Sharkey
The experimental design for this analysis involved a randomized complete block,
blocking by subjects. Table 7.6 is the ANOV A results showing statistical difference
between the means of the methods, a= 0.01. Duncan's test was used and the results are
provided in Figure 7.7. The mean from the Astrand-Rhyming test was greater than the
mean from Sharkey's.
Source
Total
Test Subject
Error
df
35
1 17 17
40
30
20
10
0
Table 7.6
ANOVA for Astrand Versus Sharkey
Sum Sguares Mean Sguare F-value P-value
3865.71
322.20 322.20 17.37 .0006 3228.16 189.89 10.24 .0001
315.34 18.55
Means of Astrand-Rhyming and Sharkey's Methods
• Astrand-Rhyming
• Sharkey
METHODS
Figure 7.7
Comparison of Mean Capacity Values for Sharkey and Astrand-Rhyming Methods
59

CHAPTERS
CONCLUSIONS AND DISCUSSION
8.1 Conclusions
Based on the statistical and graphical analysis of the data from this research the
following conclusions were made:
(1) Differences between the predicted values of aerobic capacity from the five step
test methods are significant, p = 0.0001.
(2) Differences between predicted values of treadmill and step tests, and cycle
ergometer and step tests are significant, p = 0.0001.
(3) Differences between the means of results using actual 02 consumption values
(MMC) and estimated 02 consumption values are significant for the Bruce treadmill test
and the YMCA cycle ergometer test, p= 0.0002,0.0001 and 0.0316 respectively. No
differences were detected between the means for Siconolfi's methcxl, p = 0.0316.
(4) Differences between the means of V02 max obtained from the Astrand
Rhyming step test and Sharkey's step test are significant, p = 0.0006.
8.2 Discussion of Conclusions
8.2.1 Step Tests
The focus of this research was to identify if differences existed in the predicted
physical work capacity values obtained from the various submaximal step tests. Significant
differences were identified in the statistical analysis, but specific causes for these
differences are not known. It appears that when these tests were developed high
correlations with a treadmill or cycle ergometer test protocol were not enough justification
because that did not result in the step tests providing similar predictions. However, some
means were the same and need to be discussed.
60

The Cotten step test was significantly different from the four other step test
protocols, the YMCA cycle test and the Bruce treadmill test In 1974, Holland obtained a
correlation of 0.89 between predicted values of aerobic capacity from Astrand-Rhyming's
test and Heyward's equations for the Cotten step test. Results from this study were not in
agreement with Holland. Statistical differences were identified between these two tests in
this study as seen in Table 7.2. It is not surprising that the Cotten and Astrand-Rhyming
step tests provided values with statistical difference because the two tests' variables are not
the same. The Cotten test has a variable cadence, using a 17-inch bench and alternates
work and rest periods. Subjects "appeared" to work hardest on this test due to the bench
height and only one subject completed all 18 innings. However, Heyward's (Cotten test)
prediction of VOl max is based on heart rate (inning at which a subject attains a heart rate
of 150 beats per minute) and the subject's weight. The Cotten step test, a modification of
the Ohio State University Step Test, was developed to test high school students. This test
was terminated at 150 bpm because the researchers found that the linear pattern of heart rate
increase stopped at the point The equations used during this research were developed by
Heyward in 1984 and included body weight in the calculation.
The Astrand-Rhyming step test was developed as a modification of the Harvard
Step Test which was considered a maximal effort test. One hundred and twelve healthy
males and females were used to develop the nomogram; a simple way to approximate
aerobic capacity. It is performed at a constant workload and lasts only five minutes, but
uses the heart rate at the fifth minute of exercise and the body weight to obtain a prediction
from the authors' nomogram. The authors used heart rate and body weight based on
results of earlier studies which indicated that oxygen uptake could be calculated within a
range of ±6% when using these two variables. Even though both tests use heart rate and
body weight to obtain their respective predictions the resulting values were not similar.
The means from the A strand-Rhyming and the Queen's College step tests were not
statistically different. Queen's College test was developed for group testing in
gymnasiums which is also true of the Cotten test. However, the means of the Cotten and
Queen's tests were different. The procedures for these two tests are not similar: Queen's
is a constant workload test, Cotten is varied; Queen's changes cadence based on gender,
61

Cotten's cadence is independent of gender; Queen's is a three minute test, Cotten's duration
can be one to fifteen minutes. These differences and the fact that Queen's College uses a
post-exercise heart rate to predict VOl. max may explain why the two tests produced
significantly different results. In fact, when these discrepancies were eliminated, as with
the Astrand-Rhyming and Queen's College step tests, no differences were detected.
Gender specification, constant workloads and short durations are the common variables for
these two protocols.
This was also true of the Queen's College test and Sharkey's step method; no
differences were detected between the tests' means. The tests' durations are similar, both
use a constant workload, both measure post-exercise heart rates and each one is gender
specific. Sharkey's method adjusts the bench height and Queen's test adjusts cadence for
males and females.
The means of the last two step tests, Sharkey's method and Siconolfi's method,
were not significantly different from each other. Siconolfi's step test uses exercising heart
rate, 02 consumption and age in the prediction of aerobic capacity. Sharkey's method
includes post-exercise heart rates and approximated 02 consumption values to estimate
capacity. The only similarity is that Sharkey's method and Siconolfi's method are
modifications of the Astrand-Rhyming test No single variable can be identified as the
"connector" for these tests, but what is important to note is that the five tests produced
significantly different mean values of aerobic capacity.
Future research should focus on the variables involved in the prediction equations
by stratification of subjects to obtain a large range of values for the variable(s) investigated.
It was not possible to do this with the subjects participating in this project because the
variables used: age, weight, height and leg length were not easily stratified. The age range
was 20-44 years, the weights were 110-190 lbs and the heights were 5' 1 "-6' 1 ";not a wide
range for any variable. Subjects would have to be specifically chosen.
If step testing is done for preemployment evaluations a single protocol should be
chosen for all testing. The important issue in preemployment testing would not be
overprediction or underprediction, but it would be consistency. Consistency (test, retest
62

ability) would be necessary under these circumstances to produce comparisons among
subjects that would be fair.
8.2.2 Evaluation of Step. Treadmill and Cycle Ergometer Tests
The ANOV A results in Table 7.1 showed that differences existed in the means of
the seven submaximal tests. Duncan's multiple range test then identified which tests were
significantly different (Table 7.2). The Cotten step test was found to be significantly
different from all six remaining tests. This protocol was 25% higher than the Bruce
treadmill protocol, 34% higher than the YMCA cycle ergometer test and 17-40% higher
than the four other step tests. Table 2.1 demonstrates that treadmill tests normally produce
the highest prediction of aerobic capacity, followed by step tests and then cycling.
According to Table 2.1, VOl max values from treadmill running tests are as much as 23%
higher than cycling (upright) values and 18% higher than step test values. However, three
of the step tests, Cotten, Astrand-Rhyming and Queen's College, had predictions 5-25%
higher than the treadmill test. The two remaining step tests' means, Sharkey's method and
Siconolfi's method, were 6% and 12% lower than the Bruce treadmill mean which falls
within the range given by Astrand and Rodahl (1986).
The step tests with higher means may have been a result of the treadmill protocol
used. Subjects were able to walk during testing which may have lowered the prediction
values. No comparison between walking tests and step tests could be found. Another
study done in 1991 (Zwiren et al., 1991) reported that a submaximal step test overpredicted
aerobic capacity by 12% when compared to a maximal effort test done on a treadmill. The
step test used was the Astrand-Rhyming method.
In true maximal tests many studies have shown that cycle ergometer tests are 4-23%
lower than treadmill tests (Keren et al., 1980). In this study, the YMCA cycle ergometer
test mean was 7% lower than the treadmill mean which falls within the range given by
Keren et al.. Keren et al. ( 1980), when investigating submaximal tests, found that a
treadmill test was 6% higher than step tests and ergometer tests, but found no significant
differences in predictive values of cycle and step tests. Another study of maximal tests
63

(Siconolfi et al., 1985) reported step tests proouced V02 max estimates that were 12%
higher than maximal ergometer tests. Four of the five step tests had mean predictions
higher than the ergometer prediction mean.
Table 7.2 shows the YMCA values to be significantly different from the Cotten,
Astrand-Rhyming and Queen's College step tests, but not different (statistically) from
Sharkey and Siconolfi's methoos. As stated, four step methods had higher means (1-34%
higher) than the cycle ergometer test which would be expected since the weight of the b<Xly
is not involved and the arms are not moving during biking (less muscle mass working).
Siconolfi's step methoo proouced a lower mean than the YMCA (5%), but the difference
was not significant. It is possible that this method's results were lower because it was
developed for epidemiological studies of heart patients. Siconolfi's test used the lowest
bench height and cadence. It also included a one minute rest perioo between each change in
workload.
Table 2.1 states that step test capacity values are normally 1-5% higher than values
from cycling upright The percentages from this research are considerably higher due to
the Cotten step test Cotten's results were significantly different from all six remaining
tests of this study. This step test had the largest difference, 34%, and without this test the
percentages are more reasonable, 1-12% higher.
8.2.3 Gender Performance
In the literature review, it was stated and shown (Figures 2.1-2.3) that females
normally lag behind males in strength, oxygen uptake and maximum attainable heart rates.
On average a female's aerobic capacity is sixty-five to seventy-five percent of a males's
capacity. No specific information regarding gender performance in step tests was found,
but it was assumed that this pattern would also be true for bench stepping.
The males' average was only 10% higher than the females' when all of the tests
were included: 1% lower for the ergometer, 33% higher for the treadmill and 8% higher
for the step tests. Astrand and Rooahl (1986) reported values of 12% higher in cycling,
10% higher in treadmill and no trend was given for step tests. A majority of the females
were highly active: one distance runner ( 15+ miles), one competitive cyclist, one aerobics
64

instructor and six participating in regular exercise programs. This was not the case for the
male subjects; only three were participating in some type of exercise program. The means
of the tests reflect this: 47.9 mllkg min was an average to good fitness rating for men and
43.5 mllkg min was a good rating for the females. The physical condition of the females
may have contributed to the small difference in gender capacities and to the fact that the
women's mean capacity was actually higher than the men's for the cycle ergometer.
Some of the step test protocols altered the procedures for males and females.
Sharkey and Astrand-Rhyming both lowered step height for females, the Queen's College
test lowered the cadence for females. This could have lowered the heart rate for the female
subjects and all three of these tests used heart rate in their calculation of aerobic capacity-
lower heart rate meant higher capacity. Siconolfi and Cotten's methods used body weight
in their respective calculations. Since the equations calculating capacity subtracted the body
weight (multiplied by a factor), the values for females with lower body weight would be
higher than the values of males. Table 5.2 shows that the males of this study had an
average body weight approximately 48 pounds higher than the females. This may partially
explain why there was only an 8% difference in the means for males and females during the
step tests.
In the future subjects with varied physical conditions should be tested and males'
and females' fitness levels should be more balanced. As previously mentioned, the females
in this study were considerably more active compared to the males.
8.2.4 Estimated 02 Uptake Versus Actual 02 Uptake
No other research concerning the validity of the equations estimating oxygen uptake
was reviewed. The literature provided the equations, but did not justify them. The
equation for obtaining oxygen uptake during the Bruce treadmill protocol (Equation 3.4)
was simply a conversion from workload to oxygen consumption. It used the incline and
speed of the treadmill for the stage and multiplied it by a conversion factor. The estimated
values obtained during this research produced consistently higher predictions, 34%, than
the predictions from actual uptake values (as seen in Figure 6.1). In fact, some of the
values from estimated oxygen uptake produced unreasonable results; VOl max greater than
65

80 ml/kg min is reasonable only for elite athletes. When the estimated 02 uptake values
were used this discrepancy may have been due to the fact that the consumption estimations
remained constant regardless of the physical characteristics of the subject being tested.
Five of the subjects had unreasonable V02 max predictions when this method was used
(see Table 6.1). Since workload when running is calculated using body weight (Equation
3.1) it would seem reasonable to conclude that a heavier/lighter person would work at a
different level. Also, factors such as age and gender have been shown to influence oxygen
consumption.
Another possible cause of the differences may have been due to bad data points
when the actual 02 uptake values were used. Subject four had low heart rate values as seen
in Table 6.1 and obtained a predicted capacity of 88.5 ml/kg min. The Bruce protocol
suggests using heart rate values above 110 bpm in the regression. It is at this point that the
linear relationship between heart rate and oxygen consumption begins. In Figure 6.1 the
values from the estimates follow the same pattern as the actual values with the exception of
a few data points. The estimated values produce consistent results, but these results were
significantly higher than the results from actual oxygen consumption values.
The same is true of the YMCA cycle ergometer test. The method of obtaining
oxygen uptake at each workload is constant and independent of physical characteristics (see
Table 3.3) and resulted in significantly lower capacity predictions. Figure 6.2
demonstrates that only one subject had a V01. max value from actual 01. measurements that
was lower than the V01. max from estimated uptake. Table 7.4 and Figure 7.5 demonstrate
that the predictions were statistically different. Although body weight is not a factor in
cycling, the other characteristics could be important factors when determining oxygen
uptake for cycling. The validity of the estimated values is questionable because it seems to
consistently underestimate the amount of oxygen a person is utilizing while performing this
test.
The results from the comparison of Siconolfi's V01. max values showed that no
significant differences existed between estimated and actual values of 02 consumption (see
Figure 6.3 and Figure 7.6). This may be due to the fact that these uptake estimates include
the subject's body weight (Equations 3.12-3.14). It may be necessary to include body
66
weight and/or age and gender variables to correctly estimate the oxygen consumed.
The fact that the differences exist in the Bruce and YMCA methods may be a partial
cause of the differences in the overall means of step, treadmill and cycle ergometer tests.
Sharkey and Queen's College methods also use approximate values of 02 consumption in
their equations. Only one reference was found which discussed the use of oxygen
consumption estimates. Shephard ( 1966), after studying three submaximal tests ( a
treadmill test, a cycle test and a step test), stated that a smaller coefficient of variation was
found for aerobic capacity predictions when the oxygen consumed during the test was
measured instead of estimated. It may be necessary to further investigate the estimates
discussed for the Bruce Protocol and the YMCA Protocol and to include the subjects'
physical characteristics in these equations.
8.2.5 Comparison of Astrand-Rhyming and Sharkey's Methods
Sharkey's step test method was developed as a modification of the Astrand
Rhyming test to simplify the procedure and eliminate the need for a heart rate monitor.
When developing the test, Sharkey did obtain high correlations to the Astrand-Rhyming
test. The correlations were done on the heart rate values at the fifth minute of exercise and
at fifteen to thirty seconds post-exercise. Then equations were developed based on the
nomogram and the post-exercise heart rate. However, in this study significant differences
in the means of the two methods existed (see Table 7.6). The mean value obtained from
Astrand-Rhyming's method was higher than the mean value of Sharkey's method (Figure
7.6). Figure 6.4 also shows that Astrand-Rhyming's values were consistently higher for
each individual. Either the use of post-exercise heart rates or the equations Sharkey
developed caused the prediction to be significantly lower than Astrand-Rhyming's
predictions. The equations were not validated with respect to the Astrand-Rhyming
method, only the heart rate values were validated. The reasons for developing the
equations versus using the nomogram with the post-exercise values are unknown. The
nomogram is easy to use and may be duplicated simply by photocopy. It can be used for
group testing, especially if the heart rate is taken once the test is completed instead of
67

during the exercise. There does not appear to be enough reason to change the Astrand
Rhyrning method, but if it is modified the modification must not produce significantly
different values.
8.3 Recommendations
Since a maximal test was not performed, it is difficult to recommend a submaximal
test that best predicts aerobic capacity. However, the Astrand-Rhyming step test and
nomogram have been thoroughly investigated in the years since their development and the
results obtained from this method produced "reasonable" results for the sample population
of this research. A mean of 48.0 ml/kg min was obtained which, according to Katch and
McArdle (1983), corresponds to a high level of fitness for the women and an average to
good level of fitness for the men. Also the procedure for estimating maximal oxygen
uptake included subjects' ages, weights, gender and heart rates. None of the other tests
included all these variables which appear to affect the performance values. Based on this
information the Astrand-Rhyming step method would be recommended, but is made
without knowledge of the subjects' actual aerobic capacities. Future research should
focus on the variables mentioned and their relevance to aerobic capacity predictions. This
is where most of the differences in the test protocols exist because each test uses a different
combination of the subjects' characteristics.
68
REFERENCES
Anderson, C.K., 1988, "Strength and Endurance Testing for Preemployment Placement." In: ~MH: Understanding and Preventing Back Trauma. Ergonomics Comm. of the Amencan Industrial Hygiene Assoc., San Francisco, CA.
Ande~o~, C.K., 1990, "Impact of Physical Ability Testing on Worker Compensation lnJunes and Job Performance." Advanced Ergonomics, Inc., Established Leaders in Ergonomic Engineering. Dallas, TX.
Anderson, C.K. and M.J. Catterall, 1989, "A Prospective Validation of Pre-Employment Physical Ability Tests for Grocery Warehousing." Advances in Industrial Ergonomics and Safety I. Edited by Anil Mital, Taylor and Francis, London, pp. 57-63.
Ariel, G., 1969, "The Effect of Knee-Joint Angle on Harvard Step-Test Performance." Ergonomics, 12( 1): pp. 33-37.
Astrand, P.O. and I. Ryhming, 1954, "A Nomogram for Calculation of Aerobic Capacity (Physical Fitness) from Pulse Rate During Submaximal Work." Journal of Applied Physiology, 7: pp. 218-221.
Astrand, P.O., 1967, "Measurement of Maximal Aerobic Capacity." Canadian Medical Association Journal, 96: pp. 732-735.
Astrand, P.O. and K. Rodahl, 1986, Textbook of Work Physiology. McGraw-Hill Series in Health Ed., Physical Ed. and Recreation, New York.
Balke, B., 1963, "A simple field test for the assessment of physical fitness." CARl Report 63-6. Civil Aeromedical Research Institute, Federal Aviation Agency, Oklahoma City.
Bolter, C.P., and P. Coutts, 1987, "Incremental graded treadmill run to exhaustion as a measure of aerobic power." Journal of Sports Medicine, 27: pp. 449-451.
Carver, R.P. and F.R. Winsmann, 1970, "Study of measurement and experimental design problems associated with the step test." Journal of Sports Medicine, 10: pp. 104-113.
Chaffin, D.B., Herrin, G.D. and W. Keyserling, 1978, "Preemployment Strength Testing, An Updated Position." Journal of Occupational Medicine, 20(6): pp. 403-408.
Chahal, P., Lee, S. W., Oseen, M., Singh, M. and G. Wheeler, 1992, "Physical fitness and work performance standards: A proposed approach." International Journal of Industrial Ergonomics, 9: pp. 127-135.
Cooper, K.H., 1968, "A Means of Assessing Maximal Oxygen Intake." JAMA, 203(3): pp. 135-138.
Cotten, D.J., 19 , "A Modified Step Test for Group Cardiovascular Testing." Research Quarterly, 42(1): pp. 91-95.
69

Culpepper, M.I: and K.T. Francis, 1987, "An Anatomical Model to Determine Step Height m Step Testmg for Estimating Aerobic Capacity." Journal of Theoretical Biology, 129: pp. 1-8.
Doolittle, ~.L., 1989, "~erobic Testing for Manual Material Handling Jobs." Advances in Industnal Ergonomics and Safety I. Edited by Anil Mital. Taylor and Francis, London, pp. 105-112.
Doolittle, ~.L., 1989, "Selection Standards for Manual Material Handling Tasks Using D~am~c Strength Tests." Advances in Industrial Ergonomics and Safety I. Edited by Ami Mital, Taylor and Francis, London, pp 515-521.
Duggan, A., 1988, "Energy cost of stepping in protective clothing ensembles." Ergonomics, 31(1): pp. 3-11.
Hanne-Paparo, N., 1970, "Norms for a physical fitness test in the laboratory." Journal of Sports Medicine, 10: pp. 180-184.
Harvey, VP. and G.D. Scott, 1970, "The validity and reliability of a one-minute step test for women." Journal of Sports Medicine, 10: pp. 185-192.
Heyward, V.H., 1991, Advanced Fitness Assessment and Exercise Prescription, 2nd Ed. Human Kinetics Books, Champaign, IL.
Howe, B.L., Collis, M.L. and D. Docherty, 1973, "Validation of the UVic step test as a practical measure of cardio-vascular efficiency." Journal of Sports Medicine, 13: pp. 226-230.
Kasch, F.W., Phillips, W.H., Ross, W.O. and J.E. Lindsay Carter, 1965, "A Step Test for Inducing Maximal Work." The Journal of the Association for Physical and Mental Rehabilitation, 19: pp. 84-86.
Kasch, F.W., Phillips, W.H., Ross, W.O. and J.L. Boyer, 1965, "A comparison of maximal oxygen uptake by treadmill and step-test procedures." Journal of Applied Physiology, 21(4): pp. 1387-1388.
Katch, F.l., and W.O. McArdle, 1983, Nutrition. weight control and exercise, 2nd Ed. Lea and Febiger, Philadelphia.
Keen, E.N. and A.W. Sloan, 1958, "Observation on the Harvard Step Test." Journal of Applied Physiology, 13(2): pp. 241-243.
Keren, G., Magazanik, A. andY. Epstein, 1980, "A Comparison of Various Methods for the Determination of V02 max." European Journal of Applied Physiology, 45: pp. 117-124.
Kirkendall, Gruber and Johnson, 1987, Measurement and Evaluation for Physical Educators, 2nd Ed. Human Kinetics Publishers, Inc., Springfield, IL.
Kraemer, K.H.E., 1988, "Models, Methods, and Techniques for Personnel Testing and Selection." In MMH: Understanding and Preventing Back Trauma, Ergonimics Comm. of the American Industrial Hygiene Assoc., San Francisco.
70

Kurucz,_ R.L., Fox, E.L. and D.K. Matthews, 1968, "Construction of a submaximal cardtovascular step test." Research Quarterly, 40(1): pp. 115-122.
Maritz, ~.S., Morrison, J.F., Peter, J., Strydom, N.B. and C.H. Wyndham, 19 , "A Practtcal Method of Estimating an Individual's Maximal Oxygen Intake." Ergonomics, 4: pp. 97-119.
Marley, W.P. and A.C. Linnerud, 1975, "A Three-Year Study of the Astrand-Rhyming Step Test." Research Quarterly, 47(2): pp. 211-217.
Master, A.M. and I. Rosenfeld, 1961, ''The ''Two-Step" Exercise Test Brought Up to Date." The New York State Journal of Medicine. 61: pp. 1850-1857.
Matthews, D.K., 1974, Measurement in Physical Education. Edited by W.B. Saunders, Philadelphia
Montoye, H.J., A yen, T. and R.A. Washburn, 1986, "The Estimation of V02 max from Maximal and Sub-Maximal Measurements in Males, Age 10-39." TheResearch Quarterly for Exercise and Sport, 57(3): pp. 250-253.
Nagle, F.J., Balke, B. and J.P. Naughton, 1965, "Gradational step tests for assessing work capacity." Journal of Applied Physiology, 20(4): pp. 745-748.
National Institute for Occupational Safety and Health, 1981, Work Practices Guide for Manual Lifting, DHHS (NIOSH) Publication No. 31-122. U.S. Government Printing Office, Washington, D.C.
Reedy, J.D. and G.L. Saiger, 1954, U.S. Army medical Research Lab Report No. 140. U.S. Government Printing Office, Washington, D.C.
Ricci, B., Baldwin, K., Hakes, R., Fein, J., Sadowsky, D., Tufts, S. and C. Wells, 1966, "Energy Cost and Efficiency of Harvard Step-Test Performance." Int. Z. angew. Physiol. einschl. Arbeitsphysiol., 22: pp. 125-130.
Rovelli, E. and P. Aghemo, 1963, "Physiological characteristics of the Step exercise." Int. Z. angew. Physiol. einschl. Arbeitsphysiol., 20: pp. 190-194.
Rowland, K.M., Ferris, G.R., Fried, Y. and C.D. Sutton, 1988, "An Assessment of the Physiological Measurement of Work Stress." In: Occupational Stress: Issues and Development in Research, Edited by Hurrell, Murphy, Sauter and Cooper. Taylor and Francis, London.
Shanhawaz, H., 1978, "Influence of limb length on a stepping exercise." Journal of Applied Physiology, 44(3): pp. 346-349.
Shapiro, A., Shapiro, Y. and A. Magazanik, 1976, "A simple step test to predict aerobic capacity." Journal of Sports Medicine, 16: pp. 209-214.
Sharkey, B.J., 1974, Physiological fitness and weight control, Mountain Press Publishing Co., Missoula, MT.
71
Shephard, R.J., 1966, "The Relative Merits of the Step Test, Bicycle Ergometer, and ~readmill in the Assessment of Cardio-Respiratory Fitness." Int. Z. angew. Physiol. emschl. Arbeitsphysiol., 23: pp. 219-230.
Siconolfi, S.F., Garber, C.E .• Lasater, T.M. and R.A. Carleton, 1985, "A Simple, Valid Step ~est for Estimating Maximal Oxygen Uptake in Epidemiologic Studies. •• Amencan Journal of Epidemiology, 121: pp. 382-390.
Snook, S.H .• 1987, "Approaches to preplacement testing and selection of workers." Ergonomics, 30(2): pp. 241-247.
Tuxworth, V. and H. Shahnawaz, 1gn. "The Design and Evaluation of a Step Test for the Rapid Prediction of Physical Work Capacity in an Unsophisticated Industrial Work Force." Ergonomics, 20(2): pp. 181-191.
Witten, C., 1972, "Construction of a Submaximal Cardiovascular Step Test for College Females." Research Quarterly, 44( 1): pp. 46-49.
Zwiren, L.D .• Freedson, P.S., Ward, A., Wilke, S. and J.M. Rippe, 1991, "Estimation of V02 max: A Comparative Analysis of Five Exercise Tests." Research Quarterly for Exercise and Sport, 62(1): pp. 73-78.
72

APPENDIX A
UST OF SUBMAXIMAL STEP TEST PROTOCOLS
73

tvtE
TH
OD
F-E
MU
m
easu
re
Mar
gari
a
She
phar
d M
ax T
est
a m
ax
--
~
Sha
piro
pu
lse
max
.
Sha
hnan
az
stag
es.
Nag
le M
ax T
est
-M
aritz
Ast
rand
-Rhy
min
g he
art r
ate
pred
ict m
ax
Sha
rkey
m
easu
res
Tab
le A
.1
Par
tial
Lis
t of A
vail
able
Sub
max
imal
Ste
p T
ests
ST
EP
RA
TE
24
,30
15,2
5
10,
15,
20
20,
25
25
25
24
,30
6,1
2,2
4,3
0
22
.5
ST
EP
HE
IGH
T
14,1
7,20
in
--30
sec
of
wor
k, 2
0 se
c o
f re
st,
20 in
ning
s he
art r
ate
duri
ng r
est.
Cor
rela
te t
o B
alke
40
em
--2
, 5-m
inut
e te
sts.
P
ulse
mea
sure
d du
ring
rec
over
y.
Com
pare
d to
Ast
rand
cyc
le e
rgom
eter
test
Tw
o 9
inc
h st
eps
One
18
inch
ste
p --
mea
suri
ng 0
2 a
nd h
eart
rat
e. If
not
doi
ng
test
, us
e A
stra
nd-R
hym
ing
to p
redi
ct
25,3
2.5,
40
em--
Hol
d a
bar
at e
ye le
vel,
6 m
inut
es m
easu
re
afte
r 5
seco
nds
of
reco
very
. U
se A
stra
nd t
o pr
edic
t V
02
40 e
m
--30
-60%
of
lim
b le
ngth
at 5
% in
crem
ents
--5
min
ute
Per
form
max
cyc
le te
st t
o ob
tain
V0
2 m
ax
2-50
em
(va
riab
le)-
-app
roxi
mat
ely
20
min
utes
12 i
nch
--U
se A
stra
nd to
pre
dict
V0
2 m
ax (
He
is c
ritic
al o
f A
stra
nd's
ass
umpt
ions
40
em
-men
, 33
em-w
omen
--t
otal
of
5 m
inut
es, m
easu
re
duri
ng th
e la
st m
inut
e o
f exe
rcis
e.
Use
s a
nom
ogra
m t
o
Use
s A
stra
nd-R
hym
ing
met
hods
, bu
t dev
elop
ed e
quat
ions
for
pre
dict
ion
of
max
and
he
art
rate
15-
30 s
ec.
post
exer
cise
.

.....,J
V
'l
Tab
le A
.1 C
onti
nued
ME
fHO
D
Ker
en
Har
vard
Kas
ch
trea
dmil
l te
st,
U-V
ic
Sku
bic-
Hod
gkin
s
KS
U
Win
gate
lns
t.
Arm
y pe
rson
nel
OS
U (
Cot
ten)
Car
ver
ST
EP
RA
TE
24
to4
0-6
0
30
24
incr
ease
3-6
ste
p/m
in
17 i
ncre
ased
3 s
tep/
min
24
24
wor
k ra
tes:
900
kgm
/min
fo
r m
en,
660
-wom
en
20
24
,30
,36
ST
EP
HE
IGH
T
32
.5 e
m -
-Max
tes
t
20
inch
--
5 m
inut
e te
st.
Pul
se r
ate
coun
ted
1-1.
5, 2
-2.5
&
3-3.
5 po
st e
xerc
ise.
A
ssig
ned
a fi
tnes
s in
dex,
not
V0
2 m
ax
12 i
nch
--6-
12 m
inut
es.
Max
tes
t co
mpa
red
to a
max
r
= 0
.95
·
18 i
nch
--6
min
ute
test
. S
ubm
ax t
est,
stop
in
HR
rea
ches
16
0 o
r su
bjec
t can
not c
onti
nue.
T
est
for
infl
uenc
e o
f bo
dy
size
, w
eigh
t, t
ee.
not d
iscu
ssin
g pr
edic
tion
of
V0
2 m
ax
18 in
ch -
-3 m
inut
e te
st.
30
sec
pul
se r
ae t
aken
aft
er 1
min
. o
f re
st.
Obt
ain
a sc
ore
18 i
nch
--1
min
ute
test
20, 3
0, 4
0,
50
em
M
easu
ring
res
ting
pul
se a
nd b
lood
pre
ssur
e, e
xerc
isin
g an
d
reco
very
blo
od p
ress
ure.
30
.5 e
m -
-6
min
ute.
N
ot o
btai
ning
V0
2 m
ax, j
ust
mea
sure
V
02
sub
max
and
its
inc
reas
e w
ith
incr
ease
d cl
othi
ng
17 i
nch
--3
0 s
ec w
ork,
20
sec
res
t, 18
inn
ings
or
unti
l H
R
of
150.
M
easu
re p
ulse
5-1
5 se
c du
ring
res
t. S
core
giv
en
Dev
elop
ed a
n e
quat
ion
base
d on
lin
ear
rela
tion
ship
of
HS
T s
core
s an
d st
ep d
urat
ion
so th
at p
erso
ns n
ot c
ompl
etin
g te
st c
an b
e ev
alua
ted.
S
core
giv
en.
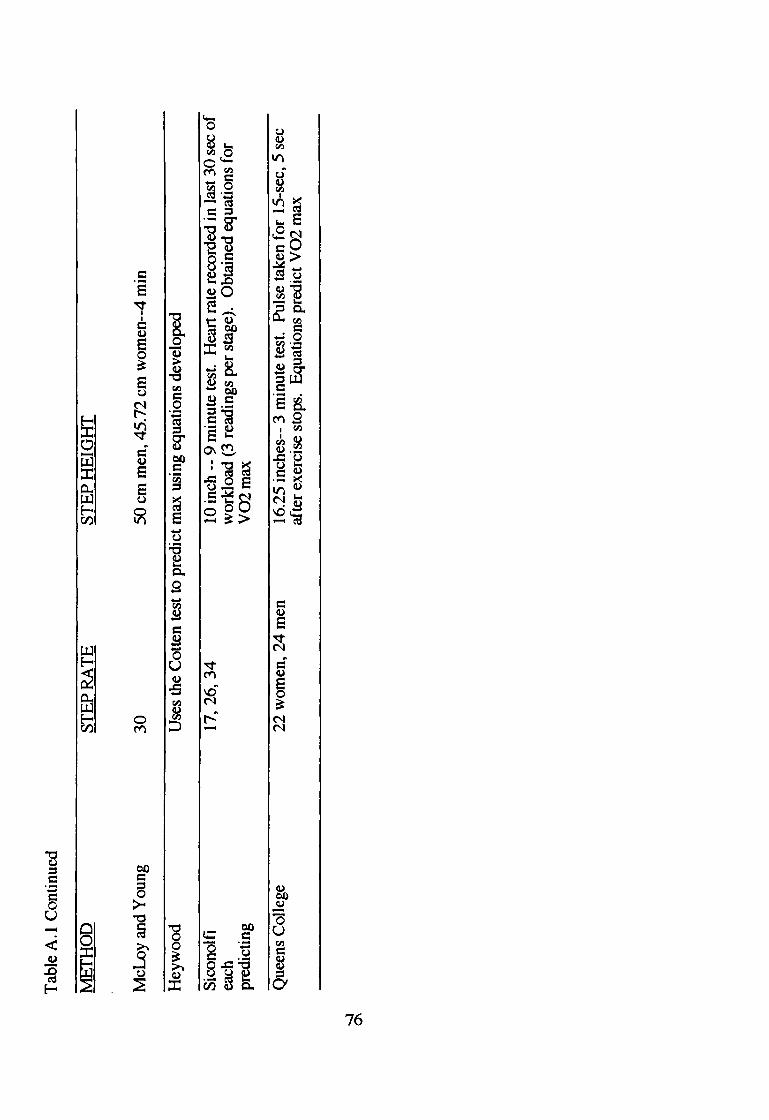
~
Tab
le A
.1 C
onti
nued
ME
fHO
D
MeL
oy a
nd Y
oung
Hey
woo
d
Sic
onol
fi
each
pr
edic
ting
Que
ens
Col
lege
ST
EP
RA
TE
S
TE
P H
EIG
HT
30
50
em
men
, 45.
72 e
m w
omen
--4
min
Use
s th
e C
otte
n te
st t
o pr
edic
t m
ax u
sing
equ
atio
ns d
evel
oped
17,
26,
34
22 w
omen
, 2
4 m
en
10 i
nch
--9
min
ute
test
. H
eart
rat
e re
cord
ed i
n la
st 3
0 se
c o
f w
orkl
oad
(3 r
eadi
ngs
per
stag
e).
Obt
aine
d eq
uati
ons
for
V0
2m
ax
16.2
5 in
ches
--3
min
ute
test
. P
ulse
tak
en f
or 1
5-se
c, 5
sec
af
ter
exer
cise
sto
ps.
Equ
atio
ns p
redi
ct V
02
max
APPENDIXB
SAMPLE OF DATA COLLECfiON SHEETS
77
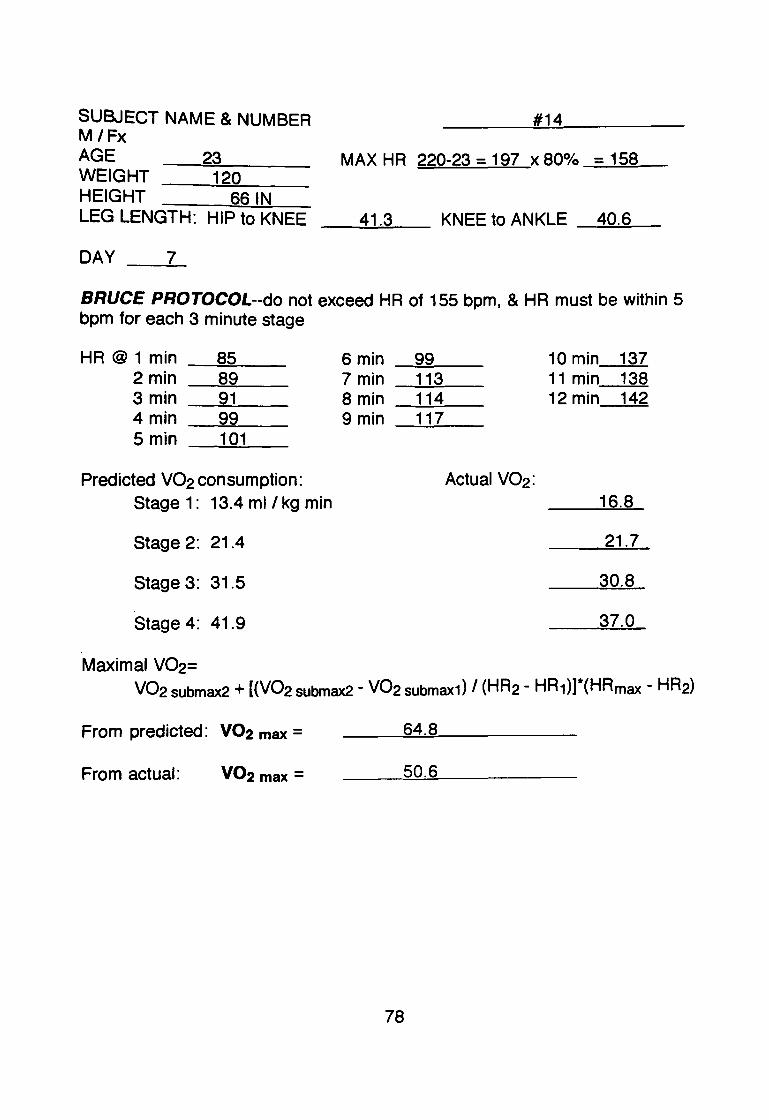
SUBJECT NAME & NUMBER M /Fx AGE --~2~3 ______ _ WEIGHT 120 HEIGHT 661N LEG LENGTH: HIP to KNEE
DAY 7
#14
MAX HR 220-23 = 197 x 80°/o = 158
41.3 KNEE to ANKLE 40.6
BRUCE PROTOCOL--do not exceed HR of 155 bpm, & HR must be within 5 bpm for each 3 minute stage
HR @ 1 min --....:8=5 __ 2 min __ ...,:8::.,:9 __ 3 min __ .....;:9'-'-1 __ 4 min __ ...,:9::..::9:.....-_ 5 min ___ 1;....;:;0~1 __
Predicted V02 consumption: Stage 1 : 13.4 ml/ kg min
Stage 2: 21 .4
Stage 3: 31.5
Stage4: 41.9
Maximal V02=
6 min ---!:9::..:9:.,...__ 7 min 113 8min 114 9 min 117
Actual V02:
10 min 137 11 min 138 12 min 142
16.8
21.7
30.8
37.0
V02 submax2 + [(V02 submax2- V02 submax1) I (HR2- HR1)]*(HAmax- HR2)
From predicted: V02 max = 64.8
From actual: 50.6
78
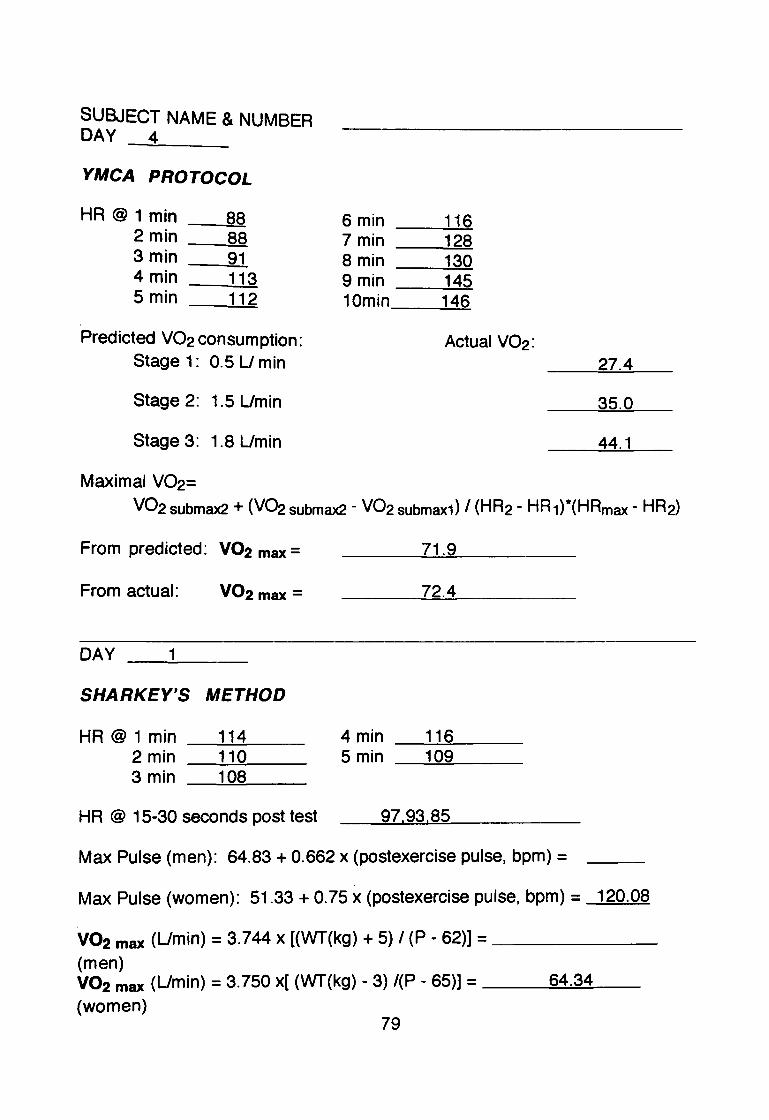
SUBJECT NAME & NUMBER DAY _4-=------
YMCA PROTOCOL
HR@ 1 min 2 min 3 min 4 min 5 min
88 88 91 113 112
Predicted V02 consumption: Stage 1: 0.5 U min
Stage 2: 1.5 Umin
Stage 3: 1.8 Umin
Maximal V02=
6 min __ 1!...,!1~6 7 min __ 1~2~8 8 min __ 1~3~0 9 min __ 1~4~5 10min __ 1~4~6
27.4
35.0
44.1
V02 submax2 + (V~ submax2- V02 submax1) I (HR2- HR1)*(HRmax- HR2)
From predicted: V02 max =
From actual:
DAY 1
SHARKEY'S METHOD
HR @ 1 min __ 1!....:1"--.:4 __ _ 2 min __ 1:....:1....::;0 __ _ 3 min _.......;1~0:..:::::8 __ _
HR @ 15-30 seconds post test
71.9
72.4
4 min ----=-1-=-16::::.-.---5 min ----=-1~09:!:!...---
97 93 85
Max Pulse (men): 64.83 + 0.662 x (postexercise pulse, bpm) =
Max Pulse (women): 51.33 + 0.75 x (postexercise pulse, bpm) = 120.08
V02 max (Umin) = 3.744 x [(WT(kg) + 5) I (P- 62)] = _____ _ (men) V02 max (Umin) = 3.750 x[ (WT(kg)- 3) I(P- 65)] = 64.34
(women) 79
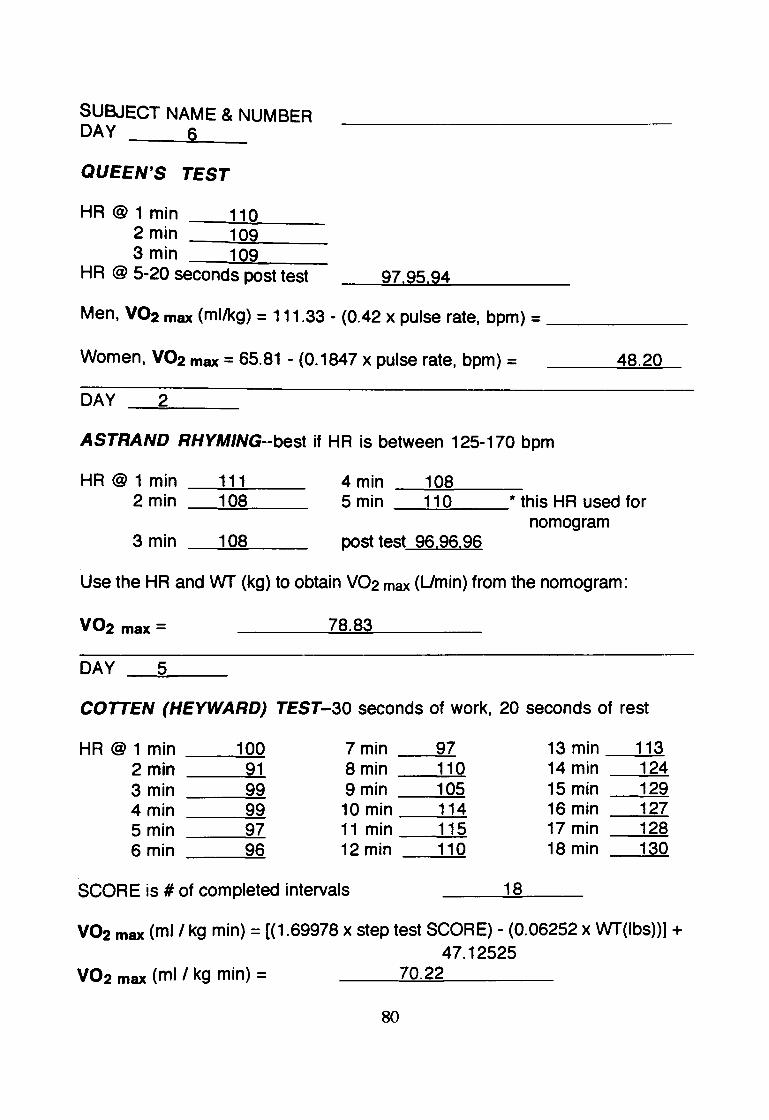
SUa.JECT NAME & NUMBER DAY 6
QUEEN'S TEST
HR@ 1 min 110 2 min 109 3 min 109
HR @ 5-20 seconds post test 97 95 94
Men, V02 max (ml/kg) = 111.33 - (0.42 X pulse rate, bpm) = _____ _
Women, V02 max= 65.81 - (0.1847 X pulse rate, bpm) = 48.20
DAY --=2=----
ASTRAND RHYMING--best if HR is between 125-170 bpm
HR @ 1 min _ _.1:.....:1....:..1 __ _ 4 min -......!.1~08~--2 min 108 5 min 11 0 * this HR used for
nomogram 3 min 108 post test 96.96.96
Use the HR and wr (kg) to obtain V02 max (Umin) from the nomogram:
vo2 max= 78.83
DAY --=5'------
COTTEN (HEYWARD) TEST-30 seconds of work, 20 seconds of rest
HR@ 1 min 100 7 min 97 13 min 113 2 min 91 8min 110 14 min 124 3 min 99 9min 105 15 min 129 4 min 99 10 min 114 16 min 127 5 min 97 11 min 115 17 min 128 6 min 96 12 min 110 18 min 130
SCORE is# of completed intervals 18
vo2 max (ml/ kg min) = [(1.69978 X step test SCORE) - (0.06252 X Wf(lbs))] + 47.12525
vo2 max (ml/ kg min) = ----.!...7~0-:...::2=2 ____ _
80
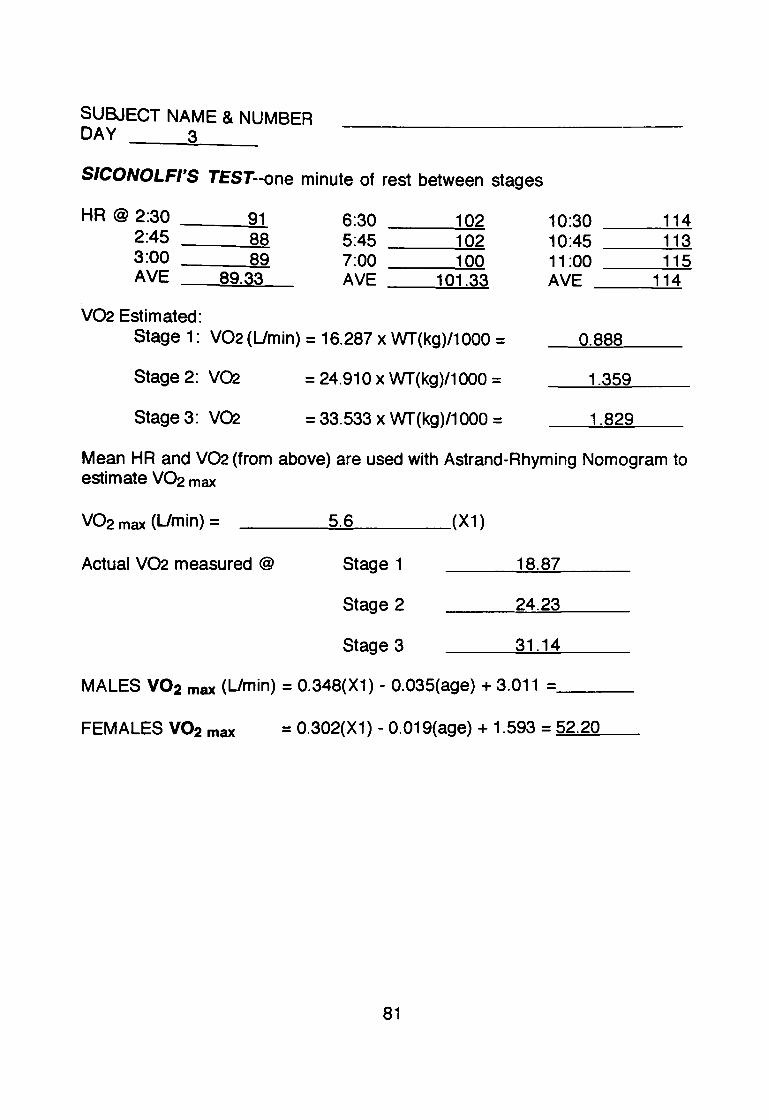
SUBJECT NAME & NUMBER DAY 3
SICONOLFI'S TEST--one minute of rest between stages
HR @ 2:30 --~9:::....:..1 2:45 88
--~=
6:30 102 ---~
5:45 102 ---~
1 0:30 ___ 1=--:1.....:..4 1 0:45 ___ 1=--:1-=3
3:00 89 ---..:::~
AVE ---=89:..:.·-=33:.-_ 7:00 100 ---~
AVE __ 1~0~1~.3~3 11 :00 ___ 1=--:1..=5 AVE ___ 1;.....;.1.....:..4
V02 Estimated: Stage 1 : V02 (Umin) = 16.287 x WT(kg)/1 000 = 0.888
Stage 2: V02.
Stage 3: V02.
= 24.910 X WT(kg)/1 000 =
= 33.533 X WT(kg)/1000 =
1.359
1.829
Mean HR and V02 (from above) are used with Astrand-Rhyming Nomogram to estimate vo2 max
V02 max (Umin) = ___ __;5~·~6 ____ (X1)
Actual V02 measured @ Stage 1
Stage 2
Stage 3
18.87
24.23
31.14
MALES V02 max (Umin) = 0.348(X1) - 0.035(age) + 3.011 =·---
FEMALES V02 max = 0.302(X1)- 0.019(age) + 1.593 = 52.20
81

APPENDIXC
INFORMATION SHEEr AND CONSENT FORM
82
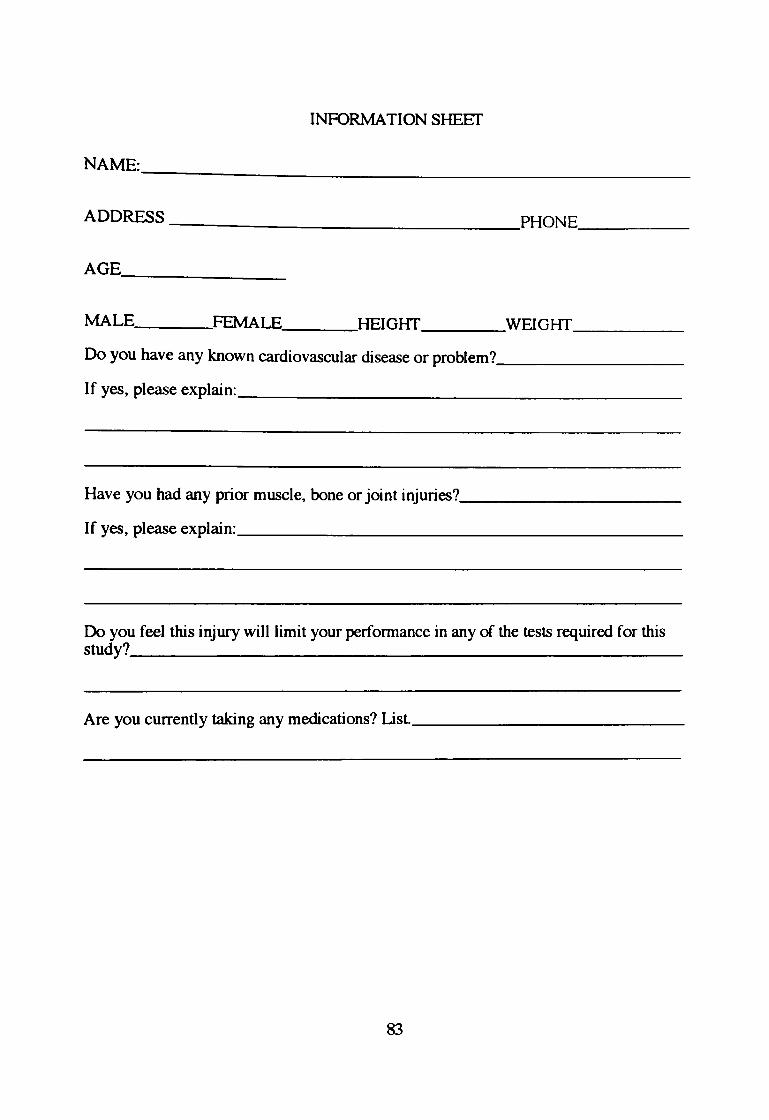
INFORMATION SHEEr
NAME: ______________________ _
ADDRESS ________________________________ PHONE ________ __
AGE. _______ _
MALE. ______ FEMALE. ____ HEIGHT ____ WEIGHT ________ __
Do you have any known cardiovascular disease or problem? ________ _
If yes, please explain: _____________________ _
Have you had any prior muscle, bone or joint injuries? __________ _
If yes, please explain: _____________________ _
Do you feel this injury will limit your performance in any of the tests required for this study? __________________________ __
Are you currently taking any medications? List ______________ _
83
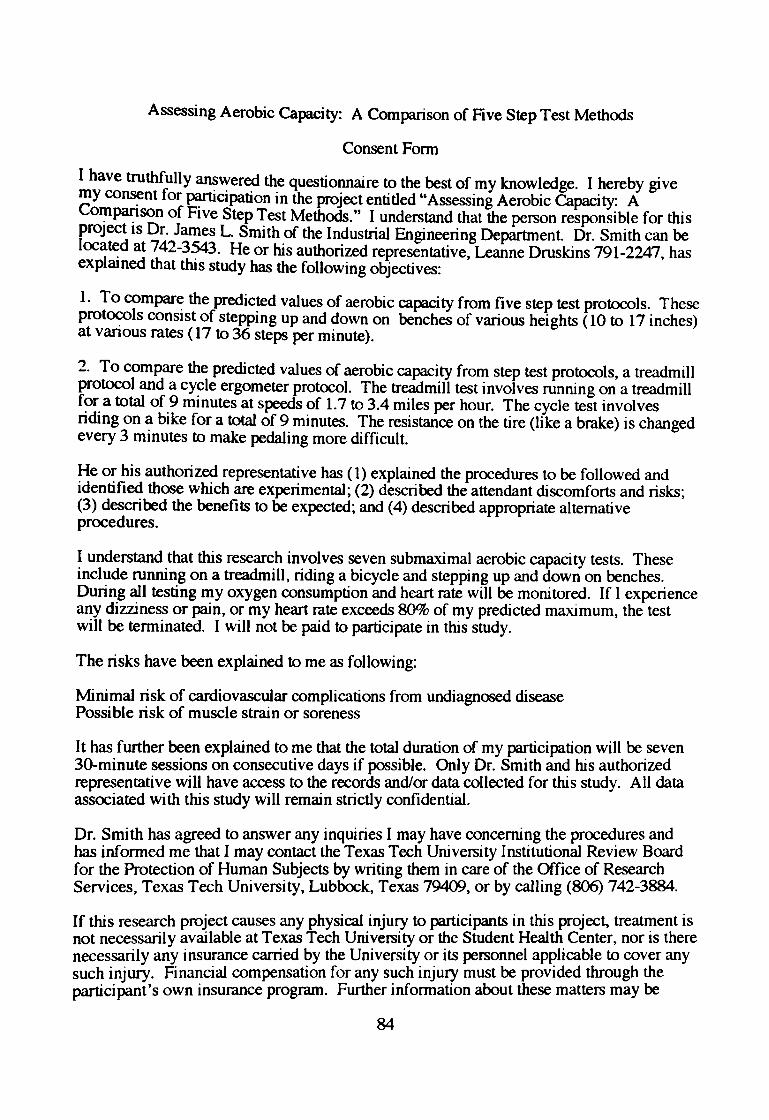
Assessing Aerobic Capacity: A Comparison of Five Step Test Methods
Consent Fonn
I have truthfully an~~er~ t~e questionnaire to the best of my knowledge. I hereby give my co~nt for ~c1pat1on m the project entitled "Assessing Aerobic Capacity: A Co~J>ai:Ison of Five Step Test Methods." I understand that the person responsible for this proJect IS Dr. James L. Smith of the Industrial Engineering Department. Dr. Smith can be locatt:d at 742-3~3. He or his authorized representative, Leanne Druskins 791-2247, has explamed that this study has the following objectives:
1. To compar~ the predicted values of aerobic capacity from five step test protocols. These prot<X?Ols cons1st of stepping up and down on benches of various heights ( 10 to 17 inches) at vanous rates (17 to 36 steps per minute).
2. To compare the predicted values of aerobic capacity from step test protocols, a treadmill protocol and a cy~le ergometer protocol. The treadmill test involves running on a treadmill f~r. a total of_9 mmutes at speeds of 1.7 to 3.4 miles per hour. The cycle test involves nding on ':1 bike for a total of 9 minutes. The resistance on the tire (like a brake) is changed every 3 mmutes to make pedaling more difficult.
He or his authorized representative has ( 1) explained the procedures to be followed and identified those which are experimental; (2) described the attendant discomforts and risks; (3) described the benefits to be expected; and (4) described appropriate alternative procedures.
I understand that this research involves seven submax.imal aerobic capacity tests. These include running on a treadmill, riding a bicycle and stepping up and down on benches. During all testing my oxygen consumption and heart rate will be monitored. If I experience any dizziness or pain, or my heart rate exceeds 80% of my predicted maximum, the test will be tenninated. I will not be paid to participate in this study.
The risks have been explained to me as following:
Minimal risk of cardiovascular complications from undiagnosed disease Possible risk of muscle strain or soreness
It has further been explained to me that the total duration of my participation will be seven 30-minute sessions on consecutive days if possible. Only Dr. Smith and his authorized representative will have access to the records and/or data collected for this study. All data associated with this study will remain strictly confidential.
Dr. Smith has agreed to answer any inquiries I may have concerning the procedures and has informed me that I may contact the Texas Tech University Institutional Review Board for the Protection of Human Subjects by writing them in care of the Office of Research Services, Texas Tech University, Lubbock, Texas 79409, or by calling (806) 742-3884.
If this research project causes any physical injury to participants in this project, treatf!Ient is not necessarily available at Texas Tech University or the Student Health Center, nor IS there necessarily any insurance carried by the University or its personnel applicable to cover any such injury. Financial compensation for any such injury must be provided through the participant's own insurance program. Further infonnation about these matters may be
84

obtained from Dr. Robert M. Sweazy, Vice Provost for Research, (806) 742-2884, Room 203 Holden Hall, Texas Tech University, Lubbock, Texas 79409-1035. I understand that I may not derive therapeutic treatment from participation in this study. I understand that I may discontinue this study at any time I choose without penalty.
Signature of Subject. ______________________ _
Date: ______ _
Signature of Parent/Guardian or Authorized Representative (if required):
Date: ·--------
Signature of Project Director or his Authorized Representative:
Date: ______ _
Signature of Witness to Oral Presentation:
Date:. ______ _
85

APPENDIXD
NarES ON SUBJECTS' PHYSICAL CONDITION
86
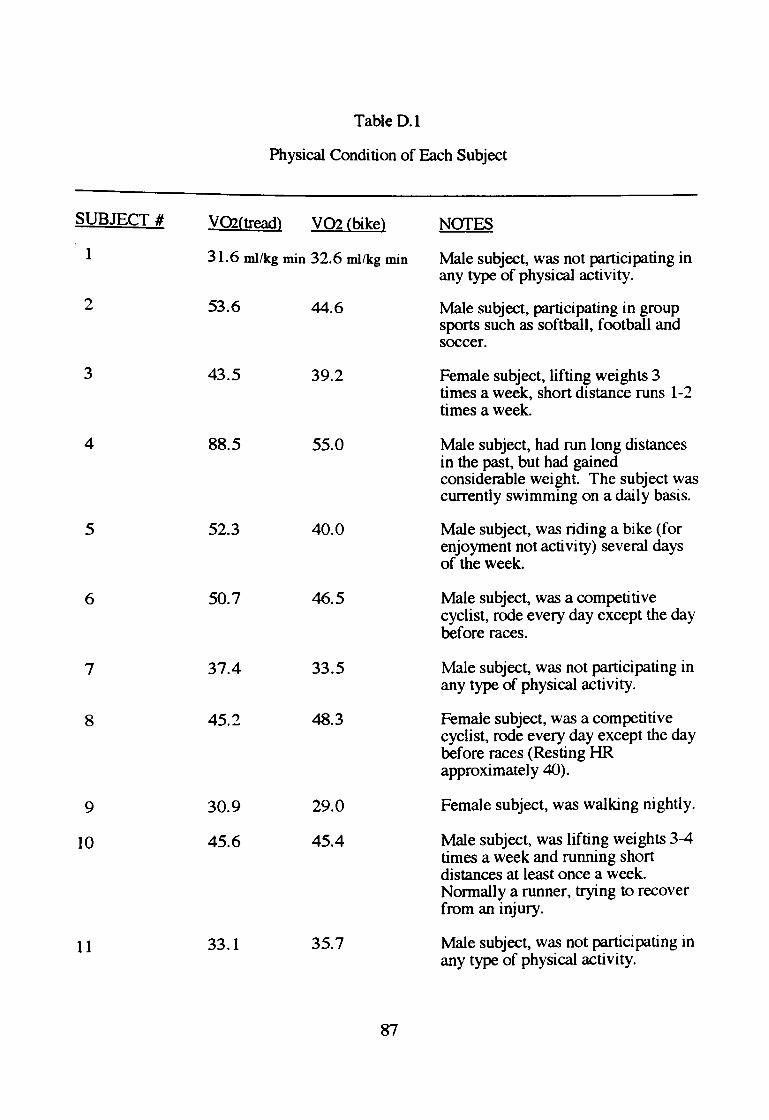
Table D.1
Physical Condition of Each Subject
SUBJECT# V02(tread) V02 (bike) NOTES
1 31.6 ml/kg min 32.6 ml/kg min Male subject, was not participating in any type of physical activity.
2 53.6 44.6 Male subject, participating in group sports such as softball, football and soccer.
3 43.5 39.2 Female subject, lifting weights 3 times a week, short distance runs 1-2 times a week.
4 88.5 55.0 Male subject, had run long distances in the past, but had gained considerable weight. The subject was currently swimming on a daily basis.
5 52.3 40.0 Male subject, was riding a bike (for enjoyment not activity) several days of the week.
6 50.7 46.5 Male subject, was a competitive cyclist, rode every day except the day before races.
7 37.4 33.5 Male subject, was not participating in any type of physical activity.
8 45.2 48.3 Female subject, was a competitive cyclist, rode every day except the day before races (Resting HR approximately 40).
9 30.9 29.0 Female subject, was walking nightly.
10 45.6 45.4 Male subject, was lifting weights 3-4 times a week and running short distances at least once a week. Normally a runner, trying to recover from an injury.
11 33.1 35.7 Male subject, was not participating in any type of physical activity.
87
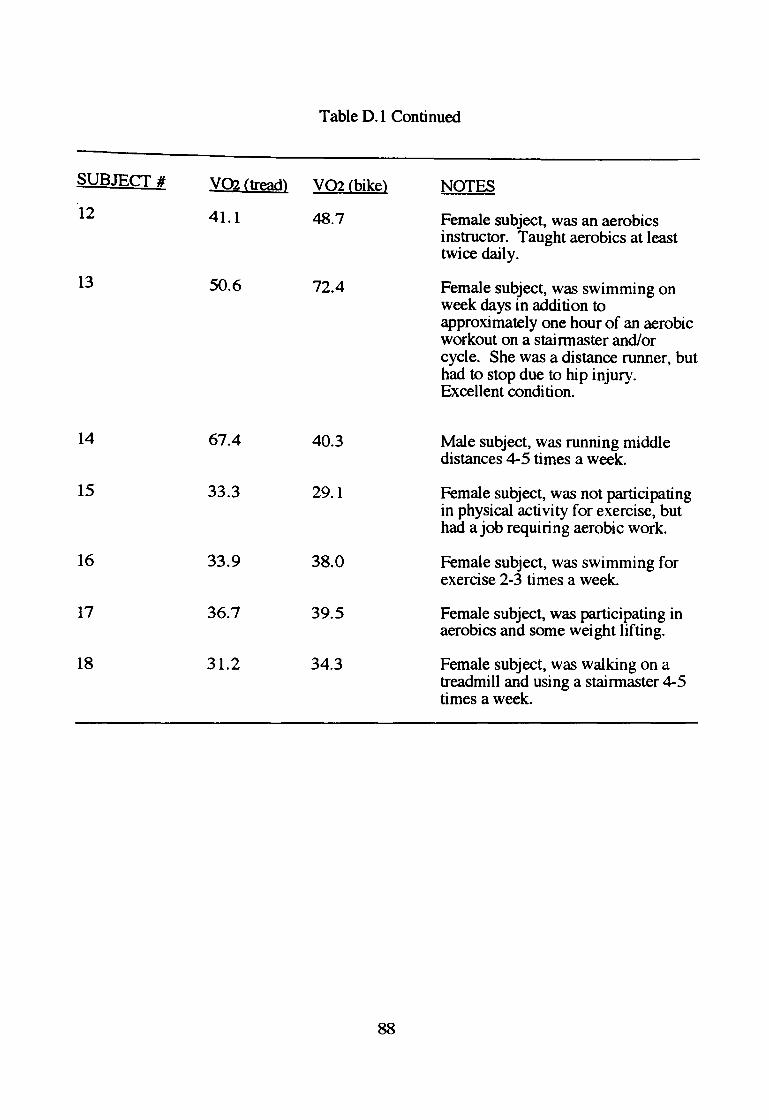
Table 0.1 Continued
SUBJEcr # VOl (tread) V02 (bike) NOTES
12 41.1 48.7 Female subject, was an aerobics instructor. Taught aerobics at least twice daily.
13 50.6 72.4 Female subject, was swimming on week days in addition to approximately one hour of an aerobic workout on a stairmaster and/or cycle. She was a distance runner, but had to stop due to hip injury. Excellent condition.
14 67.4 40.3 Male subject, was running middle distances 4-5 times a week.
15 33.3 29.1 Female subject, was not participating in physical activity for exercise, but had a job requiring aerobic work.
16 33.9 38.0 Female subject, was swimming for exercise 2-3 times a week.
17 36.7 39.5 Female subject, was participating in aerobics and some weight lifting.
18 31.2 34.3 Female subject, was walking on a treadmill and using a stairmaster 4-5 times a week.
88
APPENDIXE
SAMPLE OF MlvfC PRINfOliT
89
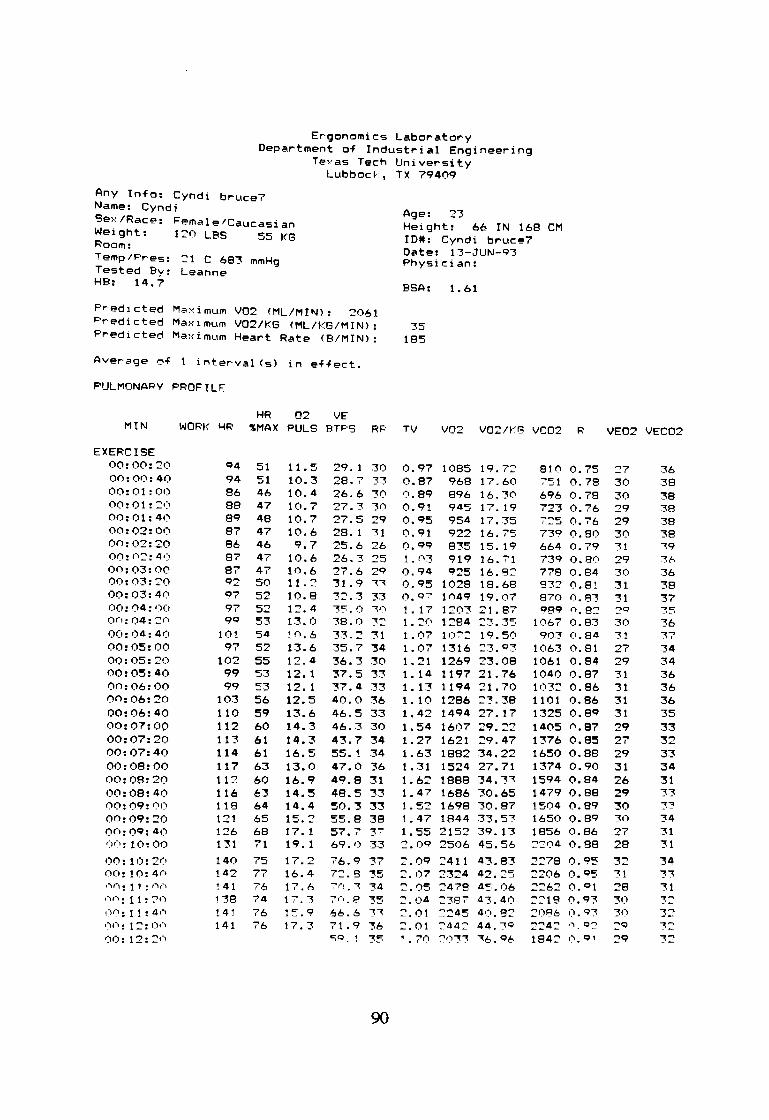
Ergonomics Laboratory Department of Industrial Engineering
Te~as Tech University Lubboc~ , TX 79409
Any Info: Cyndi bruce? Name: Cyndi Sex/Race: Female/Caucasian Weight: 120 LBS 55 KG Room: Temp/Pres: ~1 C 683 mmHg Tested Bv: Leanne HB: 14.7
Predicted Maximum V02 IML/M!Nl: 2061 Predicted Maximum V02/KG CML/KG/MINl: Predicted Maximum Heart Rate IB/MIN>:
Average of 1 intervalCs) in effect.
PULMONARY PROFILE
HR 02 VE
Age: 23 Height: 66 IN 168 CM ID#: Cyndi bruce? Date: 13-JUN-Q3 Physician:
BSA: 1.61
185
MIN WORK ~R %MAX PULS BTPS RP TV V02 V02/KG VC02 R
EXERCISE 00:00:20 00:00:40 00:01:00 00:01: ~ 1)
00:01:40 00:02:00 00:02:20 00: 0~: 4,-l
00:03:00 00:03::'0 00:03: 4(• 0(1: 04: 1)(1
00:04:~('
00:1)4:40 00:05:00 00:05:20 00:05:40 00:06:00 00:06:20 00:06:40 00:07:00 00:07:20 00:07:40 00:08:00 00:08:20 00:08:40 00:09: 1)0 00:09:20 00:09:40 <)(•: 10:00
00: 10: 2(>
00: 10: 4<• rir">: 1 1: ri(l I~H-l: 11 : ~f-) (l<i: 1 1 : 4n <)(•: 1 2: l)(l ')0: 12: :2n
94 51 94 51 86 46 88 47 89 48 87 47 86 46 87 47 87 47 92 50 97 52 97 52 9Q 53
10! 54 97 52
102 55 99 53 99 53
103 56 110 59 112 60 113 61 114 61 117 63 112 60 116 63 118 64 121 65 126 68 131 71
140 75 142 77 141 76 1 '38 74 141 76 141 76
11.5 10.3 10.4 10.7 10.7 10.6 9.7
10.6 10.6 11.2 10.8 12.4 13.0 !0.6 13.6 12.4 12. 1 12. 1 12.5 13.6 14.3 14.3 16.5 13.0 16.9 14.5 14.4 15.2 17. 1 19. 1
17.2 16.4 17.6 17.3 1~.9
17.3
29.1 30 28.7 T3 26.6 30 27.3 ~7.5
30 29
28.1 31 25.6 26 26.3 25 27.6 29 31.9 33 3:'.3 33 30::.0 ,,, 38.0 3::' 33.2 '31 35.7 34 36.3 30 37.5 33 37.4 33 40.0 36 46.5 33 46.3 30 43.7 34 55.1 34 47.0 36 49.8 31 48.5 33 50.3 33 55.8 38 57.7 37' 69. 1) 33
76.9 37 7~.9 '35 7r"l, 3 34 7t·\. 8 '35 66.6 3""1 71.9 36 so. '35
90
0.97 1085 19.7::' 0.87 968 17.60 <), 89 896 16.30 0.91 945 17.19 0.95 954 17.35 0.91 9"" 16.75 0.99 835 15.19 1 J•3 919 16.71 0.94 925 16.8::' 0.95 1028 18.68 0.<;>7 1fl49 19.07 1 . 1 7 1203 21 . 87 1. ::'(• 1284 23.35 1 . 07 1 07::' 19. 50 1.07 1316 23.Q3 1. 21 1269 23.08 1.14 1197 21.76 1.13 1194 21.70 1.10 1286 23.38 1.42 1494 27.17 1.54 1607 29.22 1.27 1621 29.47 1.63 1882 34.22 1 • 31 1524 27. 71 1.62 1888 34.33 1.47 1686 30.65 1.52 1698 30.87 1.47 1844 33.53 1. 55 2152 39.13 2.0<;> 2506 45.56
2.09 2411 43.83 ::'.07 2324 42.::'5 ::'.05 2478 45.06 2.04 2387 43.40 ::'.01 ::'~45 4•).82 ::'.01 ::'44::' 44.3<;> 1. 70 :::'1)33 36. 9(::.
810 0.75 751 0.78 696 0.78 723 0.76 7~5 0.76 739 0.80 664 0.79 739 0.80 778 0.84 932 0.8! 870 0.83 <;>89 ''· 8:'
1067 0.83 9()' (•. 84
1063 0.81 1061 0.84 1040 0.87 103::' 0.86 1101 0.86 1325 0.8<;1 1405 0.87 1'376 0. 85 1650 0.88 1374 0. 90 1594 0.84 1479 0.88 1504 0.89 1650 0.89 1856 0.86 ::?:?t)4 o. 88
2278 0.95 2206 0.<;>5 2262 0.<;>1 ::':::'18 0.93 2086 (l.Q-;'1
2~4~ '"'· Q~ 184:? 1:'>, q,
VE02 VEC02
:::'7 30 30 29 29 30 31 29 '30 31 31 :::'Q 30 31 27 29 31 31 '31 31 29 27 29 31 26 29 30 30 27 28
32 31 28 30 30 2Q 29
36 38 38 38 38 38 39 3t-36 38 37 35 36 37 34 34 36 36 36 35 33 32 33 34 31 33 33 34 31 31
34 3"3 31

APPENDIX F
RAW DATA FROM SUBJECTS
91

AEROBIC CAPACITY (ml/kg min) SUBJECT 11
• ASTRAND
• BRUCE
30 COTTEN
20 EJ QL£EN
10 • SHARKEY
Ill SICONOLFI 0
TESTS • YMCA
Figure F. I Capacity Values for Subject 1
EROBIC CAPACITY (ml/kg min) SUBJECT #2
70~---------------60 so 40 30 20 10
0 TESTS
Figure F.2 Capacity Values for Subject 2
EROBIC CAPACITY (ml/kg min) SUBJECT#
90
70
so 30
10
TESTS
--------------------------~
Figure F.4 Capacity Values for Subject 4
92
EROBIC CAPACITY (ml/kg min) SUBJECf #3
70~---------------60+---t so 40 30 20 10
0 TESTS
Figure F.3 Capacity Values for Subject 3
EROBIC CAPACITY (mllkg min) SUBJECT #5
TESTS
Figure F.5 Capacity Values for Subject 5

EROBIC CAPACITY (ml/kg min) SUB.JECr #6
70-r----60-t---so 40 30 20 10
0 TESTS
Figure F.6 Capacity Values for Subject 6
AEROBIC CAPAOTY (mllkg min) SUBJECT #8
70.----------------60 so 40 30 20 10
0 TESTS
Figure F.8 Capacity Values for Subject 8
AEROBIC CAPACITY (ml/kg min) SUBJECT #10
70~-----------------60+----S0+==---40 30 20 10
0 TESTS
Figure F.10 Capacity Values for Subject 10
93
EROBICCAPAOTY (ml/kg min) SUBJECT #7
60~----------------
50+---40 30 20 10 0
TESTS
Figure F.7 Capacity Values for Subject 7
AEROBIC CAPACITY (mllkg min) SUBJECT #9
so~---------------
40+---30 20 10
0 TESTS
Figure F.9 Capacity Values for Subject 9
AEROBIC CAPACITY (ml/kg min) SUBJECT #11
so~-----------------
40+-----
30 20 10 0
TESTS
Figure F.11 Capacity Values for Subject 11
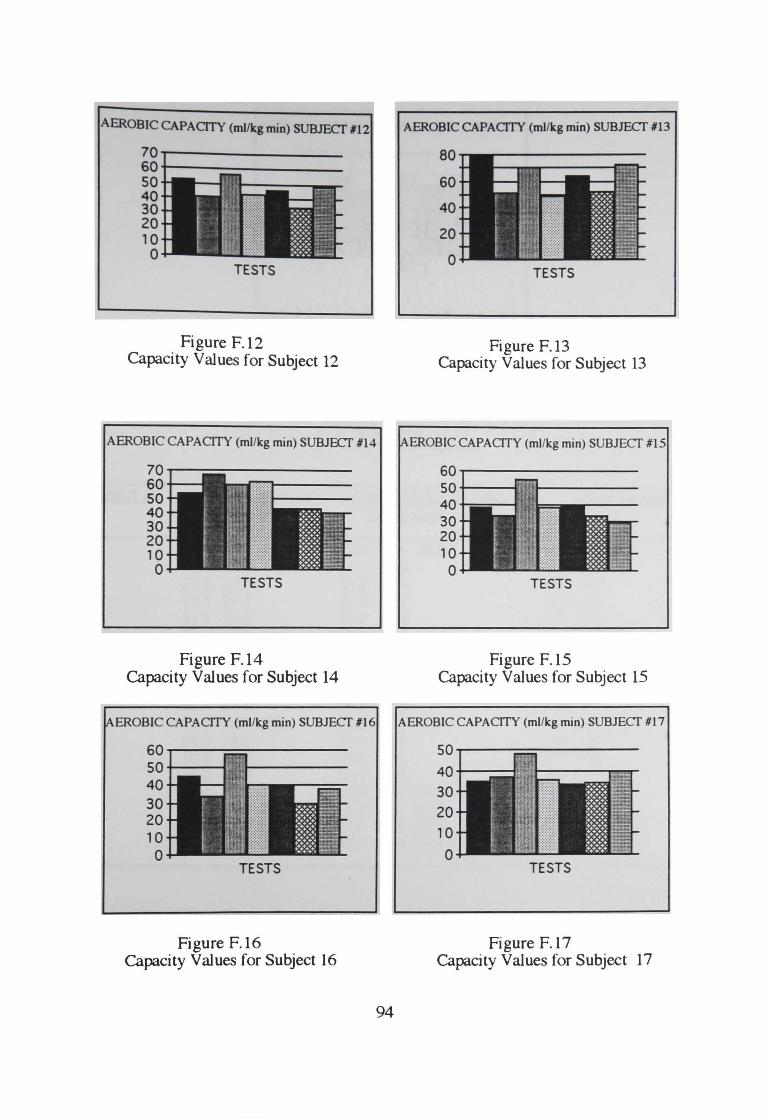
AEROBIC CAPACITY (ml/kg min) SUBJECT #12
70r---------------so.---~~--------so 40 30 20 10
0 TESTS
Figure F. l2 Capacity Values for Subject 12
AEROBIC CAPACITY (ml/kg min) SUBJECf #14
70r-~==------------60 so 40 30 20 10
0 TESTS
Figure F.l4 Capacity Values for Subject 14
EROBIC CAPACITY (ml/kg min) SUBJECf #16
so~----==~--------so +-----i~
40 30 20 10
0 TESTS
Figure F.l6 Capacity Values for Subject 16
94
AEROBIC CAPACITY (ml/kg min) SUBJECf #13
80
60
40
20
0 TESTS
Figure F.l3 Capacity Values for Subject 13
EROBIC CAPACITY (ml/kg min) SUBJECf #15
GOr-----------------50+----40 30 20 10
0 TESTS
Figure F.15 Capacity Values for Subject 15
AEROBIC CAPACITY (ml/kg min) SUBJECf #17
so~--~==----------
40+-----r·.::•ij··r-------30 20 10
0 TESTS
Figure F.17 Capacity Values for Subject 17
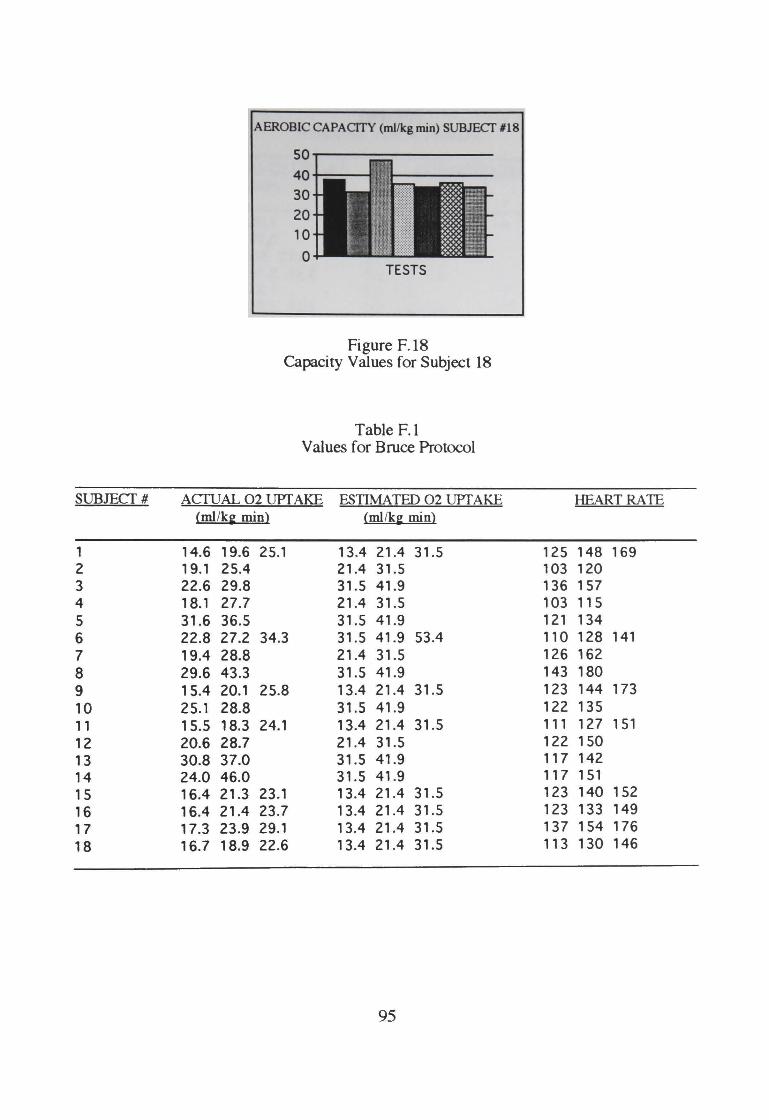
SUBJECf#
1 2 3 4 5 6 7 8 9 10 1 1 12 13 14 15 16 17 18
AEROBIC CAPACITY (ml/kg min) SUBJECf #18
so~---------------
40+----30 20 10
0 TESTS
Figure F.l8 Capacity Values for Subject 18
Table F.l Values for Bruce Protocol
ACfUAL 02 UPf AKE ESTIMATED 02 UPf AKE (ml/kg min) (ml/kg min)
14.6 19.6 25.1 13.4 21.4 31.5 19.1 25.4 21.4 31.5 22.6 29.8 31.5 41.9 18.1 27.7 21.4 31.5 31.6 36.5 31.5 41.9 22.8 27.2 34.3 31.5 41.9 53.4 19.4 28.8 21.4 31.5 29.6 43.3 31.5 41.9 1 5.4 20.1 25.8 13.4 21.4 31.5 25.1 28.8 31 .5 41.9 1 5.5 18.3 24.1 13.4 21.4 31.5 20.6 28.7 21.4 31.5 30.8 37.0 31.5 41.9 24.0 46.0 31.5 41.9 16.4 21.3 23.1 13.4 21.4 31.5 16.4 21.4 23.7 13.4 21.4 31.5 17.3 23.9 29.1 13.4 21.4 31.5 16.7 18.9 22.6 13.4 21.4 31.5
95
HEART RATE
125 148 169 103 120 136 157 103 1 15 121 134 110 128 141 126 162 143 180 123 144 173 122 135 111 127 151 122 150 117 142 117 151 123 140 152 123 133 149 137 154 176 113 130 146
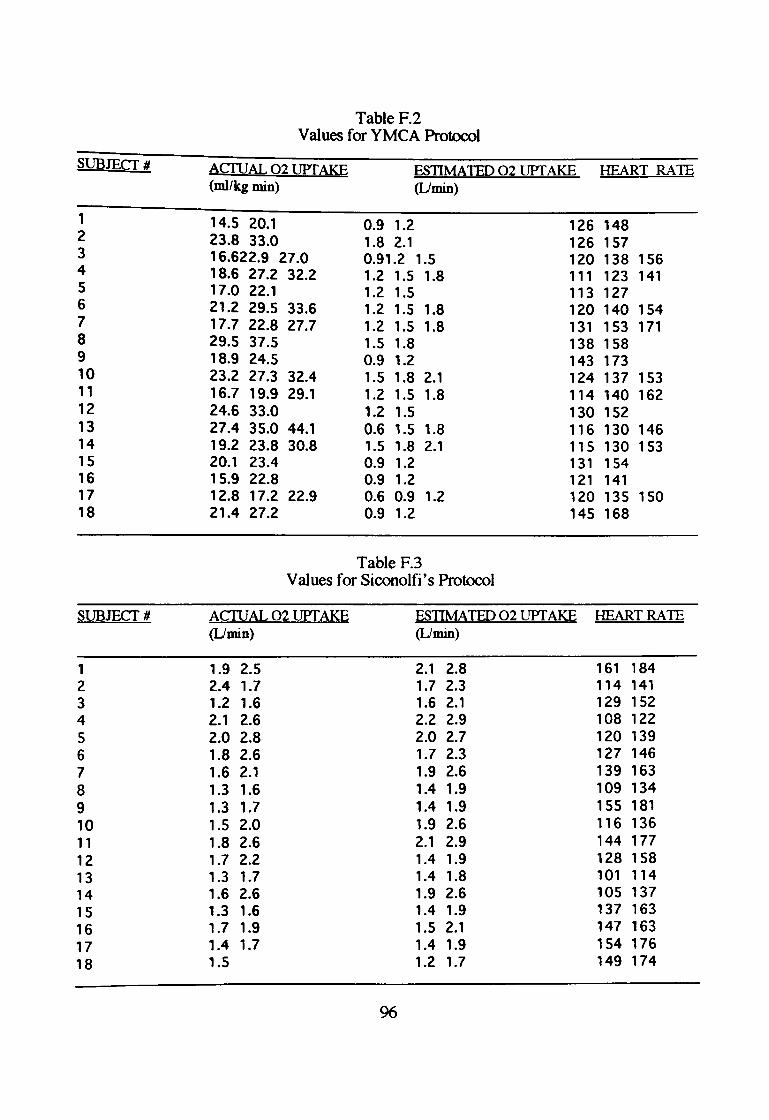
SUBJEcr #
1 2 3 4 5 6 7 8 9 10 11 12 13 14 15 16 17 18
SUBJECf#
1 2 3 4 5 6 7 8 9 10 1 1 12 13 14 15 16 17 18
Table F.2 Values for YMCA Protocol
AcruAL 02 UPf AKE (ml/kg min)
14.5 20.1 23.8 33.0 16.622.9 27.0 18.6 27.2 32.2 17.0 22.1 21.2 29.5 33.6 17.7 22.8 27.7 29.5 37.5 18.9 24.5 23.2 27.3 32.4 16.7 19.9 29.1 24.6 33.0 27.4 35.0 44.1 19.2 23.8 30.8 20.1 23.4 15.9 22.8 12.8 17.2 22.9 21.4 27.2
ESTIMATED 02 UPf AKE HEART RATE (Umin)
0.9 1.2 1.8 2.1 0.91.2 1.5 1.2 1.5 1.8 1.2 1.5 1.2 1.5 1.8 1.2 1.5 1.8 1.5 1.8 0.9 1.2 1.5 1.8 2.1 1.2 1.5 1.8 1.2 1.5 0.6 1.5 1.8 1.5 1.8 2.1 0.9 1.2 0.9 1.2 0.6 0.9 1.2 0.9 1.2
Table F.3
126 148 126 157 120 138 156 111 123 141 113 127 120 140 154 131 153 171 138 158 143 173 124 137 153 114 140 162 130 152 116 130 146 115 130 153 131 1 54 121 141 120 135 150 145 168
Values for Siconolfi's Protocol
ACI1JAL02 UPfAKE (Umin)
1.9 2.5 2.4 1.7 1.2 1.6 2.1 2.6 2.0 2.8 1.8 2.6 1.6 2.1 1.3 1.6 1.3 1.7 1.5 2.0 1.8 2.6 1.7 2.2 1.3 1.7 1.6 2.6 1.3 1.6 1.7 1.9 1.4 1.7 1.5
96
ESTIMATED 02 UPf AKE HEART RATE (Umin)
2.1 2.8 1.7 2.3 1.6 2.1 2.2 2.9 2.0 2.7 1.7 2.3 1.9 2.6 1.4 1.9 1.4 1.9 1.9 2.6 2.1 2.9 1.4 1.9 1.4 1.8 1.9 2.6 1.4 1.9 1.5 2.1 1.4 1.9 1.2 1.7
161 184 114 141 129 152 108 122 120 139 127 146 139 163 109 134 155 181 1 16 136 144 177 128 158 101 114 1 OS 137 137 163 147 163 154 176 149 174

SUBJECf#
1 2 3 4 5 6 7 8 9 10 11 12 13 14 15 16 17 18
SUBJECf#
1 2 3 4 5 6 7 8 9 10 11 12 13 14 15 16 17 18
Table F.4 V02 max Values for Bruce Protocol
From ACIUAL Cml/kg min)
31.6 53.6 43.5 88.5 52.3 50.7 37.4 45.2 30.9 45.6 33.1 41.1 50.6 67.4 33.3 33.9 36.7 31.2
Table F.5
From PREDICTED Cml/kg minl
42.5 76.7 61.7 95.5 75.5 85.3 40.8 43.3 40.3 89.1 50.6 47.0 64.8 52.0 56.3 56.6 42.7 58.4
V02 max from YMCA Protocol
ACIUAL Cml/kg minl
32.6 44.6 39.2 55.0 40.0 46.5 33.5 48.3 29.0 45.4 35.7 48.7 72.4 40.3 29.1 38.0 39.5 34.3
97
PREDICTED Cml/kg minl
22.1 36.1 36.7 32.5 32.1 34.6 27.8 38.8 24.9 38.7 25.3 36.2 71.9 33.8 30.3 30.3 39.3 31.3
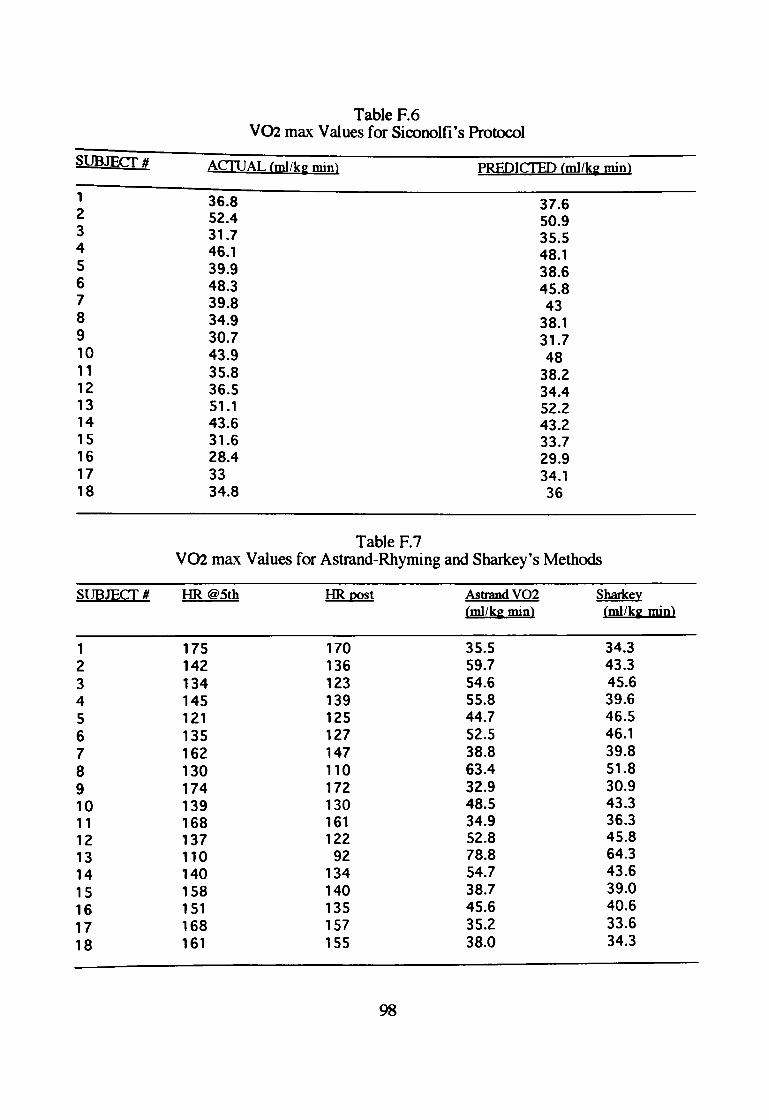
SUBJECr#
1 2 3 4 5 6 7 8 9 10 1 1 12 13 14 15 16 17 18
SUBJECf#
, 2 3 4 5 6 7 8 9 10 , 1 12 13 14 15 16 17 18
Table F.6 V02 max Values for Siconolfi's Protocol
AC11JAL Cmlikg min)
36.8 52.4 31.7 46.1 39.9 48.3 39.8 34.9 30.7 43.9 35.8 36.5 51., 43.6 31.6 28.4 33 34.8
Table F.7
PREDICI'ED Cml/kg min)
37.6 50.9 35.5 48.1 38.6 45.8 43
38.1 31.7 48
38.2 34.4 52.2 43.2 33.7 29.9 34.1 36
V02 max Values for Astrand-Rhyming and Sharkey's Methods
HR. @5th HR oost Astraod V02 Sharkey Cml/kg min) (ml/kg min)
175 170 35.5 34.3 142 136 59.7 43.3 134 123 54.6 45.6 145 139 55.8 39.6 121 125 44.7 46.5 135 127 52.5 46.1 162 147 38.8 39.8 130 1 10 63.4 51.8 174 172 32.9 30.9 139 130 48.5 43.3 168 , 61 34.9 36.3 137 122 52.8 45.8 , 10 92 78.8 64.3 140 134 54.7 43.6 158 140 38.7 39.0 151 135 45.6 40.6 168 157 35.2 33.6 161 155 38.0 34.3
98
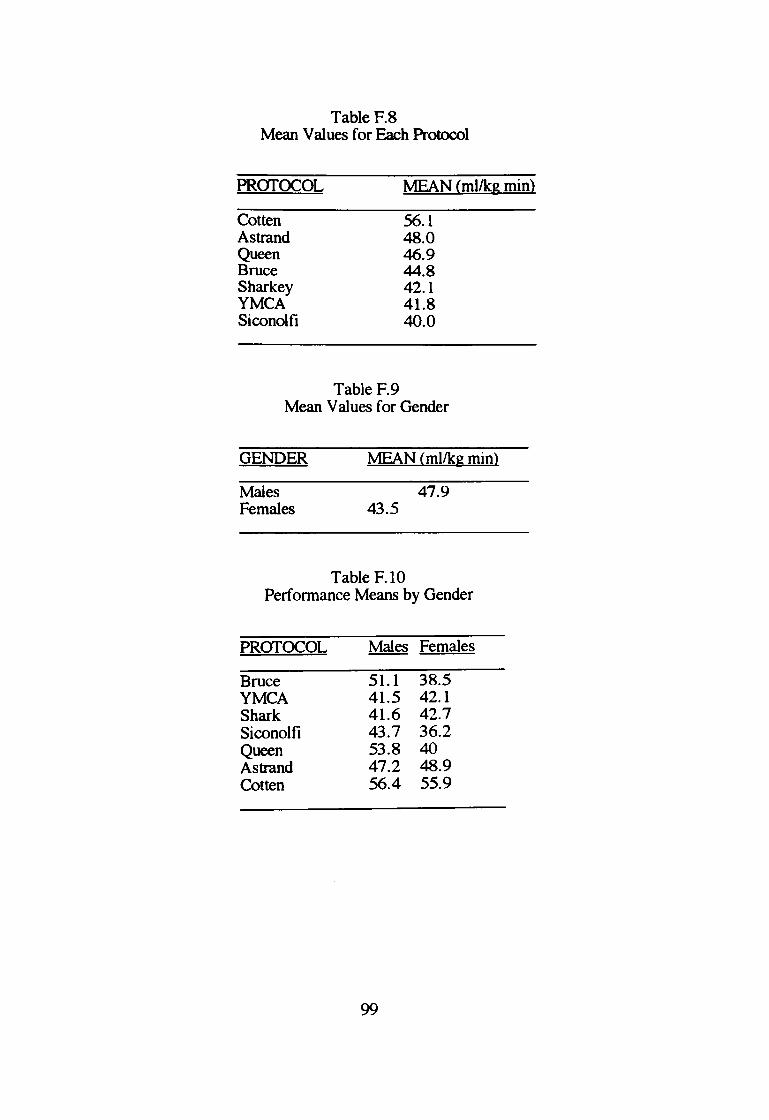
Table F.8 Mean Values for Each Protocol
PROfOCOL
Cotten A strand Queen Bruce Sharkey YMCA Siconolfi
Table F.9
MEAN (mllkg min)
56.1 48.0 46.9 44.8 42.1 41.8 40.0
Mean Values for Gender
GENDER
Males Females
MEAN (ml/kg min)
47.9 43.5
Table F.10 Performance Means by Gender
PROTOCOL
Bruce YMCA Shark Siconolfi Queen A strand Cotten
Males Females
51.1 38.5 41.5 42.1 41.6 42.7 43.7 36.2 53.8 40 47.2 48.9 56.4 55.9
99

Table F.ll Performance Values for Each Subject (ml/kg min)
SUBJECT ASIRAND BRUCE COTfEN QUEEN SHARKEY SICONOLA YMCA
1 35.5 31.6 45.7 44.6 34.3 37.6 32.6 2 59.7 53.6 64.9 58.0 43.3 50.9 44.6 3 54.6 43.5 62.4 40.1 44.0 35.5 39.2 4 55.6 88.5 50.5 49.0 39.6 48.1 55.0 5 44.7 52.3 61.7 57.9 46.5 38.6 40.0 6 52.5 50.7 68.3 63.7 46.1 45.8 46.5 7 38.8 37.4 51.8 43.0 39.8 43.0 33.5 8 63.4 45.2 64.8 45.7 51.8 38.1 48.3 9 32.9 30.9 42.6 33.5 30.9 31.7 29.0
10 48.5 45.6 62.1 56.9 44.9 48.0 45.4 11 34.9 33.1 42.1 49.3 36.3 38.2 35.7 12 49.3 41.1 56.3 42.8 45.8 34.4 48.7 13 78.8 50.6 70.2 48.2 64.3 52.2 72.4 14 54.7 67.4 60.4 61.8 43.6 43.2 40.3 15 38.7 33.3 54.6 38.5 39.0 33.7 29.1 16 45.6 33.9 57.4 40.0 40.6 29.9 38.0 17 35.2 36.7 47.8 35.8 33.6 34.1 39.5 18 38.0 31.2 47.0 35.7 34.3 36.0 34.3
100