pH‑taxis drives aerobic bacteria in duodenum to migrate into ...
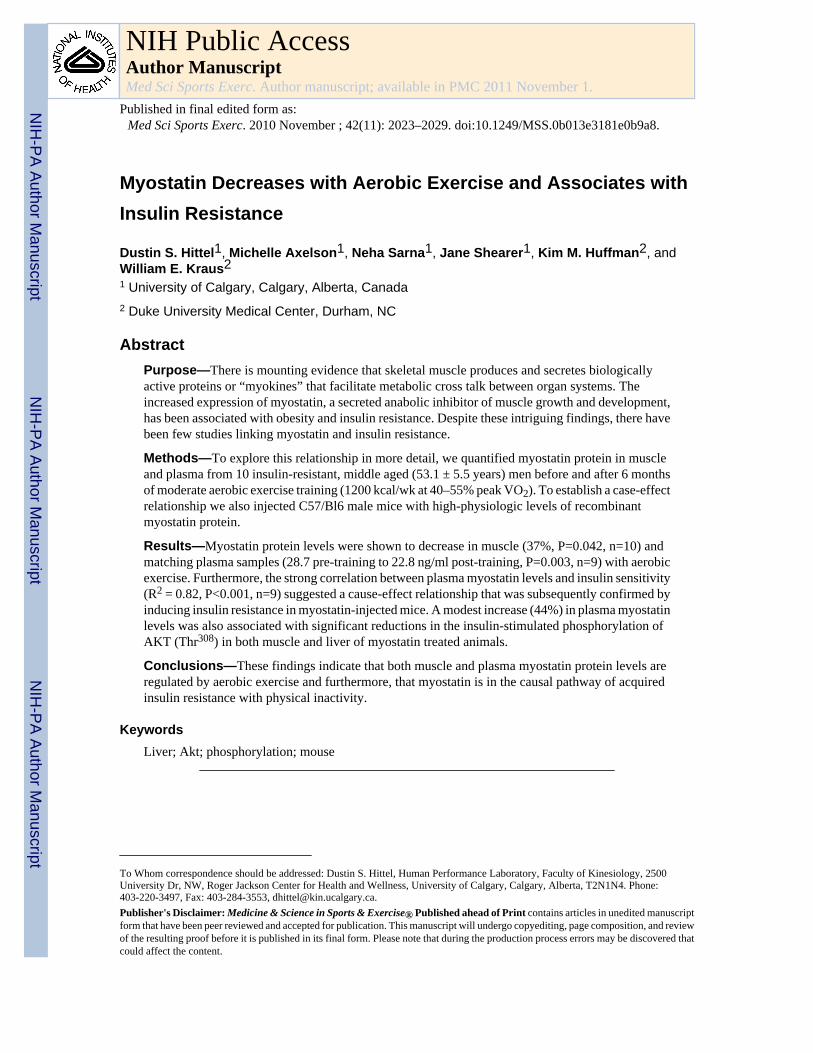
Myostatin Decreases with Aerobic Exercise and Associates withInsulin Resistance
Dustin S. Hittel1, Michelle Axelson1, Neha Sarna1, Jane Shearer1, Kim M. Huffman2, andWilliam E. Kraus21 University of Calgary, Calgary, Alberta, Canada2 Duke University Medical Center, Durham, NC
AbstractPurpose—There is mounting evidence that skeletal muscle produces and secretes biologicallyactive proteins or “myokines” that facilitate metabolic cross talk between organ systems. Theincreased expression of myostatin, a secreted anabolic inhibitor of muscle growth and development,has been associated with obesity and insulin resistance. Despite these intriguing findings, there havebeen few studies linking myostatin and insulin resistance.
Methods—To explore this relationship in more detail, we quantified myostatin protein in muscleand plasma from 10 insulin-resistant, middle aged (53.1 ± 5.5 years) men before and after 6 monthsof moderate aerobic exercise training (1200 kcal/wk at 40–55% peak VO2). To establish a case-effectrelationship we also injected C57/Bl6 male mice with high-physiologic levels of recombinantmyostatin protein.
Results—Myostatin protein levels were shown to decrease in muscle (37%, P=0.042, n=10) andmatching plasma samples (28.7 pre-training to 22.8 ng/ml post-training, P=0.003, n=9) with aerobicexercise. Furthermore, the strong correlation between plasma myostatin levels and insulin sensitivity(R2 = 0.82, P<0.001, n=9) suggested a cause-effect relationship that was subsequently confirmed byinducing insulin resistance in myostatin-injected mice. A modest increase (44%) in plasma myostatinlevels was also associated with significant reductions in the insulin-stimulated phosphorylation ofAKT (Thr308) in both muscle and liver of myostatin treated animals.
Conclusions—These findings indicate that both muscle and plasma myostatin protein levels areregulated by aerobic exercise and furthermore, that myostatin is in the causal pathway of acquiredinsulin resistance with physical inactivity.
KeywordsLiver; Akt; phosphorylation; mouse
To Whom correspondence should be addressed: Dustin S. Hittel, Human Performance Laboratory, Faculty of Kinesiology, 2500University Dr, NW, Roger Jackson Center for Health and Wellness, University of Calgary, Calgary, Alberta, T2N1N4. Phone:403-220-3497, Fax: 403-284-3553, [email protected]'s Disclaimer: Medicine & Science in Sports & Exercise® Published ahead of Print contains articles in unedited manuscriptform that have been peer reviewed and accepted for publication. This manuscript will undergo copyediting, page composition, and reviewof the resulting proof before it is published in its final form. Please note that during the production process errors may be discovered thatcould affect the content.
NIH Public AccessAuthor ManuscriptMed Sci Sports Exerc. Author manuscript; available in PMC 2011 November 1.
Published in final edited form as:Med Sci Sports Exerc. 2010 November ; 42(11): 2023–2029. doi:10.1249/MSS.0b013e3181e0b9a8.
NIH
-PA Author Manuscript
NIH
-PA Author Manuscript
NIH
-PA Author Manuscript
INTRODUCTIONMyostatin (Mstn), a potent regulator of muscle development and size is a member of thetransforming growth factor β (TGFβ) superfamily of secreted proteins (7,24). As with allmembers of the TGFβ family, it is translated as a precursor protein that is subsequentlyprocessed into a mature peptide dimer. Mature Mstn is then secreted from muscle so it can actlocally or systemically via the activin type II A and B (ActRIIA/B) receptors (29,34). Inpostnatal skeletal muscle, Mstn inhibits the proliferation and differentiation of myoblasts andas well as the Akt/mTOR pathway which regulates protein synthesis (8,13). This is why thepharmacological or genetic inhibition of Mstn signaling produces a hyper-muscular phenotypein all vertebrate species (24,27).
The antagonism of Mstn and insulin signaling was first postulated when Mstn null miceexhibited immunity to dietary-induced obesity and insulin resistance (5). This finding issupported by observational studies of muscle from obese and insulin resistant human subjectsthat show increased expression of Mstn mRNA and protein (8,25,28). Furthermore, short-termadministration of recombinant Mstn induces insulin resistance in Mstn null (36) animals.
Previously, we discovered that muscle and plasma Mstn protein levels increased with bothbody mass and the severity of insulin resistance in lean and extremely obese human subjects(8). However, a weakness of this study was that we had no way to determine if differences inlean or fat mass were contributing to elevated Mstn levels, as some have postulated (1,6). This“myostatin paradox” (14), a positive correlation between Mstn levels and muscle mass (onewould expect the opposite), has been described by others and suggests there are other factorsthat govern Mstn expression levels in muscle. Also, resistance exercise (RE), aerobic exercise(AE) and weight loss reduce Mstn mRNA levels in muscle of rats and human subjects (10,14,20–22,35,38). Because exercise and weight loss both improve whole body insulin sensitivity(9) we hypothesize that Mstn is an important component of signaling pathways that determinewhole body insulin sensitivity and that insulin action should correlate with plasma Mstn proteinlevels in interventions that modulate insulin action (8). To test this hypothesis and expand uponprevious studies that have studied Mstn mRNA levels alone, we quantified Mstn protein inpaired muscle and plasma samples from insulin resistant men before and after 6 months ofmoderate AE training (9). Furthermore, to determine its effects on whole body insulinsensitivity we also injected mice with recombinant Mstn. To our knowledge this is the firststudy of Mstn protein levels with AE training in a pre-diabetic patient population.
METHODSHuman Subjects
The skeletal muscle biopsies and plasma used in this study were obtained from 10 menparticipating in the Studies of Targeted Risk Reduction Interventions Through DefinedExercise (STRRIDE) study (9,33). Briefly, subjects ranged from 40 to 64 years of age, weresedentary (exercise < once weekly; peak V02 25.8 to 34.6 ml·kg−1·min−1), overweight (BMI27.9 to 36.1) and exhibited signs of fasting hyper-insulinemia (fasting insulin 12.3 to 18.8 IU/ml) with mild to moderate lipid abnormalities (LDL 132 to 163 mg·dl−1 and HDL 27 to 40mg·dl−1). Exclusion criteria included no medications that could alter carbohydrate metabolismand evidence for diabetes, orthopedic conditions prohibiting exercise, hypertension, and heartdisease. All subjects provided written, informed consent. This study was performed inaccordance with the Declaration of Helsinki and received ethics approval from Duke UniversityMedical Center.
Hittel et al. Page 2
Med Sci Sports Exerc. Author manuscript; available in PMC 2011 November 1.
NIH
-PA Author Manuscript
NIH
-PA Author Manuscript
NIH
-PA Author Manuscript

Human Exercise trainingSubjects were prescribed a moderate-intensity aerobic exercise regimen (1,200 kcal/wk kJ/wkat 40–55% peak VO2, 14 kcal·kg−1·wk−1). The lower exercise training intensity (40–55%VO2 peak) was chosen because it approximates brisk walking or moderate-intensity exerciselevels advised in current health guidelines. The exercise modes included cycle ergometer,treadmill, and elliptical trainers to enhance variety and adherence. Once the exercise volume(kcal·kg−1·wk−1) was calculated, subjects selected, with the assistance of an exercisephysiologist, an appropriate exercise frequency and duration to achieve their weekly exercisedose. All exercise sessions were verified by direct supervision and/or use of a heart rate monitorthat provided recorded data (Polar Electro, Woodbury, NY). To minimize musculoskeletalinjury there was an initial ramp period of 2 to 3 months followed by 6 months at the appropriateexercise prescription. Subjects were counseled to maintain baseline body weight so as toestablish the body mass independent value of increased fitness. Body mass and diet wereclosely monitored to determine if subjects were purposely changing diet to lose weight. Weobserved no systematic changes in diet among the groups. Body composition was determinedusing the sum of 4 skinfolds measured with Lange calipers (Betea Technology Inc, Cambridge,MD) and the sex-specific formulas of Jackson and Pollock as described previously (32,33).
Human Insulin SensitivityInsulin sensitivity was determined with a 3-h intravenous glucose tolerance test (IVGTT) asdescribed previously (9). Briefly, the IVGTT was performed ~24 h after the final exercise bout.After fasting samples were obtained, glucose (50%) was injected into a catheter placed in anantecubital vein at a dose of 0.3 g/kg body mass. Insulin, at a dose of 0.025 U/kg body masswas injected at minute 20. Blood samples were obtained at minutes 2, 3, 4, 5, 6, 8, 10, 12, 14,16, 19, 22, 25, 30, 40, 50, 60, 70, 80, 90, 100, 120, 140, 160, and 180 and the samples werecentrifuged, and plasma frozen at −80°C for the subsequent determination of insulin andglucose. Insulin was determined with immunoassay (Access Immunoassay System, BeckmanCoulter, Fullerton, CA) and glucose was determined with an oxidation reaction (YSI model2300 Stat Plus, Yellow Springs Instruments, Yellow Springs, OH). An insulin sensitivity index(SI) was calculated by using the minimal model where a higher SI indicates enhanced insulinsensitivity.
Human Muscle BiopsiesSkeletal muscle biopsies were obtained with the percutaneous needle biopsy technique using1% lidocaine without epinephrine. Two serial vastus lateralis muscle biopsies (100 to 200 mg)were obtained with a triple pass of the bioptome needle: one upon entry into the study and oneafter 9 months (3 months ramp up, 6 months training) of exercise training (within 24 hoursafter the last bout of exercise). Biopsy samples were flash frozen for histology and otheranalyses. Sample of approximately 25 mg/biopsy were used for the analyses described here.
Mouse Maintenance and ExperimentationProcedures were approved by the University of Calgary Animal Care and Use Committee andabide by the Canadian Association for Laboratory Animal Science guidelines for animalexperimentation. Animals were maintained a humidity controlled roomwith a 12-h light:darkcycle. Following weaning (3 wk of age), male C57BL/6J littermates were randomly segregatedinto two groups (n=16 each) and maintained in microisolator cages for one week. Followingthis acclimation period, treated animals received 15 ug/kg/day of recombinant myostatin(MSTN) (R&D Systems, Minneapolis, MN) whilst the control group received 100 uL ofphosphate buffered saline (PBS) as described by Wilkes et al. (9). The recombinant myostatinwas diluted in 100 uL of PBS and administered daily by subcutaneous injection. Food and
Hittel et al. Page 3
Med Sci Sports Exerc. Author manuscript; available in PMC 2011 November 1.
NIH
-PA Author Manuscript
NIH
-PA Author Manuscript
NIH
-PA Author Manuscript

water were provided ad libitum throughout the experiment. Insulin tolerance tests weredetermined in 6 hour fasted mice.
Mouse Insulin Tolerance TestInsulin (Novolin R; Novo Nordisk, Copenhagen, Denmark) was administered to consciousmice by intraperitoneal injection (0.75 U/kg). Tail vein blood glucose was measured induplicate using a One-Touch Ultra glucometer (One Touch, Lifescan, Burnaby, BC) at 0, 20,40, 60 and 80 minutes. Animals were allowed to rest overnight, then weighed and anesthetized(Pentobarbital) with the exception of six animals from each treatment group that were firstinjected with 10 U/kg of insulin for assessment of maximum insulin-stimulated Aktphosphorylation. Whole blood (~1 mL) was obtained by a cardiac puncture and placed on iceand allowed to clot for 30 min. Samples were then centrifuged for 10 min (3000 rpm) and seracollected prior to storage at −80 C. Tissues were harvested and flash frozen at −80 C.
Mouse Serum Hormone levelsSerum insulin, leptin, adiponectin, resistin and TNFα were measured in duplicate by theLINCOplex assay (Linco Research, Inc. St Charles Missouri, USA). This assay relied on theuse of polystyrene beads, each with a unique signature mix of fluorescent dyes that can bediscriminated by a laser-based detection instrument, the Luminex100 (Luminex Corp., Austin,TX). Each bead type was coated with a specific antibody to the cytokine of interest. Thecytokine antibody pairs in this multiplex assay do not cross react with other analytes in thepanel. The intra-assay coefficient of variation (CV) was below 10%.
Myostatin ELISAMature Mstn protein levels in human plasma and mouse serum were determined in duplicateusing an ELISA assay according to the manufacturers instructions (Immundiagnostik,Bensheim, Germany). Samples were read using a microtiter plate reader at 450 nm against 620nm as a reference. A 4-parameter-algorithm was used to calculate the standard curve againstwhich the concentration of Mstn in human and mouse samples were determined. Thecoefficient of variance between replicates was consistently below 10%.
Western BlottingNitrogen pulverized muscle and liver were extracted using GSK-3 buffer (10% Glycerol, 150mM NaCl, 50 mM HEPES (pH 7.5), 1% NP-40, 2mM EDTA (pH 8.0), 1mM CaCl2, 1mM MgCl2, 1X Halt™ Protease and Phosphatase Inhibitor Cocktail (Pierce, Rockford, IL), 3mMBenzamide) with gentle inversion at 4°C for 1 hour. Samples were then centrifuged at 4°C for1 hour at 17500g and protein concentration determined using the Bio-Rad protein assay dyereagent, following the manufacturer’s instructions (Bio-Rad, Hercules, CA). 20 μg of cellularprotein were then separated on precast 4–12% gradient SDS-PAGE gels (Invitrogen, Carlsbad,CA) and transferred to Immobilon-P PVDF Membrane (Millipore, Billerica, MA). The primaryanti-Mstn antibody used in this study (AB3239, Chemicon/Millipore) was raised in rabbitsagainst the active C-terminal domain of Mstn as previously described (6). Anti-AKT and anti-phospho-AKT(Thr308) antibodies were purchased from Cell Signal (Beverly, MA). An alpha-actin mouse monoclonal antibody (Sigma St. Louis, MO) and anti-AKT antibodies were usedon stripped membranes as a loading control. Membranes were incubated in 1/1000 in primaryantibody in TBST overnight (~14 hours) at 4°C. After washing, primary antibodies weredetected using HRP-conjugated secondary antibodies (Santa-Cruz Biotechnology, Santa Cruz,CA) at a dilution of 1/5000 and a SuperSignal West Pico Chemiluminescent Substrate (Pierce,Rockford, IL). Images were acquired and quantified using a ChemiGenius Bioimaging System(Syngene, Frederick, MD).
Hittel et al. Page 4
Med Sci Sports Exerc. Author manuscript; available in PMC 2011 November 1.
NIH
-PA Author Manuscript
NIH
-PA Author Manuscript
NIH
-PA Author Manuscript

StatisticsRelative and absolute changes (after training/before training) in Mstn protein levels werecompared with paired Student’s t-test. Insulin tolerance tests were analyzed by ANOVA andt-tests as appropriate. Correlations (Pearson product) were performed between circulating Mstnlevels (ng/ml) and selected variables (SI, Lean and Fat Mass). Statistical significance wasindicated at or below the P = 0.05 level. Data are presented as means ± SEM.
RESULTSExercise Training
The baseline and post-exercise training characteristics of STRRIDE study participants havebeen described previously (2,9). The characteristics of the 10 men used for our study aredescribed in Table 1. There were no significant changes in total weight, lean or fat mass andBMI whereas Si fasting insulin and peak VO2 changed significantly with aerobic exercisetraining.
Myostatin Western BlotsWhen compared with pre-trained skeletal muscle (Figure 1) Mstn levels decreased significantlywith exercise training relative to alpha-actin (37% decrease, P=0.042, n=10). These results areconsistent with time-frame for the depression of Mstn mRNA in muscle with both AE and REtraining in human subjects (11,14,20). Using the same antibody, a recent study found decreasein 28 and 10 kDa immunoreactive bands with 90 days of resistance training followed by asignificant increase after 30 days of detraining (12). Presumably, these proteins represent thedimeric and monomeric forms of the mature myostatin protein. While there is some controversyregarding the specificity of this antibody, in our hands the titration of pure myostatin proteineliminated the 26 kDa immunoreactive band from our Western blots. Furthermore, we usedless stringent reducing conditions during sample preparation because of significant variabilityin the reduction of the dimeric form of Mstn to the monomeric form, which makesquantification by Western blot difficult.
Myostatin ELISAWhen compared against pre-training levels, circulating Mstn protein decreased from 28.7±3.1to 22.8±2.0 ng/ml with AE training (Table 1 P=0.003, n=9). Of note, the significant intra-individual variability in pre and post training levels of plasma Mstn suggests that genetics mayplay an important role regulation of expression levels (17). Supporting this notion is the highdegree of correlation (R2 = 0.9, P<0.001, n=9) between pre and post-AE training Mstn levels.Not surprisingly, plasma myostatin levels were elevated in Mstn-treated vs PBS-treated mice(Table 2) though only modestly (44% increase, P = 0.06). Compared to previous assessmentsof circulating Mstn in human subjects our values were an order of magnitude higher (18) orlower (6) than those previously described. We assume that this discrepancy relates todifferences in the sensitivity and specificity of different antigen/antibody combinations usedby distinct ELISA assays.
Human Myostatin AssociationsWe found an found an inverse relationship between plasma Mstn levels and Si, which supportsa direct correlation between Mstn and insulin sensitivity (R2 = 0.82, P<0.001, n=9) (Figure 2).Furthermore, this association was less pronounced, but still significant after exercise training(R2 = 0.49, P=0.024, n=10). We also found that pre-training plasma Mstn levels correlatedbetter with insulin sensitivity than lean (R2 = 0.07, NS, n=9) or fat mass (R2 = 0.14, NS, n=9).
Hittel et al. Page 5
Med Sci Sports Exerc. Author manuscript; available in PMC 2011 November 1.
NIH
-PA Author Manuscript
NIH
-PA Author Manuscript
NIH
-PA Author Manuscript

Mouse Insulin Tolerance and Serum HormonesTo determine if Mstn could induce insulin resistance in mice we randomly segregated healthymale littermates of similar body mass into two treatment groups. Significant insulin resistancewas induced in Mstn-treated mice relative to PBS-treated control animals (Figure 3). Fastingglucose and insulin were also elevated (though not significantly) in Mstn-treated animals(Table 2). The concentration and duration of myostatin treatment were not sufficient to inducesignificant changes on body, gastrocnemius or soleus muscle mass. Unlike previous studieswe did not find that Mstn treatment produced an increase in circulating TNFα, which is knownto induce insulin resistance a number of tissues (9) (Table 2). Furthermore, we found nosignificant differences in circulating levels of adipocyte-derived metabolic hormones leptin,resistin or adiponectin.
Mouse Akt Western BlotsMeasurements of insulin-stimulated AKT phosphorylation at Thr308 in muscle and liverextracts showed that insulin signaling was reduced by 68% in gastrocnemius muscle and 45%in vastus lateralis of Mstn-treated animals (Figure 4). Even more impressive was the 87%reduction in insulin-stimulated AKT phosphorylation in livers of Mstn-Treated animals. Allresults were significant with P< 0.01. These results confirm and expand upon the findings ofWilkes et al (36) who were the first to suggest the antagonism of myostatin and insulin signalingin the liver. Although both Thr308 and Ser473 are required for the complete activation of AKT,the Thr308 antibody was chosen because of studies that show a complete absence of GLUT4translocation when blocking the Thr308 but not the Ser473 phosphorylation of AKT in responseto insulin (15).
DISCUSSIONAerobic and resistance exercise reduces muscle and circulating Mstn levels in human subjectswhether acute or chronic (11,20,30). While there have been prior studies of circulating Mstnprotein in relation to body mass, age, gender and exercise (6,8,18,35,37) ours is the first todescribe a significant decrease in circulating Mstn protein with aerobic exercise training. Thisis also the first study to show a significant correlation between circulating Mstn and insulinsensitivity. While this did not prove a cause-effect relationship per se, we were able to inducewhole-body insulin resistance in mice with the short-term administration of recombinant Mstn(36). This finding suggests that small changes in circulating Mstn can produce significantchanges in insulin sensitivity in both liver and muscle. However, since myostatin levels wereassayed > 12 hours after their last injection it is possible that serum levels were much higherat an earlier time point. These findings also support previously published studies in ourlaboratory in which we hypothesized a relationship between circulating Mstn and insulinresistance (8).
Interestingly, the post-natal suppression of circulating Mstn protein using anti-Mstn antibodies,soluble ActRIIB receptor and Mstn propeptide prevents dietary induced insulin resistance inmice (19,39). In fact, recent evidence suggests that improvements in insulin sensitivity andaerobic endurance in mice after short-term Mstn inhibition were as effective as four weeks ofaerobic exercise training, suggesting a potential complementary role for myostatin antagonistsin the treatment of obesity and type 2 diabetes (19). It is therefore plausible that exercise-associated decreases in muscle and plasma Mstn may contribute to improvements in whole-body insulin sensitivity.
We had previously hypothesized that increased muscle and plasma Mstn is a secondaryresponse to acquired insulin resistance with physical inactivity (8). While the evidencepresented in this study would appear to support this hypothesis it creates a minor logical
Hittel et al. Page 6
Med Sci Sports Exerc. Author manuscript; available in PMC 2011 November 1.
NIH
-PA Author Manuscript
NIH
-PA Author Manuscript
NIH
-PA Author Manuscript

paradox, wherein increased circulating Mstn is both cause and effect of insulin resistance. Thedata presented in this and other exercise studies indicate that muscle activity levels primarilydictate Mstn expression levels and that the secondary effects are metabolic. In fact, in additionto muscle (7) Mstn signaling has been shown to play a role in the metabolic adaptation of liver(36), heart (31) and placenta (26) suggesting a broad role in metabolic cross-talk betweenorgans. Although we found no evidence that Mstn altered circulating levels of hormones andcytokines known to influence insulin signaling (Table 2), to determine if myostatin signalingacts directly on the insulin signaling pathway and glucose uptake we plan to conduct follow-up studies using liver and muscle cells in culture.
Like most members of the TGFβ family Myostatin is extensively regulated at the post-translational level, where it is cleaved into a chaperone-like pro-domain and an active peptide-dimer in the very stable cysteine knot conformation (23,39). This is why some confusionpersists about the appropriate molecular weight of the immunoreactive myostatin and whysome prefer to study the mRNA levels alone. In fact, studies of Mstn mRNA have providedimportant information about the timeframe for the suppression of Mstn expression with aerobicexercise. The exercise-induced suppression of Mstn mRNA and protein occurs in as little as 1hour and persists as long as 24 hours after a single exercise session (3,11,20).
Like myostatin, insulin-like growth factor 1 (IGF-1) is an important component of thehomeostatic mechanism linking muscle activity to hypertrophy and atrophy (4,16). Exercise-induced IGF-1 signaling is mediated in part by the PI3K/PTEN/AKTpathway that promotescell proliferation and myogenesis in both the heart and skeletal muscle. Opposing thismechanism, myostatin has been shown reduce IGF-1 stimulated AKT phosphorylation in adose-dependant manner by blocking both PI3 Kinase and activating PTEN (13). Interestingly,myostatin, IGF-1 and insulin all share the PI3K/Akt pathway, which is important for signalinga number of downstream substrates that play a role in cell growth and metabolism. In fact ithas been demonstrated that the major growth inhibiting actions of myostatin are mediatedthrough the attenuation of IGF-1 induced Akt phosphorylation (13). Finally it has been shownthat both insulin and IGF-1 inhibit the Mstn-induced degradation of p300, an importanttranscriptional coactivator regulating the expression of cyclin D1 (13). Cumulatively, thissuggests a plausible mechanism linking increased circulating myostatin with inactivity to thedevelopment of insulin resistance.
In summary, we found that Mstn protein levels decreased in matching muscle and plasmasamples from insulin resistant men after six months of aerobic exercise training. Pre-trainingplasma myostatin correlated better with insulin sensitivity than lean or fat mass, suggesting acause-effect relationship that was subsequently confirmed in myostatin-injected mice. Theprofound reduction in insulin sensitivity with modest increase in plasma myostatin levels wasalso characterized at the organ level where the insulin-stimulated phosphorylation of AKT wasshown to be significantly reduced in both muscle and liver of myostatin treated mice. Theseunique observations imply a role for circulating Mstn in the pathophysiology of the insulinresistance syndromes. Finally, since moderate exercise is sufficient to both reduce circulatingMstn levels and improve insulin sensitivity, we believe that Mstn should be evaluated furtheras therapeutic benefit of exercise and a target for defining the optimal mode, dose and intensityof exercise for health benefits.
AcknowledgmentsThis work was supported by a philanthropic donation from Encana Corporation and Natural Sciences and EngineeringResearch Council of Canada grant 355763-2009 to DSH. WEK is supported the National Institutes of Health grantHL57354. The results of the present study do not constitute an endorsement by ACSM.
Hittel et al. Page 7
Med Sci Sports Exerc. Author manuscript; available in PMC 2011 November 1.
NIH
-PA Author Manuscript
NIH
-PA Author Manuscript
NIH
-PA Author Manuscript

This work was supported by a philanthropic donation from Encana Corporation of Canada and a Natural Sciences andEngineering Research Council of Canada grant 355763-2009 to DSH. WEK is supported the National Institutes ofHealth grant HL57354.
References1. Allen DL, Cleary AS, Speaker KJ, et al. Myostatin, activin receptor IIb, and follistatin-like-3 gene
expression are altered in adipose tissue and skeletal muscle of obese mice. Am J Physiol EndocrinolMetab 2008;294(5):E918–27. [PubMed: 18334608]
2. Bajpeyi S, Tanner CJ, Slentz CA, et al. Effect of exercise intensity and volume on persistence of insulinsensitivity during training cessation. J Appl Physiol 2009;106(4):1079–85. [PubMed: 19196913]
3. Callis TE, Pandya K, Seok HY, et al. MicroRNA-208a is a regulator of cardiac hypertrophy andconduction in mice. J Clin Invest 2009;119(9):2772–86. [PubMed: 19726871]
4. Gentile MA, Nantermet PV, Vogel RL, et al. Androgen mediated improvement of body compositionand muscle function involves a novel early transcriptional program including IGF-1, MGF andinduction of beta-catenin. J Mol Endocrinol 2010;44:55. [PubMed: 19726620]
5. Gonzalez-Cadavid NF, Bhasin S. Role of myostatin in metabolism. Curr Opin Clin Nutr Metab Care2004;7(4):451–7. [PubMed: 15192449]
6. Gonzalez-Cadavid NF, Taylor WE, Yarasheski K, et al. Organization of the human myostatin geneand expression in healthy men and HIV-infected men with muscle wasting. Proc Natl Acad Sci U SA 1998;95(25):14938–43. [PubMed: 9843994]
7. Guo T, Jou W, Chanturiya T, Portas J, Gavrilova O, McPherron AC. Myostatin inhibition in muscle,but not adipose tissue, decreases fat mass and improves insulin sensitivity. PLoS One 2009;4(3):e4937.[PubMed: 19295913]
8. Hittel DS, Berggren JR, Shearer J, Boyle K, Houmard JA. Increased secretion and expression ofmyostatin in skeletal muscle from extremely obese women. Diabetes 2009;58(1):30–8. [PubMed:18835929]
9. Houmard JA, Tanner CJ, Slentz CA, Duscha BD, McCartney JS, Kraus WE. Effect of the volume andintensity of exercise training on insulin sensitivity. J Appl Physiol 2004;96(1):101–6. [PubMed:12972442]
10. Hulmi JJ, Kovanen V, Selanne H, Kraemer WJ, Hakkinen K, Mero AA. Acute and long-term effectsof resistance exercise with or without protein ingestion on muscle hypertrophy and gene expression.Amino Acids 2009;37(2):297–308. [PubMed: 18661258]
11. Hulmi JJ, Tannerstedt J, Selanne H, Kainulainen H, Kovanen V, Mero AA. Resistance exercise withwhey protein ingestion affects mTOR signaling pathway and myostatin in men. J Appl Physiol2009;106(5):1720–9. [PubMed: 19299575]
12. Jespersen JG, Nedergaard A, Andersen LL, Schjerling P, Andersen JL. Myostatin expression duringhuman muscle hypertrophy and subsequent atrophy: increased myostatin with detraining. Scand JMed Sci Sports. 2009 in press.
13. Ji M, Zhang Q, Ye J, Wang X, Yang W, Zhu D. Myostatin induces p300 degradation to silence cyclinD1 expression through the PI3K/PTEN/Akt pathway. Cell Signal 2008;20(8):1452–8. [PubMed:18472397]
14. Kim JS, Cross JM, Bamman MM. Impact of resistance loading on myostatin expression and cell cycleregulation in young and older men and women. Am J Physiol Endocrinol Metab 2005;288(6):E1110–9. [PubMed: 15644458]
15. Kondapaka SB, Zarnowski M, Yver DR, Sausville EA, Cushman SW. 7-hydroxystaurosporine(UCN-01) inhibition of Akt Thr308 but not Ser473 phosphorylation: a basis for decreased insulin-stimulated glucose transport. Clin Cancer Res 2004;10(21):7192–8. [PubMed: 15534092]
16. Kopple JD, Cohen AH, Wang H, et al. Effect of exercise on mRNA levels for growth factors inskeletal muscle of hemodialysis patients. J Ren Nutr 2006;16(4):312–24. [PubMed: 17046615]
17. Kostek MA, Angelopoulos TJ, Clarkson PM, et al. Myostatin and follistatin polymorphisms interactwith muscle phenotypes and ethnicity. Med Sci Sports Exerc 2009;41(5):1063–71. [PubMed:19346981]
Hittel et al. Page 8
Med Sci Sports Exerc. Author manuscript; available in PMC 2011 November 1.
NIH
-PA Author Manuscript
NIH
-PA Author Manuscript
NIH
-PA Author Manuscript

18. Lakshman KM, Bhasin S, Corcoran C, et al. Measurement of myostatin concentrations in humanserum: Circulating concentrations in young and older men and effects of testosterone administration.Mol Cell Endocrinol 2009;302(1):26–32. [PubMed: 19356623]
19. LeBrasseur NK, Schelhorn TM, Bernardo BL, Cosgrove PG, Loria PM, Brown TA. Myostatininhibition enhances the effects of exercise on performance and metabolic outcomes in aged mice. JGerontol A Biol Sci Med Sci 2009;64(9):940–8. [PubMed: 19483181]
20. Louis E, Raue U, Yang Y, Jemiolo B, Trappe S. Time course of proteolytic, cytokine, and myostatingene expression after acute exercise in human skeletal muscle. J Appl Physiol 2007;103(5):1744–51. [PubMed: 17823296]
21. Matsakas A, Bozzo C, Cacciani N, et al. Effect of swimming on myostatin expression in white andred gastrocnemius muscle and in cardiac muscle of rats. Exp Physiol 2006;91(6):983–94. [PubMed:16873457]
22. Matsakas A, Friedel A, Hertrampf T, Diel P. Short-term endurance training results in a muscle-specificdecrease of myostatin mRNA content in the rat. Acta Physiol Scand 2005;183(3):299–307. [PubMed:15743390]
23. McFarlane C, Langley B, Thomas M, et al. Proteolytic processing of myostatin is auto-regulatedduring myogenesis. Dev Biol 2005;283(1):58–69. [PubMed: 15975431]
24. McPherron AC, Lawler AM, Lee SJ. Regulation of skeletal muscle mass in mice by a new TGF-betasuperfamily member. Nature 1997;387(6628):83–90. [PubMed: 9139826]
25. Milan G, Dalla Nora E, Pilon C, et al. Changes in muscle myostatin expression in obese subjects afterweight loss. J Clin Endocrinol Metab 2004;89(6):2724–7. [PubMed: 15181048]
26. Mitchell MD, Osepchook CC, Leung KC, McMahon CD, Bass JJ. Myostatin is a human placentalproduct that regulates glucose uptake. J Clin Endocrinol Metab 2006;91(4):1434–7. [PubMed:16464946]
27. Mukherjee A, Sidis Y, Mahan A, et al. FSTL3 deletion reveals roles for TGF-beta family ligands inglucose and fat homeostasis in adults. Proc Natl Acad Sci U S A 2007;104(4):1348–53. [PubMed:17229845]
28. Park JJ, Berggren JR, Hulver MW, Houmard JA, Hoffman EP. GRB14, GPD1, and GDF8 as potentialnetwork collaborators in weight loss-induced improvements in insulin action in human skeletalmuscle. Physiol Genomics 2006;27(2):114–21. [PubMed: 16849634]
29. Ricaud S, Vernus B, Duclos M, et al. Inhibition of autocrine secretion of myostatin enhances terminaldifferentiation in human rhabdomyosarcoma cells. Oncogene 2003;22(51):8221–32. [PubMed:14614446]
30. Roth SM, Martel GF, Ferrell RE, Metter EJ, Hurley BF, Rogers MA. Myostatin gene expression isreduced in humans with heavy-resistance strength training: a brief communication. Exp Biol Med(Maywood) 2003;228(6):706–9. [PubMed: 12773702]
31. Shyu KG, Lu MJ, Wang BW, Sun HY, Chang H. Myostatin expression in ventricular myocardiumin a rat model of volume-overload heart failure. Eur J Clin Invest 2006;36(10):713–9. [PubMed:16968467]
32. Slentz CA, Aiken LB, Houmard JA, et al. Inactivity, exercise, and visceral fat. STRRIDE: arandomized, controlled study of exercise intensity and amount. J Appl Physiol 2005;99(4):1613–8.[PubMed: 16002776]
33. Slentz CA, Duscha BD, Johnson JL, et al. Effects of the amount of exercise on body weight, bodycomposition, and measures of central obesity: STRRIDE--a randomized controlled study. Arch InternMed 2004;164(1):31–9. [PubMed: 14718319]
34. Thomas M, Langley B, Berry C, et al. Myostatin, a negative regulator of muscle growth, functionsby inhibiting myoblast proliferation. J Biol Chem 2000;275(51):40235–43. [PubMed: 10976104]
35. Walker KS, Kambadur R, Sharma M, Smith HK. Resistance training alters plasma myostatin but notIGF-1 in healthy men. Med Sci Sports Exerc 2004;36(5):787–93. [PubMed: 15126711]
36. Wilkes JJ, Lloyd DJ, Gekakis N. Loss-of-function mutation in myostatin reduces tumor necrosisfactor alpha production and protects liver against obesity-induced insulin resistance. Diabetes2009;58(5):1133–43. [PubMed: 19208906]
Hittel et al. Page 9
Med Sci Sports Exerc. Author manuscript; available in PMC 2011 November 1.
NIH
-PA Author Manuscript
NIH
-PA Author Manuscript
NIH
-PA Author Manuscript

37. Willoughby DS. Effects of an alleged myostatin-binding supplement and heavy resistance trainingon serum myostatin, muscle strength and mass, and body composition. Int J Sport Nutr Exerc Metab2004;14(4):461–72. [PubMed: 15467103]
38. Willoughby DS. Effects of heavy resistance training on myostatin mRNA and protein expression.Med Sci Sports Exerc 2004;36(4):574–82. [PubMed: 15064583]
39. Zhao B, Wall RJ, Yang J. Transgenic expression of myostatin propeptide prevents diet-inducedobesity and insulin resistance. Biochem Biophys Res Commun 2005;337(1):248–55. [PubMed:16182246]
Hittel et al. Page 10
Med Sci Sports Exerc. Author manuscript; available in PMC 2011 November 1.
NIH
-PA Author Manuscript
NIH
-PA Author Manuscript
NIH
-PA Author Manuscript

Figure 1. Mature myostatin protein decreases with exercise training in skeletal muscle of insulinresistant male subjectsThe mature myostatin 26 kDa peptide dimer was detected using Western blotting of muscleprotein from each of 10 male subjects before and after 6 months of AE training. Expressionlevels were normalized to the abundance of alpha-actin ± SEM and a double asterisk (**)indicates significant differences (p<0.05) using a paired t-test.
Hittel et al. Page 11
Med Sci Sports Exerc. Author manuscript; available in PMC 2011 November 1.
NIH
-PA Author Manuscript
NIH
-PA Author Manuscript
NIH
-PA Author Manuscript

Figure 2. Plasma myostatin levels correlate with Si in insulin resistant male subjects before andafter exercise trainingLinear regression analyses were conducted using the least squares method to compare plasmamyostatin levels to insulin sensitivity (Si) before and after 6 months of AE training. Significantassociations (p<0.05) were found between circulating myostatin and Si.
Hittel et al. Page 12
Med Sci Sports Exerc. Author manuscript; available in PMC 2011 November 1.
NIH
-PA Author Manuscript
NIH
-PA Author Manuscript
NIH
-PA Author Manuscript

Figure 3. Myostatin-treatment induces significant insulin resistance in male C57BL6 miceInsulin (0.75 U/kg) was administered to mice by intraperitoneal injection and tail vein bloodglucose measured from 15–90 minutes in myostatin-treated (25 ug/kg for 7 days; circles)compared to PBS-treated (diamonds) animals. Data represent percent of blood glucose levelat time 0 ± SEM with n=10 mice per treatment group double asterisk (**) indicates significantdifferences (MYO vs PBS) using ANOVA.
Hittel et al. Page 13
Med Sci Sports Exerc. Author manuscript; available in PMC 2011 November 1.
NIH
-PA Author Manuscript
NIH
-PA Author Manuscript
NIH
-PA Author Manuscript
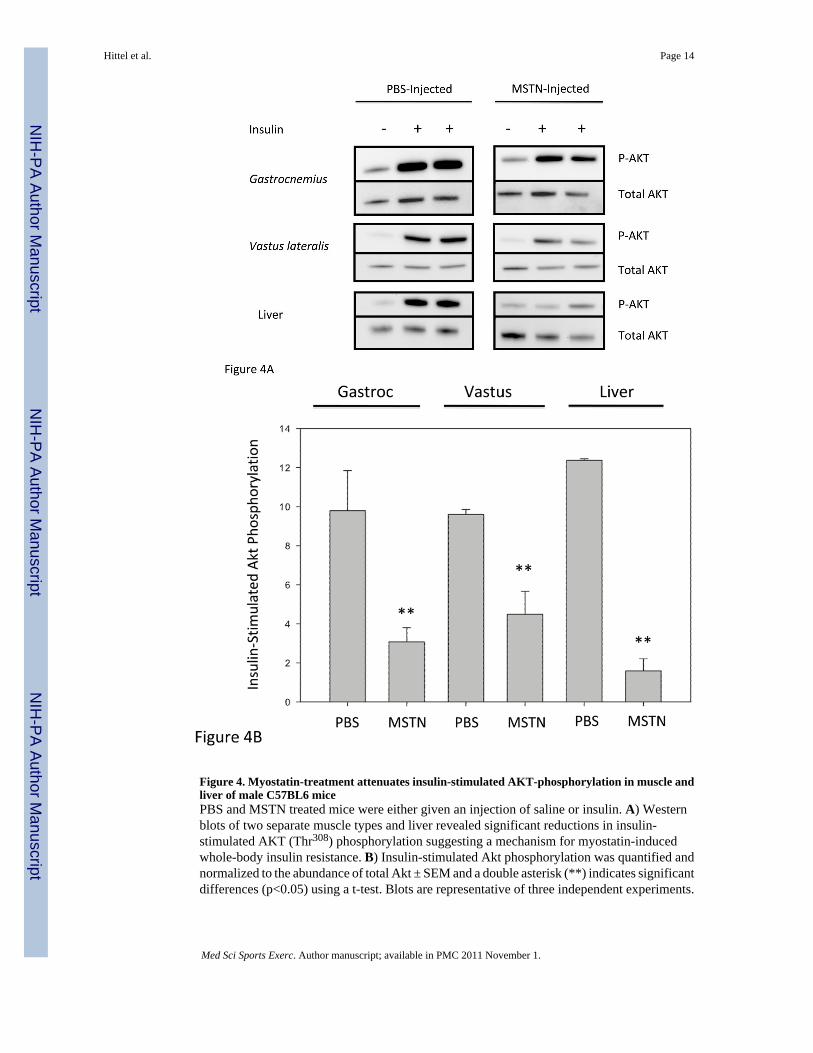
Figure 4. Myostatin-treatment attenuates insulin-stimulated AKT-phosphorylation in muscle andliver of male C57BL6 micePBS and MSTN treated mice were either given an injection of saline or insulin. A) Westernblots of two separate muscle types and liver revealed significant reductions in insulin-stimulated AKT (Thr308) phosphorylation suggesting a mechanism for myostatin-inducedwhole-body insulin resistance. B) Insulin-stimulated Akt phosphorylation was quantified andnormalized to the abundance of total Akt ± SEM and a double asterisk (**) indicates significantdifferences (p<0.05) using a t-test. Blots are representative of three independent experiments.
Hittel et al. Page 14
Med Sci Sports Exerc. Author manuscript; available in PMC 2011 November 1.
NIH
-PA Author Manuscript
NIH
-PA Author Manuscript
NIH
-PA Author Manuscript

NIH
-PA Author Manuscript
NIH
-PA Author Manuscript
NIH
-PA Author Manuscript
Hittel et al. Page 15
Table 1
Baseline and Exercise-Trained Characteristics of Male Subjects (Mean ± SEM).
Characteristic Baseline (n=10) Exercise -Trained (n=10)
Age (years) 53.1 ± 5.5 + 9 Months
Weight 95.3 ± 6.2 95.2 ± 6.7
Lean Mass (kg) 65.4 ± 8.4 64.9 ± 9.0
Fat Mass (%) 30.3 ± 6.3 29.4 ± 5.5
BMI (kg/m2) 30.1 ± 1.1 30.2 ± 1.3
Fasting Insulin (uU/ml) 16.2 ± 4.2 13.8 ± 3.6 **
Plasma Myostatin (ng/ml) 28.7 ± 2.6 22.8 ± 2.7 **
Fasting Glucose (mg/dl) 96.4 ± 4.6 95.4 ± 3.2
VO2 Max (02/kg/min) 29.8 ± 3.1 32.0 ± 3.3 **
Si 2.0 ± 0.6 2.8 ± 0.6 **
Significant differences (**) are P< 0.05, pre vs post exercise training using a paired t-test.
Med Sci Sports Exerc. Author manuscript; available in PMC 2011 November 1.

NIH
-PA Author Manuscript
NIH
-PA Author Manuscript
NIH
-PA Author Manuscript
Hittel et al. Page 16
Table 2
Characteristics of sham treated (PBS) and myostatin treated (MSTN) mice (Mean ± SEM).
Characteristic PBS Treated (n=10) MSTN Treated (n=10)
Mouse Weight (g) 22.1± 0.3 21.9 ± 0.3
Gastroc mass (mg) 138.6 ± 6.4 133.1 ± 9.2
Soleus mass (mg) 7.1 ± 0.7 7.5 ± 1.0
Glucose (mM) 7.7 ± 0.2 8.1 ± 0.2
Insulin (pg/ml) 399.9 ± 56.4 475.0 ± 69.5
Mstn (ng/ml) 15.3 ± 1.7 22.1 ± 2.4 ** (P=0.06) **
Leptin (ng/ml) 3.8 ± 1.1 3.3 ± 0.5
Resistin (ng/ml) 0.9 ± 0.1 1.3 ± 0.2
Adiponectin (ng/ml) 8.9 ± 0.8 10.6 ± 0.7
TNFα (pg/ml) 29.7 ± 2.3 28.6 ± 2.1
No significant differences were observed between treatment groups.
Med Sci Sports Exerc. Author manuscript; available in PMC 2011 November 1.
Copyright © 2022 FDOKUMEN