Aerobic nitrification–denitrification by heterotrophic Bacillus strains
Upload
unesco-iheCategory
view
3download
0
ARTICLE
Temperature Effects on the Aerobic Metabolism ofGlycogen-Accumulating Organisms
Carlos M. Lopez-Vazquez,1,5 Young-Il Song,2 Christine M. Hooijmans,1
Damir Brdjanovic,2 Moustafa S. Moussa,3 Huub J. Gijzen,1,4 Mark C.M. van Loosdrecht5
1Department of Environmental Resources, UNESCO-IHE Institute for Water Education,
Delft, The Netherlands2Department of Urban Water and Sanitation, UNESCO-IHE Institute for Water Education,
Delft, The Netherlands3Civil Engineering Department, Faculty of Engineering Mataria, Helwan University,
Cairo, Egypt4UNESCO Office, Jakarta, UNESCO House, Jakarta, Indonesia5Department of Biotechnology, Delft University of Technology, Julianalaan 67,
2628 BC Delft, The Netherlands; telephone: þ31-15-278-1618; fax: þ31-15-278-2355;
e-mail: [email protected]
Received 20 December 2007; revision received 28 February 2008; accepted 29 February 2008
Published online 12 March 2008 in Wiley InterScience (www.interscience.wiley.com)
. DOI 10.1002/bit.21892ABSTRACT: Short-term temperature effects on the aerobicmetabolism of glycogen-accumulating organisms (GAO)were investigated within a temperature range from 10 to408C. Candidatus Competibacter Phosphatis, known GAO,were the dominant microorganisms in the enriched culturecomprising 93� 1% of total bacterial population as indi-cated by fluorescence in situ hybridization (FISH) analysis.Between 10 and 308C, the aerobic stoichiometry of GAO wasinsensitive to temperature changes. Around 308C, the opti-mal temperature for most of the aerobic kinetic rates wasfound. At temperatures higher than 308C, a decrease on theaerobic stoichiometric yields combined with an increase onthe aerobic maintenance requirements were observed. Anoptimal overall temperature for both anaerobic and aerobicmetabolisms of GAO appears to be found around 308C.Furthermore, within a temperature range (10–308C) thatcovers the operating temperature range of most of domesticwastewater treatment systems, GAOs aerobic kinetic ratesexhibited a medium degree of dependency on temperature(u¼ 1.046–1.090) comparable to that of phosphorus accu-mulating organisms (PAO). We conclude that GAO do nothave metabolic advantages over PAO concerning the effectsof temperature on their aerobic metabolism, and competi-tive advantages are due to anaerobic processes.
Biotechnol. Bioeng. 2008;101: 295–306.
� 2008 Wiley Periodicals, Inc.
KEYWORDS: enhanced biological phosphorus removal(EBPR); glycogen-accumulating organisms (GAO); phos-phorus-accumulating organisms (PAO); temperature;aerobic metabolism; ATP/NADH ratio (d); aerobic kinetics
Correspondence to: M.C.M. van Loosdrecht
� 2008 Wiley Periodicals, Inc.
Introduction
In the last years, enhanced biological phosphorus removal(EBPR) has confirmed to be an economical and sustainableprocess for phosphorus removal in activated sludge waste-water treatment. The EBPR process requires a relatively basicconfiguration: alternating anaerobic and anoxic/aerobicstages. Thus, directing the influent into the anaerobic tankand recirculating the activated sludge through the differentphases favor the enrichment in the system of phosphorus-accumulating organisms (PAO) (Mino et al., 1998).
Despite that the EBPR process configuration createsfavorable conditions for the development and enrichment ofPAO, several reports have described the presence, and evendominance, of glycogen-accumulating organisms (GAO) ateither lab- (Cech and Hartman, 1993; Filipe et al., 2001a;Satoh et al., 1994) or full-scale biological phosphorusremoval systems (Crocetti et al., 2002). GAO, like PAO, arealso able to store volatile fatty acids (VFA) under anaerobicconditions as poly-b-hydroxyalkanoates (PHA) and utilizethis storage polymer in the aerobic phase as energy andcarbon source (Zeng et al., 2003). However, contrary to PAOmetabolism, poly-phosphate does not play a role in themetabolism of GAO. Unlike in PAO metabolism, thehydrolysis of intracellular stored glycogen supplies allthe energy and reducing power required for the anaerobicstorage of PHA and to cover the anaerobic maintenancerequirements (Filipe et al., 2001a; Zeng et al., 2003).Subsequently, under aerobic conditions, PHA is oxidized for(1) glycogen replenishment, (2) biomass growth, and (3)aerobic maintenance purposes (Zeng et al., 2003). Since
Biotechnology and Bioengineering, Vol. 101, No. 2, October 1, 2008 295

GAO are able to take up carbon sources anaerobicallywithout contributing to the phosphorus removal processthey are seen as potential competitors of PAO. Therefore,from an EBPR process perspective, GAO are considered tobe undesirable microorganisms.
Among several studies regarding the influence of environ-mental and operating conditions on the EBPR process,different authors have underlined temperature as one of thedeterminant factors to understand the competition betweenPAO and GAO (Erdal et al., 2003; Lopez-Vazquez et al.,2007; Panswad et al., 2003; Whang and Park, 2006). Theseresearchers agreed that temperature has a major influ-ence on the maximum anaerobic substrate uptake rates ofthese organisms providing important insights to improvethe understanding of their interaction and competition.
Despite the fact that biomass production and glycogenstorage take place under aerobic conditions, limitedattention has been paid to the effects of temperature onthe aerobic metabolism of GAO as opposite to PAO whereBrdjanovic et al. (1997, 1998) performed a systematic studyconcerning the temperature effects on the biologicalphosphorus removal. In that study, they were able todescribe the temperature dependencies of the differentprocesses involved in PAOs aerobic metabolism from 5 to308C. A similar systematic study regarding the temperatureeffects on the different processes involved in the aerobicmetabolism of a GAO culture has not been reported yet.Such a study could provide important information tounderstand the occurrence of these microorganisms at full-scale wastewater treatment plants (WWTP). Furthermore,the aerobic temperature dependencies of GAO could becombined with their anaerobic temperature dependencies(Lopez-Vazquez et al., 2007) to model the interactionbetween PAO and GAO at different temperatures. This mayfurthermore lead to better understanding of the PAO-GAOcompetition helping to comprehend the stability of theEBPR process at different temperature. Therefore, there is aclear need for studying and determining the temperaturedependencies of the aerobic metabolism of GAO.
The temperature effects on (1) the aerobic stoichiometryand (2) the aerobic kinetics of GAO were evaluated using alab-enriched culture. Since the main objective was toinvestigate the effects on the metabolism of these micro-organisms, short-term temperature changes on sludgecultivated at 208C were studied. The research was carriedout by executing aerobic batch tests within a temperaturerange from 10 to 408C which covers the operatingtemperature interval of most of domestic and industrialactivated sludge wastewater treatment plants.
Materials and Methods
Continuous Operation of the Sequencing BatchReactor (SBR)
A GAO culture was enriched in a double-jacketed lab-scalesequencing batch reactor (SBR) as described in a previous
296 Biotechnology and Bioengineering, Vol. 101, No. 2, October 1, 2008
report (Lopez-Vazquez et al., 2007). The SBR had a workingvolume of 2.5 L. Activated sludge from a domestic WWTP(Nieuwe Waterweg, Hoek van Holland, The Netherlands)was used as inoculum. The SBR was operated at 20� 0.58Cin cycles of 6 h (2.25 h anaerobic, 2.25 h aerobic, and 1.5 hsettling phase). pH was maintained at 7.0� 0.1 by dosing0.3 M HCl and 0.2 M NaOH. At the beginning of the cycle,1.25 L of synthetic medium was fed to the SBRs over a periodof 5 min. The SBR was operated with a solids retention time(SRT) of 10 days and a hydraulic retention time (HRT) of12 h. Further details regarding the operating conditions ofthe SBR can be found elsewhere (Lopez-Vazquez et al.,2007).
The aerobic batch experiments at different temperatureswere performed in a separate reactor after the biomassactivity reached steady-state conditions. Thus, the SBR wasonly used as a source of enriched GAO biomass.
Operation of the Batch Reactor
A double-jacketed laboratory fermenter with a maximalvolume of 0.5 L was used for the execution of the aerobicbatch experiments. The experiments were performed atcontrolled temperatures and pH (7.00� 0.05). pH wasmaintained by dosing 0.2 M HCl and 0.2 M NaOH. At thebeginning of each experiment, enriched GAO sludge wasmanually transferred from the parent SBR to the batchreactor. The amount of transferred sludge was 450 mL,which was higher than the amount of sludge wasted dailyfrom the SBR. In order to avoid major disturbances on thecontinuous operation and steady-state conditions of theparent SBR, the waste of sludge was stopped for almost2 days after the execution of any of the aerobic batch tests tocompensate for the sludge transfer. The sludge used in thebatch tests was not returned to the SBR. A double-jacketedrespirometer with a working volume of 10 mL wasconnected to the batch reactor for the online measurementof the oxygen uptake rate (OUR). Due to the fastrespirometric activity observed within the first minutes ofthe aerobic batch test, sludge was pumped (circulated) fromthe batch reactor to the respirometer in cycles of 3 min in thefirst 30–40 min (1 min pumping then the recirculation wasstopped and the oxygen depletion was measured for 2 min)and in cycles of 6 min during the rest of the assay (1 minpumping and the oxygen depletion was measured for 5 min)as described by Brdjanovic et al. (1997). For the deter-mination of the oxygen requirements for aerobic main-tenance processes, the length of the cycle was 25 min (5 minpumping per cycle and 20 min recording the oxygendepletion). Measured data were continuously stored in acomputer. Minimum oxygen concentration in the double-jacketed respirometer was always kept above 2 mg/L.
Synthetic Media
Synthetic media supplied to the GAO SBR at the begin-ning of the cycle contained 850 mg/L of NaAc�3H2O

(12.5 C-mmol/L, approximately 400 mg COD/L) and107 mg/L of NH4Cl (2 N-mmol, 28 mg NHþ
4 -N/L) as carbonand nitrogen sources, respectively. In order to suppress thegrowth of PAO and favor the development of an enrichedGAO culture, phosphorus concentration in GAO SBRinfluent was limited to 2.2 mg PO3�
4 -P/L (0.07 P-mmol/L)leading to a P/COD influent ratio of about 1/200 (weight/weight) (Liu et al., 1997). Two milligrams per liter of allyl-N-thiourea (ATU) were added to inhibit nitrification. Therest of minerals and trace metals present in the syntheticmedia were prepared as described by Smolders et al. (1994).Prior to use, synthetic media were autoclaved at 1108Cfor 1 h.
Analyses
The performance of the GAO SBR was regularly monitoredby measuring orthophosphate (PO3�
4 -P), mixed liquorsuspended solids (MLSS) and mixed liquor volatilesuspended solids (MLVSS). In batch experiments, ortho-phosphate (PO3�
4 P), oxygen uptake rate (OUR), MLSS,MLVSS, poly-hydroxy-butyrate (PHB), poly-hydroxy-valerate (PHV), glycogen and ammonium (NHþ
4 -N)concentrations were measured. All off-line analyses oforthophosphate, MLSS, MLVSS, and ammonium weredetermined in accordance with Standard Methods(A.P.H.A., 1995). The OUR profiles were calculated basedon the oxygen depletion (respirometric) profiles measuredin the 10 mL-respirometer using linear regression and takinginto account that the solubility of oxygen in water varieswith temperature. The PHA content (as PHB and PHV) ofthe freeze-dried biomass was determined according to themethod described by Smolders et al. (1994). Glycogen wasalso determined following the method described bySmolders et al. (1994) but extending the digestion phase at1008C from 1 to 5 h.
Fluorescence in situ hybridization (FISH) was performedas described in Amann (1995). In order to determine themicrobial population distribution in the GAO SBR, FISHprobes used in this study were EUBMIX (mixture of probesEUB 338, EUB338-II, and EUB338-III) to target the entirebacterial population (Amman et al., 1990; Daims et al.,1999); PAOMIX (mixture of probes PAO462, PAO651, andPAO 846) to target the Betaproteobacteria Accumulibacterspp. (Crocetti et al., 2000); GAOMIX (equal amounts ofGAOQ989 and GB_G2) for the GammaproteobacteriaCompetibacter spp. (Crocetti et al., 2002; Kong et al.,2002); DF1MIX (TFO_DF218 plus TFO_DF218) for theAlphaproteobacteria from Cluster 1 Defluviicoccus spp.(Wong et al., 2004); DF2MIX (DF988, DF1020 togetherwith helper probes H966, and H1038) for Cluster 2Defluviicoccus spp. (Meyer et al., 2006); and, SBR9-1a forthe Alphaproteobacteria Sphingomonas spp. (Beer et al.,2004). Large aggregates were avoided by mild sonication(5 W, 30 s). The quantification of the population distri-bution was carried out using the MATLAB image processing
toolbox (The Mathworks, Natick, MA) as described inLopez-Vazquez et al. (2007). Around fifteen separaterandomly chosen images were evaluated with final resultsreflecting the average fractions of Accumulibacter, Compe-tibacter, Defluviicoccus Cluster 1 and 2 and Sphingomonaspresent in corresponding activated sludge samples. Micro-bial population fractions were expressed as percentage ofEUB. The standard error of the mean (SEM) was calculatedas the standard deviation of the area percentages divided bythe square root of the number of images analyzed.
Aerobic Batch Test Experiments on the Stoichiometryand Kinetics of GAO
One hour before the end of the anaerobic phase, 450 mL ofthe GAO culture enriched at 208C in the parent SBR weremanually transferred to the batch reactor. At this time, allHAc supplied at the beginning of the cycle had been totallytaken up. The working temperature of the batch reactor(10, 20, 25, 30, 35, and 408C) was set 1 h before the sludgetransfer. Once the sludge was transferred to the batchreactor, the sludge was stirred and kept under anaerobicconditions for 1–1.5 h before starting the correspondingaerobic batch test in order to adjust the microorganisms tothe new temperature. During this period, N2 gas wascontinuously sparged to keep anaerobic conditions and toavoid oxygen intrusion. After this acclimation period, thesludge was exposed to aerobic conditions. Air was conti-nuously introduced into the reactor at a flow rate of 60 L/hand the sludge was constantly stirred at 500 rpm during thewhole batch test. All aerobic batch tests experiments had a2 h length. Once the aerobic conditions started, an extensivecharacterization of both liquid phase (orthophosphate,ammonium, and OUR) and biomass (PHB, PHV, glycogen,MLSS, and MLVSS) was performed throughout the 2-haerobic batch tests.
Aerobic Batch Test Experiments on the Aerobic ATPMaintenance Coefficient (mO
ATP) of GAO
This experiment followed the experiment on aerobicstoichiometry and kinetics. As the sludge was alreadyexposed to the aerobic environment for 2 h, the experimentcontinued by extended aeration for 24 h without substrateaddition. A steady respiration rate in the absence of substrateindicated the oxygen requirements for cell maintenance ormOS (the specific oxygen demand for maintenance, in molO2/C-mol biomass/h). The energy required to cover theaerobic maintenance needs, as adenosine triphosphate(ATP), was expressed in terms of the aerobic maintenancecoefficient mO
ATP (in mol ATP/C-mol biomass/h units). Foreach aerobic batch test, the mO
ATP coefficient was calculatedbased on the observed mOS and according to the metabolicmodel of GAO (Zeng et al., 2003).
Lopez-Vazquez et al.: Temperature Effects on GAO 297
Biotechnology and Bioengineering

Determination of the Aerobic Stoichiometryand Kinetics of GAO
Glycogen production (rGLY), OUR (rO2 ), and PHA (rPHA),PHB (rPHB), and PHV (rPHV) consumption, biomassproduction (rX) and the oxygen consumed (O2) per activebiomass ratio (O2/active biomass) were the kinetic rates ofinterest in this study. The maximum specific kinetic rates atthe different studied temperatures were determined bylinear regression based on the carbon profiles measuredfrom the corresponding batch experiments. Maximumspecific kinetic rates were expressed in C-mol/C-mol activebiomass/h units. The active biomass was determined as thevolatile suspended solids concentration excluding the PHB,PHV and glycogen contents (active biomass¼MLVSS–PHB–PHV–glycogen). Active biomass was used in order todistinguish between biomass and organic and inorganicstorage products since biomass can be made up of 50% ofinternal storage products. In order to calculate the specificrates, active biomass concentrations were expressed in C-mol units by taking into account the GAO biomasscomposition (CH1.84O0.5N0.19) determined by Zeng et al.(2003).
Following the approach suggested by Zeng et al. (2003),biomass production (rX) from each batch experiment wascalculated based on the aerobic ammonium consumptionmeasured during the aerobic tests considering thatnitrification was inhibited due to the continuous additionof ATU in the influent. The O2/active biomass ratio(in mol O2/C-mol biomass units) was obtained by quan-tifying the total amount of oxygen consumed in each aerobicbatch test (area below the OUR profile curve) excluding theoxygen requirements for maintenance.
The aerobic stochiometry was calculated based on themeasured aerobic kinetic rates and using the overallequations for the conversion of PHA (rPHA) and oxygen(rO2 ) (Zeng et al., 2003):
� rPHA ¼ 1
Ymaxsgly
rGLY þ 1
Ymaxsx
rX þ mSXGAO (1)
� rO2 ¼1
Ymaxogly
rGLY þ 1
Ymaxox
rX þ mOSXGAO (2)
where, rPHA is the PHA degradation profile observed in theaerobic batch test (rPHA¼ rPHB þ rPHV); rO2 is the OURsprofile computed during the 2-h aerobic test; Ymax
sgly and Ymaxsx
are the maximum yields of glycogen and biomassproduction on PHA, respectively; mS is the specific PHAdemand for maintenance; Ymax
ogly and Ymaxox are the maximum
yields of glycogen and biomass production on oxygen,respectively; mOS is the specific oxygen demand formaintenance; and, XGAO is the active biomass concentra-tion. Theoretically, mS is the energy consumption formaintenance of the cell integrity (caused by basic metabolicenergy requirements such as membrane potential, renewal
298 Biotechnology and Bioengineering, Vol. 101, No. 2, October 1, 2008
of proteins, etc.) that, under the absence of externalsubstrates, utilizes the internal stored substrate PHA (vanLoosdrecht and Henze, 1999). Meanwhile, mOS representsthe oxygen demand of the cells for maintenance, and it isindependent of the presence of external (HAc) or internal(PHA) substrates. All maximum conversion yields areexpressed in C-mol/C-mol units. mS and mOS are in C-molPHA/C-mol biomass/h and mol O2/C-mol biomass/h units,respectively.
According to the aerobic metabolic models of PAO andGAO (Murnleitner et al., 1997; Smolders et al., 1994; Zenget al., 2003), all maximum aerobic yields are coupled, andfunction of the ATP/NADH ratio (d). d is a measure of theefficiency of the oxidative phosphorylation with a maximaltheoretical value of 3. It indicates the amount of energy, asATP, produced per nicotinamide adenine dinucleotide(NADH) oxidized in the oxidative phosphorylation. At pH7.0 and for an acetate-enriched GAO culture, all maximumyields can be expressed as function of d as (Zeng et al., 2003):
1
Ymaxsgly
¼ 2dþ 1:26
2:29dþ 0:53(3)
1
Ymaxsx
¼ 2:13dþ 2:29
2:29dþ 0:53(4)
mS ¼ mOATP
2:29dþ 0:53(5)
1
Ymaxogly
¼ 0:92
2:29dþ 0:53(6)
1
Ymaxox
¼ 2:057
2:29dþ 0:53(7)
mOS ¼1:146mO
ATP
2:29dþ 0:53(8)
If Equations (3–8) are substituted in Equations (1) and(2) the system is simplified to two equations and sixvariables (rPHA, rO2 , rGLY, rX, d and mO
ATP) all of them, exceptd, can be directly determined from the aerobic batch tests.This may simplify the system to two equations and onevariable (d). However, since fluctuations were observed inthe aerobic glycogen profiles rGLY was also considered as avariable. This led to a system of two equations and twovariables (d and rGLY). AQUASIM (Reichert, 1994) was usedto compute d and rGLY by simultaneously fitting theexperimental time variable PHA concentrations and OURobserved in the aerobic batch tests to the rPHA and rO2
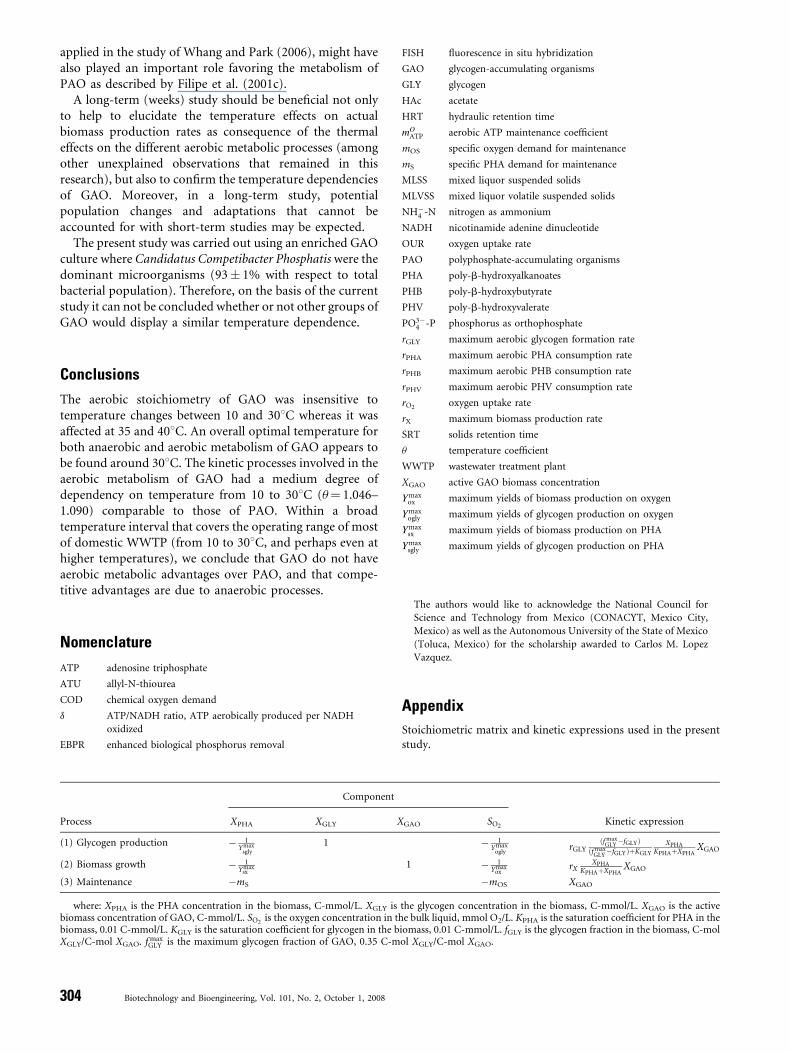
profiles defined by the two-equation system. The differentkinetic expressions used to calculate d and rGLY are shown inAppendix.

Temperature Coefficients
In this study, the effect of temperature on a constant raterelative to a standard temperature (here 2938K) wasexpressed by the simplified Arrhenius equation:
rT ¼ r293uðT�293Þ1 (9)
where the rT is the reaction at the temperature T, T is thetemperature in 8K and u1 is the temperature coefficient.Equation (9) proved to be suitable for fitting the results andallowed to comparing them with the temperature coeffi-cients of different processes considered in mathematicalmodels (Henze et al., 2000).
In order to describe the decline in bacterial activity abovethe optimal thermal point a similar Arrhenius expressionwas used:
rT ¼ rToptuðT�ToptÞ2 (10)
In Equation (10), rTopt is the maximum kinetic rateobserved within the studied temperature interval; Topt is thetemperature at which rTopt occurred (optimal temperature ofthe kinetic rate); and, u2 is the temperature coefficient usedto describe the decline in activity at a temperature higherthan the optimal (Bazin and Prosser, 2000).
Results
Enrichment of the GAO Culture
The SBR was operated for more than 100 days before theaerobic batch tests were performed. It reached steady-stateconditions within the first 50 days of operation. The biomassactivity observed under steady-state conditions in the SBRdisplayed the characteristic phenotype of an enriched GAO
Figure 1. Glycogen accumulating organisms enriched in the parent sequencing bat
enriched culture under steady state conditions: acetate (^), glycogen (*), PHB (&), PHV (
by applying Fluorescence in situ Hybridization (bar indicates 10 mm, EUBacteria: blue, C
superposition of EUBmix and GAOmix probes.
culture (Fig. 1a): complete anaerobic HAc uptake associatedwith glycogen consumption and PHA production (as PHBand PHV) and an anaerobic P-release less than 2 mg/L.Aerobically, the previously stored PHA was oxidized,glycogen was produced and ammonium was consumed.Nitrate and nitrite were not detected during the operation ofthe SBR. Average MLSS and MLVSS concentrations at theend of the aerobic phase were 2,834 and 2,653 mg/L,respectively. The MLVSS/MLSS ratio of 0.94 implied thata very low inorganic fraction (e.g., poly-phosphate) wasstored. A quantification of the biomass populationdistribution obtained by FISH analysis indicated thatCompetibacter comprised around 93� 1% of total bacterialpopulation (as EUB) whereas Accumulibacter and Defluvii-coccus were present in relatively low fractions (<1%) andSphingomonas were not detected (Fig. 1b). Other micro-organisms, likely ordinary heterotrophs growing on lysisproducts, made up the rest of the microbial community(5� 1%). Based on the biomass activity, low ash contentand FISH results, it can be concluded that GAO were thedominant microorganisms present in the parent SBR.
Aerobic Stoichiometry of GAO
The temperature effects on the aerobic stoichiometry ofGAO were evaluated considering that all aerobic metabolicprocesses are coupled and a function of the ATP/NADHratio (d) (Zeng et al., 2003). Substituting Equations (3–8) inEquations (1) and (2), and employing the kinetic ratesdirectly quantified from the results of the aerobic batch tests(rPHA, rX, and mO
ATP), led to a system of two equationswith two unknown variables (d and rGLY). Using theparameter estimation toolbox of Aquasim (Reichert, 1994)the two-equation system was solved for each correspondingtemperature by simultaneously fitting the experimentalPHA and OUR profiles to the profiles calculated with themodified Equations (1) and (2). Figure 2 shows the
ch reactor at 208C, pH 7.0� 0.1 and 10 days SRT: (a) cycle profiles observed in the
&) orthophosphate (~), and ammonium ( ); and (b) bacterial populations distribution
ompetibacter: red, and Accumulibacter green). Competibacter appear violet due to
Lopez-Vazquez et al.: Temperature Effects on GAO 299
Biotechnology and Bioengineering

Figure 2. Measured and fitted aerobic carbon and oxygen uptake rate (OUR) profiles observed in the aerobic batch test executed at 208C: (a) PHA (&) and glycogen (*)
profiles; (b) measured OUR (*).
experimental and fitted PHA, glycogen and OUR profilesfrom the aerobic batch test executed at 208C.
In average, the COD balances from the different aerobicbatch tests closed to 97� 2%. In order to verify thestoichiometry of the aerobic metabolic processes used in thecurrent study, the different aerobic and anaerobic processeswere integrated in a metabolic model for GAO (Lopez-Vazquez et al., in preparation). At steady-state conditions(that according to the model were reached at around 30days), the GAO integrated metabolic model predicted anactive biomass concentration of 87 C-mmol/L which is closeto the average concentration of 96� 4 C-mmol/L observedin the GAO SBR (approximately 9% difference).
The different estimated d values are shown in Figure 3. Anaverage d-value of 1.73� 0.37 was observed from 10 to 408C.This ratio is identical to the d-value of 1.73 applied by Zeng
Figure 3. ATP/NADH ratios (d) as function of temperature. Error bars indicate
the standard deviation of the estimations.
300 Biotechnology and Bioengineering, Vol. 101, No. 2, October 1, 2008
et al. (2003) and in the range of the d experimentallycalculated by Smolders et al. (1994) (d¼ 1.85) for PAO.Nevertheless, two distinctive trends were identified: from 10to 308C an average d of 1.95� 0.19 was measured whileabove 308C the average d-value was 1.28� 0.03.
The maximum aerobic yields for each evaluatedtemperature were calculated using the different d valuespreviously estimated and Equations (3),(4),(6) and (7).Table I presents the different maximum aerobic yieldscomputed for the temperature interval of study. Regardlessthe different d ratios observed from 10 to 408C, the aerobicstoichiometry seemed to be insensitive to temperaturefluctuations when comparing the average yields from thisstudy with the stoichiometric yields found by Zeng et al.(2003). Indeed, Ymax
sgly and Ymaxsx were insensitive to
temperature. However, temperature had a slight influenceon Ymax
ogly and Ymaxox showing a decrease of about 30% in the
aerobic yields at temperatures higher than 308C comparedto the trend observed below 308C (Table I).
Aerobic Kinetics of GAO
Figure 4 displays the aerobic kinetic parameters measured inthe different aerobic batch tests. In general, rGLY, rPHA, rPHB,and rPHV (Fig. 4a–d) increased gradually as temperatureraised from 10 to 308C finding their optimal temperature ataround 308C. Above 308C, bacterial activity declined but,even at 408C, it did not cease. As Table II shows, the rGLY andrPHA observed in this study at 208C are similar to the kineticrates reported by Filipe et al. (2001b) but differ from thevalues presented by Zeng et al. (2003). Interestingly, the rPHA
reported by Smolders et al. (1995b) and Brdjanovic et al.(1997), which corresponds to an enriched PAO culture,resembles the rPHA found in this paper at 208C; however, therGLY for PAO is lower likely due to the lower glycogenrequirements of these organisms.

Table I. Aerobic stoichiometric parameters observed in this study.
Temperature
(8C)
d
(ATP/NADH ratio)
Ymaxsgly
(C-mol GLY/C-mol PHA)
Ymaxsx
(C-mol X/C-mol PHA)
Ymaxogly
(C-mol GLY/mol O2)
Ymaxox
(C-mol X/mol O2) References
10 2.09 0.98 0.79 5.78 2.72 This study
20 1.70 0.96 0.75 4.96 2.27
25 2.10 0.98 0.79 5.88 2.74
30 1.90 0.98 0.78 5.57 2.53
35 1.26 0.92 0.69 3.86 1.74
40 1.30 0.92 0.70 3.92 1.78
Average 1.73� 0.37 0.95� 0.03 0.75� 0.04 4.99� 0.91 2.30� 0.45
20 1.73 0.95 0.75 4.89 2.18 Zeng et al. (2003)
On the other hand, biomass production rates appeared tobe insensitive to temperature from 20 to 358C meanwhile, at10 and 408C, no biomass production was detected (Fig. 4e).Unlike the other kinetic parameters, the O2/biomass ratioincreased continuously up to 408C without exhibiting anydecline in activity (Fig. 4f).
Excluding the O2/biomass ratio, whose temperaturecoefficient was 1.046, the temperature coefficients up to308C for the different kinetic parameters fluctuated between1.077 and 1.090. Accordingly, the aerobic processes involved
Figure 4. Effects of temperature on the aerobic kinetic rates of glycogen accumulating
formation rate; (d) rPHV, PHV formation rate; (e) rX, biomass production rate; and, (f) O2/a
in the metabolism of GAO appear to have a medium degreeof dependency on temperature (Henze et al., 2000).
Aerobic ATP Maintenance Coefficient (mOATP) of GAO
mOATP was moderately affected by temperature (u¼ 1.081)
(Fig. 5). In particular, the mOATP observed at 208C (0.013 mol
ATP/C-mol biomass/h) was in the range of values re-ported elsewhere for PAO and GAO enriched cultures
organisms: (a) rGLY, glycogen formation rate; (b) rPHA, PHA formation rate; (c) rPHB, PHB
ctive biomass ratio.
Lopez-Vazquez et al.: Temperature Effects on GAO 301
Biotechnology and Bioengineering

Table II. Maximum aerobic kinetic rates at 208C and pH 7.0 observed in the present study and in other reports.
Organism rPHA (C-mol PHA/C-mol X/h) rGLY (C-mol GLY/C-mol X/h) References
GAO 0.08 0.05 Zeng et al. (2003) a
0.14� 0.01 0.14� 0.04 Filipe et al. (2001b)
0.12� 0.01 0.13� 0.02 This study
PAO 0.09 — Brdjanovic et al. (1997)
0.12 0.04 Smolders et al. (1995b)aKinetic rates calculated based on figures and data provided.
(0.012–0.019 mol ATP/C-mol biomass/h) (Brdjanovic et al.,1997; Smolders et al., 1995b; Zeng et al., 2003).
Discussion
Temperature Effects on the Aerobic Stoichiometry
A series of aerobic batch tests from 10 to 408C were executedto address the temperature effects on the aerobic stoichio-metry and kinetics of GAO. The short-term effects werestudied in order to be able to evaluate the temperature effecton the metabolic rates without an influence of bacterialpopulation changes that might occur with long-termstudies. The average d-value observed from 10 to 308C(1.95� 0.19) was in the range of different ratios foundelsewhere (Table III). However, the d values calculated attemperatures higher than 308C (1.28� 0.03) clearly differedfrom the reported ratios. A lower d ratio suggests that theoxidative phosphorylation was less efficient as temperatureincreased over 308C. This was reflected in lower aerobicmaximum yields (Table I) and resulted in higher PHA andoxygen requirements for glycogen production, biomassgrowth and maintenance. In addition, as temperature raisedabove 308C a decline in rPHA and rGLY was observed (Fig. 4)as well as a continuous increase on mO
ATP (Fig. 5). This is inaccordance with Tijhuis et al. (1993) who concluded thattemperature has a major influence on the maintenancerequirements of microorganisms at temperatures higherthan 308C, affecting the biomass growth rates. Correspond-
Figure 5. Temperature effects on the aerobic maintenance coefficient (mOATP)
of glycogen accumulating organisms.
302 Biotechnology and Bioengineering, Vol. 101, No. 2, October 1, 2008
ingly, Krishna and van Loosdrecht (1999a,b) observed lowerpolymer transformation rates and higher maintenancerequirements as temperature rose from 15 to 358C leadingto lower biomass growth yields.
On the basis of the short-term temperature experimentsexecuted in the present study, we conclude that the aerobicstoichiometry of GAO is insensitive to temperature changesfrom 10 to 308C whereas temperature causes a major effecton the aerobic stoichiometric parameters of GAO as itincreases above 308C. Long-term cultivation studies need tobe carried out to assess whether a GAO population can adaptto these temperatures.
Temperature Effects on the Aerobic Kinetics
Observed rGLY as well as rPHA were different from the ratesreported by Zeng et al. (2003) (Table II). On the basis of thisstudy a direct explanation could not be found. It couldpossibly be related to the PHA content of the cells ( fPHA).For PAO cultures, fPHA, which is dependent on the substratefeed to the system and biomass content, determines thereaction rates of the aerobic processes (Smolders et al.,1995a). Zeng et al. (2003) applied an aerobic HRT of 12 h(six cycles of 4 h per day with a 2 h aerobic phase per cycle)while in this study, likewise Filipe et al. (2001b), an aerobicHRT of 9 h was used (four cycles of 6 h per day with a 2.25 haerobic stage per cycle). In the three lab set-ups, the initialacetate concentration per cycle was similar (6.25 C-mmol/L)and, in combination with the active biomass concentrationand aerobic HRT, resulted in lower initial aerobic fPHA andPHA load in the system of Zeng et al. (2003) (0.12 C-molPHA/C-mol X and 1.4 C-mol PHA/C-mol X/day, respec-tively) compared to the fractions and loads observed in thecurrent study (0.17 C-mol PHA/C-mol X, 1.8 C-mol PHA/C-mol X/day) and elsewhere (0.20 C-mol PHA/C-mol X, 2.1C-mol PHA/C-mol X/day) (Filipe et al., 2001b). This mightsuggest that aerobic reaction rates proceed slower as result oflower initial aerobic fPHA and PHA load.
Despite that the polymer transformation rates suffered adecline in activity at temperatures higher than 308C,temperature seemed not to have caused any effect on thebiomass production rates between 20 and 358C (Fig. 4e).There is a possibility that a consistent trend was not founddue to small differences in measured values that may laywithin the margin of error of the analytical technique(Brdjanovic et al., 1997). Nevertheless, between 20 and 308C,the biomass growth rates were similar and had a relatively

Table III. Comparison between different ATP/NADH ratios (d) reported in the literature.
System d (ATP/NADH ratio) Calculation method References
Aerobic activated sludge 1.60 Estimated based on biomass activity
and metabolic pathways
Beun et al. (2000)
Aerobic activated sludge 2.56� 0.08 Estimated based on biomass activity Sin et al. (2005)
Pure culture (Paracoccus pantotrophs) 1.84 Estimated based on biomass activity and
metabolic pathways
van Aalst-van Leewen et al.
(1997)
Aerobic activated sludge 1.40–1.80 Estimated based on biomass activity and
metabolic pathways
Dircks et al. (2001)
Enriched PAO culture 1.85 Directly quantified Smolders et al. (1994)
Enriched PAO culture 1.46 Directly quantified Brdjanovic et al. (1997)
Enriched GAO culture 1.74 Estimated based on biomass activity and
metabolic pathways
Filipe et al. (2001d)
Enriched GAO culture 1.73 Average d-ratio from Beun et al. (2000),
Smolders et al. (1994) and Dircks et al. (2001)
Zeng et al. (2003)
Enriched GAO culture 1.73� 0.37 Estimated based on biomass activity and
metabolic pathways
Average ratio observed in
this study
low standard deviation (�15%) which suggests that theerrors in the analytical determination technique were notvery high.
At 10 and 408C, no biomass growth was detected (Fig. 4e).Either GAOs growth was too low, being difficult to measure,or temperature had an inhibitory effect restricting theirgrowth at these temperatures. A severe increase inmaintenance requirements, as previously discussed, seemedto be the reason of the limited growth of GAO at 408C.Interestingly, in a previous report (Lopez-Vazquez et al.,2007), 408C had a detrimental effect on the anaerobicmetabolism of GAO. However, in the present study, aerobicactivity was still observed at this temperature (Fig. 4)although, as previously mentioned, no biomass growth wasobserved.
The temperature coefficients found for the different GAOaerobic processes (u¼ 1.046–1.090) are in the range of thecoefficients reported by Brdjanovic et al. (1997) for PAO(u¼ 1.035–1.081) indicating that PAO and GAO havesimilar aerobic temperature dependencies from 10 to 308C.This implies that the temperature effects on the anaerobicmetabolism of PAO and GAO (Lopez-Vazquez et al., 2007)have a higher influence on the PAO-GAO competition thanthe aerobic temperature effects.
Implications on the PAO-GAO Competition
The results of our study suggest that the anaerobic andaerobic metabolisms of GAO have different temperaturedependencies. This may have important implications onthe PAO-GAO competition influencing the stability of theEBPR process.
Regarding GAOs anaerobic metabolism, GAO haveimportant metabolic advantages over PAO from 20 to358C (Lopez-Vazquez et al., 2007). Below 208C, bothmicroorganisms exhibit similar temperature dependenciesconcerning the maximum HAc uptake rate; however, PAOseemed to be favored since they present lower anaerobic
maintenance requirements (Lopez-Vazquez et al., 2007) andGAO exhibit a low biomass growth rate (this study).Therefore, taking into account the combined temperatureeffects on the anaerobic and aerobic metabolisms, tem-peratures higher than 208C are more favorable for GAOshowing an optimal temperature around 308C, whereas,below 208C, PAO have metabolic advantages with anoptimal temperature that seems to lay around 208C(Brdjanovic et al., 1997; Lopez-Vazquez et al., 2007). Thesefindings could help to explain the stability of the EBPRprocess in colder regions (air temperature below 208C)(Meijer et al., 2002; Tykesson et al., 2005; van Veldhuizenet al., 1999; YdstebØ et al., 2000).
Concerning the temperature effects in warm regions(temperature higher than 208C), Panswad et al. (2003), in along-term study, observed that PAO were outcompeted byGAO in an EBPR SBR operated at 308C and 10 days SRT.However, the GAO culture could not be sustained whenswitching the temperature from 30 to 358C. The dominanceand disappearance of GAO could be explained on the basisof the temperature dependencies observed in the presentstudy: (a) the optimal temperature for GAO around 308C,and (b) the lower aerobic maximum yields and highermaintenance requirements as temperature rises above 308C.
In a similar study, Whang and Park (2006) observed apopulation shift from an enriched-GAO to an enriched-PAO culture at 308C when decreasing the SRT from 10 to3 days at pH 7.5. Whang et al. (2007) hypothesized that alower GAO biomass yield on PHA than that of PAO mightcause the change in population when the SRT wasshortened. However, according to the present study, theoptimal temperature of GAO seems to be found around308C, a reduction in the maximum aerobic yields was onlyobserved above 308C, and biomass growth rates appear to beindependent of temperature changes from 20 to 358C. Atthe applied operating conditions (3 days SRT and pH 7.5),the observations of Whang and Park (2006) imply that GAOrequire a higher minimum SRT than PAO. Likely, otherfactors besides temperature, such as the higher pH (7.5)
Lopez-Vazquez et al.: Temperature Effects on GAO 303
Biotechnology and Bioengineering
applied in the study of Whang and Park (2006), might havealso played an important role favoring the metabolism ofPAO as described by Filipe et al. (2001c).
A long-term (weeks) study should be beneficial not onlyto help to elucidate the temperature effects on actualbiomass production rates as consequence of the thermaleffects on the different aerobic metabolic processes (amongother unexplained observations that remained in thisresearch), but also to confirm the temperature dependenciesof GAO. Moreover, in a long-term study, potentialpopulation changes and adaptations that cannot beaccounted for with short-term studies may be expected.
The present study was carried out using an enriched GAOculture where Candidatus Competibacter Phosphatis were thedominant microorganisms (93� 1% with respect to totalbacterial population). Therefore, on the basis of the currentstudy it can not be concluded whether or not other groups ofGAO would display a similar temperature dependence.
Conclusions
The aerobic stoichiometry of GAO was insensitive totemperature changes between 10 and 308C whereas it wasaffected at 35 and 408C. An overall optimal temperature forboth anaerobic and aerobic metabolism of GAO appears tobe found around 308C. The kinetic processes involved in theaerobic metabolism of GAO had a medium degree ofdependency on temperature from 10 to 308C (u¼ 1.046–1.090) comparable to those of PAO. Within a broadtemperature interval that covers the operating range of mostof domestic WWTP (from 10 to 308C, and perhaps even athigher temperatures), we conclude that GAO do not haveaerobic metabolic advantages over PAO, and that compe-titive advantages are due to anaerobic processes.
Nomenclature
ATP
Process
(1) Gly
(2) Bio
(3) Ma
whebiomasbiomasXGLY/C
304
adenosine triphosphate
ATU
allyl-N-thioureaCOD
chemical oxygen demandd
ATP/NADH ratio, ATP aerobically produced per NADHoxidized
EBPR
enhanced biological phosphorus removalComponent
XPHA XGLY X
cogen production � 1Ymax
sgly1
mass growth � 1Ymax
sx
intenance �mS
re: XPHA is the PHA concentration in the biomass, C-mmol/L. XGLY iss concentration of GAO, C-mmol/L. SO2 is the oxygen concentration in ts, 0.01 C-mmol/L. KGLY is the saturation coefficient for glycogen in the b-mol XGAO. f max
GLY is the maximum glycogen fraction of GAO, 0.35 C-m
Biotechnology and Bioengineering, Vol. 101, No. 2, October 1, 2008
FISH
GAO
1
the glyche bulk liomass,ol XGLY
fluorescence in situ hybridization
GAO
glycogen-accumulating organismsGLY
glycogenHAc
acetateHRT
hydraulic retention timemOATP
aerobic ATP maintenance coefficientmOS
specific oxygen demand for maintenancemS
specific PHA demand for maintenanceMLSS
mixed liquor suspended solidsMLVSS
mixed liquor volatile suspended solidsNH�4 -N
nitrogen as ammoniumNADH
nicotinamide adenine dinucleotideOUR
oxygen uptake ratePAO
polyphosphate-accumulating organismsPHA
poly-b-hydroxyalkanoatesPHB
poly-b-hydroxybutyratePHV
poly-b-hydroxyvaleratePO3�4 -P
phosphorus as orthophosphaterGLY
maximum aerobic glycogen formation raterPHA
maximum aerobic PHA consumption raterPHB
maximum aerobic PHB consumption raterPHV
maximum aerobic PHV consumption raterO2
oxygen uptake raterX
maximum biomass production rateSRT
solids retention timeu
temperature coefficientWWTP
wastewater treatment plantXGAO
active GAO biomass concentrationYmaxox
maximum yields of biomass production on oxygenYmaxogly
maximum yields of glycogen production on oxygenYmaxsx
maximum yields of biomass production on PHAYmaxsgly
maximum yields of glycogen production on PHAThe authors would like to acknowledge the National Council for
Science and Technology from Mexico (CONACYT, Mexico City,
Mexico) as well as the Autonomous University of the State of Mexico
(Toluca, Mexico) for the scholarship awarded to Carlos M. Lopez
Vazquez.
Appendix
Stoichiometric matrix and kinetic expressions used in the presentstudy.
Kinetic expressionSO2
� 1Ymax
oglyrGLY
ðf maxGLY
�fGLYÞðf max
GLY�fGLYÞþKGLY
XPHAKPHAþXPHA
XGAO
� 1Ymax
oxrX
XPHAKPHAþXPHA
XGAO
�mOS XGAO
ogen concentration in the biomass, C-mmol/L. XGAO is the activeiquid, mmol O2/L. KPHA is the saturation coefficient for PHA in the0.01 C-mmol/L. fGLY is the glycogen fraction in the biomass, C-mol/C-mol XGAO.

References
Amann RI, Binder BJ, Olson RJ, Chisholm SW, Devereux R, Stahl DA. 1990.
Combination of 16S ribosomal-RNA-targeted oligonucleotide probes
with flow-cytometry for analyzing mixed microbial-populations. App
Environ Microbiol 56(6):1919–1925.
Amann RI. 1995. In situ identification of microorganisms by whole cell
hybridization with rRNA-targeted nucleic acid probes. In: Akkermans
ADL, van Elsas JD, de Bruijn FJ, editors. Molecular microbial ecology
manual. London: Kluwer Academic Publisher. pp. 1–15.
APHA/AWWA. 1995. Standard methods for the examination of water and
wastewater. 19th edition. Baltimore: Port City Press.
Bazin MJ, Prosser JI. 2000. Physiological models in microbiology. CRC
Series in mathematical models in microbiology. Florida: CRC Press.
Beer M, Kong YH, Seviour RJ. 2004. Are some putative glycogen
accumulating organisms (GAO) in anaerobic: Aerobic activated sludge
systems members of the a-Proteobacteria? Microbiology 150:2267–
2275.
Beun JJ, Paletta F, van Loosdrecht MCM, Heijnen JJ. 2000. Stoichiometry
and kinetics of poly-b-hydroxybutyrate metabolism in aerobic, slow
growing, activated sludge cultures. Biotechnol Bioeng 67(4):379–
388.
Brdjanovic D, van Loosdrecht MCM, Hooijmans CM, Alaerts GJ, Heijnen
JJ. 1997. Temperature effects on physiology of biological phosphorus
removal. ASCE J Environ Eng 123(2):144–154.
Brdjanovic D, Logemann S, van Loosdrecht MCM, Hooijmans CM, Alaerts
GJ, Heijnen JJ. 1998. Influence of temperature on biological phos-
phorus removal: Process and molecular ecological studies. Water Res
32(4):1035–1048.
Cech JS, Hartman P. 1993. Competition between phosphate and polysac-
charide accumulating bacteria in enhanced biological phosphorus
removal systems. Water Res 27:1219–1225.
Crocetti GR, Hugenholtz P, Bond PL, Schuler A, Keller J, Jenkins D, Blackall
LL. 2000. Identification of polyphosphate-accumulating organisms and
design of 16S rRNA-directed probes for their detection and quantita-
tion. Appl Environ Microbiol 66(3):1175–1182.
Crocetti GR, Banfield JF, Keller J, Bond PL, Blackall LL. 2002. Glycogen
accumulating organisms in laboratory-scale and full-scale wastewater
treatment processes. Microbiology 148:3353–3364.
Daims H, Bruhl A, Amman R, Schleifer KH, Wagner M. 1999. The domain-
specific probe EUB 338 is insufficient for the detection of all bacteria:
Development and evaluation of a more comprehensive probe set. Syst
Appl Microbiol 22:434–444.
Dircks K, Beun JJ, van Loosdrecht MCM, Heinen JJ, Henze M. 2001.
Glycogen metabolism in aerobic mixed cultures. Biotechnol Bioeng
73(2):85–94.
Erdal UG, Erdal ZK, Randall CW. 2003. The competition between PAO
(phosphorus accumulating organisms) and GAO (glycogen accumu-
lating organisms) in EBPR (enhanced biological phosphorus removal)
systems at different temperatures and the effects on system perfor-
mance. Water Sci Technol 47(11):1–8.
Filipe CDM, Daigger GT, Grady CPL Jr. 2001a. A metabolic model for
acetate uptake under anaerobic conditions by glycogen-accumulating
organisms: Stoichiometry, kinetics and effect of pH. Biotechnol Bioeng
76(1):17–31.
Filipe CDM, Daigger GT, Grady CPL Jr. 2001b. Effects of pH on the aerobic
metabolism of phosphate-accumulating organisms and glycogen-accu-
mulating organisms. Water Environ Res 73(2):213–222.
Filipe CDM, Daigger GT, Grady CPL Jr. 2001c. pH as a key factor in
the competition between glycogen-accumulating organisms and
phosphorus-accumulating organisms. Water Environ Res 73(2):223–
232.
Filipe CDM, Daiggert GT, Grady CPL. 2001d. An integrated metabolic
model for the anaerobic and aerobic metabolism of glycogen accumu-
lating organisms. In: 3rd International Water Association specialized
conference on microbiology of the activated sludge and biofilm pro-
cesses. Rome, Italy.
Henze M, Gujer W, Mino T, van Loosdrecht MCM. 2000. Activated sludge
models ASM1, ASM2, ASM2d and ASM3. IWA Scientific and Technical
Report No. 9. IWA Task Group on Mathematical Modelling for Design
and Operation of Biological Wastewater Treatment. London: IWA
Publishing.
Kong YH, Ong SL, Ng WJ, Liu WT. 2002. Diversity and distribution of
a deeply branched novel proteobacterial group found in anaerobic–
aerobic activated sludge processes. Environ Microbiol 4(11):753–
757.
Krishna C, van Loosdrecht MCM. 1999a. Effect of temperature on storage
polymers and settleability of activated sludge. Water Res 33(10):2374–
2382.
Krishna C, van Loosdrecht MCM. 1999b. Substrate flux into storage and
growth in relation to activated sludge modeling. Water Res 33(14):
3149–3161.
Liu WT, Nakamura K, Matsuo T, Mino T. 1997. Internal energy-based
competition between polyphosphate- and glycogen-accumulating bac-
teria in biological phosphorus removal reactors-effect of P/C feeding
ratio. Water Res 31(6):1430–1438.
Lopez-Vazquez CM, Song YI, Hooijmans CM, Brdjanovic D, Moussa MS,
Gijzen HJ, van Loosdrecht MCM. 2007. Short-term temperature effects
on the anaerobic metabolism of glycogen accumulating organisms.
Biotech Bioeng 97(3):483–495.
Meijer SCF, van Loosdrecht MCM, Heijnen JJ. 2002. Modelling the start-up
of a full-scale biological nitrogen and phosphorus removing WWTP.
Water Res 36(19):4667–4682.
Meyer RL, Saunders AM, Blackall LL. 2006. Putative glycogen accumulating
organisms belonging to Alphaproteobacteria identified through rRNA-
based stable isotope probing. Microbiology 152:419–429.
Mino T, van Loosdrecht MCM, Heijnen JJ. 1998. Microbiology and
biochemistry of the enhanced biological phosphorus removal process.
Water Res 32(11):3193–3207.
Murnleitner E, Kuba T, van Loosdrecht MCM, Heijnen JJ. 1997.
An integrated metabolic model for the aerobic and denitrifying bio-
logical phosphorus removal. Biotechnol Bioeng 54(5):434–450.
Panswad T, Doungchai A, Anotai J. 2003. Temperature effect on microbial
community of enhanced biological phosphorus removal system. Water
Res 37:409–415.
Reichert P. 1994. AQUASIM—A tool for simulation and data analysis of
aquatic systems. Water Sci Technol 30(2):21–30.
Satoh H, Mino T, Matsuo T. 1994. Deterioration of enhanced bio-
logical phosphorus removal by the domination of microorganisms
without polyphosphate accumulation. Water Sci Technol 30(6):203–
211.
Sin G, Guisasola A, De Pauw DJW, Baeza JA, Carrera J, Vanrolleghem PA.
2005. A new approach for modelling simultaneous storage and growth
processes for activated sludge systems under aerobic conditions. Bio-
technol Bioeng 92(5):600–613.
Smolders GJF, van der Meij J, van Loosdrecht MCM, Heijnen JJ. 1994.
Stoichiometric model of the aerobic metabolism of the biological
phosphorus removal process. Biotechnol Bioeng 44:837–848.
Smolders GJF, Klop JM, van Loosdrecht MCM, Heijnen JJ. 1995a. Valida-
tion of the metabolic model: Effect of the sludge retention time.
Biotechnol Bioeng 48(3):222–233.
Smolders GJF, van der Meij J, van Loosdrecht MCM, Heijnen JJ. 1995b.
A structured metabolic model for anaerobic and aerobic stoichiometry
and kinetics of the biological phosphorus removal process. Biotechnol
Bioeng 47(3):277–287.
Tijhuis J, van Loosdrecht MCM, Heijnen JJ. 1993. A thermodinamically
based correlation for maintenance Gibbs energy requirements in
aerobic and anaerobic chemotrophic growth. Biotechnol Bioeng
42(4):509–519.
Tykesson E, Jonsson L-E, la Cour Jansen J. 2005. Experience from 10 years of
full-scale operation with enhanced biological phosphorus removal.
Water Sci Technol 52(12):151–159.
van Aalst-van Leewen MA, Pot MA, van Loosdrecht MCM, Heijnen JJ.
1997. Kinetic modeling of poly (b-hydroxybutyrate) production and
Lopez-Vazquez et al.: Temperature Effects on GAO 305
Biotechnology and Bioengineering

consumption by Paracoccus pantotrophus under dynamic substrate
supply. Biotechnol Bioeng 55(5):773–782.
van Loosdrecht MCM, Henze M. 1999. Maintenance, endogenous respira-
tion, lysis, decay and predation. Wat Sci Technol 39(1):107–117.
van Veldhuizen HM, van Loosdrecht MCM, Heijnen JJ. 1999. Modelling
biological phosphorus and nitrogen removal in a full scale activated
sludge process. Water Res 33(16):3459–3468.
Whang LM, Park JK. 2006. Competition between polyphosphate- and
glycogen-accumulating organisms in enhanced biological phosphorus
removal systems: Effect of temperature and sludge age. Water Environ
Res 78(1):4–11.
306 Biotechnology and Bioengineering, Vol. 101, No. 2, October 1, 2008
Whang LM, Filipe CDM, Park JK. 2007. Model-based evaluation of
competition between polyphosphate- and glycogen-accumulating
organisms. Water Res 41(6):1312–1324.
Wong MT, Tan FM, Ng WJ, Liu WT. 2004. Identification and occurrence of
tetrad-forming Alphaproteobacteria in anaerobic–aerobic activated
sludge processes. Microbiology 150:3741–3748.
YdstebØ L, Bilstad T, Barnard J. 2000. Experience with biological nutrient
removal at low temperatures. Water Environ Res 72(4):444–454.
Zeng RJ, van Loosdrecht MCM, Yuan Z, Keller J. 2003. Metabolic model for
glycogen-accumulating organisms in anaerobic/aerobic activated
sludge systems. Biotechnol Bioeng 81(1):92–105.
Copyright © 2022 FDOKUMEN