Electrical conductivity studies on carbon black loaded ethylene butylacrylate polymer composites
6
Electrical conductivity studies on carbon black loaded ethylene butylacrylate polymer composites M. El Hasnaoui a , A. Triki b , M.P.F. Graça c , M.E. Achour a , L.C. Costa c, ⁎, M. Arous b a Laboratoire LASTID, Département de Physique, Faculté des Sciences, Université Ibn Tofail, B.P:133, 14000 Kénitra, Morocco b Laboratoire des Matériaux Composites, Céramiques et Polymères, Faculté des Sciences de Sfax, Route de Skoura, 3018 Sfax, Tunisia c I3N and Physics Department, University of Aveiro, 3810-193 Aveiro, Portugal abstract article info Article history: Received 14 May 2012 Received in revised form 2 July 2012 Available online 22 July 2012 Keywords: Nanocomposites; Dielectric relaxation; Percolation In this work we studied the electrical properties of carbon black mixed into ethylene butylacrylate copoly- mer, using impedance spectroscopy, in the frequency range from 100 Hz to 100 kHz and over the tempera- ture range from 150 to 360 K. A series of samples was prepared with several filler contents, below and above the percolation threshold, which was calculated using direct current conductivity measurements. For concen- trations below the critical concentration the negative temperature coefficient in resistivity effect is observed, and for concentrations above that threshold the positive temperature coefficient in resistivity effect is pres- ent. The dielectric response was analyzed using complex permittivity or modulus formalisms, depending on the concentration of filler in the polymer matrix. Havriliak–Negami model was used to fit the experimental results. © 2012 Elsevier B.V. All rights reserved. 1. Introduction Electrical properties of composites based on the dispersion of carbon black (CB) particles within an insulating polymer matrix have been ex- tensively studied over the last decades [1–4]. These properties of such media depend on the properties of each component, the degree of dis- persion, the interaction between components and the volume fraction Φ of the filler [5,6]. It is well known that DC electrical conductivity, as a function of conducting particle concentration, undergoes an insula- tor/conductor transition [7,8]. This occurs at a critical concentration where the particles contact with each other and, as a consequence, a continuous electrical path of the doped particles is built throughout the polymer matrix. That is, when the filler content is low, the mean dis- tance between conducting particles is large and the conductivity is re- stricted by the presence of the insulating matrix, but by increasing the conductive phase content, the conducting particles get closer and at a critical concentration the electrical properties are dominated by them. Another important insulator/conductor transition is related to the tem- perature dependence of the electrical resistivity [3,9,10]. In fact, when conductive fillers, such as CB, are added to the polymer matrix which is an electrically insulating material, the conductivity of the composite is changed from insulator to conductor. It is caused by electron tunnel- ing through the conductive pathway formed by loaded fillers, when the concentration of conductive fillers is over a critical value. As tempera- ture approaches to the melting temperature of the polymer matrix, the resistivity of the conductive filler added polymer composites increases rapidly. This phenomenon, known as PTCR effect (Positive Temperature Coefficient of Resistivity), has been largely studied in the last few years, due to its potential applications in industry [11]. Particu- larly, it can be used in auto controlled heaters, temperature sensors, protection circuits and security systems for power electronic circuits. This work presents a study on electrical properties of the dispersion of carbon black (CB) particles in the ethylene butylacrylate (EBA) copol- ymer matrix. The influence of the volume fraction of CB and tempera- ture on the DC conductivity of these materials is analyzed, exhibiting a positive temperature coefficient in resistivity (PTCR) effect for the CB concentration above the threshold concentration. The dielectric re- sponse of the composites was also studied in a wide frequency and tem- perature range, using broadband dielectric spectroscopy. Experimental data were analyzed by dielectric permittivity and electrical modulus formalisms [12,13]. The results show the agreement between the elec- trical resistivity variation and the electrical modulus behavior. 2. Experimental 2.1. Materials The samples of EBA copolymer filled with acetylene carbon black were obtained from Borealis AB (Sweden). The butylacrylate monomer (EBA) contains butylester side groups, providing a certain polarity and a relatively low crystallinity (about 20% in volume). The average size of the carbon black particles is about 30 nm and the mean size of the pri- mary aggregates is of the order of 150 nm [14,15]. The glass transition temperature of the neat copolymer EBA is T g =198 K and the melting temperature is T m =370 K [14]. A series of samples with nominal Journal of Non-Crystalline Solids 358 (2012) 2810–2815 ⁎ Corresponding author. Tel.: +351 234370944; fax: +351 234378197. E-mail address: [email protected] (L.C. Costa). 0022-3093/$ – see front matter © 2012 Elsevier B.V. All rights reserved. doi:10.1016/j.jnoncrysol.2012.07.008 Contents lists available at SciVerse ScienceDirect Journal of Non-Crystalline Solids journal homepage: www.elsevier.com/ locate/ jnoncrysol
-
Upload
univ-ibntofail -
Category
Documents
-
view
2 -
download
0
Transcript of Electrical conductivity studies on carbon black loaded ethylene butylacrylate polymer composites

Journal of Non-Crystalline Solids 358 (2012) 2810–2815
Contents lists available at SciVerse ScienceDirect
Journal of Non-Crystalline Solids
j ourna l homepage: www.e lsev ie r .com/ locate / jnoncryso l
Electrical conductivity studies on carbon black loaded ethylene butylacrylatepolymer composites
M. El Hasnaoui a, A. Triki b, M.P.F. Graça c, M.E. Achour a, L.C. Costa c,⁎, M. Arous b
a Laboratoire LASTID, Département de Physique, Faculté des Sciences, Université Ibn Tofail, B.P:133, 14000 Kénitra, Moroccob Laboratoire des Matériaux Composites, Céramiques et Polymères, Faculté des Sciences de Sfax, Route de Skoura, 3018 Sfax, Tunisiac I3N and Physics Department, University of Aveiro, 3810-193 Aveiro, Portugal
⁎ Corresponding author. Tel.: +351 234370944; fax:E-mail address: [email protected] (L.C. Costa).
0022-3093/$ – see front matter © 2012 Elsevier B.V. Alldoi:10.1016/j.jnoncrysol.2012.07.008
a b s t r a c t
a r t i c l e i n f oArticle history:Received 14 May 2012Received in revised form 2 July 2012Available online 22 July 2012
Keywords:Nanocomposites;Dielectric relaxation;Percolation
In this work we studied the electrical properties of carbon black mixed into ethylene butylacrylate copoly-mer, using impedance spectroscopy, in the frequency range from 100 Hz to 100 kHz and over the tempera-ture range from 150 to 360 K. A series of samples was prepared with several filler contents, below and abovethe percolation threshold, which was calculated using direct current conductivity measurements. For concen-trations below the critical concentration the negative temperature coefficient in resistivity effect is observed,and for concentrations above that threshold the positive temperature coefficient in resistivity effect is pres-ent. The dielectric response was analyzed using complex permittivity or modulus formalisms, depending onthe concentration of filler in the polymer matrix. Havriliak–Negami model was used to fit the experimentalresults.
© 2012 Elsevier B.V. All rights reserved.
1. Introduction
Electrical properties of composites based on the dispersion of carbonblack (CB) particles within an insulating polymer matrix have been ex-tensively studied over the last decades [1–4]. These properties of suchmedia depend on the properties of each component, the degree of dis-persion, the interaction between components and the volume fractionΦ of the filler [5,6]. It is well known that DC electrical conductivity, asa function of conducting particle concentration, undergoes an insula-tor/conductor transition [7,8]. This occurs at a critical concentrationwhere the particles contact with each other and, as a consequence, acontinuous electrical path of the doped particles is built throughoutthe polymermatrix. That is,when the filler content is low, themeandis-tance between conducting particles is large and the conductivity is re-stricted by the presence of the insulating matrix, but by increasing theconductive phase content, the conducting particles get closer and at acritical concentration the electrical properties are dominated by them.Another important insulator/conductor transition is related to the tem-perature dependence of the electrical resistivity [3,9,10]. In fact, whenconductive fillers, such as CB, are added to the polymer matrix whichis an electrically insulating material, the conductivity of the compositeis changed from insulator to conductor. It is caused by electron tunnel-ing through the conductive pathway formed by loaded fillers, when theconcentration of conductive fillers is over a critical value. As tempera-ture approaches to the melting temperature of the polymer matrix,the resistivity of the conductive filler added polymer composites
+351 234378197.
rights reserved.
increases rapidly. This phenomenon, known as PTCR effect (PositiveTemperature Coefficient of Resistivity), has been largely studied in thelast few years, due to its potential applications in industry [11]. Particu-larly, it can be used in auto controlled heaters, temperature sensors,protection circuits and security systems for power electronic circuits.
This work presents a study on electrical properties of the dispersionof carbon black (CB) particles in the ethylene butylacrylate (EBA) copol-ymer matrix. The influence of the volume fraction of CB and tempera-ture on the DC conductivity of these materials is analyzed, exhibiting apositive temperature coefficient in resistivity (PTCR) effect for the CBconcentration above the threshold concentration. The dielectric re-sponse of the compositeswas also studied in awide frequency and tem-perature range, using broadband dielectric spectroscopy. Experimentaldata were analyzed by dielectric permittivity and electrical modulusformalisms [12,13]. The results show the agreement between the elec-trical resistivity variation and the electrical modulus behavior.
2. Experimental
2.1. Materials
The samples of EBA copolymer filled with acetylene carbon blackwere obtained from Borealis AB (Sweden). The butylacrylate monomer(EBA) contains butylester side groups, providing a certain polarity and arelatively low crystallinity (about 20% in volume). The average size ofthe carbon black particles is about 30 nm and the mean size of the pri-mary aggregates is of the order of 150 nm [14,15]. The glass transitiontemperature of the neat copolymer EBA is Tg=198 K and the meltingtemperature is Tm=370 K [14]. A series of samples with nominal

1012
109
106
103
100
0,5 1,0 1,5 2,0 2,5
(m/s
)
φφ/φc
ρ
Fig. 1. Electrical resistivity of EBA/CB copolymer composites, at ambient temperature.Solid line is drawn to guide the eyes only.
(x1012)
(x109)
(x108)
(x103)
2.8
2.1
1.4
1.2
3.0
1.5
1.0
0.070 140 210 280 250
20 %
13 %
6 %
4 %
ρρ (m
/s)
T(K)
Fig. 2. Electrical resistivity as a function of temperature of the EBA/CB composites for fourCB concentrations, two concentrations below the percolation threshold Φc (Φ=4% andΦ=6%) and two concentrations above Φc (Φ=13% and Φ=20%). Solid lines are drawnto guide the eyes.
2811M. El Hasnaoui et al. / Journal of Non-Crystalline Solids 358 (2012) 2810–2815
carbon black volume fractionΦ ranging between 4% and 20% in volumehas been studied.
2.2. DC electrical measurements
The DC electrical measurements were made using a Keithley 617programmable electrometer, in the temperature range from 80 to350 K, in a helium atmosphere. The stabilization of temperature wasbetter than 0.1 K over the period of measurement of current. For theelectrical measurements, the samples were prepared as disks of thick-ness about 1 mm, with aluminum electrodes of 10 mm diameter onthe opposite sites of the sample. The electrical contacts were formedby silver paint.
2.3. Dielectric measurements
The dielectric measurements were carried out, in the frequencyrange from 100 Hz to 100 kHz, using a SR850 DSP Lock-In Amplifier,in the typical lock-in configuration. We measured the “in-phase” (Vf)and the “out-of-phase” (Vq) components of the sample signal, andthen we calculated the real and imaginary parts of the impedance,using the expression:
Z� ωð Þ ¼ Z′ ωð Þ−iZ″ ωð Þ ¼Ri Vf V0−V2
f −V2q
� �−ωC2
i R2i VqV0
1þω2C2i R
2i
� �V2f þ V2
q
� �
−iVqV0Ri þωC2
i R2i V f V0−V2
f −V2q
� �
1þω2C2i R
2i
� �V2f þ V2
q
� �ð1Þ
with i2=−1 and where ω is the angular frequency (ω=2πF),F being the frequency. This equation was obtained when the sampleimpedance is in series with a known resistance (1 kΩ), which is inparallel with the lock-in input impedance. Ri represents the equiva-lent resistance of the lock-in input resistance (100 MΩ) in parallelwith the known resistance, Ci the lock-in input capacitance (15 pF),V0 the input signal (|V0|=1 V), and Vf and Vq the “in-phase” andthe “out-of-phase” components of the measured signal. The samplewas modeled by a lumped circuit consisting of a resistance and a ca-pacitor in parallel. The complex admittance Y∗(ω)=1/Z∗(ω)=G(ω)+ iB(ω) can be converted into the complex permittivity formal-ism ε∗(ω)=ε′(ω)− iε″(ω) by the relations:
ε′ ωð Þ ¼ B ωð Þeε0Aω
ð2Þ
and
ε″ ωð Þ ¼ G ωð Þeε0Aω
ð3Þ
where A is the cross-sectional area of the sample, e is its thickness and ε0is the permittivity of the vacuum. The terms G(ω) and B(ω) are respec-tively the conductance and the susceptance of the samples. Estimatingrelative errors on both real and imaginary parts of the complex permit-tivity is Δε ′/ε ′=Δε″/ε″≤5%.
3. Results and discussion
3.1. DC conductivity
In Fig. 1 the electrical resistivity variation is shown, at room temper-ature, as a function of the relative carbon black-concentration. This var-iation with conducting filler can be divided into three regions [16]. Inregion I, the small decrease in resistivity of the composite can be attrib-uted to the transportation of the small number of charged particlesthrough the system without having any continuous conductive path.
In region II the resistivity decreases sharply due to a continuous conduc-tive path developed in the polymer matrix. The estimated value of theconcentration threshold Φc for the various series is Φc≈9–11%, wherethe resistivity begins to decrease abruptly. Thismajor jump in resistivitycan be attributed to the formation of an infinite agglomerate pathwaywhich allows electrons to travel a macroscopic distance through thepolymer composites. In region III, further addition of filler has amargin-al effect on the resistivity.
The transportmechanismaround the concentrationΦcwasdiscussedactively in the last years [16–19]. It is governed by tunneling across insu-lating layers between particles or aggregates. Because of the small size ofthe potential barriers between particles, there are thermally activatedvoltage fluctuations whichmay be high enough to modulate the tunnel-ing probability [20,21]. In order to check the homogeneity of the inclu-sion distribution in the polymer matrix and the topology of theclusters, microscopic photographswere carried out. Thematerial is char-acterized by the formation of a cluster of carbon nanoparticles, which al-lows the displacement of electrons through large distances of thesample. Interfacial polarization phenomenon on surfaces of the finiteclusters can always exist.
The theoretically predicted value of Φc is largely dependent on theshape of the conducting particles and can be extremely low in compos-ites consisting of highly anisotropic filler, for example, thin cylinders,

6 %8 %8.5 %
250
150
200
100
50
00 100 200 300 400
εε
‘
ε
‘
Fig. 3. Cole–Cole plot for the EBA/CB composites with three concentrations below thepercolation threshold, at room temperature. Solid lines are drawn to guide the eyes.
5
4
3
2
102
1020
1
26 %
8 %
8.5 %
6 %
8 %
8.5 %
F(Hz)
F(Hz)
M’(
x10-2
)
M’’(
x10-3
)
103
103
104
104
105
105
1
Fig. 5. Frequency dependence of the real and imaginary parts of the complex electricmodulus for the EBA/CB copolymer composites at room temperature, for concentra-tions below the percolation threshold.
2812 M. El Hasnaoui et al. / Journal of Non-Crystalline Solids 358 (2012) 2810–2815
because the critical volume fraction in this case is determined by the ex-cluded volume per cylinder [22].
The dependence of the electrical resistivity on temperature, for theinsulator/conductor composites, is quite a complex phenomenon. Thetemperature coefficient of resistancemay be positive (PTCR), or negative(NTCR), depending on the concentration of filler and the nature of thepolymer and the filler [23,24]. Fig. 2 presents the temperature depen-dence of resistivity as a function of temperature, for four CB concentra-tions in the composites; two concentrations below the percolationthreshold Φc (4 and 6%) and two concentrations above Φc (13 and20%). In these composites, the changes of the electrical resistivity mech-anisms depend on the temperature. In fact, at approximately 320–330 K,the electrical resistivity of the composites begins to increase or decreasedramatically, when the temperature approaches the melting tempera-ture Tm of the EBA copolymer matrix. The temperature dependence ofthe resistivity, for the CB concentrations below Φc, shows a decrease inresistivity with increasing temperature, and the composites having asemiconducting character [25]. In these systems, contacts between CBdisappear and conductivity of composites is controlled by temperature-dependent hopping or charge tunneling between conducting particles[26]. For the CB concentrations aboveΦc, it can be seen that in the vicin-ity of the melting temperature Tm of EBA matrix, the resistivity of thecomposite increases sharply with increasing temperature, resultingfrom the breakdown of conductive network, principally caused by thethermal expansion of thematrix [27]. The conductivitywith temperaturerises, for Φ>Φc, which can be analyzed by the activation energy of thisprocess.
3.2. Dielectric dispersion and electric modulus
The plot of ε″ as a function of ε ′ for various CB concentrations, forΦbΦc, is reported in Fig. 3. It shows the presence of the peak of relax-ation whose intensity increases with the increasing concentration ofcarbon. This relaxation phenomenon is the result of the combination
1500
1000
500
1000 2000 3000
20 %17 %16 %
εε
‘
ε
Fig. 4. Cole–Cole plot for the EBA/CB composites with three concentrations above thepercolation threshold, at room temperature.
of two polarization mechanisms [1] that depends on the physicalmovement of charges responsible for dipoles and of time requiredfor their displacement. The first one is issued from the dielectric prop-erties of the EBA copolymer which is generally attributed to thereorientation of dipoles. The secondmechanism is related to the pres-ence of carbon. This latter polarizationmechanism causes a virtual elec-tric charge concentrated at the EBA/CB copolymer interface of theheterogeneous system. This gives rise to an effect known as Maxwell–Wagner–Sillars (MWS) polarization [28,29].
Fig. 4 shows that the relaxation peak vanishes for the volume con-centrations above the percolation threshold (Φ>Φc). Indeed, themate-rial is characterized by the formation of an infinite cluster of carbonparticles, which allows the displacement of electrons through large dis-tances. Polarization interfacial phenomenon on surfaces of the finiteclusters can always exist, but they aremasked by the process of conduc-
tion ε″relax≪ σDC2πεοF
� �. The dielectric permittivity becomes then in the
form ε�≈−i σDC2πεοF. This behavior was highlighted by Baziard et al. [30]
on materials made up of copper particles dispersed in a polymerepoxy of the type DGEBA, in the interval ranging between 10 Hz and800 kHz. In addition, Achour et al. [31] have investigated the dielectricresponse of samples of carbon black-polymer matrix, in the frequencyrange from 100 Hz to 15 MHz with volume fraction Φ below andabove the percolation threshold Φc. They provided observational evi-dence showing that dipolar relaxation and anomalous low-frequencydispersion are likely the transport mechanisms in these samplesbelow and above percolation, respectively. Jonscher's phenomenologi-cal model has been used for modeling these dielectric responses.
The electrical modulus and the complex impedance formalisms, forthe analysis of the dielectric response of materials, have been reportedby many authors [14,32,33]. Impedance analysis provides a simplemethod to determine various contributions to the total conductivity ofmaterials in terms of four possible inter-related complex formulations:impedance (Z*), admittance (Y*), permittivity (ε*), and modulus (M*).
9
6
3
0102
1020
14
21
7
103
103
104
104
16 %
19 %
19 %
16 %
13 %
12 %
20 %
20 %
13 %
12 %
105
105
F(Hz)
F(Hz)
M’(
x10-5
)
M’’(
x10-5
)
Fig. 6. Frequency dependence of the real and imaginary parts of the complex electricmodulus for the EBA/CB copolymer composites at room temperature, for concentra-tions above the percolation threshold. Solid lines are drawn to guide the eyes.
12
8
4
00 4 8 12 16
M’(x10-5)
175 K197 K216 K274 K
279 K293 K304 K
Conductivity effectMWS effect
M”(
x10-5
)
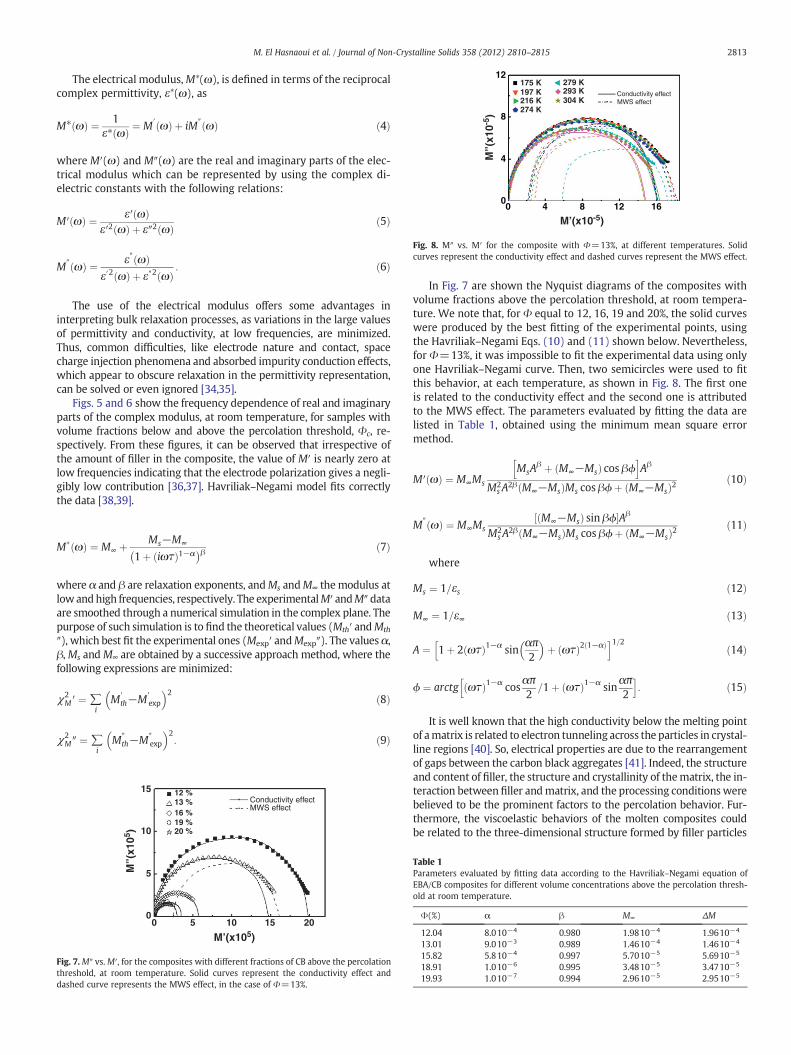
Fig. 8. M″ vs. M′ for the composite with Φ=13%, at different temperatures. Solidcurves represent the conductivity effect and dashed curves represent the MWS effect.
2813M. El Hasnaoui et al. / Journal of Non-Crystalline Solids 358 (2012) 2810–2815
The electrical modulus,M*(ω), is defined in terms of the reciprocalcomplex permittivity, ε*(ω), as
M� ωð Þ ¼ 1ε� ωð Þ ¼ M′ ωð Þ þ iM″ ωð Þ ð4Þ
where M′(ω) and M″(ω) are the real and imaginary parts of the elec-trical modulus which can be represented by using the complex di-electric constants with the following relations:
M′ ωð Þ ¼ ε′ ωð Þε′2 ωð Þ þ ε″2 ωð Þ ð5Þ
M″ ωð Þ ¼ ε″ ωð Þε′2 ωð Þ þ ε″2 ωð Þ
: ð6Þ
The use of the electrical modulus offers some advantages ininterpreting bulk relaxation processes, as variations in the large valuesof permittivity and conductivity, at low frequencies, are minimized.Thus, common difficulties, like electrode nature and contact, spacecharge injection phenomena and absorbed impurity conduction effects,which appear to obscure relaxation in the permittivity representation,can be solved or even ignored [34,35].
Figs. 5 and 6 show the frequency dependence of real and imaginaryparts of the complex modulus, at room temperature, for samples withvolume fractions below and above the percolation threshold, Φc, re-spectively. From these figures, it can be observed that irrespective ofthe amount of filler in the composite, the value of M′ is nearly zero atlow frequencies indicating that the electrode polarization gives a negli-gibly low contribution [36,37]. Havriliak–Negami model fits correctlythe data [38,39].
M� ωð Þ ¼ M∞ þ Ms−M∞
1þ iωτð Þ1−α� �β ð7Þ
where α and β are relaxation exponents, andMs andM∞ the modulus atlow andhigh frequencies, respectively. The experimentalM′ andM″dataare smoothed through a numerical simulation in the complex plane. Thepurpose of such simulation is to find the theoretical values (Mth′ andMth
″), which best fit the experimental ones (Mexp′ andMexp″). The values α,β,Ms andM∞ are obtained by a successive approach method, where thefollowing expressions are minimized:
χ2M′ ¼ ∑
iM′
th−M′exp
� �2 ð8Þ
χ2M″ ¼ ∑
iM″
th−M″exp
� �2: ð9Þ
15 12 %13 %16 %19 %20 %
Conductivity effectMWS effect
10
5
00 5 10 15 20
M’(x105)
M”(
x105 )
Fig. 7.M″ vs.M′, for the composites with different fractions of CB above the percolationthreshold, at room temperature. Solid curves represent the conductivity effect anddashed curve represents the MWS effect, in the case of Φ=13%.
In Fig. 7 are shown the Nyquist diagrams of the composites withvolume fractions above the percolation threshold, at room tempera-ture. We note that, for Φ equal to 12, 16, 19 and 20%, the solid curveswere produced by the best fitting of the experimental points, usingthe Havriliak–Negami Eqs. (10) and (11) shown below. Nevertheless,for Φ=13%, it was impossible to fit the experimental data using onlyone Havriliak–Negami curve. Then, two semicircles were used to fitthis behavior, at each temperature, as shown in Fig. 8. The first oneis related to the conductivity effect and the second one is attributedto the MWS effect. The parameters evaluated by fitting the data arelisted in Table 1, obtained using the minimum mean square errormethod.
M′ ωð Þ ¼ M∞Ms
MsAβ þ M∞−Msð Þ cos βϕ
h iAβ
M2s A
2β M∞−Msð ÞMs cos βϕþ M∞−Msð Þ2 ð10Þ
M″ ωð Þ ¼ M∞MsM∞−Msð Þ sin βϕ½ �Aβ
M2s A
2β M∞−Msð ÞMs cos βϕþ M∞−Msð Þ2 ð11Þ
where
Ms ¼ 1=εs ð12Þ
M∞ ¼ 1=ε∞ ð13Þ
A ¼ 1þ 2 ωτð Þ1−α sinαπ2
� �þ ωτð Þ2 1−αð Þh i1=2 ð14Þ
ϕ ¼ arctg ωτð Þ1−α cosαπ2
=1þ ωτð Þ1−α sinαπ2
h i: ð15Þ
It is well known that the high conductivity below the melting pointof amatrix is related to electron tunneling across the particles in crystal-line regions [40]. So, electrical properties are due to the rearrangementof gaps between the carbon black aggregates [41]. Indeed, the structureand content of filler, the structure and crystallinity of thematrix, the in-teraction between filler andmatrix, and the processing conditions werebelieved to be the prominent factors to the percolation behavior. Fur-thermore, the viscoelastic behaviors of the molten composites couldbe related to the three-dimensional structure formed by filler particles
Table 1Parameters evaluated by fitting data according to the Havriliak–Negami equation ofEBA/CB composites for different volume concentrations above the percolation thresh-old at room temperature.
Φ(%) α β M∞ ΔM
12.04 8.010−4 0.980 1.9810−4 1.9610−4
13.01 9.010−3 0.989 1.4610−4 1.4610−4
15.82 5.810−4 0.997 5.7010−5 5.6910−5
18.91 1.010−6 0.995 3.4810−5 3.4710−5
19.93 1.010−7 0.994 2.9610−5 2.9510−5

24
26
8
00 8 16 24 32
160 K 261 K278 K297 K315 K
Conductivity effect181 K203 K222 K240 K
M’(x10-6)
M”(
x10-6
)
Fig. 9.M″ vs.M′ for the composite withΦ=20%, at different temperatures. Solid curvesrepresent the conductivity effect and dashed curves the MWS effect.
Table 2Values of the activation energy for different volume concentrations of CB obtained fromthe electrical modulus and DC conductivity using the Arrhenius equation.
Φ(%) EMod (meV) RMod2 EDC (meV) RDC
2
12.04 12.17 0.99 13.10 0.9913.01 10.90 0.99 11.80 0.9815.82 10.88 0.99 8.60 0.9319.93 10.11 0.98 12.70 0.99
2814 M. El Hasnaoui et al. / Journal of Non-Crystalline Solids 358 (2012) 2810–2815
through bridging polymer chains [42,43]. CB particles in polymer meltstend to flocculate, depending on the attractive potential and distancebetween the aggregates, which can be increased by heat treatment[44]. The size of clusters increases and gap between adjacent CB clustersdecreases during the flocculation, leading to the formation of continu-ous percolating network that immobilizes the matrix chains [45]. Thefiller networking does influence not only the conductivity, but also thestiffness of filled polymers [46]. The process of flocculation can be accel-erated by increasing annealing temperature or filler content [47,48] andextending annealing time, one will obtain a higher degree of agglomer-ation of CB particles. The flocculation of CB particles is not involved inthe formation of permanent bonds linking the CB aggregates due tothe presence of a thin polymer layer attached to the surface of CB parti-cles. The movement of CB particles during flocculation can cause boththe breakdown and the reformation of the conducting clusters. The mi-crostructure change of the conducting network depends on the compe-tition of the two processes [40]. The formation of continuous conductivepathway is dominant for the composites containing high CB contents athigh temperatures, which is responsible for the resistivity decay. Thisflocculation effect can explain the appearance of the second dielectricrelaxation in the composite with Φ equals to 13% as its effect is addedto the MWS relaxation. But, for higher concentrations, the conductivitybecomes so important that this relaxation cannot be detected on theNyquist diagram for volume fractions of CB above 13%. As shown inFig. 9 all solid isothermal spectra are fitted with unique dielectric relax-ation associated with conductivity effect. In addition, this analyticalstudy using Havriliak–Negami equation fitting to the data M(F) givessmall values of the parameter α and high values of the parameter β(Table 1), showing that we are close to a single relaxation timeprocess.These results are in complete accordance with those of Belattar andco-workers [14] who reported a study of the electrical modulus of thesame composite systems with the Cole–Cole model of relaxation. How-ever, the use of Havriliak–Negami takes into account the CB mesostruc-ture, i.e. the filler–filler and filler–amorphous chain interactions which
15
14
13
122 4 6 8
1000/T (K-1)
In(ω
max
T)
10 12
12 %13 %16 %20 %
Fig. 10. ln(ωmax·T) vs. 1000/T for the EBA/CB composites for different concentrationsabove the percolation threshold. The solid lines are the least square linear fits toEq. (16).
reveals the appearance of the second dielectric relaxation for a volumefraction Φ equals to 13% as explained above.
In order to further elucidate the dielectric relaxation in EBA/CB, itis important to estimate the activation energy associated with the re-laxation process which could be obtained from the temperature de-pendence frequency, according to the relation
ωmax∝1Texp − EMod
KbT
� �ð16Þ
where EMod is the activation energy associatedwith relaxation processes,ωmax=2πFmax, Fmax is the peak frequency corresponding to the maxi-mumvalue ofM″(F),Kb is theBoltzmann's constant, and T is the absolutetemperature. Fig. 10 depicts the plots of ln(ωmax·T) versus 1/T alongwith linear fits to Eq. (16). The values of EMod and their correlation coef-ficients are resumed in Table 2. The activation energies obtained fromelectrical modulus have no significant change with variation of CB andwas found to be in the range from 10.11 to 12.17 meV. These resultsare in good agreement with that obtained from DC conductivity(Table 2) [10], suggesting that the absence of difference in the activationenergy for the different investigated samples is an indication of the dy-namically heterogeneous nature of aggregates within the polymer ma-trix, where the CB particles interact weakly with the chain segments ofthe macromolecules in the copolymer. Furthermore, it helps to under-stand that there is a poor bond between the polymermatrix and the car-bon black particles.
4. Conclusion
For concentrations below the critical concentration a NTCR effectis observed, and for concentrations above that threshold the PTCR ef-fect is present.
The modulus formalism was used to interpret the relaxation pro-cesses, for concentrations above the percolation threshold, while thepermittivity one was used for lower concentrations. The Havriliak–Negami model fits correctly the data, for the highest concentrationsand the relaxation parameters show that we are close to a Debye relax-ationmodel. The calculated activation energies, using theDC conductiv-ity or the relaxation frequency are close, and with low values, showingthat the CB particles interact weakly with the chain segments of themacromolecules in the copolymer.
References
[1] M.E. Achour, Electromagnetic properties of carbon black filled epoxy polymercomposites, In: in: C. Brosseau (Ed.), Prospects in Filled Polymers Engineering:Mesostructure, Elasticity Network, and Macroscopic Properties, Transworld Re-search Network, Singapore, 2008, pp. 129–174.
[2] W. Li, Z. Liu, Ming-B. Yang, J. Appl. Polym. Sci. 115 (2010) 2629–2634.[3] C. Zhang, Chun-An Ma, P. Wang, M. Sumita, Carbon 43 (2005) 2544–2553.[4] H. Zois, L. Apekis, M. Omastová, Macromol. Symp. 170 (2001) 249–256.[5] Z.S. Petrović, B. Martinović, V. Divjaković, J. Budinski–Simendić, J. Appl. Polym. Sci.
49 (1993) 1659–1669.[6] Y. Mahyoedin, J. Sahari, A. Mukhtar, N. Mohammad, Int. Conf. Chem. Eng. Adv.
Mater. 233–235 (2011) 3057–3063 (2011).[7] T.A. Ezquerra, M. Kulescza, F.J. Baltá-Calleja, Synth. Met. 41 (1991) 915–920.[8] L.C. Costa, F. Henry, J. Non-Cryst. Solids 357 (2011) 1741–1744.[9] L.C. Costa, A. Chakki, M.E. Achour, M.P.F. Graça, Physica B 406 (2011) 245–249.
[10] M. El Hasnaoui, M.P.F. Graça, M.E. Achour, L.C. Costa, A. Outzourit, A. Oueriagli,J. Non-Cryst. Solids 356 (2010) 1536–1541.

2815M. El Hasnaoui et al. / Journal of Non-Crystalline Solids 358 (2012) 2810–2815
[11] K. Makuuchi, S. Cheng, Radiation Processing of Polymer Materials and its Industri-al Applications, John Wiley & Sons, Inc., 2012.
[12] N.G. McCrum, B.E. Read, G. Williams, Anelastic and Dielectric Effects in PolymericSolids, John Wiley and Sons, New York, 1967.
[13] G.M. Tsangaris, G.C. Psarras, N. Kouloumbi, J. Mater. Sci. 33 (1998) 2027–2037.[14] J. Belattar, M.P.F. Graça, L.C. Costa, M.E. Achour, C. Brosseau, J. Appl. Phys. 107
(2010) 124111–124116.[15] L.C. Costa, M.E. Achour, M.P.F. Graça, M. El Hasnaoui, A. Outzourit, A. Oueriagli,
J. Non-Cryst. Sol. 356 (2010) 270–274.[16] S.H. Foulger, J. Appl. Polym. Sci. 72 (1999) 1573–1582.[17] K.-M. Jäger, D.H. McQueen, I.A. Tchmutin, N.G. Ryvkina, M. Klüppel, J. Phys. D:
Appl. Phys. 2699–2707 (2001).[18] G.C. Psarras, J. Polym. Sci., Part B: Polym. Phys. 45 (2007) 2535–2545.[19] S.I. White, R.M. Mutiso, P.M. Vora, D. Jahnke, S. Hsu, J.M. Kikkawa, J. Li, J.E. Fischer,
K.I. Winey, Adv. Funct. Mater. 20 (2010) 2709–2716.[20] P. Sheng, E.K. Sichel, J.I. Gittleman, Phys. Rev. Lett. 40 (1978) 1197–1200.[21] E.K. Sichel, J.I. Gittleman, Ping Sheng, J. Electron. Mater. 11 (1982) 699–747.[22] I. Balberg, C.H. Anderson, S. Alexander, N.Wagner, Phys. Rev. B 30 (1984) 3933–3943.[23] F. El-Tantawy, N. Abdel Aal, A.A. Al-Ghamdi, E.H. El-Mossalamy, Polym. Eng. Sci.
49 (2009) 592–601.[24] P. Kar, N.K. Shrivastava, S.Mallick, B.B. Khatua, J. Appl. Polym. Sci. 124 (2012) 607–615.[25] E.I. Rogacheva, S.G. Lyubchenko, M.S. Dresselhaus, Thin Solid Films 516 (2008)
3411–3415.[26] M.N. Kalasad, M.K. Rabinal, J. Phys. D: Appl. Phys. 42 (2009) 065414.[27] H.P. Xu, Y.H. Wu, D.D. Yang, J.R. Wang, H.Q. Xie, Rev. Adv. Mater. Sci. 27 (2011)
173–183.[28] M. Boussoualem, M. Ismaili, J.F. Lamonier, J.M. Buisine, F. Roussel, Phys. Rev. E 73
(2006) 041702.
[29] H. Lu, X. Zhang, H. Zhang, J. Appl. Phys. 100 (2006) 054104.[30] Y. Baziard, S. Breton, S. Toutain, A. Gourdenne, Eur. Polym. J. 24 (1988) 521–526.[31] M.E. Achour, C. Brosseau, F. Carmona, J. Appl. Phys. 103 (2008) 094103–094110.[32] M.D. Migahed, M. Ishra, T. Fahmy, A. Barakat, J. Phys. Chem. Solids 65 (2004)
1121–1125.[33] M.E.L. Hasnaoui, M.P.F. Graça, M.E. Achour, L.C. Costa, Mater. Sci. Appl. 2 (2011)
1421–1426.[34] A.A. Bakr, A.M. North, Eur. Polym. Sci. 13 (1977) 799–803.[35] G.C. Psarras, E. Manolakaki, G.M. Tsangaris, Composites Part A 34 (2003)
1187–1198.[36] K. Sambasiva Rao, D. Madhava Prasad, P. Murali Krishna, T. Swarna Latha, Joon
Hyung Lee, Optoelectron. Adv. Mater. Rapid Commun. 1 (2007) 510–519.[37] M. Nanda, D.K. Tripathy, Exp. Polym. Lett. 2 (2008) 855–865.[38] S. Havriliak, S. Negami, J. Polym. Sci., Part C: J. Polym. Symp. 14 (1966) 99–117.[39] H. Wagner, R. Richert, J. Appl. Phys. 85 (1999) 1750–1755.[40] Q. Zheng, Y.H. Song, G. Wu, X.B. Song, J. Polym. Sci., Part B: Polym. Phys. 41 (2003)
983–992.[41] K.-M. Jager, D.H. McQueen, J. Vilcakova, J. Phys. D: Appl. Phys. 35 (2002)
1068–1075.[42] P. Cassagnau, F. Melis, Polymer 44 (2003) 6607–6615.[43] M.I. Aranguren, E. Mora, J.V. DeGroot Jr., C.W. Macosko, J. Rheol. 36 (1992)
1165–1182.[44] G.G.A. Bohm, M.N. Nguyen, J. Appl. Polym. Sci. 55 (1995) 1041–1050.[45] V.M. Litvinov, P.A.M. Steeman, Macromolecular 32 (1999) 3290–8476.[46] W. Niedermeier, J. Frohlich, Kautsch. Gummi Kunstst. 56 (2003) 519–524.[47] M.Y. Zhang, W.T. Jia, X.F. Chen, J. Appl. Polym. Sci. 62 (1996) 743–747.[48] G.Z. Wu, S. Asai, C. Zhang, T. Miura, M. Sumita, J. Appl. Phys. 88 (2001) 1480–1487.