Electric field-mediated transport of plasmid DNA in tumor interstitium in vivo
21
Electric Field-Mediated Transport of Plasmid DNA in Tumor Interstitium In vivo Joshua W. Henshaw, David A. Zaharoff 1 , Brian J. Mossop, and Fan Yuan * Department of Biomedical Engineering Duke University, Durham, NC 27708 USA Abstract Local pulsed electric field application is a method for improving non-viral gene delivery. Mechanisms of the improvement include electropermeabilization and electrophoresis. To understand how electrophoresis affects pDNA delivery in vivo, we quantified the magnitude of electric field- induced interstitial transport of pDNA in 4T1 and B16.F10 tumors implanted in mouse dorsal skin- fold chambers. Four different electric pulse sequences were used in this study, each consisted of 10 identical pulses that were 100 or 400 V/cm in strength and 20 or 50 ms in duration. The interval between consecutive pulses was 1 s. The largest distance of transport was obtained with the 400 V/ cm and 50 ms pulse, and was 0.23 and 0.22 μm/pulse in 4T1 and B16.F10 tumors, respectively. There were no significant differences in transport distances between 4T1 and B16.F10 tumors. Results from in vivo mapping and numerical simulations revealed an approximately uniform intratumoral electric field that was predominantly in the direction of the applied field. The data in the study suggested that interstitial transport of pDNA induced by a sequence of electric pulses was ineffective for macroscopic delivery of genes in tumors. However, the induced transport was more efficient than passive diffusion. Keywords in vivo DNA electrophoresis; interstitial transport; non-viral gene therapy; DNA electrotransfer; electric field-mediated gene delivery INTRODUCTION The efficacy of non-viral gene therapy is limited by poor delivery of therapeutic genes into the nucleus of target cells. A rate-limiting physiological barrier to gene delivery is the interstitial space. In tumor interstitium, convection is negligible due to a uniformly elevated interstitial fluid pressure [1], leaving gene delivery through the extracellular matrix (ECM) to rely on passive diffusion [2]. Unfortunately, diffusion is also inefficient for larger therapeutics in tumors [3], and can be considered as a negligible transport mechanism for therapeutics the size of a typical plasmid DNA (pDNA). The limited interstitial transport implies that only the pDNA molecules localized within a very thin layer outside the cell membrane have the potential to enter the cell and elicit successful transgene expression. Increasing pDNA interstitial transport may significantly increase the thickness of this layer in vivo, and therefore the transfection efficiency of pDNA. One strategy to improve the interstitial transport is to locally apply a pulsed electric field to push exogenous genes in tumors. * Corresponding author: Dr. Fan Yuan Department of Biomedical Engineering Duke University 136 Hudson Hall Durham, NC 27708 (919) 660 – 5411 (phone) (919) 684 – 4488 (fax) [email protected]. 1 Present Address: Laboratory of Tumor Immunology and Biology, National Cancer Institiute (NIH), Bethesda, MD 20892 USA NIH Public Access Author Manuscript Bioelectrochemistry. Author manuscript; available in PMC 2010 June 15. Published in final edited form as: Bioelectrochemistry. 2007 November ; 71(2): 233–242. doi:10.1016/j.bioelechem.2007.07.005. NIH-PA Author Manuscript NIH-PA Author Manuscript NIH-PA Author Manuscript
-
Upload
independent -
Category
Documents
-
view
1 -
download
0
Transcript of Electric field-mediated transport of plasmid DNA in tumor interstitium in vivo

Electric Field-Mediated Transport of Plasmid DNA in TumorInterstitium In vivo
Joshua W. Henshaw, David A. Zaharoff1, Brian J. Mossop, and Fan Yuan*Department of Biomedical Engineering Duke University, Durham, NC 27708 USA
AbstractLocal pulsed electric field application is a method for improving non-viral gene delivery.Mechanisms of the improvement include electropermeabilization and electrophoresis. To understandhow electrophoresis affects pDNA delivery in vivo, we quantified the magnitude of electric field-induced interstitial transport of pDNA in 4T1 and B16.F10 tumors implanted in mouse dorsal skin-fold chambers. Four different electric pulse sequences were used in this study, each consisted of 10identical pulses that were 100 or 400 V/cm in strength and 20 or 50 ms in duration. The intervalbetween consecutive pulses was 1 s. The largest distance of transport was obtained with the 400 V/cm and 50 ms pulse, and was 0.23 and 0.22 μm/pulse in 4T1 and B16.F10 tumors, respectively. Therewere no significant differences in transport distances between 4T1 and B16.F10 tumors. Results fromin vivo mapping and numerical simulations revealed an approximately uniform intratumoral electricfield that was predominantly in the direction of the applied field. The data in the study suggested thatinterstitial transport of pDNA induced by a sequence of electric pulses was ineffective formacroscopic delivery of genes in tumors. However, the induced transport was more efficient thanpassive diffusion.
Keywordsin vivo DNA electrophoresis; interstitial transport; non-viral gene therapy; DNA electrotransfer;electric field-mediated gene delivery
INTRODUCTIONThe efficacy of non-viral gene therapy is limited by poor delivery of therapeutic genes into thenucleus of target cells. A rate-limiting physiological barrier to gene delivery is the interstitialspace. In tumor interstitium, convection is negligible due to a uniformly elevated interstitialfluid pressure [1], leaving gene delivery through the extracellular matrix (ECM) to rely onpassive diffusion [2]. Unfortunately, diffusion is also inefficient for larger therapeutics intumors [3], and can be considered as a negligible transport mechanism for therapeutics the sizeof a typical plasmid DNA (pDNA). The limited interstitial transport implies that only the pDNAmolecules localized within a very thin layer outside the cell membrane have the potential toenter the cell and elicit successful transgene expression. Increasing pDNA interstitial transportmay significantly increase the thickness of this layer in vivo, and therefore the transfectionefficiency of pDNA. One strategy to improve the interstitial transport is to locally apply apulsed electric field to push exogenous genes in tumors.
*Corresponding author: Dr. Fan Yuan Department of Biomedical Engineering Duke University 136 Hudson Hall Durham, NC 27708(919) 660 – 5411 (phone) (919) 684 – 4488 (fax) [email protected] Address: Laboratory of Tumor Immunology and Biology, National Cancer Institiute (NIH), Bethesda, MD 20892 USA
NIH Public AccessAuthor ManuscriptBioelectrochemistry. Author manuscript; available in PMC 2010 June 15.
Published in final edited form as:Bioelectrochemistry. 2007 November ; 71(2): 233–242. doi:10.1016/j.bioelechem.2007.07.005.
NIH
-PA Author Manuscript
NIH
-PA Author Manuscript
NIH
-PA Author Manuscript

Electric field-mediated gene delivery has been investigated extensively both in vitro [4-7] andin vivo [8-21]. Mechanisms of the delivery include electropermeabilization andelectrophoresis. Electropermeabilization has been studied extensively in vitro [22-30]. Theprocess is characterized by an increased permeability of the cell membrane to traditionally non-permeant molecules, caused by the presence of an external, pulsed electric field. Thepermeability increase is thought to occur due to the formation of transient, hydrophilic poresin the cell membrane in response to an above threshold transmembrane potential, a phenomenaknown as electroporation [31]. These pores allow cellular uptake of small molecules primarilyby passive diffusion. However, for larger molecules such as pDNA, mechanisms of the uptakeremain unclear [32]. Regardless of the uptake mechanisms, the pDNA must be within a criticaldistance from the cell membrane in order to be taken up by the permeabilized cell. This distancemay be increased through in vivo electrophoresis in the presence of an external, pulsed electricfield.
Despite its potential significance, the in vivo electrophoresis component of electric field-mediated gene delivery is only the focus of a few studies in the literature [33-37]. Thesignificance of the electrophoretic component has been demonstrated in vivo in muscle bystudying the transfection levels obtained using a combination of low voltage, non-poratingpulses with long duration (LV), and high voltage, porating pulses with short duration (HV).Bureau et al. reported high levels of transgene expression following a pulse sequence consistingof a single HV (800 V/cm, 0.1 ms), followed by four LVs (80 V/cm, 83 ms) [33]. Satkauskaset al. later demonstrated that the HV resulted in electropermeabilization and the LVs resultedin pDNA electrophoresis [34]. A recent study by Satkauskas et al. revealed that the LVs playedan important role in determining the levels of transgene expression following a prerequisiteHV [35]. These studies demonstrate the significant effects the electrophoretic component hason in vivo cell transfection following the initial pore formation. However, these studies fail todistinguish between the potential roles of electrophoresis in increasing interstitial transportversus facilitating cellular uptake. Furthermore, it is still unclear how far and how fast thepDNA can move during electrophoresis.
In this study, we investigated the ability of an applied pulsed electric field to overcome theinterstitial barrier by quantifying the magnitude of in vivo electric field-induced transport ofpDNA in tumor interstitium. Zaharoff et al. have previously reported pDNA electromobilityex vivo in tumor interstitium [36], as well as pDNA electromobility in agarose tissue phantoms[37]. Here, we used a similar technique to quantify interstitial transport of pDNA in vivo intwo types of tumors (4T1 and B16.F10) grown in mouse dorsal skin-fold chambers (DSCs),and correlated the observed electrophoretic movement with the tissue collagen content as hasbeen observed in previous studies [36,38]. Furthermore, we experimentally mapped andnumerically simulated the in vivo distribution of electric potential in tumors. The potentialdistribution determines the local field strength that is the driving force for electrophoresis intumor interstitium.
MATERIALS AND METHODSTumor model
4T1 (a murine mammary carcinoma) and B16.F10 (a metastatic subline of B16 murinemelanoma) cells were cultured in DMEM supplemented with 10 % fetal bovine serum, 100 U/ml streptomycin, and 100 U/ml penicillin at 37°C, 95 % air and 5 % carbon dioxide. Cells wereharvested from flasks with 0.25 % trypsin/EDTA and rinsed with DMEM then PBS. Cells werecentrifuged for 2 min at 176 g and re-suspended in PBS to a final concentration of 5 × 10⁷
cells/ml. Fluorescently labeled, electrically neutral, yellow-green latex microspheres with adiameter of 1.0 μm (YG-MS, Polysciences, Inc., Warrington, PA, USA) were added to the cellsuspension to be used as a tissue marker during image analysis.
Henshaw et al. Page 2
Bioelectrochemistry. Author manuscript; available in PMC 2010 June 15.
NIH
-PA Author Manuscript
NIH
-PA Author Manuscript
NIH
-PA Author Manuscript

Female Balb/C and C57BL/6 mice (18-24 g, Charles River, Raleigh, NC, USA) were used ashosts for 4T1 and B16.F10 tumors, respectively. DSCs were implanted in mice anesthetizedwith an i.p. injection of 80 mg ketamine and 10 mg xylazine per kg body weight. 10 μl of cellsuspension (~5 × 10⁵ cells) were injected into the fascia layer at the center of the DSC, andthen the DSC was sealed with a glass coverslip. Tumors were allowed to grow 5-6 days and7-10 days for 4T1 and B16.F10, respectively.
pDNA AdministrationOnce the tumors had reached 3-4 mm in diameter, the mice were anesthetized and the coverslipwas removed from the DSC. Approximately 1 μg of rhodamine-labeled plasmid DNA (Rho-pDNA, 5.1 kb, Gene Therapy Systems, San Diego, CA, USA) was injected into the center ofthe tumor using a microinjection system consisting of a TransferMan NK micromanipulatorand al CellTram Vario oil pump (Eppendorf, Westbury, NY, USA) mounted on an Axioskop2 Plus upright microscope (Zeiss, Thornwood, NY, USA). This method allowed precise controlover the location and amount of pDNA delivered while limiting damages to tumor tissue andvasculature. The tissue was washed thoroughly with PBS, and then the DSC was resealed witha sterile glass coverslip.
Electric Field ApplicationAnesthetized mice were secured on a custom designed microscope stage on a Model 510confocal microscope (Zeiss). A localized electric field was applied using two stainless steel,parallel plate electrodes on the skin side of the DSC (see Fig.1). An electric potential differencewas supplied by an ECM 830 electro square porator (BTX, San Diego, CA, USA). Pulsedelectric fields examined in this study consisted of 10 identical square voltage pulses with amagnitude of 100 or 400 V/cm and a duration of 20 or 50 ms. The interval between consecutivepulses was 1 s.
Image AcquisitionFluorescence images of the Rho-pDNA and YG-MS were acquired using a 40X objectivebefore and immediately following the application of an entire 10-pulse sequence. The area ofthe image was away from the needle track to ensure the area of the tissue imaged was notdamaged during plasmid administration. The one-dimensional resolution of the acquiredimages was 0.44 μm/pixel. Images for control groups were taken with a 10 s delay betweenimage acquisitions during which no electric field was applied.
Image AnalysisA cross-correlation analysis was performed on the fluorescence images taken before andfollowing application of the pulsed electric field. The analysis was performed independentlyon channel 1 and channel 2 to determine the displacement vector, averaged over a field of view,
of the Rho-pDNA and YG-MS respectively. Details of the analysis are asfollows. Pre- and post-pulse sequence images are represented by p(x, y) and q(x, y),respectively, where x and y are the indices of pixels in each image. If image p(x, y) is fixed andimage q(x, y) is shifted by i and j pixels in x and y directions, respectively, the normalized cross-correlation coefficient of the two images is given by
(1)
Henshaw et al. Page 3
Bioelectrochemistry. Author manuscript; available in PMC 2010 June 15.
NIH
-PA Author Manuscript
NIH
-PA Author Manuscript
NIH
-PA Author Manuscript

where pmean and qmean are the mean intensities in the images p(x, y) and q(x+i, y+j)respectively, and σp and σq are defined as follows.
(2)
(3)
The summations above include only overlapping pixels between p and q. The vector of pDNAmovement was determined by searching i and j at which the correlation coefficient, rij, reacheda maximal value.
Due to their size and neutral charge, YG-MSs were assumed to have remained locked in placewith respect to surrounding tissue and were therefore used as markers for tissue movement.The electric field-induced pDNA movement, defined as the pDNA displacement relative tothe tumor tissue, was determined on a per pulse basis by,
(4)
where dp is the electric field-induced pDNA movement per pulse and N is the number pulsesfor the applied field (N = 10 for all pulsing conditions used in this study).
The in vivo electric field-induced pDNA movement was determined in seven 4T1 and sevenB16.F10 tumors for each of the four pulsing conditions examined in this study. The averagepDNA movement for each pulse condition is reported with error bars representing the standarddeviations of the data.
In Vivo pDNA ElectromobilityThe efficiencies of the different electric fields used in this study to induce pDNA movementwere compared by calculating the pDNA electromobility for each of the pulse conditions. ThepDNA electromobility, μ, was calculated by,
(5)
where Et is the magnitude of the intratumoral electric field determined by the linear regressionanalysis of the experimentally mapped electric potential distribution (see the method sectionon intratumoral potential distribution). v is the magnitude of the velocity vector of the pDNAmovement, which was obtained by,
(6)
where tp is the pulse duration.
Henshaw et al. Page 4
Bioelectrochemistry. Author manuscript; available in PMC 2010 June 15.
NIH
-PA Author Manuscript
NIH
-PA Author Manuscript
NIH
-PA Author Manuscript

Collagen AssayA hydroxyproline assay was performed to determine the average collagen content in tumorsgrown in DSCs. 4T1 and B16.F10 tumors (3-4 mm in diameter) were excised from animalsand incubated in 1.0 ml digesting buffer (126 μg/ml papain in 0.1 M NaHPO4, 5.0 mM EDTA,and 5.0 mM L-cysteine-HCL, pH 6.0) for 20 h at 60°C. 100 μl of each papain digest were thenhydrolysed in 900 μl 6 N HCl for 20 h at 115°C. Samples were brought to room temperatureand two drops of 0.02% methyl red indicator were added. Sample solutions were neutralizedwith 2.5 M NaOH, followed by 0.5 M HCl and, finally, 0.5 M NaOH. The final volume,following titration, of each sample was determined. 1.0 ml chloramines T solution (705 mgchloramine T in 40 ml pH 6.0 buffer and 5 ml isopropanol) was then added to 1.0 ml of eachsample and allowed to stand for 20 min at room temperature. The pH 6.0 buffer consisted of5.0 g citric acid monohydrate, 12.0 g sodium acetate trihydrate, 3.4 g NaOH, and 1.2 ml glacialacetic acid, which were brought to 100 ml with distilled water. 1.0 ml pDAB solution (4.0 gp-dimethylaminobenzaldehyde (pDAB) in 16.0 ml isopropanol and 7.0 ml perchloric acid(60%)) was added and samples were incubated for 20 min at 60°C. Samples were cooled in aroom temperature water bath for 5 min. The absorbance of the solutions at 557 nm was recordedwithin 1 h following cooling. A standard hydroxyproline curve was established by dissolving0-5 μg hydroxyproline in 1 ml deionized water and repeating the above procedure from thestep of chloramines T addition. Hydroxyproline is an amino acid derivative exclusive tocollagen and accounts for approximately 12.5 % of the total collagen mass [39]. The averagecollagen content was determined for three 4T1 and three B16.F10 tumors.
Collagen HistologyHistological analysis was performed on tumor sections to visualize the collagen content anddistribution. 4T1 and B16.F10 tumors were excised from the DSCs in Balb/C and C57BL/6mice, respectively, and fixed in 10 % formalin for 24 h. Sections were then embedded inparaffin, sectioned at 5 μm, and stained with a Masson trichrome solution.
Intratumoral Potential DistributionThe intratumoral electric potential distribution determines the electric field, which is thedriving force for in vivo electrophoresis. The local electric fields within 4T1 and B16.F10tumors were mapped with a microelectrode array. The DSC coverslip was removed fromanesthetized mice secured on the custom microscope stage. A 5 × 5 array of microelectrodes(Bionic Technologies Inc., Salt Lake City, UT, USA) was placed at the center of the tumor,depressed slightly into the tissue, and held in place with clay. This placement coincided withthe approximate location at which pDNA images were taken. The electrode array consisted of25 glass enclosed, platinum electrodes. Total electrode length was 1 mm, with a 50 μm bareplatinum tip, 2.0 μm in diameter. Inter-electrode spacing was 400 μm. The potential at eachelectrode was recorded during the application of a 100 or 400 V/cm, 20 ms pulse using anEnhancer 400 oscilloscope (BTX). Readings at each electrode were taken in triplicate andaveraged. A linear decrease in potential as a function of pulse number was observed during thecourse of these measurements. To compensate for this decrease in potential, linear regressionanalysis was performed on the three readings at each potential and the resulting slopes of theseplots were averaged over the 25 electrodes. This correction factor was then applied to eachpotential reading as a function of pulse number. The potential data at each location used in theisopotential plots was the average of the three corrected readings. The potential distributionwas determined in three 4T1 and three B16.F10 tumors.
The magnitude of the electric field within a tumor was determined by linear regression analysisof the potential distribution recorded by the array of microelectrodes. If the distribution isuniform and unidirectional, the potential, V, can be fit by the function,
Henshaw et al. Page 5
Bioelectrochemistry. Author manuscript; available in PMC 2010 June 15.
NIH
-PA Author Manuscript
NIH
-PA Author Manuscript
NIH
-PA Author Manuscript
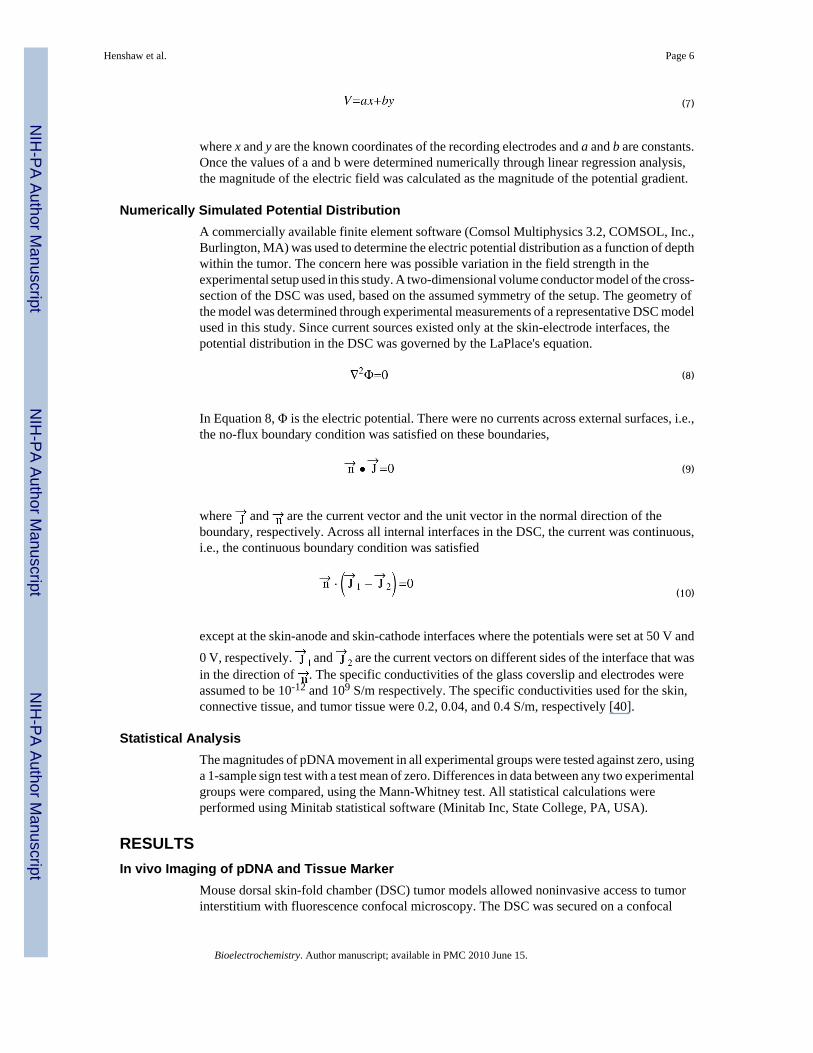
(7)
where x and y are the known coordinates of the recording electrodes and a and b are constants.Once the values of a and b were determined numerically through linear regression analysis,the magnitude of the electric field was calculated as the magnitude of the potential gradient.
Numerically Simulated Potential DistributionA commercially available finite element software (Comsol Multiphysics 3.2, COMSOL, Inc.,Burlington, MA) was used to determine the electric potential distribution as a function of depthwithin the tumor. The concern here was possible variation in the field strength in theexperimental setup used in this study. A two-dimensional volume conductor model of the cross-section of the DSC was used, based on the assumed symmetry of the setup. The geometry ofthe model was determined through experimental measurements of a representative DSC modelused in this study. Since current sources existed only at the skin-electrode interfaces, thepotential distribution in the DSC was governed by the LaPlace's equation.
(8)
In Equation 8, Φ is the electric potential. There were no currents across external surfaces, i.e.,the no-flux boundary condition was satisfied on these boundaries,
(9)
where and are the current vector and the unit vector in the normal direction of theboundary, respectively. Across all internal interfaces in the DSC, the current was continuous,i.e., the continuous boundary condition was satisfied
(10)
except at the skin-anode and skin-cathode interfaces where the potentials were set at 50 V and0 V, respectively. and are the current vectors on different sides of the interface that wasin the direction of . The specific conductivities of the glass coverslip and electrodes wereassumed to be 10-12 and 109 S/m respectively. The specific conductivities used for the skin,connective tissue, and tumor tissue were 0.2, 0.04, and 0.4 S/m, respectively [40].
Statistical AnalysisThe magnitudes of pDNA movement in all experimental groups were tested against zero, usinga 1-sample sign test with a test mean of zero. Differences in data between any two experimentalgroups were compared, using the Mann-Whitney test. All statistical calculations wereperformed using Minitab statistical software (Minitab Inc, State College, PA, USA).
RESULTSIn vivo Imaging of pDNA and Tissue Marker
Mouse dorsal skin-fold chamber (DSC) tumor models allowed noninvasive access to tumorinterstitium with fluorescence confocal microscopy. The DSC was secured on a confocal
Henshaw et al. Page 6
Bioelectrochemistry. Author manuscript; available in PMC 2010 June 15.
NIH
-PA Author Manuscript
NIH
-PA Author Manuscript
NIH
-PA Author Manuscript

microscope stage that allowed simultaneous electric field application and image acquisition.A diagram of the experimental setup is shown in Fig. 1. Images of microinjected Rho-pDNAand YG-MS within tumor interstitium in the DSCs were obtained using a 40X water immersionobjective. The microscope was set to a multichannel configuration, with channel 1 capturingthe Rho-pDNA signal, and channel 2 capturing the YG-MS signal. The images were taken ina line-switching mode to prevent cross talk between the channels. A representative image isshown in Fig. 2.
In vivo Electric Field-Induced pDNA MovementThe electrophoretic movement of pDNA in pulsed electric fields was determined by comparingconfocal images taken immediately before and immediately after pulse application. Thedistance of electric field-induced pDNA movement per pulse, dp, was determined for a set offour pulsing conditions in both 4T1 and B16.F10 tumors (Fig. 3). Under each condition, 10identical square wave pulses were applied sequentially to tumors, with the time intervalbetween pulses being 1 s. The strength and duration of pulses were 100 or 400 V/cm and 20or 50 ms, respectively.
The magnitude of pDNA movement observed without the application of a pulsed electric fieldwas not significantly different from zero in both 4T1 and B16.F10 tumors (P = 0.50 for bothtumors). The magnitude of pDNA movement was significantly greater than zero for eachapplied field in both tumor types (P < 0.05 for all groups). The distances of pDNA movementin 4T1 tumors subjected to a 100 V/cm pulsed field were 2.4 × 10⁻² μm and 3.3 × 10⁻² μm forpulse duration of 20 and 50 ms, respectively. The distances were increased to 9.51 × 10⁻² μmand 2.27 × 10⁻¹ μm, respectively, when the field strength was increased to 400 V/cm. InB16.F10 tumors, the distances of pDNA movement subjected to a 100 V/cm pulsed field were4.52 × 10-2 and 5.05 × 10⁻² μm for pulse duration of 20 and 50 ms, respectively. The distanceswere increased to 9.93 × 10⁻² μm and 2.23 × 10⁻¹ μm, respectively, when the field strengthwas increased to 400 V/cm.
The differences between the data from different groups were compared statistically and the P-values are shown in Table 1. With a 100 V/cm field, increasing the pulse duration from 20 to50 ms did not result in a significant increase in electrophoretic movement of pDNA in either4T1 or B16.F10 tumor. However, with a 400 V/cm field, the electrophoretic movement wassignificantly increased when increasing the pulse duration from 20 to 50 ms in both tumortypes. If the pulse duration was fixed at 20 ms, increasing the field strength from 100 to 400V/cm resulted in a significant increase in pDNA electrophoretic movement in 4T1 tumors, butnot in B16.F10 tumors. With the 50 ms pulses, increasing the field strength from 100 to 400V/cm did result in a significant increase in pDNA electrophoretic movement in both 4T1 andB16.F10 tumors. Finally, the distances of pDNA movement were not statistically differentbetween 4T1 and B16.F10 tumors under any pulsing conditions investigated.
In vivo pDNA ElectromobilityTo further compare the magnitudes of pDNA movement within the tumor under differentpulsing conditions, the electromobility of the pDNA was calculated and the results are shownin Fig. 4. The difference in electromobility between any two groups was statisticallyinsignificant (P > 0.05).
Collagen ContentZaharoff et al. have previously demonstrated that pDNA electrophoretic movement in excisedtumor tissues correlates with the collagen content of the tissue [36]. To determine if this wasalso the case in vivo, a hydroxyproline assay was performed to quantify the collagen contentin 4T1 and B16.F10 tumors. The collagen contents observed in three 4T1 tumors were 4.63
Henshaw et al. Page 7
Bioelectrochemistry. Author manuscript; available in PMC 2010 June 15.
NIH
-PA Author Manuscript
NIH
-PA Author Manuscript
NIH
-PA Author Manuscript

μg, 4.32 μg, and 4.98 μg (mean 4.64 μg) per mg of wet tissue, respectively. The data in threeB16.F10 tumors were 3.35 μg, 3.44 μg, and 5.98 μg (mean = 4.26 μg) per mg of wet tissue,respectively. The difference in the collagen content between 4T1 and B16.F10 tumors grownin DSCs was not statistically significant (P = 0.705).
Histological analysis was also performed on 4T1 and B16.F10 tumor sections excised fromDSCs. Masson trichrome staining of the 5-μm sections revealed similar levels of collagencontent in 4T1 and B16.F10 tumors (Fig. 5). In addition, the histological images showed aheterogeneous distribution of collagen within individual sections. The heterogeneity mightcontribute to the variations in the magnitude of electric field-induced pDNA movementindicated by the scattering of data points shown in Fig. 3.
In vivo Electric Potential DistributionThe intratumoral electric potential distribution, and the resulting electric field, were mappedin vivo using a 5 × 5 microelectrode array (see Fig. 6). The array, commonly referred to as aUtah array, was depressed slightly into the center of a tumor. The potentials at each of the 25electrodes were recorded sequentially when 25 identical pulses with the strength of 100 or 400V/cm and duration of 20 ms were applied. The measurements were performed three times ateach electrode and the average results are reported here. Representative potential distributionswithin both 4T1 and B16.F10 tumors are shown as isopotential plots in Fig. 6. The intratumoralelectric fields were approximately uniform in both tumor types. The slight nonlinearities in theisopotential plots should not drastically affect the magnitude of driving force, i.e., themagnitude of electric field, for the electrophoretic movement observed in this study.
The magnitudes of the electric field were determined through a linear regression analysis ofthe isopotential plots obtained with the Utah array. They were 17.9 and 200 V/cm in 4T1 tumorsfor the 100 V/cm and 400 V/cm applied fields, respectively. The magnitudes in the B16.F10tumor for the same applied fields were 23.0 and 237 V/cm, respectively.
The electric potential distribution in the tumor implanted in a DSC was also simulatednumerically using a finite element method. The isopotential plot in a cross section of the DSC,which was a plane perpendicular to the skin and the parallel-plate electrodes, is shown in Fig.7. The plot suggested that the electric field near the center of the tumor, where the pDNAelectrophoretic movement was measured, was approximately uniform and predominantly inthe direction of applied field.
DISCUSSIONWe successfully adapted the experimental technique, developed previously for ex vivo pDNAmobility measurement, to quantify in vivo electrophoresis of pDNA in electric field-mediatedgene delivery in tumor interstitium. The technique was based on the DSC mouse model thatallowed noninvasive access to living tumor interstitium with fluorescence confocalmicroscopy, and the cross-correlation analysis that allowed quantification of average pDNAdisplacement within a field of view.
Electrical parameters for in vivo DNA electrotransfer have yet to be homogenized in theliterature. In particular, pulse duration may vary from less than 100 μs up to 50 ms and pulsestrength may vary from 10 V/cm to up to 2.0 kV/cm. Both the strength and the duration ofelectric pulses can affect the scale of electrophoretic movement of pDNA. It is plausible thatincreasing these parameters can enhance pDNA electrophoretic movement. Unfortunately,increasing the energy of the applied pulses also increases their adverse effects on tissues.Therefore, the higher energy pulses, which may result in an irreversible cell membranemodification [41,42], are unlikely to be suitable for clinical use.
Henshaw et al. Page 8
Bioelectrochemistry. Author manuscript; available in PMC 2010 June 15.
NIH
-PA Author Manuscript
NIH
-PA Author Manuscript
NIH
-PA Author Manuscript

The pulse durations of 20 and 50 ms used in this study, which represent the longer durationpulses used in the literature, were considered to result in the greatest degree of electric field-induced pDNA mobility [34]. On the other hand, the in vivo mobility data reported in this studyshowed that electric fields applied transcutaneously with parallel-plate electrodes were onlyeffective in driving pDNA over distances less than 0.25 μm per pulse, or 2.5 μm per 10-pulsesequence. The magnitude of this movement is insignificant in terms of macroscopic transportwithin a tumor since it accounts for only one quarter of the diameter of a single cell (~10 μm).This observation suggests that electric fields are not a viable option for enhancing themacroscopic distribution of pDNA within solid tumors. Other techniques, such as intratumoralinfusion [43-45], are likely to be better choices for improving pDNA distribution within atumor.
While the electrophoretic component of electric field-mediated gene delivery may not play asignificant role in macroscopic pDNA movement, it may still have significant contributions toenhancing gene delivery in vivo. Results from this study showed that in the absence of anapplied field, there was no detectable interstitial transport of pDNA. The distance of pDNAmovement was statistically greater than zero only if a pulsed field was applied to tumors. Thisobservation confirmed a notion that DNA electrophoresis was several orders of magnitudefaster than passive diffusion [36,37]. As a result, the interstitial electrophoresis couldeffectively push more pDNA molecules towards the transient pores in the plasma membraneof cells. While mechanisms of cellular uptake of pDNA are still not fully understood [46-49],the increase in extracellular transport of pDNA towards the pores could contribute to theincreased levels of transgene expression observed in previous studies [33-35].
Previous reports have shown that electric fields are effective in driving the movement of pDNAover a greater distance in tissue phantoms composed of agarose gels [37]. Agarose gels areconsidered as accurate phantoms for tissue interstitium, as the fibrous network formed byagarose during solidification is structurally similar to the extracellular matrix (ECM) in tissueinterstitium. The discrepancies between the magnitudes of electrophoretic movement reportedin the reference [37] and those reported here may be attributed to differences in fiber spacingsand local electric fields between the phantoms and tumor tissues. We have demonstrated thatelectric fields in the phantoms are significantly higher than those in tumor tissues when exposedto the same pulsed electric fields [50]. Furthermore, the spacings in agarose gels are likely tobe significantly larger than those in tumor ECM [3,37].
Zaharoff et al. have previously demonstrated that the electrophoretic mobility of pDNA in 4T1tumors, when determined ex vivo, is significantly different from that in B16.F10 tumors [36].The in vivo results obtained in this study showed no significant difference between the twotumors. Nevertheless, the levels of electrophoretic mobility in both studies correlated with thecollagen content of the tumor. These observations were consistent with that of the diffusioncoefficient of macromolecules in tumors, which also correlates with the collagen content [38,51], suggesting that collagen is one of the main barriers for interstitial transport ofmacromolecules.
The differences in the collagen content between the ex vivo and the in vivo studies mentionedabove might be attributed to the different locations of tumor growth. Tumors used in the exvivo experiments were harvested from the hind leg, while tumors in this study were from theDSC. Previous studies have shown that tumor composition can vary with the site ofimplantation [52]. In addition, the differences in the collagen content might be due to differentstages of tumor growth. In the ex vivo study, tumors were excised when they reached ~10 mmin diameter. In this study, tumors were examined when they were 3-4 mm in diameter.
Henshaw et al. Page 9
Bioelectrochemistry. Author manuscript; available in PMC 2010 June 15.
NIH
-PA Author Manuscript
NIH
-PA Author Manuscript
NIH
-PA Author Manuscript

The local electric field was mapped in vivo in mouse DSCs in this study. The resultsdemonstrated that the electric fields, which were the driving force for pDNA movement, wereapproximately uniform in the central region of tumors where the electrophoretic mobility wasmeasured. The slight nonlinearity observed in the isopotential plots in both tumors shown inFig. 6 might be attributed to inhomogeneities in tissue structures, as shown in histologicalexaminations (see Fig. 5). A common trend observed in the isopotential plots shown in Fig. 6was that the nonlinearity was a function of the tissue structure but not the magnitude of theapplied field. Results from the numerical simulations also demonstrated little variation in theelectric field as a function of depth in the central region of the tumor (see Fig. 7). Theintratumoral electric field will not be uniform if the external electric field is applied throughneedle electrodes [53,54].
The intratumoral electric fields mapped in the central region were approximately 20% of theapplied field at 100 V/cm in both tumors and increased to approximately 55% of the appliedfield at 400 V/cm. The increase was mainly due to electric field-induced reduction in the totalelectrical resistance of skin and electrode-tissue interface [50]. To further increase the electricfield in tumors, one can improve the connection between tissue and electrodes to reduce theinterface resistance and treat the skin to reduce its electric resistance [55,56] or use internalneedle electrodes to bypass the skin.
Previous studies using agarose gel as a interstitium phantom showed an increase inelectromobility with increasing either pulse duration or pulse magnitude [37,57]. Thesedependences were attributed to the sieving mechanism of the agarose fiber matrix and thenecessity of the DNA molecule to be deformed to an extent before it was able to reptate throughthe matrix. It was expected that the collagen fibers of the ECM would have a similar effect onDNA transport in vivo. However, the in vivo findings reported here appeared to contradictthese previous findings as they showed that the dependences of electromobility on pulsemagnitude and pulse duration of the applied field were statistically insignificant. The pulseduration and pulse magnitude only affected the ranges of data within the same experimentalgroups (see Fig.4).
As a possible explanation for the above observations, the magnitude of pDNA movementobserved in the 100 V/cm applied field may represent the initial movement of the moleculefrom its post injection site to its first encounter with a physical obstacle (i.e., cell or ECM) intissues. The applied field of 100 V/cm, which yielded intratumoral electric fields of 17.9 and23.0 V/cm in 4T1 and B16.F10, respectively, may not have been sufficient to deform the pDNAto the extent necessary to pass through the pores in the interstitium. This mechanism of DNAtransport has been demonstrated in an agarose gel [57], suggesting that pDNA electrophoresisis relatively unhindered over approximately 250 and 500 nm distances in 4T1 and B16.F10tumors, respectively. When the magnitude of electric field was increased to 400 V/cm, theintratumoral fields were increased to 200 and 237 V/cm in 4T1 and B16.F10, respectively,which were likely to be sufficient to allow pDNA to pass through the pores in the interstitium.As a result, the distances of pDNA movement increased significantly with increasing the pulseduration in both tumors.
In summary, this study provides the first known, direct quantification of electric field-inducedinterstitial transport of pDNA in vivo in tumors. The results showed that the magnitude of thetransport, induced by electrophoretic pulses commonly used in electric field-mediated genedelivery, was insufficient for DNA to move macroscopically through tissues. However, themagnitude of the movement was significantly greater than that observed in the absence of anapplied electric field. Induced transport at this magnitude may be critical for local movementof pDNA from the interstitial space to the transient pores in the plasma membrane of
Henshaw et al. Page 10
Bioelectrochemistry. Author manuscript; available in PMC 2010 June 15.
NIH
-PA Author Manuscript
NIH
-PA Author Manuscript
NIH
-PA Author Manuscript

electropermeabilized cells. To induce greater macroscopic movement of pDNA, additionalmethods must be developed to overcome transport barriers in tumor interstitium.
AcknowledgmentsThis work was supported in part by a grant from the National Institutes of Health (NIH) (CA94019). JWH wassupported in part by a NIH training grant for the Center for Biomolecular and Tissue Engineering at Duke University.
REFERENCES1. Boucher Y, Baxter LT, Jain RK. Interstitial pressure gradients in tissue-isolated and subcutaneous
tumors: Implications for therapy. Cancer Res 1990;50:4478–4484. [PubMed: 2369726]2. Netti PA, Hamberg LM, Babich JW, Kierstead D, Graham W, Hunter GJ, Wolf GL, Fischman A,
Boucher Y, Jain RK. Enhancement of fluid filtration across tumor vessels: Implication for delivery ofmacromolecules. Proc Natl Acad Sci U S A 1999;96:3137–3142. [PubMed: 10077650]
3. Pluen A, Boucher Y, Ramanujan S, McKee TD, Gohongi T, di Tomaso E, Brown EB, Izumi Y,Campbell RB, Berk DA, Jain RK. Role of tumor-host interactions in interstitial diffusion ofmacromolecules: Cranial vs. Subcutaneous tumors. Proc Natl Acad Sci U S A 2001;98:4628–4633.[PubMed: 11274375]
4. Neumann E, Schaefer-Ridder M, Wang Y, Hofschneider PH. Gene transfer into mouse lyoma cells byelectroporation in high electric fields. Embo J 1982;1:841–845. [PubMed: 6329708]
5. Potter H. Electroporation in biology: Methods, applications, and instrumentation. Anal Biochem1988;174:361–373. [PubMed: 3071177]
6. Neumann E. Membrane electroporation and direct gene transfer. Bioelectrochem Bioenerg1992;28:247–267.
7. Wolf H, Rols MP, Boldt E, Neumann E, Teissie J. Control by pulse parameters of electric field-mediatedgene transfer in mammalian cells. Biophys J 1994;66:524–531. [PubMed: 8161705]
8. Neumann E, Kakorin S, Toensing K. Fundamentals of electroporative delivery of drugs and genes.Bioelectroch Bioener 1999;48:3–16.
9. Mir LM, Bureau MF, Gehl J, Rangara R, Rouy D, Caillaud JM, Delaere P, Branellec D, Schwartz B,Scherman D. High-efficiency gene transfer into skeletal muscle mediated by electric pulses. Proc NatlAcad Sci U S A 1999;96:4262–4267. [PubMed: 10200250]
10. Heller L, Jaroszeski MJ, Coppola D, Pottinger C, Gilbert R, Heller R. Electrically mediated plasmidDNA delivery to hepatocellular carcinomas in vivo. Gene Ther 2000;7:826–829. [PubMed:10845719]
11. Wells JM, Li LH, Sen A, Jahreis GP, Hui SW. Electroporation-enhanced gene delivery in mammarytumors. Gene Ther 2000;7:541–547. [PubMed: 10819568]
12. Bettan M, Ivanov MA, Mir LM, Boissiere F, Delaere P, Scherman D. Efficient DNA electrotransferinto tumors. Bioelectrochemistry 2000;52:83–90. [PubMed: 11059581]
13. Lohr F, Lo DY, Zaharoff DA, Hu K, Zhang X, Li Y, Zhao Y, Dewhirst MW, Yuan F, Li CY. Effectivetumor therapy with plasmid-encoded cytokines combined with in vivo electroporation. Cancer Res2001;61:3281–3284. [PubMed: 11309280]
14. Li S, Ma Z. Nonviral gene therapy. Curr Gene Ther 2001;1:201–226. [PubMed: 12108955]15. Tamura T, Nishi T, Goto T, Takeshima H, Dev SB, Ushio Y, Sakata T. Intratumoral delivery of
interleukin 12 expression plasmids with in vivo electroporation is effective for colon and renal cancer.Hum Gene Ther 2001;12:1265–1276. [PubMed: 11440620]
16. Lucas ML, Heller L, Coppola D, Heller R. Il-12 plasmid delivery by in vivo electroporation for thesuccessful treatment of established subcutaneous b16.F10 melanoma. Mol Ther 2002;5:668–675.[PubMed: 12027550]
17. Heller R. Delivery of plasmid DNA using in vivo electroporation. Preclinica 2003;118. Andre F, Mir LM. DNA electrotransfer: Its principles and an updated review of its therapeutic
applications. Gene Ther 2004;11(Suppl 1):S33–42. [PubMed: 15454955]19. Golzio M, Rols MP, Teissie J. In vitro and in vivo electric field-mediated permeabilization, gene
transfer, and expression. Methods 2004;33:126–135. [PubMed: 15121167]
Henshaw et al. Page 11
Bioelectrochemistry. Author manuscript; available in PMC 2010 June 15.
NIH
-PA Author Manuscript
NIH
-PA Author Manuscript
NIH
-PA Author Manuscript

20. Mir LM, Moller PH, Andre F, Gehl J. Electric pulse-mediated gene delivery to various animal tissues.Adv Genet 2005;54:83–114. [PubMed: 16096009]
21. Kachi S, Oshima Y, Esumi N, Kachi M, Rogers B, Zack DJ, Campochiaro PA. Nonviral ocular genetransfer. Gene Ther 2005;12:843–851. [PubMed: 15789063]
22. Chang DC, Reese TS. Changes in membrane structure induced by electroporation as revealed byrapid-freezing electron microscopy. Biophys J 1990;58:1–12. [PubMed: 2383626]
23. Tsong TY. Electroporation of cell membranes. Biophys J 1991;60:297–306. [PubMed: 1912274]24. Chang, DC. Structure and dynamics of electric field-induced membrane pores as revealed by rapid-
freezing electron microscopy. In: Chang, DC.; Chassy, BM.; Saunders, JA.; Sowers, AE., editors.Guide to electroporation and electrofusion. Academic Press, Inc.; San Diego: 1992. p. 9-27.
25. Weaver JC. Electroporation: A general phenomenon for manipulating cells and tissues. J CellBiochem 1993;51:426–435. [PubMed: 8496245]
26. Probstein, RF. Physicochemical hydrodynamics. John Wiley & Sons, Inc.; New York: 1994.27. Neumann, E.; Kakorin, S.; Toensing, K. Principles of membrane electroporation and transport of
macromolecules. In: Jaroszeski, MJ.; Heller, R.; Gilbert, R., editors. Electrochemotherapy,electrogenetherapy, and transdermal drug delivery: Electrically mediated delivery of molecules tocells. Humana Press; Totowa: 2000. p. 1-35.
28. Mir LM. Therapeurtic perspectives on in vivo cell electropermeabilization. Bioelectrochemistry2000;53:1–10. [PubMed: 11206915]
29. Canatella PJ, Karr JF, Petros JA, Prausnitz MR. Quantitative study of electroporation-mediatedmolecular uptake and cell viability. Biophys J 2001;80:755–764. [PubMed: 11159443]
30. Teissie J, Golzio M, Rols MP. Mechanisms of cell membrane electropermeabilization: A minireviewof our present (lack of ?) knowledge. Biochim Biophys Acta 2005;1724:270–280. [PubMed:15951114]
31. Weaver JC, Chizmadzhev YA. Theory of electroporation: A review. Bioelectroch Bioener1996;41:135–160.
32. Gehl J. Electroporation: Theory and methods, perspectives for drug delivery, gene therapy andresearch. Acta Physiol Scand 2003;177:437–447. [PubMed: 12648161]
33. Bureau MF, Gehl J, Deleuze V, Mir LM, Scherman D. Importance of association betweenpermeabilization and electrophoretic forces for intramuscular DNA electrotransfer. Biochim BiophysActa 2000;1474:353–359. [PubMed: 10779687]
34. Satkauskas S, Bureau MF, Puc M, Mahfoudi A, Scherman D, Miklavcic D, Mir LM. Mechanisms ofin vivo DNA electrotransfer: Respective contributions of cell electropermeabilization and DNAelectrophoresis. Mol Ther 2002;5:133–140. [PubMed: 11829520]
35. Satkauskas S, Andre F, Bureau MF, Scherman D, Miklavcic D, Mir LM. Electrophoretic componentof electric pulses determines the efficacy of in vivo DNA electrotransfer. Hum Gene Ther2005;16:1194–1201. [PubMed: 16218780]
36. Zaharoff DA, Barr RC, Li CY, Yuan F. Electromobility of plasmid DNA in tumor tissues duringelectric field-mediated gene delivery. Gene Ther 2002;9:1286–1290. [PubMed: 12224011]
37. Zaharoff DA, Yuan F. Effects of pulse strength and pulse duration on in vitro DNA electromobility.Bioelectrochemistry 2004;62:37–45. [PubMed: 14990324]
38. Netti PA, Berk DA, Swartz MA, Grodzinsky AJ, Jain RK. Role of extracellular matrix assembly ininterstitial transport in solid tumors. Cancer Res 2000;60:2497–2503. [PubMed: 10811131]
39. Edwards CA, O'Brien WD Jr. Modified assay for determination of hydroxyproline in a tissuehydrolyzate. Clin Chim Acta 1980;104:161–167. [PubMed: 7389130]
40. Pavselj N, Bregar Z, Cukjati D, Batiuskaite D, Mir LM, Miklavcic D. The course of tissuepermeabilization studied on a mathematical model of a subcutaneous tumor in small animals. IEEETrans Biomed Eng 2005;52:1373–1381. [PubMed: 16119232]
41. Leroy-Willig A, Bureau MF, Scherman D, Carlier PG. In vivo nmr imaging evaluation of efficiencyand toxicity of gene electrotransfer in rat muscle. Gene Ther. 2005
42. Lefesvre P, Attema J, van Bekkum D. A comparison of efficacy and toxicity between electroporationand adenoviral gene transfer. BMC Mol Biol 2002;3:12. [PubMed: 12175426]
Henshaw et al. Page 12
Bioelectrochemistry. Author manuscript; available in PMC 2010 June 15.
NIH
-PA Author Manuscript
NIH
-PA Author Manuscript
NIH
-PA Author Manuscript
43. Zhang XY, Luck J, Dewhirst MW, Yuan F. Interstitial hydraulic conductivity in a fibrosarcoma. AmJ Physiol Heart Circ Physiol 2000;279:H2726–2734. [PubMed: 11087227]
44. Wang Y, Liu S, Li CY, Yuan F. A novel method for viral gene delivery in solid tumors. Cancer Res2005;65:7541–7545. [PubMed: 16140915]
45. McGuire S, Zaharoff D, Yuan F. Nonlinear dependence of hydraulic conductivity on tissuedeformation during intratumoral infusion. Ann Biomed Eng 2006;34:1173–1181. [PubMed:16791492]
46. Golzio M, Teissie J, Rols MP. Direct visualization at the single-cell level of electrically mediatedgene delivery. Proc Natl Acad Sci U S A 2002;99:1292–1297. [PubMed: 11818537]
47. Antov Y, Barbul A, Mantsur H, Korenstein R. Electroendocytosis: Exposure of cells to pulsed lowelectric fields enhances adsorption and uptake of macromolecules. Biophys J 2005;88:2206–2223.[PubMed: 15556977]
48. Phez E, Faurie C, Golzio M, Teissie J, Rols MP. New insights in the visualization of membranepermeabilization and DNA/membrane interaction of cells submitted to electric pulses. BiochimBiophys Acta 2005;1724:248–254. [PubMed: 15878640]
49. Liu F, Heston S, Shollenberger LM, Sun B, Mickle M, Lovell M, Huang L. Mechanism of in vivoDNA transport into cells by electroporation: Electrophoresis across the plasma membrane may notbe involved. J Gene Med 2006;8:353–361. [PubMed: 16353289]
50. Mossop BJ, Barr RC, Henshaw JW, Zaharoff DA, Yuan F. Electric fields in tumors exposed to externalvoltage sources: Implication for electric field-mediated drug and gene delivery. Ann Biomed Eng2006;34:1564–1572. [PubMed: 16917743]
51. Ramanujan S, Pluen A, McKee TD, Brown EB, Boucher Y, Jain RK. Diffusion and convection incollagen gels: Implications for transport in the tumor interstitium. Biophys J 2002;83:1650–1660.[PubMed: 12202388]
52. Hobbs SK, Monsky WL, Yuan F, Roberts WG, Griffith L, Torchilin VP, Jain RK. Regulation oftransport pathways in tumor vessels: Role of tumor type and microenvironment. Proc Natl Acad SciU S A 1998;95:4607–4612. [PubMed: 9539785]
53. Sel D, Mazeres S, Teissie J, Miklavcic D. Finite-element modeling of needle electrodes in tissue fromthe perspective of frequent model computation. IEEE Trans Biomed Eng 2003;50:1221–1232.[PubMed: 14619992]
54. Dev SB, Dhar D, Krassowska W. Electric field of a six-needle array electrode used in drug and DNAdelivery in vivo: Analytical versus numerical solution. IEEE Trans Biomed Eng 2003;50:1296–1300.[PubMed: 14620000]
55. Prausnitz MR, Bose VG, Langer R, Weaver JC. Electroporation of mammalian skin: A mechanismto enhance transdermal drug delivery. Proc Natl Acad Sci U S A 1993;90:10504–10508. [PubMed:8248137]
56. Weaver JC, Vaughan TE, Chizmadzhev Y. Theory of electrical creation of aqueous pathways acrossskin transport barriers. Adv Drug Deliv Rev 1999;35:21–39. [PubMed: 10837687]
57. Henshaw JW, Zaharoff DA, Mossop BJ, Yuan F. A single molecule detection method forunderstanding mechanisms of electric field-mediated interstitial transport of genes.Bioelectrochemistry 2006;69:248–253. [PubMed: 16713747]
Henshaw et al. Page 13
Bioelectrochemistry. Author manuscript; available in PMC 2010 June 15.
NIH
-PA Author Manuscript
NIH
-PA Author Manuscript
NIH
-PA Author Manuscript

Figure 1.Diagram of the experimental setup used in this study. A DSC with tumor is shown in Panel A.Panel B shows how a DSC was secured to a stage of confocal microscope. The electric fieldwas applied to the tumor through the parallel-plate electrodes in contact with the skin side ofthe DSC while the objective of microscope had access to the tumor on the window side of theDSC. An illustration of a mouse implanted with a DSC can be found in {Jain, 1994 #59}.
Henshaw et al. Page 14
Bioelectrochemistry. Author manuscript; available in PMC 2010 June 15.
NIH
-PA Author Manuscript
NIH
-PA Author Manuscript
NIH
-PA Author Manuscript

Figure 2.A representative confocal image of Rho-pDNA (red) and YG-MS (green) in tumor tissues inthe DSC in vivo. The image was acquired in a multichannel configuration of the confocalmicroscope, using a 40X water immersion objective.
Henshaw et al. Page 15
Bioelectrochemistry. Author manuscript; available in PMC 2010 June 15.
NIH
-PA Author Manuscript
NIH
-PA Author Manuscript
NIH
-PA Author Manuscript

Figure 3.Mean values of net pDNA movement per pulse, dp, in 4T1 (A) and B16.F10 (B) tumorinterstitium with an applied electric field that consisted of 10 identical pulses with 100 or 400V/cm in magnitude and 20 or 50 ms in duration. The interval between consecutive pulses was1 s. The symbols represent individual data points and the error bars represent the standarddeviations of the data (n = 7).
Henshaw et al. Page 16
Bioelectrochemistry. Author manuscript; available in PMC 2010 June 15.
NIH
-PA Author Manuscript
NIH
-PA Author Manuscript
NIH
-PA Author Manuscript

Figure 4.Mean values of electromobility, μ, of pDNA in 4T1 (A) and B16.F10 (B) tumor interstitiumwith an applied electric field that consisted of 10 identical pulses that were 100 or 400 V/cmin magnitude, Eapp, and 20 or 50 ms in duration. The interval between consecutive pulses was1 s. Electromobility was calculated using the measured pDNA movement shown in Figure 3and intratumoral electric field determined in a separate experiment. Differences in theelectromobility between any two groups were not statistically significant (P > 0.05). Symbolsrepresent individual data points and error bars represent the standard deviations of the data (n= 7).
Henshaw et al. Page 17
Bioelectrochemistry. Author manuscript; available in PMC 2010 June 15.
NIH
-PA Author Manuscript
NIH
-PA Author Manuscript
NIH
-PA Author Manuscript

Figure 5.Masson trichrome staining of 4T1 (A) and B16.F10 (B) tumor sections (5 μm in thickness).Cytoplasm and nuclei are stained pink and collagen is stained blue.
Henshaw et al. Page 18
Bioelectrochemistry. Author manuscript; available in PMC 2010 June 15.
NIH
-PA Author Manuscript
NIH
-PA Author Manuscript
NIH
-PA Author Manuscript

Figure 6.(A) A schematic of electrode array placement for recording of intraturmaral potentialdistribution. Isopotential plots in 4T1 (B, D) and B16.F10 (C, E) tumors during the applicationof a 100 V/cm (B, C) or 400 V/cm (D, E) pulse with 20 ms in duration. The label on eachisopotential plot indicates the value of electric potential. The labels of the horizontal andvertical axes represent the coordinates of the recording electrodes on the 5 × 5 electrode array.Center-to-center spacing of adjacent recording electrodes was 400 μm.
Henshaw et al. Page 19
Bioelectrochemistry. Author manuscript; available in PMC 2010 June 15.
NIH
-PA Author Manuscript
NIH
-PA Author Manuscript
NIH
-PA Author Manuscript

Figure 7.Isopotential plot in a DSC cross-section using the data from the numerical simulations. Thestrength of the applied field was 100 V/cm. The potential difference between adjacent plots is0.5 V.
Henshaw et al. Page 20
Bioelectrochemistry. Author manuscript; available in PMC 2010 June 15.
NIH
-PA Author Manuscript
NIH
-PA Author Manuscript
NIH
-PA Author Manuscript

NIH
-PA Author Manuscript
NIH
-PA Author Manuscript
NIH
-PA Author Manuscript
Henshaw et al. Page 21
TAB
LE 1
P-V
alue
s in
stat
istic
al c
ompa
rison
s of e
lect
ric fi
eld-
indu
ced
inte
rstit
ial t
rans
port
dist
ance
sa
4T1
B16.
F10
100
V/c
m40
0 V
/cm
100
V/c
m40
0 V
/cm
20 m
s50
ms
20 m
s50
ms
20 m
s50
ms
20 m
s50
ms
4T1
100
V/c
m20
ms
1.00
0
50 m
s0.
655
1.00
0
400
V/c
m20
ms
0.00
20.
015
1.00
0
50 m
s0.
002
0.00
20.
002
1.00
0
B16.
F10
100
V/c
m20
ms
0.65
50.
748
0.09
70.
002
1.00
0
50 m
s0.
225
0.44
30.
097
0.00
20.
749
1.00
0
400
V/c
m20
ms
0.00
50.
041
0.60
90.
007
0.16
00.
160
1.00
0
50 m
s0.
002
0.00
20.
007
0.79
80.
003
0.00
30.
015
1.00
0
a The
P-va
lues
wer
e de
term
ined
by
Man
n-W
hitn
ey te
st. T
he d
iffer
ence
for e
ach
com
paris
on o
f the
dat
a sh
own
in F
ig.3
was
stat
istic
ally
sign
ifica
nt if
P <
0.0
50.
Bioelectrochemistry. Author manuscript; available in PMC 2010 June 15.