Computational Identification and Characterization of Novel Genes from Legumes
Upload
khangminh22Category
view
0download
0
Volume 25 Number 1 March 2012
of
Journal
Food Legumes
Indian Society of Pulses Research and DevelopmentIndian Institute of Pulses Research
Kanpur, IndiaI SPR D
1987
ISSN0970-6380
Online ISSN0976-2434
www.isprd.in

The Indian Society of Pulses Research andDevelopment (ISPRD) was founded in April 1987 with thefollowing objectives: To advance the cause of pulses research To promote research and development, teaching and
extension activities in pulses To facilitate close association among pulse workers
in India and abroad To publish “Journal of Food Legumes” which is the
official publication of the Society, published four timesa year.
Membership : Any person in India and abroad interestedin pulses research and development shall be eligible formembership of the Society by becoming ordinary, life orcorporate member by paying respective membership fee.Membership Fee Indian (Rs.) Foreign (US $)Ordinary (Annual) 350 25Life Member 3500 200Admission Fee 20 10Library/ Institution 3000 100Corporate Member 5000 -
INDIAN SOCIETY OF PULSES RESEARCH AND DEVELOPMENT(Regn. No.877)
The contribution to the Journal, except in case ofinvited articles, is open to the members of the Societyonly. Any non-member submitting a manuscript will berequired to become annual member. Members will beentitled to receive the Journal and other communicationsissued by the Society.
Renewal of subscription should be done in Januaryeach year. If the subscription is not received by February15, the membership would stand cancelled. Themembership can be revived by paying readmission fee ofRs. 10/-. Membership fee drawn in favour of Treasurer,Indian Society of Pulses Research and Development,through M.O./D.D. may be sent to the Treasurer,Indian Society of Pulses Research and Development,Indian Institute of Pulses Research, Kanpur 208 024,India. In case of outstation cheques, an extra amount ofRs. 40/- may be paid as clearance charges.
EXECUTIVE COUNCIL : 2010-2012
Zone I : Dr (Mrs) Livinder KaurPAU, Ludhiana
Zone II : Dr HK DixitIARI, New Delhi
Zone III : VacantZone IV : Dr Vijay Prakash
ARS, Sriganganagar
Editor-in-Chief : NP Singh
Councillors
Dr A Amarendra Reddy, ICRISAT, HyderabadDr AB Rai, IIVR, VaranasiDr AK Tripathi, CSAUAT, KanpurDr CS Prahraj, IIPR, KanpurDr IP Singh, IIPR, KanpurDr Jagdish Singh, IIPR, KanpurDr KB Saxena, ICRISAT, HyderabadDr Li Zhenghong, RIRI, PRC ChinaDr MK Singh, IIPR, Kanpur
Chief PatronDr S Ayyappan
PatronDr SK Datta
Co-patronDr N Nadarajan
Zone V : Dr KK NemaRAK College, Sehore
Zone VI : Dr Ch Srinivasa RaoCRIDA, Hyderabad
Zone VII : VacantZone VIII : Dr Anoop Singh Sachan
IIPR, Kanpur
PresidentDr JS Sandhu (Acting)
SecretaryDr AK Choudhary
Joint SecretaryMr Brahm Prakash
TreasurerDr KK Singh
Vice PresidentDr JS Sandhu
EditorsDr MA Iquebal, IASRI, New DelhiDr Mohd Akram, IIPR, KanpurDr P Duraimurugan, IIPR, KanpurDr Rajindar Peshin, SKUAT, SrinagarDr RK Varshney, ICRISAT, HyderabadDr RS Raje, IARI, New DelhiDr Sarvjeet Singh, PAU, LudhianaDr SC Gupta, ARS, DurgapuraDr VK Shahi, RAU, Pusa

Journal of Food Legumes 25(1): 1-8, 2012
Inheritance of some quantitative characters in urdbean [Vigna mungo (L.) Hepper]RAMA KANT and R.K. SRIVASTAVA
Department of Genetics and Plant Breeding, N.D. University of Agriculture and Technology, Kumarganj,Faizabad – 224 229, Uttar Pradesh, India; E-mail: [email protected](Received: May 05, 2011; Accepted: February 17, 2012)
ABSTRACT
Six populations viz., P1, P2, F1, F2, B1 and B2 of six crossesinvolving eight parents were evaluated following compactfamily block design during zaid and kharif season in 2008 tostudy the mode of inheritance by using simple (A, B, C and D)and joint scaling tests. The nature and magnitude of gene effectsfor yield and its components in urdbean was also studied usingsix parameters model of generation mean analysis. Thepresence of epistasis was detected in 130 cases by simple aswell as joint sealing test and inadequacy of additive-dominancemodel was established. Additive (d), dominance (h) gene effectsalong with one or more type of non-allelic interaction (i, j, l)contributed significantly towards the inheritance of all thequantitative characters in majority of the crosses. Duplicatetype of epistasis was also prevalent in most of the cases withfew exceptions. Thus, biparental mating may be suggested forimprovement of urdbean populations.
Key words: Epistasis, Gene action, Generation mean analysis,Urdbean, Vigna mungo
Blackgram is one of the important pulse crop grown in awide range of agro-climatic conditions of the country. It iscultivated in all the seasons in India. During kharif season, itis grown as a sole crop or mixed with sorghum, pearl millet andpigeonpea. In rabi (central and southern India) and zaid(summer) seasons, it is cultivated as a pure culture (Singh2009). However, its productivity is very low due to low yieldpotential and narrow genetic base of existing cultivars(Chakravarty 2008). Thus, in most breeding programme, majoremphasis is placed on the improvement of yield and relatedcomponent traits of polygenetic nature (Baisakh et al. 2011).An understanding of the mode of inheritance of complexquantitative traits in different cropping seasons is essentialfor formulation of an effective breeding program forimprovement of a particular trait. Epistasis is a universalphenomenon in the inheritance of yield and components incrop plants. Detection of epistasis becomes essential not onlyfor obtaining unbiased estimates of additive and dominancegene effects but it also facilitates the breeders to decide aboutthe specific breeding methods to bring about improvement inthe crop. Thus, present investigation was undertaken to detectthe epistasis and adequacy of additive dominance/non-allelicmodel by using simple (A, B, C and D) scaling test (Mather1949, Hayman and Mather 1955), as well as by Joint ScalingTest (Cavalli 1952) and to estimate the nature and magnitude
of gene effects for yield and its components during zaid andkharif in six crosses of black gram.
MATERIALS AND METHODS
Eight homozygous and genetically diverse genotypes/varieties of urdbean i.e. ‘NDU 97-10’, ‘NDU 99-2’, ‘IPU 981’,‘Shekhar 1’, ‘KU 300’, ‘KU 321’, ‘Uttara’ and ‘NDU 1’ wereselected. These urdbean genotypes were crossed to producesix F1’s i.e. NDU 97-10 × IPU 981 (cross I), NDU 99-2 × IPU 981(cross II), Shekhar 1 × KU 300 (cross III), Shekhar 1 × KU321(cross IV), Uttara × NDU 1 (cross V) and Uttara × KU 321(cross VI). These F1’s were backcrossed to their respectiveparents (P1 and P2) to produce B1’s and B2’s as well as selfedto produce F2 seeds. Thus, six genetic populations namely,P1, P2, F1, F2, B1 and B2 were raised in a compact family blockdesign with three replications during zaid and kharif 2008 atthe Genetics and Plant Breeding Research Farm, N.D.University of Agriculture and Technology, Kumarganj,Faizabad (U.P.). The F1’s and parents were sown in a singlerow plot of each. Whereas, back cross and F2 populationswere sown in a three and six rows plot, respectively in fivemeter length at a row spacing of 30 cm. Observations wererecorded on 10 randomly selected plants from parents andF1’s, 25 plants from back crosses (B1 and B2) and 30 plantsfrom F2 generations for 12 quantitative traits namely, days to50 per cent flowering, days to maturity, plant height (cm),number of clusters per plant, number of seeds per pod, numberof pods per plant, pod seed ratio (%), 100-seed weight (g),biological yield per plant (g), harvest index (%), seed yield perplant (g) and protein content (%). Simple scaling tests (Mather,1949) and joint scaling tests (Cavalli 1952) were appliedsimultaneously for the detection of epistasis. Gene effectswere determined by the six parameter model of Hayman (1958)to establish inadequacy of additive model in all the casesstudied.
RESULTS AND DISCUSSION
Mean sum of squares for differences between six crossfamilies were significant for all the traits in both zaid andkharif experiments. Mean sum of squares due to differencesamong generations or progenies within each cross family werealso significant for all the traits during both crop seasons(zaid and kharif) except number of clusters per plant in crossesNDU 97-10 × IPU 981 (C1), Uttara × NDU-1 (C5) and Uttara ×

2 Journal of Food Legumes 25(1), 2012
Table 1. Simple scaling tests, gene effects and type of epistasis for 12 metric traits in six crosses during zaid 2008
Gene effects Scales Crosses m d h i j l A B C D
Type of epistasis
Days to 50% flowering NDU 97-10 × IPU 981 39.67
±0.33 1.67
±0.47** -14.50
±1.68** -8.67
±1.63** -0.50 ±0.52
-7.00 ±2.44**
7.33 ±0.82**
8.33 ±0.82**
24.33 ±1.56**
4.33 ±0.81**
C
NDU 99 -2 × IPU 981 41.67 ±0.33
5.00 ±0.47**
-14.00 ±1.68**
-14.00 ±1.63**
2.00 ±0.53**
8.00 ±2.45**
5.00 ±0.82**
1.00 ±0.82
20.00 ±1.56**
7.00 ±0.82**
D
Shekhar 1 × KU 300 39.33 ±0.33
3.33 ±0.47**
-10.50 ±1.75**
-5.33 ±1.63**
4.83 ±0.53**
-12.33 ±2.62**
13.67 ±0.94**
4.00 ±0.94**
23.00 ±0.18**
2.67 ±0.82**
C
Shekhar 1 × KU 321 42.67 ±0.33
-2.33 ±0.47**
-9.00 ±1.68**
-8.67 ±1.63**
-0.67 ±0.53
2.00 ±2.45
2.67 ±0.82**
4.00 ±0.82**
15.33 ±1.56**
4.33 ±0.82**
-
Uttara × NDU 1 39.33 ±0.33
-3.67 ±0.47**
-2.33 ±1.68
0.67 ±1.63
-2.67 ±0.53**
-15.33 ±2.45**
4.67 ±0.82**
10.00 ±0.82**
14.00 ±1.56**
-0.33 ±0.82
-
Uttara × KU 321 43.67 ±0.33
-4.00 ±0.47**
-14.00 ±1.72**
-13.33 ±1.63**
-1.00 ±0.62
2.67 ±2.54
4.33 ±0.94**
6.33 ±0.94**
24.00 ±1.70**
6.67 ±0.82**
-
Days to maturity NDU 97-10 × IPU 981 43.67
±0.33 -4.00
±0.47** -14.00
±1.72** -13.33
±1.63** -1.00 ±0.62
2.67 ±2.54
4.33 ±0.94**
6.33 ±0.94**
24.00 ±1.70**
6.67 ±0.82**
-
NDU 99 -2 × IPU 981 78.00 ±0.58
2.00 ±0.47**
-24.33 ±2.53**
-29.33 ±2.49**
1.00 ±0.53
31.33 ±3.09**
0.00 ±0.81
-2.00 ±0.81*
27.33 ±2.44**
14.67 ±1.25**
D
Shekhar 1 × KU 300 72.33 ±0.33
5.33 ±0.47**
-5.83 ±1.68**
-1.33 ±1.63
6.83 ±0.53**
-7.00 ±2.45**
11.00 ±0.81**
-2.67 ±0.81
9.67 ±1.56**
0.67 ±0.82
C
Shekhar 1 × KU 321 76.33 ±0.33
-4.67 ±0.47**
-11.17 ±1.68**
-5.33 ±1.63**
-3.17 ±0.53**
-13.67 ±2.45**
-6.33 ±0.47
-12.66 ±0.82**
-24.33 ±1.56**
-2.66 ±0.80**
C
Uttara × NDU 1 74.33 ±0.33
-3.67 ±0.74**
-23.00 ±2.04**
-19.33 ±2.00**
-1.33 ±0.78
10.00 ±3.37**
3.33 ±0.82**
6.00 ±1.41**
28.67 ±1.56**
9.67 ±1.00**
D
Uttara × KU 321 76.67 ±0.33
-6.33 ±0.47**
-16.83 ±1.71**
-16.67 ±1.63**
-2.83 ±0.62**
8.33 ±2.54**
1.33 ±0.94
7.00 ±0.94**
25.00 ±1.70**
8.33 ±0.82**
D
Plant height (cm) NDU 97-10 × IPU 981 70.81
±0.67 -13.17
±1.07** -36.45
±3.47** -34.59
±3.43** -8.78
±1.19** 32.01
±5.18** -7.48
±1.06** 10.08
±2.15** 37.19
±2.90** 17.19
±1.71** D
NDU 99 -2 × IPU 981 69.87 ±0.37
-15.77 ±1.15**
-16.56 ±2.86**
-17.15 ±2.74**
-11.27 ±1.22**
3.24 ±5.13
-4.32 ±1.82*
18.23 ±1.94**
31.06 ±2.24**
8.58 ±1.37**
-
Shekhar 1 × KU 300 74.26 ±0.55
9.29 ±1.14**
-19.21 ±3.29**
-18.84 ±3.18**
3.86 ±1.24*
11.12 ±5.34**
7.72 ±1.79**
0.00 ±1.95
26.56 ±2.75**
9.42 ±1.59**
D
Shekhar 1 × KU 321 73.27 ±0.84
1.7 ±1.63
0.81 ±4.79
-1.44 ±4.69
1.73 ±1.65
6.20 ±7.60
-0.65 ±3.23**
-4.11 ±1.53*
-3.32 ±3.91
0.72 ±2.34
-
Uttara × NDU 1 71.49 ±0.68
8.09 ±1.51**
0.76 ±4.11
-2.81 ±4.06
3.03 ±1.65*
-4.67 ±6.75
6.77 ±2.28**
0.71 ±2.39
10.30 ±3.04**
1.41 ±2.03
-
Uttara × KU 321 81.57 ±0.35
-2.85 ±1.14*
-24.91 ±2.86**
-28.85 ±2.69**
-1.83 ±1.23
36.65 ±5.18**
-5.73 ±1.83**
-2.07 ±2.06
21.05 ±2.42**
14.43 ±1.34**
D
Number of clusters/plant NDU 97-10 × IPU 981 -- -- -- -- -- -- -- -- -- -- -- NDU 99 -2 × IPU 981 5.31
±0.10 -0.49
±0.24* 2.23
±0.69** 1.52
±0.63* -0.18 ±0.28
0.22 ±1.17
-1.05 ±0.51*
-0.69 ±0.39
-3.26 ±0.66**
-0.76 ±0.32*
-
Shekhar 1 × KU 300 7.02 ±0.48
0.02 ±0.43
-0.38 ±2.15
-2.21 ±0.13**
-0.23 ±0.47
3.02 ±2.67
-0.64 ±0.63
-1.80 ±0.78**
1.39 ±2.04
1.10 ±1.06
-
Shekhar 1 × KU 321 5.51 ±0.18
-1.13 ±0.54
4.77 ±1.34**
4.85 ±1.29**
-1.51 ±0.55**
-7.54 ±2.37**
-0.16 ±0.39
2.85 ±1.13*
-2.17 ±1.00*
-2.43 ±0.65**
D
Uttara × NDU 1 -- -- -- -- -- -- -- -- -- -- -- Uttara × KU 321 -- -- -- -- -- -- -- -- -- -- --
Number of pods/plant NDU 97-10 × IPU 981 27.60
±0.48 0.09 ±0.85
-7.83 ±2.70**
-9.29 ±2.58**
1.34 ±1.01
21.73 ±4.22**
-4.88 ±1.61**
-7.56 ±1.46**
-3.15 ±2.50
4.65 ±1.29**
D
NDU 99 -2 × IPU 981 25.61 ±0.91
-0.27 ±1.17
16.55 ±4.36**
14.16 ±4.33**
1.03 ±1.24
-15.07 ±6.03*
1.49 ±1.94
-0.58 ±1.62
-13.25 ±3.78**
-7.08 ±2.16**
C
Shekhar 1 × KU 300 27.09 ±0.75
-1.37 ±0.69*
-1.89 ±3.34
-6.27 ±3.29*
1.31 ±0.90
17.83 ±4.24**
-4.47 ±1.40**
-7.10 ±1.15**
-5.31 ±3.21
3.13 ±1.64
-
Shekhar 1 × KU 321 30.83 ±0.24
0.11 ±1.08
1.37 ±3.23
-9.79 ±3.38**
0.80 ±1.13
14.86 ±6.24*
-1.73 ±2.44
-3.34 ±2.91**
4.71 ±4.48
4.89 ±1.19**
-
Uttara × NDU 1 24.42 ±0.38
-2.39 ±0.87**
15.74 ±2.55**
16.37 ±2.31**
-3.08 ±0.96**
-15.64 ±4.38**
-3.45 ±1.76*
2.71 ±1.63
-17.11 ±2.64**
8.19 ±1.15**
D
contd.

Kant and Srivastava : Inheritance of some quantitative characters in urdbean [Vigna mungo (L.) Hepper] 3
Uttara × KU 321 29.63 ±0.22
1.56 ±1.12
-16.86 ±2.84**
-17.28 ±2.41**
-1.49 ±1.24
20.37 ±5.47**
-4.54 ±2.36
-1.55 ±2.15
11.19 ±3.16**
8.64 ±1.20**
D
Number of seeds/pod NDU 97-10 × IPU 981 -- -- -- -- -- -- -- -- -- -- -- NDU 99 -2 × IPU 981 5.40
±0.16 -0.07 ±0.13
-1.16 ±0.70
-1.25 ±0.70
0.51 ±0.17**
1.86 ±0.89*
0.20 ±0.31
-0.82 ±0.22**
0.63 ±0.71
0.62 ±0.34
-
Shekhar 1 × KU 300 -- -- -- -- -- -- -- -- -- -- -- Shekhar 1 × KU 321 4.45
±0.11 0.33
±0.11** 3.78
±0.50** 3.47
±0.48** 0.58
±0.16** -4.29
±0.67** 0.99 ±0.16
-0.17 ±0.29
-2.65 ±0.49**
-1.73 ±0.24**
D
Uttara × NDU 1 5.26 ±0.05
0.78 ±0.19**
0.87 ±0.48
-0.12 ±0.44
0.78 ±0.21**
0.47 ±0.88
0.61 ±0.36
-0.96 ±0.31**
-0.23 ±0.42
0.06 ±022
-
Uttara × KU 321 4.45 ±0.27
-0.01 ±0.27
3.41 ±1.23**
2.70 ±1.20
0.23 ±0.32
-1.42 ±1.60
-0.41 ±0.31
-0.87 ±0.61
-3.98 ±1.75**
-1.35 ±0.60*
-
Pod seed ratio (%) NDU 97-10 × IPU 981 62.25
±0.26 3.41
±0.15** 18.79
±1.12** 16.59
±1.10** 2.83
±0.20** -25.98
±1.29** 7.53
±0.30** 1.87
±0.35** -7.19
±1.13** -8.29
±0.55** D
NDU 99 -2 × IPU 981 66.94 ±0.18
5.07 ±0.95**
-6.57 ±2.11**
-10.53 ±2.04**
7.27 ±1.03**
-2.13 ±4.01
13.60 ±1.66**
-0.94 ±1.33
23.19 ±1.32**
5.26 ±1.02**
-
Shekhar 1 × KU 300 60.92 ±0.21
-1.44 ±0.32**
22.38 ±1.10**
22.73 ±1.07**
-3.52 ±0.40**
-37.17 ±1.64**
3.70 ±0.47**
10.74 ±0.69**
-8.29 ±1.05**
-11.36 ±0.53**
D
Shekhar 1 × KU 321 67.07 ±0.26
2.15 ±0.66**
-14.06 ±1.70**
-13.10 ±1.69**
0.64 ±0.67
13.13 ±2.89**
0.62 ±0.52**
-0.65 ±1.28
13.07 ±1.15**
6.55 ±0.84**
C
Uttara × NDU 1 65.22 ±0.14
-0.32 ±0.40
-11.35 ±1.00**
-13.86 ±0.98**
1.40 ±0.41**
20.20 ±1.76**
-1.76 ±0.60**
-4.57 ±0.66**
7.52 ±0.72**
6.93 ±0.49**
D
Uttara × KU 321 62.22 ±0.35
-2.82 ±0.35**
1.96 ±1.61
-0.29 ±1.57
-1.73 ±0.36**
1.89 ±2.11
-2.53 ±0.57**
0.92 ±0.67
-1.32 ±1.57
0.14 ±0.78
-
100-seed weight (g) NDU 97-10 × IPU 981 4.14
±0.05 -0.36
±0.16* 0.54 ±0.39
-0.64 ±0.39
-0.31 ±0.17
0.44 ±0.69
-0.21 ±0.20
0.40 ±0.28
0.84 ±0.25**
0.32 ±0.19
-
NDU 99 -2 × IPU 981 3.99 ±0.06
1.96 ±0.09**
3.31 ±0.38**
3.33 ±0.29**
1.14 ±0.10**
-3.67 ±0.65**
1.31 ±0.27**
-0.97 ±0.29**
-2.98 ±0.55**
-1.66 ±0.14**
D
Shekhar 1 × KU 300 -- -- -- -- -- -- -- -- -- -- -- Shekhar 1 × KU 321 3.41
±0.15 -0.13 ±0.25
1.02 ±0.79
1.46 ±0.78*
0.02 ±0.26
-0.97 ±1.19
-0.23 ±0.47
-0.26 ±0.26
-1.96 ±0.64*
-0.73±0.39
-
Uttara × NDU 1 -- -- -- -- -- -- -- -- -- -- -- Uttara × KU 321 4.03
±0.09 -0.19 ±0.21
-0.94 ±0.58
-0.94 ±0.58
-0.18 ±0.21
1.83 ±0.93*
-0.62 ±0.21**
-0.26 ±0.38
-0.06 ±0.43
0.47 ±0.29
-
Biological yield/plant (g) NDU 97-10 × IPU 981 27.8
±0.92 1.05 ±0.97
-0.18 ±4.20
-2.58 ±4.17
2.68 ±1.01*
12.05 ±5.48*
-2.05 ±1.29
-7.42 ±1.78**
-6.90 ±3.83
1.29 ±2.08
-
NDU 99 -2 × IPU 981 25.28 ±0.72
-1.94 ±0.85*
6.80 ±3.39**
6.76 ±3.35
-1.49 ±0.88
-0.43 ±4.59
-4.65 ±1.70**
-1.67 ±0.85
-13.09 ±3.09**
-3.38 ±1.67**
-
Shekhar 1 × KU 300 33.43 ±0.41
3.64 ±1.07**
-23.87 ±2.84**
-25.03 ±2.69**
0.33 ±1.13
36.74 ±4.93**
-5.53 ±2.17*
-6.19 ±1.35**
13.32 ±2.46**
12.52 ±1.34**
D
Shekhar 1 × KU 321 35.68 ±0.69
5.79 ±7.26
-5.27 ±3.98
-11.74 ±3.74**
2.20 ±1.36
12.96 ±6.37*
1.59 ±2.79
-2.81 ±1.68
10.53 ±3.88**
5.87 ±1.86**
-
Uttara × NDU 1 25.62 ±0.37
4.00 ±0.95**
18.28 ±2.52**
7.84 ±2.39**
0.72±1.10 14.42 ±4.36**
-10.41 ±1.91**
-11.85 ±1.35**
-30.11 ±2.16**
-3.92 ±1.20**
C
Uttara × KU 321 31.70 ±0.59
0.49 ±0.43
-21.66 ±2.66**
-22.49 ±2.53**
-1.69 ±0.63**
33.77 ±3.36**
-7.33 ±1.04**
-3.95 ±1.20**
11.21 ±2.89**
11.25 ±1.26**
D
Harvest index (%) NDU 97-10 × IPU 981 19.49
±0.83 -3.02
±1.49* -8.47 ±4.53
-9.91 ±4.47*
-1.59 ±1.63
16.72 ±7.00*
-5.00 ±1.52**
-1.81 ±2.93
3.09 ±3.64
4.95 ±2.23*
-
NDU 99 -2 × IPU 981 20.36 ±1.16
11.68 ±1.08**
22.48 ±5.25**
19.55 ±5.13**
10.54 ±1.33**
-25.26 ±6.74**
13.39 ±2.16**
-7.69 ±1.95**
-13.85 ±5.18**
-9.78 ±2.56**
D
Shekhar 1 × KU 300 14.26 ±0.49
-0.54 ±1.06
11.89 ±3.08**
9.83 ±2.89**
3.16 ±1.25*
2.09 ±5.15
-2.79 ±2.42
-9.12 ±1.36**
-21.74 ±2.92**
-4.91 ±1.44**
-
Shekhar 1 × KU 321 13.03 ±1.09
-2.70 ±1.18*
16.26 ±5.24**
14.59 ±4.98**
0.90 ±1.22
-12.06 ±7.23
-0.37 ±2.41
-2.17 ±2.31
-17.13 ±5.47**
-7.30 ±2.49**
-
Uttara × NDU 1 19.87 ±0.94
-2.08 ±1.08**
-4.30 ±4.39
-1.57 ±4.34
-0.46 ±1.13
-6.20 ±5.87
3.42 ±1.80
4.35 ±1.55**
9.34 ±3.96*
0.79 ±2.17
-
Uttara × KU 321 15.79 ±0.52
0.17 ±1.11
11.67 ±3.41**
8.15 ±3.03**
1.11 ±1.26
-5.97 ±5.80
0.02 ±2.40
-2.20 ±2.17
-10.32 ±3.75**
-4.07 ±1.52**
-
contd.

4 Journal of Food Legumes 25(1), 2012
Seed yield/plant (g) NDU 97-10 × IPU 981 5.40
±0.08 -0.59 ±0.33
-2.51 ±0.74**
-3.27 ±0.73**
0.05 ±0.35
7.29 ±1.38**
-1.96 ±0.32**
-2.01 ±0.62**
-0.76 ±0.39
1.63 ±0.36**
D
NDU 99 -2 × IPU 981 5.37 ±0.37
2.66 ±0.23**
6.36 ±1.58**
5.53 ±1.56**
2.42 ±0.32**
-5.31 ±1.82**
2.31 ±0.52**
-2.52 ±0.41**
5.74 ±1.57**
-2.76 ±0.78**
D
Shekhar 1 × KU 300 4.77 ±0.22
0.42 ±0.21*
0.05 ±1.00
-0.93 ±0.99
0.89 ±0.27**
6.23 ±1.29**
-1.76 ±0.44**
-3.54 ±0.34**
-4.37 ±0.97**
0.46 ±0.50
-
Shekhar 1 × KU 321 4.64 ±0.32
0.09 ±0.43
4.94 ±1.63**
3.14 ±1.55*
0.60 ±0.44
-2.19 ±2.38
0.13 ±0.91
-1.07 ±0.66
-4.09 ±1.62*
-1.57 ±0.77*
-
Uttara × NDU 1 5.09 ±0.26
0.20 ±0.13
1.82 ±1.08
1.00 ±1.07
0.13 ±0.15
0.56 ±1.22
-0.65 ±0.29*
-0.91 ±0.25**
-2.56 ±1.09*
-0.50 ±0.53
-
Uttara × KU 321 5.00 ±0.18
0.12 ±0.25
0.06 ±0.88
-1.44 ±0.86
-0.19 ±0.28
6.42 ±1.29**
-2.68 ±0.40**
-2.30 ±0.42**
-3.54 ±0.79**
0.72 ±0.43
-
Protein content (%) NDU 97-10 × IPU 981 21.94
±0.09 4.53
±0.17** -0.91 ±0.50
-1.15 ±0.49*
1.99 ±0.18**
1.02 ±0.80
2.05 ±0.27**
-1.92 ±0.26**
1.28 ±0.41**
0.58 ±0.25*
-
NDU 99 -2 × IPU 981 20.96 ±0.09
1.03 ±0.31**
-0.75 ±0.73**
-3.55 ±0.71**
0.16 ±0.32
8.52 ±1.32**
-2.32 ±0.48**
-2.64 ±0.45**
-1.41 ±0.45**
1.78 ±0.36**
-
Shekhar 1 × KU 300 22.46 ±0.21
0.95 ±0.16**
-6.24 ±0.90**
-7.95 ±0.90**
0.37 ±0.18*
10.30 ±1.07**
-0.81 ±0.18**
-1.54 ±0.32**
5.59 ±0.85**
3.97 ±0.45**
D
Shekhar 1 × KU 321 22.80 ±0.06
-1.64 ±0.15**
-5.65 ±0.45**
-7.07 ±0.40**
-0.60 ±0.24
11.09 ±0.81**
-2.62 ±0.49**
-1.41 ±0.16**
3.04 ±0.52**
3.53 ±0.20**
D
Uttara × NDU 1 24.87 ±0.04
-3.64 ±0.16*
-10.97 ±0.36**
-14.38 ±0.35**
-1.36 ±0.17**
20.83 ±0.68**
-4.59 ±0.29**
-1.86 ±0.20**
7.93 ±0.23**
7.19 ±0.18**
D
Uttara × KU 321 24.97 ±0.06
-1.86 ±0.19**
-12.40 ±0.46**
-16.01 ±0.46**
-0.29 ±0.20
21.03 ±0.83**
-2.80 ±0.15**
-2.22 ±0.38**
10.99 ±0.29**
8.01 ±0.23**
D
*, **: Significant at P= 0.05 and 0.01, respectively; C = Complementary epistasis, and D = Duplicate epistasis
Table 2. Simple scaling tests, gene effects and type of epistasis for 12 metric traits in six crosses during kharif 2008
Gene effects Scales Crosses m d h i j l A B C D
Type of epistasis
Days to 50% flowering NDU 97-10 × IPU 981 46.33
±0.33 3.33
±0.47** -16.33
±1.70** -17.33
±1.63** 0.00 ±0.58
18.00 ±2.49**
-0.33 ±0.94
-0.33 ±0.82
16.67 ±1.63**
8.67 ±0.82**
D
NDU 99 -2 × IPU 981 48.00 ±0.58
-0.33 ±0.67
-5.67 ±2.93
-8.67 ±2.67**
-4.33 ±0.71**
2.00 ±4.29
-1.00 ±1.41
7.67 ±1.70**
15.33 ±3.37**
4.33 ±1.33
-
Shekhar 1 × KU 300 45.67 ±0.33
4.00 ±0.47**
-0.17 ±1.68
0.00 ±1.63
5.17 ±0.53**
-13.00 ±2.45**
11.67 ±0.81**
1.33 ±0.81
13.00 ±1.56**
0.00 ±0.82
-
Shekhar 1 × KU 321 21.00 ±0.58
-2.00 ±0.47**
-29.83 ±2.53**
-25.33 ±2.49**
1.50 ±0.53**
17.00 ±3.09**
5.67 ±0.81**
2.67 ±0.81**
33.67 ±2.45**
12.67 ±1.25**
D
Uttara × NDU 1 47.00 ±0.58
-2.33 ±0.47**
-17.50 ±2.54**
-14.00 ±2.49**
-1.50 ±0.58**
4.33 ±3.13
3.33 ±0.94**
6.33 ±0.82**
23.67 ±2.49**
7.00 ±1.25**
-
Uttara × KU 321 44.33 ±0.33
-3.00 ±0.47**
-5.50 ±1.71**
-0.67 ±1.63
-0.50 ±0.60
-7.67 ±2.5**
3.67 ±0.96**
4.67 ±0.94**
9.00 ±1.70**
0.33 ±0.81
C
Days to maturity NDU 97-10 × IPU 981 78.00
±0.58 3.00
±0.47** -18.67
±2.54** -16.67
±2.49** 2.33
±0.58** 22.67
±3.13** -0.67 ±0.94
-5.33 ±0.82**
10.67 ±2.49**
8.33 ±1.25**
D
NDU 99 -2 × IPU 981 75.67 ±0.33
1.33 ±0.67*
-7.67 ±1.94**
-4.00 ±1.88**
1.67 ±7.45
-0.67 ±3.12
4.00 ±0.94**
0.67 ±1.24**
8.67 ±1.63
2.00 ±0.94
-
Shekhar 1 × KU 300 75.00 ±0.57
4.67 ±0.47**
-0.33 ±2.53
4.00 ±2.49
6.00 ±0.53**
-4.67 ±3.09
6.33 ±0.82**
-5.67 ±0.82**
-3.33 ±2.45
-2.00 ±1.24
-
Shekhar 1 × KU 321 84.33 ±0.33
-2.33 ±0.47**
-37.00 ±1.76**
-31.33 ±1.63**
0.33 ±0.58
28.67 ±2.67**
1.67 ±1.05
1.00 ±0.94
34.00 ±1.88**
15.67 ±0.82**
D
Uttara × NDU 1 77.67 ±0.33
-3.33 ±0.67**
-9.33 ±1.99**
-5.33 ±1.89**
-2.00 ±0.71**
-8.00 ±3.23**
4.67 ±0.94**
8.67 ±1.33**
18.67 ±1.83**
2.67 ±0.94**
C
Uttara × KU 321 81.67 ±0.33
-5.00 ±0.47**
-29.17 ±1.70**
-22.00 ±1.63**
-0.83 ±0.58
10.33 ±2.49**
5.00 ±0.82**
6.67 ±0.94**
33.67 ±1.63**
11.00 ±0.8**2
D
Plant height (cm) NDU 97-10 × IPU 981 84.45
±0.76 -24.09
±1.27** -43.56
±4.06** -50.51
±3.95** -17.25
±1.43** 76.61
±6.18** -30.30
±2.79** 4.19
±1.07** 24.40
±3.53** 25.25
±1.80** D
NDU 99 -2 × IPU 981 80.77 ±0.99
-13.78 ±0.72**
-28.70 ±4.29**
-26.28 ±4.24**
-4.47 ±0.81**
20.03 ±5.11**
-1.35 ±1.42
7.59 ±1.16**
32.53 ±4.23**
13.14 ±2.12*
D
contd.

Kant and Srivastava : Inheritance of some quantitative characters in urdbean [Vigna mungo (L.) Hepper] 5
Shekhar 1 × KU 300 86.22 ±0.62
7.96 ±1.44**
-13.50 ±4.17**
-21.63 ±3.80**
1.89 ±1.53
30.01 ±7.16**
-2.30 ±3.17
-6.09 ±2.18*
13.24 ±4.25**
10.81 ±1.90**
D
Shekhar 1 × KU 321 89.95 ±1.05
-9.57 ±0.79**
-9.98 ±4.56*
-13.31 ±4.51**
-6.25 ±1.01**
28.61 ±5.44**
-13.90 ±1.45**
-1.40 ±1.44
-2.00 ±4.43
6.65 ±2.25**
D
Uttara × NDU 1 85.84 ±0.50
20.86 ±1.05**
-33.17 ±3.07**
-48.68 ±2.90**
12.16 ±1.35**
96.53 ±5.08**
-11.76 ±1.89**
-36.09 ±2.07**
0.83 ±2.83
24.34 ±0.14**
D
Uttara × KU 321 95.39 ±0.94
-9.17 ±1.02**
-28.57 ±4.47**
-31.01 ±4.28**
-6.32 ±1.30**
38.44 ±6.12**
-10.03 ±1.99**
2.60 ±2.19
23.58 ±4.54**
15.51 ±2.14**
D
Number of clusters/plant NDU 97-10 × IPU 981 -- -- -- -- -- -- -- -- -- -- -- NDU 99 -2 × IPU 981 5.45
±0.11 1.07 ±0.80
5.54 ±1.75**
3.28 ±1.66
1.32 ±0.85
1.01 ±3.42
-0.82 ±1.20
-3.47 ±1.39*
-7.57 ±1.20**
-1.64 ±0.83*
-
Shekhar 1 × KU 300 7.91 ±0.42
1.36 ±0.41**
-1.14 ±1.93
-3.67 ±1.88
1.11 ±0.48*
4.22 ±2.48
0.84 ±0.64
-1.39 ±0.84
3.13 ±1.88
1.84 ±0.94*
-
Shekhar 1 × KU 321 6.76 ±0.39
0.41 ±0.43
3.91 ±1.80*
3.73 ±1.76*
-0.12 ±0.54
-8.80 ±2.43**
2.42 ±0.94*
2.66 ±0.60**
1.34 ±1.72
-1.87 ±0.88*
D
Uttara × NDU 1 5.43 ±0.26
0.50 ±0.90
7.68 ±2.11**
6.87 ±2.08**
0.87 ±0.90**
-7.40 ±3.82
1.13 ±1.14
-0.60 ±1.53
-6.35 ±1.24**
-3.44 ±1.04**
-
Uttara × KU 321 -- -- -- -- -- -- -- -- -- -- -- Number of pods/plant
NDU 97-10 × IPU 981 30.62 ±0.32
-1.23 ±1.01
-2.75 ±0.26**
-6.17 ±2.39**
0.31 ±1.14
20.88 ±4.69**
-7.04 ±1.51**
-7.67 ±2.08**
-8.53 ±2.35**
3.08 ±1.19**
D
NDU 99 -2 × IPU 981 31.75 ±0.64
-0.38 ±0.86
1.71 ±3.16
-0.89 ±3.07
-0.49 ±0.94
8.76 ±4.53
-4.42 ±1.55*
-3.45 ±1.39*
-6.97± 2.94*
0.45 ±1.54
-
Shekhar 1 × KU 300 33.56 ±0.51
-1.73 ±0.87*
-3.55 ±2.76
-8.04 ±2.67**
1.76 ±0.96
16.00 ±4.24**
-2.21 ±1.46
-5.74 ±1.47**
0.09 ±2.46
4.02 ±1.33**
-
Shekhar 1 × KU 321 33.22 ±0.69
0.90 ±0.78
-3.30 ±3.40
-8.47 ±3.16**
1.24 ±0.95
6.25 ±4.86
2.35 ±1.69
-0.13 ±1.82
10.68 ±3.72**
4.23 ±1.58**
-
Uttara × NDU 1 31.03 ±0.48
-0.73 ±0.98
5.38 ±2.91*
4.73 ±2.77
-1.20 ±1.05
5.11 ±4.74
-6.13 ±1.40**
-3.72 ±1.95
-14.58 ±2.64**
-2.37 ±1.38
-
Uttara × KU 321 31.17 ±0.21
1.00 ±0.46*
1.96 ±1.36
0.40 ±1.23
-1.72 ±0.65**
4.39 ±2.32
-4.12 ±0.84**
-0.67 ±1.11
-5.19 ±1.41**
-0.20 ±0.61
-
Number of seeds/pod NDU 97-10 × IPU 981 5.19
±0.14 -0.14 ±0.12
-0.62 ±0.62
-1.24 ±0.60*
-2.67 ±0.15**
3.46 ±0.80**
-1.14 ±0.27**
-1.08 ±0.23**
-0.98 ±0.63
0.62 ±0.30*
-
NDU 99 -2 × IPU 981 5.52 ±0.15
-1.33 ±0.14**
-3.80 ±0.68**
-1.28 ±0.66
0.33 ±0.20
2.12 ±0.80**
-0.09 ±0.31
-0.74 ±0.27*
0.44 ±0.68
0.64 ±0.33
-
Shekhar 1 × KU 300 -- -- -- -- -- -- -- -- -- -- -- Shekhar 1 × KU 321 5.26
±0.14 0.55
±0.13** 1.10
±0.67 0.31
±0.63 0.98
±0.19** -0.43 ±0.89
1.04 ±0.37**
-0.91 ±0.24**
-0.18 ±0.72
-0.15 ±0.32
-
Uttara × NDU 1 4.45 ±0.16
0.72 ±0.19**
2.03 ±0.77**
1.25 ±0.75
0.72 ±0.20**
1.19 ±1.06
-0.50 ±0.20*
-1.93 ±0.40**
-3.68 ±0.72**
-0.62 ±0.38
-
Uttara × KU 321 4.56 ±0.21
0.02 ±0.32
3.62 ±1.09**
2.25 ±1.08*
0.31 ±0.33
0.51 ±1.57
-1.07 ±0.22**
-1.68 ±0.65**
-5.01 ±0.91**
-1.12 ±0.54*
-
Pod seed ratio (%) NDU 97-10 × IPU 981 62.25
±0.26 3.41
±0.15** 18.79
±1.12** 16.59
±1.10** 2.83
±0.20** -25.98
±1.29** 7.53
±0.30** 1.87
±0.35** -7.19
±1.13** -8.29
±0.55** D
NDU 99 -2 × IPU 981 71.63 ±3.83
5.49 ±0.26**
-18.34 ±15.31
-22.56 ±15.31
7.75 ±0.29**
9.54 ±15.34
14.26 ±0.50**
-1.24 ±0.31**
35.58 ±15.31*
11.28 ±7.60
-
Shekhar 1 × KU 300 62.35 ±0.19
-1.11 ±0.24**
26.04 ±0.96**
23.52 ±0.91**
-2.83 ±0.35**
-31.62 ±1.40**
1.21 ±0.64
6.89 ±0.41**
-15.42 ±1.00**
-11.76 ±0.45**
D
Shekhar 1 × KU 321 68.11 ±0.27
1.94 ±0.18**
-12.10 ±1.17**
-11.41 ±1.15**
0.51 ±0.19**
8.98 ±1.36**
1.72 ±0.30**
0.71 ±0.33*
13.84 ±1.15**
5.70 ±0.58**
D
Uttara × NDU 1 62.80 ±1.05
-0.13 ±0.48
5.52 ±4.32
2.45 ±4.31
1.03 ±0.513*
0.19 ±4.65
-0.29 ±0.57
-2.36 ±0.88**
-5.10 ±4.23
-1.23 ±2.16
-
Uttara × KU 321 65.92 ±0.75
-1.09 ±0.36***
-2.12 ±3.09
-4.96 ±3.09
0.16 ±0.38
2.00 ±3.34
1.63 ±0.70*
1.32 ±0.40**
7.92 ±3.03*
2.48 ±1.54
-
100-seed weight (g) NDU 97-10 × IPU 981 4.37
±0.14 9.33
±0.14** -2.00
±0.65** -2.37
±0.65** 7.67
±0.15** 4.19
±0.84** -0.83
±0.12** -0.99
±0.30** 0.55 ±0.61
1.19 ±0.32**
D
NDU 99 -2 × IPU 981 4.05 ±0.05
-0.11 ±0.05*
-0.50 ±0.23*
-0.57 ±0.22
-0.99 ±0.63
4.35 ±0.31**
-2.88 ±0.12**
-0.90 ±0.09**
-3.20 ±0.24**
0.29 ±0.11**
D
Shekhar 1 × KU 300 -- -- -- -- -- -- -- -- -- -- -- Shekhar 1 × KU 321 3.69
±0.10 -0.23
±0.07** 0.24
±0.45 -0.09 ±0.44
-0.03 ±0.11
1.05 ±0.53*
-0.51 ±0.19**
-0.45 ±0.12**
-0.87 ±0.46
0.05 ±0.21
-
contd.
6 Journal of Food Legumes 25(1), 2012
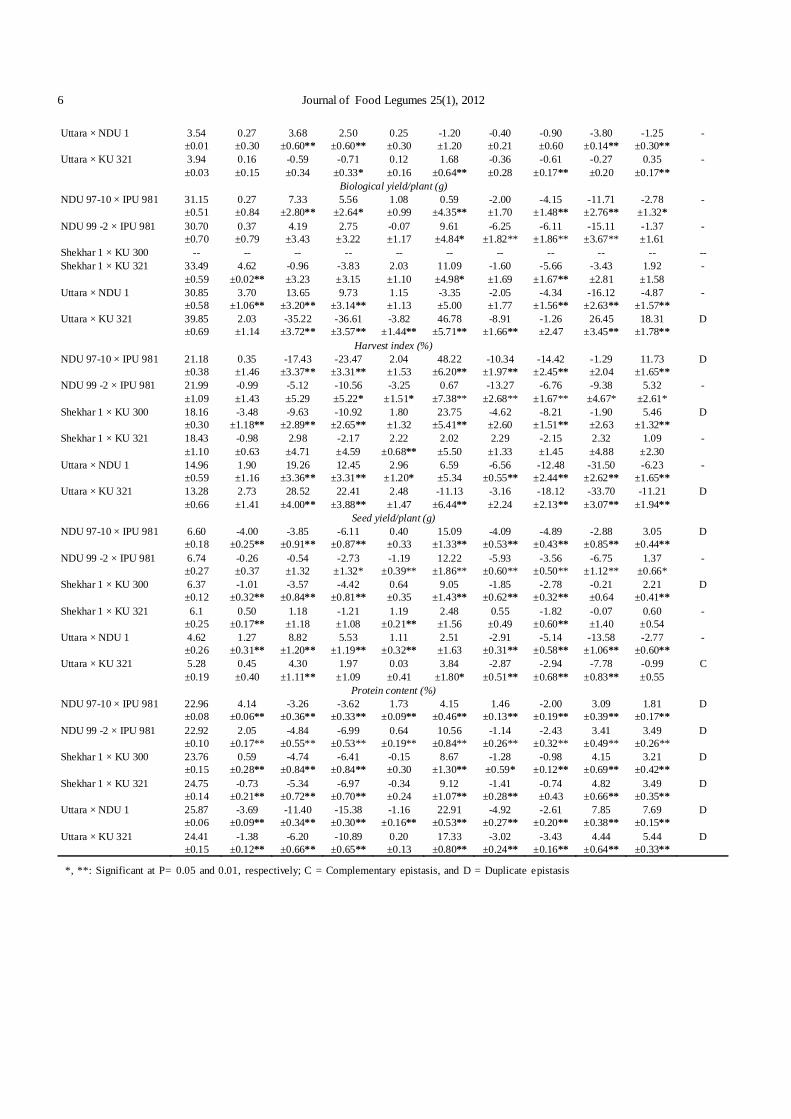
Uttara × NDU 1 3.54 ±0.01
0.27 ±0.30
3.68 ±0.60**
2.50 ±0.60**
0.25 ±0.30
-1.20 ±1.20
-0.40 ±0.21
-0.90 ±0.60
-3.80 ±0.14**
-1.25 ±0.30**
-
Uttara × KU 321 3.94 ±0.03
0.16 ±0.15
-0.59 ±0.34
-0.71 ±0.33*
0.12 ±0.16
1.68 ±0.64**
-0.36 ±0.28
-0.61 ±0.17**
-0.27 ±0.20
0.35 ±0.17**
-
Biological yield/plant (g) NDU 97-10 × IPU 981 31.15
±0.51 0.27 ±0.84
7.33 ±2.80**
5.56 ±2.64*
1.08 ±0.99
0.59 ±4.35**
-2.00 ±1.70
-4.15 ±1.48**
-11.71 ±2.76**
-2.78 ±1.32*
-
NDU 99 -2 × IPU 981 30.70 ±0.70
0.37 ±0.79
4.19 ±3.43
2.75 ±3.22
-0.07 ±1.17
9.61 ±4.84*
-6.25 ±1.82**
-6.11 ±1.86**
-15.11 ±3.67**
-1.37 ±1.61
-
Shekhar 1 × KU 300 -- -- -- -- -- -- -- -- -- -- -- Shekhar 1 × KU 321 33.49
±0.59 4.62
±0.02** -0.96 ±3.23
-3.83 ±3.15
2.03 ±1.10
11.09 ±4.98*
-1.60 ±1.69
-5.66 ±1.67**
-3.43 ±2.81
1.92 ±1.58
-
Uttara × NDU 1 30.85 ±0.58
3.70 ±1.06**
13.65 ±3.20**
9.73 ±3.14**
1.15 ±1.13
-3.35 ±5.00
-2.05 ±1.77
-4.34 ±1.56**
-16.12 ±2.63**
-4.87 ±1.57**
-
Uttara × KU 321 39.85 ±0.69
2.03 ±1.14
-35.22 ±3.72**
-36.61 ±3.57**
-3.82 ±1.44**
46.78 ±5.71**
-8.91 ±1.66**
-1.26 ±2.47
26.45 ±3.45**
18.31 ±1.78**
D
Harvest index (%) NDU 97-10 × IPU 981 21.18
±0.38 0.35 ±1.46
-17.43 ±3.37**
-23.47 ±3.31**
2.04 ±1.53
48.22 ±6.20**
-10.34 ±1.97**
-14.42 ±2.45**
-1.29 ±2.04
11.73 ±1.65**
D
NDU 99 -2 × IPU 981 21.99 ±1.09
-0.99 ±1.43
-5.12 ±5.29
-10.56 ±5.22*
-3.25 ±1.51*
0.67 ±7.38**
-13.27 ±2.68**
-6.76 ±1.67**
-9.38 ±4.67*
5.32 ±2.61*
-
Shekhar 1 × KU 300 18.16 ±0.30
-3.48 ±1.18**
-9.63 ±2.89**
-10.92 ±2.65**
1.80 ±1.32
23.75 ±5.41**
-4.62 ±2.60
-8.21 ±1.51**
-1.90 ±2.63
5.46 ±1.32**
D
Shekhar 1 × KU 321 18.43 ±1.10
-0.98 ±0.63
2.98 ±4.71
-2.17 ±4.59
2.22 ±0.68**
2.02 ±5.50
2.29 ±1.33
-2.15 ±1.45
2.32 ±4.88
1.09 ±2.30
-
Uttara × NDU 1 14.96 ±0.59
1.90 ±1.16
19.26 ±3.36**
12.45 ±3.31**
2.96 ±1.20*
6.59 ±5.34
-6.56 ±0.55**
-12.48 ±2.44**
-31.50 ±2.62**
-6.23 ±1.65**
-
Uttara × KU 321 13.28 ±0.66
2.73 ±1.41
28.52 ±4.00**
22.41 ±3.88**
2.48 ±1.47
-11.13 ±6.44**
-3.16 ±2.24
-18.12 ±2.13**
-33.70 ±3.07**
-11.21 ±1.94**
D
Seed yield/plant (g) NDU 97-10 × IPU 981 6.60
±0.18 -4.00
±0.25** -3.85
±0.91** -6.11
±0.87** 0.40 ±0.33
15.09 ±1.33**
-4.09 ±0.53**
-4.89 ±0.43**
-2.88 ±0.85**
3.05 ±0.44**
D
NDU 99 -2 × IPU 981 6.74 ±0.27
-0.26 ±0.37
-0.54 ±1.32
-2.73 ±1.32*
-1.19 ±0.39**
12.22 ±1.86**
-5.93 ±0.60**
-3.56 ±0.50**
-6.75 ±1.12**
1.37 ±0.66*
-
Shekhar 1 × KU 300 6.37 ±0.12
-1.01 ±0.32**
-3.57 ±0.84**
-4.42 ±0.81**
0.64 ±0.35
9.05 ±1.43**
-1.85 ±0.62**
-2.78 ±0.32**
-0.21 ±0.64
2.21 ±0.41**
D
Shekhar 1 × KU 321 6.1 ±0.25
0.50 ±0.17**
1.18 ±1.18
-1.21 ±1.08
1.19 ±0.21**
2.48 ±1.56
0.55 ±0.49
-1.82 ±0.60**
-0.07 ±1.40
0.60 ±0.54
-
Uttara × NDU 1 4.62 ±0.26
1.27 ±0.31**
8.82 ±1.20**
5.53 ±1.19**
1.11 ±0.32**
2.51 ±1.63
-2.91 ±0.31**
-5.14 ±0.58**
-13.58 ±1.06**
-2.77 ±0.60**
-
Uttara × KU 321 5.28 ±0.19
0.45 ±0.40
4.30 ±1.11**
1.97 ±1.09
0.03 ±0.41
3.84 ±1.80*
-2.87 ±0.51**
-2.94 ±0.68**
-7.78 ±0.83**
-0.99 ±0.55
C
Protein content (%) NDU 97-10 × IPU 981 22.96
±0.08 4.14
±0.06** -3.26
±0.36** -3.62
±0.33** 1.73
±0.09** 4.15
±0.46** 1.46
±0.13** -2.00
±0.19** 3.09
±0.39** 1.81
±0.17** D
NDU 99 -2 × IPU 981 22.92 ±0.10
2.05 ±0.17**
-4.84 ±0.55**
-6.99 ±0.53**
0.64 ±0.19**
10.56 ±0.84**
-1.14 ±0.26**
-2.43 ±0.32**
3.41 ±0.49**
3.49 ±0.26**
D
Shekhar 1 × KU 300 23.76 ±0.15
0.59 ±0.28**
-4.74 ±0.84**
-6.41 ±0.84**
-0.15 ±0.30
8.67 ±1.30**
-1.28 ±0.59*
-0.98 ±0.12**
4.15 ±0.69**
3.21 ±0.42**
D
Shekhar 1 × KU 321 24.75 ±0.14
-0.73 ±0.21**
-5.34 ±0.72**
-6.97 ±0.70**
-0.34 ±0.24
9.12 ±1.07**
-1.41 ±0.28**
-0.74 ±0.43
4.82 ±0.66**
3.49 ±0.35**
D
Uttara × NDU 1 25.87 ±0.06
-3.69 ±0.09**
-11.40 ±0.34**
-15.38 ±0.30**
-1.16 ±0.16**
22.91 ±0.53**
-4.92 ±0.27**
-2.61 ±0.20**
7.85 ±0.38**
7.69 ±0.15**
D
Uttara × KU 321 24.41 ±0.15
-1.38 ±0.12**
-6.20 ±0.66**
-10.89 ±0.65**
0.20 ±0.13
17.33 ±0.80**
-3.02 ±0.24**
-3.43 ±0.16**
4.44 ±0.64**
5.44 ±0.33**
D
*, **: Significant at P= 0.05 and 0.01, respectively; C = Complementary epistasis, and D = Duplicate epistasis

Kant and Srivastava : Inheritance of some quantitative characters in urdbean [Vigna mungo (L.) Hepper] 7
Table 3. Joint scaling test for 12 characters in six crosses during zaid and kharif 2008
Chi-square values Zaid Kharif Character
Cross I Cross II Cross III Cross IV Cross V Cross VI Cross I Cross II Cross III Cross IV Cross V Cross VI Days to 50% flowering
302.49** 178.25** 270.77** 102.28** 191.14** 203.27** 130.75** 64.99** 230.31** 211.24** 129.98** 43.77**
Days to maturity 238.78** 145.24** 229.95** 389.60** 399.09** 238.03** 72.96** 34.58** 132.18** 440.93** 116.19** 42.62** Plant height (cm)
229.60** 290.25** 99.01** 7.33 17.20** 153.56** 209.82** 98.44** 475.46** 92.50** 379.12** 76.44**
Number of clusters per plant
-- 24.38** 8.81* 14.77** -- -- -- 44.07** 7.87* 25.93** -- --
Number of pods per plant
33.66** 13.34** 48.31** 19.06** 79.11** 59.30** 29.12** 13.71** 17.98** 118.33** 35.43** 24.97**
Number of seeds per pod
-- 17.63** 10.51** 77.22** -- 12.44** 33.12** 9.41* -- 29.66** 42.53** 49.69**
Pod seed ratio (%)
364.11** 329.43** 525.10** 131.61** 223.88** 28.29** 797.12** 855.30** 815.65** 158.18** 8.56* 20.15**
100-seed weight (g)
15.20** 385.79** -- 9.53* -- -- 63.19** 625.64** -- 20.04** 699.07** 13.78**
Biological yield per plant (g)
223.07** 23.45** 129.39** 22.01** 210.14** 107.96** 19.83** 23.89** -- 11.75** 40.44** 152.27**
Harvest index (%)
13.25** 81.60** 69.32** 11.40** 14.08** 11.09** 61.73** 38.10** 51.91** 11.14* 216.00** 123.41**
Seed yield per plant (g)
47.79** 84.37** 126.99** 8.03* 15.37** 71.46** 188.06** 174.40** 61.06** 31.65** 284.40** 11.64**
Protein content (%)
13.82** 54.86** 97.08** 389.63** 22.59** 28.26** 481.29** 178.37** 132.87** 135.13** 2572.64** 652.80**
*, **: Significant at P = 0.05 and 0.01, respectively
KU 321 (C6), number of seeds per pod in crosses NDU 97-10 ×IPU 981 (C1) and Shekhar 1 × KU 300 (C3), Uttara × NDU 1 (C5)and Uttara × KU 321 (C6) in zaid. However, number of clustersper plant in cross NDU 97-10 × IPU 981 (C1), Uttara × NDU 1(C5) and Uttara × KU 300 (C6), number of seeds per pod andbiological yield per plant in cross Shekhar 1 × KU 300 (C3)were non-significant in kharif experiment. Thus, thesecharacters in different cross combinations as stated abovewere not utilized for further statistical analyses. Chakravarty(2008) also indicated lack of variation or very little variationamong existing varieties of black gram for the traits showingnon-significant variation.
Significance of epistasis was detected by either one orboth type of scaling tests in six crosses for all the charactersduring zaid and kharif (Table 1, 2 &3). Out of 142 cases (6crosses, 12 characters in both crop seasons), the presence ofepistasis was detected in 130 cases covering twelve charactersof six crosses across both the cropping season. Remainingcases were not studied due to non-significant differencesamong the progenies.
Generation mean analysis revealed that both additive(d) and dominance (h) gene effects as well as one or more ofthe epistatic interactions (i, j, l) contributed significantlytowards the inheritance of majority of the characters in all thecrosses during zaid and kharif seasons. However, nature and
magnitude of gene effects and epistatic interaction for acharacter exhibited considerable variation over the six crossesin both zaid and kharif seasons. The importance of bothadditive (d) and non-additive gene effects governing yieldand contributing traits in urdbean have also been reportedearlier by Ghafoor et al. (2002). Ram et al. (2010) reported thatboth additive and dominance components were responsiblefor genetic control of plant height, days to 50% flowering,and seed yield. Karthikeyan et al. (2007) observed bothadditive and non-additive components of variation for theinheritance of grain yield/plant and 100 seed weight. For plantheight, clusters/plant, pods/plant and seeds/pod, only theadditive component was observed. However, Chakraborty etal. (2010) have also reported additive and non-additive geneactions governed the expression of quantitative traits; themagnitude of non-additive gene action was higher than thatof additive gene action for each quantitative trait. The resultson degree of dominance revealed over dominance for all thetraits except clusters/plant with partial dominance. Thepredictability ratio also revealed the predominant role of non-additive gene action in the genetic control of quantitativetraits.
Further, all the crosses showing epistasis for differenttraits revealed manifestation of duplicate type of epistasis in55 cases while, 10 cases showed complementary type of

8 Journal of Food Legumes 25(1), 2012
epistasis over the both crop seasons. Thus, presence ofduplicate epistasis slows down the selection procedure ofadditive and or non-additive genetic variance (Gupta 2005).Hence, considering the above findings it may be suggestedthat the normal breeding methods would not solely work. Someforms of recurrent selection namely diallel selective mating orbiparental mating in early segregating generations might proveto be effective approaches. The restricted recurrent selectionof desirable segregants followed by selection might also be auseful breeding strategy for exploitation of both additive aswell as non-additive type of gene action (Chakraborty et al.2010).
REFERENCES
Cavalli LL. 1952. An analysis of linkage in quantitative inheritance.In: ECR Reeve and CH Waddington (Eds), Quantitative Inheritance.HMSO, London. Pp 135-144.
Chakraborty S, Borah HK, Borah BK, Pathak D, Baruah BK, Kalita Hand Barman B. 2010. Genetic parameters and combining abilityeffects of parents for seed yield and other quantitative traits inblack gram [Vigna mungo (L ) Hepper]. Notulae Scientia Biologicae2: 121-126.
Ghafoor A, Ahmad Z, Qureshi AS and Bashi M. 2002. Genetic relationshipin Vigna mungo (L) Hepper and V. radiata (L) Wilczek based onmorphological traits and SDS PAGE. Euphytica 123: 367-378.
Gupta RS. 2005. Genetic study for yield and its component traits inurdbean [Vigna mungo (L) Hepper]. Ph D Thesis, NDUA&T,Faizabad, India.
Hayman BI and Mather K. 1955. The description of genetic interactionsin continuous variation. Biometrics 11: 69-82.
Hayman BI. 1958. The separation of epistatic from additive anddominance variation in generation means. Heredity 12: 371-390.
Karthikeyan P, Anbuselvam Y, Elangaimannan R and Venkatesan M.2007. Genetic analysis in black gram (Vigna mungo (L.) Hepper)under saline condition. Madras Agricultural Journal 94 : 179-182.
Mather K. 1949. Biometrical Genetics: The study of continuousvariation. Methuen and Co. Ltd., London.
Ram B, Tikka SBS and Kakani RK. 2010. Genetic architecture of yieldand its component traits in black gram (Vigna mungo) grown underdifferent environments. Indian Journal of Agricultural Sciences 80 :312-315.
Singh BB. 2009. Project Coordinator’s Report. Mungbean and UrdbeanKharif (2009), Indian Institute of Pulses Research, Kanpur.
Baisakh B, Das TR and Nayak BK. 2011. Efficacy of physical andchemical mutagenic treatments for micro-mutants in urdbean.Journal of Food Legumes 24:106-109.

Journal of Food Legumes 25(1): 9-13, 2012
Thidiazuron improves in vitro multiple shoot induction in chickpea (Cicer arietinumL.) cotyledon with embryonic axisB.D. PAWAR, A.S. JADHAV, A.A. KALE, V.P. CHIMOTE and S.V. PAWAR
State Level Biotechnology Centre, Mahatma Phule Krishi Vidyapeeth, Rahuri – 413 722, Maharashtra, India;E-mail: [email protected](Received: October 10, 2011; Accepted: January 05, 2012)
ABSTRACT
A reproducible and highly efficient plant regeneration methodinvolving embryonic axis in chickpea Desi varieties, viz. ‘Vijay’,‘Di gvijay’ and Kabuli varie ty ‘Virat’ was devel oped as ane sse ntial pre -re quis i te for ge neti c transformation.Considerable variation in response to plant growth regulatorsused was observed in all the three cultivars. Embryonic axiswith cotyledon obtained from 4-6 day old seedlings were foundto be best in producing maximum of 55.02 shoot per explantwhen cul ture d on MSB5 medi um wi th 2 mg/l 2-isopentenyladenine (2-iP), 1 mg/l thidiazuron (TDZ) and 0.4mg/l kinetin (KIN). Embryonic axis without cotyledon producedonly 2.25-4.88 shoots per explant. Shoots were elongated onMSB5 medium with 2 mg/l benzylaminopurine (BAP) and 0.1mg/l indole acetic acid (IAA). Rooting was obtained by immersingcut ends of elongated shoots to 10 seconds pulse treatment of100 mM indole butyric acid (IBA) and subsequent transfer toliquid MSB5 medium which resulted in maximum of 92.67%rooti ng. Pl antlets with we ll-deve loped root systems we rehardened in polyhouse out of which 72% survived and showednormal growth and de velopment. Thi s pl ant regenerationmethod was found to be genotype independent and deemed tobe very useful in genetic transformation of chickpea.
Keywords: Chickp ea regenerat ion, Embry onic axis , Pulsetreatment, Thidiazuron
Among legumes , chickpea is widely cultivated veryimportant pulse crop and provides a rich source of protein forhuman being as well as for animals. Although valued for itshigh nut rit ional and p rotein composit ion , cultivation ofchickpea is constrained with innumerable biotic and abioticstresses. Those include ascochyta blight (Ascochyta rabiei),fusarium wilt (Fusarium oxysporum f. sp. ciceri), and podborer (Helicoverpa armigera) as well as drought, heat, coldand salinity (Mantria et a l. 2010). Amongst all attack oflep idop teron pod borer caus es mas sive y ield los s es .Conventional breeding approaches for developing ins ectresistance for chickpea have not been very successful becauseof limited variation in germplasm in respect of pod borerresistance. Furthermore, many wild annual Cicer species withdesirable agronomic characters were found to be sexuallyincompatible with the cultivated species C. arietinum (Jaiwaland Sonia 2001). To combat y ield los ses due to insects,introduction of exotic pest-resistant gene/s and development
of transgenic chickpea plants warrants a reproducible anddependable Agrobacterium mediated genetic transformationsystem (Mehrotra et al. 2011).
It is mentioned that legumes are recalcitrant to plantletregeneration under in vitro tissue culture system, therebyhalting genetic transformation to the desired level. Severalreports on in vitro regeneration in chickpea are available andin majority of the reports , the plan ts were found to beregenerated via shoot morphogenesis using immature ormature embryo explants with or without cotyledon (Tripathiand Chawla 2011, Pat il et a l. 2009, Mehrot ra et a l. 2011).Regeneration of plantlets has been reported to be, either direct(Bhatnagar-Mathur et al. 2009) or indirect through a callusphase (Mehrotra et al. 2011). However, lack of reproducibleefficien t regenerat ion protoco l, very low roo ting andsubsequent hardening of in vitro regenerated plants are themajor limiting factors in developing chickpea transgenic plants(Jaiwal and Sonia 2001). Among several considerable factors,selection of suitable explants and an appropriate procedureof in vitro plant regeneration for transformation is the majorone in order to obtain high frequency of transgenic plants(Pratap et al. 2010). The present study reports an efficientplant regeneration protocol using chickpea embryonic axiscoupled with very high shooting as well as rooting.
MATERIALS AND METHODS
Plant Material: Seeds of chickpea Desi varieties, viz. ‘Vijay’,‘Digvijay’ and Kabuli variety ‘Virat’ were obtained from thePuls es Improvement Project, Mahatma Phule Krish iVidyapeeth, Rahuri. These were surface sterilized with 70%(v/v) ethanol for 1 min followed by 0.1% (w/v) HgCl2 for 10min. The seeds were further rinsed five times with steriledistilled water and soaked overnight in sterile distilled waterat ambient temperature. Imbibed , decoated seeds wereinoculated on Murashige and Skoog (MS) basal medium(Murashige and Skoog 1962) supplemented with 3% (w/v)sucrose and 0.8% (w/v) agar. Those were incubated at 250Ctemperature with 16/8- h photoperiod for 4-6 days.Mult iple shoot induction: Four types of exp lan ts , viz.embryonic axis, half embryonic axis, embryonic axis withcotyledon and half embryonic axis with coty ledon, wereaseptically excised from in vitro grown seedlings (Fig. 1).

10 Journal of Food Legumes 25(1), 2012
Those were cultured on MS salts with B5 vitamins (MSB5)media and different levels of benzylaminopurine (BAP), 2-isopentenyladenine (2-iP), thidiazuron (TDZ) and kinetin(KIN). Emerging shoot buds were separated and transferredto MSB5 medium with hormonal combination of BAP (2 mg/l)and indole acetic acid (IAA) (0.1 mg/l) for elongation.
Rooting and hardening: Different rooting treatments wereused for rooting elongated shoots. In first treatment groupthe cut ends of elongated, 3-4 cm long shoots were exposedto pulse treatments in 100 mM indole butyric acid (IBA) for 10and 30 seconds. Subsequently the shoots were cultured onfilter paper b ridges immers ed in liquid MSB5 mediums upplemented with either of 1mg/ l o f IAA, IBA andnaphthalene acetic acid (NAA). In second treatment groupshoots were cultu red on both liquid and semisolid MSB5medium supplemented with either of 1mg/l of IAA, IBA andnaphthalene acetic acid (NAA), without any pulse treatment.Plantlets (about 12 weeks old) with well developed roots weretransferred to plastic pots containing coco peat: perlite (2:1).Those were initially covered with plastic bags for 5–7 days,and kept at polycarbonated polyhouse. Plants were irrigatedwith half MS solution for 14 days and finally transferred to
pot containing soil: cow dung (4:1) and irrigated with water atregular intervals. All treatments of regeneration experimentshad three replicates and with 30 explants in each replication.
RESULTS AND DISCUSSION
The present study depicts development of a rapid andefficien t plantlet regeneration s ystem involving all fourexplan ts from three different chickpea genotypes. Usingdifferent hormonal combination, the effect of the type ofexplant on multiple shoot induction was examined in cv. ‘Vijay’,‘Digvijay’ and ‘Virat’ (Table 1).
Irrespective of the genotype, type and concentrationof plant growth regulators used, 100% shoot regenerationfrequency was recorded in all four explants of these cultivars.Preliminary experiments had shown that both full as well ashalf embryonic axis with cotyledon yielded significantly highermult iple shoots (9.90-55.02 shoo ts/explant). However thisefficiency was d ras tically reduced when co tyledon wasdetached from the embryonic axis, indicating importance ofattachment of cotyledon in multiple shoot induction. Explantsdevoid of cotyledons yielded only 2.25-4.88 multiple shootsper explants (Table 1) evidently indicating the necessity of
Table 1. Effect of plant growth regulators on number of shoots per explant
Number of shoots developed per explants ± SE Growth regulators (mg/l)
Variety Full embryonic axis with
cotyledon Half embryonic axis with cotyledon
Full embryonic axis Half embryonic axis
Vijay 13.72 ± 0.21 12.45 ± 0.29 3 2.38 ± 0.03 Digvijay 10.67 ± 0.19 9.90 ± 0.13 3 2.55 ± 0.06
BAP 1
Virat 12.97 ± 0.17 12.82 ± 0.12 3 3 Vijay 15.02 ± 0.1 12.90 ± 0.29 3 2.37 ± 0.03 Digvijay 10.33 ± 0.19 11 ± 0.18 3 2.33 ± 0.04
BAP 2
Virat 14.67 ± 0.19 13.30 ± 0.10 3 3 Vijay 15.67 ± 0.26 15.07 ± 0.11 3 2.51 ± 0.07 Digvijay 13.30 ± 0.19 12.8 ± 0.10 3 2.25 ± 0.06
IP 1
Virat 15.72 ± 0.15 15.67 ± 0.19 3 3 Vijay 17.93 ± 0.15 17.18 ± 0.24 3 2.33 ± 0.04 Digvijay 15.93 ± 0.04 15.33 ± 0.26 3 2.48 ± 0.09
IP 2
Virat 19.3 ± 0.36 18.07 ± 0.15 3 3 Vijay 47.62 ± 0.15 45.83 ± 0.1 3.7 ±0.04 3.48 ± 0.03 Digvijay 45.22 ± 0.41 41.73 ± 0.34 3.4 ± 0.09 3.53 ± 0.04
IP 2, TDZ 1
Virat 44.03 ± 0.12 43.27 ± 0.39 3.97 ± 0.06 3.78 ± 0.07 Vijay 27.28 ± 0.36 28.85 ± 0.26 3.52 ± 0.13 3.22 ± 0.03 Digvijay 32.90 ± 0.56 29.10 ± 0.29 3.78 ± 0.03 3.47 ± 0.02
IP 2, TDZ 2
Virat 28.58 ± 0.30 26.88 ± 0.20 3.25 ± 0.1 3.08 ± 0.06 Vijay 55.02 ± 0.56 52.06 ± 0.58 3.75 ± 0.1 3.48 ± 0.12 Digvijay 49.90 ± 0.18 46.67 ± 0.5 3.65 ± 0.03 3.67 ± 0.04
IP 2, TDZ 1, KIN 0.4
Virat 52.02 ± 0.56 47.88 ± 0.20 4.20 ± 0.1 4.88 ± 0.20
SE (difference) CD (P=0.05) Variety 0.06 0.11* Growth regulators 0.08 0.17* Explant 0.06 0.13* Variety × Growth regulators 0.15 0.29* Variety × Explants 0.11 0.22* Explant × Growth regulators 0.17 0.33* *: Significant at P=0.05

Pawar et al. : Thidiazuron improves in vitro multiple shoot induction in chickpea (Cicer arietinum L.) 11
cotyledons for multiple shoot induction from embryonic axis.Polisetty et al . (1997) also reported that the presence ofcotyledons was essential to obtain maximum shoot production.Bhatnagar-Mathur et al. (2009) reported that explants withfull cotyledon showed faster appearance of shoot buds incomparison to the explants with half cotyledon followed byno cotyledon.
However, there was no t much d ifference in multipleshoot induction from half embryonic axis with single cotyledon(9.90-52.06 shoots/explant) and full embryonic axis with singlecotyledon (10.33-55.02 shoots/explant) (Table 1). Kar et al.(1996) also reported that dissection of the embryonic axis didnot adversely influence multiple shoot induction.
TDZ was earlier reported in many reports to enhancemultiple shoot formation (Patil et al. 2009, Bhatnagar-Mathuret al. 2009). Jayanand et al. (2003) had also observed that useof TDZ along with other cytokinins such as KIN, BAP and 2-iP, promotes the format ion of multiple, healthy shootlets.Anwar et al. (2008) also obtained 50-100 adventitious buds/shoots using single cotyledon with half embryonic axis asexplants on MS supplemented with 4 µM TDZ, 10 µM 2-iPand 2 µM KIN. Our results corroborate those reports. Thetype and the concentration of the phytohormones in theshooting media were found to be crucial in controlling multipleshoot induction. Multiple shoot formation was obtained in allhormonal treatments with varying frequencies (Fig. 1). TDZhas been found to be most effective for multip le shootinduction from embryonic axis when used at the concentrationof 1 mg/l. (Table 1). Irrespective of genotype, two hormonalcombination treatments, i.e. 2 mg/l 2-iP, 1 mg/l TDZ, 0.4 mg/lKIN and 2 mg/l 2-iP, 1 mg/l TDZ, were found significantlybetter over other treatments in respect of number of shoots/explants, with former treatment yielding best results (Fig. 2).Both full as well as half embryonic axis with coty ledonproduced higher number of multiple shoots/ explant (41.73-55.02 shoots/explant). Desi variety ‘Vijay’ produced maximumnumber of s hoots (55.02) per exp lant fo llowed by Kabuli
variety ‘Virat’ (52.02) and Desi variety ‘Digvijay’ (49.90)(Table 1).
Higher TDZ concentration i.e. 2 mg/l TDZ reducedmultiple shoot formation (26.88-32.90 shoots/explant) as wellas displayed stunted growth of the shoot buds. Jayanand et
Table 2. Effect of culture medium on the rooting of in vitro multiplied and elongated shoots of chickpea
B A C D
Fig 1. Explants A) Full embry onic axis wit h coty ledon;B) Half embry onic axis wit h coty ledon; C) Fullembryonic axis; D) Half embryonic axis
A B
C D
Fig 2. Mult iple shoot induction from embryonic axes after 21days of incubation on MSB5 medium with 1 mg/l TDZ,2 mg/l iP and 0.4 mg/l KIN. A) ‘Vijay’; B) ‘Digvijay’;C) ‘Virat’.
Vijay Digvijay Virat Growth regulators (1 mg/l) Rooting (%) ± SE Days to rooting Rooting (%) ± SE Days to rooting Rooting (%) ± SE Days to rooting
IAA 4.67± 0.88 18-20 3.33± 1.14 18-20 2.67± 1.14 18-20
IBA 8.67± 0.67 18-20 6.67±0.75 18-20 6.00± 1.41 18-20
NAA 6.67± 0.75 18-20 5.33± 0.88 18-20 5.33± 0.88 18-20 PIAA 88± 1.02 14-16 85.33± 0.54 14-16 86± 0.96 14-16 PIBA 92.67±1.42 10-12 91.33 ± 1.78 10-12 90.67± 1.80 10-12 PNAA 90.67± 1.61 14-16 90± 1.11 14-16 84.66±1.43 14-16 SIAA 0 - 0 - 0 - SIBA 0 - 0 - 0 - SNAA 0 - 0 - 0 - P indicates pulse treatment of 100 mM Indole -3 Butyric Acid (IBA); Filter paper bridge immersed in liquid MSB5 was used in first six treatments; S indicates use of solid MSB5 medium

12 Journal of Food Legumes 25(1), 2012
al. (2003) found that increas e in the TDZ concentrationresulted in stunted growth of the shoot buds. Shoot budsthat appeared at TDZ concentrations of 50 and 100µM failedto even elongate.
Aasim et al. (2011) recorded 16.83 shoots per explantwith mature embryo explant on MS medium containing 2.0mg/l BA. Patil et al. (2009) reported that TDZ induced morechickpea shoots/explant as compared to BAP. Our resultsresembles with this report as BAP and 2-iP when used singlyresu lted in les s number o f multiple shoot induct ion ascompared to media supplemented with TDZ. 2-iP found tobetter than BAP in respect of number of shoots developedper explant (Table 1). Average number of shoots per explant(full embryonic axis with single cotyledon) on MSB5 mediawith 2 mg/ l BAP for Vijay, Digvijay and Virat were found to be15.02, 10.33, and 14.67, respectively (Table 1). Although TDZfound to be most efficient in multiple shoot induction however,prolonged culture of explants on TDZ containing media foundto slow down the shoot elongation and resulted in formationof deformed shoots. Therefore elongation of shoots was doneon MSB5 media with 2 mg/ l BAP and 0.1 mg IAA.
In chickpea, root induction and its development is aserious constraint, and is considered to be a limiting factor inobtaining transgenic plants. Many alternative methods forroot induction were reported which included in vitro graftingby utilizing scions from pre-existing seedlings (Acharjee etal. 2010) and hydroponics culture (Bhatnagar-Mathur et al.2009). However, such methods are laborious, requires highlytechnical skill, demanding and time-consuming. Jayanand etal. (2003) reported that technique of roo ting of elongatedshoots on paper bridges immersed in liquid medium resultedin rooting frequency of 70–90% in comparison to 5–10% insemi solid medium. In the present experiment, the genotypesused did not show any root induction when cultured on MSB5semi s olid medium supplemented with differen t auxins(1mg/l), viz., IAA, IBA and NAA (Table 2) where as rootingfrequency of 2.67- 8.67% was obtained when elongated shootsplaced on paper bridges were immersed in liquid medium.
Pulse treatment with 100 mM IBA for 10 s followed byculture on paper bridges immersed in liquid medium proved tobe crucial for efficient and quick root induction. This treatment
B C A
Fig 3. Rooting of an elongated shoot on a filter paper bridge inliquid medium. A) ‘Vijay’; B) ‘Digvijay’; C) ‘Virat’
resulted in high rooting efficiency in varieties studied (85.33-92.67%) as compared to low rooting without pulse treatment(2.67-8.67%) in liquid media. The differentiation of roots onthe elongated shoots occurred over a period of 10-20 days(Table 2). The earliest rooting was observed in 10-12 days inpulse treatment involving 100 mM IBA followed by culture inliquid MSB5 with 1mg/l IBA. However, rooting without pulsetreatment took 18-20 days (Table 2). Anwar et al. (2008) hadalso reported high rooting (100%) by exposing cut ends ofthe shoots for 10 s pulse treatment with 100 mM IBA followedby transfer to liquid MS bas al medium within 10-14 days.Bhatnagar-Mathur et al. (2009) observed that pulse treatedwith 100 µM IBA to the shoots resulted into more number ofadventitious rooting emerging from basal cut end of the shoot.
Unus ual root ing pattern all over the s hoots wasobserved in the pulse treatment given for a period of 30 s(Fig. 4). Jayanand et a l. (2003) also obs erved that pu lsetreatment with IBA resu lted in adventitious root ing withinnumerable roots originating from different parts of the shoot.Healthy plantlets with efficient rooting upon their transfer toplastic pots containing sterile coco peat: perlite resulted in80% survival. The plants were then transferred to a mixture ofsoil: cow dung (4:1), 90% these plants survived and showednormal growth (Fig. 5).
C A D
B
Fig 4. Develop ment of unusual root ing due t o 30 secondp ulse treatment of 100 mM Indole IBA A) andB) ‘Vijay’; C) ‘Digvijay’; D) ‘Virat’.
In a nutshell, an efficient and reproducible regenerationprotoco l was developed involving embryonic axis withcotyledon through a series of experiments. The regenerationprotocol includes induction o f adventitious shoot buds inMSB5 medium with 1 mg/l TDZ, 2 mg/l iP and 0.4 mg/l KIN,their elongation in MSB5 media with 2 mg/l BAP and 0.1 mg/lIAA, followed by root induction through pulse treatment with

Pawar et al. : Thidiazuron improves in vitro multiple shoot induction in chickpea (Cicer arietinum L.) 13
100 mM IBA followed by culture on paper bridges immersedin liquid MSB5 containing 1 mg/l IBA. The present methodamply prospects relatively fast and routine regeneration ofchickpea plants which would certainly encourage transgenicdevelopment programme with diverse gene.
REFERENCES
Aasim M, Day S, Rezaei F, Hajyzadeh M, Mahmud ST and Ozcan S.2011. In vitro shoot regeneration from preconditioned explants ofchickpea (Cicer arie tinu m L. ) cv. Go kce. Afr ican Journal ofBiotechnology 10: 2020-2023.
Acharjee S, Sarmah BK, Kumar PA, Olsen K, Mahon R, Moar WJ,Mooree A and Higgins TJV. 2010. Transgenic chickpeas (Cicerarietinum L.) expressing a sequence-modified cry2Aa gene. PlantScience 178: 333–339.
Anwar F, Sharmila P and Saradhi PP. 2008. An optimal protocol for invitro regeneration, efficient rooting and stable transplantation ofchickpea. Physiology and Molecular Biology of Plants 14: 329-335.
A B C
Fig 5. Well developed chickp ea p lants in p oly carbonatedpolyhouse A) ‘Vijay’; B) ‘Digvijay’; C) ‘Virat’
Bhatnagar-Mathur P, Vadez V, Devi MJ, Lavanya M, Vani G and SharmaKK. 2009. Genetic engineering of chickpea (Cicer arietinum L.)with the P5CSF129A gene for osmoregulation with implicationson drought tolerance. Molecular Breeding 23: 591–606.
Jaiwal PK and Sonia. 2001. Chickpea regeneration and transformation.Current Science 80: 1368-1369.
Jayanand B, Sudarsanam G and Sharma KK. 2003. An efficient protocolfor the regeneration of whole plants of chickpea (Cicer arietinumL.) by using axillary meristem explants derived from in vitrogerminated seedlings. In Vitro Cellular and Developmental Biology-Plant 39:171–179.
Kar S, Basu D, Das S, Ramkrishnan NA, Mukherjee P, Nayak P and SenSK. 1997. Expression of Cry1A(c) gene of Bacillus thuringiensis intran sgenic chickp ea plants inh ibits develop ment of pod-borer(Heliothis armigera) larvae. Transgenic Research 6: 177–185.
Mantria NL, Ford R, Coramc TE and Panga ECK. 2010. Evidence ofunique and shared responses to major biotic and abiotic stresses inchickpea. Environmental and Experimental Botany 69: 286–292.
Meh rot r a M, Sany al I an d Amla DV. 2 0 11 . High -eff iciencyAg rob acteriu m-m ediated t ran sfo rmation of chickp ea (Cicerarietinum L.) and regeneration of insect-resistant transgenic plants.Plant Cell Reports [DOI: 10.1007/s00299-011-1071-5].
Murashige T and Skoog F. 1962. A revised medium for rapid growth andbioassays with tobacco tissue cultures. Physiology Plantarum 15:473–479.
Patil G, Patel R, Jaat R, Pattanayak A, Jain P and Srinivasan R. 2009.Glutamin e improves shoot morp hogen esis in chickpea (Cicerarietinum L.). Acta Physiologia Plantarum 31: 1077–1084.
Polisetty R, Paul V, Deveshwar JJ, Khetarpal S, Suresh K and ChandraR. 1997. Multiple shoot induction by benzyladenine and completeplant regeneration from seed explants of chickpea (Cicer arietinumL.). Plant Cell Reports 16: 565–571.
Pratap A, Choudhary AK and Kumar J.2010. In vitro techniques towardsgenetic enhancement of food legumes – a review. Journal of FoodLegumes 23: 169-185.
T rip at h i S an d Ch awla HS. 2 01 1 . Regen eratio n and gen etictransformation of chickpea. Journal of Food Legumes 24: 8-13.

Journal of Food Legumes 25(1): 14-17, 2012
Karyotype analysis in grass pea (Lathyrus sativus L.)SURENDRA BARPETE1, 2, DINESH PARMAR2, N.C. SHARMA2 and SHIV KUMAR1
1International Center for Agricultural Research in the Dry Areas (ICARDA), Aleppo, Syria; 2Department ofBiochemistry and Genetics, Barkatullah University, Bhopal, India; E-mail: [email protected](Received: October 10, 2011; Accepted: December 29, 2011)
ABSTRACT
In order to understand the chromosome morphology andstructural variation, somatic chromosomes of nine accessionsof grass pea (Lathyrus sativus L.) viz., ‘Pusa 24’, ‘Ratan’, ‘Pratik’,‘IC120455’, ‘IC120500’, ‘IC120505’, ‘IC345392’, ‘IC345401’,and ‘IC345403’ were studied using young root tips. The studyreveale d variati on not only in phys ical dime nsion andmorphology of the chromosomes but also in the position of theprimary and secondary constrictions. Although all accessionswere di pl oi d (2n=14), variati ons i n karyotype formula,chromosome length, total haploid complement, arm ratio andcentromeric index were observed. The secondary constrictionwas observed in at least one of the metacentric chromosomes of‘Pusa 24’, ‘IC120500’, ‘IC120505’, ‘IC345392’ and ‘IC345403’.Telocentri c chromosomes were absent in all the accessionswhile variable numbers of sub-metacentri c and acrocentricchromosome s we re obse rved i n these accessi ons. The sechromosomes differed in their lengthwise posi tions in thekaryotype. Total length of the largest chromosomes did notdiffer significantly among accessions. However, chromosomeswith satellites were longer. Total length of smallest chromosomewas variable among the acce ssi ons . The total hapl oi dchromosome length (TCL) varied from 5.11 µm in ‘IC345403’to 7.30 µm in ‘IC345401’. The arm ratio and centromeric indexvalue ranged from 1.21 in ‘IC120455’ to 1.44 in ‘IC120505’ and40.94 in ‘IC120505’ to 45.19 in ‘IC120455’, respectively. Theseresul ts clearly showed structural variation in karyotype atgenotypic level in grass pea.
Key words: Chromosome, Constriction, Grass pea, Karyotype.
Grass pea (Lathyrus sativus L.), a member of the familyLeguminosae, is a protein-rich pulse crop widely grown undersubs istence farming in the Indian s ubcontinent and Sub-Saharan Africa. A comparatively bet ter performance underbiotic and abiotic stresses makes grass pea an attractive cropfor adap tation in fragile agro-ecosys tems. However, thepresence of a neurotoxin, -N-Oxalyl-L-, -diaminopropionicacid (-ODAP) in its seeds renders the crop neglected andunderutilized (Kumar et al. 2011). For directed improvement,information on karyotype and genetic variation is essential,which are scanty in grass pea. Earlier studies have reported2n=2x=14 chromosomes in it s somatic cells (Res s andNarayanan 1997, Ozcan et al. 2006). In contrast, some reportsalso suggest that the chromosome numbers in somatic cellsof L. pratensis and L. palustris subsp. palustris were 2n=28and 2n=42 (Darlington and Wylie 1995).
Low genetic variability and cross incompatibility amongLathyrus species have been attributed for limited improvementin g ras s pea (Talukdar 2011). Therefore, cytogeneticinformation is considered a p rerequis ite for planning pre-breeding activities to infuse new genetic variability in thecultivated germplas m. Karyo type des crip tion , such asmorphology and number of chromosomes has been widelyaccepted as reliable diagnostic criteria for different sectionswithin the genus Lathyrus. Within the species, genotypicvariations have been reported in chromosome size, centomerelocation, and the number, size and locat ion of secondaryconstrictions in spite of the identical number of chromosomes(Sharma and Dutta 1959, Fouzard and Tandon 1975, Broich1989, Batt istin and Fernandez 1994). Similarly, reports areavailable for variation in DNA content, involving euchromatinand heterochromatin, as well as repetitive and non-repetitiveDNA sequences (Battistin et al. 1999). Therefore, the presentinvestigation was undertaken to study the karyotype of someIndian genotypes in grass pea.
MATERIALS AND METHODS
Seeds of nine accessions of Lathyrus sativus L. viz.,‘Pusa 24’, ‘Ratan’, ‘Pratik’, ‘IC120455’, ‘IC120500’, ‘IC120505’,‘IC345392’, ‘IC345401’, and ‘IC345403’ were obtained fromNational Bureau of Plant Genet ic Res ources (NBPGR),International Plant Genetic Resource Institute (IPGRI), andIndira Gandhi Agricultural University (Raipur). Healthy seedsof these accessions were germinated in Petri dishes lined withmoist filter paper at room temperature. When roo ts were1-1.5 cm long , thes e were cu t and p retreated withparadichlorobenzene for 4 h and then fixed in acetic alcohol(1:3 v/v) for 24 h. The roots were stored in 70% alcohol at 4°Ctemperature after fixation. The stored root tips were washedand hydrolyzed in 1 N HCl for 5-10 min at 60°C, followed bywashing in distilled water and staining with 2% acetic orceinfor 20 min at 60°C. Root tips were then squashed on slidesunder cover slips. Karyotype analysis was done followingthe method des cribed in Lavan et al . (1964) using CCDmicroscope. Chromosome length was determined from themean length value of the chromosomes in five cells.
RESULTS AND DISCUSSION
All the nine accessions of Indian origin viz., ‘Pusa 24’,‘Ratan’, ‘Pratik’, ‘IC120455’, ‘IC120500’, ‘IC120505’, ‘IC345392’,

Barpete et al. : Karyotype analysis in grass pea (Lathyrus sativus L.) 15
‘IC345401’ and ‘IC345403’ were dip lo id with 2n= 2x=14chromosomes (Fig. 1). This agrees with previous studies onLathyrus species from Brazil (Klamt and Witmann 2000), Iran(Arzani 2006), South America (Battistin and Fernandez 1994,Schifino-Wittman et al. 1994, Seijo and Fernandez 2003), andTurkey (Karadag and Buryukburc 2003, Ayaz and Ertekin 2008,Fatma and Crrpici 2008). Similar basic chromosome number(x=7) were also recorded earlier in seven Indian accessionsviz., ‘JRL43’, ‘Pusa28’, ‘LCD’, ‘RLS1’, ‘S101-85’, ‘JRL115’ and‘Pusa90’ (Dev 1999). Polyploid and aneuploid plants reportedin Lathyrus species from Europe, North America, Australiaand New Zealand had also shown the same basic chromosomenumber (Khwaja 1988, Broich 1989, Murray et al. 1992). Thisreveals that a conserved basic chromosome number remainsa common phenomenon in Lathyrus with polyploidy as rareexception (Kalmt and Wiltmann 2000, Seijo and Fernandez2001).
the accessions. The secondary constriction was observed inone of the metacen tric chromosomes of ‘Pusa 24’ and‘IC120500’, and two of ‘IC345392’ and ‘IC345403’. Thesecondary constriction was also observed in one of the sub-metacent ric chromosomes of ‘IC120505’. The leng th ofsatellite observed in different chromosomes of the accessionsranged from 1.90 to 2.95 µm. ‘Pusa 24’ showed four pairs ofmetacen tric chromosomes invo lving one with secondaryconstriction, one pair of submetacentric and two of acrocentric
Table 1. Karyotype formul a, chromosome l ength, totalhaploid complement (TCL), arm ratio (LA/SA) andcentromeric index (CI) in different accessions ofLathyrus sativus L.
Accession 2n Karyotype TLLC µm
TLSC µm
TCL µm
LA/SA ratio
CI
Pusa 24 14 4m*+1sm+2ac 3.75 2.65 6.40 1.42 41.41 Ratan 14 3m+3sm+1ac 3.54 2.75 6.29 1.29 43.72 Pratik 14 3m+3sm+1ac 3.68 2.74 6.42 1.34 42.68 IC120455 14 3m+2sm+2ac 3.42 2.82 6.24 1.21 45.19 IC120500 14 2m*+3sm+2ac 4.21 2.93 7.14 1.43 41.04 IC120505 14 2m+3sm*+2ac 4.27 2.96 7.23 1.44 40.94 IC345392 14 5m*+1sm+1ac 3.85 2.88 6.73 1.34 42.79 IC345401 14 4m+3sm 4.01 3.29 7.30 1.22 45.07 IC345403 14 3m*+3sm+1ac 3.01 2.10 5.11 1.43 41.10
2n: Diploid chrom osome number; TLLC: Total length of lon gestch romo som e; T LSC: To tal len gth of the sho rtest ch rom osom e;m: metacent ric; sm: submetacentr ic; ac: acrocentric chromosomes;*: Secondary constriction
Long arm
Short arm
Fig 1. Microphotograph of accessions: (A) Pusa 24, (B) Pratik,(C) IC345401, (D) Ratan, (E) IC120455, (F) IC120500,(G) IC345403, (H) IC345392, and (I) IC120505
Ratan Pratik Pusa 24
IC120455 IC120500 IC120505
IC345392 IC345401 IC345403
Secondary constrictions
Fig 2. Idiograms of grass p ea access ions based onchromosome lengt h and p rimary and secondaryconstrictions
Although all accessions were diploid with 2n = 2x = 14,variations in karyotype formula, chromosome length , totalhaploid complement, arm ratio and centromeric index wereobserved in the present study (Table 1). The ideograms ofdifferent accessions are presented in Fig 2. All accessionsdiffered in number o f metacent ric, s ubmetacentric andacrocentric chromosomes in their karyotypes. Metacentricchromosomes differed from two in ‘IC120500’ and ‘IC120505’to five in ‘IC345392’ while submetacentric chromosomes variedfrom one in ‘Pusa 24’ and ‘IC345392’ to three in remainingaccessions except two in ‘IC120455’. Acrocentric chromosomeswere nil in ‘IC345401’, one in ‘Ratan’, ‘Prateek’, ‘IC345392’and ‘IC345403’, and two in ‘Pusa 24’, ‘IC120455’, ‘IC120500’and ‘IC120505’. Telocentric chromosomes were absent in all

16 Journal of Food Legumes 25(1), 2012
chromos omes. ‘Pratik’, ‘Ratan’ and ‘IC345403’ had similarcytogenetic features with three pairs each of metacentric andsubmetacentric and one pair of acrocen tric chromosomes.However, one of the metacentric chromosomes in ‘IC345403’has secondary constriction. The karyotype of ‘IC120455’ hadthree metacentric, and two pairs each of submetacentric andacrocentric chromosomes while ‘IC120500’ and ‘IC120505’ hadtwo metacentric, three submetacentric and two acrocentricpairs o f chromos omes. Maximum five metacent ric pairsinvolving two with secondary constriction, and one each ofsubmetacentric and acrocentric pairs were found in ‘IC345392’.‘IC345401’ exhibited four pairs of metacentric and three ofsubmetacentric chromosomes. Seijo and Fernandez (2003)reported 2n=14 chromosomes with p redominance o fsubmetacentric chromosomes in 14 Lathyrus species. Ourresults suggest that Lathyrus sativus accessions representingIndian subcont inent are characterized by p redominance ofmetacent ric chromosomes. Morpholog ical d ivergence inkaryotypes of different accessions seems to be the result oftheir origin.
Another cytogenetic trait that showed variation amongdifferent accessions was chromosome length (total length ofhaploid complement). The total chromosome length (TCL)differed significantly among the accessions ranging from 5.11µm in ‘IC345403’ to 7.30 µm in ‘IC345401’ (Table 1). The TCL of‘Pusa 24’, ‘Pratik’, ‘Ratan’, ‘IC120455’ and ‘IC345392’ did notdiffer significantly from each other. Total length of the largestchromosome varied from 3.01 µm in ‘IC345403’ to 4.27 µm in‘IC120505’. Chromos omes with s atellites were longer ingeneral. Total length of the smallest chromosome ranged from2.10 µm in ‘IC345403’ to 3.29 µm in ‘IC345401’. Arm ratios ofdifferent chromosomes and their relative length p rovidecentromere types which have been found variable for differentchromosome pairs and accessions selected for the presentstudy. Arm ratio was highest (1.44) in ‘IC120505’ and lowest(1.21) in ‘IC120455’. The centromeric index ranged from 40.94in ‘IC120505’ and 45.19 in ‘IC120455’. Significant variation intotal chromosome length and arm ratio observed among theacces sions indicated asymmetrical karyo type in thes eacces sions. These karyotypes are, thus , advanced fromevolu tionary po int of view (Stebbins 1971). Variation inchromosome size is often the result of the amplification ordeletion of a chromatin segment during species diversification.Intra- and inter-specific variation in chromosome size indicatesmarked variat ion in the amount o f DNA affect ing thecomplement size, a high percentage of this DNA is moderatelyrepetitive (Rees and Narayan 1977). Chromosomes have keymorphological features such as centromere and telomere. Thus,a species can have different chromosome arrangements. Thesedifferences imply that along the path of evolution, genomesegments have been rearranged. There is a possibility thatthese kinds of rearrangements in genome may lead to change
in ODAP concentration, which is the major goal of variousgrass pea improvement programs across the globe. The presentstudy demonstrates significant intra-specific differences inchromosomal morphology and total chromosome complement,hence allowing strain characterization in Lathyrus sativus L.These results als o clearly showed st ructural variation inkaryotype at genotypic level in grass pea.
REFERENCES
Arzani A. 2006. Karyotype study in some Lathyrus L. accessions inIran. Iranian Journal of Science and Technology Transaction 30:9-17.
Ayaz E and Ertekin AS. 2008. Karyotype analysis of two species ofgenus Lathyrus from Southern eastern Anatolis Turkey. IntegrativeJournal of Agricultural Biology 10: 569-572.
Battistin A and Fernandez A. 1994. Karyotype of four species of SouthAm er ica n atives and on e cultiv at ed species of La thyru s L .Caryologia 47: 325-330.
Bat t ist in A, Bio n do E an d May CLG. 1 9 99 . Ch ro mo so malcharacterization of th ree nativ e and one cultivated species ofLathyrus L. in southern Brazil. Journal of Genetics and MolecularBiology 22: 557-563.
Broich SL. 1989. Chromosome number of North American Lathyrus(Fabaceae). Madrona 36: 41-48.
Darlington CD and Wylie AP. 1995. Chromosome Atlas of FloweringPlants. George Allen and Unwin, London. Pp 155-156.
Dev A. 1994. Karyotype studies in Lathyrus sativus L. M Sc GeneticsDissertation, Barkatullah University, Bhopal, India.
Fatma G and Cirpici A. 2008. Karyotype analysis of some Lathyrus L.species (Fabaceae) from the Thrace region (Turkey-in-Europe).Caryologia 61: 269-282.
Fouzard A and Tandon SL. 1975. Cytotaxonomic investigations in thegenus Lathyrus. Nucleus 18: 24-33.
Kalmt A and Wittmann MT. 2000. Karyotype morphology and evolutionin some Lathyrus (Fabaceae) species of southern Brazil. Journal ofGenetics and Molecular Biology 23: 463-467.
Karadag Y and Buyukbure U. 2003. Karyotype analysis of some legumespecies (Vicia noeana Boiss. and Lathyrus sativus L.) co llectedfrom native vegetation. Pakistan Journal of Biological Science 6:377-381.
Khawaja HIT. 1998. A New inter-specific Lathyrus hybrid to introducethe yellow flower color into sweat pea. Euphytica 37: 69-75.
Kumar S, Bejiga G, Ahmed S, Nakkoul H and Sarkar A. 2011. GeneticImprovement of grasspea for low neurotoxin (-ODAP) content.Food and Chemical Toxicology 49: 589-600.
Lavan A, Fredge K an d San dberg AA. 19 64. No menclat ure forcentromeric position on chromosomes. Hereditas 25: 201-220.
Murray BG, Ben net t MD and Hammett KRW. 1 992 . Seco ndaryconstrictions and NORs of Lathyrus investigated by silver stainingand in situ hybridization. Heredity 68: 473-478.
Ozcan M, Hayirlioglu AS and Inceer H. 2006. Karyotype analysis ofsome Lathyrus L. taxa (Fabaceae) from north-eastern Anatolia.Acta Botanica Gallica 153: 375-385.
Rees H an d Narayan RKJ. 199 7. Ev olutio nary DNA var iation inLathyrus. Chromosomes Today 6: 131-139.

Barpete et al. : Karyotype analysis in grass pea (Lathyrus sativus L.) 17
Schifino-Wittman MT, Lan AH and Simioni C. 1994. The genera Viciaand Lathyrus in Rio Grande do Sul (Southern Brazil): Cytogeneticof n ative, naturalized an d exotic species. Brazilian Journal ofGenetics 17: 313-319.
Seijo JG and Fernandez A. 2001. Cyto genetic analysis in Lath yrusjaponicus Wild. (Leguminosae). Caryologia 66: 173–179.
Seijo JG and Fernandez A. 2003. Karyotype analysis and chromosomeevolution in South American species of Lathyrus (Leguminosae).American Journal of Botany 90: 980-987.
Sharma AK and Datta PC. 1959. Application of improved technique intracing karyotype difference between strains of Lathyrus odoratusL. Cytologia 24: 389-402.
Stebbins GL. 1971. Chromosomal evolution in higher plants. JW ArrowSmith Ltd., Bristol, UK.
Talukdar D. 2011. Cytogenetic analysis of a novel yellow flower mutantcarrying reciprocal translocation in grass pea (Lathyrus sativus L.).Journal of Biological Research-Thessaloniki 15: 123 – 134.

Journal of Food Legumes 25(1): 18-24, 2012
Characterization and genetic diversity analysis in field bean [Lablab purpureus (L.)Sweet] collections of KarnatakaB.N. SAVITHA, R.L. RAVIKUMAR and DEEPAKKUMAR G. SHINDE
Department of Genetics and Plant Breeding, University of Agricultural Sciences, Dharwad – 580 005, Karnataka,India; E-mail: [email protected](Received: October 25, 2011; Accepted: February 23, 2012)
ABSTRACT
Forty three pendal and seventy one non-pendal genotypes werecollected from different parts of Karnataka. The pendal andnon-pe ndal genotype s we re eval uate d se paratel y in twodifferent experiments following randomized complete blockdes i gn at Dharwad duri ng kharif 2007-08. In orde r tocharacterize and differentiate the genotypes, observations on20 quantitative and 26 qualitative characters at different growthstages of the plants were recorded. The analysis of variancesuggested significant variation for all the characters in bothpendal and non-pendal genotypes. GCV was the highest fornumber of green pods/plant and green pod yield/plant in boththe types. High variation was observed for leaf, inflorescence,flower, pod and seed characters among pendal and non-pendalgenotypes. D2 statistic grouped the non-pendal genotypes into13 disti nct clusters, indicating ample divers ity among thegenotypes. The 43 pendal type genotypes were grouped into sixclusters and had high range of inter-cluster distance comparedto non-pendal types, suggesting greater diversity among thege notypes. However, gene tic dive rsi ty was not rel ated togeographical diversity in both pendal and non-pendal types.Diverse genotypes in both pendal (DDGC 18, DDGC 35, GL509, GL 502 and DDGC 32) and non-pendal (GL 63, GL 77, GL56, GL 70 and GL 37) types were identified for hybridization togenerate high variability. Wide variability for all the qualitativetraits (such as growth habit, branch orie ntati on, s te mpigmentation, and the like) was observed in both pendal andnon-pendal types.
Key words: Dolichos bean, Field bean, Genet ic diversity,Germplasm, Pendal type
Field bean [Lablab purpureus (L.)Sweet], also calledhyacinth bean/dolichos bean, belongs to family Fabaceae andis one of the most ancient crops. It is presently grown throughout the tropical reg ions in As ia, Africa and America. InKarnataka, it occup ies an area of 0.6 lakh hectares withproduction of 0.26 lakh tones and productivity of 438 kg/ha(Anonymous 2006). It is cultivated either as a pure crop ormixed with other crops such as finger millet, groundnut, castor,corn or sorghum. It is also grown in home garden. It is amultipurpose crop grown for pulse, vegetable and forage.There are two distinct types of field bean; Lablab purpureusvar. typicus and Lablab purpureus var. lignosus. Varietytypicus is a garden/pendal type and cultivated for its soft andedible pods . Variety lignosus is commonly known as field
bean/non-pendal type and cultivated for both green and dryseed (Purseglove 1968). Lablab purpureus is also grown undervaried agricultural practices (sole crop, mixed crop, inters crop,forage crop, catch crop, kitchen garden, etc).
Although field bean is cultivated throughout Karnataka,no concerted effort has been made to collect and conservethe available genetic resources. A wide genetic variability isavailable in situ in farmers’ fields and/ or kitchen gardens,offering scope for selection (Byre Gowda 2005). Informationon divergence and germplasm characterization in field bean iss can ty and also not well-documented . The pres en tinvestigation is an attempt to document such information inavailable collections of field bean.
MATERIALS AND METHODS
A total of 56 field bean genotypes were collected fromdifferent parts of North Karnataka; 33 were non-pendal (field)and 23 were pendal (garden) types. In addition, 20 gardentype and 38 field type genotypes were obtained from thegermplasm bank maintained at UAS, Bangalore. Most of thesegenotypes were collected from Southern parts of Karnataka.Altogether 43 pendal and 71 field types were evaluatedseparately in two different experiments during the year 2007-08 kharif. Both the experiments were conducted at BotanicalGarden, UAS, Dharwad.
In the first experiment, only the field type genotypeswere grown in a randomized complete block design (RCBD)with two replications. Each genotype was sown in a singlerow with a row length of 3.0 m with an inter row spacing of 60cm and inter plant spacing of 25 cm under rainfed conditions.All the agronomic practices were followed to raise a goodcrop. Six plants were randomly taken from each genotype perreplication. Out of the six, three plants were used for recordinggreen pod observations, and the remaining three plants wereused for taking dry pod and dry seed yield observation. In thesecond experiment, only pendal types were used. Each pendaltype genotype was sown in a row length of 3.6 m with an interrow spacing of 90 cm and inter plant spacing of 60 cm underrainfed condit ions. Staking was given to each p lant withbamboo pole having branches as a support to climb. Threeplants were randomly selected from each genotype perrep lication to record observations on days to flowering,primary branches/plant, racemes/ plant, raceme length, flower

Savitha et al. : Characterization and genetic diversity analysis in field bean [Lablab purpureus (L.) Sweet] collections of Karnataka 19
buds /raceme, nodes/ raceme, green pods/plan t, green podlength, green pod width, seeds/pod, green pod yield/plant(g), seed length (fresh), seed width (fresh), test weight (fresh),shelling percentage in fresh pods, dry seed yield/plant (g),seed length (dry), seed width (dry), tes t weight (dry) andshelling percentage in dry pods. The dry seed yield/plant wasnot recorded for pendal types. The plants were scored for 26qualitative traits using standard scales (Shivashankar et al.1977, Savitha 2008) at different stages of crop growth. Basedon the qualitative data, the genotypes were classified intodifferent groups.
The statist ical analysis o f indiv idual quantitativecharacters was carried out by taking the mean values overtwo replications. The mean and range was determined for eachtrait separately for two experiments. Mahalanobis D2 statistic(1936) was used for assessing the genetic divergence betweengenotypes.
RESULTS AND DISCUSSION
The ultimate goal of any plant breeding programme isto improve crop plan ts fo r agronomic and economicsuperiority. Improvement in productivity of any crop dependson the availability of variable material or germplasm for utilizingit in breeding programmes and successful determination of itsbreed ing value. The assessment of variability in the localcultivars and land races and utilization of them in breedingprogrammes is more p ruden t than looking for world
collections. The local germplasm will have adaptive traits toregional requirements.
The analysis of variance revealed highly significantdifferences among genotypes in both pendal and field typeswith respect to all the 20 quantitative characters studied (Datanot presented). This indicated that the lines under study weregenetically diverse. High diversity for many quantitative traitsin field bean has also been observed earlier in differentcollections (Borah et al. 1992, Basavarajappa and Byre Gowda2000). The range was wide for all 20 characters in both pendaland non-pendal types. The estimates of genetic coefficient ofvariation (GCV) were also moderate to high for many of thecharacters studied (Table 1). The GCV was the highest forimportant yield traits like number of green pods per plant andgreen pod yield per plant in both the types, suggesting ampleopportunity to select genotypes for high yield. Among fieldtypes, there were many genotypes which were significantlysuperior in yield to the best checks ‘HA 3’ and ‘HA 4’ (whichare the dominant varieties in Karnataka). In general, widevariability was observed for the yield and yield componentsin both garden and field types.
Quantification of genetic diversity existing within andbetween groups of germplasm is important and particularlyuseful in the choice of parents to be hybridized for creatinghigher variability in segregating populations and obtainingus efu l recombinants. The 71 field bean genotypes weregrouped in to 13 distinct clusters, indicating prevalence of
Field type Garden type Characters
Mean Range GCV Mean Range GCV
Days to 50% flowering (no.) 85.55 41.00-107.00 20.35 100.20 71.00-143.00 20.54 Primary branches/plant (no.) 3.08 2.35-7.00 22.85 2.71 1.83-3.50 8.25 Flower buds/raceme (no.) 31.44 9.35-51.00 22.25 31.02 12.50-47.17 28.07 Racemes/plant (no.) 12.53 3.80-28.60 38.43 33.02 6.83-63.00 45.17 Raceme length (cm) 27.92 15.24-47.50 15.41 22.57 4.80-35.07 33.07 Nodes/raceme (no.) 9.52 5.20-13.55 11.40 8.27 2.50-12.83 29.51 Green pod length (cm) 5.43 4.35-7.55 9.14 7.09 4.47-15.95 32.54 Green pod width (cm) 1.84 1.30-2.40 12.45 1.82 1.33-2.35 12.60 Green pods/plant (no.) 68.70 13.75-153.88 38.88 138.53 42.00-379.16 55.91 Seeds/pod (no.) 3.91 3.30-4.70 5.25 4.53 3.50-5.80 12.42 Seed length (Fresh) (cm) 1.37 1.05-1.60 7.25 1.42 1.22-1.69 6.23 Seed width (Fresh) (cm) 0.88 0.70-1.10 6.79 0.95 0.77-1.18 9.99 Test weight (Fresh) (g) 50.95 30.35-64.35 16.83 62.25 33.90-85.85 19.14 Shelling % (fresh pods) 57.77 33.50-67.75 15.16 56.53 40.90-73.61 15.57 Seed length [Dry] (cm) 0.94 0.75-1.05 6.28 0.90 0.75-1.27 11.58 Seed width [Dry] (cm) 0.70 0.60-0.90 5.44 0.66 0.49-0.78 7.49 Test weight (Dry) (g) 25.25 18.95-33.95 12.64 33.12 21.80-54.87 24.06 Shelling % (dry pods) 74.67 55.76-84.05 5.58 74.05 53.30-81.98 6.62 Green pod yield/plant (g) 172.87 31.0-439.64 38.90 477.06 169.40-861.79 36.18 Dry seed yield/plant (g) 48.77 4.85-125.50 48.21
Table 1. Mean and range observed for different quantitative characters in pendal and non-pendal genotypes of Lablab purpureus(L.) Sweet

20 Journal of Food Legumes 25(1), 2012
high diversity in the materials studied (Table 2). Cluster II wasthe larges t with 35 genotypes followed by cluster V (11genotypes), cluster III and IV (each with 6 genotypes ).Clusters VII, VIII, IX, X, XI, XII and XIII, each contained onegenotype only. The genotypes, which fell within the clusters,by and large exhibited narrow range of genetic variability. Asmany as 35 genotypes in cluster III indicated that majority ofthe genotypes in the local germplasm of field bean aregenetically similar. Nevertheless, formation of 13 clusters withdifferent frequencies of genotypes itself indicated a largeextent of diversity among the genotypes evaluated. Formationof clusters (VII to XIII) with solitary entry might be due toto tal iso lat ion preven ting the formation of gene flow orin tens ive natural/human s election fo r d iverse adap tivecomplexes. Most of these collections were from remote villagesand maintained by farmers over years. Therefore, it is possiblethat they could be reproductively is olated . However, thecluster formation did not include any geographical isolation.For example, clusters I, II, III, IV and V comprised genotypescollected from different districts of Northern and SouthernKarnataka. Such non correlation of geographical distributionwith clustering pattern has also been observed in Dolichosbean (Pujari 2000, Nandi et al. 2000). However, clusteringpattern following their respective geographical origin was alsoobserved (Basavarajappa and Byre Gowda 2000). Based oninter cluster distance (D2 values), the genotypes belonging tocluster I and VI appeared to be more diverse (363.51) followedby cluster VI and XII (304.64), cluster IV and I (298.65) andcluster VI and III (269.43), s uggest ing that selection ofgenotypes from these divergent groups would result in highermagnitude of heterosis for the characters concerned. Suchcrosses may also generate more desirable recombinants insegregating generations due to allele frequency differencesbetween these genotypes.
The 43 pendal type genotypes were grouped into sixclus ters and had high range of inter cluster D2 values,suggesting greater diversity among the genotypes. Amongclusters, two clusters had solitary entry (cluster V and VI);cluster I, IV, III and II had two, four, fifteen and twentygenotypes, respectively (Table 3). Most of the pendal typeswere collected from the kitchen garden, which is maintainedas perennials for many years. Therefore, there could be lessexchange o f seed material. Further, there is a reproductivebarrier as they were not grown as populations in the field. Stilla large number of genotypes were grouped into cluster II with20 genotypes, suggesting similarity among genotypes formany traits. In addition, the cluster formation did not includeany geographical isolation. The clusters I, II, and III comprisedgenotypes collected from different districts of Northern andSouthern Karnataka. The molecular studies also showed thatthere is less diversity in the field bean, although a wide rangeof phenotypic diversity is reported (Mass et al. 2005). Thelack of genetic diversity could be one of the reasons for thelack of relationship between geographical isolation and geneticdiversity in Field bean. The inter cluster distance was highest(779.68) between cluster I and V, indicat ing high diversitybetween the genotypes. Cluster I with two genotypes andcluster V with one genotype were the most divergent groupsbased on inter cluster distance. It is desirable to select theseaccessions as parent from these two clusters in recombinationbreeding programmes for obtaining desirable segregants.
The characterization of geno types bas ed on thequalitative traits is very useful to differentiate the genotypesas they are h igh ly heritab le and less influenced byenvironmental cond it ions . Further, as sociation o f anyqualitative characters with desirable traits/yield componentsserves as a marker in the selection process. The results of the
Table 2. Clustering pattern in field bean/ non pendal genotypes of Lablab purpureus (L.) Sweet
Cluster No. of entries Genotypes Source (district) I 2 HA 3, HA 4 Checks II 35 GL 34, GL 62, GL 63, GL 30, DDGC 65, GL 49, GL 77, GL 47, DDGC 109,
DDGC 57, DDGC 45, GL 414, DDGC 47, DDGC 39, GL 31, DDGC 43, GL 68, GL 28, DDGC 62, GL 66, GL 97, GL 37, GL 51, GL 415, DDGC 66, GL 100, DDGC 61, DDGC 67-1, GL 9, DDGC 40, DDGC 68, GL 17, DDGC 53, GL 50, DDGC 55
Belgaum (5), Dharwad (3), Bellary (1), Bagalkot (2), Bijapur (3), Dvanagere (1), UAS, Bangalore (20)
III 6 GL 413, DDGC 46, DDGC 49, DDGC 44, GL 411, DDGC 63 Dvanagere (2), Dharwad (2), Belgaum (1), UAS, Bangalore (2)
IV 6 GL 20, GL 21, GL 79, GL 48, DDGC 58, DDGC 59 Belgaum (1), Davanagere (1), UAS, Bangalore (4)
V 11 DDGC 50, DDGC 52, 321, DDGC 64, DDGC 38, DDGC 71, 246, GL 43, DDGC 67, DDHC 48, GL 56
Belgaum (3), Davanagere (2), Dharwad (2), UAS, Bangalore (4)
VI 4 GL 75, GL 85, GL 93, GL 70 UAS, Bangalore (4) VII 1 NA4 1 UAS, Bangalore VIII 1 GL 13 UAS, Bangalore IX 1 DDGC 56 Belgaum X 1 DDGC 72 Dvanagere XI 1 DDGC 54 Belgaum XII 1 DDGC 51 Belgaum XIII 1 DDGC 41 Davanagere

Savitha et al. : Characterization and genetic diversity analysis in field bean [Lablab purpureus (L.) Sweet] collections of Karnataka 21
variability observed for 26 qualitat ive characters in thegermplsam collected are presented in the Tables (4a-4d). Widerange o f variat ion was obs erved fo r g rowth habit , leaf,inflorescence, flower, pod and seed characters. The pendaltypes were indeterminate, whereas in field bean bothdeterminate and semi-determinate types were observed. Thesemi-determinate types were more (83.10%) than determinatetypes (16.9%). Such variation for growth habit was observedin a study involving 107 genotypes collected from 20 different
countries (Sultana 2001). Most of the genotypes were localcollections and not consciously bred. Therefore, the majorityof the genotypes turned out to be semi determinate types.However, for commercial cultivation, determinate types arepreferred. The genotypes showed three types of branchorientation in Dolichos bean. Most of the determinate typesshowed short and erect lateral branches. The non-pendal typesdid not show any variation with respect to stem pigmentation.On the other hand, the stem pigmentation varied from almostsolid to no pigmentation in pendal types. Majority of the pendalgenotypes did not show any p igmentation on stem. In sixgenotypes (DDGC 7, DDGC 15, DDGC 10, GL 548, GL 563) thepigmentation was extensive, while three genotypes (DDGC11, DDGC 73 and GL 504) showed pigmentation only at nodes.The stem pigmentation is used as one of the dominant markersin crops like rice and finger millet as a marker to identify truehybrids.
Leaf hairines s was clas s ified in to moderatelypubescence, low pubescent and glabrous. All the 3 types ofleaf hairiness were observed in both pendal and non-pendalgenotypes. In non-pendal genotypes, the low pubescencetype (71.83%) had the highest frequency fo llowed bymoderately pubescence (18.30%) and glabrous (9.85%). Onthe other hand, glabrous were in high frequency among pendaltypes. Leaf pubescence has been reported to be very usefulfor insect and virus resistance in many crop plants. Fieldbean, being a pulse crop, is susceptible to many insects andviruses. Therefore, the role of pubescence in reducing thesusceptibility to pests has to be explored in Dolichos bean.
Cluster No. of entries
Genotypes Source
I 2 DDGC 11, DDGC 15 Dharwad (2) II 20 GL 554, GL 558, DDGC 25,
DDGC 21, 559, GL 565, GL 534, DDGC 18, DDGC 8, DDGC 20, GL 548, DDGC 36, DDGC 35, DDGC 32, GL 557, DDGC 17, DGC 30, GL 545, DDGC 22, DDGC 27
Bijapur (1), Bellary (4), Belgaum (6), Davanagere (1), UAS, Bangalore (8)
III 15 GL 532, GL 566, DDGC 17, GL 553, GL 509, GL 550, GL 524, GL 529, GL 520, DDGC 73, GL 543, GL 504, DDGC 24, DDGC 31, GL 502
Belgaum (2), Bellary (1), Bijapur (1) UAS, Bangalore (11)
IV 4 GL 553, DDGC 23, DDGC 28, DDGC 23
Bellary (1), Davanagere (1), Belgaum (1), UAS, Bangalore (1)
V 1 DDGC 10 Bijapur VI 1 DDGC 29 Bagalkot
Table 3. Clustering pattern in pendal genotypes of Lablabpurpureus (L.) Sweet
Frequency S. N. Trait Type Pendal genotypes Non-pendal genotypes
Determinate 0 12 (16.90) Semi determinate 0 59 (83.90)
1 Growth habit
Pendal 43 (100) 0 2 Branch orientation Short and erect lateral branches 0 8 (11.26) Branches tending to be perpendicular to main stem, medium in
length 0 6 (8.45)
First lateral branches long and spreading over ground 43 (100) 57 (80.28) No pigmentation 33 (76.74) 71 (100) Extensive 6 (13.95) 0 Localized at nodes 3 (6.97) 0
3 Stem pigmentation
Almost solid 1 (2.32) 0 Green 42 (97.67) 71 (100) 4 Leaf vein colour Purple 1 (2.38) 0 Absent 43 (100) 71 (100) 5 Leaf anthocyanin Present 0 0 Pale green 24 (55.81) 15 (21.12) 6 Leaf colour Green 19 (44.18) 56 (78.87) Glaborous 29 (67.44) 7 (9.85) Low pubescence 7 (16.27) 51 (71.83)
7 Leaf hairiness
Moderately pubescence 7 (16.52) 13 (18.30) 8 Leaf shape Ovate 43 (100) 71 (100)
Table 4a. Variability for plant growth habit and leaf characters and their frequency in local collections of Lablab purpureus (L.)Sweet
Value in parenthesis is % value

22 Journal of Food Legumes 25(1), 2012
Table 4b. Variability for inflorescence and flower characteristics and their frequency in local collections of Lablab purpureus (L.)Sweet
Frequency S.N. Trait Type Pendal types Non-pendal types
Within foliage 17 (39.53) 1 (1.40) Intermediate 0 3 (4.22)
1 Raceme position
Emerging from leaf canopy
26 (60.46) 67 (94.36)
FBC SPC WPC KPC FBC SPC WPC KPC White 01 (2.32) 33 (76.67) 33 (76.74) 33 (76.74) 0 67 (94.36) 67 (94.36) 67 (94.36) Cream 0 0 0 0 5 (7.04) 1 (1.40) 1 (1.40) 1 (1.40) Light yellow 32 (74.41) 0 0 0 63 (88.73) 0 0 0
2 Flower characters
Pruple 10 (23.25) 10 (23.25) 10 (23.25) 10 (23.25) 3 (4.22) 3 (4.22) 3 (4.22) 3 (4.22)
Value in parentheses is % value; FBC: Flower bud colour, SPC: Standard petal colour, WPC: Wing petal colour, KPC: Keel petal colour
Table 4d. Variability (quantitative) for seed characters and their frequency in local collections of Lablab purpureus (L.) SweetFrequency
Pendal types Non-pendal types S.N. Trait Type
YSC MSC DSC YSC MSC DSC Green 43 (100) 25 (60.46) 0 70 (98.59) 71 (100) 0 Cream 0 0 0 1 (1.40) 0 2 (2.81) Purple 0 1 (2.32) 0 0 0 0 Brown 0 3 (6.97) 21 (48.83) 0 0 8 (11.26) Black 0 1 (2.32) 11 (25.58) 0 0 0 White 0 2 (4.65) 0 0 0 17 (23.94) Golden brown 0 0 1 (2.32) 0 0 0 Nearly sand stone 0 0 2 (4.65) 0 0 25 (35.21) Tata mimosa/dry mehandi colour
0 0 6 (13.95) 0 0 4 (5.62)
Dawn lustrous 0 0 2 (4.65) 0 0 14 (19.71)
1 Seed colour
Pinkish 0 10 (23.25) 0 0 0 0 YS (F) Dry YS (F) Dry
Round 1 (2.32) 1 (2.32) 2 (2.81) 53 (74.64) Oval 42 (97.6) 42 (97.67) 69 (97.18) 18 (25.35)
2 Seed shape
Flat 0 0 0 0 3 Seed texture Smooth 43 (100) 71 (100)
Value in parentheses is % value; YS (F): Fresh seed, YSC: Young seed colour, MSC: Matured seed colour, DSC: Dry seed colour
Table 4c. Variability for pod characters and their frequency in local collections of Lablab purpureus (L.) Sweet
Frequency Pendal types Non-pendal types
S.N. Trait Type
Unripe (fresh pod)
Matured (fresh pod)
Unripe (fresh pod)
Matured (fresh pod)
1 Pod attachment Erect 29 (67.44) 5 (11.62) 71 (100) 8 (11.26) Intermediate 4 (9.30) 5 (11.62) 0 63 (88.73) Pendant 10 (23.25) 20 (46.51) 0 0 2 Pod curvature Straight 15 (34.88) 46 (64.78) Slightly curved 28 (65.11) 25 (35.21) 3 Pod pubescence Glabrous 41 (95.34) 71 (100) Moderately pubescent 2 (4.65) 0 4 Pod beak Short beak 43 (100) 71 (100) 5 Pod constriction No constriction 18 (41.86) 13 (18.30) Slightly constricted 19 (44.18) 56 (78.87) Constricted 6 (13.95) 2 (2.81) 6 Pod colour White 9 (20.93) 0 Green 32 (74.41) 71 (100) Purple 1 (2.32) 0 Dark purple 1 (2.32) 0
Value in parentheses is % value

Savitha et al. : Characterization and genetic diversity analysis in field bean [Lablab purpureus (L.) Sweet] collections of Karnataka 23
Three different raceme positions were observed viz.,within foliage, intermediate and emerging from leaf canopy.Similarly variation fo r flower bud and its petal co lour wasobserved in both pendal and non-pendal types. Wide variationfor flower colour was observed in both pendal and non pendalgenotypes. The flower colour varied from purple to pure white.The highest frequency of genotypes recorded light yellow
colour followed by purple in both types. Similarly variationwas observed for standard petal, wing and keel petal colour.Flower colour can be used as a marker to identify genotypes/varieties. A wide variability was observed for pod charactersviz., pod attachment, pod curvature, pod constriction and podcolour except pod beak in both pendal and non-pendal types.Three types of pod attachment, erect, intermediate and pedant;two types of pod curvatures, straight and slightly curved andshort pod beak were also observed in both pendal and non-pendal types (Shivashankar et al. 1989, Mohan and Aghora2006). Similarly, pod constriction and pod colour differenceswere observed. In pendal types four different pod coloursviz., green, white, purple and dark purple were observed amongwhich green pod colour was the dominant one. There wasonly one genotype each with purple (GL 559) and dark purple(GL 529). The variation in pod characteristics is important asthere is a lot of variation in consumer preference for pod colour,size and constrict ion. The variability can be utilized whilebreed ing for region specific Dolichos beans . Further, podcharacters like pod attachment and pod curvature also playan important role in insect resistance which should be exploredas field bean is attacked by many insects at pod formationstage. The seed coat colour showed wide variation amongthe genotypes. A total of 11 seed colours namely green, cream,purple, brown, black, white, golden brown, nearly sand stone,tata mimosa, dawn lus trous and pinkish were observed atdifferent stages viz., young seed, matured seed and dry seed.The seed colour at young stage was found to be green in allthe genotypes of pendal and non-pendal types, whereas inmature seeds, the seed colours – green, pink, brown, white,black and purple – were observed with varied frequency. Onlyone genotype ‘GL 559’ had purple pod colour as well as seedcolour at maturity. The genotypes ‘DDGC 18’ and ‘GL 532’exhibited white seed colour. The genotypes ‘GL 509’, ‘GL 548’and ‘GL 524’ had brown seed colour at maturity stage. Theseed colour variation is another importan t parameter tocharacterize the genotypes/varieties for easy identificationand differentiation of germplasm lines/varieties. Such variationin seed colour was also observed for dry seeds. The highestfrequency of genotypes among pendal type had brown seeds.In non-pendal types it was s and stone followed by white,dawn lustrous, brown, tata mimosa and cream. For seed shapealso there was a lot of variation. In pendal type, the frequencyof round (2.30%) and oval (97.67%) were same in young anddry seeds. On the other hand, in non-pendal types the highestfrequency (97.18%) of geno types showed oval shape atyoung seed stage while at dry seed stage the h ighestfrequency of genotypes (74.64%) had round seeds. All thegenotypes had smooth seed texture.
In conclusion, there is a wide variability for all thequalitative traits in both pendal and non-pendal types. Further,the genotypes ‘GL 63’, ‘GL 77’, ‘GL 56’, ‘GL 70’ and ‘GL 37’among field types and ‘DDGC 18’, ‘DDGC 35’, ‘GL 509’, ‘GL502’ and ‘DDGC 32’ among pendal types recorded significantly
Fig 1. Variation observed for green pod (A), dry seed (B), seedcoat colours and flower colours in the local collectionsof Lablab purpureus (L.) Sweet

24 Journal of Food Legumes 25(1), 2012
higher yield than the check varieties. These lines need to betested in large p lots. Genetics o f majority of the traitsparticularly in pendal types are scanty. There is a need tostudy the genetics of these traits and the linkage betweendifferent qualitative traits and their influence on seed yieldand yield components for ut ilizat ion in Dolichos beanimprovement programmes.
ACKNOWLEDGEMENT
The second author (R L Ravikumar) is thankful to theKirk house Trust, UK for financial support to carry out thisresearch.
REFERENCES
Anonymous. 2006. Agricultural Statistics at a glance. Directorate ofEconomics and Statistics. Ministry of Agriculture, Government ofIndia, New Delhi.
Basavarajappa PS and Byre Gowda M. 2000. Genetic divergence amongfield bean (Lab lab pu rpureus L. Sweet) cultivars o f Sout hernKarnataka. Indian Journal of Plant Genetic Resources 13: 134-137.
Borah P and Shadeque A. 1992. Studies on genetic variability of commonDolichos bean. Indian Journal of Horticulture 49: 270-273.
Byre Gowda M. 2005. Genetic variability in Dolichos lablab collections.Paper presented during training programme on molecular markertechniques fo r crop imp rov emen t a t UAS, Ban galo re duringNovember 7-23, 2005, sponsored by Krik house trust John-Innes,Centre.
Chaudhary B. 1972. Vegetables. NBT, India, New Delhi. Pp 220.Manjunath A, Chandrappa HM, Vishanath SR and Shivashankar G. 1973.
Anthyocyanin genetics of Dolichos. Indian Journal of Genetics andPlant Breeding 33: 345-346.
Mass BL, Ramni HJ, Hean Hanson and Pengelly BC. 2005. Determiningsources of diversity in cultivated and wild Lablab purpureus relatedto provenance of germplasm by using amplified fragment lengthpolymorphism. Genetic Resources and Crop Evolution 52: 683-695.
Mohan N and Aghora TS. 2006. Variability, diversity and distributionof Dolichos (lablab purpureus L.) and races in the central districtsof Tamin Nadu. In: Proceedings of First International Conferenceon Indigenous Vegetables and Legumes, 12-15 December, 2006,ICRISAT, Patancheru, AP, India.
Nandi A, Tripathi P and Lenka D. 2000. Genetic divergence in hyacinthbean (Dolichos lablab). Indian Journal of Agricultural Sciences70: 450-451.
Nasreen Sultana, Ozaki Y and Ok ubo H. 2001. Morphological andphysiological variation in lablab bean (Lablab purpureus L. Sweet).Journal of the Faculty of Agriculture (Kyushu University) 45: 465-472.
Pujari I. 2000. Evaluation on genetic variability in country bean withconventional and molecular strategies. M Sc (Ag) Thesis, OUAT,Bhubaneswar.
Purseglove JW. 1 968. Tropical crops, Dicotyledons-1. Lon gmans,London, UK. Pp 332.
Rao CH. 1987. Genetic studies in garden bean. Indian Journal of Geneticsand Plant Breeding 47: 347-350.
Savitha BN. 2008. Characterization of Avare (Lablab purpureus (L.)Sweet) local collections for genetic variability. M Sc (Ag) Thesis,UAS, Dharwad.
Shivashankar G, Chikkadevaiah and Hiremath RC. 1977. Germplasmof field bean. Indian Journal of Genetics and Plant Breeding 37:353-370.
Shivashankar G, Kulkarni RS, Shashirdhar HE and Mahishi DM. 1989.Field bean (Lab lab pu rpureus L. Sweet). Botan y Culture andImprovement. Report of UAS Bangalore.

Journal of Food Legumes 25(1): 25-30, 2012
Study of compact dwarf pigeonpea’s response to photoperiod and exogenousgibberellic acidP. DHANASEKAR and K.S. REDDY
Nuclear Agriculture and Biotechnology Division, Bhabha Atomic Research Centre, Trombay, Mumbai - 400 085,India; Email: [email protected](Received: September 09, 2011; Accepted: January 29, 2012)
ABSTRACT
Pigeonpea [Cajanus cajan (L.) Millsp.] is the second mostimportant pulse crop of India known for its rich protein andve rsatil e use s. Pigeonpe a e xhi bits differential ge notypicre sponse to varyi ng photoperiods , whil e its response toexogenous gibberellic acid (GA3 ) has rarely been studi ed.‘TDT2004-1’ is an interspecific derivative with D0 type compactdwarf plant type. The present investigation was conceived, witha view to studying the response of compact dwarf plant type‘TDT2004-1’ to varying natural photoperiod and exogenousGA3. The flowering response to photoperiod was studied byconducting a monthly sowing trial in pots, while the responseto GA3 was assayed in vivo under controlled conditions in growthchambe r. ‘TDT2004-1’ exhibited a qual itative short dayphotoperiodic response, while it was insensitive to exogenousGA3 up to concentrations of 100 ppm. The study connotes thatshort-duration pigeonpea is also photoperiod-sensitive unlikeotherwise and that ‘TDT 2004-1’ could be used to evolve rabi /rice fallow cultivable varieties. It also serves as a valuablege neti c materi al for providing insight into GA3-medi atedprocesses.
Key words: Comp act dwarf, Gibberellic acid, Photoperiod,Pigeonpea, Qualitative short day, Rabi, Rice fallow
Pigeonpea (Cajanus cajan (L.) Millsp.) popularly knownas ‘redgram’ (Arhar or Tur) is one of the major grain legumesgrown in the tropics and subtropics of the world contributingpredominant dietary protein (Thu et al. 2003). Pigeonpea isthe most importan t khari f pulse crop in the Indian sub-continent (Hari Ram et al. 2011), cultivated in an area of 3.9mha with a production of 2.9 mt in 2011-12 (DAC 2012). Majoremphasis for improving the productivity of the crop has beentowards breed ing high yield ing cu ltivars and inducingresistance against biotic and abiotic stresses. Exploring andunderstanding the crop’s physiological response to abioticfactors could help tailor the breeding programme for nichebased supp lemental enhancement of yield. Among thephysiological constraints, sensitivity of the crop to varyingphotoperiods is well documented (Reddy 1990) and offerss cope for improvement. A lthough , pigeonpea exh ib itsimmense genetic variability fo r almost all of the charactersincluding plant height and photosens itivity (Reddy 1990),none o f the pres en t day cultivars is short and photo-insensitive, as per the envisioned plant type (Singh et al.
1990, Ali and Kumar 2005). Pigeonpea being a short day plantis cultivated exclusively in kharif season and most cultivarsflower in day lengths of 11-11.5 h (Upadhyaya et al. 2007).The short day response of pigeonpea could be classified asquantitative or qualitative. Under quantitative response thereis no delay in flowering above a critical photoperiod, while aqualitative response would elicit flowering when photoperiodexceeds a critical value (Carberry et al. 2001). Further, dayneutrality has also been reported (Turnbull et al . 1981,Omanga et al. 1995). Most of the traditional pigeonpea varietiesare extremely sensitive to photoperiod, with plant height,vegetative biomass, phenology and grain yield being the traitsmost affected (Whiteman et al. 1985). In addition, the time toflowering is als o greatly influenced by temperatu re(Choudhary et al . 2011). Thus, the wide spect rum ofphotoperiodic response reported in pigeonpea necessitatesthe evaluation of new genotypes for this trait to determinetheir suitability for a particular ecology and cropping pattern.
Limited efforts towards restructuring of pigeonpea planttype by exploiting dwarfing genes have been undertaken andno systematic study to comprehend the physiological basisof dwarfing has been carried out, even though a wide array ofdwarf plant types (D0, D1, D2, D3, D4, D5 and D6), encompassinga range of plant height (25–150 cm), have been reported(Reddy 1990). Although hormonal regulation of plant heighthas long been studied in many crops, to date there is noreport on endogenous GA 3 regu lat ing plant height inpigeonpea. A preliminary study would be to subject thesedwarf genotypes to gibberellic acid (GA3) assay to ascertaintheir sensitivity to exogenous application of GA3.
A compact dwarf plant type ‘TDT2004-1’ isolated froman in ters pecific cross between ‘C-11’ (C. cajan) and C.cajanifolia at our Centre had been used in determining theinheritance pattern (Dhanasekar et al. 2007) and DNA markersassociated with the plant type (Dhanasekar et al. 2010). The‘TDT2004-1’ characterized with short s tature (37.1 cm),shortened internodes (1.2 cm), small (1450.56 mm2) dark greenleaves and compact canopy with semi-determinate growthhabit (Dhanasekar et al. 2007) typical of D0 dwarf has beenutilized in the present investigation to gain insight into themechan ism of dwarfism and type of pho toperiod is m inpigeonpea.

26 Journal of Food Legumes 25(1), 2012
MATERIALS AND METHODS
Plant Materials: The plant material us ed in the p resentinvestigat ion comprised of true breeding lines of compactdwarf plant type ‘TDT2004-1’ and open tall p lan t type‘TT44-4’.Flowering response to photoperiod: The flowering responseof compact dwarf plant type ‘TDT 2004-1’ to photoperiod wasstudied by conducting a monthly sowing trial at Trombay.The seeds of ‘TDT2004-1’ and ‘TT44-4’ were dibbled in potsat monthly intervals from July 2008 to June 2009 as shown inTable 1, so as to expose them to varying natural photoperiods.For each of the treatments (time of sowing), three replicationseach comprising of 5 pots per genotype were used. Aftergermination the seedlings were thinned to 2 seedlings per potand were kept under field cond itions till flowering . Theappearance o f first open flower was taken as the day offlowering. The difference in the days between the date ofsowing and the date of flowering was considered as the daysto flower after sowing. The data on photoperiods andtemperature prevailing during the above period was obtainedfrom the Environment Assessment Division of our Centre.The photoperiod response was studied by comparing the dateof s owing, the mean days to flower after sowing and thecorresponding natural pho toperiod and temperatu reresponsible for the flowering.
Response to exogenous Gibberell ic Acid (GA 3): Theresponse of the compact dwarf plant type to gibberellic acid(GA3) was assayed in vivo under controlled conditions ingrowth chamber (Scien tific Ins t ruments, Mumbai). Acompletely randomized design with four treatments of GA3and 3 replications was adopted . Fifteen s eeds each of‘TDT2004-1’ and ‘TT44-4’ were soaked for seven hours intriplicate in 10-cm dia Petri-dishes containing distilled water(control), 25 ppm GA3, 50 ppm GA3 and 100 ppm GA3 solutionsto represent the four treatments respectively. GA3 solutionswere prepared by first mixing the required quantity of GA3 insmall quantity of 80% ethanol and the final volume was madeup using distilled water. After seven hours of soaking, theseeds were transferred to other Petri-dishes containing distilledwater only for germination. After 48 hours, when the plumulelength was at least 2 cm, 10 seedlings of each of the treatmentsper replication were transplanted individually in to plastic cups(height: 10.5cm, top dia: 7.5cm, bottom dia: 5.0cm) containingdistilled water only. The seedlings were held on to a thermocolesheet containing 1 cm dia holes in the center, with the help ofcotton plugs such that the plumule was above the thermocoleand the radicle below. The thermocole containing the seedlingwas placed on the plastic cups such that the radicle was dippedin the d istilled water contained in the plast ic cup . Since,exogenously applied GA3 tends to be absorbed passively;the GA3 response was studied in growth chambers at constanttemperature of 25 ± 2ºC and relative humidity of 80%. A12 h photoperiod and a photon flux dens ity of 300 to
400 mmol/m/s were prov ided with the help o f cool whitefluorescent lamps. Two rounds of appropriate concentrationof GA3 were sprayed on to the apical buds just after theemergence of the primary leaves using mini hand sprayers at48 h interval. The contro l plan ts were sprayed with onlydistilled water. The seedlings were grown for one month andmeasurements pertaining to epicotyls and internodal lengthwere recorded at regular intervals. At the end of one month,the final height of the seedlings was measured and the dataanalysed. The mean data of 10 plants per replication wereused for statistical analysis (ANOVA) to interpret the responseof the plant types to external GA3.
RESULTS AND DISCUSSION
Flowering response to photoperiod: The time of flowering interms of days after sowing (DAS) for the compact dwarf planttype ‘TDT2004-1’ and the open tall plant type ‘TT44-4’ sownat varying time periods was recorded. The mean daylength(from sunrise to sunset) prevailing for the particular sowingmonth is also reported (Table 1). The time to flowering variedaccording to the time of sowing. Both the genotypes floweredearlier in short days (day leng th around 11 to 12.5 h) ascompared to long days (daylength more than 12.5 h). Thecompact dwarf plant type ‘TDT2004-1’ flowered later than thetall genotype ‘TT44-4’ irrespective of the date of sowing. Themin imum time taken by the compact dwarf plan t type‘TDT2004-1’ to flower was 62 days when it was sown inNovember and the maximum time taken was 187 days whensown in the month of February. On the other hand the tallgenotype ‘TT44-4’ took a minimum t ime of 52 days and amaximum time of 185 days to flower when sown in the monthsof December and February, respectively.
Pigeonpea along with the majority of crop legumes ofthe tropics is generally considered to exhibit a quantitativeshort-day response (Summerfield and Roberts 1985), i.e. onein which no further delay in flowering occurs above a ceilingphotoperiod. Consistent with this, Akinola and W hiteman(1974), Sharma et a l. (1981), Singh and Saxena (1981) andSaxena and Sharma (1990) in sowing studies in the field showedthat the time from sowing to flowering was longest for sowingdates made prior to the summer so lst ice, shorten ingprogressively as sowing dates were delayed into shorteningdays approaching the winter solstice. This is reiterated in thepresent study also, wherein both the genotypes flowered earlywhen sowing was done in the months of June to December,while they flowered late when sown in the months of Februaryto May.
One of the conspicuous observation in the presentexperiment was that, none of the treatments (time of sowing)showed flowering during the months of May, June and Julywhen the daylength or photoperiod was more than 12.5 h(Table 1). Clearly, there is strong evidence from these datathat pigeonpea or at least these cultivars displayed a qualitative

Dhanasekar and Reddy : Study of compact dwarf pigeonpea’s response to photoperiod and exogenous gibberellic acid 27
short-day respons e. Qualitat ive short-day res pons e inpigeonpea has also been reported by Troedson et al. (1990)and Carberry et al. (2001), wherein floral initiation does notoccur above a certain critical photoperiod and the plant initiatesflowering only when photoperiod falls below this criticalperiod. The time to flowering took between 88 and 62 daysafter sowing for sowing dates between July 2008 and January2009 in the case of compact dwarf plant type, while the tallgenotype took between 81 and 52 days after sowing duringthe respective sowing dates. However, the February 2009sowing resulted in flowering after 187 and 185 days in case ofcompact dwarf and tall plant types, respect ively; a 30-daydelay in sowing res ulted in an extra 120 and 131 days,respectively to reach first flower compared to the previouss owing date. The subs equent s owing dates tookprogress ively shorter times to reach flowering . Thephenological development of a crop to flowering time can bedescribed in terms of four stages: (i) emergence, (ii) the end ofthe basic vegetative or juvenile period (BVP), (iii) floralinitiation and (iv) 50% flowering (Carberry et al. 1992). Theprogression of the crop through the phases between stages
(i) and (ii), and (iii) and (iv) is not affected by photoperiodunlike the t ransit ion phase between s tages (ii) and (iii).Following the BVP, the phase to floral initiation is sensitive tophotoperiod. In quan titative (o r facu ltat ive) s hort -dayresponses there is no further delay in floral initiation whenphotoperiod exceeds a critical photoperiod (Pc), while in aqualitative (or obligate) short-day response floral initiationoccurs only when photoperiod falls below Pc (Carberry et al.1992). The env ironment in the present study exposed thegenotypes to natural photoperiods ranging from 11.0 to 13.2h per day, which was sufficient to categorize the photoperiodicresponse. The time to flowering of the compact dwarf and tallplant type with respect to time of sowing suggests qualitativeshort-day photoperiodic response. The time to floweringvaried according to the photoperiod conditions existing atthe time when the genotypes reached the BVP. In February2009 sowing (Table 1), plants of tall and compact dwarf planttypes flowered on 225th and 227th Julian day o f the yearres pect ively. Plants of both the plant types sown at thesubsequent dates, March – May, also flowered on or veryclose to this same date. Clearly, these cultivars when sown
Table 1. Flowering response of pigeonpea genotypes TDT-2004-1 and TT44-4 with respect to date of sowing in a monthly sowingexperiment at Trombay
Flowering Sowing TDT-2004-1 TT44-4
Mean monthly temperature in ºC
S. N.
Date Julian Day of year
Julian Day of year
DAS Julian Day of year
DAS
Mean monthly day
length (photoperiod)
in hours Max Min Mean
1. July 9,2008 191 278 87 272 81 13.2 30 25 27 2. August 8, 2008 221 305 84 300 79 12.8 29 25 27 3. September 9, 2008 253 330 77 325 72 12.3 30 24 27 4. October 10, 2008 284 348 64 345 61 11.8 34 23 28 5. November 9, 2008 315 11 62 4 55 11.3 34 21 27 6. December 9, 2008 344 41 63 30 52 11.0 33 19 26 7. January 2, 2009 2 69 67 56 54 11.3 32 18 25 8. February 9, 2009 40 227 187 225 185 11.5 32 18 25 9. March 9, 2009 68 224 156 222 154 12.0 34 22 28 10. April 7, 2009 97 229 132 225 128 12.5 35 25 30 11. May 8, 2009 128 225 97 218 90 13.0 34 27 30 12. June 9, 2009 160 248 88 243 83 13.2 33 28 30
DAS: days after sowing
Table 2. Effect of different concentrations of GA3 on the internodal lengths of ‘TT44-4’ and ‘TDT2004-1’ at 1 month after germination
TT44-4 TDT2004-1 Internode length (cm) Plant height
(cm) Internode length (cm) Plant height
(cm)
GA3 (ppm)
PL 1 2 3 4 PL 1 2 3 4 0 6.42 1.32 1.12 1.3 0.7 10.86 5.5 0.92 0.68 0.7 0.48 8.28 25 8.52 1.54 1.50 1.74 1.4 14.70* 5.64 0.96 0.66 0.64 0.50 8.40 50 10.68 2.10 1.78 1.76 1.54 17.86* 5.64 0.92 0.70 0.72 0.44 8.42 100 12.78 7.56 2.18 2.04 1.62 26.18* 5.74 0.92 0.68 0.72 0.52 8.58 SE 0.12 0.11 0.06 0.05 0.06 0.245 0.07 0.04 0.04 0.04 0.03 0.10 CD (P=0.05) 0.36 0.34 0.17 0.17 0.18 0.76 0.26 0.13 0.13 0.12 0.09 0.32
PL: Primary leaf node; *: Significant at P=0.05

28 Journal of Food Legumes 25(1), 2012
during February to May reached the BVP when photoperiodsexceeded Pc and thus remained unres pons ive un tilphotoperiod fell below Pc. The analysis of the date of sowing,days to flowering, day lengths at the time of sowing andflowering in the present study suggests that the Pc for floweringof the pigeonpea plant types ‘TDT2004-1’ and ‘TT44-4’ was12.5 h. Carberry et al. (2001) also reported an almost similartrend in which the flowering in short-duration cultivars wasdelayed by up to 100 days and by over 150 days in mediumand long durat ion cu lt ivars when day leng th in thephotoperiod-inductive phase exceeded a critical value.
The days to flowering is also known to be influencedby the temperature. In the present investigation which wascarried out under natural field conditions, the genotypes wereexposed to mean temperatures ranging from 25 to 30°C (Table1) and the temperature range was insufficient to study theinfluence o f temperature on flowering. The effect of lowtemperature on flowering could not be inferred from the presentstudy. But prima facie analysis of the data on flowering andthe mean temperature existing at the time of flowering showedthat flowering was inhibited especially when the photoperiodwas more than 12.5 h coupled with high mean temperatureexceeding 27°C. The time to flowering was hastened underwarm temperatures (25 to 27°C). This is consistent with theresults of McPherson et al. (1985), Turnbull and Ellis (1987)and Silim and Omanga (2001).
Duration of pigeonpea cultivars has also been reportedto have influence on its photosensitivity; extra-short-durationgenotypes being leas t res pons ive and the long-durat iongenotypes to be the most (Saxena and Sharma 1990, Silim etal. 2006). Chauhan et al. (2002) hypothecated that there hasbeen a selection for a high harvest index (HI) potential andearly flowering in lines for better adaptation to longer daysand a high total dry matter production potential in lines toshorter days. Besides, short day photoperiodic response, day-neutrality has also been reported by o ther researchers(Turnbull et al. 1981 and Omanga et al. 1995) in pigeonpea.These reports sugges t that the pigeonpea crop exhibitsgenotypic differential response to varying photoperiods.Differential genotypic sensitivity to a photoperiod has majorimplications for adap tation of pigeonpea with res pect tolatitude, altitude, season and cropping pattern. This studyalso connotes that short -durat ion p igeonpea need notnecessarily be photo-insensitive.
Sensitivity to exogenous gibberellic acid (GA3): The compactdwarf plant type ‘TDT2004-1’ was found ins ens itive toexogenous GA 3, while the tall genotype ‘TT44-4’ wasresponsive. The effect of GA3 on internodal elongation inboth the genotypes is summarized in Table 2. The effect ofsoaking in GA3 solution on the tall genotype was visible within48 hours of germination. The plumule length was significantlyincreased even at 25 ppm of GA3 in case of ‘TT44-4’, while itwas almost doubled at 100 ppm. The soaking of ‘TDT2004-1’
in GA3 did not affect the plumule length much, though therewas significant increase at 50 and 100ppm. The effect of GA3on the plumule length of ‘TDT2004-1’ and ‘TT44-4’ at 96 hafter germination. At 8 days after germination, the epicotyllength reached the maximum, with the formation of the firsttrue node after the primary leaf node. The effect of GA3 wasvisible even on the first internode in the case of ‘TT44-4’,while there was no significant effect in ‘TDT2004-1’. In caseof ‘TDT2004-1’, wherein 100 ppm of GA3 had shown significanteffect on the plumule length at 96 hrs of germination, did notshow similar effect at 8 days after germination when theepicotyl length had reached its maximum.
At 30 days after germination, the effect of GA3 wasseen in each of the 4 internodes formed. In ‘TT44-4’, therewas significant increase in each of the 4 internodal lengthsfrom the control plants, while ‘TDT2004-1’ did not show similarresponse (Table 2 ). The primary leaf internode (epicotyl length)and the first internodal length were increased manifold timesin ‘TT44-4’, while increase in the s ubsequent internodallengths was not much though significant. It is evident thatthe exogenous application of GA3 significantly increased theoverall height of the tall genotype ‘TT44-4’, the increase beingproportionate to the concentration of GA3. The compact dwarfplant type ‘TDT2004-1’ did not show significant increase inplant height in response to the exogenous application of GA3.
The green revolution that led to massive improvementsin crop yield was largely caused by introgression of dwarfinggenes . Stem elongation is con tro lled by s everal facto rsincluding plant developmental stage or state, light quality,nu trien t and genotype. Many of thes e components arethought to mediate changes in elongat ion th roughmodifications relating to p lan t hormones, part icu larlygibberellins (GAs). These modificat ions may be throughaffecting the level, transport or perception of hormones. Thegibberellic acid biosynthetic pathway can be dissected bymeans of dwarfing genes (Hedden and Proebsting 1999). Dwarfmutants that are defective for different steps in the GA3pathway have been described in maize, rice and pea (Phinney1984). However, other dwarf mutants have been identified inwheat, rye, maize and rice that are insensitive to the applicationof GA3 (Gale and Youssefian 1985, Borner 1991, Harberd andFreeling 1989, Mitsunaga et al . 1994). In these mutan tsdwarfism appears to be due to causes other than blocks inGA3 biosynthesis.
The p resence o f GA3 sensitive/insensit ive dwarfinggenes can be identified by a GA3 response test conducted byexposing the dwarf plants to exogenous GA3 and studyingthe response in terms of stem elongation (Milach et al. 2002).In pigeonpea, the effects of growth regulators like GA3 oninternodal elongation have not been studied. The presentstudy was therefore conceived to study the effect of GA3 onthe plant height of pigeonpea and also to assay the responseof the compact dwarf plant type ‘TDT2004-1’ to the exogenous

Dhanasekar and Reddy : Study of compact dwarf pigeonpea’s response to photoperiod and exogenous gibberellic acid 29
app lication of GA3 and categorise it as GA3 sensit ive orinsensitive. The concentrations of GA3 in the present assayi.e., 25 to 100 mg/l were decided based on various reportsavailable in legumes such as chickpea (Iqbal et al. 2001), kidneybeans (EL-Fouly 2008), peas (Sprent 1969), Phaseolus aureus(Chaudhry and Hussain 2001) and cowpea (Emongor 2007).The tall genotype ‘TT44-4’ was responsive to exogenous GA3,while the compact dwarf plant type ‘TDT2004-1’ was non-responsive. The tall genotype responded proportionately tothe concentration of GA3 like in other crops (Chaudhry andHussain 2001, Emongor 2007, El-Fouly 2008). The 100ppm ofGA3 was able to elicit a 140% increase in the plant heightprimarily through the internodal elongation. The epicotylregion between the cotyledons and the node bearing theprimary leaves were significantly increased when the seedswere soaked in GA3 solution prior to germination (Table 2).Whereas in the compact dwarf plant type ‘TDT2004-1’, GA3even at concentrat ion of 100 ppm failed to bring forths ignifican t internodal elongat ion and hence remainedunresponsive. Thus it could be hypothesised that the dwarfplant type which was unable to utilize the exogenous GA3,probably had a mutation o r b reak in the GA3 u tilizationpathway. Because of this, the dwarfness in ‘TDT2004-1’ couldnot be revived even when GA3 was supplied externally. Thiscould be the firs t report of a GA3 insensitive genotype inpigeonpea or legumes.
The plant type ‘TDT2004-1’ with its short stature (37cm), compact canopy, high harves t index (40%) and earlymaturity (Dhanasekar et al. 2007) is an ideal plant type forrabi or rice fallow conditions. The compact dwarf plant typeis also highly amenable for effective plant protection measures.The compact dwarf trait being under the control of singlerecessive gene (Dhanasekar et al. 2007), cou ld be eas ilyintrogressed into a high yielding background. Further, thecompact p lant statu re is expected to have reduced waterrequirement, which is desirable under rice fallow conditions.Thus the genotype ‘TDT2004-1’ p rov ides avenues forimprovement in terms of reducing the maturity to around 90days for evolving rabi/ rice fallow cultivable varieties. It couldalso serve as a valuable genetic stock for dissecting the lessknown GA3 utilization pathway especially in legumes.
REFERENCES
Akinola JO and Whiteman PC. 1974. Agronomic studies on pigeonpea(Cajanus cajan (L.) Millsp.). I. Field responses to sowing time.Australian Journal of Agricultural Research 26: 43-56.
Ali M and Kumar S. 2005. Pigeonpea: retrospect and prospects. In: MAli and S Kumar (Eds), Advances in Pigeonpea Research. IndianInstitute of Pulses Research, Kanpur, India. Pp 1-22.
Borner A. 1991. Genetical studies of gibberellic acid insensitivity in rye(Secale cereale L.). Plant Breeding 106: 53-57.
Carberry PS, Ranganathan R, Reddy LJ, Chauhan YS and RobertsonMJ. 2001. Predicting growt h and development of p igeonp ea:flowering response to photoperiod. Field Crops Research 69: 151-162.
Carberry PS, Muchow RC, Williams R, Sturz JD and Mclown RL. 1992.A simulation model of kenaf for assisting fiber industry planning inNorthern Australia. 1. General introduction and phenological model.Australian Journal of Agricultural Research 43: 1501-1513.
Chaudhry NY and Hussain UK. 2001. Effect of growth hormones ie.,GA
3, IAA and kinetin on the external morphology and flowering of
Phaseolus aureus L. Online Journal of Biological Science, 1: 801-804.
Chauhan YS, Johansen C, Moon JungKyung, Lee YeongHo and LeeSuk Ha. 2002 . Pho toperiod resp onses of extr a-sho rt-durat ionpigeonpea lines developed at different latitudes. Crop Science 42:1139-1146.
Choudhary AK, Sultana R, Pratap A, Nadarajan N and Jha UC. 2011.Breeding for abiotic stresses in pigeonpea. Journal of Food Legumes24: 165-174.
DAC. 2012. First Advance Estimates of Production of Foodgrains for2011-12. Agricultural Statistics Division, Directorate of Economicsan d Statistics, Depar tment of Agriculture and Co operatio n,Gov ernm ent o f India, New Delhi (http://ean ds.d acn et.n ic.in/Advance_Estimate/1stAdvance2011-12-English.pdf, accessed onJanuary 17, 2012).
Dhanasek ar P, Dhumal KN and Reddy KS. 2010. Identification ofRAPD markers linked to plant t ype gene in pigeonpea. IndianJournal of Biotechnology 9: 58-63.
Dhanasekar P, P andey RN and Dhumal KN. 2007. Inheritan ce ofcompact dwarf plant type in pigeonpea (Cajanus cajan). PlantBreeding 126: 551-552.
EL-Fouly MM, Sakr R, Fouad MK, Zaher AM and Fawzi AFA. 2008.Effect of GA, CCC and B-9 on morphophysiological charactersand y ield of k idney beans (Phaseolus vulg aris L.) . Journal ofAgronomy and Crop Science 160: 94-101.
Emongor V. 2007. Gibberellic acid (GA3) influence on vegetative growth,
nodulation and yield of cowpea (Vigna unguiculata (L.) Walp).Journal of Agronomy 6: 509-517.
Gale MD and Youssefian S. 1985. Dwarfing genes in wheat. In: GERussell (Ed), Progress in plant breeding. Butterworth and Co, London.Pp 1-35.
Harberd NP and Freeling M. 1989. Genetics of dominant gibberellin-insensitive dwarfism in maize. Genetics 121: 827-838.
Hari Ram, Guriqbal Singh, Sekhon HS and Khanna V. 2011. Effect ofsowing time on the performance of pigeonpea genotypes. Journalof Food Legumes 24: 207-210.
Hedden P and Proebsting WM. 1999. Genetic analysis of gibberellinbiosynthesis. Plant Physiology 119: 365-370.
Iqbal HF, Tahir A, Khalid MN, I-ul-Haq and Ahmad AN. 2001. Responseof ch ickp ea (Cicer arietinu m L .) gro wth to wards th e foliarapplication of gibberellic acid at different growth stages. PakistanJournal of Biological Sciences 4: 433-434.
Singh L, Gupta SC and Faris DG. 1990. Pigeonpea: breeding. In: YLNene, SD Hall and VK Sh eila (Eds), T he Pigeon pea. CABInternational, Wallingford, UK. Pp 375-399.
McPherson HG, Warrington IJ and Turnbull HL. 1985. The effects oftemperat ure an d day len gth on the ra te of dev elo pment ofpigeonpea. Annals of Botany 56: 597-611.
Milach SCK, Rines HW and Phillips RL. 2002. Plant height componentsand gibberellic acid response of oat dwarf lines. Crop Science 42:1147-1154.

30 Journal of Food Legumes 25(1), 2012
Mitsunaga S, Tashiro T and Yamaguchi J. 1994. Identification andcharacterization of gibberellin-insensitive mutants selected fromamong dwarf mutants of rice. Theoretical and Applied Genetics 87:705-712.
Omanga PA, Summerfield RJ and Qi A. 1995. Flowering of pigeonpea(Cajanus cajan) in Kenya: responses of early maturing genotypesto location and date of sowing. Field Crops Research 41: 25-34.
Phinney BO. 1984. Gibberellin A1, dwarfism and the control of shootelongation in higher plants. In: A Crozier and JR Hillman (Eds),The biosynthesis and metabolism of plant hormones. CambridgeUniv Press, Cambridge, England. Pp 17-41.
Reddy LJ. 1990. Pigeonpea: morphology. In: YL Nene, SD Hall and VKSheila (Eds), The pigeonpea. CAB International, Wallingford, UK.Pp 47-87.
Saxena KB and Sharma D. 1990. Pigeonpea: genetics. In: YL Nene, SDHall and VK Sheila (Eds), The Pigeonpea. CAB Internat ional,Wallingford, UK. Pp 137-158.
Sharm a D, Reddy LJ, Green JM an d Jain KC. 1981. Internat ionaladaptaion of pigeonpeas. In: Proceedings of th e Internat ionalWorkshop on Pigeonpeas, Vol. 1, December 15-19, 1980, ICRISATCenter, India, Pp 77-81.
Silim SN, Coe R, Omanga PA and Gwata ET. 2006. The response ofpigeonpea genotypes of different duration types to variation intemperature and ph otoperiod un der field co nditions in Kenya.Journal of Food, Agriculture and Environment 4: 209-214.
Silim SN and Om anga PA. 200 1. The respo nse of short -durat ionpigeonpea lines to variation in temperature under field conditionsin Kenya. Field Crops Research 72: 97-108.
Singh HP and Saxena MC. 1981. Effect of date of planting on the timeof flowering in greengram, blackgram, cowpea and pigeonpea. In:Proceedings of the International Workshop on Pigeonpeas, Vol.1,
December 15-19, 1980, ICRISAT Center, India, Pp 165-174.Sprent JI. 1969. The growth of pea leaves in relation to internode
growth as affected by gibberellic acid and B-9. New Phytologist 68:305-312.
Summerfield RJ and Roberts EH. 1985. Cajanus cajan. In: AH Halevy(Ed), Handbook of Flowering, Vol. 1. CRC Press, Boca Raton, FL.Pp 83-91.
Thu TT, Mai TTX, Dewaele E, Farsi S, TadesseY, Angenon G andJacobs M. 200 3. In vitro regenerat ion and transformation ofpigeonpea (Cajanus cajan (L.) Millsp.). Molecular Breeding 11:159-168.
Troedson RJ, Wallis ES and Laxman S. 1990. Pigeonpea: adaptation.In: YL Nene, SD Hall and VK Sheila (Eds), The pigeonpea. CABInternational, Wallingford, UK. Pp 159-177.
Turnbull LV, and Ellis EH. 1987. Effect of incandescent and fluorescentlighting used in photoperiod extension on the vegetative growthand floral development of four lines of pigeonpea. Field CropsResearch 17: 25-36.
Turnbull LV, Whiteman PC and Byth DE. 1981. The in fluence oftem perature and phot operio d on f loral development of earlyflowering pigeonpea. In: Proceedings of the International Workshopon Pigeonpeas, Vol. 1, December 15-19, 1980, ICRISAT Center,India, Pp 217-223.
Upadhyay a HD, Reddy KN, Sastry DVSSR and Gowda CLL. 2007.Iden tification of ph otoperiod insen sitive sources in the worldcollection of pigeonpea at ICRISAT. E-Journal of SAT AgriculturalResearch (ICRISAT) 3 (ejournal.icrisat.org).
Whiteman ES, Byth DE and Wallis ES. 1985. Pigeonpea (Caja nuscajan (L.) Millsp.). In: RJ Summerfied and RH Ellis (Eds), GrainLegume Crops. Collins Professional and Technical Books, London,UK. Pp 658-698.

Journal of Food Legumes 25(1): 31-36, 2012
ABSTRACT
Genetic diversity among 495 accessions of chickpea collectedfrom different agro-ecological zones of India was assessed forseveral qualitative and quantitative traits. These accessionswere grown in the augmented design with 3 intermittent checks‘BG 256’, ‘K 850’ and ‘L 550’ after every fifteenth row. Widerange of variabi lity was obse rved for both qual itative andquantitative traits. The number of primary branches, 100 seedwei ght (g) and days to maturity showe d moderate to h ighhe ri tabili ty and geneti c advance. This sugge sts that theselection based on these traits would be useful in improvingthe grain yield. The diversity index indicated ample geneticvariation for seed yield per plant in the present set of materials.Therefore, a direct selection based on seed yield and componenttraits may be practiced to select better genotypes, which couldbe utilized for development of superior high yielding varieties.
Key words: Chickpea, Cluster analysis, Genotypic correlation,Germp lasm, Phenot yp ic correlation, Principalcomponent analysis
The genus Cicer comprises 34 wild perennial, 8 annualwild and one annual cultivated species . Chickpea (Cicerarietinum) is the third most important food legumes in theworld in terms of area (11.55 million hectares) and production(10.46 million tons) (FAOSTAT 2010). India is the largestproducer of chickpea in the world sharing about 72% of areaand product ion (FAOSTAT 2010). In India, ch ickpea iscultivated in an area of 8.75 million ha with the production of8.25 million tons (Singh 2011) with productivity of 945 kg/ha.In India, productivity is low as compared to other chickpeaproducing countries like Mexico (1809 kg/ha), Australia (1268kg/ha), Ethiopia (1265 kg/ha). Hence, utilization of diversegermplasm is the key to develop high yielding varieties tobridge this yield gap.
In chickpea, there are some reports available on theevaluation of genetic stock in agro-morphological traits (Singhet al. 1990, Farshadfar and Farshadfar 2008, Ali et al. 2010,Wadikar et al. 2010). These reports suggest that pod/plant,100 seed weigh t (g), plan t height and number o f primarybranches/plant are the major yield contributing traits (Singhet al. 1990). To strengthen ongoing breeding program, studyof the available natu ral genetic variation is of immenseimportance. It is imperative to collect and evaluate germplasm
Genetic diversity studies in chickpea (Cicer arietinum) germplasmSHIV SEWAK1, M.A. IQUEBAL2, N.P. SINGH1, R.K. SOLANKI3 and SARIKA2
1All India Coordinated Research Project on Chickpea, Indian Institute of Pulses Research, Kanpur – 208 024, UttarPradesh, India; 2Indian Agricultural Statistics Research Institute, New Delhi – 110 012, India; 3National ResearchCentre on Seed Spices, Ajmer, Rajasthan, India; E-mail: [email protected](Received: December 03, 2011; Accepted: February 29, 2012)
precisely to draw valid conclusions. Generally, morphologicalvariations are used to partition the available germplasm intosmall groups/clusters based on similarity and dissimilaritycoefficients (Anderson 1984). Genetic variation pres ent ingermplasm arrays and the genetic relationsh ips amonggenotypes are very useful for efficient conservation as wellas utilization of genetic res ources in breeding programme.Evaluation of germplasm increases the efficiency to makedesirable selection whereas divers ity index provides theinformation regarding the extent of variation present in thepopulation. Therefore, an experiment was conducted to assessgenetic variation, trait association and significant contributionof each trait towards yield and also their contribution towardsgenetic diversity.
MATERIALS AND METHODS
The experimental material comprising 495 accessionscollected from different agro-ecological regions were grownin an augmented design (Federer 1956) with 3 intermittentchecks ‘BG 256’, ‘K 850’ and ‘L 550’ after every fifteenth rowduring Rabi 2006-07 at New Research Farm of Indian Instituteof Pulses Research, Kanpur-208 024 (26.280N and 80.210E),India. Sowing was done in the second week of November.Each accession was grown in paired row of four meters lengthand inter- and intra- row distance were kept at 30 cm and10 cm, respectively. Observations were recorded followingthe standard descriptors of chickpea on nine qualitative traitsviz., seedling vigor, plant pigmentation, stem colour, growthhabit, flower color, pod size, seed size, seed color, testa textureand six quantitative traits viz. days to 50% flowering, days tomaturity, no. of primary branches/plant, number of seeds/pod,100 seed weight (g) and seed yield/plant (g) (Table 1).
Stat istica l analysis: Data analysis was done for bothqualitative and quantitative traits. Frequency distribution wasdone for each qualitative trait using raw mean data. Analysisof variance (ANOVA) for augmented design for all attributes(qualitat ive and quantitative) was done using statisticalso ftware, Windos tat ver. 8.0 (Khetan 2009). Genotyp iccoefficient of variance (GCV), pheno typ ic coefficient ofvariance (PCV), b road sense heritability (h2) and genet icadvance over mean in percent was computed for quantitativetraits. Phenotypic and genotypic correlation coefficients wereestimated using raw and adjus ted mean data, respectively.

32 Journal of Food Legumes 25(1), 2012
Based on adjusted mean data Euclidean distance (diversityindex) was calculated us ing Numerical Taxonomy andMultivariate Analysis System (NTSYSpc) ver. 2.1 (Rohlf, 2000).Dendrogram and cluster groupings using unweighted pairgroup with arithmetic averaging (UPGMA) clustering algorithmwas done based on Euclidean distance matrix through SAHNoption of NTSYSpc ver. 2.2. The variance co-variance matrixwas further used to calculate the Eigen values for obtainingprincipal components. Tocher method was used to producepercent contribution of each trait towards genetic diversity.
RESULTS AND DISCUSSIONS
The Analysis of Variance (ANOVA) for quantitativecharacters showed that the accessions were significantlydifferent. This indicated that sufficient genetic diversity waspresent among the accessions.
The frequency distribution of qualitative traits for 495accessions is represented in Table 2. Three hundred and sixtyacces s ions (72.7%) were v igorous at early stage, 275accessions (55.6%) were strongly pigmented, 232 accessions(46.7%) had pale green stem colour, 434 accessions (87.7%)showed semi-erect type expression, 425 accessions (85.9%)had dark pink coloured flowers, 484 accessions (97.8%) hadsmall pods, 461 (93.1%) had small sized seed, about more than
two-third accessions (67.6%) showed light or dark brown seedcolour and testa texture was found rough for 333 accessions(67.3%). Only one line, namely, ‘ICC 5262’ had large pod aswell as large seed size. This indicated that the populationdominated fo r s pecific clas s fo r many of the traits ;simultaneously variat ion for other classes under differentdescriptors was als o p resent s howing the p resence ofadequate variation.
Based on ANOVA (Table 3), it was found that seed yieldper plant had the highest GCV (33.66) followed by 100-seedweight (18.06) and days to 50% flowering (10.98). Thesimultaneous GCV and PCV values for each trait showed thatnumber of seed per pod was least affected by environmenthaving the highest heritability of 0.99 but had low geneticadvance indicating presence of non-additive gene action. Highheritability coupled with high to moderate genetic advancewas found for days to 50% flowering and days to maturitywhich suggests that ample opportunity exists in germplasmcollection for improvement of this trait. Due to high differencebetween PCV and GCV values fo r seed y ield per p lan t,heritability was recorded to be low (0.32). Presence of highgenetic advance (86.18%) indicated that seed yield per plantis governed by additive genes and selection may be moreeffective in such cases as earlier reported by Kumar andKrishna (1998).
Table 1. Details of descriptors used for major characters of chickpea
S. N. Trait Descriptors & stage of observation/scoring 1 Seedling vigour : Vigorous (1-3); Intermediate (4-6); Non-vigorous (7-9)
Visual score at 45 days after sowing 2 Plant pigmentation : No pigmentation (1); Medium pigmentation (2); Strong pigmentation (3)
Visual score on stem and leaves at the pod filling stage 3 Stem colour : Green (1); Pale Green (2); Purple (3)
Visual score at 90 days after sowing 4 Days to 50% flowering : Number of days from sowing to the day on which 50% plants end of flowering of an accession 5 Growth habit : Erect (0-150) (1); Semi-erect (16-250) (3); Prostrate (flat on the ground) (5)
Visual Score on the angle of the branches from the vertical axis at the pod filling stage 6 Flower colour : Blue (1); Dark Pink (2); White (3); Others (4)
Colour of ventral surface of the vexillum of the freshly opened flower 7 Pod size : Small (1-3); Medium (4-6); Large (7-9)
Visual score at the complete maturation of pods 8 Days to maturity : Number of days from sowing to the stage when over 90% of pods have matured and turned yellow 9 Primary branches : Profuse (1-3); Intermediate (4-6); Shy (7-9)
Visual score on the number of branching at the maturity 10 Number of seed/pod : Average of 10 pods from five competitive plants recorded at the time of harvest 11 Seed size : Large (1); Medium (3); Small (5)
Visual score after harvesting and seed drying (about 6% moisture) 12 100 seed weight : Average weight of three random samples of 100 seed each (Moisture about 6%) 13 Seed colour : Light brown (4); Dark brown (5); Black (6); Green (7);Others (8)
Visual score on dry mature seeds within three month from the harvest 14 Testa texture : Rough (1); Smooth (2); Tuberculated (3)
Visual score on dry mature seeds 15 Seed yield/plant (g) : Mean yield of five representative plants in a plot. Plant stand should at least be 60%

Sewak et al. : Genetic diversity studies in chickpea (Cicer arietinum) germplasm 33
Table 2. Frequency distribution for different morphological characters (qualitative) of chickpea
S. N. Plant Descriptors Range in expression No. of germplasm lines (% of total population)
Few example genotypes
Vigorous 360 (72.7) ICC 4907, ICC 5262 Intermediate 95 (19.2) ICC 5106, ICC 5695
1 Seedling vigour :
Non-vigorous 40 (8.1) ICC 4212, ICC 4709 No pigmentation 64 (12.9) ICC 5993, ICC 7462 Medium pigmentation 156 (31.5) ICC 5465, ICC 7423
2 Plant pigmentation :
Strong pigmentation 275 (55.6) ICC 681, ICC 1777 Green 71 (14.3) ICC 740, ICC 884 Pale Green 232 (46.9) ICC 472, ICC 836
3 Stem colour :
Purple 192 (38.8) ICC 551, ICC 725 Erect 15 (3.0) ICC 1781, ICC 5262 Semi-erect 434 (87.7) ICC 267, ICC 413
4 Growth habit :
Prostrate 46 (9.3) ICC 422, ICC 430 Blue 11 (2.2) ICC 5926, ICC 5932 Dark Pink 425 (85.9) ICC 567, ICC 676 White 31 (6.3) ICC 832, ICC 866
5 Flower colour :
Others 28 (5.7) ICC 4907, ICC 5262 Small 484 (97.8) ICC 414, ICC 5410 Medium 10 (2.0) ICC 5485, ICC 5932
6 Pod size :
Large 1 (0.2) ICC 5262 Large 1 (0.2) ICC 5262 Medium 33 (6.7) ICC 554, ICC 822
7 Seed size :
Small 461 (93.1) ICC 543, ICC 771 Light brown 127 (25.7) ICC 498, ICC 773 Dark brown 158 (31.9) ICC 809, ICC 878 Black 34 (6.9) ICC 4212, ICC 4772 Green 12 (2.4) ICC 5216, ICC 5231
8 Seed colour :
Others 164 (33.1) ICC 1743, ICC 1755 Rough 333 (67.3) ICC 865, ICC 870 Smooth 136 (27.5) ICC 773, ICC 866
9 Testa texture :
Tuberculated 26 (5.3) ICC 567, ICC 676
Table 3. Estimates of variability parameters for various quantitative traits
S. N. Character Name Mean Minimum Maximum Standard Deviation
R2 CV* GCV PCV h2 Genetic Advance
Genetic Advance
as % of mean
1 Days to 50% flowering 83.19 45.00 ICC 7423
128.00 ICC 5454
11.36 0.987 7.77 10.98 13.46 0.67 15.34 17.44
2 Days to maturity 152.53 144.00 ICC 1777
163.00 ICC 6083
9.26 0.990 1.01 1.75 2.02 0.75 4.79 3.13
3 Primary branches (cm) 3.17 3.00 ICC 676
5.00 ICC 4542
0.37 0.959 14.53 6.48 13.42 0.23 0.20 4.75
4 Number of seed/pod 1.01
1.00 ICC 676
2.00 ICC 554
0.06 1.000 0.00003 6.18 6.18 0.99 0.13 12.73
5 100 seed weight (g) 14.86
3.40 ICC 1486
33.30 ICC 7406
4.03 0.960 30.73 18.06 26.66 0.46 3.76 21.60
6 Seed yield/plant (g) 218.14
7.60 ICC 1892
651.30 ICC 4961
129.83 0.975 48.97 33.66 59.07 0.32 86.18 39.51
CV: Co-efficient of variation; GCV: Genotypic co-efficient of variation; PCV: Phenotypic co-efficient of variation
Associat ion among trai ts: Phenotyp ic and geno typiccorrelation coefficients among six quantitative characters viz.,days to 50% flowering, days to maturity, primary branches,number of seeds/pod, 100 seed weight (g) and seed yield/plant (g) were computed and presented in Table 4. It wasobserved that primary branches had highly significant positivegenotypic correlation with 100 seed weight (g) (0.336) and
seed yield/plant (0.330).Similar results were also reported byKhorgade et al.(1995) in limited germplasm set. Days tomaturity showed significant positive genotypic associationwith 100 seed weight (g) (0.241), primary branches (0.167) andseed yield per plant (0.161). Seed yield per plant was found tohave significant positive genotypic association with 100-seedweight (0.184), similar to the findings o f Farshadfar and

34 Journal of Food Legumes 25(1), 2012
Farshadfar (2008). On the other hand, days to 50% floweringshowed significant negative genotypic ass ociation withprimary branches (-0.157) and 100 seed weight (g) (-0.199).Such results were also reported earlier by Singh et al. (1990).This had a high indirect effect on seed yield per plant. Thevalues of phenotypic correlations were in accordance withgenotypic correlations, which reflect the due contribution ofgenotype in the expression of different traits. The informationgenerated will help in unders tanding relationsh ip betweentraits in studied population which subsequently may help inselection process for important traits in breeding programme.
Cluster analysis: The Euclidian distance based dissimilaritycoefficient was calculated for each pair of accessions. Themaximum distance was observed between accessions ‘ICC4709’ and ‘ICC 4969’ (857.39 unit) whereas minimum between‘ICC 429’ and ‘ICC 2148’ (2.52 unit). Total of thirteen clusterswere formed. Maximum number of 86 accessions were presentin cluster 3, followed by cluster 2 and cluster 1 having 84 and81 accessions, respect ively. However, minimum of only 6accessions formed the cluster 12 (Table 5).
The minimum in ter-cluster distance was 11.63 un itsbetween cluster 1 and 2 and the maximum inter-cluster distancewas between clusters 9 and 12 (810.30 unit). The minimumintra-cluster distance was found in cluster 8 (21.87 unit) having21 accessions, whereas the maximum intra-cluster distancewas in cluster 11 (43.67 unit) having 8 accessions (Table 6).
Table 4. Phenotypic? and genotypic correlation among different quantitative characters
S.N. Character Name Days to 50% flowering
Days to maturity
Primary Branches
Number of seeds /pod
100 seed weight (g)
Seed yield/ plant (g)
1 Days to 50% flowering 1.00 0.15 -0.16** 0.00 -0.20** -0.07 2 Days to maturity 0.06 1.00 0.17** 0.02 0.24 ** 0.16 ** 3 Primary branches 0.03 0.07 1.00 -0.03 0.34** 0.33** 4 Number of seeds/pod -0.01 0.01 -0.02 1.00 -0.01 -0.07 5 100 seed weight (g) -0.09* -0.00 0.18** 0.01 1.00 0.18 ** 6 Seed yield/plant (g) -0.04 0.01 0.17** -0.05 0.02 1.00
?Phenotypic correlation: lower diagonal; Genotypic correlation: above diagonal; *,**: Significant at P=0.05 & 0.01, respectively
Table 5. Distribution of genotypes in different clusters
Cluster No. of genotypes Name of few genotypes 1 81 ICC 406, ICC 575, ICC 866, ICC 1738, ICC 1789, ICC 4802 2 84 ICC 1331, ICC 1608, ICC 1755, ICC 1921, ICC 6138, ICC 7414 3 86 ICC 554, ICC 862, ICC 1304, ICC 1646, ICC 2834, ICC 4507 4 49 ICC 809, ICC 1483, ICC 4098, ICC 4637, ICC 4920, ICC 5386 5 75 ICC 832, ICC 5188, ICC 5324, ICC 5549, ICC 5641, ICC 7388 6 8 ICC 1705, ICC 4951, ICC 5326, ICC 5498, ICC 5932, ICC 6813 7 49 ICC 484, ICC 819, ICC 851, ICC 1327, ICC 1566, ICC 1739 8 21 ICC 479, ICC 1826, ICC 1892, ICC 2140, ICC 2208, ICC 4670 9 8 ICC 681, ICC 771, ICC 1885, ICC 4569, ICC 5543, ICC 6079 10 15 ICC 1831, ICC 1874, ICC 4688, ICC 5261, ICC 5398, ICC 5427 11 8 ICC 445, ICC 1586, ICC 4806, ICC 5485, ICC 6111, ICC 7447 12 6 ICC 1802 , ICC 1824, ICC 5424, ICC 6123, ICC 7401, ICC 7434 13 8 ICC 1508, ICC 1697, ICC 2150, ICC 4934, ICC 6008, ICC 7427
For the ease of presen tat ion, original dendrogramproduced for 495 accessions was redrawn using 52 accessions.Those 52 acces sions were drawn from each of 13 clustersth rough Probability Proport ional to Size Simple RandomSampling (PPS SRS) techn ique so as to obtain a t ruerepresentation of mother dendrogram (Fig 1).Principa l Component Analysis: Before performing PCAanalysis , the contribu tion o f each trait towards genet icdiversity was worked out us ing Tocher method. It wasobserved that seed yield per plant contributed 93.63 percentfollowed by days to 50 % flowering (4.92 %), days to maturity(0.68 %) and 100 seed weight (0.58 %). Further, for PCA analysisthe variance-covariance matrix was used to transform all theattributes into a single index of similarity in the form of principalcomponents, which represented 15 eigen values for 15 eigenvecto rs . Only 4 eigen vectors were described as theyaccounted for more than 99% variation present in complete495 set of accessions (Table 7). The first principal componenthad maximum contribution by seed yield per plant (-145.19).The second principal component was determined by days to50 % flowering (11.43). Whereas, 100 seed weight (g) (4.43)determined the third component and days to maturity (3.0)contributed for fourth principal component. It was seen thatthe result of PCA was in accordance with the result of Tochermethod where all the four major p rincipal componentsrepresented as per the trait which contributed the maximum togenetic diversity. Two- dimensional PCA of the whole set was

Sewak et al. : Genetic diversity studies in chickpea (Cicer arietinum) germplasm 35
Coeff icient3.29 87.46 171.63 255.80 339.97 424.14
ICC5993MW
BG256 ICC5498
ICC870 ICC2145
ICC865 ICC7399 ICC5436 ICC1222 ICC5326
ICC862 ICC5195 ICC2956 ICC1766 ICC7447 ICC1626 ICC1885 ICC4595
L550 ICC1245 ICC1725 ICC1781 ICC5670
ICC406 ICC5485 ICC4771
ICC930 ICC5247 ICC5720
ICC676 ICC5406 ICC5993 ICC1791
ICC771 ICC5570 ICC5513 ICC5582 ICC5695 ICC3184
ICC773 ICC4608 ICC1543 ICC1586 ICC5446
ICC740 ICC1861
ICC468 ICC4274 ICC3121 ICC4212 ICC7388 ICC4637 ICC4643
Fig 1. Dendrogram (based on dissimilarity distance) showing 52genot ypes which was drawn from each of 13 originalclus ters using Probabilit y Proportional t o Siz e (PPS)Simple Random Sampling (SRS) technique
also sketched to know the behavior of the populat ion setbased on the traits studied (Fig. 2).
Seed yield is highly complex trait, thus indirect selectionbased on major component trait may increase the efficiencyof breeder. In the present study, primary branches, 100 seedweight (g) and days to maturity which showed high to moderateheritability and desirable genetic advance had high positive
Table 7. Eigen vector of 15 variables for the first 4 principalcomponents
Principal components Variables % contribution* 1 2 3 4
Seedling vigour 0.06 0.63 0.26 0.08 0.06 Plant pigmentation 0.00 -0.05 0.03 -0.20 -0.06 Stem colour 0.08 -0.04 0.05 -0.15 0.02 Days to 50% flowering 4.92 0.79 11.98 0.38 -0.10 Growth habit 0.00 -0.05 -0.01 -0.03 -0.01 Flower colour 0.00 0.10 -0.05 0.07 0.03 Pod size 0.00 0.12 -0.10 0.15 0.03 Days to maturity 0.68 -0.54 0.07 1.39 3.00 Primary branches 0.00 -0.18 -0.08 0.15 0.00 Number of seed/pod 0.00 0.00 0.00 0.00 0.00 Seed size 0.00 -0.12 0.10 -0.26 -0.05 100 seed weight (g) 0.58 -0.86 -1.02 4.43 -0.94 Seed colour 0.05 -0.18 -0.07 0.44 -0.05 Testa texture 0.00 -0.03 -0.03 0.20 0.00 Seed yield/plant (g) 93.63 -145.19 0.07 -0.03 -0.01
*Computed using Tocher’s method
effect on yield . Therefore, select ion based on these t raitswould be fruitful. The study of diversity index reflects that inpresent set of germplasm, ample genetic variation exists forseed yield per plant, therefore a direct selection based onseed yield can be done to develop high yielding varieties.However, after further evaluation, some accessions may beused as parents in the crossing programme to create the bettergenetic recombinants for improving yield per se.
Table 6. Inter and intra cluster distances
Diagonals: Intra cluster distances; Above diagonals: Inter cluster distances
Cluster 1 Cluster 2 Cluster 3 Cluster 4 Cluster 5 Cluster 6 Cluster 7 Cluster 8 Cluster 9 Cluster 10 Cluster 11 Cluster 12 Cluster 13
Cluster 1 29.30 11.63 70.66 198.55 194.08 196.76 354.17 348.81 359.54 360.43 765.59 795.99 781.68
Cluster 2 27.04 63.50 191.40 186.92 189.61 347.02 341.65 352.38 353.28 758.43 788.84 774.53
Cluster 3 29.43 198.55 203.92 197.66 353.28 347.91 357.75 356.86 765.59 795.99 781.68
Cluster 4 29.64 60.82 189.61 364.01 358.64 370.27 369.38 776.32 806.73 792.42
Cluster 5 31.79 158.30 331.81 355.07 364.91 364.01 772.74 803.15 788.84
Cluster 6 40.95 355.07 349.70 359.54 358.64 767.37 797.78 783.47
Cluster 7 35.21 23.25 138.63 137.73 775.42 805.83 791.52
Cluster 8 21.87 133.26 132.37 775.42 805.83 791.52
Cluster 9 29.08 63.50 779.90 810.30 795.99
Cluster 10 24.56 779.00 809.41 795.10
Cluster 11 43.67 205.71 191.40
Cluster 12 22.92 46.51
Cluster 13 30.42

36 Journal of Food Legumes 25(1), 2012
Dim-10.11 0.33 0.55 0.78 1.00
Dim-2
-0.99
-0.61
-0.23
0.16
0.54
12
3
45
6
78
9
10
1112
13
1415
16
17
18
19
202122
23
24
2526
272829
30
31
32
33
34
35
36
37
3839
40
41
42
43
44
45
46
47
48
49
50
51
52
53
54
55
56
57
58
59
60
61
62
63
6465
66
676869
70
71
72
73
74
7576
77
78
79
8081
82
83
84
85
86
87
8889
9091
92
93
94
959697
9899100101
102
103
104105
106107
108109
110
111
112
113
114
115
116117
118
119
120
121122
123
124125
126
127
128
129
130131
132
133
134
135
136
137
138
139
140
141
142
143144
145146
147
148
149
150
151
152
153
154155
156
157
158
159160161
162
163
164
165
166
167
168
169
170
171
172
173
174
175
176
177
178
179
180
181
182
183
184
185
186
187
188
189
190
191192
193
194
195
196
197
198
199
200201
202
203
204
205206
207
208
209210
211
212
213
214
215
216
217
218219
220
221
222
223224
225
226
227
228
229
230
231
232
233
234
235
236237
238
239240
241
242
243
244
245
246
247
248249
250
251
252
253
254
255
256
257
258
259
260261
262
263
264
265
266
267
268
269
270
271
272
273
274
275
276
277
278
279
280
281
282
283
284
285
286
287
288
289
290
291
292
293
294
295
296
297
298
299
300
301
302
303
304
305
306
307
308
309
310
311312
313314
315
316
317318
319
320
321
322
323324
325
326
327328329
330
331332
333
334
335336
337
338
339
340341
342
343
344
345
346347
348
349
350
351
352
353
354
355
356
357
358
359360361
362363364
365
366367
368
369
370
371
372373
374
375
376
377
378
379
380
381382
383
384
385
386
387
388389390391
392393
394395
396
397
398
399400401
402
403
404405
406
407
408
409
410
411
412413
414415416
417
418
419
420
421422
423
424
425426
427
428
429430
431
432
433
434
435
436
437
438439440441
442
443
444
445
446
447
448
449
450
451
452453454455456
457
458459
460461
462
463
464
465
466
467
468
469
470
471472
473474
475
476
477478479480
481482
483
484
485
486
487
488489490
491
492
493494
495
496
497498
Fig 2. 2-dimensional PCA diagram
REFERENCES
Ali Q, Ahsan M and Faro oq J. 201 0. Genetic variability and traitassociation in chickpea (Cicer arietinum L.) genotypes at seedlingstage. Electronic Journal of Plant Breeding 1: 334-341.
Anderson TW. 1984. An Introduction to Multivariate Statistical Analysis(2nd ed). Wiley, New York.
Farshadfar M and Farshadfar E. 20 08. Genetic variability and pathanalysis of chickpea (Cicer arietinum) landraces and lines. Journalof Applied Sciences 8: 3951-3956.
Federer WT. 1956 . Augment ed (or Hoo nuiaku) designs. HawaiianPlanter’s Records. 40: 191-207.
Food and Agricultural Organization of the United Nations. 2010. FAOStatistical Databases. Available at http://faostat.fao.org/ FAO, Rome.
Khetan MM. 2009. Windostat version 8.0 (www.windostat.org).
Khorgade PW, Narkhede MN and RAUT SK. 1985. Genetic variabilityand regression studies in chickpea (Cicer arietinum L.) and theirimplication in selection. PKV Research Journal 9: 9-13.
Kumar A and Krishna R. 1998. Heritability and genetic advance in gram(Cicer aritenum) genotypes of diverse origin. Indian Journal ofAgricultural Sciences 68: 747-749.
Rohlf FJ. 2000. NTSYS-pc Numerical Taxonomy and MultivariateAnalysis System version 2.1. Applied Biostatistics, New York.
Singh KB, Bejiga G and Malhotra RS. 1 990. Association of somecharacters with seed yield in chickpea collections. Euphytica 9: 83-88.
Singh NP, Sewak Shiv, Iquebal MA, Chaturvedi SK and Nath Omkar.2009. Improved chickpea varieties in India. Technical bulletin, AllIndia Coordinated Research Project on Chickpea, Indian Instituteof Pulses Research, Kanpur 208 024.
Singh NP. 2011. Pro ject Coordinator Report, 20010-11. All IndiaCoordinated Research Project on Chickpea, Indian Institute ofPulses Research, Kanpur 208 024.
Wadikar PB, Ghodke an d Po le SP. 201 0. Genetic divergence forproductivity traits in chickpea. Journal of Food legumes 23: 245-246.

Journal of Food Legumes 25(1): 37-40, 2012
Performance of summer mungbean [Vigna radiata (L.) Wilczek] under differentirrigation regimes and boron levelsC. MONDAL, P. BANDOPADHYAY, A. ALIPATRA and H. BANERJEE
Department of Agronomy, Bidhan Chandra Krishi Viswavidyalaya, Mohanpur-741 252, Nadia, West Bengal, India;E-mail: [email protected]
(Received: November 11, 2011; Accepted: February 06, 2012)
ABSTRACT
Effect of irrigation and boron on growth and yield of mungbeanvariety ‘Samrat’ was studied during summer seasons of 2009and 2010 at Jaguli Instructional Farm, Bidhan Chandra KrishiViswavidyalaya, West Bengal on sandy loam alluvial soil. Theexperiment was laid out in a split-plot design with four levelsof irrigation in main plot and four levels of boron in sub-plot.Experimental results revealed that both irrigation and borontreatments influenced crop growth characters, yield attributesand seed yield of mungbean. S i gnificant interaction effectswere observed among the treatments. Maximum seed yield of879 kg/ha was obtained with three irrigations at branching,pre-flowering and pod filling stages and was almost 38% higherover the rainfed treatment. Among the various levels of boron,fol iar spray of 0.2% borax at flowering s tage cons istentlyinfluenced all the growth and yield parameters. A treatmentcombination involving three i rrigations at branching, pre-flowering and pod filling stages along with a foliar spray of0.2% borax at flowering stage recorded maximum mungbeanseed yield (898 kg/ha) which was comparatively higher overother treatment combinations.
Key words: Boron, Growth, Irrigation, Mungbean, Yield
Mungbean [Vigna radiata (L.) Wilczek] is primarily arainy season crop but with the development of early maturingvarieties, it has also proved to be an ideal crop for summerseason (Choudhary et al. 2011). Mungbean is often grown inmarginal lands with limited inputs making it prone to a numberof abiotic stresses causing tremendous yield loss (Singh andSingh 2011). Water stress affects various physiologicalp roces s es ass ociated with g rowth , development andeconomic yield of a crop (Hsiao and Acevedo 1974, Begg andTurner 1976). Water deficit disturbs normal turgor pressureand the loss of cell turgidity may stop cell enlargement thatcauses reduced plant growth. Mungbean is reported to bemore susceptib le to water deficits than many other grainlegumes (Pandey et al. 1984). The crop is more sensitive tomoisture stress during the flowering periods which contributeto instability and low product ivity. Severe moisture stressreduces vegetative growth, flower initiation and pod set(Morton et al. 1982). Water requirement of the crop duringsummer s eason is high because of higher rate o f evapo-transpiration (ET) to attain its proper growth and development.Therefore, scheduling of irrigation at appropriate time and in
right amount is one of the most important factors for realizingh igh yield of s ummer mungbean. In add it ion, nut rien tmanagement is one of the important factors that greatly affectthe growth, development and yield of mungbean (Singh et al.2011). Micronutrient like boron is one of the mineral nutrientsrequired for normal plant growth. The most important functionsof boron in plants are thought to be its structural role in cellwall development , cell divis ion, seed development andstimulation or inhibition of specific metabolic pathways forsugar transport and hormone development (Ahmed et al.2009). Furthermore, boron deficiency causes decrease inpollen size, pollen germination etc. It also influences growthparameters and filling up of seeds.
It is usually accepted that boron availability is decreasedunder dry soil conditions. Thus, boron deficiency is oftenassociated with dry weather and low soil moisture conditions.This behavior may be related to restricted release of boronfrom organic complexes which ultimately impaired ability ofplants to extract B from soil due to lack of moisture in therhizosphere. Even if B levels in soil is high, then also low soilmoisture impairs transport of B to absorbing root surfaces(Das 2011). Information regarding the effect of irrigation andboron application on growth and yield of summer mungbeanare scanty. Hence, the pres ent study was undertaken tomaximize the grain yield of summer mungbean with optimumlevel of irrigation and boron.
MATERIALS AND METHODS
The field experiment was carried out during summerseason in 2009 and 2010 at Jaguli Instructional Farm underBidhan Chandra Krishi Viswavidyalaya, West Bengal (situatedat 22º95'N latitude, 88º50'E longitude and the altitude of 9.75meter above the mean s ea level). The experimental siteexperiencing a typical subtropical humid climate, is situatedjust south of Tropic of Cancer. During the experimental periodthe maximum and minimum temperature varied from 32.85ºC to36.56ºC and 18.94ºC to 27.51ºC, respectively. Maximum andminimum relative humidity (RH) ranged from 93.66 to 94.93%and 45.47 to 69.23%, respectively. The field was in uplandsituation with assured irrigation facilities and proper drainagesystem. The experimental soil was Gangetic alluvial (Inceptisol)and sandy loam in texture. The soils had neutral pH (6.90),availab le N 224.08 kg /ha, available P2O5 27.45 kg/ha and

38 Journal of Food Legumes 25(1), 2012
available K2O 135.15 kg/ha. The experiment was laid out in asplit-plot design with four levels of irrigation (normal irrigationat certain days after sowing, DAS) in main plot and four levelsof boron as a sub plot with three replications. Irrigation levelsincluded no irrigation (I0), irrigation only at branching (25 DAS,I1), both branching (25 DAS) and pre-flowering (35 DAS, I2),and at branching (25 DAS), pre-flowering (35 DAS) and podfilling (55 DAS, I3) stages. Borax-boron was applied @ 10 kg/ha as a basal dose (B1), 0.2% as foliar spray at flowering (B2),10 kg/ha (basal dose) + 0.2% foliar spray at pre-flowering (B3),and at 10 kg/ha (basal dose) + borax 0.2% foliar spray at bothpre-flowering and flowering (B4). Mungbean variety‘Samrat’ (PDM 139) was taken for the experiment. Differentgrowth characters like plant height, leaf area index (LAI), drymatter accumulation (DMA), crop growth rate (CGR) andnumber and dry weight of nodules /plant were recorded.Besides, different yield attributes like pods/plant, seeds/pod,test weight and s eed yield were also recorded at harvest.Consumptive use and water use efficiency of the crop wereestimated under three different irrigation regimes includingthe control (no irrigation).
The data was analyzed statistically by the analysis ofvariance method (Gomez and Gomez, 1984). Analysis of twoyears data was done separately following split-plot design.Since the error variables were homogenous, instead of year-wise data, poo led values were given for discussion andinterpretation.
RESULTS AND DISCUSSION
Growth characteristics: All growth attributing charactersnamely plant height, LAI, DMA and CGR were increased withthe increasing levels of irrigation (Table 1). But significantincrease was obtained only in case of plant height, LAI andDMA with three irrigation levels at 25, 35 and 55 DASaccounting 3.8, 38.1 and 5.0% increased over control (noirrigation) respectively. Mohanty and Sharma (1986) alsoobserved that more number of irrigations increased DMA inMungbean over no irrigat ion . However, boron levelssignificantly influenced all the above said attributes. Foliarapplication of borax @ 0.2% at flowering stage producedsignificantly higher plant height, LAI, DMA and CGR. Increasein LAI following foliar application of B could be attributed toit s in fluence in t iss ue different iation and carbohydratemetabolism. This is in accordance with the findings of Vermaand Mishra (1999).
Interaction effect between irrigation level and Bapplication showed significant result only in case of plantheight and CGR (Table 1). Mungbean crop grown with threeirrigations applied at 25, 35 and 55 DAS accompanied by foliarapplication of borax @ 0.2 % at flowering stage producedsignificantly higher plant height (66.9 cm) and CGR (1.80 g/m2/day) at 25-45 DAS. Interaction effect was non-significantfor LAI and DMA. Increased soil moisture content due to
irrigation helped the plants to absorb greater amount of waterand nutrients from the soil which in turn accelerated CGR.Increase in growth rate with foliar application over basal dosewas due to improved physiological efficiency that played asignificant role in raising the crop productivity (Table 2).Yield attributes and yield: Influence of levels of irrigationwas s ignificant in case of nodule dry weight, pods/plant,seeds/pod and test weight (Table 2) resulting in 42.3, 54.5,31.1 and 38.8% increase over control (no irrigation). All themeasured yield attributes were higher under the combinationof three irrigations at 25, 35 and 55 DAS. Similar results werealso obtained by Pal and Jana (1991) and Pal and Lal (1993).But irrigation levels could not differentiate nodules/plant. Onthe con trary, both nodule number and dry weight weresignifican tly influenced by boron levels and the influencewas more in case of foliar application over basal dose. Yet,boron application did not influence pods/plant and seeds/pod.
Interaction effect was significant for nodu les/plant,nodule dry weight/plant and pods/plant when the crop wasgrown with two irrigations at 25 and 35 DAS in conjunctionwith foliar application of borax @ 0.2 % at flowering (Table 2).Although not sign ificant , combined app lication of threeirrigations at 25, 35 and 55 DAS along with foliar spray ofborax @ 0.2% showed better result in respect of seeds/pod(12.1) and test weight (26.5 g).
Seed yield of mungbean was significantly influencedby both irrigation and boron levels (Table 2). Significantlyhigher seed yield (38%) was obtained with three irrigationlevels at 25, 35 and 55 DAS over contro l and with foliarapplication of borax @ 0.2% at flowering over basal application.These resu lts are in close conformity with the findings ofMohanty and Sharma (1986). Control s ituat ion producedlowes t pod and seed yields. Varma and Rao (1975) alsoobserved that pod and seed yields were reduced sharply withlow soil moisture. Since the Mungbean crop was grown duringsummer season, sufficient availability of soil moisture duringcrop growth especially during its critical growth periods mightaugment its initial stand establishment and subsequent cropvigour, resulting in maximization of seed production. However,in case of boron, its effect could be ascribed to increasedpods/plant, seeds/pod and test weight which resulted in higherseed yield over the basal application of boron.
Interaction effect between levels of irrigation and boronwas positive, and higher seed yield of 898 kg/ha was obtainedwhen the plant received 0.2% foliar spray of borax at floweringalong with 3 irrigations at branching, pre-flowering and poddevelopment stages (Table 2).
Consumptive use and water use efficiency: The consumptiveuse increased appreciab ly following irrigation levels withgreater availability of soil moisture (Table 3). It was maximum(32.3 cm) with three irrigation scheduling at branching, pre-

Mondal et al. : Performance of summer mungbean under different irrigation regimes and boron levels 39
Table 1. Main and interaction effect of treatments on growth parameters of summer mungbean (Pooled data for two years)
Plant height (cm) at harvest LAI at 65 DAS DMA (g/m2) at harvest Levels of boron (B)
Levels of irrigation (I) B1 B2 B3 B4 Mean B1 B2 B3 B4 Mean B1 B2 B3 B4 Mean I0 49.7 50.1 51.8 52.1 50.9 1.83 2.10 1.90 1.90 1.93 208 213 212 210 211 I1 56.9 61.8 59.5 58.8 59.3 1.93 2.00 1.93 2.07 1.98 211 218 216 213 215 I2 57.5 62.2 61.6 60.7 60.5 2.87 3.07 3.07 2.73 2.94 216 222 219 217 219 I3 56.6 66.9 63.4 60.5 61.9 2.77 3.27 2.83 2.70 2.89 219 225 222 220 222 Mean 55.2 60.3 59.1 58.0 - 1.76 2.71 2.29 2.06 - 214 220 217 215 - CD(P=0.05) SEm(±) CD(P=0.05) SEm(±) CD(P=0.05) SEm(±) B 1.07 0.36 0.15 0.05 0.67 0.23 I 2.46 0.71 0.16 0.05 3.00 0.87 B at same or different I 2.15 0.73 NS 0.11 NS 0.45 I at same or different B 3.08 0.95 NS 0.10 NS 0.95
CGR (g/m2/day) at 25-45 DAS Nodules/plant Nodule dry weight/plant (mg) Levels of boron (B)
Levels of irrigation (I) B1 B2 B3 B4 Mean B1 B2 B3 B4 Mean B1 B2 B3 B4 Mean I0 1.63 1.70 2.47 1.93 1.93 19.5 22.8 21.3 20.2 21.0 18.7 20.5 19.6 18.8 19.4 I1 2.00 1.63 3.20 2.80 2.41 20.3 23.5 22.6 21.5 22.0 19.7 26.2 23.0 21.5 22.6 I2 2.20 1.77 3.27 2.73 2.49 19.2 27.1 24.6 22.7 23.4 23.9 29.2 27.3 26.4 26.7 I3 2.10 1.80 3.03 2.80 2.43 21.2 25.8 24.8 23.7 23.9 19.2 27.7 25.9 23.6 24.1 Mean 1.98 1.73 2.99 2.57 - 20.1 24.8 23.3 22.0 - 20.4 25.9 24.0 22.6 CD(P=0.05) SEm(±) CD (P=0.05) SEm(±) CD (P=0.05) SEm(±) B 0.39 0.13 0.14 0.05 0.65 0.22 I NS 0.17 NS 0.06 0.91 0.26 B at same or different I 0.21 0.07 1.21 0.41 1.30 0.44 I at same or different B 0.23 0.08 1.58 0.50 1.44 0.46
Table 2. Main and interaction effect of levels of irrigation and boron on yield attributes and yields of summer mungbean (Pooleddata for two years)
Pods/plant Seeds/pod Levels of boron (B)
Levels of irrigation (I) B1 B2 B3 B4 Mean B1 B2 B3 B4 Mean I0 12.6 13.6 12.4 10.9 12.4 8.9 9.0 9.0 8.6 8.9 I1 16.5 14.4 14.2 16.8 15.5 9.2 9.0 9.0 8.9 9.1 I2 15.7 20.5 19.5 17.6 18.3 10.7 11.6 11.8 11.0 11.3 I3 18.9 18.8 19.8 19.1 19.1 11.3 12.1 11.3 11.8 11.6 Mean 15.9 16.9 16.5 16.1 10.0 10.4 10.3 10.1 CD (P=0.05) SEm(±) CD(P=0.05) SEm(±) B NS 0.41 NS 0.12 I 1.43 0.41 0.75 0.22 B at same or different I 2.38 0.82 NS 0.25 I at same or different B 2.50 0.82 NS 0.30
Test weight (g) Yield (kg/ha) Levels of boron (B)
Levels of irrigation (I) B1 B2 B3 B4 Mean B1 B2 B3 B4 Mean I0 17.9 18.0 18.6 17.4 18.0 622 638 647 641 637 I1 18.4 21.2 21.1 21.1 20.4 759 774 769 763 766 I2 21.3 25.2 25.1 25.5 24.3 835 858 867 838 850 I3 23.2 26.5 26.0 24.2 25.0 862 898 867 889 879 Mean 20.2 22.7 22.7 22.0 769 792 788 783 CD (P=0.05) SEm(±) CD (P=0.05) SEm(±) B 1.57 0.54 7.18 2.46 I 1.45 0.42 18.70 5.40 B at same or different I NS 1.08 14.35 4.92 I at same or different B NS 1.02 22.38 6.88

40 Journal of Food Legumes 25(1), 2012
flowering and pod development stages. The increase inconsumptive water use with increase in number of irrigationmight be due to the fact that surface layer under frequentirrigation remained wet for a longer duration thereby creatingcondition for higher rate of evaporation as compared to dryregimes. Consumptive water use decreased with the decreasein number of irrigations and was lowest (24.4 cm) under rainfedtreatment where no irrigation was applied. Slow mois turemovement under rainfed treatment hastened natural drying ofsurface soil in absence of irrigation that reduced evaporationcomponent of evapotranspiration considerably below than amoist soil. Similar results were reported by Pal and Jana (1991).
Water use efficiency (WUE) increased correspondinglywith cons umptive us e with the increas e in number o firrigations over rainfed t reatment (Tab le 3). Water useefficiency was minimum (26.1 kg/ha-cm) under rainfed treatmentand maximum (27.2 kg/ha-cm) with three irrigations given atbranching, pre-flowering and pod development stages. Thesame treatment recorded highest WUE owing to its greaterseed yield. The result is in accordance to findings of Pal andJana (1991).
REFERENCES
Ahmad W, Niaz A, Kanwal S, Rahmatullah and Rasheed MK. 2009.Role of boron in plant growth: A review. Journal of AgriculturalResearch 47(3): 329-338.
Begg JE and Turner NC. 197 6. Crop water deficits. Advances inAgronomy 28: 191-217.
Choudhary HR, Sharma OP, Yadav, LR and Chaudhary GL. 2011. Effectof o rganic sources and chem ical fer tilizer s on pro ductivit y ofmungbean. Journal of Food Legumes 24: 324-326.
Das DK. 2011. Micronutrients: Their Behaviour in Soil and Plants.Kalyani Publishers, New Delhi. Pp 165-168.
Gomez KA and Gomez AA. 1984. Statistical Procedures for AgriculturalResearch (2nd Ed). John Wiley & Sons, New York. Pp 20-30.
Hsiao TC and Acevedo F. 1974. Plant response to water deficits, wateruse efficiency and drought resistance. Agricultural Meteorology 14:69-84.
Mohanty RN and Sharma JR. 1986. Effect of irrigation on growth andyield of summer moong. Seeds and Farms 12: 35-36.
Mo rto n F, Smit h RE and Poehlm an JM. 19 82. Th e Mungbean.University of Puerto Rico, Mayaguez. 136 pp.
Pal AK and Jana PK. 1991. Effect of phosphorus, Rhizobium inoculationand irrigation on growth, yield and water-use efficiency of summerMungbean (Phaseolus radiatus). Indian Journal of Agronomy 36:536-540.
Pal G and Lal B. 1993. Nodulation and rooting pattern of summerMungbean (Phaseolus radiatus L.) as in fluenced by irrigationvariables. Indian Journal of Agronomy 38: 129-131.
Pandey RK, Herrena WAT, Villegas AW an d Penlet ion JW. 1984.Drought response of grain legumes under irrigation gradient. III.Plant growth. Agronomy Journal 76: 557-560.
Singh DP and Singh BB. 2011. Breeding for tolerance to abiotic stressesin mungbean. Journal of Food Legumes 24: 83-90.
Singh G, Ram H, Sekhon HS, aggrawal N, Kumar M, Kaur P, Kaur J andSharma P. 2011. Effect of nitrogen and phosphorus application onproductivity of summer mungbean sown after wheat. Journal ofFood Legumes 24: 327-329.
Varma AK and Rao NSS. 1975. Effect of different levels of soil moistureon growth, yield and some physiological aspects of nodulation inmungbean. Indian Journal of Agricultural Sciences 45: 11-16.
Verma RJ and Mishra PH. 1999. Effect of doses and methods of boronapplication on growth and yield of moong bean. Indian Journal ofPulses Research 12: 115-118.
In the light of results summarized above, it may beconcluded that foliar application of 0.2% boron at floweringalong with three irrigations at branching, pre-flowering andpod development stages are optimum for realising optimumyield of summer mungbean on a sandy loam alluvial soil inWest Bengal.
Table 3. Consumpti ve use and water use e ffi ci ency ofsummer mungbean unde r di ffe re nt le vel s ofirrigation (Pooled data of two years)
Levels of irrigation
Consumptive use (cm)
Water use efficiency (kg/ha-cm)
I0 24.4 26.1
I1 29.2 26.3
I2 31.7 26.8
I3 32.3 27.2

Journal of Food Legumes 25(1): 41-44, 2012
Impact of conservation practices on crop water use and productivity in chickpeaunder middle Indo-Gangetic plainsJ.P. MISHRA1, C.S. PRAHARAJ2, K.K. SINGH2 and NARENDRA KUMAR2
1NRM Division, Krishi Anusandhan Bhawan-II, ICAR, New Delhi-110 012, India; 2Crop Production Division, IndianInstitute of Pulses Research, Kanpur- 208 024, India; E-mail: [email protected]
(Received: October 25, 2011; Accepted: February 13, 2012)
ABSTRACT
The Middle Indo-Gange tic Plains is one of the importantdomains of chickpea production in which the crop is grown indiverse production systems. S ince the crop is predominantlygrown under rainfed conditions, it experiences a deficit in soilmoisture condition especially at its terminal growth stagescausing low productivity. This is more pertinent during rabiseason although the crop is having unique adaptive mechanismsto moisture stress. To mitigate the effect of moisture stresswith improved agronomy under rainfed situation, the presentstudy was carried out at Indian Institute of Pulses Research,Kanpur during rabi seasons of 2008-10. Resource conservationpractices with tillage and mulching were eval uated on theproductivity and water use effici ency of popul ar chickpeagenotypes. Results showed that the contribution of deeper layers(30-60 cm) in the soil profile increased with the depth of tillageas was evident from different mulching and tillage treatments.The highest soil moisture de pletion as measure d throughseasonal evapo-transpiration (ET) was recorded under no mulchand zero tillage in both the surface (0-30 cm) and sub-surface(30-60 cm) depths during both the years of study. Till agepractices could not influence seed yield of chickpea duringboth the years of study. Cultural mulch however, produced highersee d yi eld (1876 kg/ha) during 2008-09 while none of themulching practices could produce difference in seed yield during2009-10 due to optimum rainfall and its fairly well distribution.Amongst chickpea genotypes, ‘JG 16’ produced the highest seedyield of 1858 kg/ha during 2009-10 while ‘KWR 108’ in 2008-09(1961 kg/ha). Water use efficiency (WUE) was the highest indee p ti ll age and cul tural mul ch during 2008-09; whil econventional tillage and no mulch recorded higher WUE in2009-10.
Key words: Chickpea, ET, Mulching, Seed yield, Tillage, Wateruse efficiency
Chickpea (Cicer arietinum L.) is the premier pulse cropin India which accounted about 44.5% of country’s total pulseproduction of 18.09 million tonnes during 2010-11 (AICRP onchickpea 2011). The crop is mainly grown during the coolseason under diverse cond itions and in varied cropp ingsequences and combinations. The Middle Gangetic Plains isone of the important domains for pulses cultivation includingchickpea. Since the country’s population is 1210 million asper latest 2011 census, the shortfall in pulse production vis-a-vis target is likely to be further widened which has to be bridgedup under more or less similar agro-ecology. Moreover, this
has to be achieved under competing situations with othercrops of the s eason and region, between the commoditiesand more importantly with the continued deceleration in theavailability of water for agriculture and extreme weather(Praharaj et al. 2011) as a result of climate change. Therefore,conservation agriculture practices like minimum tillage (zeroor reduced tillage) and moisture cons ervation th roughmulching are important agronomic practices in augmentingthe water productivity more so in the winter season rainfedpulses like chickpea mostly grown on residual soil moisture.
The potential morpho-physiological traits in plants viz.,water use efficiency (WUE), deep root system, higher relativebiomass and harvest index and osmotic adjustment of chickpeahave been advantageous in water scarce situation (Chaudhuryet al. 2005). However, it experiences terminal drought duringseed development stage as it is invariably grown on residualsoil moisture after a preceding kharif crop(s). Thus, terminalmoisture stress is a major constraint in achieving the potentialproductivity of chickpea (Singh et a l. 2010). Under s uchsituations, the photosynthetic activity of leaves is hamperedfor the want of nit rogen (Kashiwagi et al. 2010) and thus,seed filling is affected (Davies et al. 2000). Therefore, judiciousmanagement o f available s oil mois tu re through in -situconservation either by a mulching practice or a tillage optionto improve the crop/water productivity is the key in rainfedconditions (Panwar and Basu 2003). Hence the impact of zerotillage as a part of conservation agriculture is widely acclaimedeven under rainfed condition in addition to rice-wheat systemin an irrigated system. Besides this, a suitable genotype wouldboost productivity in the above stated conditions. Since suchinformation in chickpea especially under rainfed conditions islimited, the present study was undertaken to determine theimpact of conservation practices like tillage and mulching ondiverse chickpea genotypes in the Middle Indo-Gangetic Plainregion of central Uttar Pradesh.
MATERIALS AND METHODS
The field experiments were conducted at Indian Instituteof Pulses Research, Kanpur during rabi seasons of 2008-10to evaluate the productive performance of improved chickpeagenotypes under varied tillage practices and mulches. Thetreatments included th ree t illage pract ices (zero t illage,ploughing followed by planking, and deep ploughing (40 cmdeep) with disc plough), three mulching practices (control,
42 Journal of Food Legumes 25(1), 2012
paddy straw @ 6 t/ha at 25 DAS and cultural mulch at 25DAS) and two chickpea genotypes ‘JG 16’ and ‘KWR 108’during 2008-09. Based on the performance of mulchingpractices and chickpea genotypes, the paddy straw mulchwas dropped during 2009-10 by including two diverse growingchickpea genotypes ‘RSG 888’ and ‘DCP 92-3’ making 24treatment combinations as under: three tillage practices asabove, two mulching practices (no mulch and cultural mulch)and four genotypes viz., ‘JG 16’, ‘DCP 92-3’, ‘RSG 888’ and‘KWR 108’ . These field trials were laid out in split plot designswith three replications during both the years having tillagepractices in main plot and the combination of genotypes andmulching in the sub plot. The soil of experimental site wassandy loam (inceptisols) with low in N (215 kg/ha) and P (10.5kg/ha) and medium in K (230 kg/ha) and S (15.0 kg/ha). Apreceding crop of rice was grown with uniform package ofpractices to simulate the conditions similar to rice basedcropping systems. The ch ickpea was planted during midNovember and cultural mulching was done at 25 days aftersowing (DAS). Recommended package of practices includingseed rate, row spacing, use of fertilizers and bio-fertilizer werefollowed.
The total effective seasonal rainfall was 52 and 74.8 mmduring 2008-09 and 2009-10, respectively. The rainfall during2009-10 was well distributed coinciding with the critical stagesof g rowth and development. Soil moistu re con tent of theeffective root zone was determined thermo-gravimetrically infour depths (0-15, 15-30, 30-45 and 45-60 cm) at regular intervals(15 days) during crop growth period to study the distributionof soil water in the profile. Water use in the form of evapo-transpiration (ET) or consumptive use (CU) was computed bywater balance method using the following equation.
ET=P + I + Cp – Dp – Rf - S
= Peff + (Si-Sf)Where P is precipitation, I is depth of irrigation, Cp is
the contribution through capillary rose from the water table,Dp is deep percolation loss, Rf is runoff, S is change in soilmoisture storage in the profile, Sf is final moisture storage inthe profile at the end of an interval/harvest, Si is initial moisturestorage in the profile at the start of an interval/sowing, Peff iseffective precipitation. Effective precipitation was computedfrom daily rainfall data by FAO method (Brouwer and Heibloem1986).
Water use efficiency (WUE) was computed by dividingthe seed yield with the seasonal evapo-transpiration (ET).The statistical analysis of the data was carried out followingthe analysis o f variance as outlined by Gomez and Gomez(1984).
RESULTS AND DISCUSSION
Seasonal variation: The distribution and intensity of rainfallduring the win ter season in 2008-09 and 2009-10 varied
markedly affecting thereby the productivity of crop and alsothe effect of the treatments on chickpea genotypes. Thedistribution of rainfall was the most congenial during 2009-10since it coincided with the active branching and late floweringstages, thereby improving the productivity yet nullifying theimpact of tillage and mulching treatments. The data could notbe pooled (lack of homogeneity) due to differences in thetreatments and the differential trends observed for seed yieldduring the seasons with different rainfall pattern.Soil moisture depletion: Soil moisture depletion in the profileis normally influenced by the prevailing seasonal conditions,treatments like tillage and mulching, genotypes , fertilizerapplication and rooting behaviour of the chickpea genotypes.It was observed that since more than 90% of the concentrationof the p lant root lies in 0-60 cm so il depth, the moisturedepletion pattern was interpreted cumulatively at two soildepths (0-30 and 30-60 cm). Trend in soil moisture depletionpattern indicated that the upper two layers of soil (0-15 and15-30 cm) together contributed 45-48% of the total soil moistureextraction by the crop as against 52-55% from the deeper layers(30-45 and 45-60 cm) during 2008-09 (Table 1) whereas during2009-10 the upper soil layers contributed more water (52-60%)as compared to the lower depths in the soil profile (40-48%).Of the two years, the highest and evenly distributed rainfallof 74.8 mm received during 2009-10 might have contributed torecharge the upper soil layers in the profile thereby enhancingits contribut ion to t ranspiration or water us e by the cropcanopies and for evaporation loss from the soil s urfacelowering the share of deeper layers (30-60 cm).
In addition, the contribution of deeper layers in thesoil profile increased with the depth of tillage (Mishra andTripathi 1993). This was evident due to differential effects ofmulching and t illage t reatments. Amongs t the t illagetreatments, the highest depletion in soil moisture was recordedin zero tillage in both the depths during both the years ofstudy. Of the three mulching practices, different mulches had
Table 1: Moisture depletion pattern in soil profile as affectedby tillage, mulching and chickpea genotypes
Moisture depletion (mm) 2008-09 2009-10
Treatments
0-30 30-60 Total 0-30 30-60 Total Tillage practices Zero Tillage 27.2 29.3 56.5 49.3 32.9 82.2 Plough +Planking 21.7 25.9 47.6 44.3 28.9 73.2 Deep Ploughing 21.8 24.9 46.7 38.8 27.5 66.3 Mulching No Mulch 23.7 26.7 50.4 44.7 30.4 75.1 Paddy Straw Mulch 23.0 26.4 49.4 - - - Cultural Mulch 22.0 24.7 46.7 41.7 30.3 72.0 Genotypes JG 16 24.0 26.9 50.9 41.5 30.8 72.3 RSG 888 - - - 41.2 34.8 76.0 DCP 92-3 - - - 40.8 36.4 77.2 KWR 108 23.2 26.5 49.7 40.5 30.7 71.2

Mishra et al. : Impact of conservation practices on crop water use and productivity in chickpea under middle Indo-Gangetic plains 43
more depletion of moisture from deeper layers (30-60 cm) incomparison to surface layers (0-30 cm) during low rainfall year(2008-09) while the reverse was true for high rainfall year (2009-10). Thus, deep tillage facilitated more moisture absorptionand retention in the profile (subjecting it to more loss) whilecu ltu ral mulch might have dis rup ted the capillary watermovement to surface layers thereby reducing the water lossthrough evaporation leading to reduced moisture depletionin the soil profile.
Amongst the chickpea genotypes, ‘JG 16’ in 2008-09and ‘DCP 92-3’ in 2009-10 recorded the highest depletion fromboth the layers suggesting the fact that these genotypes areefficient in better moisture extraction under rainfed conditions.Similarly, higher moisture depletion was observed with mustard- another efficient soil moisture extractor - from deeper layersin comparison to surface layers under rainfed condit ions(Mishra and Tripathi 1993).
Consumpt ive use: Different so il moisture cons ervationpractices such as tillage and mulching affected consumptiveuse of chickpea genotypes considerably during all the yearsof study. Amongst the tillage options, the maximum values ofconsumptive use viz., 108.5 and 157 mm were recorded withzero tillage during 2008-09 and 2009-10, respectively followedby conventional tillage and deep tillage (Table 2). Similarly, nomulch recorded higher consumptive use (102.4 and 149.9 mm)than cultural and paddy straw mulch during both the years. Inthe same manner, the capillary breaks in cultural mulch andsurface cover through paddy straw mulch might have lowered
the evaporation loss and consequen t consumptive use inmulching treatments as compared to no mulch. Amongst thechickpea genotypes, the highest values of consumptive useviz., 102.9 and 152 mm were recorded in ‘JG 16’ during 2008-09and ‘RSG 888’ during 2009-10, respectively. The differentialresponse to water use by different genotypes was mainly dueto their genetic architecture associated with plant populationand canopy development during the cropping seasons.Water use efficiency: Being the division of economic yield toconsumptive use of water, it reflects the efficacy of a giventreatment in transforming the water used into economicproduce i.e. seed yield per unit water use. Amongst the threetillage practices, WUE was higher with deep tillage (18.2 kg/ha-mm) during 2008-09 while conventional tillage recordedhigher WUE (12.1 kg/ha-mm) during 2009-10 (Table 2). Theseasonal rainfall (October to March) of 74.8 mm during 2009-10 was adequate enough to recharge the upper soil profilewhich might have contributed for better development of cropplants under a situation with less water stress. This mighthave resulted in the higher seed yield in conventional tillageleading to higher WUE while conserved moisture in deep tillagefavoured for better seed yield and consequent higher WUEunder it during 2008-09. The cultural mulch recorded thehighest WUE of 19 kg/ha-mm during 2008-09 while during2009-10, mulching could not produce the desired impact onWUE due to less water stress again. It is reported that nitrogenacquisition capability (measured through SPAD chlorophyllmeter reading) at about mid pod-fill stage under drought stressconditions was related to seed yield in chickpea (Kashiwagiet al. 2010). Differential water use efficiency was also evidentamongst the chickpea genotypes. ‘JG-16’ also recorded highestwater use efficiency of 12.6 kg/ha-mm during 2009-10 whereas‘KWR 108’ during 2008-09 (19.3 kg/ha-mm).
Seed yield: Seed yield is the resultant product of coordinatedinterplay of all the growth and yield contributing characters.This is also governed by common growth and developmentfactors including both rainfall and temperature etc. Besidesthis, management factors also play a key role in final output interms of seed, grain, oil and fibre (Praharaj et al. 2011).
In the current investigation, tillage practices could notinfluence seed yield of chickpea significantly under moderatewinter rainfall situation of both the years. To the contrary, thecultural mulch produced significantly higher seed yield of1876 kg/ha during 2008-09 registering an increase of 12.7%over no mulch (control). Since the winter rains during 2009-10were adequate (74.8 mm) and well distributed coinciding withthe late flowering and initiation of pod formation stages inchickpea, it resulted in getting minimum or no crop responseto mulching practices. But under scanty rainfall situations - atypical characteristics feature of rainfed farming - culturalmulch could be advantageous in terms of conserving water.Amongst the ch ickpea genotypes, ‘JG 16’ recorded thesignificantly higher seed yield of 1858 kg/ha during 2009-10
Table 2. Seed yield, consumptive use and water use efficiencyof chickpea as affected by tillage, mulching andgenotypes
2008-09 2009-10 Treatments Seed yield
(kg/ha)
CU (mm)
WUE (kg/ha-mm)
Seed yield
(kg/ha)
CU (mm)
WUE (kg/ha-
mm) Tillage practices Zero tillage 1712 108.5 15.8 1638 157.0 10.5 Plough and Planking
1733 99.6 17.4 1791 148.0 12.1
Deep Plough (40 cm deep)
1800 98.7 18.2 1662 141.1 11.8
CD (P=0.05) NS NS Mulching No Mulch 1665 102.4 16.3 1719 149.9 11.5 Paddy Straw Mulch 1708 101.4 16.9 - - - Cultural mulch 1876 98.7 19.0 1676 146.8 11.4 CD (P=0.05) 128 - - NS - - Genotypes JG 16 1539 102.9 15.0 1858 147.1 12.6 DCP 92-3 - - - 1623 150.8 10.8 RSG 888 - - - 1593 152.0 10.5 KWR 108 1961 101.7 19.3 1716 146.0 11.7 CD (P=0.05) 65 - - 134 - -

44 Journal of Food Legumes 25(1), 2012
registering an increase of 14.5, 16.6 and 8.3 % over ‘DCP 92-3’,‘RSG 888’ and ‘KWR 108’, respectively. The second year (2009-10), being a good rainfall year, ‘JG-16’ performed optimallyover other genotypes. However, during 2008-09, ‘KWR 108’recorded 27.4% higher yield over ‘JG 16’ because of relativelybet ter adop ted to d ry land s ituation . Similar geno typicvariations in yield and its attributes in chickpea under moisturestress were reported by Kashiwagi et al. (2006) and Singh etal. (2010).
Conclusively, the conservat ion practices like zero/minimum tillage practices with mulching have definite positiveimpact on chickpea productivity in the Middle Indo-GangeticPlains, especially in the seasons having low post rainy seasonprecipitation. Amongst the chickpea genotypes, small seedand semi-spread ing genotype ‘JG 16’ proved the mostproductive and efficient water user under adequate rabi rainfallsituation whereas ‘KWR 108’ seemed to perform better underscanty rainfall situation.
REFERENCES
AICRP on Chickpea. 2011. Annual Report. Indian Institute of PulsesResearch, Kanpur - 208 024, India.
Brouwer C and Heibloem M. 1986. Irrigation water needs. Irrigationwater management Training Manual No. 3, FAO, Rome, Italy.
Chaudhury J, Mandal UK, Sharma KL, Ghosh H and Mandal B. 2005.Assessing soil quality under long-term rice-based cropping system.Communications in Soil Science and Plant Analysis 36: 1141-1161.
Davies SL,Turner NC, Palta JA, Siddique, KHM and Plummer JA. 2000.Remobilization of carbon and nitrogen supports seed filling in desiand kabuli chickpea subject to water deficit . Australian Journal ofAgricultural Research 51: 855-866.
Gomez KA and Gomez AA. 1984. Statistical procedures for agriculturalresearch. John Willey and Sons, New York.
Kashiwagi J, Krishnamurthy L, Crouch JH and Serraj R. 2006. Variabilityof root length density and its contributions to seed yield in chickpea(Cicer arietinum L.) under terminal drought stress. Field CropsResearch 95: 171-181.
Kashiwagi Junichi, Upadhyaya Hari D and Krishnamurthy L. 2010.Significance and genetic diversity of SPAD chlorophyll meter readingin chickpea germplasm in the semi-arid environments. Journal ofFood Legumes 23: 99-105.
Mishra JP and Tripathi HP. 1993. Effect of levels of nitrogen andspatial arrangements on growth, yield and quality of Indian mustardunder dryland conditions. Ph D Thesis, NDUAT, Faizabad, India.
Panwar JDS and Basu PS. 2003. Improving drought tolerance and wateruse efficiency in chickpea. In: Masood Ali, BB Singh, Shiv kumarand Vishwa Dhar (Eds), Pulses in new perspective. Indian Instituteof Pulses Research, Kanpur, India. Pp 480-488.
Praharaj CS, San karanarayanan K, Narendra Kumar, Singh KK andTripathi AK. 2011. Low-input technologies for increasing cropproductivity and sustainability. Current Advances in AgriculturalSciences 3(1): 1-12.
Singh AK, Singh SB, Singh AP, Singh AK, Mishra SK and Sharma AK.20 10. Ef fect of dif fer ent so il mo ist ure regim es on biomasspartitioning and yield of chickpea genotypes under intermediatezone of J & K. Journal of Food Legumes 23: 156-158.

Journal of Food Legumes 25(1): 45-49, 2012
Effect of molybdenum, iron and microbial inoculants on symbiotic traits, nutrientuptake and yield of chickpeaS.C. GUPTA and S. GANGWAR
All India Coordinated Research Project on Chickpea, R.A.K. College of Agriculture, Sehore - 466 001, MadhyaPradesh, India; E-Mail: [email protected](Received:October 11, 2011: Accepted: February 28, 2012)
ABSTRACT
A field experiment was conducted during rabi 2007-08 and 2008-09 in a medium black soil to study the effect of molybdenumand iron in combination with Rhizobium and PSB inoculationon ‘JG-130’ varie ty of chickpe a (Cicer arieti num L.). Ei ghttre atment combinations comprisi ng re comme nded dose offe rti liz ers (RDF as control ), RDF+Rhizobium+Phosphatesolubilizing bacteria (PSB), RDF+Rhizobium+PSB+0.5 and 1kg ammonium molybdate (AM) per hectare as soil application,RDF+ Rhizobi um+PSB+0.5 and 1.0 g AM/kg see d as se edtreatment, RDF+Rhizobium+PSB+1.0 g FeSO4+0.5 and 1.0 gAM/kg of seed as seed treatment were tried in RBD with threereplications. Application of AM either as soil application orthrough seed treatment in combination with Rhizobium + PSB+ RDF significantly increased number and dry weight of nodule,branch/plant, plant height, fl owers and pods/plant, N and Puptake, chlorophyll content in leaves and protein content inchickpea over control (RDF alone). Soil application of 1.0 kgAM/ha along with Rhizobium+PSB+RDF and seed treatmentwith 1.0 g AM/kg seed along with Rhizobium+PSB+RDF alsoincreased the grain yield by 39.9 and 32.4% respectively overRDF alone (1253 kg/ha); and both of these treatments on AMwere statistically on par. However, seed treatment of 1.0 g AMalong wi th Rhizobium+PSB+RDF was found to be highlyremunerative and viable as compared to others.
Key words: Chlorop hyll content, Iron, M oly bdenum, PSB,Rhizobium, Seed inoculation, Soil application
Chickpea (Cicer arietinum L.) is the most importantrabi (winter) season food legume crop in India occupying7.89 m ha area with an annual production of 7.06 m tonnes andproductivity of 895 kg/ha. The state of Madhya Pradesh isthe largest producer of chickpea covering 2.84 m ha area witha production of 2.79 m tonnes and productivity of 981 kg/ha(Agriculture Statistics 2009). Chickpea yield is usually low inM.P. as it is mostly grown under rainfed conditions constrainedwith imbalance use of fertilizers, limited seed inoculation withRhizobium and phosphorous solubilizing bacteria (Sharmaand Gupta 2005), insect pests attack and wilt susceptibility. Inaddition, due to intensive cultivation of soybean and chickpeain vert iso ls o f M.P., deficiencies in some of es sent ialmicronutrients are also affecting its productivity. Being alegume, ch ickpea is capable o f biological N fixation (BNF)through Rhizobium bacteria. Nodule rhizobia can fix nitrogen
effectively only if the plant is adequately supplied with all themineral elements essential for active growth. In this context,micronutrients like Mo, Fe, P, Zn and Co can play an importantro le (Subba Rao 1977). Hence s upp lementat ion o fmicronutrients with Mo and Fe along with Rhizobium + PSBinoculation in chickpea may also increase BNF, N assimilationand P availability in this crop res ulting in enhancing itsproductivity. Keeping above in view, the present investigationwas undertaken to assess the effect of Mo and Fe along withRhizobium+PSB inoculat ion under normal fertilization ongrowth, nutrient uptake and yield of chickpea in a black soils(vertisol) having low Mo.
MATERIALS AND METHODS
A field experiment was conducted under AICRP onChickpea at RAK College of Agriculture, Sehore, M.P during2007-08 and 2008-09 to study the effect of molybdenum andiron along with Rhizobium and PSB inoculation on chickpea‘JG 130’ in a medium black soil. The soil of the experimentalfield was having pH 7.7, EC 0.15 dS/m, and OC 0.38% withavailable N, P and K as 180, 13.5 and 438 kg/ha, respectively.As regards micronutrients, the soil was sufficient in extractableZn (0.8 ppm), Cu (4.28 ppm), Fe (75 ppm) and Mn (519 ppm)while it was below critical limit in extractable Mo (< 0.016 ppm).The experiment was carried out in thrice replicated randomizedblock design (RBD) with eight treatments viz., control (RDF@20 Kg N+50 Kg P2O5+20 Kg K2O+20 Kg S/ha),Rhizobium+PSB (as seed treatment)+RDF, 0.5 kg AM/ha assoil application +Rhizobium+PSB+RDF, 1.0 kg AM/ha as soilapplication+Rhizobium+PSB+RDF, 0.5 g AM/kg seed as seedtreatment+Rhizobium+PSB+RDF, 1.0 g AM/kg seed as seedtreatment+ Rhizobium+PSB+RDF, 0.5 g AM+1.0 g FeSO4/kgseed as seed t reatment+Rhizobium+PSB+RDF and 1.0 gAM+1.0 g FeSO4/kg seed as seed treatment + Rhizobium +PSB + RDF. Chickpea was sown with one pre-plant irrigation(palewa). Observations on symbiotic traits viz., nodule numberand its dry weight and total plant dry weight at 45 DAS,flowers/plant at 60 DAS, branches, plant height and pods/plant at maturity and grain yield at harvest were recorded. SoilN, P, K and other relevant characters were determined asdescribed by Jackson 1973. Extractable micronutrients in soilwere determined by acid ammonium acetate+EDTA (Lakanenand Ervio 1971) by using Inductively Coupled Plasma Atomic
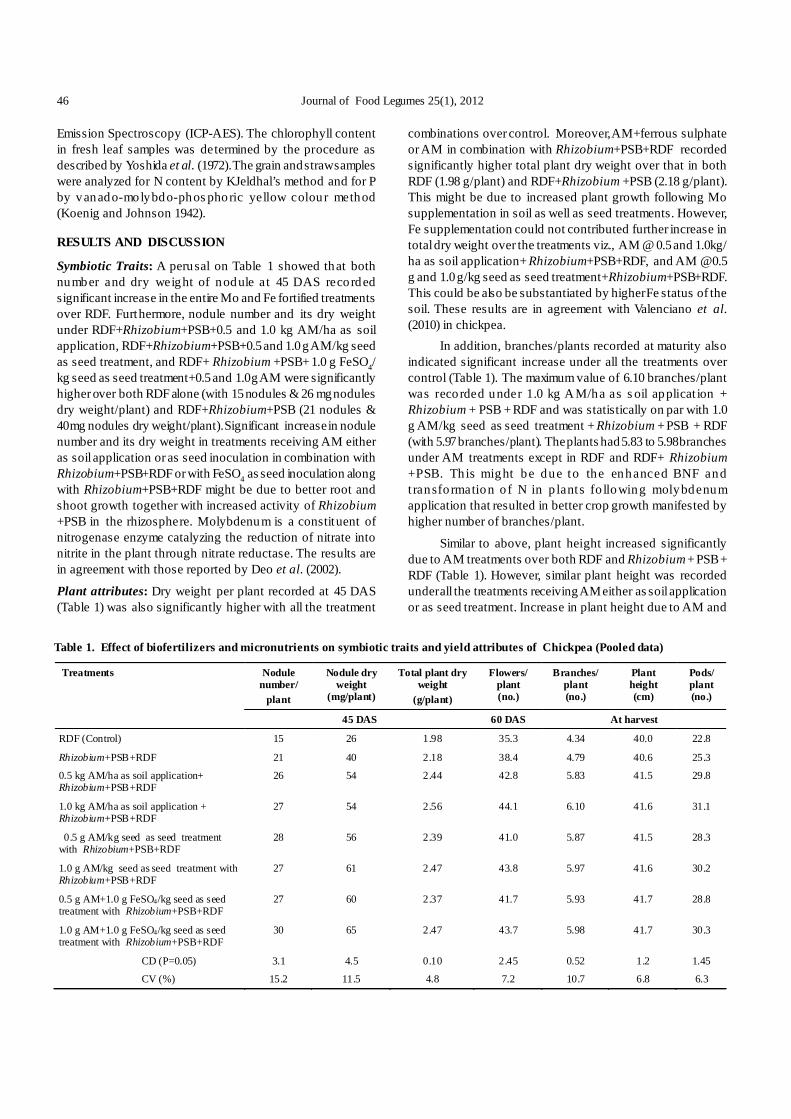
46 Journal of Food Legumes 25(1), 2012
Emission Spectroscopy (ICP-AES). The chlorophyll contentin fresh leaf samples was determined by the procedure asdescribed by Yoshida et al. (1972). The grain and straw sampleswere analyzed for N content by KJeldhal’s method and for Pby vanado-molybdo-phos phoric yellow colour method(Koenig and Johnson 1942).
RESULTS AND DISCUSSION
Symbiotic Traits: A perusal on Table 1 showed that bothnumber and dry weight of nodule at 45 DAS recordedsignificant increase in the entire Mo and Fe fortified treatmentsover RDF. Furthermore, nodule number and its dry weightunder RDF+Rhizobium+PSB+0.5 and 1.0 kg AM/ha as soilapplication, RDF+Rhizobium+PSB+0.5 and 1.0 g AM/kg seedas seed treatment, and RDF+ Rhizobium +PSB+ 1.0 g FeSO4/kg seed as seed treatment+0.5 and 1.0 g AM were significantlyhigher over both RDF alone (with 15 nodules & 26 mg nodulesdry weight/plant) and RDF+Rhizobium+PSB (21 nodules &40 mg nodules dry weight/plant). Significant increase in nodulenumber and its dry weight in treatments receiving AM eitheras soil application or as seed inoculation in combination withRhizobium+PSB+RDF or with FeSO4 as seed inoculation alongwith Rhizobium+PSB+RDF might be due to better root andshoot growth together with increased activity of Rhizobium+PSB in the rhizosphere. Molybdenum is a constituent ofnitrogenase enzyme catalyzing the reduction of nitrate intonitrite in the plant through nitrate reductase. The results arein agreement with those reported by Deo et al. (2002).
Plant attributes: Dry weight per plant recorded at 45 DAS(Table 1) was also significantly higher with all the treatment
combinations over control. Moreover, AM+ferrous sulphateor AM in combination with Rhizobium+PSB+RDF recordedsignificantly higher total plant dry weight over that in bothRDF (1.98 g/plant) and RDF+Rhizobium +PSB (2.18 g/plant).This might be due to increased plant growth following Mosupplementation in soil as well as seed treatments. However,Fe supplementation could not contributed further increase intotal dry weight over the treatments viz., AM @ 0.5 and 1.0kg/ha as soil application+ Rhizobium+PSB+RDF, and AM @0.5g and 1.0 g/kg seed as seed treatment+Rhizobium+PSB+RDF.This could be also be substantiated by higher Fe status of thesoil. These results are in agreement with Valenciano et al.(2010) in chickpea.
In addition, branches/plants recorded at maturity alsoindicated significant increase under all the treatments overcontrol (Table 1). The maximum value of 6.10 branches/plantwas recorded under 1.0 kg AM/ha as s oil applicat ion +Rhizobium + PSB + RDF and was statistically on par with 1.0g AM/kg seed as seed treatment + Rhizobium + PSB + RDF(with 5.97 branches/plant). The plants had 5.83 to 5.98 branchesunder AM treatments except in RDF and RDF+ Rhizobium+PSB. Th is might be due to the enhanced BNF andtransformation o f N in p lants fo llowing molybdenumapplication that resulted in better crop growth manifested byhigher number of branches/plant.
Similar to above, plant height increased significantlydue to AM treatments over both RDF and Rhizobium + PSB +RDF (Table 1). However, similar plant height was recordedunder all the treatments receiving AM either as soil applicationor as seed treatment. Increase in plant height due to AM and
Table 1. Effect of biofertilizers and micronutrients on symbiotic traits and yield attributes of Chickpea (Pooled data)
Nodule number/
plant
Nodule dry weight
(mg/plant)
Total plant dry weight
(g/plant)
Flowers/ plant (no.)
Branches/ plant (no.)
Plant height (cm)
Pods/ plant (no.)
Treatments
45 DAS 60 DAS At harvest
RDF (Control) 15 26 1.98 35.3 4.34 40.0 22.8
Rhizobium+PSB+RDF 21 40 2.18 38.4 4.79 40.6 25.3
0.5 kg AM/ha as soil application+ Rhizobium+PSB+RDF
26 54 2.44 42.8 5.83 41.5 29.8
1.0 kg AM/ha as soil application + Rhizobium+PSB+RDF
27 54 2.56 44.1 6.10 41.6 31.1
0.5 g AM/kg seed as seed treatment with Rhizobium+PSB+RDF
28 56 2.39 41.0 5.87 41.5 28.3
1.0 g AM/kg seed as seed treatment with Rhizobium+PSB+RDF
27 61 2.47 43.8 5.97 41.6 30.2
0.5 g AM+1.0 g FeSO4/kg seed as seed treatment with Rhizobium+PSB+RDF
27 60 2.37 41.7 5.93 41.7 28.8
1.0 g AM+1.0 g FeSO4/kg seed as seed treatment with Rhizobium+PSB+RDF
30 65 2.47 43.7 5.98 41.7 30.3
CD (P=0.05) 3.1 4.5 0.10 2.45 0.52 1.2 1.45
CV (%) 15.2 11.5 4.8 7.2 10.7 6.8 6.3

Gupta and Gangwar : Effect of molybdenum, iron and microbial inoculants on symbiotic traits 47
AM+ferrous su lphate app licat ion in combination withRhizobium+PSB+RDF in fortified treatments might be due toenhanced nodulat ion, BNF, ch lo rophyll con ten t ,photosynthesis and protein metabolism that resulted in bettergrowth of taller plants under these treatments. These findingsare in agreement with Shil et al. (2007) and Kanter (2003).
With regard to flower production, highest number offlowers/p lan t was recorded under 1.0 kg AM/ha as so ilapplication+Rhizobium+PSB+RDF followed by 1.0 g AM/kgseed as seed treatment with Rhizobium+PSB+RDF. Howeverboth these treatments were at par indicating similar effects ofboth soil and seed application of AM on flower production.Ahlawat et al. (2007) also stated that in Mo-deficient soil,both size and number of flower production/plant in chickpeawere reduced.
Yield attributes: Similar to flower production, significantlyhigher pods/plant were recorded under all the treatments than
in RDF (Table 1). Moreover, the treatments viz., 0.5 and 1.0 kg/ha AM as soil application + Rhizobium + PSB + RDF, 0.5 and1.0 g AM/kg seed as seed treatment with Rhizobium + PSB +RDF and 0.5 and 1.0 g AM+1.0 g FeSO4/kg seed as s eedtreatment with Rhizobium+PSB+RDF produced significantlyh igher pods/p lant over that in RDF+ Rhizobium+PSBinocu lat ion. Here bo th s o il and s eed applicat ion o fmolybdenum in presence of Rhizobium + PSB + RDF wasequally effective. Enhanced BNF and nitrogen metabolismcoupled with better P utilization resulted in favorable effecton pods/plant in all the treatments receiving molybdenum(Ali and Mishra 2001). These findings were in agreement withShil et al. (2007) for calcareous soils.
N and P Uptake: Nitrogen and Phosphorous uptake by plantssignificantly increased with AM application (Table 2) and themaximum uptake (77.8 kg N and 5.15 kg P/ha) was analyzedunder 1.0 kg AM/ha as soil application+Rhizobium+PSB+RDF
Table 2. Effect of biofertilizers and micronutrients on N, P uptake and protein content in seed (Pooled data)
Treatments N uptake (Kg/ha)
P uptake (Kg/ha)
Protein content (%)
RDF (Control) 51.8 3.12 20.41 Rhizobium+PSB+RDF 58.0 3.63 20.74 0.5 kg AM/ha as soil application+ Rhizobium+PSB+RDF 71.5 4.61 22.10 1.0 kg AM/ha as soil application + Rhizobium+PSB+RDF 77.8 5.15 22.73 0.5 g AM/kg seed as seed treatment with Rhizobium+PSB+RDF 66.0 4.15 21.85 1.0 g AM/kg seed as seed treatment with Rhizobium+PSB+RDF 72.5 4.51 22.40 0.5 g AM+1.0 g FeSO4/kg seed as seed treatment with Rhizobium+PSB+RDF 68.0 4.46 21.99 1.0 g AM+1.0 g FeSO4/kg seed as seed treatment with Rhizobium+PSB+RDF 73.7 3.83 22.29 CD (P=0.05) 2.50 0.23 0.35 CV (%) 5.70 7.20 11.7
Table 3. Effect of biofertilizers and micronutrients on seed yield and economics of chickpea
Economic viability Treatments Seed yield (kg/ha)
% increase in yield Additional cost
over control (Rs) Additional net return
over control (Rs) 2007-08 2008-09 Mean RDF (Control) 1520 985 1253 - - - Rhizobium+PSB+RDF 1645 1127 1386 10.6 50 2344 0.5 kg AM/ha as soil application+ Rhizobium+PSB+RDF
1890 1390 1640 30.9 1050 5946
1.0 kg AM/ha as soil application + Rhizobium+PSB+RDF
2003 1503 1753 39.9 2050 6950
0.5 g AM/kg seed as seed treatment with Rhizobium+PSB+RDF
1820 1247 1534 22.4 130 4928
1.0 g AM/kg seed as seed treatment with Rhizobium+PSB+RDF
1945 1373 1659 32.4 210 7098
0.5 g AM+1.0 g FeSO4/kg seed as seed treatment with Rhizobium+PSB+RDF
1900 1263 1582 26.3 146 5776
1.0 g AM+1.0 g FeSO4/kg seed as seed treatment with Rhizobium+PSB+RDF
1980 1387 1684 34.4 226 7532
CD (P=0.05) 114 120 114 - - - CV (%) 8.0 11.3 9.8 - - -
Cost of inputs: Ammonium molybdate commercial grade @Rs. 2000/Kg, Rhizobium & PSB @ Rs.50/ha, FeSO4@ Rs.200/kg; Cost of Produce:
chickpea seed @Rs.18/kg.
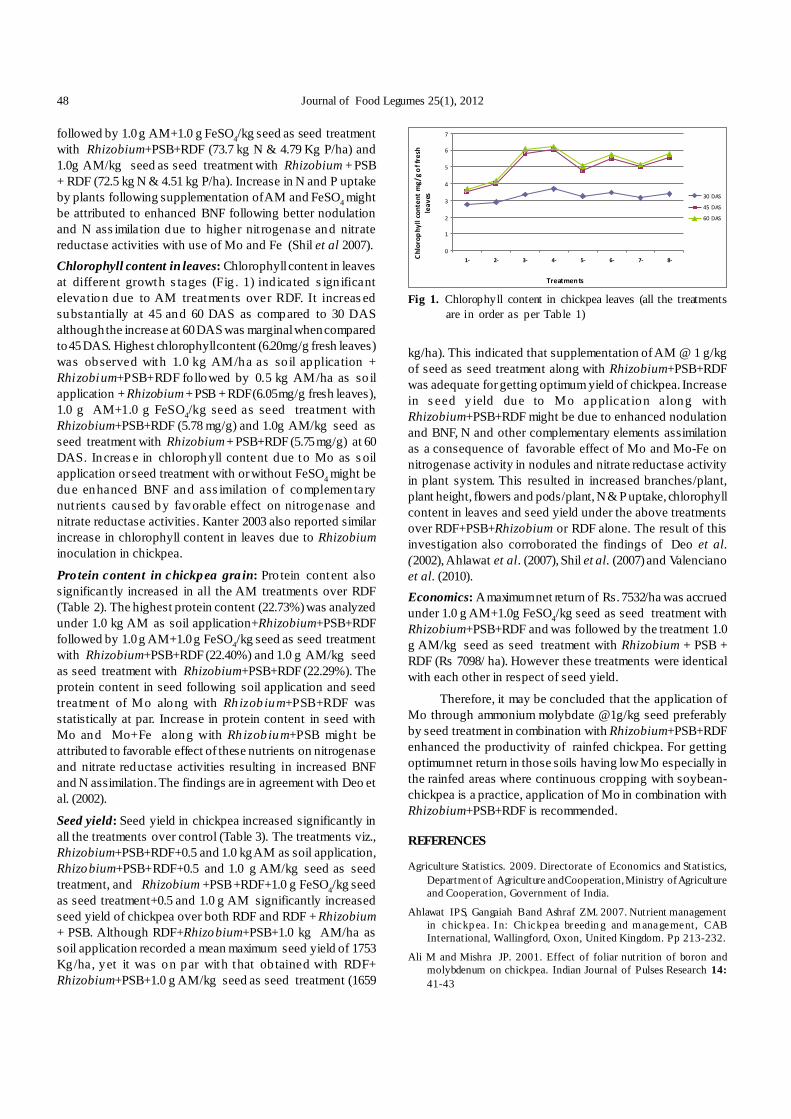
48 Journal of Food Legumes 25(1), 2012
followed by 1.0 g AM+1.0 g FeSO4/kg seed as seed treatmentwith Rhizobium+PSB+RDF (73.7 kg N & 4.79 Kg P/ha) and1.0g AM/kg seed as seed treatment with Rhizobium + PSB+ RDF (72.5 kg N & 4.51 kg P/ha). Increase in N and P uptakeby plants following supplementation of AM and FeSO4 mightbe attributed to enhanced BNF following better nodulationand N ass imilation due to higher nit rogenase and nitratereductase activities with use of Mo and Fe (Shil et al 2007).Chlorophyll content in leaves: Chlorophyll content in leavesat different growth s tages (Fig . 1) ind icated s ign ificantelevation due to AM treatments over RDF. It increas edsubstantially at 45 and 60 DAS as compared to 30 DASalthough the increase at 60 DAS was marginal when comparedto 45 DAS. Highest chlorophyll content (6.20mg/g fresh leaves)was observed with 1.0 kg AM/ha as so il application +Rhizobium+PSB+RDF fo llowed by 0.5 kg AM/ha as so ilapplication + Rhizobium + PSB + RDF (6.05 mg/g fresh leaves),1.0 g AM+1.0 g FeSO4/kg seed as seed treatment withRhizobium+PSB+RDF (5.78 mg/g) and 1.0g AM/kg seed asseed treatment with Rhizobium + PSB+RDF (5.75 mg/g) at 60DAS. Increas e in chlorophyll content due to Mo as s oilapplication or seed treatment with or without FeSO4 might bedue enhanced BNF and ass imilation o f complementarynutrients caused by favorable effect on nitrogenase andnitrate reductase activities. Kanter 2003 also reported similarincrease in chlorophyll content in leaves due to Rhizobiuminoculation in chickpea.
Protein content in chickpea gra in: Pro tein content alsosignifican tly increased in all the AM treatments over RDF(Table 2). The highest protein content (22.73%) was analyzedunder 1.0 kg AM as soil application+Rhizobium+PSB+RDFfollowed by 1.0 g AM+1.0 g FeSO4/kg seed as seed treatmentwith Rhizobium+PSB+RDF (22.40%) and 1.0 g AM/kg seedas seed treatment with Rhizobium+PSB+RDF (22.29%). Theprotein content in seed following soil application and seedtreatment of Mo along with Rhizob ium+PSB+RDF wasstatistically at par. Increase in protein content in seed withMo and Mo+Fe along with Rhizob ium+PSB migh t beattributed to favorable effect of these nutrients on nitrogenaseand nitrate reductase activities resulting in increased BNFand N assimilation. The findings are in agreement with Deo etal. (2002).
Seed yield: Seed yield in chickpea increased significantly inall the treatments over control (Table 3). The treatments viz.,Rhizobium+PSB+RDF+0.5 and 1.0 kg AM as soil application,Rhizobium+PSB+RDF+0.5 and 1.0 g AM/kg seed as seedtreatment, and Rhizobium +PSB +RDF+1.0 g FeSO4/kg seedas seed treatment+0.5 and 1.0 g AM significantly increasedseed yield of chickpea over both RDF and RDF + Rhizobium+ PSB. Although RDF+Rhizobium+PSB+1.0 kg AM/ha assoil application recorded a mean maximum seed yield of 1753Kg/ha, yet it was on par with that ob tained with RDF+Rhizobium+PSB+1.0 g AM/kg seed as seed treatment (1659
0
1
2
3
4
5
6
7
1- 2- 3- 4- 5- 6- 7- 8-
Treatmen ts
Chl
orop
hyll
cont
ent
mg/
g o
f fre
sh
leav
es 30 DAS
45 DAS
60 DAS
Fig 1. Chlorophyll content in chickpea leaves (all the treatmentsare in order as per Table 1)
kg/ha). This indicated that supplementation of AM @ 1 g/kgof seed as seed treatment along with Rhizobium+PSB+RDFwas adequate for getting optimum yield of chickpea. Increasein s eed y ield due to Mo applicat ion along withRhizobium+PSB+RDF might be due to enhanced nodulationand BNF, N and other complementary elements assimilationas a consequence of favorable effect of Mo and Mo-Fe onnitrogenase activity in nodules and nitrate reductase activityin plant system. This resulted in increased branches/plant,plant height, flowers and pods/plant, N & P uptake, chlorophyllcontent in leaves and seed yield under the above treatmentsover RDF+PSB+Rhizobium or RDF alone. The result of thisinvestigation also corroborated the findings of Deo et al.(2002), Ahlawat et al. (2007), Shil et al. (2007) and Valencianoet al. (2010).Economics: A maximum net return of Rs. 7532/ha was accruedunder 1.0 g AM+1.0g FeSO4/kg seed as seed treatment withRhizobium+PSB+RDF and was followed by the treatment 1.0g AM/kg seed as seed treatment with Rhizobium + PSB +RDF (Rs 7098/ ha). However these treatments were identicalwith each other in respect of seed yield.
Therefore, it may be concluded that the application ofMo through ammonium molybdate @1g/kg seed preferablyby seed treatment in combination with Rhizobium+PSB+RDFenhanced the productivity of rainfed chickpea. For gettingoptimum net return in those soils having low Mo especially inthe rainfed areas where continuous cropping with soybean-chickpea is a practice, application of Mo in combination withRhizobium+PSB+RDF is recommended.
REFERENCES
Agriculture Statistics. 2009. Directorate of Economics and Statistics,Department of Agriculture and Cooperation, Ministry of Agricultureand Cooperation, Government of India.
Ahlawat IPS, Gangaiah B and Ashraf ZM. 2007. Nutrient managementin chickp ea. In: Ch ickp ea breedin g and m anagement, CABInternational, Wallingford, Oxon, United Kingdom. Pp 213-232.
Ali M and Mishra JP. 2001. Effect of foliar nutrition of boron andmolybdenum on chickpea. Indian Journal of Pulses Research 14:41-43

Gupta and Gangwar : Effect of molybdenum, iron and microbial inoculants on symbiotic traits 49
Deo C, Kothari ML and Kalra YP. 2002. Effect of modes and levels ofmolybden um application on grain yield, protein con tent andnodulation of chickpea grown on sandy loam soil. Soil Science andPlant Analysis 33: 2905-2915.
Jackson ML. 1973. Soil Chemical Analysis. Printice Hall of India PrivateLimited, New Delhi.
Kanter F, Elkoca HO and Adgur OF. 2003. Chickpea yield in relationto Rhizobium inoculation from wild chickpea at high altitudes.Journal of Agronomy and Crop Science 189: 291-297.
Koenig RA and Johnson CR. 1942. Colorimetric determin ation ofbiological material. Industrial and Engineering Chemistry 14: 155-164.
Lakanen Esko and Ervio R. 1971. A comparison of eight extractantsfor the determination of plant available micronutrients in soils.Acta Agrculturae Scandinavica (Soil and Plant Science) 123: 223-232.
Sharma HO and Gupta SC. 2005. Pace of growt h and prospectsof bio-fert ilizer consum ption in different agro climatic zonesof M.P. Indian Journ al of Pure and Applied Biology 20: 19 7-204.
Shil NC, Noor S and Hossain MA. 2007. Effect of boron and molybdenumon t he yield o f ch ick pea. Jo urnal o f Agr iculture and RuralDevelopment 5:17-24.
Subba Rao NS. 1977. Soil Microorganism and Plant Growth, Oxford &IBH publishing Company, New Delhi. 96 Pp.
Valenciano JB, Boto JA and Marcelo V. 2010. Response of chickpea(Cicer a rietinu m L .) yield t o z in c, boron an d molybden umapplication under pot conditions. Spanish Journal of AgriculturalResearch 8: 797-807.
Yoshida S, Forno DA, Loc JH and Gomez KA.1972. Laboratory manualof physiological studies of rice. IRRI, Philippines. 30 Pp.

Journal of Food Legumes 25(1): 50-53, 2012
ABSTRACT
A field experiment comprising sixteen mungbean [Vigna radiata(L.) Wilczek] genotypes was conducted during two successiveyears (2007 and 2008) to study the relationship between leafare a and photosynthetic rates along with the correlati onsbetween phenological days, total dry matter buildup and leafangle. Crop was monitored for various phenological traits, viz.,days to flowering, days to podding, dry matter accumulation,leaf area, leaf angle and photosynthetic rate at flowering andpodding stages. It was observed that leaf area had negativedirect effect as well as significant negative correlation withphotosynthetic rate. Leaf angle had positive direct effects (0.72and 0.49) as we ll as si gnificant pos itive correl ations withphotosynthetic rate (0.82** and 0.49**) at both flowering andpodding stages.
Key words: Dry matter accumulat ion, Leaf angle, Leaf area,Mungbean, Phenological days, Photosynthetic rate
Differences in CO2 exchange rate (CER) amonggenotypes have been shown for several crop species andhave compared to d ifferences in various leaf anatomical,physiological, and biochemical characteristics. In some casesclose correlations have been observed and in others therewere no correlation. Specific leaf weight (SLW) is one leafcharacteristic most often positively correlated with CER (Yu-Long 2008) but in some studies the two were not related. Ithas been reported that photosynthetic rates are determinedto some extent by sink growth rates in relation to leaf area(Gifford and Evans 1973, Medlyn et al. 2002, del-Campo et al.2002) and inverse relationship between leaf area and maximumphotosynthetic rates among alfalfa (Turnbull et al. 2002) ispartly due to inverse relationship between specific leaf weightand leaf area. Leaf thickness, a major component of SLW, waspositively correlated with CER in Helianthus tuberosus(Koyama and Kikuzawa 2009) and in plants with heterobaricleaves (Nikolopoulos et al. 2002), but in deciduous woodyplants grown in sun and shade, leaf thickness was negativelycorrelated with CER (McMillen and McClendon 1983, Koikeet al. 2004). This negative correlation may have been causedby diversity of species or as a function of different leaf traitsand leaf nitrogen status as suggested by Shipley et al. (2005).Several studies have indicated that leaf CER based on areawas inversely related to leaf s ize (Rehman et al . 2000).Comparisons of diploid wheat (Triticum, Aegilops) specieswith modern tetraplo id and hexaploid cultivars show thatduring evolution of wheat, leaves have become larger, but
Photosynthetic rates of mungbean leaves as affected by morphological leaf traitsVIJAYLAXMI and A. BHATTACHARYA
Indian Institute of Pulses Research, Kanpur – 208 024, Uttar Pradesh, India; E-mail: [email protected]
(Received: August 03, 2011; Accepted: December 23, 2011)
CER on a leaf area basis has decreased. Significant negativecorrelations have been observed between CER and leaf areain genotype comparisons of alfalfa, soybean, and rice.
The present study was initiated with an objective tostudy the relationship between leaf area and photosyntheticrates across the genotypes of mungbean. The outcome ofthis study would help the plant breeder to tailor mungbeanplants with higher photosynthetic efficiency and yield.
MATERIALS AND METHODS
Sixteen genotypes of mungbean [Vigna radiata (L.)Wilczek] viz., ‘PDM 11’, ‘PDM 54’, ‘PDM 139’, ‘IPM 03-1’,‘IPM 99-125’, ‘Asha’, ‘Narendra Mung-1’, ‘K 851’, ‘HUM 1’,‘MUM 2’, ‘ML 729’, ‘Pusa Vishal’, ‘Pant M-4’, ‘SML 668’,‘IPM 99-4’, and ‘V 3518’ were planted in 2nd week of July, 2007and 2008 in field under irrigated condition at the research farmarea of Indian Institute of Pulses Research, Kanpur (260 24’15”N, 800 24’ 36” E at an altitude of 126 m above mean sea level).The soil of the experimental site was Inceptisol having lowavailable nitrogen (150 kg N/ha) medium available phosphorus(22 kg P2O5/ha) and medium in available potassium (180 kgK2O/ha). Plantings were done following randomized completeblock design (RCBD) with three replications. The crop wasplan ted in well t ilth so il with a basal fertilizer dose of di-ammonium phosphate @ 100kg per hectare. Each entry wassown in 5m rows with row to row and plant to plant distancesat 30 cm and 10 cm, respectively. Proper plant protectionmeasures were adop ted as and when required. Crop wasmonito red fo r various pheno log ical t rait s , d ry mat teraccumulation and leaf area at two growth stages, viz., floweringand podding. Leaf angle of ten leaves per treatment wasrecorded at noon time on the first fully expanded leaves atflowering. Photosynthetic rates of the genotypes in eachreplication were observed at flowering and at podding withthe help o f In fra Red Gas Analyzer (IRGA). For betterunderstanding, mungbean genotypes were grouped as perthe rates of photosynthesis at flowering stage as follows:
Less than 15 mg CO2/cm2/sec: ‘Pusa Vishal’, ‘IPM 99-125’,‘Asha’ and ‘Pant M-4’.
Between 15-25 mg CO2/cm2/s ec: ‘PDM 139’, ‘NarendraMung-1’, ‘MUM 2’, ‘IPM 03-1 and ‘ML 729’.
More than 25 mg CO2/cm2/sec: ‘PDM 54’, ‘PDM 11’, ‘SML668’, ‘K 851’, ‘HUM 1’, ‘IPM 99-4’ and ‘V 3518’.

Vijaylaxmi and Bhattacharya : Photosynthetic rates of mungbean leaves as affected by morphological leaf traits 51
Each and every trait under study was expressed as themean of genotypes in any particular photosynthetic group.Data of 2007 and 2008 were tested for their homogeneity, werepooled over years, and were subjected to standard statisticalprocedures for test of significance. Mean, critical differences(CD) and per cent coefficient of variation (CV) were workedout in accordance with Snedecor and Cochran (1978).Correlation of pho tosynthetic rate with o ther t rait s wasestimated as per Snedecor and Cochran (1978) and was furtherpartitioned for their respective direct and indirect effects usingpath analysis in accordance with Dewey and Lu (1959).
RESULTS AND DISCUSSION
Days to flowering and podding in different groups ofmungbean genotypes failed to express any s ignificantdifferences (Tab le 1). These non-s ign ificant differencesamongst the groups could be attributed to the fact that forintensive agricu lture p lant b reeders s elect only thos egenotypes which have lower maturity period so that theycould fit well in cropping system(s) along with higher seedyield. However, significantly lower maturity period in one ofthe groups can easily be taken for the same efforts by plantbreeder(s).
that around 73% variability in photosynthetic rate could beexplained by the variability of leaf angle in mungbean.
When the correlat ion o f photosynthetic rates (atflowering and podding stages) with different leaf traits werefurther partitioned into direct and indirect effects (Table 3), itwas revealed that leaf angle had the highest magnitude ofpositive correlation as well as d irect effects on rate ofphotosynthesis both at flowering and podding stages. Daysto flowering and /or days to podding exh ibited the leastmagnitude of direct as well indirect effects on photosyntheticrate. However, days to podding expres s ed s ign ifican tcorrelat ion with photos ynthetic rate. To tal dry mat teraccumulat ion in plant both at flowering and at poddingexpressed negative and relatively substantial direct effect forphotosynthetic rate. The residual correlation was estimated
Leaf characteristics such as leaf area and leaf angle,observed at flowering and podding stages (Table 2) showedsignificant differences amongst groups as well as genotypes.Leaf area was observed to be lowest at pre-flowering period,but it increased steadily during post flowering periods of allthe g roups o f geno types. In terest ingly, amongs tphotos ynthetic g roups of mungbean geno types, leaf areadecreased with the increase in photosynthetic rates. However,contrary to leaf area, leaf angle seemed to have an increasingtrend along with increase in photosynthetic rates. To get aclear relat ionsh ip between leaf area and leaf angle withphotosyn thet ic rate, regress ion graphs were plo tted forphotosynthetic rates against leaf area and leaf angels (Fig. 1–3). From the relationsh ips between leaf area andphotosynthetic rates at flowering and at podding (Fig.1 & 2),it was clear that more than 60% of the variab ility inphotosynthetic rates could be explained by variations in leafarea. Although leaf area expressed a negative relationshipwith photosynthetic rates, but leaf angle established a positiverelationship (Fig. 3). The R2 value was 72.9%, which implied
Table 2. Changes in different physiological traits in genotypicgroups of mungbean at different crop growth stages
*, **: Significant at P=0.05 and 0.01, respectively
Groups of genotypes At flowering At podding
Leaf area (dm2/plant)
<15 mg 8.11 ± 0.26 8.75 ± 0.92
15-25 mg 7.24 ± 0.21 8.19 ± 0.52
>25 mg 5.93 ± 0.22 7.10 ± 0.80
Mean 6.89 7.85
CD (P=0.05) 0.99** 2.90**
CV (%) 8.98 23.0
Leaf angle (o) at flowering
<15 mg 67.6 ± 1.16 ----------------
15-25 mg 72.4 ± 0.27 ----------------
>25 mg 77.8 ± 0.78 ----------------
Mean 73.57 ----------------
CD (P=0.05) 2.29** ----------------
CV (%) 1.94 ----------------
Total dry matter (g/plant)
<15 mg 6.12 ± 0.11 11.52 ± 0.48
15-25 mg 5.24 ± 0.14 10.79 ± 0.27
>25 mg 4.72 ± 0.22 9.66 ± 0.62
Mean 5.23 10.48
CD (P=0.05) 4.16 1.33**
CV (%) 4.96 7.91
Photosynthetic rate
<15 mg 13.57 ± 0.62 11.15 ± 1.15
15-25 mg 22.80 ± 0.80 12.78 ± 0.38
>25 mg 31.23 ± 0.52 16.36 ± 1.02
Mean 24.18 13.94
CD (P=0.05) 3.81** 1.77**
CV (%) 9.86 7.92
Table 1. Changes in phenological days in genotypic groupsof mungbean
Genotypes Flowering Podding Maturity
<15 mg 37.75 ± 1.31 41.67 ± 0.96 70.25 ± 2.09
15-25 mg 37.33 ± 1.18 42.67 ± 0.58 65.67 ± 1.68
> 25 mg 37.29 ± 1.00 44.29 ± 0.56 71.46 ± 1.76 Mean 37.42 43.13 69.33
CD (P=0.05) 2.35 1.83 4.35**
CV (%) 3.92 2.65 3.92

52 Journal of Food Legumes 25(1), 2012
to be 0.30 and 0.22, respectively at flowering and poddingstages, respectively.
The existence of significant variation in photosyntheticrates amongst the mungbean genotypes was in confirmationto earlier reports in chickpea (Bhattacharya and Singh 1999).The capacity of photosynthesis depends on light intensity. Ithas been shown that leaf metabolism can adapt to differentlight intensities according to the position in the canopy (Evans1993). It has been pointed out that the canopy structure isimportant once the leaf area index exceed 3.0 (Sakamoto andMatsouka 2004). In the present study photosynthetic ratehad shown positive relationship with leaf angle, but earlierstudies have pointed out those high yielding genotypes ofmaize, rice and wheat have erect leaf canopy (Sharma-Natu
and Ghildiyal 2005). Lower leaf angle always result in lowsimulation. Work in rice suggests that the benefits of veryerect leaf angle in high-radiation environment could only berealized at leaf area indices over 8 (Van Keulen 1976). It hasalso reported that reducing the leaf angle from 900 in Accaciacrassicarpa increased ligh t intercep tion and decreas edphotosynthetic activity Liu et al. (2003). It may, however, bementioned that leaf area index beyond the critical value, leafarea index at which the canopy first reached maximum cropgrowth rate, would be detrimental for a grain crop, because itmeans that sugars that could have been used to make grainare instead being used to keep useless leaves alive. Negativerelationship between leaf area and photosynthetic rate has
Table 3. Estimates of total correlation, direct and indirecteffects of different leaf traits with photosyntheticrates at flowering and podding in mungbean.
1 2 3 4 Correlation At flowering 1 -0.048 -0.001 -0.002 -0.132 -0.183 2 -0.001 -0.027 0.003 0.175 0.150 3 -0.001 0.001 -0.175 -0.395 -0.570** 4 0.009 -0.007 0.096 0.723 0.820** Residual effect = 0.30 At podding 1 0.163 -0.002 0.127 0.096 0.387* 2 0.002 -0.014 0.123 -0.331 -0.220 3
-0.051 0.004 -0.411 0.049 -0.408*
4 0.032 0.009 -0.041 0.493 0.493** Residual effect = 0.22
1, 2, 3, 4 represent days to flowering / podding, leaf area, total drymatter and leaf angle, respectively; *, **: Significant at P=0.05 and0.01, respectively; Bold figures are the direct effects
Fig 1. Effect of leaf area at flowering on phot osy nt heticrate in mungbean
Fig 2. Effect of leaf area at p odding on p hotosy nt heticrate in mungbean
Fig 3. Effect of leaf angle at flowering on p hot osynt heticrates in mungbean
Vijaylaxmi and Bhattacharya : Photosynthetic rates of mungbean leaves as affected by morphological leaf traits 53
also been reported in earlier studies on grapevine (del-Campoet al. 2002). However, in earlier studies as well as in the presentstudy it was not clear that what should be the minimum threshhold levels of leaf area, either at flowering or at podding, sothat photosynthesis remain optimum. This is an importantiss ue as lowering the leaf area to have increased rate ofphotosynthesis may culminate in a plant type where there isno leaf. The negat ive association between leaf area andphotosynthetic rates could be attributed to the fact that, ahigher leaf area index leads to lower transmission of lightresulting to reduced photosynthetic rate, or it may also bepossible that higher leaf area reduces the available nitrogenconcentration in leaf leading to reduced photosynthetic rates.The negative association of total dry matter accumulationand photos yn thet ic rate could be att ribu ted to thephenomenon of feedback mechanism.
In conclusion, photosynthetic rate in mungbean isdefinitely a function of leaf angle as well as total dry matterbuildup in plant either positively or negatively. However, thepresence of comparatively high amount of residual correlationboth at flowering and at podding stages point out the effectof other traits on the pho tos ynthetic rate in mungbean.Therefore, further in depth studies are needed to ascertainthe ro le o f other traits on the photos yn thet ic rates inmungbean. Further, it is also imperative to work out theminimum threshold of leaf area in mungbean to have optimumrate of photosynthesis.
REFERENCES
Rehman MA, Sirajul Karim AJM, Hoque MM, and Egashira K. 2000.Effects of irrigation and nitrogen fertilization on photosynthesis,leaf area index and dry matter production of wheat on a clay terracesoil of Bangladesh. Jo urnal of Faculty o f Agriculture (KyushuUniversity) 45: 289-300.
Bhattacharya A and Singh DN. 1999. Physiological studies in chickpeagenotypes: photosynthesis and allied parameters under normal andlate sowing. Indian Journal of Pulses Research 12: 211-220.
del-Campo MG, Ruiz C and Lissarrague JR. 2002. Effect of water stresson leaf area development, photo synthesis, and productivity inchardonnay and airaon grapevines. American Journal of Enologyand Viticulture 53: 138-143.
Dewey DR and Lu KH. 1959. A correlation and path coefficient
analysis of components of crest ed wheatgrass seed p roduction.Agronomy Journal 51: 515-519.
Evans JR. 1993. Photosynthetic acclimation and nitrogen partitioningwithin a lucerne canopy. I. Canopy characteristics. Austalian JournalPlant Physiology 20: 55–67.
Gifford RM and Evans LT. 1987. Photosynthesis, carbon partitioningand yield. Annual Review of Plant Physiology 32: 485-509.
Koike T, Kitaoka S, Ichie T, Lei TT and Kitao M. 2004. PhotosyntheticCharacteristics of Mixed Deciduous-Broadleaf Forests from Leafto Stand. In: M. Shiyomi et al. (Eds), Global Environmental Changein the Ocean and on Land, Terrapub. Pp 453–472.
Koyama K and Kikuzawa K. 2009. Is whole-plant photosynthetic rateproportional to leaf Area ? A test of scalings and a logistic equationby leaf demography census. American Naturalist 173: 640-649.
Liu Li-Xia, Xu Shou-Min and Woo KC. 2003. Influence of leaf angleon photosynthesis and the xanthophyll cycle in the tropical treespecies Acacia crassicarpa. Tree Physiology 23: 1255-1261.
McMillen GG and McClendon JH. 1983. Dependence of photosyntheticrates on leaf density thickness in deciduous woody plants grown insun and shade. Plant Physiology 72(3): 674–678.
Medlyn BE, Dryer E, Ellsworth D, Forstreuter M. 2002. Temperatureresp on se of parameter s of a bioch em ically based mo del ofphotosynthesis. Plant cell Environment 25: 1167- 1179.
Nikolopoulos D, Liakopoulos G, Drossopoulos I and Karabourniotis G.2002 . The r elation ship between anatomy and pho tosynth eticperformance of heterobaric leaves. Plant Physiology 129: 235-243.
Sakamoto T. and Matsuoka M. 2004. Generating high-yielding varietiesby genetic manipulation of plant architecture. Current Opinion inBiotechnology. 15: 144–147.
Sharma-Natu P and Ghildiyal MC. 2005. Potential targets for improvingphotosynthesis and crop yield. Current Science 88: 1918-1928.
Shipley B, Vile D, Garnier E, Wright IJ and Poorter H. 2005. Functionallinkages between leaf traits and net photosynthetic rate: reconcilingempirical and mechanistic models. Functional Ecology 19: 602-615.
Snedecor GW and Cochran WG. 1978. Statistical Methods (6 th Edition).Oxford and IBH Publishing Company, Calcutta.
Turnbull MH, Whitehead D, T issue DT, Schuster WSF, Brown KJ,Engel VC and Griffin KJ. 2002. Photosynthetic characteristics incanopies of Quercus rubra, Qirercus prinus and Acer rubrum differin response to soil water availability. Oecologia 130: 515-524.
Yu-Long F. 2008. Photosynthesis, nitrogen allocation and specificleaf area in in vasive Eu patorium ad eno ph oru m and nativeEupatorium japonicum grown at different irradiances. PhysiologiaPlantarum 133: 318-326.

Journal of Food Legumes 25(1): 54-57, 2012
ABSTRACT
During rabi 2008-09 and 2009-10, a virus disease of Frenchbean was characterized by chlorotic spots with irregular necroticor non-necrotic margins and twisting of leaf lamina. Plantsinfected at early stage remained stunted. Disease incidencewas re corded i n the range of 4-5%. The causal virus wassuccess full y sap transmitte d from field infecte d pl ants tohealthy plants of French bean and to cowpea cv. ‘Pusa Komal’,a diagnostic host for the Tospoviruses. Further, the identity ofthe virus was confirmed by reverse transcription-polymerasechain reaction using primer pairs (GBNV-MF 5’ ATG TCT CGCTTG TCT AAC GTC 3’/GBNV-MR 5’ TTA TAT TTC AAG AAGATT ATC 3’) designed to target the NSm gene of the Groundnutbud necrosis virus (GBNV). Complete NSm gene of French beanisolate of GBNV was 924 nucleotides long, encoding a proteinof 307 amino acids. Sequence analysis of the NSm gene revealedthat the French bean isolate under study (HQ259244) sharedmaximum identity at nucleotide (98%) and amino acids (99%)levels with GBNV-[Mb] isolate (AY871097). With other GBNVi solate s viz ., type i solate (U42555) and cowpe a i sol ate(AY221023), prese nt i sol ate had respectivel y, 95 and 93%identity at nucleotide level and 99% similarity at amino acidslevel. The phylogenetic relationship analysis revealed that thepresent isolate of GBNV clustered with known isolates of GBNV.Thus, the virus causing chlorotic spot disease in French beanat Kanpur was identified as an isolate of GBNV and has beendesignated as GBNV-[Raj]. Full sequence of the NSm gene of aGBNV isolate infecting Phaseolus vulgaris is being reportedhere for the first time.
Key words: French bean, Groundnut bud necrosis virus, NSmgene, Phaseolus vulgaris
French bean, commonly called rajmash, is an importantpulse crop grown in many parts of India. This is mainly a cropof hilly areas; however, it has been successfully introduced inthe northern plains of India. Tospoviruses are known to infecta number of agriculturally important crops worldwide (Pappuet al. 2009) and have widest host range among the all knownplant viruses. Five different tospovirus species have beenreported from Ind ia so far. Among them, Groundnut budnecrosis virus (GBNV), a member of serogroup IV ofTospoviruses is most prevalent throughout India and causesconsiderable losses in many important crops (Mandal et al.2011). Its natural infection has been reported in groundnut,mungbean, urdbean, potato, soybean, tomato, cowpea, Frenchbean , Dolichos, pea and jute (Reddy et a l . 1992,
Characterization of Groundnut bud necrosis virus infecting French beanMOHD. AKRAM and NAIMUDDIN
Division of Crop Protection, Indian Institute of Pulses Research, Kanpur - 208 024, India; E-mail:[email protected](Received: October 25, 2011; Accepted: February 29, 2012)
Satayanarayana et al. 1996, Bhat et al. 2001, Umamaheshwaranet al. 2003, Naimuddin et al. 2009, Jain et al. 2002, Akram et al.2003, 2004, Saritha and Jain 2007, Akram and Naimuddin 2009,2010a and b, Sivaprasad et al. 2011). We report here theass ociation of GBNV causing ch loro tic/necro tic s pots inFrench bean (Phaseoulus vulgaris) based on the symptomsobserved on naturally infected plan ts and the NSm genecharacteristics for the first time.
MATERIALS AND METHODS
Sample collection and mechanical transmission: Leaves ofnaturally infected plants of French bean (Phaseolus vulgarisvar. Amber) showing characteristic chlorotic spots during rabi2008-09 and 2009-10 were randomly collected from the fieldsand used as source of inoculum for inoculating cowpea (Vignaunguiculata cv. Pusa Komal), an indicator plant for GBNVand French bean vars. Amber and Utkarsh at primary leafstage using celite powder as an abrasive.
RNA isolation and RT-PCR: Total RNA from the naturallyinfected French bean leaves and artificially inoculated andhealthy leaves of French bean as well as cowpea was extractedus ing RNeasy Kit (Qiagen Inc., Chats worth , CA, USA)according to the manufacturer’s instructions. Total RNA thusisolated was used as a template in the reverse transcription-polymerase chain reaction (RT-PCR). Five samples of the fieldinfected leaves of each variety of French bean (Amber andUtkarsh) and two samples of systemically infected leaves ofartificially inoculated plants of each French bean and cowpeawere taken for RNA isolation. RNA from corresponding healthysamples was also extracted and subjected to RT-PCR.
The primers pair (GBNV-MF 5’ ATG TCT CGC TTG TCTAAC GTC 3’/GBNV-MR 5’ TTA TAT TTC AAG AAG ATTATC 3’) was des igned by us ing the known NSm genesequence of GBNV (AY259522). These primers were used toamplify movement protein gene (NSm gene) located on mediumRNA of the virus genome using Qiagen One Step RT-PCR kitaccording to the manufacturer’s instructions. Amplificationwas perfo rmed in an automated thermal cycler (T1Thermocycler, Biometra, Germany) programmed for one cycleof 50oC for 30 min for cDNA synthesis, 15 min as hot start forTaq polymeras e at 94oC and 35 cycles o f NSm geneamplification with following parameters: 30s of denaturationat 94oC, 1 min annealing at 52oC, 1 min for extension at 72oCfollowed by one cycle of final extension for 10 min at 72oC.

Akram and Naimuddin : Characterization of Groundnut bud necrosis virus infecting French bean 55
RT-PCR products were s ubjected to elect rophoresis. Thebands corresponding to NSm gene (~900 bp) were excisedand purified using QiaX gel extraction kit (Qiagen) followingmanufacturer’s instructions.Cloning of NSm gene and sequence analysis: The purifiedproduct of NSm gene was ligated into pJet 1.2/blunt cloningvector (Fermentas). In a microfuge tube a reaction was setup(2x reaction buffer-10 µl, purified DNA-2 µl, nuclease freewater-2 µl, and DNA blunting enzyme-1 µl) first for bluntingthe PCR product and then the ligation was done by adding 1µl pJet 1.2/blunt cloning vector and 1 µl T4 DNA ligase in themixture.
Competent cells and transformat ion: Single colony wastransferred from the overnight culture plate of E coli-XL bluein to 5ml LB broth and kept overnight for growth at 37oC inrefrigerated incubator shaker (Thermo scientific) at 200rpm.From the overnight culture, 100µl was added in fresh 100mlLB broth and kept for 30 min in incubator shaker at 150rpmfollowed by centrifugation at 4500rpm for 5 min at 4oC. Thepallet was re-suspended in 20ml 0.1M CaCl2 (ice cold) andkept on ice for 30 min. The suspension was then centrifugedat 4500 rpm for 5 minutes at 4oC. The pallet was re-suspendedin 20ml 0.1M MgCl2 (ice cold) and kep t for 30 min andcentrifuged at 4500rpm for 5 min at 4oC. The pallet was re-suspended in 4ml 0.1M ice cold CaCl2 and an aliquot of 100µlwas taken and added to ligation mixture. This mixture wasexposed to 42oC for 2 min, added to 800µl LB broth and keptfor s haking at 200rpm for 30 min at 37oC fo llowed bycentrifugation at 10000rpm for 1 min. The pallet was re-suspended in 100µl LB broth and was s pread on LB agarampicillin and tetracycline plates and kept overnight at 37oC.
Plasmid iso la tion and restriction d igest ion: Thetransformants were confirmed by colony PCR. The positiveclones were streaked on LB agar ampicillin and tetracyclineplates. Single colony was picked from overnight grown plateand suspended in 3ml LB broth supplemented with ampicillinand tetracycline. It was kept at 37oC for overnight growth andthe plasmid was iso lated us ing GenJet Plas mid mini kit(Fermentas). The isolated plasmid DNA was digested withBglII res trict ion enzyme following the manufactu rer’sinstruction for further confirmation of the insert.Sequencing and sequence analysis: The purified recombinantplasmid DNA was got sequenced by 1st BASE, Malaysia.The NSm gene nucleotide and amino acid sequences of otherknown tospov iruses (Table 1) us ed fo r comparison wereobtained from GenBank. The evolutionary history was inferredusing the Neighbor-Joining method (Saitou and Nei 1987) withbootstrap test (1000 replicates) (Felsenstein 1985). The treewas drawn to scale, with branch lengths in the same units asthose o f the evo lu t ionary d istances used to in fer thephylogenetic tree. Evolutionary analyses were conducted inMEGA5 (Tamura et a l. 2011). The NSm gene sequence ofGBNV-[Raj] was submitted to GenBank under the accessionno. HQ259244.
RESULTS AND DISCUSSION
Symptomatology, disease status and transmission: Naturallyinfected French bean (Phaseolus vulgaris) plants showedcharacteristic chlorotic spots with irregular margins in leaflamina, twisting of leaf lamina and veinal necrosis. Margin ofthe spots often turned necrotic giving leaflet a shriveled lookresulting into twisting of leaf lamina. Necrosis in veins andstem was also noticed. Plants infected at early stage of growthremained stunted. Disease incidence was recorded between4-5% in two varieties (Amber and Utkarsh) of French bean.The causal virus was sap transmitted upon inoculation fromfield-infected plants to healthy plants of French bean andproduced faint chlorotic spots on inoculated primary leaveand systemic symptoms consisting of sh riveled chloroticspots with irregular margins that resembled those seen onnaturally infected plants. On inoculated leaves of cowpea cv.Pusa Komal, characteristic local lesions appeared within 3days. The field symptoms and productions of local lesions oncowpea indicated involvement of Groundnut bud necrosisvirus, a tospovirus. Natural infection of GBNV on French beanwas reported by Jain et al. (2007) but they did not mentionabout the mechanical sap inocu lation from field infectedsamples to either French bean or cowpea.Amplificat ion and cloning of the NSm gene: RT-PCRproducts from field- infected French bean and from sap-inoculated French bean and cowpea samples analyzed inagarose gel electrophoresis revealed p res ence of DNAfragment of ~900 bp corresponding to NSm gene of GBNV(Fig. 1A&1B) indicating that the disease observed in French
Fig 1. RT-PCR amp lificat ion of NSm gene of GBNV fromnat urally infected French bean cv. Ut karsh (A) and cv.Amber (B); Lane 1-5: diseased leaves; Lane 6: healthyleaves. PCR amp lification of NSm gene (insert ) fromt ransformed bact erial colonies (C); Lane 1-4: fourtransformed colonies. Restriction digestion of recombinantplasmid DNA using BglII enzyme (D); Lane 1-4: PlasmidDNA from four transformed bacterial colonies; Lane M:1 kb DNA ladder (A&B) and 100 bp DNA ladder(C&D)

56 Journal of Food Legumes 25(1), 2012
bean is caused by the GBNV. No amplification was found inRT-PCR products from healthy French bean and cowpeasamples. NSm gene was successfully cloned in E. coli. ColonyPCR of transformed colonies gave positive amplification forthe presence of ins ert (Fig . 1C). Restriction d iges tion ofplasmid DNA from four of the transformed colonies with BglIIyielded targeted insert DNA (Fig. 1D) confirming the propercloning of the NSm gene of the virus isolate under study.
Sequence analysis: Prior to the present report, there is onlyone report of GBNV infecting French bean in India by Jain etal. (2007) who identified the virus on the basis on partialsequence o f nucleocapsid pro tein (NP) gene. NP genesequence is generally used to estab lis h the iden tity ofTos poviruses and is olates in the Tospovirus genus withgreater than 90% identity in NP gene sequence are classifiedas strain of the same virus (Moyer 1999). However, the NSmgene located on M-RNA of the tripart ite genome ofTospoviruses has also been shown to be of equal importancein the characterization of Tospoviruses (Silva et al. 2001). Inthe present study, the causal virus of chlorotic spot diseaseof French bean has been characterized on the basis of NSmgene sequence. We could not find any sequence of NSm geneof GBNV infecting French bean in the NCBI data base andhence the sequence of NSm gene ob tained in the presentstudy has been compared with corresponding gene of GBNVisolates from other hosts (Table 1).
Sequence analysis revealed that NSm gene of Frenchbean isolate (HQ259244) at nucleotide level shared maximum(98%) identity with GBNV-[Mb] isolate (AY871097), followed
Table 1. Compari son of nucl e oti des and ami no acidssequences of NSm gene of GBNV-[Raj] isolate understudy with other known Tospoviruses
S. N.
Name of the virus
Accession number
Number of nucleotides/amino acids
Per cent nucleotides
identity
Per cent amino acids
identity 1 GBNV-
[Raj] *HQ259244 924/307 - -
2 GBNV-[Mb]
AY871097 924/307 98 99
3 GBNV-[TI]
U42555 924/307 95 99
4 GBNV-[CP]
AY221023 924/307 93 99
5 CaCV NC_008303 927/308 81 88 6 WSMV U75379 939/312 77 83 7 MYSV NC_008307 927/308 65 61 8 IYSV AF213677 936/311 68 65 9 INSV M74904 912/303 41 40 10 ZLCV AF213676 912/303 37 35 11 CSNV AF213675 912/303 38 39 12 TSWV AF208498 909/302 36 40 13 TCSV AF282983 921/303 38 39 14 GRSV AF513220 912/303 37 39
*: This study; GBNV-[Raj]: Groundnut bud n ecrosis virus-Rajmashisolate; TI: Type isolate, Mb: Mungbean; CaCV: Capsicum chlorosisvirus; WSMV: Watermelon silver mottle virus; MYSV: Melon yellow spotvirus; IYSV: Iris yellow spot virus; INSV: Impatiens necrotic spot virus;ZLCV: Zucchuni lethal chlorosis virus; CSNV: Chrysanthemum stemnecrosis virus; TSWV: Tomato spotted wilt virus; TCSV: Tomato chloroticspot virus; GRSV: Groundnut ringspot viru.
Fig 2. Phylogenetic relationship between GBNV-[Raj] with some other known GBNV isolates and tospoviruses based on (a) aminoacids, and (b) nucleotide of NSm gene. The tree was constructed using the Neighbor-Joining method. The analy sis involved 14amino acids, and 14 nucleotide sequence of tospoviruses

Akram and Naimuddin : Characterization of Groundnut bud necrosis virus infecting French bean 57
by 95% and 93% similarity with type isolate (U42555) andcowpea isolate (AY221023), respectively. However, at aminoacids levels, similarity was 99 % with all these three isolates(AY871097, U42555 and AY221023). More than 90% similaritybetween the NSm gene of the present isolate, GBNV-[Raj] andother known GBNV isolates both at nucleotide and aminoacid levels unequivocally proves that the present isolate is astrain of GBNV. GBNV-[Raj] had 77- 81% similarity at nucleotidelevel and 83-88% at amino acid level with CaCV (NC_008303)and WSMV (U75379), other members of serogroup IV ofTospoviruses. With other members of Tospoviruses (TSWV,GRSV, ZLCV, CSNV, TCSV, INSV and MYSV), present isolate,GBNV-[Raj] had 37- 65% similarity at nucleotide level and 39-65% at amino acid level. The phylogenetic relationship analysisinvolving isolates of GBNV including present isolate, GBNV-[Raj] and other virus species of Tospoviruses revealed thatthe GBNV-[Raj] closely clustered with isolates of GBNV (Fig.2a,b).
The present paper adds to the understanding of fieldsymptoms caused by GBNV in French bean, quantifies thedisease in the field and describes sequence of NSm gene ofGBNV isolate infecting French bean for the first time. Thoughat present the disease incidence in French bean crop does notseem to be worrisome, but under the climate change beingexperienced in the present century, this disease may, however,prove to be a potentially damaging one.
ACKNOWLEDGMENT
Financial support from A.P. Cess Fund of the IndianCouncil of Agricultural Research, New Delhi under the project“Lal Bahadur Shas tri Young Scientis t Award Scheme on“Molecular characterization and sequence divers ity ofTospoviruses infecting Fabaceous and Solanaceous crops”to the first author is gratefully acknowledged. Authors alsothank Dr. N. Nadarajan, Director, IIPR for his constant supportand encouragement.
REFERENCES
Akram M and Naimuddin . 2009 . Movement p rotein (NS m) genesequence based characterization of Groundnut bud necrosis virusinfecting cowpea. Journal of Food Legumes 22: 82-85.
Akram M and Naimuddin. 2010 a. First report of Grou ndnut budnecrosis virus infecting pea (Pisum sativum) in India. New DiseaseRepor ts 21 :10. [htt p://dx.do i.org/10.5197/j.204 4-05 88.20 10.021.010].
Akram M and Naimuddin. 2010b. First report of natural infection ofVigna mungo var. silvestris L. by Groundnut bud necrosis virus, atospovirus. Phytopathologia Mediterranea 46:249-252.
Akram M, Jain RK, Vikas Chaudhary, Ahlawat YS and Khurana SMP.2003. Characterization of mov ement prot ein (NS m) gen e ofGroundnut bud necrosis virus from cowpea and potato. IndianPhytopathology 56: 236.
Akram M, Jain RK, Vikas Chaudhary, Ahlawat YS and Khurana SMP.2004. Comparison of Groundnut bud necrosis virus isolates based
on movement protein (NSm) gene sequences. Annals of AppliedBiology 145: 285-289.
Bh at AI, Jain RK, Varm a A, Naresh Chandra and Lal SK. 200 1.Tospovirus(es) infecting grain legumes in Delhi, their identificationby serology and nucleic acid hybridization. Indian Phytopathology54:112-116.
Felsenstein J. 1985. Confidence limits on phylogenies: An approachusing the bootstrap. Evolution 39: 783-791.
Jain RK, Bag S, Umamaheshwaran K and Mandal B. 2007. Naturalinfection by tospoviruses of cucurbitaceous and fabaceous vegetablecrops in India. Journal of Phytopathology 155:22-25.
Jain RK, Umamaheswaran K, Bhat AI, Thien HX and Ahlawat YS.2002. Necrosis disease on cowpea, mungbean and tomato is causedby Groundnut bud necrosis virus. Indian Phytopathology 55:354.
Mandal B, Jain RK, Krishnareddy M, Krishna Kumar NK, Ravi KS andPappu HR. 2011. Emerging problems of tospoviruses (Bunyaviridae)and their management in the Indian Subcontinent. Plant Disease“First Look” paper [doi: 10.1094/PDIS-06-11-0520].
Moyer JW. 1999. Tospoviruses (Bunyaviridae). In: Webster and Granoff(Eds), Encyclopedia of Virology. Academic Press, New York. Pp1803-1807.
Naimuddin, Mohd Akram and Duraimurugan, P. 2009. Detection of atospovirus associated with necrotic leaf curl disease of mungbean atKanpur. Journal of Food Legumes 22: 86-90.
Pappu HR, Jones RAC and Jain RK. 2009. Global status of tospovirusepidemics in diverse cropping systems: Successes achiev ed andchallenges ahead. Virus Research 141: 219-236.
Reddy DVR, Ratna AS, Sudarshana MR, Poul F and Kirankumar I. 1992.Serological relationships and purification of bud necrosis virus, atospovirus occurring in peanut (Arachis hypogaea L.) in India.Annals of Applied Biology 120:279-286.
Saitou N and Nei M. 1987. The neighbor-joining method: A new methodfor recon structing phylogenetic trees. Mo lecular Biology andEvolution 4: 406-425.
Saritha RK and Jain RK. 2007. Nucleotide sequence of the S and M-RNA segments of a groundnut bud necrosis virus isolate from Vignaradiata. Archives of Virology 152:1195-1200.
Satyanarana T, Mitchell SE, Reddy DVR, Kresovich S, Jarret R, NaiduRA, Gowda S and Demski JW. 1 996. The complete nucleotidesequence and genome organization of the M RNA segment of peanutbud necrosis tospovirus and comparison with other tospoviruses.Journal of General Virology 77: 2347-2352.
Silva MS, Martins CRF, Bezerra IC, Nagata T, de Avila AC, and ResendeRO. 200 1. Sequence diversity of NSm movement pro tein oftospoviruses. Archives of Virology 146:1267-1281.
Sivaprasad Y, Bhaskara Reddy BV, Naresh Kumar CVM, Raja Reddy Kand Sai Gopal DVR. 2011. Jute (Corchorus capsularis): a new hostof Peanut bud necrosis virus. New Disease Reports 23:33. [http://dx.doi.org/10.5197/j.2044-0588.2011.023.033].
Tamura K, Peterson D, Peterson N, Stecher G, Nei M and Kumar S.2011. MEGA5: Molecular Evolutionary Genetics Analysis usingMax imum Likelihoo d, Ev olutionary Dist ance, and MaximumParsimony Methods. Molecular Biology and Evolution 28: 2731-2739 [doi: 10.1093/molbev/msr121].
Umamaheswaran K, Jain RK, Bhat AI, Ahlawat YS. 2003. Biologicaland nucleocapsid protein gene characterization suggest that tomatotospovirus is a strain of Groundnut bud n ecrosis virus. In dianPhytopathology 56:168-173.

Journal of Food Legumes 25(1): 58-60, 2012
Effect of urdbean based cropping sequences on root-knot nematode (Meloidogynejavanica) populationBANSA SINGH1 and K.K. SINGH2
1Division of Crop Protection and 2Division of Crop Production, Indian Institute of Pulses Research, Kanpur-208024,Uttar Pradesh, India; Email: [email protected]
(Received: August 18, 2011: Accepted: February 13, 2012)
ABSTRACT
Studie s on the e ffe ct of cropping sequences on root-knotnematode (Meloidogyne javanica) under micro-plot conditionsshowed that the cultivation of urdbean during kharif (rainyseason) led to increase in nematode population by 56% overinitial population. When subsequent crop wheat was taken asnon-host crop in rabi (post rainy season), nematode populationreduce d by 42.3%. Urdbean followed by two non-host cropsmustard and wheat had reduced 54% of nematode population.When urdbean was grown as intercrop with sorghum, nematodepopulation decreased by 26% and subsequently wheat reducedthe nematode population further by 64.9%. In the croppingsequence of maize followed by potato and urdbean, althoughthe nematode population reduced with growing of maize in thebeginning but population further increased when potato wasgrown during rabi . Te sti ng of two croppi ng se que nce surdbe an+sorghum-whe at and urdbe an-whe at+mustard incomparison to cropping sequence urdbean-chickpea in largerplots reduced the root-knot nematode population by 82.6 and75.6% at the end of one year sequence as compared to 137.1%increase in population when urdbean was followed by chickpea.
Key words: Crop p ing sequence, Meloidogyne jav anica ,Nematode, Root-knot nematode, Urdbean
Root-kno t nematode (Meloidogyne javanica) is animportant pest of field crops causing heavy losses to pulses(Gupta and Verma 1990). The infestation of this nematoderesults in gall format ion on the root system result ing intoyellowish leaves and poor plant growth. Avoidable losses upto 40-44% in urdbean due to M. javanica have been reported(Kalitha and Phukan 1993). A lthough, several managementstrategies such as application of organic amendments, growingof resis tan t variet ies , s ummer ploughing , app lication ofnematicides etc. have been advocated for the con trol ofnematodes in crops, all may not be feasible to use under fieldconditions. In multiple cropping systems, crop rotation withnon-host crop can maintain the nematode population beloweconomic threshold levels. Therefore, correct identificationof the nematode s pecies p res en t in the field and theidentification of the crops as host and non-host to be used inthe cropping sequence are very essential with the view toregulate the nematode population in the field. Growing of hostor non-host crop in sequence will determine the increase ordecrease in nematode populations. The degree of control of
nematode population through crop rotation also dependsupon the length of use of non-host crops in rotation (Kanwarand Bhatti 1998). The accep tance of the non-hos t cropsrecommended in cropp ing sequences is als o crit ical.Therefore, in order to find out suitable cropping sequenceswith crops commonly grown with urdbean as a base crop tomanage the root-knot nematode, an experiment was conductedunder micro-plots.
MATERIALS AND METHODS
Experiment was initially carried out in micro-plots ofsize 2.0 x 2.5m for three years from July 2004 to June 2007. Soilof the micro-plots was sandy loam with pH 7.5. Four croppings equences with u rdbean as bas e crop were taken :1. Urdbean (cv. ‘Uttara’)-Wheat (cv. ‘Raj 3765’); 2. Urdbean +Sorghum (cv. ‘Versa’) (2:1)-Wheat ; 3. Urdbean-Wheat-Mustard (cv. ‘Bhawani’) (4:1) and 4. Maize (cv. ‘Azad Uttam’)-Potato (local cultivar)-Urdbean. Each cropping sequence wasgrown in randomized block design with five replications.Recommended fert ilizers and package o f p ractices werefollowed. An equal inoculum of root-knot nematode was addedto each micro-plot soil from the culture pots maintained in thenet house. Urdbean was grown in micro-plots for nematodemultiplication. Prior to sowing of crops under experiment, initialroot-knot nematode population was recorded 50 juveniles per100 cc soil. Forty-five days after germination, th ree plantsfrom each replication were removed from the soil with rootsystem for recording gall index in urdbean. Root system waswashed gent ly under tap water and obs ervat ions wererecorded for each plant on gall index (GI) based on 1-5 scaleviz., 1= No galls/egg masses; 2 = 1-10 galls/egg masses; 3 =11-30 galls/egg masses; 4 =31-100 galls/egg masses and 5 =>100 galls/egg masses (Taylor and Sasser 1978). At the harvestof first crop, soil samples were drawn from three spots in eachmicro-plot. The composite s oil sample o f each plo t wasthoroughly mixed and 100 cc soils were processed as per theCobb’s modified decanting and sieving technique (Cobb 1918).The nematode population was counted under the stereo-microscope. Biomass and grain yield of all the crops wererecorded.
Bas ed on micro-p lot res u lts , the two croppingsequences viz., urdbean + sorghum-wheat and urdbean sole-wheat +mustard found effective in reducing the nematode

Singh and Singh : Effect of urdbean based cropping sequences on root-knot nematode (Meloidogyne javanica) population 59
population were further evaluated in bigger plots naturallyinfested with root-knot nematode during 2007-08 along withcropping sequence having pulse after pulse (urdbean followedby chickpea) for comparison. Total experimental area was51×39 m2. The soil of the experimental field was sandy loamwith pH 8.3. The average initial nematode population of thefield was 443 juveniles/100 cc soil. The experiment wasconducted in RBD with 6 replications. All three croppingsequences (urdbean+s orghum-wheat, urdbean-wheat +mustard and urdbean-chickpea) were randomly allocated ineach block. Each cropping sequence was grown in 12 x 8 m2
plot. Recommended package of practices were followed ingrowing of the crops. Five soil samples were drawn (0-20 cmdepth) from each replication and mixed thoroughly to makecomposite sample after harvest of kharif and rabi crops. Thenematode population was recorded by processing 100 cc soilfrom composite sample as per Cobb’s decanting and sievingtechnique. The data on the nematode population was recordedat the time of harvest of the crops and analyzed.
RESULTS AND DISCUSSION
Four cropping sequences with urdbean as base cropi.e ., u rdbean-wheat, u rdbean+s orghum-wheat, u rdbean-wheat+mustard and maize-potato-urdbean were taken undermicro-plots. The results indicated that during kharif (rainy)season, when root-knot nematode susceptible crop urdbeanwas grown as sole crop, the nematode population increasedto 46 - 56% over initial population (Table 1). Growing of maize,as non-host crop of root-knot nematode, during kharif seasonreduced the nematode population by 52% at the end of thecrop. Probably due to the non-availability of food in non-hostcrop reduced the nematode population. During kharif seasoncultivation of urdbean, a host crop of root -knot nematodeand sorghum, a non-host crop as intercropping, the nematodepopulation was reduced by 26.0% and the gall index was 2.1compared to 3.3 in sole urdbean (Table 1). This indicated thatsorghum not only reduced the nematode population, but also
helped to lower the nematode infection in urdbean, whichwas grown as intercrop. This confirmed the earlier reports ofantagonistic effects of sorghum against root-knot nematode(Yamada et al. 2000). Haque et al. (2002) also reported grainsorghum as best alternative non-host crop for root-knot andreniform nematodes. Sorghum root exudates have been foundto contain chemicals which are toxic to root-knot nematodes(Singh and Kumar 2006).
During rabi season, when wheat was followed by soleurdbean, the nematode population decreased by 42%, whereas64.9% decrease in population occurred when wheat wasfollowed by urdbean+sorghum. After sole urdbean, growingof wheat+mustard reduced nematode population by 54%. Thereduction in nematode population was more in wheat+mustardcompared to wheat alone. This may be becaus e o f nonavailab ility of sus cept ible hos t plants for feeding of thenematode. Wheat as well as mus tard is known to havesuppressive effect on root-knot nematodes. Mustard has alsobeen recommended as in tercropping with ch ickpea forreducing the nematode infection. Potato followed by maizeincreased the nematode population by 75% which furtherincreased by 33% when urdbean was followed in spring (Table1). This has indicated that although growing of maize reducedthe nematode population during kharif, but growing of twosus cept ible crops potato and urdbean one after anotherincreased the nematode population. Rodriguez-Kabana andTouchton (1984) also observed decrease in the population ofMeloidogyne arenaria after maize and s orghum but thepopulation increased when these crops were followed bypeanut, a susceptible crop.
Nematode population recorded at the harvest of kharifcrops in bigger plots revealed the significantly less populationin intercropping of urdbean and sorghum compared to urdbeanalone. Growing of sorghum with urdbean as intercrop duringkharif season reduced the root-knot nematode population by30.1% over initial population. Whereas, population increased
Table 1. Pooled data on crops grown in different cropping sequences
Cropping Sequence/ Intercropping
Crops #Biomass (kg/ha) Yield (kg/ha) G.I. #J2/100 cc soil % increase/ decrease in population
Urdbean 684 525 3.2 78 56.0 U-W Wheat 6201 2110 - 45 -42.3 Urdbean 421 156 2.1 37 -26.0 Sorghum 2484 - - 37 -26.0
U+S-W
Wheat 5819 2006 - 13 -64.9 Urdbean 637 335 3.3 73 46.0 Mustard - 1055 - 33 -54.8
U-M+W
Wheat 5347 1914 - 33 -54.8 Maize 2392 - - 24 -52.0 Potato - 10634 2.4 42 75.0
M-P-U
Urdbean 425 148 3.1 56 33.3
#Average of five replications; J2=Second stage juveniles, U = Urdbean, W = Wheat, S = Sorgham, M = Mustord, P = Potato

60 Journal of Food Legumes 25(1), 2012
by 78.5 and 83.3% over initial population after sole urdbeanduring kharif season under cropping sequences with urdbean-wheat +mustard and urdbean-chickpea (Fig. 1). By growingwheat after sorghum + urdbean during rabi reduced furtherthe nematode population by 82.6% over initial population. Inspite of increase in population after sole urdbean during kharifseason, growing of wheat and mustard as intercrop duringrabi season reduced the root-knot nematode population by75.6% over in itial population (Fig. 1). This confirmed andvalidated the data obtained in these two cropping sequencesunder micro-plots. Contrary to these sequences the pulse-pulse crop sequence that is urdbean-chickpea, there was 78.5%increase in nematode population over initial population aftersole urdbean during kharif season and it further increased by137.1% over initial population with growing of chickpea duringrabi season. The increase in nematode population can beattributed to the growing of susceptible pulse crops duringkharif and rabi. This indicates that the selection of croppingsequences in nematode infested field plays very crucial rolein increase or decrease in nematode populations. A two-yearrotation against cyst nematodes and a one-year rotat ionagainst root-knot and reniform nematodes were sufficient to
bring down the population dens ities to levels below theeconomic injury thresholds (Ali and Singh 2007). From thestudies it can be concluded that the continuous growing ofpulse-pulse crops will increase the nematode load in the soilmaking it unprofitable for pulse production. There should beone cereal component in the pulse based cropping sequencefor effective management of root-knot nematodes.
REFERENCES
Ali SS and Singh B. 2007. An overview of nematode constraints inpulses and their management. Journal of Food Legumes 20: 1-8.
Cobb NA. 1918. Estimating the nematodes population of soil. U.S.Department of Agriculture, Bureau of Plant Industry, AgricultureTechnical Circular 1: 1-48.
Gupta DC and Verma KK. 1990. Studies on avoidable losses in mungbean(Vigna radiata) due to root-knot nematode, Meloidogyne javanicaand its control under field conditions. Indian Journal of Nematology20: 148-151.
Haque SS, Overstreet C and Santen EV. 2002. Crop rotation effects onnematode po pulations. In: Proceeding of 25 th Annual Southernconservation al T illage Conference for Sust ainable Agricult ure,Auburn Al, USA. Pp 156-160.
Kalitha DN and Phukan PN. 1993. Pathogenicity of Meloidogyneincognita on black gram. Indian Journal Nematology 23: 105-109.
Kanwar RS and Bhatti DS. 1988. Effect of length of crop rotation onthe control of root knot nematode, Meloidogyne javanica. IndianJournal Nematology 28: 213-215.
Rodriguez-Kabana R and Touchton JT. 1984. Corn and sorghum asrotational crops for managemen t of Meloidogyne arenaria inpeanut. Nematropica 14: 26-36.
Singh B and Kumar Lalit . 2006. Nematicidal properties of sorghumroot exudates. Pulses Newsletter 17: 3.
Taylor AL and Sasser JN. 1978. Biology, Identification and control ofroot knot nematodes (Meloidogyne spp.). Coop. Pub. Deptt. PlantPathol., North Carolina State University and United States Agencyfor International Development, Graphics, Raleigh. Pp 111.
Yamada E, Hashizume K, Takahashi M, Kitashima M, Matsue S andYatsu H. 2000. Antagonistic effects of hybrid sorghum and othergramineous plants on two species of Meloidogyne and Pratylenchus.Japanese Journal of Nematology 30: 18-29.
Fig 1. Effect of crop ping sequences on t he p opulat ion ofMeloidogyne javanica

Journal of Food Legumes 25(1): 61-65, 2012
Assessment of technological inputs for major pulses in Bundelkhand regionPURUSHOTTAM1, S.K. SINGH1, R.G. CHAUDHARY2, RAJESH KUMAR1, C.S. PRAHARAJ3 andBAL KRISHNA1
1Agricultural Extension Section; 2Division of Crop Protection; 3Division of Crop Production, Indian Institute ofPulses Research, Kanpur-208 024, U.P., India; E-mail: [email protected]
(Received: September 13, 2011; Accepted: January 31, 2012)
ABSTRACT
To assess the availability of te chnological inputs by pulsegrowing farmers, three villages namely Baank, Bannki andBilhari in Hamirpur district of Bundelkhand region in UttarPradesh were selected as the study area. Data was collectedfrom 180 farmers belonging to smal l, marginal and largecategory (as per land holding) in these villages during 2008-09.The respondents were categorized into four groups so as tostudy the extent of availability of recommended inputs. Analysisof data revealed that the overall input availability with farmerswas lowest in pigeonpea followed by chickpea and lentil. Thebasic inputs for chickpea such as seed cum fertilizers drill,tractor/cultivator, labour and bullocks as per recommendedpractice were available only with 46, 43, 36 and 33% of farmers,respectively. Other important inputs namely, pheromone traps,sprayer, Rhizobium, fungicide, insecticide and improved varietywere not available with 95, 95, 93, 91, 76 and 70% of farmers,respecti vely growi ng chickpe a. Even none had inputs l ikeTrichoderma for soil treatment and sulphur for crop nutrition.For lentil, the recommended inputs such as seed cum fertilizersdrill, bullocks and tractor/cultivator were available with 66, 68and 58% of farmers, respectively. However, the inputs likesprayer, insecticide, fungicide, pump set and improved varietywere not available with the majority of lentil growers (91, 86,86, 76 and 75% of farmers, respectively). S imilarly the requisiteinputs for pigeonpea viz., pheromone traps, sprayer, insecticide,phosphatic fertil iz er, improve d vari ety and nitroge nousfertilizers were not available with 95, 91, 85, 76, 75 and 70% offarmers, respectively. None of these farmers had ridge makeror applie d zinc, Trichoderma and Rhizobium for pigeonpeacultivation.
Key words: Bundelkhand region, Pulses, Rainfed, Technologicalinput assessment
Rainfed agriculture in India supports an estimated 40%of the population (484 million) and contributes a share of 77%in pulse acreage (Abrol 2011). It is estimated that by 2030, thetotal domestic pulse demand will be about 32 million tonnes atan annual growth rate of 4.2% (Nadarajan 2011). Bundelkhandregion consisting of 7 districts of Uttar Pradesh and 6 districtsof Madhaya Pradesh comes under rainfed farming. An analysisof human development, infrastructure, agriculture related socialand economic indicators ranked ‘Bundelkhand’ as the mostbackward region where agricu lture production contributes
more than 56% in cereals and 32% in pulses supply in theregion (Samra et al. 2008). In addition to the bio-physicaldeterminants, the socio-economic environment, infrastructure,land reforms and trade are also equally important for stabilityin crop production and sustained food supply. Moreover,simulation studies involving bio-physical and socio-economicmodeling indicates that climate change will also increase thenumber of people at risk of hunger depending on projectedsocio-economic developments. It is also estimated that climatechange will increase the number of undernourished peopleby 5–26% in 2080 (Fischer et al. 2002). Thus, the pressure onrain fed farming is going to increas e many folds in fu turefollowing an additional stress imposed by climate change.
Under rainfed production scenario where crop oftensuffers from low productivity, farmer’s resources are usuallynot adequate and thereby bringing food security at stake. Acomprehensive assessment report amply demonstrated thatcurrent yield under rainfed farming is 2-5 folds lower than theachievable potential yield due to low rain-water use efficiency(35–45%) in most rainfed areas (Dar et al. 2009). Technologicalinpu ts are the important resources fo r making the farmproductive. Pulses however, are grown mainly on marginalland with less input although these respond fairly well toinput application. At the same time, easy and timely availabilityof inputs is critical and should also be ensured (Roy et al.2006). Analys is o f farmers ’ feedback s howed s t rongrelations hip between technology adop tion and farmersconcerns about sustainable farming (Singh et al. 2005). Despiteall this, availability of technogical inputs plays a dominantro le in determin ing productivity and s tability in pu ls eproduction in these regions. Since the studies on this aspectare meager especially for Bundelkhand, the current study wasundertaken with an objective to as sess the availability oftechnological inputs based on farmers’ feedback in cultivationof major pulse crops.
METERIALS AND METHODS
The study was conducted in three v illages namely,Baank, Bannki and Bilhari in Sumerpur block of Hamirpurdistrict in Bundelkhand region of Uttar Pradesh, India during2008-09. These villages were having an adequate area underpulses as all the categories of farmers (depending on land

62 Journal of Food Legumes 25(1), 2012
holdings) grow pulses. The total population of the villageswas 6019 with 1232 families. The cultivable area constitutesabout 77.6% (1144 ha) of the total geographical area (1474 ha).The cultivated area during rab i (964 ha) was much higherover kharif (431 ha). Chickpea, lentil and pigeonpea were themajor pulses grown in 273, 85, and 340 ha, respectively inMar, Kabar, Paruwa and Rakar soils during 2007-08. A totalof 180 farmers were selected from these villages for the studytaking 60 farmers each with respect to land holding (small,marginal and large) and growing a pulse crop (chickpea, lentiland pigeonpea).
The recommended inputs required for selected cropsunder rainfed farming were identified based on the inputsfrom the concerned organization located nearby and also fromthe available package of practices. Data was collected fromfarmers through pers onal discus sion, g roup discussion,in terv iew schedule, farm v isit and personal observation.Analysis of data was done following standard statisticalprocedures.
In o rder to as certain the extent o f availability o frecommended inputs, the respondents were categorized intofour groups with certain score values viz., non-availability ofinpu ts (A 0: score zero), inpu ts availability belowrecommendation (A1: score one), inputs availability as perrecommendation (A2: score two) and inputs availability morethan recommended (A3: score three) for the selected crop(s).
Extent of availability of recommended inputs: There were16 recommended inputs for cultivation of chickpea and thus,the total score ranged from 0 to 48. However, the s tudyrevealed that the min imum input availab ility s core of anindividual was 4 and maximum was 15 with mean of 8.38 andstandard deviation of 3.35. Similarly there were 15 inputsrecommended for cultivation of lentil crop and the score rangedfrom 0 to 45. The min imum inpu t availab ility score of anindividual was 4 and maximum was 13 with mean of 8.47 andstandard deviation of 2.84. For pigeonpea, there were 17 inputsrecommended for cultivation of pigeonpea and the score variedfrom 0 to 51. The minimum score of an individual for availabilityof input was 4 and maximum 14 with mean of 7.12 and standarddeviation 2.07. Considering the mean and standard deviationas a measure of check, the respondents were grouped into thefollowing low, medium and high input categories based onthe level of input availability for the selected crop grown underdifferent farming situations.
RESULTS AND DISCUSSION
Availabili ty o f recommended inputs for chickpea: Theavailability of recommended inputs for chickpea indicates thatbasic inputs such as seed cum fertilizers drill (own and customhiring), tractor/cult ivator (own and custom hiring), labour(required mainly for harvesting) and bullock pair (own andcustom hiring) were available as per recommendation withonly 46.6, 43.3, 36.6, 33.3% of farmers, respectively (Table 1).Inputs like a bullock pair (own and custom hiring) and a tractor/cultivator (own and custom hiring) were also available with66.6 and 56.6% of farmers. Specific inputs namely, pheromonetraps, sprayer, Rhizobium, fungicides (carbendazim, thiram,Trichoderma), insecticide for pod borer control, improved andrecommended variety of chickpea, farmyard manure and seedcum fertilizers drill (own and custom hiring) were not availablewith 95, 95, 93.3, 91.6, 76.6, 70, 55 and 53.3% of farmers,respectively. None of the farmers had very specialized inputslike Trichoderma for soil treatment and s ulphur for cropnutrition.
Inferences were further drawn that chickpea sowing wasperformed just after lentil during rabi season. Both crops werenot sown simultaneously for an efficient utilization of availableresources. Dependency for inputs and custom hiring of tractorand bullocks consumed more time for sowing that delayedthe particular farming operation too. Inadequate availabilityof seed cum fertilizers drill might have resulted in broadcastingseeds for sowing and resorting to mixed cropping of chickpea.This is the reason for which about 30-40% chickpea area sownunder mixed cropping.
The technological inputs have a typical characteristicsand ability to integrate society through mutual sharing beforethe modern-day era. The inpu ts like bullocks and smallimplements which were previously used purely on sharingbasis had kept the society united and integrated for achievingcommon goals (Purushottam et al. 2008). This scenario hasbeen changed due to partial farm-mechanization. Moreover,dry land farming demands less labour and the operationsperformed are very much limited (Yadav et al. 2009). Labour ismainly required for chickpea harvesting followed by fieldpreparation, sowing and threshing. Inorganic fertilizers onlythrough DAP is being used but its use is restricted to crops/land use only with assured life saving irrigation. Moreover,only a limited number o f innovative, influential and largefarmers are ab le to arrange inpu ts like improved s eed,fungicides, bacterial cultu re, sprayer and ins ecticides bythemselves. This is the changed scenario revealed during thestudy while assessing the availability of technological inputsfor pulses.
Availability of recommended inputs for lentil: The data inTable 2 reveals the availability of recommended inputs forlentil. Similar to chickpea, the basic inputs such as seed cumfertilizers drill (own and custom hiring), a bullock pair (own
Input availability score Category
Chickpea Lentil Pigeonpea
Low ( x <-SD) <5.03 < 5.58 < 5.05
Medium ( x -SD to x + SD)
5.03 to11.73 5.58 to 11.36 5.05 to 9.19
High (> x +SD) >11.73 > 11.36 > 9.19

Purushottam et al. : Assessment of technological inputs for major pulses in Bundelkhand region 63
and custom hiring) and a tractor/cultivator (own and customhiring) were availab le with 66.6, 68.3 58.3% of farmers,respectively. Specific inputs namely, sprayer, pesticide for rustand aph id contro l, fung icide (carbendazim + thiram) orTrichoderma, pump set/ tube well (own and custom hiring),improved and recommended variety of lentil were not availablewith majority (91.6, 86.6, 86.6, 76.6 and 75.0% respectively) offarmers. Soil treatment with Trichoderma and N fixing bacterialculture with Rhizobium were not accessible to the farmer.
restricted and uncertainty prevailed . For example, timelyapplication of Trichoderma/Rhizobium cultures just beforeplanting could not be possible. Unavailability of inorganicfertilizers at sowing also caused its sub-optimal applicationincluding that of nitrogen and phosphorus. Replacement offertilizers by farmyard manure was not feasible as inadequateavailability of manure due to reduction in cattle population,anna pratha (loose animal for open grazing) and use of dungas a fuel. Lack of awareness, knowledge and unavailability ofquality Trichoderma for seed/soil treatment caused heavyyield losses in lentil due to root rot and wilt resulting in cropreplacement (shifting to other crops).
Table 1. Extent of availability of recommended inputs forchickpea
Extent of availability of inputs (%)*
S.N. Technological inputs
Recommended input/ha
A0 A1 A2 A3 1. Tractor/cultivator #
(own & custom hiring)
2-3 Ploughing 0 56.66 43.33 0
2. Bullock pair# (own & custom hiring)
2-3 Ploughing 0 66.66 33.33 0
3. Seed cum fertilizers drill# (own & custom hiring)
1 (Line sowing, seed, fertilizer placement)
53.33 0 46.66 0
4. Labour for harvesting (20) and others (10)
30 16.66 46.66 36.66 0
5. Seed of improved and recommended variety
80 kg (DCP 92-3, KGD 1168, JG 16)
70.00 16.66 13.66 0
6. (Carbendazim + thiram) or Trichoderma for seed treatment
( 80 g + 160 g) or 320 - 480 g
91. 66 3.33 5.00 0
7. Trichoderma for soil treatment
2.5 kg 100 0 0 0
8. Rhizobium for seed treatment
2 kg (10 x 200 g pack)
93.33 5.00 1.66 0
9. Farmyard manure 5 t 55.00 33.33 11.66 0 10. Nitrogenous
ferti lizers 9 kg N 50.00 31.66 13.66 5.00
11. Phosphatic ferti lizers
23 kg P2O5 46.66 40.00 10.00 3.33
12. Sulphur 10 kg S 100 0 0 0 13. Pump set/ tube
well# (own & custom hiring)
1 (Life saving irrigation)
46.66 36.66 16.66 0
14. Pheromone traps 5 95.00 1.66 3.33 0 15. Sprayer# 1 95.00 0 5.00 0 16. Insecticide for pod
borer control NPV 250 LE or NSKE (5%) 100 kg Neem seed and Endosulphan (0.07%) @1.5 L
76.66 13.66 6.66 0
*: Total number of farmers (n=60); #: Input available for more than one ha
Since lentil was sown in clay and clay loam soils (mar),ploughing was difficult requiring more time; and the demandfor bullocks, tractors and seed cum fertilizer drills increasedfor ensuring timely sowing and optimum seed and fertilizerplacement. Thus, availability of technological inputs was
Availability of recommended inputs for pigeonpea: The datain Tab le 3 revealed that inpu ts availab ility as perrecommendat ion was leas t in majority of the p igeonpeagrowers. The s pecific inputs such as pheromone t raps,sprayer, insecticide fo r pest control, phosphatic fert ilizers,
Table 2. Extent of availability of recommended inputs forlentil
Extent of availabil ity of inputs (%)*
S.N.
Technological inputs
Recommended input/ha
A0 A1 A2 A3 1. Ploughing by
Tractor/cultivator# (own & custom hiring)
2-3 Ploughing 0 58.33 41.66 0
2. Ploughing by bullock pair # (own & custom hiring)
2-3 Ploughing 0 68.33 31.66 0
3. Seed cum fertilizers drill # (own & custom hiring)
1 (Line sowing, seed, ferti lizer placement)
33.33 0 66.66 0
4. Labour for harvesting (14) and others (10)
24 15.00 50.00 35.00 0
5. Seed of improved and recommended variety
50 kg ( DPL 62, JL 1, JL 3)
75.00 11.66 13.33 0
6. (Carbendazim + thiram) or Trichoderma for seed treatment
(50 g + 100 g) Or 200- 300 g
86.66 8.33 5.00 0
7. Trichoderma for soil treatment
2.5 kg 100 0 0 0
8. Rhizobium for seed inoculation
2 kg (10 x 200 g pack)
100 0 0 0
9. Farmyard manure 5 t 50.00 30.00 20.00 0 10. Nitrogenous fertilizers 9 kg N 55.00 33.33 11.66 0 11. Phosphatic fertilizers 23 kg P2O5 50.00 41.66 8.33 0 12. Sulphur 10 kg S 100 0 0 0 13. Pump set/ tube well#
(own & custom hiring) 1(Life saving irrigation at pod formation)
76.66 16.66 6.66 0
14. Sprayer# 1 91.66 0 8.33 0 15. Pesticide for rust and
aphid control Mancozeb @1.25 L & Dimethoate @1.50L
86.66 8.33 5.00 0
*: Total number of farmers (n=60); #: Input available for more than one ha

64 Journal of Food Legumes 25(1), 2012
improved variety of pigeonpea and nitrogenous fertilizers werenot available with 95, 91.6, 85, 76.6, 75 and 70% of pigeonpeagrowers, respectively. Similarly, very specialized inputs namely,ridge maker (own & custom hiring), s oil treatment withTrichoderma, zinc and seed treatment with Rhizobium werealso not available with the farmers.
It was further inferred from the study that sowing ofpigeonpea depended primarily on rainfall during kharifseason. Unavailability of sufficient time increased demandfor resources i.e. bullocks, tractor and seed cum fertilizersdrill. The farmers with their own resources, had an edge overtheir counterparts (without own resources) for sowing thecrop first. This might be one of the reasons for broadcastingpigeonpea and its low acreage during kharif (30%) over rabi(70%) in Bundelkhand region. Manual weeding (cutting ofgrasses for fodder) was also performed at later stages of thecrop not falling under critical period for competition due toweeds. Thus, heavy weeds discouraged farmers to go forinorganic fert ilizers. Inadequate availab ility of life sav ingirrigation also caused heavy yield losses in pigeonpea. Lackof awarenes s, knowledge and inadequate availab ility ofinsecticide added a major concern to the above. Moreover,costly pesticides were not economical to all categories offarmers and sometimes farmers were reluctant to invest onthese crops (Singh et al. 2009).
Level of availability of recommended inputs in cultivationof pulses: It is evident from Table 4 that the availability of
Table 3. Extent of availability of recommended inputs for pigeonpea
Extent of availability of inputs (%)* S.N. Technological inputs Recommended input/ha A0 A1 A2 A3
1. Ploughing by tractor/cultivator# (own & custom hiring) 2-3 Ploughing 50.00 16.66 33.33 0 2. Bullock pair #
(own & custom hiring) 2-3 Ploughing 23.33 28.33 48.33 0
3. Ridge & furrow by Ridge maker# (own & custom hiring) 1 (Line sowing & drainage) 100 0 0 0 4. Labour for intercultural (15), harvesting (18) and others
(10) 43 16.66 50.00 33.33 0
5. Seed of improved and recommended variety 15 kg ( NA-1, Amar) 75.00 13.33 11.66 0 6. (Carbendazim + thiram) or Trichoderma for seed
treatment (15 g + 30 g) or 90 – 150 g 88.33 8.33 3.33 0
7. Soil treatment with Trichoderma 2.5 kg 100 0 0 0 8. Rhizobium for seed inoculation 2 kg (10 x 200 g pack) 100 0 0 0 9. Farmyard manure 5 t 38.33 51.66 10.00 0 10. Nitrogenous fertilizers 9 kg N 70.00 30.00 0 0 11. Phosphatic fertilizers 23 kg P2O5 76.66 23.33 0 0 12. Sulphur 10 kg S 100 0 0 0 13. Zinc 20 kg Zn 100 0 0 0 14. Irrigation by pump set/tube well # (own & custom hiring) 1 (Life saving irrigation) 50.00 36.66 13.33 0 15. Pheromone traps 5 95.00 1.66 3.33 0 16. Sprayer# 1 91.66 0 8.33 0 17. Insecticide for pest control NPV 250-350 LE or NSKE (5%) 100 kg
neem seed and Indoxacarb 500 ml 85.00 8.33 6.66 0
recommended inputs for chickpea was medium with majorityof the farmers (56.66%) followed by low (26.66%) and high(11.66%) input categories. Similarly in case of lentil, majorityof the farmers (63.33%) had medium level of input availabilityfollowed by low and high input categories. On the contrary,the availability of inputs for pigeonpea was low for majorityof the farmers (51.6%) followed by medium and high inputcategories. This is the reason why pigeonpea productivity isvery low in this region.
*: Total number of farmers (n=60); #: Input available for more than one ha
Chickpea Lentil Pigeonpea Availability of inputs No* Per cent No* Per cent No* Per cent Low Medium High
16 34 10
26.66 56.66 11.66
13 38 9
21.66 63.33 15.00
31 24 5
51.66 40.00 8.33
Total 60 100 60 100 60 100
Table 4. Extent of level of availability of recommended inputsin pulses
*Number of farmers
Thus, the study indicated that the primary technological(basic) inputs like bullocks, tractor, seed cum fertilizers drilland labour were available with majority of the farmers. Thes econdary (s pecific) ones such as farmyard manure,nitrogenous and phosphatic fertilizers were also available withfarmers to some extent . However, tertiary inputs (morespecialized ones) like quality seed, ridge maker, sulphur, zinc,

Purushottam et al. : Assessment of technological inputs for major pulses in Bundelkhand region 65
carbendazim, thiram, Trichoderma , and recommendedinsecticides were least available with the farmers. Moreover,medium and high input categories of farmers also had irrigationand stocks of nitrogenous and phosphatic fertilizers whereasthe lower one did not have these inputs. The farmers underhigh input category were also innovative and had goodlinkages with the line departments. Thus, they were able tomanage some of the tertiary inputs and had high productivityof crops.
A comparison among three pulses showed that overallinput availability with farmers was lowes t fo r pigeonpeafollowed by chickpea and lentil. The availability of qualityseed was comparatively higher in ch ickpea fo llowed bypigeonpea and lentil. The demand of wilt resistant varietiesof lentil as well as chickpea was very high and needed attentionon priority. The study also revealed that the village had 36tractors but a few sprayers and therefore, the recommendationon ins ecticides, herbicides and foliar s prays could not becarried out timely. Poor and imbalance use of fertilizers wasalso due to poor awareness about soil fertility and soil testingamong farmers. Risk against natural calamities and weatherconditions under changing climatic scenario also played animportant role in input use by farmers. Therefore, farmersminimized the risk by several ways th rough resort ing tomeasures such as intercropping (linseed/mustard) or mixedcropping (linseed/chickpea/mustard) in chickpea and lentil,and sorghum/urdbean in pigeonpea and fallow land. Hence,the average yield observed with available inputs in chickpea,lentil and pigeonpea was only 650, 520, 300 kg/ha, respectivelyand this could be at least doubled by ensuring availability ofa few technological inputs.
Thus, it may be inferred from the above that the overallinput availability may decide the productivity of a pulse cropin bundelkhand region. Meager input availability in case of
pigeonpea is the main reason for its low yields. Availability ofinputs with the farmers is also dependant on many socio-economic and biophysical factors associated with farmingcondition which should also be taken into account.
REFERENCES
Abrol IP. 2011. A report of the XII plan Working Group on NaturalReso urce Man agem en t an d Rain fed Farm ing. Cen tr e fo rAdvancement of Sustainable Agriculture, New Delhi. Pp 1.
Dar William D. 2009. Rainfed Agriculture: Unlocking the Potential.In: Wani Suhas P, Rockström J and Theib Oweis (Eds.), ICRISAT.India. Pp xii.
Fischer G, Shah M and Van velthuizen H. 2002. Climate change andagricultural vulnerability. IIASA special report commissioned byth e UN fo r t he world sum mit o n susta inable dev elopm en t,Johannesburg. Pp 160.
Nadarajan N. 2011. Vision 2030. Indian Institute of Pulses Research,Kanpur, Pp v.
Purushottam, Rao DUM and Singh Lakhan. 2008. Social integration inagrarian society: Key concern. Agriculture Today 3: 44-45.
Roy Burman R, Singh SK, Singh Lakhan and Singh AK. 2006. Adoptionof improved pulses production technologies and related constraintsin Uttar Pradesh. Indian Journal of Pulses Research 19: 104-106.
Samra JS. 2 009 . A r ep or t o n dro ught mitigat io n str at egies forBundelkhand region of U.P. and M.P.: Rainfed Authority of India,New Delhi. Pp 12.
Singh SK, Kumar Shantanu, Sah Uma and Singh AK. 2009. Participatorytechnological validation for integrated management of insect pestand diseases in kharif and rabi pulses in the Bundelkhand region.Journal of Food Legumes 22:131-134.
Singh SK, Roy BR, Chaudhary RG, Singh KK and Ansari S. 2005. Impactof usable t echnologies identified under pulse based r ainfed agroecosystem. Indian Journal of Pulses Research 18: 60-63.
Yadav VPS, Verma HK, Dalal RS, Shivrain DK, Godara AK and Yadav R.2009. Access of technological inputs for sustainable cultivation indrylands. Indian Research Journal of Extension Education 9: 17-21.
Journal of Food Legumes 25(1): 66-69, 2012
Short Communication
Estimates of genetic parameters in diverse genotypes of lentilPRAKASH SINGH1, RANJEET SINGH1, K. KUMAR1 and DHIRENDRA KUMAR SINGH2
1Department of Genetics and Plant Breeding, Narendra Deva University of Agriculture and Technology, Faizabad224 229, India; 2Department of Genetics and Plant Breeding, Institute of Agricultural Sciences, BHU, Varanasi 221005, India; E-mail: [email protected](Received: December 09, 2011; Accepted: January 31, 2012)
ABSTRACT
Two hundred forty five genotypes of lentils were evaluated forseed yield and its quality traits during 2009-2010. S ignificantgenotypic differences were observed for all the quality traitsstudied, indicating considerable amount of variation amonggenotypes. PCV was greater than GCV for all the characters.High GCV was observed for seed yield/plant, 100-seed weight,number of pods /pl ant, biologi cal yie ld and harvest inde x.Heritability estimates were high (>80%) for all the charactersexcept number of primary branches. Genetic advance were highfor seed yield/plant, 100-seed weight, number of pods/plant andbiological yield. Correlation studies indicated that most of theyield contributing characters were positively and significantlycorre lated at both phe notypi c and genotypi c l eve ls. Pathanalysis revealed direct effects of biological yield and harvestindex on seed yield. These characters merit special attentionin formulating selection strategy in lentils for developing highyielding varieties.
Key words: Correlation, Heritability, Lentils, Path coefficient,Quality traits, Yield
Lentil o r masoor (Lens cu l inaris Medik. subsp .culinaris, 2n = 14), is one of the important pulse crop of Indiaand belongs to the Leguminosae family. This crop is originatedin Eastern Mediterranean region which is the centre of geneticdivers ity (Zohari 1973, Ladizinsky 1979). Len til s eed isdigestible, constipating tonic and useful in diseases of chestand ulcer treatment. It is called poor man’s meat because lentilseeds contain 22-34.6% protein (Adsule et al. 1989). In India,lentil occupies 1.35 million ha area with an annual productionof 0.96 million tons and hav ing 693 kg /ha p roductivity(Anonymous 2011). It is mainly cultivated in Uttar Pradesh,Madhya Pradesh, Chhattisgarh, Jharkhand, Bihar and WestBengal. These states together account for 85% and 90% ofthe total area and production, respectively (Dixit et al. 2011).For making genetic improvement in s eed y ield throughconventional breeding approaches, it is necessary to havebasic knowledge on genetic variability, heritability and directeffect of contributing traits on grain yield. This informationcan be useful to formulate s elect ion criteria fo r len tilimprovement.
It is more useful to estimate heritability value togetherwith genetic advance in predicting the expected progress to
be achieved through selection. Germplasm serves as the mostvaluable natural reservoir in providing needed attributes forengineering successful varieties (Hawkes 1981, Burton 1952,Johns on et al. 1955). The correlat ion coefficient gives ameasure of the relationship between traits and provides thedegree to which various characters of a crop are associatedwith productivity. Singh et al. (2009) reported positive andsign ificant ass ociat ions o f s eed yield with pods/plan t,biological yield/plant and harvest index in lentil. Negativecorrelat ions are o ften found between morpholog icalcomponents of yield in crop plants. They probably ariseprimarily from developmentally induced relationships (Tambalet al. 2000). In present investigation, genetic variability withthe aid of genetic parameters and it s association betweenyield and its components such as GCV, PCV, heritability (h2),genetic advance (GA) and direct effect were studied amonglentil genotypes.
The experimental material was comprised o f twohundred forty five (245) genotypes/strains including 5 checksnamely, ‘NDL-1’, ‘NDL-2’, ‘DPL-15’, ‘DPL-62’ and ‘PL-5’ oflentil were collected from Indian Institute of Pulses Research,Kanpur and NDUA&T, Kumarganj, Faizabad. These entrieswere evaluated in Augmented Block Design in 12 blocks duringrabi season of the year 2009-11 at Research Farm, NDUA&T,Faizabad. Each genotype was sown in field of three meterslength with row to row and plant to plant spacing of 30 cm and5 cm, respectively. All recommended cultural practices andplant protection measures were followed to raise a healthycrop. Five randomly taken plants of each genotype was usedto record the observations on 11 characters viz., days to 50%flowering, days to maturity, p lant heigh t (cm), p rimarybranches, secondary branches, pods/plant, seeds/pod, 100-seed weight (g), biological yield/plant (g), seed yield/plant (g)and harvest index. Standard s tat is tical p rocedures andmethods were used to analyse variance, genotypic (GCV) andphenotypic (PCV) coefficients of variation, heritability (h2),genetic advance as per cen t o f mean , geno typ ic andphenotypic correlation coefficients.
Significant difference among the genotypes for all thecharacters was observed , s uggest ing the p res ence o fconsiderable amount of variability as reported earlier by Rahulet al. (2007). The estimates of GCV were high for seed yield/

Singh et al. : Estimates of genetic parameters in diverse genotypes of lentil 67
plant, 100-seed weight, pods/plant, biological yield/plant andharvest index (Table 1). These results were in conformity withthe findings of Anita et al. (2007) and Singh et al. (2009).Other characters showed low to moderate est imates ofcoefficient of variability; suggesting hybridization involvingdiverse genotypes may led to an overall increase in spectrumof genetic recombinants in lentil.
Heritability (broad sense) estimates were high (>80%)for all the characters except primary branches/plant. Geneticadvance as per cent of mean for different characters rangedfrom 6.216% to 54.994% and were high for seed yield/plant,
100-seed weight, pods/plant and biological yield/plant. Highheritability coupled with high genetic advance over mean wasobserved for pods/plant, harvest index, days to 50% flowering,days to maturity. High estimates of heritability value togetherwith genetic advance is usefu l in predicting the expectedprogress to be achieved through selection.
Knowledge of nature and magnitude of associationsamong different characters are important for the breeder tomake an effect ive selection based on the correlated anduncorrelated respons e. The geno typic and phenotyp iccorrelation coefficients between yield and yield attributes are
Table 2. Genotypic and phenotypic correlation coefficients among different characters in lentil genotypesCharacters Days to
50% flowering
(no.)
Days to maturity
(no.)
Plant height (cm)
Primary branches/ plant (no.)
Secondary branches/ plant (no.)
Pods/ plant (no.)
Seeds/ pod (no.)
Biological yield/
plant (g)
Harvest index (%)
100-seed weight (g)
Seed yield/
plant (g)
1.000 0.894** -0.035 0.076 0.066 -0.052 -0.159** -0.022 -0.033 0.163** -0.045 Days to 50% flowering (no.) 1.000 0.906** -0.037 0.126 0.074 -0.052 -0.161** -0.020 -0.035 0.164** -0.045
1.000 0.032 0.138* 0.115* 0.014 -0.214** 0.081 -0.005 0.224** 0.039 Days to maturity (no.) 1.000 0.033 0.192** 0.128* 0.017 -0.218** 0.083 -0.011 0.228** 0.037
1.000 0.047 -0.113 -0.073 -0.037 0.109 -0.248** 0.045 -0.078 Plant height(cm) 1.000 0.071 -0.120 -0.077 -0.039 0.106 -0.250** 0.049 -0.080 1.000 0.676** 0.475** -0.076 0.501** 0.127* 0.079 0.407** Primary branches
/plant (no.) 1.000 0.784** 0.544** -0.085 0.551** 0.162** 0.083 0.462** 1.000 0.683** -0.098 0.672** 0.331** 0.149** 0.653** Secondary branches
/plant (no.) 1.000 0.728** -0.097 0.721** 0.352** 0.155** 0.695** 1.000 0.096 0.801** 0.612** -0.025 0.905** Pods/plant (no.) 1.000 0.097 0.810** 0.617** -0.024 0.907** 1.000 -0.075 -0.171** -0.929** -0.148* Seeds/ pod (no.) 1.000 -0.075 -0.171* -0.932** -0.148* 1.000 0.236** 0.185** 0.815** Biological
yield/plant(g) 1.000 0.250** 0.185* 0.819** 1.000 0.287** 0.749** Harvest index
(%) 1.000 0.292** 0.753** 1.000 0.294** 100-seed weight (g) 1.000 0.294** 1.000 Seed yield/plant (g) 1.000
*, **: Significant at P = 0.05 and 0.01, respectively
Table 1. Analysis of variance, coefficient of variability, heritability and genetic advance for different characters in lentil genotypes
Characters/ Source of variation
d.f. Days to 50%
flowering (no.)
Days to maturity
(no.)
Plant height (cm)
Primary branches/
plant (no.)
Secondary branches
/plant (no.)
Pods/ plant (no.)
Seeds/ pod (no.)
Biological yield/
plant (g)
Harvest index (%)
100-seed weight
(g)
Seed yield
/plant (g)
Blocks 11 2.739** 2.767** 10.412** 0.158** 0.888* 327.869** 0.0009* 4.567** 6.735** 0.008** 0.337** Checks 4 145.567** 345.047** 73.572** 2.441** 4.124** 721.423** 0.6268** 3.986** 40.249** 3.912** 0.141** Error 44 0.335 0.606 1.097 0.037 0.249 2.189 0.0003 0.051 0.267 0.001 0.001 PCV 5.483 3.141 10.821 12.463 13.791 22.791 1 3.277 18.571 14.956 23.927 26.731 GCV 5.435 3.078 10.452 10.944 12.969 22.735 13.237 18.448 14.853 23.856 26.714 Heritability (h2) 0.983 0.961 0.933 0.771 0.884 0.995 0.994 0.987 0.986 0.994 0.998 Genetic Advance (GA)
8.799 7.795 7.785 0.635 2.678 43.629 0.468 4.021 8.946 0.993 1.737
Genetic advance (% of mean) 11.098 6.216 20.798 19.796 25.125 46.721 27.186 37.754 30.387 48.998 54.994
L 71.133 111.050 21.773 2.167 7.260 53.317 1.028 5.562 18.614 1.169 1.655 Range H 99.533 140.450 51.813 4.217 14.340 139.597 2.108 14.382 42.852 3.986 5.017
*, **: Significant at P = 0.05 and 0.01, respectively; L= Low, H= High

68 Journal of Food Legumes 25(1), 2012
presented in Table 2 revealed that association of seed yieldwas positive and significant with pods/plant, biological yield/plant, harvest index and secondary branches/plant both atgenotypic and phenotypic levels, whereas it was significantlyand negatively correlated with days to 50% flowering, plantheight and seeds/pod . Th is indicates that late floweringgenotypes had short reproduct ive period that results intolow yield. The degree of ass ociation was highest betweenpods/plant and seed yield followed by biological yield/plantand pods/plant. High positive correlation of pods/plant withseed y ield /plant may be at tributed to the increased sinkstrength. Rahul et a l. (2007) and Singh et a l. (2009) alsosuggested that yield could be raised by selecting for earliness,tallness and more pods/plant which is evident in the presentstudy. Amongst the other characters, pods/plant showedpos itive and significant correlation with b iological yield,secondary branches/plant and harvest index, suggesting thatincreased pods/plant is associated with more production ofbiological yield/plant, harvest index and secondary branches/plant.
Biological yield/plant also exhibited significant positiveassociation with primary branches/plant and 100-seed weight.Days to 50% flowering revealed significant association withdays to maturity. However, at phenotypic level, seeds/podrevealed negative significant correlation with 100-seed weight.Days to maturity showed positive significant correlation withprimary branches/plant, secondary branches/plant and 100-seed weight at both phenotypic and genotypic levels. Theseresults are in good agreement with Anita et al. (2007) andTyagi and Khan (2010). As per the primary branches/plant isconcerned, it showed the positive correlation with seed yield/plant, secondary branches/plant, biological yield/plant andpods/plant. Similarly, s econdary branches /plant revealedsignifican t as sociation with pods /plant, bio logical yield,harvest index and 100-seed weight at both levels, similar resultswere also reported by Anita et al. (2007) and Singh et al.(2009); which indicated the inherent relationship among thecharacters and masking effects of environments.
Path coefficient analysis measures the direct influenceof one variable upon the other and permits s eparation ofcorrelation coefficients into components of direct and indirecteffects. Portioning of total correlation into direct and indirecteffects prov ides actual in fo rmat ion on con tribut ion ofcharacters and thus forms the basis for selection to improvethe yield. Path coefficient analysis for seed yield/plant revealedthat the traits like biological yield/plant (0.6238) and harvestindex (0.5449) showed highest positive direct effect towardsseed yield. These results agree with the earlier reports of Tyagiand Khan (2010).
Days to 50% flowering, days to maturity, plant heightand primary branches/plant exhibited negative direct effecton seed yield. Although primary branches/plant had negativedirect effect on seed yield but it also had positive indirect
effect on seed yield through biological yield/plant. Similarly,pods/plan t had positive indirect effect on seed yield viabio logical yield were the main reason for s trong posit ivecorrelation of this character with seed yield (0.905**). While,positive ind irect effect on s eed y ield als o exh ib ited bysecondary branches/plant, harvest index and 100-seed weightvia biological yield. Similar findings were also recorded bySingh et al. (2009) and Tyagi and Khan (2010).
For seeds/pod, the direct effect was positive while itsassociation with seed yield was observed to be negative,indicating the importance of restricted selection model forexploitation of the direct effect noticed. Days to 50% flowering,days to maturity and plant height had negative or low directeffect but showed high negative indirect effect on seed yieldthrough harvest index. These results indicated that harvestindex, biological yield, pods/plant, secondary branches/plantand 100-s eed weigh t were important yield con tribu tingcharacters. The negative contribution of days to floweringand days to maturity indicated that our selection criteria shouldbe focused on earliness to improve yield. At both (genotypicand phenotypic) level, indirect contribution of harvest indexwas positive on seed yield via secondary branches /plant,pods/plant, biological yield/plant, 100-seed weight and primarybranches/plant and also association with seed yield waspositively significant. Similarly, the indirect contribution of100-seed weight was positive via all the traits except pods/plant and seeds/pod. Tyagi and Khan (2010) also identifiedharvest index and biological yield as important characters fordetermining lentil seed yield. The residual effect was found tobe moderate which indicates that there may be some more itsasso-components that are contributing towards seed yield.
On the basis of results, it can be concluded that whatevermay be the character chos en fo r increas ing the y ield byselecting ideotypes having high biological yield, harvest index,more pods/plant, secondary branches /plant and 100-seedweight. These traits showed positive direct effects along withsignificant and positive association with yield. Therefore,these traits are likely to be success fully employed for theselection of high yielding lentil genotypes.
REFERENCES
Adsule RN, Kadam SS and Leung HK. 1989. Lentil. In: DK Salunkheand SS Kadam (Eds), Hand Book of World Legumes, Volume II.CRC Press, Boca Raton, USA. Pp 131-152.
Anita A, Aich SS and Shrivastava MP. 2007 . Gen etic variability,correlation and co-heritability studies on yield and its componentsin lentil. Journal of Interacademicia Nadia 11: 247-250.
Anonymous. 2011. Directorate of Economics and Statistics, Ministryof Agriculture, Govt of India, New Delhi.
Burton GW. 1952. Quantitative inheritance in grasses. Proceedings of6th International Grassland Congress 1: 227-283.
Dixit GP, Katiyar PK and Singh BB. 2011. Characterization of lentil(Lens culinaris Medik.) varieties based on morphological traits.Journal of Food Legumes 24: 194-197.

Singh et al. : Estimates of genetic parameters in diverse genotypes of lentil 69
Hamdi A, El-Ghareib AA, Shafey SA and Ibrahim MAM. 2003. Directand indirect relationship among lentil characters. Egyptian Journalof Agriculture Research 81: 139-150.
Hawkes JG. 1981. Germplasm collection, evaluation and use. In: KJFrey (Ed), Plant Breeding (2nd Ed), Iowa State University Press,Iowa, USA. Pp 57-84.
Johnson HW, Robinson HF and Co mstock RE. 1955. Estimates ofgenetic and environmental variability in soybean. Agronomy Journal47: 314-318.
Ladizinsky G. 1979. The origin of lentil and wild gene pool. Euphytica28:179-187.
Rahul S, Sharma P and Brar JS. 2007. Genetic studies for physiologicaltraits and their relationship with seed yield in lentil. Journal ofFood Legumes 20: 29-32.
Singh S, Singh I, Gill RK, Kumar S and Sarker A. 2009. Genetic studiesfor yield and component characters in large seeded exotic lines oflentil. Journal of Food Legumes 22: 229-232.
Tambal HAA, Erskine W, Baalbaki R and Zaiter H. 2000. Relationshipof flower and pod numbers per inflorescence with seed yield inlentil. Experimental Agriculture 36: 369-378.
Tyagi SD and Khan MH. 2010. Studies on gen etic var iability andinterrelationship among the different traits in Micro-sperma lentil(Lens culinaris Medik). Journal of Agriculture Biotechnology andSustainable Development 2: 15-20.
Zohari D. 1973. The wild progenitor and place of origin of the cultivatedlentil: Lens culinaris. Economic Botany 26: 326-332.

Journal of Food Legumes 25(1): 70-72, 2012
Short Communication
Variability studies in some genotypes of chickpea (Cicer arietinum L.) under ricefallowARPITA SHRIVASTAVA, ANITA BABBAR, S.P. SHRIVASTAVA and S.S. SHUKLA
Department of Plant Breeding and Genetics, JNKVV, Jabalpur – 482 004, Madhya Pradesh, India;E-mail: [email protected](Received: July 25, 2011; Accepted: February 25, 2012)
ABSTRACT
This investigation was carried out to identify superior genotypesof chickpea on the basi s of yield and milling quality traitsgrown under rice fallow condition during genetic coefficient ofvariation, heritability and genetic advance were observed fortotal pods/plant, effective pods/plant, 100 seed weight, seed yield/plant and biological yield. S eed yiel d shared positive andsignificant association wi th harvest index, bi ological yield,effective pods/plant, total pods/plant, secondary branches andpri mary branches. Biological yield, harvest i ndex, days tomaturity, effective pods/plant and seeds/pod exhibited maximumdirect positive effect on seed yield/plant. Some lines such as‘ICCV 07111’, ‘Pusa 372’, ‘Vaibhav’, ‘PG 186’, ‘JG 16’, ‘DCP92-3’, ‘JG 11’ and ‘JG 14’ had better milling quality traits.
Key words: Chickpea, Clust er analys is, Correlation, Geneticvariability, Milling quality, Path analysis
Among puls es, Chickpea is the world ’s third mostimportant food legume cultivated in Indian subcontinent,West Asia, the Mediterranean, North Africa and the America.India contributes the major share to the global chickpea area(about 65%) and production (68%) of chickpea. In India, it isg rown in 8.75 million ha area with a product ion andproductivity of 8.25 million tons and 943 kg/ha, respectively(DAC 2011).
In India, substantial area after the harvest of kharif riceremains fallow during the rabi season. Nearly 82% of the ricefallows are located in the states of Bihar, Madhya Pradesh,Chhattisgarh, Orissa and Assam. Such fallow land can beused to grow an additional crop. Chickpea can be a suitablecrop that can be grown profitably on residual soil moisture inrice fallow with minimum irrigation. It is well adapted to growon residual soil moisture in the post rainy season because ofits deep and prolific root system. There is an ample scope forexpans ion of chickpea area th rough adopt ion of shortduration, high yielding and disease resistant varieties. Earlysowing and minimum tillage in rice fallow make chickpeaproduction more economical and sustainable (Pande et al.2009).
Chickpea is widely consumed as a s upp lement incombination with cereals, making it a well balanced humanfood. Most of the produce in India is milled into dal at domesticlevel and the rest is sold in the market at low price where it is
converted into dal by o rganis ed pu lse milling industries.Therefore, it is imperative to assess the genetic variabilityand interrelationship of the traits related to milling quality.
The experimental materials comprised 16 genotypes ofchickpea. These were evaluated in a rice fallow field followingrandomized complete b lock des ign (RCBD) with th reereplications during rabi 2010-11 at Seed Breeding Farm, JNKVV,Jabalpur. Each genotype was sown in 12 rows plot of 4m lengthwith a spacing of 30 cm × 10 cm. Recommended agronomicpractices were followed to raise a good crop. The data wererecorded on 5 randomly taken competitive plants in each plotfor days to flower initiation, days to 50% flowering, days topod initiation, days to maturity, plant height (cm), primarybranches (no.), secondary branches (no.), total pods per plant(no.), effective pods per plant (no.), 100 seed weight (g), seedsper pod (no.), seed yield per plant (g), biological yield (g),harvest index (%) and seed yield (kg/ha). Standard statisticalprocedures were adopted for calculating values of variousgenetic parameters, correlat ion coefficient and genet icdivergence.
Fourteen desi genotypes (Table 1) were subjected tomilling analysis by small scale dal mill developed by CFTRI,Mysore at Post Harvest Laboratory, JNKVV, Jabalpur. Thegrains were milled at 8-10% moisture content. One kg of eachgenotype was milled in two replications. The bulk of milledsample was co llected and its d ifferent ingred ients wereseparated. The ingredients were categorized in six groups,viz., hull, dal, gota, gota mixture, broken and powder. On thebasis of weight of different ingredients, gota index, dal index,dal with hull index, broken index, gota + dal index, overallmilling efficiency and dal recovery rate were calculated.
High genet ic coefficien t o f variation (GCV) andphenotypic coefficient of variation (PCV) were shown by the100 seed weight, seed yield per plant, effective pods per plant,total pods per plant, harvest index and biological yield, whereaslow values of these parameters were recorded for days to 50%flowering (Data not p resented). Thes e resu lts were inagreement with the findings of Meena et al. (2006).
High heritab ility estimates were recorded for all thecharacters except seeds per pod (32.85%) and primary branchesper plant (28.90%). Similar finding have also been reported byArshad et al. (2002), Muhammad et al. (2004) and Anbessaet a l. (2006). High heritability coupled with high genet ic

Shrivastava et al. : Variability studies in some genotypes of chickpea (Cicer arietinum L.) under rice fallow 71
advance (GA) was observed for 100 seed weight, seed yieldper plant, seed yield, effective pods per plant and total podsper plan t. The characters that s howed high GCV, highheritability and high GA were total pods per plant, effectivepods per plant, 100 seed weight, seed yield per plant andbiological yield. This will enable the breeders to select plantson the basis of phenotypic expression as additive gene effectsare more important for such characters.
Seed y ield per plan t s hared pos it ive significan tassociation with harvest index, biological yield, effective podsper plant, total pods per plant, secondary branches per plant
and primary branches per plant (data not presented). Thusselection for these traits would be effective for improvementin seed yield. Similar findings have also been reported byTaleb i et a l. (2007), Singh and Sandhu (2008),Bhushan and Jaiswal (2009), Bicer (2009) and Hahid et al.(2010).
The path analysis revealed that biological yield showedhighest positive direct effect on seed yield followed by harvestindex and days to maturity (data no t mentioned). Thus,selection based on harvest index and biological yield per plantwould be effective for improving yield. This further impliesthat these components are important yield determinants inchickpea. The earlier reports similar to the present studieshave also been reported for biological yield and harvest index(Babbar and Patel 2005), days to maturity, plant heigh t,secondary branches per plant. Hence, prime emphasis shouldbe given to these traits during selection of promising genotypesfor further advancement of yield in chickpea.
All the 16 genotypes fell into five clusters. The clusterI was the largest, consisting of 11 genotypes (Table 2). ClusterII compris ed 2 geno types ‘ICCV 05106’, ‘ICCV 06107’.Remaining three clusters contained one genotype only. These
Table 1. Genetic parameters of variability for yield and itscomponents of chickpea under rice fallow condition
Character Mean Range SEm CV (%) Flower initiation (days) 59 53 – 63 0.49 1.44 Days to 50% flowering (days)
65 61 – 68 0.46 1.25
Days to pod initiation (days)
71 64 – 78 0.48 1.18
Days to maturity (days) 112 105 – 119 0.68 1.06 Plant height (cm) 48.07 41.80 – 63.06 1.05 3.80 Primary branches (no.) 2.33 2.00 – 2.93 0.19 14.14 Secondary branches (no.)
6.51 4.00 – 8.06 0.51 13.73
Total pods /plant (no.) 50.22 29.26 – 76.33 0.97 3.37 Effective pods/plant (no.)
43.75 24.20 – 66.66 1.14 4.52
100 Seed weight (g) 23.16 13.06 – 34.70 0.41 3.12 Seeds/pod (no.) 1.08 0.94 – 1.25 0.04 7.60 Seed yield/ plant (g) 12.34 8.38 – 21.00 0.82 11.60 Biological yield (g) 23.85 14.66 – 29.33 1.13 8.21 Harvest index (%) 52.31 34.73 – 85.53 1.26 4.19 Seed yield (Kg/ ha) 2377.97 1490.66 – 3620.33 132.63 9.66
Table 2. Dis tribution of chi ckpea genotypes i n di fferentclusters grown under rice fallow condition
Cluster no No. of genotypes
Genotype
I 11 Rajas, JG 14, JG 11, Pusa 547, Vaibhav, GCP 105, ICCV 07111, PG 186, Pusa
372, JAKI 9218, JG 16 II 2 ICCV 05106, ICCV 06107 III 1 DCP 92-3 IV 1 AIG 21 V 1 Subhra
Table 3. Milling performance of desi chickpea genotypes grown under rice fallow condition
S.N. Genotypes Milling time (s)
Gota index
Dal index Dal with hull index
Broken index
Gota + dal index
Overall milling
efficiency
Dal recovery rate (%)
1 Rajas 3.65 0.05 0.53 0.89 0.73 0.56 0.37 47.76 2 Pusa 372 2.82 0.56 0.53 0.93 0.72 0.56 0.38 45.54 3 JG 11 3.12 0.16 0.42 0.89 0.73 0.56 0.37 37.06 4 DCP 92-3 2.71 0.05 0.63 0.96 0.77 0.66 0.48 53.26 5 GCP 105 3.11 0.08 0.45 0.90 0.67 0.52 0.32 40.44 6 Pusa 547 4.49 0.06 0.48 0.89 070 0.58 0.36 42.62 7 PG 186 3.54 0.09 0.55 0.76 0.94 0.79 0.57 48.02 8 Vaibhav 4.46 0.03 0.60 0.96 0.73 0.61 0.43 52.38 9 JG 14 4.25 0.07 0.46 0.92 0.65 0.53 0.36 42.88 10 JG 16 3.95 0.10 0.60 0.88 0.86 0.68 0.52 51.82 11 JAKI 9218 3.14 0.13 0.49 0.88 0.78 0.64 0.44 42.64 12 ICCV 06107 4.82 0.02 0.50 0.93 0.62 0.50 0.29 43.88 13 ICCV 07111 4.25 0.08 0.63 0.88 0.89 0.68 0.53 55.64 14 AIG 21 4.86 0.08 0.58 0.93 0.67 0.56 0.35 50.34 Mean 3.79 0.14 0.53 0.92 0.75 0.60 0.44 43.44 CD (P=0.05) 1.08 0.21 1.35 2.38 0.64 1.68 0.17 2.26

72 Journal of Food Legumes 25(1), 2012
resu lts indicated existence of ample diversity amongstgenotypes . Therefore, crossing genotypes from differentclusters would produce more genetic variability. On the basisof inter cluster distance cluster III and IV had maximum intercluster distance followed by II and III and cluster III and V.Maximum contribu tion towards genetic d ivergence wasobserved by 100 seed weight followed by harvest index, totalpods per plant and seed yield. These results are in conformitywith the findings of Dwivedi and Gaibriyal (2009), Hahid et al.(2010), Wadikar et al (2010) and Tomar et al (2011).
Dal milling basically consists of removal of pericarp,and transforms grains into split (dal) cotyledons without anybreakage. The milling characters depend on the size of seedand the ratio of different ingredients present during milling(Table 3). In the milling quality analysis, gota index were highfor ‘Pusa 372’ (0.56) followed by the ‘JG11’ (0.16), ‘JAKI 9218’(0.13) and ‘JG 16’ (0.10), whereas minimum in ‘ICCV 06107’(0.02). The highest dal index were found in the ‘ICCV 07111’(0.63) followed by ‘DCP 92-3’ (0.63), ‘JG 16’ (0.60) and ‘Vaibhav’(0.60), whereas lowest in ‘JG 11’ (0.42). Dal with hull indexwere highest in ‘Vaibhav’ (0.96) followed by ‘DCP 92-3’ (0.96),‘ICCV 06107’ (0.93) and ‘Pusa 372’ (0.93), whereas lowest in‘PG 186’ (0.76). Broken dal index were maximum in ‘PG 186’(0.94) with the minimum value (0.62) for ‘ICCV 06107’. Thehighest Gota + dal index were observed in ‘PG 186’ (0.79)followed by ‘JG 16’ (0.68), ‘ICCV 07111’ (0.68) and ‘DCP 92-3’(0.66). ‘PG 186’ showed the highest overall milling efficiency(0.57) followed by ‘ICCV 07111’ (0.53), ‘JG 16’ (0.52) and ‘DCP92-3’. Dal recovery rate was the maximum in ‘ICCV 07111’(55.64%) followed by ‘DCP 92-3’ (53.26), ‘Vaibhav’ (52.38) and‘JG 16’ (51.82). In conclusion, genotypes such as ‘ICCV 07111’,‘Pusa 372’, ‘Vaibhav’, ‘PG 186’, ‘JG16’, ‘DCP 92-3’, ‘JG11’ and‘JG 14’ could be rated good on the bases of their yield andquality attributes.
REFRENCES
Anbessa Y, Warkentin T, Vandenberg A and Ban M. 2006. Heritabilityand predicted grain from selection in component of crop durationin divergent chickpea cross population. Euphytica 152: 1–8.
Arshad M, Bakhsh A, Bashir M and Ahqqani M. 2002. Determining the
heritability and relationship between yield and yield components inchickpea (Cicer arietinum L.). Pakistan Journal of Botany 34: 237– 245.
Babbar A and Patel SK. 2005. Correlation and path analysis in desichickpea under Kymore Plateau Zone of Madhya Pradesh. J.N.K.V.V.Research Journal 39: 47-51.
Bhushan S and Jaiswal HK. 2009. Correlation and path analysis in shortduration chickpea. Journal of Food Legumes 22: 302.
Bicer BT. 2009. The effect of seed size on yield and yield componentof chickpea. African Journal of Biotechnology 8: 1482 –1487.
DAC. 2011. Agriculture statistics at a glance. Directorate of Economics& Statsitics, Department of Agriculture & Cooperation, Ministryof Agriculture, Govt. of India, New Delhi.
Dwivedi KK and Gaibriyal ML. 2009. Assessment of genetic diversityof cultivated chickp ea (Cicer arietinum L.) Asian Jo urnal ofAgricultural Science 1 (1): 7-8.
Hahid S, Malik R, Bakhsh A, Asif MA, Iqbal U and Iqbal SM. 2010.Assessment of genetic variability and interrelationship among someagronomic traits in chickpea. International Journal of AgriculturalBiology 12: 81-85.
Meena H, Kumar SJ and Desmukh PS. 2006. Genetic variability andcorrelation studied for traits related to drought tolerance in chickpea(Cicer arietinum L.). Indian Journal of Genetics and Plant Breeding66: 140.
Muhammad A, Bakhsh A and Gahoor A. 2004. Path coefficient analysisin chickpea (Cicer arietinum L.) under rainfed condition. PakistanJournal of Botany 36: 75-81.
Pande S, Sharma M, Neupane RK, Chaudhary RN, Rao JN, GrazywaczD, Bourai VA and St ev en sion P C. 2 009 . In tegrated cropmanagement strategy for improved chickpea production and itsim pact on liveho od of f arm ers in Nepal. Plant p rot ectionassociation of India, Hydrabad, India.
Singh A and Sandhu JS. 2008. Correlation and path analysis in chickpeaunder different environments. Indian Journal of Genetics and PlantBreeding 21: 32-33.
Talebi R, Fayaz F and Jelodar AB 2007 correlation and path coefficientanalysis of yield component of chickpea (Cicer arictinece L.) underdryland condition in the west of Iran. Asian Journal of Plant Sciences6: 1151–1154.
Tomar OK, Singh D and Singh D. 2011. Genetic divergence in chickpea.Journal of Food Legumes 24: 296-298.
Wadikar PB, Ghodke MK and Pole SP. 2010. Genetic Divergence forproductivity traits in chickpea. Journal of Food Legumes 23: 245-246.

Journal of Food Legumes 25(1): 73-75, 2012
Short Communication
Effect of phosphorus levels and bioinoculants on growth and yield of long durationpigeonpea [Cajanus cajan (L.) Millsp]AMITESH KUMAR SINGH and R.S. SINGH
Department of Agronomy, Institute of Agricultural Sciences, Banaras Hindu University, Varanasi-221005, India;Email: [email protected](Received: September 02, 2011; Accepted: December 05, 2011)
ABSTRACT
A field experiment was conducted during rainy season of 2008-09 and 2009-10 to study the effect of phosphorus levels (0, 25, 50and 75 kg P2O5 per ha) and bioinoculants (untreated control,PSB, PGPR and PSB + PGPR) on growth and yield of longduration pigeonpea. The results showed that the application of75 kg P2O5 pe r ha recorded the maxi mum plant hei ght,branche s/plant, dry matte r production/plant, chlorophyllcontent (SPAD), leaf area, LAI, grain yield, stalk yield, biologicalyield and harvest index, which were significantly superior over25 kg P2O5 per ha and control (without phosphorus application)but at par with 50 kg P2O5 per ha during both the years ofexperiment. Among the bioinoculants, dual inoculation of PSB+ PGPR significantly increased higher growth attributes suchas plant hei ght, branche s pl ant, dry matte r producti on,chlorophyll content, leaf area, LAI, grain yie ld, stalk yield,biological yield and harvest index, which were significantlysupe rior over alone appli cation of PSB, PGPR and control(without see d inocul ation) duri ng both ye ars ofexperimentation. Combined application of 75 kg P2O5 per ha +PSB + PGPR was found significantly superior to 25 kg P2O5 perha + PSB + PGPR and control (without phosphorus application+ without seed inoculation), which was at par with 50 kg P2O5per ha + PSB + PGPR during both years in respect of dry matterproduction (g), grain yield (kg/ha) and stalk yield (kg/ha).
Key words: Bioinoculants, Dry matter production, Grain yield,LAI, Phosphorus levels
Long duration pigeonpea (250-260 days) is generallygrown in mono/mixed cropping system in eastern U.P. withoutany improved agro-technology. This is main reason of lowproductivity of long duration pigeonpea. Phosphorus (P) is akey plant nutrient, but its fixation is another problem as only20-25 per cent of the phosphorus app lied to the s oils isavailable to the crop in the year of its application and theremaining part is converted into insoluble unavailable forms(Raju et al., 2005). Some heterotrophic microorganisms possessab ility to solubilis e phos phorus from ins oluble sourcesoccurring in soil. Phosphate Solubilising Bacteria (PSB) andPlan t Growth Promoting Rhizobacteria (PGPR) as s eeddress ers in nodulating legumes are highly beneficial inenhancing N and P con tent due to more N fixat ion byRhizobium and solubilisation of native P by PSB, thus, making
two essential nutrients availab le to p lants (Bansal, 2009).Cons idering the s ign ifican t ro le o f phos phorus andbiofertilizers in sustainable production of pulses, an experimentwas conducted to study the effect of phosphorus levels andbioinoculants on productivity of pigeonpea.
The field experiment was conducted during twoconsecut ive rainy s eas ons o f 2008-09 and 2009-10 atAgriculture Research Farm of Banaras Hindu University,Varanasi. The experimental soil was sandy clay loam in texturehaving pH 7.46 and 7.53 in 1st and 2nd year, respectively. It wasmoderately fertile being low in organic carbon (0.34 and 0.37%)with available N, P2O5, K2O and sulphur were 188.7, 18.5, 205.3,19.3 kg/ha and 194.2, 22.4, 210.6, 21.5 kg/ha during both theyears, respectively. The experiment was laid out in split plotdesign with three replications keeping phosphorus levels(control, 25, 50 and 75 kg/ha) in main plot and bioinoculants(Control, PSB, PGPR and PSB + PGPR) in subplot at the samesite during both the years. The recommended dose of nitrogen,potassium, sulphur at 30, 40, 30 kg/ha and phosphorus as pertreatment were applied though urea, diammonium phosphate(DAP), muriate of potash and elemental sulphur, respectively.Pigeonpea seed were inoculated with phosphate solubilizingbacteria (Baci l lus po lymyxa ), PGPR (Rhizob ium +Pseudomonas fluorescens) and dual seed inoculation of PSB+ PGPR before sowing. Sowing of long duration pigeonpeacv. ‘Bahar’ was done by ridge-furrow method of planting onJuly 14, 2008 and July 20, 2009 and the crop was harvested onApril 06, 2009 and April 12, 2010, respectively. The requiredplant population (60 cm row to row and 20 cm plant to plant)was maintained after a month of seeding by thinning the plant.
Perusal of data (Table 1 and 2) revealed that theapplication of 75 kg P2O5/ha increased the growth attributesviz. plant height (cm), branches/plant, chlorophyll content,leaf area (cm2/plant), LAI and dry matter production/plant (g)and this treatment was significantly superior over 25 kg P2O5/ha and con trol (no application of phosphorus ) bu t, wasstatistically at par with 50 kg P2O5/ha during both the years.Maximum seed yield, stalk yield and bio log ical yield ofpigeonpea was found with application of 75 kg P2O5/ha whichwas at par with 50 kg P2O5/ha and significantly superior over25 kg P2O5/ha and contro l during bo th the years o f

74 Journal of Food Legumes 25(1), 2012
Table 2. Effect of phosphorus levels and bioinoculants on pigeonpea seed, stalk, biological yield and harvest index
Seed yield (kg/ha) Stalk yield (kg/ha) Biological yield (kg/ha) Harvest index (%) Treatment 2008-09 2009-10 2008-09 2009-10 2008-09 2009-10 2008-09 2009-10
Phosphorus levels (kg/ha) Control 1673 1508 6731 6405 8404 7913 19.87 19.02 25 1945 1795 7708 7363 9653 9158 20.11 19.58 50 2218 2068 8600 8398 10818 10465 20.47 19.71 75 2265 2124 8695 8528 10960 10651 20.64 19.89 SEm (±) 39 36 153 147 192 183 0.40 0.39 CD (P=0.05) 134 123 529 510 663 633 NS NS Bioinoculants Control 1693 1530 6913 6490 8605 8020 19.64 19.08 PSB 1999 1846 7818 7655 9816 9501 20.33 19.38 PGPR 2095 1945 8084 7920 10179 9865 20.55 19.67 PSB + PGPR 2314 2173 8920 8628 11233 10800 20.57 20.08 SEm (±) 29 27 114 110 143 138 0.28 0.27 CD (P=0.05) 86 80 333 321 419 401 NS NS
Table 3. Interaction effect of phosphorus levels (P) and bioinoculants (M) on pigeonpea dry matter production/plant (g) at harvest
2008-09 2009-10 Treatment Control PSB PGPR PSB + PGPR Control PSB PGPR PSB +
PGPR Control 197.0 246.9 255.0 294.6 196.0 234.7 242.7 282.5 25 230.8 278.0 286.0 326.4 230.0 265.8 272.7 314.2 50 286.6 316.3 326.5 359.4 274.0 304.0 314.4 347.1 75 296.1 326.6 336.1 381.6 289.0 316.0 324.0 365.0
SEm (±) CD (P=0.05) SEm (±) CD (P=0.05) M at same P 8.6 25.1 8.3 24.2
P at same/diff M 9.4 29.5 9.1 28.4
Table 1. Effect of phosphorus levels and bioinoculants on pigeonpea growth attributes
Plant height (cm)
Branches/plant (no.)
Dry matter production/plant (g)
Chlorophyll content (SPAD)
Leaf area (cm2/plant)
Leaf area index (LAI)
At harvest At 200 DAS At 150 DAS
Treatment
2008-09 2009-10 2008-09 2009-10 2008-09 2009-10 2008-09 2008-09 2008-09 2009-10 2008-09 2009-10 Phosphorus levels (kg/ha) Control 180.7 174.7 19.3 18.4 248.4 239.0 34.4 32.5 3645 3390 3.04 2.82 25 196.0 190.3 21.7 20.8 280.3 270.6 39.4 36.7 3991 3736 3.33 3.11 50 212.7 205.2 24.3 23.3 322.2 309.8 44.5 41.0 4347 4092 3.62 3.41 75 215.2 206.8 25.1 23.7 335.1 323.5 45.1 41.8 4370 4114 3.64 3.43 SEm (±) 3.9 3.8 0.4 0.4 5.8 5.6 0.8 0.7 80.3 75.1 0.07 0.06 CD (P=0.05) 13.6 13.2 1.5 1.4 20.0 19.3 2.7 2.5 277.8 260.0 0.23 0.22 Bioinoculants Control 184.5 177.7 19.6 18.9 252.6 247.3 36.1 34.0 3785 3529 3.15 2.94 PSB 199.3 193.4 22.7 21.4 291.9 280.1 40.8 37.5 4010 3755 3.34 3.13 PGPR 205.0 198.2 22.9 21.9 300.9 288.5 41.3 38.2 4163 3907 3.47 3.26 PSB + PGPR 215.9 207.7 25.2 23.9 340.5 327.2 45.2 42.3 4396 4140 3.66 3.45 SEm (±) 2.8 2.7 0.3 0.3 4.3 4.2 0.6 0.5 57.5 54.1 0.05 0.05 CD (P=0.05) 8.3 8.0 0.9 0.9 12.6 12.1 1.7 1.6 167.9 157.8 0.14 0.13
investigation. Maximum harvest index was recorded withapplication of 75 kg P2O5/ha followed by 50, 25 kg P2O5/ha andminimum in control during both the years of study. Similarresults have been reported by Mahetele and Kushwaha (2011),Deshbhratar et al. (2010), Kumar and Kushwaha (2006).
Seed inocu lation with bio inoculants proved it ssuperiority over untreated contro l with res pect to g rowthattributes viz. plant height (cm), branches/plant, dry matterproduction/plant (g), chlorophyll content (SPAD), leaf area(cm2/p lan t) and LAI in p igeonpea (Tab le 1 and 2). Dual

Singh and Singh : Effect of phosphorus levels and bioinoculants on growth and yield of long duration pigeonpea 75
inoculation of PSB + PGPR recorded higher value of all thegrowth attributes and which was significantly superior overseed inoculation with PSB, PGPR and control. Seed inoculationof PSB was significantly superior over control (without seedinoculation) and at par with seed inoculation with PGPR.Higher seed yield, stalk yield and biological yield was obtainedwith dual s eed inoculat ion of PSB + PGPR which wassignifican tly superior over s eed inoculation of PSB, PGPRand control during both the years of experimentation. Highestharvest index was obtained with dual seed inoculation of PSB+ PGPR followed by PGPR, PSB and lowest in control duringboth the years of invest igation. Similar results have beenreported by Bansal (2009) in mungbean and Tilak et al. (2006)in pigeonpea.
Interact ion effects o f phos phorus levels andbioinoculants on dry matter production/plant at harvest, seedyield and stalk yield were found significant (Tables 3,4 and 5)during both the years of experimentation. Maximum dry matterproduction/plant, seed and stalk yield were obtained withcombined application of 75 kg P2O5/ha + PSB + PGPR and thiscombinat ion was s ign ificant ly s uperio r over o thercombinations and which was at par with combined applicationof 50 kg P2O5/ha + PSB + PGPR during bo th the years ofexperimentation. Similar results were also reported by Singhand Pareek (2003) in mungbean and Dubey (1997) in rainfedsoybean.
Thus, it can be inferred that application of 75 kg P2O5/ha alongwith seed inoculation with PSB + PGPR would behelpful in getting more growth attributes and higher yield ofpigeonpea.
REFERENCES
Bansal RK. 2009. Synergistic effect of Rhizobium, PSB and PGPR onnodulation and seed yield of mungbean. Journal of Food Legumes22: 37-39.
Deshbhratar PB, Singh PK, Jambhulkar AP and Ramteke DS. 2010.Effect of sulphur and phosphorus on yield, quality and nutrientsst atus o f p igeonp ea (Ca ja nus ca ja n L . Millsp.) . Journal ofEnvironmental Biology 31: 933-937.
Dubey SK. 1997. Co-inoculation of phosphorus solubilizing bacteriawith Bradyrhizobium japonicum to increase phosphate availabilityto rainfed soybean on vertisol. Journal of Indian Society of SoilScience 45: 506-509.
Kumar Avnish and Kushwaha HS. 2006. Response of pigeonpea (Cajanuscajan) to sources and levels of phosphorus under rainfed condition.Indian Journal of Agronomy 51: 60-62.
Mahetele Dev endra an d Kushwaha HS. 20 11. Product iv ity andprof it ability of p igeon pea as inf luenced by FYM, P SB andphosphorus fertilization under rainfed condition. Journal of FoodLegumes 24: 72-74.
Raju RA, Subba Rao A and Rupa TR. 2005. Strategies for integratedphosphorus management for sustainable crop production. IndianJournal of Fertilizers 1 (8): 25-28.
Singh B and Pareek RG. 2003. Effect of phosphorus and biofertilizerson growth and yield of mungbean. Indian Journal of Pulses Research16: 31-33.
T ilak KVBR, Ranganayaki N and Manoharachari C. 2006. Synergisticeffects of plant growth promoting rhizobacteria and Rhizobium onnodulation and nitrogen fixation by pigeonpea [Cajanus cajan (L.)Millsp.]. European Journal of Soil Science 57: 67-71.
Table 4. Interaction effect of phosphorus levels (P) and bioinoculants (M) on pigeonpea seed yield (kg/ha)
2008-09 2009-10 Treatment Control PSB PGPR PSB + PGPR Control PSB PGPR PSB + PGPR
Control 1400 1660 1720 1910 1200 1500 1570 1760 25 1620 1880 2000 2280 1470 1730 1850 2130 50 1850 2205 2315 2500 1700 2055 2165 2350 75 1900 2250 2345 2565 1750 2100 2195 2450
SEm (±) CD (P=0.05) SEm (±) CD (P=0.05) M at same P 59 172 55 160
P at same/diff M 64 199 59 185
Table 5. Interaction effect of phosphorus levels (P) and bioinoculants (M) on pigeonpea stalk yield (kg/ha)
2008-09 2009-10 Treatment Control PSB PGPR PSB + PGPR Control PSB PGPR PSB + PGPR
Control 5880 6670 6775 7600 5200 6500 6620 7300 25 6670 7500 7860 8800 6000 7350 7700 8400 50 7500 8500 8800 9600 7300 8340 8640 9310 75 7600 8600 8900 9678 7460 8430 8720 9500
SEm (±) CD (P=0.05) SEm (±) CD (P=0.05) M at same P 228 666 220 643
P at same/diff M 250 780 241 753

Journal of Food Legumes 25(1): 76-78, 2012
Short Communication
Status of Macrophomina stem canker disease of pigeonpea in two districts of EasternUttar PradeshSURINDER KAUR, V.B. CHAUHAN, R.B. SINGH and J.P. SINGH
Department of Mycology & Plant Pathology, Institute of Agricultural Sciences, Banaras Hindu University (BHU),Varanasi – 221 005, India; E-mail: [email protected](Received: February 09, 2011; Accepted: February 17, 2012)
ABSTRACT
A roving survey was conducted during 2008-09 and 2009-10 ofpigeonpe a crop at vari ous places of Varanasi and Mirzapurdistricts of Uttar Pradesh to know the status of Macrophominastem canker (MSC). The MSC incidence recorded in the rangeof 1 to 60% in 2008-2009 and 0 to 19.5% in 2009-2010. Theincidence during 2008-2009 was highest at Dhaurahara (60%)followed by Chilbilla (25%), Dugmugpur, Arjunpur and Basani(20%), Lalpurchatti (10.25%), Fulwaria (10%) and Sagarpur(9.5%). During 2008-09, hundred per cent disease prevailed inboth the districts, while in 2009-10 crop season, the diseaseprevalence was 52.63% and 75% in Mirzapur and Varanasidi stri ct, respectivel y. Due to the more conduci ve weatherconditions for disease development in 2008-09 crop season, thedisease prevalence was so high.
Pigeonpea [Cajanus cajan (L.) Millspaugh] is one ofthe important food legume crops of the tropics and sub-tropics.It is mainly consumed as split pulse as ‘dal’ or fresh vegetable(de-hulled split peas) in some parts of India such as Gujrat,Maharashtra and Karnataka or as green vegetable in sometribal areas of various states (Saxena et al. 2010). Stem cankerincited by Macrophomina phaseo lina (Tassi) Goid hasemerged as one of the very important diseases of pigeonpea.M. phaseo lina is p rimarily so il borne in nature, withheterogeneous host specificity, that is, the ability to infectmonocots as well as dicots and non-uniform distribution inthe soil (Mayek-Perez et al. 2001, Su et al. 2001). The pathogenincites the disease by producing microsclerotia / pycnidia(primary s ource o f inoculum). Since the first report of itsoccurrence by Kannaiyan et al. (1979) in this part of EasternUttar Pradesh (Varanasi and Mirzapur districts), the incidenceof Macrophomina stem canker has increased gradually to takean alarming proposition in recent years. This may probablybe attributed to an increased environmental temperature anddrought conditions prevailing during past few crop seasons.The disease incidence varied from 2 to 70% in most fields andits severity ranged from 17 to 55% in the aforesaid regions ofEastern Uttar Pradesh (Kaur et al. 2009). Knowledge of theoccurrence and distribution of the stem canker of pigeonpeaand environmental variables that affect the disease is lacking.In view of the above facts, a survey was conducted to elucidatethe status of stem canker disease of pigeonpea in two districtsof Eastern Uttar Pradesh.
A roving survey of pigeonpea grown at various placesin Varanasi and Mirzapur districts was conducted during theyears 2008-09 and 2009-10 near maturity growth stage of thecrop. The pigeonpea fields were randomly selected at theinterval of 5-10 km along the roadside depending upon thetopography and the cultivation of pigeonpea in the aforesaidarea. Four 1.0 m2 quadrants were used, number of diseasedand healthy plants was counted and incidence of disease wascalculated. The per cent disease prevalence was calculatedusing following formula:
Locations showing stem canker diseasePer cent Prevalence = ---------------------------------------------- × 100
Total locations observed
Plants showing symptoms of stem canker from eachplace were collected for disease diagnosis and confirmationof the pathogen. A fungus was isolated asep tically fromdiseased parts on potato dextrose agar medium. The plateswere incubated at 25 ± 1°C for growth and development offungus. Koch’s postu late was proved and identity of thepathogen was confirmed. Meteorological data for the year2008-09 and 2009-10 were obtained from the Department ofAgronomy, Institute of Agricultural Sciences, Banaras HinduUniversity, Varanasi.
The disease incidence varied from 1 to 60% and 0 to19.5% in the aforesaid two years (Table 1). The incidenceduring 2008-2009 was highest at Dhaurahara (60%) followedby Chilbilla (25%), Dugmugpur, Arjunpur and Basani (20%),Lalpurchatti (10.25%), Fulwaria (10%) and Sagarpur (9.5%).While at rest of the places it ranged from 1.0-6.0%. Mirzapurdistrict had higher disease incidence as compared to Varanasi.In Mirzapur, disease occurrence varied from 1.0 to 60% and1.0 to 19.5% whereas in Varanasi it ranged from 1 to 25% and1 to 15% in two respective surveyed years. During 2008-09,hundred per cent disease prevailed in both the districts whilein 2009-10 crop seasons; it was 52.63% and 75% in Mirzapurand Varanasi district, respectively (Fig. 1).
Occurrence of disease at various places indicates widegeographical distribution of the Macrophomina stem cankerin the area covered. In the year 2009-10, the disease incidencewas lower than in 2008-2009. It could be attributed to theweather factors which affected growth and development of

Kaur et al. : Status of Macrophomina stem canker disease of pigeonpea in two districts of Eastern Uttar Pradesh 77
the disease. The maximum and minimum temperature recordedduring 2008-09 was 30.35°C and 21.49°C, respectively, whilein 2009-10 it was 29.97°C and 18.51°C. The mean temperatureduring the months of October to March varied from 28.54°C -19.55°C and 27.35°C - 14.12°C and the rainfall recorded duringOctober to March in 2008-09 and 2009-10 was 1.0 mm and 62.1
0
2 0
4 0
6 0
8 0
100
200 8-09 200 9-10
Dise
ase
Pre
vale
nce
(%)
Cropping season (Year)
Mirzapur Varanasi
Fig 1. Stem canker prevalence (%) during 2008-09 and 2009-10in pigeonpea crop in Varanasi and Mirzapur districts
Table 1: Per cent incidence of Macrophomina stem cankerof pigeonpea in different villages of Varanasi andMirzapur districts during 2008-09 and 2009-10
All the values are mean of 4 replicates
Disease incidence (%) District Village 2008-09 2009-10
Mirzapur Narayanpur 4.0 1.0 Sivnagar 2.0 1.0 Dudharpur 5.0 5.0 Arjunpur 20.0 0 Aamghat 5.0 1.5 Jhingura 6.0 5.0 Bharpura 5.0 0 Badri 6.0 1.0 Dugmagpur 20.0 10.0 Dhaurahara 60.0 19.5 Gurkhule 4.0 0 Tedha 2.0 0 Barsodha 5.0 0 Umeria 2.0 0 Sagarpur 9.5 1.0 Baripur 1.0 0 Lalpurchatti 10.25 2.0 Basarat 1.0 0 Lakhanpura 5.0 0 Varanasi Lohta bhatti 2.0 0 Akelwa 1.0 0 Gorai bajar 5.0 5.0 Nawada 2.0 2.0 Kapsehi 5.0 2.0 Fulwaria 10.0 6.0 Chilbilla 25.0 15.0 Basani 20.0 13.2
0
5
10
15
20
25
30
35
Oct Nov D ec J a n Feb Ma r
Cropping months (October -March)
Rai
nfa
ll (m
m)
2008-09 2009-10
0
5
10
15
20
25
30
35
40
O ct Nov D ec J an F e b Ma r
Cropping m onths (Oc tobe r -March)
Tem
pera
ture
(o C)
2008 -09 Max. 2 009-10 Max. 2008-09 Min. 2009-10 M in.
0
10
20
30
40
50
60
70
80
90
100
Oct Nov D ec J a n F eb MarCropping months (October - March)
Rel
ativ
e hu
mid
ity (
%)
2008-09 Max. 2009-10 Max. 2008-09 Min. 2009-10 Min.
Fig 2. Weather parameters during Oct ober-March in 2008-09and 2009-10 crop seasons
mm, respectively (Fig. 2). In 2008-09 crop season, the weatherconditions were more conducive for diseas e development.The average maximum and minimum temperature during thecrop maturity was higher in 2008-09. Presen t observationscorroborate the results of Noble and Richardson (1968) inwhich they noted that under favourab le environmentalconditions stem canker disease increases as the plant achievesmaturity.
It has also been reported that the stress conditions suchas drought and resultan t h igh temperature increas e thevu lnerab ility of the crop to d is ease and enhances theaggressiveness of the pathogen (Mihail 1989). In the presentstudies, dry spell prevailing during 2008-2009 cropping seasonmay be attributed to the scanty rainfall in the said period. Ithas also been reported that in the agricultural areas wherechanging climate occur, the resultant longer drought periodsand higher temperature may result in unpredicted epidemicsof M. phaseolina (Garrett et al. 2006).
It has been recorded that the stem canker pathogencauses infection in the early stage of the crop and remaindormant in the plant (personal observation). As the plant

78 Journal of Food Legumes 25(1), 2012
approaches its maturity, the growth and development of thedisease increases. During the survey of the fields, it was alsoobserved that most of the fields were having sole-croppedpigeonpea which may lead to the increase of the pathogenpopulat ion and hence the increas ed d is ease. Recen tobservations on enhanced stem canker severity in pigeonpeaare an alarming situation which has increased in - turn theresponsibilities of the scientific communities in agriculture tocome forward for rescue of the farmers. In perspective of theabove statement, sincere efforts are needed to elucidate theimpact of different weather variables on the pathogen andimplicate the in format ion thus generated to combat th isdreaded disease of pigeonpea.
REFERENCES
Garrett KA, Dendy SP, Frank EE, Rouse MN and Travers SE. 2006.Climate change effects on plant disease: genomes to ecosystems.Annual Review of Phytopathology 44: 489–509.
Kannaiyan J, Reddy MV and Nene YL. 1979. Pulse Pathology Progress6. ICRISAT, Patancheru, AP, India. Pp 65-67.
Kaur S, Singh JP and Chauhan VB. 2009. Stem canker - an emergingthreat to pigeonpea production: a preliminary study. In: Abstractof the 5th International Conference on “Plant Pathology in theglobalized Era” held at Indian Agricultural Research Institute (IARI),New Delhi, India. Pp 300 & 553.
Mayek-Perez N, Lop ez-Castaneda C, Gonzalez-Chavira M, Garch-Espinosa R, Acosta-Gallegos J, De la Vega OM and Simpson J.2001. Variability of Mexican isolates of Macrophomina phaseolinabased on pat hogenesis an d AFLP gen oty pe. Ph ysio logy andMolecular Plant Pathology 59: 257–264.
Noble M and Richardson MJ. 1968. An annotated list of seed bornediseases. Phytopathology 8:191.
Saxena KB, Kumar RV and Gowda CLL. 2010. Vegetable pigeonpea-areview. Journal of Food Legumes 23: 91-98.
Su G, Suh SO, Schneider RW and Russin JS. 2001. Host Specialization int he Charco al Ro t Fungus, Ma cro p ho m in a p h a seo lin a .Phytopathology 91: 120-126.

Journal of Food Legumes 25(1): 79-80, 2012
Short Communication
Sources of stable resistance to Ascochyta blight in exotic kabuli chickpeaLIVINDER KAUR1, J.S. SANDHU2, R. S. MALHOTRA3, M IMTIAZ3 and A. SIRARI1
1Punjab Agricultural University, Ludhiana – 141 004, India; 2Indian Council of Agricultural Research, KrishiBhavan, New Delhi – 110 014; 3International Centre for Agricultural Research in the Dry Areas, Aleppo, Syria;E-mail: [email protected](Received: July 7, 2011; Accepted: November 5, 2011)
ABSTRACT
Ascochyta blight caused by Ascochyta rabiei occurs in most ofthe chickpea growing areas of the world. Chickpea breedingmaterial were screened against Ascochyta blight (AB) in thefie ld using fie ld scree ning technique. Out of 1000 stocksreceived as FLIP numbers, stocks were identified with consistentreaction to AB. FLIP 97-121C was tested for 8 years and averagescore of the stock was 2.7. S imilarly FLIP 97-110C and FLIP 97-219C were tested for 6 years and gave an average disease scoreof 2.6. Consistent good resistance was observed in ‘ILC182’,‘ILC200’, ‘ILC3279’, ‘ILC3912’, ‘ILC3919’, ‘ILC3274’,‘ILC3856’, ‘ILC7374’, ‘ILC7795’, ‘PHC 15’ and ‘ICC12004’.‘ICC12004’ used as the check remained resistant over the yearsof testing.
Key words: Ascochy ta blight , Ascochyta rabiei, Durableresistance, Kabuli chickpea
Chickpea (Cicer arietinum L.) is the only species of thegenus Cicer, which is exploited for cultivation in various agro-ecological zones. It occurs in two versions, desi mostly smallseeded with seed coat colour varying from tan, brown to blackand bold seeded kabuli with seed coat colour light beige.Kabul i’s are popular and extensively g rown in wes tMediterranean region, West Asia, North Africa and NorthAmerica. Kabuli fetch higher price owing to large seed sizeand other culinary traits. Turkey, Canada and Mexico are themajor exporters of kabuli chickpea. Due to high domesticdemand, India is the largest importer of chickpea accountingfor 40 per cent of the Asia’s import from the world market.India needs to develop strategies to be self-sufficient, if not,to cut down its import.
Chickpea in general is prone to ascochyta blight (AB)with Kabuli’s inherently more susceptible than desi’s (Kauret al. 2008). With systematic breeding efforts AB has beencontrolled to large extent in desi varieties but in Kabuli, thisis still at a distant dream (Kaur and Singh 2009). Chickpea isconventionally sown as spring crop in Mediterranean regionwhich was followed by hot summer. Low rain fall during thisperiod led to low biomass of the crop and low yield. With shiftto winter sowing due to cool weather, crop produced higherbiomass and yield (Singh et al. 1997). But increased biomasscoupled with extensive cropping, cool moist conditions in
winter exposed the crop to the attack of ascochyta blight, adevastating disease. Unless some very good resistance ismade possible against AB, winter sowing here is difficult tobe popularized in Mediterranean region (Halila et al. 2000).High level of ascochyta blight resistance is not available inkabuli material in chickpea growing countries (Toker andCanci 2003). The major aim is to develop genetic material withhigh and stable yield and addition of resistance to AB as itwas observed that the shift from spring to winter sowing ofkabuli chickpea doubled the yield but this also subjected thecrop to AB. A systematic approach for screening of breedingmaterials and fixed lines in Chickpea International AscochytaBlight Screening Nurseries (CIABN) against AB was startedin 1985 at Punjab Agricultural University, Ludhiana. The fieldscreening technique used since 1985 was devised taking intoconsideration the two important factors viz., ‘leaf wetness’and ‘temperature’. Though, later studies also concluded thatthe disease severity is positively correlated with optimumtemperature, leaf wetness and inoculum concentration (Khanet al. 2002).
Approximately, 1000 chickpea breeding material receivedfrom ICARDA, Syria in segregating generations in CIABN(1984-85 to 2010-11) were screened in the field using fieldscreening technique. Test material was planted in 2 m rowsspaced at 40 cm apart in replicated trials. The indicator cuminfector rows of highly suscep tib le varieties L550/C214/ILC1929/ILC482/ILC263 were planted after every 4/8 rows.Inoculations were done when the plants were at maximumbranching and flowering in month of February with compositeconidial suspension in water of A. rabiei @ 40x104conidia/mlin all the years of screening, raised on Potato Dextrose Broth,after sun set in the evening in the irrigated field. Night dewand wet so il created enough humidity and the p revailingtemperature of 12-18°C was conducive for rapid germinationof conidia and successful infection process. Free moistureand relative humidity beyond 85% was maintained by runningthe water sprinkler system from 10 to 16 h at the gap of oneand half hour daily for 21days. The day and night temperaturevaried between 18-24°C and 12-18°C was s u itab le fo rdevelopment of d is ease epidemic. The d is ease s tartedappearing after 9-10 days of inoculation and more than 80%mortality was observed in susceptible material and check

80 Journal of Food Legumes 25(1), 2012
varieties after 15 days. Final observations were recorded after21 days on 1-9 point scale (Singh et al. 1982, Singh 2004). Thed is eas e d id no t increase thereafter and there was norequirement for second observations. Disease rating =3.0 wasconsidered resistant, 3.1-5.0 moderately resistant, 5.1 to 7.0susceptible and 7.1 to 9.0 as highly susceptible.
Table 1 depicts that out of 1000 breeding lines receivedfrom ICARDA in CIABN 30 lines as FLIP numbers showedresistance for number of years of testing. Among these, threelines, ‘FLIP 98-231’, ‘FLIP 97-116’ and ‘FLIP 93-176’ exhibitedthe disease rating < 4.0 in all the years of testing. ‘FLIP 97-121C’ was tested for 8 years and average score of the stockwas 2.7 and disease rating ranged from 2 to 3.5. Similarly ‘FLIP97-110C’ and ‘FLIP 97-219C’ were tested for six years andgave average disease score of 2.6 each with disease ratingrange 2 to 3.0 for former and 2 to 3.5 for latter stock. Thestocks ‘FLIP 98-230C’, ‘FLIP97-131C’, ‘FLIP93-174C’, ‘FLIP95-51C’, ‘FLIP 98-228C’, ‘FLIP 98-227C’, ‘FLIP 95-58C’ , ‘FLIP95-60C’, ‘FLIP 95-67C’, ‘FLIP 96-47C’, ‘FLIP 96-75C’, ‘FLIP96-26C’, ‘FLIP 97-195C’, ‘FLIP 97-239C’ that have an averagedisease score of 3.0 and the disease range was up to 3.0 in allthe years of testing can serve as good sources of resistancefor utilizing in breeding programme for gene pyramiding ormay be directly recommended for cultivation.
resistance have been identified from ICARDA hybridizationmaterial and released in different countries, still desired resultsare awaited. The major limitations faced are non availability ofhigh level of resistance and lack of understanding of pathogenvariability (Malhotra et al. 2003).
The experience with AB resistance suggests that nosingle strategy in breeding can impart absolute resistanceagainst AB. A combination of more than one strategy involvingpyramiding of genes, and use of diverse germplasm with multi-race resistance is required to get rid of the threat emancipatingfrom AB.
REFERENCES
Halila MH, Hadad B, Sakr and Kusmenoglu I. 2000. Regional Reviews -Region 5 Near East . In: R Knight (Ed), Linking Research andMarketing Opportunities for Pulses in the 21st Century. KluwerAcademic Publisher, Dordrecht, The Netherlands. Pp 107-114.
Kaur L, Sandhu JS and Gupta SK. 2008. Multiple disease resistance asolution for encouraging chickpea (Cicer arietinum) cultivation invarious climatic zones in India. Indian Journal of Agricultural Sciences78: 1067-1070.
Kaur L and Singh VP. 2009. Inheritance of resistance in four elitechickpea genotypes to Ascochyta blight. Journal of Food Legumes22: 239-240.
Khan SM, Javed N, Ahmed I and Bashir M. 2002. Factors affectingdisease development and severity by Ascochyta rabiei (Pass) Lab.In: Proceedings of 3rd National Conference of Plant Pathology -Chickpea Integrated Plant Disease Management, 1-3 October 2001,NARC, Islamabad. Pp 80-85.
Malhotra RS, Baum M, Udupa SM, Bayaa B, Kabbabeh S and Khalaf G.2003. Ascochyta blight resistance in chickpea: present status andfuture prospects. In: Proceeding of the Intern ational ChickpeaConference: Chickpea Research for the Millennium, Indira GandhiAgricultural University, Raipur, Chhattisgarh, India.
Singh G, Singh K and Kapoor S. 1982. Screening for sources of resistanceto ascochyta blight of chickpea. International Chickpea Newsletter12:21-22.
Singh G. 2004. My experience of Ascochyta blight of chickpea: Leadthe way towards eradication. Plant Disease Research 19:1-9.
Singh KB, Malhotra RS, Saxena MC and Bejiga G. 1997. Superiority ofwinter sowing over traditional spring sowing of chickpea in theMediterranean region. Agronomy Journal 89:112-118.
Toker C and Canci H. 2003. Selection of chickpea (Cicer arietinum L.)genotypes for resistance to Ascochyta blight, Ascochyta rabiei(Pass) Lab. yield and yield criteria. Turkish Journal of Agricultureand Forestry 27: 277-283.
Table 1. Ascochyta blight resistant Kabuli chickpea stocksin CIABN (ICARDA) from 1985-2011
No. of years of resistance
FLIP No.
8 97-121C (1) 6 97-110C, 97-219C (2) 5 98-226 C, 98-230C, 98-231C, 97-116C, 97-131C (5) 4 93-174 C, 93-175C, 93-176C, 93-181C, 95-51C, 95-
51C, 95-53C, 95-58C, 95-60C, 95-67C, 96-47C, 96-57C, 96-76C, 97-195C, 97-229C, 97-239C, 98-37C, 98-53C, 98-107C, 98-227C, 98-228C, 05-45C (22)
2 84-182C, 90-85C, 91-196C, 92-155C, 92-162C, 92-164C, 92-174C, 92-175C, 93-160C, 93-186C, 93-128C, 94-510C, 94-509C, 94-508C, 95-68C, 96-68C, 97-25C, 97-74C, 97-127C, 97-132C, 97-139C, 97-171C, 97-191C, 97-205C, 97-208C, 97-227C, 97-111C, 97-173C, 97-220C, 97-221C, 97-230C, 97-174C, 97-85C, 97-185C, 98-15C, 98-22C, 98-128C, 98-130C, 98-133C, 99-19C, 99-33C, 99-44C, 99-54C, 98-106C, 98-177C, 98-204C, 98-205C, 98-224C, 98-225C, 98-254C, 98-131C, 98-176C, 98-174C, 00-46C, 00-50C, 00-55C, 03-29C, 03-41C, 03-42C, 04-22C, 04-23C, 05-11C, 05-16C, 05-17C, 05-33C, 05-40C, 05-50C (67)
Some stable kabuli genotypes with consistent goodres istance were ‘ILC182’, ‘ILC200’, ‘ILC3279’, ‘ILC3912’,‘ILC3919’, ‘ILC3274’, ‘ILC3856’, ‘ILC7374’, ‘ILC7795’ and ‘PHC15’. ‘ICC 12004’ (Table 2) used as resistant check and remainedresistant over the years of testing. ‘ILC200’ and ‘ILC 3279’showed consistent resistant reaction over the 12 years oftesting depicting no reshuffle in races flora of the pathogen.Though some resistant sources with acceptable level of AB
Table 2. Ascochyta blight (AB) stable resistant chickpea linesfrom ICARDA
Lines Av. AB score Lines Av. AB score ILC182 3.0 ILC13729 5.0 ILC200 3.3 ILC3274 3.5 ILC7795 3.0 ILC3856 3.5 ILC3279 2.8 ILC7374 3.0 ILC3912 5.0 ICC12004 3.2 ILC3919 5.0 PHC 15 2.0 ILC4975 5.0 ILC263 (C) 9.0
C: Check

Journal of Food Legumes 25(1): 81-82, 2012
Short Communication
Genotypic response and soil sickness for identification of resistant donors againstFusarium wilt of lentilJ. AKHTAR1, H.P. MURMU1, Y. KUMAR2 and P.K. SINGH3
1Department of Plant Pathology, 2Department of Plant Breeding and Genetics, 3Department of Entomology, BirsaAgricultural University, Ranchi – 834 006, Jharkhand, India; Email: [email protected](Received: November 11, 2010; Accepted: December 14, 2011)
ABSTRACT
Fourteen genotypes of lentils were screened during rabi seasons(2006-07, 2007-08 and 2008-09) in Fusarium wilt sick plot theDepartment at Plant Pathology, Birsa Agricultural University,Ranchi. The initial Fusarium wilt symptoms appeared on 25th
day after sowing in susceptible check ‘L 9-12’. Only threegenotypes ‘VL 133’, ‘LL 985’ and ‘VL 515’ representing smallseeded, large seeded and extra large seeded groups, respectivelywere identified as resistant to Fusarium wilt, which could beexploited in breeding programme for varietal improvement.The genotype ‘L 688’ could be recommended as an alternativesusceptible check as it had more wilted plants than the presentsusceptible genotype ‘L 9-12’.
Key words: Fusarium wilt, Lentil, Varietal improvement
Lentil is one of the most important pulse crops of India.It is cultivated in 7.7 thousand ha area with an average yieldof 805 kg/ha. The wilt of lentil caused by Fusarium oxysporumf. sp. lentis is a very destructive disease and is considered amajor constraint for its production (Vasudeva and Srinivasan1952). Most of the cultivated varieties are susceptible toFusarium wilt; hence inoculum is spreading to all the lentilgrowing areas of the state. This pathogen causes losses ingrain yield to the extent of over 90% (De et al. 2003). Thedevelopment of high yielding resistant genotypes is the onlyalternative to overcome losses incurred due to Fusarium wilt
in lentil (Kamboj et al. 1990). Therefore, the present studywas undertaken to find out s ources o f resistance againstFusarium wilt that can be us ed in breeding programme fordeveloping wilt resistant varieties of lentil.
To assess field performance of the lentil genotypes, anexperiment was carried out in Fusarium wilt sick plot of theDepartment at Plant Pathology, Birsa Agricultural University,Ranchi which is geographically situated at 230 17’ N latitudeand 850 19’ E longitudes with an altitude of 625 meter abovemean sea level in the Chotanagpur region of Jharkhand.Fourteen promising geno types (Table 1) including onesusceptible check ‘L 9-12’ were screened during rabi seasonsfor three consecutive years (2006-07, 2007-08 and 2008-09) inFusarium wilt sick plot, where two rows of test genotypeswere alternated by one row of suscep tible check. Theexperiment was laid out in complete randomized block designwith three replications. Each plot comprised of four rows oftest genotypes having row length and inter-row distance of5.0 m and 0.3 m, respectively. The number of days of initialwilting and wilt incidence for each genotype was recorded.Based on pooled data of Fusarium wilt incidence for threeyears, disease reaction of individual genotypes was workedout. Finally, suscept ibility of genotype ‘L 9-12’ and testgenotype ‘L 668’ over three years (206-07, 2007-08 and 2008-09) in terms of soil sickness were plotted onto a graph toquantify the sickness of wilt sick plot.
Observations recorded on the wilt reaction indicatedthat the initial Fusarium wilt symptoms appeared on 25th dayafter sowing in susceptible check ‘L 9-12’ whereas in testgenotypes wilt started to appear about 35-40 days aftersowing. The complete wilting/mortality was recorded onsusceptible check between 28-30 days after sowing whereas,in all the test genotypes it was recorded between 50-70 daysexcept ‘L 688’ where mortality was recorded between 25-30days after sowing.
During 2006-07, out of 13 test genotypes, 3 genotypes‘LL 985’, ‘VL 133’ and ‘VL 515’ showed only 1-3% Fusariumwilt incidence. Five genotypes viz., ‘VL 514’, ‘LH 3-12’, ‘KLS2003-3’, ‘IPL 81’ and ‘PL 406’ showed 5% wilt incidence andremaining 4 genotypes viz., ‘DPL 52’, ‘IPL 213’, ‘LH 84-4’ and‘IPL 525’ showed varying degree of Fusarium wilt incidence
Table 1. Details of the genotypes used for testing
Entry Pedigree Seed Size LL 985 DPL 15 x H 92-127 Small VL 133 VL 103 x DPL 58 Small VL 515 VL 501 x Sehore 74-3 Large VL 514 VL 501 x VL 103 Extra large LH 3-12 LH 84-8 x LG 362 Extra large L 688 – small KLS 2003-3 KLS 139 x WBL 58 Small IPL 81 K 75 x PL 369 Large DPL 62 JLS 1x LG 171 Extra large IPL 213 ILL 7163 x DPL 58 Small LH 84-8 L 9-12 x JLS 2 Large IPL 525 K 75 x ILL 1712 Small PL 406 Selection from P 495 Small L 9-12 (check) Selection from P 495 Small

82 Journal of Food Legumes 25(1), 2012
ranging from 5.5 to 10%. Out of the thirteen test genotypes,only ‘L 668’ recorded 55% wilt incidence whereas susceptiblecheck ‘L 9-12’ showed 51.50% wilt incidence (Table 2).
During 2007-08, s imilar res ults were ob tained withslightly higher wilt incidence in most of the test genotypes.But test genotype ‘L 668’ and suscep tible check ‘L 9-12’showed relatively higher Fusarium wilt incidence 64.5% and57.5%, respectively (Table 2) indicat ing an increas e in thelevel of sickness which could be due to increased level ofinoculum in sick plot. During 2008-09, all 13 test genotypesshowed relatively higher wilt incidence and only 2 genotypesviz., ‘LL 985’ and ‘VL 133’ were recorded with less than 5%Fusarium wilt incidence (Table 2). In 10 geno types wiltincidence ranged between 5 to 16%, whereas in one genotype‘L 668’ wilt incidence was relatively higher (85%) in comparisonto susceptible check ‘L 9-12’ (79%).
Pooled data of wilt incidence of three years revealedthat out of thirteen genotypes screened, only three genotypesviz., ‘LL 958’, ‘VL 133’ and ‘VL 515’ proved to be highly resistantwith an average Fusarium wilt incidence of 1.83, 1.66 and 3%,res pect ively. Genotypes ‘VL 514’ and ‘LH 3-12’ showedresistant reaction with average wilt incidence of 5.83% andremaining six genotypes viz., ‘KLS 2003-3’, ‘IPL 81’ ‘DPL 62’‘IPL 213’ ‘LH-84-8’ and ‘IPL 525’ were moderately resistantwith wilt incidence between 6.83-12.66%. Further analysisrevealed that at the end of third year wilt incidence increasedby 2.5% in genotype ‘LL 985’ whereas in genotypes ‘VL 133’and ‘VL 515’, wilt incidence increased by 1.50 and 2%,respectively and average wilt incidence o f these threegenotypes remained below 5% (Table 2) for three consecutive
Table 2. Incidence and re acti on of l enti l genotypes toFusarium wilt
Wilt incidence (%) Entry 2006-07 2007-08 2008-09
Average Reaction
LL 985 1.0 1.0 3.5 1.83 VL 133 1.0 1.5 2.5 1.66 VL 515 3.0 3.0 5.0 3.66
Highly resistant
VL 514 5.0 6.0 6.5 5.83 LH 3-12 5.0 5.0 7.5 5.83
Resistant
PL 406 5.0 5.0 9.5 6.50 IPL 525 2.5 03.0 15.0 6.83 KLS 2003-3 5.0 7.5 12.5 8.33 IPL 213 5.5 7.5 14.0 9.00 IPL 81 5.0 7.5 16.0 9.50 DPL 62 10.0 12.0 12.0 11.33 LH-84-8 9.5 12.5 16.0 12.66
Moderately resistant
L-9-12 (Check)
51.5 57.5 79.0 62.66
L 688 55.0 64.5 85.0 68.16
Susceptible
CD (P=0.05)
8.05
CV (%) 29.33
68.17
85.00
55.0064.50
62.67
79.00
51.5057.50
010203040
5060
708090
2006-07 2007-08 2008-09 Average
Ye ar
Wilt
inci
denc
e (%
)
L 688L 9- 12
Fig 1. Wilt incidence of genotypes ‘L668’ and susceptible check‘L 9-12’ indicating increase in t he s ickness ofwilt sick plot
years. Therefore, the genotypes ‘VL 133’, ‘LL 985’ and ‘VL515’ representing small seeded, large seeded and extra largeseeded groups , respectively were iden tified as res istantagainst Fusarium wilt.
The data presented (in Fig. 1) shows that wilt incidenceof test genotype ‘L 668’ increased from 55% in first year(2006-07) to 85% in third year (2008-09), whereas in susceptiblecheck ‘L 9-12’ wilt incidence increased from 51.5% in 2006-07to 79% in 2008-09. This clearly indicated that the inoculum ofF. oxysporum. f. sp. lentis continued to buildup in wilt sickplot. On the other hand, the average wilt incidence andmortality in genotype ‘L 688’ was also higher (68.17% and95.35%, respectively) as compared to susceptible check ‘L 9-12’ (62.67% and 85.97%, respectively) (Table 2).
Genotypes , ‘VL 133’, ‘LL 985’ and ‘VL 515’ identified aswilt resistant in the present study can be exploited in breedingprogramme for varietal improvement. One of the main reasonsfor the slow progress in the development of wilt resistantgenotypes could be due to lack of stable sources of resistanceagainst wilt. The intensity of the inoculum varies within sickplot. Therefore, planting susceptible check at regular intervalsis relevant in wilt resistant breeding programme to maintainproper s o il s ickness . The genotype ‘L 688’ can berecommended as an alternative susceptible check as it hadmore wilt than ‘L 9-12’.
REFERENCES
De RK, Dwivedi RP and Narain U. 2003. Biological control of lentilwilt caused by Fusarium oxysporum f. sp. lentis. Annals of PlantProtection Sciences 11: 46-52.
Kamboj RK, Pandey MP and Chaube HS. 1990. Inheritance of resistanceto Fusarium wilt in Indian lentil germplasms (Lens culinaris Medik.).Euphytica 50: 113-117.
Vasudeva RS and Srinivasan KV. 1952. Studies on the wilt disease oflentil (Lens esculanta Moench). Indian Phytopathology 5: 419-421.

Journal of Food Legumes 25(1): 83-85, 2012
Short Communication
Population dynamics of gram pod borer (Helicoverpa armigera) in relation to weatherfactors under Tamil Nadu conditionJ. RAJESH KUMAR and C. DURAIRAJ
Department of Agricultural Entomology, Tamil Nadu Agricultural University, Coimbatore – 641 003, Tamil Nadu,India; E- mail: [email protected](Received: September 6, 2011; Accepted: February 7, 2012)
ABSTRACT
Pheromone technology possesses enormous potential as one ofthe tools in IPM. Population dynamics of gram pod borer,Helicoverpa armigera was studied using sex pheromone luresdeveloped at Tamil Nadu Agricultural University, Coimbatore.Result showed that the peak emergence of H. armigera adultsduring 51st (8.25 moths /trap/ week) and 52nd (8.00 moths)standard weeks followed by 1st standard week (7.25 moths). Thecorre l ation and re gre ss ion anal ys i s indicate d that theemergence of H. armi gera adults had a significant ne gativeassociati on with mi ni mum te mperature whi l e, othe rparameters (maximum temperature, relative humidity, rainfalland rainy days) had no influence on H. armigera activity. Thesimple liner regression analysis showed a R2 value of 0.528revealing that 52.8% of the variation in the trap catches of H.armigera was influenced by minimum temperature alone.
Key words: Helicoverpa armigera, Indigenous pheromone lures,Pigeonpea, Trap catches, Weather parameters
Gram pod borer, Helicoverpa armigera (Hubner)(Lep idoptera: Noctu idae) is the mos t importan t pes t ofpigeonpea out of 200 species recorded at various stages of itsgrowth with an estimated loss of 328 million dollars annuallyin the semi-arid tropics (Sharma et al. 2011). High polyphagy,mobility and fecundity are major factors contributing to theserious pest status of H. armigera. This insect has developeda high level o f resistance to many of the commonly usedinsecticides due to indiscriminate use (Deepa and Srivastava2011). Hence, various Integrated Pest Management (IPM)practices are being upgraded periodically for the managementof H. armigera. Pheromone technology possesses enormouspoten tial as one of the tools in IPM. Pheromone helps inmonitoring pest population and indirect con trol of insectseither by male annihilation through mass trapping or by matingdisruption. Continuous monitoring aids in timely detectionand als o helps for t imely application of pest icides whenabsolutely essential. Adoption of pheromone technology bythe farmers is meager for want of quality and timely availabilityof lu res . Hence, the present study is focused on theindigenously developed H. armigera pheromone lures andits effect on H. armigera population dynamics. The impact ofweather parameters on the trap catches was also studiedthrough correlation and regression analysis.
Pheromone lures of H. armigera was formulated in theDepartment o f Agricu ltu ral En tomology, Tamil NaduAgricultural University (TNAU) based on the methodologydeveloped by Ind ian Inst itu te of Chemical Technology,Hyderabad. The lures thus formulated were field evaluated inpigeonpea ecosystem for H. armigera from July 2010 to June2011 at New Area Farm, TNAU, Coimbatore. Pheromone traps(plastic funnel traps - funnel dia. 11 cm) were installed into thefield with rubber septa impregnated with pheromone blend ofZ-11: hexadecenal and Z -9: hexadecenal in the ratio of 97: 3with four replicates. The traps were deployed at a height of 1m (approximately to crop canopy level). The distance betweenthe traps was 40 ± 5 m (at this distance there is no attractioninterference between two traps). Observations on number ofmales trapped were made twice a week and the data wereconverted into weekly catches. The pheromone catches wassubjected to correlation and regression analysis with weatherparameters viz., maximum temperature, minimum temperature,relative humidity, rainfall and rainy days in respect of thecorresponding standard week. The meteorological data forthe above analysis were obtained from the Department ofAgricultural Meteorology, TNAU, Coimbatore. Significanceof simple correlation was estimated by using t-test (Saxenaand Ujagir 2007). Regress ion s tudies for the s easonalexperiment, the method suggested by Panse and Sukhatme(1967) was followed.
Studies conducted on the population dynamics of H.armigera during July 2010 to June 2011 indicated that thepeak emergence was maximum (8.25 moths /trap/ week) duringthe 51st standard week (2nd fortnight of December) followed by52nd standard week (8.0 moths) and 1st standard week (7.25moths.) (Fig.1). Pres ent find ing is in agreement with thefindings of Loganathan (1981) who reported the peak activityof H. armigera during December in Tamil Nadu. Chitra (1989)reported that moth activity was high from the first week ofNovember in Tamil Nadu. Present study also revealed thatthere was no H. armigera activity during 26th to 31st standardweeks of (July to 2nd fortnight of August). Under Tamil Naducondition there was only one peak period of activity. However,in Andhra Pradesh two peaks were observed during Augustto September and November to December in groundnut andpigeonpea ecosystem respect ively (Trivedi et al. 2005).

84 Journal of Food Legumes 25(1), 2012
Observation on H. armigera larval population during the sameperiod of study showed a maximum larval population of 18larvae/plant in third week of December. Significant positivecorrelation (r = 0.560) was obtained between moths trappedand larval population. Similar kind of positive correlation wasobs erved by Prabhakar et a l. (1998) and Srivastava andSrivastava (1995) in chickpea. Ahmad (2003) suggested that5 to 6 moths/trap/day for 3 to 4 days continuously duringpost winter months may be used as warning signal for closemonitoring of eggs and larval population in pigeonpea.
The correlation and a simple linear regression analysisbetween pheromone trap catches of H. armigera and weatherparameters showed that the trap catches had a significantcorrelation with minimum temperature (r = -0.7263) and therewas no sign ificant correlation with maximum temperature,relative humidity, rainfall and rainy days (Fig. 2 and Table 1).The peak pheromone catches of 8.25 males / trap / week wasrecorded during 51st standard week. During this period norainfall was observed and the mean maximum and minimum
temperature recorded were 27.70C and 17.40C respectively witha RH of 76.4%. Hence, the above weather parameters may befavourable for the adult emergence. The simple liner regressionanalysis showed a R2 value of 0.528 revealing that 52.80 percent of the variation in the trap catches of H. armigera wasinfluenced by minimum temperature alone. The simple linearregression equation fitted with weather parameters to predictthe pheromone trap catches of H. armigera is Y = 21.86 - 0.946X. Equation ind icated that, for every one unit increase inminimum temperature, the trap catches of H. armigera loweredby 0.946 unit.
Through correlation and regres sion analysis, it wasfound that the H. armigera pheromone trap catches had asignificant negative associat ion with minimum temperaturewhile, other parameters had no significant impact. In contrast,Mehto et al. (1985) revealed that incidence of H. armigerawas pos it ively and sign ificant ly related with minimumtemperature. Earlier work done by Vaishampayan (1980)revealed that there were no correlation existed between trapcatches and temperature, relat ive humidity and rainfall. Incon tras t, Srinivas (1987) reported negat ive sign ifican tcorrelation o f trap catches o f H. armigera for maximumtemperature alone at Bangalore. Pat il and Kulkarni (1997)obtained significant negative correlation between H. armigerat rap catches with maximum temperatu re and min imumtemperature. Balasubramanian et al. (1981) opined a negativecorrelation between moth activity and intensity of rainfall andnumber of rainy days.
The large scale adoption of pheromone technology inIPM depends on availability of quality lure. The quality of thelure is of greater significance in deciding the efficacy of thelure under field condit ion. There is every chance for thepresence of sub-standard lures in the market. Hence, TNAUmade an attempt to develop indigenous lures and throughpresent study it is proved to be effective. Based on the presentfindings there are possibilities for the production of qualitylu res which may be t imely available to the farmers . Inconclusion, the p res en t s tudy s howed that the lu resformulated at TNAU was found to be effective against H.armigera. The peak emergence of H. armigera adults wasobserved during 2nd fortnight of December. The simple linerregression analysis showed a R2 value of 0.528 revealing that52.80 per cent of the variation in the trap catches of H. armigerawas influenced by minimum temperature alone.
02468
101214161820
26 27 28 29 30 31 32 33 34 35 36 37 38 39 40 414243 44 45 46 47 48 49 50 51 52 1 2 3 4 5 6 7 8 9 10 11 12 13 14 15 16 17 18 19 20 21 22 23 2425
No. of catches /trap/ w ee k L arval population / p lant
Fig 1. Pheromone trap cat ches of H. armigera in p igeonp eaecosystem (July 2010 to June 2011)
Standard week
Table 1. Correlation between pheromone trap catches of H. armigera and weather parameters
Temperature Pheromone trap catch Maximum Minimum
R.H % (Morning) Rainfall (mm) Rainy days Period
Mean Mean r Mean r Mean r Total r Total r July 2010 to June 2011
2.1 30.5 -0.4811NS 20.9 -0.7263* 71.7 -0.0649NS 94.5 -0.4282 NS 4.5 -0.4415 NS
*: Significant at P=0.05; NS: Non significant
Fig 2. Male moth trap cat ches of H. armigera/ trap/ monthwith weather parameters

Kumar and Durairaj : Population dynamics of gram pod borer (Helicoverpa armigera) in relation to weather factors 85
REFERENCES
Ahmad R. 2003. Insect Pests of Chickpea and their Management. In:M Ali, Shiv Kumar and NB Singh (Eds), Chickpea Research in India.Indian Institute of Pulses Research, Kanpur, India. Pp 229-260.
Balasubramaniam G, Balasubramanian M and Kulandaivelu R. 1981.Prediction of bollworms damage in cotton in relation to weatherfactors. Madras Agricultural Journal 68: 657-659.
Chitra K. 19 89. Studies o n eco logy, host-in sect interactions andsusceptibility of Heliothis armigera (Hubner) to insecticides. M Sc(Ag) Thesis, Tamil Nadu Agricultural University, Coimbatore, TamilNadu, India.
Deepa M and Srivastava CP. 2011. Genetic diversity in Helicoverpaarmigera (Hubner) from different agroclimatic zones of India usingRAPD markers. Journal of Food Legumes 24:313-316.
Loganath an M. 1981. Studies on the ecolo gy and susceptibility oflarvae of Heliothis armigera (Hubner) to insecticides as influencedby pest p lan ts. M.Sc. (Ag.) Thesis, Tamil Nadu Agr iculturalUniversity, Coimbatore, Tamil Nadu, India.
Mehto DNK, Singh M and Singh RN. 1985. Incidence of insect pest inchickpea, Cicer arietinum (L.). Indian Journal of Entomology 47:117-136.
Panse VG and Sukhatme PV. 1967. Statistical methods for agriculturalworkers. ICAR, New Delhi, India. 381 pp.
Patil BV and Kulkarni NS. 1997. Monitoring of Helicoverpa armigera(Hubner) with light and pheromone traps. Indian Journal of PlantProtection 25: 13-19.
Prabh akar MSP, Singh Y, Singh SP and Sin gh S. 1998. PredictingHelicoverpa armigera in chickpea by using sex pheromone traps.Indian Journal of Entomology 60: 339-344.
Saxena K and Ujagir R. 2007. Effect of temperature and relative humidityon pod borer in pigeonpea. Journal of Food Legumes 20:121-123.
Sharma HC, Smith RTJ and Clement SL. 2011. Insect pests: Podbo rers. In: W Chen , HC Sh arma an d FJ Mueh lbauer (Eds),Compendium of Chickpea and Lentil Diseases an d Pests. TheAmerican Phytopathological Society, Minnesota, USA. Pp 121.
Srinivas PR. 1987. Studies on ecology of management of gram podborer, Heliothis armigera (Hubner) (Lepidoptera: Noctuidae). PhD Thesis, Tamil Nadu Agricultural University, Coimbatore, TamilNadu, India.
Srivastava CP and Srivastava RP. 1995. Monitoring of Helicoverpaarmigera (Hubner) in Chickpea (Cicer arietinum L.). Journal ofApplied Entomology 119: 607-609.
Trivedi TP, Yadav CP, Vishwadhar, Srivastava CP, Dhandapani A, DasDK and Singh J. 2005. Monitoring and Forecasting of Heliothis /Helicoverp a p op ulations. In: HC Sharma (Ed) , Helioth is /Helicoverpa Management : Emerging Trends and Strategies forFuture Research. Oxford & IBH Publishing Co. Pvt. Ltd, New Delhi.Pp 119-140.
Vaishampayan SM. 1980. Seasonal abundance and activity of gram podborer moth, Heliothis armigera on light trap equipped with mercuryvapours lamp at Jabalpur. Indian Journal of Entomology 7: 147-154.

86 Journal of Food Legumes 25(1), 2012
List of Referees for Vol. 25(1), 2012
The Editorial Boarg gratefully acknowledges the help rendered by following referees in reviewing manuscrips for the Vol. 25(1),March 2012
Dr A SamadVirologist, CIMAP, Lucknow
Dr AB RaiPrincipal Scientist, IIVR, Varanasi
Dr Aftab HussainUAS, Bangalore
Dr AK ChoudharySr Scientist (Plant Breeding), IIPR, Kanpur
Dr Asit B MandalPrincipal Scientist, Plant Breeding, CRIJAF, Barrackpore(WB)
Dr Awnindra SinghSr Scientist (Plant Breeding), CARI, Port Blair
Dr CS PraharajPrincipal Scientist, Crop Production, IIPR, Kanpur
Dr DK VermaSr Scientist, Plant Breeding, IARI Regional Station, Indore(MP)
Dr IS SolankiIncharge, IARI Regional Research Station, Pusa, Samastipur
Dr Jagdish KumarPrincipal Scientist, Division of Genetics, IARI, New Delhi
Dr Jagmeet KaurIncharge (Pulses), PAU, Ludhiana
Dr Jitendra KumarCI Division, IIPR, Kanpur
Dr JP UpadhyayDirector (Extension), RAU, Pusa, Samastipur (Bihar)
Dr KB SaxenaPrincipal Scientist, Pigeonpea Breeding, ICRISAT,Patancheru, Hyderabad
Dr MR KhanAssociate Professor, AMU, Aligarh
Dr N MallikarjunaPrincipal Scientist, ICRISAT, Patancheru, Hyderabad
Mr NaimuddinScientist (SG), IIPR, Kanpur
Dr NP SinghPC (Chickpea), IIPR, Kanpur
Dr (Mrs) Om GuptaHead (Plant Pathology), JNKVV, Jabalpur
Dr PK PandaSenior Scientist (Agronomy), CSWCRTI Res. Centre, Agra
Dr PK SinghAssociate Professor (Plant Breeding), Institute of AgrilSciences, BHU, Varanasi
Dr Pooja BhatnagarPrincipal Scientist, ICRISAT, Patancheru, Hyderabad
Dr Rajib NathAssociate Professor, BCKVV, Kalyani (WB)
Dr Ram Vinod KumarPrincipal Scientist, Plant Breeding, IGFRI, Jhansi (UP)
Dr RG ChaudharyPrincipal Scientist, IIPR, Kanpur
Dr Sanjeev KumarSr. Scientist (Agronomy), ICAR Res. Compex for EasternRegion, BVC Campus, Patna
Dr Satish GuptaPrincipal Scientist, ARS, Durgapaura, Jaipur (RAJ)
Dr SK JhaSr Scientist (Extension), DRMR, Bharatpur (RAJ)
Dr SS SohrabPDF, King Abdul Aziz University, Saudi Arabia

87
International Conference on Legumes in the ChangingClimate Scenario: Challenges and OpportunitiesFebruary 9-11, 2013Kanpur, India
ICL 2013
Background
Chickpea, dry beans, pigeonpea, lentils, peas, lupines, grasspea and common vetch are the major grain legume crops producedworldwide and play an important role in food and nutritional securityand sustainable agricultural production. Besides, there are a numberof forage legumes that are grown primarily for fodder purposes.Among these, chickpea, pigeonpea, dry pea, mungbean, urdbean andlentils are a major protein source in the diet of the populations ofSouth Asia. India, Pakistan and Bangladesh are together majorproducers and importers of these crops, while Canada, France, theUSA, Australia, Turkey and Myanmar the major exporting countries.With ever-growing population, the demand for these legumes willalso increase in that proportion.
Climate models have predicted increased atmospheric CO2concentrations, increasing global temperatures, modified rainfallpatterns and increased frequency of extreme weather events in thenext 100 years. Overall, these predicted climate changes may resultin increased yields in temperate countries (such as Canada, the USA,France, and the like) but decreased yields in developing countries ofthe tropics and sub-tropics (India, Pakistan, Bangladesh and Ethiopia,for instance). The negative effects of climate change on grain legumeproduction in these latter countries can be mitigated by adaptations trat egies such as crop relocation, changes in sowing date,development of stress tolerant varieties and increased nutrient andplant protection inputs.
Keeping these facts in view, the Indian Society of PulsesResearch and Development (ISPRD) and Indian Institute of PulsesResearch (ICAR) are delighted to announce an InternationalConference on Legumes in the Changing Climate Scenario: Challengesand Opportunities (ICL 2013) during February 9-11, 2013 at IIPR,Kanpur, India. T he conference will p rovide an except ionalopportunity to scientists, policy makers and executives, extensionworkers, traders and entrepreneurs to discuss various strategies formitigating the negative effects of climate change on grain and foragelegumes and draft a consensus road map for increasing productivityand profitability of legumes under such changes.
The Conference will comprise well structured technicalsessions with 1-2 keynote lectures by the distinguished scientist(s)of the respective area. The technical sessions will also include anumber of parallel sessions. Poster exhibition will also be arrangedon major themes. There will be provision for the best poster awardon each major theme. During the conference, an excursion may bearranged for the participants. The organising committee will make allout efforts to make this conference a memorable event.
Themes
1. Global scenario on legume production
Production and consumption
Marketing and trade
Policies and issues
2. Crop adaptation to climate change
Adaptation mechanism
Mitigation strategies
Crop modelling
3. Innovative techniques towards legumes improvement
Pre-breeding and germplasm enhancement
Restructuring plant types
Genomics enabled improvement
Transgenics
4. Resource conservation in extreme environments
Resource use efficiency
Crop diversification and sustainability
Soil health improvement
5. Disease - pest dynamics in climate change
Surveillance and forecasting
Host plant resistance
Diagnostics and bio-ecology
Novel pest management techniques
6. Improving nutritional quality of legumes
Nutrition and human health
Biofortification vis-a-vis micronutrient malnutrition
Value addition
7. Mechani zation for i mprovi ng l egume productionefficiency
Efficient resource saving machineries
Drudgery reduction and energy management
8. Participatory technology development
Public-private partnership
Technology assessment, refinement and dissemination
Social, economic and policy issues

88 Journal of Food Legumes 25(1), 2012
Date and Venue
The conference will be held at the Indian Institute of PulsesResearch (IIPR), Kanpur during February 9-11, 2013. Kanpur is theindustrial city of the state of Uttar Pradesh, India. It is ~ 425kilometers away from New Delhi and is connected by road, rail andairways. There is a limited number of flights directly from NewDelhi to Kanpur. One can also reach Kanpur via Amausi Airport(Lucknow), which is only 75-80 km away from Kanpur. The weathercondition at Kanpur remains usually pleasant with the temperaturerange of 10 – 25°C during the second week of February.
Call for Papers
The participants of the Conference are invited to contributeabstracts of the papers for oral or poster presentation on all themajor food legumes (including peanuts and soybean), arid legumes(guar, moth bean, cowpea and horse gram) and forage legumes (lucerne,berseem, etc.). However, abstracts for poster presentation can besubmitt ed on any legumes of even minor or local importance.Abstracts not exceeding 250 words should be submitted on A4 sizep ap er in MS Word and/or mailed elect ronically [email protected]. The title of the abstract should be in boldfont followed by t he name(s) of author(s) and affiliat ion. TheAbstracts will be published pre-conference.
Schedule and Important Deadlines
Submission of Abstract: July 31, 2012
Notification of Acceptance: August 31, 2012
Submission of Full Paper: October 31, 2012
Registration Fee
Title: Prof/Dr/Mr/Ms/Mrs
Name:________________________________________________
Organization:__________________________________________
Address:_______________________________________________
PIN: _________________________________________________
Mobile No.: ___________________E-mail: ___________________
Passport details (only for foreigners including SAARC delegates)
Nationality: ____________________________________________
Passport No.: __________________________________________
Date of issue: __________________________________________
Validity date: ___________________________________________
Whether submitting an abstract of a paper: Yes/No
If yes, whether for: Oral Poster
Title of presentation: ____________________________________
______________________________________________________
______________________________________________________
Theme: _______________________________________________
Sub-theme: ____________________________________________
Category of participant: ISPRD member/Non-member,SAARC delegate/Foreign delegate/Student
________________________________________________
Payment of Fees
I am sending registration fee for Rs/US$______________________through DD No. ______________________dated______________in favour of ISPRD-ICL 2013, payable at Kanpur.
Date: Signature
______________________________________________________
* Participants are requested to return filled-in registration formalong with payments to the Dr AK Choudary, Organ izingSecretary (ICL 2013), IIPR, Kanpur - 208 024 on or beforeSeptember 30, 2012.
*** Registration form can be downloaded from conferencewebsite: http://www.isprd.in
*** Please add 30% more (of registration fee) for accompanyingperson(s)
REGISTRATION FORMICL 2013
Member Non-member Student* Schedule
Indian &
SAARC
Foreign Indian &
SAARC
Foreign Indian &
SAARC
Foreign
Early birds (on or before September 30, 2012)
Rs 5000 $300 Rs 6000 $ 350 Rs 3000 $ 200
From October 01 – December 31, 2012
Rs 5500 $ 325 Rs 6500 $ 375 Rs 3500 $ 225
On spot registration
(February 9, 2013)
Rs 6000 $350 Rs 7000 $ 400 Rs 4000 $ 250
Research Fellows and Research Associates will also be included instudents' category

Journal of Food Legumes (formerly Indian Journal of PulsesResearch) publishes original papers, short communicationsand review articles by renowned scientists, covering all areasof food legumes research. The paper should not have beenpublished or communicated elsewhere. Authors will be solelyresponsible for the factual accuracy of their contribution.Language of publication is English (British).Please send your manuscript to following address:SecretaryISPRDIndian Institute of Pulses ResearchKalyanpur, Kanpur 208 024, IndiaEmail: [email protected] must be submitted through e-mail. You shouldalso submit a hard copy of your manuscript for our officialrecord. Besides author(s) is required to submit a certificatethat the paper is exclusive for Journal of Food Legumes.Manuscripts must conform to the Journal style (see the latestissue). Correct language is the responsibility of the author.After having received your contribution (date of submission),there will be a review process before the editorial board takesdecision regarding acceptance for publication. One copy ofthe revision together with the original manuscript must bereturned to the subject editor or Secretary. The submittedpaper must be one complete word document file comprising atitle page, abstract, text, references, tables, figure legends andfigures. When preparing your text file, please use only TimesNew Roman for text (12 point, double spacing) and Symbolfont for Greek letters to avoid inadver tent charactersubstitutions.FormatEvery original paper should be divided into the following fivesections: ABSTRACT, Key words, INTRODUCTION,MATERIALS AND METHODS, RESULTS ANDDISCUSSION, and REFERENCES. The manuscript should betyped on one side of the paper only, double spaced, and with4-cm margins with page and line numbers. The main title mustbe capital bold. Subheading must be bold italic and Sub-subheading normal italic.At the head of the manuscript, the following informationshould be given: the title of the paper, the name(s) of theauthor(s), the institute where the research was carried out,the present addresses of the authors (foot note) and of thecorresponding author (if different from above Institute).Authors are required to provide running title of the paper.You must supply an E-mail address for the correspondingauthor.The abstract should contain at least one sentence on each ofthe following: objective of investigation (hypothesis, purpose,aim), experimental material, method of investigation, datacollection, result and conclusions. Maximum length of abstractis 175 words. Up to 10 key words should be added at the endof the abstract and separated by comma. Key words must bearranged alphabatically (e.g., EMS, Gamma ray, Mungbean,Mutations, Path coefficient, ......).Each figure, table, and bibliographic entry must have areference in the text. Any correction requested by the reviewershould also be integrated into the file.Manuscript file including tables must be in MS Word andWindows-compatible and must not contain any files otherthan those for the current manuscript. Please do not importthe figures into the text file. The text should be prepared usingstandard software (Microsoft Word); do not use automatedor manual hyphenation.
Length
Manuscripts should not exceed a final length of 15 printedpages, i.e., 5,000 words, including spaces required for figures,tables and lis t of references. Manuscr ipts for shortcommunications should not exceed 3000 words (3 printedpages, with not more than a total of 2 figures or tables).
Units, abbreviations and nomenclature
For physical units, unit names and symbols, the SI-systemshould be employed. Biological names should be givenaccording to the latest international nomenclature. Botanicaland zoological names, gene designations and gene symbolsare italicised. Yield data should be reported in kg/ha. The nameof varieties or genotypes must start and end with singleinverted comma (e.g., ‘Priya’, ‘IPA 204’, ......).
Tables and Figures
Tables and figures should be limited to the necessary minimum.Please submit reproducible artwork. For printing of colouredphotograph, authors wil l be charged Rs. 4000/- perphotograph. It is essential that figures are submitted as high-resolution scans.
ReferencesThe list of references should only include publications citedin the text. They should be cited in alphabetical order underthe first author ’s name, listing all authors, the year ofpublication and the complete title, according to the followingexamples:Becker HC, Lin SC and Leon J. 1988. Stability analysis in plantbreeding. Plant Breeding 101: 1-23.Sokal RR and Rholf FJ. 1981. Biometry, 2nd Ed. Freeman, SanFrancisco.Tandon HLS. 1993. Methods of Analysis of Soils, Plants, Waterand Fertilizers (ed). Fertilizer Development and ConsultationOrganization, New Delhi, India. 143 pp.Singh DP. 1989. Mutation breeding in blackgram. In: SA Farookand IA Khan (Eds), Breeding Food Legumes. PremierPublishing House, Hyderabad, India. Pp 103-109.Takkar PN and Randhawa NS. 1980. Zinc deficiency in Indiansoils and plants. In: Proceedings of Seminar on Zinc Wastesand their Utilization, 15-16 October 1980, Indian Lead-ZincInformation Centre, Fertilizer Association of India, New Delhi,India. Pp 13-15.Satyanarayan Y. 1953. Photosociological studies on calcariousplants of Bombay. Ph.D. Thesis, Bombay University, Mumbai,India.In the text, the bibliographical reference is made by giving thename of the author(s) with the year of publication. If there aretwo references, then it should be separated by placing ‘comma’(e.g., Becker et al. 1988, Tandon 1993). If references are of thesame year, arrange them in alphabatic order, otherwise arrangethem in ascending order of the years.While preparing manuscripts, authors are requested to gothrough the latest issue of the journal. Authors are alsorequired to send the names & E-mail address of at least 3-4reviewers appropriate to their articles.
Instructions to Authors

www.isprd.in
Published by Dr AK Choudhary, Secretary on behalf of The Indian Society of Pulses Research and Development from
Indian Institute of Pulses Research, Kanpur-208 024Telefax: 0512-2572582
E-mail: [email protected], [email protected] Army Printing Press, 33, Nehru Road, Sadar Cantt. Lucknow-2 Ph.: 0522-2481164
(www.isprd.in)
I SPR D1987 Hkknvl
PF O U LE ST EU STI RT ES
SNI E
AN
RAI CD HNI
For free download of JFL articles, please also visit: www.indianjournals.com
Copyright © 2022 FDOKUMEN