Journal of food Science and Technlogy 1987 Volume.24 No.5
80
JOURNAL OF FOOD SCIENCE AND TECHNOLOGY ASSOCIATION OF FOOD SCIENTISTS & TECHNOLOGISTS, INDIA VOL. 24. NO. 5. SEPT./OCT. 1987
-
Upload
khangminh22 -
Category
Documents
-
view
3 -
download
0
Transcript of Journal of food Science and Technlogy 1987 Volume.24 No.5
JOURNALOF
FOOD SCIENCEAND
TECHN O LO GY
ASSO CIATIO N OF FOOD SCIENTISTS & TECH N O LO GISTS, INDIA
VOL. 24. NO. 5. SEPT./OCT. 1987

B gS@ SSSSSSSQ 8SSSSSS@ SB SB Q G 9G 9SSSSSB BS ^
ASSOCIATION OF FOOD SCIENTISTS AND TECHNOLOGISTS
( I N D I A )
The Association is a professional and educational organization of Food Scientists and Technologists
Affiliated to the Institute of Food Technologists, USAbmmbmbaaaaaaaaaaaaaaaaaaaaaaaaaaaaaaaaa
Objects:1 .
2.
3.
To stimulate research on various aspects of Food Science and Technology.To provide a forum for the exchange, discussion and dissemination of current developments in the field of Food Science and Technology. To promote the profession of Food Science and Technology.
The ultimate object is to serve humanity through better food.Major Activities:
1. Publication of Journal of Food Science and Technology (bi-monthly) and Indian Food Industry (IFI) (quarterly).
2. Arranging lectures and seminars for the benefit of members.3. Holding symposia on different aspects of Food Science and Technology.
Membership:Membership is open to graduates and diploma holders in Food Science and
Technology, and to those engaged in the profession. Each member will receive a copy of the Journal of Food Science and Technology, published by the Association. The Chapters of the Association are located at Bangalore, Bombay, Calcutta, Delhi, Hyderabad, Hissar, Jabalpur, Jammu, Karnal, Kanpur, Ludhiana, Lucknow, Madras, Nagpur, Parbhani, Poona, Palayamkottai, Pantnagar and Trivandrum.
Membership Fee Admission Fee
Life Member Rs 500 Rs 5Life Member (Resident abroad) S 400 f 1Corporate Member Rs 700 Rs 5Member Rs 40 Rs 5Member (Resident abroad) t 25 $ 1Affiliate Member Rs 60 Rs 5Student Member Rs 25 Rs 5Student Member (abroad) $ 15
Annual SubscriptionJournal of Food Science and
TechnologyInland Rs. 180Foreign Surface Mail | 60
Air Mail $ 80
Indian Food Industry Inland Rs. 125Foreign : Surface Mail $ 40
Air Mail $ 50
lhfiJT)n-I?r 10«Famigli
For membership and other particulars kindly addressThe Honorary Executive Secretary
Association of Food Scientists and Technologists, India Central Food Technological Research Institute, Mysore-570 013, India
0 0 0 0 0 0 0 0 0 0 0 0 0 0 0 0 0 0 0 0 0 0 0 0 0 0 0 0 0 0 0 0 1 9 SKBB
(BEB
O!B
B£EO
OBŒ
(SÎB
!B^E
BSBE
B(Bf
SlBi
BHBl
B£E£
SO>S
£SSS
S3S3
ÎBlB
31tB
iBi&
SI

Editorial BoardN. Balasubramanyam Kantha S. Shurpalekar P. NarasimhamS. N. Nigam Patric Tauro D. Rajalakshmi G. Ramanatham L. A. Ramanathan K. A. Ranganatii J. R. Rangaswamy Richard JosephR. SheshadriT. Sreenivas D. S. WagleY. S. Lewis (Ex officio)T. S. S, Rao ( —do— )N. Keshava ( —do— )
EditorN. Chandrasekhara
The Journal of Food Science and Technology is a bimonthly publication of the Association of Food Scientists and Technologists, India (AFSTl issued in February, April, June, August, October, and December.TheFditor assumes no responsibility for the statements and opinions expressed by the contributors.Manuscripts for publication and books for reviewing in the Journal should be addressed to the Editor, Journal of Food Science and Technology. AFST, Central Food Technological Research Institute, Mysore-570 013. The Editor reserves the privilege of editing the manuscript to make it suitable for publication in the Journal.N o part of this journal can be reproduced by anybody without written permission of the Editor. Correspondence regarding subscriptions and advertisements should be addressed to the Executive Secretary, AFST, Central Food Technological Research Institute, Mysore-570013, India. Payments may be made by cheque, draft, postal or money order in favour of Exec. Secretary, AFST.
Executives of the AFST(I) President
V. H. Potty Vice-Presidents
A. M. Nanjundaswamy P. J. DubashK. L. SarodeB. P. N. Singh A. C. Kapoor
Exec. SecretaryT. S. Satyanarayana Rao
Joint Secretary N. Keshava
TreasurerK. Sambaiah
JOURNAL OF FOOD SCIENCEAND TECHNOLOGY
Volume 24 Number 5 Sept./Oct. 1987
C O N T E N T S
Research PapersEmulsification Efficiency of Various Extracts o f Fish, Goat and Beef Proteins in
Model Food Emulsions and Preparation of Sausage 203Subrata Basu, K. P. Das, D. K. Chattoraj and K. Gopakumar
Enterotoxigenic Staphylococcus aureus in Infant Foods 208Sanjeev K. Anand and R. S. Singh
A Thermostable ^-Galactosidase from Alternaría paltni 211Sanjeev Agrawal and S. M. Dutta
Nitrosamines in some Indian Brands of Soya Sauce Samples Treated with Nitrite 214N. R. Shenoy and A. S. U. Choughuley
Study of the Physico-chemical, Rheological, Baking and Noodle Quality of Improved Durum and Bread Wheat Cultivars 217
A. K. Bakhshi and G. S. Bains
Effect o f Traditional Processing on the Functional Properties of Cowpea( Vigna catjang) Flour 221
T. S. Padmashree, L Vijayalakshmi and Shashikala Puttaraj
Inhibitory Effect of Mercuric Compounds and Dyes on Decay and Sprouting of Seed Potato Tubers During Storage 225
M. N. Shashi Rekha and P. Narasimham
Tamaroggtt—A New Product from Date and Oggtt 230Ibrahim M. Al-Ruqaie and Hamza El-Nakhal
Application of Reverse Osmosis in the Manufacture of Khoa. Process p Optimization and Product Quality 233Dharam Pal and Munir Cheryan
Study of Paneer Quality in Relation to Pressing Conditions 239Manoj Kulshrestha, U. S. Agrawal and B. P. N. Singh
Effect of Freezing and Sodium Citrate Treatment on the Association-Dissociation of Proteins from Shrimp (Parapenaeopsis stylifera) 243
S. Godavari Bai, V. S. Khabade and V. Prakash
Study of Pectolytic Factors and Processing in Relation to RheologicalCharacteristics of Tomato Juice 247
Upasana R. Bhasin and G. S. Bains
Inhibitory Effect on Lithogenesis by Ingestion of a Curcuma Mixture(Temoe lawak Singer^) 253
A. C. Beynen, J. J. Visser and J. A. Schouten
vTojaufif-i.vi.i: if) iswi w
Research NotesA Method to Determine Shrinkage of Mushrooms During Processing 257M. Konanayakam, S. K. Sastry and R. C. Anantheswaran
Preparation of Full Fat Soy Flour and Its Use in Fortification of Wheat Flour 259N. S. Venna, H. N. Mishra and G. S. Chauhan
Surface Microflora of Seed Potatoes (Solatium tuberosum L., CV.Kufri Jyothi): Isolation and Identification of Organisms Responsible for Spoilage of Potatoes Grown at Devanahalii 261
M. N. Shashirekha, N. G. K. Karanth and P. Narasimham
Variation in Quality Traits of Litchi (Litchi chinensis Sonn.) Cultivars 264Ajay Singh, A. B. Abidi and Surendra Srivastava
Nutrient Status During Shrikhand Making 266S. K. Atreja and A. D. Deodhar
Physico-chemical and Functional Properties of Spent Hen Components 267N. Kondaiah and B. Panda
Bacteriological Quality of Fresh Pork Collected from Different Abattoirs and Retail Shops 270
P. K. Gupta, G. S. Chauhan and G. S. Bains
Book R eview s 273
Association News 276

RESEARCH PAPERS
Emulsification Efficiency of Various Extracts of Fish, Goat and Beef Proteins in Model Food Emulsions and
Preparation of SausageSUBRATA BASU
Central Institute of Fisheries Technology, (Kakinada Research Centre), Kakinada-533 003, India
K . P. D a s , D . K. C hattoraj
Department of Food Technology and Biochemical Engineering, Jadavpur University, Calcutta, Indiaand
K. G o pak um ar
Central Institute of Fisheries Technology, Cochin-29, India
Received 16 November 1985; revised 7 February 1987
A method of determining emulsifying capacity has been described. The emulsification efficiency of fish and goat proteins in various extracts have been measured and compared with those of beef. The maximum phase volume ratio determined from salt extract, water extract, actomyosin and slurry, vary in the order beef>goat>fisb . Emulsification efficiency of proteins in presence of mixed fat (extracted goat fat mixed with peanut oil in varying proportions) was also studied. Although the viscosity values for different systems change slightly, the maximum phase volume ratio for a particular protein source does not vary appreciably with change in composition of the mixed fat. The protein stabilised water-in-oil emulsions seemed to be less stable than oil-in-water emulsions. All fish, goat and beef sausages were found to be acceptable to a taste panel, although goat and beef sausages scored better than fish sausage.
Recently, attempts have been made to study the physico-chemical properties of model food emulsions because of the importance of such properties in the preparation of sausage. The efficiency of emulsification of proteins from different sources may vary with the source and composition of fat. A number of combinations of proteins and fats from different animal sources need to be studied to find a good sausage formulation. The literature reveals two distinct aspects of most studies, namely physico-chemical and preparative. Though the emulsifying properties of animal proteins have been studied1-6, fish proteins have not been so extensively studied. The emulsifying properties of fish proteins have been demonstrated in some recent studies6 ,7 in developing frankfurter type of products. But quantitative data on emulsifying capacity is still lacking. An attempt has been made in this paper to measure emulsifying efficiency of fish, goat and beef proteins quantitatively in terms of phase-volume ratio8. Fish sausage was prepared and its properties compared with those of goat and beef sausages.
Materials and MethodsPreparation o f protein extracts and slurry; A 100 g
sample of beef, goat or fish meat was blended with 650 ml of cold (5°C) water or 0.5 M sodium chloride solution in a blender for 5 min. The slurry was centrifuged at 5000 r.p.m. for 10 min and supernatant used for emulsification.
Preparation o f actomyosin: Actomyosin was prepared following the method of Herring et al.9; it contained actin and myosin.
Extraction o f goat fat: Goat fat was procured from local market and heated in a beaker until the fat melted and separated. The melted fat was then filtered through a piece of fine cloth and stored in a bottle at 5°C. The melting point of goat fat was 49 °C and those of goat fat peanut oil mixtures (35:65), (50:50) and (60:40) were 31 °C, 34°C and 36°C, respectively.
Determination o f protein concentration: The protein concentration was determined by AO AC method to.
Viscosity o f emulsion: Apparent viscosity of the emulsions was measured in a Brookfield Synchro-
2 0 3

2 0 4 JOURNAL OF FOOD SCIENCE AND TECHNOLOGY, VOL. 2 4 , SEPT./OCT. 1987
lectic Viscometer (LVT model). A known volume of aqueous solution of known protein concentration was placed in a beaker along with a known amount of oil so that the phase-volume ratio (<fc) could be calculated. The mixture was blended and apparent viscosity (t\) of the resulting emulsion was measured at 30.0±0.1oC. The phase volume ratio of the emulsion was increased by stepwise addition of oil and measured.
Determination o f type o f emulsion: The type of emulsion i.e., oil in water (O/W) or water in oil (W/O) was determined conductometrically according to the method of Bhatnagar11.
Preparation o f sausage: After several trials, the following recipe was found to be the best: meat 100 g, fat or fat-oil mixture 60 ml, ice cold water 20 ml, salt 5g, garlic 3g, black pepper 2g. Deboned meat was first passed through a meat mincer. The minced meat was placed in a waring blender, ice cold water and salt were added and mixed for 1 min; oil and spices were then added and mixed for 3 min. The resulting sausage was stuffed into sausage casing (salted, washed goat intestine) with a hand stuffer. The sausage was then cooked at 80°C for 30 min.
Sausages prepared from the meat of fish, goat arid beef were served to a taste panel comprising five persons. Designation of fish sausage made with peanut oil is (A), with hydrogenated vegetable oil (Dalda, MP 34°C) is (B) and with molten goat fat and peanut oil (50:50) is (C). Sausages with goat and beef meat were prepared with 50:50 mixture of goat fat and peanut oil. For each variety of sausage, five independent batches were made and their scores for odour, flavour, texture and acceptability were rated by the members of the taste panel. Details regarding scores are given in Table 3.
Other ingredients: Double refined peanut oil was purcnased from the market and used without further treatment. All salts were of analytical grade.
Statistical analysis: Analysis of variance12 was used to analyse the organoleptic scores to find out the statistical significance of different parameters.
Results and DiscussionEmulsions were prepared with the various extracts of
proteins from beef, goat and fish and apparent viscosity of the emulsions after each stage of oil addition was measured. Fig. 1 shows a plot of apparent viscosity as a
Vofunction of phase volume ratio (<£= —-----— Vo=;
V o+ Vcvolume of oil, Vc=;volume of continuous phase) of emulsions prepared with salt-extracts of beef, goat and fish proteins. The curves were obtained by two different ways; firstly by increasing the phase-volume ratio with gradual addition of oil and measuring the viscosity (forward curve, solid lines) secondly by decreasing the
Fig. 1. Apparent viscosity against phase ratio of emulsions. Oil-water em ulsion;------------water-oil emulsion.
phase volume ratio with gradual addition of protein solution to the peanut oil (reverse curve, dashed line), initially for the forward curve, the viscosity increased with increase in phase volume ratio, reaching a maximum at a certain phase volume ratio and then falling sharply. All the three emulsions-beef, goat and fish-show the same characteristics. The rise in viscosity is due to the excess population of emulsified droplets leading to a concentrate demulsion. The maximum viscosity represents a state of saturation with regard to the amount of emulsified oil in the protein solution. The sharp fall in viscosity is the result of coalescence of the emulsion droplets and subsequent breaking leading to the separation of oil phase. Thus, it is seen that the phase-volume ratio that gives the highest viscosity for a particular protein at a particular concentration may be a good index of emulsifying capacity. The end point is easily detectable and reproducible.
The average values of the emulsifying capacity of various extracts at different protein concentrations (Cp) as determined graphically have been presented in Table 1 It is seen that emulsifying ability of the three actomyosins are distinctly different. Beef actomyosin shows highest efficiency with maximum phase volume ratio (#m ) as high as 0.76. Fish actomyosin is the least efficient of the three having <£m as 0.64 only. Goat actomyosin has efficiency intermediate between the two having the maximum phase volume ratio of 0.70. It should be noted that a value of 0.74 for the <i>m was attained theoretically if the emulsion droplets are of identical size8. The value of 0.76 for beef actomyosin probably indicates the theoretical saturation with a narrow distribution of paiticle size8. Fish and goat actomyosins are inefficient to reach the saturation. Although actomyosin acts as an emulsifier in all the three cases, the efficiency varies with the source. Chattoraj et al.5 found during gel

BASU et al: EMULSIFICATION e f f ic ie n c y o f e x t r a c t s o f f is h , g o a t a n d b e e f 2 0 5
Table 1. peanut oil emulsifying capacity of fish, goat and beef proteins
Water extract Salt extract Actomycin SlurryProtein Protein Protein Proteinconcn. <hm concn. <pm concn. 4>m concn. 4>m(mg/ml) (mg/ml) (mg/ml) (mg/ml)
Fish
2.75 0.375±0.005 3.25 0.502±0.005 0.87 0.415 ±0.010 3.05 0.410±0.0165.50 0.555±0.015 6.50 0.655±0.007 1.75 0.562 ±0.006 6.10 0.574± 0.0068.25 0.643 ±0.006 9.75 0.718±0.011 3.50 0.625±0.012 9.15 0.590±0.012
11.00 0.677±0.018 13.00 0.740±0.008 5.25 0.650±0.015 12.40 0.605 ±0.00713.75 0.672 ±0.009 16.25 0.737±0.014 15.25 0.620±0.018
Goat
1.84 0.474 ±0.021 2.50 0.500±0.012 0.81 0.412±0.018 4.54 0.445±0.0103.68 0.574±0.006 5.00 0.655 ±0.005 1.63 0.624±0.008 9.07 0.615 ±0.0025.52 0.643±0.015 7.50 0.706±0.008 2.45 0.664 ±0.005 13.61 0.670±0.0057.36 0.667±0.012 10.00 0.730±0.006 3.27 0.774±0.005 18.15 0.720±0.0129.20 0.672±0.018 12.50 0.730 ±0.010 22.69 0.737± 0.007
Beef
2.54 0.505±0.020 2.98 0.636±0.010 0.48 0.475 ±0.024 5.85 0.583 ±0.0075.09 0.615±0.013 5.96 0.701 ±0.005 0.96 0.600±0.008 11.70 0.692 ±0.0107.63 0.697± 0.009 8.94 0.744±0.005 1.44 0.690± 0.006 17.55 0.730±0.008
10.17 0.700±0.005 11.92 0.773±0.011 1.92 0.752±0.004 23.40 0.756±0.00512.71 0.697±0.012 14.91 0.773±0.007 2.40 0.764±0.005 29.25 0.750± 0.005
Mean ± SD of 3 determinations.
electrophoresis of actomyosins that number of protein bands differed depending upon the protein source. They also found that the mobilities of individual fractions of actomyosin from different sources were not exactly the same. This was attributed by them to the inherent small differences in the primary structure of the proteins. They further noticed that the colour intensities of the gel bands of the different fractions were also dependent on the source of actomyosin. These results may explain the differences in emulsifying capacity for various actomyosin preparations as being due to differences in the surface activity of the proteins. Schut and co-workers4 suggested that one of the salt soluble proteins may become preferentially absorbed on the interface of the emulsion droplets so that the stability and efficiency of meat emulsion may be considerably increased.
From the data in Table 1, it is found that the relative order of effiicency of emulsification at a fixed protein concentration for water-extracts, salt extracts, slurries and actomyosins is the same i.e., beef>gcat>fish. For a particular protein source, the efficiency of emulsification at a particular protein concentration varies in the order actomyosin>salt extraet>water extract. The
results of the study with mixed fat (goat fat mixed with peanut oil) are presented in Table 2 (Fig. 2). The fat was mixed in proportions of 35:65, 50:50 and 60:40 V/V with respect to goat fat and peanut oil. Results imply that for a mixed fat system at a particular protein concentration, the maximum phase volume ratio for fish, goat and beef protein emulsions is independent of the composition of mixed fat. A close comparison of the values in Table 1 and Table 2 reveals that <£m for emulsions of peanut oil only is always higher than that of emulsions of mixed fat at same protein concentrations;
Table 2. mixed fat emulsifying capacity of fish, goat andBEEF SALT EXTRACTS AT 55°C
Goat fat: <$m <$m <f>mPeanut oil fish goat beef
35 :65 0.520±0.008 0.610±0.015 0.550±0.006
50 : 50 0.525±0.012 0.615±0.010 0.550 ±0 .004
60: 40 0.540±0.006 0.630±0.010 0.560±0.010
Concentration of proteins (mg/ml): fish, 3.25; goat, 5.00; beef, 2,98.

2 0 6 JOURNAL OF FOOD SCIENCE AND TECHNOLOGY, VOL. 2 4 , SEPT./OCT. 1987
Fig. 2. Apparent viscosity against phase volume ratio of fish, goat and beef protein emulsions with goat fat: peanut oil in different ratios.
the difference may, however, be a result of different temperatures: 55°C for mixed fat and 30°C for peanut oil alone.
Analysis of the reverse curve of Fig. 1 reveals that initially viscosity increases gradually as we go from right to left. At a certain point, it cuts the forward curve and
thereafter follows more or less the same trend as the forward curve. Initially, when the protein solutions were added to the large volume of oil, the emulsions were of W/O type11. At a certain stage, the viscosity begins to fall. This point was identified conductometrically as the phase inversion point changing from W/O to O/W
Table 3. SENSORY RATING OF COOKED FISH, G O A T A N D BEEF SAUSAGES
Sample Flavour Odour Texture Overallacceptability
Averagescore
Fish A 4.0±0.3 4.0±0.0 3.0±0.2 3.5 ¿ 0 .2 3.63 ¿0 .40
Fish B 4.5±0.3 4.5±0.3 3.0±0.2 ^ ¿ 0 . 3 3.88¿0.60
Fish C 5.0±0.0 5.0±0.0 3.5±0.3 4 ^ 0 . 1 ^ ¿ 0 . 6 0
Goat 5.0±0.0 5.0 ¿ 0 .0 4.5±0.3 ^ ¿ 0 . 3 4.75¿0.25
Beef 5.0±0.0 5.0±0.0 5.0±0.0 5 ^ 0 . 0 5.00 ¿0 .0 0
Sig. diff. among 5 samples 0.178 0.126 0.509 0.193
D. F. for error mean square 20 20 20 20
S. E. of the mean 0.0419“ 0.0297* 0.1200“ 0.04564
Scoring
Flavour./Odour: Characteristic of fish or meat—5.0; slight fishy or meaty—4.0; just recognisable as fishy or meaty—3.0; no fishy or meaty—2.0; off flavour/odour—1.0.
Texture: Excellent (firm)—5; very good -4; good—3; fair—2; very soft—1.
Acceptability: Like extremely—5; like moderately-4; like slightly—3; neither like nor dislike—2; dislike—1.

BASU et al: EMULSIFICATION e f f ic ie n c y o f e x t r a c t s o f f is h , g o a t a n d b e e f 2 0 7
system. Forward curves represent O/W emulsions and after reaching maximum viscosity do not generally invert to W/O system. This speaks in favour of greater stability of O/W emulsion than W/O emulsion with protein as emulsifier. It is also noted from the curve that it is often difficult to determine $ m from such plots for W/O and O/W systems. So, in reporting the emulsifying capacity the type of emulsions formed need to be mentioned. The data in Tables 1 and 2 are for O/W emulsions. Analysis of variance shows that the differences in scores for each of the four parameters were highly significant (P<0.01). However, inspection of all differences between pair of mean square, employing Hantley’s sequential variant of the Q method, originally due to Newman and Keuls as given by Snedecor and Cochran12 showed that there was no difference in scores of fish C, goat or beef with regard to flavour and odour and with regard to texture and acceptability between Fish A and Fish B. In conclusion, with regard to flavour and odour Fish C compared well with beef and goat. But in texture and acceptability, none of the preparations compared well with beef.
Thus, although the texture of the fish and goat sausage was softer than beef sausage, and acceptability was not as high a popular fish sausage can be prepared.
Acknowledgement
Thanks are due to Dr. C. C. Panduranga Rao., Director, Central Institute of Fisheries Technology, Cochin, for granting study leave to one of the authors (Subrata Basu) during which period this work was carried out in the Department of Food Technology
& Biochemical Engineering, Jadavpur University, Culcutta.
References1. Swift, C. E. and Sulzbacher, W. L., Comminuted meat
emulsions: Factors affecting meat proteins as emulsion stabilisers. F d T ech n o l., 1963, 17, 224.
2. Saffle, R. L., Christian, J. A., Carpenter, J. A. and Zirkle,S. B., Rapid method to determine stability of sausage emulsions and effects on processing temperatures and humidities. F d T ech n ol., 1967, 21, 784.
3. Saffle, R. L., Meat emulsions. A d v . F d R e s ., 1968, 16, 105.4. Schut, J., in F o o d E m u lsio n s by Friberg, S. (Ed.) Marcel
Dekker Inc. New York, 1976, 385.5. Chattoraj, D. K., Bose, A. N., Sen, M. and Chatterjee, P.,
Physico-chemical studies on model meat emulsions in relation to the preparations of stable sheep and goat meat sausage. J. F d S e i . , 1979, 44, 1965.
6. Lee, C. M. and Toledo, R. T„ Processing and ingredientinfluences on texture of cooked comminuted fish muscle. J. F d S e i . , 1979, 44, 1615.
7. Deng, J. C„ Toledo, R. T. and Lillard, D. A., Protein-Protein interaction and fat and water binding in comminuted flesh products. J. F d S e i . , 1981, 46, 1117.
8. Bacher, P., E m u lsion : T h eo ry a n d P ra c tic e , A.C.S. monogramseries Reinhold Publ. Co., New York, 1957.
9. Herring, H. K., Cassens, R. G., Fukazawa, T. and Brishkey,E. J., Studies on natural actomyosin: Survey of experimental conditions. J. F d S e i . , 1969, 34, 308.
10. O ffic ia l M e th o d s o f A n a ly s is , Association of Official Analytical Chemists, Washington, 13th Edn., 1980.
11. Bhatnagar, S. S., Studies in emulsions. 1. A new method ofdetermining the inversions of phases. J. ch em . S o c ., 1920, 117, 542.
12. Snedecor, G. W. and Cochran, W. G., S ta t is t ic a l M e th o d s .Oxford & IBH Publishing Co., New Delhi, 1968.

Enterotoxigenic Staphylococcus aureus in Infant FoodsS a n je e v K. A n a n d * a n d R. S . S i n g h **
Division of Microbiology, National Dairy Research Institute, Karnal-132 001, India
Received 29 May 1986; revised 15 December 1986
About 102 samples o f infant foods were analysed for presence of enterotoxigenic staphylococci. A wide variation was observed in their incidence with a maximum average count o f 3.5 per g. Staphylococci was present in 57.8% of the samples. Among the staphylococcal isolates, 30 per cent produced enterotoxins, mainly (90.7 per cent) o f type B. O ther enterotoxin types produced were A and C in combination with type B. Single radial immunodiffusion was found to be less sensitive than rocket immunoelectrophoresis as these techniques detected 0.50 and 0.30 p g o f enterotoxin, respectively. O ther biochemical tests revealed th a t all enterotoxin producers were TD N ase positive. However, only 84% of these produced coagulase. None o f TD N ase negative strains released enterotoxins, while
7 .8% o f coagulase negative strains produced enterotoxins.
Staphylococci constitute one of the most important group of pathogenic bacteria encountered in baby foods. These are widely distributed in nature. They gain easy access into milk and milk products and are responsible for various health hazards. A few workers have studied the incidence of pathogenic staphylococci in dried milk powder1 and baby foods2,3. So far, no systematic attempt has been made to evaluate enterotoxin production by such strains. The present study was undertaken to investigate the pathogenicity of S. aureus strains isolated from baby foods by quantitatively evaluating their capability to produce different enterotoxins.
Materials and MethodsA total of 102 infant food samples were procured from
different milk plants as well as from local market. These comprised different batches of 10 brands of infant milk food and 3 brands of infant cereal weaning food, designated as brand I to XIII. For microbiological analysis, samples were prepared as per the standard procedure recommended by Indian Standards Institution (ISI)4.
Appropriate dilutions of the samples were spread over prepared plates of Baird-Parker (BP) medium using a hockey bat shaped bent glass rod5. A non-selective enrichment procedure6 was followed using Tryptic Soy broth to enumerate low population of stressed cells of staphylococci. Suspected colonies from the BP medium were picked up and confirmed to be S ■ aureus using various biochemical tests such as sugar fermentation7,8 catalase9, phosphatase10 and gelatinase9 production and haemolysins11 and salt tolerance (7.5 per cent). The
enterotoxigenicity of S. aureus strains was initially checked by coagulase12 and thermostable deoxyribonuclease (TDNase) production13.
All the staphylococcal isolates were subsequently screened for enterotoxin production. A modified cellophane-over-agar procedure14 was used to produce enterotoxins by individual strains. The identification of staphylococcal enterotoxins was done serologically, using microslide gel double diffusion test (MGDD)15. This test indicated the production of only three types of enterotoxins namely: A, B and C by the staphylococcal isolates. These enterotoxins were further quantified using single radial immuno-diffusion (SR1D) technique16 and rocket immunoelectrophoresis (RIE) technique17. Identification and quantification of staphylococcal enterotoxins was carried out using standard antisera A,B,C,D and E obtained from Dr. M. S. Bergdoll, FRI, Wisconsin, USA.
Results and DiscussionA wide variation was noted in staphylococcal counts
in the different samples analysed. The average log counts ranged from 1.0 to 3.5 per gram of the sample. The distribution profile indicated the occurrence of staphylococci in 57.8 per cent of the samples (Table 1). A significant variation (P<0.01) with regard to the incidence of staphylococci was observed among and within different brands. The variation in incidence among different samples has also been reported by earlier workers2,3. One possible reason for such high incidence of staphylococci in infant foods may be due to their
Present address:* Food Microbiology Laboratory, Central Avian Research Institute, Izatnagar-243 122, India.** Sanjay Gandhi Institute of Dairy Technology, Pusa, Bihar.
2 0 8

ANAND AND SINGH; ENTEROTOXIGENIC STAPHYLOCOCCUS AUREUS IN INFANT FOODS 209
Table 1. distribution OF STAPHYLOCOCCI in INFANT FOODS
Counts/g Positivesamples
Per cent
< 1 0 18 30.510-100 13 22.0101-500 22 37.3501-1000 3 5.11001-5000 2 3.4>5000 1 1.7
excessive load in raw milk1. The ISI4 has not formulated any specific standards foi staphylococci in infant foods. However, on comparing the present data with International Standards18 it may be inferred that only 30.5 per cent of the positive samples can be considered to be of good quality as they contained less than 10 staphylococci per gram of sample.
The results obtained in relation to enterotoxigenicity indicated the production of enterotoxins by about 30 per cent of the isolates. These enterotoxins were produced either singly or in combination of more than one type. It may also be observed from Table 2 that 90.7 per cent of S. aureus isolates elaborated enterotoxin type B. Other types of enterotoxins produced were type A and C in combination with type B. The staphylococcal enterotoxins have been shown to be present in milk products including infant foods2,3. However, these authors indicated the predominance of enterotoxin A producers. Our observation of simultaneous production of more than one type of enterotoxin by single strain are in agreement with some of the recent reports19,20- Among isolates of S. aureus recovered during the present study, enterotoxin B producers predominated. Although this group of enterotoxins may not be as hazardous as type A or D, these have also been shown to cause food poisoning21,22.
Higher sensitivity of RIE as compared to SRID; is also evident, RIE and SRiD detected a minimum of 0.3 and 0.5 fig enterotoxins, respectively. However, M'GDD was found to be most suitable for qualitative purposes due to its higher sensitivity to detect a minimum
Table 2. enterotoxin production by s. aureus isolates
Isolates Enterotoxin Per cent(No.) types
Table 3. enterotoxin production and other characteristics of s. aureus isolates
Enterotoxin producersCharacteristics Number Per cent
Mannitol fermentation (anaerobic) 43 100.0Phosphatase 42 97.6Gelatinase 41 95.3Salt tolerance (7.5%) 43 100.0Haemolysins 18 41.8Coagulase 36 83.7TDNASE 43 100.0
No. of enterotoxin producers: 43
of 0.25 f.i g. Majority of the cultures tested (72.1 per cent) produced enterotoxin less than 0.5 fig per ml.
In view of the difficulties encountered during the extraction and assay of staphylococcal enterotoxins, production of various other metabolites by pathogenic strains were used to possibly correlate them with enterotoxin production. The relationship of enterotoxigenic strains with other characteristics of S. aureus is given in Table 3. It was noted that 69.3 per cent of coagulase positive strains elaborated enterotoxins. Interestingly,7.8 per cent of the coagulase negative isolates also produced enterotoxins. Since, more emphasis is now given to the relationship of TDNase with enterotoxin production23-26, it may be inferred from the present findings that all enterotoxin producers were TDNase positive, but the reverse is not true as about 20 per cent of TDNase positive cultures did not produce any enterotoxin.
It may further be observed that all the enterotoxin producers fermented mannitol anaerobically and were salt tolerant as well. However, about 84 per cent of such cultures produced coagulase, while phosphatase and gelatinase activities were recorded in 97.6 and 95.3 per cent of the isolates respectively (Table 3).
It is concluded that incidence of entertoxigenic S. aureus should be viewed with great concern, as infant foods are meant to be consumed by the most vulnerable of the population. No single characteristic can be considered as an absolute indicator of entero-toxigeni- city of S. aureus. There is a need to introduce specific standards regarding the incidence of pathogens like S. aureus in high risk foods such as infant foods.
392
2
BABBC
90.7 Acknowledgement4.7 The financial assistance received in the form of N.D.4 . 7 R.I. Sr. Research Fellowship is gratefully acknowledged
________ by the senior author.2

2 1 0 JOURNAL OF FOOD SCIENCE AND TECHNOLOGY, VOL. 2 4 , SEPT./OCT. 198 7
References1. Ghosh, S. S. and Laxminarayana, H., Incidence and distri
bution of staphylococci in milk and milk products. Indian J . A n im . H lth , 1974, 13, 117.
2. Batish, V. K., Ghodekar, D. R. and Ranganathan, B., Thethermostable deoxyribonuclease (DNase) test as a rapid screening method for the detection of staphylococcal enterotoxins in milk and milk products. M ic ro b io l. Im m u n o l., 1978, 22, 437.
3. Singh, R. S., Singh, S., Batish, V. K. and Ranganathan, B.,Bacteriological quality of infant milk foods. J . F d P r o t . , 1980, 43, 340.
4. H a n d b o o k o f F o o d A n a ly s is . P a r t I . G en era l M e th o d s . IndianStandards Institution, New Delhi, 1981. 1st ed,
5. Baird-Parker, A. C., An improved diagnostic and selectivemedium for isolating coagulase positive staphylococci. J . A p p l. B a c te r io ! , 1962, 25, 12.
6. Heidelbaugh, N. D., Rowley, D. B., Powers, E. M., Bourland,,C. T. and McQueen, J. L., Microbiological testing of skylab foods. A p p l. M ic r o b io l., 1973, 25, 55.
7. Baird-Parker, A. C., A classification of micrococci andstaphylococci based on physiological and biochemical tests. J . G en . M ic r o b io l., 1963, 30, 409.
8. Baird-Parker, A. C., The classification of staphylococci andmicrococci from world-wide sources. J . G en. M ic ro b io l., 1965, 38, 363.
9. Mitruka, B. M., Review of current methods used in bacteriology. In M e th o d s o f D e te c tio n a n d Id e n tif ica tio n o f B a c te r ia , CRC Press, Ohio, 1976,
10. Barber, M. and Kuper, S. W. A., Identification of S ta p h y lo co ccu s p y o g e n e s by phosphatase reaction. J . P a th o l- B a c te r io I , 1951, 63, 65.
11. Harrigan, W. F. and McCance, M. E., L a b o ra to ry M e th o d sin F o o d a n d D a ir y M ic r o b io lo g y ., Academic Press, N.Y., 1976.
12. Sperber, W. H. and Tatini, S. R., Interpretation of thetube coagulase test for identification of S ta p h y lo co ccu s au reu s. A p p l. M ic r o b io l., 1975, 29, 502.
13. Lachica, R. V. F., Genigeorgis, C. and Hocprich, P. D.,Metachromatic agar-diffusion methods for detecting, staphylococcal nuclease activity. A p p l. M ic ro b io l., 1971, 21, 585.
14. Jarvis, A. W. and Lawrence, R. C., Production of hightiter of enterotoxins for the routine testing of staphylococci. A p p l. M ic ro b io l., 1970, 19, 698.
15. Bennet, R. W. and Mc dure, F., Collaborative study of theserological identification of staphylococcal enterotoxins by the microslide gel double diffusion test. J . A s s . O ff. an a l. C h em ., 1976, 59, 594.
16. Meyer, R. F. and Palmieri, M. J., Single radial immunodiffusion method for screening staphylococcal isolates for enterotoxins. A p p l. E n viron . M ic r o b io l., 1980, 40, 1080.
17. Weeks, B., Rocket immunoelectrophoresis. In M a n u a l o fQ u a n tita tiv e Im m u n o e lec tro p h o res is M e th o d s a n d A p p lic a tion . 1973. Universitatsforlaset. Orlo-Bergen-Tromo.
18. M ic ro o rg a n ism s in F oods, International Commission onMicrobiological Specifications for Foods (ICMSF). Univ. of Toronto Press, Toronto, 1974.
19. Vardaraj, M. C., S tu d ie s on th e R o le o f S ta p h y lo c o c c i a s ap o te n t ia l P ro d u cer o f E n te ro to x in in K h o a , 1980. Ph.D. thesis submitted to Kurukshetra Univ.
20. Noleto, A. L. and Bergdoll, M. S., Production of enterotoxin by S ta p h y lo c o c c u s au reu s strain that produces three identifiable enterotoxins. J . F d P r o t . , 1982, 45, 1096.
21. Casman, E. P. and Bennet, R. W., Detection of staphylococcal enterotoxins in food. A p p l. M ic r o b io l., 1965,13, 181.
22. Raj. H. D. and Bergdoll, M. S., Effect of enterotoxin B onhuman volunteers. J . B a c te r ia l ., 1969, 98, 833.
23. Lachica, R. V. F., Wiess, K. F. and Deibel, R. M., Relationship among coagulase, enterotoxin and heat stable deoxyribonuclease production by S ta p h y lo c o c c u s au reus. A p p l . M ic r o b io l., 1969, 18, 126.
24. Rayman, M. K., Park, C. E., Philpott, P. J. and Todd, E. C. D.Reassessment of coagulase and thermostable nuclease test as means of identifying S ta p h y lo c o c c u s au reu s. A p p l. M ic ro b io l., 1975, 29, 451.
25. Rea, M. O’conner and Daly, C., Isolation and characterization of S ta p h y lo c o c c u s au reu s from dairy products. Irish J . F d S c i. T ech n ol., 1979, 3, 61.
26. Bugrova, V. I., Comparative data on the ability of S ta p h y lo co ccu s au reu s to produce enterotoxins and other biologically active substances. V o p ro sy P ita n iy a ., 1982, 4, 70.

A Thermostable /3-Galactosidase from Alternaria palmiSanjeev A graw al* a n d S. M. D utta
Biochemistry Division, National Dairy Research Institute, Karnal-132 001, India
R e c e iv e d 14 O c to b e r 1986; re v is e d 28 J a n u a ry 1987
/3-Galactosidase of A lte r n a r ia p a lm i was purified by acetone fractionation, ultrafiltration through amicon filter PM-30 and column chromatography on DEAE-Sephadex A-50. Its molecular weight was estimated to be about 160,000 daltons by SDS polyacrylamide gel electrophoresis. The enzyme was most active between pH 5.0 and 5.5 and at 65°C. Only 25% of its activity was lost when heated at 65°C for 2 hr. Km and Vmax with ortho-nitrophenyl $ - galactopyranoside as the substrate were 0.8 mM and 0.14 p moles/mg protein/min, respectively. With lactose as the substrate, the values for Km and Vmax were 263 mM and 0.21 p moles/mg protein/min, respectively. Metal ionsas well as group specific reagents had no effect on enzyme
Lactose not only contributes to the nutritive value of milk and milk products, but also to the colour and flavour characteristics of certain dairy products. It, however, presents some problems during processing of milk into certain concentrated, frozen dairy products. Moreover, lactose intolerance is common in the majority of adults in the world. Hydrolysis of lactose in milk by the enzyme, 3-galactosidase can be used to circumvent these difficulties. Extensive studies have been carried out on /6-galactosidase from Kluyveromyces fragilis for this purpose and the enzyme, is now commercially available also. This enzyme, is, however, thermolabile and is inactivated at temperatures above 40 °C. Agrawal et al. 1
screened fortyfive strains of molds to search for a thermostable /8-galactosidase and reported that a strain of Alternaria palmi produces /5-galactosidase which did not lose activity when heated at 65 °C for 45 min. The present communication reports on the purification and properties of jj-galactosidase from A. palmi.
Materials and MethodsAlternaria palmi was obtained from the culture collec
tion centre of National Dairy Research Institute, Karnal and was maintained on Czapeck Dox agar containing lactose as the sole source of carbon2. Spore suspension of A. palmi (1 X10⁸ spores/ml) was inoculated into whey reconstituted to 6 per cent (W/V) total solids and supplemented with casein hydrolysate (2.5 per cent W/V) and corn steep liquor (2 per cent W/V) and adjusted to pH4.0. Mold mycelia obtained after incubation for 9 days at 30 °C were separated by filtering through Whatman
activity.
No. 1 filter paper, washed twice with citrate buffer (0.05M, pH 5.0) and homogenised in the same buffer for preparation of cell free extract.
Cell free extract was prepared by disintegrating the mycelial suspension at 4°C by ultrasonic vibration at 60W in a B12 sonifier. Cell debris was removed by centrifugation (20 minx20,000 g at 4°C) and cell free extract thus prepared was used for assaying /J-galacto- sidase. All the assays were conducted in duplicate. /3-Galactosidase activity was assayed according to Wendroff etu i A The cell free extract was incubated with 1 mM ortho - nitrophenyl - li - galactopyranoside (ONPG) in a total volume of 3 ml at 65°C for 10 min. After incubation, reaction was stopped by addition of 2 ml of 1.0 M sodium carbonate and colour developed was measured at 420 nm. A unit of enzyme activity was expressed as the amount of enzyme required to liberate 1 p mole of ortho-nitrophenol in 1 min at 65 °C under specified conditions. Protein was estimated according to the method of Lowry et alA
Acetone precipitation: Two hundred and fifty ml of chilled acetone was added drop wise to the cell free extract (500 ml) at 4°C with constant stirring. The mixture was allowed to stand for 30 min and centrifuged (20 m in x 500 g at 4°C) to remove the precipitated proteins. An incremental volume of chilled acetone was added to the supemate with constant stirring to get the cell free extract-acetone ratio to 1: 1.5. The mixture was allowed to stand for 30 min and the precipitate formed was collected by centrifugation for 20 min at 5000 g. It was dissolved in 35 ml of phosphate buffer (0.02 M,
* P resen t a d d re ss: Department of Physiology and Biochemistry, SKN College of Agriculture, Sukhadia University, Jobner-303 329, India.
211

212 j o u r n a l o f f o o d s c ie n c e a n d TECHNOLOGY, VOL. 24, SEPT./OCT. 1987
pH 7.0) and dialyzed against the same buffer at 4°C for 12 hr. The dialyzate was concentrated using an ultrafil- tration cell (Amicon filter PM-30).
DEAE-Sephadex A-50 column chromatography: DEAE-Sephadex A-50 was equilibrated with phosphate buffer (0.2 M, pH 7.0) and packed in a glass column (2.0 x 30 cm). The column was then charged with enzyme solution concentrated through the ultrafiltration cell and the chromatogram was developed with 0.1 M sodium chloride in phosphate buffer (0.02 M, pH 7.0). Five ml fractions were collected at a flow rate of 35 ml/hr and active fractions were pooled.
Determination o f molecular weight: Apparent molecular weight of the purified enzyme was determined following the procedure of Weber and Osborn5 using sodium dodecyl sulfate polyacrylamide gel electrophoresis at room temperature. Molecular weight was determined by comparing electrophoretic mobility (Ry) of the purified sample with known protein markers of molecular weight, 70,000, 140,000, 210,000 and 280,000.
Results and DiscussionConsiderations of the growth temperature of micro
organisms normally present in milk and milk products and the heat lability and optimum temperature of the lactose hydrolysing enzyme led several workers to search for a thermostable /3-gaIactosidase preparation exhibiting an elevated optimum temperature6. This paper reports such a study on a thermostable fi-galac- tosidase from A. palmi.
fi-galactosidase from A. palmi was purified by acetone fractionation, ultra-filtration using Amicon filter PM-30, and DEAE sephadex A-50 column chromatography (Fig. 1.). Nearly 30-fold purification was achieved with an overall recovery of 60 per cent activity (Table 1).
Apparent molecular weight of the purified enzyme was observed to be approximately 160,000 daltons. Enzyme preparations from molds have been observed to have a molecular weight ranging from 1 x 10s to 5.7 x 10⁵ daltons6-11. Various substrates viz., 0-nitrophenyl
Fig. 1. DEAE-Sephadex A-50 column chromatography of /J-galactosidase of A. palmi.------, Enzyme activity---- , protein.
/3-D-galactopyranoside, p-nitrophenyl /J-D-galacto- pyranoside, p - nitrophenyl - X - D - galactopyranoside, p-nitrophenylN-acetyl g-D-galactosamine, p-nitrophynyl X -D mannopyranoside, p-nitrophenyl x -L fucopy-
ranoside, 0-nitrophenyl /S-D-fucopyranoside, p-nitrophenyl /J-D-glucopyranoside and 0-nitrophenyl fi-D- xylopyranoside at a concentration of 10"3 M and lactose at a concentration of 10_1M were examined to determine substrate specificity of the enzyme. The enzyme was observed to be highly specific, hydrolysing only /8-D-galactopyranoside linkage. Strict specificity of g-galactosidase for R (1-4) linkage has been reported for the enzyme from other sources also6,12"14.
Optimum temperature of incubation for /J-galacto- sidase of A. palmi was found to be 65°C. A sharp decline in enzyme activity was observed at temperatures above 70 °C. The enzyme was found to be quite stable at 65 °C losing only 25 per cent of its activity on heating at this temperature for 2 hr. Heating at 70°C for 10 min caused a marked loss of enzyme activity (Fig.2). Sorensen and Crisan15 reported that /J-galactosidase of Mucor
T able 1. purification of g —galactosidase of a. palmi
Step/ProcedureVolume
(ml)Enzymeactivity
(units/ml)
Protein(mg/ml)
Specificactivity
(units/mg)
Totalactivity(units)
Purification(fold)
Yield(%)
1. Cell free extract 500.0 0.15 1.00 0.15 75.0 1.0 100
2. Acetone fractionation 35.0 1.90 1.25 1.52 66.5 10.1 89
3. Ultrafiltration 3.5 18.50 7.00 2.64 64.7 17.6 86
4. DEAE-Sephadex A-50 20.0 2.35 0.50 4.70 47.0 31.3 63

AGRAWAL AND DUTTA: THERMOSTABLE /5-GALACTOSIDASE FROM ALTERNARIA PALMI 213
Fig. 2. Thermostability of A . p a lm i /B-galactosidase. —- • —, 55°C; —O—, 60°C; — A — 65°C; —X—, 70°C.
pusillus exhibited an unusual thermostability having a half life of 10 min at 70°C. Griffiths and Muir16 reported a thermostable /5-galactosidase optimally active at 60 °C, having a half life of S3 min at 65 °C. The optimum temperature as well as stability at 65°C for /5-gaIacto- sidase of A. palmi recorded in the present study would be important for commercial scale immobilized lactase reactor.
Optimum pH of the enzyme was recorded between5.0 and 5.5; this would be suitable for the hydrolysis of lactose in acid products such as yoghurt or acid whey. The enzyme was stable on exposure to pH ranging from1.0 to 7.0 overnight at 30°C. Stability over a wide pH range has been observed in /5-galactosidase from molds by several workers9,13,15,17,18.
The Michaelis constant (Km) and maximum velocity Vmax extrapolated from Lineweaver Burk plot were recorded as 8 X 10~4M and 0.14 jumoles/mg protein/min, respectively with ONPG as the substrate. With lactose as the substrate Km and Vmax were found to be 0.263 M and 0.21 p moles/’mg protein/min, respectively.
There was little or no stimulation or inhibition of enzyme activity with 10-4 to 10-3M concentration of metalions such as Pb++, Ag+, Hg++, Ba++, Co++, Cu++ Ni++, Mg++, Mn++, Fe++, Li+, K+ and Na+ and some group specific reagents viz., EDTA, 1, 10 phenanthroline X , x , dipyridyl, hydrazine sulfate, cysteine hydrochloride, 2-mercaptoethanol, N-ethyl maleimide, PCMB, thiomersal, iodoacetamide and ascorbic acid. Metal ions like Na+, K+, Mg++ and Mn++ have been reported to activate /5-galactosidase preparations from yeast and bacteria14,19,20. However, other workers have reported that metal ions or certain group specific reagents did not stimulate or inhibit enzyme activity11,18,21-23. This
enzyme would be important for commercial scale immobilized lactase reactor and might be used along with glucose isomerase in preparation of syrup from lactose and whey.
AcknowledgementThe author (S.A.) is grateful to Council of Scientific
and Industrial Research, New Delhi, for the award of Senior Research Fellowship.
References1. Agrawal, S., Sonawat, H. M. and Dutta, S. M , Thermo
stable /5-galactosidase from fungi. J . D a ir y S c i . , 1982, 65, 366.
2. Haynes, W. D., Wickerman, L. J. and Hasseltine, C. W.,Maintenance of cultures of industrially important microorganisms. A p p l. M ic r o b io l., 1955, 3, 361.
3. Wendorfif, W. L. and Amundson, C. H., Characterization of/5-galactosidase from S a cch a ro m y ces f r a g i l is . J . M i lk F d T ech n o l., 1971, 34, 300.
4. Lowry, O. H., Rosebrough, N. J., Farr, A. L. and Randall,R. J., Protein measurement with folin-phenol reagent. J . bio l. C h em ., 1951, 193, 265.
5. Weber, K. and Osborn, M., The reliability of molecularweight determination by dodecyl sulfate-polyacrylamide gel electrophoresis. J . b io l. C h em ., 1969, 244, 4406.
5. Borglum, G. S. and Sternberg, M. Z., Properties of a fungal lactase. J . F d S c i . , 1972, 37, 619.
7. Bates, W. K. and Woodward, D. O., Neurospora /5-galacto-sidase. Evidence for a second enzyme. S c ien ce , 1964, 146, 777.
8. Ulrich, J. T., Me Feters, G. A. and Temple, K. L., Inductionand characterization of /3-galactosidase in an extreme thermophile. J . B a c te r io l ., 1972, 110, 691.
9. Tanaka, Y., Kagamilshi, A., Kiuchi, A. and Horiuchi, T.,Purification and properties of a /3-galactosidase from A s p e rg il lu s o ry za e . J . b io l. C h em ., 1975, 77, 241.
10. Sugiura, M., Suzuki, M., Sasaki, M. and Shimomura, T.,Studies on /3-galactosidase. I. Purification and properties of /3-galactosidase I and II from S c le ro tiu m tu liparu m C h em . P h a rm . B u ll., 1976, 24, 788.
11. Ogushi, S., Yousimoto, T. and Tsuru, D., Purification andcomparison of two types of /5-galactosidase from A s p e r g il lu s O r y z a e . J . F erm en t. T ech n o l., 1980, 58, 115.
12. Akasaki, M., Suzuki, M., Funakoshi, I. and Yamashina, I.,Characterization of /3-galactosidase from a special strain of A s p e rg il lu s o r y z a e . J . B io ch em ., 1976, 80, 1195.
13. Watanabe, Y., Kibesaki, Y., Takenishi, S., Sakai, K. andTsujisaka, Y., Purification and properties of /5-galactosidase from P e n ic illiu m citr in u m . A g r ic . b io l. C h em ., 1979, 43, 943.
14. Ramana Rao, M. V. and Dutta, S. M., Purification andproperties of /5-galactosidase fiom S tre p to c o c c u s th erm o- p h ilu s , J . F d S c i . , 1981, 46, 1419.
15. Sorensen, S. G. and Crisan, E. V., Thermostable lactasefrom thermophilic fungi. J . F d S c i . , 1974, 39, 1184.

2 1 4 JOURNAL OF FOOD SCIENCE AND TECHNOLOGY, VOL. 24, SEPT./OCT. 1987
16. G riffith s , M . N . a n d M u ir , D . D . , P ro p e r t ie s o f a th e rm o s ta b le jg -g a lac to s id ase fro m a th e rm o p h ilic b a c illu s : C o m p a riso n o f th e enzym e a c tiv ity o f w ho le cells. J. Sci. Fd Agric., 1978, 29, 753.
17. K a j i , A ., S a to , M ., S h in m y o , N . a n d Y a su d a , M ., P u rifica t io n a n d p ro p e rtie s o f a c id f l-D -g a la c to s id a se fro m Corticium rolfsii .Agric. biol. Chem., 1972, 36 , 1729.
18. P a rk , Y . K ., D e S a n ti, H . S. S. a n d P a s to re , G . M ., P ro d u c tio n a n d c h a ra c te riz a tio n o f f l-g a la c to s id a se fro m Aspergillus oryzae. J. Ferment. Technol., 1980, 58, 115.
19. D o n n e lle y , M . J . , P h a n o la in , I . N . a n d P a tc h in g , J . W .,S om e p ro p e rtie s o f m u ltip le fo rm /3 -g a lac to s id ase fro m a n Arthrobacter S p. Int. J. Biochem., 1977, 8, 101.
20. A h n , J . K . an d K im , H . U ., S tu d ies o n th e th e rm o sta b lef l-g a la c to s id a se o f Bacillus coagulans A T C C 8038 u tiliza b le in d a iry p ro d u c ts . Korean J. Anim. Sci., 1977, 19, 220.
21. A n em a, P . J . , P u rif ica tio n a n d som e p ro p e rtie s o f ,6 -g a ia c to -s id a se o f Bacillus subtilis. Biochim. Biophys. Acta, 1964, 89, 495.
22. G o o d m a n , R . E . a n d P e d e rso n , D . M ., /8 -g a lac lo s id ase fro mBacillus stearothermophilus. Can. J. Microbiol., 1976, 22, 817.
23. S u g iu ra , M „ S u zu k i, M ., S asak i, M . a n d S h im o m u ra , T .,S tu d ies o n fl-g a la c to s id a se fro m Macrophomina phaseoli a n d i ts en zy m atic p ro p e rtie s . Chem. Phann. Bull., 1976, 24, 794.
Nitrosamines in Some Indian Brands of Soya Sauce Samples Treated with Nitrite
N . R. S h e n o y a n d A. S . U . C h o u g h u l e y *
Bio-organic Division, Bhabha Atomic Research Centre, Trombay, Bombay-400 085, India
Received 12 September 1986; revised 15 December 1986
Soya sauce on treatment with nitrite leads to the formation of at least three known carcinogenic nitrosamines, namely, nitrosodimethylamine (NDMA), nitrosodiethylamine (NDEA) and nitrosopyrrolidine (NPY). 1-Methyl-1, 2, 3, 4-tetrahydro-j3-carboHne-3-carboxylic acid (MTCCA) whose nitroso derivative is known to be mutagenic is also formed under these conditions. However, some antioxidant factors present in the food are likely to offer protection against nitrosamines in the diet containing soya sauce.
Diet and life-style related factors are responsible for more than 80 per cent of the cancers. Nitrosamines, present as such or formed by the interaction of food and tobacco amines with dietary and salivary nitrite are believed to subscribe to about 30 per cent of these cancers1. A number of processed foods have been examined for their nitrosamine content before and after treating with nitrite. Soya sauce is one of these as it is widely used for the seasoning of foods. In recent years, its use in India is on the increase with the popularity of Chinese foods and soya products. There are reports about the formation of nitrosamines in some samples of soya sauce of American and Japanese makes when treated with nitrite2,3. However, the nature and quantity of nitrosamines formed varies from product to product and it was therefore considered relevant to examine the nitrosamine content of the locally available soya sauce samples as such and after treatment with nitrite.
M aterials and M ethodsThree brands of soya sauce a, b and c were purchased
from the local market. Sodium nitrite. ‘Analar grade’, was supplied by BDH (India). Standard nitrosamine samples were procured from Sigma Chemical Co. USA.
UV spectra were recorded with a Carl Zeiss Model RPQ 20A spectrophotometer. Gas chromatography was carried out on a Toshniwal gas chromatograph type RL04 equipped with a hydrogen flame ionization detector. The column was a 10 per cent silar 7C glass column. The operating conditions were: Nitrogen flow rate, 40 ml/min; injection temp, 2403C; column temp., 140/180 °C. For HPLC, liquid chromatograph model ALC/GPC-244 equipped with model 6000 A solvent delivery system and model U 6 K injection system supplied by M/s Waters Associates, Milford, USA was used. The HPLC column was a p Bondapak Cj8
column. The operating conditions were: Solvent system, H2 O: CHgOH (90:10 v/v); flow rate 1 ml/min; chart speed 0.2 in./min; detector UV at 254 nm.
Isolation and identification o f volatile nitrosamines in soya sauce as such and after treatment with nitrite: One litre of soya sauce was first defatted with petroleum ether
*T o w h o m e n q u irie s m ay b e add ressed .
SHENOY AND CHOUGHULEY : NITROSAMINES IN NITRITE TREATED SOYA SAUCE 2 1 5
(b.p. 60-80°, 3x500 ml) and extracted with methylene chloride (3 X 500 ml) to isolate preformed nitrosamines, if any. Both the extracts were concentrated and then examined for Griess-reagent4 positive compounds by thin layer chromatography (TLC) (Silica Gel G plates; hexane: ethyl acetate: methylene chloride, 5:2:2 v/v).
The defatted soya sauce (as above) was treated with 2 g (2000 p.p.m.) of sodium nitrite, acidified to pH 3.5 with HC1 (1:1) and stirred at room temperature for 2 hr. The mixture was then steam-distilled5 and the distillate extracted with methylene chloride (3x500 ml). The extract was washed with water, dried over anhydrous sodium sulphate and concentrated to 1 ml. The concentrate was examined by TLC as above. Preparative TLC was carried out to separate the various products (silica gel G plates; hexane: ethyl acetate: methylene chloride 5:2:2 v/v). Compounds corresponding to Griess-reagent positive areas were extracted with methylene chloride and then examined by gas liquid chromatography (GLC) and co-chromatographed with authentic standards.
Isolation o f \-methyl-\ ,2,3,A-tetrahydro-B-carboline-3 carboxylic acid (MTCCA) from soya sauce samples: The carboline derivative was isolated by partial modification of the procedure of Wakabayashi et al. 3
Hundred ml of soya sauce was first defatted by extraction with petroleum ether (b.p. 60-30°, 2x50 ml). It was diluted 20 times with water and passed through a column of activated charcoal (4x16 cm). The column was washed with water and the material eluted with (i) methanol, (ii) methanol-1M acetic acid, (Hi) methanol followed by (iv) methanol-IN NH 4 OH and finally(v) with methanol again as described by Wakabayashi et all. The fractions eluted with methanol, 80 per cent methanol-lM acetic acid and methanol were pooled and evaporated to dryness and the dry material (4 g) was dissolved in water (90 ml) and loaded on an Amberlite XAD-7 column (4x20 cm). The column was washed with water and the material eluted with methanol. The eluate was again evaporated to dryness and dissolved in benzene. This solution was loaded onto a silica gel column (250 g, 5x35 cm) and eluted with benzene- methanol (100:0 to 0:100 v/v) gradient. Most of MTCCA was eluted with 80:20 benzene, methanol: The fraction containing MTCCA was concentrated and purified by preparative TLC (silica gel G, methanol: benzene 40:60 v/v). The compound so obtained gave a single spot when rechromatographed.
Results and DiscussionThe nitrosamines characterized in the steam distil
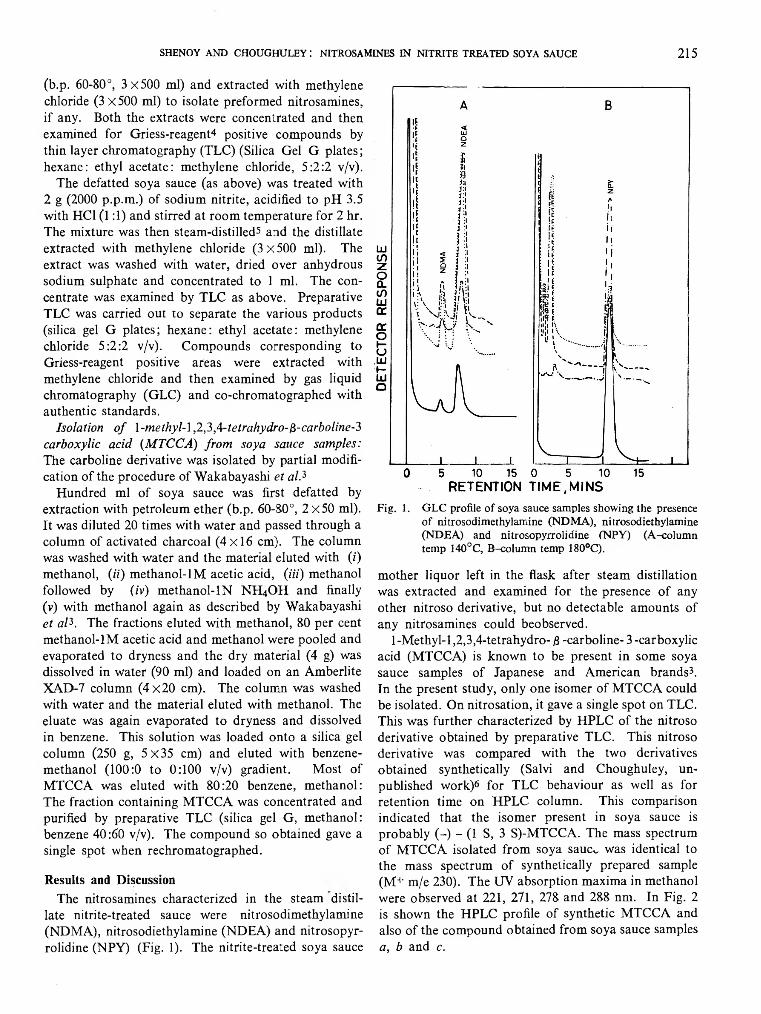
late nitrite-treated sauce were nitrosodimethylamine (NDMA), nitrosodiethylamine (NDEA) and nitrosopyr- rolidine (NPY) (Fig. 1). The nitrite-treated soya sauce
F ig . 1. G L C p rofile o f so y a sauce sam ples sh o w in g th e p resence o f n itro so d im e th y la m in e (N D M A ), n itro so d ie th y la m in e (N D E A ) a n d n itro so p y rro lid in e (N P Y ) (A -c o lu m n tem p 140°C , B -c o lu m n tem p 180°C ).
mother liquor left in the flask after steam distillation was extracted and examined for the presence of any other nitroso derivative, but no detectable amounts of any nitrosamines could beobserved.
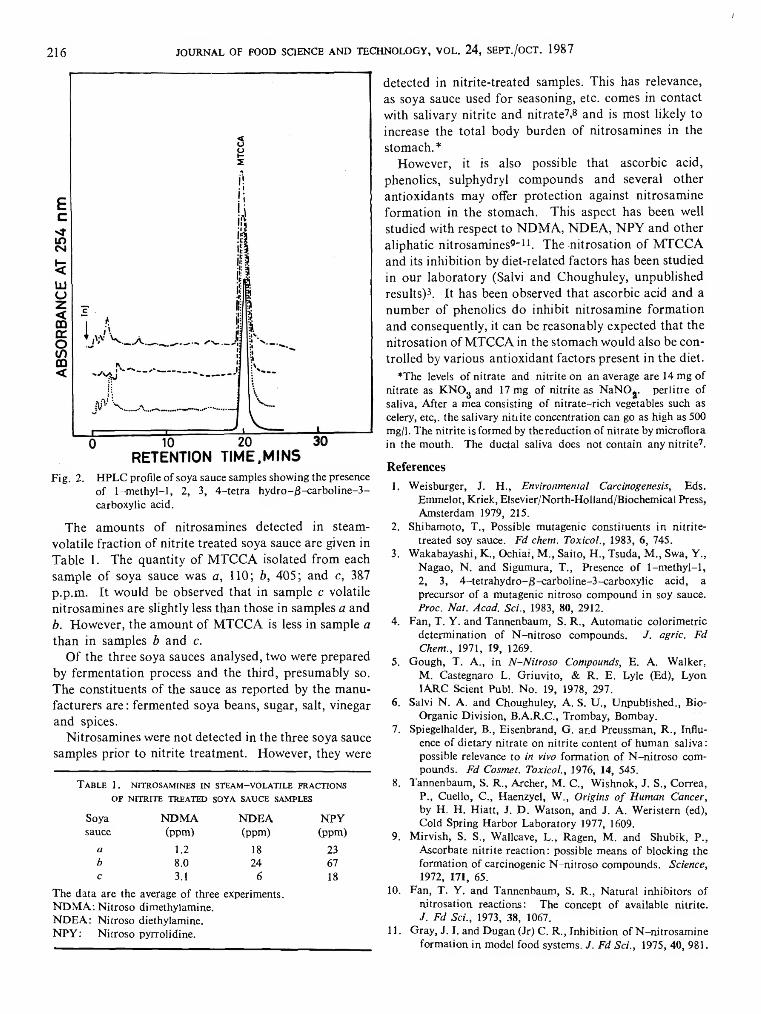
1-Methyl-1,2,3,4-tetrahydro- B -carboline- 3 -carboxylic acid (MTCCA) is known to be present in some soya sauce samples of Japanese and American brands3. In the present study, only one isomer of MTCCA could be isolated. On nitrosation, it gave a single spot on TLC. This was further characterized by HPLC of the nitroso derivative obtained by preparative TLC. This nitroso derivative was compared with the two derivatives obtained synthetically (Salvi and Choughuley, unpublished work) 6 for TLC behaviour as well as for retention time on HPLC column. This comparison indicated that the isomer present in soya sauce is probably (-) - ( 1 S, 3 S)-MTCCA. The mass spectrum of MTCCA isolated from soya sauc^ was identical to the mass spectrum of synthetically prepared sample (M3" m/e 230). The UV absorption maxima in methanol were observed at 221, 271, 278 and 288 nm. In Fig. 2 is shown the HPLC profile of synthetic MTCCA and also of the compound obtained from soya sauce samples a, b and c.
I
2 1 6 JOURNAL OF FOOD SCIENCE AND TECHNOLOGY, VOL. 24, SEPT./OCT. 1987
F ig . 2. H P L C p ro file o f so y a sau ce sam p les sh o w in g th e p resence o f 1-m e th y l-1 , 2, 3, 4 - t e t r a h y d r o - ^ - c a r b o l in e - 3 - ca rb o x y lic ac id .
The amounts of nitrosamines detected in steam- volatile fraction of nitrite treated soya sauce are given in Table 1. The quantity of MTCCA isolated from each sample of soya sauce was a, 110; b, 405; and c, 387 p.p.m. It would be observed that in sample c volatile nitrosamines are slightly less than those in samples a and b. However, the amount of MTCCA is less in sample a than in samples b and c.
Of the three soya sauces analysed, two were prepared by fermentation process and the third, presumably so. The constituents of the sauce as reported by the manufacturers are : fermented soya beans, sugar, salt, vinegar and spices.
Nitrosamines were not detected in the three soya sauce samples prior to nitrite treatment. However, they were
T able 1. nitrosamines in steam- volatile fractions of nitrite treated soya sauce samples
Soya N D M A N D E A N P Ysauce (ppm ) (p p m ) (p p m )
a 1.2 18 23b 8.0 24 67c 3.1 6 18
T h e d a ta a re th e average o f th ree experim en ts . N D M A : N itro so d im e th y lam in e .N D E A : N itro so d ie th y lam in e .N P Y : N itro so p y rro lid in e .
detected in nitrite-treated samples. This has relevance, as soya sauce used for seasoning, etc. comes in contact with salivary nitrite and nitrate7 .8 and is most likely to increase the total body burden of nitrosamines in the stomach. *
However, it is also possible that ascorbic acid, phenolics, sulphydryl compounds and several other antioxidants may offer protection against nitrosamine formation in the stomach. This aspect has been well studied with respect to NDMA, NDEA, NPY and other aliphatic nitrosamines9"11. The-nitrosation of MTCCA and its inhibition by diet-related factors has been studied in our laboratory (Salvi and Choughuley, unpublished results)3. It has been observed that ascorbic acid and a number of phenolics do inhibit nitrosamine formation and consequently, it can be reasonably expected that the nitrosation of MTCCA in the stomach would also be controlled by various antioxidant factors present in the diet.
*T he levels o f n i tr a te a n d n i tr i te o n a n av erag e a re 14 m g o f n itr a te as K N O g a n d 17 m g o f n i tr i te a s N a N O g. p e r l i t r e o f sa liv a , A fte r a m ea co n sis tin g o f n i t r a te - r ic h vegetab les su ch as celery , e tc ,, th e sa livary n itr i te c o n c e n tra tio n c an go as h ig h as 500 mg/1. T h e n i tr i te is fo rm ed by th e re d u c tio n o f n i tr a te b y m ic ro flo ra in th e m o u th . T h e d u c ta l sa liv a do es n o t c o n ta in a n y n i tr i te 7.
References1. W eisb u rg e r, J . H ., Environmental Carcinogenesis, E d s.
E m m elo t, K rie k , E Ise v ie r/N o rth -H o lla n d /B io c h em ic a l P ress , A m ste rd am 1979, 215.
2. S h ib a m o to , T ., P o ss ib le m u ta g e n ic c o n s titu e n ts in n itr i te -t r e a te d soy sauce . Ed chem. Toxicol., 1983, 6 , 745.
3. W ak a b a y a sh i, K ., O c h ia i, M ., S a ito , H ., T su d a , M ., Sw a, Y .,N a g a o , N . a n d S ig u m u ra , T ., P resen ce o f 1 - m e th y l - l , 2 , 3, 4 - te tra h y d ro - j8 -c a rb o l in e -3 -c a rb o x y l ic a c id , ap re c u rso r o f a m u ta g e n ic n itro s o c o m p o u n d in soy sauce. Proc. Nat. Acad. Sci., 1983, 80, 2912.
4. F a n , T . Y . a n d T an n e n b au m , S. R . , A u to m a tic c o lo r im e tr icd e te rm in a tio n o f N - n i t r o s o co m p o u n d s . J. agric. Fd Chem., 1971, 19, 1269.
5. G o u g h , T . A ., in N-Nitroso Compounds, E . A . W alk e r,M . C a steg n a ro L . G r iu v ito , & R . E . L y le (E d), L y o n I A R C S c ien t P u b l. N o . 19, 1978, 297.
6. S alv i N . A . a n d C h o u g h u ley , A . S. U ., U n p u b lish e d ., B io -O rg a n ic D iv is io n , B .A .R .C ., T ro m b a y , B o m b ay .
7. S p ieg elh a ld er, B ., E isen b ra n d , G . a n d P re u ssm a n , R . , In flu ence o f d ie ta ry n i tr a te o n n i tr i te c o n te n t o f h u m a n s a liv a : possib le re levance to in vivo fo rm a tio n o f N - n i t r o s o co m p o u n d s . Fd Cosmet. Toxicol., 1976, 14, 545.
8. T an n e n b au m , S . R . , A rc h e r, M . C ., W ish n o k , J . S ., C o rre a ,P ., C u e llo , C ., H aen zy e l, W ., Origins of Human Cancer, b y H . H . H ia tt , J . D . W atso n , a n d J . A . W e r is te rn (ed), C o ld S p rin g H a rb o r L a b o ra to ry 1977, 1609.
9. M irv ish , S. S ., W allcave , L ., R a g en , M . a n d S h u b ik , P .,A sco rb a te n i tr i te re a c tio n : p o ss ib le m ea n s o f b lo ck in g th e fo rm a tio n o f ca rc in o g en ic N -n i t ro s o co m p o u n d s . Science, 1972, 171, 65.
10. F a n , T . Y . a n d T a n n e n b a u m , S . R . , N a tu ra l in h ib ito rs o fn itro s a tio n re a c tio n s : T h e c o n ce p t o f a v a ilab le n i tr i te .J. Fd Sci., 1973, 38, 1067.
11. G ra y , J . I. an d D u g a n (Jr) C . R . , In h ib it io n o f N -n i t ro s a m in efo rm a tio n in m o d el fo o d system s. J. Fd Sci., 1975, 40, 981.

Study of the Physico-chemical, Rheological, Baking and Noodle Quality of improved Durum and Bread Wheat Cultivars
A. K. B a k h s h i a n d G. S. B a in s
Department of Food Science and Technology, Punjab Agricultural University,Ludhiana-141 004, India
Received 28 M ay 1986; revised 28 January 1987
Physico-chemical, rheological and end use properties of 10 improved cultivars of durum and two of bread wheats were investigated. Durum flours were characterised by significantly higher pigments (£ -carotene), protein, damaged starch and diastatic activity. Ideologically, durum cultivars showed dough development times of 0.9-2.1 min as compared to 2.4-2.8min of bread wheats. Their water absorptions were significantly higher and were attributed to the higher damaged starch content. The loaf volumes of durum flours were less than those of bread wheat flours.Among durum cultivars ‘HD 4571’, ‘BitternS’, ‘DWL 5061’, ‘DWL5023’, ‘DWL5009’ and ‘HI 8137’ were outstanding in respect of noodle quality, characterised by pigment content and gruel clarity.
Durum wheat production in India is estimated at about 3 million tonnes. This is likely to increase as about 10 per cent of the cropped wheat area in Punjab, is expected to be covered by the newly evolved durum varieties which are more resistant to Karnal bunt disease than bread wheat cultivars1,2. Durums are preferred for pasta production3. Bread wheats are more extensively grown in different parts of the world including India4"7. The technological implications of likely increased production of durum wheat by Punjab, a surplus bread wheat producing state, have several implications for the cereal processing industry and the consumer. A number of durum cultivars are undergoing field tests. Information regarding their technological suitability is lacking. Results of physico-chemical, rheological and end use properties of promising durum cultivars are presented in this paper.
M aterials and M ethodsRepresentative samples of ten varieties of durum,
‘DWL 5023’, ‘DWL 5009’, ‘DWL 5031’, ‘MPO 456’, ‘Bittern ‘S’, ‘HI 8137’, ‘DWL 5061’, ‘HD 4571’, ‘Raj 2413’, ‘DWL 5045’ and of two bread wheats, ‘WL 1562’ and ‘WL 711’ were obtained from the 1980-81 crop grown at the experimental farms of the Punjab Agricultural University. ‘DWL 5023’ durum is now grown extensively in the Punjab.
The samples were cleaned and milled into flour in the Buhler Pneumatic Laboratory Flour Mill (ML 202). The durum varieties were conditioned to 16.0 per cent moisture and bread wheats to 15.5 per cent moisture,
respectively. A feed rate of lOOg/min facilitated satisfactory milling. Bran and shorts were dusted in the bran finisher to recover adhering fractions of flour and homogeneously mixed with the break and reduction flours, kept in air-tight containers and used for different studies.
Mixing properties of the doughs were evaluated using the Brabender farinograph, according to the AACC methods8. Extensibility of the dough was determined by the alveograph method. The dough was prepared as described by Kent-Jones and Amos9. The curves were interpreted for extensibility (1, cm), tenacity (T, curve height, cm) and area (S, cm2). Moisture, protein (N X5.7), gluten, diastatic activity, damaged starch, ash, sugars and pigments were determined according to the AACC methods8.
Noodles: Flour (30g) was made into a stiff dough by hand kneading until smooth, rolled to a uniform 9-inch diameter disc using a wooden rolling pin. Strips of uniform size of 1 mm width were cut and dried under ambient conditions. The noodles were evaluated for cracks, appearance and cooking quality. The gruel of the cooked noodles was evaluated for iodine blue (IB) values using the method of Batchel et al io.
Baking: Straight dough procedure of Irvine and McMullan11 was followed without the remixing step. The baking formula consisted of lOOg flour, 2.25g yeast, 1.5g salt, 2.0g sugar, 10 ppm potassium bromate and optimum water absorption. Loaf volume was measured by the rapeseed displacement method.
The results have been expressed on 14 per cent moisture basis and statistically examined for the varietal
2 1 73

218 JOURNAL OF FOOD SCIENCE AND TECHNOLOGY, VOL. 24, SEPT./OCT. 1987
Table 1. yield and composition of durum and bread wheat flours
D u ru m flours B read w h ea t flours
Y ie ld /c o tn p o s itio n M ean R an g e C . V. ( % ) M ean R an g e
F lo u r y ie ld ( % ) 60.6 54.1-66.9 8.2 71.1 70.9-72.2
A sh (% ) 0.65 0.59-0.74 7.6 0.45 0.43-0.48
D ry g lu te n (% ) 11.0 9.6-12.7 8.2 9.8 9 .6-10 .1
P ig m en ts as B -c a io te n e (ppm ) 3.9 3.0-4.8 15.8 1.8 1.2 -2 .3
R e d u c in g su g a rs (% ) 0.36 0.3-0.4 7.9 0.275 0.27-0.28
N o n -re d u c in g su g a rs (% ) 1.8 1.5 -2 .2 12.0 1.5 1 .3 -1 .6
D a m ag e d s ta rc h (% ) 14.6 10.8-24.5 14.8 9.2 8.9-9.5
C .V .: C oefficient o f v a r ia tio n
differences by Thomas and Hills12 method. The coefficient of variation (C.V.) was also calculated.
Results and DiscussionThe durum cultivars gave lower yields of straight-
grade flour than bread wheats. Their ash content was higher than that of bread wheat flours (Table 1). Higher ash contents in durum flour have also been reported by other workers13-15. A durum semolina of 65 per cent extraction was reported to have an ash content of 0.55 to 0.75 per cent15. The ash content depended on the variety and milling efficiency.
The protein contents of durum flours were generally higher than those of bread wheat flours. Bread wheat glutens were stronger and more elastic than those of durums. However, glutens of ‘MPO 456’ and ‘DWL 5023’ were generally more elastic but not as strong. The pigments in durum flours were distinctly higher than in
bread flours. ‘HI 8137’ flour had maximum yellow pigments among the durum cultivars. The higher pigments in the durum flours were also reflected in their gluten pigments which were distinctly higher than pigments in bread wheat glutens which were whitish looking.
Reducing sugars were maximum in the flours of ‘Bittern ‘S’ and ‘DWL 5009’ varieties, whereas ‘HD 4571’ had the lowest value; no marked differences were observed among the flours of different varieties. Unlike reducing sugars, the non-reducing sugars predominated in the flours of durum varieties as compared to those of bread wheat flours.
Farinograph curve characteristics: Durum floursinvariably showed higher absorption in the range of66.0 to 81.0 per cent for centering the curves on the 500 B.U. line as compared to 64.8 and 66.2 per cent absorption of ‘WL 1562’ and ‘WL 711’ bread wheat flours,
Table 2. farinograph and alveograph curve characteristics of durum and bread wheat flours
R h eo lo g ica l D u ru m flours B read w h eat floursp a ram e te r M e a n R a n g e C .V . ( % ) M e a n R an g e
Farinograph curve
F a r in o g ra p h w a te r a b so rp tio n (% ) 72.3 66.0-81.0 6.9 65.5 64.0-66.2D o u g h d ev e lo p m en t tim e (m in ) 1.7 0.9-2.1 21.2 2.6 2.4-2.8M ix in g to le ran c e in d ex (B .U .) 100 65-140 23.0 10.5 10 .0 -11.0S ta b ility (m in ) 3.4 1.8 -7 .7 54.1 14.1 13.9 -14 .3S o ften in g (B .U .) 89.5 50-130 34.0 9.3 4.0-14.6
Alveograph curves
R esistan ce to d e fo rm a tio n (cm ) 12.1 7.0-15.0 22.3 11.6 10 .2 -13.0E x te n sib ility (cm ) 4.1 2 .1-S .l 29.3 5.9 5.3-6.4C urves a re a (cm 2) 32.7 10.0-47.0 39.4 34.0 33 -35B u re tte w a te r level (m l) 12.5 9.0-15.5 16.8 16.0 15 .5 -16 .5
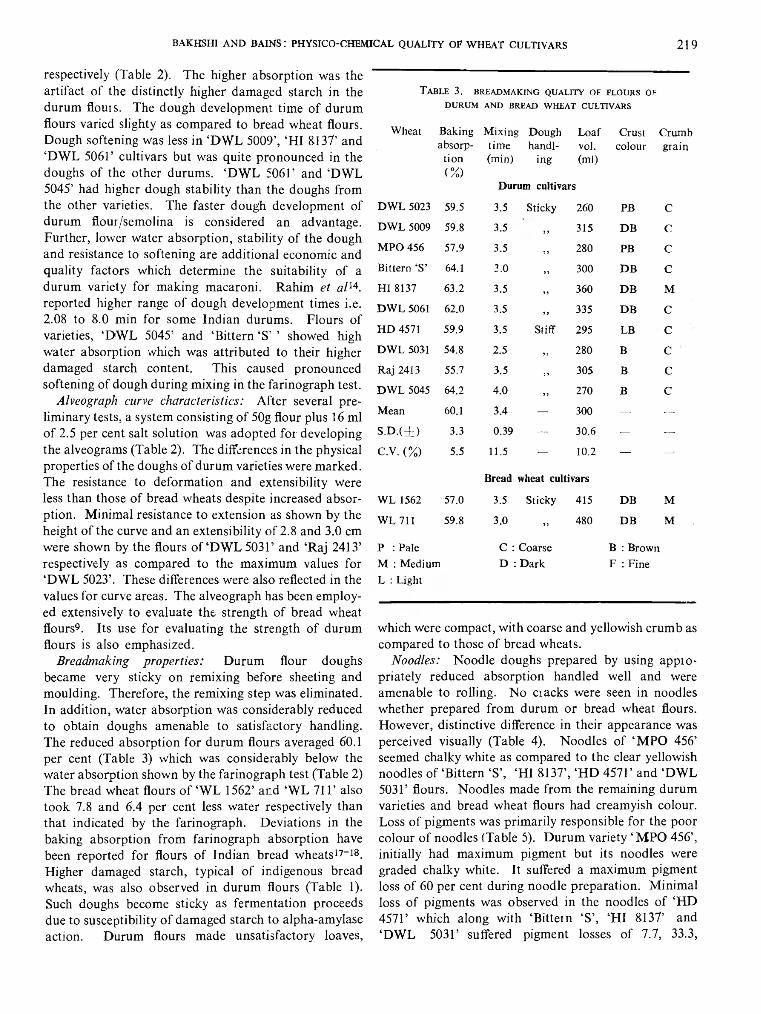
BAKHSHI AND BAINS : PHYSICO-CHEMICAL QUALITY OF WHEAT CULTIVARS 219
respectively (Table 2). The higher absorption was the artifact of the distinctly higher damaged starch in the durum flouis. The dough development time of durum flours varied slighty as compared to bread wheat flours. Dough softening was less in ‘DWL 5009’, ‘HI 8137’ and ‘DWL 5061’ cultivars but was quite pronounced in the doughs of the other durums. ‘DWL 5061’ and ‘DWL 5045’ had higher dough stability than the doughs from the other varieties. The faster dough development of durum flour/semolina is considered an advantage. Further, lower water absorption, stability of the dough and resistance to softening are additional economic and quality factors which determine the suitability of a durum variety for making macaroni. Rahim et a /14, reported higher range of dough development times i.e.2.08 to 8.0 min for some Indian durums. Flours of varieties, ‘DWL 5045’ and ‘Bittern ‘S’ ’ showed high water absorption which was attributed to their higher damaged starch content. This caused pronounced softening of dough during mixing in the farinograph test.
Alveograph curve characteristics: After several preliminary tests, a system consisting of 50g flour plus 16 ml of 2.5 per cent salt solution was adopted for developing the alveograms (Table 2). The differences in the physical properties of the doughs of durum varieties were marked. The resistance to deformation and extensibility were less than those of bread wheats despite increased absorption. Minimal resistance to extension as shown by the height of the curve and an extensibility of 2.8 and 3.0 cm were shown by the flours o f ‘DWL 5031’ and ‘Raj 2413’ respectively as compared to the maximum values for ‘DWL 5023’. These differences were also reflected in the values for curve areas. The alveograph has been employed extensively to evaluate the strength of bread wheat flours9. Its use for evaluating the strength of durum flours is also emphasized.
Breadmaking properties: Durum flour doughsbecame very sticky on remixing before sheeting and moulding. Therefore, the remixing step was eliminated. In addition, water absorption was considerably reduced to obtain doughs amenable to satisfactory handling. The reduced absorption for durum flours averaged 60.1 per cent (Table 3) which was considerably below the water absorption shown by the farinograph test (Table 2) The bread wheat flours of ‘WL 1562’ and ‘WL 711’ also took 7.8 and 6.4 per cent less water respectively than that indicated by the farinograph. Deviations in the baking absorption from farinograph absorption have been reported for flours of Indian bread wheats17-18. Higher damaged starch, typical of indigenous bread wheats, was also observed in durum flours (Table 1). Such doughs become sticky as fermentation proceeds due to susceptibility of damaged starch to alpha-amylase action. Durum flours made unsatisfactory loaves,
Table 3. breadmaking quality of flours ofD U R U M A N D BREAD W H E A T CULTIVARS
W h ea t B a k in ga b so rp
t io n(% )
M ix in g D o u g h L o a f t im e h a n d l- vol. (m in ) in g (m l)
Durum cultivars
C ru stc o lo u r
C ru m bg ra in
D W L 5023 59.5 3.5 S tick y 260 P B C
D W L 5009 59.8 3.5 99 315 D B C
M P O 456 57.9 3.5 , , 280 PB cB itte rn ‘S ’ 64.1 3.0 99 300 D B cH I 8137 63.2 3.5 „ 360 D B M
D W L 5061 62.0 3.5 99 335 D B C
H D 4571 59.9 3.5 S tiff 295 LB C
D W L 5031 54.8 2.5 99 280 B C
R a j 2413 55.7 3.5 , , 305 B C
D W L 5045 64.2 4 .0 9 9 270 B cM e a n 60.1 3.4 — 300 — —
S . D . ( ± ) 3.3 0.39 — 30.6 — —
C .v. (% ) 5.5 11.5 — 10.2 — —
Bread wheat cultivars
W L 1562 57.0 3.5 S ticky 415 D B M
W L 711 59.8 3.0 99 480 D B M
P : P a le C : C o a rse B : B ro w nM : M e d iu m D : D a rk F : F in e
L : l ig h t
which were compact, with coarse and yellowish crumb as compared to those of bread wheats.
Noodles: Noodle doughs prepared by using appio- priately reduced absorption handled well and were amenable to rolling. No ciacks were seen in noodles whether prepared from durum or bread wheat flours. However, distinctive difference in their appearance was perceived visually (Table 4). Noodles of ‘MPO 456’ seemed chalky white as compared to the clear yellowish noodles of ‘Bittern ‘S’, ‘HI 8137’, ‘HD 4571’ and ‘DWL 5031’ flours. Noodles made from the remaining durum varieties and bread wheat flours had creamyish colour. Loss of pigments was primarily responsible for the poor colour of noodles (Table 5). Durum variety ‘MPO 456’, initially had maximum pigment but its noodles were graded chalky white. It suffered a maximum pigment loss of 60 per cent during noodle preparation. Minimal loss of pigments was observed in the noodles of ‘HD 4571’ which along with ‘Bittern ‘S’, ‘HI 8137’ and ‘DWL 5031’ suffered pigment losses of 7.7, 33.3,

2 2 0 JOURNAL OF FOOD SCIENCE AND TECHNOLOGY, VOL. 2 4 , SEPT./OCT. 1987
T a b l e 4 . c o o k i n g q u a l it y o f n o o d l e s p r e p a r e d
FROM DURUM AND BREAD WHEAT FLOURS
Wheat Wateruptake(ml/g)
Gruelsolids(%)
IB values (O.D.)
Score Remarks
Durum cultivars
DWL 5023 4.0 0.82 . 0.45 7 G
DWL 5009 4.3 0.74 0.39 7 G
MPO 456 5.2 0.68 0.58 5 G
Bittern ‘S’ 4.4 1.00 0.56 8 VG
HI 8137 4.9 0.87 0.50 7 G
DWL 5061 4.4 0.93 0.44 8 VG
HD 4571 3.5 0.58 0.28 10 E
DWL 5031 3.7 0.59 0.36 5 A
Raj 2413 3.8 0.56 0.44 5 A
DWL 5045 3.6 0.59 0.45 5 A
Mean 4.2 0.74 0.44 — —
S. D. ( ± ) 0.56 0.16 0.08 — —
C. V. (%) 13.4 21.6 18.4 — —
Bread wheat cultivars
WL 1562 3.9 0.98 0.36 5 A
WL 711 4.4 0.63 0.35 3 P
G : Good P : Poor
A : Acceptable E : Excellent
VG : Very good
T a b l e 5 . p i g m e n t l o s s e s i n t h e p r e p a r a t i o n o f
NOODLES FROM DURUM AND BREAD WHEAT FLOURS
Pigment asWheat -carotene (ppm) pigment Appearance
Flour Noodles loss (.%)
Durum cultivars
DWL 5023 3.3 2.1 36.4 Creamy
DWL 5009 3.3 2.4 27.3 Creamy
MPO 456 4.5 1.8 60.0 Chalky
Bittern ‘S’ 4.2 2.8 33.3 Yellowish
HI 8137 4.2 3.3 21.4 Yellowish
DWL 5061 3.3 2.1 36.3 Creamy
HD 4571 3.9 3.6 7.7 Yellowish
DWL 5031 4.2 3.2 23.8 Yellowish
Raj 2413 4.2 3.4 19.1 Creamy
DWL 5045 3.0 2.1 30.0 Creamy
Mean 3.8 2.7 29.8 —
S. D . ( ± ) 0.53 0.66 13.8 —
C. V. (%) 13.9 24.5 46.2 —
Bread wheat cultivars
WL 1562 2.1 1.8 14.3 White
WL 711 1.5 1.5 0.0 ? J
combine resistance to diseases, at the same time ensuring suitability for baking.
21.4 and 53.8 per cent, respectively. However, they were visually judged as yellowish.
Variation in gruel loss was more than that of the water uptake of the noodles during cooking. Noodles of durum were less sticky than those of bread wheat. Consistency was relatively better for the noodles of ‘DWL 5031’, ‘Raj 2413’, ‘DWL 5045’, ‘MPO 456’, ‘Bittern ‘S” and ‘HI 8137’ varieties as well as of the bread wheats. Eating quality of noodles from all the varieties was rated high with the exception of ‘WL 711’ noodles which were softer to bite. The noodles of ‘HD 4571’ variety were rated high closely followed by those of ‘Bittern ‘S” , ‘DWL 5061’, ‘DWL 5023,’ ‘DWL 5009’ and ‘HI 8137’.
Though durum cultivars are less satisfactory for breadmaking they were more suitable for macaroni products. It may be important to develop new varieties by crossing bread wheat and durum wheat genotypes to
References1. Gill, K. S., The durum wheat in India. G en e t. A g r ., 1985,
39, 163.2. Munjal, R. L., Bunt disease of wheat. S c i. R e p ., 1966, 3, 32.3. Matsuo, R. R., and Irvine, G. N., Rheology of durum
wheat products. C e re a l C h em ., 1970, 42, 173.4. Walsh, D. E. and Gilles, K. A., The influence of protein
composition on spaghetti making quality. C e re a l C h em ., 1971, 48, 544.
5. Matweef, M., Influence of the gluten of hard wheats on thevalue of food pastes (doughs). B u ll. an c . E le v . E c . F r. M a u n ., 1966, 213, 133.
6. Matsuo, R. R., Bradley, J. W. and Irvine, G. N., Effect ofprotein content on the cooking quality of spaghetti. C e r e a l C h em ., 1972, 49, 707.
7. Wasik, R. J. and Bushuk, W., Relation between molecularweight distribution of endospermic proteins and spaghetti making quality of wheats. C e re a l C h em ., 1975, 52, 322.
8. A p p r o v e d M e th o d s , American Association of Cereal Chemists,St. Paul, Minn., 1976.
PADMASHREE et al: TRADITIONAL PROCESSING ON THE FUNCTIONAL PROPERTIES OF COWPEA FLOUR 221
9. Kent-Jones, D. W. and Amos, A., M o d e rn C e re a l C h em is try . F o o d Trade Press, London, 1967.
10. Batchel, O. M., Deary, P. A. and Dawson, E. H., Cookingquality of 26 varieties of milled rice. C e re a l C h em ., 1957, 34, 277.
11. Irvine, G. N. and McMullan, M. E., The ‘remix’ bakingtest. C e r e a l C h em ., 1960, 37, 603.
12. Thomas, M. L. and Hills, F. J. S ta t i s t ic a l M e th o d s inA g r icu ltu ra l R esea rch , University of California, California, 1972, 242.
13. Puri, Y. P., Qualset, C. D., Baghott, K . G., Vogt, H. E„Lehman, W. F., Hemplern, E. W., Shuey, W. G., Prato, J. D. and Modok, A., A new durum wheat for Northern California. C a lif . A g r ic . , 1976, 11, 9.
14. Rahim, A., Prabhawati, C., Haridas, Rao, P. and Shurpale-
kar, S. R., Suitability of Indian durum wheats for semolina milling and vermicelli preparation, J . F d S c i . T ech n ol., 1974, 11, 249.
15. Irvine, G. N., Goals for quality and yield of Canadian durumwheat. G etre id e M e h l B r o t . , 1978, 32, 145.
16. Rao, P. N., Rahim, A., Prabhawati, C. and Shurpalekar, S. R.,Physico-chemical, rheological and milling characteristics of Indian durum wheats. J . F d S c i. T ech n o l., 1976, 13 317.
17. Bains, G. S. and Irvine, G. N., The quality of Canadianamber durum wheat grades and the role of a pentosan rich fraction in macaroni dough quality. J . S c i. F d A g r ic ., 1965, 16, 233.
18. Finney, P. L., Bains, G. S., Hoseney, R. C. and Lineback,D. R., Quality of Indian wheats. C e re a l S c i. T o d a y , 1973, 18, 392.
Effect of Traditional Processing on the Functional Properties of Cowpea ( V ig n a c a tja n g ) Flour
T . S. PADMASHREE*, L . VIJAYALAKSHMI AND SHASHIKALA PUTTARAJ
Department of Post-graduate Studies and Research in Home Science, Manasa Gangotri,Mysore-570 006, India
R e c e iv e d 12 A u g u st 1986; re v ise d 2 J a n u a ry 1987
The functional properties i.e. nitrogen solubility (NS) water absorption capacity (WAC), fat absorption capacity (FAC) bulk density (BD), foaming capacity (FC), foam stability (FS) and emulsification capacity of raw and processed (fermented, germinated, boiled, pressure cooked, puffed and roasted) cowpea flours were investigated. Heat treatments reduced the nitrogen solubility of cowpea flour. All the processing treatments increased the WAC of cowpea flour. Heat treatments increased the BD of cowpea flour, whereas it was reduced by germination. Germination increased FAC, while other processing treatments did not have marked effect. Processed cowpea flour had a lower foaming and emulsifying capacity.
Pulses play an important role in the acceptability of monotonous diets in many parts of the world1. Their role as protein supplements in the diets based on cereals and millets is well recognized1. Recently, attention has also been directed towards increasing the utilization of these protein sources for food use. The ultimate success of utilizing plant proteins in food formulations depends largely upon the functional attributes2. It is well known that processing conditions, particularly heating improves protein quality by destroying anti-nutritional factors but concomitantly may alter the functionality3,4. Cowpea (Vigna catjang) is an important food legume of many tropical countries. It is used as a fresh vegetable and also as reconstituted dry bean in many of the traditional food preparations in India. It is reported that only small amounts of cowpea can be used replacing
portions of wheat flour and milk in bread and biscuits2,5,6. Therefore, an attempt was made to study the functional properties of cowpea flours subjected to various traditional processing conditions such as heating wet-boiling and pressure cooking, dry-puffing and roasting, fermentation and germination.
Materials and MethodsCowpea (Vigna catjung) of C-120 variety was obtained
in bulk from the Karnataka State Seed Corporation, cleaned and stored. Cowpea seeds in 1-kg lots were subjected to the following processing conditions.
(a) Dehusked seeds were soaked in water (1500 ml) for 8 hr. The soaked cowpea was then ground into a paste and was allowed to ferment for 16 hr at room temperature 0~ 28°C) and sun-dried.
‘Research Fellow, NIMHANS, Bangalore.
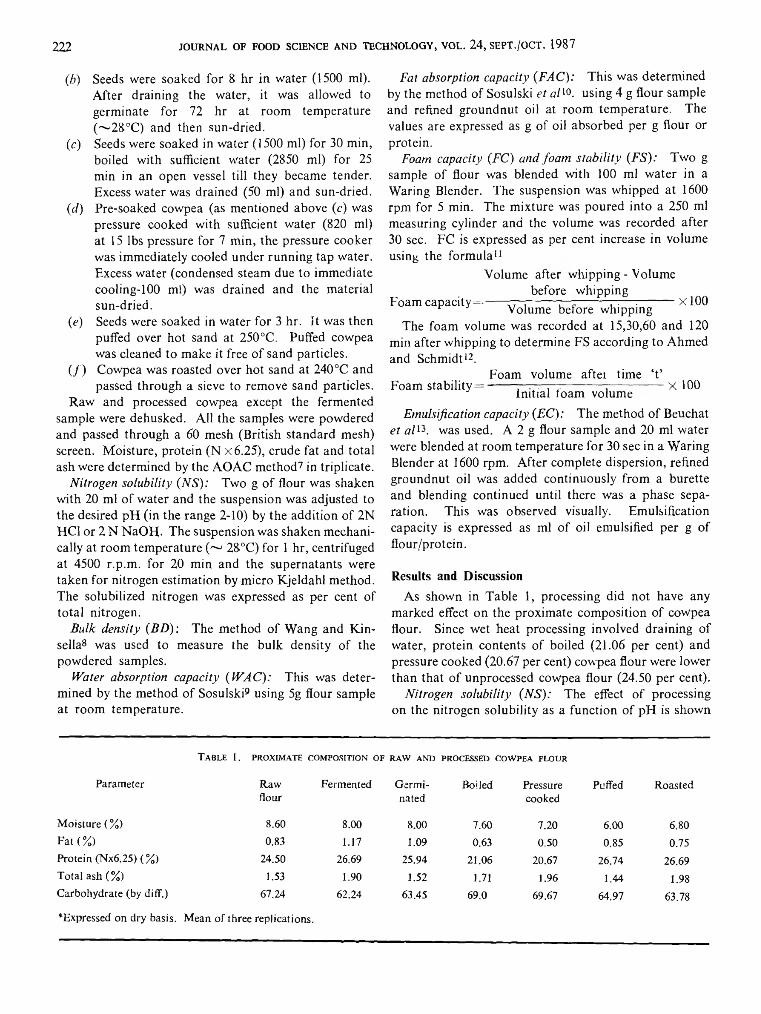
2 2 2 JOURNAL OF FOOD SCIENCE AND TECHNOLOGY, VOL. 2 4 , SEPT./OCT. 19 8 7
(,b) Seeds were soaked for 8 hr in water (1500 ml). After draining the water, it was allowed to germinate for 72 hr at room temperature (~28°C) and then sun-dried.
(c) Seeds were soaked in water (1500 ml) for 30 min, boiled with sufficient water (2850 ml) for 25 min in an open vessel till they became tender. Excess water was drained (50 ml) and sun-dried.
(,d) Pre-soaked cowpea (as mentioned above (c) was pressure cooked with sufficient water (820 ml) at 15 lbs pressure for 7 min, the pressure cooker was immediately cooled under running tap water. Excess water (condensed steam due to immediate cooling- 1 0 0 ml) was drained and the material sun-dried.
(e) Seeds were soaked in water for 3 hr. It was then puffed over hot sand at 250°C. Puffed cowpea was cleaned to make it free of sand particles.
( / ) Cowpea was roasted over hot sand at 240 °C and passed through a sieve to remove sand particles.
Raw and processed cowpea except the fermented sample were dehusked. AH the samples were powdered and passed through a 60 mesh (British standard mesh) screen. Moisture, protein (N x6.25), crude fat and total ash were determined by the AOAC method7 in triplicate.
Nitrogen solubility (NS): Two g of flour was shaken with 2 0 ml of water and the suspension was adjusted to the desired pH (in the range 2-10) by the addition of 2N HC1 or 2 N NaOH. The suspension was shaken mechanically at room temperature ( ~ 28°C) for 1 hr, centrifuged at 4500 r.p.m. for 20 min and the supernatants were taken for nitrogen estimation by micro Kjeldahl method. The solubilized nitrogen was expressed as per cent of total nitrogen.
Bulk density (BD): The method of Wang and Kin- sella8 was used to measure the bulk density of the powdered samples.
Water absorption capacity (WAC): This was determined by the method of Sosulski9 using 5g flour sample at room temperature.
Fat absorption capacity (FAC): This was determined by the method of Sosulski et a /10, using 4 g flour sample and refined groundnut oil at room temperature. The values are expressed as g of oil absorbed per g flour or protein.
Foam capacity (FC) and foam stability (FS): Two g sample of flour was blended with 1 0 0 ml water in a Waring Blender. The suspension was whipped at 1600 rpm for 5 min. The mixture was poured into a 250 ml measuring cylinder and the volume was recorded after 30 sec. FC is expressed as per cent increase in volume using the formula11
Volume after whipping - Volume before whipping
Foam capacity= --- rp~.------------------- ry— :-------- X100r Volume before whippingThe foam volume was recorded at 15,30,60 and 120
min after whipping to determine FS according to Ahmed and Schmidt12.
Foam volume after time ‘t ’Foam stability= ----- : ~~.~ rr-----------;------------------ X 100Initial foam volume
Emulsification capacity (EC): The method of Beuchat et n /13. was used. A 2 g flour sample and 20 ml water were blended at room temperature for 30 sec in a Waring Blender at 1600 rpm. After complete dispersion, refined groundnut oil was added continuously from a burette and blending continued until there was a phase separation. This was observed visually. Emulsification capacity is expressed as ml of oil emulsified per g of flour/protein.
Results and DiscussionAs shown in Table 1, processing did not have any
marked effect on the proximate composition of cowpea flour. Since wet heat processing involved draining of water, protein contents of boiled (21.06 per cent) and pressure cooked (20.67 per cent) cowpea flour were lower than that of unprocessed cowpea flour (24.50 per cent).
Nitrogen solubility (NS): The effect of processing on the nitrogen solubility as a function of pH is shown
T a b l e 1. p r o x im a t e COMPOSITION OF RAW AND PROCESSED COWPEA FLOUR
Parameter Raw Fermented Germi- Boiled Pressure Puffed Roastedflour nated cooked
Moisture (%) 8.60 8.00 8.00 7.60 7.20 6.00 6,80Fat ( %) 0.83 1.17 1.09 0.63 0.50 0.85 0.75Protein (Nx6.25) (%) 24.50 26.69 25.94 21.06 20.67 26.74 26.69Total ash (%) 1.53 1.90 1.52 1.71 1.96 1.44 1.98Carbohydrate (by diff.) 67.24 62.24 63.45 69.0 69.67 64,97 63.78
♦Expressed on dry basis. Mean of three replications.

PADMASHREE et al: TRADITIONAL PROCESSING ON THE FUNCTIONAL PROPERTIES OF COWPEA FLOUR 223
Fig. 1: Nitrogen solubility index of raw and processed cowpea flour
□ Raw; ^ Fermented; ©Germinated; § Roasted; O Puffed; Boiled; V Pressure cooked.
in Fig 1. Raw cowpea flour gave a U shaped curve in the pH range 2-10 with minimum solubility (26 per cent) at pH 4 and this increased considerably at acidic (58 per cent) and alkaline (96 per cent) pH. This is similar to the solubility profile reported by Okaka and Potter6 for raw cowpea flour. While germination and fermentation did not have significant effect, heat treatments (roasting, puffing, boiling and pressure cooking) significantly reduced the solubility of cowpea proteins; solubility was low in the range of 2 to 10 pH. It has been reported that
water soluble cowpea proteins are particularly sensitive to heat and undergo thermal dissociation and unfolding at temperatures lower than that generally observed for plant proteins14. Probably, heat treatments denatured the cowpea proteins and reduced their solubility. In case of heat processed sunflower seed, rapeseed, groundnut and soya bean proteins also, reduction in NS has been reported10*15,16.
Water absorption capacity: The WAC values aregiven in Table 2. Raw cowpea flour had a WAC of 1 .6 g/g flour. All the processing conditions increased WAC. Germinated seeds had the lowest (1.9g/g) whereas puffed seeds had the highest (4.5g/g) WAC. It is known that polar amino acids of a protein have an affinity for water and denatured proteins are reported to bind more water. Polar amino acid content of cowpea is 25-65 g/lOOg protein17. The enhanced WAC of processed cowpea may be due to the denaturation of protein which facilitates water binding. Hermanssen18 pointed out that proteins can increase their water holding capacity when their swelling capacity is increased. It is also known that polysaccharides which are hydrophilic greatly affect water absorption19. The higher WAC seen in case of puffed, pressure cooked and boiled samples may also be due to gelatinization of starch and swelling of crude fibre. WAC is considered a critical function of protein in viscous foods like soups, gravies, doughs, baked products, etc10. Hence, increased WAC observed due to processing can be made use of in these preparations.
Bulk density (BD): Bulk density of raw, fermented and roasted cowpea flour were similar (Table 2). Other heat treatments increased bulk density while germination lowered it. Higher BD is desirable since it helps to reduce the paste thickness. This is an important factor in convalescent and child feeding.
Fat absorption capacity (FAC): FAC has been
T a b l e 2 . b u l k DENSITY, WATER ABSORPTION AND FAT ABSORPTION CAPACITY OF RAW AND PROCESSED COWPEA FLOUR
Type of sample Bulk density’* Protein Water absorption* Fat absorption(g/ml) (%) g/g g/g g/g g/g
flour protein flour protein
Raw 0 .8 8 8 2 4 .5 1 .6 6 .8 0 .5 2 .0 6
Fermented 0 .8 8 5 2 6 .7 2 .4 9 .2 0 .6 2 .2 5
Germinated 0 .7 7 5 2 5 .9 1 .9 7 .3 1.0 3 .8 6
Boiled 0 .9 4 0 2 1 .1 2 .3 1 0 .9 0 .7 3 .3 2
Pressure cooked 0 .9 4 0 2 0 .7 2 .4 1 1 .6 0 .7 3 .3 8
Puffed 0 .9 4 0 2 6 .7 4 .5 1 6 .6 0 .6 2 .2 5
Roasted 0 .8 9 0 2 6 .7 2 .2 6 .0 0 .6 2 .2 5
*Mean of three replications.

2 2 4 JOURNAL OF FOOD SCIENCE AND TECHNOLOGY, VOL. 2 4 , SEPT./OCT. 198 7
T able 3. em u lsific a tio n c a pa c ity , foam c a pa city
AND STABILITY OF RAW AND PROCESSED COWPEA FLOUR
Type of Emulsifying capacity* Foam vol* Foamsample ml/g ml/g increase stability+
protein flour (%) (%)
Raw 35.0 85.0 20 91
Fermented 35.5 95.0 11 99 .
Germinated 27.5 70.5 15 97
Boiled 19.0 40.0 5 97
Pressure cooked 19.0 39.0 5 97
Puffed 31.0 83.0 8 97
Roasted 25.7 69.0 3 97
*Mean of three replications; +after 120 min.
attributed to the physical entrapment of oil. This is important since fat acts as flavour retainer and increases the mouth feel of foods8. FAC of raw cowpea was0.5g/g flour (Table 2). Germination increased the FAC of cowpea flour, while other processing conditions did not bring about a significant increase. Fat absorption is primarily attributed to the protein and is reported to be affected by temperature, size of ingredient particles and degree of denaturation of protein2!. From the reported amino acid composition data, apolar amino acid content of cowpea is 40.57g/100 g protein17. Generally, more hydrophobic proteins show superior binding of lipids1®, implying a direct correlation between FAC and apolar amino acids. However, no such relationship was observed in the present study between FAC and apolar amino acid content. FAC of raw cowpea was lower than that of soy flour (1 .2 g/g) which is reported to have an apolar amino acid content of 30.7g/100 g protein, a value lower than that of cowpea flour8.
FAC is reported to have an inverse correlation with the bulk density. However, FAC of raw and processed cowpea flour did not follow this pattern. This is in conformity with the observation of Okaka and Potter6
who reported that FAC of raw and blanched cowpea flour did not consistently follow this pattern.
Foam capacity (FC) and foam stability (FS): Though considerable decrease in FC was observed in all the processed samples, it was more pronounced in heat processed cowpea flour, indicating that heat treatment had lowered FC, probably by denaturing protein (Table 3). It is reported that mild heat treatment causes surface denaturation of proteins and yet keeps it in solution to result in better foaming properties26,2b This shows that heat treatments used in the present study were drastic enough to precipitate the proteins.
It has been stated that FC is also dependent on nitrogen solubility21. No such relationship between FC and NS was seen in case of raw, fermented and germinated cowpea flour as these samples also showed lower FC. However, foam stability was not different between raw and processed cowpea flours.
Emulsifying capacity (EC): The ability of a protein to aid the formation and stabilization of emulsion is critical for its application in preparations like batters, milk and frozen desserts22. EC of the processed cowpea flours except that of fermented flour was lower than that of the raw cowpea flour (Table 3). Even the EC of raw cowpea flour (35 ml/g protein) was much lower than that reported for raw soy flour (70 ml/g protein). This observation is similar to the findings of Okaka and Potter6 who showed that the EC of raw cowpea flour was lower than that of soy flour. The EC of raw cowpea flour is consistent with the findings of Mcwaters and Cherry2 2 who reported a EC of 36.4 ml/g protein for cowpea flour. Though effect of pH and salt solutions on EC has not been studied in the present study, it is reported that EC is higher when cowpea flour is dispersed in water at neutral pH than in salt solutions at different pH.
It may be concluded that processing treatments increased the WAC, BD and FAC of cowpea flour but lowered FC and EC. It may be suggested that cowpea flour may be suitable in viscous foods like gravies, soups, baked products where good protein-water interactions aie required, but will be unsuitable for foods like idli and dosai where good foaming properties are essential.
References1. Walker, A. F. and Kochei, N., Effect of processing including
domestic cooking on nutritional quality of legumes. Proc.Nutr. Soc., 1982, 41, 41.
2. Mcwaters, K. M., Replacement of milk protein with proteinfrom cowpea and field pea flours in baking powder biscuits.Cereal Chem., 1980, 57, 223.
3. Report on the FAO expert consultation on grain legumeprocessing, FAO, Rome, 1978.
4. Wu, Y. V. and Inglett, G. E., Denaturation of plant proteinsrelated to functionality and food applications. J. Fd Sci.,1974, 39, 218.
5. Okaka, I. G. and Potter, N. N., Functional and storageproperties of cowpea powder—wheat flour blends in breadbaking. J. Fd Sci., 1977, 42, 828.
6. Okaka, I. G. and Potter, N. N., Physico-chemical and functional properties of cowpea powders processed to reducebeany flavour. J. Fd Sci., 1979, 44, 1235.
7. Official Methods o f Analysis, Association of Official AnalyticalChemists, Washington, D.C., 1976, 12th Edn.
8. Kinsella, J. E., Functional properties of protein in foods,a survey. CRC Critical Rev. Fd Sci. Nutr., 1976, 7, 219.

SHASHI RE KHA AND NARASIMHAM: INHIBITORY EFFECT OF MERCURIC COMPOUNDS ON STORED POTATO 225
9. Sosulski, F. W., The centrifuge method for determining flour absorption in hard red spring wheats. Cereal Chem., 1962, 39, 344.
10. Sosulki, F. W., Humbert, E. S., Bui, K. and Jones, J. D.,Functional properties of rape seed flours, concentrates and isolates. J. Fd Sci., 1976, 41, 1349.
11. Lawhon, J. T., Cater, C. M. and Matil, K. F., A comparativestudy of the whipping potential of an extract from several oilseed flours. Cereal Sci. Today, 1972, 17, 240.
12. Ahmed, E. M. and Schmidt, R. H., Functional propertiesof peanut and soya proteins as influenced by processing method. Peanut Sci., 1979, 4, 1.
13. Beuchat, L. R., Cherry, J. P. and Quinn, M. R., Physicochemical properties of peanut flour as affected by proteolysis. J. agric. Fd Chem., 1975, 23, 616.
14. Armstrong, D. L., Maurice, T. T. and Stanley, D. W.,Protein functionality in foods. In Am. Chem. Soc. Symp. Series No. 92, 1979, 147.
15. Lin, M. J. Y., Humbert, E. S. and Sosulski, F. W., Certainfunctional properties of sunflower meal products. J. Fd Sci., 1974, 39, 368.
16. Mcwaters, K. H. and Holms, M. R., Influence of moist heaton solubility properties of soy and peanut flours. J. Fd Sci., 1979, 44, 774.
17. Food Composition Table for Use in East Asia. US Dept.Health Education Welfare, FAO report. 1972.
18. Hermannsen, A. M., Methods of studying functional characteristics of vegetable proteins. J. Am. Oil Chem. Soc., 1979, 56, 272.
19. Hutton, C. W. and Campbell, A. M., In Am. Chem. Soc.,Symp. Series No. 147 by Cherry, J. P. (Ed), 1981, 178.
20. Tamsama, A., Kontson, A. and Pallansch, M. J., Productionof whippable nonfat dried milk by homogenation. J. Dairy Sci., 1969, 52, 428.
21. Richest, S. H., Morr, C. V. and Cocney, C. M., Effect ofheat and other factors upon foaming propeities of whey protein concentrates. J. Fd Sci., 1974, 39, 42.
22. Mcwaters, K. H. and Cherry, J. P., In Protein functionalityin foods. In Am. Chem. Soc. Symp. Series No. 147 by Cherry, J. P. (Ed), 1981, 217.
Inhibitory Effect of Mercuric Compounds and Dyes on Decay and Sprouting of Seed Potato Tubers During Storage
M. N. Shashirekha and P. N arasimham Central Food Technological Research Institute, Mysore-570 013, India
Received 29 August 1986; revised 9 January 1987
Mercurial compounds are commonly used to reduce the spoilage of seed potatoes during storage. To aid in differentiating the treated seed potatoes from the untreated, 13 synthetic dyes were assessed for colouring the potatoes as also in inhibiting the growth of Fusarium oxysporum and Erwinia carotovora, the two microbes causing spoilage of potatoes during storage. The ED5 0 values indicated that brilliant green and malachite green were equally effective against both the microbes compared to mercuric chloride. Treating seed potatoes with these two dyes in combination with mercuric chloride was more effective than when used individually in reducing the microbial spoilage. Sprouting was also significantly reduced by the combination treatments. Treated seed potato tubers, when planted at the end of storage, in pots as well as in field, did not show any inhibitory action on plant growth and the yield of tubers was at par with that of untreated tubers. The mercury residue in harvested tubers obtained from treated seed tubers was 0.025 /¿g/kg fresh weight which is well within the permissible limit. It is concluded that, it would be better to use mercurial salts in combination with an antimicrobial dye for the control of decay of seed potatoes.
In Karnataka, during storage of seed potatoes under ambient conditions (21-35°C, RH 40-75 per cent) upto periods of 2 to 3 months, 20-70 per cent losses occur due to microbial spoilage, sprouting and shrivelling. Microbial spoilage is mainly due to the fungus, Fusarium oxysporum (Schl. ex. fr) emend which causes ‘dry rot of potatoes’ and the bacterium, Erwinia carotovora (Jones) Dye causing ‘soft rot of potatoes’. Mercurial compounds are being used to control the microbial spoilage1-4.
Since these toxic mercurial compounds are colourless, it is necessary to differentiate the treated seed potatoes from the untreated in order to prevent accidental consumption. This difficulty could be overcome by colouring the tubers with synthetic dyes; some of them are also known to have antimicrobial activity^3-io, In this context, the effect of 13 dyes on the growth of F. oxysporum and E. carotovora was studied.
4

2 2 6 JOURNAL OF FOOD SCIENCE AND TECHNOLOGY, VOL. 2 4 , SEPT./OCT. 1987
Materials and MethodsIn vitro studies: The following dyes, namely basic
fuschin, brilliant green, cotton blue, eosin, gentian violet, janus green, malachite green, methyl red, methylene blue, nigrosin, rhodamine b, safranin and victoria blue were screened for their antimicrobial activity against F. oxysporum and E. carotovora. Analytical grade mercuric chloride was used.
In vitro screening and assay of the antimicrobial activity of chemicals was done by the agar well method, food poison technique11 and serial dilution technique. In the agar well method, used normally for screening the compounds, the antimicrobial property is expressed as diameter of the inhibitory zone, while in the food poison technique (for fungi) and serial dilution technique (for bacteria), the per cent inhibition calculated using Vincent’s formula12, enables to quantify precisely the extent of antimicrobial action of test compounds. ED5o (concentration required to bring 50 per cent inhibition) of the test organisms, F. oxysporum and E. carotovora was determined by food poison technique13.
In vivo studies: Washed, sound potato seed tubers of variety ‘Kufri Jyoti’ procured from Devanahalli (Bangalore District) were used. The seed tubers were dipped in solutions at various concentrations of test chemicals individually as well as in various combinations for 5 min. Tubers dipped in water for 5 min served as controls. The dipped tubers were surface dried and then packed in gunny bags (40x25 cm). Each treatment consisted of five replicates, each of 60 medium size
tubers weighing 50 to 70 g. During storage, the untreated tubers were observed at intervals for (?) microbial spoilage and (if) sprouting behaviour.
Pot experiments: To test the sproutability of treated and untreated tubers, tuber pieces having eyes were planted in pots (37.5 cm) having sandy soil. Five replicates each of 25 cut pieces were planted in a pot. Later, they were transplanted individually into a number of pots provided with nutrients and the pots were watered regularly. At weekly intervals, length of plants, number of tuber pieces germinated and those that were spoiled were recorded. At the end of the growth period, fresh weights of root, shoot and tuber yield were determined.
Field experiments: Field performance tests on the yield of the treated and untreated tubers were done at Devanahalli, Bangalore district. Completely randomised design was employed for raising seed tubers, under ‘seed plot technique’. Plots of 3m X3m (9 m2) were used as replicates. About 5-8 replicates were maintained for each treatment in the different experiments. Both the laboratory and field experiments were repeated 2 to 3 times during 1982-84.
Mercury residues in the tubers obtained by planting treated seed tubers were estimated by AOAC method14
as modified by Vibhakar et al15.
Results and DiscussionOut of the 13 dyes studied, malachite green and
brilliant green were inhibitory to the growth of both the
T able 1. in h ib it o r y effec t** o f some dyes o n f . o x y spo ru m a n d e . ca ro tov o ra by a g a r c u p m eth o d
Inhibition zone (diatn. in cm) at indicated concn (fig/ml)Dye+ 100 500 1,000 10,000 ED so
F. oxysporum
Brilliant green 2.4 ± 0 .5 2.6 ±0.05 3.6 ± 0 .2 3.8 ±0.1 0.63Gentian violet 0 0 0 0 34.67Malachite green 1.5 ± 0 .8 2.2 ± 0 .6 2.3 ±0.1 2.8 ± 0 .3 0.95Mercuric chloride 1.1*±0.S 1.4*±0.1 1.8 ± 0 .2 2.6 ±0 .1 9.12
E. carotovora
Brilliant green 1.6 ± 0 .8 1.7 ± 0 .5 2.5 ± 0 .2 3.3 ±0.1 8.03Gentian violet 1.1 ± 0 .3 2.2 ± 0 .2 2.7 ±0.1 3.2 ± 0 .5 13.18Malachite green 1.5 ± 0 .7 1.9 ± 0 .2 2.3 ± 0 .5 2.6 ±0.05 9.88Mercuric chloride 0 0.9 *±0.05 1.7* ±0.04 2.1 *±0.2 4.12
** Inhibition zone recorded on the third day of incubation at 28±2°C .+ Other dyes viz. Basic fuschin, Cotton blue, Eosin, Janus green, Msthyl red, Methylene blue, Nigrosin, Rhodamine b, Safranin,
Victoria blue—did not show antimicrobial activity.* Inhibitory activity was lost after 3 days.
Mean ± S.D.

SHASHIREKHA AND NARASIMHAM: INHIBITORY EFFECT OF MERCURIC COMPOUNDS ON STORED POTATO 2 2 7
test organisms (Table 1). Though gentian violet exhibited antimicrobial activity even at 1 0 0 /ug/ml against E. carotovora, it failed to exhibit any inhibitory effect against F. oxysporum, even at a concentration as high as 10 mg/ml. Mercuric chloride was inhibitory against both the organisms, but after 3 days of incubation they invaded the inhibitory zone. In the case of dyes, the inhibitory zone was not overgrown by the test organisms upto the observed period of 15 days.
The dyes which proved effective were studied further to determine the ED5 0 values for both the test organisms. ED5 0 values of brilliant green and malachite green against F. oxysporum were far less than mercuric chloride. However, the ED 5 0 values of these two dyes against E. carotovora were about two times that of mercuric chloride (Table 2). At a concentration of 9.12 pg /ml, mercuric chloride was effective in controlling both the microbes. At the same concentration,
Table 2. effect of mercuric chloride on theCONTROL OF SPROUTING AND SPOILAGE OF SEED
POTATOES STORED FOR 45 DAYS AT AMBIENT CONDITIONS
Concn. of Spoiled Sprouted Sproutmercuric chloride tubers tubers yield
(%) (%) (%) (g/100 tubers)
0 21.0±8.2 97.5±5.6 6.9±0.7
0.1 20.0±4.5 75.1 ± 6 .6 1.4*±0.7
0.5 18.0±4.3 62.0±5.2 0.4*±0.03
1.0 13.0*±2.5 56.0±6.5 0.3*±0.03
2.5 25.4™s± 6 .0 87.0±5.6 1.8*±0.03(Slight pitting)
5.0 Severe pitting
‘denotes significant at 0.001 ns—not significant Mean ± S.D.
Fig. 1. Effect of mercuric chloride and parasan (at 1% level) on sprouting and spoilage behaviour of seed potato tubers stored foi 30 days at ambient conditions. A & B denote significance at P^C0.001 and 0.005 respectively; NS—not significant.
either of the two dyes was also equally effective in the control of both the microbes. Further, non-toxicity and ability to impart colour to tubers that helps to differentiate the treated seed potatoes are the advantages of using the dyes. However, gentian violet was far less effective than the above two dyes or mercuric chloride.
The effectiveness of parasan as an antimicrobial agent was next to that of mercuric chloride (Fig. 1). The data show that at the end of 15 days of storage (this being a confirmatory experiment of the work done by Kapur et al16, potatoes at sprout emergence stage were used and hence it was possible to record sprouting within 15 days), mercuric chloride exhibited statistically significant antisprouting activity. These findings on the antimicrobial and antisprouting activities of mercuric chloride corroborate with those of Kapur et al16.
Mercuric chloride (1 per cent) was found optimal for reducing microbial spoilage as well as sprouting (Table 3).
Table 3. efficacy of mercuric chloride alone and in combination with brilliant green on the control ofSPROUTING AND SPOILAGE OF SEED TUBERS STORED (FOR 150 DAYS) AT LOW TEMPERATURE (2± 1°C )
Concn. Spoiled Sprouted SproutTreatment (ppm) tubers tubers yield
(%) (%) (g/100 tubers)
Mercuric chloride 10,000 0* 72.9*±2.8 135.9nJ±17.0Brilliant green 500 2.4*±0.9 88.9*±3.7 62.7*±16.7Mercuric chloride 10,000 0* 72.6*±3.5 32.5*±11.6
+ +Brilliant green 500Control — 4.1 ± 0 .2 100.0 ± 0 .0 109.1 ±16.5
‘ denotes significant at P ^ 0,001 ns—not significant.Mean ¿ S .D .

228 JOURNAL OF FOOD SCIENCE AND TECHNOLOGY, VOL. 24 , SEPT./OCT. 1987
C o n c a n t r a t i o n ( p p m )
Fig. 2. Effect of dyes (Brilliant green and Malachite green) on sprouting and spoilage behaviour of seed potato tubers stored for 30 days at ambient conditions.
C o n c e n t r a t i o n ( p p m )
Fig. 3. Effect of dyes (Brilliant green and Malachite green) at various concentrations in combination with mercuric chloride (1 %) on the control of sprouting and spoilage of seed potato tubers stored for 30 days at ambient conditions.
At concentrations above this, there was reduced spoilage but it was accompanied with pitting which is an undesirable feature. At lower concentrations, its efficacy in controlling the microbial spoilage and sprouting was less.
Brilliant green was more effective in reducing microbial spoilage than malachite green at all the concentrations studied (Fig. 2). The ability of these two dyes to reduce sprouting was directly proportional to their concentrations (Fig. 2).
Brilliant green or malachite green in combination with mercuric chloride ( 1 per cent) caused further significant reduction in microbial spoilage at all the levels studied (Fig. 3) as compared to the dye or mercuric chloride alone (Fig. 2 and Table 3). Hence, in all further experiments, mercuric chloride and brilliant green at 1 and 0.05 per cent respectively were used in combination treatments. Even though 0.05 per cent brilliant green is higher than the minimum effective concentration viz. 0 . 0 1 per cent, in order to colour the potatoes distinctly, this concentration was used. The effects of mercuric chloride ( 1 per cent) and brilliant green (0.05 per cent) either alone or in combination on the spoilage and sprouting were further confirmed in a subsequent experiment (data not shown). Similar trends in results were obtained when tubers were stored at 2 ± 1 °C for a period of 5 months (Table 3).
A study on the effect of time lag after harvest on the efficacy of mercuric chloride and brilliant green in controlling spoilage and sprouting at ambient conditions indicated that treating the tubers on the 5th day after
T able 4 . effect o f tim e la g a fter ha rv est o n th e effic a c y o f m er c u r ic c h lo r id e in co m b in a tio n w it h b r ill ia n t
GREEN ON THE CONTROL OF SPROUTING AND SPOILAGE OF SEED TUBERS STORED FOR 75 DAYS AT AMBIENT CONDITIONS
Days after harvest Treatment
ControlI HgCh+Bg
Control3 HgCl2+Bg
Control5 HgCl2+Bg
Control10 HgCl2+Bg
Control20 HgCl2+Bg
HgCla+Bg—Mercuric chloride (1 %)+Brilliant green (0.05%). ^Denotes significant at P^O.001. ns—not significant.Mean ± S.D.
Spoiledtubers
(%)
Sproutedtubers
(%)
Sprout yield (g/100 tubers)
25.1 ± 3 .5 61.4 ± 4.0 20.7 ± 3 .219.5« ± 9_g 44.0* ±10.7 2 1 .8 « ± 3 .226.5 ± 5 .0 61.2 ± 4.8 17.1 ± 3 .713.3*± 0.4 21.7* ± 4.3 10.8*± 1.029.9 ± 0 .3 63.5 ± 7.0 14.2 ± 1.79 .8*± 2.8 27.4* ± 9.2 5.9 * ± 0.9
24.5 ± 2 .0 75.7 ± 5.9 18.9 ± 7 .619 .5«± 6.4 43.1* ± 6.2 10.1*± 2.429.7 ± 9 .5 86.3 ± 8.2 17.4 ± 5.914.6*± 2.9 82.7« ± 7.6 9 .5 * ± 1.8

SHASHIREKHA AND NARASIMHAM: INHIBITORY EFFECT OF MERCURIC COMPOUNDS ON STORED POTATO 2 2 9
Fig. 4. Effect of time lag from harvest to treatment on the efficacy of mercuric chloride (1 % ) in combination with Brilliant green (0.05 % ) in the control of sprouting and spoilage of seed potato tubers during cold storage for 75 days. A & B denote significance at p ^ 0.001 and
0.005 respectively; N S —not significant.
harvest was ideal (Table 4). Less sprouting was recorded in the treated tubers than the untreated control lots.
Tubers given treatment with mercuric chloride and brilliant green after 3rd or 5th day of harvest showed reduced spoilage and sprouting (Fig. 4), when the treated tubers were stored at low temperature (2±1°C). These results indicated that treating the tubers on the 3rd or 5th day after harvest ensured effective control of spoilage and sprouting.
The results of the pot experiments revealed that the treated tubers differed in no way from the untreated lot (control) in all the four parameters of plant growth, namely (i) length of plants (z'z) fresh weight of shoot system, (iii) root system and (zv) tuber yield which was confirmed further under field conditions (data not shown).
Residue analysis for mercury in the tubers obtained from the plants of treated tubers indicated that the mercurial residues were well within the permitted levels0.025 p.p.m. (0.025 jag/kg fresh weight)14.
AcknowledgementOur thanks are to Dr. B. L. Amla, Director and Dr.
M. V. Patwardhan, Area Co-ordinator, for their interest in this investigation. The first author is grateful to the
Council of Scientific and Industrial Research, New Delhi, for awarding a research fellowship.
References1. Mukhthar Singh and Verma, S. C ., in Proceedings of Inter
national Symposium on Post-harvest Technology and Utilization of Potato, C P R I, Simla, 1979, 55.
2. Leach, J. G . and Rose, R . C ., Acid-mercury dip, a simplifiedtreatment for potatoes, Minnesota agric. expl. Station Circul., 1931, 35, 1.
3. Cunningham, H . S., Yellow oxide of mercury treatment forseed potatoes on Long Island, N. Y. agric. Expl. Station Bull., 1936, 668, 14.
4. Forsberg, J. L ., Gladiolus disease control studies, GladiolusMag., 1946, 11, 19.
5. Hillegas, A . B. and Camp, E ., The testing of fungicidesinsoluble in water. J. Invest. Dermat., 1945, 6, 217.
6. Riley, K . and Flowei, A . H ., A comparison of the inhibitoryeffect of Castellan’s Paint and of Gentian Violet solution on the in vitro growth of Candida albicans. J. Invest. Dermat.,1950, 15, 355.
7. Rakieter, M . L . and Rettger, L . F ., Brilliant green and itsuse in an enrichment medium in the isolation of typhoid and paratyphoid organisms. J. Infec. Dis., 1927, 41, 93.
8. M iller, R . B. and Banwart, G . J., Effect of various concentrations of brilliant green and bile salts on salmonellae and other micro-organisms. Appl. Microbiol., 19 6 5,13 , 77.
9. Stokes, J. L . and Osborne, W . W ., A selenite brilliant greenmedium for the isolation of salmonella. Appl. Microbiol., 1955, 3, 217.
10. Sessoms, A . R . and Banwart, G . J., Effect of brilliant greenon the mobility of salmonellae and other selected microorganisms. Appl. Microbiol., 1969, 18, 542.
1 1 . Grover, R . K . and Moore, J. D ., Taxonomic studies offungicides against the brown rot organisms, Sclerotinia fruiticola and S. loxa. Phytopathology, 1962, 52, 876.
12. Vincent, J. M ., Distortion of fungal hyphae in the presenceof certain inhibitors. Nature, Bond., 1947, 159, 850.
13. Finney, D . J., Probit Analysis. Cambridge University Press,Cambridge, 1977.
14. Official Methods o f Analysis, Association of Official AnalyticalChemists, Washington, 1975, 12th Edn., 452.
15. Vibhakar, S., Nagaraj, K . V ., and Kapur, O. P., Modificationof K lein ’s wet ashing procedure for determination of mercury. J. Asso. off. Analyt. Chem., 1983, 66, 317.
16. Kapur, N . S., Mathur, P. B. and K ripal Singh, K . , Coldstorage of seed potatoes. Indian J. Hort., 1952, 9(4), 30.
T a m a r o g g tt — A New Product from Date and O g g tt
Ibrahim M. A l-R uqaie and H amza El-N akhal
College of Agricultural and Food Sciences, King Faisal University, Hofuf-31982, Saudi Arabia
Received 22 September 1986; revised 24 January 1987
Tamaroggtt a combination of tamar (date) and oggtt was developed by mixing different ratios of pitted, minced date with fermented milk (butter milk) prepared from skim milk powder. The mixture was shaped and dehydrated at room temperature under continuous aeration. The new product is not only rich in protein, sugar and minerals but also acceptable. It can be kept at room temperature without noticeable changes.
Tamar (date) is the ripe dried fruit of date palm (Phoenix dactylifera L.). Without any treatment, it can be kept at room temperature without microbial spoilage. Oggtt, Mathier, Jameed or Buggl are different names given to a dried fermented milk product which is made by bedouins from milks of cows, camels, sheep, etc.
Oggtt is made primitively by different methods in different areas. The two most common types are cooked oggtt and salted oggtt. Cooked oggtt is known throughout the Arabian peninsula. It is made by allowing the milk to ferment naturally in a warm place for one or two days. The fermented milk is churned and butter is removed. The butter milk is left to boil on fire with continuous stirring until it thickens. The thick product is left to cool down to a paste. The warm paste is shaped in the form of small patties by hand. The patties are then pressed on tent cloth and left to dry in the sun foi several days. The colour of the final product is yellowish white. Salted oggtt is common in the northern region of the Arabian peninsula and in Lebanon, Syria and Jordan. This product is named Jameed. It is made by fermenting and churning the milk as mentioned earlier. No heat is applied; instead salt is added. Then, the salted fermented product is placed in a sac of cheese cloth and left to drain the whey for one day. The paste is then shaped by fingers in larger and more regular patties and then left to dry in the sun. The final product is white. Both types of oggtt can be consumed either dry “as is” or after reconstitution. The salted oggtt should be rinsed with water before reconstitution. The reconstituted product is called merase for either type of oggtt.
Tamar (date) and oggtt have been known in the Arabian peninsula for a long time and have a great sentimental value to the nomads, as they were particularly useful during long trips in the desert.
The objective of this work was the development of a new sanitary product that combines both tamar (date) and oggtt, namely Tamaroggtt.
Materials and MethodsSkim milk powder, tamar (date, Rezaiz), salt, cocoa
and oggtt samples were bought from the local market in Hofuf, Saudi Arabia.
Preparation o f Tamaroggtt: Tamaroggtt was prepared from reconstituted skim milk powder. Yoghurt was used as starter for carrying out fermentation at 42°C for 5 hr. Samples were drawn periodically to determine the acidity; when it reached 0 . 6 per cent, the fermented milk was heated with continuous stirring until most of the moisture evaporated. Heating was stopped when the fermented milk became pasty. At this stage, pitted chopped date as well as other additives were added and mixed well. The mixture was shaped by biscuit shaping equipment. The product was dried overnight by a draft of air using a fan. Tamaroggtt containing the highest ratio of date was further dried in an oven at 50°C for 8 hr. The final product was packed in separate units in small polyethylene bags and sealed. The products were: (1) tamaroggtt-l, 1:1 of date and SMP; (2) tamaroggtt-2, 1 : 2 followed by 0 . 1 per cent anise and 0 . 2 per cent sesame seeds; (3) tamaroggtt-3, 1 per cent cocoa added to tamaroggtt-l.
Chemical analysis: Moisture was determined by using a vacuum oven at 70 °C. Nitrogen was estimated by the Kjeldahl procedure and multiplied by 6.38 to obtain crude protein1. Fat, ash and total and reducing sugars were determined as described by Pearson2.
Physical and sensory properties: Texture was determined by Penetrometer (Precision Scientific Co., Chicago Illinois) by using standard needle 73524 with 150 g weight as a driving force. The penetration of the needle into the product during 3 sec was determined. The
230

AL-RUQAIE AND EL-NAKHAL: TAMAROGGTT— A NEW PRODUCT FROM DATE AND OGGTT 231
average penetration distance per second was calculated.Sensory properties were determined by a panel of ten
Saudi members. The panel members were selected, familiarized with the new product tamaroggtt as well as with the classical (market) oggtt. Then they were asked to evaluate the oggtt (as a comparison) and the different tamaroggtt samples on a hedonic scale according to Stone and Siedel3 designed in five descriptive terms namely: very desirable, mildly desirable, neutral (neither desirable nor undesirable), mildly undesirable, and very undesirable. Furthermore, the panel members were asked to grade three main characteristics (colour, 40 points; texture, 20 points; and flavour 40 points).
Statistical analysis: The data were analyzed for least significant difference (LSD) at 5 per cent probability according to Snedecor and Cochran4.
Results and DiscussionChemical composition: Table 1 shows the chemical
composition of date, oggtt and different tamaroggtt samples. ‘Rezaiz’ tamar is the most abundant cultivar in Al-Hassa. Sixty per cent of dates produced in Al- Hassa is ‘Rezaiz’5,6. The chemical composition of date
used in this study differs slightly from that reported by other investigators7 -io. With the exception of protein content, oggtt was similar in its analysis to that reported by El-Erian11. Tamaroggtt products are rich in protein, carbohydrates and minerals.
Physical and sensory properties: Tamaroggtt was shaped regularly in different biscuit shaping equipments. The average weight of each tamaroggtt unit is about 40 g for formula 1:1 and 35 g for formula 1:2. The colour of tamaroggtt depends on the percentage of date and other materials such as cocoa present. But the final colour is homogenous and stable. The colour of oggtt is usually creamy with darker ends.
The distribution of the panel members on the five previously mentioned descriptive terms is indicated in Table 2. Tamaroggtt products (except the one with cocoa) were superior to the market oggtt, inspite of the traditional and sentimental value of the latter. No significant differences were observed between Tama- roggtt-l and Tamaroggtt-2. The addition of sesame seeds and anise to Tamaroggtt-2 seem to make up the difference that resulted from reducing the amount of date of Tamaroggtt-l. Tamaroggtt-2 (with cocoa) was
T a b l e 1 . c o m p o s it io n o f d a t e (‘r e z a i z ’ t a m a r ), o g g t t a n d t a m a r o g g t t
Sample Moisture FatProtein
N x 6.25Reducing
sugars Total sugars Ash( % ) ( % ) t % ) ( % ) ( % ) ( % )
Date (‘Rezaiz’ tamar) 8.70 0.46 2.77* 77.50 82.40 1.30
Oggtt 4.90 22.76 37.42 13.87 23.50 11.87
Tamaroggtt-l 10.25 — 25.71 56.05 59.10 2.79
Tamaroggtt-2 9.75 — 34.35 44,30 48.95 2.48
Tamaroggtt-'i 10.10 — 33.50 46.25 49.90 3.25
Least significant diff. 0.60 — 1.50 2.50 3.50 0.50
T a b l e 2 . p e n e t r o m e t e r v a l u e s , f r e q u e n c y d is t r ib u t io n o f p a n e l is t s r a t in g s a n d c o m p o s it e s c o r e s f o r p r o d u c t s
SamplePenetra
tion(mm/sec)
Frequency % Composite score
E D C B A Colour Texture Flavour Total
Oggtt 0 50 50 0 0 0 32 16 35 83
Tamaroggtt-l 0.50 80 10 10 0 0 36 17 39 92
Tamaroggtt-2 0.17 80 20 0 0 0 34 18 38 90
Tamaroggtt-’i 0.25 10 20 50 20 0 31 16 20 68
Least sig. diff. 0.05
Values are means of 3 determinations. B, very desirable; D , mildly desirable; C , neutral; B, undesirable; A , very undesirable.
2.5 1.4 5.0 8.3

2 3 2 JOURNAL OF FOOD SCIENCE AND TECHNOLOGY, VOL. 2 4 , SEPT./OCT. 1987
much less desirable. Since quality attributes such as colour, texture and flavour interact among each other12, the composite score was also determined by the panel.
The yellowish colour of market oggtt was considered to be desirable by most of the panel members. The addition of date increased the desirable colour of tamaroggtt. Texture as determined by penetrometer varied considerably. There was no penetration at all in market oggtt, Yet it was very acceptable. Tamaroggtt has much improved texture but scored slighly above market oggtt. Tamaroggtt-l (with 50 per cent date) was the softest. Flavour of tamaroggtt (without cocoa) was superior to market oggtt. But tamaroggtt with cocoa was inferior. From these results, it is concluded that Tamaroggtt-1 and tamaroggtt-2 are desirable but tamaroggtt-3 is not acceptable.
The cost of preparing either tamaroggtt-1 or tamaroggtt-2 does not exceed 2 0 per cent of retail value of market oggtt.
References1 . Jacobs, M . R ., The C hem ical A n alysis o f F ood Products.
Robert E . Kreiger Publ. Co ., Huntington, New York, 1973, 3rd Edn., 21.
2. Pearson, D ., C hem ical A nalysis o f Food. Churchill Livingstone, New York, 1976, 7th Edn., 14.
3. Stone, H . and Sidel, J. L ., Sensory Evaluation P ractices,Academic press, New York, 1985, 76.
4. Snedecor, G . W . and Cochran, W . G ., S ta tis tic a l M ethods,Iowa State University Press, Iowa, 1974, 6th Edn.
5. E l-N a k h a l, H . and A l-K a h ta n i, M . S., Artificial ripeningof dates by freezing. Science a n d Technology fo r M u slim W o rld D evelopm ent. P a r t III. Proceedings o f the Sth Conference o f the A ssociation o f M u slim S cien tists and
Engineers, Purdue University, W . Lafayette, Indiana, Sept. 3 -5 , 1982, 585.
6. Sumainah, G . M . and El-N akhal, H ., Tamar Eddin, a newproduct from date. J. F d Sci. Technol., 1984, 2 1, 88.
7. Abdel-Hafiz, M . J., Shelabi, A . F. and A l-A k h al, I. A .,Chemical composition of 15 varieties of dates grown in Saudi Arabia, Proceedings o f 4th Conference on the B iological A spects o f Saudi A rabia. Saudi Biological Society, College of Science, University of Riyadh, Riyadh, Saudi Arabia, 1980, 181.
8. Sawaya, W. N ., K halil, J. K ., Khatchadourian, H .A ., Safi,W . M. and Mashadi, A . S., Sugars, tanins and some vitamin contents of twenty-five date cultivars grown in Saudi Arabia at the Khalal (mature colour) and tamar (ripe) stages. Proceedings o f the F irst Sym posium on D a te P alm in Saudi A rabia, March 23-25, 1982. K ing Faisal University, A l-H assa, Saudi Arabia, 1983, 468.
9. Khatchadourian. H . A ., Sawaya, W . N ., K h alil, J. K .,Safi, W. M . and Mashadi, A . S., Utilization of dates (Phoenix dactylifera L.), grown in the Kingdom of Saudi Arabia, in various date products. Proceedings o f the F irst Sym posium on the D a te P alm in Saudi A rabia. March 23-25, 1982, King Faisal University, A l-H assa, Saudi Arabia, 1983, 504.
10. Sawaya, W. N ., Safi, W. M ., Khalil, J. K . and Mashadi, A . S.,Physical measurements, proximate analysis and nutrient element contents of twenty-five date cultivars, grown in Saudi Arabia, at Khalal (mature colour) and tamar (ripe). Proceedings o f the F irst Sym posium on the D a te P alm in Saudi Arabia. March 23-25, 1982. K ing Faisal U n iversity, A l-H assa, Saudi Arabia, 1983, 454.
1 1 . E l-E ria n , A . F . M ., Studies on O ggtt, Proceedings o f ThirdConference on the B iological A spects o f Saudi A rabia, Saudi Biological Society, King Faisal University, Al-H assa, Saudi Arabia, 1979, 7.
12. Amarine, M . A ., Pangborn, R . M . and Roessler, E . B.,Principles o f Sensory Evaluation, Academic Press, New York, 196o.

Application of Reverse Osmosis in the Manufacture of Khoa. Process Optimization and Product Quality
D haram Pal
Division of Dairy Technology, National Dairy Research Institute, Karnal-132 001, Indiaand
M unir Chbryan
Department of Food Science, University of Illinois, 382 A.E.S. Building, Urbana. IL 61801, U.S.A.
Received 10 August 1986; revised 7 February 1987
A process has been developed for the manufacture of khoa using reverse osmosis (RO) to preconcentrate the milk. Flux in spiral-wound cellulose acetate membranes was pressure-dependent up to 27 kg/cm2 and then became independent of pressure. No permeation was observed until a pressure of 6 kg/cm2 was applied due to the osmotic pressure of milk. Flow rate affected flux only in the pressure-independent region. The average flux when concentrating cow’s milk from 12.5% total solids to 31% total solids was 8-10 liters per square meter per hour at 30°C. Khoa manufactured from pre-concentrated (31% total solids) whole milk was typical in flavour and texture compared to khoa made in the traditional open-pan boiler. The mineral and ash contents of RO -khoa were slightly lower doe to permeation of these compounds through the RO membrane. The overall economics and feasibility of a continuous khoa manufacturing operation based on reverse osmosis is attractive primarily because of the large savings in energy compared to traditional open-pan boilers.
The use of synthetic membranes in the chemical, medical, food and bio-processing industries is rapidly increasing around the world i. Membrane processes such as reverse osmosis (RO) and ultrafiltration (UF) can play a significant role in food processing, especially the dairy industry. To date, the major application on a world-wide basis has been the use of ultrafiltration for fractionating cheese whey or for pre-concentrating milk prior to cheese making. In India, however, owing to the nature and demand of indigenous dairy products, reverse osmosis, which is essentially a dewatering operation, should have wider application.
Khoa is an important indigenous milk product. It has been estimated that as much as 7 per cent of India’s total milk production is converted into khoa2. It is presently manufactured on a small scale by continuous boiling of milk until the desired concentration (65-70 per cent total solids) is reached. Several attempts have been made to develop new methods for commercial production of khoa, including the use of scraped-surfacc kettles or heat exchangers, evaporation for partial moisture removal3 and use of dehydrated milk4. The general conclusions were that using pre-concentrated milk above 31 per cent total solids resulted in poor quality khoa. The superior energy efficiency of reverse osmosis during initial stages of milk concentration could
be used to advantage in developing an economical low- energy continuous khoa-mao ufacturing process. The aim of this study was to develop such a process. The specific objectives were to optimize the processing of milk by reverse osmosis and to manufacture khoa from RO-concentrated milk and evaluate product quality.
Materials and MethodsThe processes used in this study are shown schemati
cally in Fig. 1. Cow’s milk was obtained from the University of Illinois dairy herd. In all the 4 processes shown, reverse osmosis was used to pre-concentrate the milk to either approximately half its initial volume (2X) or to 40 per cent of its initial volume (2.5X). The concentrated milk was then converted into khoa in an open stainless steel kettle using a Teflon-coated stirrer. Khoa made by the traditional open-pan method served as the control. The following variations in the basic process were studied:
Process A: Raw milk, with no further treatment, was processed in the reverse osmosis module prior to open-pan boiling.
Process B: Milk was pasteurized at 63 °C for 30 min before reverse osmosis. The process was otherwise identical to Process A.
52 3 3

2 3 4 JOURNAL OF FOOD SCIENCE AND TECHNOLOGY, VOL. 2 4 , SEPT./OCT. 19 8 7
R O .
RETENTATE
OPEN-PAN BO ILIN B
XHOA-IB)
RAW MILK
— 4PA STEU RIZE
(SKIM
\RO-
IRETENTATE
BOILINGf :
KHOA-(C)
SEPARATION ___ __ I_____
~1CREAM
------- JHOMOGENIZE
iRO-
RETENTATE
IBOILING
KHOMO)
Fig. 1. Schematic o f reverse osm osis process fpr manufacturing khoa
Process C: Milk was pasteurized and separated in a cream separator. The skim milk was concentrated by RO. The RO retentate was then combined back with the cream before converting it to khoa.
Process D. Milk was pasteurized and homogenized in a Manton-Gaulin homogenizer at a total pressure of 2000 psig (135 kg/cm2), The homogenized milk was concentrated by reverse osmosis.
A fifth process, referred to as the “Two Stage Membrane Process for Khoa” , was also evaluated (Fig. 2). After pasteurization, the milk was ultrafiltered to a concentration factor of 4.5X, The permeate from the UF operation was then concentrated by reverse osmosis
WHOLE MILK
IPASTEURIZE
1ULTRAFILTRATION
k4OA
to a 4.4X concentration factor. The UF retentate and the RO retentate were then combined before manufacturing khoa.
Membrane systems : Reverse osmosis was done on a spiral-wound pilot-scale module manufactured by Osmonics Inc, Minnetonka, Minnesota, USA. The membrane was type SEPA-97(CA) in a Model 192 housing. The membrane is made of cellulose acetate rated at 97 per cent rejection of sodium chloride, with a nominal pore size of 0.5 nm and maximum recommended operating temperature of 30°C. The module was installed in a process loop consisting of a feed tank, a high-pressure reciprocating pump fitted with a variable speed rhotor, a pulsation dampener, a shell-and-tube heat exchanger to control the temperature, the appropriate valves, pressure gauges, flowmeters and thermocouples to control and measure temperature, inlet and outlet pressures, flow rate through the module (recycling rate, Q) and permeate flux (J). Unless otherwise mentioned, RO was done at 30°C and pH 6 .8 .
The ultrafiltration system was a pilot-scale Romicon hollow fiber unit. The module was the HF15-43-PM50; it had a polysulfonc membrane of 1.4 m2 area with a nominal molecular weight cut-off of 50,000. Ultrafiltration was done at 50°C and pH 6 .8 . Further details on the operation of hollow fibers with milk are available elsewhere5,6.
The membrane systems were operated in the batch mode7. Both retentate and permeate were recycled to the feed tank during the fouling and optimization studies. During concentration, the permeate was discarded and the feed allowed to concentrate. The concentration factor (X) or Weight Concentration Ratio (WCR) is expressed as:
Initial weight of feedWCR or (X) ■ ■ * - — ( 1 )Weight of retentate
The performance of a membrane unit is measured in terms of flux and rejection7. Flux, the rate of removal of permeate, is expressed as the permeate volume per unit membrane area per unit time (i.e., l/m2/hr or LMH). Rejection is a measure of the membrane’̂ ability to retain or separate a particular component in the feed. It is expressed as:
R = (l -Cp/Cr) x 100 (2)where Cp is concentration in the permeate and Cr is concentration of that component in the retentate.
The driving force for permeation is the transmembrane pressure. It is calculated as:
Pi + PoA P T = ----Ö— - P p (3.)
Fig. 2. Schematic of two-stage membrane process for manufacturing khoa.
where Pi is the inlet pressure and Po the outlet pressure of the RO module. Pp is the permeate back pressure
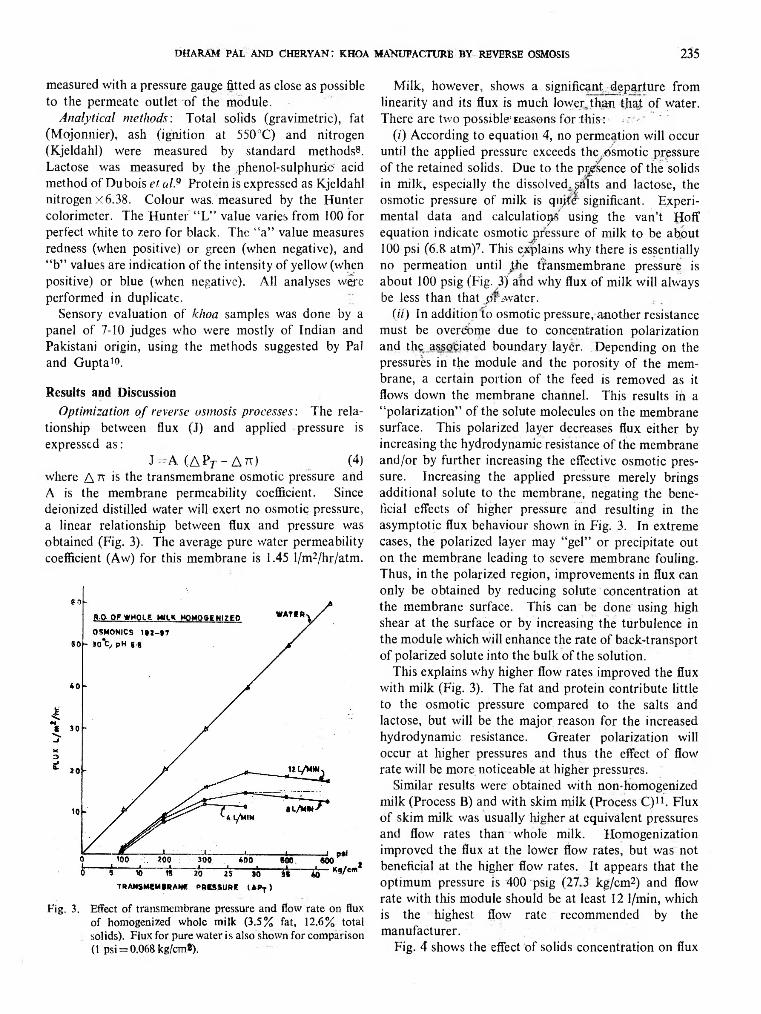
DHARAM PAL AND CHERYAN: KHOA MANUFACTURÉ BY REVERSE OSMOSIS 235
measured with a pressure gauge fitted as close as possible to the permeate outlet of the module.
Analytical methods: Total solids (gravimetric), fat (Mojonnier), ash (ignition at 550°C) and nitrogen (Kjeldahl) were measured by standard methods8. Lactose was measured by the ..phenol-sulphuric acid method of Dubois et al.9 Protein is expressed as Kjeldahl nitrogen X 6.38. Colour was. measured by the Hunter colorimeter. The Hunter “L” value varies from 100 for perfect white to zero for black. The “a” value measures redness (when positive) or green (when negative), and “b” values are indication of the intensity of yellow (when positive) or blue (when negative). All analyses wax performed in duplicate.
Sensory evaluation of khoa samples was done by a panel of 7-10 judges who were mostly of Indian and Pakistani origin, using the methods suggested by Pal and Gupta10.
Results and DiscussionOptimization o f reverse osmosis processes: The rela
tionship between flux (J) and applied pressure is expressed as:
J - A. (A Pp - A n ) (4)where A n is the transmembrane osmotic pressure and A is the membrane permeability coefficient. Since deionized distilled water will exert no osmotic pressure, a linear relationship between flux and pressure was obtained (Fig. 3). The average pure water permeability coefficient (Aw) for this membrane is 1.45 l/m2/hr/atm.
Fig. 3. Effect of transmembrane pressure and flow rate on flux of homogenized whole milk (3.5% fat, 12.6% total solids). Flux for pure water is also shown for comparison (l psi = 0.068 kg/cm8).
Milk, however, shows a significant departure from linearity and its flux is much lower, than that of water. There are two possible1 reasons for th is : i
(0 According to equation 4, no permeation will occur until the applied pressure exceeds the „Osmotic pressure of the retained solids. Due to the presence of the solids in milk, especially the dissolved,^?!Its and lactose, the osmotic pressure of milk is qipte significant. Experimental data and calculations using the van’t Hoff equation indicate osmotic pressure of milk to be about 100 psi (6.8 atm)7. This explains why there is essentially no permeation until the transmembrane pressure is about 100 psig (Fig. 3) and why flux of milk will always be less than that p r ¿water.
(it) In addition to osmotic pressure, another resistance must be overcome due to concentration polarization and the associated boundary layer. Depending on the pressures in the module and the porosity of the membrane, a certain portion of the feed is removed as it flows down the membrane channel. This results in a “polarization” of the solute molecules on the membrane surface. This polarized layer decreases flux either by increasing the hydrodynamic resistance of the membrane and/or by further increasing the effective osmotic pressure. Increasing the applied pressure merely brings additional solute to the membrane, negating the beneficial effects of higher pressure and resulting in the asymptotic flux behaviour shown in Fig. 3. In extreme cases, the polarized layer may “gel” or precipitate out on the membrane leading to severe membrane fouling. Thus, in the polarized region, improvements in flux can only be obtained by reducing solute concentration at the membrane surface. This can be done using high shear at the surface or by increasing the turbulence in the module which will enhance the rate of back-transport of polarized solute into the bulk of the solution.
This explains why higher flow rates improved the flux with milk (Fig. 3). The fat and protein contribute little to the osmotic pressure compared to the salts and lactose, but will be the major reason for the increased hydrodynamic resistance. Greater polarization will occur at higher pressures and thus the effect of flow rate will be more noticeable at higher pressures.
Similar results were obtained with non-homogenized milk (Process B) and with skim milk (Process C)11. Flux of skim milk was usually higher at equivalent pressures and flow rates than whole milk. Homogenization improved the flux at the lower flow rates, but was not beneficial at the higher flow rates. It appears that the optimum pressure is 400 psig (27 3 kg/cm2) and flow rate with this module should be at least 12 1/min, which is the highest flow rate recommended by the manufacturer.
Fig. 4 shows the effect of solids concentration on flux

2 3 6 JOURNAL OF FOOD SCIENCE AND TECHNOLOGY, VOL. 2 4 , SEPT./OCT. 1987
Fig. 4. Relationship between total solids and flux during reverse osmosis of milk. (A =skim milk; 0=w hole milk; # = homogenized whole milk). The transmembrane pressure was 400 psig and the flow rate (Q) was 12 L/min.
using these optimum operating parameters. Since the system is operating in the mass transfer controlled region, the relationship between flux and solids concentration appears to follow the film theory7. The differences between the three milks are due to slight differences in their initial composition and rates of fouling of the membrane. By extrapolation, it appears that the maximum concentration of milk that can be obtained under these conditions is 36-38 per cent total solids.
Two-stage membrane process: Fig. 5 shows the relationship between flux and solids during the hollow fiber ultrafiltration of whole milk (the two-stage process shown in Fig. 2). Semi-logarithmic relationship was observed as long as the flow rate could be maintained constant. However, due to increases in viscosity at higher solids, large pressure drops were required to maintain the flow rate. This exceeded the pressure rating of the hollow fiber module. Above 30 per cent solids, the flow rate was reduced to 19 l/min. In practice, hollow fibers are limited to about 36-40 per cent solids with whole milk.
Fig. 6 shows the relationship between flux and total solids during RO of the UF permeate. Since the UF permeate was free of macromolecules and fat, concentration polarization was insignificant compared to milk. There was no asymptotic flux behaviour and little effect of flow rate on flux11. Thus, since osmotic pressure of the feed is the major resistance, the optimum process conditions for reverse osmosis of UF permeate would be highest possible pressure and low flow rates in contrast
Fig. 5. Ultrafiltration of whole milk: effect of retentate solids concentration of flux. The flow rate (Q) through the module was 86 L/min upto 3X, then it was lowered to 19 L/min. Transmembraue pressure was 15 psig.
Fig. 6. Concentration by reverse osmosis of permeate from ultrafiltration of whole milk: relationship between retentate solids concentration and flux.
to the optimum conditions for reverse osmosis of milk (highest flow rate and intermediate pressure).
Since the osmotic pressure of UF permeate would be close to that of milk and the applied pressure is 400 psi,

DHARAM PAL AND CHERYAN: KHOA MANUFACTURE BY REVERSE OSMOSIS 2 3 7
the maximum concentration possible (assuming a linear relationship between UF permeate solids and osmotic pressure) would be 4.4X, according to equation 4. This is approximately what we obtained before the flux became too low to be measured. The initial solids content of the UF permeate was 5.81 pei cent and the maximum concentration possible (obtained by extrapolating the data in Fig. 6 ) is about 27 per cent solids. Higher applied pressures would no doubt have permitted a higher final concentration.
However, there is a practical limit to the degree of concentration which is dictated by the loss of solids. Permeation of the solids is a function of the difference in concentration on either side of the membrane. The higher the solids in the feed/retentate, the greater the
Fig. 7. Rejection of total solids, ash and lactose during reverse osmosis of UF-milk permeate. Top: Concentration in retentate. Bottom: concentration in permeate.
passage of the solids into the permeate. This is shown in Fig. 7, where the concentration factor in terms of WCR is plotted against the permeate and retentate composition during the experiment shown in Fig. 6. Above WCR 3, the “leakage” of ash and lactose increased significantly. However, even at the highest retentate concentration, the overall rejection of the solids was more than 9 5 per cent. If losses of the solids are to be minimized with this particular cellulose acetate membrane, the concentration factor should be kept below 3X.
Product composition: Based on previous research2 - 4
and our own optimization studies, it was decided to limit the pre-concentration of milk by RO to less than 3X. This should keep RO losses low and the flux high and the sensory properties of the khoa made from the concentrates should be satisfactory. With each process shown in Fig. 1, two concentrates were prepared ; one where the milk was concentrated to 2X and the other to 2.5X. The composition of the khoa made from milk and its concentrates is shown in Table 1 . Preparation of khoa from RO retentâtes took less than half the time of the control khoa made by the traditional method. In general, the khoa from RO concentrates showed higher moisture contents than the controls. The fat content of all khoa, including the control, was usually less than 2 0 per cent, since the raw material was cow’s milk. However, fat content can be adjusted during the process, either before or after RO.
Throughout all the experiments11, a significant difference was observed in the fat and ash contents between control and RO-khoa. The ash was always lower in the RO-khoa. This could be due to the passage of some
Table 1. composition of khoa (as is basis)
Process Concn.factor
Totalsolids(%)
Fat(%)
Protein(%)
Ash(%)
Lactose(%)
A Control 69.9 17.0 19.9 4.4 28.52X 63.2 16.1 18.1 3.7 25.3
2.5X 60.5 15.7 17.4 3.4 24.1
B Control 67.7 19.6 19.3 4.0 24.92X 61.4 18.6 17.7 3.2 22.0
2.5X 60.3 18.3 17.5 3.0 21.5
C Control 66.7 19.3 18.8 4.3 23.82X 66.4 20.6 18.8 3.6 23.3
2.5X 65.9 20.5 18.7 3.5 23.2
D Control 62.5 17.8 17.4 3.9 23.52X 61.3 18.1 17.1 3.3 22.8
2.5X 60.6 17.9 17.0 3.2 22.5
6

238 JOURNAL OF FOOD SCIENCE AND TECHNOLOGY, VOL. 2 4 , SEPTV/OCT. 1987
ionic species through the membrane during concentration. At WCR of 2-2.5X, rejection of ash was typically about 78 per cent (Fig. 7) and thus the lower ash content of the RO-khoa is to be expected. Lactose loss was much less since the rejection of lactose was in excess of 97 per cent. Some non-protein nitrogen may pass through the membrane, but Table 1 indicates nitrogen rejection was also very high since protein contents of RO-khoa were comparable to the- control. Fat rejection is essentially 100 per cent with RO membranes. Since there was a loss of other components, the fat content of RO-khoa is expected to be slightly higher.
Sensory properties: Table 2 shows sensory properties of RO-khoa. There were essentially no differences in the colour values (L,a,b) among any of the RO-khoa samplesi.e., neither the process used (A, B, C or D) nor the degree of pre-concentration (2X or 2.5X) had any effect on the colour values. The RO-khoa showed less of a greenish tinge than control khoa, but the diffeiences were not significant. All khoa samples showed a noticeable yellowish-orange colour, due to the presence of carotene in the cow’s milk.
There were no differences in other sensory properties between 2X and 2.5X RO-khoa samples. The RO-khoa samples did not show any large differences in flavour and body from their respective control, except for Process A samples. Since Process A used raw milk, the RQ-khoa was. distinctly rancid. This is due to The hydrolysis of fat by lipase which was not inactivated before concentration. RO-khoa tended to lack graininess, but this may not be an undesirable quality. In fact, in preparation of products such as burfi, this will help in producing a homogeneous and smooth product. It is also possible to control the graininess during the final
T able 2. sensory properties op ro- khoa
Colour by Hunter colorimeter (average of all trials)
L a b
Control khoa 69.3 —4.1 19.5RO-khoa (2X) 67.0 —1.5 16.7RO-Khoa (2.5X) 67.8 —3.1 15.7
Flavour and Texture (average ratings for all samples)
Control khoa* : Normal, granular, typical flavourQ
RO-Khoa (Process A) : Rancid, free fat, lacks grains RO-Khoa (Process B) : Normal, free fat, no grains RO-Khoa (Process C) : Cooked, slight free fat, no grains RO-Khoa (Process D) : Normal, no free fat, no grains
♦Except for Process A control, which had a rancid flavour. n .
finishing/heating stages. Except when homogenized, the RO-khoa showed slightly higher free fat which was evident from deposition on the sides of the container.
It is concluded that the application of reverse osmosis for the manufacture of khoa appears to have great potential in India. The process is quite simple, requiring only the pumping of milk through a membrane module. The khoa prepared from RO-concentrated milk has a slightly higher moisture content, but the flavour and body do not appear to be affected. This should result in higher yields of the product, Since there were no major differences between the products (except for the khoa from Process A), Process B is preferred due to its simplicity: no separation is needed as with Process C, and no homogenization as with Process D.
Acknowledgement
This project was supported in part by the Illinois Agricultural Experiment Station and United Nations Development Program of the Food and Agricultural Organization (Project No. IND/78/020), which provided one of the authors (D. Pal) with a Fellowship to conduct the research at the University of Illinois, Urbana.
References
1. Cheryan, M., Membrane processing. In McGraw-Hill Yearbook of Science and Technology, by Parker, S. P. (Ed.),McGraw-Hill Book Co., New York, 1984, 1985 Edn.,182.
2. Rajorhia, G. S. and Srinivasau, M. R., Technology of khoa—a review. Indian J. Dairy Sci., 1979, 32, 209.
3. Vogra, V. R. and Rajorhia, G. S., Utilization of pre-concent-rated milk for khoa making. Asian J. Dairy Res., 1982, 1, 1.
4. Vogra, V. R. and Rajorhia, G. S., Utilization of dried milkfor khoa making. Asian J. Dairy Res., 1983, 2,113.
5. Cheryan, M. and Chiang, B. H., Performance and fouling behaviour of hollow fibre and spiral wound ultrafiltration units processing skim milk, in Engineering and Food. Vol. 1: Engineering Sciences in the Food Industry, by B. M. McKenna (Ed.), Elsevier Applied Science, London, 1984, 191.
Chiang, B.H. and Cheryan, M., Ultrafiltration of skim milk in hollow fibers. / . Food Sci., 1986, 51, 340.
Cheryan, M., Ultrafiltration Handbook, Technomic Publising . Co., Lancaster, PA, 1986.
Official Methods of Analysis, Association of Official Analytical Chemists, Washington, D.C. 11th Edn,, 1970.
Dubois, M,, Gilles, K. A., Hamilton, J. K., Rebers, P. A. and Smith, F., Colorimetric methods for determination of sugars and related substances. Analyt. Chem., 1956,28, 350.
Pal, D. and Gupta, S. K., Sensory evaluation of Indian milk products. Indian Dairyman, 1985, 37, 465.
Pal, D., Report on UNDP Fellowship Training at University of Illinois, National Dairy Research Institute, Karnal, 1985.

Study of Paneer Quality in Relation to Pressing ConditionsM anoj K ulshreshtha, U. S. A grawal and B. P. N. Singh
Department of Post Harvest Process and Food Engineering, Pantnagar-263 145, India
R ece ived 27 January 1986; revised 23 February 1987
The study was conducted on a laboratory model paneer press for correlating final paneer quality to pressing co n -' ditions. Three quality factors, namely, moisture content, shear strength and porosity were considered and the effect of pressure and time of pressing on these quality factors was studied. Mathematical models for predicting final moisture content and shear strength as a function of pressure and time of pressing were developed. Effect of pres
sing conditions on porosity of paneer product was not significant even at 1 0 % level of significance. From the point of view of uniformity, of product quality, pressing at lower pressures around 1 kg/cm® is recommended.
Paneer (Indian cheese) is a common milk product of high nutritive value. In India, paneer production is mostly limited to domestic level because of lack of technical details of production. The process ol paneer making consists of coagulation of milk with the help of a suitable coagulant and separation of curd from whey. The curd is subsequently pressed for increasing the cohesion and removal of excess moisture.
Quality of paneer is judged on the basis of its cohesive strength, moisture content, sponginess and nutritive value. All these quality factors, except the nutritive value, are dependent on the pressing parameters which include the pressure and the time of pressing. Product pressed under a high pressure or for a long time, would probably be very compact lacking sponginess. On the other hand, pressing with very low pressure, or for a short time, may result in poor handling and storage properties owing to low cohesive strength and high moisture content. Hence, optimization of pressing condition is needed to produce paneer of desirable quality.
Kundu and De1 and De2 employed the method of hanging for removing excess water from the curd by dripping. No pressure was applied. The dripping of water stopped in 30-60 min. De et al$ employed a pressure of 2 kg/cm2 and a pressing time of 25 min while studying paneer production from acidic milk. The study was conducted only at a single pressing condition and the effect of pressing conditions was not investigated. A general description of paneer making process has been discussed by Warner4. He did not specify the pressure but mentioned a pressing time of 15-20 min. Kulshreshtha5 presented a mathematical analysis of the process under low pressure short time pressing, based on rheological properties of paneer. No experimental
data were presented and the developed model was not verified experimentally.
Considering the limited extent of work on the effect of pressing conditions on the quality of paneer, the present study was undertaken. Cohesive strength, moisture content and porosity were chosen as quality factors and were studied in relation to pressure and time of pressing.
M aterials and MethodsExperiments were conducted at 1, 2 and 3 kg/cm2
pressures, and pressing time intervals of 5, 10, 20, 60 and 120 min. Moisture content, cohesive strength and porosity of final product were the dependent parameters.
Paneer press: A vertical paneer press (Fig. 1) was developed for conducting the experiments. It consisted of a vertical perforated cylinder (5.5 cm internal diameter, 12 cm height), made of a G.I. pipe and threaded
Fig. 1. The paneer press (all dimensions are in mm)
239
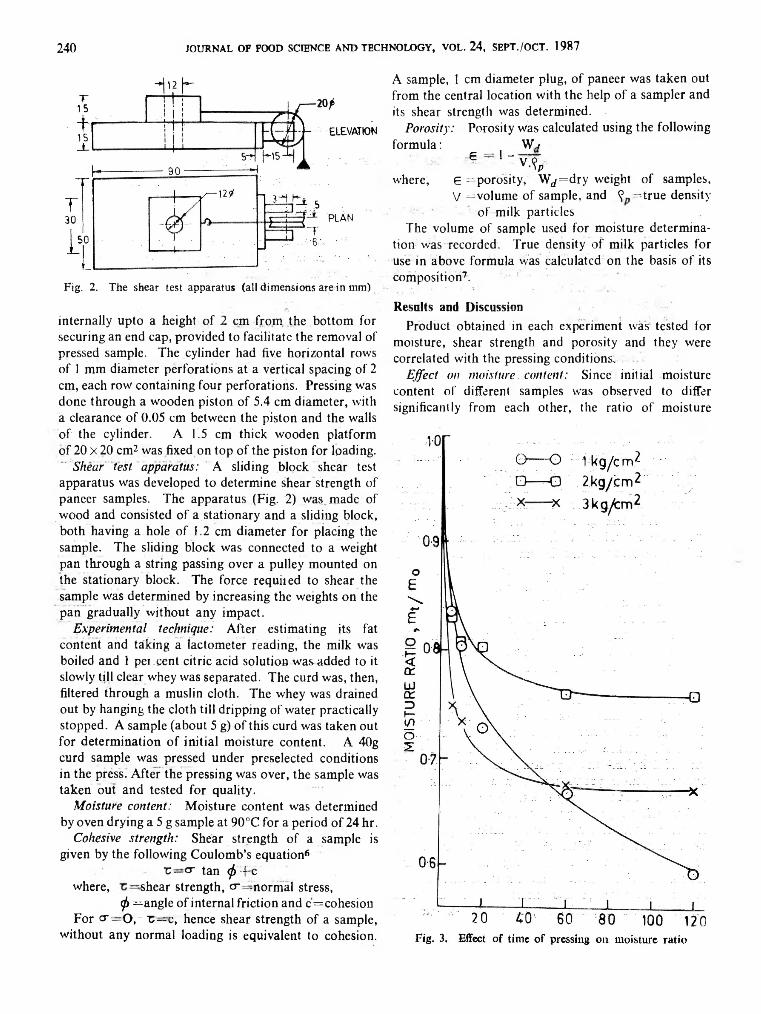
2 4 0 JOURNAL OF FOOD SCIENCE AND TECHNOLOGY, VOL. 24 , SEPT./OCT. 1987
Fig. 2. The shear test apparatus (all dimensions are in mm)
internally upto a height of 2 cm from the bottom for securing an end cap, provided to facilitate the removal of pressed sample. The cylinder had five horizontal rows of 1 mm diameter perforations at a vertical spacing of 2
cm, each row containing four perforations. Pressing was done through a wooden piston of 5.4 cm diameter, with a clearance of 0.05 cm between the piston and the walls of the cylinder. A 1.5 cm thick wooden platform of 2 0 x 2 0 cm2 was fixed on top of the piston for loading.
Shear test apparatus: A sliding block shear test apparatus was developed to determine shear strength of paneer samples. The apparatus (Fig. 2) was made of wood and consisted of a stationary and a sliding block, both having a hole of 1 . 2 cm diameter for placing the sample. The sliding block was connected to a weight pan through a string passing over a pulley mounted on the stationary block. The force requited to shear the sample was determined by increasing the weights on the pan gradually without any impact.
Experimental technique: After estimating its fat content and taking a lactometer reading, the milk was boiled and 1 pet, cent citric acid solution was added to it slowly till clear whey was separated. The curd was, then, filtered through a muslin cloth. The whey was drained out by hanging the cloth till dripping of water practically stopped. A sample (about 5 g) of this curd was taken out for determination of initial moisture content. A 40g curd sample was pressed under preselected conditions in the press. After the pressing was over, the sample was taken out and tested for quality.
Moisture content: Moisture content was determined by oven drying a 5 g sample at 90°C for a period of 24 hr.
Cohesive strength: Shear strength of a sample is given by the following Coulomb’s equation6
r — cr tan <f> 2 cwhere, shear strength, cr -normal stress,
0 = angle of internal friction and c=cohesionFor cr —O, z —e, hence shear strength of a sample,
without any normal loading is equivalent to cohesion.
A sample, 1 cm diameter plug, of paneer was taken out from the central location with the help of a sampler and its shear strength was determined.
Porosity: Porosity was calculated using the following formula: Wj
6 1~ vTPwhere, 6 =porosity, W ^=dry weight of samples,
V =volume of sample, and ^ = true density of milk particles
The volume of sample used for moisture determination was recorded. True density of milk particles for use in above formula was calculated on the basis of its composition7.
Results and DiscussionProduct obtained in each experiment was tested for
moisture, shear strength and porosity and they were correlated with the pressing conditions.
Effect on moisture content: Since initial moisture content of different samples was observed to differ significantly from each other, the ratio of moisture
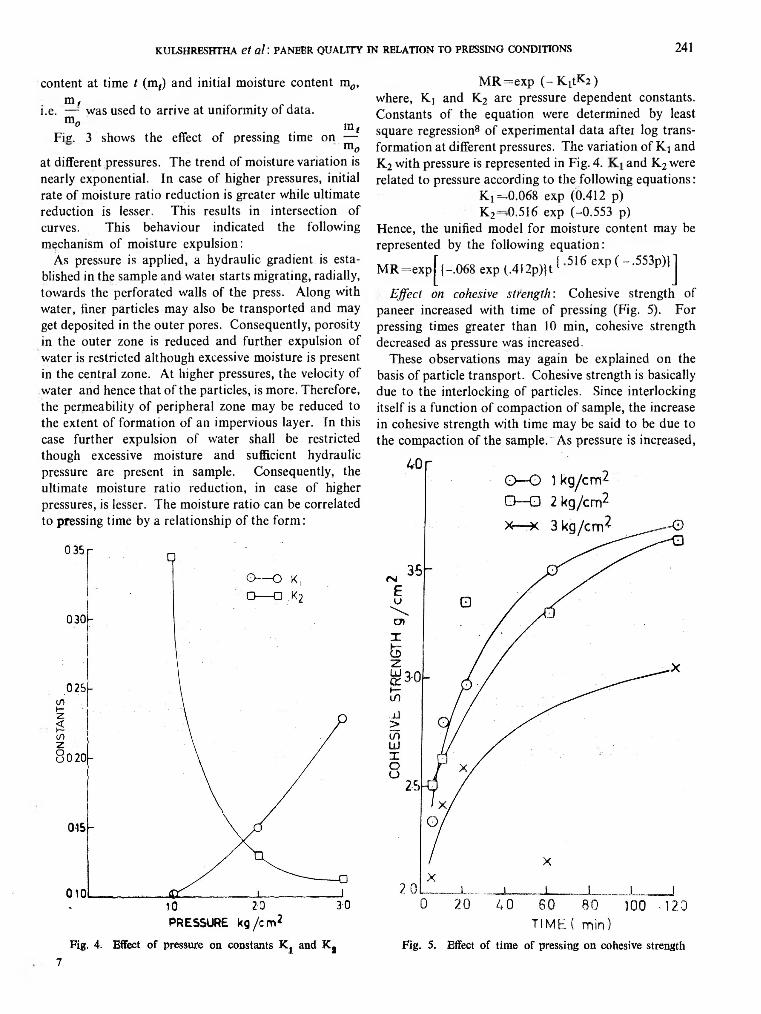
KULSHRESHTHA étal : PANEER QUALITY IN RELATION TO PRESSING CONDITIONS 241
content at time t (m,) and initial moisture content m0, m ,
i.e. — was used to arrive at uniformity of data.m° m ,
Fie. 3 shows the effect of pressing time on —m0at different pressures. The trend of moisture variation is nearly exponential. In case of higher pressures, initial rate of moisture ratio reduction is greater while ultimate reduction is lesser. This results in intersection of curves. This behaviour indicated the following mechanism of moisture expulsion:
As pressure is applied, a hydraulic gradient is established in the sample and watei starts migrating, radially, towards the perforated walls of the press. Along with water, liner particles may also be transported and may get deposited in the outer pores. Consequently, porosity in the outer zone is reduced and further expulsion of water is restricted although excessive moisture is present in the central zone. At higher pressures, the velocity of water and hence that of the particles, is more. Therefore, the permeability of peripheral zone may be reduced to the extent of formation of an impervious layer. In this case further expulsion of water shall be restricted though excessive moisture and sufficient hydraulic pressure are present in sample. Consequently, the ultimate moisture ratio reduction, in case of higher pressures, is lesser. The moisture ratio can be correlated to pressing time by a relationship of the form:
M R=exp ( - KrtKa)where, K, and K2 are pressure dependent constants. Constants of the equation were determined by least square regression8 of experimental data aftei log transformation at different pressures. The variation of K4 and K 2 with pressure is represented in Fig. 4. and K 2 were related to pressure according to thofollowing equations:
Kj =D.068 exp (0.412 p)K2—0.516 exp (-0.553 p)
Hence, the unified model for moisture content may be represented by the following equation:
M R=expJ{-.068 exp (,412p)}t{ 5 1 6 exP ( - - 553P)lj
Effect on cohesive strength: Cohesive strength of paneer increased with time of pressing (Fig. 5). For pressing times greater than 1 0 min, cohesive strength decreased as pressure was increased.
These observations may again be explained on the basis of particle transport. Cohesive strength is basically due to the interlocking of particles. Since interlocking itself is a function of compaction of sample, the increase in cohesive strength with time may be said to be due to the compaction of the sample. As pressure is increased,
7
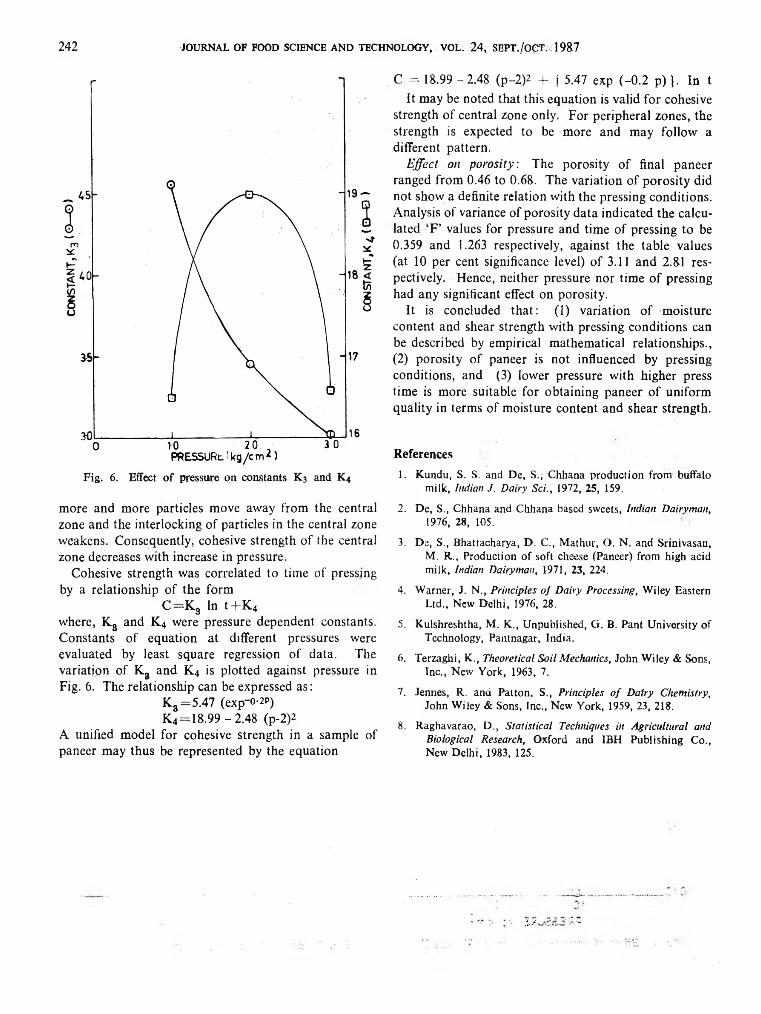
242 JOURNAL OF FOOD SCIENCE AND TECHNOLOGY, VOL. 24 , SEPT./OCT. 1987
more and more particles move away from the central zone and the interlocking of particles in the central zone weakens. Consequently, cohesive strength of the central zone decreases with increase in pressure.
Cohesive strength was correlated to time of pressing by a relationship of the form
C —K3 In t+ K 4
where, K8 and K4 were pressure dependent constants. Constants of equation at different pressures were evaluated by least square regression of data. The variation of Kg and K4 is plotted against pressure in Fig. 6 . The relationship can be expressed as:
K 3 = 5 . 4 7 (e x p "0 - 2 P )
K 4 = 1 8 . 9 9 - 2 . 4 8 (p - 2 )2
A unified model for cohesive strength in a sample of paneer may thus be represented by the equation
C =; 18.99 - 2.48 (p-2)2 + i 5.47 exp (-0.2 p ) }. In tIt may be noted that this equation is valid for cohesive
strength of central zone only. For peripheral zones, the strength is expected to be more and may follow a different pattern.
Effect on porosity: The porosity of final paneer ranged from 0.46 to 0.68. The variation of porosity did not show a definite relation with the pressing conditions. Analysis of variance of porosity data indicated the calculated ‘F ’ values for pressure and time of pressing to be0.359 and 1.263 respectively, against the table values (at 10 per cent significance level) of 3.11 and 2.81 respectively. Hence, neither pressure nor time of pressing had any significant effect on porosity.
It is concluded that: (1) variation of moisturecontent and shear strength with pressing conditions can be described by empirical mathematical relationships., (2) porosity of paneer is not influenced by pressing conditions, and (3) lower pressure with higher press time is more suitable for obtaining paneer of uniform quality in terms of moisture content and shear strength.
References
1. Kundu, S. S. and De, S., Chhana production from buffalomilk, Indian J. D airy S c i., 1972, 25, 159.
2. De, S., Chhana and Chhana based sweets, Indian D airym an,1976, 28, 105.
3. De, S., Bhattacharya, D. C., Mathur, O. N. and Srinivasan,M. R,, Production of soft cheese (Paneer) from high acidmilk, Indian D airym an, 1971, 23, 224.
4. Warner, J. N., Principles o f D airy Processing, Wiley EasternLtd., New Delhi, 1976, 28.
5. Kulshreshtha, M. K., Unpublished, G. B. Pant University ofTechnology, Pantnagar, India.
6. Terzaghi, K., Theoretical S o il M echanics, John Wiley & Sons,Inc., New York, 1963, 7.
7. Jennes, R. and Patton, S., Principles o f D a iry C hem istry,John Wiley & Sons, Inc., New York, 1959, 23, 218.
8. Raghavarao, D., S ta tis tica l Techniques in A gricultural andB iological Research, Oxford and IBH Publishing Co.,New Delhi, 1983, 125.
. t V -

Effect of Freezing and Sodium Citrate Treatment on the Association-Dissociation of Proteins from Shrimp
(P a ra p en a eo p s is s ty l ife r a )
S. G o d a v a r i B a i , V. S. K h a b a d e a n d V. P r a k a s h *
Central Food Technological Research Institute, Mysore-570 013, India
R eceived 2 June 1986; revised 12 February 1987
The effect of freezing at -2 0 °C and treatment with sodium citrate on proteins of shrimp (Parapenaeopsis sty lifera) has
been investigated by analytical ultracentrifugation. The results indicate that the proteins dissociate during storage at -2 0 °C . The rate of dissociation of proteins of shrimp by sodium citrate treatment was slower; and they had less drip loss and the overall quality of the shrimp was better. These are considered to be due to partial dehydration during
storage and the effect of inorganic salts, mainly on the
The shelf-life of fish depends upon the physical and chemical treatments given to it both on-shore and onboard fishing vessels. Generally, temperatures in the range of -20 to -40°C are used to extend the shelf-life of fish. Chemical treatments with hydrophilic additives antioxidants, neutral lipids and inorganic salts also extend their shelf-life to a considerable extent1-5. Frozen shrimp is an important export item and accounts for about 90 per cent of the total fisheiy export amounting to nearly 55000 MT6.
Flowever, apart from studies on cod meat by Mathews et alJ and Laird et al.s, no systematic investigation is available on the deteriorative changes in proteins of shrimp upon storage. These treatments, both physical and chemical, can lead to dissociation-association and denaturation-aggregation of the proteins, particularly in lean fish and thus bringing about deterioration of the texture of the product. In the present study, such changes induced by storage at -20°C and treatment with sodium citrate are monitored mainly by analytical ultracentrifugation and measurement of drip loss and proteolytic activity.
M aterials and MethodsRaw material: Shrimp belonging to the commercial
species Parapenaeopsis stylifera was used in these studies. They were obtained immediately after landing at Mangalore (West Coast of India). After washing with municipal water, they were beheaded, peeled and devein- ed. One portion of the fresh meat was then subjected to quick freezing, filled in waxed cartons (400 g capacity) and stored at -20°C. Another portion was given a dip
*To whom all correspondence m ay be addressed.
non-covalent interactions.
treatment in sodium citrate ( 8 per cent solution) for 5 min, drained over inclined stainless steel mesh for 5 min and then subjected to quick freezing and stored at -20°C like the control sample. The samples were stored for five months. At predetermined intervals, the blocks were taken out, thawed at 4°C and the meat and drip were taken for analysis.
Sodium carbonate, sodium chloride and sodium citrate were of reagent grade from BDH Chemicals, India; denatured haemoglobin was from Worthington Biochemicals USA. Distilled water was used in all the experiments. All other chemicals used were of reagent grade. Sodium citrate was estimated by a standard procedure9,10.
Extraction o f protein: Twenty grams of shrimpmeat was homogenised for 2 min in a Waring blender with 140 ml of buffer solution, consisting of0.02M sodium carbonate, pH 7.8, containing 5 per cent sodium chloride. The homogenate was centrifuged at 4000 rpm for 45 min at 4°C and the supernatant was used for analysis.
Protein concentration: The concentration of protein in the supernatant was estimated by micro-Kjeldhal procedure11. For routine determination of protein concentration, a calibration curve relating the protein content in the sample to its absorbance at 280 nm was established using a Shimadzu spectrophotometer (^-lcm, 28 0nm“ 15.52).
Analytical ultracentrifugation: Sedimentation velocity experiments were carried out at 25°C in a Spinco Model E analytical ultracentrifuge equipped with a phase plate schlieren optics and a rotor temperature indicator and control (RTIC) unit. For a typical run, a standard 12 mm
2 4 3

2 4 4 JOURNAL OF FOOD SCIENCE AND TECHNOLOGY, VOL. 24 , SEPT./OCT. 1987
Kel F centerpiece cell was used. Protein sample of 1.6 per cent was routinely used and centrifuged at 59,780 rpm unless otherwise stated. Photographs were taken at frequent intervals and plates were read on a Gaertner microcomparator and S2<j,w value calculated by the standard procedure12. The per cent composition of the various peaks were calculated from the sedimentation velocity patterns after enlarging them on a Gaertner microcomparator and accurately weighing the tracing paper equivalent in area to the various peaks.
Proteolytic activity: The proteolytic activity of the total soluble proteins in the shrimp was determined by using denatured haemoglobin as substrate13. The reaction mixture contained 1 ml of supernatant from muscle homogenate (muscle: buffer 1:6) and 2.5 ml of 2 per cent denatured haemoglobin in 0.1M acetate buffer, pH 4.0. The reaction was carried out at 37°C for 30 min in a constant temperature shaking water bath and was terminated by addition of 3 ml of 10 per cent trichloroacetic acid (TCA). Blanks were prepared by the addition of TCA solution to the denatured haemoglobin substrate followed by immediate addition of the tissue extract. These extracts were filtered and the absorbance monitored at 280 nm with respective blanks in a Shimadzu spectrophotometer and the enzyme activity calculated as described by Wojtowicz and Odense13.
Results and DiscussionFig. 1 shows the drip loss and the salt soluble nitrogen
as a function of storage. The sample treated with sodium citrate has a bettei water holding capacity than the untreated sample. The residual sodium citrate in the meat was 1 per cent. This has a profound effect on the shelf-
Fig. 1. Salt soluble n itrogen versus num ber o f days o f storage o f shrim p: treated(O ), u n tre a te d f® ) , (Inset) percentage drip loss versu s num ber o f days storage.
life as well as the colour, texture and flavour of shrimp9. However, there appears to be a gradual change in the salt soluble nitrogen upto 40 days followed by a sharp decrease in the treated and untreated samples. These results indicate that sodium citrate has a profound effect on the water holding capacity of shrimp proteins and hence the changes with respect to the association-dissociation profiles of the proteins were monitored.
The sedimentation pattern for total protein extracted from fresh shrimp indicates four distinct components of
Fig. 2. Sedim entation velocity pa tte rn o f (a) u p p e r : shrim p proteins 0-day storage, lo w e r : shrim p proteins 0-da> sto rag e+ in v itro ad d itio n o f sodium c itra te (b) u p p er . 49 days storage a t -2 0 °C a n d lo w e r : trea ted w ith 8% sodium c itra te and 49 days storage a t -20°C (c) u p p e r : 128 days storage a t -2 0 °C and lo w e r , trea ted w ith 8% sodium c itra te and 128 days storage at-2 0 °C (d) u pper: d rip o f 30 days stored a t -2 0 °C untreated sam ple and lo w e r : d rip o f 97 days stored a : -2 0 °C and treated w ith 8% sodium citrate . All the runs were perform ed a t 59,780 rpm and a t 27°C.

GODÀVARI BAI é t a l : FREEZING AND SODIUM CITRATE TREATMENT ON SHRIMP PROTEINS 245
sedimentation coefficients of 3,5,6 and 7S the percentage of each component being 43,22,23 and 12 respectively (Fig. 2-a upper). As the time of storage increases the proteins dissociate to the 3S component with a concomitant decrease in the percentage of 5,6 and 7S components. Fig. 2-b and c show representative sedimentation profiles of the total protein as a function of time of storage. In order to monitor the changes in the treated and untreated samples, the components arc grouped as low molecular weight (LMW) proteins (consisting of only 3S component) and high molecular weight (HMW) proteins (consisting of 5,6 and 7S components).
Fig. 3 and 4 show the changes of LMW and HMW components as a function of storage. Results with the untreated sample indicate that the increase in LMW
Fig. 3, Per cent fraction versus period (days) of storage of untreated sample, frozen stored at -20°C (O—O LMW component, # —• HMW component).
Fig. 4. Per cent fraction versus period of storage (days) of treated sample (5 min dip) with 8% sodium citrate and then frozen stored at -20°C. O—O LMW, component # —• , HMW, component.
component follows a sigmoidal pattern with a concomitant decrease in the per cent fraction of the HMW component; nearly 50 per cent of each is present at 50 days of storage (Fig. 3). On the other hand, in the treated sample, the pattern does not change significantly upto nearly 50 days of storage period, after which there appears to be a rapid increase in the LMW components (Fig. 4). The rate of protein dissociation is much less in the initial 50 days of storage in the treated samples than the untreated samples. These results along with the drip loss data (Fig. 1) indicate that sodium citrate has a profound effect on the association-dissociation of shrimp proteins probably mediated through the water holding capacity.
Fig. 2-d shows the sedimentation pattern of the drips collected at 30 and 97 days storage period from which it is clear that both in the treated and untreated samples, the 2S fraction predominates in the drip fraction.
In order to find out whether these association-dissociation profiles are not mediated by proteolytic enzymes, the proteolytic activity of the shrimp extract was monitored as a function of storage. Over a period of 120 days, there is only a 0.75 per cent increase in the proteolytic activity of the system. However, at 150 days, nearly4.5 per cent of proteolytic activity was observed. These results indicate that probably proteolytic activity is not the only causative agent for the degradation of the protein in the shrimp. However, in some fish proteins, proteolytic enzymes are attributed to be the solely deteriorative cause.
The deterioration of fish proteins during frozen storage is reflected mainly by alterations that occur in the myosin-actomyosin system. Accelerated dénaturation of myosin has been reported in fish on the basis of ultracentrifugal analysis and electron photomicrographic studies14. However, the properties of cod actin did not change significantly during prolonged storage at -14°C15. The results observed here indicate that untreated shrimp proteins dissociate during storage at -20°C. These results are similar to those obtained by King16 where a rapid dissociation of F-actomyosin into G-actomyosin has been observed before the protein finally precipitates out. Similar results are obtained here with sodium citrate treated samples, but the rate of dissociation is slower. In Fig. 2-a (lower) is demonstrated-the-m vitro effect of sodium citrate on the dissociation of shrimp proteins when added directly after extraction.
These results can be explained by (n) partial dehydration during storage and (b) effect of inorganic salts. It is well known that the orientation of the water molecules around the protein is different from the rest of the water. During freezing, the surrounding water and the water-mediated hydrophobic/hydrophillic bonds which keep conformation of the protein intact are disrupted17,18.

2 4 6 JOURNAL OF FOOD SCIBNCB AND TECHNOLOGY, VOL. 2 4 , SEPT./OCT. 1987
Hence, in these protein fractions which are predominantly held by noncovalent interactions, freezing of water has a profound dissociative and/or denaturing effect. This inference is supported by the fact that a fully denatured and hydrated protein in a state of random coil is characterized by a high entropy value. The entropy of the surrounding water, however, is lower because of the ordering of its molecules induced by the hydration of all polar groups. On the other hand, inorganic salts affect proteins in frozen fish most probably by depressing the freezing point of tissue fluids, dehydration, by altering interfacial tension and by ionic interaction with charged groups of the side chains1. The characteristic capacity of ions to hydrate and interfere with water structures, makes the various salts at different concentrations exert specific influences on the conformation of proteins. Snow19 has shown that sodium chloride at low concentration has a protective effect against freezing-induced ‘denaturation’ of myosin. Other ions like calcium and magnesium can form ionic cross-linkage between polypeptide chains and hence involved in changes in protein conformations. Further, sodium chloride and calcium chloride also influence the hydrolysis of lipids2<> which in turn affects protein solubility. Based on these reports, it may be that sodium citrate can exert indirect action on freezing changes in proteins of shrimp. However, at the concentration used they are not capable of efficiently decreasing the amount of ice formed in the tissues at low temperatures21.
The sodium citrate treated shrimps were much better in their colour, flavour and texture than untreated samples in terms of glossyness, juiciness, taste and retention of their original shape9. These results are in agreement with in vitro screening tests, especially of sodium aspartate, malonate, maleate, malate, glycolate and sodium citrate which effectively prolonged the frozen storage fife of horse mackerel mince22. However, more information is needed on the extent of conformational changes of individual specific proteins upon freezing and storage and the effect of individual inorganic ions on the water structure and the relation of these parameters to the changes in texture and functional properties of shrimp meat, so that rational methods can be developed for better processing of shrimp/fish at low temperatures.
References
1. Sikorski, Z ., Olley, J. and Kostuch, S., Protein changes in Frozen Fish, C rit. Rev. F d Sci. N u tr ., 1976, 8, 97.
2. Dyer, W. J. and Dingle, J. R ., in Fish a s Food, by Botgstrom,G . (Ed) Academic Press, New York, 1961, 1 , 275.
3. Love, R . M ., in C ryobio logy , by Meryman, H . T ., (Ed),Academic Press, London, 1966, 317.
4. Connell, J. J., in L o w Tem perature B iology o f Foodstuffs byHowthorn 3. and Rolfe, E . J., (Ed), Pergamon Press, Oxford, 1968, 333.
5. Powrie, W. O., in L ow Tem pérature Preservation o f Foodsa n d L iving M a tter , by Fennema, O. R ., Powrie, W . D . and Marth, E. H ,, (Eds.), Marcel Dekker, New Yo rk, 1973, 6.
6. Year B ook o f F ishery S ta tis tic s , F A D , Rome, 1984, 57.
7. Mathews, A . D ., Park, G . R . and Anderson, E . M ., in,Advances in Fish Science an d Technology by Connell, J. J., (Ed.), Fishing News Books Ltd., 1980, 438.
8. Laird, W. M ., Mackie, I. M . and Hattula, T ,, in A dvancesin Fish Science and Technology by Connell, J. J., (Ed.), Fishing News Books Ltd., 1980, 428.
9. A nnual R eport, 19 8 1-82 and 1982-83. Central Food Technological Research Institute, Mysore, India.
10. Vogel, A . I. in M acro and Sem im acro Q u a lita tive InorganicA nalysis, Longmans Green and Co., London, 1953, 407.
1 1 . O fficial M ethods o f A nalysis, Association of Official AnalyticalChemists, Washington, D .C ., 1980.
12. Schachman, H . K ., in U ltracentrifugation in B iochem istry,Academic Press, New York, 1959
13. Wojtowicz, M , B. and Odense, P. H ., Comparative study ofthe muscle catheptic activity of some marine species. J. Fish. R es. Board. Can., 1972, 29, 85.
14. Buttkus, H ,, Accelerated dénaturation of myosin in frozensolution, J . F d S c i , 1970, 35, 558.
15. Connell, J. .1., Changes in the actin of cod fish duringstorage at - 1 4 ° . J. Sci. F d A gric ., 1960, 1 1 , 515.
16. King, F. J,, Ultracentrifugal analysis of changes in thecomposition of myofibrillar protein extracts obtained from fresh and frozen cod muscle. / . F d S c i., 1966, 3 1, 649.
17. Kuntz, 1. D . and Kauzatnanu, W., Hydration of proteins andpolypeptides. A dv. Protein Chetn., 1974, 28, 239.
18. Lewin, S., D isplacem ent o f W ater a n d Its C on tro l o f B iochem ical R eactions. Academic Press, London, 1974, 1.
19. Snow, J. M ., Proteins in fish muscle, I I I , Denaturation ofmyosin by freezing. J. Fish. R es. Board. C an., 1950, 7, 599.
20. Brockerhoff, H . and Jensen, R . G ., L ip o ly tic Enzym es,Academic Press, New York, 1974, 74.
2 1. Love, R . M . and Abel, G ., The effect of phosphate solutionson the denaturation of frozen cod muscle. J . F d Tecknol., 1966, 1 , 323.
22. Noguchi, S., Shinouda, E . and Matsumoto, J. J., Studieson the control of denaturation of fish muscle proteins during frozen storage—V . Technological application of eryoprotective substances on the frozen minced fish meat. Bull. Jap. Soc. sci. Fish., 1975, 41, 779.

Study of Pectolytic Factors and Processing in Relation to Rheological Characteristics of Tomato Juice
U p a s a n a R. B h a s in a n d G. S. B a in s
Department of Food Science and Technology, Punjab Agricultural University,Ludhiana-141 004, India
R e c e iv e d 2 2 S e p te m b e r 1986; re v ise d 2 7 D e c e m b e r 1986
The effect o f processing conditions on the pectolytic factors and rheological properties o f juice o f two commercially, grown cultivars o f tomatoes, ‘Pb. C hhuhara’ and ‘Pb. Kesri’, was studied. The high viscosity o f hot break tom ato juice was related to its high pectin content and the nature o f pectin. W ater soluble pectin was the predominant fraction in juice. Gel filtration studies o f soluble pectin showed th a t more o f the higher molecular weight fraction was retained in the hot break juice than the control. The methoxyl content o f serum pectin in hot b reak juice was higher than in cold break. Differences in electrophoretic pattern o f cold vs bot break juice soluble pectin were also observed. Effect o f long term storage on the elution profile and electrophoretic mobility o f pectin fractions is described.
The pectin components and the associated enzymes in tomato are highly important factors which determine processing and possible innovations to be introduced for obtaining juice of consistent commercial quality. Inactivation of pectic enzymes by the hot break process yielding a high viscosity juice has been reported by several Workers1-4. Xu et al.5 observed a relationship between microstructure and rheological properties of tomato juice. Differences in molecular weight and changes of pectic substances of two cultivars of tomato have been reported by Stein and Brown6.
The purpose of this investigation was to study the integrated effects of pectolytic changes in relation to rheological characteristics of cold vs hot break tomato juice of two extensively grown cultivars, ‘Pb. Chhuhara’ and ‘Pb. Kesari’ as a corollary to the extraction of viable seed of the new cultivars and utilizing the juice as a byproduct.
M aterials and M ethodsRipe tomatoes of ‘Pb. Chhuhara’ and ‘Pb. Kesri’
cultivars obtained from a local farm were graded according to size, ripening, freedom from damage and blemishes.
Processing: To enable recovery of viable seed, the juice was extracted by mechanically pressing 30 to 40 kg lots of tomatoes in a pulper (Rayions Metal Works, Bombay) twice, using 1mm sieve. The extract was brought to near boiling in a steam jacketed kettle for 5 min filled hot in glass bottles (700 ml capacity), crown corked
and processed in boiling water for about 55 min. Another portion of the juice was homogenized at 65 °C/ 1000 psi, followed by boiling and bottling as above.
For hot pressing, tomatoes were crushed mechanically, immediately transferred to a steam jacketed kettle and brought to near boiling for 5 min before passing through the pulper twice, boiled and filled hot. A second portion of the juice was homogenized before bottling and processed as above. Bottles of juice were kept under ambient summer and winter conditions.
Composition: Proximate composition of tomato juice and reducing sugars were determined using the AOAC methods7. Tannins were estimated by the colorimetric method8 using Folin-Denis reagent. Lycopene was determined according to Adsule and Dan9. Colour was also determined using the Universal Lovibond Tintometer (Associated Instrument, Mfg., India) and expressed in Yellow (Y), Red (R) and Blue (B) Tintometer Units (TU).
Pectinesterase assay: The enzyme extract was prepared according to Al-Delaimy and Ali16 and the assay carried out according to Lineweaver and Jansen11 using pure pectin substrate (Loba-Chemie Indoaustranal Co. Bombay) and Hinton’s indicator12. The activity was expressed as the amount of enzyme which produced one milliequivalent of ester hydrolysed/min/g of sample (PE, pig).
Pectic fractions: Four pectic fractions present in tomato juice were determined by adopting sequential extraction in distilled water, 0.2 per cent ammonium
82 4 7

248 JOURNAL OF FOOD SCIENCE AND TECHNOLOGY, VOL. 24 , SEPT./OCT. 1 9 8 7
oxalate, 0.05 N HC1 and 0.05N NaOH13. The pectin content in each fraction expressed on juice weight basis was quantified by using the carbazole method of Mc- Comb and McCready14.
Equivalent weight and methoxyl content of soluble pectin were determined according to methods of Owens et al.xs and Stier et a/.16, respectively.
Gel filtration: An accurately measured aliquot (0.3 ml) containing about 800 fig of demethoxylated soluble pectin with pH adjusted to 5.5, was eluted with distilled water using a Sephadcx G-200 column (0.9 X 30 cm) and a flow rate of 5 ml/hr according to Stein and Brown6. Pectin in the fractions (1 ml) was quantified by using the carbazole method14. Elution profiles were established by plotting the absorbance at 520 nm against elution volume (Ve).
Electrophoretic studies: Electrophoresis was carried out in 7.5 per cent polyacrylamide gels prepared essentially as prescribed by Davis17 and set in 75 mm long glass tubes with 4 mm inner diameter. The electro- pherograms, were developed according to Do et a/.18 and stained by using periodic-fuschin-sulfite method19.
Rheological characteristics: Rheotest 2 viscosimeter (VEB MLW Prufgerate-Werk, Medingen, Sitz, Freital) with S/Si coaxial cylinder system and an ascending and descending range of shear rates (3-1312s-1), was used to characterize the flow behaviour of tomato juice.
Apparent viscosity (x\a) was calculated by dividing shear stress values ( t , dynes cm-2) by shear rate (Ds-1) and expressed in centipoise (cp). The relationship bet
ween log T\a and log Ds-1 was developed. Effect of processing on the rheological parameters of Power Law26, Casson’s21 and Michaels and Bolger22 models, was evaluated.
Results and DiscussionThe yield of the juice was higher for both the varieties
of tomatoes when pressed hot, the recovery being 86.6 to 86.8 per cent as compared to 78.6 to 84.3 per cent of juice by the cold extraction method. While evaluating 12 varieties of tomatoes including ‘Pb. Kesri’, Singh et al.2i reported a juice yield of 46.5 to 56.0 per cent which seemed very low. Much higher yields of tomato juice were obtainable by using appropriate equipment24-26.
Effect o f variety and processing on composition o f juice: On hot extraction, the juice had 15 per cent higher total soluble solids (TSS) content. Homogenization of cold extracted juice also increased the TSS by 12 per cent. The juice of ‘Pb. Kesri’ was more acidic than that of ‘Pb. Chhuhara’. The pulp content of cold pressed juice was considerably less than that of hot pressed juice (Table 1). The cold pressed juice of ‘Pb. Kesri’ tomatoes, however, contained 15 per cent more pulp than that of ‘Pb. Chhuhara’ juice.
The TSS of a commercial juice included for comparison was considerably more than that of the pure tomato juice of both the varieties and was found to be due to added sugar. The amount of reducing sugars in the commercial juice was nearly twice that of the natural
Table 1. effect of variety and processing on the composition of tomato juice
Processing methods Total Pulp Acidity Red.sugars Tannins* Lycopene Colour (Tintometer units)soluble solids (as C A as dextrose (mg/100g) ( f i g/g) —----------------— -------------------------
(°Brix) ( % ) % ) ( % ) Red Yellow Blue
Pb. Chhuhara
Cold break 4.0 0.54 0.42 2.52 32.0 5.30 21 10 0.3
Cold break-H 4.5 0.58 0.54 3.10 27.2 5.07 23 10 0.4
Hot break 5.0 0.77 0.49 2.91 32.0 5.19 23 10 0.7
H ot break-H 5.0 0.78 0.51 3.20 31.2 5.19 25 10 0.4
Pb. Kesri
Cold break 4.0 0.62 0.67 2.27 27.2 2.88 19 10 1.0Cold break-H 4.5 0.62 0.63 2.70 22.4 2.76 20 10 1.0H ot break 5.0 0.76 0.67 2.47 31.4 2.59 19 10 1.0Hot break-H 5.0 0.70 0.63 3.06 25.6 2.54 20 10 1.0Commercial 9.5 0.80 0.67 6.10 41.6 1.30 18 12 —
Least sig. diff. (0.01) — — ■ — — — 1.25 12 — —
H : Homogenized, C A : C itric acid, * As tannic acid.
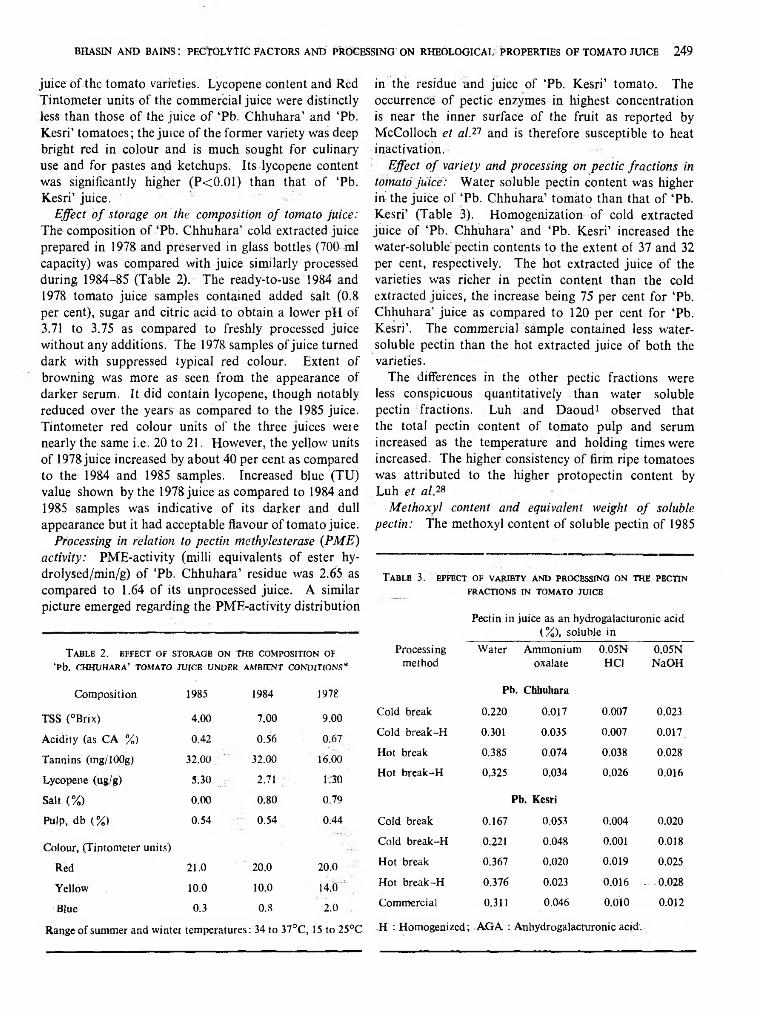
BHASIN AND BAINS: PECT0LYT1C FACTORS AND PROCESSING ON RHEOLOGICAL PROPERTIES OF TOMATO JUICE 249
juice of the tomato varieties. Lycopene content and Red Tintometer units of the commercial juice were distinctly less than those of the juice of ‘Pb. Chhuhara’ and ‘Pb. Kesri’ tomatoes; the juice of the former variety was deep bright red in colour and is much sought for culinary use and for pastes and ketchups. Its lycopene content was significantly higher (P<0.01) than that of ‘Pb. Kesri’ juice.
Effect o f storage on the composition o f tomato juice: The composition o f ‘Pb. Chhuhara’ cold extracted juice prepared in 1978 and preserved in glass bottles (700 ml capacity) was compared with juice similarly processed during 1984-85 (Table 2). The ready-to-use 1984 and 1978 tomato juice samples contained added Salt (0.8 per cent), sugar and citric acid to obtain a lower pH of 3.71 to 3.75 as compared to freshly processed juice without any additions. The 1978 samples of juice turned dark with suppressed typical red colour. Extent of browning was more as seen from the appearance of darker serum. It did contain lycopene, though notably reduced over the years as compared to the 1985 juice. Tintometer red colour units of the three juices weie nearly the same i.e. 20 to 21. However, the yellow units of 1978 juice increased by about 40 per cent as compared to the 1984 and 1985 samples. Increased blue (TU) value shown by the 1978 juice as compared to 1984 and 1985 samples was indicative of its darker and dull appearance but it had acceptable flavour of tomato juice.
Processing in relation to pectin methylesterase (PME) activity: PME-activity (milli equivalents of ester hy- drolysed/min/g) of ‘Pb. Chhuhara’ residue was 2.65 as compared to 1.64 of its unprocessed juice. A similar picture emerged regarding the PME-activity distribution
T able 2. bffect of storage on the composition of‘Pb. CHHUHARA’ TOMATO JUICE UNDER AMBIENT CONDITIONS*
Composition 1985 1984 1978
TSS (°Brix) 4.00 7.00 9.00
Acidity (as C A % ) 0.42 0.56 0.67
Tannins (mg/IOOg) 32.00 32.00 16.00
Lycopene (ug/g) 5.30 2.71 1.30
Salt ( % ) 0.00 0.80 0.79
Pulp, db ( % ) 0.54 0.54 0.44
Colour, (Tintometer units)
Red 21.0 20.0 20.0
Yellow 10.0 10.0 14,0
Blue 0.3 0.8 2.0
Range of summer and winter temperatures : 34 to 37° C , 15 to 2 5 °C
in the residue and juice of ‘Pb. Kesri’ tomato. The occurrence of pectic enzymes in highest concentration is near the inner surface of the fruit as reported by McColloch et al.21 and is therefore susceptible to heat inactivation.
Effect o f variety and processing on pectic fractions in tomato juice: Water soluble pectin content was higher in the juice of ‘Pb. Chhuhara’ tomato than that of ‘Pb. Kesri’ (Table 3). Homogenization of cold extracted juice of ‘Pb. Chhuhara’ and ‘Pb. Kesri’ increased the water-soluble pectin contents to the extent of 37 and 32 per cent, respectively. The hot extracted juice of the varieties was richer in pectin content than the cold extracted juices, the increase being 75 per cent for ‘Pb. Chhuhara’ juice as compared to 120 per cent for ‘Pb. Kesri’. The commercial sample contained less water- soluble pectin than the hot extracted juice of both the varieties.
The differences in the other pectic fractions were less conspicuous quantitatively than water soluble pectin fractions. Luh and Daoud1 observed that the total pectin content of tomato pulp and serum increased as the temperature and holding times were increased. The higher consistency of firm ripe tomatoes was attributed to the higher protopectin content by Luh et a l2S
Methoxyl content and equivalent weight o f soluble pectin: The methoxyl content of soluble pectin of 1985
Table 3. effect of variety and processing on th e pbctinFRACTIONS IN TOMATO JUICE
Pectin in juice as an hydrogalacturonic acid ( % ) , soluble in
Processingmethod
Water Ammoniumoxalate
0.05N-H C 1
0.05NN aO H
Pb. Chhuhara
Cold break 0.220 0.017 0.007 0.023
Cold break-H 0.301 0.035 0.007 0.017
Hot break 0.385 0.074 0.038 0.028
Hot break-H 0.325 0.034 0.026 0.016
Pb. Kesri
Cold break 0.167 0.053 0.004 0.020
Cold break-H 0.221 0.048 0.001 0.018
Hot break 0.367 0.020 0.019 0.025
Hot break-H 0.376 0.023 0.016 - 0.028
Commercial 0.311 0,046 0.010 0.012
H : Homogenized; A G A : Anhydrogalacturonic acid.

250 JOURNAL OP FOOD SCIENCB AND TECHNOLOGY, VOL. 24, SEPT./OCT. 1987
crop cold extracted juice of ‘Pb. Kesri’ and ‘Pb. Chhuhara’ was 6.2 and 10.4 per cent as compared to11.0 and 10.0 per cent of the respective hot extracted juice. Soluble pectin in the 7-year old cold extracted juice of ‘Pb. Chhuhara’ tomato showed a high methoxyl content of 14.1 per cent as compared to 10.2 and 10.4 per cent of 1984 and 1985 juices, respectively. The equivalent weight of the pectin of hot extracted ‘Pb. Kesri’ juice was 728 as compared to 1041 of ‘Pb. Chhuhara’. The equivalent weight of the pectins in cold extracted juice of both the varieties was considerably more (ranging 1238 to 1439) than that of the hot extracted juice pectins which was attributed to the presence of higher molecular weight pectin fractions resistant to degradation.
Effect o f storage on changes in pectin fractions: Water soluble pectin in the juice decreased considerably during storage. The pectin content of 1 year old juice was 0.174 per cent as compared to 0.220 and 0.101 per cent of the fresh and 7 years old juice, respectively. The ammonium oxalate soluble fraction in the long stored juice was0.037 per cent which was double that of 1984 and 1985 samples. There was also a decrease from 0.028 to 0.009 per cent in the alkali soluble pectin fraction with storage.
Gelfiltration profiles o f pectin: There were two major fractions of pectin in the serum of juice prepared by cold and hot extraction methods (Fig. 1). The hot extracted juice o f ‘Pb. Chhuhara’ contained 24.1 per cent of higher molecular weight pectin fraction as compared to 16.6 and 15.5 per cent in the cold extracted juice prepared during 1978 and 1985, respectively. Similarly, hot
Fig . 1. Effect o f cold vs ho t b reak o n th e pectin e lu tion profile o f Pb. C hhuhara tom ato juice
extracted juice of ‘Pb. Kesri’ contained 29.2 per cent of higher molecular weight fraction as compared to 16.5 per cent for the cold extracted juice. Lower molecular weight pectin fraction was predominant in the cold extracted juice of both the varieties and this would partly account for higher viscosity of hot extracted tomato juice.
Electrophoretic pattern o f soluble pectin: A major band of pectin common to all juices was located in proximity to the site of loading the samples (Fig. 2). This was also observed by Stein and Brown6 in their studies on the electrophoresis of water soluble pectin fraction in alcohol insoluble solids (AIS) of tomatoes. Another common major band of pectin which migrated to a distance of 7 to 12 mm from the origin was observed. One or two minor bands were observed in between these two major bands depending on the variety or period of storage of tomato juice.
The cold extracted juice of ‘Pb. Chhuhara’ (1984 and 1985) showed the presence of three distinct pectin bands. From the pectin of 1978 juice, the minor band was missing. The distance travelled by the second pectin band of the hot extracted juice of ‘Pb. Chhuhara’ varied from 1.2 to 2.0 mm as compared to 9.5 mm of the ‘Pb. Kesri’. There was no third pectin band in the hot extracted juice of ‘Pb. Kesri’ unlike the ubiquitous presence of this band in the cold extracted juice of both the varieties and the hot extracted juice o f‘Pb. Chhuhara’. There were only two major pectin bands in the 1978 juice of ‘Pb. Chhuhara’ tomato.
Apparent viscosity: The log-log relationship of apparent viscosity vs shear rate over the range of 16 to 730s-1 was linear. Shear thinning of the tomato juice occurred with increasing shear rate. On homogenization, apparent viscosities (100s-1) of cold break juice of ‘Pb. Chhuhara’ and ‘Pb. Kesri’ tomatoes showed an increase from 39.5 to 52.0 cp and 32.0 to 58.0 cp, and of hot break juice from 74.0 to 84.0 cp and 66.0 to 82.0 cp, respectively. Settling of cold break juice was effectively reduced by homogenization.
Rheological characteristics: The values for the flow behaviour index ‘n’ computed from the slope of log-log plots of shear stress vs shear rate according to power law26 were< 1 which was indicative of the pseudoplastic nature29 of tomato juice (Table 4). Neither the Variety of tomato nor the method of juice extraction had any significant effect on values for ‘n’. The values for consistency coefficient ‘K’ were affected notably by the method of juice extraction. However, the effect of tomato variety on this parameter was minimal. Homogenization of cold extracted juice of ‘Pb. Chhuhara’ and ‘Pb. Kesri’ tomatoes increased the ‘K’ values by 15.1 and 46.1 per cent, respectively. There was a notable increase in the ‘K’ values of hot extracted juice of the

BHASIN AND BAINS: PECTOLYTIC FACTORS AND PROCESSING ON RHEOLOGICAL PROPERTIES OF TOMATO JUICE 251
Fig. 2a. Polyacrylamide gel electropherograms of soluble pectin in ‘Pb. Chhuhara’ 1985 juice
1. Cold break, 2. Hot break, 3. Cold break + Urea,4. Hot break -t- Urea.
Fig. 2b. Phlyacrylamide gel electropherograms of soluble pectin in ‘Pb. Chhuhara’ cold break stored juice
1. 1984, 2. 1978, 3. 1984 + Urea, 4. 1978 + Urea.
varieties as compared to that of cold extracted juice. On homogenization, the ‘K ‘ values further increased by31.3 and 18.5 per cent, respectively.
C asson 's y ie ld value: The effect of processing on the Casson’s22 yield ( t o c ) values of tomato ju ice was perceptible. The values for hot extracted ju ice of ‘Pb. Chhuhara’ and ‘Pb. K e sri’ tomatoes increased by 97.3 and78.3 per cent, as compared to the respective values of22.1 and 23.0 dynes cm-2 for the cold extracted juices. Homogenization also increased the yield values of juice but the effect of hot break method of juice extraction was more pronounced (Table 4).
M ich a e ls a n d B o lger m o d el p a ra m eters: The values for shear stress (rc r) necessary for bieaking of aggregates of particles in the hot break ju ice of ‘Pb. Chhuhara’ increased to the extent of 90.9 per cent as compared to cold break juice. A further increase of 30.9 per cent was
obtained by homogenization as compared to 19.1 per cent for a sim ilar juice of ‘Pb. K e sri’. Fo r viscous flow, the magnitude of shear stress ( t v ) was nominal as compared to the values foi the destruction of net work (rn ) and the breaking of aggregates ( t c t ) in the juice system, respectively (Table 4).
Besides tomato cultivar, the break temperature and mechanical factors of juice extraction considerably affected the viscosity30 of tomato juice. W ith prolonged higher break temperatures, reduction in ju ice consistency has been attributed to pectin degradation31. Pectolytic factors and the particulate nature of suspended pulp determine largely the body of tomato juice.
AcknowledgementGrateful acknowledgement is expressed to the Indian
Council of Agricultural Research ( IC A R ), New Delhi for the award of Sr. Research Fellowship to Upasana R . Bhasin.

252 JOURNAL OF FOOD SCIENCE AND TECHNOLOGY, VOL. 2 4 , SEPT./OCT. 1987
T a b l e 4 . e f f e c t o f v a r ie t y a n d p r o c e s s in g o n t h e r h e o l o g ic a l p a r a m e t e r s o f t o m a t o ju ic e
Processing methodPower law Casson’s model Michaels and Bolger model
n K TO C Tn Ter Tv
Cold break 0.162 27.8
Pb. Chhuhara
22.1 22.0 0.023
Cold break-H 0.168 32.0 26.0 24,0 24.0 0.029
Hot break 0.175 45.0 43.6 40,0 42.0 0.017
Hot break-H 0.176 59.1 50.4 50.0 55.0 0.029
Cold break 0.191 26.0
Pb, Kesri
23.0 20,0 0.010
Cold break-H 0.171 38.0 34.8 28.0 36.0 0.017
Hot break 0.205 42.6 41.0 42.0 42.0 0.017
Hot break-H 0.167 50.5 45.0 48.0 50.0 0.053
Commercial juice 0.242 31.5 29.2 — 38.5 0.023
H : Homogenized Tn : Shear stress for destruction of net work, dynes enr2n : Flow behaviour index T e r : Shear stress for breaking of aggregates, dynes cm-2K : Consistency coefficient, dynes sec" cm'2 T V : Shear stress for viscous flow, dynes sec” cm'2TO C : Yield value, dynes cm"2
References1. Luh, B. S. and Daoud, H. N., Effect of break temperature
and holding time on pectin and pectic enzymes in tomato pulp. J. Fd Sci., 1971, 36, 1039.
2. Sherkat, F. and Luh, B. S., Quality factors of tomato pastesmade at several break temperatures. J. Agric. Fd Chern., 1976, 24, 1155.
3. Sherkat, F. and Luh, B. S., Effect of break temperature onquality of paste, reconstituted juice and sauce made from M-32 tomatoes. J, Inst. Can. Sci. Technol. Aliment, 1977, 10, 92.
4. Fonesca, H. and Luh, B. S., Effect of break temperature onquality of tomato juice reconstituted from frozen tomato concentrates. J. Fd Sci., 1976, 41, 1308.
5. Xu, Shi-Ying., Shoemaker, C. F. and Luh, B. S., Effect ofbreak temperature on rheological properties and microstructure of tomato juices and pastes. J. Fd Sci., 1986, 51, 399.
6. Stein, E. R. and Brown, H. F.., Gel filtration and disc gelelectrophoresis of tomato pectic substances. J. Agric. Fd Client., 1975, 23, 526.
7. Methods of Analysis, Association of Official AnalyticalChemists, Washington, D.C., 1980, 13th Edn.
8. Ruck, J. A., Chemical Methods for Analysis of Fruit andVegetable Products. Canada Dept. Agric., Summerland, B. C., 1963, 44.
9. Adsule, P. G. and Dan, A., Simplified extraction procedurein the rapid spectrophotometric method for lycopene estimation in tomato. J. Fd Sci. Technol., 1979, 16, 216.
10. Al-Delaimy, K. S. and Ali, S. H., Pectinesterase extractionfrom Sherabi apples. J. Sci. Fd Agric., 1969, 20, 660.
11. Lineweaver, H. and Jansen, E. F., Pectic enzymes. Adv.Enzymol., 1951, 2, 267.
12. Hinton, C. L., Fruit Pectins, Their Chemical Behaviour andJellying Properties, Chemical Pub. Co., New York, 1940, 27.
13. Brown, H. W. and Stein, E. R., Studies on the alcohol-insoluble solids of Chico III and Homestead-24 tomatoes. J. Agric. Fd Chem., 1977, 25, 790.
14. McComb, E. A. and McCready, R. M., Colorimetric determination of pectic substances. Analyt Client., 1952, 24, 1630.
15. Owens, H. A., McCready, R. M., Shepherd, A. D., Schultz,E. L., Pippen, H. A., Swenson, J. C., Miers, R. F., Erland- son, R. F., and Maclay, W. D., Methods used at Western Regional Research Laboratory for Extraction and Analysis of Pectic Materials, Bureau of Agricultural and Industrial Chemistry, ARA, USDA, 1952, 7.
16. Stier, E. F., Ball, C. O. and Maclinn, W. A., Changes inpectic substances of tomatoes during storage. Fd Technol., 1956, 9, 39.
17. Davis, B. J., Disc-electrophoresis-2, Method and Application to Human Serum Proteins. Ann. N. Y. Acad. Sci., 1964, 121, 404.
18. Do, J. Y., loannou, J. and Haard, N. F., Polyacrylamide gelelectrophoresis of pectic substances. J. Fd Sci., 1971, 36, 1137.
19. Zacharius, R. M., Zell, T. E., Morrison, J. H. and Woodlock,J. J., Glycoproteins staining following electrophoresis on acrylamide gels. Analyt. Biochem., 1969, 30, 148.

BEYNEN e t al. : INHIBITORY e f f e c t o n l it h o g e n e s is b y in g e s t io n o f a curcuma m ix t u r e 253
20. Harper, J. C. and El. Sahrigi, A. F., Viscometric behaviourof tomato concentrates. J. Fd Sci., 1965, 30, 470.
21. Casson, N., A flow equation for pigment oil suspensions ofthe printing ink type in Rheology in Disperse System, Pargamon, Oxford, 1959, 84.
22. Duran, L. and Costell, E., Rheology of apricot puree:Characterization of flow. J. Texture Stud., 1982, 13, 43.
23. Singh, B. K., Ray, P. K. and Mishra, K. A., Biochemicalcomposition of tomato in relation to maturity on the vine. Indian FdPackr., 1983, 37, 72.
24. Moyer, J. C., Robinson, W., Ransford, J. R.. Labelb, R. L-and Hand, D. B., Processing conditions affecting the yield of tomato juice. Fd Technot., 1959, 13, 270.
25. Sidhu, J. S., Jain, V. K. and Bains, G. S., Effect ot processingon tomato juice quality and ascorbic acid content. Res. bid. India, 1974, 19, 155.
26. Singh, K. K. and Bains, G. S., Technology for seed extraction
and by product-utilization of tomato and water melon. Punjab Hort. J., 1981, 21, 123.
27. McColloch, R. J., Keller, G. J. and Beavens, E. A., Factorsinfluencing the quality of tomato products. 1. surface- localized pectic enzymes inactivated by blanching. Fd Technol., 1952, 6, 197.
28. Luh, B. S., Villarreal, F., Leonard, S. J. and Yamaguchi, M.,Effect of ripeness level on consistency of canned tomato juice. Fd Technol., 1960, 14, 635.
29. Muller, H. G., An Introduction to Food Rheology, WilliamHeinemann Ltd., Heinemann, London, 1973, 64.
30. Bel-Haj, H. M., Effect of Cultivars, Break Temperature,Pulping and Extraction Methods on the Viscocity o f tomato Juice, 1981, Ph.D. Dissert., Ohio State University, Columbus
31. Doesburg, J. J., Pectic Substances in Fresh and PreservedFruits and Vegetables, I.B.V.T. Commun. 25. Inst, of Research on Storage and Processing of Horticultural Produce, Wageningen, Netherlands, 1965, 122.
Inhibitory Effect on Lithogenesis by Ingestion of a CurcumaMixture (Temoe lawak SingerR)
A. C. Beynen*Department of Laboratory Animal Science, State University, P.O. Box 80.166, 3508 TD Utrecht
Department of Human Nutrition, Agricultural University, De Dreijen 12, 6703 BC, Wageningen, The NetherlandsJ. J. V isser
Laboratory of Experimental Surgery, Free University Hospital,P.O. Box 7057, 1007 MB Amsterdam, The Netherlands
andJ. A. Schouten
Department of Internal Medicine, Free University Hospital,P.O. Box 7057, 1007 MB Amsterdam, The Netherlands
Received 22 September 1986; revised 2 March 1987
Rabbits were fed high-cholesterol diets without o r with 0.1 or 1.0% (w/w) o f a Curcuma m ixture ( T em o e L a w a k
Singer®), which consisted of an ex tract o f the roots o f Curcuma aromatica rhizoma and whole roots o f Curcuma amara rhizoma and Rhamni purshianae cortex. After 28 days, the Curcuma m ixture had not influenced the concentrations o f cholesterol in serum and plasma. The Curcuma m ixture partly counteracted the increase in lithogenic index o f bile seen after cholesterol feeding. I t is suggested th a t the Curcuma m ixture under study could be o f value in the prevention o f recurrence o f cholesterol gallstone formation.
Mixtures and extracts of the roots of Curcuma species are widely used as cholerectic and cholagoguic drugs. Experiments have been performed in order to identify the components responsible for the increase in bile flow caused by Curcuma prepaiations. It became clear that both the so-called etherical oil components and the
curcuminoids cause an increase in bile flow and changes in bile composition1-6. It could be suggested that Curcuma preparations affect lithogenicity of bile. The objective of the present study was to find out whether a Curcuma mixture consisting of the extracts of roots of Curcuma aromatica rhizoma, Curcuma amara rhizoma
*To whom correspondence should be addressed.

254 ■ JOURNAL OF FOOD SCIENCE AND TECHNOLOGY, VOL. 24 , SEPT./OCT. 1987
and Rhamni purshianae cortex would counteract the increase in lithogenicity of the bile fluid of rabbits seen after cholesterol feeding. In the Netherlands, this Curcuma preparation is marketed as a cholerectic drug.
Materials and MethodsRandom-bred, male rabbits of the New Zealand White
strain were obtained fiom the Broekman Institute, Helmond, The Netherlands. The animals were fed a commercial rabbit diet (Hope Farms, Woerden, The Netherlands). All rabbits were kept individually in cages with mesh bases constructed of galvanized steel in a room with controlled lighting (14 hr/day), constant temperature (16-20°C) and relative humidity (55-65 per cent).
At day O of the experiment, when they were aged about 4 months, the rabbits were divided into 4 groups, consisting of 8 animals each. The groups were formed so that the distributions of serum cholesterol concentration and body weight were similar. The rabbits were transferred to semipurified diets for a period of 4 weeks. The composition of the cholesterol-free, control diet was as follows (per cent, w/w): casein, 21 corn starch, 17; dextrose, 21; molasses, 5; corn oil, 1; coconut fat, 9; sawdust, 18; dicalciumphosphate, 2.9; sodium chloride, 0.6; magnesium carbonate, 0.3; magnesium oxide, 0.2; potassium bicarbonate, 1.8; vitamin premix, 1.2; mineral premix, 1.0. The composition of the vitamin and mineral premixes has been described7. The three cholesterol- enriched diets contained 0.1 per cent (w/w) of cholesterol, which was added at the expense of the dextrose component. Two cholesterol-rich diets also contained Temoe Lawak SingerR, RVG 08637 (The Singer Import b.v., Leusden, The Netherlands), either at a level of 0.1 or 1.0 per cent (w/w). Temoe Lawak Singer11, which was added at the expense of the dextrose component, consisted of 75 per cent of extract from the roots of Curcuma aromatica rhizoma, 12 per cent of whole roots of Curcuma amara rhizoma, 4 pet cent of whole roots of Rhamni purshianae cortex and 9 per cent of sucrose. The analysed content of curcumin and etherical lipids of this mixture was 0.74 and 2.34 per cent, respectively All diets were in pelleted form. Food was provided each day at 09.00 hr on a restricted basis, the animals receiving 70 g/day. Most rabbits consumed all their food within 4 hr. Tap water was available ad libitum.
Body weight of the animals was recorded at the beginning, day 14 and at the end of the experiment. Samples of blood were taken between 08.00 and 10.00 hr after the removal of any remaining food at 16.00 hr the previous day. Blood was taken from a marginal ear vein into tubes without anticoagulant; serum was prepared by low speed centrifugation. Cholesterol in serum was measured enzymatically using the kit (Mono
test) supplied by Boehringer-Mannheim GmbH, FRG. At the end of the experiment, the rabbits were killed by cervical dislocation. The livers were rapidly removed, the gall bladder was excised and the bile was collected. Liver wet weight was determined as liver without gallbladder and bile. Liver cholesterol was extracted and analysed according to Abell et als. Biliary lipids were analysed as described earlier9 and the lithogenic index calculated using the formula of Thomas and Hofmann19 and data of Hegardt and Dam11 and Holzbach et a!12.
Results and DiscussionTable 1 documents that the experimental diet had no
differential effect on body weight of the rabbits. The feeding of cholesterol at a level of 0.1 per cent (w/w) of diet caused a significant increase in serum total cholesterol, the increase being about 3-told after 28 days. Temoe Lawak Singer® at either 0.1 or 1.0 per cent of diet did not influence the cholesterol-induced rise in serum cholesterol (Table 1). This contradicts the results obtained in a study with rats13. In this study, 1.0 per cent of Temoe Lawak Singer® in the diet completely counteracted the increase in serum cholesterol seen after cholesterol loading. Subba Rao et alM reported that curcumin, the active principle of turmeric, also nullified the dietary-cholesterol-induced increase in serum cholesterol concentrations in rats. It should be noted that in this study14 using rats the concentration of curcumin in the diet was about 100-fold higher than that in the present study with rabbits. Nevertheless, there might be a difierence between rats and rabbits with respect to their response of serum cholesterol to curcumin or a Curcuma mixture.
Cholesterol feeding did not affect liver wet weight. The Curcuma mixture tended to cause an increase in liver weight, an effect that reached statistical significance at the lowest dose (0.1 per cent). As would be anticipated9 the consumption of cholesterol produced a significant increase in liver cholesterol (Table 1). The Curcuma mixture did not influence the cholesterol- induced increase in liver cholesterol concentration. Again, there appears to be a discrepancy between rabbits and rats in their response of liver cholesterol concentration to curcumin. Both Subba Rao14 and ourselves13 have reported that curcumin and a Curcuma mixture, respectively, partially counteracted the increment in liver cholesterol in rats seen after cholesterol loading.
Dietary cholesterol caused a significant increase in biliary cholesterol concentration, whereas the concentrations of phospholipids and bile acids in the bile were not affected (Table 1), in conformity with oui earlier work9.
The addition of the Curcuma mixture to the cholesterol-enriched semi-purified diet did not significantly

BEYNEN e t a l . : INHIBITORY EFFECT ON LITHOGENESIS BY INGESTION OF A CURCUMA MIXTURE 255
T a b l e 1. p l a s m a l ip id s , l iv e r c h o l e s t e r o l a n d b il ia r y l ip id s in r a b b it s f e d h i g h - c h o l e s t r o l d ie t s w i t h o r w it h o u t
A CURCUMA MIXTURE
Dietary cholesterol/Dietary Curcuma mixture (%/%)0/0 0.1/0 0.1/0.1 0.1/1.0
Body weight (kg)Day 0 2.66±0.19 2.67±0.10 2.66±0.16 2.65±0.16Day 28 2.82±0.10 2.83±0.10 2.88 ±0.20 2.84±0.10
Serum cholesterol (mmol/1)Day 7 1.21 ±0.22 1.23 ±0.22 1,18±0.20 1.19 ±0.23Day 14 1.90±1.09 3.01 ±0.83“ 3.17±1.06 3.65 ±1.66Day 28 2.03±1.22 6.40 ±4.08“ 6.45±2.71 6.99 ±3.33
Liver wet wt (g) 98 ± 1 2 91 ± 12 107 ±8» 103 ± 18Liver cholesterol (/ttmol/g) 6.4 ±0.7 11.6±2.2“ 10.9±2.8 11 .8±2 6
Biliary lipids (mn:ol/l)cholesterol 4.5±0.4 5.9±0.9“ 5.1 ±0.7 5.5 ± 0 .9phospholipids 12.0 ±4 .2 J1.0±3.8 12.7±4.3 15.8±6.3bile acids 175± 9 186± 11 181 ± 19 168 ± 32
Lithogenic index of bile 0.67±0.10 0.86±0.13° 0.74 ±0.07* 0.79±0.20
Results are means ± SD for 8 animals per group. Values for liver wt, liver cholesterol and biliary lipids refer to the end (Day 28) of the experiment. “p<r0.05, versus cholesterol-free diet; ftp<0.05, versus high-cholesterol diet without Curcuma mixture. All rabbits were fed a commercial diet until day 0 of the experiment, and were then transferred to the semi- purified, experimental diets.
alter the biliary concentrations of lipids. However, the Curcuma mixture tended to reduce the concentration of biliary cholesterol. Such an effect was also observed when bile was collected from rats which had been fed a diet containing curcumin for 4 weeks6. In the same experimental design, however, curcumin caused a pronounced increase in the concentration of bile acids in bile6.
Cholesterol feeding markedly elevated the lithogenic index of bile. An increase in the lithogenic index reflects an enhanced risk for the precipitation of cholesterol stones in the bile. Temoe Lawak SingerR partly counteracted the increase in lithogenic index, the effect being statistically significant at the lowest dose (0.1 per cent). At the level of 1.0 per cent of diet, the Curcuma mixture also caused a decrease in the lithogenic index, but this effect did not reach statistical significance because of the relatively large inter-individual variation, as indicated by the high standard deviation (Table 1). In the lowest dose group, the rabbits ingested only about 25 mg of Temoe Lawak SingerR/kg body weight/day. Assuming that rabbits and humans are equally responsive, this would be equivalent to about 1.75 g/day for humans. In practice, the use of such a dose is feasible.
In conclusion, it is suggested that Temoe Lawak Singer11, which is widely used because of its cholerectic
action, may be of value in the prevention of recurrence of gallstone formation.
AcknowledgementThanks are due to A. G. Lemmens, A. M. Fielmich-
Bouman and K. van Ettinger for expert analytical assistance, and J. A. Ditmars for typing this manuscript.
References1. Kalk, H. and Nissen, K., Untersuchungen über die wirk
samen Stoffe der Curcuma (Temoelavac) und ihren Einfluss auf die Funktion der Leber und Gallenwege. Dtsch. Med. Wschr., 1932, 58, 1718.
2. Grabe, F., Ueber die galletreibende Wirkung von Curcumadomestica (Temoe Lawak). Arch. Expl. Pathol. Pharmakol., 1934, 176, 673.
3. Robbers, H., Ueber den Wirkungsmechanismus der einzelnenCurcumabestandteile auf die Gallensekretion. Are. Expl. Pathol. Pharmakol., 1936, 181, 328.
4. Ramprasad, C. and Sirsi, M., Curcuma longa and bile secretion—Quantitative changes in the bile constituents induced by sodium curcuminate. J. scient ind. Res., 1975,16C, 108.
5. Baumann, J. C., Heintze, K. and Muth, H. W., Klinischexperimentelle Untersuchungen der Gallen-, Pankreas- und Magensaftsekretion unter den phytocholagogen, Wirkstoffen einer Carduus marianus-Chelidonium-curcuma Suspension. Arzneim.-Forsch., 1971, 21, 98.

256 JOURNAL OF FOOD SCIENCE AND TECHNOLOGY, VOL. 24, SEPT./OCT. 1987
6. Ganesh Bhat, B., Srinivasan, M. R. and Chandrasekhara,N., Influence of curcumin and capsaicin on the composition and secretion of bile in rats. J. Fd Sci. Technol., 1984, 21, 225.
7. Beynen, A. C., West, C. E., Van Zutphen, L. F. M. andKatan, M. B., Relation between the responses of serum cholesterol to dietary cholesterol and to the type of dietary fat in random-bred rabbits. Nutr. Rep. Int., 1986, 33, 71.
8. Abell, L. L., Levy, B. B. and Kendall, F. E., A simplifiedmethod for the estimation of total cholesterol in serum and demonstration of its specificity. J. biol. Chem., 1952, 195, 357.
9. Beynen, A. C., West, C. E., Kuyvenhoven, M. W., Visser,J. J., Schouten, J. A. and Van Zutphen, L. F. M., Biliary lipid composition of rabbits fed casein, soy protein or cholesterol. Nutr. Rep. Int., 1985, 31, 869.
10. Thomas, P. J. and Hofmann, A. F., A simple calculation ofthe lithogenic index of bile. Expressing biliary lipid composition on rectangular coordinates. Gastro enterol. 1973, 65, 698.
11. Hegardt, F. G. and Dam, H., The solubility of cholesterolin aqueous solutions of bile salts and lecithin. Z. Ernährung swiss., 1974, 10, 223.
12. Holzbach, R. T., Marsh, M., Olszewski, M. and Holan,K., Cholesterol solubility in bile: Evidence that supersaturated bile is frequent in man. J. Clin. Invest., 1973, 52, 1467.
13. Beynen, A. C., Lowering of serum cholesterol by TemoeLawak Singer5, a Curcuma mixture. Artery, 1987,14, 190.
14. Subba Rao, D., Chandrasekhara, N., Satyanarayana, M. N.and Srinivasan, M., Effect of curcumin on serum and liver cholesterol levels in the rat. J. Nutr., 1970, 100, 1307.

RESEARCH NO TES
A METHOD TO DETERMINE SHRINKAGE OF MUSHROOMS DURING PROCESSING
M. KONANAYAKAM, S. K. SASTRY Department of Food Science, The Pennsylvania State
University, University Park, PA 16802.and
R. C. ANANTHESWARANFood Processing Centre and the Department of Agricultural
Engineering, University of Nebraska, Lincoln, NE 68583.
Received 20 October 1986; revised 24 January 1987
A modified liquid displacement method was developed to measure volume of porous biological m aterials o f low density and th a t absorb water. The method consisted o f Immersing the sample in a glass container with an overflow spout. W ater treated with a surfactant was used as the displacement liquid in the glass container. This technique was found to be reliable for determining shrinkage of mushrooms during processing.
Shrinkage during processing is a major problem in the mushroom processing industry1. In order to maintain the desired drained weight in the final product, the common industry practice is to induce major portion of shrinkage during the blanching operation and thus minimize the shrinkage during thermal processing of canned mushrooms.
In order to improve existing processes and to control shrinkage, it is desirable to be able to monitor the change in volume along with change in weights in mushrooms during different processing steps. The research reported in the literature dealt with loss of weight during processing2-4, but not with the volume change during processing.
Methods presently available to measure volumes of biological materials use either air comparison pycnometer or specific gravity bottle5. For porous materials such as fresh mushrooms, the air comparison pycnometer method requires coating of the sample with wax by immersing in a molten wax bath. Since mushrooms shrink when subjected to high temperatures, this method cannot be used. Use of the specific gravity bottle is also not feasible since the mushrooms absorb water and moreover, the diameter of the specific gravity bottle restricts the size of the mushroom that can be used in the test..
The objective of this study was to develop a liquid displacement method to measure volume of porous biological materials, such as mushrooms that are of low density.
A glass container with an overflow spout and a funnel with a long stem was fabricated (Fig. 1). The shape and size of the funnel was chosen such that the mushroom sample can be enclosed within the funnel in order to immerse the fresh mushroom tissue completely in the glass container; the fresh mushroom sample will otherwise float on top of the water. The angle between the wall of the glass container and the protruding tube was kept as small as possible for free flow of the displaced liquid. Water was used as the displacement liquid. Tween-80 (Fisher Scientific, Pittsburgh, PA) was added to this water to reduce its surface tension and to promote its free flow through the overflow spout.
The glass container was initially filled with water and the excess water was allowed to flow through the overflow spout. Then, the funnel was immersed in it and the water displaced by the funnel was collected in the beaker
Journal Series No. 7253 of The Pennsylvania Agricultural Experiment Station.
2 5 7
10

2 5 8 JOURNAL OF FOOD SCIENCE AND TECHNOLOGY, VOL. 2 4 , SEPT./OCT. 1987
and weighed. This was converted into the volume of the material of the funnel.
Disc shaped samples that were cut from mushroom cap were used in the experimental studies. The weight, diameter and thickness of the samples were measured and were kept in a humidified environment to prevent moisture loss. The volume of the sample was calculated using the mensuration formula for a cylinder. The sample was then coated with a thin layer of water proofing compound (consisting of a mixture of wax and tetrolatum) to prevent absorption of water. The glass container was filled with water and once the overflow of water stopped, the mushroom sample was gently placed in the glass container. The sample was completely immersed by means of the funnel. The water that was displaced by the sample and the funnel was collected and weighed. This was converted into the volume displaced by the sample and the material of the funnel. By subtracting the volume displaced by the funnel alone, as measured initially, the volume of the sample as measured by the displacement technique was obtained.
Samples were then blanched in boiling water for 5 min (as done during commercial processing). The waterproofing compound had a melting point well below the blanching temperature and hence did not interfere with the shrinkage of mushrooms. The blanched samples were kept in the humidified environment after the diameter and thickness were measured. Volumes of blanched samples were measured by displacement technique with two modifications: (1) the blanched sample was not coated since it did not absorb any liquid, and (2) no funnel was required since the blanched sample did not float. Volumes of the blanched samples were also calculated by mensuration formula. This process was repeated with ten different samples.
The shrinkage ratio was calculated using the equation: / Initial vol o f\ / Vol of sample after \ \ sample / \ blanching /
Shrinkage ratio— initial vol of sampleThe volumes of 10 samples and the shrinkage ratios
evaluated by the displacement technique and calculated by the mensuration formula are presented in Table I. There was no significant difference ( «: —0.05) between the volumes and shrinkage ratios as determined by the two different methods. Errors arising from the volume of waterproofing compound were found to be less than 1.5 per cent. For blanched samples, the differences between the calculated and measured volumes were generally greater than for fresh tissue. This may be due to errors in the calculated values because of distortion of the shape of the sample due to blanching.
References1. Ferguson, A. M. and Malick, H. M., Processing of mushroom
with reduced weight loss. United States Patent, 4407 832— 1983.
2. Beelman, R. B., Kuhn, G. D. and McArdie, F. J., The influence of post-harvest storage and soaking treatments on the yield and quality of canned mushrooms. / . Fd Sci., 1973, 38, 951.
3. Bradley, J. J., Soaking, Blanching and Thermal ProcessingSystems and Practices Affecting Shrinkage o f Canned Mushrooms. M. S. Thesis, 1970, The Pennsylvania State University.
4. McArdie, F. J. and Curwen, D., Some factors influencingshrinkage of canned mushrooms. Mushroom Sci., 1962, 5, 547.
5. Mohsenin, N. M., Physical Properties of Plant and AnimalMaterial. Gordon and Breach Science Publishers, New York, 1970.
T a b l e 1 . c a l c u l a t e d a n d m e a s u r e d v o l u m e s o f d is c s h a p e d m u s h r o o m t is s u e s , b e f o r e a n d a f t e r b l a n c h i n g
Sample Before blanching After blanching Shrinkage ratioNo. Calculated Measured Calculated Measured Using calculated Using measured
vol. (cc) vol. (cc) vol. (cc) vol. (cc) vol. vol.
1 2.252 2.205 0.882 0.852 0.608 0.6142 2.214 2.183 0.868 0.859 0.608 0.6073 2.282 2.288 0.701 0.691 0.692 0.6984 2.218 2.219 0.772 0.781 0.652 0.6485 1.865 1.906 0.763 0.758 0.591 0.6026 2.442 2.479 0.909 0.891 0.628 0.6417 2.178 2.177 0.893 0.907 0.590 0.5838 2.334 2.364 0.887 0.793 0.620 0.6659 2.009 1.963 0.781 0.822 0.611 0.581
10 2.493 2.500 1.139 1.069 0.543 0.572
2.229 2.228 0.859 0.842 0.614 0.621± 0.187 ± 0.194 ± 0.121 ± 0.104 ± 0 .0 4 0 ± 0 .0 4 7

259FULL FAT SOY FLOUR AND ITS USE IN FORTIFICATION OF WHEAT FLOUR
PREPARATION OF FULL FAT SOY FLOUR AND ITS USE IN FORTIFICATION OF WHEAT FLOUR
N. S. VERMA, H. N. MISHRA AND G. S. CHAUHANDepartment of Food Science and Technology, G. B. PantUniversity of Agriculture & Technology, Pantnagar-263 145
(Nainital), U.P., India
Received 26 June 1986; revised 7 April 1987
Whole soybeans were sand roasted, boiled for 5 min and steamed for 5, 10, IS and 20 min a t 15 psi. The treated beans were sun-dried to 7 -8 % m oisture content. The minimum trypsin inhibitor (T .I.) activity was observed in steam samples. Nitrogen solubility indices indicated that the steaming o f beans beyond 5 min a t 15 psi was not desirable. Therefore, full fa t soy flour was prepared from beans steamed a t 15 psi for 5 min. Different blends o f full fa t soy flour and wheat flour were prepared and chapaties were made using traditional method. T .I. activity in chapaties was found to be 0.73 to 2.18% indicating alm ost complete elimination o f trypsin inhibitor in the processes o f flour preparation and chapati making. The results o f sensory evaluation indicated th a t chapaties containing 25 % full fa t soy flour were found neither acceptable nor disliked, but those with 10% full fa t soy flour were quite acceptable.
Soybean with 40 per cent good quality protein and 20 per cent oil holds great promise for combating the problem of malnutrition in developing countries. The lower cost of soy protein when compared with milk, meat and fish is the most favourable point in utilizing soybean in human food preparations. Though foods from whole soybean (including seed coat) have been developed1,2, soy flour, which is comparatively easy and inexpensive to process is one of the most promising forms in which it can be used in the Indian diet, provided the problem concerning flavour, anti-nutritional factors and stability of the product are minimised if not completely eliminated. The existing solvent extraction plants in the country are not in a position to produce food grade soy flour due. to inadequate preparatory equipment3. Preparation of full fat soy flour by extrusion cooking has been discussed earlier4.
Chapaties from wheat constitute the major portion of Indian diet. Wheat flour used for chapati making, if fortified with soy flour would be a good source to counteract protein malnutrition. In view of this, the present investigation was undertaken to prepare full fat soy flour free from anti-nutritional factors and use it with wheat flour to prepare chapati.
Soybeans (var. ‘Bragg’) and wheat (var. ‘RR 2T) obtained from Crop Research Centre, G. B. Pant University of Agriculture & Technology, Pantnagar, Nainital, U.P. were cleaned and graded manually. Four different lots of graded bean were autoclaved separately at 15 psi for 5, 10, 15 and 20 min and then sun-dried. The sun-dried lots of beans were analysed for proximate composition and nitrogen solubility index (NSI) by the AACC5 and AOCS6 procedures, respectively. Trypsin inhibitor activity was determined in the bean after boiling in water for 5 min, autoclaving at 15 psi for 5 min and after sand roasting by the method of Kakade et al.1 The flours of autoclaved and sun-dried beans and wheat were prepared by milling in a hammer mill. Chapaties were prepared with different ratios of soy flour and wheat flour by the traditional method using fire wood. Chapaties thus prepared were analysed for trypsin inhibitor activity and subjected to sensory evaluation on a nine-point Hedonic scale using a trained panel of five judges. All the determinations were done in triplicate and the average values have been reported. The data were analysed by two way ANOVA8,
The percentage composition of soybean was: moisture, 7.5, protein, 42.2, fat, 21.5, ash, 5.85, and carbohydrate 22.9. The NSI of raw soybean was about 79 per cent which showed a decreasing trend due to steaming (Table 1). The minimum value of 8.1 per cent NSI was observed in beans steamed at 15 psi for 15 min. Mustakas9 observed NSI value of 16 per cent in beans steamed for 30 min. at atmospheric pressure. Since the NSI value of less than 23 per cent is not desirable, the steaming of beans at 15 psi for more than 5 min should be avoided.
It is evident from Table 2 that steaming of beans for 5 min at 15 psi showed about 45 per cent inactivation of trypsin inhibitor activity and this was the maximum
T a b l e 1. e f f e c t o f s t e a m in g s o y b e a n s a t 15 p s i
ON NITROGEN SOLUBILITY INDEX (NSl)
Steamingperiod(min)
Water soluble N
(%)
TotalN
(%)NSI
0 5.05 6.39 78.9
5 1.68 7.23 23.2
10 1,40 7.23 19.3
15 0.56 6.91 8.1
20 0.56 6.49 8.6

2 6 0 JOURNAL OF FOOD SCIENCE AND TECHNOLOGY, VOL. 2 4 , SEPT./OCT. 19 8 7
T a b l e 2 . e f f e c t o f h e a t t r e a t m e n t o f s o y b e a n s
ON ITS TRYPSIN INHIBITOR ACTIVITY (UÀ)
Trypsin units %Inhibited
% TIA InactivationPresent Inhibited
Control(no heat treatment) 10.50 23.75 69.3 —
Boiling 5 min in plain water 16.30 17.45 52.4 26.1Steaming 5 min at 15 psi 19.65 14.60 42.6 38.5Sand roasting on an electric heater 18.40 15.85 45.7 33.2
inactivation that could be achieved. These results arein conformity with the findings of Wu et al.10 and Dumka11 who reported that trypsin inhibitor activity could not be completely eliminated even by autoclaving at 121 °C for 15 min.
Beans steamed for 5 min at 15 psi with minimum trypsin inhibitor activity and maximum NSI value were, therefore, selected for full fat soy flour preparation. As indicated in Table 3, trypsin inhibition ranged from 0.73 to 2.18 per cent in chapaties prepared from blends of wheat and full fat soy flour. The results of the present investigation thus indicated almost complete inactivation (99.27 per cent) of trypsin inhibitor activity in chapaties made from blend of 10 per cent soy and 90 per cent wheat flour. Results of sensory evaluation of chapaties prepared from different blends presented in Table 3 indicate that chapaties made from 25:75 and 20:80 soy-wheat flour blends scored lowest. Statistical analysis of overall sensory score showed that the differences in the
overall sensory score of the chapaties prepared from mixtures containing 15,20 and 25 per cent soy flour were significant when compared with control (100 per cent wheat flour) whereas those prepared from blends containing 5 and 10 per cent soy flour were non-significant.
References1. Soybean Processing Feasibility Study (for USAID, India).
Servotec, 1969, Vol. Ill, 16.2. Nelson, A. I., Steinberg, M. P. and Wei, L. S., Utilization
of whole soybean for food products. Soybean Dig. 1971,31.32.
3. Shemer, M., Wei, L. S. and Perkins, E. C., Nutritional andchemical studies of three processed soy foods. J. Fd Sci., 1973, 38, 112.
4. Mustakas, G. C., Albercht, W. J., Bookwalter, G. N.,McGhee, J. E., Kwolek, W. F. and Griffin, E. L. (Jr)., Extruder processing to improve nutritional quality, flavour and keeping quality of full fat flour. Fd Technol., 1970, 24, 1290.
5. Approved Methods of American Association of CerealChemists. St. Paul, Minnesota, 1962, 8th edn.
6. Official and Tentative Methods. American Oil Chemists'Society, Chicago, 1969, 3rd edn.
7. Kakade, M. L., Reckis, J. J., McGhee, J. E. and Puski, G.,Determination of trypsin inhibitor activity of soy products: A collaborative analysis of an improved procedure. Cereal Client., 1974, 51, 376.
8. Snedecor, G. W. and Cochran, W. G., S ta t i s t ic a l M e th o d sOxford and IBW Publ. New Delhi, 1968,1st edn,
9. Mustakas, G. C., Full fat and defatted soy flours for humannutrition. J. Am. Oil. Chem. Soc, 1971, 48, 815.
10. Wu, A. C. M., Eitenmiller, R. R. and Powers, J. J., Effectof fluctuating temperature treatment on milk coagulation and inactivation of soybean trypsin inhibitor. J. Fd Sci., 1975, 40, 1171.
11. Dumka, P. K., Effect o f Thermal Processing on TrypsinInhibitor Activity and Nitrogen Solubility Index o f Soybeans. 1977, M.Sc. Thesis, G. B. Pant Univ. of Agric. & Tech., Pantnagar.
T a b l e 3 . t r y p s in in h ib it o r a c t i v i t y a n d s e n s o r y q u a l it y o f c h a p a t ie s p r e p a r e d f r o m t h e b l e n d s o f
soy flour and wheat flour
Soyflour(%)
Wheat flour (%)
% Inhibition of trypsin
units
Tenderness Chewiness Colour Flavour Overallacceptability
25 75 2.04 5.75 4.50 5.00 4.75 5.0020 80 2.18 5.50 5,00 5.00 4.50 5.0015 85 1.46 6.00 6.00 6.25 4.75 5.7010 90 0,73 6.25 6.50 6.25 5.50 6.105 95 1.90 6.00 6.50 6.00 6.00 6.100 100 — 7.00 7.25 7.00 7.00 7.60
Chapaties were evaluated by a trained panel of five members.Critical difference, 1.506.Hedonic scale: Dislike extremely 1, Dislike very much 2, Dislike moderately 3, Dislike slightly 4, Neither like nor dislike 5,
Like slightly 6, Like moderately 7, Like very much 8, Like extremely 9.

ISOLATION AND IDENTIFICATION OF SPOILAGE MICROFLORA OF SEED POTATOES 261
SURFACE MICROFLORA OF SEED POTATOES (SOLANUM TUBEROSUM L., CV. KUFRI JYOTI): ISOLATION AND IDENTIFICATION OF ORGANISMS RESPONSIBLE FOR SPOILAGE OF
POTATOES GROWN AT DEVANAHALLI
M. N. SHASHIREKHA, N. G. K. KARANTH AND P. NARASIMHAM*
Central Food Technological Research Institute, Mysore-570 013India
Received 9 September 1986; revised 23 December 1986
Seed potatoes suffer from microbial spoilage to the extent o f 8 to 15% during the post-cold storage transport, handling and holding a t tropical ambient conditions. Bacterial soft ro t and fungal dry ro t were noticed as the principal types o f spoilage in Kufri Jyo ti variety grown largely in K arnataka. Surface mycoflora consisted o f genera like Fusarium, Penicillium, Aspergillus and Rhizopus. Gram positive rods and Gram negative coccobacilli constituted the bacterial surface flora. I t has been established that in ‘Kufri Jy o ti’, the dry ro t is caused by Fusarium oxys- porum while the soft ro t is by Erwinia carotovora var carotovora (Jones) Dye. Isolated organisms produced characteristic disease symptoms when inoculated to healthy tubers under laboratory conditions.
The popular potato cultivar grown in Karnataka is 'Kufri Jyoti’. The seed tubers are generally produced in the northern states of Himachal Pradesh, Bihar and Punjab, put into cold storages for about 2-3 months, thereafter removed and transported at ambient conditions to southern states for use as seed for the ware crop. This process involves a time lag of 2-4 weeks from the time of removal from cold storage to their planting in the southern states. During this post-harvest handling and transport of seed potatoes, the tubers are prone to microbial spoilage. In terms of the total production of85,000 tonnes of potato in Karnataka, the spoilage inflicts considerable economic loss both to the farmer and to the nation1. Dry rot and soft rot are the principal forms of microbial spoilage. Although Fusarium and Pseudomonas or Erwinia are implicated as causative agents of dry rot and soft rot respectively, so for no report on the isolation and characterisation of the spoilage microorganisms has appeared from ‘Kufii Jyoti’ cultivar grown at Devanahalli—a principal potato growing region in Karnataka.
Although storage of potatoes at ambient conditions (21-35°C, RH 40-75 per cent) appears to be an economi
*To whom all correspondence should be made.11
cal alternative method to refrigerated storage, it is beset with serious problems like microbial spoilage. If the causative organisms are known, microbial spoilage of potatoes, especially seed tubers, could be avoided adopting the seed plot technique2' 6, and/or by appropriate post-harvest control measures. However, no systematic studies on the microbial spoilage of potatoes of cultivar ‘Kufri Jyoti’ were carried out and hence attempted in the present study. Fungi and bacteria were isolated from the surface of seed potatoes not only to identify the spoilage organisms relevant to the variety and to the agrometeorological conditions of the region, but also to use them as test materials for evolving control measures.
Tubers weighing 50 g were thoroughly shaken for 10 min in 450 ml sterile distilled water in a sterilised screw type bottle and plated on various growth media at appropriate dilutions. For the estimation of total bacterial and fungal counts, nutrient agar and potato dextrose agar were used respectively7. Gram negative bacteria were enumerated on McConkey agar of pH 7.17. Stewart’s medium was used to isolate the total pectolytic bacteria and also to distinguish Pseudomonas from Erwinia8. For the estimation of yeasts and moulds, malt extract agar was used7. All media were autoclaved at 121 °C for 20 min.
The colonies developed were examined and scored for bacteria and yeasts after 24 hr and for moulds after 72 hr. Five replicates were maintained. Study was carried out selecting tubers carrying visible infections and those which appeared to be free from infection (designated as healthy). The fungal isolates were identified based on the colony morphology, pigmentation and spore characteristics9.
The bacterial isolates were identified10 on the basis of both morphological features and biochemical properties detailed below. In addition, the arrangement of flagella was examined by scanning electron microscopy.
The oxidase and catalase tests were carried out following the method of Kovacs11. Production of gas from carbohydrates, gelatin liquefaction, nitrate reduction, indole production, litmus milk reaction, production of H2 S, hydrolysis of starch, citrate and ethanol utilisation, methyl red and Voges-Proskauer tests were carried out according to standard procedures12. Pseudomonas culture was used as a positive control during biochemical studies.
Confirmatory tests by inducing the soft rot production in healthy tuber slices were done by inoculating about 10® cells in the form of thick paste on to the surface of healthy tuber slices. The inoculated samples were incubated for 24-48 hr at 37±2°C, in a petri dish having 5 ml of sterile water, kept in such a way that the tuber
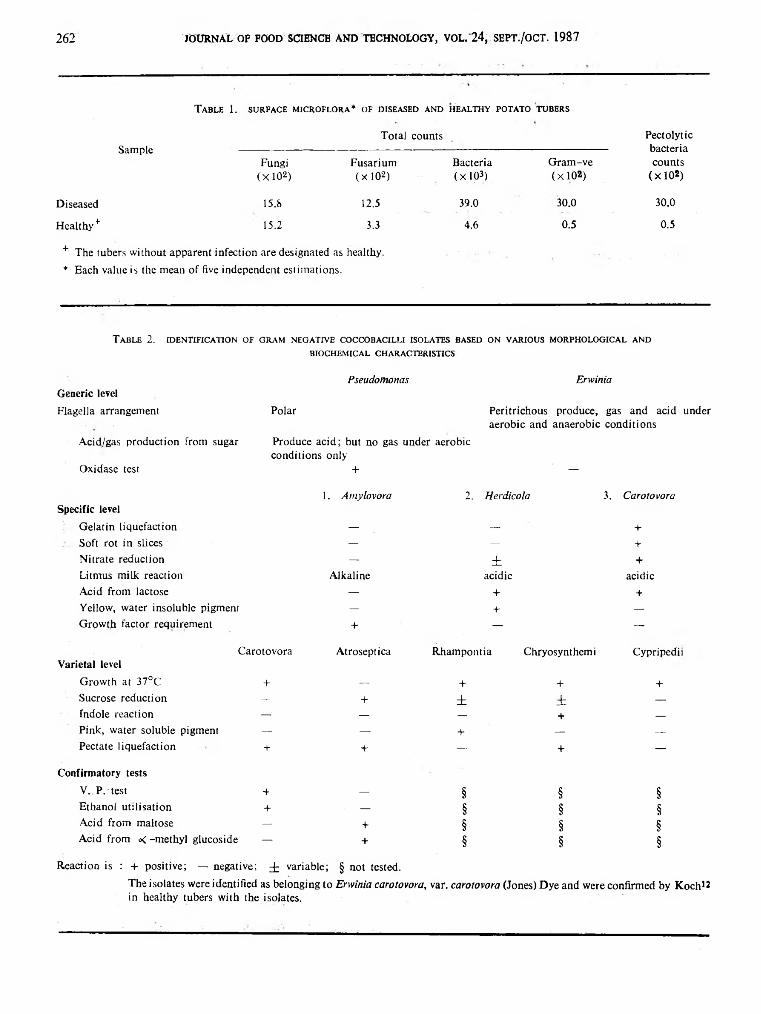
2 6 2 JOURNAL OF FOOD SCIENCE AND TECHNOLOGY, VOL. 2 4 , SEPT./OCT. 1987
Table 1. surface microflora* of diseased and healthy potato tubers
SampleTotal counts Pectolytic
bacteriacounts
(x lO 2)Fungi
(X102)Fusarium
(X102)Bacteria (X lO2)
Gram-ve ( x 10®)
Diseased 15.8 12.5 39.0 30.0 30.0
Healthy f 15.2 3.3 4.6 0.5 0.5
+ The tubers without apparent infection are designated as healthy. * Each value is the mean of five independent estimations.
Table 2. identification of gram negative coccobacilli isolates based on various morphological andb io c h e m ic a l c h a r a c t e r is t ic s
Pseudomonas ErwiniaGeneric levelFlagella arrangement Polar Peritrichous produce, gas and acid under
aerobic and anaerobic conditionsAcid/gas production from sugar Produce acid; but no gas under aerobic
conditions onlyOxidase test + —
1, Amylovora 2. Her dicola 3. CarotovoraSpecific level
Gelatin liquefaction — _ +Soft rot in slices — — +Nitrate reduction — ± +Litmus milk reaction Alkaline acidic acidicAcid from lactose — + +Yellow, water insoluble pigment — + —Growth factor requirement + — —
Carotovora Atroseptica Rhampontia Chryosynthemi CypripediV arietal level
Growth at 37°C + — + + +■ Sucrose reduction — + ± ± —
Indole reaction — — — + —
Pink, water soluble pigment — — + — —
Pectate liquefaction + + — + —
Confirmatory tests
V.. P. test + — § § §Ethanol utilisation + — § § §Acid from maltose — + § § §Acid from X -methyl glucoside — + § § §
Reaction is : + positive; — negative; i variable; § not tested.The isolates were identified as belonging to Erwinia carotovora, var. carotovora (Jones) Dye and were confirmed by Koch12 in healthy tubers with the isolates.

ISOLATION AND IDENTIFICATION OF SPOILAGE MICROFLORA OF SEED POTATOES 263
slices did not come in direct contact with the water. Softening of the slices, accompanied by production of characteristic odour was taken as positive reaction. In addition, sucrose inversion, growth factor requirement and pigment production tests were carried out as indicated by Dye13,14 and Perombelon15, From the experimentally induced soft rot, bacteria were isolated and compared with the original isolate of Erwinia carotovora.
The results indicate that surface microbial load on the apparently healthy tuber was markedly less than the diseased tubers (Table 1). The isolates from both the samples showed the presence of fungal genera, Fusarium, Penicillium, Aspergillus and Rhizopus. Even though the total fungal count did not deviate considerably in healthy and diseased tubers, Fusarium oxysporum dominated the latter and accounted for 80 per cent of the total mycoflora, indicating Fusarium oxysporum as the causative agent for dry rot of ‘Kufii Jyoti’ potatoes. This fungus has the following properties: parasitic on potatoes; mycelium extensive and cottony in culture, often with some tinge of pink in the mycelium or medium; conidial layer cushion-shaped, conidiophores grouped into sporodochia; macroconidia typically canoe shaped,3-7.5ft in diameter, usually with five septa; microconidia with 1-3 cells; yeasts were absent.
The bacterial isolates included Gram positive rods and Gram negative coccobacilli. Since Gram positive bacteria are not considered to be primary pathogens16, further identification was restricted to only Gram negative coccobacilli. Biochemical properties studied are shown in Table 2 and the isolate had the following distinctive characters.
Growth on beef extract agar slants greyish white, Gram negative, short rods measuring 0.7 to 2/a, motile with peritrichous flagella; produce acid and gas from glucose, sucrose and lactose; use ethanol as carbon source; liquefy pectate and gelatin; coagulate litmus milk in 4 days; do not produce indole and hydrogen sulphide; methyl red test positive and produce acetyl- methyl carbinol; nitrite is formed from nitrates, grow at 3 7 and produce rapidly soft rot of potato. Based on these properties, the isolate is identified as Erwinia. Further tests were also carried out to characterise the strain at species and varietal level. Results in Table 2 indicate that the isolated bacteria is Erwinia carotovora var carotovora (Jones) Dye.
The authors wish to thank Dr. B. L. Amla, Director, and Dr. M. V. Patwardhan, of the Institute for their keen
interest in this investigation. Mrs. Shashirekha is grateful to the Council of Scientific and Industrial Research, New Delhi for the award of research fellowship.
References1. District-wise estimates o f area and production o f potato
1982-83 (Final). Agric. Situation India. 1984, 39, 538.
2. Chaudhuri, R. P., Some aspects o f insect transmission ofplant viruses. Indian J. Ent., (Pt I) 1955, 16, 40.
3. Ramanujam, S., Mukhtar Singh and Swaminathan, K ., Seedtreatment for breaking dormancy o f potatoes. Indian J. agric. Sci., 1957, 27, 35.
4. Pushkarnath, V. P., Producing healthy seed potatoes in theplains—a new approach. Indian Potato J., 1959, 1, 63.
5. Pushkarnath, V. P., Seed potato production in the subtropical plains o f India. Am. Potato J., 1967, 44, 429.
6. Nagaiach, B. B., Pushkarnath, V. P., Bhardwaj, B. K.,G iri, S. R ., Anand, S. R. and Upreti, G. C., Production of disease free seed potatoes in the Indo-gangetic plains. Indian J. agric. Sci., 1969, 39, 238.
7. Difco Manual of Dehydrated Culture Media and Reagentsfor Microbiological and Clinical Laboratory Procedure, D ifco Laboratories, Detroit, Michigan, U .S .A ., 1953,9th Edn.
8. Stewart, D . J., A selective diagnostic medium o f the isolationof pectolytic organisms in the Enterobacteriaceae, Nature Loud., 1962, 195, 1023.
9. Gilman, J. C„, A Mannual o f Soil Fungi. Oxford & IBH Publ.,Co., New D elhi, 1950.
10. Bergy’s Manual of Determinative Bacteriology, by Breed, R. S.Murray, E. G. D ., and Smith, N . R., (Eds) W illiams and Wilkins Co., Baltimore, 1957.
11. Kovacs, N ., Identification o f Pseudomonas aeriginosa by theoxidase reaction, Nature, Load., 1956, 178, 703.
12. Manual of Microbiological Methods by The Society o fAmerican Bacteriologists, McGraw H ill Book Co., Inc., New York, 1957.
13. D ye, D . W., A toxonom ic study of the genus Erwinia. I.The Amylovora group, N. Z. J. Sci., 1968, 11, 590.
14. D ye, D . W., A toxonomic study o f the genus Erwinia II.The Carotovora group. N. Z. J. Sci., 1969, 12, 81.
15. Perombelon, M .C .M ., The extent and survival o f contamination of potato stocks in Scotland by Erwinia carotovora var. carotovora and E. carotovora var. atroseptica, Ann. Appl. Biol., 1972, 71, 111.
16. Perombelon, M. C. M. and Kelman, A ., Ecology of the softrot Erwinia., Ann. Rev. Phytopathol., 1980, 18, 361.

264 JOURNAL OF FOOD SCIENCE AND TECHNOLOGY, VOL. 24, SEPT./OCT. 1987
VARIATION IN QUALITY TRAITS OF LITCHI (LITCHI CHINENS1S SONN.) CULTIVARS*
AJAY SINGH, A . B. ABIDI A N D SU R E N D R A SRTVASTAVA Department o f B io c h e m is t r y , N . D . University o f Agriculture
and Technology, Kumarganj, Faizabad-224 229, India
R e c e iv e d 13 O c to b e r 1986; r e v i s e d 23 D e c e m b e r 1986
Physico-chemical composition in four promising cultivars o f freshly harvested iitchi fruits was investigated. The ranges o f values were; fruit weight 6.8-21.2 g, edible protein 61.7-84.4% , seed 3 .3 -26 .1% , peel 12.2-19.5% , total soluble solids (TSS) 21.0-21.5% , total acidity0 .51-0.54% , moisture 80.0-82.0% , protein 1.12-1.20% , fa t 0 .21-0 .35% , carbohydrates 16.06-17.9% , total minerals 0 .52-0 .55% , reducing sugars 5 .60-6 .44% , total sugars 15.51-16.22% , protopectin 0 .11-0.14% , pectinic acid 0 .41-0.57% , total pectins 0 .55-0 .71% , ascorbic acid 35.76-44.36 mg/100 g, tryptophan 1.17-1.34 g/16 gN, methionine 0.18-0.25 g/16 gN, anthocyanin (in skin)0.30-0.38 O .D ./10 discs and total phenols 116-151 mg/100 g fresh tissue. ‘M uzaffarpur’ was found to be superior to other cultivars.
Litchi, called ‘summer sweet’ is a single seeded nut and varies in size and shape according to variety1. The edible portion of litchi called aril, is a good source of minerals particularly calcium and phosphorus and has got medicinal importance. The fruit is a good appetizer and useful in dyspepsia and small pox1, information regarding the quality constituents of the fruit is of interest and of great importance to breeders, agronomists, nutritionists and others. The quality composition of litchi cultivars was determined and the information is recorded here.
Fully ripe fruits of ‘Early Large Red’, ‘Calcuttia’, ‘Muzaffarpur’ and ‘Bedana’ were procured from the trees growing in the Government Garden, Faizabad
during the last week of May, 1986. After harvesting, the samples were kept in polythene bags and brought immediately to the laboratory in ice-box. Four replicate samples were selected from each cultivar and all the analyses were carried out in duplicate.
After weighing the fruits, pulp and seeds were separated and weighed after removing the peel. Moisture content was calculated by subtracting dry weight from fresh weight and expressed as per cent of fresh weight. Total soluble solids (TSS) of fresh extracted juice was determined with the help of a hand refractometer. The methods as described in A.O.A.C.3 were used to analyse acidity, ascorbic acid and fat contents. Total carbohydrates were determined by difference4. Reducing, non-reducing and total sugars were estimated by Shaffer- Somogyi micromethod3. Determination of protein content was done by the method of Lowry et al. using Folin-Ciocalteau reagent5. Tryptophan and methionine contents were analysed according to Spies and Chambers6 and Horn et al? Pectin was estimated according to Ranganna® and total mineral content according to Hart and Fisher9. The method of Swain and Hillis19 was followed for the quantitation of total phenols using gallic acid as standard. Anthocyanin was determined by the colorimetric method as described by Kliewer11 and expressed as OD/10 discs.
Fruit weight, edible portion, seed percentage and peel percentage exhibited remarkable variation among the cultivars (Table 1). ‘Early Large Red’ showed significantly highest fruit weight, edible portion and lowest seed percentage while ‘Bedana’ gave highest value for peel percentage.
As shown in Table 2, there were considerable differences in the level of all the constituents except TSS, moisture and protopectin content. Total acidity was significantly high in ‘Calcuttia’. The highest and lowest values for carbohydrates were observed in cultivars ‘Early Large Red’ and ‘Calcuttia’ respectively, while ‘Muzaffarpur’ showed highest fat content (0.35 per cent).
Table 1. PHYSICAL MEASUREMENTS OF LITCHI CULTIVARS
Trait Early Large Red
Calcuttia Muzaffarpur Bedana Mean C.D . at 5%
Fruit wt. (g) 21.2 13.8 17.9 6.8 14.90 2.7
Edible part (%) 84.4 61.7 68.2 71.7 71.50 5.2
Seed (%) 3.3 26.1 18.1 8.8 14.07 2.5
Peel (%) 12.3 12.2 13.7 19.5 14.04 1.5
*The paper was accepted for presentation in the 22nd International Horticultural Congress, held at D avis, California, llth -2 0 th . August, 1986.

VARIATION IN QUALITY TRAITS OF LITCHI CULTIVARS 265
Table 2. composition of litchi cultivars
E arly large R ed
C alcu ttia M uzaffarpur B edana M ean C .D . a t 5 %
TSS (% ) 21.5 21.0 21.5 21.0 21.2 N S
A cidity (% ) 0.51 0.54 0.51 0.53 0.52 0.01
M oisture (% ) 80.2 82.0 80.3 81.2 80.9 N S
C arbohydrates (% ) 17.9 16.06 17.60 16.93 17.12 0.34
F a t (% ) 0.21 0.27 0.35 0.23 0.26 0.02
R educing sugars (% ) 10.17 9.88 9.78 9.91 9.93 0.12
N on-reducing sugars (% ) 5.86 5.76 6.44 5.60 5.91 0.15
T otal sugars (% ) 16.03 15.64 16.22 15.51 15.85 0.32
Proteins (% ) 1.15 1.13 1.20 1.12 1.15 0.01
T ryptophan (g/16gN) 1.25 1.24 1.34 1.17 1.25 0.01
M ethionine (g/16gN) 0.18 0.21 0.22 0.25 0.21 0.01
T otal m inerals (% ) 0.54 0.54 0.55 0.52 0.53 0.01
Protopectin (% ) 0.14 0.12 0.14 0.11 0.13 N S
Pectinic acid (% ) 0.41 0.53 0.57 0.56 0.52 0.03
T otal pectins (% ) 0.55 0.65 0.71 0.67 0.64 0.01
A scorbic acid (mg/100g) 38.43 35.76 44.36 37.88 39.11 0.70
T otal phenols (mg/100g) 127 116 143 151 134 0.30
A nthocyanin (O D /10 discs) 0.35 0.33 0.38 0.30 0.34 0.01
Energy (Kcal) 78.09 71.19 78.35 74.27 75.47 0.85
The highest amounts of non-reducing and total sugars were observed in ‘MuzafFarpur’ whereas ‘Early Large Red’ gave highest value for reducing sugars.
Protein content of the cultivars varied from 1.12 to 1.20 per cent. The essential amino acids viz. tryptophan and methionine were also analysed, keeping in view the importance of amino acids during ripening12. Tryptophan and methionine were highest in ‘MuzafFar- pur’ and ‘Bedana’ cultivars. The highest total mineral and ascorbic acid contents were observed in ‘MuzafFarpur’ cultivar. Pectinic acid and total pectins langed from 0.41 to 0.57 per cent and from 0.55 to 0.71 per cent respectively. West and Todd1? suggested that 0.30-0.70 per cent protein is requiied for gel formation and because of its capacity to form gel, it may reduce irritation at the intestinal wall14. The highest content of total phenols was observed in ‘Bedana’ and the lowest, in ‘Calcuttia’ while anthocyanin which is responsible for the bright red colour of litchi, was found to be highest in ‘MuzafFarpur’. The highest energy value would be attributable to ‘MuzafFarpur’ and the energy value for all the cultivars were higher than those reported earlier15. Cultivar ‘MuzafFarpur’ was observed to be nutritionally excelling other three cultivars on the basis of the constituents analysed.
References1. N ijja r, G . S., Litchi Cultivation. P .A .U . Press, L udhiana,
1972, 3.
2. Sood, D . R ., D h indsa , K . S. and W agle, D . S., S tudies onnu tritive value o f pom egranate (Punica granatum), Haryana J. Hort. Sci., 1982, 11, 175.
3 . Official Methods o f Analysis, A ssociation o f Official AnalyticalC hem ists, W ashington, D .C ., 1970, 11th Edn.
4. R anjhan , S. K . and G opal K rishna , Manual o f NutritionResearch, V ikas Publ. H ouse Pvt. L td ., N ew D elh i, 1981,20
5. Lowry, O. H ., R osebrough, N . J., F a rr , A . L . and R andall,R . J ., P ro te in m easurem ent w ith th e folin-phenol reagent. J. biol. Ghent., 1951, 193, 265.
6. Spies, J. R . and C ham ber, D . C ., C hem ical de term ination o ftryp tophan in p roteins. Analyt. Chem., 1949, 21, 1249.
7. H orn , J . M ., Jones, D . B. and Blum, A . E ., D e term in a tio n o fm eth ion ine in p ro te in and foods. J. biol. Chem., 1946, 166, 313.
8. R anganna, S ., Manual of Analysis o f Fruit and VegetableProducts, T ata M cG raw H ill Publ. C o. L td ., N ew D elh i, 1977.
9. H a rt, F . L. and F isher, H . J ., Modern Food Analysis, S prin g er-Verlag, N ew Y ork, 1971,
10. Sw ain, T . and H illis, U . E ., The phenolic constituents o f Prunus domestica: Q u an tita tive analysis o f phenolic constituen ts. J. Sci. Fd Agric., 1959, 10, 63.
12
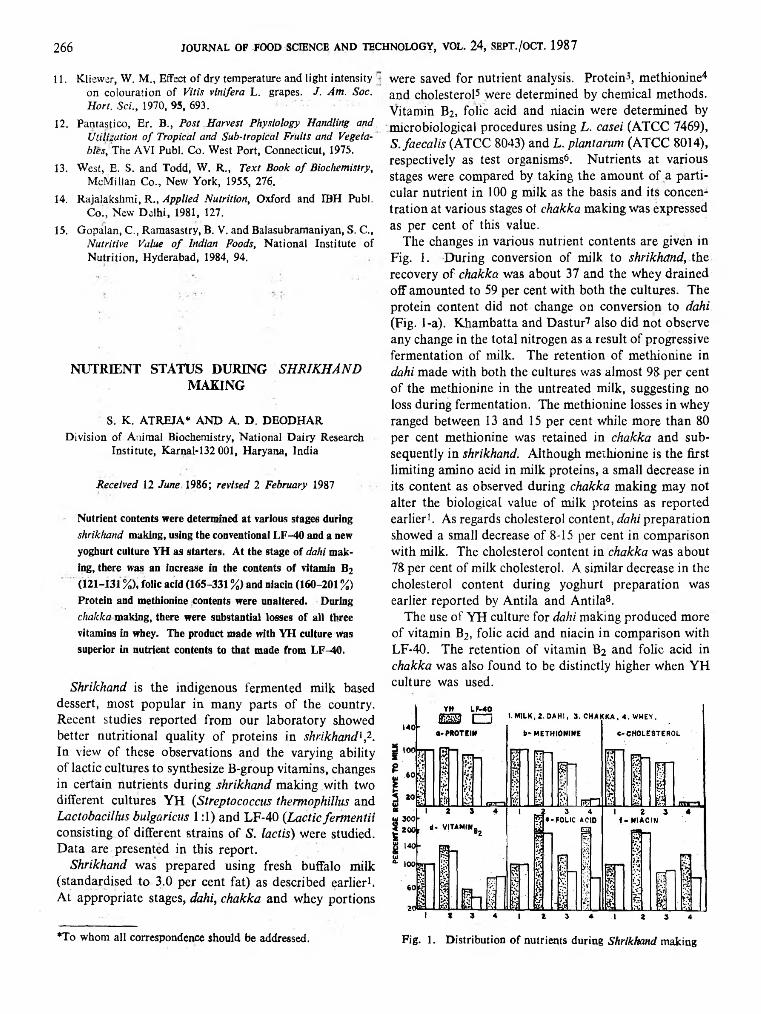
2 6 6 JOURNAL OF FOOD SCIENCE AND TECHNOLOGY, VOL. 2 4 , SEPT./OCT. 1 9 8 7
11. K liew er, W . M „ Effect o f d ry tem perature and ligh t intensityon co lou ra tion o f Vitis vinifera L. grapes. J. Am. Soc. Hort. Sci., 1970, 95, 693.
12. Pan tastico , E r. B ., Post Harvest Physiology Handling andUtilization of Tropical and Sub-tropical Fruits and Vegetables, The AVI Publ. Co. W est Po rt, C onnecticut, 1975.
13. W est, E. S. and T odd, W . R ., Text Book o f Biochemistry,M cM illan C o., N ew Y ork, 1955, 276.
14. R aja lakshm i, R ., Applied Nutrition, O xford and EBH Publ.C o:, New D elh i, 1981, 127.
15. G opalan , C ., R araasastry, B. V. and B alasubram aniyan, S. C .,Nutritive Value of Indian Foods, N atio n a l In stitu te o f N u tritio n , H yderabad, 1984, 94.
NUTRIENT STATUS DURING SHRIKHAND MAKING
S. K . A T R E JA * A N D A. D . D E O D H A RD ivision o f A nim al B iochem istry, N a tional D a iry Research
In stitu te , Karnal-132 001, H aryana, Ind ia
R e c e iv e d 12 Ju n e 1986; re v is e d 2 F eb ru a ry 1987
Nutrient contents were determined at various stages during shrikhand making, using the conventional LF-40 and a new yoghurt culture YH as starters. At the stage of dahi making, there was an increase in the contents of vitamin B2
(121-131 %), folic acid (165-331 %) and niacin (160-201 %) Protein and methionine contents were unaltered. During cWc/ca making, there were substantial losses of all three vitamins in whey. The product made with YH culture was superior in nutrient contents to that made from LF-40.
Shrikhand is the indigenous fermented milk based dessert, most popular in many parts of the country. Recent studies reported from our laboratory showed better nutritional quality of proteins in shrikhand\2. In view of these observations and the varying ability of lactic cultures to synthesize B-group vitamins, changes in certain nutrients during shrikhand making with two different cultures YH (Streptococcus thermophillus and Lactobacillus bulgaricus 1:1) and LF-40 (Lactic fermentii consisting of different strains of S. lactis) were studied. Data are presented in this report.
Shrikhand was prepared using fresh buffalo milk (standardised to 3.0 per cent fat) as described earlier1. At appropriate stages, dahi, chakka and whey portions
♦To w hom all correspondence should be addressed.
were saved for nutrient analysis. Protein3, methionine4 and cholesterol5 were determined by chemical methods. Vitamin B2 , folic acid and niacin were determined by microbiological procedures using L. casei (ATCC 7469), S.faecalis (ATCC 8043) and L. plantarum (ATCC 8014), respectively as test organisms6. Nutrients at various stages were compared by taking the amount of a particular nutrient in 100 g milk as the basis and its concentration at various stages of chakka making was expressed as per cent of this value.
The changes in various nutrient contents are given in Fig. 1. During conversion of milk to shrikhand, the recovery of chakka was about 37 and the whey drained off amounted to 59 per cent with both the cultures. The protein content did not change on conversion to dahi (Fig. 1-a). Khambatta and Dastur7 also did not observe any change in the total nitrogen as a result of progressive fermentation of milk. The retention of methionine in dahi made with both the cultures was almost 98 per cent of the methionine in the untreated milk, suggesting no loss during fermentation. The methionine losses in whey ranged between 13 and 15 per cent while more than 80 per cent methionine was retained in chakka and subsequently in shrikhand. Although methionine is the first limiting amino acid in milk proteins, a small decrease in its content as observed during chakka making may not alter the biological value of milk proteins as reported earlier1. As regards cholesterol content, dahi preparation showed a small decrease of 8-15 per cent in comparison with milk. The cholesterol content in chakka was about 78 per cent of milk cholesterol. A similar decrease in the cholesterol content during yoghurt preparation was earlier reported by Antila and Antila8.
The use of YH culture for dahi making produced more of vitamin B2 , folic acid and niacin in comparison with LF-40. The retention of vitamin B2 and folic acid in chakka was also found to be distinctly higher when YH culture was used.
Fig. 1. D istribu tion o f nu trien ts du rin g S h rik h a n d m aking
267PROPERTIES OP SPENT HEN COMPONENTS
The starter cultures used in this study were mixed ones. Culture' LF-40 was Lactic fermenlii containing different strains of S. lactis while YH comprised S. thermophilus and L. bulgaricus. The increase in vitamin contents observed in this study was in keeping with the earlier observations, that levels of certain vitamins of B-group markedly increase during fermentation of milk using mixed cultures9-13.
The authors express sincere thanks to the Director, National Dairy Research Institute, Karnal for providing necessary facilities to work.
References
1. Chaudhary, A. and A treja, S. K ., N u tritio n a l quality o fproteins o f shrikhand . J . F d S c i. T e c h n o i, 1985, 22, 411.
2. C haudhary, A. and A treja, S. K ,, G row th prom oting abilityo f chakka. Indian J . D a ir y S c i., 1986, 39, 247.
3. O ffic ia l M e th o d s o f A n a ly s is , A ssocia tion o f Official AnalyticalChemists, W ashington!, D . C ., 1980.
4. M cC arthy, T . E. and Sullivan, M . X ., A new and highlyspecific colorim etric test fo r m ethionine. J . b io l. C hem . 1941, 141, 871.
5. Abell, L. L ., Levy, B. B., B rodie, B. B. and K endall, F . E.,A sim plified m ethod for th e estim a tio n of to ta l cholesterol in serum and de term ination o f its specificity. J . b io l. C h em ., 1952, 195, 357.
6. Freed, M ., M ethods o f v itam in assay, John W illey andSons, New Y ork, 1966, 3rd Edn.
7. K ham batta , J. S. and D astu r, N . N ., The changes in chemicalcom position o f m ilk during souring. II. Changes in the n itrogen constituents. In d ian J . D a ir y S c i . , 1951, 4, 73.
8. A ntila , P. and A ntila , V., C holesterol in F in n ish m ilk anddifferent m ilk products and rela tionsh ip between fat and cholesterol content. N eija r itie te c llin en A ik a k o w sk ira ja , 1976, 34, 3 ( D a ir y S c i. A b s t . , 1977, 39, 1007).
9. Laxm inarayana, H ., N utritive and therapeutic properties o fferm ented m ilks. P a p e r P re s e n te d a t th e U N D P W orksh op on th e R o le o f M ic ro -o rg a n ism s in P ro cess in g o f M ilk a n d a n d M i lk P ro d u c ts a t N D R I, K arnal, 1981, A pril 6 -9 .
10. Reddy, K . P ., C o m p a ra tiv e B V itam in C o n ten t o f C u ltu reda n d A c id if ie d Y ogh u rt, M .Sc. Thesis, 1972, U niversity of N ebraska.
11. Reddy, K . P., Shahani, K. M . and K u lk arn i, S. M .,Bn:om plex vitam ins in cultured and acidified yoghurt. J . D a ir y S c i . , 1976, 59, 191.
12. B ham ba, P . P ., Shankara Setty, P . A ., N am budripad , V. K . N .and L axm inarayana, H ., Changes in v itam in B-com plex content o f m ilk during the p roduction o f d a h i (ferm ented m ilk). Indian J . A n itn . S c i . , 1973, 43, 210.
13. N ilson, K. M ., V akil, J. R . and Shahani, K . M ., B -v itam incontent o f Cheddar cheese. J . N u tr . , 1985, 86, 362.
PHYSICO-CHEMICAL AND FUNCTIONAL PROPERTIES OF SPENT HEN COMPONENTS
N . K O N D A IA H A N D B. PA N D A *
.D iv is io n o f Livestock Products Technology, Ind ian V eterinary Research Institu te , Izatnagar-243 122, Ind ia
R e c e iv e d 4 N o v e m b e r 1986; re v is e d 11 F e b ru a ry 1987
Physico-chemical and functional characteristics of deboned meat components (breast, leg and wing+back meats) and low value components (skin, gizzard and heart) were studied in ‘White Leghorn’ spent hens. Breast meat was found to be superior with higher protein, extractable proteins, emulsifying capacity and lower fat and collagen contents for use in further processed or comminuted meat products. Skin contained higher fat and lower protein with maximum collagen. Gizzard was slightly preferable to heart and skin was least preferable for nse in products due to poor functional properties. Determination of optimum level of incorporation of low value components into products needs greater consideration.
In India, spent hens contribute about 83 thousand tonnes of poultry meat comprising about 46 per cent of the total poultry meat. One of the greatest needs of the poultry industry is increasing the utilization of spent laying hens considered to be a by-product of the egg industry1. Ground or emulsion type products were attempted for efficient utilization of spent hen components. Information on the various physico-chemical and functional properties of spent hen components is essential for development of such further processed products as these properties determine the quality of the finished products. Reports are available on some of the compositional2-4 and functional properties2,5,6 of spent hen components. In the present study, an attempt was made to evaluate the deboned meat components and low value components from spent hens for the physicochemical and functional properties.
Spent hens of ‘White Leghorn’ breed (above 500 daysand maintained on deep litter) available from a researchfarm were utilised in the study. Birds selected at randomwere fasted for 15 hr, slaughtered and hand dressed afterscalding for 1 min at 60°C. After evisceration, birdswere hot deboned within 3 hr of slaughter. Debonedmeat components namely, breast meat, leg meat andwing+back meat; and low value components like skin,gizzard and heart were packed separately in polythenebags and frozen for 7 days at -10°G,and thawed at 5°Cfor 15 hr, fine minced and analysed. Components frommore than one bird (2 to 20) were grouped in order to
?.........._ —i¡♦C entral A vian Research Institu te , Izatnagar.

268 JOURNAL OP FOOD SCIENCE AND TECHNOLOGY, VOL. 2 4 , SEPT./OCT. 198 7
T a b l e 1 . p h y s i c o - c h e m ic a l a n d f u n c t i o n a l c h a r a c t e r is t ic s o f d e b o n e d m e a t c o m p o n e n t s a n d l o w v a l u e
COMPONENTS FROM SPENT HENS
Quality characteristics Deboned meat components Low value componentsBreast Leg Wing+ back Skin Gizzard Heart
Moisture (%) 72.09 ¿0.59° ^ ^ ¿ 1 .1 2 “ 62.96¿0,21“ 52.22¿1.36 * 72.97 ¿0 .58“ 70.60¿0.17“
Protein (%) 23.07±0.566 ^ ^ ¿ 0 .6 5 “ 17 .7^ 0 .09“ 1 5 .^ 0 .3 1 “ 20.28¿0.36* 17.55 ¿0 .3 3 “
Fat (%) 3.42±0.72fl ^ ¿ 1 .4 4 * 17.79 ¿0 .44“ 31.91 ¿2.36* 6.43 ¿ 1 .3 2 “ 10.94¿0.32“
Ash (%) 1.21 ±0.05« ^•^¿0.01* 0.73 ¿0 .0 2 “ 0.44 ¿0.06* 0.94 ¿0.03“ 0.82¿0.05“
pH 5.94±0.07a 6.08¿0.05“ 6.07¿0.04“ 5.98 ¿0.24* 6.67¿0.09“ 6.50¿0.06“
Water holding capacity (ml/lOOg) 12.81 ¿3 .67“ ^ ¿ 1 . 8 7 “ ^ ¿ 1 . 8 9 “ 2 3 .^ 4 .8 9 “* 31.38¿0.20* 13.81 ¿1 .84“
Emulsifying capacity (ml oil/2.3g) 131 ¿5 .6 4 “ ^ ¿ 2 .7 3 * ^ ¿ 2 . 6 9 “ 47¿4.41* 89¿2.08“ 94¿2.33“
Cooking loss (%) 21.72 ¿1 .42“ 22.89¿1.10“ 21.73 ¿0 .63“ 23.04 ¿2 .24“ 27.42 ¿1 .00“ 39.65 ¿0.68*Water soluble proteins (%) 7.87 ¿0.30* 4.90 ¿0 .57“ 4.72 ¿0.23“ 1.45 ¿0.03* 6.73 ¿0 .23“ 5.50¿0.35“Salt soluble proteins (%) 12.^¿0.94* 7.75 ¿0 .25“ 6.41 ¿0 .15“ 2.04¿0.04* 5.27¿0.14“ 5.02 ¿0 .2 7 “Extractable proteins (%) 81.94¿2.98* 60.24 ¿4.54“ 63.01 ¿1 .38“ 73.44 ¿1.00* 59.79 ¿0 .44“ 60.07 ¿3.82“Collagen (%) 0.68¿0.11“ 1.03 ¿ 0 .1 6 “ 1 . ^ 0 . 2 5 “ 5 .^ ¿ 0 .4 4 “ 2.79 ¿0.02* 1.17 ¿0 .07“
Mean with the same superscript in the same row do not differ significantly (P<0.05) when compared separately under deboned meat components and low value components.
obtain sufficient quantities of sample for analysis and a minimum of 3 such pooled samples were analysed for the various physico-chemical and functional properties as per the procedures reported earlier7. Analysis of variance was conducted and means were compared using
Duncan’s multiple range test8, separately under deboned meat components and low value components.
Quality characteristics of different spent hen components are presented in Table 1 and the analysis of variance in Table 2. A highly significant difference was
T a b l e 2 . a n a l y s is o f v a r ia n c e o f q u a l i t y c h a r a c t e r is t c s
Quality characteristics Deboned meat component Low value componentserror Error Components’ Error Error Components’
d.f m.s m.s d.f m.s m.s
Moisture (%) 15 0.018 0.036 12 3.95 660“Protein (%) 17 2.46 45.77“ 9 0.49 29.25“Fat (%) 17 8.64 276.14“ 9 9.81 1366“Ash (%) 11 0.006 0.256“ 7 0.009 0.26“pH 15 0.018 0.037 6 0.069 0.388*Water holding capacity 9 27.36 101.67 11 36.35 309.18*Emulsifying capacity 23 102.86 1256“ 6 29.24 2045“Cooking loss (%) 13 7.77 2.55 9 8.65 296**Water soluble proteins (%) 9 0.62 12.51“ 6 0,106 22.90**Salt soluble proteins (%) 9 1.29 35.93“ 6 0.095 9.69“Extractable proteins (%) 9 41.78 558“ 6 15.76 1331“Collagen (%) 6 0.105 0.18 6 0.20 12“
1 : components d.f= 2 ‘significant P<0.05; “ significant P <0.01.
PROPERTIES OF SPENT HEN COMPONENTS 2 6 9
observed between the deboned meat components for the parameters of protein, fat, ash content, emulsifying capacity (EC), water soluble proteins (WSP), salt soluble proteins (SSP) and extractable proteins (EP) while under low value components, all the parameters showed significant differences (Table 2).
Deboned meat components: Breast meat contained relatively higher moisture and significantly higher protein than the other components (Table 1). Fat was significantly higher in wing+back meat followed by leg meat and breast meat. Ash was significantly lower in leg and wing+back meat due to higher contents of fat in these components.
pH was significantly different between the components but was relatively lower in breast meat. Even though no significant difference was observed in the water holding capacity (WHC) of different components, the mean differences clearly indicate that breast meat had superior WHC followed by leg meat and wing+back meat (Table 1). Emulsifying capacity differed significantly between the components and was maximum in breast meat followed by leg and wing+back meat. Cooking loss did not differ significantly between the components. WSP, SSP, and EP were significantly higher in breast meat than the other components due to the relatively higher protein content and lower fat content in breast meat. Collagen content was maximum in wing+ back meat (1.16 per cent) indicating a higher proportion of connective tissue followed by leg meat (1.03 per cent) and breast meat (0.68 per cent).
The trend of differences between breast and leg meat for the parameters of pH, moisture, protein, fat and SSP was similar to that of McCready and Cunningham2 for light and dark meat of fowls. Higher SSP per cent of breast meat was in agreement with the findings of other workers2,3. Significantly higher EC observed in breast meat than in leg meat did not confirm the findings of other workers2,9,10. However, in support of the present study Maurer and Baker6 and Parkes and May10 reported the superiority of breast meat over other parts for emulsification. Breast meat with better compositional and functional properties was found to be more desirable for use in the preparation of products with better yields and quality compared to leg and wing+back meats. Wing+back meat showed relatively poor functional properties due to higher fat and lower protein contents.
Low value components: In general, lower values were observed for all the parameters in skin than gizzard and heart except for fat per cent, WHC and collagen per cent (Table 1). Moisture and protein were significantly lower in skin due to higher fat content. The composition of gizzard and heart were nearly comparable
with the reported values3 but in case of skin much variation was observed due to the subcutaneous fat which is dependent on the condition (fatty or non fatty) of the birds.
pH of the skin (5.98) has been found to be similar to the normal pH of poultry meat (6.0) and significantly lower than gizzard and heart. Water holding capacity was significantly lower in heart than gizzard showing that cardiac muscle has very poor WHC. Lyon and Thomson11 also reported that hearts showed less WHC than gizzards and livers. Emulsifying capacity values were comparable with the values reported by Maurer and Baker6. Skin emulsified significantly less oil as could be expected because of the high content of fat and low content of total protein. Cooking loss was significantly higher in heart since it has very poor WHC. Water soluble proteins, SSP and total extractable proteins were significantly lower in skin than other components due to the lower protein percent and maximum collagen content.
References1. Brekke, C. J., Increased utilisation of fowl meat. Inst. Fd
Technol. Muscle Fd Div. News Lett.,1983, 9, 1.2. McCready, S. T. and Cunningham, F. E., Salt soluble pro
teins of poultry meat, 1. Composition and emulsifying capacity. Poult. Sci., 1971, 50, 243.
3. Hudspeth, J. P. and May, K. N., Emulsifying capacity of saltsoluble proteins of poultry meat. II. Heart, gizzard and skin from broilers, turkeys, hens and ducks. Fd Technol., 1969, 2 3 , 373.
4. Singh, J. N. and Bhatia, B. S., A note on composition ofpullet and culled hen meat. Indian J. Poult. Sci., 1984, 19, 280.
5. Randall, C. J., Use of mechanically deboned and manuallydeboned poultry meat in meat emulsions: A review. Can. Inst. Fd Sci. Technol. J., 1977, 10, 147.
6. Maurer, A. J. and Baker, R. C., The relationship betweencollagen content and emulsifying capacity of poultry meat. Poultr. Sci., 1966, 45, 1317.
7. Kondaiah, N., Anjaneyulu, A. S. R., Kesava Rao, V.,Sharma, N. and Joshi, H. B., Effect of salt and phosphate on the quality of buffalo and goat meats. M eat Sci., 1985, 15, 183.
8. Duncan, D. B., Multiple range and multiple ‘F’ test. Biometrics, 1955, 11, 1.
9. Hudspeth, J. P. and May, K. N., A study of the emulsifyingcapacity of salt soluble protein of poultry meat. I. Light and dark meat tissues of turkeys, hens, broilers and ducks. Fd Technol., 1969, 2 3 , 373.
10. Parkes, M. R. and May, K. N., Effect of freezing evaporationand freeze drying on emulsifying capacity of salt soluble proteins. Poult. Sci., 1968, 47, 1236.
11. Lyon, B. G. and Thomson, J. E., Physical and functionalcharacteristics of poultry giblets. Poult. Sci., 1982, 61, 451.
13

270 JOURNAL OF FOOD SCIENCE AND TECHNOLOGY, VOL. 2 4 , SEPT./OCT. 1987
BACTERIOLOGICAL QUALITY OF FRESH PORK COLLECTED FROM DIFFERENT ABATTOIRS
AND RETAIL SHOPS
P. K. GUPTA, G. S. CHAUHAN AND G. S. BAINS Department of Food Science & Technology, G. B. Pant
University of Agriculture & Technology, Pantnagar-263 145, Nainital, U.P., India
Received 17 April 1986; revised 28 March 1987
Samples of fresh pork collected from 3 types of slaughterhouses (Le. modern, semi-modern and rural) and two retail shops at 15 days interval were analysed for total bacterial count, (SPC) most probable number (MPN) of coliform, MPN of E. coli and salmonella incidences. The values of mean SPC, MPN of coliform and E, coli in fresh pork samples ranged from 5.77 x log 10 to 9.14 X log 10,4.3 X log 10 to 7.81 x log 10 and 3.5 x log 10 to 7.07 x log 10 per gram, respectively. SPC, coliform and E. coli count of the pork samples collected from retail shops were significantly higher than those of the samples collected from slaughter houses. Some of the samples were positive for salmonella and serotype isolates were S. hareilly and 5 . Stanley.
The bacteriological quality of meat is dependent on several factors and the hygienic condition of abattoirs is one of them. Total bacterial count of pork sample increased when it moved from butcheries to home1. Among the beef, pork and poultry samples, contamination with salmonella was maximum in pork2. Several workers have studied the bacteriological quality of fresh meat3-6. Though information is available on the bacteriological quality of fresh pork in general, the present study was undertaken to evaluate the bacteriological quality of pork as influenced by abattoir type and retail shops in Tarai regions of U.P. For comparison, samples of fresh pork were also collected from C.D.F., Aligarh.
Samples of fresh pork were collected from three different types of slaughter houses viz. modern type equipped with fully automatic commercial plant having tap water supply; semi-modern type where slaughtering is done by local butchers on tables and water supply is from well; and rural type where slaughtering is done in the open on ground and water supply is from river and two retail shops under aseptic conditions at 15 days interval. These samples were transported to laboratory in ice boxes and stored in deep freeze at -18°C until analysed (2-10 hr).
Weighed quantity (10 g) of each sample was cut into small pieces and triturated with 90 ml of sterilized normal saline solution in a sterilized blender for 10 min. From
this, further dilutions were made for counting. Enumerations of Standard plate count (SPC), most probable number (MPN) of coliform and E. coli were carried out by using selective media nutrient agar, Mcconkey’s broth and Ejackman lactose, respectively according to the procedure given in Methods of Standard Plate Count of Bactoeria in Food Stuff7 for standard plate count and that of International Organization for Standardization8 for MPN of coliform and E. coli. Total bacterial colonies in nutrient agar plate were counted with the help of Qubecs colony counter. MPN of coliform and E. coli were determined by the production of gas in durham’s tubes. The production of gas at 37°C for 48 hr in case of coliform and at 44°C for 48 hr in case of E. coli was taken as positive for presumptive test. The MPN/100 ml of dilutions was computed on the basis of positive tubes for presumptive test by using probabilities table9 and further, it was calculated per gram of sample.
For isolation and identification of salmonella, the method of Roberts et al.10 was used. Minced sample (about 10 g) was inoculated in tetrathionate broth and incubated at 37°C for 18 hr. A loopfull of the inoculated broth cultures was streaked on brilliant green agar plates which were incubated at 37°C for 24 hr. Colonies suspected to be of salmonella were isolated, purified and tested biochemically by using the techniques described by Edwards and Edwing11. The biochemically confirmed isolates were sent to Central Research Institute, Kasauli, Himachal Pradesh, for serotyping.
The data of SPC, MPN of coliform and E. coli were statistically analysed by two way analysis of variance12.
Standard Plate Count (SPC): Significantly higher mean SPC were obtained in the samples collected from retail shops as compared to slaughter houses which might be due to successive time lapses between slaughtering and marketing (Table 1). However, among the slaughter houses, the samples collected from modern slaughter houses exhibited higher mean SPC which might be due to the consequences of long chain handling of meat as well as due to the lapse of longer time (about 20 hr) during transportation of samples from modern slaughter house to laboratory as compared to other two local slaughter houses (3-4 hr). Higher mean SPC has been observed by Park1 in pork samples collected from local meat shop as compared to local slaughter houses. The day of sampling did not significantly influence SPC.
Coliform and E. coli count: Variation in MPN of coliform counts due to the source of sampling was significant at 5 per cent level whereas day of sampling did not have any significant effect (Table 1). The samples collected from shop No. 1 exhibited the highest MPN of E. coli. The sample from modern slaughter house showed higher MPN of E. coli as compared to local slaughter houses. The differences in E. coli count of pork

BACTERIOLOGICAL QUALITY OF FRESH PORK FROM ABATTOIRS AND SHOPS 271
T a b l e 1. s t a n d a r d p l a t e c o u n t (s p c ) , m o s t p r o b a b l b n u m b e r ( m f n ) o f c o i .if o r m s a n d o f e . c o l i ( x l o g 10/g)IN FRESH PORK SAMPLES COLLECTED FROM DIFFERENT ABATTOIR AND RETAIL SHOPS AT DIFFERENT TIMES
Sampling interval Enumeration Abattoir Retail shop Mean(days) type Modern Semi-modern Rural No. 1 No. 2
0 SPC 7.73 5.87 6.22 9.36 6.77 8.68Coliform MPN 4.95 3.87 3.47 8.17 4.95 7.55E. coli MPN 4.95 2.84 3.36 6.66 4.95 5.97
15 SPC 8.21 5.49 5.77 7.29 8.66 8.07Coliform MPN 7.38 3.17 4.17 4.60 7.00 6.85E. coli MPN 6.66 2.60 2.95 3.38 6.66 6.25
30 SPC 7.93 5.99 7.50 9.60 ' 7.30 8.91Coliform MPN 5.60 3.97 4.55 8.17 4.66 7.47E. coli MPN 5.36 3.36 3.32 7.63 4.63 6.93
45 SPC 8.32 6.32 5.30 8.65 8.25 8.20Coliform MPN 6.96 3.63 4.60 7.32 6.20 6.79E. coli MPN 6.96 3.60 3.95 5.36 6.17 6.34
60 SPC 8.00 5.55 6.25 8.46 6.63 7.95Coliform MPN 6.32 4.60 4.95 7.04 5.60 6.43E. coli MPN 6.17 3.95 4.36 7.04 4.60 6.39
Mean valuesSPC 8,08 5.83 5.77 9.14 8.11Coliform MPN 6.85 4.30 4.56 7.81 6.44E. coli MPN 6.49 3.51 3.87 7.07 6.07
C.D. for variation due to source of samples (at 5%): SPC=9.0xlog 10, MPN of coliform =--7.67 x log 10, MPN of E. coli— 7,06 x log 10.
T a b l e 2 . i n c i d e n c e o f s a l m o n e l l a i n f r e s h p o r k
SAMPLES COLLECTED FROM DIFFERENT ABATTOIRS AND RETAIL SHOPS
Samples SalmonellaSource tested Samples+ ve Serotype
(No.) (No.) identifiedAbattoirModern 5 1 S. StanleySemi-modern 5 0 —
Rural 5 1 S. bareilly
Retail shopsNo. 1 5 1 S. bareillyNo. 2 5 0 —
samples collected from shop No. 1, shop No. 2 and modern slaughter house were non-significant. However, E. coli count of samples collected from rural slaughter house was significantly lower than that of the samples collected from shop No. 1.
Salmonella: The results of salmonella analysis showed that 12 per cent of samples of fresh pork were positive for salmonella and serotype isolates were S ■ bareilly andS. Stanley (Table 2). The samples collected from modern and rural slaughter houses and from retail shop No. 2 showed the presence of salmonella. Studies of Oesterem et al.13 and Swaminathan et al.2 showed that 12.9 and21.5 per cent of samples, respectively were positive for salmonella.
These data underscore the need to observe strict hygienic conditions during production and sale of fresh pork.
References1. Park, K. S., Bacterial contamination of meat during transport
from butchery to the home. Korean J, publ. Htth., 1971,8, 21.
2. Swaminathan, B., Link, M. A. B. and Ayres, J. C., Incidencesof salmonella in raw meat and poultry samples in retail stores. J. Fd prot., 1978, 41, 518.
272 JOURNAL OF FOOD SCIENCE AND TECHNOLOGY, VOL. 2 4 , SEPT./OCT. 1987
3. Dseo, L. and Engeli, P., Bacteriological control of mincedmeat in Zurich Sohweizer. Arch. Für Tier Heikunde., 1979, 121, 83.
4. Karim, M. I. A. and Yu, S. Y., Microbiological quality offresh frozen and frozen thawed meat. Malaysian appl. Biol. 1980, 9, 75.
5. Mulder, S. J. and Krol, B. Studies on the bacteriologicalfeatures of fresh meat. III. Effects at transport. Tijdschr. Voor Diergeneeskunde. 1976, 101, 1306.
6. Powers, E. M., Microbiological criteria for food in militaryand federal specification. / . Milk Fd Technol., 1976, 39, 55.
7. Methods o f Standard Plate Count o f Bacteria in Food Stuff.IS: 2402-1969, Indian Standards Institution, New Delhi.
8. Meat and M eat Products. Detection and Enumeration ofPresumptive Coliform Bacteria and Presumptive E. coli
(Reference method). Geneva International Standard, ISO 3811, 1979, 5 pp.....
9. Standard Methods for the Examination o f Dairy Products. American Public Health Association, New York, 1986, 2nd Edn.
10. Roberts, D., Boag, K., Hall, M. L. M. and Ship, C. R.,The isolation of salmonella from British pork sausages and sausage meat. J. Hyg., 1975, 75, 173.
11. Edwards, R. R. and Edwing, W. H., Identification o f Entero-bacteriaceae, Burgess Publ. Co. Minnesota, 1972, 3rd Edn.
12. Snedecor, G. W. and Cochran, W. G., Statistical Methods.Oxford and IBH Pub. New Delhi, 1968, 1st Edn., 258 pp.
13. Oesterem, J., Dekker, R., Wilde, G. J. A. De; Kempen deTroye, F. V. and Engels, G. B., Prevalence of compylo- bacter Jejuni and Salmonella during pig slaughtering. 1985, 7, 31.
A P P E A L
The late Prof. J. V. Bhat’s contribution to the cause of Indian science in general and microbiologyin particular is indisputable. In order to commemorate his endeavours, the J. V. Bhat Memorial Committeeconstituted by his students, colleagues and well wishers, plans to undertake a number of projects like, anational annual award for the best research work in microbiology carried out in India, a national awardfor the best publication in microbiology in Indian journals and merit scholarships for post-graduate studentsof microbiology.
•
For supporting these activities, it is proposed to raise a fund of Rupees five lakhs, to be collected over the next three years.
Your contribution, in one lumpsum or in 3 instalments can be paid by crossed cheque, payable in favour of “PROF. J. V. BHAT MEMORIAL FUND” and the same sent to Prof. J. V. Bhat Memorial Committee, c/o Dr. (Mrs) Y. M. Freitas, Microbiology Department, St. Xavier's College, Bombay-400 001.
Fabian FernandesPresident.Prof. J. V. BhatMemorial Committee.

B O O K R E V IE W S
Advances in Biochemical Engineering / Biotechnology, Vol. 32: Agricultural Feedstock and Waste Treatment and Engineering, Edited by A. Fiechter, Springer- Verlag, Berlin, Heidelberg, New York, 1985; pp: 267; Price: DM132.
The first chapter is on Industrial Processing and Products from the Jerusalem Artichoke by N. Kosaric,A. Wieczorek, G. P. Cosentino and Z. Duvnjak. Jerusalem artichoke gives high yields per hectare in terms of biomass. It contains substantial levels of carbohydrates and has been used as food as well as feed. Its production has declined over the years because tubers got preference. Production of ethyl alcohol and high- fructose syrup are described. Preparation of raw material, pretreatment of carbohydrates, optimisation of conditions for fermentation along with energy balance and economics are discussed for ethanol production. In this preparation of syrup, juice extraction, hydrolysis, purification and concentration steps are discussed.
The second chapter is on the Utilisation of Cheese Whey and its Components by N. Kosaric and Y. J. Asher. The author discusses various alcoholic beverages, xanthan gum etc. Hydrolysis of lactose and conversion to high fructose syrup have been described. It has also been shown how lactose could be utilised to produce lactic acid and single cell proteins. Finally, discussion on utilisation of whey proteins is also given. A detailed discussion on functional properties of whey protein concentrates has been presented and also the various uses of whey protein concentrates in food products.
The third chapter is on Bioconversion of Hemi- cellulosics by R. J. Mages and N. Kosaric. This chapter discusses the structure and availability of hemicellulose carbohydrates which comprise mostly pentose sugars and the biochemistry and process technology involved in their conversion to fuels and chemical feedstocks. In the discussion on hemicellulose utilisation various hydrolysis methods and bioconversion processes to ethanol are described. More discussion on economics of such processes would have been desirable.
The fourth chapter is on Mathematical Modelling, Parameter Identification and Adaptive Control of Single Cell Protein Processes in Tower Loop Bioreactors by R. Luttmann, A. Munack and M. Thoma. Among new types of bioreactors developed for large scale single cell protein (SCP) production, tower and tower loop reactors have been successfully used at pilot plant and production levels. A discussion of optimisation of SCP processes in tower loop reactors is given. Optimisation methods
are presented both for dynamically changing cultivation as well as for steady state behaviour with respect to SCP processes. Modelling of cultivation is presented with various parameters such as cell mass, oxygen, substrate, etc. Simulation and parameter identification methods are given and their application is shown with the help of experimental data. Finally, optimisation of continuous pilot plants is given describing the scale up, process parameters and steady state model. Method of evaluating the economy of the production process is also briefly discussed.
The last chapter is on Modelling, Optimisation and Control of semi-Batch Bioreactors by S. J. Parulekar and H. J. Lim. A number of products like antibiotics, organic acids, amino acids, proteins, cellomass and enzymes are produced by fed-batch process. A review of various models, structured and unstructured along with their applications is presented. Discussion on optimisation gives formulation of problem and its solution both for constant and non-constant biomass yield. Various control schemes are described along with the instrumentation and specific examples on control in biomass production and in antibiotic and enzyme production are discussed.
In the fine tradition of Advances of Biochemical Engineering/Biotechnology series, this volume does not come upto the expectation. The title of this volume is justified by first three chapters each of which is a short review of some moderately important areas. ‘Cultivation of Jerusalem Artichoke’ is so small as it does not have the importance of many other crops which could become potential sources for industrial exploitation. Cheese whey may be considered an important source of agricultural feed stock, a large proportion of which forms a waste at present and can be recovered and converted to useful products. Hemicellulosics have been glorified in the present volume showing only the research possibilities. In reality, the cost constraints are so great, most processes described will be uneconomical under present conditions.
The remaining chapters which form the bulk of the volume, although excellent reviews, do not really belong in this volume. Instead, the editors could have chosen various subjects which could merit mention in this volume. Many different wastes, agricultural and industrial, have promising applications and are being researched. Inclusion of some of these would have enhanced the usefulness of this volume.
J. S. Pai U.D.C.T., B o m b a y
27314

274 JOURNAL OF FOOD SCIENCE AND TECHNOLOGY, VOL. 24, SBPT./OCT. 1987
Evaluation of Certain Food Additives and Contaminants:Twentyninth Report of the Joint FAO/WHO ExpertCommittee on Food Additives, Technical ReportSeries 733, World Health Organisation, Geneva,1986; pp: 59; Price: Sw. fr. 9.
The report of the Joint FAO/WHO Expert Committee on Food Additives which met in Geneva on 3-12 June 1985 deals with topics like principles governing the toxicological evaluation of certain enzyme preparations, organic and inorganic acids and their salts, vegetable gums and also gives its comments on specific food additives based on the data available on toxicological studies. The report deals with the following:
(a) While considering enzyme preparations, lot of stress was made on the testing requirements for immobilised enzymes and immobilising agents.
(b) ADI values for certain inorganic and organic acids and their salts with cations comprising A1+++, Ca++, Fe++, Mg++, K +, Na+ and anions such as, acetate, adipate, fumarate, sorbate, carbamate, silicate, sulphate, etc. were proposed.
(c) Specific food additives under the headings: enzyme preparations and enzyme immobilising agents, flour treatment agents, flavouring agents, food acids and their salts, food colour, sweetening agents, thickening agents and miscellaneous food additives have been commented upon based on the available toxicological data.
0d) While evaluating food colours, particularly different caramels 2-acetyl-4(5)-tetrahydroxy butyl imidazole (THI) in caramel prepared by ammonia process was considered as lymphocyte depressant and was given an ADI of 0-200 mg/kg b.w. Similarly, 4- methyl imidazole was considered while evaluating caramel prepared by ammonia sulphite process. The report indicates the preparation of a consolidated toxicological monograph on different caramels.
(e) Certain details on establishment, revision and withdrawal of certain specifications for antioxidants, emulsifying agents, extraction solvents, sweetening agents, thickening agents were given.
( / ) The report recommends the future programme on various items including establishment of tolerable intakes of lead for infants and children which is of great relevance to people working on food safety assurance programme.
There are four annexures-Annexure I deals with the report and other documents resulting from previous meetings of the Joint FAO/WHO Expert Committee on Food additives, Annexure 2: Acceptable daily intakes, other toxicological recommendations and information on specifications. Annexure 3-Further toxicological studies and information required or desired by the Committee. Annexure 4 deals with matters arising from
the reports oi Sessions of the Codex Committee on Food Additives.
This report will be useful for persons working on various aspects of food additives and researchers of food safety evaluation.
K. V. N agaraja C.F.T.R.I., Mysorb
Produce Handling, Packaging and Distribution: byKalman Peleg, AVI Publishing Company Inc., WestPost Connecticutt, U. S. A., 1985; pp: 625; Price:$ 135.
The number of books on the subject of fresh produce handling and packaging is rather limited considering the extensive R & D output in this area. It is only in recent years that the number of books on this subject appears to be on the increase. The present volume by K. Peleg is a very welcome addition to the growing list of books in this field.
In 18 chapters, the author has endeavoured to cover various aspects of fresh produce handling and packaging from the field to the distribution centre having the prevelent system in the west as the back drop. Each chapter ends with a comprehensive bibliography and summary. The real feature of the book is the in-depth treatment of the approach to some of the packaging problems which still engage the attention of the researchers. There is a copious use of mathematics obviously treating the subject on a technical plane. However, there are some chapters almost completely descriptive and understandable to those without much mathematical background.
The fust three chapters cover preliminary operations from the time of harvest, viz. harvesting techniques, maturity standards, pre-treatments for storage etc. as is in vogue in advanced countries.
The next three chapters deal with sorting operations sizing and sizing machines, grading and the theory and techniques behind these operations. The adoption of optical grading machines X-ray and 7 -ray techniques for grading serve to highlight the importance given to the grading, which in India is done only manually and restricted to very few commodities.
Chapter 7 gives a mathematical treatment of packing patterns of the produce in containers, assuming a spheroidal shape for the content. The counts, packing density, have all been worked by using mathematics. The relative merits of jumble packs and pattern packs have also been highlighted.
In chapter 8, computer programmes for stacking pattern foims leading to optimal container selection has been presented. This provides necessary guidance for

BOOK REVIEWS 275
tackling problems on better volume utilisation of container space.
The whole sale produce packaging, the FCC produce packaging system and retail produce packaging are discussed in chapters 9, 10 and 11. The chapter on whole sale produce packaging, presents the technological economic and protective features of the different packing systems like the jumble pack, pattern pack and cell packs commonly adopted in Transport packs. The filling machines are also described.
The FCC produce packaging system being the outcome of the author’s research over several years is thoroughly discussed in chapter 10. The abbreviation FCC stands for ‘Face Centered Cubic ‘structure the densest’ atomic lattice'. Adoption of this pattern provides for “better volume utilisation of the shipping container, thereby saving on the material storage and transportation costs” .
The retail packing or consumer packing and the recent trends therein are presented in Chapter 11. A brief treatment of pre-packaging is also presented.
The subject of shipping containers is dealt in chapters 12 and 15. Corrugated fibreboard containers get a very extensive treatment since they happen to be the most widely used ones in fresh produce trade in all advanced countries.
The highlight of chapter 15 is the detailing of container design procedures using the data on static strength and dynamic strength of containers. The theoretical basis adopted in design procedure is elucidated in eachcase.
The handling and transportation of unit loads is discussed in chapter 13, detailing the procedures followed in road, rail car, marine and air transports. The pelletisation and .containerisation are also dealt in brie!.
The next chapter (chapter 14) discusses the transportation environment, introducing the reader to the basics of the theory of vibration and shock.
Chapter 16, on package-produce testing is utilised to describe the testing machines and methods of measurement of shock and vibration and compression. The theoretical basis underlying these tests and their relative merits are given a fairly adequate treatment.
Since the fresh produce are treated as viscoelastic materials, the rheological behaviour of these are sought to be explained by appropriate models. This forms the subject matter of chapter 17.
The concluding chapter (18) discusses mechanical injury to the produce in processing storage and distribution. The needs and different approaches to quantify the damage and indirect methods of damage evaluation are described in brief.
The book ends with 5 useful appendices inclusive of
two computer programme print-outs and one on small statistics which is very useful to the research worker whereas the computer programmes will be of interest for problems in pelletising and container loading.
On the whole, the book is sure to delight the researchers in fresh produce packaging. Since here is a single source which fulfills several needs, as an inventory of latest research, an advanced technical text book, and an information guide for developments abroad. Despite limitations like the technical treatment being severely limited to spherical fruits, like the apple, and being biassed heavily towards the situations obtaining in advanced west, the book is one of the best to appear in this field in recent times.
A. R. Vijayendra Rao C.F.T.R.I., Mysore
Season to Taste: by Colin Dence, Food Trade Press Ltd., 29, High Street, Green Street Green, Orpington BR6 6LS Kent, England; 1985; pp. 165; Price. £ 19.5 in U.K., & Europe, £ 23, Outside Europe including Air Mail Postage.
The book fulfills the long felt need on the role of seasoning in food by describing the desirability, com- patability and the effect of various seasonings on the palatability of food. It has been divided into three basic sections. The first section deals with the various types of seasonings, those which are used for addition of particular aroma to food and those that affect the taste. The importance of interactions of taste and aroma in relation to seasonings have also been discussed.
The second part deals with the history and origin of seasonings, agricultural aspects of each spice and herb and their individual and combined uses, the various recipes of the past, the culinary practice of medieval world and the changes which have led to the present day practice of use of spices. Different seasoning affinities based on the nature of the food viz., sweet, sweet-sour or savory, have been discussed. The past and present cooking practices of Roman Lombard, French and English have been discussed with particular reference to seasonings.
The third part deals with present day seasonings, balancing various spice flavours, compatability of each spice in a recipe and harmony of the flavours in detail. An attempt has been made to answer the question “Why use seasoning at all?”
On the whole, this is a good book throwing some light on the theory and practice of seasoning food. The price of the book is too high.
D . RAJALAKSHMI C.F.T.R.I., Mysore

AFST(I) NewsBombay Chapter
The Annual General Body Meeting of the Bombay Chapter was held on Saturday, the 20th June 1987. A lecture on “Emerging Scenario in Chemical Industries” by Prof. M. M. Sharma, FNA, Head, Chemical Engineering Division, B.U.D.C.T., Bombay was also organised on this occasion.
The results of the elections to the Local Executive Committee (LEC) for 1987-88 were declared. The following members and office-bearers were elected.
Members : Prof. K. M. Agashe Dr. H. R. Adhikari Dr, S. V. Bhalkar Dr. D. R. Bongirwar Dr. D. P. Nerkar Dr. S. V. Padgaokar Mr. N. A. Pandit Dr. S. B. K. Warrier Mr. L. K. Shah (Ex-officio)
PresidentVice-Presidents
Hon. Secretary Hon. Jt. Secretary Hon. Treasurer
Dr. P. J. Dubash Dr. C. L. Nagarsekar Mr. S. V. Krishnaswamy Dr. A. S. Gholap Dr. G. M. Tewari Dr. S. R. Padwal-Desai
Co-opted Members : Dr. C. P. S. Menon Dr. J. S. Pai Mr. J. K. Sanzgiri Dr. R. R. Mallya Dr. R. Y. Angle Dr. (Mrs.) Sucy Eapen
276

S3E
EE
EE
EE
EE
EE
EE
EE
EE
EE
EE
EE
EE
EE
EE
EE
EE
EE
EE
EE
EE
EE
EE
EE
INSTRUCTIONS TO AUTHORS1. Manuscripts of papers (in triplicate) should be typewritten in double space on one side of bond
paper. They should be complete and in final form, since only minor corrections are allowed at the proof stage. The submitted paper should not have been published or data communicated for publication anywhere else. Only invited review papers will be published.
2. Short communications in the nature of Research Notes should clearly indicate the scope of the investigation and the salient features of the results.
3. Names of chemical compounds and not their formulae should be used in the text. Methods of sampling, number of replications and relevant statistical analyses should be indicated. Superscripts and subscripts should be legibly and carefully placed. Foot notes especially for text should be avoided as far as possible.
4. Abstract: The abstract should indicate the principal findings of the paper. It should be about 200 words and in such a form that abstracting periodicals can readily use it.
5. Tables: Tables as well as graphs, both representing the same set of data, should be avoided. Tables and figures shoujd be numbered consecutively in Arabic numerals and should have brief titles. They should be ty ped on separate sheets. Nil results should be indicated and distinguished clearly from absence of data, which is indicated by ’ sign. Tables should not have more than nine columns.
6. Illustrations: Graphs and other line drawings should be drawn in Indian ink on tracing paper or white drawing paper preferably art paper not bigger than 20 cm (oy axis) x 16 cm (ox axis). The lettering should be such that they are legible after reduction to column width. Photographs must be on glossy paper and must have good contrast; three copies should be sent.
7. Abbreviations of the titles of all scientific periodicals should strictly conform to those cited in the World List of Scientific Periodicals, Butterworths Scientific Publication, London, 1962.
8. References: Names of all the authors along with title of the paper should be cited completely in each reference. Abbreviations such as el al., ibid, idem should be avoided.
The list of references should be included at the end of the article in serial order and the respective serial number should be indicated in the text as superscript.
Citation of references in the list should be in the following manner:(a) Research Paper: Jadhav, S. S. and Kulkarni, P. R., Presser amines in foods. J. Fd Sci-
Technol., 1981, 18, 156.(b) Book: Venkataraman, K., The Chemistry of Synthetic Dyes, Academic Press, Inc., New
York, 1952, Vol. II, 966.(c) References to article in a book: Josbi, S. V., in The Chemistry of Synthetic Dyes, by
Venkataraman, K., Academic Press, Inc., New York, 1952, Vol. II, 966.(if) Proceedings, Conferences and Symposia Papers: Nambudiri, E. S. and Lewis, Y. S., Cocoa
in confectionery, Proceedings of the Symposium on the Status and Prospects of the Confectionery Industry in India, Mysore, May 1979, 27.
(e) Thesis: Sathyanarayan, Y., Phytosociological Studies on the Calcicolous Plants of Bombay,1953, Ph.D. Thesis, Bombay University.
( / ) Unpublished Work: Rao, G., unpublished, Central Food Technological Research Institute, Mysore, India.
9. Consult the latest issue of the Journal for guidance and for “Additional Instructions for Reporting Results of Sensory Analysis” see issue No. 1 of the Journal.
OIE
EE
EE
EE
EE
EE
EE
EE
EE
EE
EE
EE
EE
EE
EE
EE
EE
EE
EE
EE
EE
EE
EE
EE

R EG . NO. 24918/64
JOURNAL OF FOOD SCIENCE AND TECHNOLOGYVol. 24. No. 6 Contents of forthcoming issue Nov./Dec. 1987
Research PapersN IS IN A S A N ATD F O R T H E R M A L P R E S E R V A T IO N O F IN D IA N D IS H E S — UPMA & KHEER by L o k e n d ra
Singh, M . S. Mohan and R. Sankaran
S T U D Y O F P H Y S IC A L P R O P E R T IE S , M IL L IN G P E R F O R M A N C E A N D C O O K IN G T IM E O F M IN O R M IL L E T Sby B. L. Mandhyan, S. K. Shanna and H. R. Tyagi
E F F E C T O F A D D IT IO N O F D E F A T T E D S O Y F L O U R O N P H Y S IC O -C H E M IC A L C H A R A C T E R IS T IC S A N D A C C E P T A B IL IT Y O F G R E E N G R A M (M O O N G ) B A R IA N by Meena Tandon and Gummukh Singh
O N F A C T O R S A F F E C T IN G T H E A C ID IT Y O F S O F T D O U G H B IS C U IT S by C. N. Vatsala and P. Haridas Rao
D E T E C T IO N O F B E E F A N D P O R K IN F R E S H A N D H E A T T R E A T E D M E A T P R O D U C T S U S IN G E N Z Y M E IM M U N O A S S A Y by E. K. Kang’Ethe, and K. J. Lindqvist
S P E C IE S D IF F E R E N T IA T IO N IN R A W A N D H E A T T R E A T E D M E A T S U S IN G S E R O L O G IC A L M E T H O D S (A G A R G E L P R E C IP IT A T IO N T E S T S ) by A .T . Sherikar, J. B. Khot, B. M . Jayarao and S. R. Pillai
S T U D IE S O N S 0 2 T R E A T M E N T O F M IN C E D G O A T M E A T . I . E F F E C T O N S T O R A G E L IF E A N D O R G A N O L E P T IC Q U A L IT IE S by K. S . Reddy and Usha V. Mandokhot
C H A N G E S I N F L E S H L IP ID S O F S E E R F IS H D U R IN G F R O Z E N S T O R A G E by A. A. Fazal and L. N, Srikar
S E L E C T IV E G R IN D IN G A S A B A SIS F O R S E P A R A T IN G W H IT E P E P P E R by P. P, Thomas, A. Nirmala Menon, A. V. Bhat and A. G. Mathew
C O L O R IM E T R IC M E T H O D F O R T H E D E T E R M IN A T IO N O F C A R B E N D A Z IM (M B C ), B E N O M Y L A N D T H E IR D E G R A D A T IV E P R O D U C T — 2 .-A M IN O B E N Z IM ID A Z O L E by J. R. Rangaswamy, Y. N. Vijayashankar and S. R . Prakash
Research NotesA P P L IC A T IO N O F G A R C IN O L A S A C O L O U R A N T F O R B U T T E R A N D G H E E A N D M E T H O D O F IT S
E S T IM A T IO N by N. Krishnanwrthy and S. R. Sampathit
G E N E T IC V A R IA B IL IT Y IN T H E M IL L IN G A N D V E R M IC E L L I Q U A L IT Y O F S O M E IN D IA N D U R U M W H E A T C U L T IV A R S by D. Indrani, S. Sukanya and J. S. Sidhu
F L O U R M IL L S T R E A M S . S T U D Y O F P H Y T IC A C ID D IS T R IB U T IO N by D, Indrani, K. Leelavathi and J. S . Sidhu
U S E O F N O N -C O N V E N T IO N A L C O A G U L A N T S IN T H E M A N U F A C T U R E O F PANEER by S. Sachdeva and S. Singh
U T IL IZ A T IO N O F W H E Y F O R T H E P R O D U C T IO N O F B E T A -G A L A C T O S 1 D A S E B Y H ELM IN TH O SPO RIU M O R IZA E by Rakesh Mathur, S. K. Garg and Sanjeev Agrawal
D IS IN F E S T A T IO N O F W H O L E A N D G R O U N D SP IC E S B Y G A M M A IR R A D IA T IO N by S. R. Padwal-Desai, Aritn Shanna and S. V. Amonkar
T H Y M O L — A S E C O N D A R Y P R O D U C T F R O M C A L L U S C U L T U R E S O F A JO W A N (C ARU M COPTICUM)by Reim Agrawal and M . V. Patwardhan
M Y C O T O X IN S IN S P IC E S . I I I . IN V E S T IG A T IO N O N T H E N A T U R A L O C C U R R E N C E O F A F L A T O X IN S IN C O RIANDERUM SA TIV U M L . by N . Misra
Printed and Published by T. S. Satyanarayana Rao, Secretary, AFST(India), CFTR1, Mysore-570 013, at Sharada Press, Mangalore-575 001


![The American Legion [Volume 123, No. 1 (July 1987)]](https://static.fdokumen.com/doc/165x107/6319d6814cd7b344240934ae/the-american-legion-volume-123-no-1-july-1987.jpg)