Special Topic - Journal of Agriculture, Food Systems, and ...
196
Journal of Agriculture, Food Systems, and Community Development Volume 1, Issue 2 Fall 2010 Published online at www.AgDevJournal.com New Leaf Associates, Inc. ISSN 2152-0801 (online only) Special Topic: Urban Agriculture
-
Upload
khangminh22 -
Category
Documents
-
view
0 -
download
0
Transcript of Special Topic - Journal of Agriculture, Food Systems, and ...
Journal of Agriculture, Food Systems, and Community Development
Volume 1, Issue 2 Fall 2010
Published online at www.AgDevJournal.com New Leaf Associates, Inc. ISSN 2152-0801 (online only)
Special Topic: Urban Agriculture
Journal of Agriculture, Food Systems, and Community Development Publisher and Editor in Chief: Duncan L. Hilchey [email protected] / +1 (607) 342-0259 / Skype: duncan.hilchey
Managing Editor: Amy S. Christian / [email protected] / +1 (607) 342-0258 / Skype: amy.christian295
Advisory Committee Laura Brown, University of Wisconsin Cooperative
Extension (USA)* Kate Clancy, Minnesota Institute for Sustainable
Agriculture (USA) Nevin Cohen, The New School (USA)* David Conner, University of Vermont (USA)* Cornelia Butler Flora, Iowa State University (USA) Julia Freedgood, American Farmland Trust (USA)* Gilbert W. Gillespie, Cornell University (Retired)
(USA)* R. Bruce Gregory, Farmer, Mitchell Bay Farm &
Nursery (USA)*
Shermain Hardesty, University of California (USA)* John Ikerd, University of Missouri, Columbia
(Emeritus) (USA)† Anupama Joshi, National Farm to School
Network/Occidental College (USA)* Larry Lev, Oregon State University (USA) Fred Magdoff, University of Vermont (Emeritus)
(USA) Ken Meter, Crossroads Resource Center (USA)* † Joseph McIntyre, Ag Innovations Network (USA)* † Rich Pirog, Iowa State University (USA) Ken Robinson, Clemson University (USA)
John Smithers, University of Guelph (Canada) G. W. (Steve) Stevenson, University of Wisconsin-
Madison (USA) Dawn Thilmany McFadden, Colorado State University
(USA) Mark Winne, Community Food Security Coalition
(USA) Larry Yee, Fairhaven Strategy Group (USA) Rami Zurayk, American University of Beirut
(Lebanon)* †
* Also serve on editorial committee. † Also write a regular column.
Editorial Committee Paivi Abernethy, University of Waterloo (Canada) Mahbubul Alam, Ehime University (Japan) Kristy Apostolides, Mediterranean Agronomic Institute
of Chania (Greece) Mary Margaret Barth, Responsible Source, UIUC
(USA) Sandip Banerjee, Hawassa University (India) Herb Barbolet, Simon Fraser University, Centre for
Sustainable Community Development (Canada) Ricky Martin Bates, Penn State University (USA) Molly K. Bean, The Ohio State University (USA) Anne C. Bellows, University of Hohenheim (Germany) Rachelle Bostwick, Farmer, Earthkeeper Farm (USA) Rebecca Briggs, Biodynamic Farming and Gardening
Association (USA) Marcia Caton Campbell, Center for Resilient Cities
(USA) Megan Carney, U.C.–Santa Barbara (USA) Christine C. Caruso, City Univ. of New York (USA) Gina Cavallo Collins, Farmer, Victory Farms, Inc.
(USA) Sean Connelly, Alberta Social Economy Research
Alliance Centre for Sustainable Community Development (Canada)
Hendrik deWilde, The Gabriola Commons (Canada) Michael L. Dougherty, University of Wisconsin–
Madison (USA) Leslie Duram, Southern Illinois University (USA) Patti Taranto Erickson, Salisbury University (USA) Ayman Ekram Fahim, Suez Canal University (Egypt) Anna Fedman, Univ. of California–Berkeley (USA) Melissa Fernandez Arrigoitia, London School of
Economics (UK) Rok Fink, Univerza v Ljubljani (Slovenia) Danielle Nicholas Fisher, Farmer, Eagle Ridge Ranch,
Bozeman, MT (USA) Claire Franek, Retired librarian (USA) Nancy Franz, Iowa State University College of Human
Sciences (USA) Lynn Fredericks, FamilyCook Productions (USA) Hanna Garth, Univ. of California–Los Angeles (USA) Stephan Goetz, Northeast Regional Center for Rural
Development (USA) Carol Goland, Ohio Ecological Food and Farm
Association (USA) Sheila L. Gray, Washington State Univ.–Lewis County
Extension (USA) Angela Gordon Glore, AmeriCorps/VISTA (USA) Janet Guss Darwich, Research Scientist: Feeding
Behavior (USA)
Leslie Hossfeld, University of North Carolina–Wilmington (USA)
Susanne Howard, Missouri State University (USA) Guiping Hu, Iowa State University (USA) Lauren Hunter, Coop. Extension, Univ. of Idaho-
Blaine County (USA) Valerie Imbruce, Bennington College (USA) George Irwin, Green Living Technologies (USA) Douglas Jack, Food Producer, Sustainable
Development Corp. (Canada) Matthew James, Garifuna Seafood Collective (Belize) Hugh Josephs, Tufts University (USA) Joel Kimmons, Centers for Disease Control and
Prevention (USA) Franz Klingender, Canada Agriculture Museum
(Canada) Jasenka Gajdoš Kljusurić, Prehrambeno Biotehnoloski
Fakultet (Croatia) Fiona Knight, Private food system consulting practice
(Canada) Uma Koirala, Tribhuvan University (Nepal) Jane Kolodinsky, University of Vermont (USA) Lori Dawn Kulhavy, Farmer, The Maui Farm, Inc.
(USA) John D. Lee, Farmer, Allandale Farm, Inc. (USA) Kristi Lekies, The Ohio State University (USA) Dale Levering, LCC International University
(Lithuania) Charles Levkoe, University of Toronto (Canada) Matt Lobley, University of Exeter (UK) Bohdan Lojka, Czech University of Life Sciences
(Czech Republic) Uford A. Madden, Florida A&M University (USA) Lisa Markowitz, University of Louisville (USA) Derek Masselink, Masselink Environmental Design
(Canada) Mike McDonald, Florida Gulf Coast University (USA) Jesse C. McEntee, Cardiff University (UK) Laura McGough, University of Maryland, Baltimore
County (USA) Jesse C. McEntee, Cardiff University (UK) Bethann G. Merkle, Missoula Urban Demonstration
Project (USA) Bernadette Montanari, Univ. of Kent, Canterbury (UK) Vicki Morrone, Michigan State University (USA) Heidi Mouillesseaux-Kunzman, Cornell Univ. (USA) Phil Mount, University of Guelph (Canada) Scot Nelson, University of Hawaii at Manoa (USA) Kim L. Niewolny, Virginia Tech (USA) Kimberly Norris, University of Maryland (USA)
Lydia Oberholtzer, Penn State University (USA) Fernando Ona, Indiana University (USA) Aleck Ostry, University of Victoria (Canada) Isidro Ovando-Medina, Center of Biosciences, Univ. of
Chiapas (Mexico) Mary Peabody, Northeast Regional Center for Rural
Development (USA) Francois Pelatan, AMAP Dordogne (France) Greg Pillar, Queens University of Charlotte (USA) William A. Powers, Nebraska Sustainable Agriculture
Society (USA) Madeleine Pullman, Portland State University (USA) Md. Masud Parves Rana, Rajshahi University
(Bangladesh) Taylor Reid, Michigan State University (USA) Kristin A. Reynolds, The New School, New York
(USA) David Richey, Lane Council of Governments (USA) Antonio Roman-Alcalá, Alemany Farm (USA) Natalie R. Sampson, Univ. of Michigan, School of
Public Health (USA) Valerie M. Scopaz, VMS Planning Services (USA) Uma i Shankari, Rashtriya Raithu Seva Samithi, a
farmers’ organization (India) Peggy Smith-Eppig, Maryland Agricultural Education
Foundation (USA) Christopher Sneed, The University of Tennessee
Extension–Blount County (USA) Lois Stanford, New Mexico State University (USA) Garry Stephenson, Oregon State University (USA) Bill Swanson, Valentine Hill Farm (USA) Diana Vergis Vinh, Public Health Department, Seattle
(USA) Jessy Van Wyk, Cape Peninsula University of
Technology (South Africa) Christina von Roedern, Farm apprentice and MS
degree candidate (USA) Gerald W. Warmann, South Dakota State Univ. (USA) Sue D. Weant, Partners for Family Farms (USA) E. Christian Wells, University of South Florida (USA) Bob Weybright, Weybright & Associates, Inc. (USA) Melissa White Pillsbury, Maine Organic Farmers and
Gardeners Association (USA) Niki Whitley, North Carolina A&T State Univ. (USA) Mollie Woods, Michigan State University (USA) Jen Wrye, Carleton University (USA) Steve Young-Burns, PastureLand Cooperative and
freelance food writer (USA) Lorna Zach, University of Wisconsin (USA)
The Journal of Agriculture, Food Systems, and Community Development is published quarterly (August, November, February, May) by New Leaf Associates, Inc., ISSN 2152-0801 (online only). Corporate office: 295 Hook Place, Ithaca, NY 14850 USA
Online subscriptions: Farmer/Student/Sole Proprietor: USD39; Agency/Nonprofit Staffperson: USD49; Faculty/Consultant/Corporate Employee: USD69; Institutional Library: USD179–502 (based on FTE students).
Copyright © 2011 by New Leaf Associates, Inc. All rights reserved. The publisher assumes no responsibility for any statements of fact or opinion expressed in these published papers. No part of this publication may be reproduced, stored, transmitted, or disseminated in any form or by any means without prior written permission from New Leaf Associates, Inc. For permission to reuse material from JAFSCD, please go to www.copyright.com or contact the Copyright Clearance Center, Inc. (CCC), 222 Rosewood Drive, Danvers, MA 01923 USA, +1-978-750-8400. CCC is a not-for-profit organization that provides licenses and registration for a variety of uses.
Volume 1, Issue 2 / Fall 2010
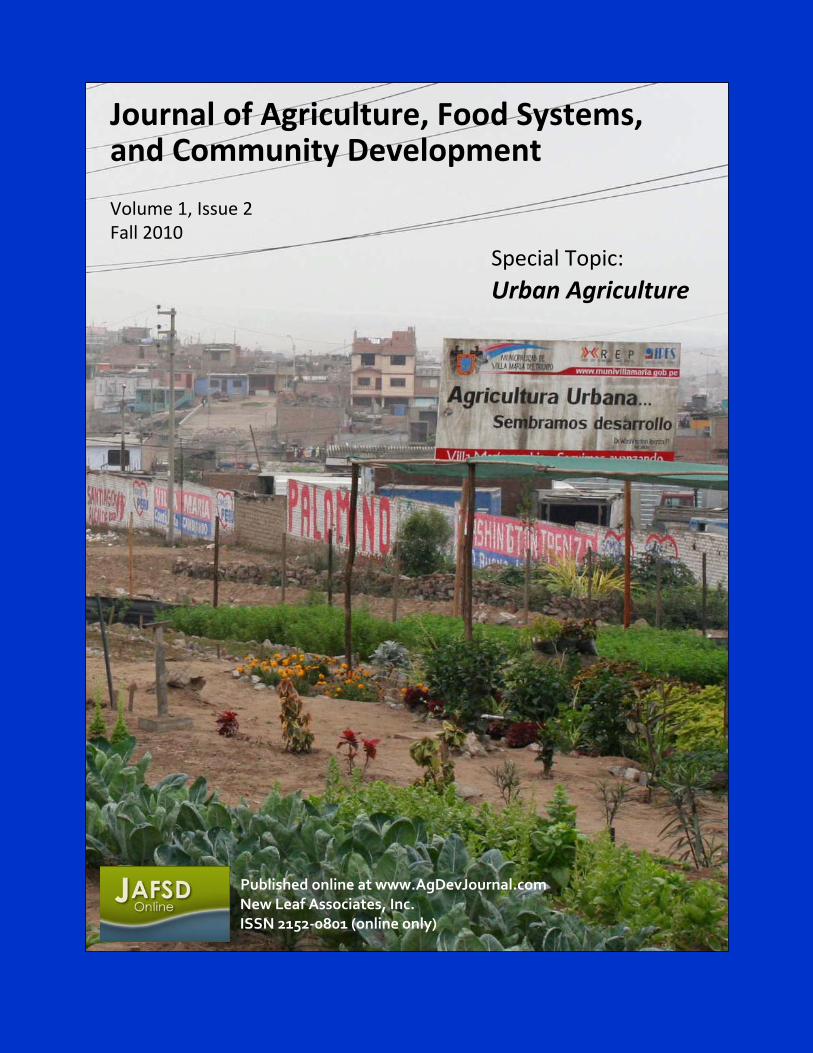
Cover: A community garden in Villa María del Triunfo, Lima, Peru, makes use of vacant land under high-tension wires. Participating households increase their family nutrition and also sell surplus production for some additional income. Photo copyright © 2010 by Marielle Dubbeling.
Journal of Agriculture, Food Systems, and Community Development ISSN: 2152-0801 online www.AgDevJournal.com
Volume 1, Issue 2 / Fall 2010 i
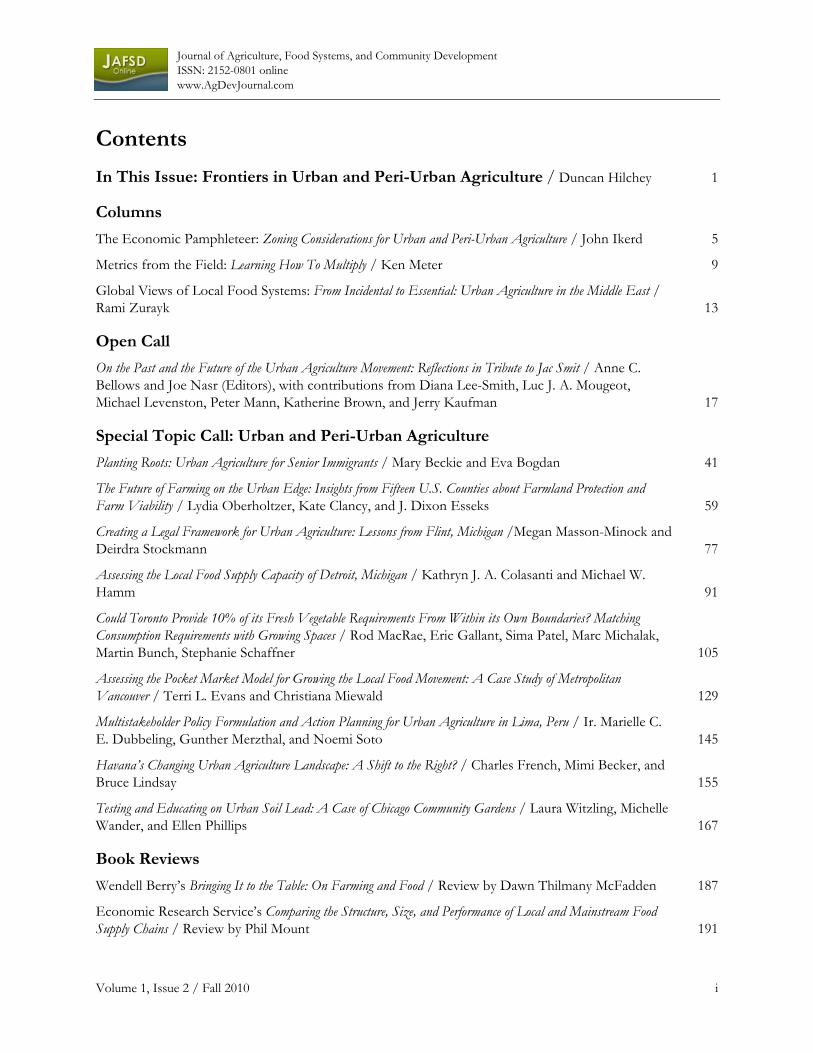
Contents In This Issue: Frontiers in Urban and Peri-Urban Agriculture / Duncan Hilchey 1
Columns
The Economic Pamphleteer: Zoning Considerations for Urban and Peri-Urban Agriculture / John Ikerd 5
Metrics from the Field: Learning How To Multiply / Ken Meter 9
Global Views of Local Food Systems: From Incidental to Essential: Urban Agriculture in the Middle East / Rami Zurayk 13
Open Call
On the Past and the Future of the Urban Agriculture Movement: Reflections in Tribute to Jac Smit / Anne C. Bellows and Joe Nasr (Editors), with contributions from Diana Lee-Smith, Luc J. A. Mougeot, Michael Levenston, Peter Mann, Katherine Brown, and Jerry Kaufman 17
Special Topic Call: Urban and Peri-Urban Agriculture
Planting Roots: Urban Agriculture for Senior Immigrants / Mary Beckie and Eva Bogdan 41
The Future of Farming on the Urban Edge: Insights from Fifteen U.S. Counties about Farmland Protection and Farm Viability / Lydia Oberholtzer, Kate Clancy, and J. Dixon Esseks 59
Creating a Legal Framework for Urban Agriculture: Lessons from Flint, Michigan /Megan Masson-Minock and Deirdra Stockmann 77
Assessing the Local Food Supply Capacity of Detroit, Michigan / Kathryn J. A. Colasanti and Michael W. Hamm 91
Could Toronto Provide 10% of its Fresh Vegetable Requirements From Within its Own Boundaries? Matching Consumption Requirements with Growing Spaces / Rod MacRae, Eric Gallant, Sima Patel, Marc Michalak, Martin Bunch, Stephanie Schaffner 105
Assessing the Pocket Market Model for Growing the Local Food Movement: A Case Study of Metropolitan Vancouver / Terri L. Evans and Christiana Miewald 129
Multistakeholder Policy Formulation and Action Planning for Urban Agriculture in Lima, Peru / Ir. Marielle C. E. Dubbeling, Gunther Merzthal, and Noemi Soto 145
Havana’s Changing Urban Agriculture Landscape: A Shift to the Right? / Charles French, Mimi Becker, and Bruce Lindsay 155
Testing and Educating on Urban Soil Lead: A Case of Chicago Community Gardens / Laura Witzling, Michelle Wander, and Ellen Phillips 167
Book Reviews
Wendell Berry’s Bringing It to the Table: On Farming and Food / Review by Dawn Thilmany McFadden 187
Economic Research Service’s Comparing the Structure, Size, and Performance of Local and Mainstream Food Supply Chains / Review by Phil Mount 191

Journal of Agriculture, Food Systems, and Community Development ISSN: 2152-0801 online www.AgDevJournal.com
ii Volume 1, Issue 2 / Fall 2010
Journal of Agriculture, Food Systems, and Community Development ISSN: 2152-0801 online www.AgDevJournal.com
Volume 1, Issue 2 / Fall 2010 1
IN THIS ISSUE DUNCAN HILCHEY Frontiers in urban and peri-urban agriculture
Published online February 2011 Citation: Hilchey, D. (2010, Fall). In this issue: Frontiers in urban and peri-urban agriculture. Journal of Agriculture, Food Systems, and Community Development, 1(2): 1–3. doi:10.5304/jafscd.2010.012.016 Copyright © 2011 by New Leaf Associates, Inc.
Important note from the publisher: JAFSCD is now following an advance publication schedule — and subscribers receive notification of new postings!
JAFSCD is dedicated to publishing the most up-to-date applied research on agriculture and food system–based community development. To further this mission, we are “prepress” publishing our content, beginning with this issue. Instead of waiting for all of the accepted papers, commentaries, columns, and book reviews to be completed before publishing an entire issue, we are publishing all content online as it is ready.
The publishing process is a long one, especially for a peer-reviewed journal. Prepress publishing will get timely material in your hands as quickly as possible. If you’re a subscriber, you’ll automatically receive announcements of new content via our iContact email list. You can also sign up for the RSS feed to receive notifications immediately. To do this, click on the orange feed icon for each category of article in which you are most interested.
Introduction to Urban Agriculture The special topic focus of JAFSCD volume 1, issue 2, is urban and peri-urban agriculture. While urban and peri-urban agriculture are common and often traditional aspects of food systems in the Global South, they are now on the rise in industrial countries as well, especially among ethnic immigrant groups in North America and Europe. The Food and Agriculture Organization (FAO) of the United Nations defines urban agriculture as “an industry that produces, processes and markets food and fuel, largely in response to the daily demand of consumers within a town, city, or metropolis, on land and water dispersed throughout the urban and peri-urban area, applying intensive production methods, using and reusing natural resources and urban wastes to yield a diversity of crops and livestock.”1 The findings of national censuses, household surveys, and research 1 http://en.wikipedia.org/wiki/Urban_agriculture
Journal of Agriculture, Food Systems, and Community Development ISSN: 2152-0801 online
www.AgDevJournal.com
2 Volume 1, Issue 2 / Fall 2010
projects suggest that up to two-thirds of urban and peri-urban households around the world are involved in agriculture. Much of the food produced is for their own consumption, with occasional surpluses sold to local markets.2
The expansion of urban and peri-urban agriculture is fueled by family economic situations as well as by growing interest among agencies and NGOs in greening and revitalizing cities, localizing food production, and promoting food sovereignty. These trends in urban and peri-urban agriculture are also accompanied by debates on related issues that include land use, public health, sanitation, and economic viability. Our intent for this special-topic call for papers is to help fill the significant deficit in the applied literature on trends and programming activities.
I want to express my appreciation to Anni Bellows and Joe Nasr, along with their colleague Gabriela Alcaraz V., for the colossal effort they put into our special tribute to Jac Smit, who passed away in 2009. Jac is sometimes referred to as the “father of urban agriculture” for his long career dedicated to bringing attention to urban agriculture and cultivating its expansion throughout the world. Jac’s legacy continues in the work of Anni and Joe — and countless others — who were deeply inspired by his intellect and passion.
In This Issue Rami Zurayk reveals the ephemeral nature in urban and peri-urban farming in the Middle East and the need for more stability in his Global Views of Local Food Systems column. John Ikerd’s The Economic Pamphleteer column “Zoning Considerations for Urban and Peri-Urban Agriculture” suggests using zoning ordinances to restrict farming to sustainable activities. And Ken Meter challenges the conventional wisdom of economic multipliers in his Metrics from the Field column.
This issue’s papers offer a smorgasbord of views on food production in a wide range of urban environments. Kathryn Colasanti and Michael Hamm estimate the capacity of the most famous American Rust Belt city — Detroit — to tap into its potential to produce food. In contrast, Rod MacRae and colleagues look at the capacity of the thriving metropolis of Toronto to increase its food production. Using Flint, Michigan, as an example, planners Megan Masson-Minock and Deirdra Stockmann offer a tool for North American cities to inventory ordinances that can affect the proliferation of urban agriculture. Mary Beckie and Eva Bogdan present the results of pilot project that uses SPIN gardening to help integrate immigrants into the community. In the context of Lima, Peru, Marielle Dubbeling, Gunther Merzthal, and Noemi Soto describe how a thoughtful stakeholder engagement process helps institutionalize urban agriculture and insure its sustainability. Lydia Oberholtzer, Kate Clancy, and J. Dixon Esseks reveal the challenges and opportunities of producers in the shadows of growing urban areas around the United States. Terri Evans and Christiana Miewald evaluate a new urban marketing strategy being put to use in Vancouver, Canada: the pocket farmers’ market. Charlie French, Mimi Becker, and Bruce Lindsay offer a provocative look at “Havana’s Changing Urban Agriculture Landscape.” And Laura Witzling, Michelle Wander, and Ellen Phillips study lead levels in a sample of community gardens in Chicago and make recommendations for testing, education, and abatement.
Finally, Dawn Thilmany McFadden reviews Wendell Berry’s collection of essays, Bringing It to the Table: On Farming and Food, and Phil Mount reviews the USDA Economic Research Service’s “Comparing the Structure, Size, and Performance of Local and Mainstream Food Supply Chains,” which includes a series of recent supply chain case studies in the U.S.
2 http://www.fao.org/ag/magazine/9901sp2.htm
Journal of Agriculture, Food Systems, and Community Development ISSN: 2152-0801 online www.AgDevJournal.com
Volume 1, Issue 2 / Fall 2010 3
Forthcoming in Issue 1, Volume 3 Look for these articles to be available online as soon as they are through the publishing process:
• In “Integrated Policy for Achieving Sustainable Peri-urban Fruit and Vegetable Production to Reach Healthy Consumption Targets in Victoria, Australia,” R. Carey, Kathy McConell, and colleagues examine that city’s challenge in protecting its Green Wedges — traditional peri-urban production areas.
• In “Building Gardens, Rebuilding a City: Baltimore’s Community Greening Resource Network,” Sarah Krones and Shari Edelson describe Baltimore’s successful adaptation of Detroit’s highly regarded Garden Resource Program Collaborative.
• In “Smallholder Peri-Urban Organic Farming in Nepal: A Comparative Analysis of the Farming Systems,” Gopal Bhatta documents the highly differentiated production strategies in Kathmandu, and makes a case for organic production as a viable alternative.
We appreciate your support and feedback as we continue publishing applied research on the intersection of agriculture and community development!
Publisher and editor in chief

Journal of Agriculture, Food Systems, and Community Development ISSN: 2152-0801 online
www.AgDevJournal.com
4 Volume 1, Issue 2 / Fall 2010
Journal of Agriculture, Food Systems, and Community Development ISSN: 2152-0801 online www.AgDevJournal.com
Volume 1, Issue 2 / Fall 2010 5
THE ECONOMIC PAMPHLETEER JOHN IKERD
Zoning considerations for urban and peri-urban agriculture
Citation: Ikerd, J. (2010, November). Zoning considerations for urban and peri-urban agriculture. Journal of Agriculture, Food Systems, and Community Development, 1(2): 5–7. doi:10.5304/jafscd.2010.012.001 Copyright © 2010 by New Leaf Associates, Inc.
Every year, about 1.2 million acres of U.S. farm-land is converted to residential and other commer-cial uses, according to the American Farmland Trust.1 This includes some of the most fertile farmland in the nation, as many of our major cities
1 American Farmland Trust, http://www.farmland.org/programs
were originally established in fertile farming areas. With more than 900 million acres of farmland remaining, we are not likely to run out of land for farming in the near future. However, farmland conversion is clearly putting the long-run sustainability of U.S. food production at risk.
Our current industrial food system is critically dependent on cheap fossil energy for fertilizer, machine operation, irrigation, and food manufac-
Why did I name my column “The Economic Pamphleteer”? Pamphlets historically were short, thoughtfully written opinion pieces and were at the center of every revolution in western history. Current ways of economic thinking aren’t working and aren’t going to work in the future. Nowhere are the negative consequences more apparent than in foods, farms, and communities. I know where today’s economists are coming from; I have been there. I spent the first half of my 30-year academic career as a very conventional free-market, bottom-line agricultural economist. I eventually became convinced that the economics I had been taught and was teaching wasn’t good for farmers, wasn’t good for rural communities, and didn’t even produce food that was good for people. I have spent the 25 years since learning and teaching the principles of a new economics of sustainability. Hopefully my “pamphlets” will help spark a revolution in economic thinking.
John Ikerd is professor emeritus of agricultural economics, University of Missouri, Columbia. He was raised on a small dairy farm in southwest Missouri and received his BS, MS, and Ph.D. degrees in agricultural economics from the University of Missouri. He worked in private industry for a time and spent 30 years in various professorial positions at North Carolina State University, Oklahoma State University, University of Georgia, and the University of Missouri before retiring in 2000. Since retiring, he spends most of his time writing and speaking on issues related to sustainability with an emphasis on economics and agriculture. Ikerd is author of Sustainable Capitalism; A Return to Common Sense; Small Farms Are Real Farms; Crisis and Opportunity: Sustainability in American Agriculture; and, just published, A Revolution of the Middle. More background and selected writings are at http://web.missouri.edu/~ikerdj.
Journal of Agriculture, Food Systems, and Community Development ISSN: 2152-0801 online
www.AgDevJournal.com
6 Volume 1, Issue 2 / Fall 2010
turing, transportation, and retailing. Industrial agriculture is also a major contributor to growing environmental problems. Although estimates vary, food production in the U.S. may account for up to 20% of all fossil energy use and something more than 20% of all greenhouse gas emissions. In addition, agriculture is the number one nonpoint source of pollution of U. S. rivers and lakes.2 With dwindling fossil energy supplies and rising environ-mental concerns, every acre of fertile farmland lost to development becomes more precious each year.
The local foods movement presents a prime oppor-tunity to address the problem of farmland conversion. Producing more of our food in and near major population centers would obviously preserve fertile farmland for future food produc-tion. People also become more aware of their inherent connectedness to the land when they live on or near farms. Thus, commercial farming in urban and peri-urban areas should encourage the transition from industrial to sustainable systems of farming and food production. However, as farms and residences increasingly rub shoulders, farms in urban and peri-urban areas will need to be “people-friendly” farms.
Many of the current conflicts associated with farming in urbanizing areas arise from industrial farming practices, such as aerial pesticide applica-tion and confinement animal feeding operations.3 Many residents in peri-urban areas logically refuse to be subjected to a daily dose of noxious odors or even an annual dose of toxic pesticides. In densely populated urban areas, the nuisance and health
2 U.S. Environmental Protection Agency, Managing nonpoint source pollution from agriculture, Pointer No. 6, EPA841-F-96-004F, http://water.epa.gov/polwaste/nps/outreach/ point6.cfm 3 American Farmland Trust, Sustaining farms on the urban edge, http://www.farmland.org/resources/sustaining-agriculture-in-urbanizing-counties
risks associated with industrial agriculture would be even less tolerable.
On the other hand, farms that use organic or other sustainable farming practices are good places to live on and live around. Anyone willing to adapt to life in the country would enjoy living next door to a sustainable farmer or even in a cluster development with residences strategically placed to accommo-
date the farming operation. Sustainable urban “farms”—on rooftops, in backyards, or on neighborhood farm-parks—would generate fewer odors, less noise, and fewer health risks than the garbage, traffic, and other daily perils of urban living. However, those who produce food in urban and peri-urban areas
must accept restrictions in their choices of enterprises to accommodate the preferred lifestyles of nearby residents.
Land is inherently a “public good” and must be used in ways that benefit the common good of society in general. This does not deny private property rights, which have always been limited rights of land use rather than absolute rights of land ownership. Zoning is a common means of limiting uses of private property. For example, people living in areas zones as “residential” cannot use their property for most commercial purposes. Even areas zoned “commercial” may be restricted as to what types of businesses may be operated, depending on their proximity to private residences, housing developments, schools, churches, or other noncommercial uses.
Zoning is a process by which the public, in essence, grants permission to landowners to use their land for certain limited purposes. Rezoning likewise requires public permission to change land uses. Rezoning may be done with or without the permission of the landowner. Private property rights are not absolute. They are granted by and
As farms and residences
increasingly rub shoulders,
farms in urban and peri-urban
areas will need to be
“people-friendly” farms.
Journal of Agriculture, Food Systems, and Community Development ISSN: 2152-0801 online www.AgDevJournal.com
Volume 1, Issue 2 / Fall 2010 7
may be revoked by the public through due processes of law.
Historically, agriculture has been exempt from many of the land use restrictions that apply to other types of commercial operations. Right-to-farm laws have exempted farmers from nuisance laws as long as they use “accepted and standard” farming practices, even in cases where such practices are detrimental to nearby property owners or the general public.4 The exemptions typically include noise, odors, visual clutter, and dangerous structures. Every state has some form of a right-to-farm law.
Right-to-farm laws became common in the U.S. during a time when a large segment of the popula-tion lived on a farm, had grown up on a farm, or had some direct knowledge of farm life. Farming was an accepted way of life and could not be deemed a nuisance legally by those who didn’t understand it. Perhaps most important, farming was very different from other commercial land uses. Farming at the time generally didn’t involve heavy applications of toxic liquids and poisonous gasses, constant loud noises, or even significant exposure to noxious odors.
Today, right-to-farm laws are being challenged in the courts because today’s large industrial farming
4 Wikipedia On-Line Encyclopedia, http://en.wikipedia.org/wiki/Right-to-farm_laws
operations are more like industry than agriculture. Fifty years of socioeconomic studies have verified that industrial agriculture not only diminishes property values and the quality of life of its neigh-bors, but also degrades the social and economic
well-being of communities in which it becomes commonplace.5 For example, the one thing on which advocates and opponents of large-scale confinement animal feeding operations seem to agree is the dissention these CAFOs invariably create in communities
where they attempt locate.
If food production is to become commonplace in urban and urbanizing areas, agriculture must accept the same types of restrictions as are common for other land uses. Zoned uses for “urban agricul-ture,” for example, might be limited to organic, bio-intensive, and other methods appropriate in densely populated areas. Most types of sustainable agriculture could be allowed on land zoned for peri-urban agriculture. Typical agriculture zoning and right-to-farm laws would be limited to traditional family farming operations. Industrial agriculture should be subject to the same zoning restriction and nuisance laws as any other industrial operation. If farmers resist reasonable land-use restrictions, food production will continue to be zoned out of urban and peri-urban areas.
5 Stofferahn, C. (2006, September). Industrialized Farming and Its Relationship to Community Well-Being: An Update of a 2000 Report by Linda Lobao, report prepared for the State of North Dakota, Office of the Attorney General, http://www.und.edu/org/ ndrural/Lobao%20&%20Stofferahn.pdf
If food production is to become
commonplace in urban and urbanizing
areas, agriculture must accept the
same types of restrictions as are
common for other land uses.

Journal of Agriculture, Food Systems, and Community Development ISSN: 2152-0801 online
www.AgDevJournal.com
8 Volume 1, Issue 2 / Fall 2010
Journal of Agriculture, Food Systems, and Community Development ISSN: 2152-0801 online www.AgDevJournal.com
Volume 1, Issue 2 / Fall 2010 9
METRICS FROM THE FIELD Blending insights from research with insights from practice KEN METER Learning how to multiply
Published online 24 January 2011
Citation: Meter, K. (2011, January). Learning how to multiply. Journal of Agriculture, Food Systems, and Community Development, 1(2): 9–12.
doi:10.5304/jafscd.2010.012.014
Copyright © 2011 by New Leaf Associates, Inc.
As I work across the country, I often get asked by local economic officials, or potential investors, what the economic impact would be if investments were made in community-based food activity.
This seems like one of the right questions to ask, but it is typically asked for the wrong reasons. First of all, in most communities the economic impact can be estimated fairly easily by knowing the amount of locally produced food that will be consumed by local people. Typically, especially when few firms are locally owned, all that is needed is to multiply these sales figures by 1.3 to get a reasonable minimum estimate of overall impact This is a typical multipler measurement in an
industrial farm community. A tribal reservation might be much lower, 1.1 or less.
I wince as people spend thousands of dollars to obtain a more elaborate value, including the number of jobs or new local sales revenue, that would be generated. As a former planning commissioner in my home town, I understand that these calculations are the currency around which
Community groups and local governments often spend money needlessly trying to conform to the wishes of developers and political leaders, rather than being able to set the terms of the development discussion to address local food visions. One of the key issues is the calculation of an economic multiplier for proposed projects. In this column, Ken Meter offers some perspectives from his work with local officials on how to frame the multiplier issue, and how simpler estimates might be calculated.
Ken Meter is president of Crossroads Resource Center in Minneapolis, Minnesota. He has performed 56 local food-system assessments in 23 states and one Canadian province; this information has promoted effective action in partner communities. He served as coordinator of the review process for USDA Community Food Project grants, and has taught economics at the Harvard Kennedy School and the University of Minnesota. He is co-convener of the Community Economic Development working group of the Community Food Security Coalition. A member of the American Evaluation Association’s Systems Technical Interest Group, Meter also serves as an Associate of the Human Systems Dynamics Institute. He serves as a contributing advisor to JAFSCD.
Journal of Agriculture, Food Systems, and Community Development ISSN: 2152-0801 online
www.AgDevJournal.com
10 Volume 1, Issue 2 / Fall 2010
local investment decisions are often made. The software that generates them is sound. Yet they are seldom satisfying totals.
An economic multiplier is a measure of how many times a dollar earned in one community cycles through that locale before it leaves. Strictly speak-ing, a multiplier only applies to a specific firm doing business in a specific context. If economic transactions cycle wealth back into the community, amplifying the local purchases made by a local business, the multiplier will be high. At minimum, as typically calculated, a multiplier must be 1.0. This means that each dollar a given business earns leaves the community immediately. If the multiplier is 2.0, this means that for each dollar earned, an additional dollar cycles through the locale—a total of two dollars. The larger the multiplier, the more a proposed investment might impact a local economy.
What such numbers do is lubricate a political process that wants to think in the short term and consider only short-term impacts. Civic official X can get in front of the cameras and say, “By investing Y dollars, we will generate Z jobs in our community.” Then attention shifts to the next project. Seldom does anyone do the research to find out whether those jobs were created, or whether they lasted.
Moreover, as one economic development official pointed out to me, local foods businesses are “small potatoes” compared to the more favored investments: housing projects and manufacturing plants.
The trouble with this line of reasoning is revealed in other, nonmultiplier studies. When American Farmland Trust measured the actual net tax base created by building new suburban housing, it discovered that the costs of public services typically exceeded the new tax base that was created: that is, new housing is typically a losing proposition for the municipality’s long-term tax base.
Increasingly, I find economic developers saying they invested in factories only to find that once the
incentives were used up, the factory moved to a different state or nation, because it got incentives (or cheaper labor) in its new location.
After the official who considered local foods initi-atives to be tiny tubers offered his opinion, some-one in the room had the courage to point out that few housing and factory deals were being made in these times. He agreed. A year later, he had lost his job, presumably because he had not convincingly shown the county that it needed a development officer during a time when no deals were being made.
Listening more closely to local food proponents might have made his job more secure. Even though he would have seen little short-term payoff, his efforts to work with his own citizens would have built the foundation for a stronger local economy.
The New Economics Foundation in the UK has done a fine job of demystifying the concept of the economic multiplier in its development of the “Local Multiplier 3.” NEF argues that about 90% of the economic multiplier is defined by the first three cycles of cash through a given locale. This includes: (a) how much the firm sells to the local community, (b) how many locally produced inputs the firm purchases from local suppliers, and (c) how many locally sourced products the firm’s employees buy. NEF’s book The Money Trail outlines this case quite eloquently, and offers pragmatic calculation templates for resident groups to use (Sacks, 2002). The main limitation I see is that apparently it is easier in the UK to get firms to divulge their financial figures than it is in the U.S. It is difficult to do citizen multiplier calculations without these data.
The multiplier is, then, a fairly easy concept to grasp. It is a measure of the economic infra-structure that surrounds a given business. If the infrastructure connects local economic actors and promotes local trade, the multiplier gets larger. This means that the more connected a community is to itself, and the more local businesses trade with each other, and the longer a given dollar will linger
Journal of Agriculture, Food Systems, and Community Development ISSN: 2152-0801 online www.AgDevJournal.com
Volume 1, Issue 2 / Fall 2010 11
in the community. Geography plays a role: the larger the land base, in general, the more a dollar can multiply, since more hands are likely to be involved in trade. Of course, it also matters that local residents decide to buy from local stores. Even more importantly, they should buy locally produced items. Heading to the local vendor to buy an item that was produced in China does not do a great deal to improve the local economy.
Some examples bear this out. A Michigan study found a statewide multiplier of 1.32 for produce raised on medium-sized family farms (Conner, Knudson, Hamm, & Peters, 2008). For the state of Iowa, it was calculated that dollars spent at the state’s farmers’ markets cycled more, attaining a multiplier of 1.58 (Otto & Varner, 2005). Another Iowa economist found that a small restaurant that had committed itself to buying local foods generated a multiplier of 1.9 in an eight-county area, as compared to a value of 1.53 for an average restaurant in the region (Swenson, 2007). An Oregon study indicated that each dollar spent buying food for school lunches cycled enough to create a multiplier of 1.87 in the state (Ecotrust, 2009). In one small-farm region of western Wisconsin, the overall output multiplier was calculated between 2.2 and 2.6 (L. Swain,1 personal interview, February 12, 2001; Swain, 1999; Swain & Kabes, 1998).
What characterizes the places with large multipliers is social capital (or social connectivity): these are communities whose residents trade among them-selves because they are connected with each other. The industrial economy is precisely what breaks down these local connections, by forcing consumers to rely on distant suppliers and by creating jobs instead of livelihoods—with the result that local residents feel they have less stake in shaping local policy, and often end up in fact having very little influence. Those civic officials who, raising the question posed at the opening of
1 Economics professor Larry Swain, community development specialist for the University of Wisconsin Extension Service and director of the Survey Research Center at UW-River Falls (now retired).
this essay, hold off on investing in a new project because the multiplier is too low, will find it never gets large enough.
I have been arguing for several years now that investing in community-based foods is one of the best ways we have for building local economies and local multipliers. This is not because the short-term rewards are great, but because forming community foods networks is one of the best ways I can think of to build local commerce and local business ownership. After all, food is the number two household expense after housing. Consumer food purchases total US$1 trillion per year, more than enough to have financed the bank stimulus package a few years back. Moreover, we all eat, and we make decisions about what to eat, three times a day. Everyone gets involved in this discourse.
Food also has less need for startup capital. One can begin farming at a small scale and produce healthy food to eat without a great deal of investment—although clearly it may take substantial public and private capital to actually make a good living. Yet if a community wants to make windmills, solar collectors, factories, or banks, the entry costs are much steeper.
Primarily, however, food is a very special product. It forces us to create a more inclusive economy. If someone cannot afford food, we cannot simply say they are “out of the market.” To do so would be cruel, since food is a human right. More prag-matically, it is likely that someone who does not eat well will get ill—and will often require medical attention they also cannot afford, provoking additional public expense. Since county govern-ments are often on the hook for caring for people with no health insurance, some counties could find themselves saving hundreds of millions of dollars by building local food trade that ensures residents eat the healthiest meals possible. This can reduce the erosion of resident assets.
This work of creating a community food economy, however, is long term, and our political process is notorious for being unable to handle long-term discussions. The reason that planning for the long
Journal of Agriculture, Food Systems, and Community Development ISSN: 2152-0801 online
www.AgDevJournal.com
12 Volume 1, Issue 2 / Fall 2010
term pays off is well documented by Robert Putnam, author of Bowling Alone and a pioneer in the measurement of social capital. In Making Democracy Work, he shows that the regions of Italy with the strongest democracies are also those that had the strongest craft guilds in the 1300s.
The proper question to ask of developers, it seems to me, is, “How do we best build a local multiplier?” The answer is community foods. With a time frame like this, it is high time we get started.
References Conner, D. S., Knudson, W. A., Hamm, M. W., &
Peters, H. C. (2008, December). The food system as an economic driver: Strategies and applications for Michigan. Journal of Hunger & Environmental Nutrition, 3:4, 371–383. doi:10.1080/19320240802528849
Ecotrust. (2009, March 18). Farm to school investment yields a healthy return into state coffers. Accessed at http://www.ecotrust.org/press/f2s_investment_20090318.html
Otto, D., & Varner, T. (2005, March). Consumers, vendors, and the economic importance of Iowa farmers’ markets: An economic impact survey analysis. Iowa State University: Leopold Center for Sustainable Agriculture and its Regional Food Systems Working Group, part of the Value Chain Partnerships for a Sustainable Agriculture, Report RWG03-04. Accessed at http://www.leopold.iastate.edu/research/ marketing_files/markets_rfswg.pdf
Sacks, J. (2002). The Money Trail: Measuring your impact on the local economy using LM3. London: New Economics Foundation. Available at http://www.neweconomics.org
Swain, L. B. (1999). A study of the economic contribution of small farms to communities—completed 1996 to 1999. Unpublished manuscript.
Swain, L. B., & Kabes, D. (1998). 1996 community supported agriculture report. Unpublished manuscript.
Swenson, D. (2007, March). Economic impact summaries for local food production. Iowa State University: Leopold Center for Sustainable Agriculture, and University of Northern Iowa Center for Energy and Environ-mental Education. See K. Enshayan (2008) summary listed at http://www.leopold.iastate.edu/ research/marketing_files/food/food.htm
Journal of Agriculture, Food Systems, and Community Development ISSN: 2152-0801 online www.AgDevJournal.com
Volume 1, Issue 2 / Fall 2010 13
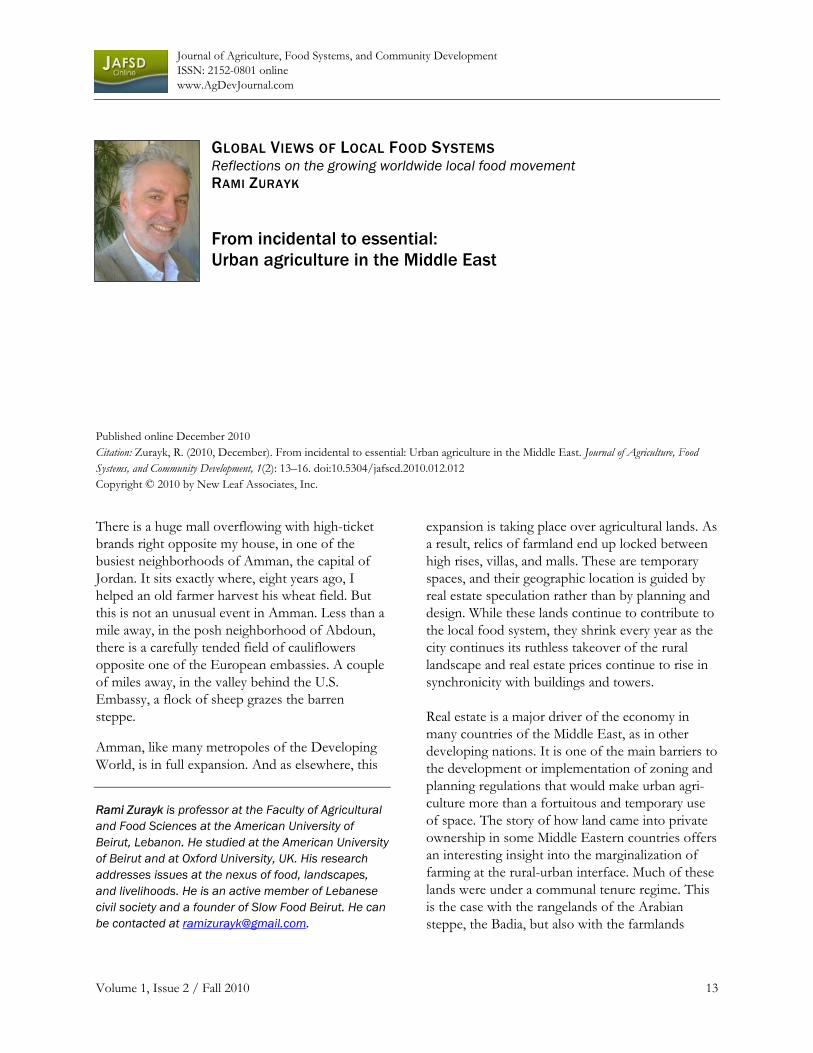
GLOBAL VIEWS OF LOCAL FOOD SYSTEMS Reflections on the growing worldwide local food movement RAMI ZURAYK From incidental to essential: Urban agriculture in the Middle East
Published online December 2010 Citation: Zurayk, R. (2010, December). From incidental to essential: Urban agriculture in the Middle East. Journal of Agriculture, Food Systems, and Community Development, 1(2): 13–16. doi:10.5304/jafscd.2010.012.012 Copyright © 2010 by New Leaf Associates, Inc.
There is a huge mall overflowing with high-ticket brands right opposite my house, in one of the busiest neighborhoods of Amman, the capital of Jordan. It sits exactly where, eight years ago, I helped an old farmer harvest his wheat field. But this is not an unusual event in Amman. Less than a mile away, in the posh neighborhood of Abdoun, there is a carefully tended field of cauliflowers opposite one of the European embassies. A couple of miles away, in the valley behind the U.S. Embassy, a flock of sheep grazes the barren steppe.
Amman, like many metropoles of the Developing World, is in full expansion. And as elsewhere, this
Rami Zurayk is professor at the Faculty of Agricultural and Food Sciences at the American University of Beirut, Lebanon. He studied at the American University of Beirut and at Oxford University, UK. His research addresses issues at the nexus of food, landscapes, and livelihoods. He is an active member of Lebanese civil society and a founder of Slow Food Beirut. He can be contacted at [email protected].
expansion is taking place over agricultural lands. As a result, relics of farmland end up locked between high rises, villas, and malls. These are temporary spaces, and their geographic location is guided by real estate speculation rather than by planning and design. While these lands continue to contribute to the local food system, they shrink every year as the city continues its ruthless takeover of the rural landscape and real estate prices continue to rise in synchronicity with buildings and towers.
Real estate is a major driver of the economy in many countries of the Middle East, as in other developing nations. It is one of the main barriers to the development or implementation of zoning and planning regulations that would make urban agri-culture more than a fortuitous and temporary use of space. The story of how land came into private ownership in some Middle Eastern countries offers an interesting insight into the marginalization of farming at the rural-urban interface. Much of these lands were under a communal tenure regime. This is the case with the rangelands of the Arabian steppe, the Badia, but also with the farmlands
Journal of Agriculture, Food Systems, and Community Development ISSN: 2152-0801 online
www.AgDevJournal.com
14 Volume 1, Issue 2 / Fall 2010
surrounding villages where farmers were able to claim access to communal lands by reclaiming them or by “reviving” them. Colonial rule in its multiple forms (direct colonization, protectorates, mandates) brought “modern” concepts and principles for governance that were not directly applicable but were made to seem universal. Among these were state simpli-fications1 (Scott, 1998) and centrally managed cadas-tral registers, which allowed local elites to grab vast areas of the com-mons. The resulting landscape dissection2 (Hobbs, Galvin, Stokes, Lackett, Ash, Boone, Reid, & Thornton, 2008), along with the creation of increasingly hermetic borders of nation states, was detrimental to agriculture and especially to mobile pastoralism in the Middle East. This was felt most strongly in the surroundings of the mushrooming cities and expanding towns.
In the post-colonial period, real estate became a very efficient way of capturing the surplus gener-ated from nonproductive economic sectors, such as remittances. Speculation drove prices upward, and land became a commodity and a capital asset, the value of which is determined by its return on investment. Agriculture, traditionally a low-return sector, stood no chance. The city invaded its sur-roundings, both physically and ideologically. Much of the farmland that remains locked into the ex-panding conurbation is just green space given a reprieve. This is what I refer to as accidental urban agriculture.
1 Ideas and actions aimed at improving human condition through rationalization and the creation of social order (see Scott, 1998). 2 The dissection of the earth’s surface into spatially isolated parts.
State simplifications and the falling of communal space into private hands did not always happen smoothly. Customary land users have often voiced their complaints and protested what they saw as a robbing of their customary rights. In 1983, in
Jordan again, the Bani Hassan Bedouin3 tribe collectively stood up to the state for land rights, but was repressed (Tell, 1993). They ended up, like many of the Bedouins, locked in the anteroom of the next urban expansion zones, between malls, villas, and towers. They still raise sheep and goats, but they now rely on imported feed and on state subsidies. Their main market is the meat market of the adjacent towns. They know their presence
is temporary, as is their food system. But they will stick with it until the next wave of displacement.
There is, however, in the same region, a totally dif-ferent approach to urban agriculture. As a result of the conflicts and wars that have reshaped the region in the 20th century, a significant part of the population has been turned into refugees, often in their own countries. International aid has been a main source of food for refugees. However, the rations often proved insufficient, inadequate, or inappropriate, and lacked fresh and green products. In spite of the limited space available, people have taken to farming in order to supplement their diets and their incomes. Reports from Gaza show that food production on rooftops in refugee camps is an important activity that provides better nutrition and alternative activities (Bartlett, 2010). In a recent issue of Urban Agriculture magazine, Adam-Bradford and coworkers drew on experiences from populations that have experienced serious internal displacement to show the important role played by urban agriculture in relief, rehabilitation, and 3 The mobile pastoralists of Arabia.
The Bani Hassan Bedouin ended up
locked in the anteroom of the next
urban expansion zones, between
malls, villas, and towers…They
know their presence is temporary,
as is their food system.
But they will stick with it until the
next wave of displacement.
Journal of Agriculture, Food Systems, and Community Development ISSN: 2152-0801 online www.AgDevJournal.com
Volume 1, Issue 2 / Fall 2010 15
development (Adam-Bradford, Hoekstra, & van Veenhuizen, 2009). It is where space is the most limited, paradoxically, such as in refugee camps, that we see urban farming imposing itself as a necessity. But in reality, this should be hardly surprising: the origin of the allotments that give so much joy to urban farmers in much of Western Europe today goes back to a planned British strategy for family food production during WWII, just as victory gardens were encouraged in the U.S. It is much later that allotments became integrated into urban green space and into leisure activities.
However, things may be changing in many Middle Eastern countries as a drive toward regional green planning slowly starts to take hold. The city of Erbil in Iraq recently completed a plan for the green belt surrounding the city that retains a large proportion of farmland in order to foster local food systems and feed the city. Perhaps we will see,
in the next decade, urban agriculture turning from incidental to essential.
References Adam-Bradford, A., Hoekstra, F., & van Veenhuizen, R.
(2009, January). Linking relief, rehabilitation and development: A role for urban agriculture? Urban Agriculture. Number 21. Accessed from http://ruaf.org/node/1995
Bartlett, E. (2010). Gaza: The roof is now the field. City Farmer. Accessed at http://www.cityfarmer.info/ 2010/12/07/gaza-the-roof-is-now-the-field
Hobbs, N. T., Galvin, K. A., Stokes, C. J., Lackett, J. M., Ash, A. J., Boone, R. B., Reid, R. S., & Thornton, P. K. (2008). Fragmentation of rangelands: Implications for humans, animals, and landscapes. Global Environmental Change 18 (4), 776–785.
Scott, J. (1998). Seeing like a state: How certain schemes to improve the human condition have failed. New Haven: Yale University Press.
Tell, T. (1993). Paysans, nomades et etat en Jordanie orientale: Les politiques de développement rural, 1920–1989. In Bocco, R., Jaubert, R., & Metral, F. (Eds.) Steppes d’Arabie. Paris: Presses Universitaires de France (pp. 87–102).

Journal of Agriculture, Food Systems, and Community Development ISSN: 2152-0801 online
www.AgDevJournal.com
16 Volume 1, Issue 2 / Fall 2010
Journal of Agriculture, Food Systems, and Community Development ISSN: 2152-0801 online www.AgDevJournal.com
Volume 1, Issue 2 / Fall 2010 17
a Anni and Joe benefited from the excellent technical and organizational support proffered by Gabriela Alcaraz V., ABD, Agricultural Economics, University of Hohenheim.
Note: Consult the list of acronyms on page 22 for any unfamiliar to you throughout these reflections. A consolidated reference list appears on page 23.
JS
Tribute to Jac Smit
On the past and the future of the urban agriculture movement: Reflections in tribute to Jac Smit
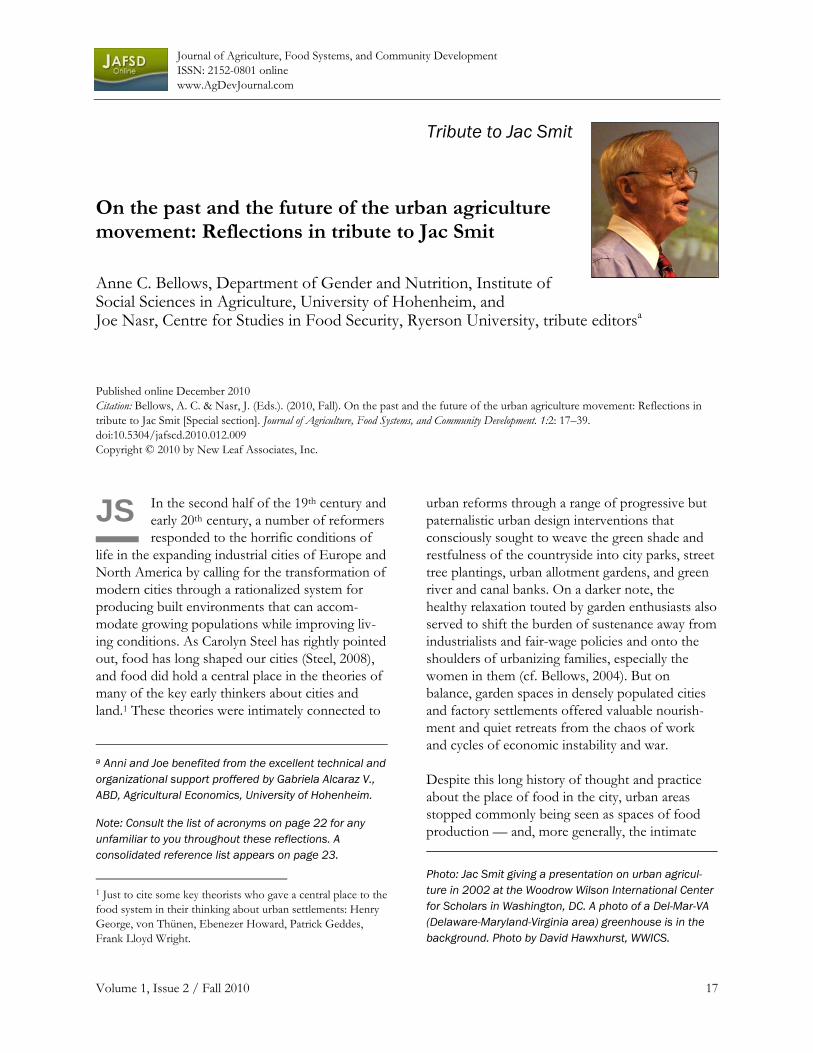
Anne C. Bellows, Department of Gender and Nutrition, Institute of Social Sciences in Agriculture, University of Hohenheim, and Joe Nasr, Centre for Studies in Food Security, Ryerson University, tribute editorsa Published online December 2010 Citation: Bellows, A. C. & Nasr, J. (Eds.). (2010, Fall). On the past and the future of the urban agriculture movement: Reflections in tribute to Jac Smit [Special section]. Journal of Agriculture, Food Systems, and Community Development. 1:2: 17–39. doi:10.5304/jafscd.2010.012.009 Copyright © 2010 by New Leaf Associates, Inc.
In the second half of the 19th century and early 20th century, a number of reformers responded to the horrific conditions of
life in the expanding industrial cities of Europe and North America by calling for the transformation of modern cities through a rationalized system for producing built environments that can accom-modate growing populations while improving liv-ing conditions. As Carolyn Steel has rightly pointed out, food has long shaped our cities (Steel, 2008), and food did hold a central place in the theories of many of the key early thinkers about cities and land.1 These theories were intimately connected to
1 Just to cite some key theorists who gave a central place to the food system in their thinking about urban settlements: Henry George, von Thünen, Ebenezer Howard, Patrick Geddes, Frank Lloyd Wright.
urban reforms through a range of progressive but paternalistic urban design interventions that consciously sought to weave the green shade and restfulness of the countryside into city parks, street tree plantings, urban allotment gardens, and green river and canal banks. On a darker note, the healthy relaxation touted by garden enthusiasts also served to shift the burden of sustenance away from industrialists and fair-wage policies and onto the shoulders of urbanizing families, especially the women in them (cf. Bellows, 2004). But on balance, garden spaces in densely populated cities and factory settlements offered valuable nourish-ment and quiet retreats from the chaos of work and cycles of economic instability and war.
Despite this long history of thought and practice about the place of food in the city, urban areas stopped commonly being seen as spaces of food production — and, more generally, the intimate
Photo: Jac Smit giving a presentation on urban agricul-ture in 2002 at the Woodrow Wilson International Center for Scholars in Washington, DC. A photo of a Del-Mar-VA (Delaware-Maryland-Virginia area) greenhouse is in the background. Photo by David Hawxhurst, WWICS.
Journal of Agriculture, Food Systems, and Community Development ISSN: 2152-0801 online
www.AgDevJournal.com
18 Volume 1, Issue 2 / Fall 2010
relationship between food and cities became increasingly and thoroughly disconnected over the course of the 20th century.2 This social, psycholog-ical, and physically designed separation is one of the ill-fated aspects of what is sometimes referred to as “the urban century.”
Yet here we are today, in a world where the indus-trialized and globalized system of food production that provided essential underpinnings of this past century’s momentous transformations is under increasing attack for being socially unjust, environ-mentally unsustainable, eco-nomically precarious, nutri-tionally ravaging, energetically wasteful, and more. The critique has been buttressed by the concurrent evolution of community- and local-scale food-system alternatives. In the course of a few short years, the relationship between food and cities is newly maturing after decades in the shadows, with urban agricul-ture acting as a pivotal lynch-pin in the development. In a word, urban agriculture is “hot.” It is visible again. To compre-hend this reemergence, one must understand the role that Jac Smit played in it.
Jac Smit was born in 1929 in London and emi-grated three years later with his parents to the United States. According to the biography encap-sulated in nine audio segments on his website (www.jacsmit.com), he started gardening in the third grade; this engagement with the potential of soil and plants sparked an interest that carried through to a junior college degree in ornamental horticulture and graduate studies at Harvard University (masters in city and regional planning in 1961). Jac was an optimist, an activist,3 and a self-
2 Of course, there are some exceptions to this general rule, the most notable one being the brief rediscovery during the Second World War. 3 Jac Smit was a long-term member of Planners Network, an international coalition of progressive planners
starter. He worked on several continents develop-ing city and regional plans that promoted the research and practice of urban food and fuel production. His curiosity and vision pursued the ramifications of urban agriculture on planning for social, financial, and environmental systems and infrastructures, in and near cities, including job creation, food production and nutrition enhance-ment, gray- and wastewater recycling, urban com-posting, air cooling and cleaning, and the presence of a framework of green zones. He found the applications relevant, as he says, from Zimbabwe
to Santa Barbara, ground level to raised beds, and from greenhouses and hydroponic systems to rooftops and skyscrapers.
Jac started to reflect on urban agriculture in the context of graduate papers he was writing in graduate school. In the mid-1960s, he went on to work as a planner on the Chicago Regional Plan, introducing
green productive wedges between development corridors. Following this experience, he worked for two decades as a planning consultant in a wide range of countries, among others, for the Ford Foundation, the United Nations, and the governments of Norway and Japan. Through work in Calcutta, Karachi, Bangladesh, the Suez Canal zone, Tanzania, the Sinai desert, Baghdad, and elsewhere, he was able to include the promotion of urban and peri-urban agriculture into plans for new development areas, in refugee resettlement, in postwar reconstruction, and in large-scale metropolitan plans.
In 1991, the United Nations Development Pro-gramme (UNDP) awarded Jac Smit a contract that asked him to assess what is known and practiced in urban agriculture, a field that was barely known at the time. With the help of Joe Nasr, a young doc-
(http://www.plannersnetwork.org), and the World Future Society (http://www.wfs.org).
Jac critiqued the concept of a
rural-urban “divide”...to him, this
should be replaced with the
concept of diverse human habitats
represented by a continuum of
food production capacities.
Journal of Agriculture, Food Systems, and Community Development ISSN: 2152-0801 online www.AgDevJournal.com
Volume 1, Issue 2 / Fall 2010 19
toral researcher at the University of Pennsylvania at the time, he undertook an extensive desktop survey and a set of field visits (ultimately taking Jac to 16 countries on three continents). This initial contract allowed him to focus exclusively on urban agri-culture for several years — a focus he maintained for the remainder of his professional career. To foster attention to this new and growing area, Jac, together with Joe, founded the information and consulting organization, The Urban Agriculture Network (TUAN) in 1992, and remained its president until Joe took over the role in 2009.
Among the multiple ways in which he advocated for the importance of urban agriculture (making plans, public speaking, advising researchers, dis-cussing with decision makers…), Jac’s most signifi-cant contribution to popularizing the topic may have been his work as an author. His first pub-lished article on the subject dates back to 1980 (Smit, 1980) — prehistoric times in terms of the urban agriculture movement. In 1992, he co-authored with Joe Nasr an article based on the early results from the UNDP-sponsored study (Smit & Nasr, 1992/1999), which was frequently cited by others starting to join the urban agriculture movement. This article provided the groundwork for the 1996 UNDP publication he co-authored with Annu Ratta and Joe Nasr, Urban Agriculture: Food, Jobs, and Sustainable Cities (Smit, Ratta & Nasr, 1996). This book, for which Jac is best known internationally, helped to build recognition of and support for urban agriculture as a broad-based, multifaceted set of activities, ultimately anchoring it inexorably in the discourse on sustainability. The second, expanded edition of this book, written in 2000–01 but never published, is due to be released online at the end of 2010.4
The 1996 publication coincided with the 2nd United Nations Conference on Human Settlements in Istanbul in the same year. Cities were grappling
4 The second edition of Urban Agriculture: Food, Jobs, and Sustainable Cities by Jac Smit, Joe Nasr, and Annu Ratta, sponsored by UNDP, 2001 (unpublished), will be placed on the websites http://www.jacsmit.com and http://www.metroagalliance.org
with the growing global phenomenon of rural outmigration and the crushing waves of resettle-ment on their old and insufficient infrastructure systems. Jac introduced to that event a vision of an urban agriculture made up of container gardens, of community tool sharing, of flexible access to undeveloped public and private space — a vision relevant to a wide range of stakeholders, from individuals to civil society organizations, entrepre-neurs, and public-sector planners.
Anni Bellows heard of Jac Smit and the “Habitat II” Conference in Istanbul while conducting field research in 1996 on the Polish garden or działki allotment system. On her return to Rutgers University, she traveled to Washington, DC, to meet Jac and to visit the TUAN headquarters, located in a beautiful old home in the residential section of Mount Pleasant. Jac was delighted that doctoral research on an urban food production system had been sanctioned, and he encouraged her to publish the results.5 He was always trying to expand knowledge and acceptance of urban agriculture through diverse forms of media and communication. Ten years later, he collaborated with Anni and Katherine Brown, together with the support of the Community Food Security Coali-tion’s Urban Agriculture Committee, to write a review of research on the Health Benefits of Urban Agriculture (Bellows, Brown & Smit, 2005).
In 1997, Anni invited Jac to Rutgers, the State University of New Jersey, where he shocked some of the geography, nutrition, and agriculture faculty and students by figuratively striding through the advantages of city gardening plots and onward to the urban fringe, calling all of the highly populated state of New Jersey an urban agriculture zone. Jac was like a kid in a candy store, thinking about how new hydroponic, de-salinization, solar and other technologies could enhance profit-making green
5 Jac mentored a number of young urban agriculture researchers and activists over the years, whether by offering them opportunities for employment or internship at TUAN, or through advice and support. Building on this launch pad, several of these individuals have maintained a focus and even a career around urban agriculture.
Journal of Agriculture, Food Systems, and Community Development ISSN: 2152-0801 online
www.AgDevJournal.com
20 Volume 1, Issue 2 / Fall 2010
businesses, at the same time that he embraced the enthusiasm of city gardeners resisting concrete to establish plant-a-row strategies for soup kitchens. He was always interested in bridging divides — including distinctions between high tech and low tech, and for-profit and for-livelihood,6 approaches in the context of urban agriculture.
Similarly, Jac critiqued the concept of a rural-urban “divide” that defines where food can or should be produced. To him, this is a failed idea that should be replaced with the concept of diverse human habitats represented by a continuum of food production capacities located in more and less built spaces. He was thus delighted when asked by Andre Viljoen and Katrin Bohn to write the foreword to the 2005 book CPULs — Continuous Productive Urban Landscapes (Viljoen, 2005), which is proving influential in its own right. The book introduced the idea of CPULs, a concept that reimagines urban landscapes with spaces of food production weaving through the more and less built-up fabrics of urbanized areas. Reflecting after Jac’s passing, Andre and Katrin find that the two words in “urban agriculture,” as popularized by Jac, are “radical agents” that “provoke a powerful visual image” and offer “a certain helpful ambiguity ...that encompasses a lot.”7
6 Jac Smit always opposed the use of the term “subsistence” as applied to urban agriculture, preferring concepts such as “livelihood” to convey the role that urban agriculture plays, especially for the poor. For the above-mentioned second edition of the Urban Agriculture book, he favored substituting “livelihood” for the “jobs” in the original title. 7 “There are many different interpretations for what they [the words “urban agriculture”] actually mean. This openness alongside specific interpretations is healthy and inclusive, opening ways to speculate.” Personal communication, Andre Viljoen and Katrin Bohn with Joe Nasr, 7 September 2010.
In this “Denkmalschrift”8 we celebrate the life and work of Jac Smit, who passed away on November 15, 2009. We have gathered here contributions from some of his colleagues who introduce his work in the Global North and South while reflecting on their own involvement in and around urban agriculture.
The authors are based in nongovernmental and United Nations organiza-tions as well as academia. Their involvement in urban agriculture arises from grassroots empowerment to global antihunger efforts, and from knowledge sharing to capacity building. All of them knew Jac for years, during which time they witnessed the emer-gence of urban agriculture from a fringe curiosity to a global movement that has now captured the attention of high-level policy-makers
and ordinary citizens alike. Rather than a simple tribute to him, we asked these experts to reflect on this emergence through the lens of their interaction with Jac over the past few decades. Transcending the tribute to Jac, the collected stories serve as a collec-tive oral history written by a half-dozen key actors in the movement itself.
Diana Lee-Smith, co-founder of the Mazingira Institute9 (one of Africa’s most-established inde-pendent research and advocacy centers) and former sub-Saharan Africa coordinator for the UN’s Urban Harvest program for Africa,10 opens the series of reflections. This is appropriate since it was in East Africa that concentrated research and extensive activism on behalf of urban agriculture first took place, dating back at least to the 1970s.
8 This German term refers to a series of contributions written in the memory of a noted person to celebrate his or her accomplishments and reflect on how they were influenced by him or her. 9 Mazingira Institute, http://www.mazinst.org 10 See http://www.uharvest.org
Jac was like a kid in a candy store,
thinking about how new
technologies could enhance
profit-making green businesses,
at the same time that he
embraced the enthusiasm of
city gardeners establishing
plant-a-row strategies
for soup kitchens.
Journal of Agriculture, Food Systems, and Community Development ISSN: 2152-0801 online www.AgDevJournal.com
Volume 1, Issue 2 / Fall 2010 21
Not only was much research on urban agriculture taking place there when little had started elsewhere, but this research introduced a participatory ap-proach before the same-named methodology was acceptable academic practice. Stakeholder-based research, and later activism, resulted in expanded public engagement with urban agriculture and that leveraged related policy changes. Jac was there to witness and support this pioneering work — back before there was something to call an urban agriculture movement.
Much of the serious research that Diana refers to — and took part in — was initially supported by one international funding agency: the Canadian International Development Research Centre (IDRC).11 Luc Mougeot, instigator of the IDRC’s commitment to urban agriculture and original coordinator of its Cities Feeding People program, offers his thoughts next. Luc provides an insight on the intense international collaborative initiatives that existed in what may be considered the “take-off phase” of the urban agriculture movement — pre-Internet. The IDRC played a critical role in funding individual research on urban agriculture. But beyond that, the IDRC supported Jac and others with opportunities for face-to-face interactions that facilitated the construction of information and communication networks in the age of snail mail and prohibitively expensive international phone calls. These meetings played a crucial role in the emergence and maturing of the urban agriculture movement.
While the processes of uniting diverse international engagements in urban agriculture began with direct interactions and posted envelopes, there is no question that the remarkable growth in interest in the past few years surged forward through the power of the Internet. No one is better equipped to reflect on this transition than Michael Levenston, creator of the City Farmer website12 — the pioneer-ing depository of information on the subject, for which Jac wrote a regular column until his death.
11 International Development Research Centre, http://www.idrc.ca 12 See City Farmer News, http://www.cityfarmer.info
Mike provides us, in the third piece, with insights on how the Internet exponentially expanded communi-cation, and with it, urban agriculture networks, outreach, awareness, and knowledge.
Peter Mann, director emeritus of the Global Move-ments program of WhyHunger (formerly World Hunger Year),13 shares observations on other transitions in the urban agriculture movement. Initially, one of the principal drivers of interest in urban agriculture was the effort to counter hunger around the world, as self-provision came to be seen as one approach in strengthening the supply of food to the poorest members of society. Peter shows in the fourth piece of our series how city farming came to transcend this initial focus, mov-ing toward broader goals of community food security. Building on a reflection of his interaction with Jac, Peter shows how urban food production continues to evolve in directions that bridge the rural-urban divide and ensure social justice.
Communication, internationalization, and activism have helped transfer working concepts for and experiences in urban agriculture globally. In the next piece, Katherine Brown, who has led the Southside Community Land Trust in Providence, Rhode Island,14 to become one of the premier organizations focusing on urban food production in the U.S., shares her perspective on why “urban agriculture” is “oxymoron no more.” Based on her local experience working in the trenches, Katherine (who collaborated with Jac on the Urban Agricul-ture Primer and with Anni and Jac on the Health Benefits of Urban Agriculture) comes to the conclusion that the success of urban agriculture projects will remain limited as long as “their integration into the city’s fabric and power base” has not been ensured.
The final contribution is somewhat different from the others, offering Jac’s voice more directly. Its author, Jerome Kaufman, emeritus professor of
13 See WhyHunger, http://www.whyhunger.org; WhyHunger’s Global Movements Program, http://www.whyhunger.org/ programs/global-movements.html 14 See Southside Community Land Trust, http://www.southsideclt.org
Journal of Agriculture, Food Systems, and Community Development ISSN: 2152-0801 online
www.AgDevJournal.com
22 Volume 1, Issue 2 / Fall 2010
urban and regional planning at the University of Wisconsin–Madison, certainly could have written a similarly reflective piece, having played a central role in the fast adoption of food-system planning into the American planning profession’s mandate.15 Instead, Jerry chose to share Jac’s own thoughts on the future of urban agriculture, based on an inter-view Jerry had with him just a few months before Jac passed away. This offers a fitting end to our commemorative tribute, as Jac — despite his strong interest in the history of urban agriculture and care for its present conditions — was always looking forward to where the movement needs to go next.
Jac Smit propelled the urban agriculture movement forward through his visionary embrace of the
15 See, for example, the American Planning Association’s Food Interest Group (FIG), http://www.planning.org/national centers/health/food.htm
diversity and magnitude of projects and approaches initiated around the world, including his own. He understood that real change happens through a broad spectrum of concurrent and autonomous actions projecting us forward on a trajectory that no one person can plan, though he did believe that progressive planners, himself included, should instigate and support such a course. Jac’s objective was always to develop multifunctional urban food production strategies that could address food security, green open space, social needs, environ-mental enhancements, and more, and all at the same time — or as his 1996 book subtitle said, food, jobs and sustainability for cities.
Journal of Agriculture, Food Systems, and Community Development ISSN: 2152-0801 online www.AgDevJournal.com
Volume 1, Issue 2 / Fall 2010 23
JS
Tribute to Jac Smit Relating research to action on urban agriculture — the East African experience Diana Lee-Smith, Mazingira Institute, Nairobi
We first met Jac Smit in the 1980s when he came to visit the Mazingira office in Nairobi while we were working on our
national survey of urban agriculture and he was in Tanzania; however, we had “met” much earlier. There was much networking in those early days, done without benefit of the Internet, but ideas and discussions about urban agriculture took place through Planners Network16 and Settlements Information Network Africa (SINA),17 using the postal system. Jac Smit linked up to Mazingira Institute in Kenya right at its start, having made contact earlier through the Planners Network in the mid-1970s.
In Africa, civic action on urban agriculture has often been preceded by research, but the process of effecting action has often been long and compli-cated. The earliest research on urban agriculture in Africa, such as that by Vennetier (1963) in Congo Brazzaville going back to the 1960s, and later by Sanyal (1985) in Zambia, failed to persuade either international organizations or national govern-ments at the time that it ought to be part of their development planning. Urban agriculture was seen as a marginal activity of the urban poor — occa-sionally supported through community kitchen garden projects — rather than as something to be included in public decision-making. Jac cam-paigned tirelessly for urban agriculture to be
16 A U.S.–based international network of progressive planners that publishes Progressive Planning. http://www.plannersnetwork.org 17 This Kenya-based network has published a newsletter covering the region since 1981. http://www.mazinst.org/ sinahomepage.htm
incorporated in development planning inter-nationally as well as in the policy systems of a number of countries.
Researchers in Eastern Africa working on urban agriculture got a big boost when IDRC responded to their ideas. Program officers Aprodicio Laquian and Yue-Man Yeung, who were familiar with the subject from Asia (where they had undertaken some pioneering work) as well as other regions, supported the research of Daniel Maxwell in Uganda, Camillus Sawio in Tanzania, and the Mazingira Institute in Kenya. All three studies attempted to address policy issues and engage decision-makers locally as they worked, and the results were effectively disseminated when IDRC later published them in the book Cities Feeding People (Egziabher, Lee-Smith, Maxwell, Memon, Mougeot, & Sawio, 1994).
Jac, Annu Ratta, and Joe Nasr took the data to much wider attention when it was included in the book Urban Agriculture: Food, Jobs and Sustainable Cities, published in 1996. Jac did not leave it there, but, thanks to his influence internationally, helped persuade the Consultative Group on International Agricultural Research (CGIAR) to start a system-wide initiative on urban agriculture research, Urban Harvest, which ran for a decade. I was privileged to run its Africa Program in 2002–2005 and helped edit two recent books emerging from the research (Cole, Lee-Smith, & Nasinyama, 2008; Prain, Karanja, & Lee-Smith, 2010).
The efforts of Urban Harvest, Resource Centres on Urban Agriculture and Food Security (RUAF),
Journal of Agriculture, Food Systems, and Community Development ISSN: 2152-0801 online
www.AgDevJournal.com
24 Volume 1, Issue 2 / Fall 2010
the Municipal Development Program, International Water Management Institute (IWMI) and other multinational programs and entities have resulted in the building of research-to-policy platforms. These institutions engage a wide range of actors applying research to policy and have been effective in bringing about needed civic action.
Informed by Sawio’s research and the Sustainable Dar-es-Salaam Program’s 1992–1993 UN-supported stakeholder consultation process, the Tanzanian government introduced legislation governing urban crop and livestock production and developed a strategic plan for urban agriculture. Together with the Urban Vegetable Promotion Project under the Ministry of Agriculture and Cooperatives, which included research initiatives, these measures led to an abundance of food produced in the city and improvement in urban farmers’ incomes. The adoption of both national and local government policy measures on urban agriculture occurred two decades after Jac had worked in Tanzania and advocated for such measures.
In Kampala, the capital of neighboring Uganda, it was local stakeholders who built an institution to guide policy on urban agriculture, specifically by linking research to action. The Kampala Urban Food Security, Agriculture and Livestock Coordi-nating Committee (KUFSALCC) carried out research and mid-wifed new legislation on urban agriculture in 2006. The participation in the research of representatives of both local and national government, elected politicians among them, along with local NGOs and university departments, was influential in making the political leadership aware of urban farmers’ concerns, as well as in getting the new laws passed. It was the first instance of public participation in law-making under Uganda’s 1995 constitution.
A similar research-policy platform on urban agri-culture was built about the same time in neighbor-ing Kenya in very different circumstances. Despite its economic development, the interests of Kenya’s urban poor, particularly in the capital, Nairobi, were neglected. There was extensive research on
urban agriculture in the country but virtually no policy support by the end of the 1990s. While international assistance helped initiatives in some local governments outside the capital, the local authorities in Nairobi and other towns remained hostile. After a change of government in 2003, the Nairobi and Environs Food Security, Agriculture and Livestock Forum (NEFSALF), aimed at bringing public, private and community stake-holders together, was convened by the Mazingira Institute in 2004 as a bottom-up initiative from civil society.
NEFSALF attracted many farmers, with nearly 700 members belonging to about 50 groups by 2008. The farmers formed a network with a gender-balanced executive committee and procedures, and set their priorities, which included skills training. Researchers attended because they wanted to disseminate their results to farmers, and the Ministries of Agriculture and Livestock also came, realizing that they could collaborate and use the Mazingira Institute as a base for running courses for the farmers. This had such an impact that Nairobi province was selected to launch the second phase of the National Agriculture and Livestock Extension Program (NALEP) in 2006. Meanwhile Urban Harvest helped the Kenyan government hold a stakeholder workshop on urban agriculture in 2004, and supported the Municipal Council of Nakuru — Kenya’s fourth-largest town — in developing urban agriculture bylaws. Despite the reluctance of Nairobi City Council to engage with farmers in the capital, the central government continued moving forward. A preliminary draft of Kenya’s Urban and Peri-urban Agriculture policy was being circulated in 2010. And finally, urban agriculture was also incorporated in the National Land Policy adopted in 2010.
To the end of his life, Jac Smit remained in contact and abreast of these efforts, affording endless moral support. The book African Urban Harvest (Prain et al., 2010) that documents them is dedicated to him.
Journal of Agriculture, Food Systems, and Community Development ISSN: 2152-0801 online www.AgDevJournal.com
Volume 1, Issue 2 / Fall 2010 25
JS
Tribute to Jac Smit Thoughts on the emergence of urban agriculture as a global movement Luc J. A. Mougeot, International Development Research Center
I first met Jac Smit at the headquarters of the UNDP in New York City (NYC) in 1992. Under the mentorship of Frank
Hartvelt, then deputy director of the UNDP’s Division for Science, Technology and Private Sector, and with support from the Urban Develop-ment Unit’s Jonas Rabinovitch and Robertson Work,18 Jac Smit and his colleagues, economist Annu Ratta and planner Joe Nasr, had just completed the draft of a field survey on urban agriculture worldwide. By the time this report was completed, this consultancy had taken Jac’s team at TUAN to cities in some 30 countries. As the manuscript made good use of results from research funded by the IDRC in the late 1980s in East Africa, the UNDP invited the IDRC to sit on the external panel that would review the manuscript. This was a time when we at the IDRC’s Social Sciences Division were revisiting our urban programming under my responsibility. We had collaborated with UN programs on several urban issues in the past, and we saw this invitation as an opportunity to explore the potential for research on this growing activity to contribute to develop-ment in cities of the Global South.
Jac’s work on urban agriculture was unprecedented. Never before had a study of such scope been undertaken on the subject by any agency, private or public. It documented, classified, assessed, and synthesized ground practice, then suggested concrete interventions for “policy and action”.19 18 Rabinovitch was then senior urban environment advisor, and Work was then senior program advisor. 19 The United Nations University’s Food-Energy Nexus Programme (1983–1987), directed by Prof. Ignacy Sachs, produced some 27 reports of its own, surveying innovative ways at work in over 20 countries to improve the urban poor’s
The book was also a feat. Given the informal nature of much of urban agriculture in most of the world, as well as incipient public records on this sector, the practical challenges faced by Jac’s team were many. Peer review was severe and, in the midst of reduced Overseas Development Assistance by donor countries in the early 1990s, it would take four years for Urban Agriculture: Food, Jobs and Sustainable Cities to be published. To this day, not only the scale of the effort contained in this one book remains unsurpassed but, nearly 15 years later, its agenda remains largely germane today.
My meeting with Jac in NYC was the beginning of a long and most enriching professional relation-ship. Jac had an extensive network of contacts in East Africa, and the IDRC hired him as a consul-tant initially to join me on visits to Nairobi and Dar-es-Salaam, to help negotiate the joint funding of an action research on urban agriculture with UN Habitat.20 This research was to inform a flagship project of UN Habitat’s Sustainable Cities Program on environmental management in Dar-es-Salaam. The collaboration with UN Habitat led the IDRC to be invited and to feature its urban agriculture programming at the 2nd UN Conference on Human Settlements (commonly known as Habitat II) in Istanbul (1996). This first collaboration between the IDRC and UN Habitat on urban agriculture was the beginning of a series of projects on this topic, jointly funded by the two organizations over the next decade.
access to energy and food. A majority of these reports addressed urban agriculture practices. 20 UN Habitat: http://www.unhabitat.org
Journal of Agriculture, Food Systems, and Community Development ISSN: 2152-0801 online
www.AgDevJournal.com
26 Volume 1, Issue 2 / Fall 2010
In 1994, the International Institute for the Envi-ronment and Development (IIED) was commis-sioned to organize Global Forum ’94: Cities and Sustainable Development, a five-day conference in Manchester, UK, attended by officials from 50 cities around the world. Jac and I led a workshop for city officials where we polled participants on their perception of, and experience with, agricul-tural activities in their own city. We were surprised by the degree of acceptance and support that city officials expressed. This provided arguments for Jac and UNDP officials to put urban agriculture on the agenda of its International Colloquium of Mayors in 1994 in NYC. At that colloquium the assembly of mayors would issue a specific recommendation for all actors to support the creation of jobs through urban agriculture.
In early 1996, the IDRC commissioned TUAN to provide background research and facilitation for a meeting that the IDRC would convene in Ottawa. This was for interested development agencies (including the World Bank, the UN Food and Agriculture Organization (FAO), the UNDP, and the German and Dutch agencies for International Cooperation — GTZ and DGIS) to better coordinate support to urban agriculture in the Global South. Jac produced and presented a perspective on the development of the sector. And it was at that meeting that the DGIS and IDRC agreed to work together to fund what later would become the first (and still is the largest) worldwide network of Resource Centers for Urban Agriculture and Food Security (RUAF). The meeting also formalized a global Support Group on Urban Agriculture (SGUA). This was mostly composed of development agencies that wanted to keep in touch with one with another to take opportunities to complement each other’s work in this new area.
TUAN became an associate of the RUAF network, and Jac played an important liaison role in the SGUA, whose leadership eventually would migrate from the IDRC to ETC International (Educational Training Consultancy International), the coordi-nating body of RUAF. Jac remained decidedly engaged in SGUA proceedings.
In the context of the United Nations General Assembly’s Special Session on Implementing the Habitat Agenda (Istanbul+5) in NYC in early June
2001, and given the IDRC’s and UN Habitat’s interest in working more together on policy-oriented research, we organized at the UNDP headquarters a lunchtime brainstorming between Jac, Frank Hartvelt, myself, and regional officials of UN Habitat’s Urban Management Programme. This lunchtime meeting gathered some 30 local government officials from cities around the globe. We polled them on their information needs for better
local policy on urban agriculture. Out of this exploration, the IDRC and UN Habitat would launch a series of multicity research projects between 2001 and 2004. These projects docu-mented practices and tested innovations in urban physical planning, municipal regulations, and financing and credit vehicles for small urban producers.
From where I stood, Jac Smit’s steadfast commit-ment and passion, as an advocate, an adviser, a catalyst, a liaison, or a facilitator, was felt, respected, and valued in many of the key moments that defined the rise of urban agriculture on the development agenda in the 1990s and early 2000s. Jac’s greatest contribution just may have been to open our eyes to the scale and potential of urban agriculture, then let us deal with it in the best way we could, within our respective mandates, competences, and resources.
Jac’s greatest contribution
just may have been to open
our eyes to the scale and
potential of urban agriculture,
then let us deal with it in
the best way we could,
within our respective mandates,
competences, and resources.
Journal of Agriculture, Food Systems, and Community Development ISSN: 2152-0801 online www.AgDevJournal.com
Volume 1, Issue 2 / Fall 2010 27
It was unfortunate that Jac could not make it to the World Urban Forum in Vancouver in 2006, where so many of his expectations by then had flourished and others were blossoming. The last time I spoke to Jac, a couple of years ago, we were marveling at the advances over the last decade — advances in public awareness, in community support, in academic training and graduate research, in policy making and public programs, in technology development, and in private-sector business. I sensed that, in hindsight, he was gratified by the many changes. Over the course of a little more
than a decade, a collective initiative had crossed cultures and continents, scientific disciplines, and organizational mandates. Jac Smit had been a principal instigator and relentless promoter. Thanks to this initiative, which spanned research, technical assistance, information, and financing, what we know of urban agriculture (and agricul-tural urbanism) — what we have learned from Jac — now provides governments with an unprecedented opportunity to factor urban agriculture into better strategies for agricultural development in our now largely urban world.
Journal of Agriculture, Food Systems, and Community Development ISSN: 2152-0801 online
www.AgDevJournal.com
28 Volume 1, Issue 2 / Fall 2010
JS
Tribute to Jac Smit The Internet and urban agriculture Michael Levenston, City Farmer Society
When we began our work in 1978 at City Farmer, an organization dedicated to teaching people how to grow food in the
city, it was an exciting day when we saw the subject “urban agriculture” mentioned anywhere. We’d send away for the publication by “snail mail,” wait for it to return weeks later, and then proudly shelve it in our library. If an interested visitor wanted to see that paper, he’d visit our office, read it at a desk, and then Xerox a copy.
Today, if a graduate student finishes writing her thesis on urban agriculture, she can email it to me as a PDF or .doc file from thousands of miles away, and within minutes I can FTP it to my server and place a story and link to that 150-page document on our current website City Farmer News, where millions of people can read it immediately without leaving their desks or needing to put a stamp on an envelope.
New ideas travel that fast today, and this transfor-mation of our communication system began in the early 1990s when the Internet emerged. I remem-ber being at a meeting of Vancouver’s Apple computer club in 1993, looking at a computer screen as someone showed us the marvels of a text and graphically rich web page that some early pioneer had put online.
It wasn’t long before I begged the University of
British Columbia to let me have an Internet account so that we could put up our own website. City Farmer received support letters from profes-sors in the faculties of Agriculture and Landscape Architecture. The university technology staff patiently taught me the basics of HTML coding
because there were no books on the subject back then.
In October 1994 we went live on the Internet with Urban Agriculture Notes.21 I remember the massive job of putting Luc Mougeot’s Urban Food Production: Evolution, Official Support and Significance on the website. I used optical character recognition to scan the printed document and then
laboriously hand-coded the pages, linking them to a table of contents.
But the effort was always worth the trouble be-cause of the growing audience around the world. I found it riveting to check my data logs every morn-ing and see new countries appearing. For example, when Bolivia would appear it meant that someone in that country had Internet access and was reading about urban agriculture. I’d add that country to our home page in a uniquely colored font. As the country section grew, it began to look like a
21 http://www.cityfarmer.org. This site was superseded by http://www.cityfarmer.info in late 2007, but its archives are still maintained online.
Jac was always eager to hear
how many “hits” the City Farmer
site received each month.
He understood that the
growing popularity of urban
agriculture was related to the
Internet’s reach.
Journal of Agriculture, Food Systems, and Community Development ISSN: 2152-0801 online www.AgDevJournal.com
Volume 1, Issue 2 / Fall 2010 29
delicious candy collection. My “stamp collection” grew to include the Solomon Islands, Maldives, Kyrgyzstan, Heard and McDonald Islands, and the Vatican City State; these were exciting and rare collectibles, and once we’d passed 200 states, I knew that urban agriculture had arrived.
Jac Smit was always eager to hear how many “hits” the City Farmer site received each month. Hits were an early measure of a site’s popularity. (That measure has been replaced today by “page views”
and “unique visitors.”) He understood that the growing popularity of urban agriculture was related to the Internet’s reach. We spoke about that subject often in our weekly phone chats between Washington and Vancouver. He thought enough about the immediacy of publishing on the Net to contribute weekly articles to our site, which were posted on a page titled “From The Desk of Jac Smit.” Jac embraced the 21st century and its useful technology and continued writing and planning future stories for us until his death at age 80.
Journal of Agriculture, Food Systems, and Community Development ISSN: 2152-0801 online
www.AgDevJournal.com
30 Volume 1, Issue 2 / Fall 2010
JS
Tribute to Jac Smit Urban agriculture: Linking the local and the global Peter Mann, Global Movements Program, WhyHunger
Greenbelts around cities, farming at the city edge, backyard orchards, rooftop beehives, vegetable plots in community gardens, school-yard greenhouses, fish farms, municipal compost facilities, window box gardens, farm animals at public housing sites, restaurant-supported salad gardens — these are all examples of urban agriculture at work in our cities.22
Thus began the introduction to a Special Fall 1999/Winter 2000 Issue of the Community Food Security News on “Grow-
ing Food in Cities: Urban Agriculture in North America.”23 The forms and scope of urban agriculture have only expanded in the decade since then as the local food movement has exploded, the economic crisis hit America’s inner cities, and urban farmers responded by turning vacant lands from “brownfields” into “greenfields.” In addition, the increasing health problems of inner city and rural populations have turned the attention of nutritionists, urban planners, and politicians to the issue of food deserts.
As co-editor of the newsletter with Kate Sullivan, this was the first time I collaborated with Jac Smit, who contributed an article entitled “The Roots of Urban Agriculture in North America.” I had met Jac years earlier in my international work when the
22 Introduction, special issue on “Growing Food in Cities: Urban Agriculture in North America.” Community Food Security News, Fall 1999/Winter 2000. 23 This was one of many publications by the Urban Agriculture Committee of the Community Food Security Coalition at www.foodsecurity.org/ua_home. Unfortunately, this special issue of CFS News is not available in the newsletter’s digital archives.
path-breaking book Urban Agriculture: Food, Jobs and Sustainable Cities, of which he was the lead author (Smit et al., 1996), opened the eyes of many of us at a UN conference to the incredible work of people growing food in and around cities through-out the world. I remember at that conference handing an extra copy of the book to Kathy Lawrence, at the time executive director of the organization Just Food, which we had recently launched in New York. I feel sure that Urban Agriculture was a catalyst for many local initiatives, including Just Food’s highly successful “City Farms” program.24
Community Food Security and Anti-Hunger Urban agriculture brought together in my work two worlds: community food security and anti-hunger/anti-poverty. Within the U.S, it was the Community Food Security Coalition (CFSC) that made a commitment to urban agriculture and brought its issues into public policy and federal agencies. In that early CFS newsletter, it was the words of inner-city community activists such as Karen Washington and Abu Talib that helped me see how urban gardening and farming can begin to transform poor communities.
Gardeners from Harlem to the South Bronx, to Wyoming, to Kansas City, we know who we are. We are forces of nature. We are sowing seeds of life, we are giving life to people in our communities, and that transcends everything. What we have in common is that we’re trying
24 For more on Just Food’s City Farms program, go to http://www.justfood.org/city-farms
Journal of Agriculture, Food Systems, and Community Development ISSN: 2152-0801 online www.AgDevJournal.com
Volume 1, Issue 2 / Fall 2010 31
to at least provide fresh food to people who need it.25
Since then, community food security issues and anti-hunger work have increasingly converged in urban farming, farm-to-school programs, community supported agriculture, farmers’ markets, and food banks working with local farmers. WhyHunger’s Food Security Learning Center brings many examples of this convergence.26 Hank Herrera, a leader in develop-ing local food systems, noted that the urban agriculture movement “has experienced explosive growth in the past few years with so many new folks and new leadership. It is all wonderful and truly inspiring to witness these changes. But at a moment like this, let’s pause briefly to remember with fondness the people who came before us, led the way, encouraged and respected us. Knowing Jac was a gift.”27
On the international level, it was primarily Jac Smit who opened my eyes to the ongoing connections between the urban poor and urban farming. As an urban planner employed for decades by govern-ments and international agencies to develop agri-culture plans for cities as well as in zones of con-flict and refugee camps, he had a vast knowledge of global urban agriculture initiatives which he shared easily and eloquently with others. My last interview with him was on rebuilding Iraq’s food system after the second Gulf War. In that interview he blended
25 Karen Washington, special issue on “Growing Food in Cities: Urban Agriculture in North America.” Community Food Security News, Fall 1999/Winter 2000, 10. 26 The Food Security Learning Center’s (http://whyhunger. org/programs/fslc.html) topic on community gardens will soon be joined by a forthcoming topic on urban farming. 27 See “Remembering Jac Smit” at www.whyhunger.org/ programs/39-global-movements/864-latest-news-from-global-movements.html
historical perspectives on agriculture in the Middle East with practical initiatives for rebuilding Iraq’s food system. It is tragic that the post-war history of Iraq went in a very different direction.28
Rural and Urban Linkages One problem in resolving urban food issues is that the needs of urban and rural populations are often treated as separate or even competing issues, when
in reality they are inextricably linked. The same forces that are driving peasants off the land are spurring rising rates of food insecurity and diet-related health pandemics in cities throughout the world. Indeed, many of those joining the ranks of the urban poor and food insecure are those who once earned their livelihoods from the land. Urban food insecurity therefore cannot be addressed in isolation from the crisis in the
countryside. A far more viable approach is to maximize the food-producing capacity of cities through urban and peri-urban farms and gardens, while building “urban-rural linkages” in which cities are fed through sustainable farms in surrounding regions and, in turn, “the purchasing power of global cities and their institutions can be an engine for new investment in the rural sector.”29
Jac’s work will live on, not least in the renewed focus on urban-rural linkages. I feel that his insights will help us resolve problems we face today.
28 The interview is in WHY Speaks at http://www.whyhunger. org/news-and-alerts/why-speaks/473.html. During the 1980s, Jac led the development of a comprehensive plan for Greater Baghdad. 29 This section is adapted from Christina Schiavoni’s “Addressing Urban Food Insecurity” section in Eradicate Hunger’s 2009 report, and from Thomas Forster (2009) “Regions Feeding Cities — Urban Rural Linkages for Food Security.”
Jac Smit opened my eyes to
the ongoing connections
between the urban poor and
urban farming. He had a vast
knowledge of global urban
agriculture initiatives
which he shared easily and
eloquently with others.
Journal of Agriculture, Food Systems, and Community Development ISSN: 2152-0801 online
www.AgDevJournal.com
32 Volume 1, Issue 2 / Fall 2010
JS
Tribute to Jac Smit Urban agriculture: Oxymoron no more! Katherine Brown, Southside Community Land Trust
Farms in the city still sounded like a contradiction only 10 years ago when several of us, including Jac Smit,
compiled an urban agriculture “primer” for the Community Food Security Coalition’s Urban Agriculture Committee (2003). Hoping to inspire others with the changes that are possible when urban food systems thrive, we peppered the document with examples of wonderful pioneers in the movement. Among the model projects we included were The Homeless Garden Project in Santa Cruz; in and nearby Boston, The Food Project’s farming-based youth leadership programs; Heifer Project’s Chicago-based Cabrini Greens project; Nuestras Raices’s social entrepreneurs in Holyoke, Mass.; and Will Allen’s Growing Power in Milwaukee. The primer also offered recommen-dations for growing the movement.
These days urban agriculture is common vocabu-lary. This morning, for example, a quick Google search yielded more than 9 million results when I typed in urban agriculture. And not a month passes without my mother sending me a New York Times news clipping about someone in some city grow-ing, selling, or eating farm-fresh food. The number of community, backyard, and school food gardens has grown exponentially. Providence, Rhode Island, where I live, established over 20 new com-munity gardens over the past three years alone, jumping from 250 to 750 families eating home-grown food. Farmers’ markets, CSAs, and farm-to-institution initiatives over the past decade have translated into farm viability and a resurgence in the number of new, young farmers.
The main reason that urban agriculture has taken hold so powerfully is that it has demonstrated on the ground that its impacts are immediately posi-tive, far-reaching, and relatively cost-effective — whether as a tool for improving community food security, remediating polluted soils, connecting people to nature, building community, fighting crime, providing meaningful livelihoods, or grow-ing the next generation of leaders and entrepre-neurs. We have also prospered immeasurably from the guidance of brilliant but down-to-earth vision-aries like Jac. I am among many others who learned from Jac’s remarkable ability to synthesize theory, practical know-how, and foresight.
Jac, Annu Ratta, and Joe Nasr’s 1996 book Urban Agriculture: Food, Jobs, and Sustainable Cities, often referred to as “the bible of urban agriculture,” kindled a palpable change in my and others’ think-ing about what urban agriculture was capable of accomplishing. Their book was published when I was about a year into founding City Sprouts, a half-acre food garden in Omaha, Nebraska, on the site of a drive-by shooting in a vacant lot. Reading about their complex systems approach to urban agriculture and learning from their detailed documentation, I “got it” that our little garden was a part of something very big — worldwide in fact. What we in Omaha, and those hundreds of millions of others elsewhere, are doing is no less than re-envisioning our urban and suburban landscapes in ways that are making real differences in urban residents’ quality of life.
Subsequent conversations with Jac, Joe, and others at CFSC annual meetings reinforced the under-
Journal of Agriculture, Food Systems, and Community Development ISSN: 2152-0801 online www.AgDevJournal.com
Volume 1, Issue 2 / Fall 2010 33
standing that to realize urban agriculture’s potential for structural change and social justice requires more than simply good examples of urban agricul-ture projects on the ground. For the impact of these projects to endure and expand, we urgently need to ensure their integration into the city’s fabric and power base.
The concept of an interconnected food system that shapes the contours of urban agriculture’s develop-ment, and the explicit appeal to include policy change in the urban agriculture agenda, opened the field to professionals and practitioners who other-wise would not have found common ground with urban agriculture’s original proponents, such as community gardeners and youth advocates. Conse-quently, urban agriculture has become a regular feature at conferences, drawing an ever-widening and interlocking community of professionals from planning, environmental and public health, nutrition, social work, architecture and landscape design, economic develop-ment, social justice, criminal justice, and a range of other academic and scientific fields.
Funders too are increasingly attracted to the significant track record set by the USDA’s Community Food Project Program grants. These grants require grantees to ensure that their program innovations strengthen sustained collaborations between such food sectors as producers, consumers, composters, and market vendors, and link broadly with people working to transform their community’s transportation, economic development, education, brownfield conversions, health care, or affordable housing.
In preparation for writing this tribute to Jac, I took a look at the recommended to-do list we published in our Urban Agriculture Primer, and felt Jac’s affirmative thumbs-up with where we’ve come. For
instance, the urban agriculture movement lays claim to food policy councils and other coalitions that have incorporated urban agriculture into city and state land-use plans, including zoning changes and developers’ set-back requirements that enable edible landscaping and other areas where food can be grown. More and more cities are adopting regulatory allowances for chickens and bees, and for establishing community gardens in public parks. And a few cities have mandated composting as part of solid-waste management, providing support for on-site composting facilities in urban agriculture projects, with related public education programs and advice.
The farm-to-school initiative has grown from 10 schools with local food purchasing agreements in
1997 to 2,000 in 2008, many of them in urban centers (Joshi & Azuma, 2009). Most cities now boast farmers’ markets, bolstered by government and philanthropic partners’ expansion of WIC Farmer’s Market Nutrition Program, the Senior Farmer’s Market Nutrition Program, and EBT (food stamps) to support purchases of healthy local food. Urban agriculture practitioners have also learned a lot about how to remediate polluted urban soils for
food production (Scheyer & Hipple, 2005). As a result of these and many other milestones, city people are raising and eating increasingly noteworthy amounts of food. However Jac’s memory remains as a compelling and persistent nudge, keeping us all working toward what still needs to be done.
More of the above is needed of course…and some! But land also remains key to the future of urban agriculture. The recent financial collapse has lowered land values and created a window of
We have prospered immeasurably
from the guidance of brilliant
but down-to-earth visionaries
like Jac. I am among many
others who learned from Jac’s
remarkable ability to
synthesize theory, practical
know-how, and foresight.
Journal of Agriculture, Food Systems, and Community Development ISSN: 2152-0801 online
www.AgDevJournal.com
34 Volume 1, Issue 2 / Fall 2010
opportunity to preserve farms on the urban fringe and convert idle and underused urban lands into production areas. Usufruct is a term I learned from Jac, meaning the legal right to use property that belongs to someone else. Its nimble application in these times requires urban agriculture proponents to evolve new land-tenure schemes such as urban land trusts, leases, and even eminent domain to secure long-term commitment for community gardens, entrepreneurial farms, and other urban agriculture ventures. Urban agriculture advocates also need to be thinking outside the box with government, banks, businesses, and investors to tailor financial loan packages, subsidies, and
business savvy to fit urban agriculture’s needs for capital to support infrastructure improvements to support local food systems. Finally, it would not be true to Jac’s vision if we were to forget the need to support aquaculture by cleaning up and providing access to public waterways for raising fish so urban families have greater access to a high-protein source of food.
The movement is fortunate to have benefited from Jac’s lasting wisdom and his undaunted sense of possibility. May we continue to draw from his legacy to guide our best thinking and most courageous and politically strategic efforts.
Journal of Agriculture, Food Systems, and Community Development ISSN: 2152-0801 online www.AgDevJournal.com
Volume 1, Issue 2 / Fall 2010 35
JS
Tribute to Jac Smit On urban agriculture’s future: Some remarks from Jac Smit Jerry Kaufman, University of Wisconsin–Madison
Jac Smit was one of the founders of the urban agriculture movement; some even consider him to be the father of the
movement. I first met Jac in Chicago when I worked for the American Society of Planning Officials (ASPO) in the 1960s. Jac worked at the time for the Northeastern Illinois Planning Commission (NIPC) and led the team, as project director, that developed the Chicago Region 2000 Year Plan.
Our paths did not cross again until 30 years later when I discovered that he had become a leader in the emerging urban agriculture movement. Jac’s interest and expertise in urban agriculture were honed over the period after he left NIPC as he worked as a planning consultant who helped prepare city and regional plans in far-away places, from India and Pakistan, to Egypt and Iraq, to Tanzania — making sure to integrate urban agricul-ture as a consideration in all these plans. A relative newcomer to the food-planning arena myself in the late 1990s, I asked him to join me in 1999 to speak at the first-ever session on food-system planning at a conference of the American Planning Association (APA).30
I remained in communication with Jac in the subsequent decade, as urban agriculture and other parts of the food system were gradually accepted into the fold of the planning discipline as an area of increasing interest. It was thus fitting that I would seek to include Jac in a session that I organized in 2009 at the APA conference in Minneapolis on Urban Agriculture’s Future.
30 APA had been formed in 1978 through the merger of ASPO and the American Institute of Planners.
The attendance at that panel was massive — esti-mated at several hundred people.31 Unfortunately, Jac could not join us, as he was terminally ill at that point. However, he was pleased to have me share some of his views about the future of urban agri-culture with the audience at this session. This contribution is thus based partly on my phone interview with Jac Smit prior to that conference.32 I will focus here on some of his thinking about the prospects for urban agriculture. His thoughts about the future nest within what he was fond of saying are the principal “drivers” of change that explain the surge of interest and application of urban agriculture in the 21st century.
1. Rapid urbanization. Jac points to rapid urbanization outpacing even population growth in the world — “the world became over half urban in 2005.”
2. The Internet. The Internet has given great impetus to the increase of global access to vast stores of information. In 1995 urban agriculture was not listed at the world’s largest repository of information, the Library of Congress. In 2008, 13 years later, Smit said he checked urban agriculture on Google and found 4 million entries.
3. Technology. The development of technology for urban agriculture includes bio-intensive
31 Other luminaries who took part in that session on April 27, 2009, were Will Allen, the founder of Growing Power (the organization whose board I chair), and Wayne Roberts, the longtime coordinator of the influential Toronto Food Policy Council. 32 Unless referenced otherwise, all passages below quoting Jac Smit are from phone interviews by the author, April 2009.
Journal of Agriculture, Food Systems, and Community Development ISSN: 2152-0801 online
www.AgDevJournal.com
36 Volume 1, Issue 2 / Fall 2010
production; hoop houses that are less costly than greenhouses; drip irrigation; hydro-ponic and aeroponic production; eco-sanitation, which safely reuses city waste-water and solid organic wastes; and agri-cultural production on roofs, water, and fences.
4. Energy and climate benefits. Jac often pointed out the need for increasing recognition of the beneficial impacts of urban agriculture on energy and climate, often pointing to data he collected over the years to make his point.
a. Productivity: The UN Food and Agricul-ture Organization reports that urban agriculture produces seven times as much per acre as rural agriculture worldwide. NASA has found that the urban area in the U.S. has ten times the potential productivity per acre as compared to space that is currently being farmed.33
b. Energy costs: Urban agriculture has lower energy demand per calorie of food produced than does rural agriculture because, claimed Smit, of its greater relative productivity, its closeness to markets, and its use of urban organic wastes as a major production input.
So, what about the future? In a piece Jac wrote about sustainable development, he presented his vision of urban agriculture in the future as follows:
33 http://www.jacsmit.com/21century.html
Urban agriculture will make roofs, fences, walls, parking lots, roadsides and vacant lots and abandoned sites productive. It will connect lawns to produce fruits and vegetables. Street trees will bear fruit. Waterways will produce fish and vegetables. Steep slopes will be terraced and produce vegetables and vineyards, as well as provide pastures for sheep and goats.34
Far-fetched? Maybe, maybe not. In a recent issue of APA’s Planning magazine (May 2009), Tim Beatley, professor of planning at the University of Virginia, wrote a prescient and informative piece titled Sustainability 3.0: Building tomorrow’s earth-friendly communities. In it, Beatley contends that “the last
decade or so has seen a remarkable emergence of new commitments to sustainability, and that sustainability has emerged as a major new paradigm in planning” (Beatley, 2009).35 Beatley’s article is sprinkled with references to urban agriculture or surrogates for that term — e.g., rooftop gardens (450 of them in Chicago alone); “solid waste and wastewater (traditionally seen as negative outputs)
being re-envisioned as productive inputs to satisfy other urban needs, including food, energy, and clean water” (Ibid.); what he might have called local food autonomy in his description of Dongtan, China, a new ecological city near Shanghai, where most food are produced locally; and finally, new large-scale models of urban sustainability that represent “more holistic thinking and integrative design: thinking at once about energy, water, transportation, urban form, and even food production — and how they integrate” (Ibid.).
34 http://www.jacsmit.com/sustainableagri.html 35 Note that Smit, et al.’s 1996 book on urban agriculture worldwide prominently featured the words “sustainable cities” in its title. Jac was clearly ahead of the game.
This simultaneous consideration
of food along with other key
resources such as water and
energy match Jac’s strong focus
on the link between food and
climate change.
Journal of Agriculture, Food Systems, and Community Development ISSN: 2152-0801 online www.AgDevJournal.com
Volume 1, Issue 2 / Fall 2010 37
This simultaneous consideration of food along with other key resources such as water and energy match Jac’s strong focus, in his final years, on the link between food and climate change. He sets the table for this discussion by contending that “urban places cover between 2% and 3% of the world’s surface, but are responsible for the majority of air and water pollution, carbon and other toxic emissions, global warming and climate change.” He then goes on to make a strong claim: “There is no better tool known or available to fight climate change than urban agriculture.”
Most intriguing, however, is Jac’s notion that lawns (e.g., residential lawns, university, government and institutional lawns, office building lawns, golf course greens, and portions of schoolyards, parks, and amusement parks) have great potential to become a major force in the urban agriculture movement as settings for producing vast amounts of food. In a short, provocative article titled “Eat half your lawn,”36 Jac waxes enthusiastically about lawns as food production centers.
He begins by citing work of NASA, which, he says, identified 23 million acres of lawn in 2007. Corn, at 7 million acres, is in second place as the most cultivated crop. Going on, he makes the following provocative contentions: “Lawns require more water, fertilizer and weed and insect treatment per acre than corn or any other major crop and…lawns are the single greatest polluter of our creeks, ponds, rivers, and lakes, and bays.”37
He then asks the question: “What if half of every lawn was converted to food production?” He
36 http://www.jacsmit.com/archive/eatlawn.html 37 http://dirt.asla.org/2007/07/10/nasa-goes-looking-for-us-lawnsfrom-space
points out, in response, that such a conversion “would reduce global warming and polluting factors of agriculture including shipping, storage, packaging, and waste.” A key factor in doing this is that it would reduce the consumption per calorie of fossil fuels — so-called food miles. He goes on to say that our current global food system uses 7 to 14 fossil-fuel calories for every food calorie consumed at the dinner table.
He concludes with the following: “With the global food-energy-climate nexus crisis, this is a good time to ratchet up the agenda. ‘Eat Half Your Lawn,’ transforming 10 million acres (half the acreage of lawns) from mowed grass to other productive plants, lettuce to chestnuts. This goal may be a major element in our passing a healthy planet to our grandchildren.”38
Clearly, Jac was a passionate believer in and advocate for urban agriculture. He saw its biggest impact on reducing global warming, but also on having significant reductions in water pollution and obesity. He was quite comfortable with the idea of urban agriculture as an important component of the new paradigm of sustainable communities. For him, “urban agriculture is not the total solution, but it is an indispensable major element in a plan and program to achieve an urban society that is carbon neutral and does not further destroy our planet.”
The urban agriculture movement is indebted to Jac Smit for his trail-blazing leadership and accom-plishments.
38 http://www.jacsmit.com/archive/eatlawn.html
Journal of Agriculture, Food Systems, and Community Development ISSN: 2152-0801 online
www.AgDevJournal.com
38 Volume 1, Issue 2 / Fall 2010
List of Acronyms
APA American Planning Association
ASPO American Society of Planning Officials
CFSC Community Food Security Coalition
CGIAR Consultative Group on International Agricultural Research
CSA Community supported agriculture
DGIS Directorate General for International Cooperation (Netherlands)
EBT Electronic Benefits Transfer (food stamps, U.S.A.)
ETC International Educational Training Consultancy International (Netherlands)
FAO Food and Agriculture Organization
FTP File Transfer Protocol
GTZ Deutsche Gesellschaft für Technische Zusammenarbeit (Germany)
HTML HyperText Markup Language
IDRC International Development Research Center (Canada)
IIED International Institute for Environment and Development (UK)
IWMI International Water Management Institute
KARI Kenya Agricultural Research Institute
KUFSALCC Kampala Urban Food Security, Agriculture and Livestock Coordinating Committee (Uganda)
NALEP National Agriculture and Livestock Extension Program (Kenya)
NASA National Aeronautics and Space Administration (U.S.A.)
NEFSALF Nairobi and Environs Food Security, Agriculture and Livestock Forum (Kenya)
NGO Nongovernmental organization
NIPC Northeastern Illinois Planning Commission
NYC New York City
PDF Adobe Acrobat Portable Document Format
RUAF Resource Centres on Urban Agriculture and Food Security
SGUA Global Support Group on Urban Agriculture
SINA Settlements Information Network Africa
TUAN The Urban Agriculture Network
UA Urban Agriculture
UN United Nations
UNDP United Nations Development Programme
USDA United States Department of Agriculture
WIC Women Infant and Children Program (U.S.A.)
Journal of Agriculture, Food Systems, and Community Development ISSN: 2152-0801 online www.AgDevJournal.com
Volume 1, Issue 2 / Fall 2010 39
References Beatley, T. (2009). Sustainability 3.0. Building tomor-
row’s earth-friendly communities. Planning, 75:5, 16–22.
Bellows A. C., Brown, K. & Smit, J., with Urban Agriculture Committee: North American Initiative of the Community Food Security Coalition. (2005). Health benefits of urban agriculture. Community Food Security Coalition. http://foodsecurity.org/ pubs.html
Bellows, A. C. (2004). One hundred years of allotment gardening in Poland. Food and Foodways, 12:4, 247–276. doi:10.1080/07409710490893793
Cole, D. C, Lee-Smith, D. & Nasinyama, G. W. (Eds.) (2008). Healthy city harvests: Generating evidence to guide policy on urban agriculture. CIP/Urban Harvest and Makerere University Press. Lima, Peru.
Community Food Security Coalition’s North American Urban Agriculture Committee. 2003. Urban agriculture and community food security in the United States: Farming from the city center to the urban fringe. Accessed at http://www.foodsecurity.org/PrimerCFSCUAC. pdf
Egziabher, A. G., Lee-Smith, D., Maxwell, D. G., Memon, P. A., Mougeot L. J. A., & Sawio, C. J. (1994). Cities feeding people: An examination of urban agriculture in East Africa. International Development Research Centre, IDRC Ottawa.
Eradicate Hunger. (2009). Policies and actions to eradicate hunger and malnutrition. Working document. Retrieved from http://eradicatehunger.org
Forster, T. (2009, May). Regions feeding cities: Urban rural linkages for food security. Outreach Issues, 5.
Joshi, A. & Azuma, A. M. (2009). Bearing fruit. Farm to school program evaluation resources and recommendations. National Farm to School Network, Center for Food and Justice, Occidental College.
Mougeot, L. J. A. (1994). Urban food production: Evolution, official support and significance. Cities Feeding People Series, Report 8. International Development Research Centre, IDRC Ottawa. http://www. cityfarmer.org/lucTOC26.html
Prain, G., Karanja, N. K., & Lee-Smith, D. (Eds.). (2010). African urban harvest: Agriculture in the cities of Cameroun, Kenya and Uganda. Springer, New York: International Development Research Centre, IDRC Ottawa.
Sanyal, B. (1985). Urban agriculture: Who cultivates and why? A case study of Lusaka, Zambia. Food and Nutrition Bulletin, 7:3, 15–24.
Scheyer, J. M. & Hipple, K. W. (2005). Urban soil primer. United States Department of Agriculture, Natural Resources Conservation Service, National Soil Survey Center, Lincoln, Nebraska.
Smit, J. (1980). Urban and metropolitan agricultural prospects. Habitat International, 5:3/4, 499–506. doi:10.1016/0197-3975(80)90036-3
Smit, J., & Nasr, J. (1999). Urban agriculture for sustainable cities: Using wastes and idle land and water bodies as resources. In D. Satterthwaite (Ed.). The Earthscan Reader in Sustainable Cities (pp. 221–233). London: Earthscan. (Reprinted from Environment and Urbanization, 4: 2 (1992), 141–151)
Smit, J., Nasr, J. & Ratta, A. (Undated). Urban Agriculture: Food, Jobs and Sustainable Cities. Sponsored by the United Nations Development Programme. Unpublished 2nd edition (2001). Forthcoming in 2010 online at http://www.jacsmit.com and http://www.metroagalliance.org
Smit, J., Ratta, A. & Nasr, J. (1996). Urban agriculture: Food, jobs and sustainable cities. United Nations Development Programme, publication series for Habitat II, Vol. 1. New York: UNDP.
Steel, C. (2008). Hungry city: How food shapes our lives. London: Random House.
Vennetier, P. (1963). ’L’urbanisation et ses consequences en Congo-Brazzaville. Cahiers d’Outre-Mer, 16, 263–380.
Viljoen, A. (Ed.). (2005). CPULs — Continuous Productive Urban Landscapes: Designing urban agriculture for sustainable cities. Oxford: Architectural Press.
Washington, K. (2000, Fall 1999/Winter 2000). Growing food in cities: Urban agriculture in North America. Community Food Security News, Special issue, 10.

Journal of Agriculture, Food Systems, and Community Development ISSN: 2152-0801 online
www.AgDevJournal.com
40 Volume 1, Issue 2 / Fall 2010
Journal of Agriculture, Food Systems, and Community Development ISSN: 2152-0801 online www.AgDevJournal.com
Volume 1, Issue 2 / Fall 2010 41
Assessing the local food supply capacity of Detroit, Michigan Kathryn J. A. Colasanti, MSa Academic Specialist, Department of Community, Agriculture, Recreation and Resource Studies, Michigan State University
Michael W. Hamm, PhDb C.S. Mott Professor of Sustainable Agriculture, Department of Community, Agriculture, Recreation and Resource Studies, Michigan State University
Submitted 22 April 2010 / Accepted 16 June 2010/ Published online November 2010 Citation: Colasanti, K. A., & Hamm, M. W. (2010, November). Assessing the local food supply capacity of Detroit, Michigan. Journal of Agriculture, Food Systems, and Community Development, 1(2):41–58. doi:10.5304/jafscd.2010.012.002
Copyright © 2010 New Leaf Associates, Inc.
Abstract Urban agriculture is touted as a strategy for more locally reliant food systems, yet there is little under-standing of its potential food provisioning capacity. Using Detroit, Michigan as an example, we use secondary data to develop a methodology for estimating the acreage required to supply, as far as seasonally possible, the quantity of fresh fruits and vegetables consumed by city residents. We com-pare these requirements with a catalog of the publicly owned, vacant parcels in Detroit to assess the feasibility of producing significant quantities of the fresh produce consumed within city limits. We demonstrate that if high-yield, biointensive grow-ing methods are used, 31% and 17% of the sea-sonally available vegetables and fruits, respectively, currently consumed by 900,000 people could be
a Corresponding author: Dept. of Community, Agriculture, Recreation and Resource Studies, Michigan State University, 303 Natural Resources Building, East Lansing, MI 48824 USA; tel. +1-517-353-0642; [email protected]
b Dept. of Community, Agriculture, Recreation and Resource Studies, Michigan State University, 312B Natural Resources Building, East Lansing, MI 48824 USA; [email protected]
supplied on less than 300 acres without incorpo-rating extraordinary postharvest management or season-extension technology. This indicates that urban agriculture could play an important role in food provisioning in many places.
Keywords food supply, local food systems, season extension, urban agriculture, urban sustainability
Introduction and Background Deindustrialized cities with large amounts of vacant land and transitioning economic founda-tions force us to reconsider patterns of urban land use. Some scholars have proposed developing green infrastructure, including urban agriculture, as a way to “revitalize urban environments, empower community residents, and stabilize dysfunctional markets” within shrinking cities (Schilling & Logan, 2008, p. 451). Research from Germany points to community gardens as a good use of land in deindustrialized areas, not only because of the social and ecological benefits, but also because these uses require minimal up-front investment and do not impede later edificial development (Rosol,
Journal of Agriculture, Food Systems, and Community Development ISSN: 2152-0801 online
www.AgDevJournal.com
42 Volume 1, Issue 2 / Fall 2010
2005). In numerous U.S. cities that have faced severe economic declines, such as Philadelphia, Detroit, and Milwaukee, urban agriculture (UA) movements have been able to utilize vacated spaces to cultivate food and reinvest in neighborhoods (Gray, 2007; Hair, 2008; McGuire, 2007; McMillan, 2008; Wells, 2008).
As interest in UA grows and as ecological threats increase, the possibility of UA on a larger scale has gained attention as a strategy for moving toward sustainable urbanization. Urban green space, which can include UA, has been shown to generate numerous social and environmental benefits (Kuo & Sullivan, 2001; Taylor, Wiley, Kuo, & Sullivan, 1998; Tzoulas et al., 2007) and has been posited as a key element of urban sustainability (Chiesura, 2004). Advocates of urban agriculture have argued that an increase in local food production would diminish a city’s reliance on resource-consumptive imported foods (see for example Deelstra & Girardet, 2000; Garnett, 1999; Rees, 1997). Our research addresses this possibility by exploring the connection between an urban land base and local provision of food. A better understanding of this connection and the methods by which a potential contribution to urban food supply can be estimated will enable city planners and urban developers to understand the food-provisioning capacity of UA.
With Detroit, Michigan, as a test case, our research was driven by two questions. First, what percent-age of current and recommended Detroit resident dietary intake of fruits and vegetables could be met through urban food production? Secondly, how much land would be necessary to achieve this level of production, and is the utilization of this quantity of land feasible given the amount and distribution of vacant, publicly owned land? With its large swaths of vacant land and its strong urban agricul-ture movement, Detroit offers an ideal place to conduct research on the opportunities to signifi-cantly affect food supply through scaling up UA.
We begin by summarizing the links between UA and sustainable urbanization. We then present our research methods alongside a discussion of our results. Our discussion summarizes the most sig-
nificant results and notes the transferability of our methodology. We conclude by discussing future avenues of inquiry and implications for practitioners.
Urban Agriculture and Sustainable Urbanization Empirical studies of UA document benefits such as improved air quality, preservation of cultivatable land, cooler buildings, improved urban biodiver-sity, waste and nutrient recycling, and stormwater management (Deelstra & Girardet, 2000; Mendes, Balmer, Kaethler, & Rhoads, 2008). Irvine, Johnson & Peters (1999) argue that community participation in the creation of a garden can be a model for defining the dimensions of urban sus-tainability in a way that meets the needs of diverse urban residents.
Smit and Nasr (1992) envision UA integrating into the urban environment and improving sustainabil-ity through its ability to recycle urban wastes, util-ize idle land and bodies of water, and conserve energy by substituting for less sustainable practices associated with importing food. Landscape archi-tect André Viljoen (2005) advocates urban land-scapes that are socially, economically and environmentally productive and imagines UA playing a key role in achieving urban sustainability as sites for recreation, for ecological services, and as the foundation for food system relocalization. Yet, absent empirical research on the impacts of UA on a particular city, much in these visions remains speculative.
A small body of work looks at how UA can con-tribute to the social dimension of sustainability. Ferris, Norman, and Sempik (2001) show that community gardens can play a role in restoring environmental justice to ecologically degraded and marginalized communities. Garden sites can be a model of dynamic and participatory “sustainability in action” through social inclusion, environmental protection, and organic food production (Holland, 2004, p. 304). Howe and Wheeler (1999) argue that UA can support local economies by providing vocational training, producing goods and services, and bridging market gaps in the mainstream food
Journal of Agriculture, Food Systems, and Community Development ISSN: 2152-0801 online www.AgDevJournal.com
Volume 1, Issue 2 / Fall 2010 43
system. The social and ecological impacts of gardens can be particularly pronounced when blighted vacant lots necessitating continual city maintenance expenditures are transformed into places of beauty that foster safe play for children and neighbor interaction (Pottharst, 1995).
While estimates of the contribution of UA to food supply have been made, much is still unknown. A number of researchers have conducted foodshed analyses that look at the ability to supply a local population from current agricultural production within a region. Peters, Bills, Wilkins, and Smith (2002), for example, find New York has the capacity to provide 37.5% of the state’s total annual vegetable intake, while maintaining surplus levels of some crops. Researchers looking at the Willamette Valley in Oregon found that in 2008 agriculture production met only 10% of the recommended vegetable servings and 24% of the recommended fruit servings for the valley’s popu-lation (Giombolini, Chambers, Schlegel, & Dunne, in press). Desjardins, MacRae, and Schumilas (2010) looked at the Waterloo region of Ontario, Canada, and found it would be feasible to supply 10% to 50% of the additional intake needed to meet nutritional guidelines of particular fruit and vegetable crops that grow well in the area. How-ever, there remains a dearth of research relating an urban land base to food consumption by urban residents.
Some estimates suggest there are cities around the world that supply much of their own fruits and vegetables. For example, Shanghai and Beijing are apparently fully self-sufficient in vegetables (Howe, Bohn, & Viljoen, 2005). Several urban centers in Africa, including Brazzaville (Congo), Dar Es Salaam (Tanzania) and Accra (Ghana), produce more than 80% of their leafy vegetable needs (Mougeot, 2005). Some large Latin American cities are able to meet one-third of vegetable demand through urban production (Mougeot, 1993). However, the geographical boundaries used in these estimates are not clear and empirical data is scarce.
Nonetheless, a small but growing number of municipalities have embraced UA as a strategy for sustainable urbanization (Mendes et al., 2008). City government support has often come from the desire to increase green space and capitalize on public concern with environmental issues (Connelly & Ross, 2007). In 2006 the city of Vancouver announced an initiative to create 2,010 new gardens as a legacy for the 2010 Olympics (City of Vancouver, 2006) and as a way of “en-hancing the City’s food security and reducing the City’s ecological footprint by reducing ‘distance to fork,’” of “encouraging increased social interac-tion,” and of “supporting and encouraging an envi-ronmentally and socially sustainable activity” (Morris & Tapp, 2008, p. 3). Similarly, in 2008 the mayor of London and his appointed Chair of London Food announced a program to support identifying land and providing resources to create 2,012 garden sites by the 2012 Olympics (Capital Growth, 2008). At the national level, an executive order from the Philippines mandates funding for “the setting up of urban vegetable gardens and backyard fisheries” as protection against the global financial crisis (President of the Philippines Execu-tive Order No. 776, 2009). All of these initiatives cite environmental benefits and increased food security from UA as motivating forces.
Yet the question remains, what portion of the food supply could really be achieved through urban cultivation? Despite the interest in UA, we need to understand what level of urban production is feasible and what level is desirable across a city. While numerous advocates have speculated that UA could reduce dependency on imported food, and the associated carbon footprint, little research has explored the conceivable scale of urban food production relative to a city’s food needs.
This question becomes even more interesting when we consider that the majority of people in the U.S. eat far fewer fruits and vegetables than recom-mended by the U.S. Department of Agriculture (USDA) dietary guidelines (U.S. Department of Health and Human Services and U.S. Department
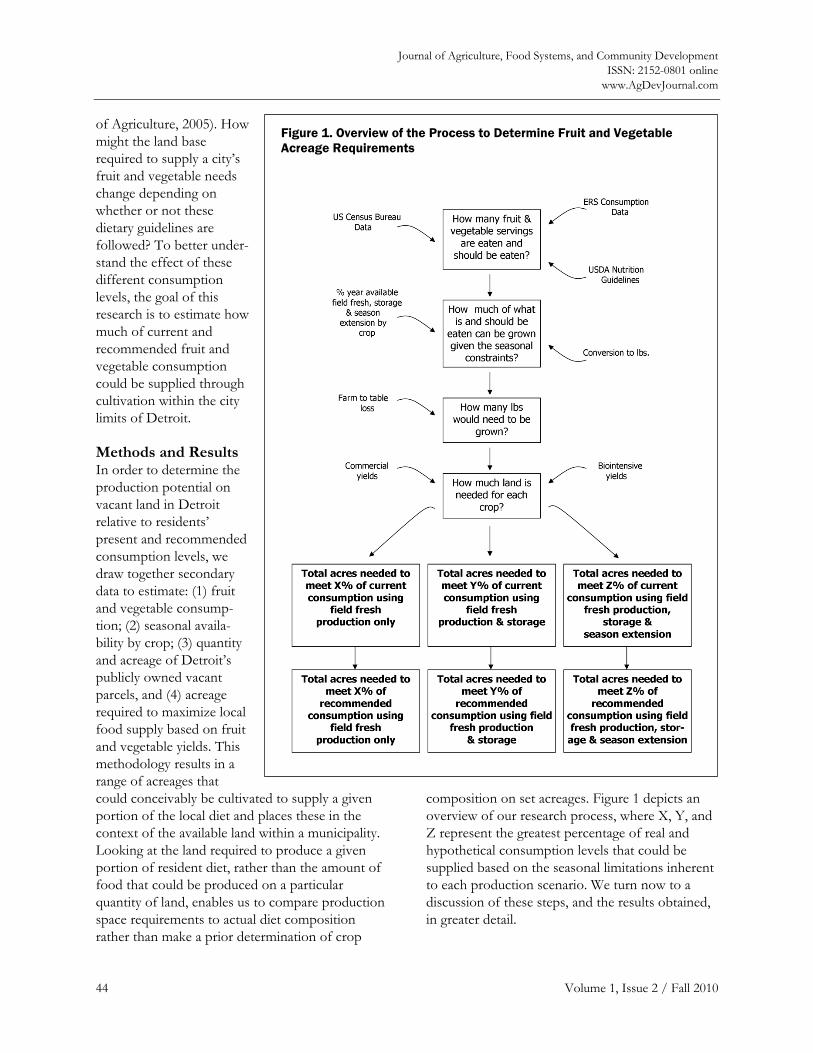
Journal of Agriculture, Food Systems, and Community Development ISSN: 2152-0801 online
www.AgDevJournal.com
44 Volume 1, Issue 2 / Fall 2010
of Agriculture, 2005). How might the land base required to supply a city’s fruit and vegetable needs change depending on whether or not these dietary guidelines are followed? To better under-stand the effect of these different consumption levels, the goal of this research is to estimate how much of current and recommended fruit and vegetable consumption could be supplied through cultivation within the city limits of Detroit.
Methods and Results In order to determine the production potential on vacant land in Detroit relative to residents’ present and recommended consumption levels, we draw together secondary data to estimate: (1) fruit and vegetable consump-tion; (2) seasonal availa-bility by crop; (3) quantity and acreage of Detroit’s publicly owned vacant parcels, and (4) acreage required to maximize local food supply based on fruit and vegetable yields. This methodology results in a range of acreages that could conceivably be cultivated to supply a given portion of the local diet and places these in the context of the available land within a municipality. Looking at the land required to produce a given portion of resident diet, rather than the amount of food that could be produced on a particular quantity of land, enables us to compare production space requirements to actual diet composition rather than make a prior determination of crop
composition on set acreages. Figure 1 depicts an overview of our research process, where X, Y, and Z represent the greatest percentage of real and hypothetical consumption levels that could be supplied based on the seasonal limitations inherent to each production scenario. We turn now to a discussion of these steps, and the results obtained, in greater detail.
Figure 1. Overview of the Process to Determine Fruit and Vegetable Acreage Requirements
Journal of Agriculture, Food Systems, and Community Development ISSN: 2152-0801 online www.AgDevJournal.com
Volume 1, Issue 2 / Fall 2010 45
Current and Recommended Consumption Estimates of current consumption were calculated using a 10-year average (1996–2006) of the USDA Economic Research Service (ERS) average daily per capita servings for fresh fruits and vegetables. We used the ERS Loss-Adjusted Food Availability database, which starts with aggregate food availa-bility data, adjusts for waste, and then calculates national average daily per capita servings (U.S. Department of Agriculture Economic Research Service, 2008). These per capita servings were multiplied by the resident population of Detroit according to the 2006 U.S. Census Bureau (834,557 people).1
The number of fruit and vegetable servings that should be eaten according to the USDA Nutrition Guidelines was calculated based on the My Pyramid recommendations for daily consumption of fruits and vegetables according to gender, age range, and activity level (U.S. Department of Agriculture Center for Nutrition Policy and Promotion, 2005). An active lifestyle is defined as one that, in addition to the activity of daily life, involves “physical activity equivalent to walking more than 3 miles per day at 3 to 4 miles per hour” (U.S. Department of Agriculture Center for Nutrition Policy and Promotion, 2005).
Following the assumption made by Conner, Knudson, Hamm, and Peterson (2008) that two-thirds of the population is sedentary and one-third of the population is active, we used the 2006 U.S. Census Bureau data to determine the resident population by gender and age range (U.S. Census
1 The Detroit population differs from the U.S. population as a whole in some significant ways. Most notably the city is 83.2% African-American and 32.5% of individuals are below the poverty line, according to the 2006 U.S. Census, compared to the national average of 12.2% African-American and 13.3% of individuals below the poverty line. This will certainly affect consumption patterns even though our analysis does not account for this. Furthermore many Detroiters suspect that the U.S. Census significantly undercounts the city’s population, particularly in the poorest communities. Despite these limitations, we believe the data nonetheless provide the appropriate order of magnitude for estimating fruit and vegetable consumption.
Bureau American Fact Finder, 2006), which then allowed us to calculate the yearly number of fruit and vegetable servings that should be eaten by Detroit residents. Since it was beyond the scope of this study to explore the potential for the proces-sing of locally grown fruits or vegetables, only the consumption of fresh, unprocessed fruits and vegetables was considered.
Of the fruits and vegetables tracked by ERS, only one vegetable, artichokes, cannot be grown in the Detroit region. However, 12 of the 23 fruits cannot be cultivated in this area: oranges, tangerines, grapefruit, lemons, limes, avocados, bananas, kiwi-fruit, mangoes, pineapple, papayas and cranberries.2 In this analysis we included artichokes and cran-berries in the total number of current and recom-mended servings, but excluded the aforementioned 11 tropical fruits, which we presume would con-tinue to be imported and consumed in the same relative proportions. In other words, the total numbers of both presently consumed and recom-mended vegetable servings include all vegetables for which data was available, but the total numbers of fruit servings include only the temperate fruits and do not include any tropical fruits.3
Again following Conner et al. (2008), we assumed that if Detroiters increased their daily servings of fruits and vegetables, they would still maintain both the relative proportions of different fruit and vege-table types and the relative proportions of fresh and processed produce in their diets. We therefore multiplied the total number of recommended fruit and vegetable servings by the proportion each fruit or vegetable in its fresh form represents within
2 Cranberries are the sole nontropical fruit in this list, and while on the basis of seasonal temperature fluctuations they could be grown in Detroit, their cultivation necessitates distinct production techniques that involve flooding the crop at various stages, the possibility of which was not considered in this analysis. 3 Of all the fruit and vegetable crops included in this analysis, all but six of the vegetables (asparagus, eggplant, escarole/ endive, garlic, kale, and lima beans) and all but three of the fruits (cherries, grapes, and plums) were documented crops in Detroit gardens in the 2005–2006 growing seasons (Alaimo & Miles, 2007).
Journal of Agriculture, Food Systems, and Community Development ISSN: 2152-0801 online
www.AgDevJournal.com
46 Volume 1, Issue 2 / Fall 2010
current fruit and vegetable consumption. This allowed us to compare quantities of current fresh fruit and vegetable consumption with hypothetical quantities of fresh fruit and vegetable consumption that would accord with dietary guidelines even though there is no recommendation for levels of fresh produce consumption.
In this analysis both current and recommended consumption figures assume individuals consume equal portions of all fruit and vegetable crops throughout the year. While this is likely generally true for many crops, some crops, such as straw-berries or sweet corn, are probably eaten in greater quantities during the local harvest months. To the extent that this is the case, the proportion of current consumption that could be met through local production will be underestimated in our analysis, as will the amount of land necessary to supply current consumption levels.
According to our calculations, Detroiters eat an annual total of 285 million (285,036,649) fresh vegetable servings and 98.2 million (98,232,531) fresh, temperate fruit servings. If dietary patterns were to follow USDA recommendations, they would eat 854.1 million (854,131,315) fresh vegetable servings and 410.6 million (410,572,711) fresh, temperate fruit servings. This means that recommended consumption levels are more than four (4.2) times higher for fruit and three (3.0) times higher for vegetables than current consumption. In confirmation of this consumption pattern, the 2005–2007 Michigan Behavioral Risk Factor Surveillance System Regional & Local Health Department survey found that 77.2% of Detroit residents consume less than 5 servings of fruits and vegetables per day (Fussman, 2008).
The reasons why not just Detroiters but the majority of people across America tend to underconsume fruits and vegetables are many. Research has drawn attention to the comparatively limited physical access to healthy foods, including fruits and vegetables, for rural, low-income, and minority communities (Larson, Story, & Nelson, 2009; Pothukuchi & Wallace, 2009). While cultural dietary patterns, household food practices,
knowledge level, and perhaps even evolutionarily influenced food preferences (see Pollan, 2008) also affect consumption patterns, a literature review notes that research generally shows a correlation between better access to supermarkets and healthier diets (Larson et al., 2009). Furthermore, some research has shown that participation in UA increases fruit and vegetable intake (Alaimo, Packnett, Miles, & Kruger, 2008).
In Detroit, the extent to which research shows fruits and vegetables are not only physically less accessible but also of poorer quality and more expensive than in the suburbs (M. Gallagher, 2007; Pothukuchi, 2003; Treuhaft, Hamm, & Litjens, 2009; Zenk, Schulz, Hollis-Neely et al., 2005; Zenk, Schulz, Israel et al., 2005; Zenk et al., 2006), indicates that the limited sources for fruits and vegetables may have a particularly large influence on underconsumption patterns. Still, our intention in this work is not to argue that growing more fruits and vegetables in Detroit would reverse dietary patterns. We simply wish to call attention to the existence of this consumption gap, in Detroit and elsewhere, and argue that even if a city could grow all of its own fruits and vegetables based on what its residents currently eat, it does not necessarily mean it could meet the quantities needed for optimal diets. We also are not implying that if a city could grow quantities necessary for an optimal diet that residents would necessarily consume them; rather our goal is to explore the boundary conditions of what is feasible from a supply-consumption perspective.
Seasonal Availability In order to compare consumption data with what could be grown in Detroit, it was necessary to factor in the months of the year during which different fruits and vegetables are available. In addition to considering the season in which each crop is available fresh from the field, we also looked at whether and during what time period any of these crops could be available through the use of storage or season-extension technology via unheated hoop houses. Based on harvest and distribution data from the Michigan State
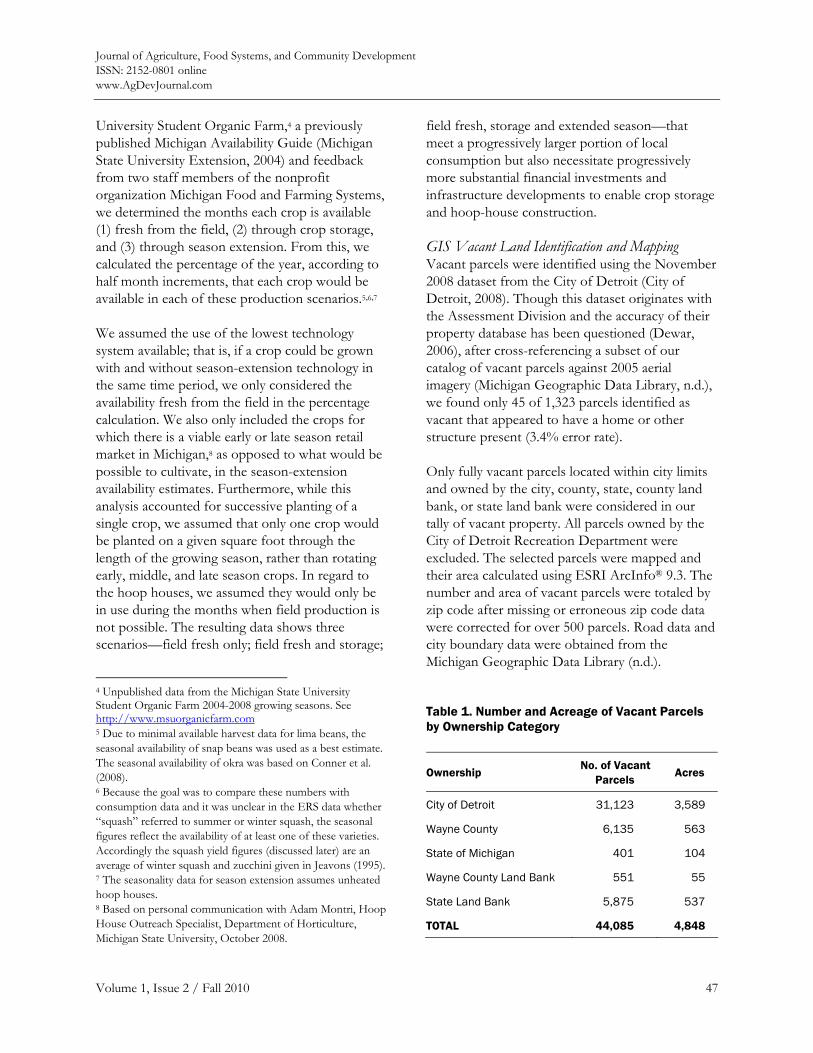
Journal of Agriculture, Food Systems, and Community Development ISSN: 2152-0801 online www.AgDevJournal.com
Volume 1, Issue 2 / Fall 2010 47
University Student Organic Farm,4 a previously published Michigan Availability Guide (Michigan State University Extension, 2004) and feedback from two staff members of the nonprofit organization Michigan Food and Farming Systems, we determined the months each crop is available (1) fresh from the field, (2) through crop storage, and (3) through season extension. From this, we calculated the percentage of the year, according to half month increments, that each crop would be available in each of these production scenarios.5,6,7
We assumed the use of the lowest technology system available; that is, if a crop could be grown with and without season-extension technology in the same time period, we only considered the availability fresh from the field in the percentage calculation. We also only included the crops for which there is a viable early or late season retail market in Michigan,8 as opposed to what would be possible to cultivate, in the season-extension availability estimates. Furthermore, while this analysis accounted for successive planting of a single crop, we assumed that only one crop would be planted on a given square foot through the length of the growing season, rather than rotating early, middle, and late season crops. In regard to the hoop houses, we assumed they would only be in use during the months when field production is not possible. The resulting data shows three scenarios—field fresh only; field fresh and storage;
4 Unpublished data from the Michigan State University Student Organic Farm 2004-2008 growing seasons. See http://www.msuorganicfarm.com 5 Due to minimal available harvest data for lima beans, the seasonal availability of snap beans was used as a best estimate. The seasonal availability of okra was based on Conner et al. (2008). 6 Because the goal was to compare these numbers with consumption data and it was unclear in the ERS data whether “squash” referred to summer or winter squash, the seasonal figures reflect the availability of at least one of these varieties. Accordingly the squash yield figures (discussed later) are an average of winter squash and zucchini given in Jeavons (1995). 7 The seasonality data for season extension assumes unheated hoop houses. 8 Based on personal communication with Adam Montri, Hoop House Outreach Specialist, Department of Horticulture, Michigan State University, October 2008.
field fresh, storage and extended season—that meet a progressively larger portion of local consumption but also necessitate progressively more substantial financial investments and infrastructure developments to enable crop storage and hoop-house construction.
GIS Vacant Land Identification and Mapping Vacant parcels were identified using the November 2008 dataset from the City of Detroit (City of Detroit, 2008). Though this dataset originates with the Assessment Division and the accuracy of their property database has been questioned (Dewar, 2006), after cross-referencing a subset of our catalog of vacant parcels against 2005 aerial imagery (Michigan Geographic Data Library, n.d.), we found only 45 of 1,323 parcels identified as vacant that appeared to have a home or other structure present (3.4% error rate).
Only fully vacant parcels located within city limits and owned by the city, county, state, county land bank, or state land bank were considered in our tally of vacant property. All parcels owned by the City of Detroit Recreation Department were excluded. The selected parcels were mapped and their area calculated using ESRI ArcInfo® 9.3. The number and area of vacant parcels were totaled by zip code after missing or erroneous zip code data were corrected for over 500 parcels. Road data and city boundary data were obtained from the Michigan Geographic Data Library (n.d.).
Table 1. Number and Acreage of Vacant Parcels by Ownership Category
Ownership No. of Vacant
Parcels Acres
City of Detroit 31,123 3,589
Wayne County 6,135 563
State of Michigan 401 104
Wayne County Land Bank 551 55
State Land Bank 5,875 537
TOTAL 44,085 4,848
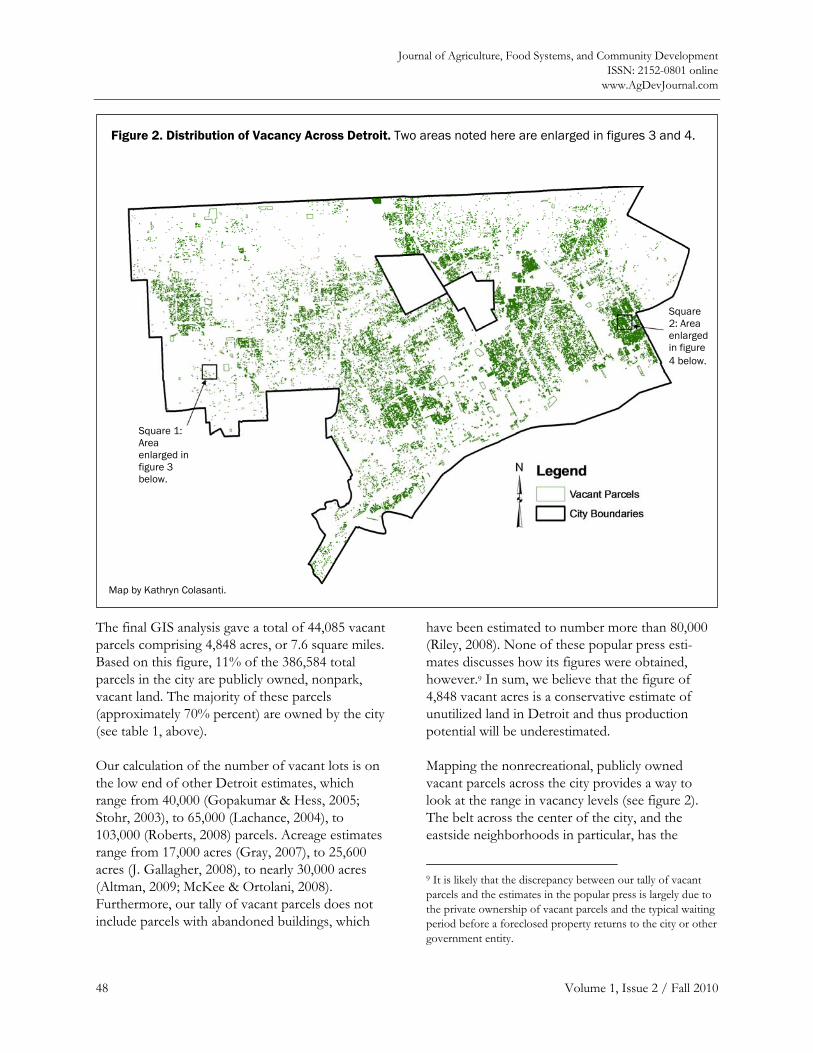
Journal of Agriculture, Food Systems, and Community Development ISSN: 2152-0801 online
www.AgDevJournal.com
48 Volume 1, Issue 2 / Fall 2010
The final GIS analysis gave a total of 44,085 vacant parcels comprising 4,848 acres, or 7.6 square miles. Based on this figure, 11% of the 386,584 total parcels in the city are publicly owned, nonpark, vacant land. The majority of these parcels (approximately 70% percent) are owned by the city (see table 1, above).
Our calculation of the number of vacant lots is on the low end of other Detroit estimates, which range from 40,000 (Gopakumar & Hess, 2005; Stohr, 2003), to 65,000 (Lachance, 2004), to 103,000 (Roberts, 2008) parcels. Acreage estimates range from 17,000 acres (Gray, 2007), to 25,600 acres (J. Gallagher, 2008), to nearly 30,000 acres (Altman, 2009; McKee & Ortolani, 2008). Furthermore, our tally of vacant parcels does not include parcels with abandoned buildings, which
have been estimated to number more than 80,000 (Riley, 2008). None of these popular press esti-mates discusses how its figures were obtained, however.9 In sum, we believe that the figure of 4,848 vacant acres is a conservative estimate of unutilized land in Detroit and thus production potential will be underestimated.
Mapping the nonrecreational, publicly owned vacant parcels across the city provides a way to look at the range in vacancy levels (see figure 2). The belt across the center of the city, and the eastside neighborhoods in particular, has the
9 It is likely that the discrepancy between our tally of vacant parcels and the estimates in the popular press is largely due to the private ownership of vacant parcels and the typical waiting period before a foreclosed property returns to the city or other government entity.
Figure 2. Distribution of Vacancy Across Detroit. Two areas noted here are enlarged in figures 3 and 4.
Square 1: Area enlarged in figure 3 below.
Square 2: Area enlarged in figure 4 below.
Map by Kathryn Colasanti.
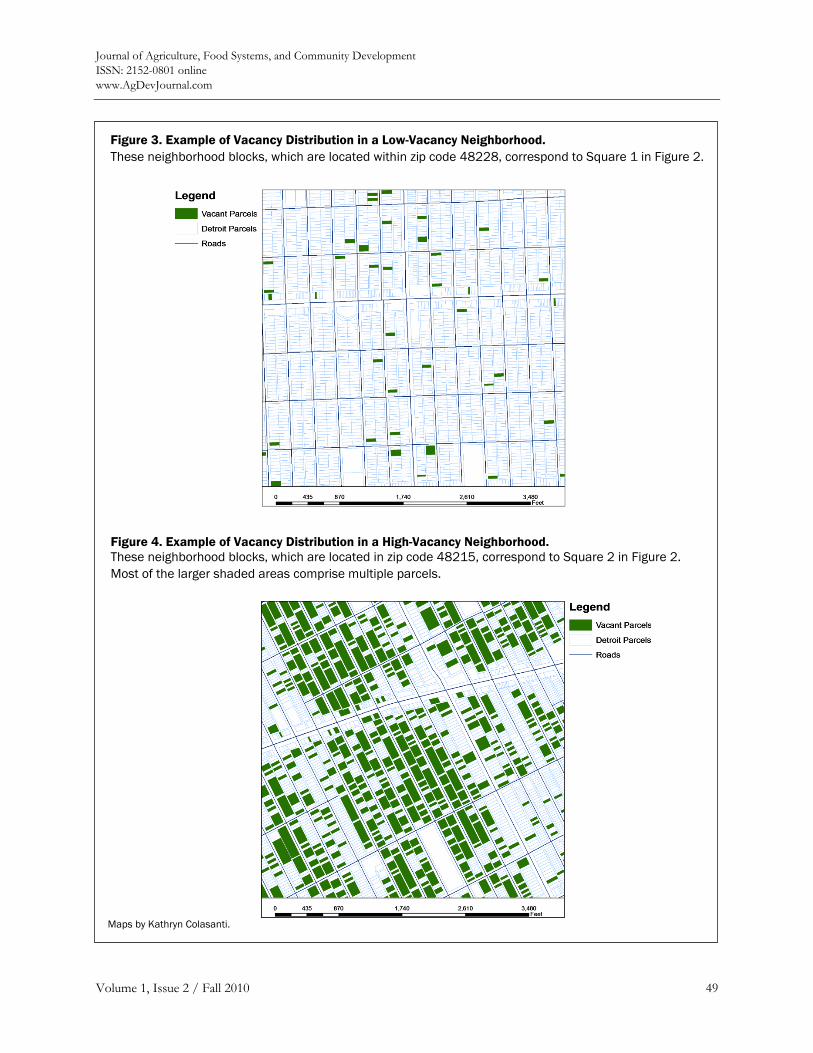
Journal of Agriculture, Food Systems, and Community Development ISSN: 2152-0801 online www.AgDevJournal.com
Volume 1, Issue 2 / Fall 2010 49
Figure 3. Example of Vacancy Distribution in a Low-Vacancy Neighborhood. These neighborhood blocks, which are located within zip code 48228, correspond to Square 1 in Figure 2.
Figure 4. Example of Vacancy Distribution in a High-Vacancy Neighborhood. These neighborhood blocks, which are located in zip code 48215, correspond to Square 2 in Figure 2. Most of the larger shaded areas comprise multiple parcels.
Maps by Kathryn Colasanti.
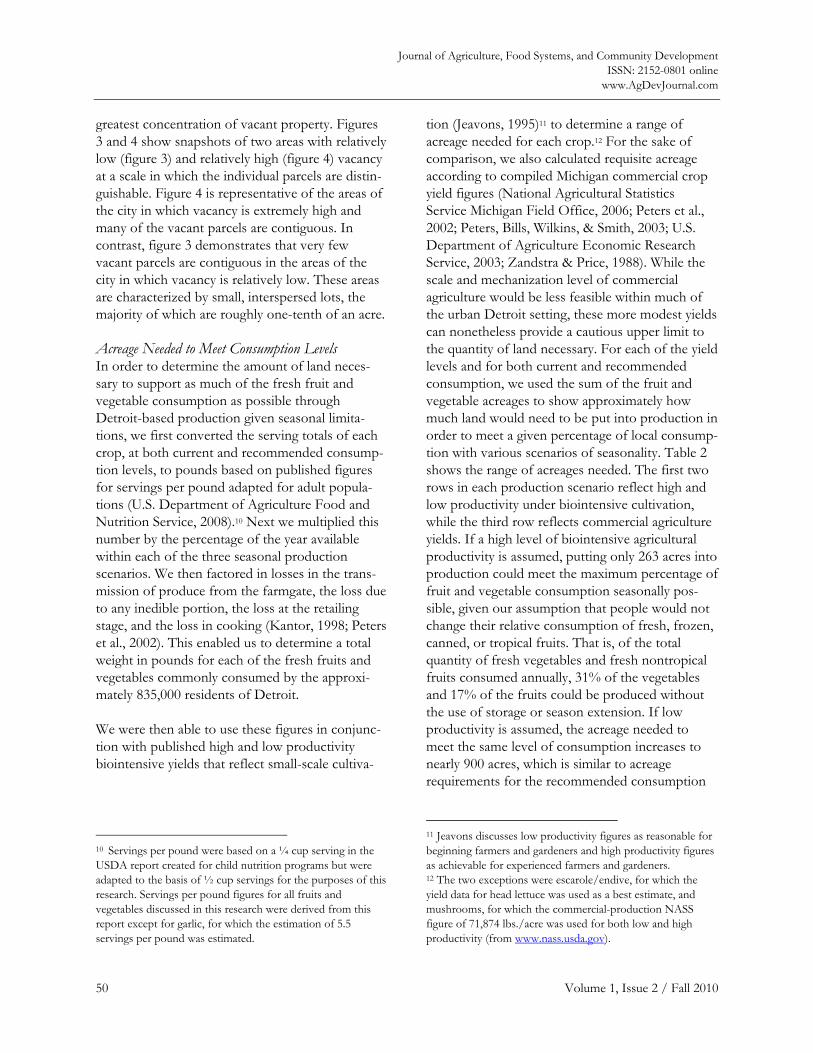
Journal of Agriculture, Food Systems, and Community Development ISSN: 2152-0801 online
www.AgDevJournal.com
50 Volume 1, Issue 2 / Fall 2010
greatest concentration of vacant property. Figures 3 and 4 show snapshots of two areas with relatively low (figure 3) and relatively high (figure 4) vacancy at a scale in which the individual parcels are distin-guishable. Figure 4 is representative of the areas of the city in which vacancy is extremely high and many of the vacant parcels are contiguous. In contrast, figure 3 demonstrates that very few vacant parcels are contiguous in the areas of the city in which vacancy is relatively low. These areas are characterized by small, interspersed lots, the majority of which are roughly one-tenth of an acre.
Acreage Needed to Meet Consumption Levels In order to determine the amount of land neces-sary to support as much of the fresh fruit and vegetable consumption as possible through Detroit-based production given seasonal limita-tions, we first converted the serving totals of each crop, at both current and recommended consump-tion levels, to pounds based on published figures for servings per pound adapted for adult popula-tions (U.S. Department of Agriculture Food and Nutrition Service, 2008).10 Next we multiplied this number by the percentage of the year available within each of the three seasonal production scenarios. We then factored in losses in the trans-mission of produce from the farmgate, the loss due to any inedible portion, the loss at the retailing stage, and the loss in cooking (Kantor, 1998; Peters et al., 2002). This enabled us to determine a total weight in pounds for each of the fresh fruits and vegetables commonly consumed by the approxi-mately 835,000 residents of Detroit.
We were then able to use these figures in conjunc-tion with published high and low productivity biointensive yields that reflect small-scale cultiva-
10 Servings per pound were based on a ¼ cup serving in the USDA report created for child nutrition programs but were adapted to the basis of ½ cup servings for the purposes of this research. Servings per pound figures for all fruits and vegetables discussed in this research were derived from this report except for garlic, for which the estimation of 5.5 servings per pound was estimated.
tion (Jeavons, 1995)11 to determine a range of acreage needed for each crop.12 For the sake of comparison, we also calculated requisite acreage according to compiled Michigan commercial crop yield figures (National Agricultural Statistics Service Michigan Field Office, 2006; Peters et al., 2002; Peters, Bills, Wilkins, & Smith, 2003; U.S. Department of Agriculture Economic Research Service, 2003; Zandstra & Price, 1988). While the scale and mechanization level of commercial agriculture would be less feasible within much of the urban Detroit setting, these more modest yields can nonetheless provide a cautious upper limit to the quantity of land necessary. For each of the yield levels and for both current and recommended consumption, we used the sum of the fruit and vegetable acreages to show approximately how much land would need to be put into production in order to meet a given percentage of local consump-tion with various scenarios of seasonality. Table 2 shows the range of acreages needed. The first two rows in each production scenario reflect high and low productivity under biointensive cultivation, while the third row reflects commercial agriculture yields. If a high level of biointensive agricultural productivity is assumed, putting only 263 acres into production could meet the maximum percentage of fruit and vegetable consumption seasonally pos-sible, given our assumption that people would not change their relative consumption of fresh, frozen, canned, or tropical fruits. That is, of the total quantity of fresh vegetables and fresh nontropical fruits consumed annually, 31% of the vegetables and 17% of the fruits could be produced without the use of storage or season extension. If low productivity is assumed, the acreage needed to meet the same level of consumption increases to nearly 900 acres, which is similar to acreage requirements for the recommended consumption
11 Jeavons discusses low productivity figures as reasonable for beginning farmers and gardeners and high productivity figures as achievable for experienced farmers and gardeners. 12 The two exceptions were escarole/endive, for which the yield data for head lettuce was used as a best estimate, and mushrooms, for which the commercial-production NASS figure of 71,874 lbs./acre was used for both low and high productivity (from www.nass.usda.gov).
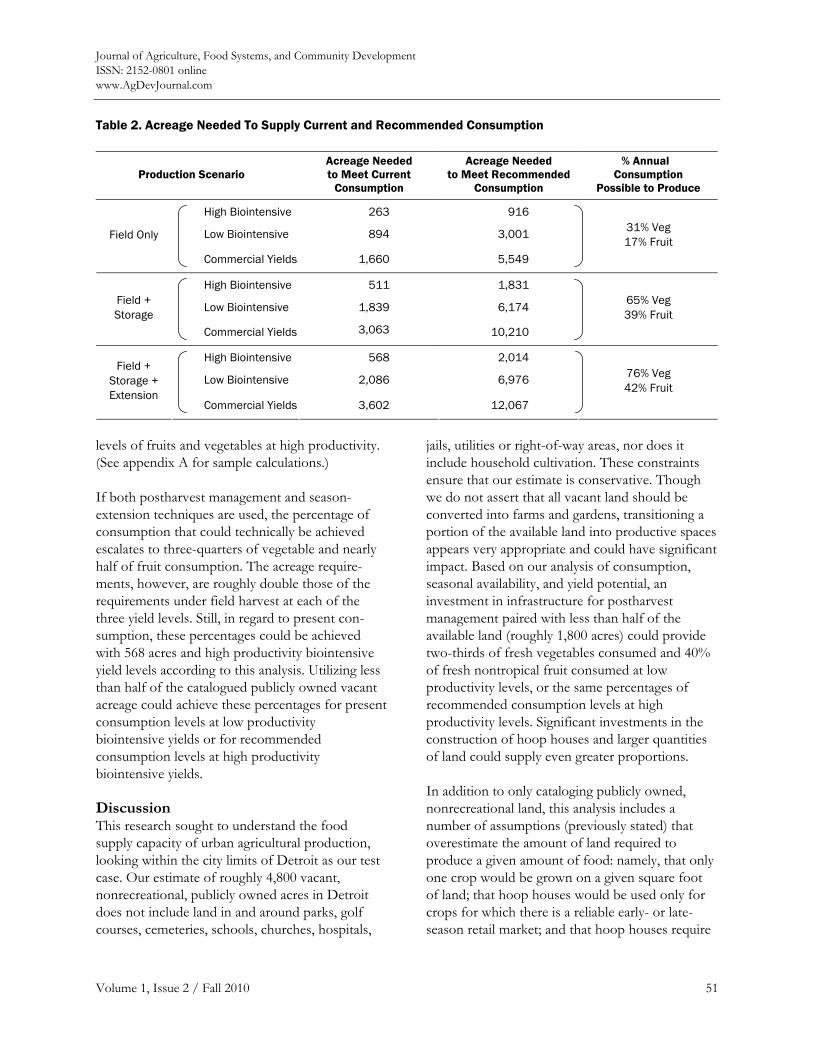
Journal of Agriculture, Food Systems, and Community Development ISSN: 2152-0801 online www.AgDevJournal.com
Volume 1, Issue 2 / Fall 2010 51
levels of fruits and vegetables at high productivity. (See appendix A for sample calculations.)
If both postharvest management and season-extension techniques are used, the percentage of consumption that could technically be achieved escalates to three-quarters of vegetable and nearly half of fruit consumption. The acreage require-ments, however, are roughly double those of the requirements under field harvest at each of the three yield levels. Still, in regard to present con-sumption, these percentages could be achieved with 568 acres and high productivity biointensive yield levels according to this analysis. Utilizing less than half of the catalogued publicly owned vacant acreage could achieve these percentages for present consumption levels at low productivity biointensive yields or for recommended consumption levels at high productivity biointensive yields.
Discussion This research sought to understand the food supply capacity of urban agricultural production, looking within the city limits of Detroit as our test case. Our estimate of roughly 4,800 vacant, nonrecreational, publicly owned acres in Detroit does not include land in and around parks, golf courses, cemeteries, schools, churches, hospitals,
jails, utilities or right-of-way areas, nor does it include household cultivation. These constraints ensure that our estimate is conservative. Though we do not assert that all vacant land should be converted into farms and gardens, transitioning a portion of the available land into productive spaces appears very appropriate and could have significant impact. Based on our analysis of consumption, seasonal availability, and yield potential, an investment in infrastructure for postharvest management paired with less than half of the available land (roughly 1,800 acres) could provide two-thirds of fresh vegetables consumed and 40% of fresh nontropical fruit consumed at low productivity levels, or the same percentages of recommended consumption levels at high productivity levels. Significant investments in the construction of hoop houses and larger quantities of land could supply even greater proportions.
In addition to only cataloging publicly owned, nonrecreational land, this analysis includes a number of assumptions (previously stated) that overestimate the amount of land required to produce a given amount of food: namely, that only one crop would be grown on a given square foot of land; that hoop houses would be used only for crops for which there is a reliable early- or late-season retail market; and that hoop houses require
Table 2. Acreage Needed To Supply Current and Recommended Consumption
Production Scenario Acreage Needed to Meet Current
Consumption
Acreage Needed to Meet Recommended
Consumption
% Annual Consumption
Possible to Produce
High Biointensive 263 916
Low Biointensive 894 3,001 Field Only
Commercial Yields 1,660 5,549
31% Veg 17% Fruit
High Biointensive 511 1,831
Low Biointensive 1,839 6,174 Field + Storage
Commercial Yields 3,063 10,210
65% Veg 39% Fruit
High Biointensive 568 2,014
Low Biointensive 2,086 6,976 Field +
Storage + Extension
Commercial Yields 3,602 12,067
76% Veg 42% Fruit
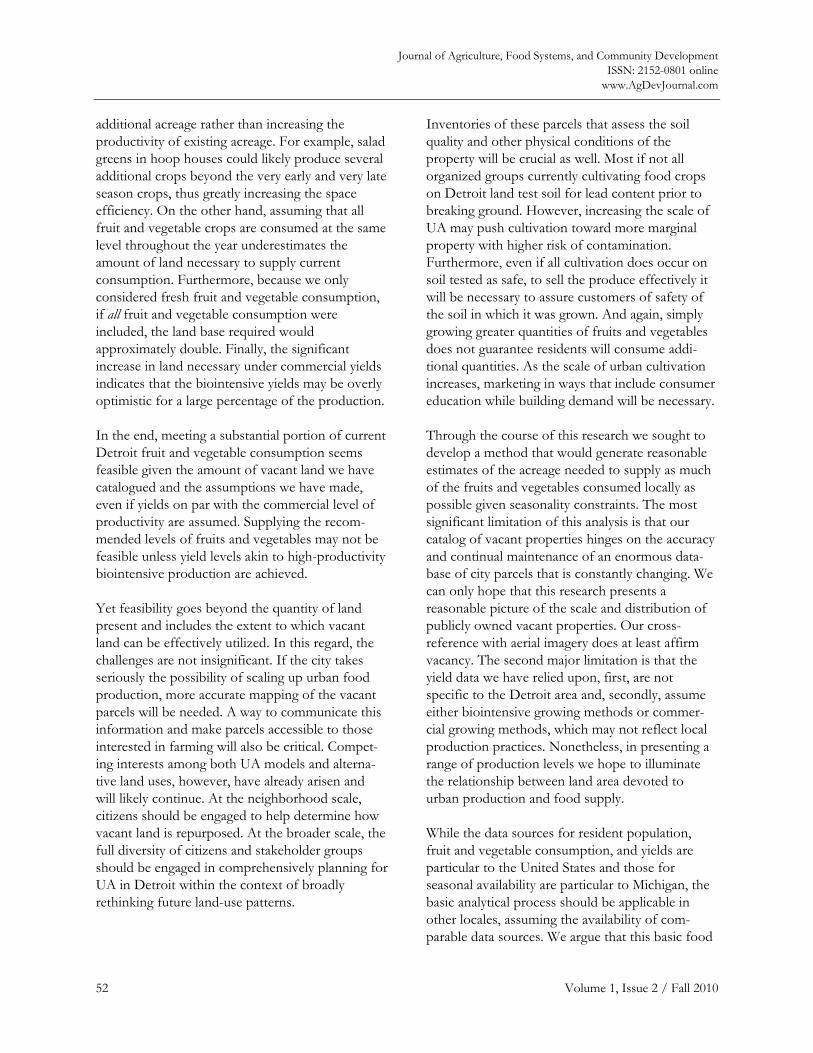
Journal of Agriculture, Food Systems, and Community Development ISSN: 2152-0801 online
www.AgDevJournal.com
52 Volume 1, Issue 2 / Fall 2010
additional acreage rather than increasing the productivity of existing acreage. For example, salad greens in hoop houses could likely produce several additional crops beyond the very early and very late season crops, thus greatly increasing the space efficiency. On the other hand, assuming that all fruit and vegetable crops are consumed at the same level throughout the year underestimates the amount of land necessary to supply current consumption. Furthermore, because we only considered fresh fruit and vegetable consumption, if all fruit and vegetable consumption were included, the land base required would approximately double. Finally, the significant increase in land necessary under commercial yields indicates that the biointensive yields may be overly optimistic for a large percentage of the production.
In the end, meeting a substantial portion of current Detroit fruit and vegetable consumption seems feasible given the amount of vacant land we have catalogued and the assumptions we have made, even if yields on par with the commercial level of productivity are assumed. Supplying the recom-mended levels of fruits and vegetables may not be feasible unless yield levels akin to high-productivity biointensive production are achieved.
Yet feasibility goes beyond the quantity of land present and includes the extent to which vacant land can be effectively utilized. In this regard, the challenges are not insignificant. If the city takes seriously the possibility of scaling up urban food production, more accurate mapping of the vacant parcels will be needed. A way to communicate this information and make parcels accessible to those interested in farming will also be critical. Compet-ing interests among both UA models and alterna-tive land uses, however, have already arisen and will likely continue. At the neighborhood scale, citizens should be engaged to help determine how vacant land is repurposed. At the broader scale, the full diversity of citizens and stakeholder groups should be engaged in comprehensively planning for UA in Detroit within the context of broadly rethinking future land-use patterns.
Inventories of these parcels that assess the soil quality and other physical conditions of the property will be crucial as well. Most if not all organized groups currently cultivating food crops on Detroit land test soil for lead content prior to breaking ground. However, increasing the scale of UA may push cultivation toward more marginal property with higher risk of contamination. Furthermore, even if all cultivation does occur on soil tested as safe, to sell the produce effectively it will be necessary to assure customers of safety of the soil in which it was grown. And again, simply growing greater quantities of fruits and vegetables does not guarantee residents will consume addi-tional quantities. As the scale of urban cultivation increases, marketing in ways that include consumer education while building demand will be necessary.
Through the course of this research we sought to develop a method that would generate reasonable estimates of the acreage needed to supply as much of the fruits and vegetables consumed locally as possible given seasonality constraints. The most significant limitation of this analysis is that our catalog of vacant properties hinges on the accuracy and continual maintenance of an enormous data-base of city parcels that is constantly changing. We can only hope that this research presents a reasonable picture of the scale and distribution of publicly owned vacant properties. Our cross-reference with aerial imagery does at least affirm vacancy. The second major limitation is that the yield data we have relied upon, first, are not specific to the Detroit area and, secondly, assume either biointensive growing methods or commer-cial growing methods, which may not reflect local production practices. Nonetheless, in presenting a range of production levels we hope to illuminate the relationship between land area devoted to urban production and food supply.
While the data sources for resident population, fruit and vegetable consumption, and yields are particular to the United States and those for seasonal availability are particular to Michigan, the basic analytical process should be applicable in other locales, assuming the availability of com-parable data sources. We argue that this basic food
Journal of Agriculture, Food Systems, and Community Development ISSN: 2152-0801 online www.AgDevJournal.com
Volume 1, Issue 2 / Fall 2010 53
supply analysis, regardless of the extent of vacant property, would be useful to any city attempting to systematically plan for urban agriculture in the context of resident food security or agrifood market opportunities. Inventorying the quantity of vacant land within a municipality requires an existing database or extensive mapping and surveying. In a general sense, given that Detroit falls near the 42nd parallel, we can presume that in many parts of America and the globe it would be feasible to supply locally even more substantial portions of the fruits and vegetables consumed.
Conclusion This research indicates that urban farms and gardens can contribute significantly to the supply of fresh fruits and vegetables in cities like Detroit with large amounts of vacant land. If residential yards and spaces around other buildings, as well as nontraditional cultivation sites like rooftops and balconies, were considered, this level of production may well be achievable in other urban areas as well. In any case, this research sets out a method that any locality could use to estimate how much of its fruits and vegetables could be grown within its boundary.
On a conceptual level there remains a need to criti-cally consider not only how scaling up UA could integrate into the urban landscape, but also how expanded scales of UA in a city core would affect suburban and rural development, potentially on prime farmland. Expanding urban food production will transform the design of everything from buildings to neighborhoods to cities themselves. On the leading edge of this new research frontier, Mullinix et al. (2008, p. 4) coined the term “agricultural urbanism” to describe “a compre-hensive social, environmental and economic integration of an agrifood system, in all of its dimensions and manifestations, within the plan-ning, governance and function of the city” and a handful of scholars have begun to explore the shape of such integration (see for example Barr et al., 2008; Gorgolewski, Komisar, & Nasr, 2009; Viljoen, 2005). In Detroit, given the low popula-tion density relative to other major cities and the
high concentration of vacancy in particular areas of the city, along with interviews and focus groups with Detroit residents that suggest many people are supportive of expanding food production in the city but not entirely comfortable abandoning the traditional cityscape (Colasanti, Litjens, & Hamm, 2010), it may be most feasible to move toward developing distinct agrifood districts as a way to expand urban agriculture to the farm scale.
The research presented here suggests many possible avenues for future inquiry in relation to increasing a municipal commitment to supporting urban food production. How will farm and garden spaces integrate into the cityscape? How can planners and local officials support UA and also maintain distinctly urban settings? What tools are available for the remediation of soils contaminated to varying degrees? If urban production is increased, how will the food be marketed and distributed? What would tenure on these land parcels looks like? How could scaling up also catalyze local resident ownership? How can urban agriculture further sustainable urbanization? As researchers continue to investigate the social and ecological services of urban agriculture, and as metropolises are increasingly faced with concerns of sustainability and food security, we predict that in many urban centers these questions will rise to the fore.
For practitioners, this research provides a context for gauging the significance of scaling and helps guide considerations of expanding urban agricul-ture as a means of food provisioning by clarifying the relationship between land base and fruit and vegetable supply related to average consumption. The increasing interest in urban agriculture and the possibility that a major portion of a city’s food supply could be produced within its own bound-aries points to the need for practitioners to con-sider the nature of an urban agricultural infrastruc-ture that could both enable such production to occur and facilitate the integration of cultivation with retailing and distribution activities.
Journal of Agriculture, Food Systems, and Community Development ISSN: 2152-0801 online
www.AgDevJournal.com
54 Volume 1, Issue 2 / Fall 2010
Acknowledgements The authors wish to thank David Conner for compiling the commercial yield data, the W. K. Kellogg Foundation and the Fair Food Foundation for supporting this work, and three anonymous reviewers for their insightful comments.
References Alaimo, K., & Miles, R. (2007). The Detroit garden
resource program collaborative research study report. Department of Food Science and Human Nutrition Michigan State University, East Lansing, MI. Contact: [email protected]
Alaimo, K., Packnett, E., Miles, R. A., & Kruger, D. J. (2008). Fruit and vegetable intake among urban community gardeners. Journal of Nutrition Education and Behavior, 40(2), 94–101. doi:10.1016/j.jneb.2006.12.003
Altman, A. (2009, April 6). Road to renewal. Time Magazine, 40–45.
Barr, J., Bolen, D., Boyd, K., Conroy, P., Dodwell, V., Dupuis, F. et al. (2008). Southlands: A vision for agricultural urbanism. Retrieved from http://www.box.net/shared/srol1caobn
Capital Growth. (2008). Mayor launches capital growth to boost locally grown food in London. Retrieved from http://www.capitalgrowth.org/press/ press_releases
Chiesura, A. (2004). The role of urban parks for the sustainable city. Landscape and Urban Planning, 68(1), 129–138. doi:10.1016/j.landurbplan.2003.08.003
City of Detroit. (2008). GIS maps homepage. Retrieved from http://www.detroitmi.gov/Departmentsand Agencies/InformationTechnologyServices/ GISMaps.aspx
City of Vancouver. (2006). 2,010 garden plots by 2010. Retrieved from http://vancouver.ca/ctyclerk/ cclerk/20060530/documents/motionb2.pdf
Colasanti, K., Litjens, C., & Hamm, M. (2010). Growing food in the city: The production potential of Detroit’s vacant land. C.S. Mott Group for Sustainable Food Systems at Michigan State University. Available at http://www.mottgroup. msu.edu/uploads/files/59/Growing%20Food %20in%20the%20City%20-%20Colasanti %20Litjens%20Hamm.pdf
Connelly, P., & Ross, C. (2007). Farming the concrete jungle. In These Times, 31(9), 20–24.
Conner, D. S., Knudson, W. A., Hamm, M. W., & Peterson, H. C. (2008). The food system as an economic driver: Strategies and applications for Michigan. Journal of Hunger and Environmental Nutrition, 3(4), 371–383. doi:10.1080/19320240802528849
Deelstra, T., & Girardet, H. (2000). Urban agriculture and sustainable cities. In N. D. Bakker, M.; Guendel, S.; Sabel-Koschella, U.; deZeeuw, H. (Ed.), Growing cities, growing food: Urban agriculture on the policy agenda (pp. 43–65). Feldafing, Germany: German Foundation for International Development.
Desjardins, E., MacRae, R., & Schumilas, T. (2010). Linking future population food requirements for health with local production in Waterloo region, Canada. Agriculture and Human Values, 27(2), 129–140. doi:10.1007/s10460-009-9204-y
Dewar, M. (2006). Selling tax-reverted land. Journal of the American Planning Association, 72(2), 167–180. doi:10.1080/01944360608976737
Ferris, J., Norman, C., & Sempik, J. (2001). People, land and sustainability: Community gardens and the social dimension of sustainable development. Social Policy & Administration, 35(5), 559–568. doi:10.1111/1467-9515.t01-1-00253
Fussman, C. (2008). Health indicators and risk estimates by community health assessment regions & local health departments; Michigan Behavioral Risk Factor Survey 2005–2007 combined. Retrieved from http://www.michigan.gov/documents/ mdch/2005-2007_MiBRFS_RegLHD_Tables_ 9_17_08_249915_7.pdf
Gallagher, J. (2008, December 15). Acres of barren blocks offer chance to reinvent Detroit. Detroit Free Press. Retrieved from http://www.cityfarmer.info/acres-of-barren-blocks-offer-chance-to-reinvent-detroit
Gallagher, M. (2007). Examining the impact of food deserts on public health in Detroit. Chicago, IL: Mari Gallagher Research & Consulting Group.
Garnett, T. (1999). City harvest: The feasibility of growing more food in London. London: Sustain.
Giombolini, K., Chambers, K., Schlegel, S., & Dunne, J. (in press). Testing the local reality: does the Willamette Valley growing region produce enough to meet the needs of the local population? A comparison of agriculture production and
Journal of Agriculture, Food Systems, and Community Development ISSN: 2152-0801 online www.AgDevJournal.com
Volume 1, Issue 2 / Fall 2010 55
recommended dietary requirements. Agriculture and Human Values. Advance online publication.
Gopakumar, G., & Hess, D. (2005). Case study of community gardens, Detroit, MI. Retrieved from http://www.davidjhess.org/DetroitCG.pdf
Gorgolewski, M., Komisar, J., & Nasr, J. (2009). Carrot city: Designing for urban agriculture (Exhibition). Toronto, Ontario: Exhibition at Design Exchange in partnership with Ryerson University.
Gray, K. (2007, December 24). Urban farmers take root: Foreclosed lots are being turned into vegetable plots. Detroit Free Press. Retrieved from http://www.freep.com
Hair, M. (2008, August 1). Cash for carrots: Detroit youngsters are earning money and learning to grow fruits and vegetables at the city’s community gardens. Detroit Free Press. Retrieved from http://www.freep.com
Holland, L. (2004). Diversity and connections in community gardens: A contribution to local sustainability. Local Environment, 9(3), 285–305. doi:10.1080/1354983042000219388
Howe, J., Bohn, K., & Viljoen, A. (2005). Food in Time: The history of English open urban space as a European example. In A. Viljoen (Ed.), Continuous Productive Urban Landscapes: Designing Urban Agriculture for Sustainable Cities (pp. 95–107). Amsterdam: Architectural Press.
Howe, J., & Wheeler, P. (1999). Urban food growing: The experience of two UK cities. Sustainable Development, 7(1), 13–24. doi:10.1002/(SICI) 1099-1719(199902)7:1%3C13::AIDSD100% 3E3.0.CO;2-B
Irvine, S., Johnson, L., & Peters, K. (1999). Community gardens and sustainable land use planning: A case-study of the Alex Wilson community garden. Local Environment, 4(1), 33–46. doi:10.1080/13549839908725579
Jeavons, J. (1995). How to grow more vegetables: Fruits, nuts, berries, grains and other crops (5th ed.). Berkeley, CA: Ten Speed Press.
Kantor, L. S. (1998). A dietary assessment of the U.S. food supply: Comparing per capita food consumption with food guide pyramid serving recommendations (No. 772 Agricultural Economic Report). Washington, DC: Food and Rural Economics Division, Economic Research Service, USDA.
Kuo, F. E., & Sullivan, W. C. (2001). Environment and crime in the inner city: Does vegetation reduce crime? Environment and Behavior, 33(3), 343–367.
Lachance, J. D. (2004). Supporting urban agriculture: A proposed supplement to the city of Detroit master plan of policies. Unpublished Master of Urban Planning Thesis, University of Michigan, Ann Arbor, MI.
Larson, N. I., Story, M. T., & Nelson, M. C. (2009). Neighborhood environments: Disparities in access to healthy foods in the U.S. American Journal of Preventive Medicine, 36(1), 74–81. doi:10.1016/j.amepre.2008.09.025
McGuire, V. C. (2007, September 2). Replacing neglect with peach trees. The New York Times. Retrieved from http://www.nytimes.com/2007/09/02/ realestate/02nati.html?scp=3&sq=philadelphia%20urban%20garden&st=cse
McKee, M., & Ortolani, A. (2008, December 8). GM’s bust turns Detroit into urban prairie of vacant-lot farms. Bloomberg News. Retrieved from http://www.bloomberg.com/apps/news?pid=20601109&sid=aMV8_J49diKs&refer=home
McMillan, T. (2008, May 7). Urban farmers’ crops go from vacant lot to market. The New York Times. Retrieved from http://www.nytimes.com/2008/ 05/07/dining/07urban.html?_r=1&scp=2&sq=urban%20farmers&st=cse
Mendes, W., Balmer, K., Kaethler, T. M., & Rhoads, A. (2008). Using land inventories to plan for urban agriculture experiences from Portland and Vancouver. Journal of the American Planning Association, 74(4), 435–449. doi:10.1080/01944360802354923
Michigan Geographic Data Library. (n.d.). Center for geographic information, Michigan Department of Information Technology. Retrieved from http://www.michigan.gov/cgi
Michigan State University Extension. (2004). Michigan availability guide. Retrieved from http://www. projectfresh.msu.edu/Portals/Projectfresh/MI_Availability_Guide.pdf
Morris, V., & Tapp, C. (2008). Urban agriculture design guidelines for the private realm. Vancouver, Canada: City of Vancouver Policy Report P2.
Mougeot, L. J. A. (1993). Overview—urban food self-reliance: Significance and prospects. International Development Research Centre Reports, 21(3).
Journal of Agriculture, Food Systems, and Community Development ISSN: 2152-0801 online
www.AgDevJournal.com
56 Volume 1, Issue 2 / Fall 2010
Mougeot, L. J. A. (Ed.). (2005). Agropolis: The social, political and environmental dimensions of urban agriculture. Ottawa, ON: International Development Research Centre.
Mullinix, K., Henderson, D., Holland, M., de la Salle, J., Porter, E., & Fleming, P. (2008, September 18). Agricultural urbanism and municipal supported agriculture: A new food system path for sustainable cities. Paper presented at the Surrey Regional Economic Summit, Surrey, British Columbia.
National Agricultural Statistics Service Michigan Field Office. (2006). Michigan agricultural statistics 2005–2006. Retrieved from http://www.nass.usda.gov/ Statistics_by_State/Michigan/Publications/Annual_Statistical_Bulletin/stats06/agstat06all.pdf
Peters, C. J., Bills, N., Wilkins, J., & Smith, R. D. (2002). Vegetable consumption, dietary guidelines and agricultural production in New York State — Implications for local food economies. Ithaca, NY: Cornell University.
Peters, C. J., Bills, N., Wilkins, J., & Smith, R. D. (2003). Fruit consumption, dietary guidelines, and agricultural production in New York State — Implications for local food economies. Ithaca, NY: Cornell University.
Pollan, M. (2008). In defense of food: An eater’s manifesto. New York, NY: Penguin Group.
Pothukuchi, K. (2003). The Detroit food system: A handbook for community planners. Detroit: Wayne State University.
Pothukuchi, K., & Wallace, R. (2009). Sustainable food systems: Perspectives on transportation policy. In S. Malekafzali (Ed.), Healthy, Equitable Transportation Policy: Recommendations and Research (pp. 113–129). Oakland, CA: PolicyLink; Prevention Institute; Convergence Partnership.
Pottharst, K. (1995). Urban dwellers and vacant lots: Partners in pride. Parks & Recreation, 30(9), 94.
President of the Philippines Executive Order No. 776. (2009). Rolling out the backyard food production programs in the urban areas. Retrieved from http://www.lawphil.net/executive/execord/eo2009/eo_776_2009.html
Rees, W. E. (1997). Why urban agriculture? Notes for the IDRC Development Forum on Cities Feeding People: A growth industry. Retrieved from http://www.cityfarmer.org/rees.html#rees
Riley, R. (2008, December 25). Detroit must tear down to build up. Detroit Free Press. Retrieved from http://www.freep.com
Roberts, W. (2008, November 26). Looking beyond the auto. NOW Toronto. Retrieved from http://www. nowtoronto.com/news/story.cfm?content=166191
Rosol, M. (2005). Community gardens — A potential for stagnating and shrinking cities? Examples from Berlin. Die Erde, 136(2), 165–178.
Schilling, J., & Logan, J. (2008). Greening the Rust Belt: A green infrastructure model for right sizing America’s shrinking cities. Journal of the American Planning Association, 74(4), 451–466. doi:10.1080/01944360802354956
Smit, J., & Nasr, J. (1992). Urban agriculture for sustainable cities: Using wastes and idle land and water bodies as resources. Environment and Urbanization, 4(2), 141–152. doi:10.1177/095624789200400214
Stohr, K. (2003). In the capital of the car, nature stakes a claim. The New York Times. Retrieved from http://query.nytimes.com/gst/fullpage.html?res=9405E6DA163DF937A35751C1A9659C8B63&sec=&spon=&pagewanted=1
Taylor, A. F., Wiley, A., Kuo, F. E., & Sullivan, W. C. (1998). Growing up in the inner city — Green spaces as places to grow. Environment and Behavior, 30(1), 3–27. doi:10.1177/0013916598301001
Treuhaft, S., Hamm, M. W., & Litjens, C. (2009, August). Healthy food for all: Building equitable and sustainable food systems in Detroit and Oakland. Oakland, CA, Ann Arbor, MI and East Lansing, MI: PolicyLink, Fair Food Network, and the C.S. Mott Network.
Tzoulas, K., Korpela, K., Venn, S., Yli-Pelkonen, V., Kazmierczak, A., Niemela, J. et al. (2007). Promoting ecosystem and human health in urban areas using green infrastructure: A literature review. Landscape and Urban Planning, 81(3), 167–178. doi:10.1016/j.landurbplan.2007.02.001
U.S. Census Bureau American Fact Finder. (2006). 2006 American Community Survey; Detroit city, Michigan; age and sex. Retrieved from http://factfinder.census.gov/servlet/ADPTable?_bm=y&-geo_id=16000US2622000&-qr_name=ACS_2008_3YR_G00_DP3YR5&-ds_name=ACS_2008_3YR_G00_&-_lang=en&-_sse=on
Journal of Agriculture, Food Systems, and Community Development ISSN: 2152-0801 online www.AgDevJournal.com
Volume 1, Issue 2 / Fall 2010 57
U.S. Department of Agriculture Center for Nutrition Policy and Promotion. (2005). My pyramid food intake patterns. Retrieved from http://www. mypyramid.gov/downloads/MyPyramid_Food_Intake_Patterns.pdf
U.S. Department of Agriculture Economic Research Service. (2003). Fruit and tree nut yearbook data archive. Retrieved from http://usda.mannlib. cornell.edu/MannUsda/viewStaticPage.do?url=http://usda.mannlib.cornell.edu/usda/ers/./89022/2004/index.html
U.S. Department of Agriculture Economic Research Service. (2008). Loss-adjusted food availability. Retrieved from http://www.ers.usda.gov/Data/ FoodConsumption/FoodGuideIndex.htm
U.S. Department of Agriculture Food and Nutrition Service. (2008). Food buying guide for child nutrition programs. Retrieved from http://www.fns.usda.gov/TN/Resources/foodbuyingguide.html
U.S. Department of Health and Human Services and U.S. Department of Agriculture. (January 2005). Dietary guidelines for Americans, 2005. Washington, DC: U.S. Government Printing Office.
Viljoen, A. (Ed.). (2005). Continuous productive urban landscapes: Designing urban agriculture for sustainable cities. Amsterdam: Architectural Press.
Wells, M. (2008, July 10). Urban farming takes root in Detroit. BBC News. Retrieved from http://news.bbc.co.uk/go/pr/fr/-/1/hi/world/americas/7495717.stm
Zandstra, B., & Price, H. (1988). Yields of Michigan vegetable crops. East Lansing, MI: Michigan State University.
Zenk, S. N., Schulz, A. J., Hollis-Neely, T., Campbell, R. T., Holmes, N., Watkins, G. et al. (2005). Fruit and vegetable intake in African Americans — Income and store characteristics. American Journal of Preventive Medicine, 29(1), 1–9. doi:10.1016/j.amepre.2005.03.002
Zenk, S. N., Schulz, A. J., Israel, B. A., James, S. A., Bao, S. M., & Wilson, M. L. (2005). Neighborhood racial composition, neighborhood poverty, and the spatial accessibility of supermarkets in metropolitan Detroit. American Journal of Public Health, 95(4), 660–667. doi:10.2105/AJPH.2004.042150
Zenk, S. N., Schulz, A. J., Israel, B. A., James, S. A., Bao, S. M., & Wilson, M. L. (2006). Fruit and vegetable access differs by community racial composition and socioeconomic position in Detroit, Michigan. Ethnicity & Disease, 16(1), 275–280.
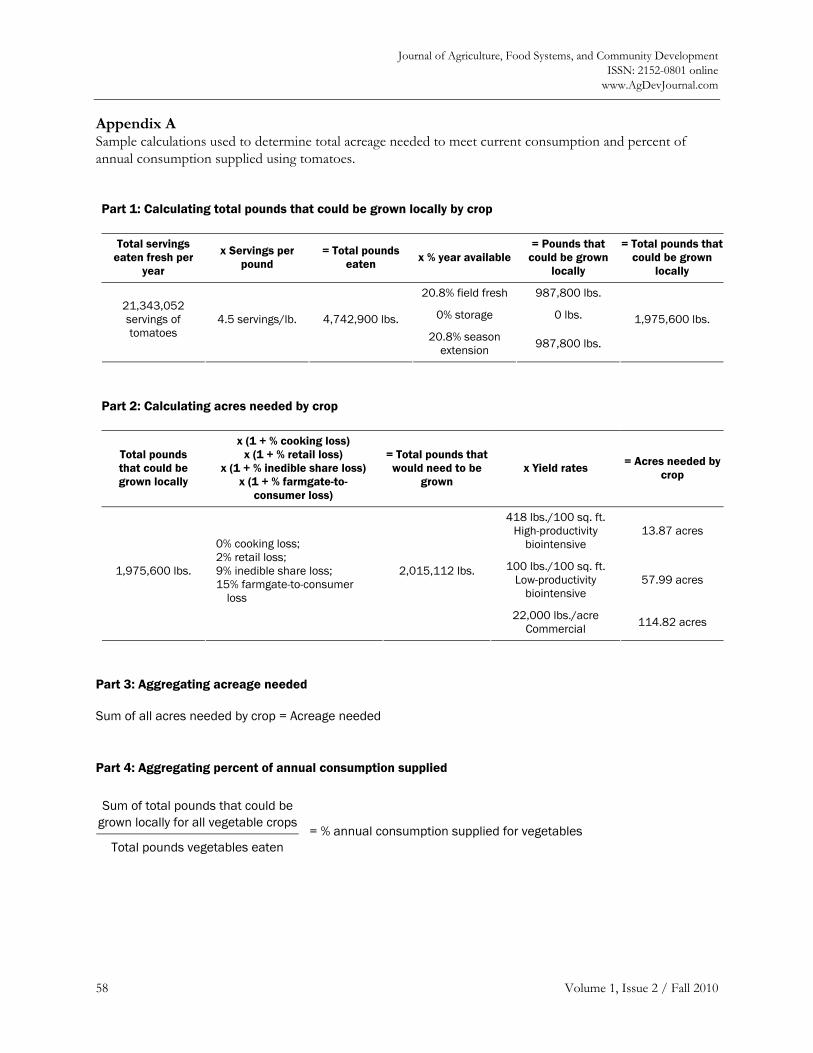
Journal of Agriculture, Food Systems, and Community Development ISSN: 2152-0801 online
www.AgDevJournal.com
58 Volume 1, Issue 2 / Fall 2010
Appendix A Sample calculations used to determine total acreage needed to meet current consumption and percent of annual consumption supplied using tomatoes.
Part 1: Calculating total pounds that could be grown locally by crop
Total servings eaten fresh per
year
x Servings per pound
= Total pounds eaten
x % year available= Pounds that
could be grown locally
= Total pounds that could be grown
locally
20.8% field fresh 987,800 lbs.
0% storage 0 lbs. 21,343,052 servings of tomatoes
4.5 servings/lb. 4,742,900 lbs. 20.8% season
extension 987,800 lbs.
1,975,600 lbs.
Part 2: Calculating acres needed by crop
Total pounds that could be grown locally
x (1 + % cooking loss) x (1 + % retail loss)
x (1 + % inedible share loss) x (1 + % farmgate-to-
consumer loss)
= Total pounds that would need to be
grown x Yield rates
= Acres needed by crop
418 lbs./100 sq. ft. High-productivity
biointensive 13.87 acres
100 lbs./100 sq. ft. Low-productivity
biointensive 57.99 acres
1,975,600 lbs.
0% cooking loss; 2% retail loss; 9% inedible share loss; 15% farmgate-to-consumer
loss
2,015,112 lbs.
22,000 lbs./acre Commercial 114.82 acres
Part 3: Aggregating acreage needed Sum of all acres needed by crop = Acreage needed Part 4: Aggregating percent of annual consumption supplied Sum of total pounds that could be
grown locally for all vegetable crops
Total pounds vegetables eaten = % annual consumption supplied for vegetables
Journal of Agriculture, Food Systems, and Community Development ISSN: 2152-0801 online www.AgDevJournal.com
Volume 1, Issue 2 / Fall 2010 59
The future of farming on the urban edge: Insights from fifteen U.S. counties about farmland protection and farm viability Lydia Oberholtzera The Pennsylvania State University
Kate Clancyb Food Systems Consultant
J. Dixon Esseksc Center for Great Plains Studies
Submitted 3 June 2010 / Accepted 13 September 2010 / Published online 18 November 2010 Citation: Oberholter, L., Clancy, K. and Esseks, J. D. (2010, November). The future of farming on the urban edge: Insights from fifteen U.S. counties about farmland protection and farm viability. Journal of Agriculture, Food Systems, and Community Development, 1(2): 59–75. doi:10.5304/jafscd.2010.012.003 Copyright © 2010 New Leaf Associates, Inc.
Abstract Farmland protection and farm viability are two important aspects of urban-edge farming. Surveys of landowners and informant interviews were com-pleted between 2005 and 2007 in 15 U.S. counties to examine the opportunities and constraints that farmers face in these areas. Landowners’ percep-tions about the future outlook for their county’s agriculture varied greatly. Many operators in counties producing long-established crops, such as corn and soybeans, rely heavily on wholesale markets for sales. In other counties, farmers depend on a mix of wholesale and direct markets.
a Corresponding author: Senior Researcher, The Pennsylvania State University, [email protected]; +1 (301) 891-0470. Perma-nent address: 214 Spring Avenue, Takoma Park, MD 20912 USA.
b Food Systems Consultant, 4401 Van Buren Street, University Park, MD 20782 USA.
c Visiting Scholar, Center for Great Plains Studies, University of Nebraska at Lincoln, P.O. Box 880214, Lincoln, NE 68588-0214 USA.
Study results show that over half the respondents relying on direct markets operate small acreage farms with low gross agricultural sales. Operators using primarily wholesale markets tended to be more optimistic about the profitability and acces-sibility of their markets and the outlook for agricul-ture in their county than those depending on direct markets. In additional results from the survey, almost a third felt that equal emphasis should be placed on farmland preservation and farm viability efforts in order to keep farming viable in their county, while approximately the same number felt the priority should be protecting agricultural land from development via growth management policies. The unique characteristics of agriculturally important counties undergoing urbanization pressures pose challenges and opportunities to researchers and developers to recognize and employ the strategies that will help maintain a viable agricultural sector for urban-edge farming.
Keywords: agricultural marketing, farm viability, farmland protection, landowner survey, succession
Journal of Agriculture, Food Systems, and Community Development ISSN: 2152-0801 online
www.AgDevJournal.com
60 Volume 1, Issue 2 / Fall 2010
Introduction and Background For over 60 years, researchers have been con-cerned about the loss of farmland in the United States (Bogue, 1956). Thirty years ago, it was pointed out that farmland protection on the urban edge needs to emphasize farm profitability (Blobaum, 1982). Five years later, Johnston and Bryant (1987) noted that the many remaining farms in urbanizing areas have been able to adapt to prevailing conditions, demonstrating that they can remain viable despite strong development pressure. In the past decade, more attention has been paid to the need to simultaneously improve the markets and incomes of farms on the urban edge because, among other reasons, so much food is produced there. But the changing environment faced by farmers is complicating and intensifying these endeavors (Clark, Inwood, Sharp, & Jackson-Smith, 2007).
Population growth and mobility have led to intense demand for low-density “countryside” living and huge increases in household formation (Heimlich & Anderson, 2001). The newest National Resources Inventory report shows that over the last 20 years (1987 to 2007), approximately 34 million acres of land were newly developed, representing a 45 percent increase in developed land (USDA, NRCS, 2009). Over this time, crop-land acres decreased a total of 12 percent and pastureland decreased 6 percent. While the threat to the agricultural sector as a whole may be limited because converted farmland represents a small portion of all farmland, specific segments of agriculture (Heimlich & Anderson, 2001), especi-ally farmland closest to metro areas, may be greatly affected by farmland conversion. For instance, over a decade ago (in 1997), 86 percent of all the country’s fruits, nuts, and vegetable production and 63 percent of dairy products were produced in “the most urban-influenced counties” (American Farmland Trust, 2003). Data from 2002 revealed that 55 percent of all U.S. farm sales were from farms located at the rural-urban interface (Jackson-Smith & Sharp, 2008).
Federal, state, and local laws have been enacted in response to the growing public interest in the loss
of farmland. Among other issues, access to open and scenic landscapes, retention of the farming culture of the community, preservation of local and regional food production, environmental effects of development (e.g., loss of wildlife habitat, water-shed protection), and the costs of development to communities, such as increased costs of public services (e.g., roads, sewer, and water services) that cannot be fully covered by residential use taxes, are often raised in the debate over farmland loss (AFT, 2007, Heimlich & Anderson, 2001; Hellerstein et al. 2002; USDA, ERS, 2005).
Some of the key federal, state, and local agricultural protection programs include agricultural protection zoning (APZ), agricultural use-value tax assess-ments, and the purchase or transfer of develop-ment rights (PDR or TDR programs). Many jurisdictions have developed farmland retention programs employing a mix of regulations, incen-tives, and purchase easements to secure or encourage protection of working lands for the many services they provide (AFT, 1997; Daniels & Bowers, 1997; Libby, 2002). All 50 states have at least one farmland protection program.
Daniels (1999) has argued that “Farmland Protec-tion makes sense only if agriculture is a profitable business” (p. 228). However, farmers in urbanizing areas must compete with non-farmers for the services of land and water, while maintaining an income flow sufficient to pay the higher labor and other costs associated with operating in an urbanizing environment. In some cases, farmers may adjust by shifting to more capital-intensive commodities and by adding enterprises that take advantage of proximity to nonfarm populations (Heimlich & Anderson, 2001; Johnston & Bryant, 1987).
Researchers and advocates have compiled a long list of the potential benefits for small and midsized farmers near metropolitan areas. There are oppor-tunities for marketing vegetables, fruits, and other products through high-value urban markets, such as restaurants and farmers’ markets, and through high-volume purchasers like schools and hospitals. There are also high-value nonfood products
Journal of Agriculture, Food Systems, and Community Development ISSN: 2152-0801 online www.AgDevJournal.com
Volume 1, Issue 2 / Fall 2010 61
purchased by urban and peri-urban consumers, such as nursery plants and Christmas trees, as well as opportunities for agritourism. Farmers may be able to access a larger pool of seasonal labor as well as benefit from greater off-farm employment opportunities themselves. Among other benefits, there is a greater diversity of financing mechanisms (including for leasing land) and a larger variety of production intensities, especially with regard to fruits and vegetables, in urban-edge areas (Bryant & Johnston, 1992). Many of the solutions suggested for continued farm viability on the urban edge have focused on direct and niche marketing. By its very nature, however, increasing direct and high-value markets for many farms on the urban edge is only one piece to the puzzle given that these products are often produced on relatively smaller acreage farms (Gale, 1997) than traditional field crops (e.g., corn and soybeans, or orchards).
Census of Agriculture statistics also reveal that those farms in the “middle” or those that “operate in the space between the vertically integrated commodity markets and the direct markets” (Kirschenmann, Stevenson, Buttel, Lyson, & Duffy, 2008) are likely at more risk than other farms. These “midsized farms are the most vul-nerable in today’s polarized markets, since they are too small to compete in the highly consolidated commodity markets and too large and commodi-tized to sell in the direct markets” (Kirschenmann et al., 2008). Between 1997 and 2007, this “dis-appearing middle” has meant that farms with gross sales of $100,000 to $499,999 decreased 15 percent and those with gross sales of $50,000 to $99,999 decreased 24 percent. The only increases occurred in farms with less than $2,500 in gross sales (increasing 30 percent) or more than $500,000 (increasing 65 percent) (USDA, NASS, 2009). Examining agriculture’s midsized sector from a farm size perspective also reveals a decrease: the number of farms between 50 and 1,999 acres in size decreased over the same period (1997 to 2007), while those with smaller and larger acreage increased in number (USDA, NASS, 2009).
To study the nexus of farmland preservation and farm viability, a multidisciplinary team of
researchers funded by USDA’s National Research Initiative set out to identify the conditions facing farms in agriculturally important areas in the United States that are also subject to development pressures, focusing on 15 counties in 14 states in the U.S. This paper describes some of the findings of the project. The overall study aimed to determine:
• the types of agricultural products being successfully raised in the study’s counties;
• the adequacy of marketing outlets for crops and livestock products;
• the supply and affordability of land for farming and ranching;
• the adequacy of other major production inputs (e.g., field labor, new farmers, credit); and
• the future outlook for agriculture in those counties based on the perceptions and plans of landowners and agricultural leaders.
This article focuses primarily on the marketing pieces of the research, incorporating other aspects to inform the discussion. Relying on both primary data and the Census of Agriculture, we first examine each of the county’s agricultural marketing indicators and then address the future outlook for agriculture in these counties. Most of the project’s research took place between 2005 and 2007, when development pressures were high or just beginning to decline.
Research Methods Fifteen U.S. counties with urban-edge farming conditions were chosen for the study (see table 1): three from the Pacific Coast region, four from the Mid-Atlantic/Northeast region, five from the Corn Belt region, and three from other parts of the country. The latter group included highly scenic areas with important agricultural sectors threatened by a special set of development pressures, such as first- and second-home buyers, as well as tourism entrepreneurs attracted to the scenic landscapes and related recreational opportunities. Regional
Journal of Agriculture, Food Systems, and Community Development ISSN: 2152-0801 online
www.AgDevJournal.com
62 Volume 1, Issue 2 / Fall 2010
references in this article, however, are for illustra-tive purposes only, and do not imply that counties were chosen by region. Instead, the geographic unit of reference for the study was the county level. This unit was chosen because in agriculturally important areas, the county is often the framework for many actors relevant to the continued viability of agriculture. In addition, the countywide land-scape tends to be large enough to be the loci of policies and programs critical to the survival of agriculture.
To develop the sample, over 180 counties across the U.S. were identified that met the following criteria: (1) the county had a significant agricultural sector (defined as reporting at least $50 million in gross farm sales in the 1987 Census of Agriculture); (2) having an increase in population between 1990 and 2000 of at least 5 percent occurring from a substantial base of urbanization or urban influence, defined as at least 33 percent of the county’s total land surface being subject to medium or high “urban influence” (data provided by USDA, ERS; represented in Heimlich & Anderson, 2001, p. 47), and (3) each county’s land in agricultural use in the 1987 Census of Agriculture covered the equivalent of at least one full “township,” a geographic unit used by the Public Lands Survey for most of the country, consisting of 36 square miles of land or 23,040 acres.
Out of this sample, researchers chose the set of 15 counties. These counties were chosen with the intent of studying a diversity of geographic features, major agricultural products raised, and land-use tools utilized to protect farmland and farming. Of the four key growth management policies designed in part to protect farmland from conversion to nonagricultural uses, including restrictive zoning, purchase of development rights (PDR) or transfer of development rights (TDR), agricultural use-value assessment for property tax purposes, and right-to-farm ordinances, nine out of 15 counties had all of these policies in place, with 10 having PDR programs and four having TDR
programs.1 (See Esseks, Oberholtzer, Clancy, Lapping, & Zurbrugg, 2009, for a detailed look at each of the programs in each county.) The selected counties also varied in the size of their metro areas and the extent of urban influence within their boundaries (see table 1, following page). In the end, these counties were chosen not for compara-tive purposes per se, but to help examine and elucidate the set of issues that face historically agricultural counties that are undergoing urbaniza-tion pressures.
Along with the Census of Agriculture, two primary sources of data were used: a survey of landowners and a series of interviews with experts and stake-holders in each of the 15 counties. A number of county-specific case studies were developed from the data, as well as an overall project report (see http://www.unl.edu/plains/about/research_report 1 Restrictive zoning or agricultural protection zoning (APZ) refers to county and municipal zoning ordinances that support and protect farming by stabilizing the agricultural land base. APZ designates areas where farming is the desired land use, generally on the basis of soil quality as well as a variety of locational factors. Other land uses are discouraged. The density of residential development is limited by APZ. Maximum densities range from one dwelling per 20 acres in the eastern United States to one residence per 640 acres in the West. Purchase of development rights (PDR) programs compensate property owners for restricting the future use of their land. Transfer of development rights (TDR) programs enable the transfer of development potential from one parcel of land to another, and are often used to shift development from agricultural land to designated growth zones located closer to municipal services. Agricultural use-value assessments include differential assessment programs that allow officials to assess farmland at its agricultural-use value, rather than its fair market value, which is generally higher. Right-to-farm laws are designed to accomplish one or both of the following objectives: (1) to strengthen the legal position of farmers when neighbors sue them for private nuisance; and (2) to protect farmers from antinuisance ordinances and unreasonable controls on farming operations. A growing number of counties and municipalities are passing their own right-to-farm legislation to supplement the protection provided by state law. (All definitions for these terms, and more information about these tools, can be found at American Farmland Trust’s Farmland Information Center, http://www.farmlandinfo.org).
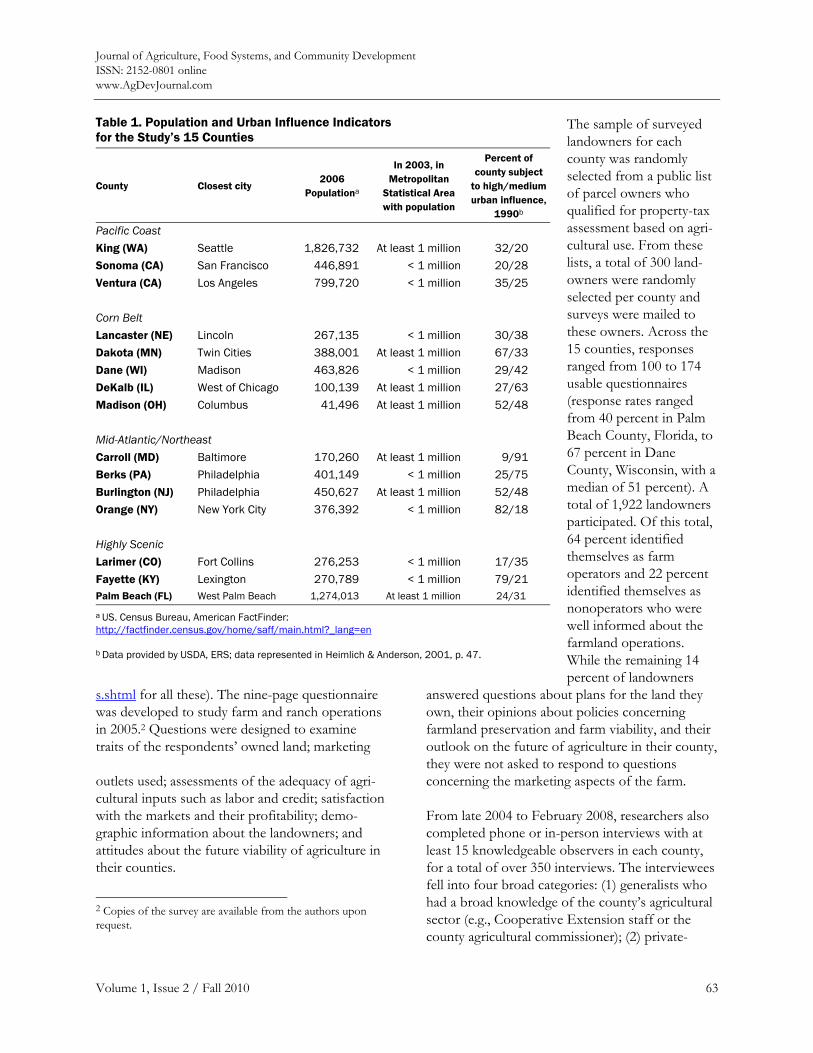
Journal of Agriculture, Food Systems, and Community Development ISSN: 2152-0801 online www.AgDevJournal.com
Volume 1, Issue 2 / Fall 2010 63
s.shtml for all these). The nine-page questionnaire was developed to study farm and ranch operations in 2005.2 Questions were designed to examine traits of the respondents’ owned land; marketing
outlets used; assessments of the adequacy of agri-cultural inputs such as labor and credit; satisfaction with the markets and their profitability; demo-graphic information about the landowners; and attitudes about the future viability of agriculture in their counties.
2 Copies of the survey are available from the authors upon request.
The sample of surveyed landowners for each county was randomly selected from a public list of parcel owners who qualified for property-tax assessment based on agri-cultural use. From these lists, a total of 300 land-owners were randomly selected per county and surveys were mailed to these owners. Across the 15 counties, responses ranged from 100 to 174 usable questionnaires (response rates ranged from 40 percent in Palm Beach County, Florida, to 67 percent in Dane County, Wisconsin, with a median of 51 percent). A total of 1,922 landowners participated. Of this total, 64 percent identified themselves as farm operators and 22 percent identified themselves as nonoperators who were well informed about the farmland operations. While the remaining 14 percent of landowners
answered questions about plans for the land they own, their opinions about policies concerning farmland preservation and farm viability, and their outlook on the future of agriculture in their county, they were not asked to respond to questions concerning the marketing aspects of the farm.
From late 2004 to February 2008, researchers also completed phone or in-person interviews with at least 15 knowledgeable observers in each county, for a total of over 350 interviews. The interviewees fell into four broad categories: (1) generalists who had a broad knowledge of the county’s agricultural sector (e.g., Cooperative Extension staff or the county agricultural commissioner); (2) private-
Table 1. Population and Urban Influence Indicators for the Study’s 15 Counties
County Closest city 2006
Populationa
In 2003, in Metropolitan
Statistical Area with population
Percent of county subject
to high/medium urban influence,
1990b
Pacific Coast King (WA) Seattle 1,826,732 At least 1 million 32/20 Sonoma (CA) San Francisco 446,891 < 1 million 20/28 Ventura (CA) Los Angeles 799,720 < 1 million 35/25 Corn Belt Lancaster (NE) Lincoln 267,135 < 1 million 30/38 Dakota (MN) Twin Cities 388,001 At least 1 million 67/33 Dane (WI) Madison 463,826 < 1 million 29/42 DeKalb (IL) West of Chicago 100,139 At least 1 million 27/63 Madison (OH) Columbus 41,496 At least 1 million 52/48 Mid-Atlantic/Northeast Carroll (MD) Baltimore 170,260 At least 1 million 9/91 Berks (PA) Philadelphia 401,149 < 1 million 25/75 Burlington (NJ) Philadelphia 450,627 At least 1 million 52/48 Orange (NY) New York City 376,392 < 1 million 82/18 Highly Scenic Larimer (CO) Fort Collins 276,253 < 1 million 17/35 Fayette (KY) Lexington 270,789 < 1 million 79/21 Palm Beach (FL) West Palm Beach 1,274,013 At least 1 million 24/31
a US. Census Bureau, American FactFinder: http://factfinder.census.gov/home/saff/main.html?_lang=en
b Data provided by USDA, ERS; data represented in Heimlich & Anderson, 2001, p. 47.
Journal of Agriculture, Food Systems, and Community Development ISSN: 2152-0801 online
www.AgDevJournal.com
64 Volume 1, Issue 2 / Fall 2010
sector professionals with more specialized exper-tise, such as bankers who handled agricultural loans or mangers of farm equipment dealerships; (3) staff members of public and not-for-profit agencies who led programs designed to assist farmers and ranchers; and (4) farmers or ranchers producing products about which the survey and Census of Agriculture did not provide sufficient information.
Results: Agricultural Marketing and the Outlook for Agriculture in 15 U.S. Counties Although all of the counties chosen for the study have been undergoing development pressures, the 2007 Census of Agriculture reveals diverse variations in market and farm level characteristics (see appendix A). In 10 counties, comparisons with the 2002 Census show rising farm numbers and decreasing average farm size. In other words, they recorded more but smaller farms, such as those in the 1 to 9, 10 to 49, and 50 to 69 acre categories. Just over half the counties lost farmland between 2002 and 2007, while seven of the counties (King, Dakota, Dane, DeKalb, Madison, Berks, and Fayette) gained farmland. Almost all the counties that added farmland by 2007 had lost land between the previous two censuses of agriculture (1997 to 2002)3 (Esseks et al., 2009).4
3 The 1997 and 2002 Census of Agriculture were used for the project study, as the 2007 Census of Agriculture was not reported until 2009. 4 For five of these seven counties, the percentage increases between 2002 and 2007 were modest, from 1 to 4 percent. However, King and Fayette experienced increases of 18 and 14 percent respectively. Some explanations for these increases seem reasonable. For three Corn Belt counties (Dakota, DeKalb, Madison), a majority of the growth was in harvested cropland, especially acres in corn for grain (increasing between 20 to 33 percent), most likely due to better market prices for corn in 2007 than 2002. This may also be true of Dane County. However, both Dane and Berks counties recorded higher acres in the land-use category “woodland not pastured,” but there is no evidence of significantly increased commercial activity on such land (such as cut Christmas trees, short-rotation woody crops, or maple syrup). It may be that this growth was mostly for scenic, environmental, or long-term timber harvesting. In King and Fayette counties, the recorded increase in
Results: Agricultural Marketing Indicators in the 15 Counties Across our sample of counties, in 2007 grains and oilseeds topped agricultural sales in four counties (Lancaster, Dakota, DeKalb, and Madison) (table 2). Nursery/greenhouse sales topped the list in Berks, Burlington, and Orange (tied with vegetables). In four counties (Dane, Carroll, Larimer, and King), dairy was the most important in terms of sales, fruits were in Sonoma and Ventura counties, horses in Fayette County, and vegetables in Palm Beach County. Also of note is that Carroll and Dane counties have large percentages of land in forage production for dairy and beef cattle, and soybeans and forage are in the top three crop items by acreage in a number of counties. Finally, nursery and greenhouse crops were among the top four moneymakers in 13 of 15 counties; much of the demand in this category is likely from nearby residential and other construction and the need for trees, shrubs, sod, and other similar products.
Across the 15 counties, the survey data suggest that respondents in eight of the counties relied on a mix of both direct and wholesale marketing (table 3), that is, in these counties, farmers had average sales of at least 20 percent in direct-to-consumer markets, with the exceptions being the five Corn Belt counties and Ventura and Palm Beach counties. However, in most counties, wholesale markets accounted for the majority of sales, with an average of 62 percent of total sales through wholesale markets, with direct marketing accounting for an average 27 percent across all counties (table 2). For six counties—five from the Corn Belt region and Ventura County—an average of more than three-quarters of all sales were in wholesale markets. Respondents in the top four counties in terms of percentage of sales through farmland was primarily in pasture land. Inventories of both horses and “other cattle” rose in these two counties. Whether these two categories can account for the greater total land in pasture is not clear. It could be that it also includes low-density pasturing by landowners who were more interested in scenic and other lifestyle benefits than in commercial farming.
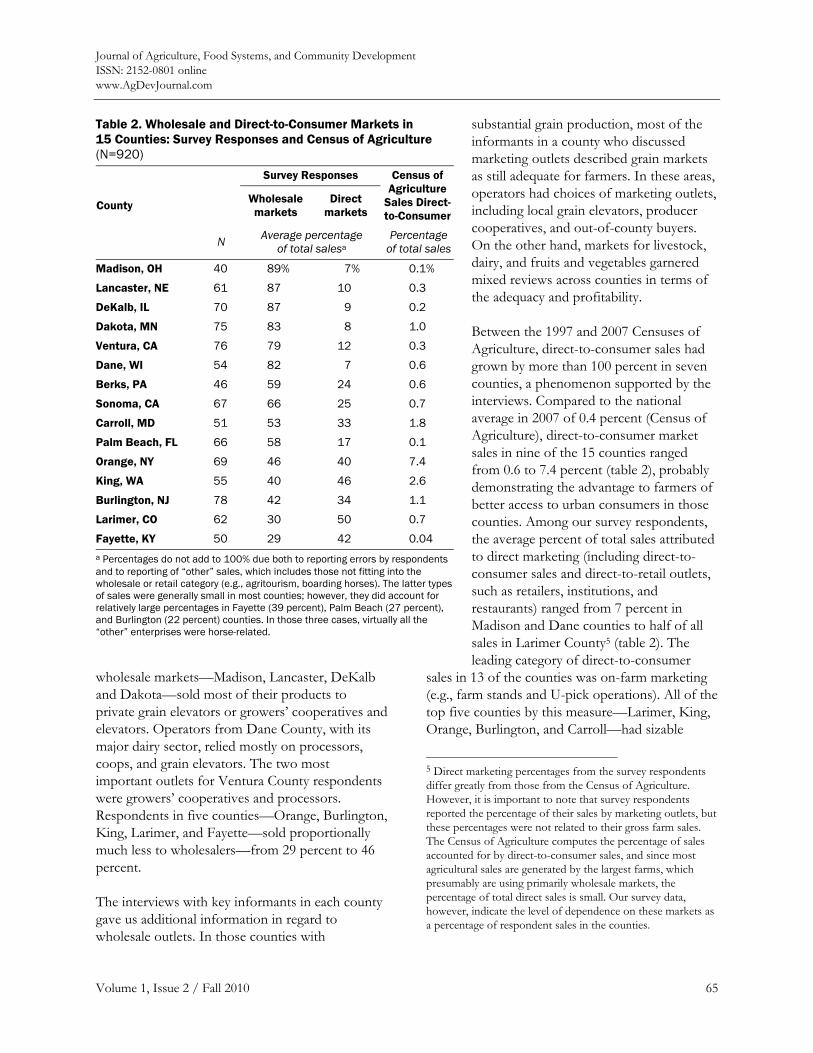
Journal of Agriculture, Food Systems, and Community Development ISSN: 2152-0801 online www.AgDevJournal.com
Volume 1, Issue 2 / Fall 2010 65
wholesale markets—Madison, Lancaster, DeKalb and Dakota—sold most of their products to private grain elevators or growers’ cooperatives and elevators. Operators from Dane County, with its major dairy sector, relied mostly on processors, coops, and grain elevators. The two most important outlets for Ventura County respondents were growers’ cooperatives and processors. Respondents in five counties—Orange, Burlington, King, Larimer, and Fayette—sold proportionally much less to wholesalers—from 29 percent to 46 percent.
The interviews with key informants in each county gave us additional information in regard to wholesale outlets. In those counties with
substantial grain production, most of the informants in a county who discussed marketing outlets described grain markets as still adequate for farmers. In these areas, operators had choices of marketing outlets, including local grain elevators, producer cooperatives, and out-of-county buyers. On the other hand, markets for livestock, dairy, and fruits and vegetables garnered mixed reviews across counties in terms of the adequacy and profitability.
Between the 1997 and 2007 Censuses of Agriculture, direct-to-consumer sales had grown by more than 100 percent in seven counties, a phenomenon supported by the interviews. Compared to the national average in 2007 of 0.4 percent (Census of Agriculture), direct-to-consumer market sales in nine of the 15 counties ranged from 0.6 to 7.4 percent (table 2), probably demonstrating the advantage to farmers of better access to urban consumers in those counties. Among our survey respondents, the average percent of total sales attributed to direct marketing (including direct-to-consumer sales and direct-to-retail outlets, such as retailers, institutions, and restaurants) ranged from 7 percent in Madison and Dane counties to half of all sales in Larimer County5 (table 2). The leading category of direct-to-consumer
sales in 13 of the counties was on-farm marketing (e.g., farm stands and U-pick operations). All of the top five counties by this measure—Larimer, King, Orange, Burlington, and Carroll—had sizable
5 Direct marketing percentages from the survey respondents differ greatly from those from the Census of Agriculture. However, it is important to note that survey respondents reported the percentage of their sales by marketing outlets, but these percentages were not related to their gross farm sales. The Census of Agriculture computes the percentage of sales accounted for by direct-to-consumer sales, and since most agricultural sales are generated by the largest farms, which presumably are using primarily wholesale markets, the percentage of total direct sales is small. Our survey data, however, indicate the level of dependence on these markets as a percentage of respondent sales in the counties.
Table 2. Wholesale and Direct-to-Consumer Markets in 15 Counties: Survey Responses and Census of Agriculture (N=920) Survey Responses
County Wholesale markets
Direct markets
Census of Agriculture
Sales Direct-to-Consumer
N Average percentage of total salesa
Percentage of total sales
Madison, OH 40 89% 7% 0.1%
Lancaster, NE 61 87 10 0.3
DeKalb, IL 70 87 9 0.2
Dakota, MN 75 83 8 1.0
Ventura, CA 76 79 12 0.3
Dane, WI 54 82 7 0.6
Berks, PA 46 59 24 0.6
Sonoma, CA 67 66 25 0.7
Carroll, MD 51 53 33 1.8
Palm Beach, FL 66 58 17 0.1
Orange, NY 69 46 40 7.4
King, WA 55 40 46 2.6
Burlington, NJ 78 42 34 1.1
Larimer, CO 62 30 50 0.7
Fayette, KY 50 29 42 0.04 a Percentages do not add to 100% due both to reporting errors by respondents and to reporting of “other” sales, which includes those not fitting into the wholesale or retail category (e.g., agritourism, boarding horses). The latter types of sales were generally small in most counties; however, they did account for relatively large percentages in Fayette (39 percent), Palm Beach (27 percent), and Burlington (22 percent) counties. In those three cases, virtually all the “other” enterprises were horse-related.
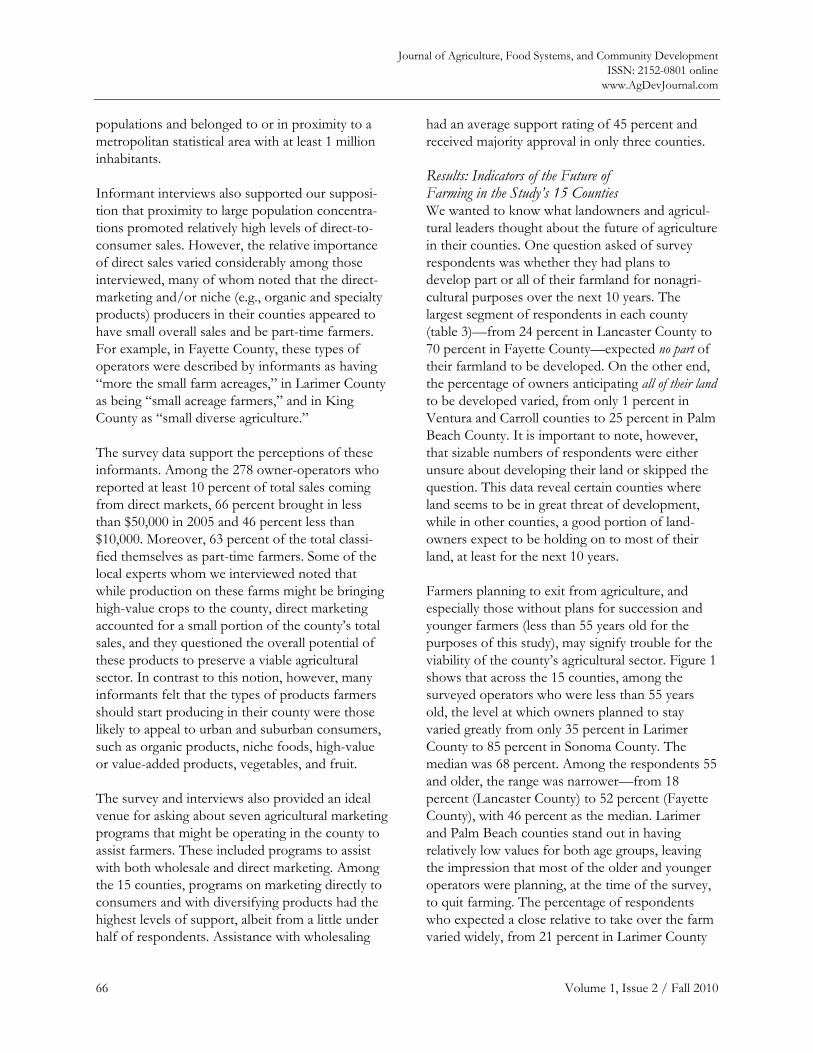
Journal of Agriculture, Food Systems, and Community Development ISSN: 2152-0801 online
www.AgDevJournal.com
66 Volume 1, Issue 2 / Fall 2010
populations and belonged to or in proximity to a metropolitan statistical area with at least 1 million inhabitants.
Informant interviews also supported our supposi-tion that proximity to large population concentra-tions promoted relatively high levels of direct-to-consumer sales. However, the relative importance of direct sales varied considerably among those interviewed, many of whom noted that the direct-marketing and/or niche (e.g., organic and specialty products) producers in their counties appeared to have small overall sales and be part-time farmers. For example, in Fayette County, these types of operators were described by informants as having “more the small farm acreages,” in Larimer County as being “small acreage farmers,” and in King County as “small diverse agriculture.”
The survey data support the perceptions of these informants. Among the 278 owner-operators who reported at least 10 percent of total sales coming from direct markets, 66 percent brought in less than $50,000 in 2005 and 46 percent less than $10,000. Moreover, 63 percent of the total classi-fied themselves as part-time farmers. Some of the local experts whom we interviewed noted that while production on these farms might be bringing high-value crops to the county, direct marketing accounted for a small portion of the county’s total sales, and they questioned the overall potential of these products to preserve a viable agricultural sector. In contrast to this notion, however, many informants felt that the types of products farmers should start producing in their county were those likely to appeal to urban and suburban consumers, such as organic products, niche foods, high-value or value-added products, vegetables, and fruit.
The survey and interviews also provided an ideal venue for asking about seven agricultural marketing programs that might be operating in the county to assist farmers. These included programs to assist with both wholesale and direct marketing. Among the 15 counties, programs on marketing directly to consumers and with diversifying products had the highest levels of support, albeit from a little under half of respondents. Assistance with wholesaling
had an average support rating of 45 percent and received majority approval in only three counties.
Results: Indicators of the Future of Farming in the Study’s 15 Counties We wanted to know what landowners and agricul-tural leaders thought about the future of agriculture in their counties. One question asked of survey respondents was whether they had plans to develop part or all of their farmland for nonagri-cultural purposes over the next 10 years. The largest segment of respondents in each county (table 3)—from 24 percent in Lancaster County to 70 percent in Fayette County—expected no part of their farmland to be developed. On the other end, the percentage of owners anticipating all of their land to be developed varied, from only 1 percent in Ventura and Carroll counties to 25 percent in Palm Beach County. It is important to note, however, that sizable numbers of respondents were either unsure about developing their land or skipped the question. This data reveal certain counties where land seems to be in great threat of development, while in other counties, a good portion of land-owners expect to be holding on to most of their land, at least for the next 10 years.
Farmers planning to exit from agriculture, and especially those without plans for succession and younger farmers (less than 55 years old for the purposes of this study), may signify trouble for the viability of the county’s agricultural sector. Figure 1 shows that across the 15 counties, among the surveyed operators who were less than 55 years old, the level at which owners planned to stay varied greatly from only 35 percent in Larimer County to 85 percent in Sonoma County. The median was 68 percent. Among the respondents 55 and older, the range was narrower—from 18 percent (Lancaster County) to 52 percent (Fayette County), with 46 percent as the median. Larimer and Palm Beach counties stand out in having relatively low values for both age groups, leaving the impression that most of the older and younger operators were planning, at the time of the survey, to quit farming. The percentage of respondents who expected a close relative to take over the farm varied widely, from 21 percent in Larimer County
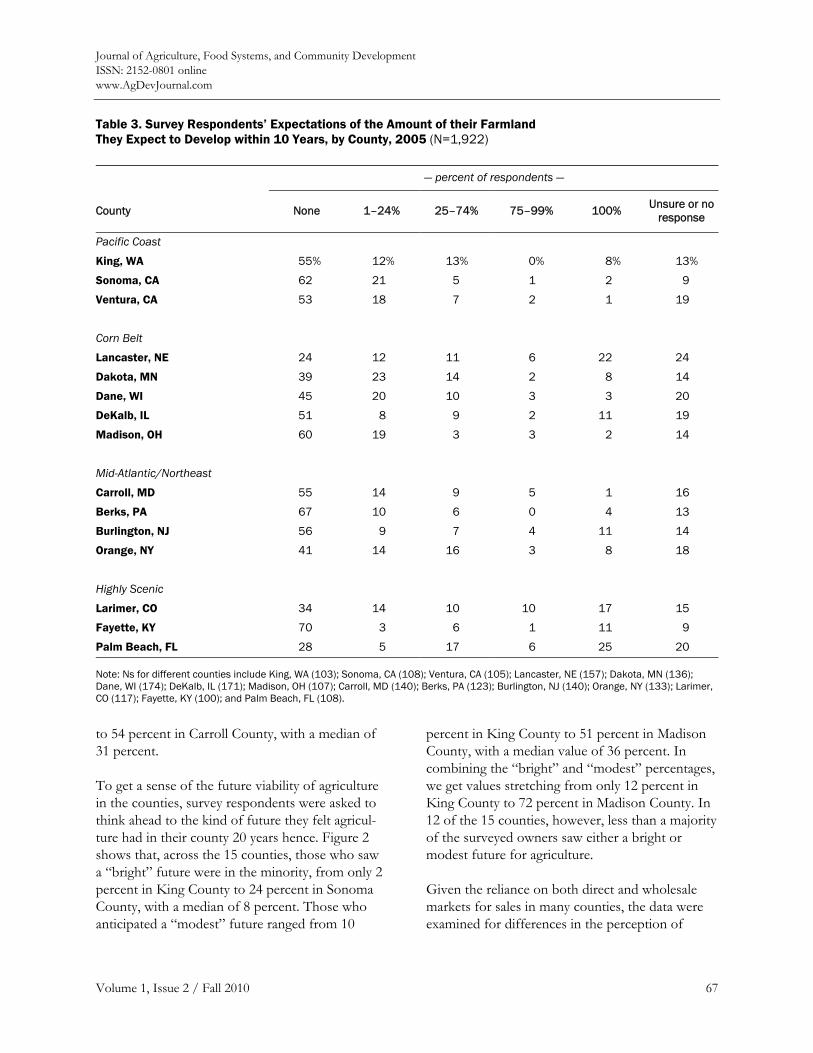
Journal of Agriculture, Food Systems, and Community Development ISSN: 2152-0801 online www.AgDevJournal.com
Volume 1, Issue 2 / Fall 2010 67
to 54 percent in Carroll County, with a median of 31 percent.
To get a sense of the future viability of agriculture in the counties, survey respondents were asked to think ahead to the kind of future they felt agricul-ture had in their county 20 years hence. Figure 2 shows that, across the 15 counties, those who saw a “bright” future were in the minority, from only 2 percent in King County to 24 percent in Sonoma County, with a median of 8 percent. Those who anticipated a “modest” future ranged from 10
percent in King County to 51 percent in Madison County, with a median value of 36 percent. In combining the “bright” and “modest” percentages, we get values stretching from only 12 percent in King County to 72 percent in Madison County. In 12 of the 15 counties, however, less than a majority of the surveyed owners saw either a bright or modest future for agriculture.
Given the reliance on both direct and wholesale markets for sales in many counties, the data were examined for differences in the perception of
Table 3. Survey Respondents’ Expectations of the Amount of their Farmland They Expect to Develop within 10 Years, by County, 2005 (N=1,922)
— percent of respondents —
County None 1–24% 25–74% 75–99% 100% Unsure or no response
Pacific Coast
King, WA 55% 12% 13% 0% 8% 13%
Sonoma, CA 62 21 5 1 2 9
Ventura, CA 53 18 7 2 1 19
Corn Belt
Lancaster, NE 24 12 11 6 22 24
Dakota, MN 39 23 14 2 8 14
Dane, WI 45 20 10 3 3 20
DeKalb, IL 51 8 9 2 11 19
Madison, OH 60 19 3 3 2 14
Mid-Atlantic/Northeast
Carroll, MD 55 14 9 5 1 16
Berks, PA 67 10 6 0 4 13
Burlington, NJ 56 9 7 4 11 14
Orange, NY 41 14 16 3 8 18
Highly Scenic
Larimer, CO 34 14 10 10 17 15
Fayette, KY 70 3 6 1 11 9
Palm Beach, FL 28 5 17 6 25 20
Note: Ns for different counties include King, WA (103); Sonoma, CA (108); Ventura, CA (105); Lancaster, NE (157); Dakota, MN (136); Dane, WI (174); DeKalb, IL (171); Madison, OH (107); Carroll, MD (140); Berks, PA (123); Burlington, NJ (140); Orange, NY (133); Larimer, CO (117); Fayette, KY (100); and Palm Beach, FL (108).
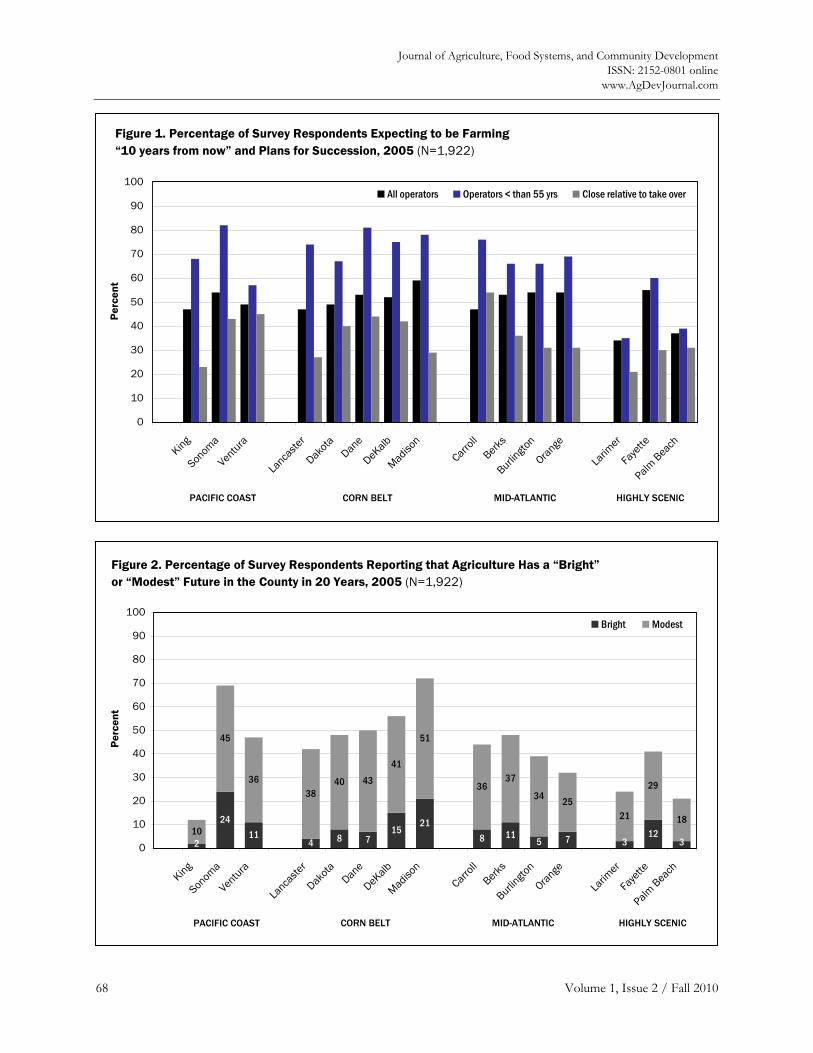
Journal of Agriculture, Food Systems, and Community Development ISSN: 2152-0801 online
www.AgDevJournal.com
68 Volume 1, Issue 2 / Fall 2010
Figure 1. Percentage of Survey Respondents Expecting to be Farming “10 years from now” and Plans for Succession, 2005 (N=1,922)
0
10
20
30
40
50
60
70
80
90
100
King
Sonom
a
Ventura
Lanca
ster
Dakota
Dane
DeKalb
Madison
Carroll
Berks
Burlingto
n
Orange
Larim
er
Faye
tte
Palm Bea
ch
Per
cent
All operators Operators < than 55 yrs Close relative to take over
PACIFIC COAST CORN BELT MID-ATLANTIC HIGHLY SCENIC
Figure 2. Percentage of Survey Respondents Reporting that Agriculture Has a “Bright” or “Modest” Future in the County in 20 Years, 2005 (N=1,922)
2411
4 8 715
218 11
5 7 1210
45
3638
40 43
41
51
3637
34 2521
29
18
2 3 30
10
20
30
40
50
60
70
80
90
100
PACIFIC COAST
King
Sonom
a
Ventura
CORN BELT
Lanca
ster
Dakota
Dane
DeKalb
Madison
MID-ATLANTIC
Carroll
Berks
Burlingto
n
Orange
HIGHLY SCENIC
Larim
er
Faye
tte
Palm Bea
ch
Per
cent
Bright Modest
PACIFIC COAST CORN BELT MID-ATLANTIC HIGHLY SCENIC
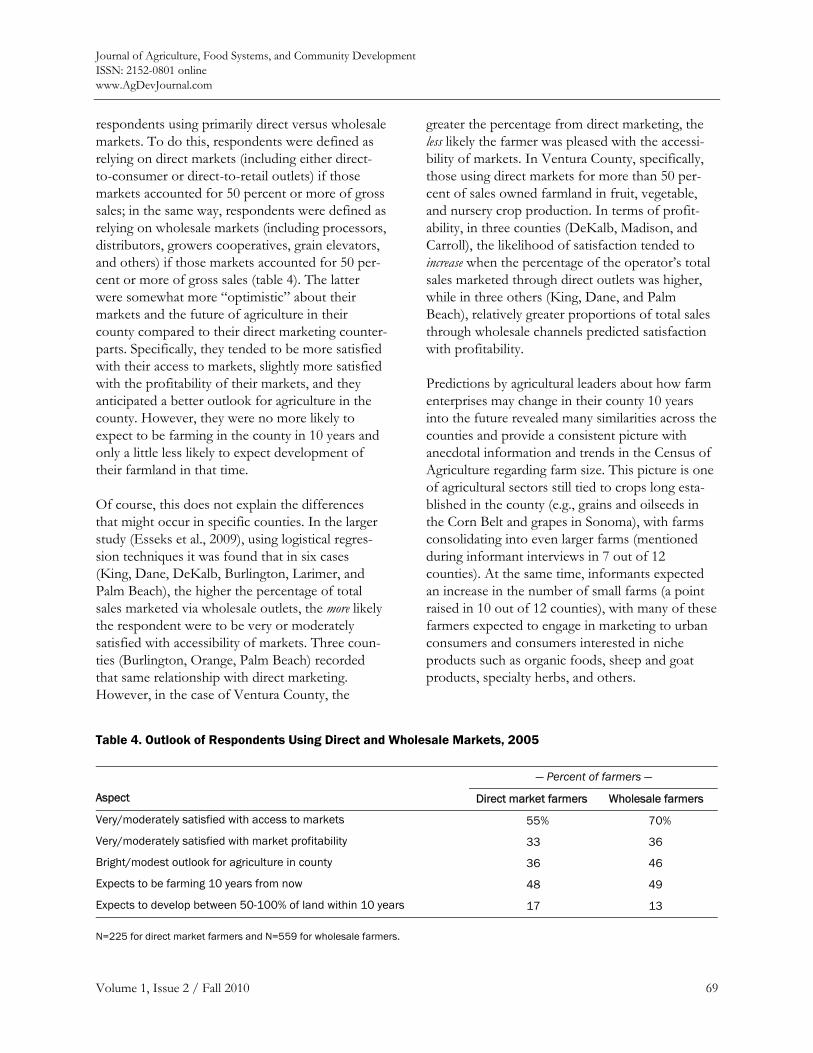
Journal of Agriculture, Food Systems, and Community Development ISSN: 2152-0801 online www.AgDevJournal.com
Volume 1, Issue 2 / Fall 2010 69
respondents using primarily direct versus wholesale markets. To do this, respondents were defined as relying on direct markets (including either direct-to-consumer or direct-to-retail outlets) if those markets accounted for 50 percent or more of gross sales; in the same way, respondents were defined as relying on wholesale markets (including processors, distributors, growers cooperatives, grain elevators, and others) if those markets accounted for 50 per-cent or more of gross sales (table 4). The latter were somewhat more “optimistic” about their markets and the future of agriculture in their county compared to their direct marketing counter-parts. Specifically, they tended to be more satisfied with their access to markets, slightly more satisfied with the profitability of their markets, and they anticipated a better outlook for agriculture in the county. However, they were no more likely to expect to be farming in the county in 10 years and only a little less likely to expect development of their farmland in that time.
Of course, this does not explain the differences that might occur in specific counties. In the larger study (Esseks et al., 2009), using logistical regres-sion techniques it was found that in six cases (King, Dane, DeKalb, Burlington, Larimer, and Palm Beach), the higher the percentage of total sales marketed via wholesale outlets, the more likely the respondent were to be very or moderately satisfied with accessibility of markets. Three coun-ties (Burlington, Orange, Palm Beach) recorded that same relationship with direct marketing. However, in the case of Ventura County, the
greater the percentage from direct marketing, the less likely the farmer was pleased with the accessi-bility of markets. In Ventura County, specifically, those using direct markets for more than 50 per-cent of sales owned farmland in fruit, vegetable, and nursery crop production. In terms of profit-ability, in three counties (DeKalb, Madison, and Carroll), the likelihood of satisfaction tended to increase when the percentage of the operator’s total sales marketed through direct outlets was higher, while in three others (King, Dane, and Palm Beach), relatively greater proportions of total sales through wholesale channels predicted satisfaction with profitability.
Predictions by agricultural leaders about how farm enterprises may change in their county 10 years into the future revealed many similarities across the counties and provide a consistent picture with anecdotal information and trends in the Census of Agriculture regarding farm size. This picture is one of agricultural sectors still tied to crops long esta-blished in the county (e.g., grains and oilseeds in the Corn Belt and grapes in Sonoma), with farms consolidating into even larger farms (mentioned during informant interviews in 7 out of 12 counties). At the same time, informants expected an increase in the number of small farms (a point raised in 10 out of 12 counties), with many of these farmers expected to engage in marketing to urban consumers and consumers interested in niche products such as organic foods, sheep and goat products, specialty herbs, and others.
Table 4. Outlook of Respondents Using Direct and Wholesale Markets, 2005
— Percent of farmers —
Aspect Direct market farmers Wholesale farmers
Very/moderately satisfied with access to markets 55% 70%
Very/moderately satisfied with market profitability 33 36
Bright/modest outlook for agriculture in county 36 46
Expects to be farming 10 years from now 48 49
Expects to develop between 50-100% of land within 10 years 17 13
N=225 for direct market farmers and N=559 for wholesale farmers.
Journal of Agriculture, Food Systems, and Community Development ISSN: 2152-0801 online
www.AgDevJournal.com
70 Volume 1, Issue 2 / Fall 2010
Informants considered certain crops and livestock —horses in Fayette County, wine grapes in Sonoma County, and high-value fruits and vege-tables in Ventura County—more profitable than others, apparently because these are desired by urban consumers. Horse-related enterprises were also important in at least five of the studied counties’ agricultural pictures and will likely continue to be unless the number of wealthy families declines in these communities. Hay was a profitable crop in many places, although it may be a small part of total farm income. If used for horses or other livestock it would be a viable crop; if used as straw for construction, it may be profitable as long as development is robust. The future of the landscaping sector for agriculture will probably also be influenced greatly by the amount of new development.
Dairy and livestock presented perhaps the most pessimistic sector in our study. In most of the six counties in which dairy recorded the first or second largest volume of sales in the 2002 Census of Agriculture (King, Sonoma, Dane, Carroll, Orange, and Larimer counties), key informants expected declines because of low profits, problems with succession (e.g., price of land too high for new entrants), and environmental conflicts (such as over manure odors and flies). One issue raised by many informants in regard to livestock in general was the impact of increasing suburbanization and urbanization; that is, as more people move to these agricultural areas, there seemed to be less tolerance of large livestock operations, causing many of those interviewed, including operators, to be pessimistic about the future of livestock production in these areas.
For some time, one of the foci of agricultural development has been value-added food proces-sing as a way for farmers to capture more of a commodity’s food value. Informants in most counties noted that there was limited processing infrastructure, except for traditional enterprises like dairies and slaughterhouses, and that these were declining. There were exceptions, such as Berks County, which has a strong agricultural processing infrastructure, and in some counties those
interviewed believed that processing of locally grown agricultural products, such as cheese from milk, wine from grapes, or small-scale livestock processing, will increase in the future.
Conclusion and Recommendations Views about farming, farmland preservation, and the future of agriculture in the 15 urban-edge counties were quite varied. For example, on one end of the spectrum, Palm Beach, Larimer, and Lancaster county landowners reported the highest percentage of farmland expected to be developed over the next 10 years. In addition, Larimer and Palm Beach had the lowest number of farmers under the age of 55 planning on farming in 10 years. Not surprisingly, these two counties also had the lowest number of respondents (after King County) reporting that agriculture in the county had a bright or modest future. On the other end of the spectrum, the same indicators—including land not expected to be developed, operators under 55 still planning on farming in 10 years, and a bright or modest outlook for agriculture on the part of respondents—describe four counties with the highest level of farmer optimism. Agricultural production and land use in these counties—Madison, DeKalb, Sonoma, and Dane—are still very much focused, both in terms of the amount of land in production and the value of sales, on commodities such as grain, soybeans, and corn, as well as commodities that have been long esta-blished, such as grapes in Sonoma County and dairy in Dane County.
Although much of the discussion around urban-edge farming centers on alternative crops and marketing avenues, it is clear that farmland protection and farm viability efforts must also concentrate on how land devoted to these more traditional enterprises, which account for the majority of farmland in these counties, will be secured given the economics of urban-edge farming. This becomes even more critical given previous research. Results from Clark and Irwin (2009) highlight that many communities contain farmers who are not likely to adapt to urban-edge conditions because they may be in contractual relations that cannot be changed, may have
Journal of Agriculture, Food Systems, and Community Development ISSN: 2152-0801 online www.AgDevJournal.com
Volume 1, Issue 2 / Fall 2010 71
previous investments that require them to continue what they are doing, do not rely on farm income and therefore are not motivated to change what they are doing, have perceptions about what real farming is that keep them from doing new things, or need to keep in mind what the local community considers agriculture to be.
Many of the farms in the studied counties fall into the category of midsize farms, defined by their gross sales, farm size, and markets. This middle sector of agriculture has experienced the greatest loss in farm numbers in the last 15 years. Infor-mant interviews uncovered clear indications that “agriculture of the middle” is declining in many of the studied counties. As mentioned earlier, infor-mants often described the future in many of the counties as one of both consolidation of produc-tion on large farms and increasing numbers of small farms direct-marketing high-value products. These agricultural leaders suggest that midsize farms are vulnerable, and yet given the number of acres they represent, they are essential to maintain-ing an agricultural sector that is productive over the long term. On the land preservation side, this points to the need for more strategic land-use planning. On the marketing side, it means addi-tional research on, and importance given to, developing food value chains, exploring options for scaling up to regional markets, and assessing the factors affecting the profitability of enterprises of different sizes producing, processing, and distributing different commodities.
Following expectations about urban-edge farming in many of the 15 study sites, large numbers of farmers rely on direct markets for a good portion of their sales. The Census of Agriculture indicates higher-than-average direct-to-consumer sales in many of the counties, and the survey data support this. However, these farms tend to have low total agricultural sales and farmers slightly less satisfied with their markets and less optimistic about the future of agriculture in their county. Many of these farms are small and, as mentioned earlier, while they are bringing high-value crops to the county’s markets, many informants questioned their overall potential to preserve a viable agricultural sector
because they represent such a small portion of total agricultural sales. That said, many farmers are using direct-to-consumer markets and developing alternative agricultural products. It may be that some of these smaller farms increase their sales and “become the backbone of a resilient future peri-urban industry” (Clark, Inwood, Sharp, & Jackson-Smith, 2007). Thus, it is vital that the availability of technical assistance and funding programs that relate to direct marketing and alternative agricul-tural products be supported and better promoted at the local, state, and national levels, and that new programs be developed in areas currently lacking these programs.
When survey respondents were asked what inter-ested stakeholders should do to keep farming viable in their county, 29 percent felt that equal emphasis should be placed on the goals of land preservation and helping farmers to farm more profitably. A little over a third felt that the priority should be to help protect agricultural land from development (via zoning or purchase of develop-ment rights, for example). Sixteen percent felt that interested parties should help farmers to farm more profitably, while 14 percent agreed with the choice to do “nothing and let private forces guide things.”
Our results suggest that the long-term viability of urban-edge agriculture will likely depend on a variety of factors, including types of products produced, climate and other environmental conditions, strength of urbanization pressures, and the size of nearby markets for both wholesale and direct-to-consumer products, as well as the effec-tiveness of growth management policies. This and other analyses demonstrate that while a number of farmers have adapted to urban-oriented agriculture, the future of agriculture looks quite different in different areas (Clark, Jackson-Smith, Sharp, & Munroe, 2007). Urban fringe counties need to increase their efforts to maintain a viable agricul-tural sector by taking into account the unique farming and demographic characteristics of their county. There are areas of the country that are experiencing urbanizing pressures where direct marketing of agricultural products has not caught the interest of farmers in the county (e.g., Corn
Journal of Agriculture, Food Systems, and Community Development ISSN: 2152-0801 online
www.AgDevJournal.com
72 Volume 1, Issue 2 / Fall 2010
Belt region). Research and development efforts need to be undertaken differently in these areas where wholesale markets dominate farming than in areas where direct marketing has entered and benefited the farming culture.
At the same time, ongoing research is needed to examine changes to agriculture taking place in these and other urbanizing counties over time. Certainly over the last few years the economic downturn in the United States has caused a decrease in development pressure from both the residential and business sectors. Changes in the economic climate need to be accounted for in research, and studies that examine locations over time will help us understand farmers’ adaptations to economic circumstances. We also need to know more about the right mix of markets and policy instruments for individual farmers in peri-urban areas and how to help farmers discern what path might be most successful for them. We need a better understanding of the characteristics of midsize farms in different areas of the country. It will also be useful to have much more information on what policies and logistical infrastructure are found in peri-urban areas where the farm sector is
growing or stable. Finally, research that identifies planning assessments and approaches that have successfully incorporated the concepts of farm viability and regional food security into the plan-ning process would of great interest and use.
Acknowledgements We want to acknowledge and thank our key research collaborators, Mark Lapping (Muskie School of Public Service, University of Southern Maine) and Anita Zurbrugg (Center for Agriculture in the Environment, American Farmland Trust). We also want to thank our student colleagues who helped collect a great deal of the data: John Seward, Monica Stroe (Ministry of Agriculture, Bucharest, Romania), Jessica Nelson (University of Nebraska-Lincoln), Elizabeth Moorhouse, Ph.D. (Depart-ment of Economics, Lycoming College), Fraser MacDonald (University of Oregon-Eugene), and Mark Bauermeister (Iowa State University).
The project represented in this article was supported by the National Research Initiative of the Cooperative State Research, Education, and Extension Service, USDA, Grant #2004-35401-14944.
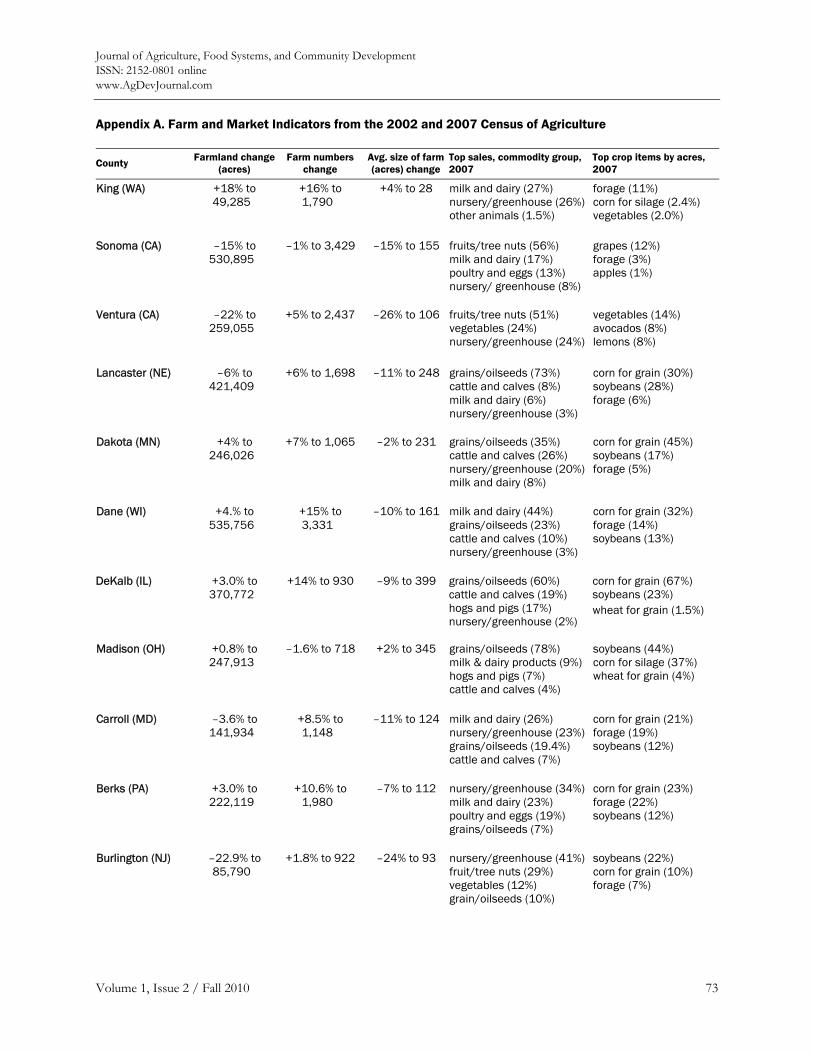
Journal of Agriculture, Food Systems, and Community Development ISSN: 2152-0801 online www.AgDevJournal.com
Volume 1, Issue 2 / Fall 2010 73
Appendix A. Farm and Market Indicators from the 2002 and 2007 Census of Agriculture
County Farmland change
(acres) Farm numbers
change Avg. size of farm (acres) change
Top sales, commodity group, 2007
Top crop items by acres, 2007
King (WA) +18% to 49,285
+16% to 1,790
+4% to 28
milk and dairy (27%) nursery/greenhouse (26%) other animals (1.5%)
forage (11%) corn for silage (2.4%) vegetables (2.0%)
Sonoma (CA) –15% to 530,895
–1% to 3,429 –15% to 155
fruits/tree nuts (56%) milk and dairy (17%) poultry and eggs (13%) nursery/ greenhouse (8%)
grapes (12%) forage (3%) apples (1%)
Ventura (CA) –22% to 259,055
+5% to 2,437 –26% to 106
fruits/tree nuts (51%) vegetables (24%) nursery/greenhouse (24%)
vegetables (14%) avocados (8%) lemons (8%)
Lancaster (NE) –6% to 421,409
+6% to 1,698 –11% to 248
grains/oilseeds (73%) cattle and calves (8%) milk and dairy (6%) nursery/greenhouse (3%)
corn for grain (30%) soybeans (28%) forage (6%)
Dakota (MN) +4% to 246,026
+7% to 1,065 –2% to 231
grains/oilseeds (35%) cattle and calves (26%) nursery/greenhouse (20%) milk and dairy (8%)
corn for grain (45%) soybeans (17%) forage (5%)
Dane (WI) +4.% to 535,756
+15% to 3,331
–10% to 161
milk and dairy (44%) grains/oilseeds (23%) cattle and calves (10%) nursery/greenhouse (3%)
corn for grain (32%) forage (14%) soybeans (13%)
DeKalb (IL) +3.0% to 370,772
+14% to 930 –9% to 399 grains/oilseeds (60%) cattle and calves (19%) hogs and pigs (17%) nursery/greenhouse (2%)
corn for grain (67%) soybeans (23%) wheat for grain (1.5%)
Madison (OH) +0.8% to 247,913
–1.6% to 718 +2% to 345
grains/oilseeds (78%) milk & dairy products (9%) hogs and pigs (7%) cattle and calves (4%)
soybeans (44%) corn for silage (37%) wheat for grain (4%)
Carroll (MD) –3.6% to 141,934
+8.5% to 1,148
–11% to 124
milk and dairy (26%) nursery/greenhouse (23%) grains/oilseeds (19.4%) cattle and calves (7%)
corn for grain (21%) forage (19%) soybeans (12%)
Berks (PA) +3.0% to 222,119
+10.6% to 1,980
–7% to 112
nursery/greenhouse (34%) milk and dairy (23%) poultry and eggs (19%) grains/oilseeds (7%)
corn for grain (23%) forage (22%) soybeans (12%)
Burlington (NJ) –22.9% to 85,790
+1.8% to 922 –24% to 93
nursery/greenhouse (41%) fruit/tree nuts (29%) vegetables (12%) grain/oilseeds (10%)
soybeans (22%) corn for grain (10%) forage (7%)
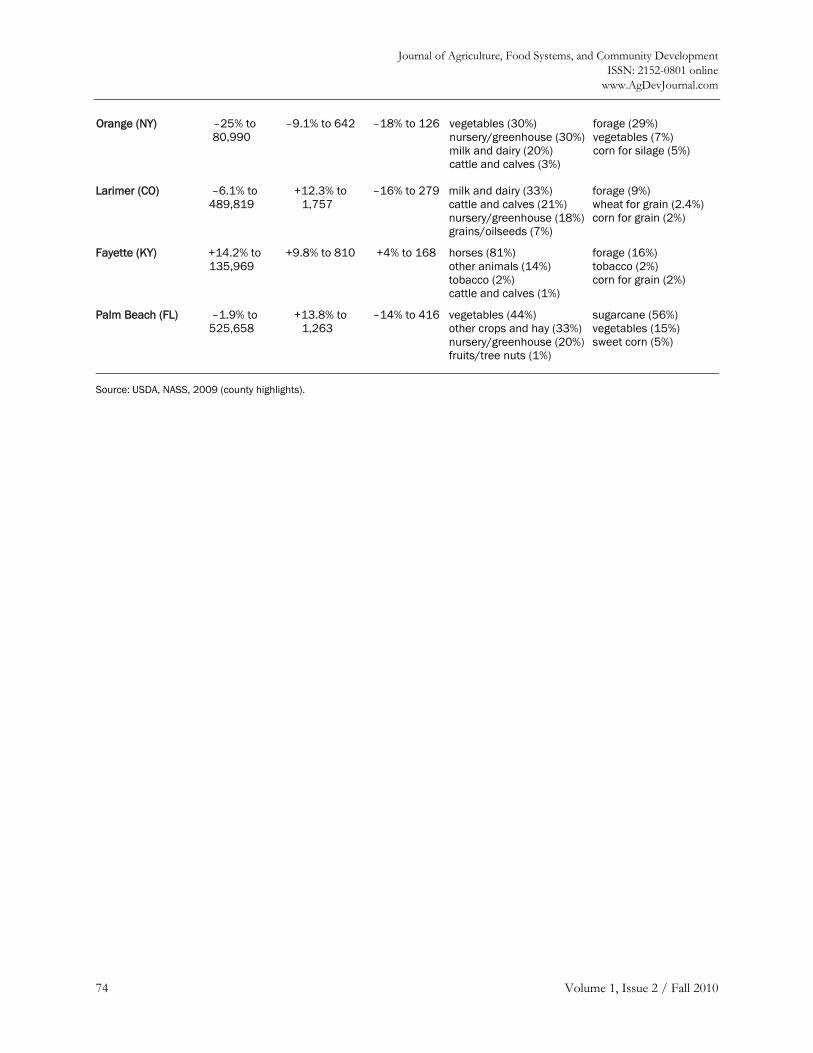
Journal of Agriculture, Food Systems, and Community Development ISSN: 2152-0801 online
www.AgDevJournal.com
74 Volume 1, Issue 2 / Fall 2010
Orange (NY) –25% to 80,990
–9.1% to 642 –18% to 126
vegetables (30%) nursery/greenhouse (30%) milk and dairy (20%) cattle and calves (3%)
forage (29%) vegetables (7%) corn for silage (5%)
Larimer (CO) –6.1% to 489,819
+12.3% to 1,757
–16% to 279 milk and dairy (33%) cattle and calves (21%) nursery/greenhouse (18%) grains/oilseeds (7%)
forage (9%) wheat for grain (2.4%) corn for grain (2%)
Fayette (KY) +14.2% to 135,969
+9.8% to 810 +4% to 168 horses (81%) other animals (14%) tobacco (2%) cattle and calves (1%)
forage (16%) tobacco (2%) corn for grain (2%)
Palm Beach (FL) –1.9% to 525,658
+13.8% to 1,263
–14% to 416 vegetables (44%) other crops and hay (33%) nursery/greenhouse (20%) fruits/tree nuts (1%)
sugarcane (56%) vegetables (15%) sweet corn (5%)
Source: USDA, NASS, 2009 (county highlights).
Journal of Agriculture, Food Systems, and Community Development ISSN: 2152-0801 online www.AgDevJournal.com
Volume 1, Issue 2 / Fall 2010 75
References American Farmland Trust (AFT). (2007). Fact sheet: Cost
of community services. http://www.farmlandinfo.org/ documents/27757/COCS_09-2007.pdf
American Farmland Trust. (2003). Fact sheet: America’s agricultural land is at risk. http://www.farmlandinfo.org/documents/28562/Why_Save_Farmland_1-03.pdf
American Farmland Trust. (1997). Saving American farmland: What works. Northampton, MA: American Farmland Trust.
Blobaum, R. (1982). Remarks at Food and Agriculture Symposium (AAAS Annual Meeting). Washington, DC: American Association for the Advancement of Science. January
Bogue, D. J. (1956). The spread of cities. The American Economic Review, 46 (2): 284–292.
Bryant, C. R., and Johnston, T. R. (1992). The nature of agriculture in the city’s countryside: A synthesis. In C. R. Bryant, T. R. Johnston and T. R. R. Johnston (Eds.) Agriculture in the city’s countryside (pp. 190–198). Toronto: University of Toronto Press.
Clark, J., and Irwin, E. (2009, October). Exurban farming in the current market: Past effects, future possibilities. Presented at the Baldwin Center Inaugural Symposium, Charlottesville, VA. http://cffpi.osu.edu/agadapt.htm
Clark, J., Inwood, S., Sharp, J. and Jackson-Smith, D. (2007). Community-level influences on agricultural trajectories: Seven cases across the exurban United States. Paper presented at the Sixth Quadrennial Conference of British, Canadian, and American Rural Geographers, Spokane, WA. http://cffpi.osu.edu/agadapt.htm
Clark, J., Jackson-Smith, D., Sharp, J., and Munroe, D. (2007, September). The geography of U.S. peri-urban agricultural adaptation. Paper presented at the TransAtlantic Land Use Conference, Washington, DC. http://cffpi.osu.edu/agadapt.htm
Daniels, T. (1998). When city and country collide: Managing growth in the metropolitan fringe. Washington, DC: Island Press.
Daniels, T., and Bowers, B. (1997). Holding our ground: Protecting America’s farms and farmland. Washington, DC: Island Press.
Esseks, D., Oberholtzer, L., Clancy, K., Lapping, M., and Zurbrugg, A. (2009). Sustaining agriculture in urbanizing counties: Insights from 15 coordinated case studies. Lincoln, NE: Center for Great Plains Studies, University of Nebraska, Lincoln. www.farmland.org/resources/sustaining-
agriculture-in-urbanizing-counties/documents/ Sustaining-agriculture-in-urbanizing-counties.pdf
Gale, E. (1997). Direct marketing as a rural development tool. Rural Development Perspectives, 12 (2): 19–25.
Heimlich, R. E., and Anderson, W. D. (2001). Development at the urban fringe and beyond: Impacts on agriculture and rural land. Agricultural Economic Report No. 893. Washington, DC: U.S. Depart-ment of Agriculture, Economic Research Service.
Hellerstein, D., Nickerson, C., Cooper, J., Feather, P., Gadsby, D., Mullarkey, D., Tegene, A., and Barnard, C. (2002). Farmland protection: The role of public preferences for rural amenities. Agricultural Economic Report No. 815. Washington, DC: U.S. Department of Agriculture, Economic Research Service.
Jackson-Smith, D., and Sharp, J. (2008). Farming in the urban shadow: Supporting agriculture at the rural-urban interface. Rural Realities, 2 (4).
Johnston, T. R., and Bryant, C. R. (1987). Agricultural adaptation: The prospects for sustaining agriculture near cities. In W. Lockeretz (Ed.), Sustaining agricul-ture near cities (pp. 9–21). Ankeny, IA: Soil and Water Conservation Society.
Kirschenmann, F., Stevenson, G. W., Buttel, F., Lyson, T. A. and Duffy, M. (2008). Why worry about the agriculture in the middle? In T. A. Lyson, G. W. Stevenson, and R. Welsh (Eds.) Food and the mid-level farm: Renewing an agriculture of the middle (pp. 3–22). Cambridge, MA: MIT Press.
Libby, L. W. (2002). Farmland is not just for farming any more: The policy trends. In L. Tweeten and S. Thompson (Eds.), Agricultural policy for the 21st century (pp. 184–203). Ames, IA: Iowa State University Press. doi:10.1002/9780470390375.ch10
U.S. Department of Agriculture, Economic Research Service (USDA, ERS). (2005). Briefing room: Land use, value, and management: Urbanization and agricultural land. http://www.ers.usda.gov/ Briefing/LandUse/urbanchapter.htm
U.S. Department of Agriculture, National Agricultural Statistics Service (USDA, NASS). (2009). 2007 census of agriculture. Washington, DC: U.S. Depart-ment of Agriculture, NASS.
U.S. Department of Agriculture, Natural Resources Conservation Service (USDA, NRCS). (2009). Summary report: 2007 national resources inventory, Washington DC: U.S. Department of Agriculture, Natural Resources Conservation Service, and Ames, IA: Center for Survey Statistics and Methodology.

Journal of Agriculture, Food Systems, and Community Development ISSN: 2152-0801 online
www.AgDevJournal.com
76 Volume 1, Issue 2 / Fall 2010
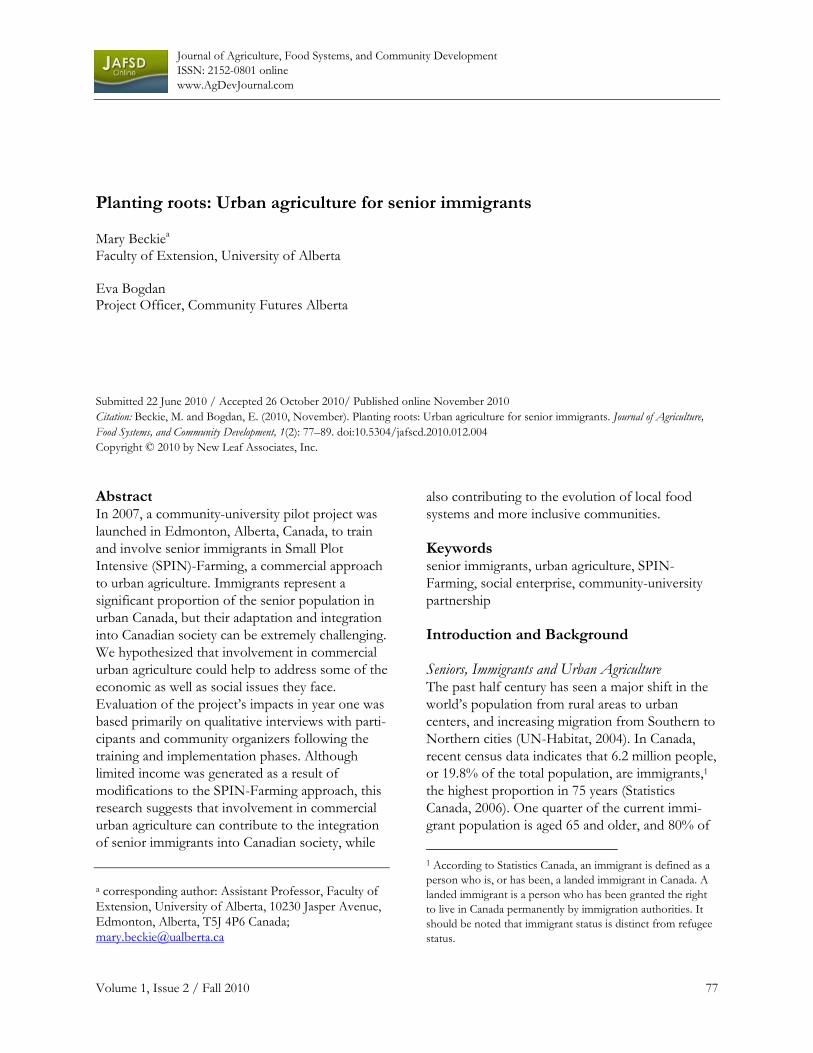
Journal of Agriculture, Food Systems, and Community Development ISSN: 2152-0801 online www.AgDevJournal.com
Volume 1, Issue 2 / Fall 2010 77
Planting roots: Urban agriculture for senior immigrants Mary Beckiea Faculty of Extension, University of Alberta Eva Bogdan Project Officer, Community Futures Alberta Submitted 22 June 2010 / Accepted 26 October 2010/ Published online November 2010 Citation: Beckie, M. and Bogdan, E. (2010, November). Planting roots: Urban agriculture for senior immigrants. Journal of Agriculture, Food Systems, and Community Development, 1(2): 77–89. doi:10.5304/jafscd.2010.012.004 Copyright © 2010 by New Leaf Associates, Inc.
Abstract In 2007, a community-university pilot project was launched in Edmonton, Alberta, Canada, to train and involve senior immigrants in Small Plot Intensive (SPIN)-Farming, a commercial approach to urban agriculture. Immigrants represent a significant proportion of the senior population in urban Canada, but their adaptation and integration into Canadian society can be extremely challenging. We hypothesized that involvement in commercial urban agriculture could help to address some of the economic as well as social issues they face. Evaluation of the project’s impacts in year one was based primarily on qualitative interviews with parti-cipants and community organizers following the training and implementation phases. Although limited income was generated as a result of modifications to the SPIN-Farming approach, this research suggests that involvement in commercial urban agriculture can contribute to the integration of senior immigrants into Canadian society, while
a corresponding author: Assistant Professor, Faculty of Extension, University of Alberta, 10230 Jasper Avenue, Edmonton, Alberta, T5J 4P6 Canada; [email protected]
also contributing to the evolution of local food systems and more inclusive communities.
Keywords senior immigrants, urban agriculture, SPIN-Farming, social enterprise, community-university partnership
Introduction and Background
Seniors, Immigrants and Urban Agriculture The past half century has seen a major shift in the world’s population from rural areas to urban centers, and increasing migration from Southern to Northern cities (UN-Habitat, 2004). In Canada, recent census data indicates that 6.2 million people, or 19.8% of the total population, are immigrants,1 the highest proportion in 75 years (Statistics Canada, 2006). One quarter of the current immi-grant population is aged 65 and older, and 80% of
1 According to Statistics Canada, an immigrant is defined as a person who is, or has been, a landed immigrant in Canada. A landed immigrant is a person who has been granted the right to live in Canada permanently by immigration authorities. It should be noted that immigrant status is distinct from refugee status.
Journal of Agriculture, Food Systems, and Community Development ISSN: 2152-0801 online
www.AgDevJournal.com
78 Volume 1, Issue 2 / Fall 2010
these seniors2 live in census metropolitan areas (Statistics Canada, 2006).
The integration of senior immigrants into Canadian life, and their overall health and well-being, is influenced by a number of socio-economic and environmental circumstances, such as economic security, social inclusion and exclusion, food security, and housing (Durst, 2005). For recent senior immigrants, financial security can be a pressing concern as eligibility for the Canada pension plan is dependent upon having lived in Canada for 10 years or more (Durst, 2005; Service Canada, 2010). This and other variables identified as social determinants of health3 are viewed as having an equal if not more important impact on an individual’s health than medical care and personal health behaviors (Raphael, 2004; Public Health Agency of Canada, 2010).
Urban agriculture, whether focused on household consumption or commercial enterprise, has proven to be an effective way for many minority groups to become integrated into the socio-economic fabric of the cultures and countries to which they immigrate (Hannah & Oh, 2000; Mougeot, 2006, Redwood, 2009; Valtonen, 2004). In Montreal, Italian and Portuguese immigrants were instru-mental in establishing the first community gardens during the 1970s, and the city’s community garden program continues to have a strong multicultural presence (Cosgrove, 2010; Mougeot, 2006). Several other urban agriculture programs and projects involving immigrants are currently underway across North America, such as the Field to Table Urban Agriculture project run by Food Share in Toronto (www.foodshare.net), Cob Connection in Chicago (www.cobconnection.org), and Heifer Inter-national’s programs in various cities across the United States (www.heifer.org).
On a broader social scale, there is increasing evi-dence that urban agriculture has positive impacts
2 The Canadian government defines seniors as individuals 65 years of age and older. 3 http://www.phac-aspc.gc.ca/ph-sp/determinants/index-eng.php
on individual and community health and well-being. In a summary of results from two decades of research on urban agriculture, Canada’s Inter-national Development Research Council (IDRC) identifies several benefits of urban agriculture, including improved access to fresh and nutritious food, reduced food costs, physical exercise, therapy and recreation, income generation, reduced food miles,4 urban greening,5 and community capacity-building (Mougeot, 2006). Increased social engage-ment experienced through urban agriculture and direct marketing has been shown to positively correlate with personal attention to health care and wellness, and provides opportunities for relation-ship-building and information exchange (Bellows, Brown, & Smit, 2003).
A number of studies have investigated the role of gardening in the health and well-being of older adults. Milligan, Gatrell, and Bingley (2004) found that gardening offers isolated seniors a reason to leave their households and engage in the wider landscape. Furthermore, they report that com-munal gardening can create an inclusive space in which seniors “benefit from gardening activity in a mutually supportive environment that combats social isolation and contributes to the development of their social networks” (2004, p. 1781). Working with soil and plants improves seniors’ mental health and personal wellness by contributing to a sense of achievement, satisfaction, and aesthetic pleasure, and increased confidence and self-esteem (Brown, Allen, Dwozan, Mercer, & Warren, 2004; Milligan et al., 2004; Patel, 1991). Gardening has also been shown to induce relaxation, and reduce fear, anger, and stress in older adults, which in turn affects physical health (Milligan et al., 2004).
Despite significant evidence of the socio-economic benefits of urban agriculture for immigrants, and
4 Food miles is a term that refers to the distance food is transported from the site of production to the site of consumption. 5 Urban green space is a term that refers to public and private spaces in urban areas that are primarily covered by vegetation. Increasing urban green spaces, referred to as urban greening, is seen to play a prominent role in enhancing the sustainability and livability of a city.
Journal of Agriculture, Food Systems, and Community Development ISSN: 2152-0801 online www.AgDevJournal.com
Volume 1, Issue 2 / Fall 2010 79
other studies reporting on the positive impacts of gardening on seniors’ health and well-being, the linking of senior immigrants with commercial urban agriculture has not been previously reported. The research described in this paper is, to the best of our knowledge, the first investigation of this kind. We set out to explore if involvement with Small Plot Intensive Farming (SPIN-Farming), a commercial approach to urban agriculture, could contribute to immigrant seniors’ adaptation and integration into urban life in Canada, and improve their overall health and well-being.
SPIN-Farming Small Plot Intensive Farming, also known as SPIN-Farming, is a commercial approach to urban agri-culture developed by Wally Satzewich and Gail Vandersteen, two market gardeners based in Saskatoon, Saskatchewan, Canada. This method integrates relay planting,6 to maximize harvest volume as well as economic gain, and organic farming methods,7 which reduce reliance on external inputs by eliminating the use of synthet-ically manufactured fertilizers and pesticides. SPIN-Farming requires moderate start-up costs and low operating and overhead costs, and has been shown to generate relatively high levels of income from a subacre land base (Satzewich & Christensen, 2005; Urban Partners, 2007). This approach also allows for flexibility in the scope and scale of the production system, as well as flexibility in land-use arrangements. For example, Satzewich and Vandersteen run a multisite operation from a number of rented backyards in Saskatoon, whereas a single-site SPIN initiative was developed in Philadelphia on a half-acre of land owned by that city’s Water Works Department. A detailed manual describing the SPIN method has been developed (Satzewich & Christensen, 2005) and can be
6 The SPIN relay planting method involves the reseeding of the planting bed following crop harvest. For short-term crops, such as lettuce and spinach, it is possible to harvest two to three crops per season (www.spinfarming.com). 7 Organic certification is considered optional in the SPIN-Farming approach, but organic methods are incorporated to reduce operating costs associated with agrochemical use as well as to foster production systems that are more ecologically, economically, and socially sustainable.
ordered through the SPIN website (www.spinfarming.com). Over the past five years, Satzewich and Vandersteen have delivered several SPIN training workshops throughout North America. In addition to the SPIN-Farming manual, an economic analysis of the five-year SPIN initiative in Philadelphia is available on the SPIN website (Urban Partners, 2007). Thus, as a well developed, tested, and accessible method, SPIN-Farming was identified as a plausible way to introduce senior immigrants in Edmonton to commercial urban agriculture.
Research Purpose, Methodology, and Methods Senior immigrants represent a vulnerable and poorly understood, but significant, segment of Canadian society (Durst, 2005). As many senior immigrants living in Edmonton were known to come from rural and farming backgrounds, it was hypothesized that providing them with an oppor-tunity to become involved in a commercial approach to urban agriculture could help to address the economic, social, and health challenges they face. To test this hypothesis, we investigated the impacts resulting from senior immigrants’ involvement in the pilot year of the “Urban Agriculture for Senior Immigrants” project. This pilot project was initiated in Edmonton, Alberta, in 2007 through a university-community partnership involving the Seniors’ Association of Greater Edmonton (SAGE)8 serving as the overall coordi-nating agency, the Multicultural Health Brokers Co-operative (MCHB)9 providing connections to senior immigrants from various ethnic communi- 8 Seniors’ Association of Greater Edmonton (SAGE) is a nonprofit organization that provides services to older adults (55 and over) and their families, including information and referral, social services, advocacy, housing, help in applying for court-appointed guardianship, relocation services, and home-maintenance assistance. It also offers health, lifestyle, social, and recreation programs. 9 Multicultural Health Brokers Co-operative (MCHB) is a registered worker’s cooperative with members from immigrant and refugee communities in Edmonton. For the past 10 years, it has been providing culturally and linguistically relevant public health support to immigrant and refugee families in a number of areas, such as family relationships, housing, education, economics, and food security.
Journal of Agriculture, Food Systems, and Community Development ISSN: 2152-0801 online
www.AgDevJournal.com
80 Volume 1, Issue 2 / Fall 2010
ties and serving as interpreters during the project, and members of the Faculty of Extension10 at the University of Alberta carrying out research during the pilot year of the project.
We utilized exploratory (Stebbins, 2001) and qualitative case study (Yin, 2009) approaches to investigate the first year of the pilot project. Issue identification, analysis of themes, and evaluation and integration of information were based on review of documentary data (academic and popular press) as well as narrative data gathered from qualitative interviews, and researchers’ observa-tions. Two sets of interviews (n=26) were con-ducted, at the end of the workshop and after final harvest, with seniors, the gardening coordinator, and representatives from SAGE and MCHB. SPIN trainers were interviewed once, following comple-tion of the workshop. Interviews ranged from 60 to 90 minutes, and were recorded and transcribed verbatim. Interviews with senior immigrants included interpretation by a MCHB representative where necessary. Interviews were semistructured, guided by a list of predetermined topics and questions. Participants were encouraged to speak freely on topics they identified as relevant, how-ever. Grounded theory was used as a framework for data analysis (Charmaz, 2000; Strauss & Corbin, 1998), as issues and themes were drawn from the data. Photographs were used to document the project, to illustrate the emergence of specific themes from narrative and documentary data, and also as ways to disseminate knowledge gained in this research.
Preliminary discussions about the feasibility of this project took place during the summer of 2006 with representatives from the three agencies. Informal inquiries with seniors of different ethnic communi-ties indicated there was sufficient interest for
10 The Faculty of Extension works collaboratively with other faculties and educational institutions, professional and community associations, business organizations, and public agencies. It “promotes responsive university-community engagement through a wide range of innovative, learning-centered programs, and includes inquiry (research and experimentation), and practice (services, products, and events)” (Rajwani, 2009).
project planning to proceed. By early January 2007, both project and research funding had been secured. The pilot was divided into two phases. Phase one (January–February 2007) involved participant recruitment followed by a three-day SPIN training workshop. Phase two (March–September 2007) involved preparation for and implementation of SPIN-Farming. The objectives for the workshop were to provide effective knowledge transfer on SPIN-Farming; to provide opportunities for sharing knowledge among the participants; and to provide an enjoyable learning experience that would motivate the seniors to continue with phase two. The objective for phase two was to provide opportunities for participants to improve their quality of life by addressing the following social determinants of health: income and social status, personal health (physical and mental) practices and coping skills, and food security and nutrition (Public Health Agency of Canada, 2010).
A SPIN-Farming workshop was conducted by Satzewich and Vandersteen over two and a half days in late February 2007 at SAGE in downtown Edmonton. Senior immigrants, aged 55 years and older,11 were recruited by MCHB and SAGE from the various ethnic communities they work with. Recruitment was based on interest, self-assessed physical ability, and immigrant (versus refugee) status at the time of entry. Language interpretation was provided by MCHB brokers. The SPIN trainers developed the workshop to accommodate language translation by simplifying the context and pacing their presentation accordingly. They also relied extensively on visual aids (photographs on poster boards and as part of a PowerPoint presen-tation), and incorporated hands-on demonstrations of tools and equipment. Following the completion of the workshop, those seniors interested in taking part in phase two were identified and provided with additional information regarding the imple-mentation phase over the next few months.
The project was structured as a social enterprise, with senior participants carrying out jobs according 11 SAGE defines seniors as 55 years of age or older.
Journal of Agriculture, Food Systems, and Community Development ISSN: 2152-0801 online www.AgDevJournal.com
Volume 1, Issue 2 / Fall 2010 81
to their interest and abilities, SAGE providing overall coordination, and MCHB brokers providing language support for the seniors, but to a lesser degree than during the workshop. A coordinator with extensive horticultural teaching experience was hired by SAGE to oversee development (securing the land base, purchasing seeds and tools, creating a work plan from seeding to harvest and marketing) and assist the seniors in the daily running of the project. Advertisements for land were placed in local newspapers and on social networking sites. The selection of the four garden-ing sites was based on plot size, access to water, and proximity to seniors’ residences. First plantings took place in May, but plantings continued throughout the summer to maximize diversity, volume, and profits. The final harvest, at the end of September, signaled the end of phase two. Harvested fresh produce was taken home on a regular basis by the seniors and shared with their families and friends, with the coordinator selling the surplus during the summer through informal networks. The coordinator and some of the seniors operated a stall in early September at one farmers’ market event in downtown Edmonton. The Korean seniors also sold bok choy and other ethnic vegetables to a small number of Korean restaurants in Edmonton.
Results and Discussion
Participants Profiles, Motivations, and Concerns Thirteen seniors (five males and eight females) from six different ethnic backgrounds (Argen-tinean, Bosnian, Chilean, Croatian, Korean, and Kurdish) took part in the SPIN training workshop and were involved in the preparation and seeding of the plots (see table 1). The age of participants ranged from 55 to 85, but the highest proportion were in the 65-to-75 age category.
As the season progressed, eight of the original group of seniors (three males and five females) dropped out of the project, but the remaining five (two males and three females) participated on a regular basis. There were a variety of reasons provided by the seniors for withdrawing from the project, none of which stemmed from dissatisfac-
tion with the project. For example, one couple had the opportunity to visit their son in the United States for most of the summer. One woman developed some serious health issues, and the 85-year-old Korean man decided that there were enough people taking part and he felt he was too busy with other activities and responsibilities. Early in the growing season, five new seniors (one male and four females) joined the project. There were three additional seniors who participated on an irregular basis. As far as residency, five of the participants had been in Canada less than 10 years. Eight participants had lived in Canada for up to 29 years, but English language skills remained an issue, particularly for the Korean seniors, who can function fully in the well-established Korean community in Edmonton without having to speak English.
The seniors’ prior experience with gardening and agriculture varied widely, from none at all to that of many years as large-scale field-crop farmers. The seniors identified various reasons for their interest in taking part in this project: “to have fresh vege-tables,” “to learn something and do something that makes me happy,” “to have something to be busy with, I’m bored at home,” “to be in contact with nature again,” and “to socialize…We are not in our country, we don’t have a lot of friends here…We need friends.” A participant who had endured an ethnic war for three years in her homeland was drawn to the multicultural aspect of the project: “You know, it’s in my memory, it was crazy back then [during the war]…this [project] is beautiful because all the different people come together and work together. That is first for me, then the
Table 1: SPIN-Farming Workshop Participants
Ethnic origin of participants
Number and gender of participants
Percentage of total
Korean 5 (4f, 1m) 38.4
Kurdish 3 (m) 23.1
Bosnian 2 (1f, 1m) 15.4
Argentinean 1 (f) 7.7
Chilean 1 (f) 7.7
Croatian 1 (f) 7.7
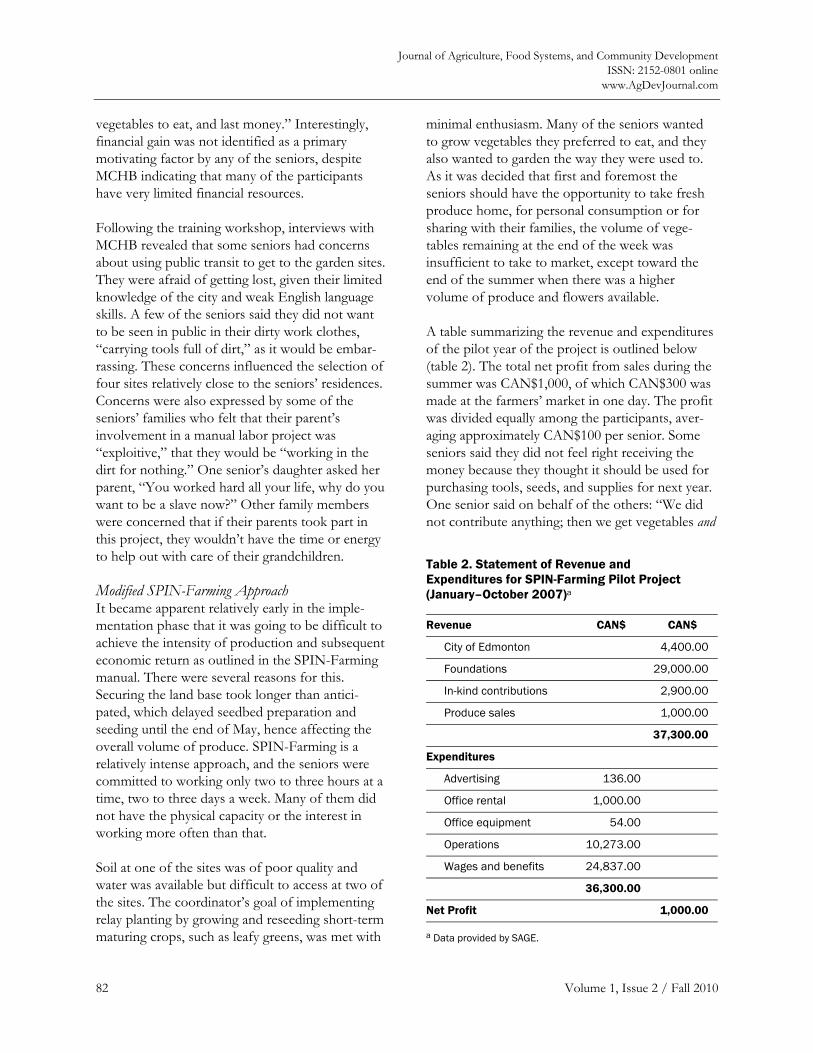
Journal of Agriculture, Food Systems, and Community Development ISSN: 2152-0801 online
www.AgDevJournal.com
82 Volume 1, Issue 2 / Fall 2010
vegetables to eat, and last money.” Interestingly, financial gain was not identified as a primary motivating factor by any of the seniors, despite MCHB indicating that many of the participants have very limited financial resources.
Following the training workshop, interviews with MCHB revealed that some seniors had concerns about using public transit to get to the garden sites. They were afraid of getting lost, given their limited knowledge of the city and weak English language skills. A few of the seniors said they did not want to be seen in public in their dirty work clothes, “carrying tools full of dirt,” as it would be embar-rassing. These concerns influenced the selection of four sites relatively close to the seniors’ residences. Concerns were also expressed by some of the seniors’ families who felt that their parent’s involvement in a manual labor project was “exploitive,” that they would be “working in the dirt for nothing.” One senior’s daughter asked her parent, “You worked hard all your life, why do you want to be a slave now?” Other family members were concerned that if their parents took part in this project, they wouldn’t have the time or energy to help out with care of their grandchildren.
Modified SPIN-Farming Approach It became apparent relatively early in the imple-mentation phase that it was going to be difficult to achieve the intensity of production and subsequent economic return as outlined in the SPIN-Farming manual. There were several reasons for this. Securing the land base took longer than antici-pated, which delayed seedbed preparation and seeding until the end of May, hence affecting the overall volume of produce. SPIN-Farming is a relatively intense approach, and the seniors were committed to working only two to three hours at a time, two to three days a week. Many of them did not have the physical capacity or the interest in working more often than that.
Soil at one of the sites was of poor quality and water was available but difficult to access at two of the sites. The coordinator’s goal of implementing relay planting by growing and reseeding short-term maturing crops, such as leafy greens, was met with
minimal enthusiasm. Many of the seniors wanted to grow vegetables they preferred to eat, and they also wanted to garden the way they were used to. As it was decided that first and foremost the seniors should have the opportunity to take fresh produce home, for personal consumption or for sharing with their families, the volume of vege-tables remaining at the end of the week was insufficient to take to market, except toward the end of the summer when there was a higher volume of produce and flowers available.
A table summarizing the revenue and expenditures of the pilot year of the project is outlined below (table 2). The total net profit from sales during the summer was CAN$1,000, of which CAN$300 was made at the farmers’ market in one day. The profit was divided equally among the participants, aver-aging approximately CAN$100 per senior. Some seniors said they did not feel right receiving the money because they thought it should be used for purchasing tools, seeds, and supplies for next year. One senior said on behalf of the others: “We did not contribute anything; then we get vegetables and
Table 2. Statement of Revenue and Expenditures for SPIN-Farming Pilot Project (January–October 2007)a
Revenue CAN$ CAN$
City of Edmonton 4,400.00
Foundations 29,000.00
In-kind contributions 2,900.00
Produce sales 1,000.00
37,300.00
Expenditures
Advertising 136.00
Office rental 1,000.00
Office equipment 54.00
Operations 10,273.00
Wages and benefits 24,837.00
36,300.00
Net Profit 1,000.00
a Data provided by SAGE.
Journal of Agriculture, Food Systems, and Community Development ISSN: 2152-0801 online www.AgDevJournal.com
Volume 1, Issue 2 / Fall 2010 83
money, which is not fair.” She further explained that she thought of the gardening more as volun-teer work. The MCHB brokers conveyed to the researchers that despite the seniors’ comments, the financial recompense, although very modest, was still beneficial to the seniors with limited financial resources. In addition, the seniors were able to save money that they would have normally spent on purchasing fresh produce, thus making this money available for them to spend in other ways.
When organizers were asked how they felt the project measured up in terms of the concept and the economic potential of SPIN-Farming, one had this response:
I’m kind of disappointed that it didn’t really unfold as a pure SPIN project, because I think the concept is fabulous and we know that many of these people are in dire poverty. There is the potential to generate substantial income for them. But, that being said, it’s up to them, and if that’s not what they want to do, then who am I to say that’s what they should be doing? It’s not all about money; it’s about a lot of other values…Do I think that SPIN is totally dead? No, I don’t. I think it may re-emerge with a certain number of people a year or two years down the road and we will come back to it and we will work it more intensively. I think it’s still embedded within this project, even if it didn’t fully meet that concept this year. We were very successful in spite of not adhering totally to SPIN but nor did we toss it out completely—so it’s a modified SPIN.
The low economic output in the first year of this project could have been anticipated, given that most commercial enterprises take several years to make a profit, depending on a number of factors such as start-up costs, knowledge and skill develop-ment, changes in market demand, and other unforeseen challenges. The economic impact analysis of a five-year SPIN project in Philadelphia details the gradual improvements in economic performance that occurred from year to year (Urban Partners, 2007).
One of the advantages of the SPIN-Farming method is that it can be adapted to different circumstances, with outputs of produce, volume, and financial return varying according to scale and intensity of production. Thus, despite the low economic return in the first year of the project, the opportunity to scale up the profit-making aspect of this senior immigrant project was not lost. At the end of the growing season, the Korean seniors indicated their interests in scaling up their efforts the next year by doubling the size of their land base. Also, by seeding earlier and gardening more intensively, they planned to harvest four crops of Korean vegetables and expand their marketing portfolio by approaching additional Korean restaurants and grocery stores.
Impacts on the Seniors, their Families, and the Wider Community Access to fresh and nutritious foods—for them-selves, their families and friends—was of high importance to the seniors, and they were able to take home a variety of vegetables throughout the summer. The growing and sharing of produce created a sense of achievement and elevated their self esteem; according to MCHB, the seniors “felt happy that they could bring home vegetables” and contribute to their families. MCHB stated that many senior immigrants feel they are a burden to their families as they are not able to contribute financially. Thus, in addition to improving the seniors’ access to fresh food, involvement in the project contributed to elevating their perception of social status within their families as well as their mental well-being. The seniors also shared food and seeds with each other, and exchanged recipes and telephone numbers. As one of the project organizers aptly commented, “There is nothing better than food to build community.”
The seniors began to make their own decisions regarding crop selection during the plantings. The Kurdish participants, for example, were not interested in planting leafy greens, preferring tuberous vegetables, such as potatoes and carrots, which are more common to their diet and also have a long shelf life. The Korean participants initially grew what the coordinator had suggested,
Journal of Agriculture, Food Systems, and Community Development ISSN: 2152-0801 online
www.AgDevJournal.com
84 Volume 1, Issue 2 / Fall 2010
but after the first harvest replaced spinach and lettuce with sesame and bok choy. They were the only subgroup to develop their own market outlets through family, friends, and Korean restaurants. The Koreans’ decision to grow their “own” vegetables and market ethnic vegetables to friends and restaurants was seen by an organizer as “one of the highlights” of the project.
This is what I felt I really wanted to see. It’s not our project, it’s their project. They took it and went with it, they got the restaurant owners involved, they grew what they wanted to grow, they sold…That, to me, is really exciting.
With four members, the Koreans formed the largest and seemingly most close-knit ethnic group. They were also very enthusiastic gardeners and produced the largest volume of produce. They would frequently have potluck picnic lunches at the garden, including the coordinator if she was present. They would also sing together while gardening. Despite these signs of harmony, a conflict arose between three of the members over the allocation of produce. The eldest felt entitled to the best vegetables, even though she worked the least (due to physical limitations), while the young-est had worked the hardest. In Korean culture, age influences social status and rights. The conflict was mediated by their MHCB broker and the project coordinator and was quickly resolved.
Many of the seniors spoke of the enjoyment and satisfaction they derived from watching the plants grow in the gardens, substantiating other research findings that aesthetic pleasure contributes to mental well-being (for example, see Milligan, Gatrell & Bingley, 2004). The relaxation effect of gardening on the seniors was also observed by the coordinator, who said that gardening alongside one of the Korean participants was like “a meditation.” One participant whose spouse had Alzheimer’s commented, “This project, for me, is good, because of the stress [at home]. At the garden I forget my problems.” The merging of physical and mental well-being experienced by one of the farmers is reflected in the following comment, as
translated by one of the MHCB brokers: “When-ever he has time, he goes to the garden and does some work, and it makes him feel alive. It’s a really fresh activity, and he can sweat sometimes and that clears his mind, so that was a good thing.”
The project provided opportunities for a range of physical activities, from fine motor movements (e.g., cleaning, bagging the vegetables) to more strenuous movements (e.g., seeding, weeding, harvesting). Specialized labor-saving tools were available, but some of the seniors felt more comfortable using tools more familiar to them. In the garden site where soil conditions were not optimal, seeding and weeding were more labor-intensive than anticipated. However, none of the seniors identified physical labor as a problem. The MHCB brokers and the coordinator did observe that the seniors’ physical output was limited to two to four hours per day, every other day, for a maximum of three days per week, but varied according to their own schedules.
Organic farming methods were utilized in all the gardens, except for an initial and minimal use of synthetic fertilizer in the Korean garden before the coordinator was aware of it. No other agrochemi-cals were used; for example, a potato-bug infesta-tion was managed manually with the help of a participant’s four-year-old daughter. Food miles were low since the gardens were located close to the farmers’ homes. The gardens also contributed to neighborhood greening, and the ethnic vege-tables grown contributed to a broadening of the diversity of crops within Edmonton.
Not all the participants had previous gardening or agricultural experience, but this was not a barrier to their commitment to or benefits from the project. Individuals without previous experience said they “learned a lot from the project.” For all the seniors, it was an opportunity to reconnect with nature; according to one, “It is to observe how plants grow —you plant it and then the next time when you come, you can see the difference. Each time you go there you see a result of your work.” Learning also occurred around public transit use and increased English language vocabulary. One of the partici-
Journal of Agriculture, Food Systems, and Community Development ISSN: 2152-0801 online www.AgDevJournal.com
Volume 1, Issue 2 / Fall 2010 85
pants made her own illustrated dictionary of the names of vegetables grown and other commonly used words, in both Korean and English. Even though English language skills were still limited by the end of the project, the coordinator and the MCHB brokers noted that the seniors’ confidence to try and speak English had noticeably improved. They also overcame their fears of using public transit and expressed pride in having learned how to navigate the city’s transit system.
A significant turning point in the seniors’ involve-ment was reached when the project started receiv-ing media attention and public interest. This made the seniors feel visible and valued, and it boosted their sense of pride. One of the organizers com-mented: “They wanted to talk to the press and tell their stories; it was really uplifting. They were clearly having fun and very proud of the work that they were doing.” It was also a turning point in terms of acceptance of the seniors’ involvement in the project by their families and communities. One MHBC broker said that when the seniors’ pictures began to appear in the newspapers, the family members who had previously discouraged their parents’ involvement now became very supportive of their continued involvement in the project.
Many immigrant seniors suffer a loss of identity after emigrating (Durst, Abu-Laban, MacLean, Ng, & Northcutt, 2001). Durst et al. underline the importance of cultural connections to successful integration of immigrants. After establishing his garden, a Kurdish refugee exclaimed, “Come see the garden! We brought Kurdistan to Canada!” His statement illustrates one of the important successes of the project: in bringing the participants’ pasts to the present, they created personal identity within a new landscape, making them feel more at home. Cultural connections were also developed during the workshop, as the seniors discussed familiar and unfamiliar vegetables, exchanged names of vege-tables, compared tools, and shared gardening experiences. The coordinator, who is a Canadian and is very interested in other cultures and languages, was seen by some of the farmers as their bridge between Canadian culture and their own ethnic culture.
Seniors’ participation in the project helped to reduce their social isolation; many of them said that they participated in the project in order to make new friends and build social networks. A son of one of the seniors said that if his father were not participating in the garden project, he would be “stuck at home, 24-7.” One farmer said the garden project gave her a reason to “put on new and nice clothes to get out of the house” and tell people what she was doing. A few participants occasion-ally brought family members or friends to the garden. The farmers’ market experience facilitated broader social exchange and other economic op-portunities. One customer complimented a farmer on the scarf she was wearing and that she had made, and the customer requested that the senior make another for her to purchase. The Koreans were very enthusiastic market vendors, clapping their hands and smiling to get customers’ attention. Not all enjoyed the experience, however; as one senior later commented, “I don’t like to sell, but I like to grow.”
Conclusions The results of this research support findings from previous studies that have identified health benefits from gardening for older adults, as well as other research that has shown positive socio-economic impacts from urban agriculture for immigrants. In drawing together these topics, this research inte-grates knowledge emerging from these two areas of study and contributes new knowledge about the application of a novel commercial approach to urban agriculture by senior immigrants. The result-ing impacts from the seniors’ involvement in this initiative were analyzed using a social determinants of health framework, which also includes econom-ic, social, and environmental factors in assessing health and well-being. Beyond the individual level, the effects of this project on the seniors’ families and the wider community were also identified.
Participation in this pilot project generated a number of benefits for the seniors that extended well beyond nutrition and physical activity. By providing opportunities for the seniors to develop urban farming skills, and to grow fresh produce for personal consumption as well as for sharing with
Journal of Agriculture, Food Systems, and Community Development ISSN: 2152-0801 online
www.AgDevJournal.com
86 Volume 1, Issue 2 / Fall 2010
family and friends, this initiative contributed to individual learning and capacity-building, and feel-ings of self-worth. By creating opportunities for senior immigrants to develop and strengthen ties with both host and ethnic communities, social and cultural competencies were expanded, and their visibility and acknowledgement within the commu-nity increased, creating a deeper sense of accep-tance and belonging. Willingness and confidence to engage with others outside of their ethnic commu-nity was observed to increase as the project pro-gressed, which contributed to greater independence and mobility for the seniors within the urban land-scape. Collaborative decision-making and entrepre-neurship were also demonstrated, in the field and in the marketplace, particularly by the Korean seniors.
As relationships began to form and strengthen among the participants and the organizers, links to other social networks, such as those focused on food security, local food, ethnicity, and aging, began to emerge. There were also connections to and positive responses from the general public throughout the pilot year, beginning with the overwhelming number of backyards and commer-cial vacant lots offered for use during the project, to the strong interest and support for the project expressed at the farmers’ market booth. There was significant media interest in the project, with articles in local newspapers as well as coverage on local television and radio stations. This public recognition influenced the shift in attitude and support by the seniors’ family members.
The environmental impacts associated with this project were minimal given the scale of the opera-tion, but can be considered positive in contrast with a conventional industrialized agricultural system. The project was not a major contributor to greenhouse gas emissions, as fossil fuel use was low due to reduced food miles, the use of public transit by the seniors, and the negligible use of agrochemicals. The seniors’ gardens also contri-buted to neighborhood greening. The production of ethnic vegetables and heritage varieties contrib-uted to a greater diversity of food crops grown
within Edmonton, which contributed to develop-ment of the local food system.
The project was not without its challenges and limitations, however. Income generation was low compared to the figures outlined in the SPIN-Farming manual. A number of factors influenced this outcome. First, though the project had a commercial focus, economic gain was not the primary goal of the seniors, whereas social and health criteria were. Second, their physical capacity and other external commitments influenced the amount of time they were willing to dedicate to the project. Third, the overall volume of harvest from the project was impacted by the delay in initial seeding, a result of the unanticipated length of time it took to identify and acquire suitable garden sites. Fourth, the amount of produce available for sale was relatively low throughout most of the summer due to the priority given to the seniors’ and their families’ consumptive needs. Finally, changes made by the seniors to the selection of vegetable crops grown, while being more compatible with their ethnic and cultural preferences, did alter relay planting plans and schedules and subsequently impacted the volume and timing of harvest.
Despite the modest economic performance of the first year of the project, the role of SPIN-Farming in this initiative was assessed by the organizers as being “absolutely important—a catalyst” that launched the project and also provided an ongoing structure and framework. Although the seniors participating in the pilot year were not able and/or interested in achieving the intensity of production and marketing that can be accomplished using the SPIN method, the concept and the practice remained embedded in the project. One reason SPIN-Farming was initially identified as a plausible method for carrying out this pilot was the flexibility it offers in terms of scale and scope. The output, in terms of produce and financial gain, can be scaled up or down depending on the circumstances and goals of the practitioners. In order to scale up the economic viability of the project, while also enhancing other aspects of the project, the organizers identified the following changes and improvements:
Journal of Agriculture, Food Systems, and Community Development ISSN: 2152-0801 online www.AgDevJournal.com
Volume 1, Issue 2 / Fall 2010 87
• Merge and extend SPIN training and preparation for the growing season over a longer period of time during the winter in order to engage the seniors more fully in the preparatory phase and minimize the gap between the training and preparation phase and implementation phase;
• During the preparatory phase, involve the seniors in identifying short- and longer-term crops to be grown and in mapping out the planting schedule, in order to include their cropping preferences and guarantee adequate and continuous harvest throughout the growing season;
• Secure the land base early enough so that planting-bed preparation and seeding can take place in early spring (with timing dependent on suitable climatic conditions);
• Select production site(s) bearing in mind the pros and cons of single-site versus multisite SPIN operations. For example, multisite operations are more difficult to coordinate than a single-site operation, but can have advantages in terms of accessi-bility for the seniors, whereas single-site operations can increase the opportunities for intercultural exchange;
• Secure suitable and adequate infrastructure for processing (e.g., washing, bagging) and cold storage;
• Engage the seniors in developing and coordinating a marketing strategy (e.g., farm-gate, restaurants, farmers’ markets);
• Expand the program to include younger members of immigrant families, either as volunteers or as members of the social enterprise, and/or English-speaking seniors;
• Invite high-school and university students from community-service learning pro-
grams to become involved as volunteers in the project.
Given the growing number of senior immigrants in Canada, there is potential for this type of initiative to be piloted in other communities, and interest in doing so has been expressed by a federal govern-ment agency as well as by social economy organiza-tions in two other provinces. However, it is likely that initiatives established in other contexts would unfold differently. One of the SAGE organizers explained, “It won’t ever be exactly the same as the Edmonton model, because it will be unique to the time and place and people and cultures that are involved, wherever they are. So, this is an experi-ence we’ve had that has taken us to a certain point and will continue on its journey.”
This research was limited to the first year of a pilot project due to availability of funding. A more in-depth assessment of the economic, social, and health impacts of this project could be carried out in a longitudinal study; there are plans to pursue this in the coming year in partnership with a broader range of subject specialists. The results of the research to date suggest that involvement in commercial urban agriculture can contribute to the adaptation and integration of senior immigrants into Canadian society, and contribute to partici-pating seniors’ overall health and well-being. Urban agriculture in general, and SPIN-Farming in particular, create opportunities to generate and integrate a broad range of social, economic, environmental, and health benefits that “transcend the individual and leaves lasting change on others and on the physical and social space of the community” (Bellows et al., 2003, p. 5). The positive impacts of this pilot project have resulted in “Urban Farming for Senior Immigrants” becoming a permanent program at SAGE; in 2009 the city of Edmonton granted long-term land tenure for the program at a centrally located community garden in downtown Edmonton.
Acknowledgements The authors would like to acknowledge and thank the following individuals and agencies who made this pilot project and research possible: the senior
Journal of Agriculture, Food Systems, and Community Development ISSN: 2152-0801 online
www.AgDevJournal.com
88 Volume 1, Issue 2 / Fall 2010
immigrants who took part; Wally Satzewich and Gail Vandersteen of SPIN-Farming; Maureen Elhatton for coordinating this project; the MCHB for providing vital links to ethnic communities and interpretation for the seniors; SAGE for their vision and ongoing support; and Dr. Kyle Whitfield and Dr. Fay Fletcher for their valuable input on this research. The pilot year of this project would not have been possible without the support of the Catherine Donnelly Foundation, the city of Edmonton, and the Faculty of Extension at the University of Alberta.
References Bellows, A. C., Brown, K., & J. Smit. (2003). Health
benefits of urban agriculture. Venice, CA: Community Food Security Coalition. Retrieved from http://foodsecurity.org/UAHealthArticle.pdf
Brown, V. M., Allen, A. C., Dwozan, M., Mercer, I., & Warren, K. (2004). Indoor gardening and older adults: Effects on socialization, activities of daily living, and loneliness. Journal of Gerontological Nursing, 30, 34–42.
Charmaz, K. (2000). Grounded theory: Objectivist and constructivist methods. In N. K. Denzin & Y. S. Lincoln (Eds.), Handbook of qualitative research (pp. 509–535). Thousand Oaks, NY: SAGE Publications.
Cosgrove, S. (2010). Montreal’s community gardening program. Canada’s Office of Urban Agriculture. Retrieved from http://www.cityfarmer.org/ Montreal13.html
Durst, D. (2005). Aging amongst immigrants in Canada: Policy and planning implications. Paper presented at the meeting of the 12th Biennial Canadian Social Welfare Policy Conference on Forging Social Futures, June 17, 2005. Retrieved from http://www.ccsd.ca/cswp/2005/durst.pdf
Durst, D., Abu-Laban, S., MacLean, M., Ng, C., & Northcott, H. (2001). The integration experiences of immigrant seniors. University of Regina, Social Policy Research Unit. Retrieved from http://cat. uregina.ca/spr/assets/documents/writeup.pdf
Hanna, A. K., & Oh, P. (2000). Rethinking urban poverty: A look at community gardens. Bulletin of Science, Technology and Society, 20, 207–216. doi:10.1177/027046760002000308
Milligan, C., Gatrell, A., & Bingley, A. (2004). Cultivating health: Therapeutic landscapes and
older people living in Northern England. Social Science and Medicine, 58, 1781–1793. doi:10.1016/S0277-9536(03)00397-6
Mougeot, L. J. A. (2006). Growing better cities: Urban agriculture for sustainable development. Ottawa, Canada: International Development Research Centre (IDRC).
Patel, I. C. (1991) Gardening’s socio-economic impacts. Journal of Extension 29(4). Retrieved from http://www.joe.org/joe/1991winter/a1.html
Public Health Agency of Canada. (2010). Social determinants of health. Retrieved from http://www.phac-aspc.gc.ca/ph-sp/ determinants/index-eng.php
Raphael, D. (Ed.). (2004). Social determinants of health: Canadian perspectives. Toronto, Ontario: Canadian Scholar’s Press Inc.
Rajwani, S. (2009, August 27). Extension faculty council orientation. Faculty of Extension, University of Alberta. Retrieved from http://www3.extension. ualberta.ca/faculty/orientation.pdf
Redwood, M. (2009). Agriculture in urban planning: Generating livelihoods and food security. Ottawa, Ontario: International Development Research Centre.
Satzewich, W., & Christensen. R. (2005). SPIN-Farming®: How to Grow Commercially on Under an Acre. Self-published.
Service Canada. (2010). A reference guide to old age security and Canada pension plans. Retrieved from http://www.servicecanada.gc.ca/eng/isp/pub/overview/refguide6.shtml
Statistics Canada. (2006). A portrait of seniors in Canada: Chapter 7. Immigrant seniors. Retrieved from http://www.statcan.ca/english/freepub/89-519-XIE/2006001/immigrant.htm
Stebbins, R. (2001). Exploratory research in the social sciences. Qualitative Research Methods Series 48. London: SAGE Publications.
Strauss, A., & Corbin, J. (1998). Basics of qualitative research: Techniques and procedures for developing grounded theory. London: SAGE Publications.
UN-Habitat. (2004). State of the world’s cities 2004/ 2005. Retrieved from http://ww2.unhabitat.org/ mediacentre/sowckit.asp
Urban Partners. (2007). Farming in Philadelphia: Feasibility analysis and next steps. A report prepared for: Institute for Innovations in Local

Journal of Agriculture, Food Systems, and Community Development ISSN: 2152-0801 online www.AgDevJournal.com
Volume 1, Issue 2 / Fall 2010 89
Farming. Retrieved from http://www.spin farming.com
Valtonen, K. (2004). From the margin to the mainstream: Conceptualizing refugee settlement processes. Journal of Refugee Studies, 17: 70–96.
doi:10.1093/jrs/17.1.70 Yin, Robert. (2009). Case study research design and
methods. 4th edition. Applied Social Research Methods Series. Vol. 5. London: SAGE Publications.

Journal of Agriculture, Food Systems, and Community Development ISSN: 2152-0801 online
www.AgDevJournal.com
90 Volume 1, Issue 2 / Fall 2010
Journal of Agriculture, Food Systems, and Community Development ISSN: 2152-0801 online www.AgDevJournal.com
Volume 1, Issue 2 / Fall 2010 91
Creating a legal framework for urban agriculture: Lessons from Flint, Michigan Megan Masson-Minock, AICPa Deirdra Stockmannb
Submitted 1 July 2010 / Accepted 16 September 2010/ Published online 30 November 2010 Citation: Masson-Minock, M., & Stockmann, D. (2010, Fall). Creating a legal framework for urban agriculture: Lessons from Flint, Michigan. Journal of Agriculture, Food Systems, and Community Development, 1(2): 91–104. doi:10.5304/jafscd.2010.012.007 Copyright © 2010 by New Leaf Associates, Inc.
Abstract Urban agriculture is not new to Flint, Michigan. Like most cities around the world, Flint has been home to back yard and small community gardens throughout its history. Today, over 150 churches, shelters, and neighborhood block clubs grow vegetables in the city. As the most recent wave of interest in urban agriculture swelled in Flint, how-ever, many enterprising gardeners encountered city ordinances that barred certain activities and failed to define land uses common for small-scale food production. As a result, advocates pressed the Flint Planning Commission to change codes in order to enable a wider range of agricultural activities within the city limits. This case study highlights how the legal framework in Flint discouraged efforts to expand the scope of community gardening and how local nongovernmental organizations inter-
vened, opening a vibrant public dialogue about urban agriculture. We discuss the importance of public input and education in efforts to amend city policies to support a range of urban agricultural activities, outline the strategies used in Flint, and identify some of the challenges that arose in this process.
Keywords urban agriculture, community food system planning, urban planning, zoning
Introduction Urban agriculture is not new to Flint, Michigan. Like most cities around the world, Flint has been home to back yard and small community gardens throughout its history. In recent years, as vacant lots became available, people have expanded their yards and gardens. Today, countless individual residents and over 150 churches, shelters, and neighborhood block clubs grow vegetables in the city.
As the most recent wave of interest in urban agriculture has swelled in Flint, however, many
a Planner, ENP & Associates, P.O. Box 131095, Ann Arbor, Michigan, 48113 USA, [email protected]
b corresponding author: PhD Candidate, Taubman College of Architecture and Urban Planning, University of Michigan, 2000 Bonisteel Boulevard, Ann Arbor, MI 48109 USA, [email protected]
Journal of Agriculture, Food Systems, and Community Development ISSN: 2152-0801 online
www.AgDevJournal.com
92 Volume 1, Issue 2 / Fall 2010
gardeners and potential agrepreneurs1 encountered city ordinances that barred certain activities and failed to define land uses common in small-scale food production. As a result, advocates pressed the Flint Planning Commission to consider several changes to the codes that would explicitly enable a wider range of agricultural activities within the city limits. This led to a vibrant public dialogue that highlighted competing ideas of what a city is and what types of land uses and activities are appropri-ate within it. After a year, only some of the issues were resolved; nevertheless, there was nearly unanimous agreement that food system issues would figure into future planning.
In this case study we examine Flint’s foray into urban agriculture planning. We begin with a brief discussion of the literature and previous research that provides a context for emerging food system planning in Flint and other U.S. cities. Then we describe how urban agriculture came to be a policy issue in Flint, identify the legal impediments to expanded urban agriculture efforts in the city, and chronicle the attempt to remove some of these impediments. In our discussion, we consider the critical, if initially unanticipated, role that the public played in the process and offer recommendations for other cities, planners, and advocates based on the Flint experience.
Food Systems and Urban Planning While food concerns were a fringe issue 10 years ago, urban planning scholars and practitioners increasingly appreciate the role that local and regional-level planning can play in food policy-making and systems change (American Planning Association, 2007). In recent years, scholars have identified myriad ways in which the food system affects and is affected by the social and infra-structure systems that define the more traditional scope of urban planning, including transportation, urban design, economic development, and environmental conservation (Campbell, 2004;
1 Hewitt (2009) uses this term to refer to a new wave of entrepreneurs finding a niche in the growing market for local, small-scale, and sustainable food production.
Pothukuchi & Kaufman, 1999; Pothukuchi & Kaufman, 2000; Wekerle, 2004).
As a large sector of the economy, the food system ―including farms, processing facilities, distribution centers, and retailers―comprises a major land use and provides many jobs in cities, suburbs, and rural areas alike (Pothukuchi & Kaufman, 1999). All stages of the food system consume energy and other resources, and many result in pollutants released into the air, soil, and water (Heller & Keoleian, 2003). Because nearly all of the food consumed in the U.S. is moved at least some distance from farm to point of sale, transportation networks and policy interact with the food system on a daily basis and affect access to food (Pothukuchi & Wallace, 2009). Perhaps most important, nourishing food is necessary for good health, and insufficient access to nutritious, culturally appropriate food has been linked to both hunger and obesity (Morland, Wing, & Roux, 2002; Morland, Wing, Roux, & Poole, 2002). The American Planning Association’s Policy Guide on Community and Regional Food Planning 2 (2007) concisely summarizes recent research on these relationships and generates recommendations for planning practice and policy.
While cities throughout the country experience the impact of the food system on public health and social well-being, the challenges are often severe in communities with high levels of unemployment and poverty, poor public transportation systems, and the out-migration and vacant land associated with de-industrialization. A growing body of scholarly work and practice focuses on how community gardening and other forms of urban agriculture might help address these issues by providing fresh food, employment, and community green space (e.g., Bingen, Colasanti, Fitzpatrick, & Nault, 2009; Brown & Jameton, 2000; Kaufman & Bailkey, 2000).3 Much has been published about
2 http://www.planning.org/policy/guides/adopted/food.htm 3 Numerous master’s projects and exploratory committees have investigated the characteristics and potential of urban agriculture in cities throughout the U.S. See, for instance,
Journal of Agriculture, Food Systems, and Community Development ISSN: 2152-0801 online www.AgDevJournal.com
Volume 1, Issue 2 / Fall 2010 93
urban agriculture in the Global South, but the literature lags behind the growing movement in North America. We have few examples in the scientific literature that describe the practical challenges and social dynamics of planning for urban agriculture in the U.S. generally and in its old industrial core cities in particular. There is a great deal to learn about how these processes unfold in practice and how different types of policies work in different communities.
Data and Methods This case study of emerging urban agriculture planning in Flint, Michigan, combines participant observation and reflection with observation (by a nonparticipant) and qualitative research. Analysis of Flint’s city codes and of other cities’ relevant plans and policies was conducted by one of the authors as part of the planning process. The authors, who are independent researchers, later conducted semistructured, in-depth interviews with participants and observers. Interviewees included members of the Flint Planning Commission, the Flint zoning administrator, representatives of nongovernmental organizations, urban gardeners, and other Flint residents. Detailed interview notes were open-coded for emergent themes. Direct observation and review of meeting minutes, reports, newspaper articles, and nongovernmental organizations’ publications supplemented and validated the interview data and practitioner reflection.
Background on Flint Flint, Michigan, is a modest Great Lakes city that lays bare the social and economic repercussions of the rise and fall of U.S. manufacturing in the
twentieth century. Located on the Flint River in central Michigan, the city anchors the “thumb” region of the state—a large, rural peninsula where sugar beet, dry bean, and wheat fields run to the shores of Lake Huron. As the birthplace and home of General Motors, Flint became the “Vehicle City” in the early twentieth century. Flint grew steadily to a population of almost 200,000 in 1960
Balmer et al. (2005), Bickerdike et al. (2010) and Felsing (2002).
(U.S. Census Bureau, 1990), but the city soon began losing manufacturing jobs to the suburbs, and later to overseas countries (Highsmith, 2009).
Today, the Flint population hovers just over 100,000, less than half the number of people the city was planned for in the 1960s. The depopula-tion has resulted in about 11,000 vacant properties within the city. The median household income in 2008 was $28,584, just over half the U.S. median according to the American Community Survey (U.S. Census Bureau, 2009). In the face of a shrink-ing tax base, local government has cut back city services. Consistency in leadership has been a challenge as well; five city administrations cycled through City Hall between 2002 and 2009.
Many Hoops To Go Through In 2007, a small youth development organization in Flint, Urban Community Youth Outreach (UCYO), received a grant to erect a hoop house so that the young people in the program could raise seedlings for their established community garden. Using the hoop house, which consists of curved metal “hoops” covered in plastic, the organization could grow vegetables most of the winter without an additional heat source. Because the Michigan growing season is limited, this technology has increased in popularity among large-scale commer-cial growers and small gardening organizations alike that seek to extend or intensify production (Conner, Montri, Montri, & Hamm, 2009).
The Genesee County Land Bank helped UCYO secure six formerly vacant lots in Flint across the street from the UCYO garden. With the land prepared, the materials purchased and the ground-breaking set, the director of the program went to acquire a building permit from the city. To her surprise, she was told that her plans required a full site plan review, a level of scrutiny for which she was not prepared. Hoop houses were not defined in the city zoning ordinance or the state building code, and officials considered the structure to be permanent because it was intended to stand longer than 180 days. Based on existing policy, plans in which a hoop house is the only permanent structure on a parcel must go through site plan
Journal of Agriculture, Food Systems, and Community Development ISSN: 2152-0801 online
www.AgDevJournal.com
94 Volume 1, Issue 2 / Fall 2010
review, a formal administrative process to verify that building plans comply with the zoning ordinance. The designation as a “permanent structure” necessitated professional architectural drawings and calculations for wind and snow loads.
Site plan review and the building permit process took more than two years, much longer than expected and than is usual for approval of a building in Flint or surrounding communities. After administrative review, the city of Flint requires the planning commission to review and approve all site plans during one of their bimonthly meetings. Because hoop houses were not defined in the state building code and the city had not reviewed an application for a similar structure such as a greenhouse in decades, the building safety department had limited information about the safety of the hoop house structure and thus required additional time and review. During this time, the Ruth Mott Foundation funded the construction of a hoop house for a youth group in Mount Morris Township, just to the north of the Flint River; in contrast, the approval process took only a few months.
Policy Impediments to Urban Agriculture in Flint The Flint zoning ordinance has not been updated for over 20 years. It contains inflexible site plan review requirements and procedures and lacks mechanisms for waivers and exceptions common in more recently developed zoning codes.4 With only a few specific exceptions, all permanent structures proposed as the primary or principal use on a parcel require site plan approval by the Flint Planning Commission. Drawings must include a long list of items such as building elevations, which can be waived only by the planning commission.
The zoning ordinance allows “customary agricul-tural uses including noncommercial nurseries and greenhouses, but expressly excluding the keeping
4 Innovations and flexibility in other codes include a sketch plan option where sealed drawings are not needed, basic administrative review, waiver of requirements by staff, and a planned unit development option for projects that offer public benefit but do meet the letter of the ordinance.
of farm animals”5 in its residential and commercial zones. Neither “noncommercial nursery” nor “customary agricultural uses,” however, are defined in the ordinance. As a result, the planning commis-sion had to deliberate whether the UCYO hoop house was a noncommercial nursery. The ordi-nance also did not specify standards for parking, screening, and lighting for agricultural uses, which the planning commission had to debate and define.
Even after the hoop house was erected, the city ordinances caused obstacles. Since the hoop house was not a residence, the city would not pick up the trash, and because no one resided at the address, the municipal water system could not be used. Until the organization raised the funds to drill a well, youth group members brought water to the site and carried garbage away.
Changing the Legal Framework in Flint Urban Community Youth Outreach was not the only group interested in expanding its gardening efforts. In 2007 and 2008, the Genesee County Land Bank and the Ruth Mott Foundation saw a marked increase in requests for land and funding for urban agriculture projects in Flint. Both organizations saw a need for a more transparent, navigable approval process and fewer barriers to urban agricultural uses in the city. In fall 2008, the Ruth Mott Foundation paid ENP & Associates (including author Masson-Minock) to provide professional planning services to the City of Flint Planning Commission to update city ordinances to allow for, if not encourage, urban agriculture. The Genesee County Land Bank served as the super-visor of ENP, as the funding was part of a larger Ruth Mott Foundation grant given to the Land Bank for stabilization of vacant land. An update to Flint’s master plan was not considered, due to the political climate and limited budget.
ENP began with a diagnostic review of the city ordinances to identify challenges to urban agri-culture. Unaware of an existing template for such a review, ENP developed a process modeled in part 5 Flint Zoning Ordinance, Article II. Chapter 50, A-1, § 50-17, page 26.
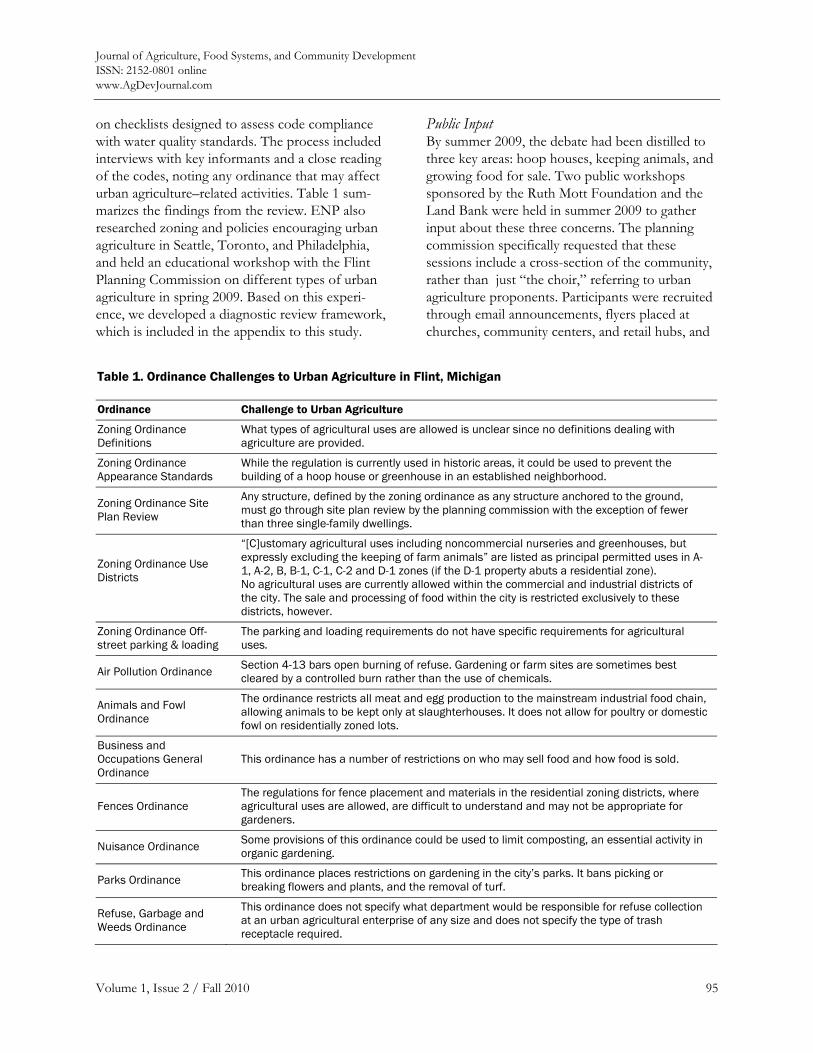
Journal of Agriculture, Food Systems, and Community Development ISSN: 2152-0801 online www.AgDevJournal.com
Volume 1, Issue 2 / Fall 2010 95
on checklists designed to assess code compliance with water quality standards. The process included interviews with key informants and a close reading of the codes, noting any ordinance that may affect urban agriculture–related activities. Table 1 sum-marizes the findings from the review. ENP also researched zoning and policies encouraging urban agriculture in Seattle, Toronto, and Philadelphia, and held an educational workshop with the Flint Planning Commission on different types of urban agriculture in spring 2009. Based on this experi-ence, we developed a diagnostic review framework, which is included in the appendix to this study.
Public Input By summer 2009, the debate had been distilled to three key areas: hoop houses, keeping animals, and growing food for sale. Two public workshops sponsored by the Ruth Mott Foundation and the Land Bank were held in summer 2009 to gather input about these three concerns. The planning commission specifically requested that these sessions include a cross-section of the community, rather than just “the choir,” referring to urban agriculture proponents. Participants were recruited through email announcements, flyers placed at churches, community centers, and retail hubs, and
Table 1. Ordinance Challenges to Urban Agriculture in Flint, Michigan
Ordinance Challenge to Urban Agriculture
Zoning Ordinance Definitions
What types of agricultural uses are allowed is unclear since no definitions dealing with agriculture are provided.
Zoning Ordinance Appearance Standards
While the regulation is currently used in historic areas, it could be used to prevent the building of a hoop house or greenhouse in an established neighborhood.
Zoning Ordinance Site Plan Review
Any structure, defined by the zoning ordinance as any structure anchored to the ground, must go through site plan review by the planning commission with the exception of fewer than three single-family dwellings.
Zoning Ordinance Use Districts
“[C]ustomary agricultural uses including noncommercial nurseries and greenhouses, but expressly excluding the keeping of farm animals” are listed as principal permitted uses in A-1, A-2, B, B-1, C-1, C-2 and D-1 zones (if the D-1 property abuts a residential zone). No agricultural uses are currently allowed within the commercial and industrial districts of the city. The sale and processing of food within the city is restricted exclusively to these districts, however.
Zoning Ordinance Off-street parking & loading
The parking and loading requirements do not have specific requirements for agricultural uses.
Air Pollution Ordinance Section 4-13 bars open burning of refuse. Gardening or farm sites are sometimes best cleared by a controlled burn rather than the use of chemicals.
Animals and Fowl Ordinance
The ordinance restricts all meat and egg production to the mainstream industrial food chain, allowing animals to be kept only at slaughterhouses. It does not allow for poultry or domestic fowl on residentially zoned lots.
Business and Occupations General Ordinance
This ordinance has a number of restrictions on who may sell food and how food is sold.
Fences Ordinance The regulations for fence placement and materials in the residential zoning districts, where agricultural uses are allowed, are difficult to understand and may not be appropriate for gardeners.
Nuisance Ordinance Some provisions of this ordinance could be used to limit composting, an essential activity in organic gardening.
Parks Ordinance This ordinance places restrictions on gardening in the city’s parks. It bans picking or breaking flowers and plants, and the removal of turf.
Refuse, Garbage and Weeds Ordinance
This ordinance does not specify what department would be responsible for refuse collection at an urban agricultural enterprise of any size and does not specify the type of trash receptacle required.
Journal of Agriculture, Food Systems, and Community Development ISSN: 2152-0801 online
www.AgDevJournal.com
96 Volume 1, Issue 2 / Fall 2010
local media, including television, radio, and the Flint Journal mentioning the events. The workshops had a high turnout for community meetings, with about 162 people attending. While most of the planning commissioners considered the meetings to be sufficiently representative, a few did not believe that the workshop results reflected their ward’s interests. Although demographic data about the 162 participants was not made available, interviewees reported that a mix of Flint residents and residents of neighboring townships attended. Some commissioners noted that few if any residents of their ward participated, and that the demographic make-up of the meetings did not mirror that of the city overall.
At each workshop, the UCYO director and other local growers presented their experiences growing food in Flint. Participants received information packets that included detailed descriptions of each of the three issues and how they are regulated in other communities. Small groups, randomly assigned, discussed how hoop houses, keeping animals, and growing food for sale might positively or negatively affect their neighborhood, and shared their concerns and thoughts. Each small group had a facilitator to encourage discussion and a note-taker to document feedback. ENP compiled the information into a comprehensive report that served as a resource for the planning commission when discussing whether and how to change city ordinances.
Hoop Houses By an overwhelming margin the workshop parti-cipants felt that hoop houses should be allowed in Flint, including in residential areas, and most felt the approval process should be simplified. Parti-cipants did express concern, however, that the hoop houses should be maintained and secured from vandalism and squatting. A few groups proposed that the surrounding neighbors should be notified and their input sought when a hoop house was proposed.
When discussing regulations, the planning commis-sion considered adding a definition of a hoop
house to the zoning ordinance, specifying the structure as a conditional use, or special land use, in residential and commercial areas. While these amendments would clarify the identity of hoop houses, designation as a conditional use would add processing time, costs, and risks for any group proposing a hoop house, as a proposed conditional use requires a higher level of scrutiny.
Instead of changing the zoning ordinance, the planning commission agreed to change its admini-strative rules to allow a streamlined approval process for hoop houses, as long as the plans were based on three hoop house prototypes under development by the Michigan State University Department of Horticulture and the Michigan State University Student Organic Farm.6 Preapproved hoop house designs will eliminate the cost of producing sealed and stamped drawings for each proposal. At the time of this writing, the proto-types were under review.
Keeping of Animals Participants in the public workshop sessions were asked to consider whether bees, goats, and chickens should be allowed in Flint. Participants were divided on this issue. Many of the 24 small groups supported keeping of animals, especially chickens and bees. Four of the groups decided that animals should not be allowed. Participants voiced concerns about noise and odors associated with chickens and goats, safety (particularly of children with respect to bee stings and pecking hens), and the potential for cruelty to animals. Consistent with support for other types of urban agriculture, those in support of keeping small animals in the city cited health benefits and personal and community empowerment.
The planning commission studied ordinances allowing for animals in other cities, specifically Ann Arbor (Michigan), Cleveland and Seattle. All ordinances limit the number of animals, establish where animals can be kept, and how far structures
6 Michigan State Department of Horticulture website: http://www.hrt.msu.edu; Michigan State Student Organic Farm website: http://www.msuorganicfarm.com
Journal of Agriculture, Food Systems, and Community Development ISSN: 2152-0801 online www.AgDevJournal.com
Volume 1, Issue 2 / Fall 2010 97
and pens must be from property lines and adjacent houses. Some cities require licenses to be renewed on an annual or biannual basis. Ann Arbor requires a petition from all neighboring property owners giving their permission for the applicant to keep chickens.
The planning commission decided to allow only chickens. They were concerned about bee stings, and ruled that goats were not appropriate in Flint due to potential odor problems and the fencing needed. The commission recommended to the city council an ordinance that would allow up to four chickens in a coop in residential back yards if all adjacent property owners gave permission. The proposed ordinance requires the applicant to have completed a training course on keeping chickens, which a new collaborative called Edible Flint may develop and implement. The Flint City Council debated the chicken ordinance in spring 2010 and sent it to a council committee for further study.
Growing Food for Sale The workshop participants generally supported growing food for sale, viewing urban farming as a source of jobs, food, and education. Their con-cerns focused on items regulated by state and federal laws that override local legislation; food safety and soil quality, which are monitored by the USDA; the use of pesticides; and the locations where the food produced can be sold. Both of the latter items are regulated by the Michigan Right to Farm Act.
From discussions among the commissioners and the public there emerged a distinction between gardening and urban agriculture. Gardening refer-red to the widely accepted practice of growing vegetables in back yards and vacant lots, by residents, block groups, and youth groups. Urban agriculture or city farming was perceived as a for-profit venture that could jeopardize the redevelop-ment of neighborhoods, if not carefully located and regulated.
The planning commission decided not to add definitions or change allowed uses dealing with agriculture, largely due to the Michigan Right to
Farm Act. This state law dictates that a farm operation shall not be found to be a nuisance if it conforms to Generally Accepted Agricultural Management Practices (GAAMPs) determined by the Michigan Department of Agriculture. Recent court cases have treated urban gardens and green-houses the same as rural farm operations under the Right to Farm Act.7 The Flint Planning Commis-sion did not want to risk allowing land uses associ-ated with nuisances regulated by the state. Since gardening efforts had developed within the current legal framework, the planning commission recom-mended minor adjustments to the existing regula-tions for yard waste and trash pick-up in order to smooth the way for gardening, but not to under-take a more comprehensive revision as advocates had originally hoped for in the beginning of this year-long process.
Lessons from Flint Given the growing interest in small-scale food production in Flint, two nongovernmental organizations―Genesee County Land Bank and the Ruth Mott Foundation―working with the ENP & Associates planning firm proposed several changes to the zoning ordinance. Two public input sessions engaged over 160 people and provided critical feedback for the policymakers. The plan-ning commission spent countless hours learning about urban gardening and farming, hearing testimony from community members, and debating the proposed changes.
While sympathetic to the needs and interests of residents who garden, and willing to make minor changes to address their needs, the planning commission felt that more extensive public input and mapping was needed to ascertain where and how urban agriculture should be allowed in Flint. The Flint Planning Commission, like most planning commissions, normally addresses site-specific planning and zoning issues. Other than master planning, it is not usually engaged in
7 Woodland Hills Homeowners Assn of Thetford Twp v. Thetford Twp and Roger Allison (2008), retrieved from http://www.michbar.org/opinions/appeals/2008/052008/39418.pdf
Journal of Agriculture, Food Systems, and Community Development ISSN: 2152-0801 online
www.AgDevJournal.com
98 Volume 1, Issue 2 / Fall 2010
citywide policy-making. With no language in the city’s master plan validating the proposed changes to the city ordinances to support urban agriculture, the commission chose to accept only some of the proposed changes and to leave several restrictions in place.
Recommendations Though de-industrialization is extreme in Flint, the city is not alone in the experience of depopulation and financial distress associated with the loss of major economic sectors. Today nearly all cities are struggling with the effects of the recession and the recent housing foreclosure crisis. As municipalities strive to adapt to this turbulent social and econ-omic environment, and as the urban agriculture movement continues to grow, more cities may feel public pressure to rethink the role of food production in urban areas.
While the specific policies, actors, and debates reflected the legal and political climate in Flint, the city’s foray into planning and policy-making for urban agriculture is an experience from which others might learn. While we do not profess that a single case is sufficient for a full understanding of the issues and conflicts that characterize local urban agriculture policy-making, we offer the following interrelated propositions based on the Flint experience.
• Assess whether policy changes are necessary. Planners and advocates may adapt and apply the Urban Agriculture Ordinance Assessment provided in the appendix to analyze the extent to which local policies support or discourage urban agriculture and other food-system activities. In some communities, urban agriculture uses may be allowed under existing policy; therefore, efforts to educate planning, zoning, and building administrators may be the most pressing need.
• Provide for public education and input. Most people are cautious about allowing
unfamiliar activities in their neighborhoods and communities. Until residents feel fully informed about what “urban agriculture” means for their block or ward or city, they are unlikely to support it.
• If policy changes are deemed necessary, an inclusive and community-based approach is essential for giving validity and legiti-macy to proposed revisions or plans. Policymakers want to hear from a broad cross-section of the public. Proposed policies should reflect, as well as possible, the wishes and concerns of the communi-ty. Proposed new or amended policies will require numerous edits and amendments to address resident concerns, such as how to regulate chicken keeping.
• Policy change takes time. While some cities may pass enabling policy for urban agriculture relatively quickly, the process may take many months or years in cities like Flint in which there are varying degrees of awareness about urban food production and many different opinions about what types of activities are appro-priate in the urban context. Advocates, funding agencies, and planning depart-ments should prepare for thorough assessment, ongoing public education, and extensive, authentic community input.
Further research is needed to test and refine these propositions. From our work, we have learned that in developing new policies, local officials prefer to learn from cases with which they identify and in which they can see elements of their own com-munity. As more municipalities engage in planning and policy change around food production and other community food system components, we will need in-depth case studies from a wide range of cities as well as larger and comparative studies engaging multiple research methods. We invite practitioners, advocates, and scholars to apply the diagnostic tool we created based on our experience and research in Flint. This resource needs to be
Journal of Agriculture, Food Systems, and Community Development ISSN: 2152-0801 online www.AgDevJournal.com
Volume 1, Issue 2 / Fall 2010 99
honed and validated through testing in a range of municipal environments.
Reflecting on the process, some project partners felt that a more comprehensive planning process might have yielded different results, had time and resources allowed. Nevertheless, the conversation about urban agriculture planning and policy in Flint continues. At public meetings, many residents are still debating issues such as raising poultry and growing food for sale. A new farm is underway in partnership with the city parks department. Plan-ning commissioners, among others, expect urban agriculture to be addressed in the next master plan, reflecting public interest and demand. To many advocates of urban agriculture and public partici-pation in planning, this continued dialogue is a success unto itself and a critical step toward reshaping our cities to support food system change.
Disclaimer It should be noted that as an employee of ENP & Associates, coauthor Megan Masson-Minock worked with the City of Flint Planning Commis-sion on the issues described in this paper. Her work was completed before writing this paper. She was not compensated in any way for writing this piece and has no financial interest at stake.
References American Planning Association. (2007). Policy guide on
community and regional food planning. Retrieved from http://www.bracrtf.com/documents/APAPolicyGuide-CommunityandRegionalFoodPlanning.pdf
Balmer, K., Gill, J., Kaplinger, H., Miller, J., Peterson, M., Rhoads, A., …Wall, T. (2005). The diggable city: Making urban agriculture a planning priority. Nohad A. Toulan School of Urban Studies and Planning. Retrieved from http://www.portlandonline.com/ shared/cfm/image.cfm?id=122587
Bickerdike, C., DiLisio, C., Haskin, J., McCullagh, M., & Pierce-Quinonez, M. (2010). From factories to fresh food: Planning for urban agriculture in Somerville. Field projects, Tufts Department of Urban and Environmental Policy and Planning. Retrieved from http://www.ase.tufts.edu/uep/Degrees/field_ project_reports/2010/Team_5_Final_Report.pdf
Bingen, J., Colasanti, K., Fitzpatrick, M., & Nault, K. (2009). Urban agriculture. In L. Phoenix (Ed.), Critical food issues: Problems and state-of-the-art solutions worldwide (pp. 109–122). Santa Barbara, CA: ABC-CLIO, LLC.
Brown, K. & Jameton, A. (2000). Public health implications of urban agriculture. Journal of Public Health Policy, 21(1), 20–39. doi:10.2307/3343472
Campbell, M. C. (2004). Building a common table: The role for planning in community food systems. Journal of Planning Education and Research, 23(4), 341–55. doi:10.1177/0739456X04264916
City of Flint Zoning Ordinance. Article II. Chapter 50: Zoning, A-1: Single-Family Low Density District, § 50-17: Principle Permitted Uses, p. 26. Flint, MI. Retrieved from http://www.ci.flint.mi.us/Planning/ ZONING_ORD.pdf
Conner, D., Montri, A. D., Montri, D. N., & Hamm, M. W. (2009). Consumer demand for local produce at extended season farmers’ markets: Guiding farmer marketing strategies. Renewable Agriculture and Food Systems, 24(4), 251–259. doi:10.1017/S1742170509990044
Felsing, R. D. (2002). The pros and cons of zoning for community gardens. Unpublished manuscript, The Madison Ad-Hoc Committee on Community Gardens, Department of Urban and Regional Planning, University of Wisconsin-Madison.
Heller, M. & Keoleian, G. (2003). Assessing the sustainability of the US food system: A life cycle perspective. Agricultural Systems, 76(3), 1001–1041. doi:10.1016/S0308-521X(02)00027-6
Hewitt, B. (2009). The town that food saved: How one community found vitality in local food. New York, NY: Rodale.
Highsmith, A. (2009). Demolition means progress: Urban renewal, local politics, and state-sanctioned ghetto formation in Flint, Michigan. Journal of Urban History, 35(3), 348–368. doi:10.1177/0096144208330403
Hodgson, K. (2009). Where food planning and health intersect. Planning, 75(8), August/September, 9–13.
Kaufman, J. & Bailkey, M. (2000). Farming inside cities: Entrepreneurial urban agriculture in the United States. Working paper, Lincoln Institute of Land Policy, Cambridge, MA. Retrieved from http://www.urbantilth.org/wp-content/uploads/ 2008/10/farminginsidecities.pdf
Journal of Agriculture, Food Systems, and Community Development ISSN: 2152-0801 online
www.AgDevJournal.com
100 Volume 1, Issue 2 / Fall 2010
Morland, K., Wing, S. B., & Roux, A. D. (2002). The contextual effect of the local food environment on residents’ diets: The Atherosclerosis Risk in Communities study. American Journal of Public Health, 92(11), 1761–1767. doi:10.2105/AJPH.92.11.1761
Morland, K., Wing S. B., Roux A. D., & Poole, C. (2002). Neighborhood characteristics associated with the location of food stores and food service places. American Journal of Preventive Medicine, 22(1), 23–29.
Pothukuchi, K., & Kaufman, J. (1999). Placing the food system on the urban agenda: The role of municipal institutions in food systems planning. Agriculture and Human Values, 16, 213–24. doi:10.1023/A:1007558805953
Pothukuchi, K., & Kaufman, J. (2000). The food system: A stranger to the planning field. Journal of the American Planning Association, 66(2), 113–24. doi:10.1080/01944360008976093
Pothukuchi, K. & Wallace, R. (2009). Sustainable food systems: Perspectives on transportation policy. In Malkefzali, S. (Ed.), Healthy, Equitable Transportation Policy: Recommendations and Research (pp. 113–130). Oakland, CA: PolicyLink.
Shaw, L. (2009, July 7). Flint to consider ordinance changes to enhance urban agriculture. The Flint Journal. Retrieved from http://blog.mlive.com/ get-healthy-in-genesee/2009/07/flint_to_ consider_ordinance_ch.html
U.S. Census Bureau. (1990). 1990 Census of Population and Housing: Population and housing unit counts. CPH-2-1. Retrieved from www.census.gov/prod/ cen1990/cph2/cph-2-1-1.pdf
U.S. Census Bureau. (2009). Median household income for states: 2007 and 2008 American Community Surveys. Retrieved from http://www.census.gov/ prod/2009pubs/acsbr08-2.pdf
Wekerle, G. (2004). Food justice movements: Policy, planning, and networks. Journal of Planning Education and Research, 23(4), 378–386. doi:10.1177/0739456X04264886
Woodland Hills Homeowners Association of Thetford Township. v. Thetford Township and Roger Allison, No. 275315 Mich. Ct. of Appeals (2008), aff’d, 05-081537-NZ (Genesee Cir. Ct.). Retrieved from http://www.michbar.org/opinions/ appeals/2008/052008/39418.pdf
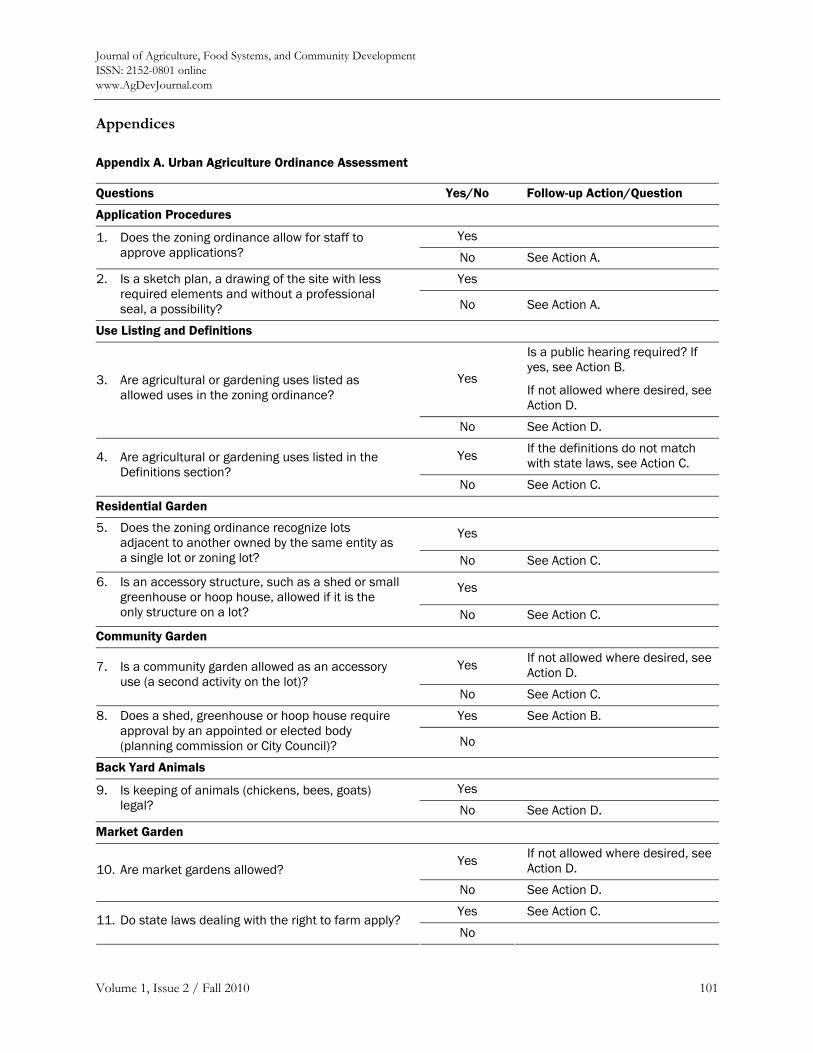
Journal of Agriculture, Food Systems, and Community Development ISSN: 2152-0801 online www.AgDevJournal.com
Volume 1, Issue 2 / Fall 2010 101
Appendices
Appendix A. Urban Agriculture Ordinance Assessment
Questions Yes/No Follow-up Action/Question
Application Procedures
Yes 1. Does the zoning ordinance allow for staff to approve applications? No See Action A.
Yes 2. Is a sketch plan, a drawing of the site with less required elements and without a professional seal, a possibility? No See Action A.
Use Listing and Definitions
Yes
Is a public hearing required? If yes, see Action B.
If not allowed where desired, see Action D.
3. Are agricultural or gardening uses listed as allowed uses in the zoning ordinance?
No See Action D.
Yes If the definitions do not match with state laws, see Action C. 4. Are agricultural or gardening uses listed in the
Definitions section? No See Action C.
Residential Garden
Yes 5. Does the zoning ordinance recognize lots adjacent to another owned by the same entity as a single lot or zoning lot? No See Action C.
Yes 6. Is an accessory structure, such as a shed or small greenhouse or hoop house, allowed if it is the only structure on a lot? No See Action C.
Community Garden
Yes If not allowed where desired, see Action D. 7. Is a community garden allowed as an accessory
use (a second activity on the lot)? No See Action C.
Yes See Action B. 8. Does a shed, greenhouse or hoop house require approval by an appointed or elected body (planning commission or City Council)? No
Back Yard Animals
Yes 9. Is keeping of animals (chickens, bees, goats) legal? No See Action D.
Market Garden
Yes If not allowed where desired, see Action D. 10. Are market gardens allowed?
No See Action D.
Yes See Action C. 11. Do state laws dealing with the right to farm apply?
No
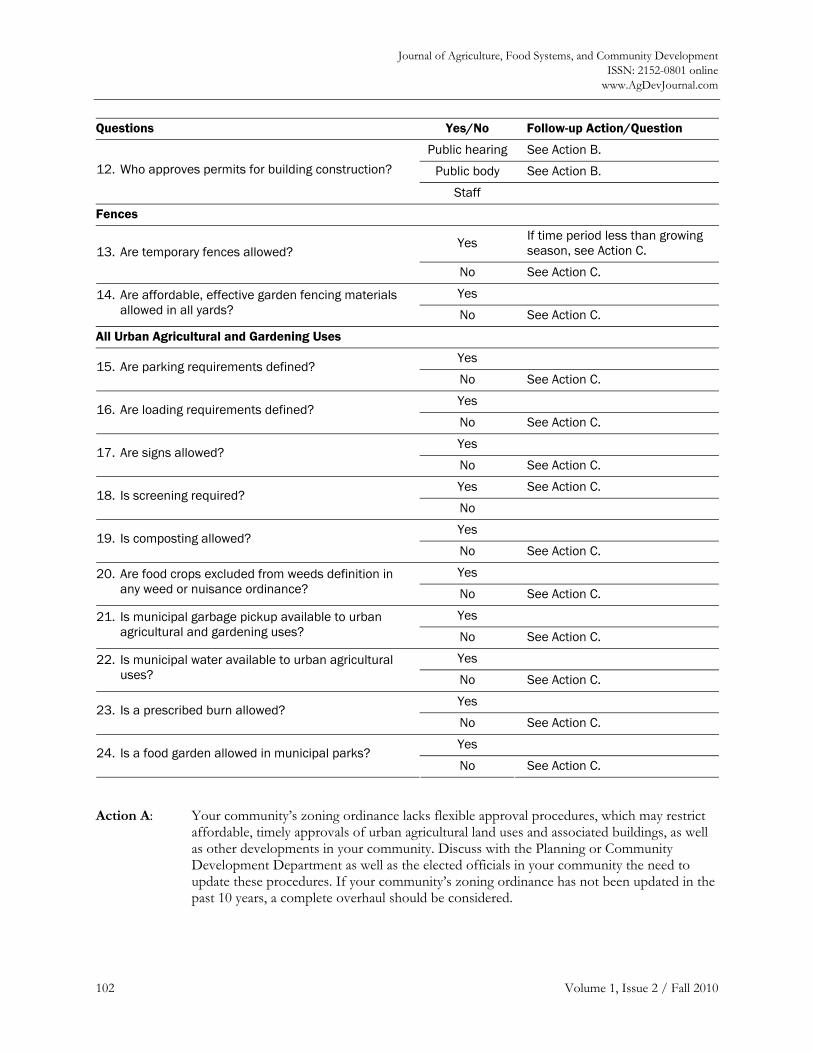
Journal of Agriculture, Food Systems, and Community Development ISSN: 2152-0801 online
www.AgDevJournal.com
102 Volume 1, Issue 2 / Fall 2010
Questions Yes/No Follow-up Action/Question
Public hearing See Action B.
Public body See Action B. 12. Who approves permits for building construction?
Staff
Fences
Yes If time period less than growing season, see Action C. 13. Are temporary fences allowed?
No See Action C.
Yes 14. Are affordable, effective garden fencing materials allowed in all yards? No See Action C.
All Urban Agricultural and Gardening Uses
Yes 15. Are parking requirements defined?
No See Action C.
Yes 16. Are loading requirements defined?
No See Action C.
Yes 17. Are signs allowed?
No See Action C. Yes See Action C.
18. Is screening required? No
Yes 19. Is composting allowed?
No See Action C.
Yes 20. Are food crops excluded from weeds definition in any weed or nuisance ordinance? No See Action C.
Yes 21. Is municipal garbage pickup available to urban agricultural and gardening uses? No See Action C.
Yes 22. Is municipal water available to urban agricultural uses? No See Action C.
Yes 23. Is a prescribed burn allowed?
No See Action C.
Yes 24. Is a food garden allowed in municipal parks?
No See Action C.
Action A: Your community’s zoning ordinance lacks flexible approval procedures, which may restrict affordable, timely approvals of urban agricultural land uses and associated buildings, as well as other developments in your community. Discuss with the Planning or Community Development Department as well as the elected officials in your community the need to update these procedures. If your community’s zoning ordinance has not been updated in the past 10 years, a complete overhaul should be considered.
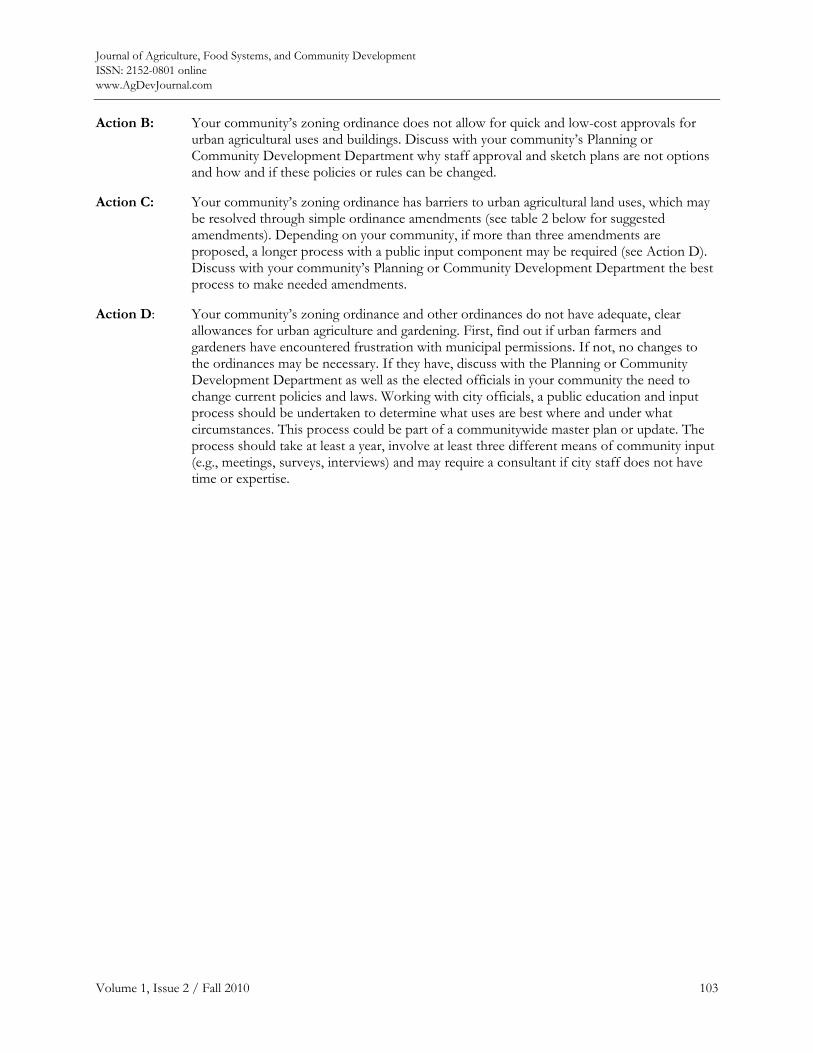
Journal of Agriculture, Food Systems, and Community Development ISSN: 2152-0801 online www.AgDevJournal.com
Volume 1, Issue 2 / Fall 2010 103
Action B: Your community’s zoning ordinance does not allow for quick and low-cost approvals for urban agricultural uses and buildings. Discuss with your community’s Planning or Community Development Department why staff approval and sketch plans are not options and how and if these policies or rules can be changed.
Action C: Your community’s zoning ordinance has barriers to urban agricultural land uses, which may be resolved through simple ordinance amendments (see table 2 below for suggested amendments). Depending on your community, if more than three amendments are proposed, a longer process with a public input component may be required (see Action D). Discuss with your community’s Planning or Community Development Department the best process to make needed amendments.
Action D: Your community’s zoning ordinance and other ordinances do not have adequate, clear allowances for urban agriculture and gardening. First, find out if urban farmers and gardeners have encountered frustration with municipal permissions. If not, no changes to the ordinances may be necessary. If they have, discuss with the Planning or Community Development Department as well as the elected officials in your community the need to change current policies and laws. Working with city officials, a public education and input process should be undertaken to determine what uses are best where and under what circumstances. This process could be part of a communitywide master plan or update. The process should take at least a year, involve at least three different means of community input (e.g., meetings, surveys, interviews) and may require a consultant if city staff does not have time or expertise.
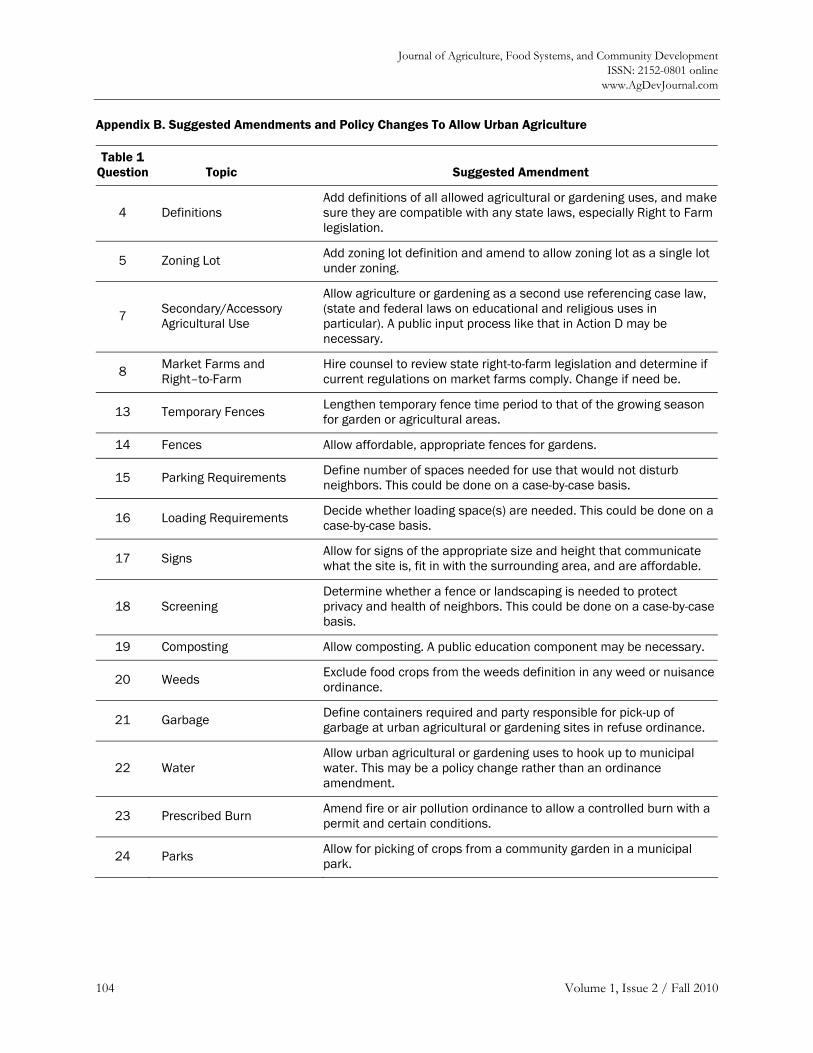
Journal of Agriculture, Food Systems, and Community Development ISSN: 2152-0801 online
www.AgDevJournal.com
104 Volume 1, Issue 2 / Fall 2010
Appendix B. Suggested Amendments and Policy Changes To Allow Urban Agriculture
Table 1 Question Topic Suggested Amendment
4 Definitions Add definitions of all allowed agricultural or gardening uses, and make sure they are compatible with any state laws, especially Right to Farm legislation.
5 Zoning Lot Add zoning lot definition and amend to allow zoning lot as a single lot under zoning.
7 Secondary/Accessory Agricultural Use
Allow agriculture or gardening as a second use referencing case law, (state and federal laws on educational and religious uses in particular). A public input process like that in Action D may be necessary.
8 Market Farms and Right–to-Farm
Hire counsel to review state right-to-farm legislation and determine if current regulations on market farms comply. Change if need be.
13 Temporary Fences Lengthen temporary fence time period to that of the growing season for garden or agricultural areas.
14 Fences Allow affordable, appropriate fences for gardens.
15 Parking Requirements Define number of spaces needed for use that would not disturb neighbors. This could be done on a case-by-case basis.
16 Loading Requirements Decide whether loading space(s) are needed. This could be done on a case-by-case basis.
17 Signs Allow for signs of the appropriate size and height that communicate what the site is, fit in with the surrounding area, and are affordable.
18 Screening Determine whether a fence or landscaping is needed to protect privacy and health of neighbors. This could be done on a case-by-case basis.
19 Composting Allow composting. A public education component may be necessary.
20 Weeds Exclude food crops from the weeds definition in any weed or nuisance ordinance.
21 Garbage Define containers required and party responsible for pick-up of garbage at urban agricultural or gardening sites in refuse ordinance.
22 Water Allow urban agricultural or gardening uses to hook up to municipal water. This may be a policy change rather than an ordinance amendment.
23 Prescribed Burn Amend fire or air pollution ordinance to allow a controlled burn with a permit and certain conditions.
24 Parks Allow for picking of crops from a community garden in a municipal park.
Journal of Agriculture, Food Systems, and Community Development ISSN: 2152-0801 online www.AgDevJournal.com
Volume 1, Issue 2 / Fall 2010 105
Could Toronto provide 10% of its fresh vegetable requirements from within its own boundaries? Matching consumption requirements with growing spaces Rod MacRaea,b, Eric Gallanta, Sima Patela, Marc Michalaka, Martin Buncha, Stephanie Schaffnera
Submitted 4 June 2010 / Accepted 30 November 2010/ Published online December 2010 Citation: MacRae, R., Gallant, E., Patel, S., Michalak, M., Bunch, M., & Schaffner, S. (2010, Fall). Could Toronto provide 10% of its fresh vegetable requirements from within its own boundaries? Matching consumption requirements with growing spaces. Journal of Agriculture, Food Systems, and Community Development, 1(2): 105–127. doi:10.5304/jafscd.2010.012.008 Copyright © 2010 by New Leaf Associates, Inc.
Abstract Is it feasible for Toronto to produce and market 10% of its fresh vegetable requirements from within its own boundary, without competing with existing Ontario vegetable producers? We used zoning maps, aerial photography, and numerous exclusionary and inclusionary criteria to identify potential food production sites across the city and, after identifying organic vegetable production yields, to calibrate supply potentials against current vegetable consumption estimates for the Toronto population. It was determined that Toronto required 2,317 hectares (5,725 acres) of food production area to meet current demand, if all production were organic to fulfill other municipal environmental objectives. Of this, 1073.5 ha (2,653 acres) of land could be available from existing
Census farms producing vegetables, lands currently zoned for food production, certain areas zoned for industrial uses, and over 200 small plots (0.4–2 ha or 1–4.9 acres) dotted throughout the northeast and northwest of the city. In addition, 1243.5 ha (3,072.8 acres) of rooftop space would also be required. The land and rooftop space available suggests, however, that there would be difficulties meeting requirements for land-extensive crops such as sweet corn, squash, potatoes, cabbage, carrots, and asparagus.
Keywords urban agriculture, land inventory, vegetable consumption
Introduction: Why Food in Cities? By 2025, two-thirds of humanity will live in cities. Many experts wonder where food to feed five billion urban people will come from. A portion may well come from cities themselves. Many urban areas are now producing over 20% of their vege-table production from within city boundaries,
a Faculty of Environmental Studies, York University, 4700 Keele Street, Toronto, ON M3J 1P3 Canada
b corresponding author: +1-416-736-2100 x22116 (tel.); +1-416-476-5679 (fax); [email protected]
Journal of Agriculture, Food Systems, and Community Development ISSN: 2152-0801 online
www.AgDevJournal.com
106 Volume 1, Issue 2 / Fall 2010
including such cities of the Global South as Havana, Singapore, and Accra. Feeding urban populations has long been thought of as a chal-lenge for the Global South, not for the cities of the industrialized North. But many cities of the North have also invested in urban food production, including Berlin, San Francisco, Burnaby (British Columbia), and potentially Detroit. In many ways, cities of the North are recapturing spaces that were devoted to food production in the past. In 1944, the United States had 20 million “victory gardens” in backyards that produced 46% of the nation’s fresh vegetables as a national effort during World War II (Kortright & Wakefield, 2010). Urban agri-culture has been defined as “the production of food and nonfood plant and tree crops, and animal husbandry, both within and fringing urban areas” (UN Organization for Economic Cooperation and Development as quoted by Kaufman & Bailkey, 2000, p. 3). Approaches to urban food production range from these victory gardens to new ideas for intensive farming in dedicated high-rise structures (Gorrie, 2009). However, in this study we focus specifically on commercial-scale vegetable produc-tion within the boundaries of the city of Toronto.
Recent Census of Population data affirm that Canada is an increasingly urban nation: Between 2001 and 2006, Canada’s population grew by over 1.6 million people—a 5.4% increase (Statistics Canada, 2007a). Nearly 90% of Canada’s popula-tion growth is concentrated in large metropolitan areas. At the same time, loss of agricultural land around cities has continued, with the production mix in the urban shadow continuing to shift away from basic foods toward, for example, horse breeding, animal feed for export, and crops for industrial applications, such as plastics and lubri-cants. In some quarters, concerns about the relia-bility and security—economic, biosecurity and climate-related—of supply chains continue to mount. If nearby Waterloo, Ontario, estimates are comparable to Toronto, the average imported food is traveling about 4500 km (2,796 miles) (Xuereb, 2005), much of it by truck. By some industry estimates, Toronto has only three to four days of perishable food within its boundary at any given time (Lue & Koc, 1999).
Despite repeated calls over the last 20 years to expand food production in the city of Toronto, the municipal government has responded only modestly with some investments in community gardening and some rooftop garden pilot sites. However, recent developments suggest that the city is primed to significantly expand urban food production.
Space (with its associated urban norms and rules) is typically assumed to be the limiting factor in urban food production. This study, part of a larger inquiry into policy and infrastructure changes to support urban agricultural development in Toronto, was undertaken to determine if growing space is available in the city to provide 10% of its main vegetable requirements from within its own boundaries. To set the stage for subsequent reports, which we hope to publish in this journal, we provide some descriptive context on urban agriculture in Toronto and details on the method employed to analyze potential growing spaces. We conclude with some analysis of significant challenges that will be further explored in later articles.
The Planning Context The land use planning system in Ontario is generally referred to as a provincial policy–driven system. The provincial Planning Act provides the overall procedural framework, outlines matters of provincial interest such as the preservation of agricultural land, and grants municipalities the authority to plan through official plans, zoning bylaws, and a host of other planning tools. The province also sets out inter-regional legislation that sets the overall planning framework. Several inter-regional acts and plans apply to the city of Toronto, specifically the Greenbelt Plan, empowered by The Greenbelt Act, and the Growth Plan for the Greater Golden Horseshoe, empowered by The Places to Grow Act.
The Greenbelt Plan The Greenbelt forms a wide band across a large portion of southern Ontario and extends into Toronto from the north to encompass the Rouge River Park in the northeast corner of the city. The
Journal of Agriculture, Food Systems, and Community Development ISSN: 2152-0801 online www.AgDevJournal.com
Volume 1, Issue 2 / Fall 2010 107
Greenbelt acts to connect the Oak Ridges Moraine Area with the Niagara Escarpment and the Park-way Belt West through the designation of lands as Protected Countryside. Rouge River Park forms a key part of the Natural Heritage System within the Protected Countryside, as it acts as a corridor con-necting the Oak Ridges Moraine to Lake Ontario. The Natural Heritage System policies allow the full range of existing agricultural, agriculture-related, secondary uses, and normal farm practices within Rouge River Park, and also limit new development.
The Greenbelt Plan’s Natural Heritage System works in concert with the Provincial Rouge Park Management Plan and The Little Rouge Corridor Management Plan, which zone 318 ha (785.8 acres) of the park’s land as an Agricultural and Agricul-tural Heritage Reserve. The close proximity of agriculture to the natural heritage system highlights a significant tension for urban agricultural develop-ment in Toronto: should ecologically sensitive lands and amenity spaces be used for food pro-duction? This question is ultimately reflected in the exclusionary screens used to identify suitable production lands (see methods below).
The Growth Plan for the Southern Ontario Region (Greater Golden Horseshoe) The Growth Plan sets out policies for directing where and how to develop southern Ontario. It requires that, by 2031 and for every year thereafter, 40 percent of all new development within upper-tier municipalities (regions) and the city of Toronto must occur within the already built-up areas of municipalities. The remaining 60 percent must occur within designated greenfield areas on the immediate periphery of the built-up areas. Within both built-up areas and greenfields, growth is directed to a series of municipally designated nodes and corridors. Greenfield areas must develop at densities of greater than 50 people and jobs per hectare (123 people and jobs per acre), while desig-nated Urban Growth Centres such as downtown Toronto must develop at densities of at least 400 people and jobs per hectare (988 people and jobs per acre). The entire city of Toronto is designated as a built-up area, with the exception of the Rouge
River Park, which is designated as greenbelt. There are no greenfield areas within the city.
The Growth Plan’s direction of growth to nodes and corridors has two primary repercussions for agriculture within city limits. First, it encourages growth along arterials and may thereby turn some development away from established neighbor-hoods and institutional, commercial, and industrial lands. In doing so, the Growth Plan may tend to relieve some competition for scarce space within these areas. Second, in prioritizing arterials (refer-red to as avenues in the city’s official plan) as places for growth, it ensures that spaces along these routes are likely to be considered for higher-value development before they would be consid-ered for urban agriculture. Thus, larger scale agri-cultural uses, such as the ones we are proposing (>0.4 ha or 1 acre), are not likely to find their way into Urban Growth Centres or any other identified nodes within the city.
Some Toronto Context Toronto is the largest city in Canada, and a top 10 urban centre in North America. It occupies an area of 63,175 ha (156,109 acres), with 75% of the city’s land developed and, apparently, the remaining 25% available for new growth over the next 30 years (City of Toronto, 2006). One estimate is that 18% of the city surface is green space,1 and 65% of residents have a lawn or garden (Statistics Canada, 2007c). The population is 2.5 million. Toronto is now considered the most culturally diverse city in the world, with more than 200 countries of origin for its residents and over 100 languages spoken (Lister, 2007). The city has many places to eat and shop; according to 1996 data, it has some 6,000 food service establishments and almost 5,000 food shops and grocery stores (Food and Hunger Action Committee (FHAC), 2001; Lister, 2007). Given urban development pressures on farmland around Toronto and the globalization of the food system, a significant percentage of farms has likely
1 A study is currently underway at Ryerson University to refine this estimate (Nina Marie Lister (personal communication), Ryerson University, 2009).
Journal of Agriculture, Food Systems, and Community Development ISSN: 2152-0801 online
www.AgDevJournal.com
108 Volume 1, Issue 2 / Fall 2010
shifted to nonfood uses and production for markets beyond the city of Toronto.
The city was a significant food producer in earlier periods. In 1915, some 2,000 garden plots coordinated by the Rotary Club generated almost $1 million in produce in current dollars (Johnson, 2009). In 1934, an 80 ha (198 acre) garden site in the western part of the city was created to help 5,000 unemployed families. During WWII, Toronto was part of the Canadian cities Victory Gardens effort that created 200,000 wartime gardens nationally and produced 52 million kg of vegetables (Johnson, 2009). Market gardens and greenhouse operations were very common in Toronto until the 1930s (Fram, 2009). Up until the 1960s, much of the northern part of the city was still farmland, but it was gradually converted as population and commercial pressures resulted in redevelopment.
Numerous efforts to expand urban food produc-tion are underway and, combined with mounting interest in local and direct food procurement, suggest the moment is right for a coordinated and long-term urban food production strategy. The city has a Community Garden Action Plan (1999), an Environment Plan (2000) that called for urban agriculture pilot projects, a Food Charter (2001), and is preparing to adopt both an associated Food Strategy and a climate change mitigation strategy (the Climate Change, Clean Air and Sustainability Energy Action Plan). Urban food production is viewed as part of all these strategic developments, yet significant food production measures remain unrealized. The city’s Official Plan now makes reference to urban food production, and Toronto City Council is now, more than ever, receptive to including urban farm scenarios within its Official Plan (W. Roberts (personal communication), City of Toronto, 2009).
Current Food Production Activities and Potentials in Toronto 2 Backyard and Community Gardening Back- and front-yard gardening remains a signifi-cant activity in multicultural Toronto. Some 4,500 private garden plots produce a substantial amount of food (Cook, 2008), but it is likely that a substan-tially larger percentage of households3 have small cook’s gardens (Kortright, 2007, p. 16). City Farmer found that 40% of people living in the Greater Toronto Area (GTA)4 were producing some of their own food. Kanengoni, (2010), working with data presented by Kortright and Wakefield (2010), suggests that there might be about 650 ha (1,606 acres) of gardens currently in the city, a little more than 1% of the city’s surface area.
Toronto is also reported to have at least 1,000 community garden plots in parks, public lands, and social housing complexes, and 20 municipal allotments containing 2,500 plots (FHAC, 2001). The municipal government runs 52 community gardening sites and 12 of the allotments (1,674 plots), providing outreach, training, technical supports, and some seedling production (City of Toronto, 2009). The waiting lists for sites are reputed to be long, but no new allotments gardens have been established since 1998. According to some municipal officials, however, spaces are soon to increase.
Census Farms and Food Production Businesses According to Statistics Canada (2007a), there are 76 census farms5 on 2,710 ha (6,697 acres) within the city of Toronto, 52 of which report crops (not
2 We do not consider small livestock production because municipal bylaws currently do not permit poultry and livestock production except on land zoned agricultural. There is some momentum building, however, to change the bylaw (Schrivener, 2008). 3 Toronto has some 391,000 detached, semidetached, and row houses. 4 The GTA includes many suburban municipalities with larger housing lots. 5 To be a census farm, the farm must produce agricultural products with the intention to sell.
Journal of Agriculture, Food Systems, and Community Development ISSN: 2152-0801 online www.AgDevJournal.com
Volume 1, Issue 2 / Fall 2010 109
including Christmas trees) on 1,613 ha (3,986 acres), and an additional 310 ha (766 acres) in pasture. Located primarily in the northeastern corner of the city, they produce mostly soybeans, grain corn, and small grains (about 1,000 ha or 2,471 acres), most of which is likely for animal feed. Seventeen farms report growing fruits, berries, and nuts on 194 ha or 479 acres (the majority in grapes), and 11 farms report growing vegetables on 126 ha (311 acres). Data suppression rules limited information on what vegetables are produced, but it would appear to be diverse. Seven farms reported greenhouse operations, mostly flowers with some vegetable production (likely transplants), totaling 30,487 sq. m (328,159 sq. ft.) of greenhouse space.
According to a representative of the Toronto and Region Conservation Authority (TRCA), there are 530 hectares (1,310 acres) that are currently farmed in the Rouge Park under lease arrangements (318 ha or 786 acres of which are zoned agricultural), with 150 ha (317 acres) of that coming out of agricultural production in the near future for natural habitat restoration (Bob Clay (personal communication), TRCA, 2008). There are approximately six farmers who manage these parcels of land. Most of the farms in the park operate on a rotation of soybeans, winter wheat, and corn, although there is one dairy herd and one beef herd. There are also some parcels of private land within Rouge Park, probably covering some 100–200 hectares (247–494 acres).6 The TRCA Natural Heritage Plan (2007) suggests that pressures on land cost are pushing producers out of field crops and into greenhouse, nursery, fruit and vegetables, and specialty production.
In 1996, there were six nonfarm food production businesses within the city (including sprout operations), employing 93 people (Toronto Food Policy Council (TFPC), 1999). A more current estimate is lacking.
6 Data suppression rules make it difficult to overlay information from the TRCA with that of Statistics Canada.
Green Roofs Rooftop gardens are increasingly common in Toronto. In 2007, installations of green roof infrastructure reached 7,700 sq. m or 82,882 sq. ft. (or 0.77 ha or 1.9 acres), though how much of this is in food production is not currently known. Toronto is ranked first among Canadian cities in green roof installation.7
In 2004, the city commissioned a study of the suitability of green roofs (Banting, Doshi, Li, Missios, Au, Currie & Verrati, 2005) that found about 13,478 ha or 33,305 acres (21% of the city land area) represented a roofed area. About 4,984 ha (12,316 acres) of the roofed area (8% of the total city land area) would be suitable for greening of some form (roofs of 350 sq. m (3,767 sq. ft.) or more at 75% roof coverage in buildings that had heating and cooling). How much of that area would be suitable for food production is unknown, as the survey was based on spatial GIS data and did not fully examine issues of structural integrity, access, and growing infrastructure—all pertinent to commercial rooftop production. The authors did recommend a follow-up survey of structural requirements to accommodate a range of media thickness on roofs. The city followed this study with a pilot program that offered $50 per square meter for any resident or building owner to install green roofs. A green roof bylaw has recently been adopted to require roof greening on many new types of construction in the city8; however, it may not be well designed to encourage food production.
Greening the Towers The previous mayor of Toronto endorsed a pilot project to renew Toronto’s postwar residential tower building stock, focusing particularly on energy efficiency. As part of this effort, the architectural team9 has numerous proposals
7 2008 Green Roof Industry Survey, http://www.greenroofs. org/index.php?option=com_content&task=view&id=1015& Itemid=135 8 See http://www.toronto.ca/legdocs/bylaws/2009/ law0583.pdf 9 http://www.era.on.ca/news/index.php?news_id=20
Journal of Agriculture, Food Systems, and Community Development ISSN: 2152-0801 online
www.AgDevJournal.com
110 Volume 1, Issue 2 / Fall 2010
illustrating the potential for urban agriculture around the tower grounds and in some cases on rooftops and balconies. However, there are numerous barriers related to the official plan to using the space around the towers for food production. Some of the towers are compromised as growing sites by the way the buildings cast shadows and traditional approaches to landscaping, so significant food production will be difficult (Danyluk, 2009).
Institutional Lands Toronto and Region Conservation Authority (TRCA) The TRCA is one of the largest landholders in the Greater Toronto Area, with thousands of existing farm acres (Gary Wilkins (personal communica-tion), TRCA, 2009), including existing farmland rentals in the Rouge Park in northeast Toronto. TRCA has adopted a policy on sustainable near-urban agriculture for its current agricultural land base, including some not currently in agricultural production. The TRCA believes that it can play “a role in helping to revitalize agriculture in the Toronto region by establishing new partnerships and venturing into new agricultural projects on its lands that are more community-based, support the local food system and are environmentally sustainable” (Toronto and Region Conservation Authority (TRCA), 2008). One site in northwest Toronto, the Toronto Urban Farm, is managed by the city of Toronto, consists of eight acres, and began in 2004. Its original feasibility study estimated that it could feed 254 people. The focus of this farm is on local food production, youth employment, and leadership training.
Downsview Park As part of the redevelopment of the federally owned park in the northwestern part of Toronto, a small portion (approximately 20 acres) of the 230 hectare property is slated for various types of agriculture. In 2009, FoodCycles, a nonprofit organization whose goals include education around healthy eating, helping at-risk youth, and creating jobs in the community through vermicomposting and food-growing operations, started its first
season. The farmers (including many volunteers) sell their produce at a farmstand on site. Food-Cycles’s plan is to use waste from the weekly Downsview Farmers’ Market as raw product for its compost operation in order to produce healthy soil for sale to the public in addition to local, organic produce. In terms of marketing its produce, one of the goals for the future is to offer the fruits and vegetables grown through a community supported agriculture (CSA) operation.
Toronto District School Board The Toronto District School Board (TDSB) commissioned a feasibility study to examine urban production possibilities on a number of school sites in the northern part of the city. The board sees this as part of an effort to create new learning opportunities for students, especially as part of a co-op training program. In its model, it would tender a contract to manage the farm and retain management of the education efforts associated with the site. No citywide targets for food production have yet been set.
Hydro Corridors Ontario Hydro, the biggest landowner in the province, has right-of-way, some unused, over some 12 km2 (4.6 miles2)in the city (Danyluk, 2009), with 243 ha (600 acres) already devoted to parkland, recreational activities, and community gardens. Currently, there are nine allotment gardens in corridors and four community gardens (Danyluk, 2009). The city Parks, Forestry and Recreation Division has proposed that a similar amount of land could be used to expand recreational activities in existing corridors.
Nongovernmental Organization Projects There are some examples of entrepreneurial agriculture happening on private lands within the city. For example, the nonprofit agency FoodShare Toronto, dedicated to food and hunger issues, established Sunshine Garden, a 650-square-meter certified organic operation, on the grounds of the Centre for Addiction and Mental Health (CAMH) in downtown Toronto where CAMH participants grow vegetables and herbs. Its produce has been sold on the property in a makeshift farmers’ market
Journal of Agriculture, Food Systems, and Community Development ISSN: 2152-0801 online www.AgDevJournal.com
Volume 1, Issue 2 / Fall 2010 111
and is included in the thousands of boxes that FoodShare’s Good Food Box program delivers in the city each month.
Another antihunger and community development agency, The Stop, has established its Green Barn project. A sustainable food production and education center in a heritage building renovated to LEED standards, the facility houses a sheltered garden, greenhouse, community kitchen, and bake oven. The Stop has also conducted a feasibility study on a six-acre site in the northwestern corner of Toronto, examining its potential as an urban farm, with four acres to be cultivated. At this point, no commitments to developing the site as a farm have been made (staff at The Stop (personal communication), November 2009).
Demand-side Interest in Local Markets Parallel to this interest in urban production, increasing numbers of food buyers are focusing on expanding local food purchasing. For several years, through an organization called Knives and Forks, many Toronto chefs have been expanding their connections with Ontario farmers. There has been, as well, exceptional growth in the number of farmers’ markets within the city during the 2000s, rising from seven to 27 (as of 2008), many having requirements that sales are of Ontario food only (Young, 2009). A new nongovernmental organization, Local Food Plus, has been working with several Toronto educational institutions, retailers, and restaurants to revamp their food supply chains to provide more local product on their menus. The city of Toronto recently adopted a local procurement policy and will focus first on expanding local food offerings in city daycare centers. The provincial government recently expanded its program promoting Ontario foods and is looking at increasing the proportion of Ontario foods in its cafeterias.
Most of these new initiatives report that demand is very strong and that the limited supply of local food and the need to rebuild local processing and distribution infrastructure are their biggest operational challenges.
Methodology
The Consumption Side of the Scenario To estimate how much food would be needed to meet 10% of Toronto’s vegetable consumption requirements, we adapted a method developed by Desjardins, MacRae, and Schumilas (2010), focusing solely on the vegetable consumption and production elements of their work and using their framing to help determine what fresh vegetables on which to focus. As part of their study, they estimated vegetable consumption from national Statistics Canada food disappearance data and organized vegetable consumption and production data according to the optimal consumption patterns set out in Canada’s Food Guide (Health Canada, 2007). They accounted for food waste factors and then applied typical yields in organic production to estimate hectares of land required.
We used a similar national analysis because current data available for Toronto did not meet our data requirements.10 Our assumption, therefore, is that Torontonians consume vegetables comparable to the national average.11 We did, however, update food disappearance data using 2006 figures.12
To select vegetables to study, we used the Desjardins et al. (2010) criteria and selected many of the same vegetables because of their significance in the diet, their suitability for growing in the region, the availability of reliable horticultural data, and the popularity of vegetables, based on their frequency of consumption. We made a few adjust-ments to balance the Desjardins et al. analysis with Toronto’s proximity to the Holland Marsh vege-table production region (which supplies a large
10 The city of Toronto periodically collects data on frequency of consumption of fruits and vegetables through its Rapid Risk Factor Surveillance System (RRFSS, http://www.rrfss.on.ca). However, these data could not be used because the survey doesn’t report quantities consumed and does not distinguish between fresh and processed consumption. 11 Since Toronto is the most multicultural city in Canada, this is not likely true, but not enough is known to make reasonable adjustments (see footnote 10). 12 http://www.statcan.gc.ca/pub/21-020-x/2007001/ 5211860-eng.htm
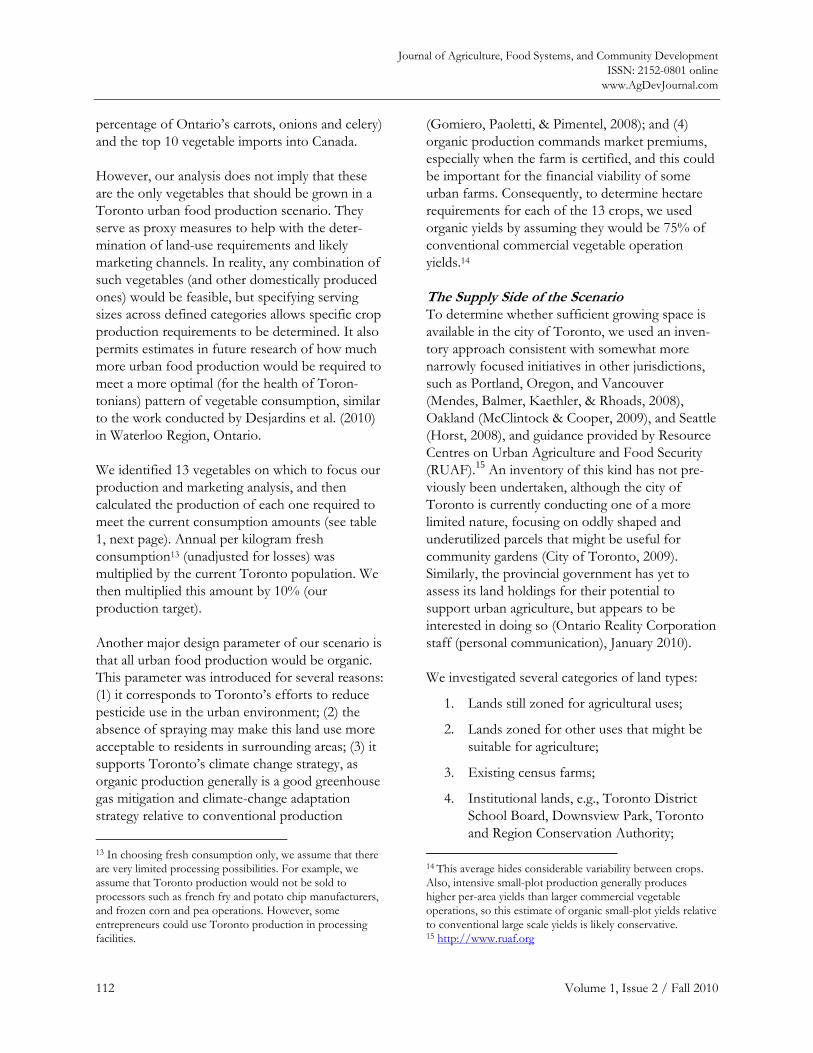
Journal of Agriculture, Food Systems, and Community Development ISSN: 2152-0801 online
www.AgDevJournal.com
112 Volume 1, Issue 2 / Fall 2010
percentage of Ontario’s carrots, onions and celery) and the top 10 vegetable imports into Canada.
However, our analysis does not imply that these are the only vegetables that should be grown in a Toronto urban food production scenario. They serve as proxy measures to help with the deter-mination of land-use requirements and likely marketing channels. In reality, any combination of such vegetables (and other domestically produced ones) would be feasible, but specifying serving sizes across defined categories allows specific crop production requirements to be determined. It also permits estimates in future research of how much more urban food production would be required to meet a more optimal (for the health of Toron-tonians) pattern of vegetable consumption, similar to the work conducted by Desjardins et al. (2010) in Waterloo Region, Ontario.
We identified 13 vegetables on which to focus our production and marketing analysis, and then calculated the production of each one required to meet the current consumption amounts (see table 1, next page). Annual per kilogram fresh consumption13 (unadjusted for losses) was multiplied by the current Toronto population. We then multiplied this amount by 10% (our production target).
Another major design parameter of our scenario is that all urban food production would be organic. This parameter was introduced for several reasons: (1) it corresponds to Toronto’s efforts to reduce pesticide use in the urban environment; (2) the absence of spraying may make this land use more acceptable to residents in surrounding areas; (3) it supports Toronto’s climate change strategy, as organic production generally is a good greenhouse gas mitigation and climate-change adaptation strategy relative to conventional production
13 In choosing fresh consumption only, we assume that there are very limited processing possibilities. For example, we assume that Toronto production would not be sold to processors such as french fry and potato chip manufacturers, and frozen corn and pea operations. However, some entrepreneurs could use Toronto production in processing facilities.
(Gomiero, Paoletti, & Pimentel, 2008); and (4) organic production commands market premiums, especially when the farm is certified, and this could be important for the financial viability of some urban farms. Consequently, to determine hectare requirements for each of the 13 crops, we used organic yields by assuming they would be 75% of conventional commercial vegetable operation yields.14
The Supply Side of the Scenario To determine whether sufficient growing space is available in the city of Toronto, we used an inven-tory approach consistent with somewhat more narrowly focused initiatives in other jurisdictions, such as Portland, Oregon, and Vancouver (Mendes, Balmer, Kaethler, & Rhoads, 2008), Oakland (McClintock & Cooper, 2009), and Seattle (Horst, 2008), and guidance provided by Resource Centres on Urban Agriculture and Food Security (RUAF).15 An inventory of this kind has not pre-viously been undertaken, although the city of Toronto is currently conducting one of a more limited nature, focusing on oddly shaped and underutilized parcels that might be useful for community gardens (City of Toronto, 2009). Similarly, the provincial government has yet to assess its land holdings for their potential to support urban agriculture, but appears to be interested in doing so (Ontario Reality Corporation staff (personal communication), January 2010).
We investigated several categories of land types:
1. Lands still zoned for agricultural uses;
2. Lands zoned for other uses that might be suitable for agriculture;
3. Existing census farms;
4. Institutional lands, e.g., Toronto District School Board, Downsview Park, Toronto and Region Conservation Authority;
14 This average hides considerable variability between crops. Also, intensive small-plot production generally produces higher per-area yields than larger commercial vegetable operations, so this estimate of organic small-plot yields relative to conventional large scale yields is likely conservative. 15 http://www.ruaf.org
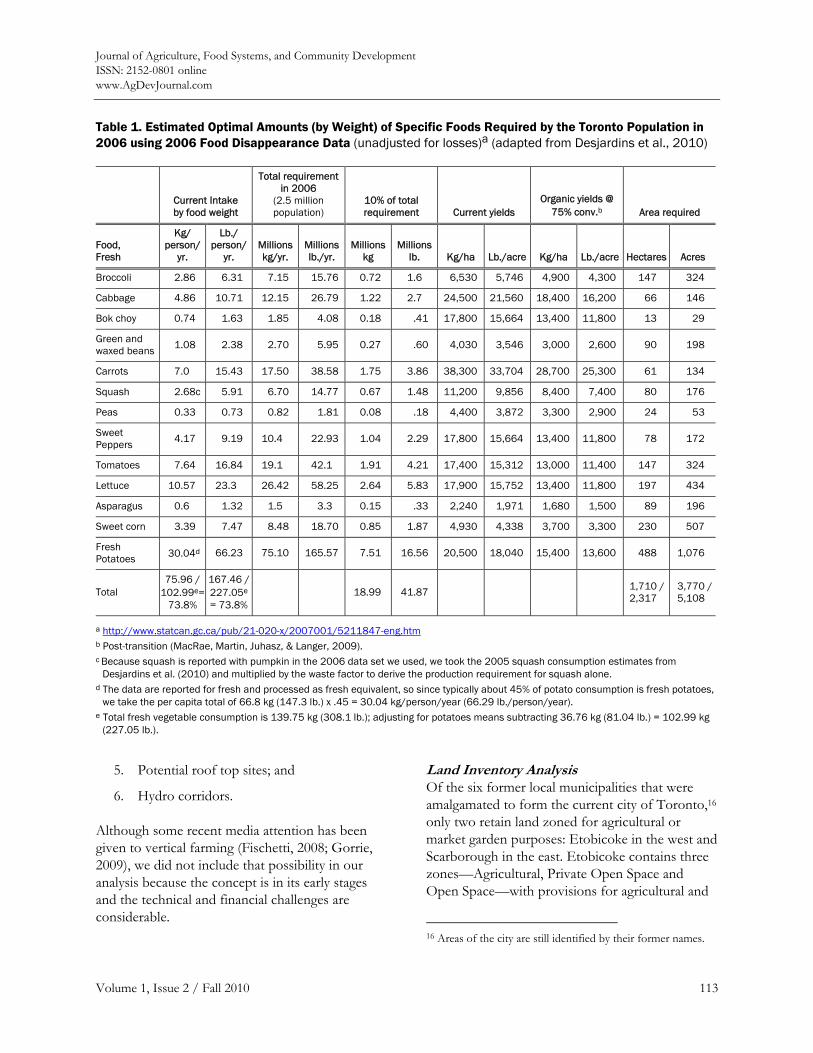
Journal of Agriculture, Food Systems, and Community Development ISSN: 2152-0801 online www.AgDevJournal.com
Volume 1, Issue 2 / Fall 2010 113
5. Potential roof top sites; and
6. Hydro corridors.
Although some recent media attention has been given to vertical farming (Fischetti, 2008; Gorrie, 2009), we did not include that possibility in our analysis because the concept is in its early stages and the technical and financial challenges are considerable.
Land Inventory Analysis Of the six former local municipalities that were amalgamated to form the current city of Toronto,16 only two retain land zoned for agricultural or market garden purposes: Etobicoke in the west and Scarborough in the east. Etobicoke contains three zones—Agricultural, Private Open Space and Open Space—with provisions for agricultural and
16 Areas of the city are still identified by their former names.
Table 1. Estimated Optimal Amounts (by Weight) of Specific Foods Required by the Toronto Population in 2006 using 2006 Food Disappearance Data (unadjusted for losses)a (adapted from Desjardins et al., 2010)
Current Intake by food weight
Total requirement in 2006
(2.5 million population)
10% of total requirement Current yields
Organic yields @ 75% conv.b Area required
Food, Fresh
Kg/ person/
yr.
Lb./ person/
yr.
Millions kg/yr.
Millions lb./yr.
Millions kg
Millions lb.
Kg/ha Lb./acre
Kg/ha Lb./acre Hectares Acres
Broccoli 2.86 6.31 7.15 15.76 0.72 1.6 6,530 5,746 4,900 4,300 147 324
Cabbage 4.86 10.71 12.15 26.79 1.22 2.7 24,500 21,560 18,400 16,200 66 146
Bok choy 0.74 1.63 1.85 4.08 0.18 .41 17,800 15,664 13,400 11,800 13 29
Green and waxed beans 1.08 2.38 2.70 5.95 0.27 .60 4,030 3,546 3,000 2,600 90 198
Carrots 7.0 15.43 17.50 38.58 1.75 3.86 38,300 33,704 28,700 25,300 61 134
Squash 2.68c 5.91 6.70 14.77 0.67 1.48 11,200 9,856 8,400 7,400 80 176
Peas 0.33 0.73 0.82 1.81 0.08 .18 4,400 3,872 3,300 2,900 24 53
Sweet Peppers 4.17 9.19 10.4 22.93 1.04 2.29 17,800 15,664 13,400 11,800 78 172
Tomatoes 7.64 16.84 19.1 42.1 1.91 4.21 17,400 15,312 13,000 11,400 147 324
Lettuce 10.57 23.3 26.42 58.25 2.64 5.83 17,900 15,752 13,400 11,800 197 434
Asparagus 0.6 1.32 1.5 3.3 0.15 .33 2,240 1,971 1,680 1,500 89 196
Sweet corn 3.39 7.47 8.48 18.70 0.85 1.87 4,930 4,338 3,700 3,300 230 507
Fresh Potatoes 30.04d 66.23 75.10 165.57 7.51 16.56 20,500 18,040 15,400 13,600 488 1,076
Total 75.96 /
102.99e= 73.8%
167.46 / 227.05e = 73.8%
18.99 41.87 1,710 / 2,317
3,770 / 5,108
a http://www.statcan.gc.ca/pub/21-020-x/2007001/5211847-eng.htm b Post-transition (MacRae, Martin, Juhasz, & Langer, 2009). c Because squash is reported with pumpkin in the 2006 data set we used, we took the 2005 squash consumption estimates from
Desjardins et al. (2010) and multiplied by the waste factor to derive the production requirement for squash alone. d The data are reported for fresh and processed as fresh equivalent, so since typically about 45% of potato consumption is fresh potatoes,
we take the per capita total of 66.8 kg (147.3 lb.) x .45 = 30.04 kg/person/year (66.29 lb./person/year). e Total fresh vegetable consumption is 139.75 kg (308.1 lb.); adjusting for potatoes means subtracting 36.76 kg (81.04 lb.) = 102.99 kg
(227.05 lb.).
Journal of Agriculture, Food Systems, and Community Development ISSN: 2152-0801 online
www.AgDevJournal.com
114 Volume 1, Issue 2 / Fall 2010
market garden uses. Scarborough has one Agricul-tural zone specifically designated for agricultural uses. Several of the other former municipalities—the former city of Toronto and the former North York—also have zones containing agricultural use provisions, but these are mixed residential/ agricultural zones. A survey of each borough revealed that these zones are now primarily occupied by residential buildings, rendering their agricultural designations moot. The continued existence of dedicated agricultural and market garden lands in both Scarborough and Etobicoke, combined with their large amounts of open space, guided our selection of these boroughs for the purposes of our land inventory analyses.
Digital geospatial data for both Official Plan land use and zoning information were not available from the city of Toronto. The land use layers found in the city of Toronto Official Plan are not intended to be accurate or precise for the purposes of analysis and are hence not available for public use. Digital zoning information is also not available for public use. Potential agricultural land identified through the parcel analysis was therefore broken down into zoning categories by visually cross-referencing available paper and PDF copies of zoning maps. We amalgamated specific zoning categories into broad designations.
In order to identify the land potentially available for urban agriculture in the city of Toronto, we used two separate and successive analyses. First, using GIS, we undertook a parcel analysis that identified potential land based on a set of basic physical criteria. Second, a policy analysis examined these potential parcels in order to understand how the land use policy framework in the city of Toronto might act to restrict or facilitate their conversion to agricultural use. We describe the analysis below.
For both these analyses, data were provided by the planning units of the pertinent former municipalities of the city of Toronto.
Parcel Analysis For this preliminary supply analysis we employed ArcGIS 9.0 to identify and map parcels and calculate their areas. Using 2005 20-cm resolution orthorectified color air photos of the city of Toronto as a base layer, we conducted a thorough visual survey of two former municipalities of the current city of Toronto: Scarborough and Etobicoke. A property boundary layer and road centerline layer from the city of Toronto were used to help identify locations.
Through the visual survey, we identified parcels that we characterized as suitable to be converted to agricultural purposes. Parcels were digitized as a separate polygon layer for later area calculations.
In this parcel analysis, we sought both dispersed small plots that could be converted to small-scale but intensive production operations, and larger parcels that could be converted to more traditional forms of organic agriculture. The same seven criteria were used to identify lands for both types of agriculture: size, shape, site coverage, accessi-bility, proximity to watercourses, proximity to roads, and use of park space.
• Size In order to ensure the viability of dispersed agricultural plots, the minimum size we considered for agricultural parcels was 0.4 hectares (1 acre). The only exceptions to this rule occurred where multiple parcels of slightly less than 0.4 hectares occurred within close proximity to one another. Often this would occur where parcels were separated by a foot path or a small but significant natural barrier.
• Shape For the purposes of conceptualization, only parcels in shapes that could efficiently be worked by a small tractor (e.g., Kuboka) were considered. A degree of flexibility was exercised, but, in general, the aim was to only include shapes with primarily straight sides and widths of at least 20 meters. Thus square, rectangular, L-shaped, T-shaped and C-shaped parcels were the most common formation. However, given
Journal of Agriculture, Food Systems, and Community Development ISSN: 2152-0801 online www.AgDevJournal.com
Volume 1, Issue 2 / Fall 2010 115
that the aim in this initial phase was to determine the full amount of available land area, in a number of instances curvilinear borders were utilized.
• Site coverage A primary assumption guiding the selection of parcels for urban farming is that the existing on-site soils would be utilized. Thus, our parcel analysis sought sites where access to soils would not be significantly impeded by the site coverage. In this process we employed a number of exclusionary and inclusionary screens. Lands excluded from consideration consisted of:
a. Buildings, concrete, pavement, or other constructed material
b. Roads, trails, paths, or other transportation routes
c. Baseball diamonds, soccer fields, or other active recreation space
d. Active utility corridors
e. Forest
f. Water
Ideal sites possessed none of the above coverage types and had one of more of the following:
a. Agricultural uses
b. Disturbed soils
c. Gardens
d. Grasses (maintained and non-maintained)
e. Herbs and shrubs
f. Patches of young forest (diameter at breast height <10cm)17
17 Given the unclear picture regarding green space in Toronto, it is difficult to determine potential conflicts with food production. Regarding tree cover, 17% is the current level, but the city target is 35%.
Ground Truthing (Site Inspection) In the early phases of the parcel identification process, 10 parcels of apparently different coverage types were selected for ground truthing. Through these site visits, we calibrated our visual analysis of coverage types with the existing conditions on the ground. This process was used primarily to aid in distinguishing between different vegetative types visible in the 2005 orthophotographs.
A second round of ground truthing was undertaken after a complete preliminary analysis of the orthophotos. Over the course of three months, site visits were completed on 150 parcels (about 37% of 401 sites originally selected). Sites were not randomly selected, but rather were chosen because they were perceived from orthophotos to be potentially less suitable. These sites were also examined through aerial maps on a website providing current aerial data (http://www.maps. live.com). This allowed a closer look at certain parcels that may not have been easy to examine from the ground, due to borders of trees, for example. To gain ownership and development plan information, the city Planning Department, along with the Facilities and Real Estate Department, provided general information on whether develop-ment plans were pending for any particular parcel. While they were not able to disclose specific ownership information,18 they did indicate whether the parcel was owned by the city. Some ownership information was already known, such as the parcels within Rouge Park managed by the TRCA.
Ground truthing eliminated about 22% of the parcels from our original estimates (see figures 1 and 2).
• Accessibility Again, a number of exclusionary and inclusionary screens were used to determine
18 Note that to find specific ownership information, the Ontario Land Registry maintains electronic records on ownership information and history that may be obtained for a fee. This can become an expensive process, as any parcel may have many deeds attached to it, and each deed is a separate record, with a separate fee.
Journal of Agriculture, Food Systems, and Community Development ISSN: 2152-0801 online
www.AgDevJournal.com
116 Volume 1, Issue 2 / Fall 2010
whether sites were sufficiently accessible for our purposes. Parcels were excluded where no access point was visible or where sole means of access was provided:
a. By highway or highway off- or on-ramp (exception: where parking was visible alongside a highway or off- or on-ramp, indicating the potential for parking and access),
b. Through existing active recreational space, or
c. Only by travelling over manicured lawns.
Parcels were included where access was provided:
a. Directly by arterial, collector, or local municipal roads,
b. By bicycle path or wide pedestrian path, recognizing that city Parks, Forestry and Recreation staff access these spaces, or
c. Over lawns that were not heavily managed.
• Proximity to watercourses Although contamination and nutrient enrichment impacts from organic agriculture are generally considered to be minimal (Lynch, 2009), a riparian buffer is required to mitigate potential water quality issues. In this light, using GIS, five-meter buffers were created from the approximate bankfull width of all streams and rivers within the Humber, Don, and Rouge watersheds. These areas were excluded from the inventory.
• Proximity to roads Contaminants from roads and traffic can be a problem for urban agricultural soil quality and crop health. However, it has been recognized for some time that effects can be reduced with separation distances from the roadways (cf. Lagerwerff & Specht, 1970). We used GIS to create a 10-metre exclusionary buffer on all roads and highways within proximity to a potential parcel.
• Use of park space Park space is a precious commodity within densely populated urban areas. Within the city of Toronto, parks are often the only open arable lands remaining for conversion to agriculture. Used for both passive and active recreation, parks are valued by for a multitude of reasons by any number of users. Although the city may soon reassess its view of agriculture in parks, we expect that the conversion of park space to agricultural use is likely to generate a range of responses from park users. In recognition of this, our selection criteria within urban parks were necessarily restrictive.
In general, we excluded land:
a. In parks under 1.2 ha (3 acres) where our minimum 0.4 ha (1 acre) parcel size would represent more than one-third of the total park area,
b. Currently dedicated to active recreation, or
c. In the centre of parks, or in other locations where the agricultural parcel or access to it would negatively affect the continuity of park space or park uses.
We included land:
a. In apparently unutilized or underutilized corners of parks,
b. Near an access point, but not impeding access, or
c. In locations that could enhance the overall form and function of the park.
In this phase or our analysis, we were unable to factor in:
• Nonobvious slopes (from orthophotos) that might limit production
• Tree line impacts—we were unable to account for all possible tree line buffers to reduce shading on plots
• Space in highway off-ramps and medians, on the assumption that contamination and
Journal of Agriculture, Food Systems, and Community Development ISSN: 2152-0801 online www.AgDevJournal.com
Volume 1, Issue 2 / Fall 2010 117
access issues would be significant obstacles to agricultural use
• Access to water—whether it would be impossible to effectively deliver water to a site
• Site histories that would identify contamination, although the city of Toronto is developing a new system for site appraisals that can be considered in the next phases of the inquiry
• Ownership—limited analysis was undertaken
• Full ground-truthing of all identified parcels
• Complete assessment of development pres-sures associated with parcels. For example, those on main avenues may face significant and relatively immediate redevelopment pressures, though there is a provision in the city’s Avenues development plan for urban gardens to be retained and developed.
Because of our criteria for including and excluding parcels, we were not fully able to account for all potential institutional sites that might be targeted for food production. The institutional actors will apply their own criteria that might differ from ours, resulting in a different inventory. However, we did communicate with key institutional actors—the Toronto District School Board, the Toronto and Region Conservation Authority, and Parc Downs-view Park—regarding their urban agriculture plans, and we cross-referenced their information with our identified parcels. We added the total area from their sites not already identified in our estimates to our total, as reported below.
Results
Consumption We calculated that a total of 1,710 ha (4,226 acres) is required to meet consumption of the 13 crops presented in table 1. Total fresh vegetable consumption was 103 kg/person/year (227 lb./person/year) in Toronto in 2006, unadjusted
for losses.19 Our 13 studied crops represent 73.8% of current vegetable consumption. To determine the land area required to meet 10% of fresh vegetable consumption in Toronto, we multiplied 1,710 ha (4,226 acres) by 73.8% to come up with our estimate of 2,317 ha (5,725 acres) to meet 10% of Toronto’s demand. If we assume that the current 126 ha (311 acres) of vegetables produced on Toronto census farms is, or readily could be, sold within the city and converted to organic production,20 then an additional 2,191 ha (5,414 acres) in vegetable production are required. Our assumption is that it is unrealistic to expect all census farm acreage within the city to be converted to meet local vegetable consumption objectives.
Supply Results for Scarborough and Etobicoke are presented in figures 1 and 2 and tables 2 and 3. Approximately 845 ha (2,088 acres) of land are available, with over half on lands currently zoned for agricultural uses. Another 25% is sited on lands currently zoned industrial. Given that only 3% of identified land area is zoned residential, 10% parks and open space, and 1% institutional, there may be opportunities to minimize conflicts over land uses that are typically associated with urban agriculture proposals.
This analysis does not include a full assessment of institutional lands owned by governmental and paragovernmental actors. The federal and provin-cial governments, school boards, hospitals, and postsecondary educational institutions may all have underutilized or surplus properties that were not all captured using our methodology. However, key institutional actors report the areas of future development in table 4.
We also did not include active hydro corridors in our geospatial analysis, although some abandoned utility corridors in Scarborough were inventoried and added (determined by orthophotography to
19 http://www.statcan.ca/english/freepub/21-020-XIE/2007001/tablesectionlist.htm 20 Note that we have no current information on the production systems used in producing these vegetables.
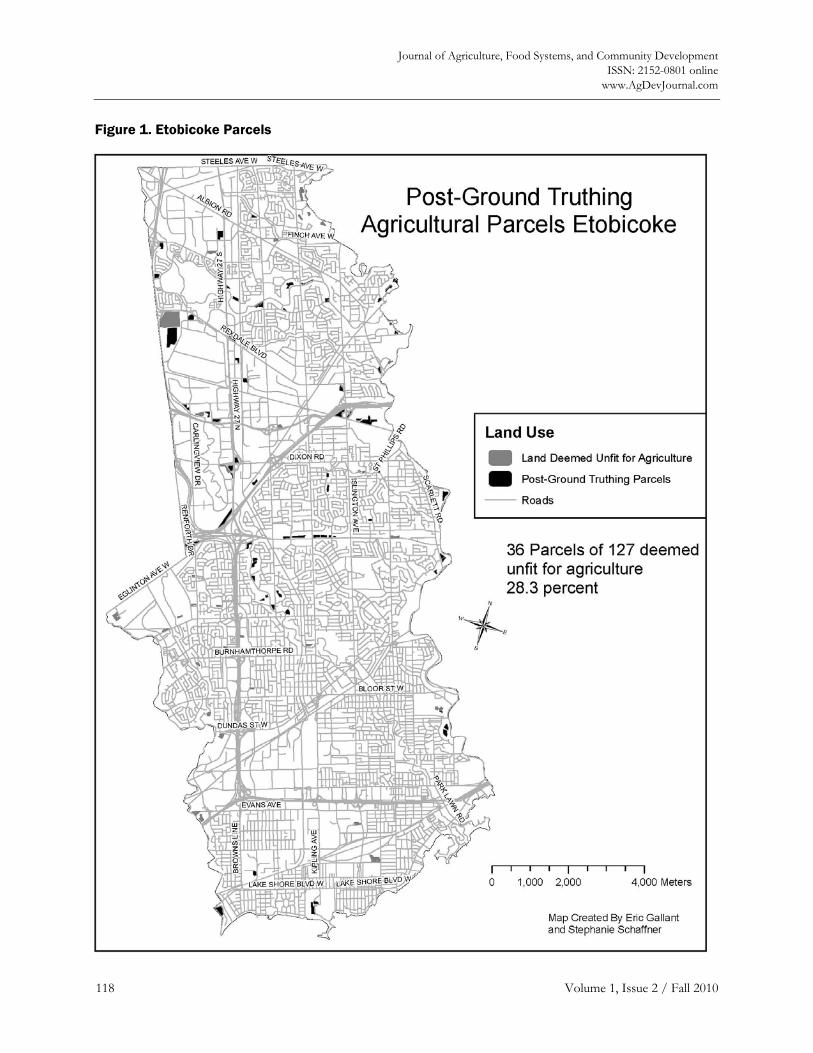
Journal of Agriculture, Food Systems, and Community Development ISSN: 2152-0801 online
www.AgDevJournal.com
118 Volume 1, Issue 2 / Fall 2010
Figure 1. Etobicoke Parcels
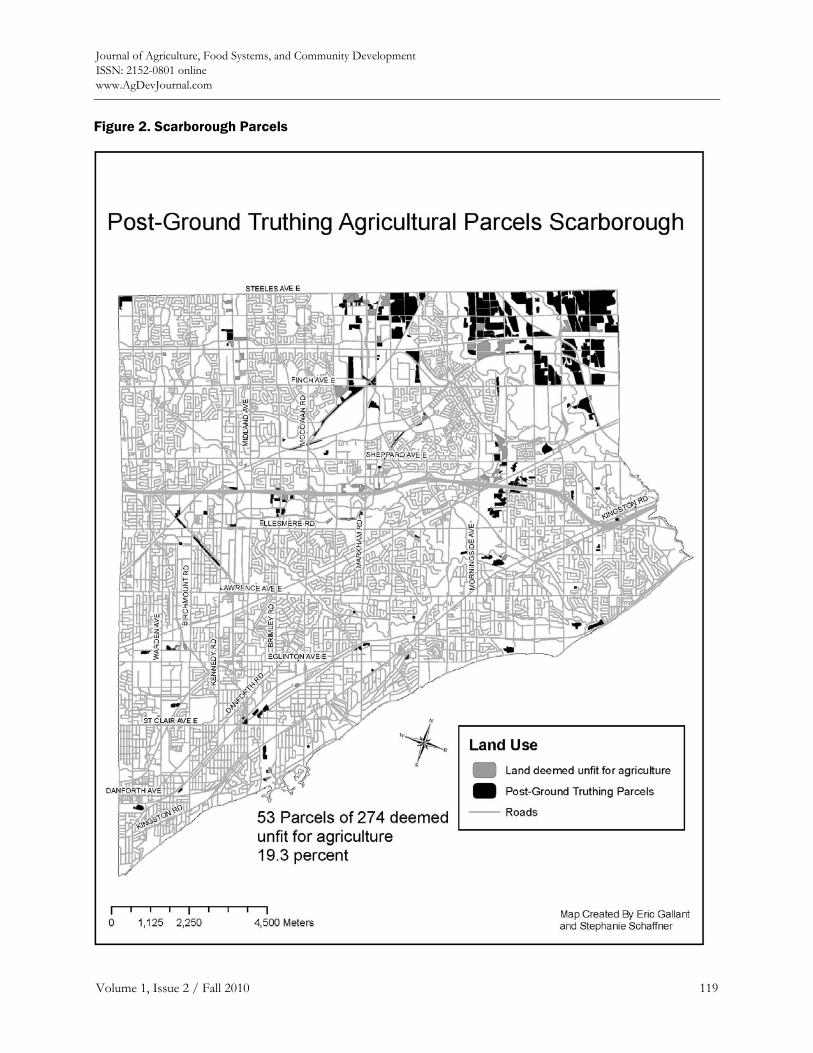
Journal of Agriculture, Food Systems, and Community Development ISSN: 2152-0801 online www.AgDevJournal.com
Volume 1, Issue 2 / Fall 2010 119
Figure 2. Scarborough Parcels
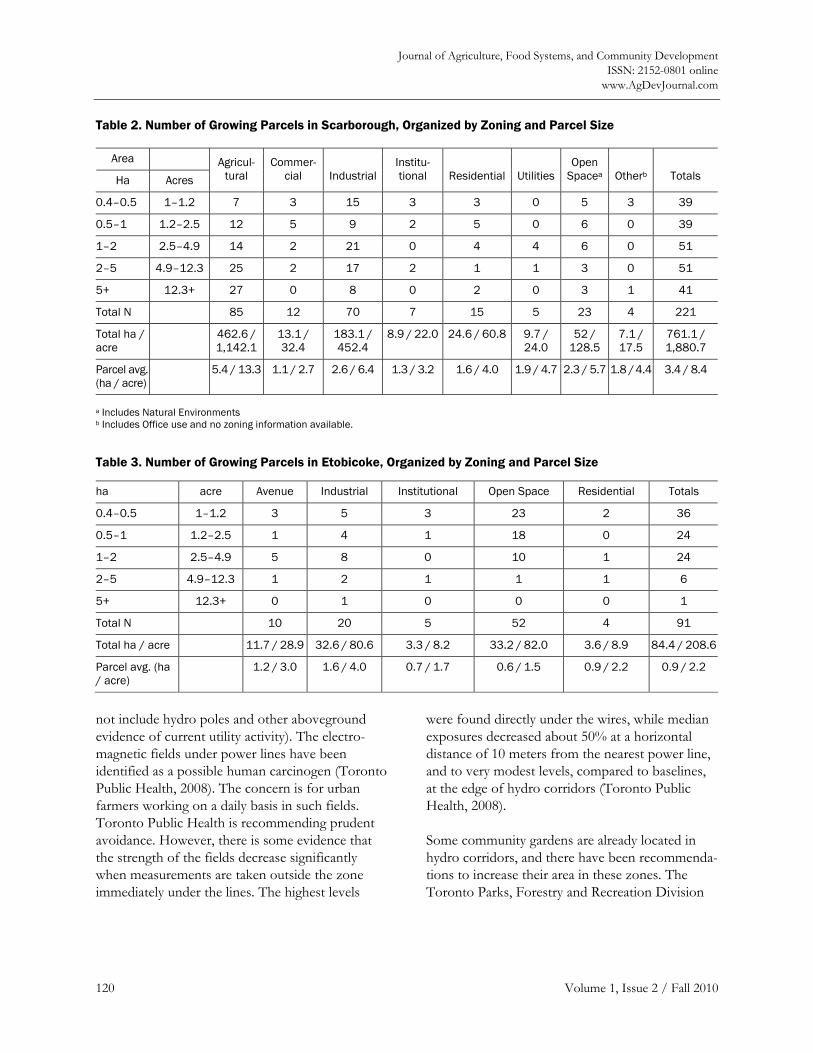
Journal of Agriculture, Food Systems, and Community Development ISSN: 2152-0801 online
www.AgDevJournal.com
120 Volume 1, Issue 2 / Fall 2010
not include hydro poles and other aboveground evidence of current utility activity). The electro-magnetic fields under power lines have been identified as a possible human carcinogen (Toronto Public Health, 2008). The concern is for urban farmers working on a daily basis in such fields. Toronto Public Health is recommending prudent avoidance. However, there is some evidence that the strength of the fields decrease significantly when measurements are taken outside the zone immediately under the lines. The highest levels
were found directly under the wires, while median exposures decreased about 50% at a horizontal distance of 10 meters from the nearest power line, and to very modest levels, compared to baselines, at the edge of hydro corridors (Toronto Public Health, 2008).
Some community gardens are already located in hydro corridors, and there have been recommenda-tions to increase their area in these zones. The Toronto Parks, Forestry and Recreation Division
Table 2. Number of Growing Parcels in Scarborough, Organized by Zoning and Parcel Size
Area
Ha Acres Agricul-
tural Commer-
cial IndustrialInstitu- tional Residential Utilities
Open Spacea Otherb Totals
0.4–0.5 1–1.2 7 3 15 3 3 0 5 3 39
0.5–1 1.2–2.5 12 5 9 2 5 0 6 0 39
1–2 2.5–4.9 14 2 21 0 4 4 6 0 51
2–5 4.9–12.3 25 2 17 2 1 1 3 0 51
5+ 12.3+ 27 0 8 0 2 0 3 1 41
Total N 85 12 70 7 15 5 23 4 221
Total ha / acre
462.6 / 1,142.1
13.1 / 32.4
183.1 / 452.4
8.9 / 22.0 24.6 / 60.8 9.7 / 24.0
52 / 128.5
7.1 / 17.5
761.1 / 1,880.7
Parcel avg. (ha / acre)
5.4 / 13.3 1.1 / 2.7 2.6 / 6.4 1.3 / 3.2 1.6 / 4.0 1.9 / 4.7 2.3 / 5.7 1.8 / 4.4 3.4 / 8.4
a Includes Natural Environments b Includes Office use and no zoning information available.
Table 3. Number of Growing Parcels in Etobicoke, Organized by Zoning and Parcel Size
ha acre Avenue Industrial Institutional Open Space Residential Totals
0.4–0.5 1–1.2 3 5 3 23 2 36
0.5–1 1.2–2.5 1 4 1 18 0 24
1–2 2.5–4.9 5 8 0 10 1 24
2–5 4.9–12.3 1 2 1 1 1 6
5+ 12.3+ 0 1 0 0 0 1
Total N 10 20 5 52 4 91
Total ha / acre 11.7 / 28.9 32.6 / 80.6 3.3 / 8.2 33.2 / 82.0 3.6 / 8.9 84.4 / 208.6
Parcel avg. (ha / acre)
1.2 / 3.0 1.6 / 4.0 0.7 / 1.7 0.6 / 1.5 0.9 / 2.2 0.9 / 2.2
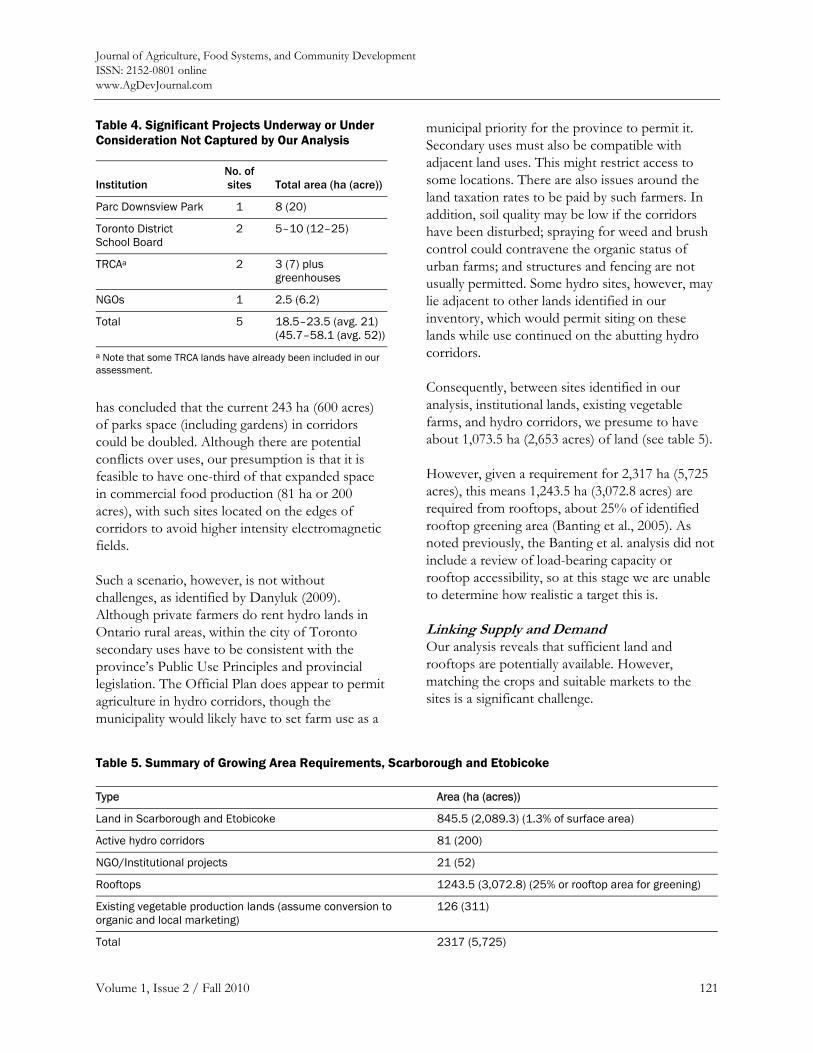
Journal of Agriculture, Food Systems, and Community Development ISSN: 2152-0801 online www.AgDevJournal.com
Volume 1, Issue 2 / Fall 2010 121
has concluded that the current 243 ha (600 acres) of parks space (including gardens) in corridors could be doubled. Although there are potential conflicts over uses, our presumption is that it is feasible to have one-third of that expanded space in commercial food production (81 ha or 200 acres), with such sites located on the edges of corridors to avoid higher intensity electromagnetic fields.
Such a scenario, however, is not without challenges, as identified by Danyluk (2009). Although private farmers do rent hydro lands in Ontario rural areas, within the city of Toronto secondary uses have to be consistent with the province’s Public Use Principles and provincial legislation. The Official Plan does appear to permit agriculture in hydro corridors, though the municipality would likely have to set farm use as a
municipal priority for the province to permit it. Secondary uses must also be compatible with adjacent land uses. This might restrict access to some locations. There are also issues around the land taxation rates to be paid by such farmers. In addition, soil quality may be low if the corridors have been disturbed; spraying for weed and brush control could contravene the organic status of urban farms; and structures and fencing are not usually permitted. Some hydro sites, however, may lie adjacent to other lands identified in our inventory, which would permit siting on these lands while use continued on the abutting hydro corridors.
Consequently, between sites identified in our analysis, institutional lands, existing vegetable farms, and hydro corridors, we presume to have about 1,073.5 ha (2,653 acres) of land (see table 5).
However, given a requirement for 2,317 ha (5,725 acres), this means 1,243.5 ha (3,072.8 acres) are required from rooftops, about 25% of identified rooftop greening area (Banting et al., 2005). As noted previously, the Banting et al. analysis did not include a review of load-bearing capacity or rooftop accessibility, so at this stage we are unable to determine how realistic a target this is.
Linking Supply and Demand Our analysis reveals that sufficient land and rooftops are potentially available. However, matching the crops and suitable markets to the sites is a significant challenge.
Table 5. Summary of Growing Area Requirements, Scarborough and Etobicoke
Type Area (ha (acres))
Land in Scarborough and Etobicoke 845.5 (2,089.3) (1.3% of surface area)
Active hydro corridors 81 (200)
NGO/Institutional projects 21 (52)
Rooftops 1243.5 (3,072.8) (25% or rooftop area for greening)
Existing vegetable production lands (assume conversion to organic and local marketing)
126 (311)
Total 2317 (5,725)
Table 4. Significant Projects Underway or Under Consideration Not Captured by Our Analysis
Institution No. of sites Total area (ha (acre))
Parc Downsview Park 1 8 (20)
Toronto District School Board
2 5–10 (12–25)
TRCAa 2 3 (7) plus greenhouses
NGOs 1 2.5 (6.2)
Total 5 18.5–23.5 (avg. 21) (45.7–58.1 (avg. 52))
a Note that some TRCA lands have already been included in our assessment.
Journal of Agriculture, Food Systems, and Community Development ISSN: 2152-0801 online
www.AgDevJournal.com
122 Volume 1, Issue 2 / Fall 2010
The 91 Etobicoke parcels are small, averaging 0.9 ha (2.2 acres), and dispersed (see figure 1). This pattern lends itself to more intensive production and localized distribution. The 221 parcels in Scarborough average 3.4 ha (8.4 acres), with the agricultural zonings having on average 5.4 ha (13.3 acres), with many significantly larger (see figure 2). Such holdings are better suited to more extensive production.
Regarding farm size and location, certain crops are higher value than others. To maximize viability, it makes sense to match the scale of the operation with both the value of the production and the markets that are interested in high-value crops. For example, salad greens generate more production in a small plot than squash, and their production can be spaced out over the growing season to provide regular and consistent cash flow. This makes greens a more viable production option on small plots and rooftops. Squash, potatoes, and sweet corn, in contrast, work well in a more extensive production environment, as is found on some existing census farms. Many restaurants will desire lettuce deliveries 3–5 times a week, so significant postharvest handling and distribution infrastructure will be required to assure quality and reliability of supply. Squash and potatoes, in contrast, are easier to handle and distribute.
However, according to our analysis there exists something of a mismatch between crops that require larger parcel units and the amount of land available in those parcel sizes. Referring to table 1, sweet corn, squash, potatoes, cabbage, carrots, and asparagus require 1,014 ha (2,506 acres). This would require almost all the ground spaces avail-able for production, including many individual sites that are too small for these crops (see tables 2 and 3). A related challenge is that for reasons of farm finances and appropriate crop rotations, it might not be feasible to allocate all the land in these parcels to this limited set of crops.
For small parcels and rooftop production, there appears to be a better match between requirements of intensively produced crops and available locations. Both small plot land parcels and rooftop
locations, however, have some unique challenges. The dispersed locations and small scale suggest postharvest handling and distribution challenges. Rooftops present load-bearing, physical infrastruc-ture, and access challenges that are different from land parcels. Moving inputs and harvest to and from the roof will be particularly challenging at many sites. They may also present some unique lease and insurance-related dilemmas.
Experiences with local food promotion in Ontario reveal that mainstream retailers and food service companies, and their distributors, tend to be hesitant to purchase local fresh vegetables.21 Independent retail, table-service restaurants, specialty shops, farmers’ markets, box schemes, and CSAs are more promising outlets for Toronto food. See table 6 in the appendix for an analysis of all crop and land use scenarios contrasted with market opportunities.
Conclusions Is it feasible for Toronto to produce 10% of its fresh vegetable requirements from within its own boundary? This level of food production would require 2,317 ha (5,725 acres) to meet current demand. Of this, 1,073.5 ha (2,652.7 acres) of land could be available from existing census farms producing vegetables, lands currently zoned for food production, certain areas zoned for industrial uses, and over 200 small plots (0.4–2 ha or 1–4.9 acres) dotted throughout the northeast and north-west of the city. This area would have to be supple-mented with some combination of production under hydro corridors (potentially problematic because of public health concerns about electro-magnetic frequency), institutional lands in other parts of the city, and rooftop production. The maximum rooftop area required would be about 1,243.5 ha (3,072.8 acres), approximately 25% of the rooftop area identified as generally suitable for rooftop greening in the city of Toronto. Given the types of vegetables required, a combination of extensively (e.g., potatoes, sweet corn, squash,
21 The senior author is a consultant to Local Food Plus, an NGO trying to rebuild local and sustainable food production and distribution capacity.
Journal of Agriculture, Food Systems, and Community Development ISSN: 2152-0801 online www.AgDevJournal.com
Volume 1, Issue 2 / Fall 2010 123
cabbage) and intensively (e.g., lettuce, bok choy) cropped areas would be required. The land and rooftop space available suggests, however, that there would be difficulties meeting requirements for crops such as sweet corn, squash, potatoes, cabbage, carrots, and asparagus. Additionally, there are some unique challenges associated with commercial rooftop vegetable production that would have to be addressed. These totals are modest in comparison with hollowed out urban cities, such as Detroit, where some 10,000 ha (24,711 acres) of land, currently abandoned, might be suitable for agricultural production (Dowie, 2010). But they are broadly consistent with a comparable Oakland study (McClintock & Cooper,
2009) that concluded that 5–10% of that city’s fruit and vegetable requirements (for an estimated population 423,000) could be met from 486 ha (1,201 acres) of food production on 495 aggregated public land sites.
We will be exploring all these themes more fully in forthcoming reports being finalized by our team, including a detailed future scenarios analysis of policy and infrastructure changes to ramp up urban production,22 an inquiry into the potential for urban CSAs, research on urban food distribution and related logistical challenges, and policy and program proposals to support farmers’ market development.
22 An earlier and more wide-ranging version of this paper was published by the Metcalf Foundation as Scaling up urban agriculture in Toronto: Building the infrastructure (Nasr, MacRae, & Kuhns, 2010). This paper addressed both commercial and self-provisioning issues. See http://www.metcalffoundation.com/ downloads/Metcalf_Food_Solutions_Scaling_Up_Urban_ Agriculture_in_Toronto.pdf
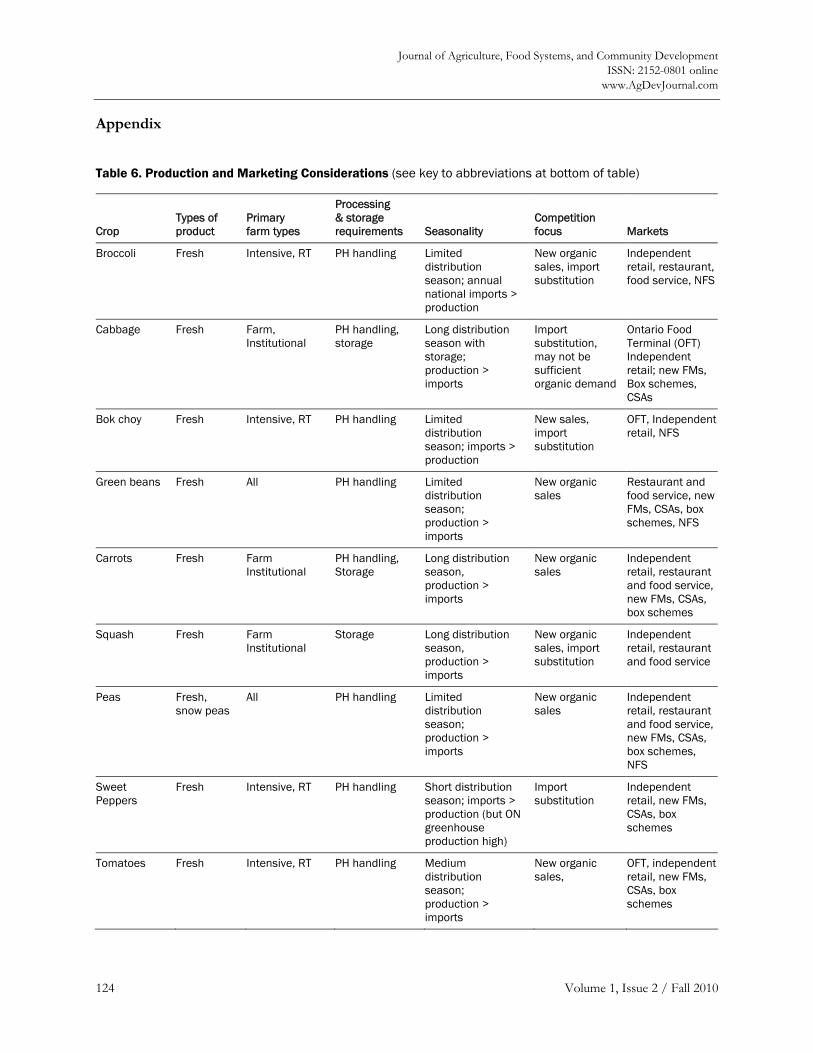
Journal of Agriculture, Food Systems, and Community Development ISSN: 2152-0801 online
www.AgDevJournal.com
124 Volume 1, Issue 2 / Fall 2010
Appendix
Table 6. Production and Marketing Considerations (see key to abbreviations at bottom of table)
Crop Types of product
Primary farm types
Processing & storage requirements Seasonality
Competition focus Markets
Broccoli Fresh Intensive, RT PH handling Limited distribution season; annual national imports > production
New organic sales, import substitution
Independent retail, restaurant, food service, NFS
Cabbage Fresh Farm, Institutional
PH handling, storage
Long distribution season with storage; production > imports
Import substitution, may not be sufficient organic demand
Ontario Food Terminal (OFT) Independent retail; new FMs, Box schemes, CSAs
Bok choy Fresh Intensive, RT PH handling Limited distribution season; imports > production
New sales, import substitution
OFT, Independent retail, NFS
Green beans Fresh All PH handling Limited distribution season; production > imports
New organic sales
Restaurant and food service, new FMs, CSAs, box schemes, NFS
Carrots Fresh Farm Institutional
PH handling, Storage
Long distribution season, production > imports
New organic sales
Independent retail, restaurant and food service, new FMs, CSAs, box schemes
Squash Fresh Farm Institutional
Storage Long distribution season, production > imports
New organic sales, import substitution
Independent retail, restaurant and food service
Peas Fresh, snow peas
All PH handling Limited distribution season; production > imports
New organic sales
Independent retail, restaurant and food service, new FMs, CSAs, box schemes, NFS
Sweet Peppers
Fresh Intensive, RT PH handling Short distribution season; imports > production (but ON greenhouse production high)
Import substitution
Independent retail, new FMs, CSAs, box schemes
Tomatoes Fresh Intensive, RT PH handling Medium distribution season; production > imports
New organic sales,
OFT, independent retail, new FMs, CSAs, box schemes
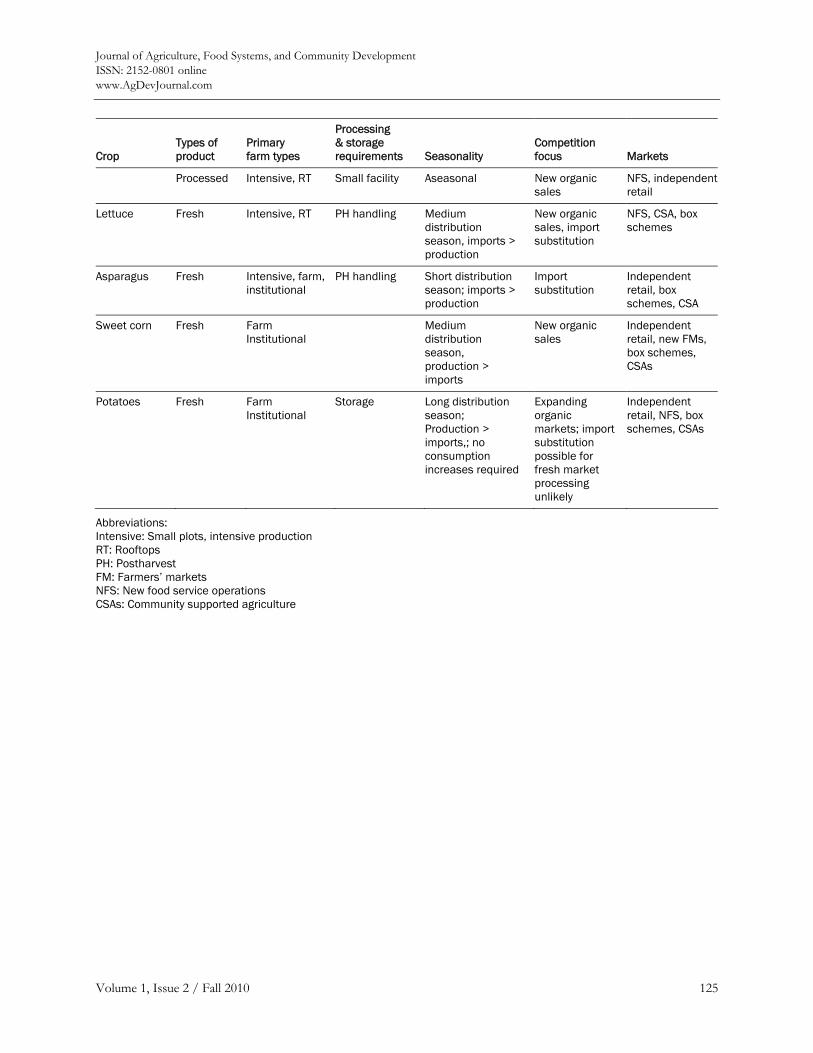
Journal of Agriculture, Food Systems, and Community Development ISSN: 2152-0801 online www.AgDevJournal.com
Volume 1, Issue 2 / Fall 2010 125
Crop Types of product
Primary farm types
Processing & storage requirements Seasonality
Competition focus Markets
Processed Intensive, RT Small facility Aseasonal New organic sales
NFS, independent retail
Lettuce Fresh Intensive, RT PH handling Medium distribution season, imports > production
New organic sales, import substitution
NFS, CSA, box schemes
Asparagus Fresh Intensive, farm, institutional
PH handling Short distribution season; imports > production
Import substitution
Independent retail, box schemes, CSA
Sweet corn Fresh Farm Institutional
Medium distribution season, production > imports
New organic sales
Independent retail, new FMs, box schemes, CSAs
Potatoes Fresh Farm Institutional
Storage Long distribution season; Production > imports,; no consumption increases required
Expanding organic markets; import substitution possible for fresh market processing unlikely
Independent retail, NFS, box schemes, CSAs
Abbreviations: Intensive: Small plots, intensive production RT: Rooftops PH: Postharvest FM: Farmers’ markets NFS: New food service operations CSAs: Community supported agriculture
Journal of Agriculture, Food Systems, and Community Development ISSN: 2152-0801 online
www.AgDevJournal.com
126 Volume 1, Issue 2 / Fall 2010
References Banting, D., Doshi, H., Li, J., Missios, P., Au, A., Currie,
B. and Verrati, M. (2005). Report on the environmental benefits and costs of green roof technology for the city of Toronto. Report to the City of Toronto and Ontario Centres of Excellence – Earth and Environmental Technologies (OCE-ETech). Toronto: Ryerson University. http://www.toronto.ca/greenroofs/ pdf/fullreport103105.pdf
City Farmer (2002a). City dwellers are growing good in surprising numbers! http://www.cityfarmer.org/ 40percent.html
City Farmer (2002b). 44% of Vancouver households grow food. Retrieved from http://www.cityfarmer. org/44percent.html#44percent
City of Toronto. Toronto Official Plan (2006). Retrieved from http://www.toronto.ca/planning/official_ plan/pdf_chapter15/chapters1_5_aug2007.pdf
City of Toronto (2009, May). Identifying urban agriculture opportunities in the city of Toronto, Report to Parks and Environment Committee from Oates, L. and Patterson, B. Toronto Environment Office and Department of Parks, Forestry, and Recreation.
Cook, B. (2008). State of Toronto’s food. Toronto: Toronto Department of Public Health.
Danyluk, M. (2009). Cultivating potential: Planning for urban agriculture in Toronto’s hydro corridors. Current Issues Paper Final Report. Toronto: Geography Department, University of Toronto.
Desjardins, E., MacRae, R., & Schumilas, T. (2010). Linking future population food requirements for health with local production in Waterloo, Canada. Agriculture and Human Values, 27(2), 129–140. doi:10.1007/s10460-009-9204-y
Dowie, M. (2010, April 30). Food among the ruins: Should Detroit be converted into a farming mecca? Alternet. Retrieved from http://www.alternet.org/ food/146667/food_among_the_ruins%3A_should_detroit_be_converted_into_a_farming_mecca_?page=1
Fischetti, M. (2008, September 29). Growing vertical, skyscraper farming: Cultivating crops in downtown skyscrapers might save bushels of energy and provide city dwellers with distinctively fresh food. Scientific American [Special edition].
Food and Hunger Action Committee (FHAC), City of Toronto (2001). The growing season, phase II. Toronto: Food and Hunger Action Committee.
Fram, M. (2009). Greenhouse Toronto, once upon a time. In C. Palassio and A. Wilcox (Eds.), The Edible City: Toronto’s Food from Farm to Fork (pp. 140–147). Toronto: Coach House Press.
Gomiero, T., Paoletti, M., & Pimentel, D. (2008). Energy and environmental issues in organic and conventional agriculture. Critical Reviews in Plant Sciences, 27(4), 239–254. doi:10.1080/07352680802225456
Gorrie, P. (2009, April 3). Environment: Where farm meets city, hello sty-scrapers! IPSNews. http://www.ipsnews.net/news.asp?idnews=46388
Health Canada. (2007). Canada’s food guide. Ottawa: Health Canada.
Horst, M. (2008). Growing green: An inventory of lands suitable for community gardening in Seattle. Seattle, WA: University of Washington, College of Architecture and Urban Planning. http://faculty.washington. edu/bborn/Growing%20Green.pdf
Johnson, L. (2009). Revisiting victory: Gardens past, gardens future. In C. Palassio and A. Wilcox (Eds.), The Edible City: Toronto’s Food from Farm to Fork (pp. 58–65). Toronto: Coach House Press.
Kanengoni, T. (2010). Energy use and CO2 emissions reductions associated with household gardening and composting. MES Major Paper, Toronto, ON: Faculty of Environmental Studies, York University.
Kaufman, J., & Bailkey, M. (2000). Farming inside cities: Entrepreneurial urban agriculture in the United States. Lincoln Institute of Land Policy – Working Paper. Retrieved from http://queencityfarm.org/Farming InsideCities.pdf
Kortright, R. (2007). Edible backyards: Residential land use for food production in Toronto (master’s thesis). Department of Geography, University of Toronto.
Kortright R., & Wakefield, S. (2010). Edible backyards: A qualitative study of household food growing and its contributions to food security. Agriculture and Human Values. doi:10.1007/s10460-009-9254-1
Lagerwerff, J. V., & Specht, A. W. (1970). Contamina-tion of roadside soil and vegetation with cadmium, nickel, lead and zinc. Environmental Science and Technology, 4(7), 583–586. doi:10.1021/es60042a001
Lister, N. M. (2007). Placing Food. In: J. Knechtel (Ed.). Food. Boston: MIT Press.
Lue, T., & Koc, M. (1999). Why worry about Y2K? Food security and emergency preparedness for the year 2000. Toronto: Centre for Studies in Food Security, Ryerson University.
Journal of Agriculture, Food Systems, and Community Development ISSN: 2152-0801 online www.AgDevJournal.com
Volume 1, Issue 2 / Fall 2010 127
Lynch, D. (2009). Environmental impacts of organic agriculture: A Canadian perspective. Canadian Journal of Plant Science, 89, 621–628. doi:10.4141/CJPS08165
MacRae, R. J, Martin, R. C., Juhasz, M., & Langer, J. (2009). Ten percent organic within 15 years: Policy and programme initiatives to advance organic food and farming in Ontario, Canada. Renewable Agriculture and Food Systems, 24(2), 120–136. doi:10.1017/S1742170509002531
McClintock, N., & Cooper, J. (2009). Cultivating the commons: An assessment of the potential for urban agriculture on Oakland’s public lands. Berkeley: Department of Geography, University of California. Retrieved from http://www.oakland food.org/media/ AA/AD/oaklandfood-org/ downloads/27621/Cultivating_the_Commons_ COMPLETE.pdf
Mendes, W., Balmer, K., Kaethler, T., & Rhoads, A. (2008). Using land inventories to plan for urban agriculture: Experiences from Portland and Vancouver. Journal of the American Planning Association, 74(4), 435–449. doi:10.1080/01944360802354923
Nasr, J., MacRae, R., & Kuhns, J. (2010, June). Scaling up urban agriculture in Toronto: Building the infrastructure. Toronto: George Cedric Metcalf Charitable Foundation.
Schrivener, L. (2008, May 4). Poultry in motion: Chickens adopting urban lifestyle. Toronto Star. Retrieved from http://www.thestar.com/News/ GTA/article/421205
Statistics Canada. (2001). Food consumption in Canada: Part II. Ottawa: Statistics Canada. Retrieved from
http://www. statcan.ca/english/freepub/32-230-XIB/0000132-230-XIB.pdf
Statistics Canada. (2007a). 2006 Census of Agriculture. Ottawa: Statistics Canada.
Statistics Canada. (2007b). Portrait of the Canadian population in 2006, 2006 Census. Catalogue no. 97-550-XIE. Ottawa: Statistics Canada.
Statistics Canada. (2007c). Households and the environment 2006, Catalogue no. 11-526-XIE. Ottawa: Statistics Canada.
Toronto and Region Conservation Authority (TRCA). (2007). Terrestrial natural heritage system plan. Toronto: TRCA.
Toronto and Region Conservation Authority (TRCA). (2008). Draft TRCA operational procedures and guidelines for near urban agriculture. Toronto: TRCA.
Toronto Food Policy Council (TFPC). (1999). Feeding the city from the back 40: A commercial food production plan for the city of Toronto. Toronto: Toronto Food Policy Council. Retrieved from http://www.toronto. ca/health/tfpc_feeding.pdf
Toronto Public Health. (2008). An assessment of health implications associated with exposures to electromagnetic fields in and next to hydro corridors in the city of Toronto. Toronto: Toronto Public Health.
Xuereb, M. (2005). Food miles: Environmental implications of food imports to Waterloo region. Waterloo, ON: Region of Waterloo Public Health Department.
Young, C. (2009). Growing Toronto’s farmers markets: Towards a comprehensive municipal policy (unpublished master in environmental studies major paper). Faculty of Environmental Studies, York University, Toronto.

Journal of Agriculture, Food Systems, and Community Development ISSN: 2152-0801 online
www.AgDevJournal.com
128 Volume 1, Issue 2 / Fall 2010
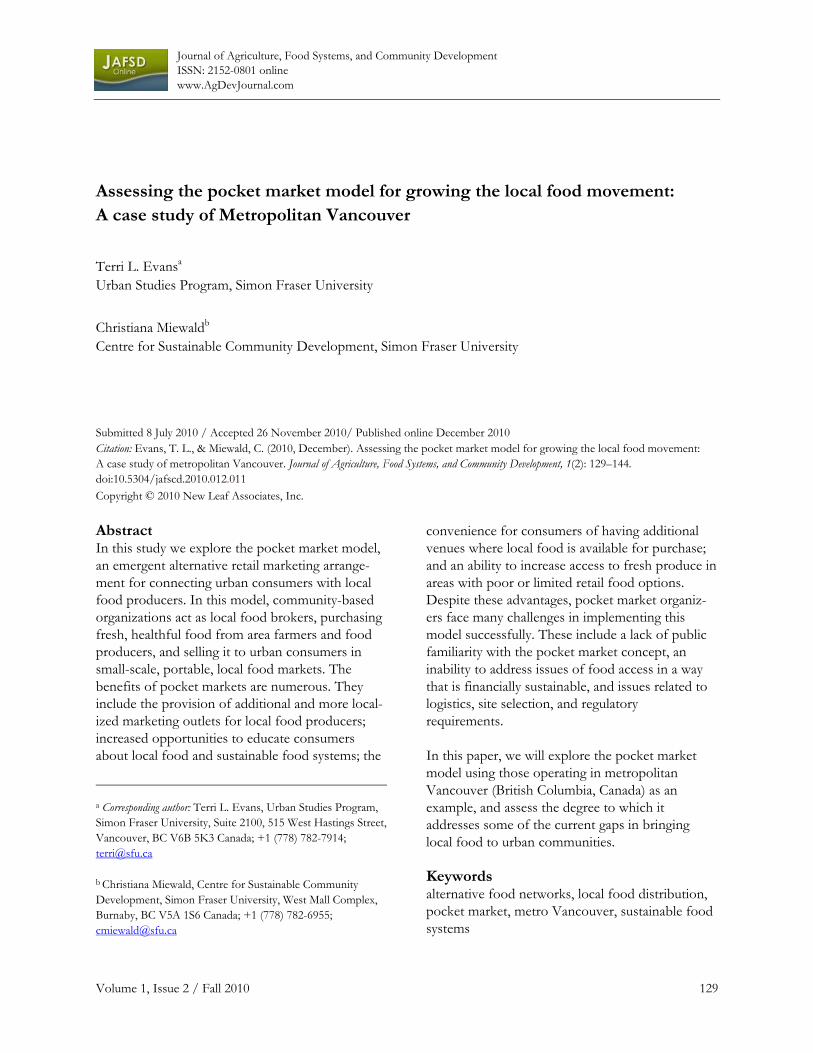
Journal of Agriculture, Food Systems, and Community Development ISSN: 2152-0801 online www.AgDevJournal.com
Volume 1, Issue 2 / Fall 2010 129
Assessing the pocket market model for growing the local food movement: A case study of Metropolitan Vancouver
Terri L. Evansa Urban Studies Program, Simon Fraser University
Christiana Miewaldb Centre for Sustainable Community Development, Simon Fraser University
Submitted 8 July 2010 / Accepted 26 November 2010/ Published online December 2010 Citation: Evans, T. L., & Miewald, C. (2010, December). Assessing the pocket market model for growing the local food movement: A case study of metropolitan Vancouver. Journal of Agriculture, Food Systems, and Community Development, 1(2): 129–144. doi:10.5304/jafscd.2010.012.011
Copyright © 2010 New Leaf Associates, Inc.
Abstract In this study we explore the pocket market model, an emergent alternative retail marketing arrange-ment for connecting urban consumers with local food producers. In this model, community-based organizations act as local food brokers, purchasing fresh, healthful food from area farmers and food producers, and selling it to urban consumers in small-scale, portable, local food markets. The benefits of pocket markets are numerous. They include the provision of additional and more local-ized marketing outlets for local food producers; increased opportunities to educate consumers about local food and sustainable food systems; the
convenience for consumers of having additional venues where local food is available for purchase; and an ability to increase access to fresh produce in areas with poor or limited retail food options. Despite these advantages, pocket market organiz-ers face many challenges in implementing this model successfully. These include a lack of public familiarity with the pocket market concept, an inability to address issues of food access in a way that is financially sustainable, and issues related to logistics, site selection, and regulatory requirements.
In this paper, we will explore the pocket market model using those operating in metropolitan Vancouver (British Columbia, Canada) as an example, and assess the degree to which it addresses some of the current gaps in bringing local food to urban communities.
Keywords alternative food networks, local food distribution, pocket market, metro Vancouver, sustainable food systems
a Corresponding author: Terri L. Evans, Urban Studies Program, Simon Fraser University, Suite 2100, 515 West Hastings Street, Vancouver, BC V6B 5K3 Canada; +1 (778) 782-7914; [email protected]
b Christiana Miewald, Centre for Sustainable Community Development, Simon Fraser University, West Mall Complex, Burnaby, BC V5A 1S6 Canada; +1 (778) 782-6955; [email protected]
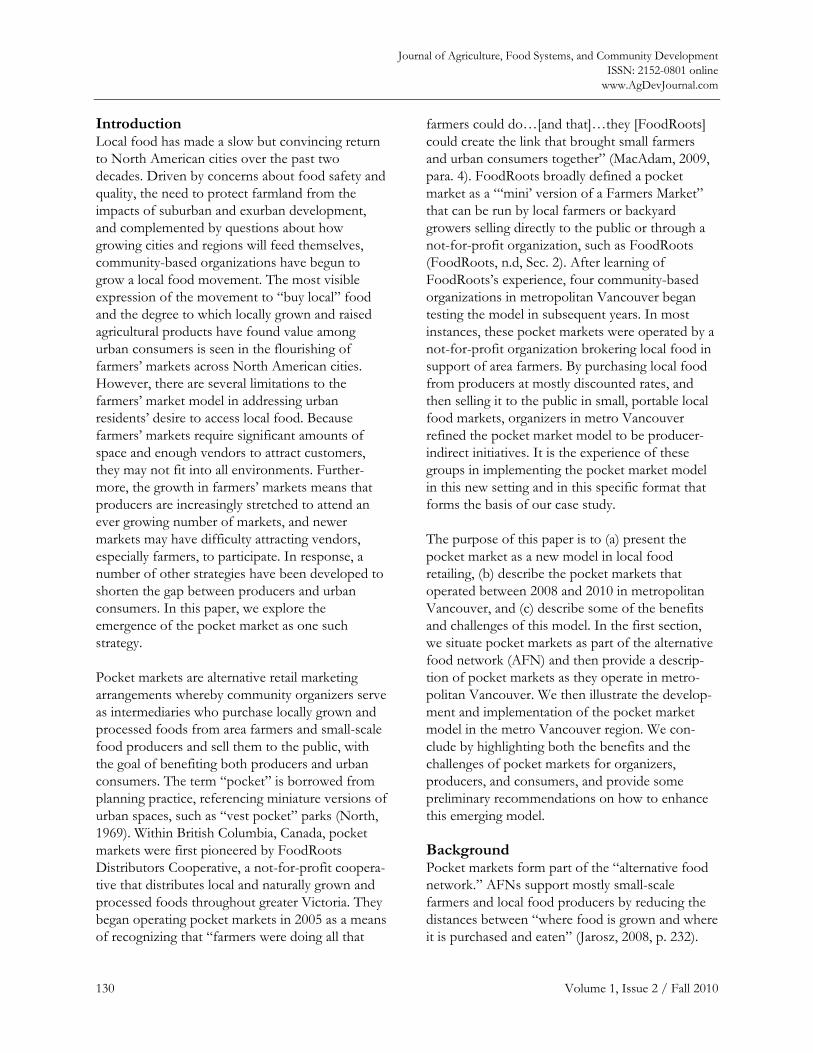
Journal of Agriculture, Food Systems, and Community Development ISSN: 2152-0801 online
www.AgDevJournal.com
130 Volume 1, Issue 2 / Fall 2010
Introduction Local food has made a slow but convincing return to North American cities over the past two decades. Driven by concerns about food safety and quality, the need to protect farmland from the impacts of suburban and exurban development, and complemented by questions about how growing cities and regions will feed themselves, community-based organizations have begun to grow a local food movement. The most visible expression of the movement to “buy local” food and the degree to which locally grown and raised agricultural products have found value among urban consumers is seen in the flourishing of farmers’ markets across North American cities. However, there are several limitations to the farmers’ market model in addressing urban residents’ desire to access local food. Because farmers’ markets require significant amounts of space and enough vendors to attract customers, they may not fit into all environments. Further-more, the growth in farmers’ markets means that producers are increasingly stretched to attend an ever growing number of markets, and newer markets may have difficulty attracting vendors, especially farmers, to participate. In response, a number of other strategies have been developed to shorten the gap between producers and urban consumers. In this paper, we explore the emergence of the pocket market as one such strategy.
Pocket markets are alternative retail marketing arrangements whereby community organizers serve as intermediaries who purchase locally grown and processed foods from area farmers and small-scale food producers and sell them to the public, with the goal of benefiting both producers and urban consumers. The term “pocket” is borrowed from planning practice, referencing miniature versions of urban spaces, such as “vest pocket” parks (North, 1969). Within British Columbia, Canada, pocket markets were first pioneered by FoodRoots Distributors Cooperative, a not-for-profit coopera-tive that distributes local and naturally grown and processed foods throughout greater Victoria. They began operating pocket markets in 2005 as a means of recognizing that “farmers were doing all that
farmers could do…[and that]…they [FoodRoots] could create the link that brought small farmers and urban consumers together” (MacAdam, 2009, para. 4). FoodRoots broadly defined a pocket market as a “‘mini’ version of a Farmers Market” that can be run by local farmers or backyard growers selling directly to the public or through a not-for-profit organization, such as FoodRoots (FoodRoots, n.d, Sec. 2). After learning of FoodRoots’s experience, four community-based organizations in metropolitan Vancouver began testing the model in subsequent years. In most instances, these pocket markets were operated by a not-for-profit organization brokering local food in support of area farmers. By purchasing local food from producers at mostly discounted rates, and then selling it to the public in small, portable local food markets, organizers in metro Vancouver refined the pocket market model to be producer-indirect initiatives. It is the experience of these groups in implementing the pocket market model in this new setting and in this specific format that forms the basis of our case study.
The purpose of this paper is to (a) present the pocket market as a new model in local food retailing, (b) describe the pocket markets that operated between 2008 and 2010 in metropolitan Vancouver, and (c) describe some of the benefits and challenges of this model. In the first section, we situate pocket markets as part of the alternative food network (AFN) and then provide a descrip-tion of pocket markets as they operate in metro-politan Vancouver. We then illustrate the develop-ment and implementation of the pocket market model in the metro Vancouver region. We con-clude by highlighting both the benefits and the challenges of pocket markets for organizers, producers, and consumers, and provide some preliminary recommendations on how to enhance this emerging model.
Background Pocket markets form part of the “alternative food network.” AFNs support mostly small-scale farmers and local food producers by reducing the distances between “where food is grown and where it is purchased and eaten” (Jarosz, 2008, p. 232).
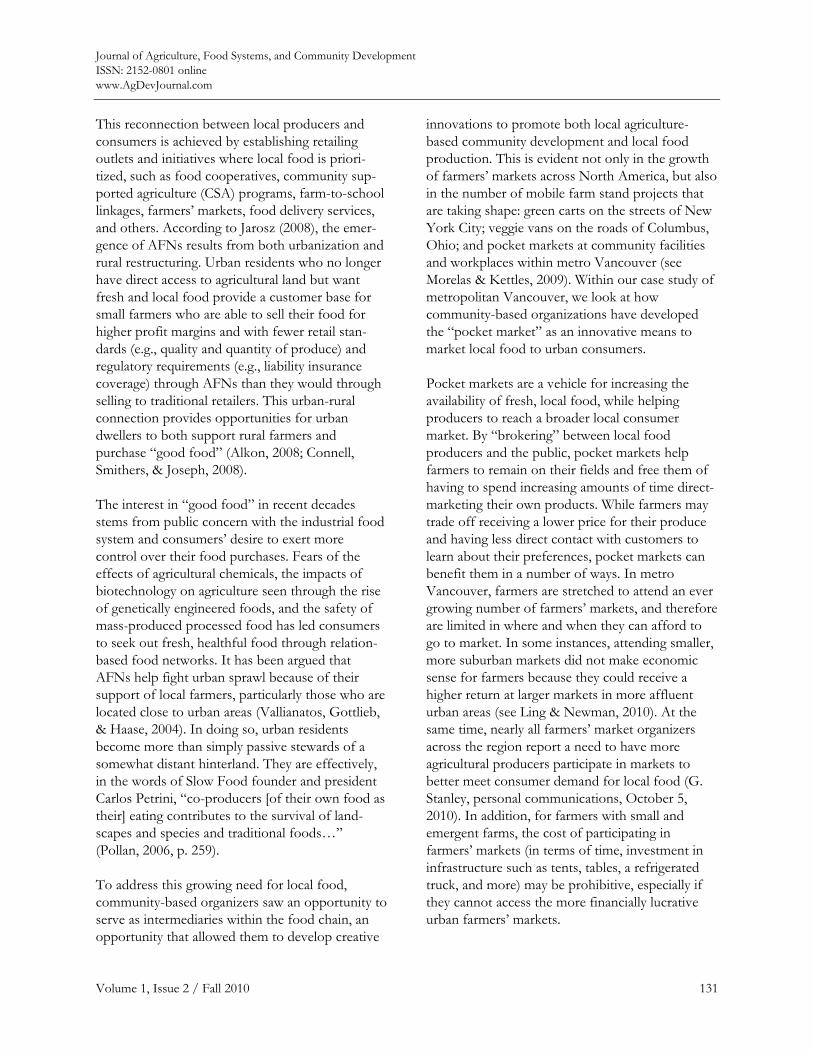
Journal of Agriculture, Food Systems, and Community Development ISSN: 2152-0801 online www.AgDevJournal.com
Volume 1, Issue 2 / Fall 2010 131
This reconnection between local producers and consumers is achieved by establishing retailing outlets and initiatives where local food is priori-tized, such as food cooperatives, community sup-ported agriculture (CSA) programs, farm-to-school linkages, farmers’ markets, food delivery services, and others. According to Jarosz (2008), the emer-gence of AFNs results from both urbanization and rural restructuring. Urban residents who no longer have direct access to agricultural land but want fresh and local food provide a customer base for small farmers who are able to sell their food for higher profit margins and with fewer retail stan-dards (e.g., quality and quantity of produce) and regulatory requirements (e.g., liability insurance coverage) through AFNs than they would through selling to traditional retailers. This urban-rural connection provides opportunities for urban dwellers to both support rural farmers and purchase “good food” (Alkon, 2008; Connell, Smithers, & Joseph, 2008).
The interest in “good food” in recent decades stems from public concern with the industrial food system and consumers’ desire to exert more control over their food purchases. Fears of the effects of agricultural chemicals, the impacts of biotechnology on agriculture seen through the rise of genetically engineered foods, and the safety of mass-produced processed food has led consumers to seek out fresh, healthful food through relation-based food networks. It has been argued that AFNs help fight urban sprawl because of their support of local farmers, particularly those who are located close to urban areas (Vallianatos, Gottlieb, & Haase, 2004). In doing so, urban residents become more than simply passive stewards of a somewhat distant hinterland. They are effectively, in the words of Slow Food founder and president Carlos Petrini, “co-producers [of their own food as their] eating contributes to the survival of land-scapes and species and traditional foods…” (Pollan, 2006, p. 259).
To address this growing need for local food, community-based organizers saw an opportunity to serve as intermediaries within the food chain, an opportunity that allowed them to develop creative
innovations to promote both local agriculture-based community development and local food production. This is evident not only in the growth of farmers’ markets across North America, but also in the number of mobile farm stand projects that are taking shape: green carts on the streets of New York City; veggie vans on the roads of Columbus, Ohio; and pocket markets at community facilities and workplaces within metro Vancouver (see Morelas & Kettles, 2009). Within our case study of metropolitan Vancouver, we look at how community-based organizations have developed the “pocket market” as an innovative means to market local food to urban consumers.
Pocket markets are a vehicle for increasing the availability of fresh, local food, while helping producers to reach a broader local consumer market. By “brokering” between local food producers and the public, pocket markets help farmers to remain on their fields and free them of having to spend increasing amounts of time direct-marketing their own products. While farmers may trade off receiving a lower price for their produce and having less direct contact with customers to learn about their preferences, pocket markets can benefit them in a number of ways. In metro Vancouver, farmers are stretched to attend an ever growing number of farmers’ markets, and therefore are limited in where and when they can afford to go to market. In some instances, attending smaller, more suburban markets did not make economic sense for farmers because they could receive a higher return at larger markets in more affluent urban areas (see Ling & Newman, 2010). At the same time, nearly all farmers’ market organizers across the region report a need to have more agricultural producers participate in markets to better meet consumer demand for local food (G. Stanley, personal communications, October 5, 2010). In addition, for farmers with small and emergent farms, the cost of participating in farmers’ markets (in terms of time, investment in infrastructure such as tents, tables, a refrigerated truck, and more) may be prohibitive, especially if they cannot access the more financially lucrative urban farmers’ markets.
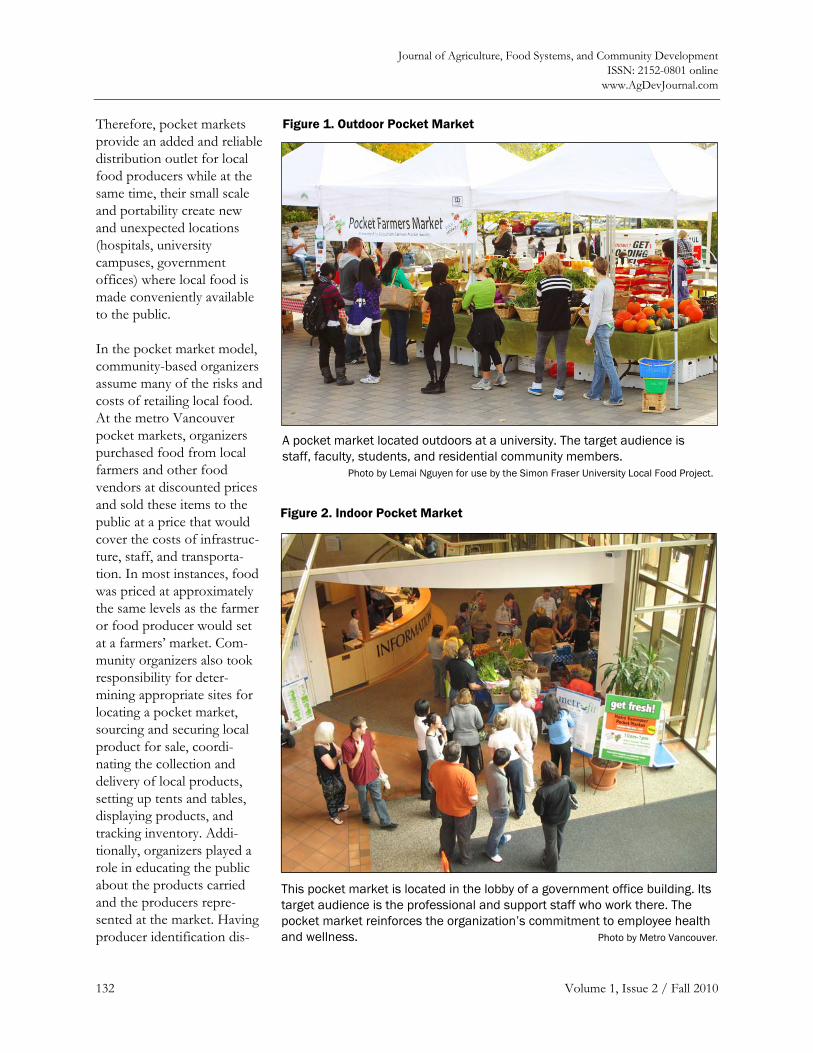
Journal of Agriculture, Food Systems, and Community Development ISSN: 2152-0801 online
www.AgDevJournal.com
132 Volume 1, Issue 2 / Fall 2010
Therefore, pocket markets provide an added and reliable distribution outlet for local food producers while at the same time, their small scale and portability create new and unexpected locations (hospitals, university campuses, government offices) where local food is made conveniently available to the public.
In the pocket market model, community-based organizers assume many of the risks and costs of retailing local food. At the metro Vancouver pocket markets, organizers purchased food from local farmers and other food vendors at discounted prices and sold these items to the public at a price that would cover the costs of infrastruc-ture, staff, and transporta-tion. In most instances, food was priced at approximately the same levels as the farmer or food producer would set at a farmers’ market. Com-munity organizers also took responsibility for deter-mining appropriate sites for locating a pocket market, sourcing and securing local product for sale, coordi-nating the collection and delivery of local products, setting up tents and tables, displaying products, and tracking inventory. Addi-tionally, organizers played a role in educating the public about the products carried and the producers repre-sented at the market. Having producer identification dis-
Figure 1. Outdoor Pocket Market
A pocket market located outdoors at a university. The target audience is staff, faculty, students, and residential community members. Photo by Lemai Nguyen for use by the Simon Fraser University Local Food Project.
Figure 2. Indoor Pocket Market
This pocket market is located in the lobby of a government office building. Its target audience is the professional and support staff who work there. The pocket market reinforces the organization’s commitment to employee health and wellness. Photo by Metro Vancouver.
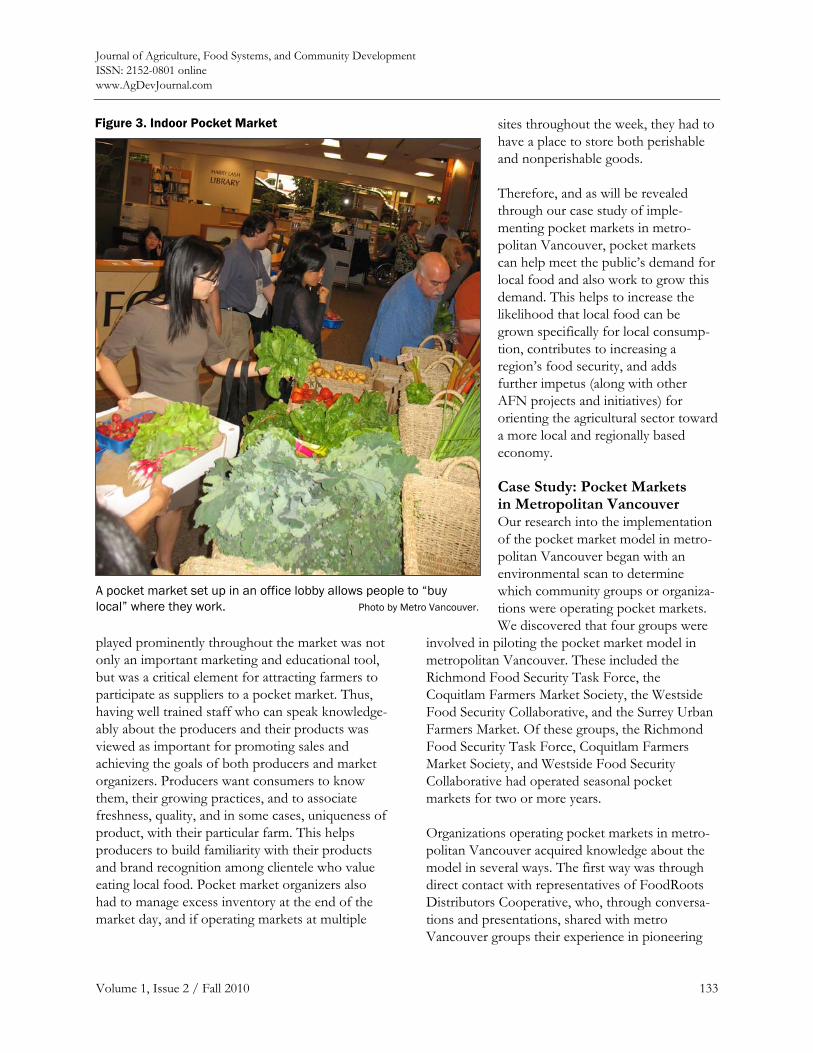
Journal of Agriculture, Food Systems, and Community Development ISSN: 2152-0801 online www.AgDevJournal.com
Volume 1, Issue 2 / Fall 2010 133
played prominently throughout the market was not only an important marketing and educational tool, but was a critical element for attracting farmers to participate as suppliers to a pocket market. Thus, having well trained staff who can speak knowledge-ably about the producers and their products was viewed as important for promoting sales and achieving the goals of both producers and market organizers. Producers want consumers to know them, their growing practices, and to associate freshness, quality, and in some cases, uniqueness of product, with their particular farm. This helps producers to build familiarity with their products and brand recognition among clientele who value eating local food. Pocket market organizers also had to manage excess inventory at the end of the market day, and if operating markets at multiple
sites throughout the week, they had to have a place to store both perishable and nonperishable goods.
Therefore, and as will be revealed through our case study of imple-menting pocket markets in metro-politan Vancouver, pocket markets can help meet the public’s demand for local food and also work to grow this demand. This helps to increase the likelihood that local food can be grown specifically for local consump-tion, contributes to increasing a region’s food security, and adds further impetus (along with other AFN projects and initiatives) for orienting the agricultural sector toward a more local and regionally based economy.
Case Study: Pocket Markets in Metropolitan Vancouver Our research into the implementation of the pocket market model in metro-politan Vancouver began with an environmental scan to determine which community groups or organiza-tions were operating pocket markets. We discovered that four groups were
involved in piloting the pocket market model in metropolitan Vancouver. These included the Richmond Food Security Task Force, the Coquitlam Farmers Market Society, the Westside Food Security Collaborative, and the Surrey Urban Farmers Market. Of these groups, the Richmond Food Security Task Force, Coquitlam Farmers Market Society, and Westside Food Security Collaborative had operated seasonal pocket markets for two or more years.
Organizations operating pocket markets in metro-politan Vancouver acquired knowledge about the model in several ways. The first way was through direct contact with representatives of FoodRoots Distributors Cooperative, who, through conversa-tions and presentations, shared with metro Vancouver groups their experience in pioneering
Figure 3. Indoor Pocket Market
A pocket market set up in an office lobby allows people to “buy local” where they work. Photo by Metro Vancouver.
Journal of Agriculture, Food Systems, and Community Development ISSN: 2152-0801 online
www.AgDevJournal.com
134 Volume 1, Issue 2 / Fall 2010
pocket markets on nearby Vancouver Island. The second way that groups learned of the pocket market model was through consulting the online toolkit that FoodRoots had developed and posted to its website. Thirdly, groups within metro Vancouver shared their knowledge of and experi-ence with implementing the pocket market model with each other. For example, after most groups had operated pocket markets for at least one year, representatives from the Richmond, Coquitlam, and Westside groups held a teleconference to share experiences, glean deeper understandings of opera-tional practices, and explore opportunities for collaboration. Through these exchanges and interactions, groups adapted and refined the pocket market model to suit their particular circumstances.
We contacted all groups with requests for project-related reports and summaries, customer surveys, and financial reports. After analyzing the materials provided to us, we conducted semi-structured interviews with representatives of the four groups operating pocket markets in metro Vancouver, as well as a representative from FoodRoots. In addi-tion, we conducted interviews with several farmers who participated in selling their food to pocket market organizers, and who also are involved with direct marketing at farmers’ markets, through farm gate sales, and/or as part of local food distribution networks. We analyzed these interviews for conver-gent and divergent themes. Finally, both authors have been active participants in developing farmers’ and pocket markets in metropolitan Vancouver and have drawn on this experience as well.
All groups involved in testing the pocket market model in metro Vancouver have social action as part of their mandates, with local food as a particu-lar focus. As table 1 (next page) indicates, the motivations behind operating a pocket market vary among the groups. The Richmond Food Security Task Force, the Westside Food Security Collabora-tive, and to a lesser degree the Surrey Urban Farmers Market were primarily focused on addressing the food needs of vulnerable popula-tions. For the Richmond Food Security Task Force, pocket markets offered a “feasible way to
support local food and provid[e] food to difficult to reach neighborhoods” (A. Hamir, personal communication, December 14, 2009). Similarly, the Westside Food Security Collaborative was acting on a research study that showed that food insecur-ity was a real, yet largely hidden, issue within a wealthy enclave in the city of Vancouver, especially among the population of seniors (Pottery & Jinkerson, 2007). For the third group operating pocket markets, the Coquitlam Farmers Market Society, the motivation was to provide local food to areas where a full farmers’ market may prove unfeasible. By targeting students, office workers, and the general public who frequent community facilities, this group focused on better connecting middle-class consumers with local food options. In Surrey, piloting a pocket market at a seniors’ centre allowed for the provision of fresh produce to underserved populations, especially seniors, refugees, and new immigrants.
Most groups studied were explicitly committed to securing local produce from within their own municipality as a first priority and within the wider region as a secondary priority. The Coquitlam Farmers Market Society and the Surrey Urban Farmers Market were able to draw on their farmers’ market vendor base to make purchasing arrangements. The Richmond Food Security Task Force and the Westside Food Security Collabora-tive approached area farmers to secure local pro-duce for sale. The Richmond group also sourced local foods from a produce distribution company when extra supply was needed. While all pocket markets sold exclusively local produce, there were differences between the markets in regard to their support of local producers whose growing methods and practices fell along a spectrum that ranged from organic to spray- or pesticide-free, to conventional. While providing only organic pro-duce may help to support a more sustainable food system, organics also tended to be more expensive and therefore potentially inaccessible to people with limited incomes. For example, the Richmond pocket market chose not to carry organic produce in part because of issues of financial accessibility for their customers (A. Hamir, personal communi-cation, December 14, 2009). Similarly, the
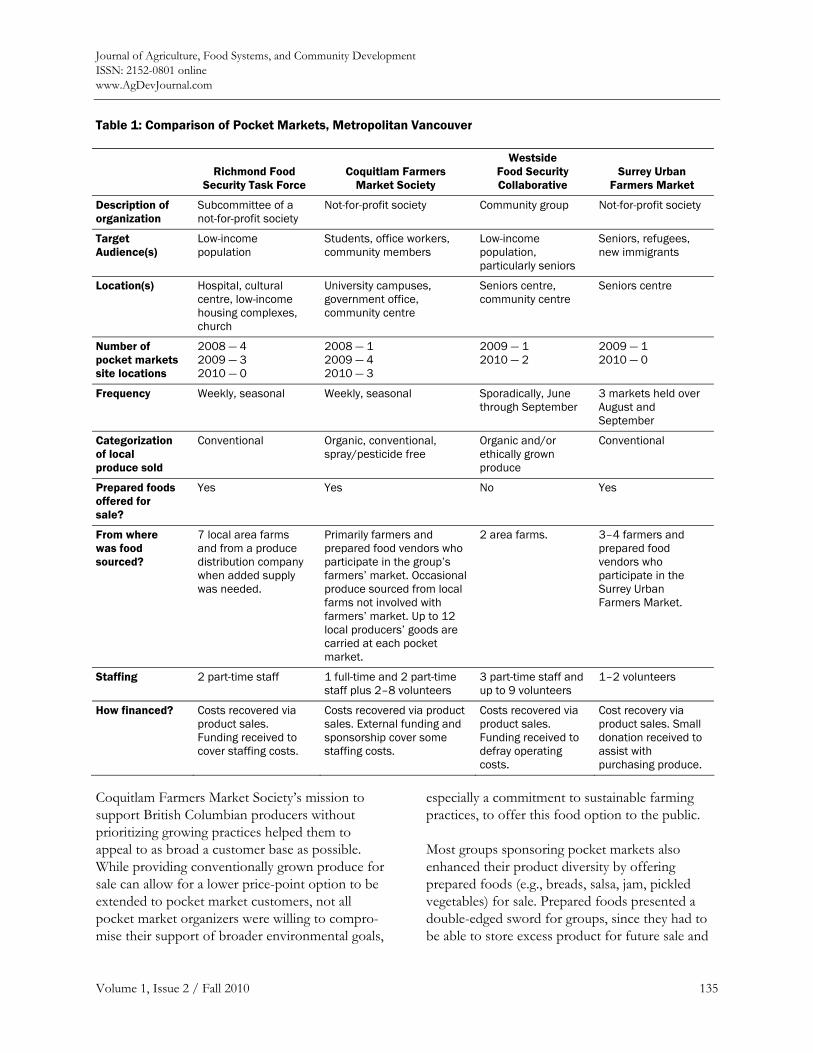
Journal of Agriculture, Food Systems, and Community Development ISSN: 2152-0801 online www.AgDevJournal.com
Volume 1, Issue 2 / Fall 2010 135
Coquitlam Farmers Market Society’s mission to support British Columbian producers without prioritizing growing practices helped them to appeal to as broad a customer base as possible. While providing conventionally grown produce for sale can allow for a lower price-point option to be extended to pocket market customers, not all pocket market organizers were willing to compro-mise their support of broader environmental goals,
especially a commitment to sustainable farming practices, to offer this food option to the public.
Most groups sponsoring pocket markets also enhanced their product diversity by offering prepared foods (e.g., breads, salsa, jam, pickled vegetables) for sale. Prepared foods presented a double-edged sword for groups, since they had to be able to store excess product for future sale and
Table 1: Comparison of Pocket Markets, Metropolitan Vancouver
Richmond Food
Security Task Force Coquitlam Farmers
Market Society
Westside Food Security Collaborative
Surrey Urban Farmers Market
Description of organization
Subcommittee of a not-for-profit society
Not-for-profit society Community group Not-for-profit society
Target Audience(s)
Low-income population
Students, office workers, community members
Low-income population, particularly seniors
Seniors, refugees, new immigrants
Location(s)
Hospital, cultural centre, low-income housing complexes, church
University campuses, government office, community centre
Seniors centre, community centre
Seniors centre
Number of pocket markets site locations
2008 — 4 2009 — 3 2010 — 0
2008 — 1 2009 — 4 2010 — 3
2009 — 1 2010 — 2
2009 — 1 2010 — 0
Frequency Weekly, seasonal Weekly, seasonal Sporadically, June through September
3 markets held over August and September
Categorization of local produce sold
Conventional Organic, conventional, spray/pesticide free
Organic and/or ethically grown produce
Conventional
Prepared foods offered for sale?
Yes Yes No Yes
From where was food sourced?
7 local area farms and from a produce distribution company when added supply was needed.
Primarily farmers and prepared food vendors who participate in the group’s farmers’ market. Occasional produce sourced from local farms not involved with farmers’ market. Up to 12 local producers’ goods are carried at each pocket market.
2 area farms. 3–4 farmers and prepared food vendors who participate in the Surrey Urban Farmers Market.
Staffing 2 part-time staff 1 full-time and 2 part-time staff plus 2–8 volunteers
3 part-time staff and up to 9 volunteers
1–2 volunteers
How financed? Costs recovered via product sales. Funding received to cover staffing costs.
Costs recovered via product sales. External funding and sponsorship cover some staffing costs.
Costs recovered via product sales. Funding received to defray operating costs.
Cost recovery via product sales. Small donation received to assist with purchasing produce.
Journal of Agriculture, Food Systems, and Community Development ISSN: 2152-0801 online
www.AgDevJournal.com
136 Volume 1, Issue 2 / Fall 2010
take the risk, as with fresh produce, that perishable items like bread and pastries might not sell. Selling prepared foods also meant that organizers had to interface with health regulators and become familiar with the guidelines and requirements for hosting temporary food markets. These risks were weighed against the ability to provide the market shopper with a wide range of local products and a selection that enhanced the fresh produce available for sale.
Of the groups studied, most had received some level of seed funding to start up their pocket markets from health, social service, and environ-mental organizations. While this funding provided groups with some start-up monies, the main generator of revenue was derived from product sales at the pocket market. With small profit margins, potentially high wastage and overhead costs (transportation, storage, and staffing), it was difficult for most organizers to cover their costs. Nevertheless, a few individual pocket market locations did make modest profits. This was in large measure due to organizers being able to target a specific and identifiable customer base (e.g., at a workplace or in a university setting) with direct marketing and educational initiatives and by enhancing market-day activities with interactive displays. Having access to an identified customer base allowed organizers to provide information on upcoming markets and related educational activities, receive feedback from customers, and survey existing and potential customers about their shopping habits, preferences, and experience at market, which, according to organizers, created more interest in and utilization of the market and helped them to refine operating practices.
Benefits and Challenges of the Pocket Market Model Pocket markets offer a creative solution for con-necting urban consumers with local food as they can be seen as an addition to and/or extension of farmers’ markets and other AFN initiatives. As pocket markets are an emergent model of local food distribution, they offer both benefits and challenges. They are worthy of analysis as the issue of demand putting stress on farmers’ markets is a
structural issue to overcome in the development of more localized food systems.
Benefits of the Pocket Market Model According to our interviews, there are a number of benefits to operating a pocket market. These in-clude providing additional marketing outlets for local food producers; creating opportunities to educate consumers about local food and sustain-able food systems; offering convenient additional venues to consumers where they may purchase local food; and increasing access to fresh produce in areas with poor or limited food retail options.
All of the market organizers we interviewed agreed that part of their goal was to assist local producers reach a broader base of urban consumers. Unlike grocery stores or other retail produce stands, pocket markets are intended to rely on and primarily represent regional farmers and their products. Therefore, at the markets, products are labeled with their provenance and, in some instances, pictures of the farmer and/or farm, and further information about them (e.g., growing practices, years spent farming, range of products grown) is on display for customers to read. These marketing efforts allow a degree of personalization to occur around the shopping experience as consumers can become familiar with the agricul-tural producers and the range and quality of product they supply. This helps farmers to build and grow a targeted customer base. According to one representative of an organic cooperative that sold to the pocket markets run by the Coquitlam group, pocket markets are most beneficial to young farmers who “don’t have the network developed that we have with all the markets that we go to. The pocket market could be a really valuable way for them to develop markets for their products without having to stretch themselves between a lot of farmers’ markets and their fields” (C. Bodnar, personal communication, February 11, 2010). This point was echoed by a new farmer whose produce was largely being sold via the farm’s CSA program and through pocket markets operated by the Coquitlam group. The farmer noted, “the pocket markets [were] excellent for us as we can’t afford to be at a farmers’ market for 10 hours a day very
Journal of Agriculture, Food Systems, and Community Development ISSN: 2152-0801 online www.AgDevJournal.com
Volume 1, Issue 2 / Fall 2010 137
frequently…[and]…the high cost of insurance and our busy schedules make it difficult for us to have the public visit the farm to purchase at the farm gate.” (H. Cavendish-Palmer, personal communi-cation, October 10, 2010). Similarly, the Richmond market representative stressed that for “some [agricultural] producers who are kind of on the edge of not doing well financially, this year…[the pocket market] was a lifesaver. We were able to keep sales going, especially early in the season, when they didn’t have a lot of farm-gate sales” (A. Hamir, personal communication, December 14, 2009). For more established farmers, the pocket market organizers’ marketing efforts helped to develop brand identity among consumers, some-thing that might lead to sales at farmers’ markets or at their farm gate. This is particularly beneficial in an area where there are few farms and increasing demand for farmers to be at markets. As one farmer whom we interviewed explained, “We thought [pocket markets] were a really innovative idea [because] we can’t go to any more [farmers’] markets” (C. Bodnar, personal communication, February 11, 2010).
Secondly, organizers viewed pocket markets as an opportunity to go into communities and educate on issues of local food and sustainable food systems. Several organizers said that part of the reason for holding a pocket market was to let people know about local food in their communi-ties. They saw any encounter around local food as an opportunity to educate and build awareness. A few of the pocket market organizers made explicit efforts to provide information about issues sur-rounding local food, such as farmland preservation, farming techniques, understanding the food cycle (from seed to compost), nutrition, and seasonal cooking, through displays, activities, and news-letters or bulletins. This was most effective when done in partnership with a host organization, especially one with a sustainability mandate. For example, one university-based pocket market was closely connected to the student-run sustainability club and other on-campus environmental groups. Similarly, an office-based pocket market was seen as mutually supportive with the corporation’s health and wellness mandate and was seen as a
benefit to staff and a commitment to their well-being. This connection then provided, according to one early champion of the project, “a ‘vehicle’ for launching awareness and education on sustainabil-ity issues that may otherwise have less impact and less connectivity” (R. Kempe, personal communi-cation, October 1, 2010).
Furthermore, because pocket markets are more flexible and can be set up in a variety of environ-ments (e.g., inside office buildings), they can enhance accessibility to local food. Research suggests that people tend to utilize food resources that are convenient (Blake, Mellor, & Crane, 2010). Customer surveys conducted by the Coquitlam Farmers Market Society at a pocket market they operated in an office lobby highlighted the need for local food to be made more conveniently avail-able for the public. One office worker stated, “This was an absolutely fantastic idea that I was extreme-ly pleased to see happen. It’s so very important to support local farmers and organic producers at that. To have such a wonderful availability right in our building was great!” This sentiment was shared by another colleague who expressed, “I really enjoyed having the market at work. I want to support local farmers and I prefer to shop locally whenever I can” (Coquitlam Farmers Market Society, 2009). From the outset, this pocket market found favor among the office workers it served. However, in Richmond, setting up a pocket market in an atypical location was more challenging. When organizers set up a pocket market in a hospital lobby, there were concerns from staff, volunteers, and the public. According to the organizer, “We had two types of naysayers. We had people who were saying, ‘why are you selling food in a dirty hospital?’ and then we had those that said, ‘why are you bringing dirty food into the hospital?’ Once people got over the idea of buying fresh vegetables at a hospital, they would time their breaks to come down and buy produce. It became quickly a popular site” (A. Hamir, personal communication, December 14, 2009).
Pocket markets have also been created to address issues of food insecurity in areas that may lack access to fresh produce due to poor or limited
Journal of Agriculture, Food Systems, and Community Development ISSN: 2152-0801 online
www.AgDevJournal.com
138 Volume 1, Issue 2 / Fall 2010
food retailing options. Studies have suggested that farmers’ markets can address issues of food access and cost in low-income communities (Fisher, 1999; Larsen & Gilliland, 2009) although they are typically targeted to more affluent communities (Slocum, 2007). Both the Richmond and Westside pocket markets were specifically designed to address the issue of food access among potentially vulnerable populations. The Westside pocket markets were created “to help address access to fresh food … by low-income residents, especially seniors on the west side of Vancouver” (S. Gillard, personal communication, January 6, 2010). Similarly, an organizer of the Richmond markets saw its pocket markets as a form of “social support because it …[contributed toward improved health and nutrition among residents by] providing [low income] people who live in Central Richmond with an opportunity to purchase [fresh] local food” (A. Hamir, personal communication, December 14, 2009).
Challenges of the Pocket Market Model Interviews with pocket market organizers high-lighted several challenges involved in implementing this model. These included a lack of familiarity by the public with what a pocket market is; an inability to address issues of food access in a way that was financially sustainable; and issues of logistics, site selection, and regulatory requirements.
Because pocket markets are an emerging model of local food distribution, the term is generally unfamiliar to many potential customers. Several organizers reported that customers’ expectations were not met when they initially came across the pocket market, expecting to see a scaled down version of a farmers’ market with its diversity of vendors and products. In assessing this difference between what was anticipated and what was encountered, it appears that community groups may have inadvertently contributed toward the identity predicament that befalls their pocket markets. The Coquitlam group began using the term “pocket farmers’ market” to legitimize them as and connect them with authentic spaces of local food retailing. However in doing so they laid the groundwork for patrons to associate them with and
expect the producer-direct shopping experience that a farmers’ market offers. Other organizations simply used the “pocket market” label, a term that carries little resonance with the public and one that lacks identification to or connection with the fresh local product featured for sale. To overcome this challenge, organizers might consider re-branding these projects to better emphasize their niche of providing fresh local food direct from area pro-ducers. Should this option not be desirable, organizers will need to place added emphasis on public education about what a pocket market is, how its small scale works to expand the availability of local food to additional, even unexpected, locations, and how the model supports many more local producers than may be evident at first glance (see table 1 and the appendix). This focus on public education is not unlike what farmers and farmers’ market organizers undertook in the mid-1990s when they began to establish markets in parking lots across metro Vancouver, engaging with and educating the public around the benefits of “buying local” and watching as unconventional locations became spaces of acceptance as con-sumer shopping behavior slowly began to change.
Another ongoing challenge for pocket market organizers is how to address the social goal of improving access to local food with the practical need to generate sufficient revenue for the pocket markets to be financially self-sustainable. While not all pocket markets were focused on addressing accessibility issues, two of the organizations studied had an explicit goal of addressing issues of food security (or access to healthy, affordable, and culturally appropriate food) in areas that are other-wise poorly served by grocery stores or other food resources. This prioritizing of equity as the most important project goal, or as a goal on par with more traditional goals of the local food movement, shows an important and perhaps new area of emphasis. In these instances, efforts were made to provide food at an affordable cost for the intended customer base (e.g., seniors or low-income fami-lies). At the same time, pocket market organizers also wanted to provide a fair purchasing price to local producers and also price the food at a level that would also cover the costs of infrastructure,
Journal of Agriculture, Food Systems, and Community Development ISSN: 2152-0801 online www.AgDevJournal.com
Volume 1, Issue 2 / Fall 2010 139
staffing, and transportation. In some instances, this meant that the food was too expensive for sub-populations vulnerable to food insecurity. This challenge was echoed by market organizers whose pocket markets targeted largely middle-income consumers: “the products that are carried and the price point, people in low income communities won’t purchase them. Other programs such as a Harvest Box [a good food box program] are more effective [for these populations] because it has less overhead. You have economies of scale and can sell produce at a lower price point than [for what] we can buy and sell” (T. McLoughlin and A. Thebault, personal communication, March 2, 2010).
These pocket markets also faced logistical chal-lenges. Having the quality, quantity, and diversity of product that customers want meant that pocket market organizers needed to work with a variety of producers. This required careful ordering, as any product not sold at the end of the day was typically donated to social service organizations (with the exception of the Coquitlam group, which was able to circulate some produce through several mar-kets). However, because the quantities ordered for pocket markets were fairly small, it was sometimes difficult to ensure that farmers would be able to provide the desired produce. As one organizer put it, “in terms of priorities [for the producer], we were pretty much on the bottom…For some of the older, established farms that have a high degree of farm-gate sales, we were definitely lower on their priorities” (A. Hamir, personal communication, December 14, 2009). For producers, small orders required as much work or more to organize than large ones, and came with a smaller financial return. In one instance, an organic producer who had supplied the Coquitlam pocket markets in 2008 and 2009 decided to not continue with their markets in 2010 because “it got to the point where that for the size of the orders, it was a tremendous amount of work…we spread ourselves too thin, too quickly” (C. Bodnar, personal communication, February 11, 2010).
Another logistical issue for pocket market organizers related to the infrastructure required to
mount the markets. Most pocket markets are small in scale and have limited storage, personnel, or transportation infrastructure. Many rely on a small complement of staff and volunteer workers and have made arrangements with other organizations or individuals to provide or share storage and transportation. For instance, the Coquitlam Farmers Market Society and the Richmond Food Security Task Force both established partnerships with their local food bank that provided storage facilities and use of a truck in exchange for donations of fresh produce, which is often in short supply from charitable food providers. Also, because some farmers were unable or unwilling to deliver their produce directly to pocket market sites, pocket market personnel spent a good deal of time driving out to farms to pick up orders, thus increasing both transportation and staffing costs. In addition, this lack of infrastructure means that pocket markets are vulnerable if these external resources are lost.
Identifying appropriate sites was also a challenge for many market organizers, and there was little consensus among them about what made a good pocket market site. In metro Vancouver, pocket markets have been held in a number of locations, including community and seniors’ centers, office buildings, health-care facilities and university cam-puses. These sites were typically chosen because they had a large number of potential customers in close proximity, good access to public transporta-tion, and/or were easily accessed by a particular population (e.g., seniors, students). Attention was also paid to the location of potential competition, typically in the form of conventional produce stands, grocery stores, or in the case of one market, on-farm sales. While it is important to find a site with high foot traffic, it was also noted that not all busy locations were necessarily well suited as a pocket market site. For instance, one pocket market organizer noted that while the market was situated within an area with high transit access, its location was not sufficiently visible to attract transit users to the market. Similarly, locating a pocket market in an office building meant that organizers needed to be aware of staffing hours, employees’ ability to store produce near or at their desks after
Journal of Agriculture, Food Systems, and Community Development ISSN: 2152-0801 online
www.AgDevJournal.com
140 Volume 1, Issue 2 / Fall 2010
they have bought it, as well as have access to methods of communication with staff (via internal email networks or presence on a company website) in order to advertise and promote the market directly and regularly.
Finally, because pocket markets do not fit into established categories designed to regulate food retail, they have experienced regulatory barriers. Some organizers reported that they had difficulties meeting health regulations and were therefore limited in what they could sell. Since pocket markets are a new concept, health authority representatives did not always interpret and apply the guidelines for temporary food markets in the same manner. This left some market organizers unclear at times about what was required in terms of health regulation. For instance, one market organizer reported that“[Vancouver] Coastal Health made us put up signs to the effect that our produce hadn’t been washed and you needed to wash it before consuming” (A. Hamir, personal communication, December 14, 2009). This was not a requirement for pocket markets operating in jurisdictions governed by a neighboring health authority. It was also observed that organizers who also operated farmers’ markets experienced fewer challenges in this regard. They had a higher degree of familiarity with and experience in dealing with health authority policies, guidelines, and expecta-tions, and seemed more nimble at meeting the administrative requirements when it came to their pocket markets.
Organizers also had to be aware of municipal-level regulatory requirements when establishing their pocket markets. Municipal governments have a number of ways in which they can regulate efforts to improve food access (e.g., mobile and pocket markets, food carts, farmers’ markets), which can enable or constrain these enterprises (Morelas & Kettles, 2009; Tester, Stevens, Yen, & Laraia, 2010). For instance, the degree to which munici-palities enforced their signage bylaws impacted pocket markets differently. A pocket market operating at one suburban community centre was rendered largely invisible when the enforcement of municipal signage bylaws meant that organizers
could not post signage in the immediate vicinity of the market. Despite attempts to find a middle ground with municipal staff, the inability to adver-tise directly to the community played a large role in the discontinuation of that pocket market. Con-versely, in a different municipality where signage bylaws were not enforced as stringently, this was a non-issue for organizers.
Pocket market organizers also had to navigate other municipal requirements. In one municipality, grassroots-level, commercially oriented local food initiatives are subject to a comprehensive approval process that involves site assessments by municipal and health authority regulators and the levying of municipal fees and charges that may be cost-prohibitive to continuing such small-scale projects. Further, a couple of organizers also reported that an extended approval process was necessary to overcome regulation that prohibited retail activity on government property. Organizers noted that having status as an incorporated not-for-profit society, combined with a focus on sustainability and education (i.e., capacity building), were impor-tant for being able to access these environments and to mitigate concerns about competition with other food retailers.
Discussion and Conclusion Pocket markets are a relatively new strategy for bringing locally produced food to urban popula-tions. Organizers in metropolitan Vancouver are using the model to increase access to local food in novel locations and at the same time reducing the burden on producers to attend an ever growing number of farmers’ markets. Proponents of this model, however, face many challenges to overcome for it to meet these goals. In this section we will discuss strategies to enhance the sustainability of the pocket market model.
Our study reveals that most organizations opera-ting pocket markets find sustaining them to be a challenge given current organizational capacity and resources. This is not unlike the experience of many alternative enterprises. Most pocket markets operate on shaky financial ground due to the risks they assume in bringing local food to new markets
Journal of Agriculture, Food Systems, and Community Development ISSN: 2152-0801 online www.AgDevJournal.com
Volume 1, Issue 2 / Fall 2010 141
and are heavily reliant on volunteer resources and in-kind exchanges to implement and operate their markets. Organizations looking to operate a pocket market need to first make the business case for engaging in such an endeavor. This would be helped by developing, prior to implementation, a business plan that clearly sets out the rationale for the project, establishes revenue targets, and balances these with expense estimates so that the financial viability of the project remains in the forefront.
In addition, prior to starting a pocket market, organizations need to understand and establish protocols and processes around where and how to source products, how logistics (storage, transporta-tion, and tracking of inventory) will be coordi-nated, what marketing tools and initiatives will be employed to promote the markets, how the consumer base will be educated on the products and producers represented at market, and how mutually beneficial relationships (e.g., with local producers, host organizations or communities, municipal and health regulators) can be fostered to grow markets in new locations. Organizations could also benefit from developing criteria and/or indicators for evaluating the success and short-comings of their projects across locations and from year to year. Information that would be useful to track includes expense and revenue data, including the cost of staffing, transportation, storage, and purchasing product, sales data (including number of transactions, order vs. sales ratios, amount of revenue generated), and information gleaned through end-of-season surveys of customers and producers. Doing so would assist organizations in developing best practices and implement more efficient systems for operating their markets.
As revealed through the interviews, organizers also need to develop sound rationales for the siting of pocket markets. Several markets in this study were unsuccessful in part due to issues with location. There is currently little in the way of best practices on what constitutes a good site for a pocket market. Typically organizers are invited to do a market at a particular location by community members or an organization interested in hosting a
market. However, without a thorough needs assessment, this may prove to be a waste of resources as such a site may turn out to be poor. Having site selection criteria would enhance the success of pocket markets and reduce the loca-tional risk and uncertainty that at present seem to be contributing factors to financial losses. The need for this also speaks to a wider point: the pocket market model in metro Vancouver remains in the testing and adaptation stage and has yet to reach a point of settlement and stability. Once this has occurred, an evaluation of the model can be undertaken and best practices established.
As the local food movement grows, the issue of scale becomes important (Born & Purcell, 2006). In some places like metropolitan Vancouver, the appetite for local food has grown beyond the current capacities of producers who are interested in selling at farmers’ markets. At the same time, for consumers, the accessibility of local food is often limited to a weekly farmers’ market. Pocket markets provide accessible places for consumers to purchase food from local farmers without the need for direct participation of those farmers. They introduce consumers to the idea of purchasing local food “where they are,” be it in their neigh-borhood or at their workplace. At the same time, pocket markets provide producers, especially farmers, with additional outlets across the region where they may market added quantities of their food and to do so in an environment that offers low risk and little cost for their participation. Pocket markets are also an alternative to main-stream retail outlets that often demand a particular quality and/or quantity of produce that in most cases prohibits the participation of small producers.
The future viability of pocket markets hinges on a number of factors, including developing more refined business practices, the continued demand for local food, and increased participation of small and medium-sized farmers in the region. Pocket markets have the potential to fill a niche in the alternative food network and provide benefits for farmers, consumers, and community organizers.
Journal of Agriculture, Food Systems, and Community Development ISSN: 2152-0801 online
www.AgDevJournal.com
142 Volume 1, Issue 2 / Fall 2010
Acknowledgements The authors would like to thank representatives from the organizations under study for helping us to understand their motivations and practices. Thanks also to Eugene McCann, Peter V. Hall, Jonathan Fershau, and the anonymous JAFSCD reviewers for their valuable insights on earlier versions of this paper. We acknowledge and thank Simon Fraser University’s Urban Studies program (Anthony Perl) and the Urban Affairs Association
for funding received to present preliminary findings from this study at the 2010 UAA conference. All the usual disclaimers apply.
Disclosures Both authors have been directly involved with developing farmers’ markets and pocket markets in metro Vancouver. They currently serve on the board of the Coquitlam Farmers Market Society.
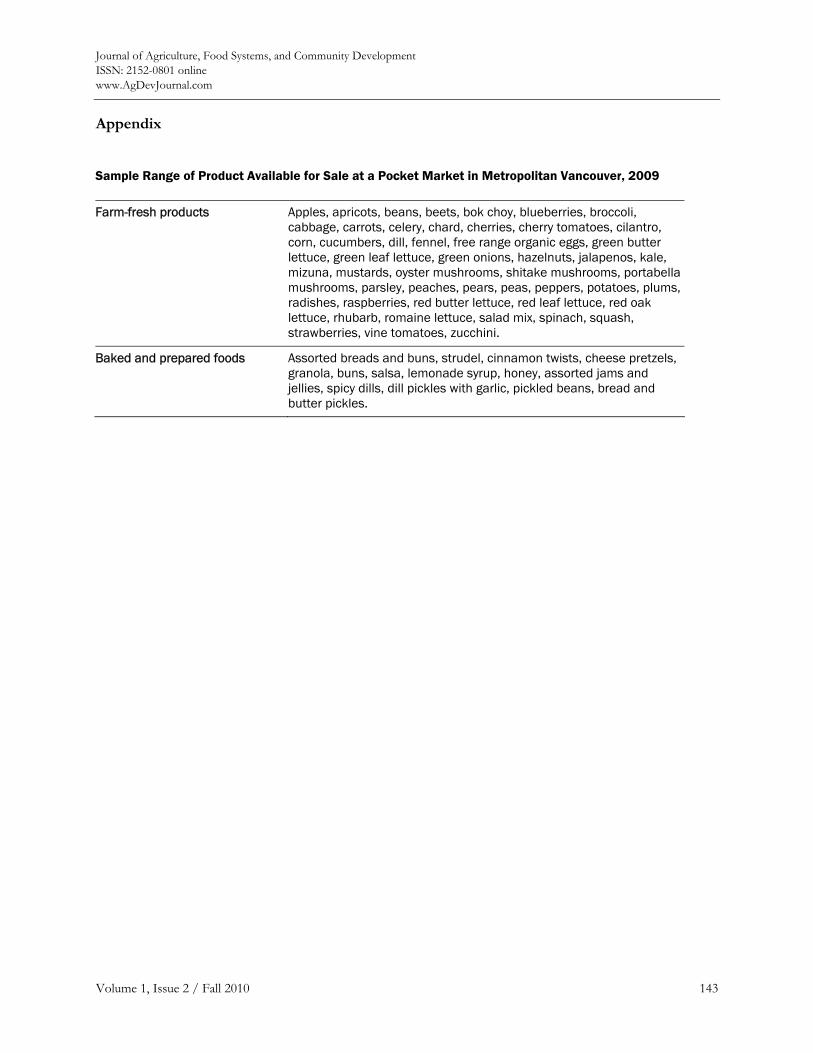
Journal of Agriculture, Food Systems, and Community Development ISSN: 2152-0801 online www.AgDevJournal.com
Volume 1, Issue 2 / Fall 2010 143
Appendix
Sample Range of Product Available for Sale at a Pocket Market in Metropolitan Vancouver, 2009
Farm-fresh products Apples, apricots, beans, beets, bok choy, blueberries, broccoli, cabbage, carrots, celery, chard, cherries, cherry tomatoes, cilantro, corn, cucumbers, dill, fennel, free range organic eggs, green butter lettuce, green leaf lettuce, green onions, hazelnuts, jalapenos, kale, mizuna, mustards, oyster mushrooms, shitake mushrooms, portabella mushrooms, parsley, peaches, pears, peas, peppers, potatoes, plums, radishes, raspberries, red butter lettuce, red leaf lettuce, red oak lettuce, rhubarb, romaine lettuce, salad mix, spinach, squash, strawberries, vine tomatoes, zucchini.
Baked and prepared foods Assorted breads and buns, strudel, cinnamon twists, cheese pretzels, granola, buns, salsa, lemonade syrup, honey, assorted jams and jellies, spicy dills, dill pickles with garlic, pickled beans, bread and butter pickles.
Journal of Agriculture, Food Systems, and Community Development ISSN: 2152-0801 online
www.AgDevJournal.com
144 Volume 1, Issue 2 / Fall 2010
References Alkon, A. (2008). Paradise or pavement: The social
constructions of the environment in two urban farmers’ markets and their implications for environmental justice and sustainability. Local Environment, 13(3), 271–289. doi:10.1080/13549830701669039
Blake, M., Mellor, J., & Crane, L. (2010). Buying local food: Shopping practices, place and consumption networks in defining food as “local.” Annals of the Association of American Geographers, 100(2), 409–426. doi:10.1080/00045601003595545
Born, B., & Purcell, M. (2006). Avoiding the local trap: Scale and food systems in planning research. Journal of Planning Education and Research, 26, 195–207. doi:10.1177/0739456X06291389
Connell, D. J., Smithers, J., & Joseph, A. (2008). Farmers’ markets and the “good food” value chain: A preliminary study. Local Environment, 13(3), 169–185. doi:10.1080/13549830701669096
Coquitlam Farmers Market Society. (2009). Metro Market Survey.[Unpublished survey]
Coquitlam Farmers Market Society. (2010). 2009 Pocket Market report. Unpublished report.
Fisher, A. (1999). Hot Peppers and Parking Lot Peaches. Evaluating Farmers’ Markets in Low-Income Communities. Community Food Security Coalition.
FoodRoots Distributors Cooperative. (n.d.) The Pocket Market Toolkit. Retrieved from http://foodroots.ca/pmtoolkit_index.htm
Jarosz, L. (2008). The city in the country: Growing alternative food networks in Metropolitan areas. Journal of Rural Studies, 24, 231–244. doi:10.1016/j.jrurstud.2007.10.002
Larsen, K., & Gilliland, J. (2009). A farmers’ market in a food desert: Evaluating impacts on the price and availability of healthy food. Health & Place, 15:1158–1162. doi:10.1016/j.healthplace.2009.06.007
Ling, C., & Newman, L. (2010). Garlic and granola: Food webs and the catchment of farmer’s markets from the food producers' perspective. Paper presented at the Canadian Association of Food Studies Meeting, Montreal.
MacAdam, R. (2009, November/December). Local
hero: Lee Fuge of FoodRoots. EAT Magazine. Retrieved from http://www.eatmagazine.ca/ heroes/2009-11-01/leefuge
Morales, A., & Kettles, G. (2009). Healthy food outside: Farmers’ markets, taco trucks and sidewalk fruit vendors. Journal of Contemporary Health Law and Policy 20, 20–48.
North, W. N. (1969). Small Urban Spaces: The Philosophy, Design, Sociology and Politics of Vest-Pocket Parks and Other Small Urban Spaces. New York: New York University Press.
Pollan, M. (2006). The Omnivore’s Dilemma: A Natural History of Four Meals. New York: Penguin Press.
Pottery, H. & Jinkerson, A. (2007). Exploring Food Security in Vancouver’s Westside. Unpublished report prepared for the Westside Food Security Collaborative.
Richmond Food Security Task Force. (2008). Richmond Pocket Market Report. Unpublished report.
Slocum, R. (2007). Whiteness, space and alternative food practice. Geoforum, 38(3), 520–533. doi:10.1016/j.geoforum.2006.10.006
Statistics Canada. (2006). GVRD Population and Private Dwellings, 2006 Census. Retrieved from http://www.metrovancouver.org/about/statistics/Pages/KeyFacts.aspx (see Population: Census 2006 Population and Dwelling Counts).
Surrey Urban Farmers Market. (2009). 2009 Pocket Market Review. Unpublished report.
Tester, J. M., Stevens, S. A., Yen I. H., & Laraia, B. A. (2010). An analysis of public health policy and legal issues relevant to mobile food vending. American Journal of Public Health. Advance online publication. doi:10.2105/AJPH.2009.185892
Vallianatos, M., Gottlieb R., & Haase, M. A. (2004). Farm-to-school: Strategies for urban health, combating sprawl and establishing a community food systems approach. Journal of Planning Education and Research, 23, 414–423. doi:10.1177/0739456X04264765
Westside Food Security Collaborative. (2009). Pocket Market Pilot Program report. Unpublished report.
Journal of Agriculture, Food Systems, and Community Development ISSN: 2152-0801 online www.AgDevJournal.com
Volume 1, Issue 2 / Fall 2010 145
Multistakeholder policy formulation and action planning for urban agriculture in Lima, Peru Ir. Marielle C. E. Dubbeling,a ETC Urban Agriculture/RUAF Foundation
Gunther Merzthalb and Noemi Soto,c IPES/RUAF Foundation
Submitted 23 July 2010 / Accepted 8 November 2010 / Published online December 2010 Citation: Dubbeling, M., Merzthal, G., & Soto, N. (2010, Fall). Multistakeholder policy formulation and action planning for urban agriculture in Lima, Peru. Journal of Agriculture, Food Systems, and Community Development, 1(2): 145–154. doi:10.5304/jafscd.2010.012.010 Copyright © 2010 by New Leaf Associates, Inc. Abstract Multistakeholder processes are increasingly consid-ered to be an important element of policy design, action planning, and implementation. By involving a broad base of stakeholders, municipal authorities are more likely to develop policies and programs that will meet the needs of both the municipality and its constituents, and are thus more inclusive and successful in their implementation. Because of its multisectoral character, with impacts on land use planning, health, food security, and economic development, among others, urban agriculture development calls for the involvement of multiple stakeholders, including individuals, and groups and organizations from both nongovernmental as well
as governmental sectors. In doing so, requirements for setting up and managing successful multistake-holder processes, including sufficient financial resources, time, training, and creating mutual trust, have to be taken into account. This article will illustrate the multistakeholder process taken and lessons learned by the district of Villa María del Triunfo in Lima, Peru. It shows how such processes can result in urban agriculture becoming institutionalized, while at the same time providing concrete benefits for urban producers (such as enhanced food security and employment) and the city as a whole. Linking project implementation to policy formulation, including urban agriculture in land use planning, providing it with an institutional home, and regular monitoring and empowerment of urban farmer organizations prove to be key elements to ensure the sustainability and consolida-tion of an urban agriculture policy and program beyond the period of a given political administra-tion and to plan for its future up-scaling.
Keywords urban agriculture, policy formulation, strategic planning, Lima, Peru
a Corresponding author: Senior Adviser Urban Agriculture, ETC Urban Agriculture/RUAF Foundation, Kastanjelaan 5, P.O. Box 64, Leusden, 3830 AB The Netherlands; [email protected]
b Regional Coordinator for Latin America and the Caribbean, IPES/RUAF Foundation, Calle Audiencia 194 San Isidro, Lima 27 - Perú; [email protected]
c IPES/RUAF Foundation, Calle Audiencia 194 San Isidro, Lima 27 - Perú; [email protected]
Journal of Agriculture, Food Systems, and Community Development ISSN: 2152-0801 online
www.AgDevJournal.com
146 Volume 1, Issue 2 / Fall 2010
The need for multistakeholder policy formulation and action planning on urban agriculture Urban agriculture is increasingly recognized for its potential to contribute to various urban policy goals, including food security, poverty alleviation, local economic development, environmental management, and community development (Baker, 2008; Mougeot, 2005; Redwood, 2009; van Veenhuizen, 2006). Once governmental authorities and support institutions (public, non-profit and private) better understand the benefits and risks associated with urban agriculture, they often seek to facilitate its development by means of proactive policies and intervention strategies that enhance the socioeconomic and environmental benefits of urban agriculture, while controlling and regulating the practice in order to reduce potential associated health and environmental risks (Cole, Lee-Smith, & Nasinyama, 2008; Dubbeling, De Zeeuw, & van Veenhuizen, 2010).
City governments aiming to promote and/or regulate certain types of urban agriculture can apply various policy instruments and intervention strategies to do so. Formulating and implementing effective policies, however, will require involving a wide range of often disconnected actors or stakeholders.1 Urban agriculture takes place in a multisectoral environment, touches on a large number of urban management areas (e.g., land-use planning, environmental and waste management, economic development, public health, and social and community development), and involves a large diversity of systems and related actors (input provision, vegetable production, aquaculture, livestock production, processing, and marketing).
1 For our purposes, the term “urban agriculture stakeholders” refers to individuals, groups, or organizations, including governments, involved in urban agriculture activities, such as the production, processing, marketing, or distribution of food, and disposal of food wastes, etc., within or near urban areas. Urban agriculture stakeholders can be defined as all those who have an interest—something at stake— in urban agriculture. This includes people and organizations who influence a decision, or can influence it, as well as those affected by it.
Urban agriculture can only be successfully integrated into urban policies and planning if coordination between various government levels, structures, and departments is improved and can ensure that land-use planning is coordinated with community development and health authorities for the benefit of food production (Redwood, 2010). Such integration also requires that local producer and community groups, who tend to be the city’s most excluded groups, are recognised as legitimate actors in urban management and decision-making. This in order to get support in becoming more professional and accountable for their trade, and in increasing their contribution to the local economy, or to the landscape of community organizations through partnerships and alliances with other stakeholders (Mougeot, 2005).
When a government collaborates—preferably from an early stage—with other stakeholders such as citizens, farmers, civic organizations, private-sector companies, and other governmental entities in the preparation, implementation, and evaluation of policies and related action plans, we speak of multistakeholder policy and action planning (MPAP). Multistakeholder processes, sometimes called “partnerships,” have been widely promoted in different sectors of development, e.g. water and catchment management, rural development, and information and communication management. They are becoming a very popular mode of involving civil society in debates and decision-making on resource management, as they provide a negotiating space for a diversity of interests (Warner 2007).
Characteristics of multistakeholder processes The Multistakeholder Policy formulation and Action Planning (MPAP) approach was developed in the 1990s in the context of the UNEP Local Agenda 21 programs2 and the UN-HABITAT city
2 Local Agenda 21 is “a local-government-led, community-wide, and participatory effort to establish a comprehensive action strategy for environmental protection, economic prosperity and community well-being in the local jurisdiction or area. This requires the integration of planning and action
Journal of Agriculture, Food Systems, and Community Development ISSN: 2152-0801 online www.AgDevJournal.com
Volume 1, Issue 2 / Fall 2010 147
consultation strategies.3 It is normally built around the following phases (UN-HABITAT and UNEP, 1999):
1. diagnosis, assessment and stakeholder inventory;
2. consultation to confirm political support and consolidate stakeholder participation;
3. joint strategy development and action planning;
4. implementation;
5. follow-up and consolidation; and
6. integrated monitoring and evaluation.
If a participatory and multistakeholder approach is chosen, action plans and policies are formulated and implemented in collaboration with and inter-action between a local (or national) government and other relevant stakeholders, including citizen groups, community-based organizations (CBOs), nongovernmental organizations (NGOs), munici-pal departments, regional or national governmental organizations, credit institutions, private enter-prises, and others. The ideal of such inclusive participation, however, may have different levels of significance that vary according to each phase of food (or urban agriculture) policy development. While inclusive participation may be particularly critical during early phases of identifying problems and proposing solutions, it may be less critical during implementation phases, where different
across economic, social and environmental spheres. Key elements are full community participation, assessment of current conditions, target setting for achieving specific goals, monitoring and reporting.” See http://www.gdrc.org/ uem/la21/la21.html 3 City consultations “bring together local authorities, the private sector, community representatives and other stakeholders within a city to discuss specific issues and solutions to key urban problems. They are a continuous process of dialogue among stakeholders and the city government.” See http://www.unhabitat.org/content.asp? typeid=19&catid=374&cid=186
mechanisms of collaboration and communication can be put in place for different actors and groups (Mendes, 2008).
A major aim of applying the multistakeholder approach is to build participatory and democratic governance in cities. Multistakeholder policy and planning processes are based on principles of participation, ownership, and commitment, mutual trust and collaboration (in planning, decision-making, and control). They are thus in fact political processes through which power relations are redefined and, if well organized, lead to a more participatory governance and increased participa-tion of civil society in decision-making. Challenges, however, include the following (Faysse, 2006, Hemmati 2002):
Benefits of applying a participatory and multi-stakeholder approach include the following (Hemmati, 2002; Partners and Propper, 2004):
• It contributes to more participatory gover-nance, encourages public-private partnerships, and helps overcome distrust and bridge the gap between citizen groups and the government.
• It improves the quality of the diagnosis of the actual situation and the decision-making on the courses of action needed. This comes about through a better understanding of priority issues and the needs of different stakeholders involved, and a better linking of different sources of knowledge, information, and expertise.
• It improves the likelihood of success and sustainability of implementation through enhanced acceptance and ownership of the policy, improved mechanisms and processes for coordinating the implementation, and by mobilizing and pooling scarce human, technical, and financial resources.
• It strengthens the problem-solving and political lobbying capacities of the participating institu-tions, and contributes to the empowerment of citizens’ groups (in this case, especially, resource-poor urban producers).
Journal of Agriculture, Food Systems, and Community Development ISSN: 2152-0801 online
www.AgDevJournal.com
148 Volume 1, Issue 2 / Fall 2010
• The process requires skilled facilitators and sufficient financial means.
• It may need more time than conventional approaches, not the least of which is to allow for changes that may be required in institutional cultures.
• It may also lead to an undue increase in the influence of some stakeholders, for example those who have a higher capacity to actively participate in the process and to convince other stakeholders.
• It may prove difficult to build true participation among stakeholders who may never have worked together, had conflicts in the past, hold strongly differing views on the key issues at stake, or are not interested in new forms of collaboration and management.
The duration of the MPAP process varies widely, influenced by the degree of commitment of the local partners (especially the local government), the complexity of the issues, and other factors. Some-times tangible results become visible within a relatively short time period, whereas in other cases it may take quite some time before things start falling into place.
Organizations like the international network of Resource centres on Urban Agriculture and Food Security (RUAF), the former Urban Management Programme supported by UNDP and UN-HABITAT, and the UN-FAO have supported various cities in multistakeholder planning and policy formulation on urban agriculture. In the Democratic Republic of the Congo, for example, FAO has provided assistance to support a municipal multistakeholder consultation platform (MCP). Its mandate is to moderate and make recommendations on the key issues related to sustainable urban and peri-urban agriculture and more specifically to make decisions in the area of land and water use for urban agriculture activities. In addition, MCP acts as a pressure group with the urban planners to fully integrate green spaces for
urban agriculture activities into a city development plan and to make best use of recycled waste materi-als. Stakeholders include central government authorities, public health and education representa-tives, municipal authorities, representatives of producer associations, inputs suppliers, land tenure authority, water distribution and use managers, NGOs, and microfinance operators (UN FAO, 2008).
Through its Cities Farming for the Future program, RUAF has supported multistakeholder policy in action planning in 21 cities around the world. In the following case example, one such experience with implementing a MPAP on urban agriculture in Lima, Peru, is described in further detail and the results illustrated with some concrete examples. This MPAP in Lima was supported by RUAF’s regional partner, IPES (IPES-Promoción del Desarrollo Sostenible), which participated in all steps of the process. Regular process documenta-tion and monitoring was applied as an integral part of the approach, using quarterly documentation and monitoring reports, regular team meetings, and field visits. Reports were developed on main steps in the process (e.g., for the situation analysis, a City Strategic Agenda was developed4). This case study is the result of personal experience of the supporting IPES/RUAF team and a systematic review of all documents produced.
The case of Lima, Peru Agriculture is practiced widely in the low-income districts of Lima, Peru. Yet despite the significant contribution urban and peri-urban agriculture make to household incomes and food security, this sector of the economy was little known or under-stood until a couple of years ago. Farming was absent from the municipal organization and planning, and the voices of local producers were unheard (CIP, 2007).
The district of Villa María del Triunfo is located at the southern outskirts of Lima and has a popula-
4 The City Strategic Agenda can be downloaded from http://www.ipes.org/index.php?option=com_content&view=article&id=203&Itemid=125
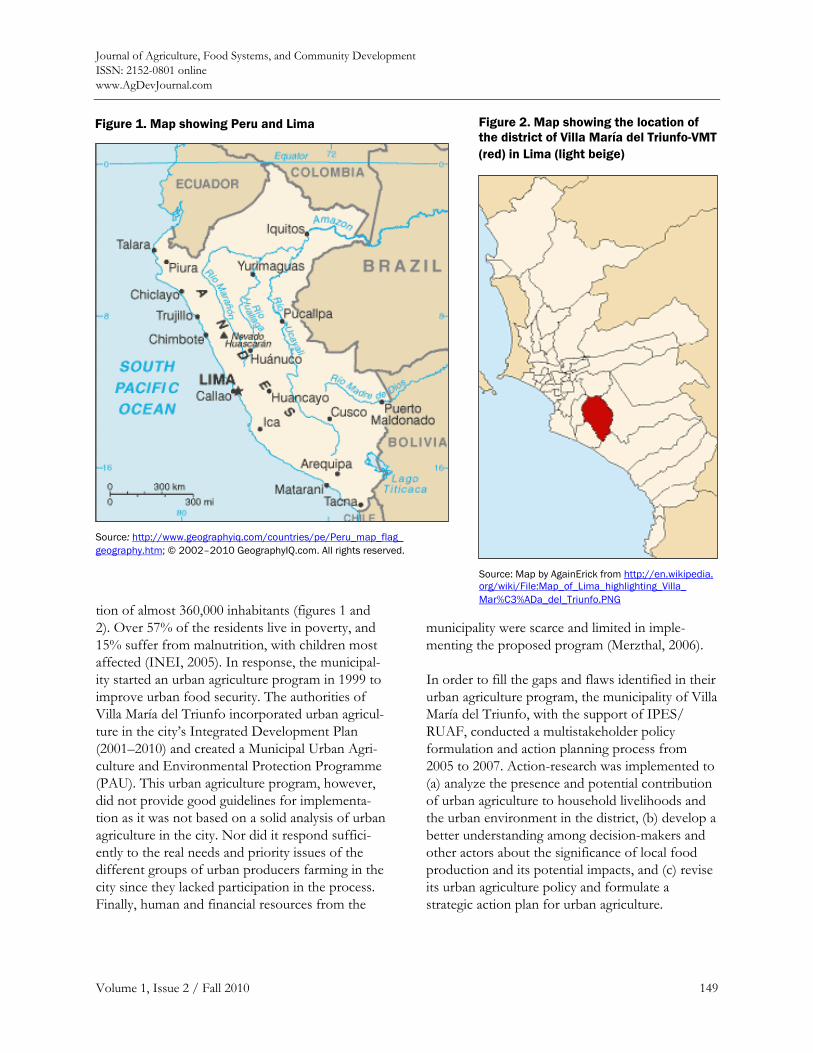
Journal of Agriculture, Food Systems, and Community Development ISSN: 2152-0801 online www.AgDevJournal.com
Volume 1, Issue 2 / Fall 2010 149
tion of almost 360,000 inhabitants (figures 1 and 2). Over 57% of the residents live in poverty, and 15% suffer from malnutrition, with children most affected (INEI, 2005). In response, the municipal-ity started an urban agriculture program in 1999 to improve urban food security. The authorities of Villa María del Triunfo incorporated urban agricul-ture in the city’s Integrated Development Plan (2001–2010) and created a Municipal Urban Agri-culture and Environmental Protection Programme (PAU). This urban agriculture program, however, did not provide good guidelines for implementa-tion as it was not based on a solid analysis of urban agriculture in the city. Nor did it respond suffici-ently to the real needs and priority issues of the different groups of urban producers farming in the city since they lacked participation in the process. Finally, human and financial resources from the
municipality were scarce and limited in imple-menting the proposed program (Merzthal, 2006).
In order to fill the gaps and flaws identified in their urban agriculture program, the municipality of Villa María del Triunfo, with the support of IPES/ RUAF, conducted a multistakeholder policy formulation and action planning process from 2005 to 2007. Action-research was implemented to (a) analyze the presence and potential contribution of urban agriculture to household livelihoods and the urban environment in the district, (b) develop a better understanding among decision-makers and other actors about the significance of local food production and its potential impacts, and (c) revise its urban agriculture policy and formulate a strategic action plan for urban agriculture.
Figure 1. Map showing Peru and Lima
Source: http://www.geographyiq.com/countries/pe/Peru_map_flag_ geography.htm; © 2002–2010 GeographyIQ.com. All rights reserved.
Figure 2. Map showing the location of the district of Villa María del Triunfo-VMT(red) in Lima (light beige)
Source: Map by AgainErick from http://en.wikipedia. org/wiki/File:Map_of_Lima_highlighting_Villa_ Mar%C3%ADa_del_Triunfo.PNG
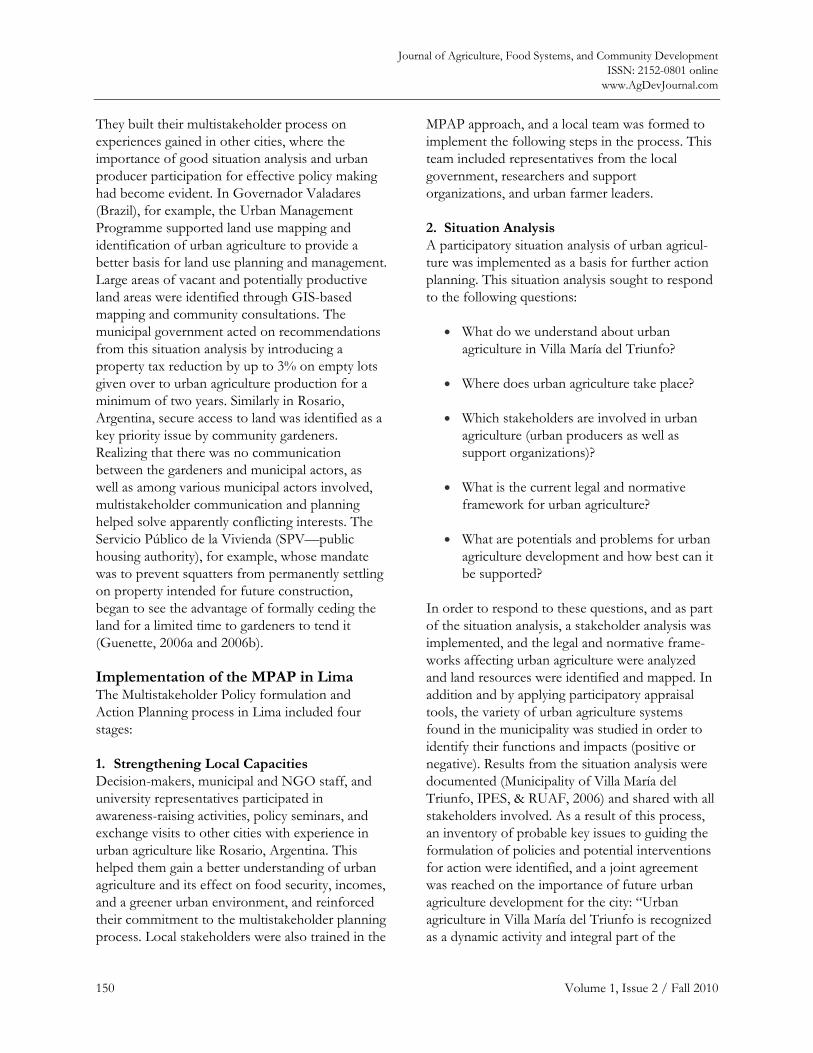
Journal of Agriculture, Food Systems, and Community Development ISSN: 2152-0801 online
www.AgDevJournal.com
150 Volume 1, Issue 2 / Fall 2010
They built their multistakeholder process on experiences gained in other cities, where the importance of good situation analysis and urban producer participation for effective policy making had become evident. In Governador Valadares (Brazil), for example, the Urban Management Programme supported land use mapping and identification of urban agriculture to provide a better basis for land use planning and management. Large areas of vacant and potentially productive land areas were identified through GIS-based mapping and community consultations. The municipal government acted on recommendations from this situation analysis by introducing a property tax reduction by up to 3% on empty lots given over to urban agriculture production for a minimum of two years. Similarly in Rosario, Argentina, secure access to land was identified as a key priority issue by community gardeners. Realizing that there was no communication between the gardeners and municipal actors, as well as among various municipal actors involved, multistakeholder communication and planning helped solve apparently conflicting interests. The Servicio Público de la Vivienda (SPV—public housing authority), for example, whose mandate was to prevent squatters from permanently settling on property intended for future construction, began to see the advantage of formally ceding the land for a limited time to gardeners to tend it (Guenette, 2006a and 2006b).
Implementation of the MPAP in Lima The Multistakeholder Policy formulation and Action Planning process in Lima included four stages:
1. Strengthening Local Capacities Decision-makers, municipal and NGO staff, and university representatives participated in awareness-raising activities, policy seminars, and exchange visits to other cities with experience in urban agriculture like Rosario, Argentina. This helped them gain a better understanding of urban agriculture and its effect on food security, incomes, and a greener urban environment, and reinforced their commitment to the multistakeholder planning process. Local stakeholders were also trained in the
MPAP approach, and a local team was formed to implement the following steps in the process. This team included representatives from the local government, researchers and support organizations, and urban farmer leaders.
2. Situation Analysis A participatory situation analysis of urban agricul-ture was implemented as a basis for further action planning. This situation analysis sought to respond to the following questions:
• What do we understand about urban agriculture in Villa María del Triunfo?
• Where does urban agriculture take place?
• Which stakeholders are involved in urban agriculture (urban producers as well as support organizations)?
• What is the current legal and normative framework for urban agriculture?
• What are potentials and problems for urban agriculture development and how best can it be supported?
In order to respond to these questions, and as part of the situation analysis, a stakeholder analysis was implemented, and the legal and normative frame-works affecting urban agriculture were analyzed and land resources were identified and mapped. In addition and by applying participatory appraisal tools, the variety of urban agriculture systems found in the municipality was studied in order to identify their functions and impacts (positive or negative). Results from the situation analysis were documented (Municipality of Villa María del Triunfo, IPES, & RUAF, 2006) and shared with all stakeholders involved. As a result of this process, an inventory of probable key issues to guiding the formulation of policies and potential interventions for action were identified, and a joint agreement was reached on the importance of future urban agriculture development for the city: “Urban agriculture in Villa María del Triunfo is recognized as a dynamic activity and integral part of the
Journal of Agriculture, Food Systems, and Community Development ISSN: 2152-0801 online www.AgDevJournal.com
Volume 1, Issue 2 / Fall 2010 151
economic and ecological urban system that contributes, based on participation of all actors involved, to rehabilitating vacant spaces, in harmony with the environment and to food security and income generation for its population” (vision on urban agriculture development, Concerted Strategic Plan for Urban Agriculture in Villa María del Triunfo 2007–2011).
3. Action Planning By the end of 2006, a multistakeholder forum on urban agriculture was formed, named the “Urban Agriculture Forum,” in which 20 institutions, including the local government, development NGOs, community-based organizations, private-sector organizations, international agencies, and urban producer groups participated. Tasks of the forum included: (1) bridging the communication gap between direct stakeholders and the institu-tional actors in urban agriculture; (2) functioning as a more permanent platform for information exchange and dialogue; (3) coordinating the planning, implementation, and monitoring of a concerted city agenda on urban agriculture; and (4) stimulating the institutionalization of such activities. The forum was given the mandate of developing a five-year strategic action plan based on a common vision of the development of urban agriculture in the municipality (see above). In a series of forum meetings, a set of policy objectives and related intervention strategies were defined, including proposals for project implementation, training, and research, and the development of a facilitating legal framework for urban agriculture. The strategic action plan was also coordinated with the city’s economic development plan. By the end of 2007, the plan was formally approved by all the city council and other stakeholders involved in the forum.
4. Implementation In addition to policy reform, the multistakeholder forum sought to operationalize the City Strategic Plan into the design, budgeting, and operational planning of specific projects under each of the identified key areas. With some co-funding from IPES/RUAF, in 2007–2008 the multistakeholder forum was able to secure over US$195,000 to
implement several of its short-term actions as defined in the strategic plan, including:
(a) Strengthening and formalizing an urban agriculture producers’ network In order to benefit from more coordinated action and a more common voice in interactions with the local government and support organizations, the urban farmers in Villa María were organized on both the neighbourhood and district level. The groups received training in personal relations and organizational management, developed regulations, agreed on organizational principles, and developed a common logo for sale of urban agricultural produce. The producers organization, which ob-tained legal status from the local government in 2008 (Municipal Resolution No. 060-2008/
Strategic Plan For Urban Agriculture (2007–2011) The Villa María Strategic Plan on Urban Agriculture aims to contribute to the 2011 city vision for a healthy, productive, and food-secure city. It identifies six key areas for developing urban agriculture: 1. Strengthening the awareness of the urban
population on the benefits of urban agriculture
2. Developing technical and managerial (organizational) capacities of urban producers
3. Improving access to and the rational use of water for urban agriculture
4. Improving local production and marketing of urban agriculture
5. Strengthening the institutional and normative framework for developing urban agriculture in the district
6. Facilitating access to information on and financing for urban agriculture.
Source: Municipality of Villa María del Triunfo, IPES, RUAF and the VMT Urban Agriculture Forum (2007). Villa María: Sembrando para la vida. Plan Estratégico Concertado de Agricultura Urbana para Villa María del Triunfo (2007–2011). Available at http://www.ipes.org/index.php?option=com_ content&view=article&id=172&Itemid=104
Journal of Agriculture, Food Systems, and Community Development ISSN: 2152-0801 online
www.AgDevJournal.com
152 Volume 1, Issue 2 / Fall 2010
MVMT), played a critical role in lobbying for continued political support for urban agriculture after changes in the municipality’s mayor and municipal council took place in 2006.
(b) Setting up five community garden units and strengthening enterprise development in urban agriculture In collaboration and with financial support of Red Electrica Peru (an electric utility company), FAO and the municipality, five community gardens were established on vacant land located under electrical power lines. As construction and other urban land uses under these lines are prohibited, access to and tenure of land for urban farming is ensured through renewable leases from the electricity company. Participating farming households produce for home consumption as well as sale of surplus production. To this date, a total of 45 families (225 persons) have benefited directly from this intervention. In addition to supporting these more social forms of urban agriculture, a project with peri-urban producers in Villa María was implemented to analyse and develop more com-mercial urban agriculture enterprises. With support of IDRC-Canada and IPES/RUAF, a peri-urban producers’ organization with 59 household members is being supported to improve produc-tion and marketing of aloe vera. The technical and organizational capacities of the producers are strengthened in urban farmer field schools. In addition, the project supports the organization in its efforts to secure access to the land on which they are developing their activities.
(c) Urban agriculture week In August 2007, the first urban agriculture week was organized to increase awareness of and enhance public support for urban agriculture. During the week, the urban gardens can be visited, short workshops and discussion groups are organized, videos are shown, and a variety of local produce is sold. Since 2007, the urban agriculture week has been organized every year.
(d) Municipal ordinance on urban agriculture As urban agriculture had lacked specific regulation in the district up to now, a municipal ordinance on
urban agriculture was drafted and approved in 2007. Among other things, the ordinance recognizes urban agriculture as a permanent and legitimate activity in the district; creates a specific government entity for urban agriculture (a sub-department) with human and financial resources to strengthen urban agriculture; provides for the inclusion of urban agriculture in land use plans; and calls for technical and financial assistance to be given to producers. Today, the municipality has legalized access by urban producer groups to public (municipal) land for the development of community gardens. This has been carried out under a municipal authorization for land use based on the Municipal Urban Agriculture Ordinance mentioned here.
Results and lessons learned Results of the MPAP as illustrated above demonstrate that there is wide consensus among decision-makers and other stakeholders that urban agriculture contributes to the city’s policy goals of reducing hunger and poverty and generating local economic development. Formerly vacant land areas in the city, such as those located under high-voltage power lines or on steep slopes, have been transformed into productive green spaces, contributing not only to greater food security and increased income, but also to a more liveable urban environment.
The municipal ordinance has provided urban agriculture with legitimacy and facilitated its integration in the city’s economic development and land use plans. The urban agriculture program is now a permanent structure under the Department for Local Economic Development with five permanent staff and an annual budget of US$55,000. In order to enhance the development of concrete activities in urban agriculture, it is essential to institutionalize urban agriculture. This includes providing it an institutional home and incorporating it into the normative frameworks and strategic development and land use plans of the city, and to develop specific policies (municipal ordinances, laws, regulations) for urban agriculture that facilitate and regulate its practice.
Journal of Agriculture, Food Systems, and Community Development ISSN: 2152-0801 online www.AgDevJournal.com
Volume 1, Issue 2 / Fall 2010 153
It has proven crucial to combine a process of strategic planning and policy formulation with implementation of actions that produce tangible results and help to reinforce the commitment and participation of the actors, and especially the urban farmers, involved. The development of pilot projects or actions that have an impact in the short term may also help create a positive environment for more complex and long-term processes.
The multistakeholder forum that was formed guarantees continuous dialogue among involved stakeholders and oversees the implementation of the Strategic Plan for Urban Agriculture. The forum still continues to function in 2010, even after direct IPES/RUAF support ended in 2008.
Continued awareness-raising and information dissemination among decision-makers and other stakeholders of the potential of urban agriculture to alleviate hunger and poverty, however, remains key to promoting and institutionalizing policies friendly to urban agriculture, especially to counteract possible negative consequences of change in technical and municipal staff. Strategies to do so could include the organization of policy seminars, exchange visits, and fairs and field days such as those organized during the urban agriculture week.
To overcome inevitable changes in levels of political support, it is also necessary to strengthen the organizational, managerial, technical, and networking capacities of urban farmers. Consolidated and strong organizations are better equipped to speak clearly and in unison with local authorities. The organization and empowerment of urban farmers in Villa María proved vital to sustaining the multistakeholder planning process after municipal elections and political changes took place.
Finally, it will be important to regularly revise and update the City Strategic Action Plan, by defining priorities for the coming years and eventually including additional policy goals and strategies. After all, while implementing the plan, new strategic needs or opportunities for developing
urban agriculture will emerge. Experiences in other cities showed that in other cases, the initial plan focused mainly on certain types of urban agriculture (for example, the promotion of home and community gardening) and needed to be broadened to include strategies for developing other types of more commercial urban agriculture (Dubbeling et al., 2010).. This might also be relevant for Villa María del Triunfo. In order to do so, monitoring the implementation of the plan and its results will be crucial.
Another aspect that may require more attention and monitoring in the future are concerns about the possible negative effect of electromagnetic fields for gardens under power lines. For example, there is a “prudent avoidance” policy in place in Toronto, Canada, for hydro corridors (City of Toronto, 2008). The policy seeks to specifically minimize children’s exposure to electromagnetic fields (EMFs) using easily achievable, low- or no-cost measures. When planning new gardens and other beneficial uses in hydro corridors, the policy requires that the city measure EMF levels and predict the average time children might spend in the corridor so as to determine the best location for the garden. Toronto Public Health is currently developing an EMF protocol to further guide the city’s compliance with this policy (Jodi Callan, personal communication, 2010).
References Baker, J. (2008). Impacts of financial, food and fuel
crisis on the urban poor. In Directions in urban development. Washington, DC: World Bank, Urban Development Unit.
Centro Internacional de la Papa-CIP. (2007). Impacts of urban agriculture—Highlights of Urban Harvest research and development, 2003–2006. Lima, Peru: Author.
City of Toronto. (2008). Staff report: Reducing electromagnetic field exposure from hydro corridors, Toronto, Canada. http://www.toronto.ca/health/hphe/ pdf/emf_boh_report.pdf
Cole, D., Lee-Smith D., & Nasinyama G. (Eds.) (2008), Healthy city harvests: Generating evidence to guide policy on urban agriculture, Lima, Peru: CIP and Makarere University Press.
Dubbeling, M., de Zeeuw, H., & van Veenhuizen, R. (Eds.). (2010, forthcoming). Cities, poverty and food;
Journal of Agriculture, Food Systems, and Community Development ISSN: 2152-0801 online
www.AgDevJournal.com
154 Volume 1, Issue 2 / Fall 2010
Multistakeholder policy formulation and action planning. Rugby, UK: Practical Action Publishing.
Faysse, N. (2006). Troubles on the way: An analysis of the challenges faced by multistakeholder platforms. Montpellier, France: CIRAD.
Guenette, L. (2006a). A city hooked on urban farming. Case Study No 6. Growing Better Cities. Ottawa, Canada: IDRC.
Guenette, L. (2006b). Gardening takes root in Governador Valadares. Case study No 4. Growing Better Cities. Ottawa, Canada: IDRC.
Hemmati, M. (with contributions from F. Dodds, J. Enayati & J. McHarry). (2002). Multi-stakeholder processes for governance and sustainability: Beyond deadlock and conflict. London: Earthscan.
Instituto Nacional de Estadística et Información (INEI). (2005). Censo Nacional 2005 de población y de vivienda, Lima, Peru: Author.
Mendes, W. (2008). Implementing social and environmental policies in cities: The case of food policy in Vancouver, Canada. International Journal of Urban and Regional Research, 32 (4). doi:10.1111/j.1468-2427.2008.00814.x
Mougeot, L. J. A. (Ed.). (2005). AGROPOLIS The social, political and environmental dimensions of urban agriculture. London: Earthscan.
Municipality of Villa María del Triunfo, IPES, and RUAF. (2006). Villa María, Sembrando para la vida –Situación, limitaciones, potenciales y actores de la agricultura urbana en Villa María del Triunfo (2007–2011), Lima, Peru: Authors.
Municipality of Villa María del Triunfo, IPES, RUAF, & the VMT Urban Agriculture Forum. (2007). Villa
María: Sembrando para la vida. Plan Estratégico Concertado de Agricultura Urbana para Villa María del Triunfo (2007–2011), Lima, Peru: Authors.
Merzthal, G. (2006). Integration of urban agriculture in municipal agendas, experiences from Lima, Peru. In Urban Agriculture Magazine No 16: Formulating effective policies on urban agriculture. Leusden, The Nether-lands: RUAF Foundation.
Partners and Propper. (2004). Verslag Afronding ‘initiatieffase’ opstelling regeling burgerparticipatie gemeente Westervoort. Vught, The Netherlands.
Redwood, M. (2009). Agriculture in urban planning- generating livelihoods and food security. London: Earthscan/IDRC.
Redwood, M. (2010). Commentary: Food price volatility and the urban poor, In C. J. Pearson, S. Pilgrim, J. Pretty (Eds.), Urban agriculture: Diverse activities and benefits for city society (pp. 5–6). London: Earthscan.
UN FAO. (2008). Urban agriculture for sustainable poverty alleviation and food security. Paper prepared for the World Bank (unpublished), Rome.
UN Habitat & UNEP. (1999). Institutionalising environ-mental planning and management process. Sustainable Cities Programme. Nairobi: Authors.
van Veenhuizen, R. (Ed.). (2006). Cities farming for the future: Urban agriculture for green and productive cities. Los Banos, The Philippines: RUAF Foundation, IDRC, and IIRR.
Warner, J. (Ed.). ( 2007). Multistakeholder platforms for integrated water management. Aldershot, UK: Ashgate Publishing.
Journal of Agriculture, Food Systems, and Community Development ISSN: 2152-0801 online www.AgDevJournal.com
Volume 1, Issue 2 / Fall 2010 155
Havana’s changing urban agriculture landscape: A shift to the right? Charles French, University of New Hampshire, Cooperative Extension/Department of Natural Resources and the Environment
Mimi Becker, University of New Hampshire, Department of Natural Resources and the Environment
Bruce Lindsay, University of New Hampshire, Department of Natural Resources and the Environment
Submitted 2 June 2010 / Accepted 3 December 2010/ Published online January 2011
Citation: French, C., Becker, M., & Lindsay, B. (2010, Fall). Havana’s changing urban agriculture landscape: A shift to the right?. Journal
of Agriculture, Food Systems, and Community Development, 1(2): 155–165. doi:10.5304/jafscd.2010.012.013
Copyright © 2011 New Leaf Associates, Inc.
Abstract For two decades Havana, Cuba, has served as a living laboratory for practitioners and scholars of urban agriculture, particularly in its well-docu-mented role in helping stave off food insecurity during a period of severe resource constraints. After the collapse of the Soviet Union in 1991 and the austere economic conditions that followed, the Cuban government enacted a series of radical agrarian reforms aimed at seeding the growth of private urban gardens—a new phenomenon in this country once dependent on trade subsidies and food rations. As a result of the reforms, close to 300 private urban agricultural cooperatives and
thousands of small home gardens sprouted up across Havana. Yet in the ensuing decade and a half, Cuba’s increasing desire to integrate with the global economy, and its adoption of free-market principles, has forced the urban agriculture sector to make dramatic adjustments. Using secondary data, reports by other observers, and our own structured interviews with 11 of Havana’s urban gardeners, this study examines the challenges and opportunities that urban agriculture has experienced, and will continue to experience, in Cuba’s post-communist society. We hope to stimulate continuing inquiry into Havana’s evolving urban agriculture scene, as it continues to provide valuable lessons for other cities in the Global North and South that are increasingly likely to experience their own future resource constraints and food insecurity.
Keywords Havana, Cuba, urban agriculture, agricultural cooperatives, agricultural policy reform
a Corresponding author: 204 Nesmith Hall, University of New Hampshire, Durham, NH 03820 USA; charlie.french@ unh.edu; +1-603-862-0316.
b 207b James Hall, University of New Hampshire, Durham, NH 03820 USA.
c 114 James Hall, University of New Hampshire, Durham, NH 03820 USA.
Journal of Agriculture, Food Systems, and Community Development ISSN: 2152-0801 online www.AgDevJournal.com
156 Volume 1, Issue 2 / Fall 2010
Introduction As a socialist country abandoned during the collapsed Soviet Union and isolated by a lack of trade with many former trading partners, Cuba has provided a unique opportunity to study how nations and their urban communities in particular cope with resource limitation to maintain an ade-quate food supply. Over the last 60 years Cuba has had to restructure its agriculture sector to meet the needs of its citizens during various crises. Private industrial farms dominated the rural landscape prior to the revolution; communist-style, state-run megafarms took over after the revolution; and thousands of smaller farmer-owned cooperatives proliferated during the country’s “Special Period” after the loss of Eastern Block support.
In aggressively addressing food insecurity, the Cuban government instituted reforms, such as giving citizens the right to use vacant land for the production and sale of food, encouraging farmers’ markets (termed “kiosks”), as well as allowing the creation of privately owned cooperatives. Through-out Havana, urban agriculture burgeoned as resi-dents realized this was a way for them to earn extra income (sometimes more than state salaries) as well as supplement their family food needs. Despite limited amounts of oil and petrochemicals to sustain food production, the country managed to stave off widespread hunger and malnutrition.
Recent indications suggest that agriculture and food system reforms have set the stage for yet another period of remarkable change, including some of Cuba’s most liberal policies since the Revolution. Based on data we gathered and inter-views we conducted with urban agriculturalists in Havana, we believe that Cuba is continuing its evolution toward an economy that includes more market-based reforms and individual freedoms— a change that provides new opportunities and challenges in a post-communist society.
Using published data and interviews with a small sample of urban agriculture practitioners in Havana, we explore the recent past and current transformation taking place in the city’s urban agriculture movement. In this paper we endeavor
to encourage further inquiry into Cuba’s rapidly changing urban food system that will lead to viable urban food production strategies for use in coping with a post–fossil fuel future.
Revolution and Communist Control of Agriculture For the better part of the 20th century, sugarcane grown on large, corporate farms dominated Cuba’s agricultural landscape, accounting for 90% of the country’s exports by 1950 (Koont, 2004). In fact, 73.3% of the rural land was owned by less than 9.4% of the landholders, most of which were U.S.-owned companies (Koont, 2004). One of the implications of this export-based agricultural system was that very little government policy was focused on achieving food security, as indicated by the widespread poverty, malnutrition, and class inequities that pervaded Cuba through the 1950s (Murphy, 1999).
When Fidel Castro and his revolutionary forces took control in 1959, however, corporate farms were seized and converted to state-run farms or were redistributed to landless farmers. The state also assumed control over the marketing and distribution of food through what was called the Acopio system of government procurement. Under Acopio, farmers kept a portion of the harvest, while the remainder was distributed by the government to Cuba’s population through food rations (Murphy, 1999). Although state farms diversified their production to include staples for domestic consumption, sugarcane still dominated Cuba’s agricultural landscape. It was the country’s main trade commodity with the Soviet Union, for which Cuba received cheap petroleum, fertilizer, and food staples (Funes, Garcia, Bourque, Perez, & Rosset, 2002).
The Special Period When the Soviet Union collapsed in 1991, prices for Cuban sugar dropped while access to oil and capital goods at below-market prices was virtually cut off, launching Cuba into a period of economic and food insecurity known as the Período Especial en Tiempo de Paz, or the “Special Period in Times of Peace” (Murphy, 1999). At the onset of the
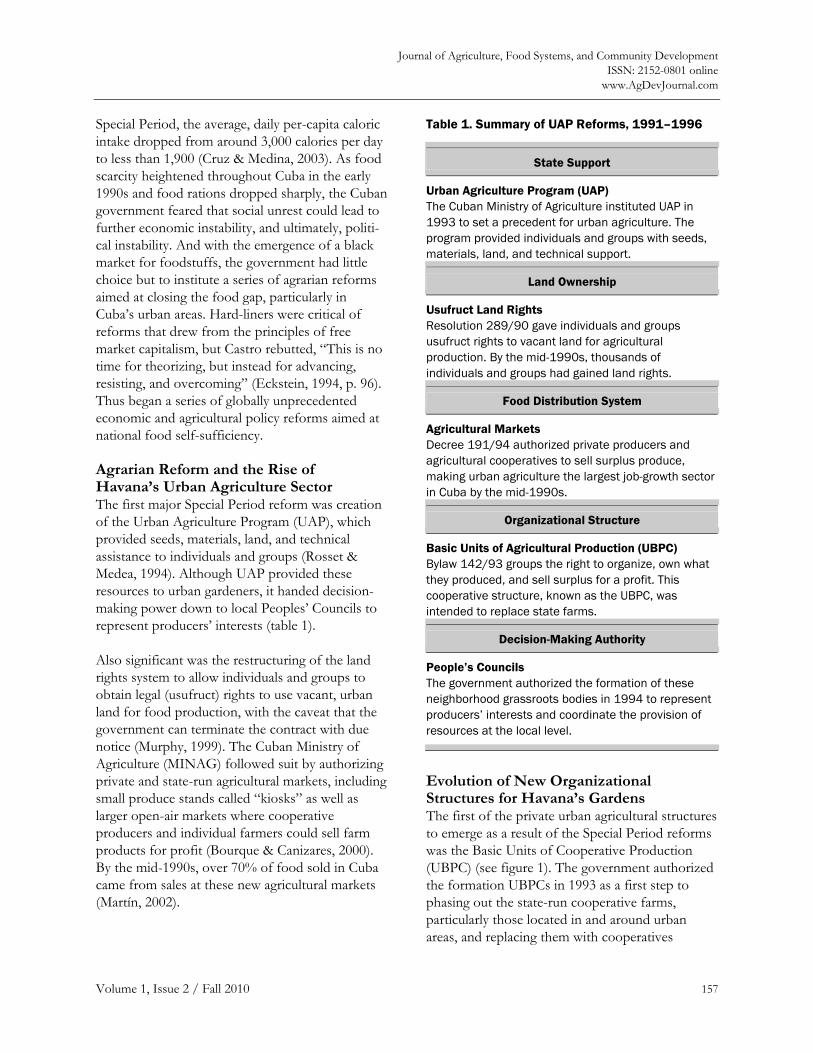
Journal of Agriculture, Food Systems, and Community Development ISSN: 2152-0801 online
www.AgDevJournal.com
Volume 1, Issue 2 / Fall 2010 157
Special Period, the average, daily per-capita caloric intake dropped from around 3,000 calories per day to less than 1,900 (Cruz & Medina, 2003). As food scarcity heightened throughout Cuba in the early 1990s and food rations dropped sharply, the Cuban government feared that social unrest could lead to further economic instability, and ultimately, politi-cal instability. And with the emergence of a black market for foodstuffs, the government had little choice but to institute a series of agrarian reforms aimed at closing the food gap, particularly in Cuba’s urban areas. Hard-liners were critical of reforms that drew from the principles of free market capitalism, but Castro rebutted, “This is no time for theorizing, but instead for advancing, resisting, and overcoming” (Eckstein, 1994, p. 96). Thus began a series of globally unprecedented economic and agricultural policy reforms aimed at national food self-sufficiency.
Agrarian Reform and the Rise of Havana’s Urban Agriculture Sector The first major Special Period reform was creation of the Urban Agriculture Program (UAP), which provided seeds, materials, land, and technical assistance to individuals and groups (Rosset & Medea, 1994). Although UAP provided these resources to urban gardeners, it handed decision-making power down to local Peoples’ Councils to represent producers’ interests (table 1).
Also significant was the restructuring of the land rights system to allow individuals and groups to obtain legal (usufruct) rights to use vacant, urban land for food production, with the caveat that the government can terminate the contract with due notice (Murphy, 1999). The Cuban Ministry of Agriculture (MINAG) followed suit by authorizing private and state-run agricultural markets, including small produce stands called “kiosks” as well as larger open-air markets where cooperative producers and individual farmers could sell farm products for profit (Bourque & Canizares, 2000). By the mid-1990s, over 70% of food sold in Cuba came from sales at these new agricultural markets (Martín, 2002).
Evolution of New Organizational Structures for Havana’s Gardens The first of the private urban agricultural structures to emerge as a result of the Special Period reforms was the Basic Units of Cooperative Production (UBPC) (see figure 1). The government authorized the formation UBPCs in 1993 as a first step to phasing out the state-run cooperative farms, particularly those located in and around urban areas, and replacing them with cooperatives
Table 1. Summary of UAP Reforms, 1991–1996
State Support
Urban Agriculture Program (UAP) The Cuban Ministry of Agriculture instituted UAP in 1993 to set a precedent for urban agriculture. The program provided individuals and groups with seeds, materials, land, and technical support.
Land Ownership
Usufruct Land Rights Resolution 289/90 gave individuals and groups usufruct rights to vacant land for agricultural production. By the mid-1990s, thousands of individuals and groups had gained land rights.
Food Distribution System
Agricultural Markets Decree 191/94 authorized private producers and agricultural cooperatives to sell surplus produce, making urban agriculture the largest job-growth sector in Cuba by the mid-1990s.
Organizational Structure
Basic Units of Agricultural Production (UBPC) Bylaw 142/93 groups the right to organize, own what they produced, and sell surplus for a profit. This cooperative structure, known as the UBPC, was intended to replace state farms.
Decision-Making Authority
People’s Councils The government authorized the formation of these neighborhood grassroots bodies in 1994 to represent producers’ interests and coordinate the provision of resources at the local level.
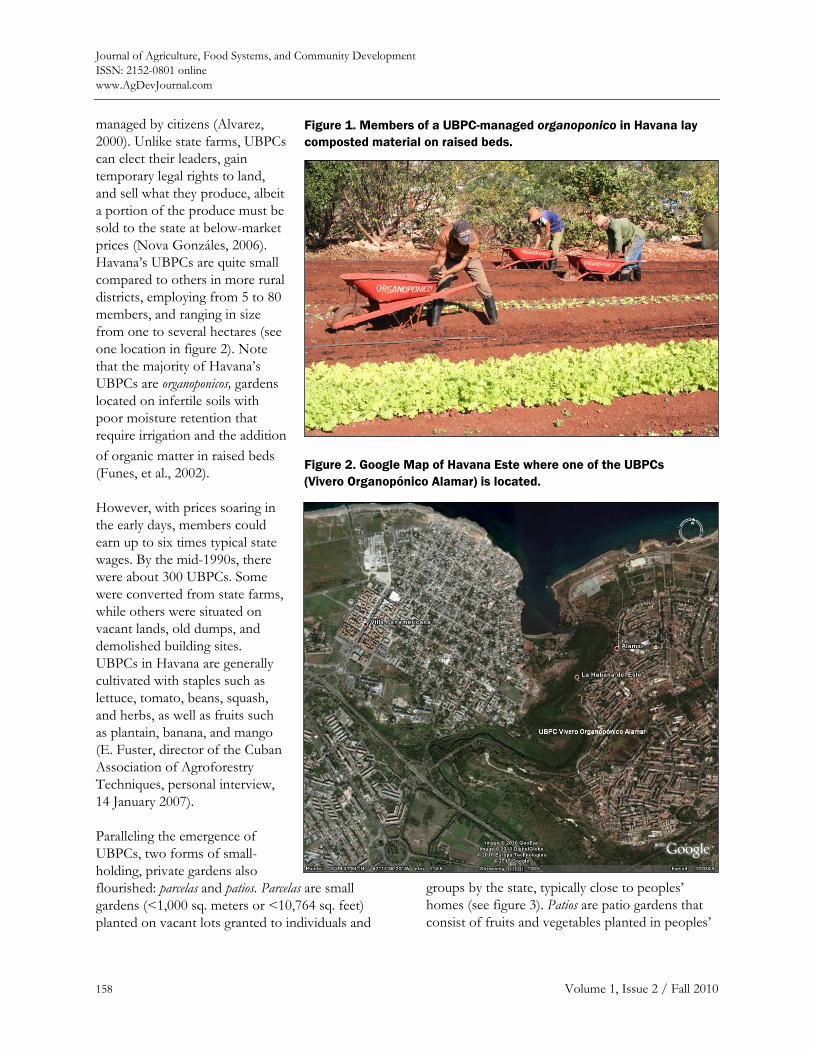
Journal of Agriculture, Food Systems, and Community Development ISSN: 2152-0801 online www.AgDevJournal.com
158 Volume 1, Issue 2 / Fall 2010
managed by citizens (Alvarez, 2000). Unlike state farms, UBPCs can elect their leaders, gain temporary legal rights to land, and sell what they produce, albeit a portion of the produce must be sold to the state at below-market prices (Nova Gonzáles, 2006). Havana’s UBPCs are quite small compared to others in more rural districts, employing from 5 to 80 members, and ranging in size from one to several hectares (see one location in figure 2). Note that the majority of Havana’s UBPCs are organoponicos, gardens located on infertile soils with poor moisture retention that require irrigation and the addition of organic matter in raised beds (Funes, et al., 2002).
However, with prices soaring in the early days, members could earn up to six times typical state wages. By the mid-1990s, there were about 300 UBPCs. Some were converted from state farms, while others were situated on vacant lands, old dumps, and demolished building sites. UBPCs in Havana are generally cultivated with staples such as lettuce, tomato, beans, squash, and herbs, as well as fruits such as plantain, banana, and mango (E. Fuster, director of the Cuban Association of Agroforestry Techniques, personal interview, 14 January 2007).
Paralleling the emergence of UBPCs, two forms of small-holding, private gardens also flourished: parcelas and patios. Parcelas are small gardens (<1,000 sq. meters or <10,764 sq. feet) planted on vacant lots granted to individuals and
groups by the state, typically close to peoples’ homes (see figure 3). Patios are patio gardens that consist of fruits and vegetables planted in peoples’
Figure 1. Members of a UBPC-managed organoponico in Havana lay composted material on raised beds.
Figure 2. Google Map of Havana Este where one of the UBPCs (Vivero Organopónico Alamar) is located.
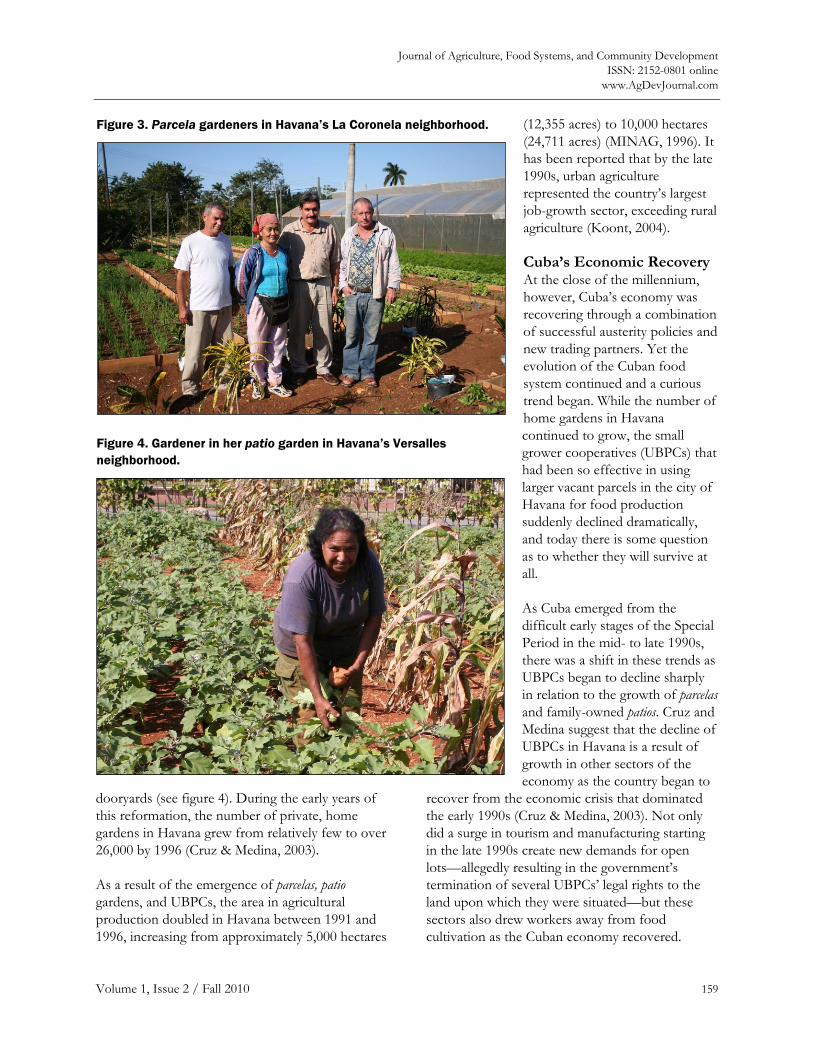
Journal of Agriculture, Food Systems, and Community Development ISSN: 2152-0801 online
www.AgDevJournal.com
Volume 1, Issue 2 / Fall 2010 159
dooryards (see figure 4). During the early years of this reformation, the number of private, home gardens in Havana grew from relatively few to over 26,000 by 1996 (Cruz & Medina, 2003).
As a result of the emergence of parcelas, patio gardens, and UBPCs, the area in agricultural production doubled in Havana between 1991 and 1996, increasing from approximately 5,000 hectares
(12,355 acres) to 10,000 hectares (24,711 acres) (MINAG, 1996). It has been reported that by the late 1990s, urban agriculture represented the country’s largest job-growth sector, exceeding rural agriculture (Koont, 2004).
Cuba’s Economic Recovery At the close of the millennium, however, Cuba’s economy was recovering through a combination of successful austerity policies and new trading partners. Yet the evolution of the Cuban food system continued and a curious trend began. While the number of home gardens in Havana continued to grow, the small grower cooperatives (UBPCs) that had been so effective in using larger vacant parcels in the city of Havana for food production suddenly declined dramatically, and today there is some question as to whether they will survive at all.
As Cuba emerged from the difficult early stages of the Special Period in the mid- to late 1990s, there was a shift in these trends as UBPCs began to decline sharply in relation to the growth of parcelas and family-owned patios. Cruz and Medina suggest that the decline of UBPCs in Havana is a result of growth in other sectors of the economy as the country began to
recover from the economic crisis that dominated the early 1990s (Cruz & Medina, 2003). Not only did a surge in tourism and manufacturing starting in the late 1990s create new demands for open lots—allegedly resulting in the government’s termination of several UBPCs’ legal rights to the land upon which they were situated—but these sectors also drew workers away from food cultivation as the Cuban economy recovered.
Figure 3. Parcela gardeners in Havana’s La Coronela neighborhood.
Figure 4. Gardener in her patio garden in Havana’s Versalles neighborhood.
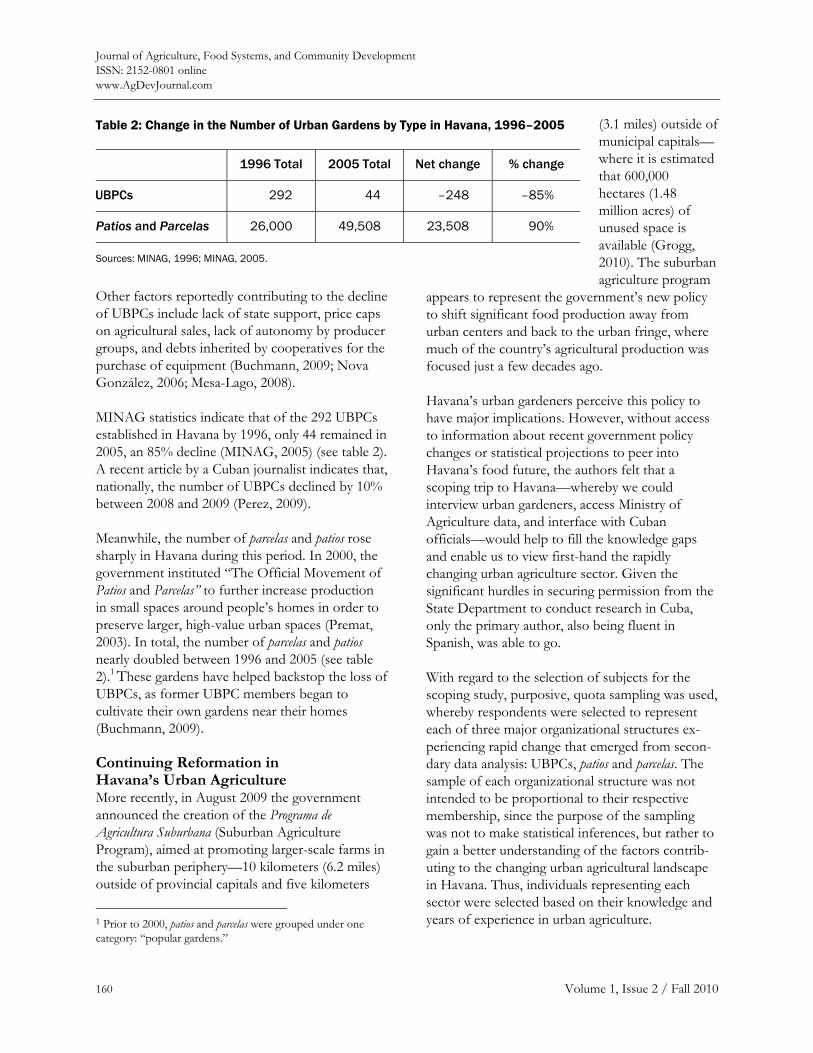
Journal of Agriculture, Food Systems, and Community Development ISSN: 2152-0801 online www.AgDevJournal.com
160 Volume 1, Issue 2 / Fall 2010
Other factors reportedly contributing to the decline of UBPCs include lack of state support, price caps on agricultural sales, lack of autonomy by producer groups, and debts inherited by cooperatives for the purchase of equipment (Buchmann, 2009; Nova González, 2006; Mesa-Lago, 2008).
MINAG statistics indicate that of the 292 UBPCs established in Havana by 1996, only 44 remained in 2005, an 85% decline (MINAG, 2005) (see table 2). A recent article by a Cuban journalist indicates that, nationally, the number of UBPCs declined by 10% between 2008 and 2009 (Perez, 2009).
Meanwhile, the number of parcelas and patios rose sharply in Havana during this period. In 2000, the government instituted “The Official Movement of Patios and Parcelas” to further increase production in small spaces around people’s homes in order to preserve larger, high-value urban spaces (Premat, 2003). In total, the number of parcelas and patios nearly doubled between 1996 and 2005 (see table 2).1 These gardens have helped backstop the loss of UBPCs, as former UBPC members began to cultivate their own gardens near their homes (Buchmann, 2009).
Continuing Reformation in Havana’s Urban Agriculture More recently, in August 2009 the government announced the creation of the Programa de Agricultura Suburbana (Suburban Agriculture Program), aimed at promoting larger-scale farms in the suburban periphery—10 kilometers (6.2 miles) outside of provincial capitals and five kilometers
1 Prior to 2000, patios and parcelas were grouped under one category: “popular gardens.”
(3.1 miles) outside of municipal capitals—where it is estimated that 600,000 hectares (1.48 million acres) of unused space is available (Grogg, 2010). The suburban agriculture program
appears to represent the government’s new policy to shift significant food production away from urban centers and back to the urban fringe, where much of the country’s agricultural production was focused just a few decades ago.
Havana’s urban gardeners perceive this policy to have major implications. However, without access to information about recent government policy changes or statistical projections to peer into Havana’s food future, the authors felt that a scoping trip to Havana—whereby we could interview urban gardeners, access Ministry of Agriculture data, and interface with Cuban officials—would help to fill the knowledge gaps and enable us to view first-hand the rapidly changing urban agriculture sector. Given the significant hurdles in securing permission from the State Department to conduct research in Cuba, only the primary author, also being fluent in Spanish, was able to go.
With regard to the selection of subjects for the scoping study, purposive, quota sampling was used, whereby respondents were selected to represent each of three major organizational structures ex-periencing rapid change that emerged from secon-dary data analysis: UBPCs, patios and parcelas. The sample of each organizational structure was not intended to be proportional to their respective membership, since the purpose of the sampling was not to make statistical inferences, but rather to gain a better understanding of the factors contrib-uting to the changing urban agricultural landscape in Havana. Thus, individuals representing each sector were selected based on their knowledge and years of experience in urban agriculture.
Table 2: Change in the Number of Urban Gardens by Type in Havana, 1996–2005
1996 Total 2005 Total Net change % change
UBPCs 292 44 –248 –85%
Patios and Parcelas 26,000 49,508 23,508 90%
Sources: MINAG, 1996; MINAG, 2005.
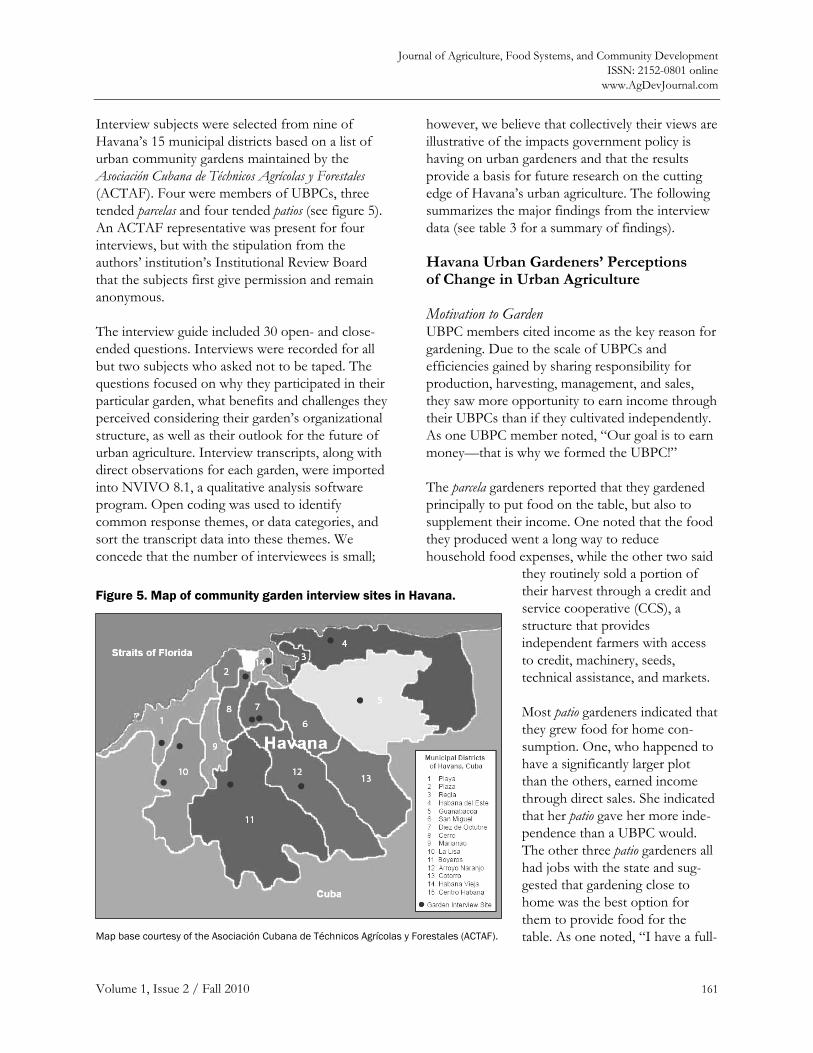
Journal of Agriculture, Food Systems, and Community Development ISSN: 2152-0801 online
www.AgDevJournal.com
Volume 1, Issue 2 / Fall 2010 161
Interview subjects were selected from nine of Havana’s 15 municipal districts based on a list of urban community gardens maintained by the Asociación Cubana de Téchnicos Agrícolas y Forestales (ACTAF). Four were members of UBPCs, three tended parcelas and four tended patios (see figure 5). An ACTAF representative was present for four interviews, but with the stipulation from the authors’ institution’s Institutional Review Board that the subjects first give permission and remain anonymous.
The interview guide included 30 open- and close-ended questions. Interviews were recorded for all but two subjects who asked not to be taped. The questions focused on why they participated in their particular garden, what benefits and challenges they perceived considering their garden’s organizational structure, as well as their outlook for the future of urban agriculture. Interview transcripts, along with direct observations for each garden, were imported into NVIVO 8.1, a qualitative analysis software program. Open coding was used to identify common response themes, or data categories, and sort the transcript data into these themes. We concede that the number of interviewees is small;
however, we believe that collectively their views are illustrative of the impacts government policy is having on urban gardeners and that the results provide a basis for future research on the cutting edge of Havana’s urban agriculture. The following summarizes the major findings from the interview data (see table 3 for a summary of findings).
Havana Urban Gardeners’ Perceptions of Change in Urban Agriculture Motivation to Garden UBPC members cited income as the key reason for gardening. Due to the scale of UBPCs and efficiencies gained by sharing responsibility for production, harvesting, management, and sales, they saw more opportunity to earn income through their UBPCs than if they cultivated independently. As one UBPC member noted, “Our goal is to earn money—that is why we formed the UBPC!”
The parcela gardeners reported that they gardened principally to put food on the table, but also to supplement their income. One noted that the food they produced went a long way to reduce household food expenses, while the other two said
they routinely sold a portion of their harvest through a credit and service cooperative (CCS), a structure that provides independent farmers with access to credit, machinery, seeds, technical assistance, and markets.
Most patio gardeners indicated that they grew food for home con-sumption. One, who happened to have a significantly larger plot than the others, earned income through direct sales. She indicated that her patio gave her more inde-pendence than a UBPC would. The other three patio gardeners all had jobs with the state and sug-gested that gardening close to home was the best option for them to provide food for the table. As one noted, “I have a full-
Figure 5. Map of community garden interview sites in Havana.
Map base courtesy of the Asociación Cubana de Téchnicos Agrícolas y Forestales (ACTAF).
Journal of Agriculture, Food Systems, and Community Development ISSN: 2152-0801 online www.AgDevJournal.com
162 Volume 1, Issue 2 / Fall 2010
time job, but my family and I grow vegetables to eat because the cost of food is so high.”
Individual Challenges UBPC members complained that management of the cooperative was the biggest issue. In the words of one UBPC farmer, “We see a lot of turnover of members and it is getting harder to manage the cooperative and split the proceeds. We just don’t have the experience to manage the UBPC.” He indicated that a number of UBPCs in Havana had disbanded due to lack of leadership. Another UBPC member indicated that some of Cuba’s changing policies and supports made it difficult for his UBPC, such as changes in the proportion of the harvest required to be sold through the Acopio system, reduced access to financing, and the chang-ing requirements on what the UBPC is authorized to grow by the state. As well, new price caps im-posed by the state on food sold by the UBPC cut into their proceeds. Furthermore, his UBPC was now required to pay the state a fee for use of the land. In the words of this individual, “the chal-lenges of managing a UBPC—sharing the pro-ceeds, lack of leadership, and fears that the state will take the land—make UBPCs a dying breed in Havana.”
Patio and parcela gardeners indicated that their big-gest challenge was access to resources and materi-als. Materials and resources most frequently cited were tools, quality seeds, tilling equipment, water access, and help with pest management. One also noted that there are not enough agricultural exten-sionists to meet their technical assistance needs. He said, “Some of us have little experience with grow-ing food and we need help…We need resources to get us started.” Another noted, “Unless the gov-ernment helps me with pest control, it’s not worth harvesting my garden.”
Two parcela gardeners who sold produce through a CCS noted that state taxes on their produce sales were increasingly cutting into their profits. In con-trast, the patio gardeners were generally not con-cerned about new regulations or taxes, since three of the four did not sell their produce.
Future Outlook When asked what they perceived the future of their own garden to hold, the responses were striking. UBPC members were mainly concerned with re-taining land tenure. One UBPC member described how several UBPCs had folded since 2000 because the land was appropriated by the state for other uses. Their contract explicitly stated that they had indefinite usufruct rights to the land, meaning that there was no long-term guarantee. UBPC members also shared concerns that regulations on the sale of food through the system of open agricultural markets would increase, and that new taxes would be imposed, thus reducing their profits. Not only had price caps been instituted after the Special Period, but a portion of UBPCs’ produce now has to be sold through the Acopio system. Confirming the bleak outlook on the future of many UBPCs, one indicated that he doubted that they would still be in business in five years.
In contrast, the patio and parcela gardeners were not concerned that the state would take their land, since they gardened on undevelopable parcels around their homes. One patio gardener indicated that he had once been a UBPC member, but was forced to get a job at a hotel due to a sense of uncertainty of the future of his UBPC. He said, “I decided to grow food at home instead because there is more opportunity for growth.”
All but one of the parcela and patio gardeners said that they saw an opportunity to increase their productivity, and sales of vegetables and orna-mentals. At the same time, they said that the government would need to provide additional support to them.
Outlook on the Future of the Urban Agriculture Sector Interviewees’ views on the perceived future of the urban agriculture sector varied widely. There was, however, broad sentiment by UBPC members, parcela gardeners, and patio gardeners alike that the government was changing how it supported urban agriculture. One patio gardener noted, “The govern-ment helped us get started in the early ’90s. But
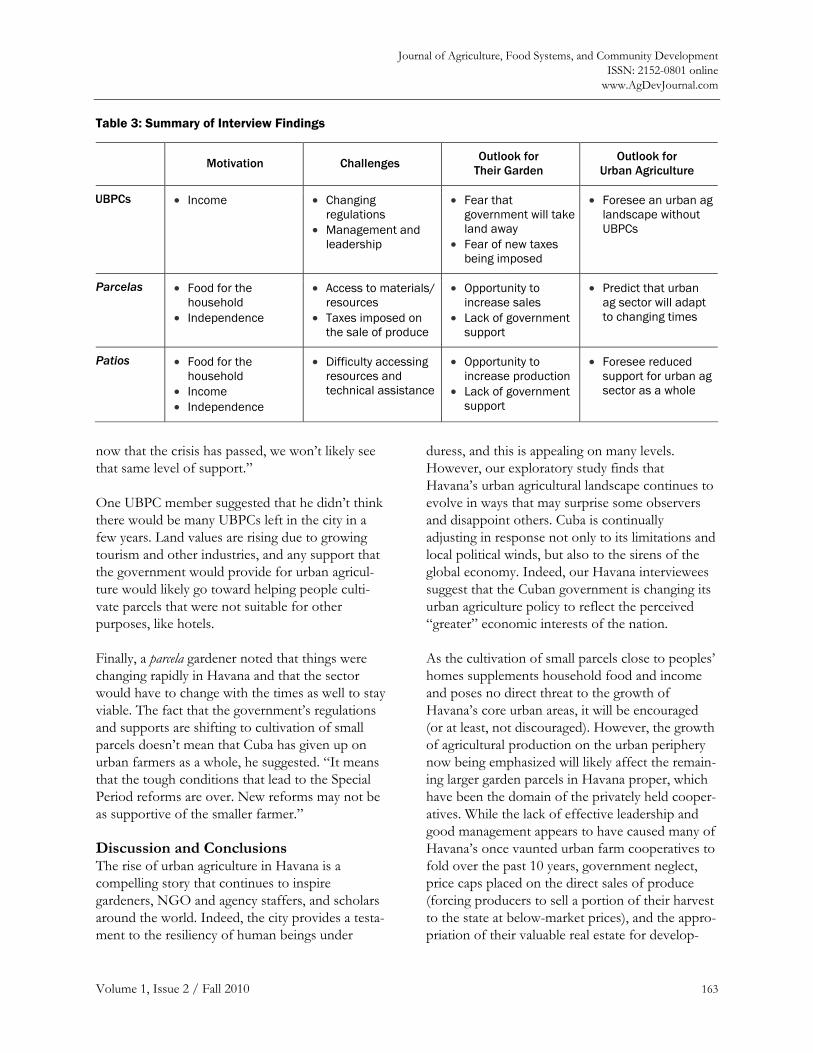
Journal of Agriculture, Food Systems, and Community Development ISSN: 2152-0801 online
www.AgDevJournal.com
Volume 1, Issue 2 / Fall 2010 163
now that the crisis has passed, we won’t likely see that same level of support.”
One UBPC member suggested that he didn’t think there would be many UBPCs left in the city in a few years. Land values are rising due to growing tourism and other industries, and any support that the government would provide for urban agricul-ture would likely go toward helping people culti-vate parcels that were not suitable for other purposes, like hotels.
Finally, a parcela gardener noted that things were changing rapidly in Havana and that the sector would have to change with the times as well to stay viable. The fact that the government’s regulations and supports are shifting to cultivation of small parcels doesn’t mean that Cuba has given up on urban farmers as a whole, he suggested. “It means that the tough conditions that lead to the Special Period reforms are over. New reforms may not be as supportive of the smaller farmer.”
Discussion and Conclusions The rise of urban agriculture in Havana is a compelling story that continues to inspire gardeners, NGO and agency staffers, and scholars around the world. Indeed, the city provides a testa-ment to the resiliency of human beings under
duress, and this is appealing on many levels. However, our exploratory study finds that Havana’s urban agricultural landscape continues to evolve in ways that may surprise some observers and disappoint others. Cuba is continually adjusting in response not only to its limitations and local political winds, but also to the sirens of the global economy. Indeed, our Havana interviewees suggest that the Cuban government is changing its urban agriculture policy to reflect the perceived “greater” economic interests of the nation.
As the cultivation of small parcels close to peoples’ homes supplements household food and income and poses no direct threat to the growth of Havana’s core urban areas, it will be encouraged (or at least, not discouraged). However, the growth of agricultural production on the urban periphery now being emphasized will likely affect the remain-ing larger garden parcels in Havana proper, which have been the domain of the privately held cooper-atives. While the lack of effective leadership and good management appears to have caused many of Havana’s once vaunted urban farm cooperatives to fold over the past 10 years, government neglect, price caps placed on the direct sales of produce (forcing producers to sell a portion of their harvest to the state at below-market prices), and the appro-priation of their valuable real estate for develop-
Table 3: Summary of Interview Findings
Motivation Challenges Outlook for Their Garden
Outlook for Urban Agriculture
UBPCs • Income
• Changing regulations
• Management and leadership
• Fear that government will take land away
• Fear of new taxes being imposed
• Foresee an urban ag landscape without UBPCs
Parcelas • Food for the household
• Independence
• Access to materials/ resources
• Taxes imposed on the sale of produce
• Opportunity to increase sales
• Lack of government support
• Predict that urban ag sector will adapt to changing times
Patios • Food for the household
• Income • Independence
• Difficulty accessing resources and technical assistance
• Opportunity to increase production
• Lack of government support
• Foresee reduced support for urban ag sector as a whole
Journal of Agriculture, Food Systems, and Community Development ISSN: 2152-0801 online www.AgDevJournal.com
164 Volume 1, Issue 2 / Fall 2010
ment in total clearly signal a new phase in the evolution of Havana’s urban agriculture.
As the state takes away with one hand and gives with another, interesting questions arise: Will Havana’s remaining UBPCs and their urban spaces painstakingly cultivated into organic oases now give rise to world-class hotels and office com-plexes? And what of the long-term viability of the privately owned periphery farms? Fidel Castro’s recent statement to Jeffrey Goldberg from The Atlantic that, “The Cuban model doesn’t even work for us anymore,” is a pretty clear indication of Cuba’s future direction (Campo-Flores & Bast, 2010). As Cuba continues to experiment with private ownership, efficiencies, and free markets, how will it deal with capitalism’s comorbidities, including competition, consolidation, industrializa-tion, and monopolization? The most exciting development to watch may be how Cuba fosters freedom while also trying to find the elusive balance of interests that urban and periurban agriculture need in order to be sustainable in the long run. Only time will tell. But one thing is for sure: Havana may become even more valuable as a living laboratory for the rest of us as it becomes increasingly like other cities in the Global North in the years to come, and the new suburban agricul-ture program now being instituted in the hinter-lands of Havana informs our own attempts at peripheral or “metropolitan” agriculture. We have much to learn from the urban agricultural experi-ment that is Havana’s rapidly evolving food system.
Acknowledgements Special thanks go to Eugenio Fuster and Castillano with of the Cuban Association of Agroforestry Techniques (ACTAF) for providing orientation to Havana’s diverse urban gardens.
References Alvarez, J. (2000). Differences in agricultural
productivity in Cuba’s state and nonstate sectors: further evidence. Cuba in Transition. Reston, VA: American Society of Civil Engineers.
Bourque, M., & Canizares, K. (2000). Agricultura urbana en produccíon de alimentos en la comunidad, por la
comunidad y para la comunidad. Oakland, CA: Policy Institute on Food and Development.
Buchmann, C. (2009). Cuban home gardens and their role in social-ecological resilience. Human Ecology, 37(6), 705–721. doi:10.1007/s10745-009-9283-9
Butterfield, B. (2009). The impact of home and community gardening in America: National garden survey. Proceedings from the 5th Annual Garden Writers Web Teleconference, February 25, 2009.
Campo-Flores, A., & Bast, A. (2010, September 13). Fidel tells the truth in Cuba. Newsweek, Vol. 155.
Chaplowe, S. (1996). Havana’s popular gardens: Sus-tainable urban agriculture. City Farmer, 5(22), 1–7.
Cruz, M., & Medina. R. (2003). Agriculture in the city: A key to sustainability in Havana, Cuba. Kingston, Jamaica: Ian Randall Publishers.
Eckstein, S. (1994). Back from the future: Cuba under Castro. London: Routledge.
Funes, F., Garcia, L., Bourque, M., Perez, N., & Rosset, P. (Eds.). (2002). Sustainable agriculture and resistance: Transforming food production in Cuba. Oakland, CA: Food First Books.
Gleissman, S., & Resemey, M. (Eds). (2010). The conversion to sustainable agriculture: Principles, processes and practices. Boca Raton, FL: CRC Press.
Grogg, P. (2007). Agriculture-Cuba: Waiting for announced reforms. Published by Inter-Press Service. Retrieved from http://ipsnews.net/ news.asp?idnews=40349
Grogg, P. (2010). Sustainable agriculture moves to the suburbs. Published by Inter-Press Service. Retrieved from http://ipsnews.net/news. asp?idnews=51296
Koont, S. (2004). Food security in Cuba. Monthly Review, 55(8), 11–20.
Martín, L. (2002). Transforming the Cuban countryside: Property, markets and technological change. Chapter 4 in F. Funes, L. Garcia., L. Borque., N. Perez., and P. Rosset. (Eds.), Sustainable agriculture and resistance: Transforming food production in Cuba. Oakland, CA: Food First Books.
Mesa-Lago, C. (2008). The Cuban economy in 2006–2007. Cuba in Transition, 17.
MINAG. (1996). Informes Anuales de la Empresa Horticula Metropolitana.
MINAG. (2005). Informes Anuales de la Empresa Horticula Metropolitana.
Murphy, C. (1999). Cultivating Havana: Urban agriculture and food security in the years of crisis. Development Report No. 12. Oakland, CA: Food First Books.

Journal of Agriculture, Food Systems, and Community Development ISSN: 2152-0801 online
www.AgDevJournal.com
Volume 1, Issue 2 / Fall 2010 165
Nova González, A. (2006). La agricultura en Cuba: Evolución y trayectoria (1959-2005). La Habana: Editorial Ciencias Sociales.
Perez, J. (2009). “Aciertos y desaciertos de las UBPC segun el granma. Cuba Independiente. Accessed from http://cubaindependiente.blogspot.com/ 2009/12/aciertos-y-desaciertos-de-las-ubpc.html
Premat, A. (2003). Small-scale urban agriculture in Havana and the reproduction of the “New Man” in contemporary Cuba. Revista Europa de Estudios Latinoamericanos y del Caribe, 75, 85–99.
Rosset, P., & B. Medea. (1994). The greening of the revolution: Cuba’s experiment with organic agriculture. Sydney, Australia: Ocean Press.

Journal of Agriculture, Food Systems, and Community Development ISSN: 2152-0801 online www.AgDevJournal.com
166 Volume 1, Issue 2 / Fall 2010
Journal of Agriculture, Food Systems, and Community Development ISSN: 2152-0801 online www.AgDevJournal.com
Volume 1, Issue 2 / Fall 2010 167
Testing and educating on urban soil lead: A case of Chicago community gardens
Laura Witzlinga, University of Illinois at Urbana Champaign
Michelle Wanderb, University of Illinois at Urbana Champaign
Ellen Phillipsc, University of Illinois Extension
Submitted 7 July 2010 / Accepted 10 January 2011/ Published online 31 January 2011 Citation: Witzling, L., Wander, M., & Phillips, E. (2011, January). Testing and educating on urban soil lead: A case of Chicago community gardens. Journal of Agriculture, Food Systems, and Community Development, 1(2): 167–185. doi:10.5304/jafscd.2010.012.015
Copyright © 2011 New Leaf Associates, Inc.
Abstract Chicago has many urban agricultural projects that provide a source of local food for city dwellers. Urban garden soil, however, may contain lead pollution, and soil quality can vary dramatically from location to location. Soil testing and access to information should improve gardeners’ abilities to grow food safely in urban soils, and to know if time-consuming or expensive measures to avoid lead exposure or enrich the soil are really necessary for their gardens. Soil quality including lead levels was profiled in 10 Chicago gardens. Gardens growing food within raised beds were compared to
gardens growing food without raised beds. We also quantified lead in adjacent areas of bare soil or where children might play. Soil lead was measured in two ways: through acid digestion with the Environmental Protection Agency (EPA) 3050B method and a Mehlich-III extraction. The overall mean soil lead level reported through the EPA method was 135 parts per million (n=86), with a range from 10 parts per million to 889 parts per million in individual soil samples. The average for the Mehlich-III method was 63 parts per million. Lead levels in most gardens were not a concern, although gardens contained excessive fertility. Use of raised beds reduced lead levels and thus the potential risk of lead ingestion from plant uptake, but further study comparing the use of raised beds with a greater number of gardens is required. Higher lead levels in soil from nearby areas suggest the possibility of contamination to raised beds and supports the notion that areas with bare soil adjacent to gardens may be an equal or greater source of risk. Our results suggest that the Mehlich-III soil test was positively correlated with the more costly EPA test and could be developed as less expensive test easily conducted by commer-cial soil-testing labs. Additionally, a training pro-
a Corresponding author: Laura Witzling, M.S., University of Illinois at Urbana Champaign, 415 South Orchard Street, Madison, WI 53715 USA; +1-414-238-3431; [email protected]
b Michelle Wander, Associate Professor, University of Illinois at Urbana Champaign, N-225 Turner Hall, MC-047 1102 South Goodwin Avenue, Urbana, IL 61801 USA; +1-217-333-9471; [email protected]
c Ellen Phillips, Extension Educator, Crop Systems, University of Illinois Extension, Countryside Extension Center, 6438 Joliet Road, Countryside, IL 60525; +1-708-352-0109; [email protected]
Journal of Agriculture, Food Systems, and Community Development ISSN: 2152-0801 online www.AgDevJournal.com
168 Volume 1, Issue 2 / Fall 2010
gram about urban garden safety with live and online options was created and evaluated with questionnaires given to Master Gardeners. Both live-trained and online-trained groups’ quiz scores improved significantly after the trainings, demon-strating that education about urban soil manage-ment can be effective.
Keywords community garden, lead, soil testing, urban agriculture, urban soil, Chicago, training, web-based learning
Introduction Urban gardening is a popular activity that offers many benefits to participants and communities. The nonprofit organization GreenNet documents over 600 community gardens in Chicago (GreenNet, no date). Access to fresh food in Chicago is also important, as more than half a million people in Chicago live in food deserts (Mari Gallagher Research & Consulting, 2006). Urban gardening projects can offer neighborhood stabil-ity, create a place for interracial connections, and help participants meet self-esteem and social needs (Shinew, Glover, & Parry, 2004; Tranel & Handlin, 2006; Waliczek, Zajicek, & Lineberger, 2005).
Urban garden settings, however, may contain contaminants that pose risks to gardeners, children who play in or near the gardens, and consumers of garden produce. Research shows that seasonal peaks in human blood lead levels correspond with environmental conditions, such as warm tempera-tures, low soil moisture, and greater amounts of wind, that result in increased suspension and movement of small soil particles (Laidlaw, Mielke, Filippelli, Johnson, & Gonzales, 2005). Urban soil can contain elevated amounts of lead because the tiny, insoluble lead particles become bound to small soil particles. Even though the addition of lead to gasoline and paint was phased out in the 1970s, these sources remain in urban soil and can be the primary contributors to lead in urban soils (Clark, Brabander, & Erdil, 2006). The Centers for Disease Control and Prevention (CDC) reports that of the more than 3,500,000 children in the U.S. under three years old tested for blood lead
levels in 2007, about 1.00% had elevated blood lead levels, defined as more than 10 micrograms per deciliter (CDC, 2009). Among the 23,434 chil-dren under six years old tested in 2008 in Cook County, where Chicago is located, the percentage of children with elevated blood lead levels was 7.23% (CDC).
While the negative effects of lead exposure are indisputable, deciding the degree to which soil lead in gardens used for growing food poses a health risk is challenging because lead has complicated soil chemistry, soil sampling methods may affect the level of lead detected, and exposure to soil lead in gardens used for growing food can occur both through soil ingestion and by consumption of produce grown on contaminated soil.
Currently, the most common Environmental Protection Agency (EPA) method for measuring soil lead uses a very strong acid to remove almost all of the lead from a soil sample (known as an acid digest) (U.S. EPA, 1996). Alternatively, much research is devoted to finding an extraction method that measures only bioavailable forms of lead. Bioavailable forms of lead are of interest because these are the forms of lead a plant may uptake more easily, and consumption of contaminated edible plants is one route of human exposure to lead. Simple extracts like Mehlich-I and Mehlich-III are attractive options since these are routinely used by commercial soil testing labs and cost less than the acid digest method.
Soil sampling methods are a key and challenging aspect of testing for soil lead. In general, sampling strategies emphasize surface soil since lead can accumulate there in insoluble forms (Laidlaw & Filippelli, 2008), though other research suggests that in gardens where soil is mixed, lead can be homogenous to the root zone (Clark, Hausladen, & Brabander, 2008). Studies also suggest that a risk to lead exposure is posed by soil in areas adjacent to gardens, so sampling bare paths or areas in which children might play may be important (Clark et al., 2008; Binns et al., 2004). Finally, understanding and predicting the risks of soil lead are particularly difficult in gardens used for growing food because
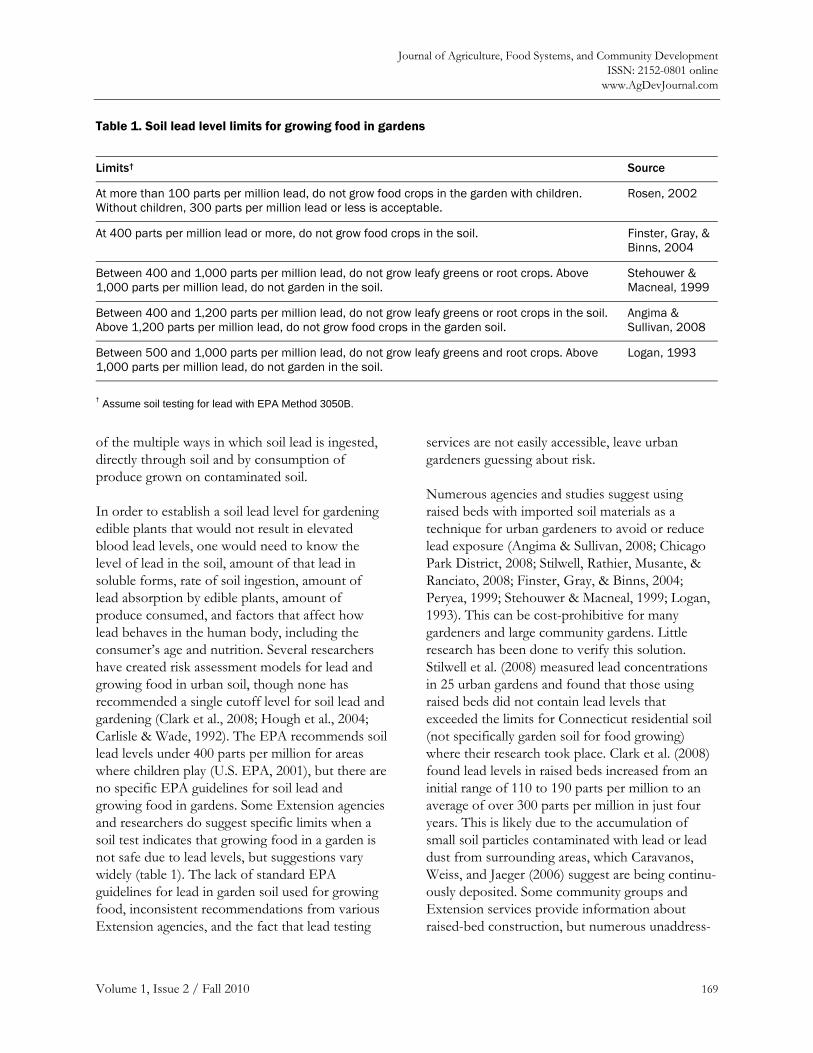
Journal of Agriculture, Food Systems, and Community Development ISSN: 2152-0801 online
www.AgDevJournal.com
Volume 1, Issue 2 / Fall 2010 169
of the multiple ways in which soil lead is ingested, directly through soil and by consumption of produce grown on contaminated soil.
In order to establish a soil lead level for gardening edible plants that would not result in elevated blood lead levels, one would need to know the level of lead in the soil, amount of that lead in soluble forms, rate of soil ingestion, amount of lead absorption by edible plants, amount of produce consumed, and factors that affect how lead behaves in the human body, including the consumer’s age and nutrition. Several researchers have created risk assessment models for lead and growing food in urban soil, though none has recommended a single cutoff level for soil lead and gardening (Clark et al., 2008; Hough et al., 2004; Carlisle & Wade, 1992). The EPA recommends soil lead levels under 400 parts per million for areas where children play (U.S. EPA, 2001), but there are no specific EPA guidelines for soil lead and growing food in gardens. Some Extension agencies and researchers do suggest specific limits when a soil test indicates that growing food in a garden is not safe due to lead levels, but suggestions vary widely (table 1). The lack of standard EPA guidelines for lead in garden soil used for growing food, inconsistent recommendations from various Extension agencies, and the fact that lead testing
services are not easily accessible, leave urban gardeners guessing about risk.
Numerous agencies and studies suggest using raised beds with imported soil materials as a technique for urban gardeners to avoid or reduce lead exposure (Angima & Sullivan, 2008; Chicago Park District, 2008; Stilwell, Rathier, Musante, & Ranciato, 2008; Finster, Gray, & Binns, 2004; Peryea, 1999; Stehouwer & Macneal, 1999; Logan, 1993). This can be cost-prohibitive for many gardeners and large community gardens. Little research has been done to verify this solution. Stilwell et al. (2008) measured lead concentrations in 25 urban gardens and found that those using raised beds did not contain lead levels that exceeded the limits for Connecticut residential soil (not specifically garden soil for food growing) where their research took place. Clark et al. (2008) found lead levels in raised beds increased from an initial range of 110 to 190 parts per million to an average of over 300 parts per million in just four years. This is likely due to the accumulation of small soil particles contaminated with lead or lead dust from surrounding areas, which Caravanos, Weiss, and Jaeger (2006) suggest are being continu-ously deposited. Some community groups and Extension services provide information about raised-bed construction, but numerous unaddress-
Table 1. Soil lead level limits for growing food in gardens
Limits† Source
At more than 100 parts per million lead, do not grow food crops in the garden with children. Without children, 300 parts per million lead or less is acceptable.
Rosen, 2002
At 400 parts per million lead or more, do not grow food crops in the soil. Finster, Gray, & Binns, 2004
Between 400 and 1,000 parts per million lead, do not grow leafy greens or root crops. Above 1,000 parts per million lead, do not garden in the soil.
Stehouwer & Macneal, 1999
Between 400 and 1,200 parts per million lead, do not grow leafy greens or root crops in the soil. Above 1,200 parts per million lead, do not grow food crops in the garden soil.
Angima & Sullivan, 2008
Between 500 and 1,000 parts per million lead, do not grow leafy greens and root crops. Above 1,000 parts per million lead, do not garden in the soil.
Logan, 1993
† Assume soil testing for lead with EPA Method 3050B.
Journal of Agriculture, Food Systems, and Community Development ISSN: 2152-0801 online www.AgDevJournal.com
170 Volume 1, Issue 2 / Fall 2010
ed issues include where to purchase fill materials for raised beds, what materials are safe for raised-bed construction (e.g., untreated lumber), how to validate that soil materials are uncontaminated and of high quality, and which (if any) organic amend-ments might aid in reducing metal availability, as some research suggests.
Because of the potential for contamination, access to resources about urban soil risks is critical. Web-based learning, in particular, could offer many benefits. Potential advantages of web-based learn-ing include increased accessibility to information and the ability to easily cross-reference materials (Chumley-Jones, Dobbie, & Alford, 2002). Agius and Bagnall (1998) state that learning through the Internet is a resource-based approach that promotes “learner autonomy” and presents the opportunity to incorporate numerous styles of learning. Much research has evaluated the use of online learning methods specifically for gardeners. Meyer and Foord (2008) found that 28% of surveyed gardeners reported that they were very likely to use the Internet to solve a question about a plant problem. VanDerZanden and Kirsch (2003) found that 85% of surveyed Oregon Master Gardeners, a group of volunteers given formal training by Extension services, used computers and 92% of those used the Internet, suggesting that Master Gardeners may be open to taking training courses online. Typical Master Gardener demo-graphics (over 40, well educated, motivated) are conducive to distance learning (Jeannette & Meyer, 2002). It is unclear whether this group would have the same learning preferences as younger or more diverse urban populations who garden.
It is also unclear whether gardeners would use the Internet to learn about environmental risk. The wealth of information about soil fertility and environmental risk in scientific journals may be overlooked by urban gardeners lacking access to the information or the time to interpret it. After reviewing online resources that address urban gardening risks, we found few sources that encourage soil testing for metals like lead or have information about how to find a soil testing lab that will measure pollutants and interpret soil test
results. Some websites misinterpret EPA guidelines for soil lead, erroneously reporting that the EPA has guidelines for soil and growing food in gardens. Most sites that do offer information about safety and urban gardening are completely text-based and do not use interactive multimedia, such as videos or audio clips, the use of which can increase learner knowledge (VanDerZanden & Rost, 2003). Most websites also miss the opportunity to link the public to in-depth research articles or abstracts. It is not clear whether gardeners have, want, or would benefit from access to information about urban soil management and potential risks.
Study Objectives The objectives of this research were to: (1) create soil quality profiles of 10 urban gardens in Chicago for use as explanatory tools, (2) evaluate the differ-ences in soil quality profiles between raised-bed food-growing areas, non–raised-bed food-growing areas, and other nearby garden areas such as pathways and exposed soil, (3) compare the evaluation of soil lead through both a strong acid digestion (the EPA method) and an extraction (the Mehlich-III method), and assess the tests’ predictive capabilities through a lettuce bioassay, and (4) determine whether a live and/or online delivery of educational materials about urban soils management and risks might benefit urban gardeners.
Methods
Study of Garden Soils We sampled 10 gardens in a transect of Chicago approximately 20 miles long (figure 1). These were distributed to cover a larger geographic space than many of the other studies conducted to date. The gardens were paired to represent raised-bed and non–raised-bed gardens. Soil was sampled from the gardens in late May and early June of 2008. A total of 86 soil samples (zero to 30 centimeters deep with a five centimeter diameter volume corer) were taken from the 10 sites. At most sites, four soil cores were taken from food-growing areas and three soil cores from nearby areas of soil not used for growing food (such as exposed soil in pathways or places where children play). In gardens where
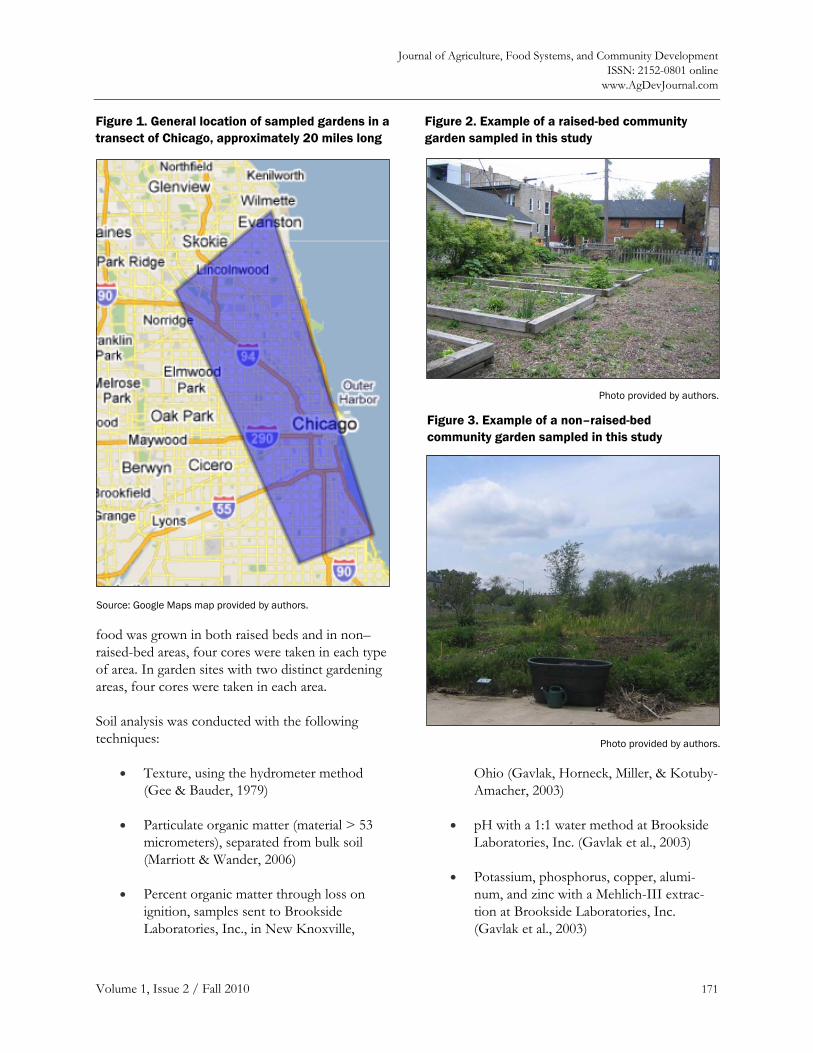
Journal of Agriculture, Food Systems, and Community Development ISSN: 2152-0801 online
www.AgDevJournal.com
Volume 1, Issue 2 / Fall 2010 171
food was grown in both raised beds and in non–raised-bed areas, four cores were taken in each type of area. In garden sites with two distinct gardening areas, four cores were taken in each area.
Soil analysis was conducted with the following techniques:
• Texture, using the hydrometer method (Gee & Bauder, 1979)
• Particulate organic matter (material > 53 micrometers), separated from bulk soil (Marriott & Wander, 2006)
• Percent organic matter through loss on ignition, samples sent to Brookside Laboratories, Inc., in New Knoxville,
Ohio (Gavlak, Horneck, Miller, & Kotuby-Amacher, 2003)
• pH with a 1:1 water method at Brookside Laboratories, Inc. (Gavlak et al., 2003)
• Potassium, phosphorus, copper, alumi-num, and zinc with a Mehlich-III extrac-tion at Brookside Laboratories, Inc. (Gavlak et al., 2003)
Figure 2. Example of a raised-bed community garden sampled in this study
Photo provided by authors.
Figure 3. Example of a non–raised-bed community garden sampled in this study
Photo provided by authors.
Figure 1. General location of sampled gardens in a transect of Chicago, approximately 20 miles long
Source: Google Maps map provided by authors.
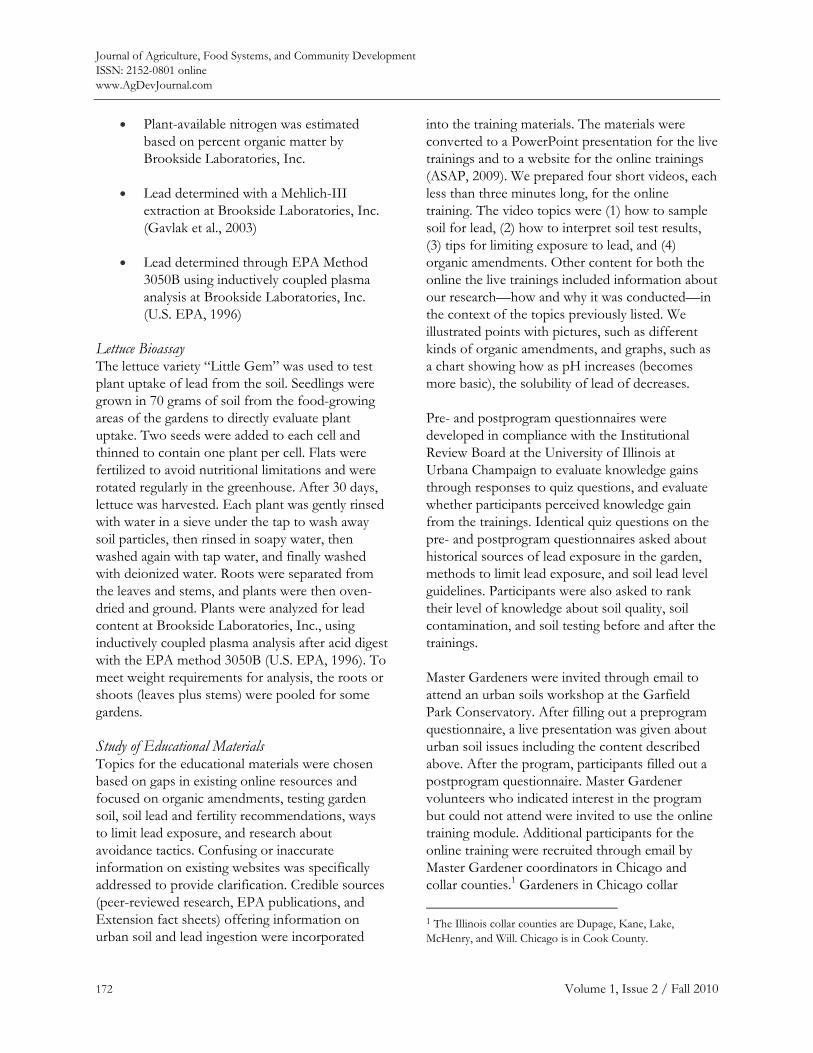
Journal of Agriculture, Food Systems, and Community Development ISSN: 2152-0801 online www.AgDevJournal.com
172 Volume 1, Issue 2 / Fall 2010
• Plant-available nitrogen was estimated based on percent organic matter by Brookside Laboratories, Inc.
• Lead determined with a Mehlich-III extraction at Brookside Laboratories, Inc. (Gavlak et al., 2003)
• Lead determined through EPA Method 3050B using inductively coupled plasma analysis at Brookside Laboratories, Inc. (U.S. EPA, 1996)
Lettuce Bioassay The lettuce variety “Little Gem” was used to test plant uptake of lead from the soil. Seedlings were grown in 70 grams of soil from the food-growing areas of the gardens to directly evaluate plant uptake. Two seeds were added to each cell and thinned to contain one plant per cell. Flats were fertilized to avoid nutritional limitations and were rotated regularly in the greenhouse. After 30 days, lettuce was harvested. Each plant was gently rinsed with water in a sieve under the tap to wash away soil particles, then rinsed in soapy water, then washed again with tap water, and finally washed with deionized water. Roots were separated from the leaves and stems, and plants were then oven-dried and ground. Plants were analyzed for lead content at Brookside Laboratories, Inc., using inductively coupled plasma analysis after acid digest with the EPA method 3050B (U.S. EPA, 1996). To meet weight requirements for analysis, the roots or shoots (leaves plus stems) were pooled for some gardens.
Study of Educational Materials Topics for the educational materials were chosen based on gaps in existing online resources and focused on organic amendments, testing garden soil, soil lead and fertility recommendations, ways to limit lead exposure, and research about avoidance tactics. Confusing or inaccurate information on existing websites was specifically addressed to provide clarification. Credible sources (peer-reviewed research, EPA publications, and Extension fact sheets) offering information on urban soil and lead ingestion were incorporated
into the training materials. The materials were converted to a PowerPoint presentation for the live trainings and to a website for the online trainings (ASAP, 2009). We prepared four short videos, each less than three minutes long, for the online training. The video topics were (1) how to sample soil for lead, (2) how to interpret soil test results, (3) tips for limiting exposure to lead, and (4) organic amendments. Other content for both the online the live trainings included information about our research—how and why it was conducted—in the context of the topics previously listed. We illustrated points with pictures, such as different kinds of organic amendments, and graphs, such as a chart showing how as pH increases (becomes more basic), the solubility of lead of decreases.
Pre- and postprogram questionnaires were developed in compliance with the Institutional Review Board at the University of Illinois at Urbana Champaign to evaluate knowledge gains through responses to quiz questions, and evaluate whether participants perceived knowledge gain from the trainings. Identical quiz questions on the pre- and postprogram questionnaires asked about historical sources of lead exposure in the garden, methods to limit lead exposure, and soil lead level guidelines. Participants were also asked to rank their level of knowledge about soil quality, soil contamination, and soil testing before and after the trainings.
Master Gardeners were invited through email to attend an urban soils workshop at the Garfield Park Conservatory. After filling out a preprogram questionnaire, a live presentation was given about urban soil issues including the content described above. After the program, participants filled out a postprogram questionnaire. Master Gardener volunteers who indicated interest in the program but could not attend were invited to use the online training module. Additional participants for the online training were recruited through email by Master Gardener coordinators in Chicago and collar counties.1 Gardeners in Chicago collar
1 The Illinois collar counties are Dupage, Kane, Lake, McHenry, and Will. Chicago is in Cook County.
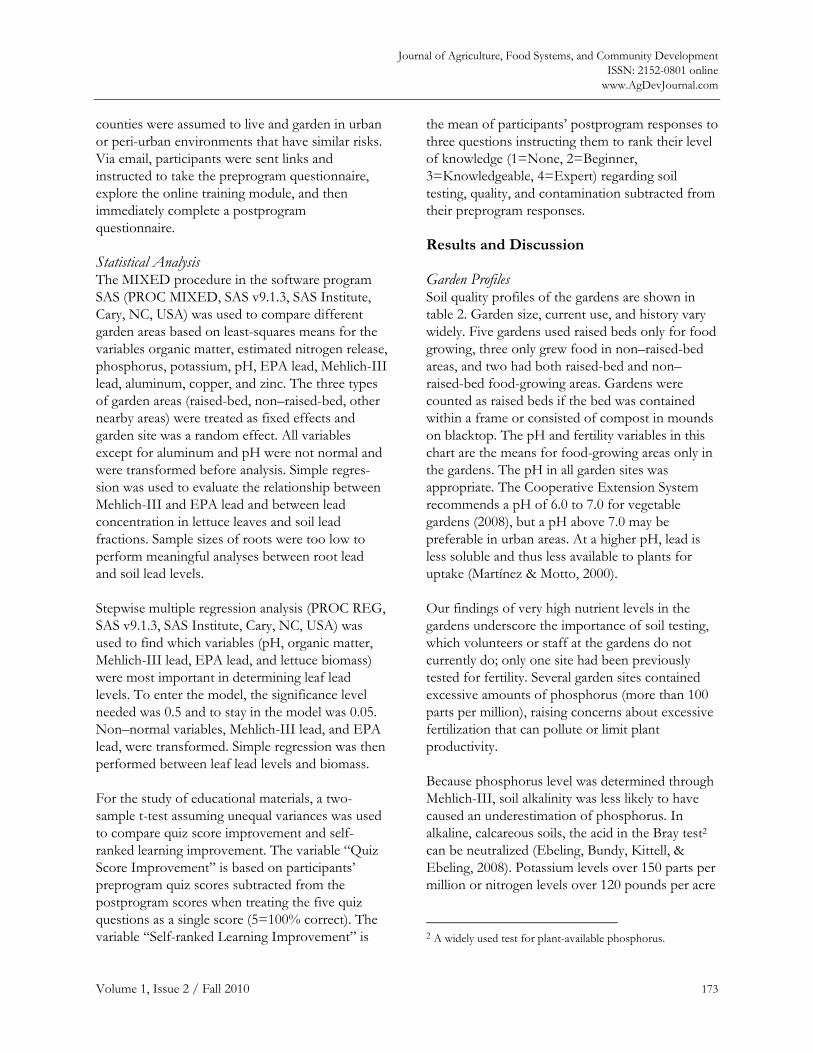
Journal of Agriculture, Food Systems, and Community Development ISSN: 2152-0801 online
www.AgDevJournal.com
Volume 1, Issue 2 / Fall 2010 173
counties were assumed to live and garden in urban or peri-urban environments that have similar risks. Via email, participants were sent links and instructed to take the preprogram questionnaire, explore the online training module, and then immediately complete a postprogram questionnaire.
Statistical Analysis The MIXED procedure in the software program SAS (PROC MIXED, SAS v9.1.3, SAS Institute, Cary, NC, USA) was used to compare different garden areas based on least-squares means for the variables organic matter, estimated nitrogen release, phosphorus, potassium, pH, EPA lead, Mehlich-III lead, aluminum, copper, and zinc. The three types of garden areas (raised-bed, non–raised-bed, other nearby areas) were treated as fixed effects and garden site was a random effect. All variables except for aluminum and pH were not normal and were transformed before analysis. Simple regres-sion was used to evaluate the relationship between Mehlich-III and EPA lead and between lead concentration in lettuce leaves and soil lead fractions. Sample sizes of roots were too low to perform meaningful analyses between root lead and soil lead levels.
Stepwise multiple regression analysis (PROC REG, SAS v9.1.3, SAS Institute, Cary, NC, USA) was used to find which variables (pH, organic matter, Mehlich-III lead, EPA lead, and lettuce biomass) were most important in determining leaf lead levels. To enter the model, the significance level needed was 0.5 and to stay in the model was 0.05. Non–normal variables, Mehlich-III lead, and EPA lead, were transformed. Simple regression was then performed between leaf lead levels and biomass.
For the study of educational materials, a two-sample t-test assuming unequal variances was used to compare quiz score improvement and self-ranked learning improvement. The variable “Quiz Score Improvement” is based on participants’ preprogram quiz scores subtracted from the postprogram scores when treating the five quiz questions as a single score (5=100% correct). The variable “Self-ranked Learning Improvement” is
the mean of participants’ postprogram responses to three questions instructing them to rank their level of knowledge (1=None, 2=Beginner, 3=Knowledgeable, 4=Expert) regarding soil testing, quality, and contamination subtracted from their preprogram responses.
Results and Discussion
Garden Profiles Soil quality profiles of the gardens are shown in table 2. Garden size, current use, and history vary widely. Five gardens used raised beds only for food growing, three only grew food in non–raised-bed areas, and two had both raised-bed and non–raised-bed food-growing areas. Gardens were counted as raised beds if the bed was contained within a frame or consisted of compost in mounds on blacktop. The pH and fertility variables in this chart are the means for food-growing areas only in the gardens. The pH in all garden sites was appropriate. The Cooperative Extension System recommends a pH of 6.0 to 7.0 for vegetable gardens (2008), but a pH above 7.0 may be preferable in urban areas. At a higher pH, lead is less soluble and thus less available to plants for uptake (Martínez & Motto, 2000).
Our findings of very high nutrient levels in the gardens underscore the importance of soil testing, which volunteers or staff at the gardens do not currently do; only one site had been previously tested for fertility. Several garden sites contained excessive amounts of phosphorus (more than 100 parts per million), raising concerns about excessive fertilization that can pollute or limit plant productivity.
Because phosphorus level was determined through Mehlich-III, soil alkalinity was less likely to have caused an underestimation of phosphorus. In alkaline, calcareous soils, the acid in the Bray test2 can be neutralized (Ebeling, Bundy, Kittell, & Ebeling, 2008). Potassium levels over 150 parts per million or nitrogen levels over 120 pounds per acre
2 A widely used test for plant-available phosphorus.
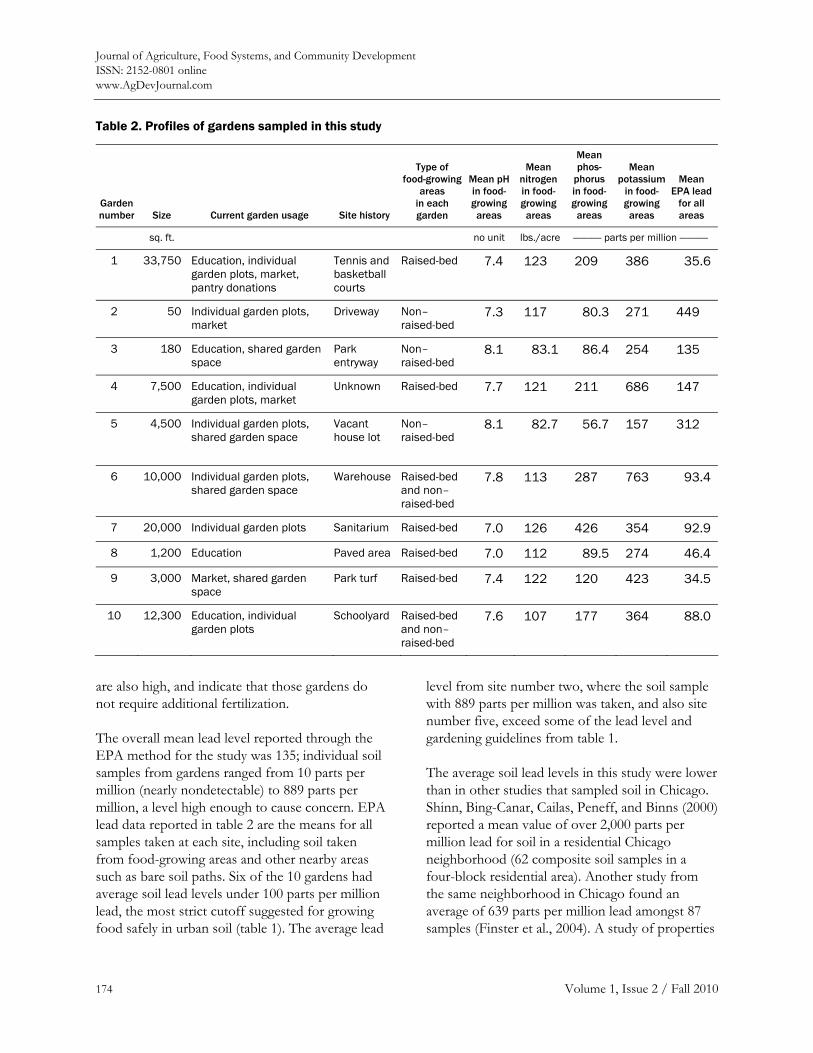
Journal of Agriculture, Food Systems, and Community Development ISSN: 2152-0801 online www.AgDevJournal.com
174 Volume 1, Issue 2 / Fall 2010
are also high, and indicate that those gardens do not require additional fertilization.
The overall mean lead level reported through the EPA method for the study was 135; individual soil samples from gardens ranged from 10 parts per million (nearly nondetectable) to 889 parts per million, a level high enough to cause concern. EPA lead data reported in table 2 are the means for all samples taken at each site, including soil taken from food-growing areas and other nearby areas such as bare soil paths. Six of the 10 gardens had average soil lead levels under 100 parts per million lead, the most strict cutoff suggested for growing food safely in urban soil (table 1). The average lead
level from site number two, where the soil sample with 889 parts per million was taken, and also site number five, exceed some of the lead level and gardening guidelines from table 1.
The average soil lead levels in this study were lower than in other studies that sampled soil in Chicago. Shinn, Bing-Canar, Cailas, Peneff, and Binns (2000) reported a mean value of over 2,000 parts per million lead for soil in a residential Chicago neighborhood (62 composite soil samples in a four-block residential area). Another study from the same neighborhood in Chicago found an average of 639 parts per million lead amongst 87 samples (Finster et al., 2004). A study of properties
Table 2. Profiles of gardens sampled in this study
Garden number Size Current garden usage Site history
Type of food-growing
areas in each garden
Mean pH in food-growing areas
Mean nitrogen in food-growing areas
Mean phos-
phorus in food-growing areas
Mean potassium
in food-growing areas
Mean EPA lead
for all areas
sq. ft. no unit lbs./acre ———— parts per million ————
1 33,750 Education, individual garden plots, market, pantry donations
Tennis and basketball courts
Raised-bed 7.4 123 209 386 35.6
2 50 Individual garden plots, market
Driveway Non–raised-bed
7.3 117 80.3 271 449
3 180 Education, shared garden space
Park entryway
Non–raised-bed
8.1 83.1 86.4 254 135
4 7,500 Education, individual garden plots, market
Unknown Raised-bed 7.7 121 211 686 147
5 4,500 Individual garden plots, shared garden space
Vacant house lot
Non–raised-bed
8.1 82.7 56.7 157 312
6 10,000 Individual garden plots, shared garden space
Warehouse Raised-bed and non–raised-bed
7.8 113 287 763 93.4
7 20,000 Individual garden plots Sanitarium Raised-bed 7.0 126 426 354 92.9
8 1,200 Education Paved area Raised-bed 7.0 112 89.5 274 46.4
9 3,000 Market, shared garden space
Park turf Raised-bed 7.4 122 120 423 34.5
10 12,300 Education, individual garden plots
Schoolyard Raised-bed and non–raised-bed
7.6 107 177 364 88.0
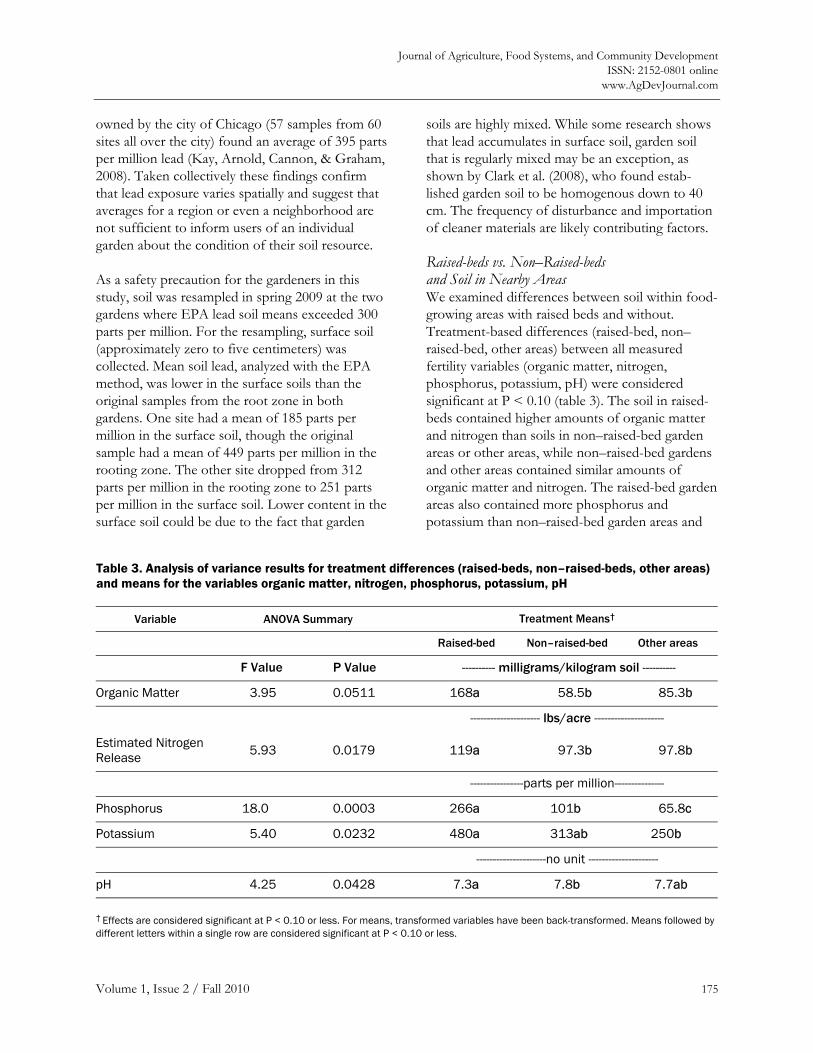
Journal of Agriculture, Food Systems, and Community Development ISSN: 2152-0801 online
www.AgDevJournal.com
Volume 1, Issue 2 / Fall 2010 175
owned by the city of Chicago (57 samples from 60 sites all over the city) found an average of 395 parts per million lead (Kay, Arnold, Cannon, & Graham, 2008). Taken collectively these findings confirm that lead exposure varies spatially and suggest that averages for a region or even a neighborhood are not sufficient to inform users of an individual garden about the condition of their soil resource.
As a safety precaution for the gardeners in this study, soil was resampled in spring 2009 at the two gardens where EPA lead soil means exceeded 300 parts per million. For the resampling, surface soil (approximately zero to five centimeters) was collected. Mean soil lead, analyzed with the EPA method, was lower in the surface soils than the original samples from the root zone in both gardens. One site had a mean of 185 parts per million in the surface soil, though the original sample had a mean of 449 parts per million in the rooting zone. The other site dropped from 312 parts per million in the rooting zone to 251 parts per million in the surface soil. Lower content in the surface soil could be due to the fact that garden
soils are highly mixed. While some research shows that lead accumulates in surface soil, garden soil that is regularly mixed may be an exception, as shown by Clark et al. (2008), who found estab-lished garden soil to be homogenous down to 40 cm. The frequency of disturbance and importation of cleaner materials are likely contributing factors.
Raised-beds vs. Non–Raised-beds and Soil in Nearby Areas We examined differences between soil within food-growing areas with raised beds and without. Treatment-based differences (raised-bed, non–raised-bed, other areas) between all measured fertility variables (organic matter, nitrogen, phosphorus, potassium, pH) were considered significant at P < 0.10 (table 3). The soil in raised- beds contained higher amounts of organic matter and nitrogen than soils in non–raised-bed garden areas or other areas, while non–raised-bed gardens and other areas contained similar amounts of organic matter and nitrogen. The raised-bed garden areas also contained more phosphorus and potassium than non–raised-bed garden areas and
Table 3. Analysis of variance results for treatment differences (raised-beds, non–raised-beds, other areas) and means for the variables organic matter, nitrogen, phosphorus, potassium, pH
Variable ANOVA Summary Treatment Means†
Raised-bed Non–raised-bed Other areas
F Value P Value ---------- milligrams/kilogram soil ----------
Organic Matter 3.95 0.0511 168a 58.5b 85.3b
--------------------- lbs/acre ---------------------
Estimated Nitrogen Release 5.93 0.0179 119a 97.3b 97.8b
----------------parts per million---------------
Phosphorus 18.0 0.0003 266a 101b 65.8c
Potassium 5.40 0.0232 480a 313ab 250b
---------------------no unit ---------------------
pH 4.25 0.0428 7.3a 7.8b 7.7ab
† Effects are considered significant at P < 0.10 or less. For means, transformed variables have been back-transformed. Means followed by different letters within a single row are considered significant at P < 0.10 or less.
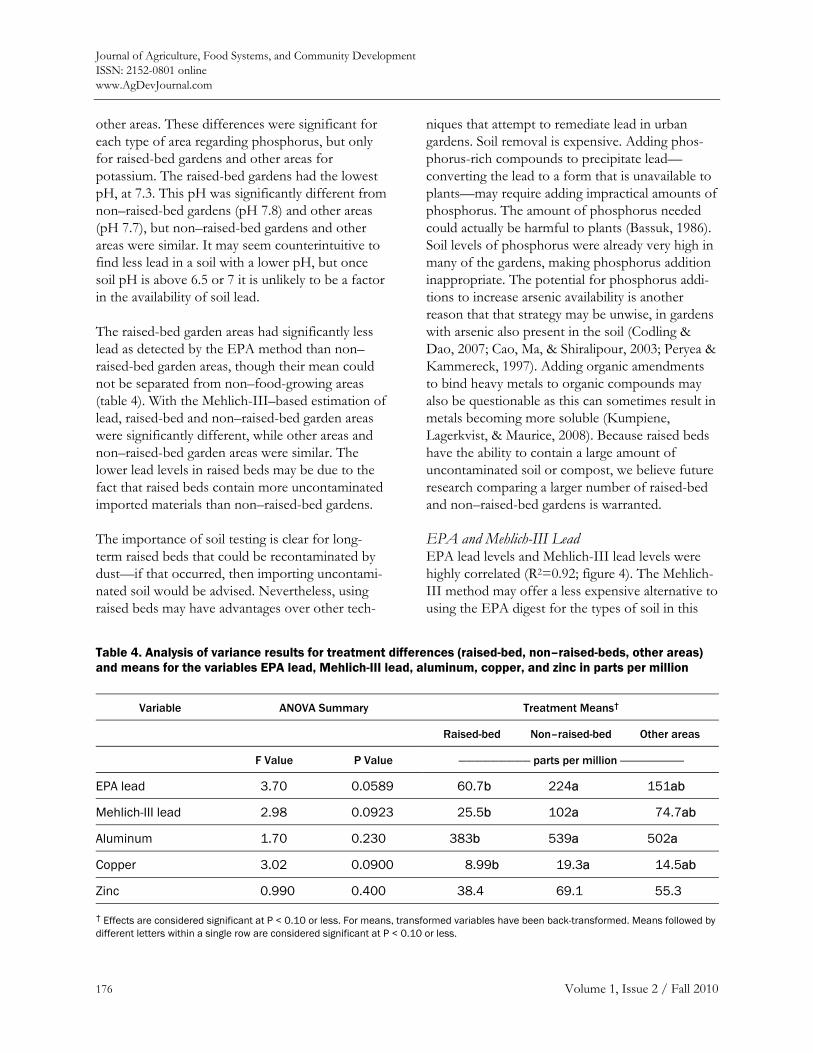
Journal of Agriculture, Food Systems, and Community Development ISSN: 2152-0801 online www.AgDevJournal.com
176 Volume 1, Issue 2 / Fall 2010
other areas. These differences were significant for each type of area regarding phosphorus, but only for raised-bed gardens and other areas for potassium. The raised-bed gardens had the lowest pH, at 7.3. This pH was significantly different from non–raised-bed gardens (pH 7.8) and other areas (pH 7.7), but non–raised-bed gardens and other areas were similar. It may seem counterintuitive to find less lead in a soil with a lower pH, but once soil pH is above 6.5 or 7 it is unlikely to be a factor in the availability of soil lead.
The raised-bed garden areas had significantly less lead as detected by the EPA method than non–raised-bed garden areas, though their mean could not be separated from non–food-growing areas (table 4). With the Mehlich-III–based estimation of lead, raised-bed and non–raised-bed garden areas were significantly different, while other areas and non–raised-bed garden areas were similar. The lower lead levels in raised beds may be due to the fact that raised beds contain more uncontaminated imported materials than non–raised-bed gardens.
The importance of soil testing is clear for long-term raised beds that could be recontaminated by dust—if that occurred, then importing uncontami-nated soil would be advised. Nevertheless, using raised beds may have advantages over other tech-
niques that attempt to remediate lead in urban gardens. Soil removal is expensive. Adding phos-phorus-rich compounds to precipitate lead—converting the lead to a form that is unavailable to plants—may require adding impractical amounts of phosphorus. The amount of phosphorus needed could actually be harmful to plants (Bassuk, 1986). Soil levels of phosphorus were already very high in many of the gardens, making phosphorus addition inappropriate. The potential for phosphorus addi-tions to increase arsenic availability is another reason that that strategy may be unwise, in gardens with arsenic also present in the soil (Codling & Dao, 2007; Cao, Ma, & Shiralipour, 2003; Peryea & Kammereck, 1997). Adding organic amendments to bind heavy metals to organic compounds may also be questionable as this can sometimes result in metals becoming more soluble (Kumpiene, Lagerkvist, & Maurice, 2008). Because raised beds have the ability to contain a large amount of uncontaminated soil or compost, we believe future research comparing a larger number of raised-bed and non–raised-bed gardens is warranted.
EPA and Mehlich-III Lead EPA lead levels and Mehlich-III lead levels were highly correlated (R2=0.92; figure 4). The Mehlich-III method may offer a less expensive alternative to using the EPA digest for the types of soil in this
Table 4. Analysis of variance results for treatment differences (raised-bed, non–raised-beds, other areas) and means for the variables EPA lead, Mehlich-III lead, aluminum, copper, and zinc in parts per million
Variable ANOVA Summary Treatment Means†
Raised-bed Non–raised-bed Other areas
F Value P Value ————————— parts per million ————————
EPA lead 3.70 0.0589 60.7b 224a 151ab
Mehlich-III lead 2.98 0.0923 25.5b 102a 74.7ab
Aluminum 1.70 0.230 383b 539a 502a
Copper 3.02 0.0900 8.99b 19.3a 14.5ab
Zinc 0.990 0.400 38.4 69.1 55.3
† Effects are considered significant at P < 0.10 or less. For means, transformed variables have been back-transformed. Means followed by different letters within a single row are considered significant at P < 0.10 or less.
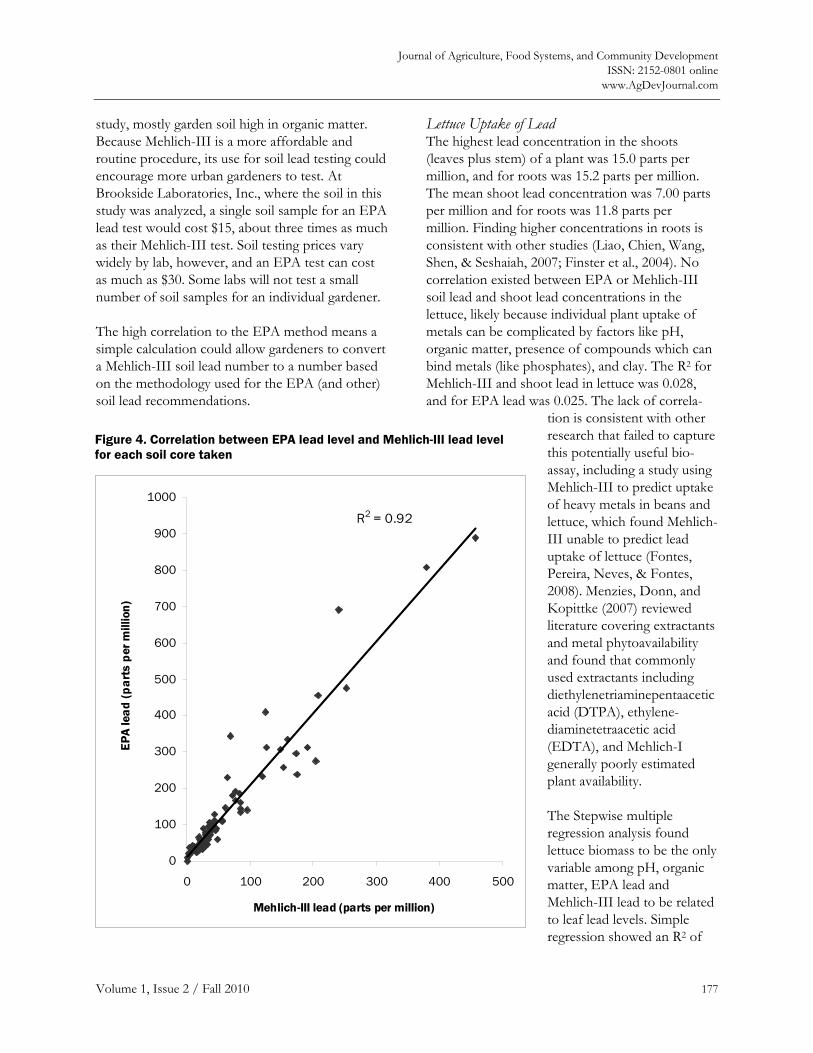
Journal of Agriculture, Food Systems, and Community Development ISSN: 2152-0801 online
www.AgDevJournal.com
Volume 1, Issue 2 / Fall 2010 177
study, mostly garden soil high in organic matter. Because Mehlich-III is a more affordable and routine procedure, its use for soil lead testing could encourage more urban gardeners to test. At Brookside Laboratories, Inc., where the soil in this study was analyzed, a single soil sample for an EPA lead test would cost $15, about three times as much as their Mehlich-III test. Soil testing prices vary widely by lab, however, and an EPA test can cost as much as $30. Some labs will not test a small number of soil samples for an individual gardener.
The high correlation to the EPA method means a simple calculation could allow gardeners to convert a Mehlich-III soil lead number to a number based on the methodology used for the EPA (and other) soil lead recommendations.
Lettuce Uptake of Lead The highest lead concentration in the shoots (leaves plus stem) of a plant was 15.0 parts per million, and for roots was 15.2 parts per million. The mean shoot lead concentration was 7.00 parts per million and for roots was 11.8 parts per million. Finding higher concentrations in roots is consistent with other studies (Liao, Chien, Wang, Shen, & Seshaiah, 2007; Finster et al., 2004). No correlation existed between EPA or Mehlich-III soil lead and shoot lead concentrations in the lettuce, likely because individual plant uptake of metals can be complicated by factors like pH, organic matter, presence of compounds which can bind metals (like phosphates), and clay. The R2 for Mehlich-III and shoot lead in lettuce was 0.028, and for EPA lead was 0.025. The lack of correla-
tion is consistent with other research that failed to capture this potentially useful bio-assay, including a study using Mehlich-III to predict uptake of heavy metals in beans and lettuce, which found Mehlich-III unable to predict lead uptake of lettuce (Fontes, Pereira, Neves, & Fontes, 2008). Menzies, Donn, and Kopittke (2007) reviewed literature covering extractants and metal phytoavailability and found that commonly used extractants including diethylenetriaminepentaacetic acid (DTPA), ethylene-diaminetetraacetic acid (EDTA), and Mehlich-I generally poorly estimated plant availability.
The Stepwise multiple regression analysis found lettuce biomass to be the only variable among pH, organic matter, EPA lead and Mehlich-III lead to be related to leaf lead levels. Simple regression showed an R2 of
Figure 4. Correlation between EPA lead level and Mehlich-III lead level for each soil core taken
R2 = 0.92
0
100
200
300
400
500
600
700
800
900
1000
0 100 200 300 400 500
Mehlich-III lead (parts per million)
EP
A le
ad
(p
art
s p
er m
illio
n)
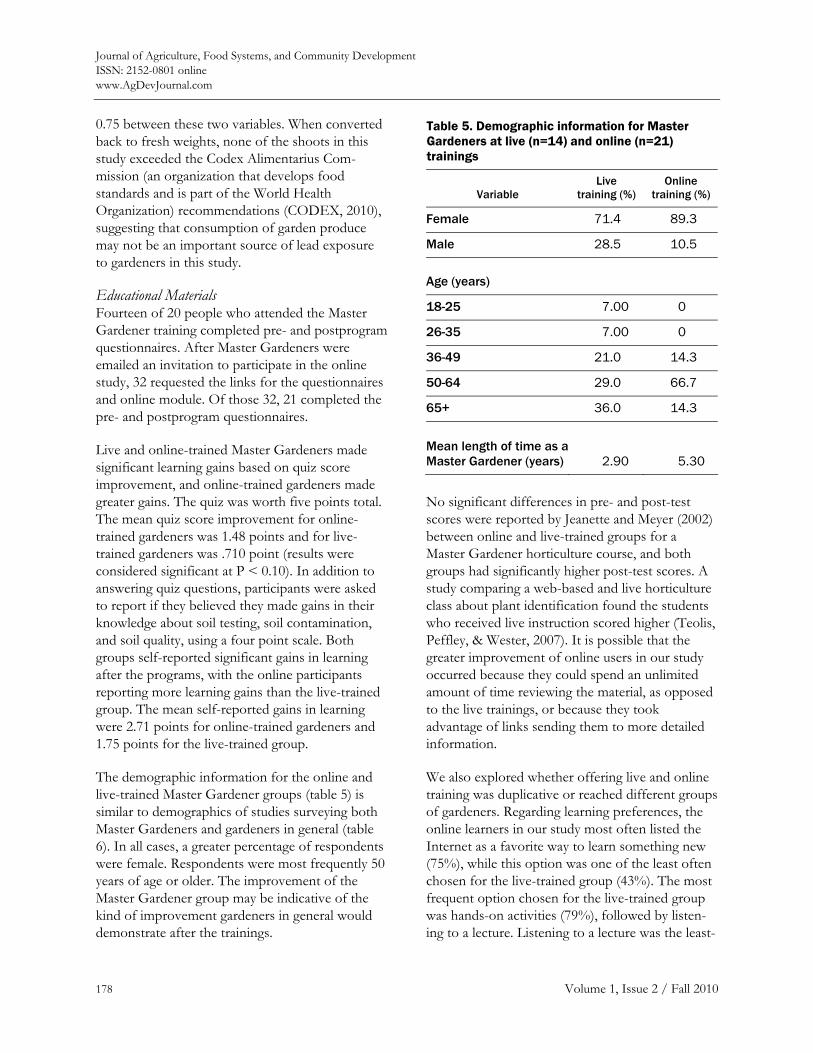
Journal of Agriculture, Food Systems, and Community Development ISSN: 2152-0801 online www.AgDevJournal.com
178 Volume 1, Issue 2 / Fall 2010
0.75 between these two variables. When converted back to fresh weights, none of the shoots in this study exceeded the Codex Alimentarius Com-mission (an organization that develops food standards and is part of the World Health Organization) recommendations (CODEX, 2010), suggesting that consumption of garden produce may not be an important source of lead exposure to gardeners in this study.
Educational Materials Fourteen of 20 people who attended the Master Gardener training completed pre- and postprogram questionnaires. After Master Gardeners were emailed an invitation to participate in the online study, 32 requested the links for the questionnaires and online module. Of those 32, 21 completed the pre- and postprogram questionnaires.
Live and online-trained Master Gardeners made significant learning gains based on quiz score improvement, and online-trained gardeners made greater gains. The quiz was worth five points total. The mean quiz score improvement for online-trained gardeners was 1.48 points and for live-trained gardeners was .710 point (results were considered significant at P < 0.10). In addition to answering quiz questions, participants were asked to report if they believed they made gains in their knowledge about soil testing, soil contamination, and soil quality, using a four point scale. Both groups self-reported significant gains in learning after the programs, with the online participants reporting more learning gains than the live-trained group. The mean self-reported gains in learning were 2.71 points for online-trained gardeners and 1.75 points for the live-trained group.
The demographic information for the online and live-trained Master Gardener groups (table 5) is similar to demographics of studies surveying both Master Gardeners and gardeners in general (table 6). In all cases, a greater percentage of respondents were female. Respondents were most frequently 50 years of age or older. The improvement of the Master Gardener group may be indicative of the kind of improvement gardeners in general would demonstrate after the trainings.
No significant differences in pre- and post-test scores were reported by Jeanette and Meyer (2002) between online and live-trained groups for a Master Gardener horticulture course, and both groups had significantly higher post-test scores. A study comparing a web-based and live horticulture class about plant identification found the students who received live instruction scored higher (Teolis, Peffley, & Wester, 2007). It is possible that the greater improvement of online users in our study occurred because they could spend an unlimited amount of time reviewing the material, as opposed to the live trainings, or because they took advantage of links sending them to more detailed information.
We also explored whether offering live and online training was duplicative or reached different groups of gardeners. Regarding learning preferences, the online learners in our study most often listed the Internet as a favorite way to learn something new (75%), while this option was one of the least often chosen for the live-trained group (43%). The most frequent option chosen for the live-trained group was hands-on activities (79%), followed by listen-ing to a lecture. Listening to a lecture was the least-
Table 5. Demographic information for Master Gardeners at live (n=14) and online (n=21) trainings
Variable Live
training (%) Online
training (%)
Female 71.4 89.3
Male 28.5 10.5
Age (years)
18-25 7.00 0
26-35 7.00 0
36-49 21.0 14.3
50-64 29.0 66.7
65+ 36.0 14.3
Mean length of time as a Master Gardener (years) 2.90 5.30
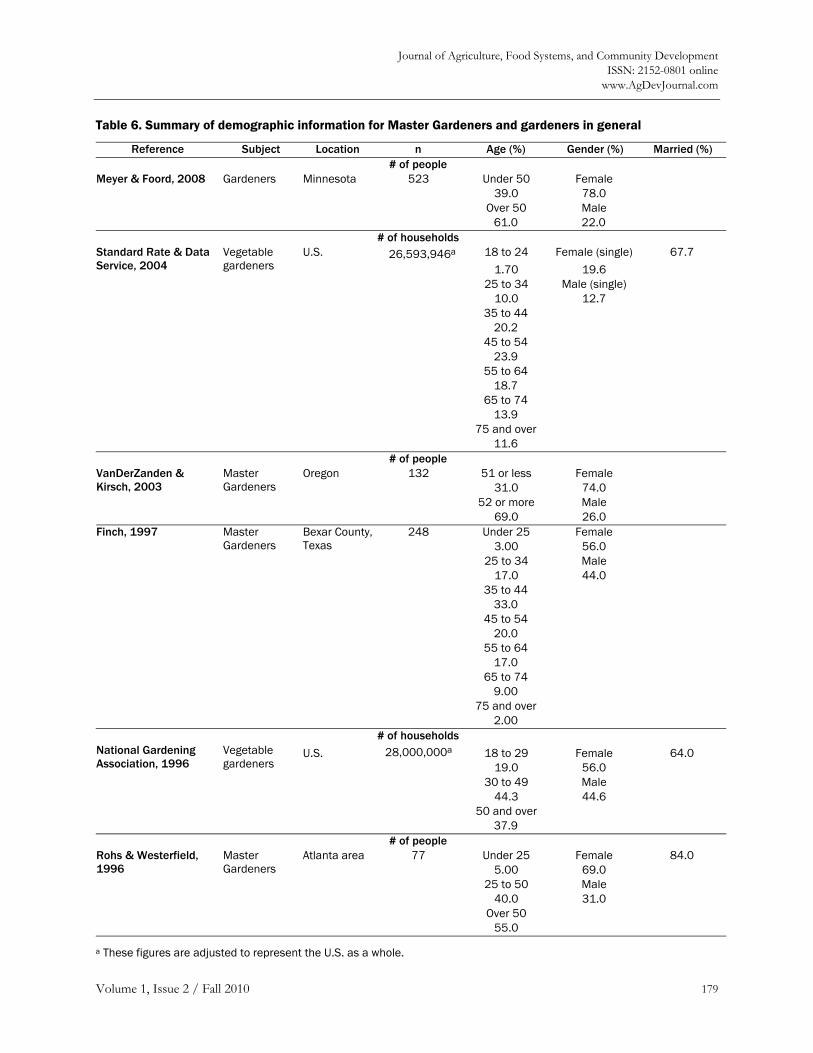
Journal of Agriculture, Food Systems, and Community Development ISSN: 2152-0801 online
www.AgDevJournal.com
Volume 1, Issue 2 / Fall 2010 179
Table 6. Summary of demographic information for Master Gardeners and gardeners in general
Reference Subject Location n Age (%) Gender (%) Married (%) # of people
Gardeners Minnesota 523 Under 50 Female 39.0 78.0
Meyer & Foord, 2008
Over 50 Male 61.0 22.0 # of households
U.S. 26,593,946a 18 to 24 Female (single) 67.7 1.70 19.6
Vegetable gardeners
25 to 34 Male (single)
Standard Rate & Data Service, 2004
10.0 12.7 35 to 44 20.2 45 to 54 23.9 55 to 64 18.7 65 to 74 13.9 75 and over 11.6 # of people
Oregon 132 51 or less Female 31.0 74.0
Master Gardeners
52 or more Male
VanDerZanden & Kirsch, 2003
69.0 26.0 Finch, 1997 248 Under 25 Female
3.00 56.0
Master Gardeners
25 to 34 Male
Bexar County, Texas
17.0 44.0 35 to 44 33.0 45 to 54 20.0 55 to 64 17.0 65 to 74 9.00 75 and over 2.00
# of households U.S. 28,000,000a 18 to 29 Female 64.0 19.0 56.0
Vegetable gardeners
30 to 49 Male 44.3 44.6
National Gardening Association, 1996
50 and over 37.9 # of people
77 Under 25 Female 84.0 Atlanta area 5.00 69.0
Master Gardeners
25 to 50 Male
Rohs & Westerfield, 1996
40.0 31.0 Over 50 55.0
a These figures are adjusted to represent the U.S. as a whole.
Journal of Agriculture, Food Systems, and Community Development ISSN: 2152-0801 online www.AgDevJournal.com
180 Volume 1, Issue 2 / Fall 2010
often option chosen by the online group (35%). This suggests the importance of offering materials in both live and online formats to accommodate two distinct sets of preferences. It also suggests that participants may have been predisposed to certain types of learning. Additionally, these preferences are likely due to learning style and not because of lack of Internet access. No one from either group said they never use the Internet, and more than 90% of both the online and live-trained groups said they most often use the Internet at home, as opposed to work, the library, or other. High percentages of respondents (80% of the online group and 79% of the live group) said a new website about urban soil quality would be useful to them. Respondents in the Meyer and Foord (2008) study about how consumers access gardening information reported that they learned gardening information the best from friends or others (75%), and only 28% identified the Internet as the best learning tool. Expression of a stronger preference for online learning by the live-trained group in our study, as compared to Meyer and Foord, could be because they were asked their favorite way to learn something new as a general statement, not specifically about gardening.
All the online respondents were able to access the video clips. VanDerZanden and Hilgert (2002) found that Master Gardeners surveyed after using an online training module could not access videos, decreasing user satisfaction. Participants in our study may have had easier access to videos because the videos were hosted on a video-sharing website with minimum computer requirements to view the videos (computers needed Adobe Flash Player and to have JavaScript enabled). Advances in free, user-friendly technology may play an important part in enhancing accessibility to online materials. Finally, users left various additional comments, most notably, three objected to the word lead being written as “Pb,”" underscoring the need to communicate with plain language.
Conclusion Urban gardeners need to know their soil, and to do this they need more access to information about soil testing. In this study, soil in raised-bed garden
areas contained less lead and more nutrients than soil in garden areas not using raised beds and soil in nearby areas. The lack of soil testing among the 10 gardens in this study is likely a contributing factor to the overfertilization of the gardens. The overall mean total lead level reported through the EPA method for the study was 135 parts per mil-lion. Six of the 10 gardens had mean soil lead levels under 100 parts per million lead, the most stringent cutoff suggested for growing food in urban soil (table 1). The average soil lead levels in this study were lower than in other studies sampling in Chicago. The majority of soil lead levels in this study do not cause concern. For gardens contain-ing low amounts of lead, soil testing could reassure gardeners overwhelmed by the various techniques to avoid or reduce soil lead exposure (table 7), some of which are expensive or time-consuming. We believe that future study involving a greater number of gardens should investigate further the potential of raised beds to mitigate lead levels and the possibility of recontamination from exposed soil in nearby garden areas.
A standard interpretation for lead levels in garden soil that accounts for lead ingested through pro-duce is needed, along with potential for recontami-nation from nearby soil, soil pH, and other factors. A standard approach to sampling garden soils is also needed. We encourage sampling from the root zone in food-growing areas (and surface sampling in other key areas) to allow gardeners to use some samples for the dual purposes of environmental and nutrient analysis while still minding the pos-sible threat of lead accumulation on surface soil.
Total lead levels and Mehlich-III lead levels were highly correlated. We believe future study investigating the relationship between reported EPA and Mehlich-III lead levels could lead to the development of a soil lead assay that most soil-testing laboratories could do inexpensively and easily for gardeners with small numbers of samples.
Live and online-trained Master Gardeners made significant learning gains based on quiz score improvement, and online-trained gardeners made greater gains. The mean quiz score improvement
Journal of Agriculture, Food Systems, and Community Development ISSN: 2152-0801 online
www.AgDevJournal.com
Volume 1, Issue 2 / Fall 2010 181
for online-trained gardeners was 1.48 points and for live-trained gardeners was .710 point. Both groups self-reported significant gains in learning after the programs, with the online participants self-reporting more learning gains than the live-trained group. The mean self-reported gains in learning were 2.71 points for the online-trained group and 1.75 points for the live-trained group. It is possible that the greater improvement of online users in our study occurred because they could spend an unlimited amount of time reviewing the material, as opposed to the live trainings, or because they took advantage of links sending them to more detailed information.
The development of protocols for sampling in urban gardens, ways to interpret those results, and
better tools for understanding this information would benefit urban gardeners greatly. We suggest further development of online resources about urban soil quality to deliver content to urban gardeners.
Acknowledgements The authors wish to thank Dr. Susanne Aref, Dr. Carmen Ugarte, Dr. Robert Darmody, Dr. Wesley Jarrell, Dr. Terry Niblack, Patricia Lazicki, Angie Hernandez, Jordan Dunn, John E. Marlin, Saujanya Gumidyala, and all the gardeners who participated in our study. This work was funded by grants from the North Central Region Sustainable Agriculture Research and Education program, the Community Informatics Initiative, and the Ball Fellowship in Horticulture.
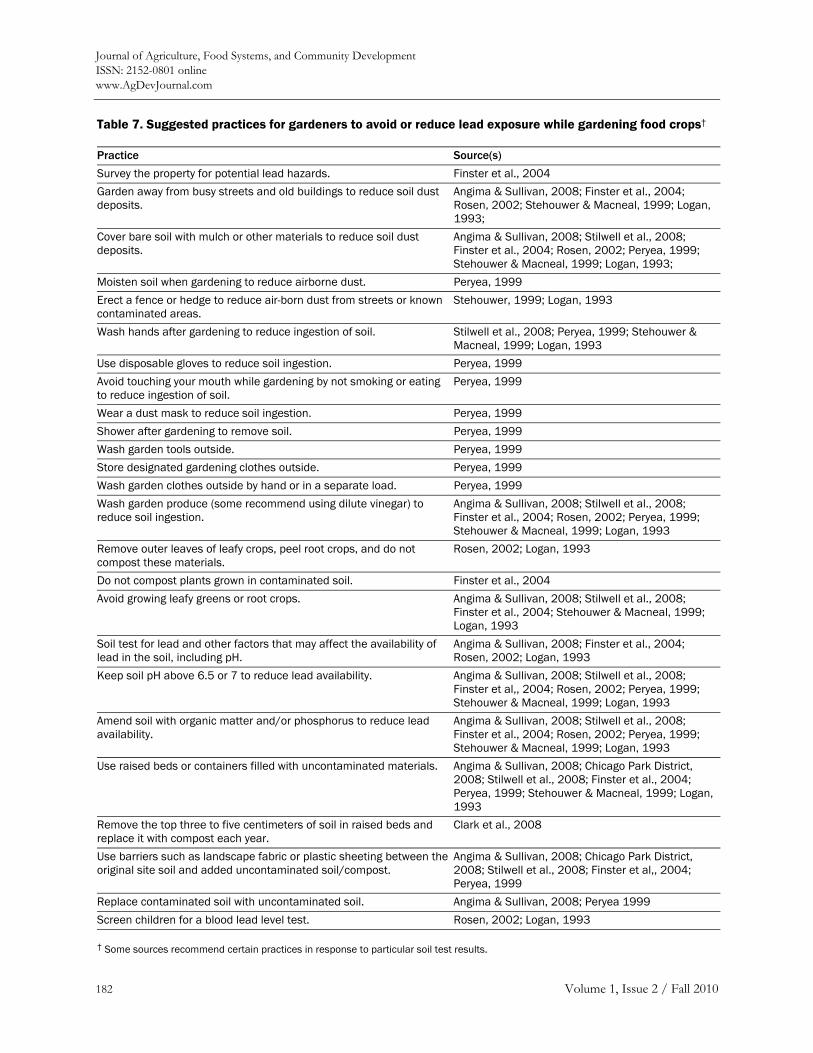
Journal of Agriculture, Food Systems, and Community Development ISSN: 2152-0801 online www.AgDevJournal.com
182 Volume 1, Issue 2 / Fall 2010
Table 7. Suggested practices for gardeners to avoid or reduce lead exposure while gardening food crops†
Practice Source(s) Survey the property for potential lead hazards. Finster et al., 2004 Garden away from busy streets and old buildings to reduce soil dust deposits.
Angima & Sullivan, 2008; Finster et al., 2004; Rosen, 2002; Stehouwer & Macneal, 1999; Logan, 1993;
Cover bare soil with mulch or other materials to reduce soil dust deposits.
Angima & Sullivan, 2008; Stilwell et al., 2008; Finster et al., 2004; Rosen, 2002; Peryea, 1999; Stehouwer & Macneal, 1999; Logan, 1993;
Moisten soil when gardening to reduce airborne dust. Peryea, 1999 Erect a fence or hedge to reduce air-born dust from streets or known contaminated areas.
Stehouwer, 1999; Logan, 1993
Wash hands after gardening to reduce ingestion of soil. Stilwell et al., 2008; Peryea, 1999; Stehouwer & Macneal, 1999; Logan, 1993
Use disposable gloves to reduce soil ingestion. Peryea, 1999 Avoid touching your mouth while gardening by not smoking or eating to reduce ingestion of soil.
Peryea, 1999
Wear a dust mask to reduce soil ingestion. Peryea, 1999 Shower after gardening to remove soil. Peryea, 1999 Wash garden tools outside. Peryea, 1999 Store designated gardening clothes outside. Peryea, 1999 Wash garden clothes outside by hand or in a separate load. Peryea, 1999 Wash garden produce (some recommend using dilute vinegar) to reduce soil ingestion.
Angima & Sullivan, 2008; Stilwell et al., 2008; Finster et al., 2004; Rosen, 2002; Peryea, 1999; Stehouwer & Macneal, 1999; Logan, 1993
Remove outer leaves of leafy crops, peel root crops, and do not compost these materials.
Rosen, 2002; Logan, 1993
Do not compost plants grown in contaminated soil. Finster et al., 2004 Avoid growing leafy greens or root crops. Angima & Sullivan, 2008; Stilwell et al., 2008;
Finster et al., 2004; Stehouwer & Macneal, 1999; Logan, 1993
Soil test for lead and other factors that may affect the availability of lead in the soil, including pH.
Angima & Sullivan, 2008; Finster et al., 2004; Rosen, 2002; Logan, 1993
Keep soil pH above 6.5 or 7 to reduce lead availability. Angima & Sullivan, 2008; Stilwell et al., 2008; Finster et al,, 2004; Rosen, 2002; Peryea, 1999; Stehouwer & Macneal, 1999; Logan, 1993
Amend soil with organic matter and/or phosphorus to reduce lead availability.
Angima & Sullivan, 2008; Stilwell et al., 2008; Finster et al., 2004; Rosen, 2002; Peryea, 1999; Stehouwer & Macneal, 1999; Logan, 1993
Use raised beds or containers filled with uncontaminated materials. Angima & Sullivan, 2008; Chicago Park District, 2008; Stilwell et al., 2008; Finster et al., 2004; Peryea, 1999; Stehouwer & Macneal, 1999; Logan, 1993
Remove the top three to five centimeters of soil in raised beds and replace it with compost each year.
Clark et al., 2008
Use barriers such as landscape fabric or plastic sheeting between the original site soil and added uncontaminated soil/compost.
Angima & Sullivan, 2008; Chicago Park District, 2008; Stilwell et al., 2008; Finster et al,, 2004; Peryea, 1999
Replace contaminated soil with uncontaminated soil. Angima & Sullivan, 2008; Peryea 1999 Screen children for a blood lead level test. Rosen, 2002; Logan, 1993
† Some sources recommend certain practices in response to particular soil test results.
Journal of Agriculture, Food Systems, and Community Development ISSN: 2152-0801 online
www.AgDevJournal.com
Volume 1, Issue 2 / Fall 2010 183
References Agius, R. M., & Bagnall, G. (1998). Development and
evaluation of the use of the Internet as an educational tool in occupational and environmental health and medicine. Occupational Medicine-Oxford 48: 337–343. doi:10.1093/occmed/48.5.337
Agroecology and Sustainable Agriculture Program. (2009). Urban Soil Quality Training Module. Available at http://asap.sustainability.uiuc.edu/ groups/Urbansoil/usqipublicdocs/usqitraining
Angima, S. D., & Sullivan, D. M. (2008). Evaluating and reducing lead hazard in gardens and landscapes, EC 1616-E. Oregon State University Extension Service. Available at http://extension.oregonstate.edu/ catalog/pdf/ec/ec1616-e.pdf
Bassuk, N. L. (1986). Reducing lead uptake in lettuce. HortScience 21: 993–995.
Binns, H. J., Gray, K. A., Chen, T., Finster, M. E., Peneff, N., Schaefer, P., Ovsey, V., Fernandes, J., Brown, M., & Dunlap, B. (2004). Evaluation of landscape coverings to reduce soil lead hazards in urban residential yards: The Safer Yards Project. Environmental Research 96: 127–138. doi:10.1016/j.envres.2004.02.010
Cao, X., Ma, L. Q., & Shiralipour, A. (2003). Effects of compost and phosphate amendments on arsenic mobility in soils and arsenic uptake by the hyperaccumulator, Pteris vittata L. Environmental Pollution 126: 157–167. doi:10.1016/S0269-7491(03)00208-2
Caravanos, J., Weiss, A. L., & Jaeger, R. J. (2006). An exterior and interior leaded dust deposition survey in New York City: Results of a 2-year study. Environmental Research 100: 159–164. doi:10.1016/j.envres.2005.08.005
Carlisle, J. C., & Wade, M. J. (1992). Predicting blood lead concentrations from environmental concentrations. Regulatory Toxicology and Pharmacology 16: 280–289. doi:10.1016/0273-2300(92)90008-W
Centers for Disease Control and Prevention. (2009). Childhood lead poisoning data, statistics, and surveillance. Available at http://www.cdc.gov/ nceh/lead/data/index.htm
Chicago Park District. (2008). Community gardens in the parks manual for development. Available at http://www.cpdit01.com/resources/community_ gardens/index.html
Chumley-Jones, H. S., Dobbie, A., & Alford, C. L. (2002). Web-based learning: Sound educational method or hype? A review of the evaluation
literature. Academic Medicine 77: S86–S93. doi:10.1097/00001888-200210001-00028
Clark, H. F., Brabander, D. J., & Erdil, R. M. (2006). Sources, sinks, and exposure pathways of lead in urban garden soil. Journal of Environmental Quality 35: 2066–2074. doi:10.2134/jeq2005.0464
Clark, H. F., Hausladen, D. M., & Brabander, D. J. (2008). Urban gardens: Lead exposure, recontamination mechanisms, and implications for remediation design. Environmental Research 107: 312–319. doi:10.1016/j.envres.2008.03.003
CODEX. (2010). Current Official Standards, Codex General Standard for Contaminants and Toxins in Food and Feed. STAN 193. Available at http://www.codexalimentarius.net/web/standard_list.do?lang=en
Codling, E. E., & Dao, T. H. (2007). Short-term effect of lime, phosphorus, and iron amendments on water-extractable lead and arsenic in orchard soils. Communications in Soil Science and Plant Analysis 38: 903–919. doi:10.1080/00103620701277783
Cooperative Extension System. (2008). Soil preparation for the vegetable garden. Available at http://www.extension.org/pages/Soil_Preparation_of_the_Vegetable_Garden
Ebeling, A. M., Bundy, L. G., Kittell, A. W., & Ebeling, D. D. (2008). Evaluating the Bray P1 test on alkaline, calcareous soils. Soil Science Society of America Journal. 72: 985–991. doi:10.2136/sssaj2006.0347
Finch, C. R. (1997). Profile of an active Master Gardener. HortTechnology 7: 371–376.
Finster, M. E., Gray, K. A. , & Binns, H. J. (2004). Lead levels of edibles grown in contaminated residential soils: A field survey. Science of the Total Environment. 320: 245–257. doi:10.1016/j.scitotenv.2003.08.009
Fontes, R. L. F., Pereira, J. M. N., Neves, J. C. L., & Fontes, M. P. F. (2008). Cadmium, lead, copper, zinc, and nickel in lettuce and dry beans as related to Mehlich-3 extraction in three Brazilian Latossols. Journal of Plant Nutrition 31: 884–901. doi:10.1080/01904160802043239
Gavlak, R., Horneck, D., Miller, R., & Kotuby-Amacher, J. (2003). Soil, plant and water reference methods for the western region WREP-125. 2nd ed. Western Regional Extension.
Gee, G. W., & J. W. Bauder. (1979). Particle-size analysis by hydrometer — simplified method for routine textural analysis and a sensitivity test of measurement parameters. Soil Science Society of America Journal 43: 1004–1007. doi:10.2136/sssaj1979.03615995004300050038x
Journal of Agriculture, Food Systems, and Community Development ISSN: 2152-0801 online www.AgDevJournal.com
184 Volume 1, Issue 2 / Fall 2010
GreenNet. (n.d.). Chicago’s community garden map. Available at http://www.greennetchicago.org/ map.htm
Hough, R. L., Breward, N., Young, S. D., Crout, N. M. J., Tye, A. M., Moir, A. M., & Thornton, I. (2004). Assessing potential risk of heavy metal exposure from consumption of home-produced vegetables by urban populations. Environmental Health Perspectives 112: 215–221. doi:10.1289/ehp.5589
Jeannette, K. J., & Meyer, M. H. (2002). Online learning equals traditional classroom training for Master Gardeners. HortTechnology 12: 148–156.
Kay, R. T., Arnold, T. L., Cannon, W. F., & Graham, D. (2008). Concentrations of polycyclic aromatic hydrocarbons and inorganic constituents in ambient surface soils, Chicago, Illinois: 2001-2002. Soil & Sediment Contamination 17: 221–236. doi:10.1080/15320380802006939
Kumpiene, J., Lagerkvist, A., & Maurice, C. (2008). Stabilization of As, Cr, Cu, Pb, and Zn in soil using amendments — a review. Waste Management 28: 215–225. doi:10.1016/j.wasman.2006.12.012
Laidlaw, M. A. S., & Filippelli, G.M. (2008). Resuspension of urban soils as a persistent source of lead poisoning in children: A review and new directions. Applied Geochemistry 23: 2021–2039. doi:10.1016/j.apgeochem.2008.05.009
Laidlaw, M. A. S., Mielke, H. W., Filippelli, G. M., Johnson, D. L., & Gonzales, C. R. (2005). Seasonality and children’s blood lead levels: Developing a predictive model using climatic variables and blood lead data from Indianapolis, Indiana, Syracuse, New York, and New Orleans, Louisiana (USA). Environmental Health Perspectives 113: 793–800. doi:10.1289/ehp.7759
Liao, Y. C., Chien, S. C., Wang, M., Shen, Y., & Seshaiah, K. (2007). Relationship between lead uptake by lettuce and water-soluble low-molecular-weight organic acids in rhizosphere as influenced by transpiration. Journal of Agricultural and Food Chemistry 55: 8640–8649. doi:10.1021/jf071491a
Logan, T. (1993). Lead contamination in the garden, HYG-1149-93. Ohio State University Extension. Available at http://140.254.84.215/cached.jsp? idx=0&id=120342
Mari Gallagher Research & Consulting. (2006). Examining the impact of food deserts on public health in Chicago. Available at http://marigallagher.com/projects
Marriott, E., & Wander, M. (2006). Qualitative and quantitative differences in particulate organic matter fractions in organic and conventional farming
systems. Soil Biology & Biochemistry 38: 1527–1536. doi:10.1016/j.soilbio.2005.11.009
Martínez, C. E., & Motto, H. L. (2000). Solubility of lead, zinc and copper added to mineral soils. Environmental Pollution 107: 153–158. doi:10.1016/S0269-7491(99)00111-6
Menzies, N. W., Donn, M. J., & Kopittke, P. M. (2007). Evaluation of extractants for estimation of the phytoavailable trace metals in soils. Environmental Pollution 145: 121–130. doi:10.1016/j.envpol.2006.03.021
Meyer, M. H., & Foord, K. (2008). Consumer preferences and perceptions of gardening information. HortTechnology 18: 162–167.
National Gardening Association. (1996). National Garden Survey. Burlington, VT.
Peryea, F. J. (1999). Gardening on lead- and arsenic-contaminated soils EB1884. Washington State University: Washington State University Cooperative Extension.
Peryea, F. J., & Kammereck, R. (1997). Phosphate-enhanced movement of arsenic out of lead arsenate-contaminated topsoil and through uncontaminated subsoil. Water Air and Soil Pollution 93: 243–254. doi:10.1007/BF02404759
Rohs, F. R., & Westerfield, R. R. (1996). Factors influencing volunteering in the Master Gardener Program. HortTechnology 6: 281–285.
Rosen, C. J. (2002). Lead in the home garden and urban soil environment. University of Minnesota Exten-sion. Available at http://www.extension.umn.edu/ distribution/horticulture/DG2543.html
Shinew, K. J., Glover, T. D., & Parry, D. C. (2004). Leisure spaces as potential sites for interracial interaction: Community gardens in urban areas. Journal of Leisure Research 36: 336–355.
Shinn, N. J., Bing-Canar, J., Cailas, M., Peneff, N., & Binns, H. J. (2000). Determination of spatial continuity of soil lead levels in an urban residential neighborhood. Environmental Research 82: 46–52. doi:10.1006/enrs.1999.4004
Standard Rate & Data Service. (2004). The lifestyle market analyst. A reference guide for consumer market analysis. Des Plaines, IL: SRDS—Equifax Marketing Services.
Stehouwer, R., & K. Macneal. (1999). Lead in residential soils: Sources, testing, and reducing exposure. The Pennsylvania State University. Available at http://cropsoil.psu.edu/extension/esi/lead-in-soil
Stilwell, D. E., Rathier, T. M., Musante, C. L., & Ranciato, J. F. (2008). Lead and other heavy metals in community garden soils in Connecticut. The
Journal of Agriculture, Food Systems, and Community Development ISSN: 2152-0801 online
www.AgDevJournal.com
Volume 1, Issue 2 / Fall 2010 185
Connecticut Agricultural Experiment Station, New Haven Bulletin 1019.
Teolis, I., Peffley, E. B., & Wester, D. B. (2007). Comparing student performance in live versus web-based instruction in herbaceous plant identification. HortTechnology 17: 120–124.
Tranel, M., & Handlin, Jr., L. B. (2006). Metromorphosis: Documenting change. Journal of Urban Affairs 28: 151–167. doi:10.1111/j.0735-2166.2006.00265.x
U.S. EPA. (2001). Lead; identification of dangerous levels of lead; final rule 40 CFR part 745. Available at http://www.epa.gov/fedrgstr/EPA-TOX/2001/January/Day-05/
U.S. EPA. (1996). Method 3050B Acid digestion of sediments, sludges, and soils. Available at
http://www.epa.gov/epawaste/hazard/testmethods/sw846/online/3_series.htm
VanDerZanden, A. M., & Hilgert, C. (2002). Evaluating on-line training modules in the Oregon Master Gardener program. HortTechnology 12: 297–299.
VanDerZanden, A. M., & Kirsch, E. (2003). Computer and Internet use among Oregon Master Gardeners. HortTechnology 13: 548–551.
VanDerZanden, A. M., & Rost, B. (2003). Internet video access appears difficult for Oregon Master Gardeners. HortTechnology 13: 385–387.
Waliczek, T. M., Zajicek, J. M., & Lineberger, R. D. (2005). The influence of gardening activities on consumer perceptions of life satisfaction. HortScience 40: 1360–1365.

Journal of Agriculture, Food Systems, and Community Development ISSN: 2152-0801 online www.AgDevJournal.com
186 Volume 1, Issue 2 / Fall 2010
Journal of Agriculture, Food Systems, and Community Development ISSN: 2152-0801 online www.AgDevJournal.com
Volume 1, Issue 2 / Fall 2010 187
Comparing the Structure, Size, and Performance of Local and Mainstream Food Supply Chains Robert P. King, Michael S. Hand, Gigi DiGiacomo, Kate Clancy, Miguel I. Gómez, Shermain D. Hardesty, Larry Lev, and Edward W. McLaughlin. (2010, June). (Economic Research Report Number 99). Washington, DC: United States Department of Agriculture, Economic Research Service. 81 pp. Review by Phil Mount Published online 24 November 2010 Citation: Mount, Phil. (2010). Comparing the Structure, Size, and Performance of Local and Mainstream Food Supply Chains. [Review of the report Comparing the Structure, Size, and Performance of Local and Mainstream Food Supply Chains, by R. P. King, M. S. Hand, G. DiGiacomo, K. Clancy, M. I. Gómez, S. D. Hardesty, L. Lev, and E. W. McLaughlin]. Journal of Agriculture, Food Systems, and Community Development, 1(2): 187–189. doi:10.5304/jafscd.2010.012.005 Copyright © 2010 by New Leaf Associates, Inc. Following on the attention generated by a popular local food movement, the necessity—or at least the potential—of growth in local and regional food systems has been widely identified as an important area of focus for food systems analysis and policy.1
The claims about the strengths and benefits of more localized diets and production systems—particularly those made in the promotion of the “locavore” movement—have increasingly come under attack in the mainstream and academic press (Budiansky, 2010; Desrochers & Shimizu, 2008). Much of this debate is grounded in speculative rhetoric and assumptions, as the research needed to support such claims and counterclaims does not yet exist. In North America in particular the debate has suffered from an absence of detailed, compara-
1 See Baker, Campsie, & Rabinowicz, 2010; Harvie & Steffey, 2010; Kirschenmann, Stevenson, Buttel, Lyson, & Duffy, 2008; as well as the special issue of the Cambridge Journal of Regions, Economy and Society (Issue 3, 2010) focusing on “food system (re)-regionalization.”
tive research measuring inputs, performance, and outcomes for producers and consumers, in both mainstream and local food systems.
As such, the latest report from the Economic Research Service of the USDA, entitled “Com-paring the Structure, Size, and Performance of Local and Mainstream Food Supply Chains,” is timely indeed. The authors state their role clearly: “Understanding the operation and performance of local food supply chains is an initial step toward gauging how the food system might incorporate
The full report is available for free download at http://www.ers.usda.gov/publications/err99
Phil Mount is a PhD candidate in the Geography Department of the University of Guelph whose current research looks at how local food systems address the challenges of scale and growth. His most recent paper, “Growing Local Food: Scale and Local Food Systems Governance,” is in process at Agriculture and Human Values.
Journal of Agriculture, Food Systems, and Community Development ISSN: 2152-0801 online
www.AgDevJournal.com
188 Volume 1, Issue 2 / Fall 2010
more local foods in the future to meet growing demand” (p. iv).
The report is based on 15 food supply chain case studies in five U.S. metro areas. In each area, an example from a “direct marketing,” “intermedi-ated” and “mainstream” food supply chain was studied in order to capture scale effects produced by the length or volume of product flowing through each chain. The mainstream cases involved produce sold through national or regional super-market chains, while all other cases studied local produce that was marketed either directly by the producer to the consumer, or through one or more intermediaries.
The intent of the coordinated case-study approach was to address two general research questions (p. 1):
1. What factors influence the structure and size of local food supply chains?
2. How do local food supply chains compare with mainstream supply chains for key dimensions of economic, environmental, and social performance?
The result is an analysis of case studies rich in detail and revealing a complexity of food supply chain relationships, at all three levels of scale, that will be a valuable resource for producers looking to explore and understand alternative production, distribution, or marketing arrangements. This report is intended—and is most effective—as an exploratory vehicle “to uncover new observations …but also to generate new hypotheses and questions for future study” (p. 2).
Limited resources led to a small sample size, which in turn meant that the selection of the 15 case study subjects played a significant role in the types of answers, and thus also comparisons, that the research questions would generate. As the study’s authors anticipated (p. 4), selecting a diversity of case study examples—to capture the greatest possible breadth of production and marketing
forms—produced a set of results with limited scope for comparative analysis.
This influence was most noticeable in the selection of specialty grocers or “upscale supermarkets” (e.g., Twin Cities/beef, p. 26; Sacramento/spring mix, p. 36) as “mainstream” case studies. Comparative analysis would have been better served by the selection of 5 mainstream case studies that most typified the delivery of each product in a given region, since the mainstream cases were meant “to serve as a baseline for comparison” (p. 53). One cannot help but think that the use of the specialty grocers as mainstream case studies would skew the comparisons of several key food supply chain factors being measured, including food miles or fuel efficiency, price to producers, and supply chain relationships. That is, while the specialty grocers’ case studies show the variety of options available, their inclusion almost certainly distorts the comparative analysis.
Due to limited resources, these food supply chain case studies have also treated a significant link in the chains—the consumer—as a set of assump-tions. The authors acknowledge that the lack of attention to the consumer component of these food chains limits their ability to make broader claims (p. 6). However, included in the report are research questions (p. 8) and key findings (pp. 2, 51, 63) related to consumer intent and valuation that could only be verified with consumer research. Clearly, this is one component that could consid-erably increase the value of further food supply chain research.
To its credit, this report opens the discussion on the possibilities of growth within the local food sector, and takes some tentative first steps toward a comparative analysis of food supply chain perfor-mance across scale. The strength of this report, however, is the evidence of unexpected or innova-tive food supply chain practices, including four important, interrelated findings:
1. Producers, processors, distributors, and retailers often interact in complex and
Journal of Agriculture, Food Systems, and Community Development ISSN: 2152-0801 online www.AgDevJournal.com
Volume 1, Issue 2 / Fall 2010 189
hybrid relationships, resulting in the cross-pollination of food supply chains (p. 68);
2. For producers at many scales of operation, viability demands diversification of both products and market outlets (p. 62);
3. Producers often use the profile and relationships generated through direct marketing to foster expansion into secondary markets or intermediated food chains with the potential for greater scale (p. 68); and
4. Where regional processing and delivery infrastructure allow, relatively minor increases in scale (such as producers acting together) produce efficiencies that rival or surpass mainstream chains (pp. 62, 67–68).
These findings suggest that an interesting comple-ment to further research would involve similar case studies of “food hubs.” Theoretically, these chains aggregate local produce, creating efficiencies of scale and reducing transaction costs while retaining many of the benefits of direct marketing identified in this report, including transparency, connection, and increased net revenue. Analyses of these
hybrid direct/intermediated chains would add to the diverse and complex picture of opportunities and innovation that has been presented in this foundational USDA report.
References Baker, L., Campsie, P. & Rabinowicz, K. (2010). Menu
2020: Ten good food ideas for Ontario. Metcalf Foundation.
Budiansky, S. (2010, August 19). Math lessons for locavores. [Op-ed] New York Times. Retrieved from http://www.nytimes.com/2010/08/20/opinion/20budiansky.html?ref=food_prices
Desrochers, P. and Shimizu, H. (2008, October). Yes, we have no bananas: A critique of the “food-miles” perspective. Mercatus Policy Series Policy Primer No. 8. Mercatus Center, George Mason University.
Harvie, A. and Steffey, H. (2010). Rebuilding America’s economy with family farm-centered food systems. Cambridge, MA: Farm Aid Inc.
Kirschenmann, F., Stevenson, S., Buttel, F., Lyson, T., and Duffy, M. (2008). Why worry about the agriculture of the middle? In T. A. Lyson, G. W. Stevenson, and R. Welsh (Eds.), Food and the Mid-Level Farm (pp. 3–22). Cambridge, MA: MIT Press.
Kneafsey, M. (2010). The region in food—important or irrelevant? Cambridge Journal of Regions, Economy and Society, 3: 177–190.

Journal of Agriculture, Food Systems, and Community Development ISSN: 2152-0801 online
www.AgDevJournal.com
190 Volume 1, Issue 2 / Fall 2010
Journal of Agriculture, Food Systems, and Community Development ISSN: 2152-0801 online www.AgDevJournal.com
Volume 1, Issue 2 / Fall 2010 191
Dawn Thilmany McFadden is a professor of agribusiness and an agribusiness extension economist with Colorado State University. She also serves on the Markets Advisory Board and Farmers Market Working Group and is a past Farm Foundation Fellow. Dawn’s research and extension focus on two distinct areas of inquiry: small agribusiness management and local-food entrepreneurs as a part of rural development. In her Extension role, she currently leads a local food systems initiative for CSU Extension, and co-leads the CSU teams for the Northern Colorado Regional Food Assessment and Colorado Building Farmers program.
Berry’s Bringing It to the Table: A call to honor farming and food
Book Review: Bringing It to the Table: On Farming and Food by Wendell Berry Wendell Berry (2009). Berkeley, CA: Counterpoint. ISBN 978-1-58243-543-5. 256 pp. $14.95, trade paperback.
Dawn Thilmany McFadden, Colorado State University
Citation: Thilmany McFadden, D. (2010, November). Berry’s Bringing It to the Table: A call to honor farming and food. [Review of the book Bringing It to the Table: On Farming and Food, by W. Berry]. Journal of Agriculture, Food Systems, and Community Development, 1:2, advance online publication. doi:10.5304/jafscd.2010.012.006 Published online 29 November 2010 Copyright © 2010 by New Leaf Associates, Inc.
Forty years of Wendell Berry’s essays and excerpts from his fiction are gathered in Bringing It to the Table: On Farming and Food, providing some inter-esting historical, critical and thoughtful insights into what has shaped farming and food over these past decades. As a testament to the breadth of ideas that Berry expresses on American agriculture and food, you find chapters with names as varied as “A Defense of the Family Farm,” “The Soil and Health,” “Renewing Husbandry,” and “The Pleasures of Eating.” For those previously unfamil-iar with Berry and his writing, this compilation is a perfect introduction to his ongoing conversation
with the public on the perils of a agricultural system that is not in balance with its ecosystem and communities. Michael Pollan sums it up well in his introduction: “[Berry’s] now-famous formulation, ‘eating is an agricultural act’ is perhaps Berry’s… signal contribution to the rethinking of food and farming under way today” (p. xiv).
Bringing It to the Table is divided into three sections. In “Farming,” the essays (written between 1971 and 2004) provide a compelling review of the central argument of all Berry’s work, while the second section, “Farmers,” is made up of seven essays that describe his vision of “true farmers,” who are innovating rather than adopting what the agribusiness sector sells with the marketing message of efficient production. Finally, the third section, “Food,” includes excerpts from Berry’s fiction: people sitting down to eat the food they have planted, raised, harvested, cooked, and served. His concepts are illustrated by the cover image of Grant Wood’s Dinner for Threshers.
One of the interesting perspectives Berry adds to the food system discussion is his summary of the “displacement of a portfolio or energies and skills.”
Journal of Agriculture, Food Systems, and Community Development ISSN: 2152-0801 online
www.AgDevJournal.com
192 Volume 1, Issue 2 / Fall 2010
These words, from 1979 and found on pages 63 and 64, are at the core of many current debates on the balance of payments that the farming sector has with the earth’s resources. Even in 1979, he warned against the move away from solar energy, as cover crops could capture more of the sun’s energy year-round; animal energy, in a critique of confinement systems; human energy and skills, which may make the human capital that was gained in agricultural arts obsolete; and finally, soil and soil health. For the latter, he argues that in achiev-ing scale efficiencies and advanced production technologies, we may have lost the customized practices and place-based knowledge needed to produce in the context of our agronomic natural assets.
Along these lines, he is critical of the land grant system’s role in promoting “sound and prosperous rural life” (p. 39) at a time when its programs often pointed to practices and technologies that were dependent on purchased inputs and specialized technology from outside communities, rather than optimizing returns to the energy, resources, and people within farm-based communities. The message to the reader, whether a professional or a member of the food consumer community, is that we must pay close attention to how the system is structured and what it means for where food dollars flow: the types of energy, types of human capital, and where “reinvestments” may or may not be made in our natural resource base and communities.
In a 2002 piece, he envisions “stable, locally adapted resource-preserving communities,” and goes on to say that committed consumers could support balanced plant and animal systems with their purchases. This seems to have framed the re-emergence of local food systems we see engaging the public today. As a word of caution, he noted early on (1978) the absolute dependence of most of the population on industrial agriculture—and the lack of any backup system. With a large urban population that has no knowledge of how to grow
food, no land, and few food-preparation skills, he saw the food-security implications for developed countries far before they entered the mainstream consciousness, when most were only concerned about malnutrition in the developing world.
Berry is unique in that he has always highlighted the characteristics of good farmers in his work, an aspect that influenced other contemporary writers such as Pollan. In his essays on farmers, he returns to his themes of promoting the arts of agriculture and the need for balance in resource use. In “Renewing Husbandry,” he notes that “our recent focus upon productivity, genetic and technological uniformity and global trade…has obscured the necessity for local adaptation.” In another work, he uses the word “sustainable” to describe farmers who waste nothing as they recognize their inter-action and interdependence with their ecosystem, and maintain the cycle of natural resource use and replenishment.
Finally, Berry is unique in his lifting up of Eating as an essential element of society, as highlighted in his writings in the third section of this book. He talks about food politics vs. food esthetics vs. food ethics to highlight how we can’t let our concerns about food production and security interfere with our enjoyment of food. He returns to the theme of agricultural and culinary arts versus the industrial themes of consumer transactions. When our time at meals is discounted by talk of costs and nutritional matrices, perhaps we are not valuing food as the social fabric it can be in our households and communities.
This book is perhaps the most valuable in its historical framing of how current food issues and debates are actually founded on concerns that have been raised for many decades. But it’s also wonderful reading for its seamless movement between global issues, individual farmer-based vignettes, and fictional writings on the “character” of food in our society’s story.