Journal of Food Composition and Analysis 2011 Supplemental Materials
65
Journal of Food Composition and Analysis Fardet et al. 1 Online Supplementary Material 1 1 Expanded Methods: Methodological considerations for estimating the polyphenol and myo-inositol contents of plant- based foods 1.1 Folin-Ciocalteu method and the choice of standard units Concerning Folin-Ciocalteu reagent, the solvents used for extraction were methanol, ethanol, acetone or a combination, to which diluted chloridric, acetic, formic or perchloric acid was added. The total phenolic compound (TPC) content was then determined colourimetrically using a standard that could be gallic acid (GA), caffeic acid (CA), ferulic acid (FA), chlorogenic acid (ChA) or catechin (Cat) depending on the main polyphenols contained in the product tested. The TPC content is finally expressed as GA, CA, FA, ChA or Cat equivalents (respectively, GAE, CAE, FAE, ChAE or CatE). Gallic acid was the most frequently used standard, and TPC values obtained with this standard and expressed as GAE were first selected. Then, when GAE-based TPC values were not available for some products, other standards were considered: they were FA for roasted buckwheat groats, wheat germ, raw flaxseed and raw sunflower seed; ChA for boiled brussel sprouts, boiled cauliflower and fresh lambsquarters; CA for boiled cabbages; and Cat for dried apricot, raisins and carbonated orange soda. The mean TPC contents of whole-grain oat flour, dark rye flour, white wheat flour, fresh sweet basil and sauerkraut were collected exclusively from Phenol-Explorer database (Neveu et al., 2010) and are aggregated means calculated from several TPC values expressed as GAE, FAE, ChAE, CAE and/or CatE. In total, TPC values were collected for 108 products among the 132 initially selected.
Transcript of Journal of Food Composition and Analysis 2011 Supplemental Materials
Journal of Food Composition and Analysis Fardet et al.
1
Online Supplementary Material 1
1 Expanded Methods: Methodological considerations for estimating the polyphenol and myo-inositol contents of plant-based foods
1.1 Folin-Ciocalteu method and the choice of standard units
Concerning Folin-Ciocalteu reagent, the solvents used for extraction were methanol, ethanol,
acetone or a combination, to which diluted chloridric, acetic, formic or perchloric acid was
added. The total phenolic compound (TPC) content was then determined colourimetrically
using a standard that could be gallic acid (GA), caffeic acid (CA), ferulic acid (FA),
chlorogenic acid (ChA) or catechin (Cat) depending on the main polyphenols contained in the
product tested. The TPC content is finally expressed as GA, CA, FA, ChA or Cat equivalents
(respectively, GAE, CAE, FAE, ChAE or CatE).
Gallic acid was the most frequently used standard, and TPC values obtained with this
standard and expressed as GAE were first selected. Then, when GAE-based TPC values were
not available for some products, other standards were considered: they were FA for roasted
buckwheat groats, wheat germ, raw flaxseed and raw sunflower seed; ChA for boiled brussel
sprouts, boiled cauliflower and fresh lambsquarters; CA for boiled cabbages; and Cat for
dried apricot, raisins and carbonated orange soda. The mean TPC contents of whole-grain oat
flour, dark rye flour, white wheat flour, fresh sweet basil and sauerkraut were collected
exclusively from Phenol-Explorer database (Neveu et al., 2010) and are aggregated means
calculated from several TPC values expressed as GAE, FAE, ChAE, CAE and/or CatE. In
total, TPC values were collected for 108 products among the 132 initially selected.
Journal of Food Composition and Analysis Fardet et al.
2
1.2 Folin-Ciocalteu method and interference with other compounds
Folin Ciocalteu’s method was initially developed to measure the content of antioxidant
compounds and it actually measures the sample’s reducing capacity (i.e. an electron transfer
based assay), which is not reflected in the name “total phenolic assay”. In reality, it was also
sensitive to compounds other than polyphenols, such as vitamin C (ascorbic acid), aromatic
amines, sulphur dioxides, sugars, organic acids and/or many others (Huang et al., 2005; Prior
et al., 2005). Thus, this method may over-estimate the real TPC content in some foods.
Despite this caveat, most data in the literature were determined according to this method
without measuring the interference of other aromatic compounds, notably because this
method is convenient, simple and reproducible (Huang et al., 2005).
The interference of aromatic compounds other than polyphenols may be overcome by heating
the extract at temperatures above 60°C and, to a lesser degree, via sonication, but which may
also degrade polyphenols as shown with anthocyanins (Tiwari et al., 2008). Therefore, TPC
values obtained after sonication and/or heating above 60°C were not considered to avoid
collecting heterogeneous data as regards with the nature of the polyphenols extracted.
1.3 Relevance of myo-inositol contents given in literature according to the analytical method employed
Because potentially available myo-inositol (PAI) content was in some cases deduced from
both myo-inositol phosphate (IP) and total myo-inositol (TI) contents, another important issue
was the relevance of data given for phytate (hexakisphosphate, IP6) contents in the literature.
Briefly: phytate was generally measured in foods using two types of methods, non-specific
techniques (generally more ancient techniques and less recent articles) that measured an
overall IP content and specific techniques (generally more recent techniques based on HPLC
or NMR and more recent articles), that separate the different IPs from IP6 to IP1 (Lott et al.,
2000; Xu et al., 1992). Methods are based on different modes of detection. In many cases,
Journal of Food Composition and Analysis Fardet et al.
3
phytate contents that were obtained by non-specific methods were based on iron or phosphate
determination by colourimetry (Wheeler and Ferrel, 1971) and/or ion-exchange
chromatography (Harland and Oberleas, 1977). Theoretically, the latter method should give
IP6 content, but lower IPs can interfere with colourimetric determination or co-elute with IP6
(Xu et al., 1992). Therefore, non-specific methods only give a global estimation of IP content,
including IP6 and sometimes other IPs (not quantified). In this context, because the IP5-IP1
content is generally much lower than IP6 content in raw products, the conversion factor
0.2729 (used for phytate or IP6) was applied to obtain the estimated content in myo-inositol
moieties. Less often, values were given for IP6 and lower IPs (specific methods), but values
were rarely given all of the way through IP1. Consequently, to approximate IP content,
depending on the methods used and the level of confidence of the data given, either total IP
(non-specific methods) or the sum of IP6-IP1 (specific methods) contents has been utilised.
For processed products where IP6 may have been degraded into lower IP, the sum of IP6-IP1
was always considered when available. When no data for IP6 were available, we estimated
these values, when possible, by subtracting the PAI content from the TI content given by the
Clements and Darnell database (Clements and Darnell, 1980).
Values presented in Supplemental Table 1 were therefore either real or estimated PAI content
accompanied by real or estimated IP content. Therefore, these values were generally rough
estimations and, in most cases, under-estimated (notably due to the lack of data for
glycosylated myo-inositols and lipid-bound myo-inositols, e.g. phosphatidylinositol).
2 Expanded results: Rankings of raw products, cereal brans, wheat germ and defatted soybean flour (comments to Supplemental Tables 3-8)
High densities may result from low caloric content (e.g. cucumber and radish), high lipotrope
content (e.g. wheat bran, wheat germ and defatted soybean flour) or a combination of both
Journal of Food Composition and Analysis Fardet et al.
4
(e.g. beetroot and spinach). For a food-by-food analysis, one may return to the original values
given in Supplemental Table 1, which were used to calculate the Lipotrope Densities (LDs).
Cereal brans, wheat germ and defatted soybean flour were not included in the ranking
numbering because they were not sensu stricto un-processed raw products but the by-products
of milling and defatting. However, because they concentrate very high quantities of
lipotropes, they were included in overall rankings to allow relevant comparisons.
2.1 The main lipotropes: betaine, choline, myo-inositol and methionine
All LD distributions were characterised by high ranges (Supplemental Tables 3 and 5). While
the betaine distribution was characterised by having a few products with very high densities
above 170 mg/100 kcal and almost all other products with low densities (50 products had a
density between 0 mg/100 kcal and 10 mg/100 kcal), the density distributions of choline,
myo-inositol and methionine exhibited more progressive decreases.
Concerning betaine density (Supplemental Table 3), the cereal products and milling by-
products all ranked high. Among whole-grain cereal products, whole-grain quinoa had the
highest density, greatly above that of rye, wheat, amaranth and maize. Except algae with a 0
value, vegetable products also ranked high, with lambsquarters, spinach and beetroot having a
density above 450 mg/100 kcal. Fruit, nut, seed and legume products exhibited lower betaine
densities than cereals and vegetables. Raspberries, soybean seeds, peanuts and sunflower
seeds ranked first for fruits, legumes, nuts and seeds, respectively. Seeds tended to rank
higher than nuts.
Ranking according to choline density was quite different (Supplemental Table 3). The first 13
products were all vegetables within the range of 43-95 mg/100 kcal. Spinach and
lambsquarters were the only vegetables with both high betaine and choline densities. Fruits
Journal of Food Composition and Analysis Fardet et al.
5
and cereals were ranked intermediary, at 7-36 mg/100 kcal and 10-49 mg/100 kcal,
respectively. As for betaine, wheat germ and wheat bran were the cereal products with the
highest sources of choline relative to calories supplied, and whole-grain cornmeal was the
lowest source. Among fruits, apple with skin had a very low density while raspberries again
ranked first. Nuts and seeds ranked low (<18 mg/100 kcal) with four nuts ranking last.
Otherwise, soybean and common bean had similar densities.
Concerning methionine density (Supplemental Table 3), apart from fruits (with 16 of 17
products ranking last), the ranking of other plant-based foods (PBF) products by food group
was less marked than for betaine and choline densities. Among the first products were maize
bran, wheat bran, wheat germ, all legume products, dried Brazil nuts, sesame seeds and seven
vegetables.
The range of values was higher for PAI density than for methionine and choline densities
(Supplemental Table 6), with min- and max-values of 0 for bananas, celery and almond and
668 mg/100 kcal for blackberries, respectively. The other fruit products ranked quite high,
with citrus fruits being the next highest source of PAI on a 100 kcal basis. Cereal, legumes,
nut and seed products ranked low (< 33 mg/100 kcal). The myo-Inositol Phosphate (IP)
density distribution was opposite that of PAI, with vegetables and fruits in the lower part of
the ranking and cereals, nuts, seeds and legumes in the higher part. This was confirmed by the
negative and significant Spearman’s correlation coefficient of -0.462 (Supplemental Table 7).
Wheat bran had the highest IP density, with a value of 709 mg/100 kcal, while wheat germ,
ranking second, had an IP density of only 222 mg/100 kcal.
The highest correlation coefficients (r) were associated with the most similar LD rankings.
First, the r between PAI and betaine and methionine densities and the r between methionine
and pantothenic acid densities were not significant. However, although the number of PBF for
Journal of Food Composition and Analysis Fardet et al.
6
which PAI content could have been found was lower, the PAI density was significantly and
positively correlated with choline density (r = 0.327; P = 0.0448). Second, betaine, choline
and methionine densities were significantly and positively correlated with each other, with the
highest value found for choline vs. betaine (r = 0.457); this meant that a significant number of
products was similarly ranked for these LDs.
The sum of betaine, choline, PAI and methionine densities (BeChIMe) was only calculated
for 38 products (Supplemental Table 8). The density difference between the first (spinach)
and last (banana) product was almost 50-fold. Spinach, blackberries, wheat germ and
beetroots were largely above other products with a density within the range of 561-965
mg/100 kcal. No PAI data have been found for lambsquarters and wheat bran; however, by
summing only betaine, choline and methionine densities, the summed LDs of both products
remained high with respective values of 1073 mg/100 mg and 916 mg/100 mg (results not
shown). More generally, seven raw vegetables ranked among first eight products. Citrus fruits
ranked rather high, within the density range of 283-355 mg/100 kcal. Soybean and common
bean had a similar BeChIMe density of 160 mg/100 kcal. Among cereal products, except
germ and bran, whole-grain quinoa had the highest BeChIMe density. Apple with skin,
pineapple, carrots, strawberries, peanuts, blueberries, pears, grapes, almonds, avocado and
bananas all had a relatively low BeChIMe density below 100 mg/100 kcal and 10-fold less
than spinach. Considering the level of correlation, the BeChIMe density was the most
correlated with choline density (r = 0.693), then with PAI density (r = 0.600), and less with
methionine density (r = 0.425), meaning that the BeChIMe density ranking was the closest to
that of choline density (Supplemental Table 7).

Journal of Food Composition and Analysis Fardet et al.
7
2.2 The lipotropic micronutrient: magnesium and B vitamins
The magnesium density distribution resembled that of betaine, with five products having a
high density within the range of 119-465 mg/100 kcal and all other products having densities
within the range of 10-95 mg/100 kcal (Supplemental Table 3). More than half (11/19) of the
vegetable products were ranked among the first 13 products. As for methionine, fruits had a
low magnesium density, with 12 of 19 products among the last 14 products with a density
below 20 mg/100 kcal. Again, wheat bran ranked high. Seeds tended to have higher
magnesium densities than nuts. Blackberries, the first fruit, ranked 14. The two legume
products had similar magnesium densities. Concerning the level of correlation, the
magnesium density correlated most with the methionine density (r = 0.720; P < 0.05;
Supplemental Table 7).
Niacin and pantothenic acid densities had very similar distributions, with one outlier product
(mushrooms) with very high densities of 19.00 mg/100 kcal and 5.93 mg/100 kcal,
respectively; all other products were within the lower ranges of 0.04-5.81 mg/100 kcal and
0.03-2.65 mg/100 kcal, respectively, LD decrease being progressive (Supplemental Table 4).
Vegetable products tended to rank first for all B vitamin densities, especially folate, with 13
of 19 vegetables among the first 15 products. Nut and seed products ranked quite low for B
vitamin densities, especially dried Brazil nut. Fruits ranked intermediary for the three B
vitamin densities, between ranks 9 and 53 for niacin, 11 and 52 for pantothenic acid and 13
and 56 for folates, with blackberry always ranking the highest. Conversely, grape and apple
with skin ranked very low. Among cereal products, wheat bran and wheat germ had relatively
high niacin and pantothenic acid densities, while whole-grain cereals ranked relatively low.
Nuts and seeds also generally tended to rank low. Common bean and soybean ranked
intermediary, had similar niacin and pantothenic acid densities and had a very high folate
density. Nut, seed, fruit and cereal products tended to have lower folate densities than
Journal of Food Composition and Analysis Fardet et al.
8
vegetable and legume products; for example, whole-grain cereals (grains or flours) all had
folate densities below 0.024 mg/100 kcal, i.e. at least 23-fold less than the density of lettuce,
which ranked first at 0.572 mg/100 kcal. The level of correlation (r) was relatively high for
each B vitamin density in a tight range of 0.627 (folates vs. niacin densities) - 0.687 (folates
vs. pantothenic acid densities) (Supplemental Table 7).
When considering the sum of B vitamins, the density distribution was characterised by a very
high density for mushrooms (25.05 mg/100 kcal), and then density progressively decreased
for all other products within the range of 0.07-8.46 mg/100 kcal (Supplemental Table 5).
Most vegetables (14/19) had a relatively high density above 3.00 mg/100 kcal. Among fruits,
blackberries ranked first. Apples with skin, pears and grapes had the lowest total B vitamin
density. Among nuts and seeds, peanuts and seeds ranked the highest, while three nuts ranked
last. Compared to vegetables and, to a lesser extent, fruits, soybean and common bean were
not a good source of B vitamins on a 100 kcal-basis. Cereal ranking had quite heterogeneous
densities ranging from 0.67 mg/100 kcal for whole-grain oat flour to 2.37 mg/100 kcal for
whole-grain wheat flour and 8.46 mg/100 kcal for wheat bran. Total B vitamin density
correlated very well with niacin density (r = 0.931), pantothenic acid (r = 0.835) and folate (r
= 0.726) densities (Supplemental Table 7), meaning that total B vitamin density ranking was
first very similar to niacin density ranking.
In comparison to the r from B vitamin densities between 0.627 and 0.687, the r from the 4
main LDs was lower, between 0.327 and 0.457, underlying a lower level of ranking
similarities for betaine, choline, PAI and methionine densities than for B vitamins.
2.3 Mean rank for the eight lipotrope densities
Due to very different LD ranges obtained for B vitamins (from 0.003 to 19.003 mg/100 kcal)
and other lipotropes (from 0 to 887.1 mg/100 kcal), the sum of only eight LDs cannot
Journal of Food Composition and Analysis Fardet et al.
9
satisfactorily reflect B vitamin densities, notably that of folates, due to its very low values
(range of 0.003-0.572 mg/100 kcal) compared to betaine, choline, PAI, methionine and
magnesium density values: indeed, while a 1 mg/100 kcal-difference between 2 foods for the
methionine density may not have relevant physiological effect, 0.1 mg/100 kcal difference in
folate density may be nutritionally relevant. Consequently, the sum of the eight LDs cannot
satisfactorily express the overall lipotropic potential of PBFs from a physiological point of
view.
Raw PBF products were therefore finally classified according to their mean rank for either
seven (Supplemental Table 4) or eight (Supplemental Table 6) LDs. First, excluding PAI
density, sweet basil ranked first with a mean rank of 6.7 relative to the 61 PBF products, and
grapes ranked last with a mean rank of 56.7. All nuts ranked low, above a mean rank of 37.0,
while seeds tended to rank higher, between 27.0 and 41.0. Except onion, avocado and potato
with skin, all raw vegetables ranked high with a mean rank below 23.0. Except blackberries,
all fruits ranked relatively low with a mean rank above 24.0. Except wheat bran, wheat germ
and maize bran, all whole-grain cereals ranked similarly to seeds, with mean ranks between
24.0 and 40.0. Excluding defatted soybean flour, the two legume products had a mean rank
around 30.0. When including PAI density, raw asparagus rank first with a mean rank of 5.5
relative to the 39 PBF products (38 PBFs + wheat germ), and grapes ranked last again with a
mean rank of 35.9 (Supplemental Table 6). Despite a high betaine density, beetroot had a
mean rank of only 16.1, reflecting lower rankings for other LDs. Except avocado and onion,
all vegetables had high mean rank, within the range of 5.5-16.1. Except blackberries, fruit and
nut products still ranked low, with mean ranks between 19.0 and 35.9.
Ranking first among raw PBFs, raw asparagus was therefore chosen as the reference food
(Lipotropic Capacity, LC = 100) for calculating other LCs.
Journal of Food Composition and Analysis Fardet et al.
10
3 Expanded discussion: methodological choices for calculating the lipotropic capacity
3.1 What is the best way to express the lipotrope content?
The LC is calculated from the LD, expressed on a 100 kcal-basis. However, the lipotrope
content of PBF may be also based on 100 g fresh weight- or a serving size-basis. From a
nutritional point of view, the calorie basis was shown to be the “preferred option when based
on nutrients to encourage” (p. 902) (Drewnowski et al., 2009). Undoubtedly, lipotropic
compounds are nutrients to encourage. Otherwise, it has been recently demonstrated in
Swedish children and adolescents that consumption of diets with “lower dietary energy
density is associated with better dietary quality” (p. 1) (Patterson et al., 2010). In addition,
the liver fat score in sedentary abdominally obese men was significantly and positively
associated with average total caloric intake (Kuk et al., 2008). Based on these results, and 1)
because lipotropes counteract excess hepatic fat deposits, 2) because excess weight gain or
obesity is physiologically expressed by excess fat deposits, notably in the liver, and 3)
because obesity/weight gain notably results from excess energy consumed (Wadden, 1993),
expression of lipotrope content on a calorie basis appeared to be the most nutritionally
relevant. Otherwise, serving sizes largely vary from one country to another.
The major drawback of expressing LD on a 100 kcal-basis was the over-estimation of the LD
for PBFs having a very low caloric content, such as brewed coffee (0.7 kcal/100 mL) and
brewed tea (1.2 kcal/100 mL). In addition, a 100 kcal-basis may be excessive and not very
nutritionally representative with respect to the usual and low daily amounts consumed for
some vegetables and fruits with low caloric content (Drewnowski et al., 2009). Conversely,
foods that combine both very high energy and lipotrope contents have low LDs, such as nuts
and seeds; however, such PBFs should be considered as interesting sources of lipotropes and

Journal of Food Composition and Analysis Fardet et al.
11
be consumed in small amounts, either daily or weekly. In such cases, a serving basis
expression would probably be more relevant.
3.2 The polyphenol, carnitine and resistant starch contents
The calculation of the PBF LC is based on the LD of eight compounds.
However, polyphenols may also exhibit lipotropic effects (Fardet & Chardigny, 2011). The
total phenolic compound fraction was chosen as being roughly representative of polyphenols.
Indeed, PBFs’ TPC content corresponds to the easily extractable fraction and not to bound
polyphenols. Thus, the TPC content would be likely to be released within the digestive tract
and be potentially available for absorption and to exert a lipotropic effect. However, this is
probably not completely true, as shown with different cereal products by comparing the TPC
content of aqueous-organic (acidic methanol/water - 50/50 - plus acetone/water - 70/30) vs.
digestive enzymatic (pepsin, pancreatin, amylase and amyloglucosidase) extracts (Perez-
Jimenez & Saura-Calixto, 2005). Perez-Jimenez and Saura-Calixto (2005) showed that
enzymatic extract TPC contents were between 2 and 15-fold higher than those measured in
the aqueous-organic extracts; for example, the boiled rice, wheat flour and wheat bran TPC
contents increased from, respectively, 21, 344 and 280 mg GAE/100 g in the aqueous-organic
extracts to 323, 703 and 863 mg GAE/100 g in the enzymatic extracts. From a nutritional
perspective, our collected data for TPC contents undoubtedly underestimated the real amount
of polyphenols that can be released within the digestive tract, and they must be taken as only
indicative of some tendencies, notably by food groups. Thus, when adding the TPC density to
the eight LDs, the C group ranked last; however, considering the results of the study by Perez-
Jimenez and Saura-Calixto (Perez-Jimenez & Saura-Calixto, 2005), it is highly probable that
the overall amount of polyphenols released within the small intestine following digestion of
products from this food group is far higher than the TPC content usually measured by the
Journal of Food Composition and Analysis Fardet et al.
12
Folin-Ciocalteu method. In addition to using digestive enzymatic extracts, it will be necessary
to differentiate the amounts of each class of polyphenols, specifically phenolic acids,
lignanes, flavonoids and stilbenes. Only by doing such an analysis will it be meaningful to
include polyphenols within the calculations for the lipotropic potential of PBFs.
Another issue with polyphenols is the vitamin C (ascorbic acid) content of PBFs, which can
interfere with TPC measurements and lead to an over-estimation of the real TPC content of
PBFs. This is a particular concern for vegetables and fruits, which have the highest vitamin C
contents of all the PBF groups. Thus, from our list of 19 vegetables and 19 fruits, the mean
vitamin C values of, respectively, 26 ±36 and 24 ± 24 mg/100 g of food were calculated from
the USDA (United State Department of Agriculture) databases (2005); while those of the C (n
= 6 products), L (n = 2 products) and N (n = 9 products) groups were, respectively, 0, 3.9 ±2.9
and 1.4 ±1.9 mg/100 g of food (results not shown). The degree of over-estimation was not
possible to evaluate because it should be measured separately for each product. Nevertheless,
it has been estimated on 18 different fruit types (including avocado) that 92% of the vitamin C
content can be substracted from the TPC content to reach more realistic values (Vinson et al.,
2001). In this study, the TPC content was determined by Folin-Ciocalteu method with
catechin as standard (Vinson et al., 2001). Interestingly, 14 of these fruits were the same as
those in our study. By applying this correction factor of “0.92 x vitamin C content” (corrected
data not shown) and bearing in mind that most of our collected values were expressed in GAE
and not CatE, a rough estimation of the corrected TPC density for the F group has been
obtained: it decreased from 570 to 525 mg GAE/100 kcal (∼ -8%). Similar results have been
reported in 18 other fruits (Stratil et al., 2007). Others have measured the TPC content of
some fruits using HPLC combined with Folin Ciocalteu’s assay; the TPC content obtained by
the latter method corresponded to the sum of polyphenols and vitamin C, as measured by
HPLC (Klimczak et al., 2007). Our collected TPC data must be therefore balanced by the
Journal of Food Composition and Analysis Fardet et al.
13
interference with other compounds, notably the vitamin C content, especially for citrus fruits,
and by the fact that they underestimate the real amount of TPC that is likely to be released
within the intestine.
Besides the eight lipotropes selected, carnitine, common to both PBFs and animal-based
foods (ABFs), is also a recognised lipotrope (Fardet & Chardigny, 2011). Carnitine allows
acyl-CoA derived from free fatty acids to be transferred within the mitochondrial and/or
peroxisomal matrices for further β-oxidation via carnitine palmityl transferase I (CPT I).
Unfortunately, the lack of data for the carnitine contents of PBFs prevented us from including
it in calculations because the number of PBFs selected would have been too low compared to
the number of PBFs selected for the betaine and choline contents. The highest carnitine
contents are found in ABFs and range from 3.23 to 166 mg/100 g of food for meat products (n
= 20 products), 2.20 to 9.72 mg/100 g for liquid dairy products (n = 17 products) and 0.64 to
12.7 mg/100 g of food for cheeses (n = 20 products) (Seline & Johein, 2007). The few
existing data for PBFs are mainly derived from two studies by Seline and Johein (Seline &
Johein, 2007) and Bourdin et al. (Bourdin et al., 2007). Ranges reported were 0.014-0.164
mg/100 g of food for 4 fruits (apple, banana, guava and orange), 0.163-0.43 mg/100 g of food
for 6 vegetables (avocado, carrot, cauliflower, corn, cucumber and peas) and 1.32-4.98
mg/100 g of food for 3 mushrooms (chanterelle, an undefined mushroom and oyster
mushroom) (Seline & Johein, 2007) and 0.270-0.510 mg/100 g dry food for 3 mature seeds
(6‐day‐old in vitro seedlings of rapeseed, flax and tobacco at the stage of emergence of
the first pair of leaves) (Bourdin et al., 2007). Thus, mushrooms appear to be a good source
of carnitine, followed by vegetables, then fruits and seeds. Once more data will be available
for carnitine PBF contents, it can be included within the calculation of the PBF LC.
Journal of Food Composition and Analysis Fardet et al.
14
Although not being a phytochemical sensu stricto, resistant starch (RS) is classified as a fibre-
type compound (Sajilata et al., 2006), is specific to PBFs and was also shown to exert
lipotropic effect in rats (Fardet & Chardigny, 2011). It includes physically protected starch
(RS1), ungelatinised resistant granules (RS2), retrograded starch (RS3) and/or chemically
modified starches (RS4) (Sajilata et al., 2006). High RS contents are notably found in
processed starchy PBF following thermal treatments, mainly cereal and legume products, and
may depend on processing conditions. For example, the total RS content of adzuki bean
(Phaseolus angulari) seed flour increased from 0.53 g/100 g to 1.36 g/100 g and 2.90 g/100 g
dry matter after 60 and 90 min, respectively, of being cooked in water (Cheung & Chau,
1998). One may also find very high RS contents in some raw starchy PBFs, like bananas, of
which more than 80% of its native α-glucans may be resistant to small intestine digestion in
humans (Englyst & Cummings, 1986; Faisant et al., 1995), and nuts and seeds such as
chestnut (Castanea sativa), of which 58% of its starch content was reported to be RS
(Pizzoferrato et al., 1999). Unlike the adzuki bean, the RS content of raw chestnut decreases
upon ripening and roasting (17% of starch) (Pizzoferrato et al., 1999), and banana RS content
decreases upon ripening. However, RS is composed of different types with different colonic
fates and different resulting physiological properties (Champ, 2004), suggesting that all
fractions may have not the same lipotropic potential. As for polyphenols and carnitine, more
data for PBF RS contents are necessary before including this compound within the calculation
of the PBF LC.
Abbreviations
ABF: animal-based food
BeChIMe: acronym for the sum of betaine, choline, myo-inositol and methionine
GAE: gallic acid equivalents

Journal of Food Composition and Analysis Fardet et al.
15
IP: myo-inositol phosphates
IP6: myo-inositol hexakisphosphate (or phytic acid)
LC: lipotropic capacity
LD: lipotrope density
PAI: potentially available myo-inositol
PBF: plant-based food
RS: resistant starch
TI: total myo-inositol
TPC: total phenolic compounds
USDA: United States Department of Agriculture
References
Bourdin, B., Adenier, H., Perrin, Y., 2007. Camitine is associated with fatty acid metabolism
in plants. Plant Physiology and Biochemistry 45, 926-931.
Champ, M., 2004. Physiological aspects of resistant starch and in vivo measurements. Journal
of AOAC International 87, 749 - 755.
Cheung, P. C.-K., Chau, C.-F., 1998. Changes in the dietary fiber (resistant starch and
nonstarch polysaccharides) content of cooked flours prepared from three Chinese
indigenous legume seeds. Journal of Agricultural and Food Chemistry 46, 262-265.
Journal of Food Composition and Analysis Fardet et al.
16
Clements, R., Jr, Darnell, B., 1980. Myo-inositol content of common foods: development of a
high-myo- inositol diet. American Journal of Clinical Nutrition 33, 1954-1967.
Drewnowski, A., Maillot, M., Darmon, N., 2009. Should nutrient profiles be based on 100 g,
100 kcal or serving size? European Journal of Clinical Nutrition 63, 898-904.
Englyst, H., Cummings, J., 1986. Digestion of the carbohydrates of banana (Musa
paradisiaca sapientum) in the human small intestine. American Journal of Clinical
Nutrition 44, 42-50.
Faisant, N., Buleon, A., Colonna, P., Molis, C., Lartigue, S., Galmiche, J. P., Champ, M.,
1995. Digestion of raw banana starch in the small intestine of healthy humans: structural
features of resistant starch. British Journal of Nutrition 73, 111-123.
Fardet, A., Chardigny, J. M., 2011. Plant-based foods as a source of lipotropes for human
nutrition: a survey of in vivo studies. Critical Reviews in Food Science and Nutrition "In
press".
Harland, B. F., Oberleas, D., 1977. Modified method for phytate analysis using an ion-
exchange procedure - Application to textured vegetable proteins. Cereal Chemistry 54,
827-832.
Huang, D., Ou, B., Prior, R. L., 2005. The chemistry behind antioxidant capacity assays.
Journal of Agricultural and Food Chemistry 53, 1841-1856.
Klimczak, I., Malecka, M., Szlachta, M., Gliszczynska-Swiglo, A., 2007. Effect of storage
on the content of polyphenols, vitamin C and the antioxidant activity of orange juices.
Journal of Food Composition and Analysis 20, 313-322.
Kuk, J. L., Davidson, L. E., Hudson, R., Kilpatrick, K., Bacskai, K., Ross, R., 2008.
Association between dietary fat intake, liver fat, and insulin sensitivity in sedentary,
abdominally obese, older men. Applied Physiology, Nutrition and Metabolism-
Physiologie Appliquée, Nutrition Et Métabolisme 33, 239-245.
Journal of Food Composition and Analysis Fardet et al.
17
Lott, J. N. A., Ockenden, I., Raboy, V., Batten, G. D., 2000. Phytic acid and phosphorus in
crop seeds and fruits: a global estimate. Seed Science Research 10, 11-33.
Neveu, V., Perez-Jimenez, J., Vos, F., Crespy, V., du Chaffaut, L., Mennen, L., Knox, C.,
Eisner, R., Cruz, J., Wishart, D., Scalbert, A., 2010. Phenol-Explorer: An online
comprehensive database on polyphenol contents in foods. Database 2010,
doi:10.1093/database/bap024.
Patterson, E., Warnberg, J., Poortvliet, E., Kearney, J. M., Sjostrom, M., 2010. Dietary energy
density as a marker of dietary quality in Swedish children and adolescents: The European
Youth Heart Study. European Journal of Clinical Nutrition 64, 356-363.
Perez-Jimenez, J., Saura-Calixto, F., 2005. Literature data may underestimate the actual
antioxidant capacity of cereals. Journal of Agricultural and Food Chemistry 53, 5036-
5040.
Pizzoferrato, L., Rotilio, G., Paci, M., 1999. Modification of structure and digestibility of
chestnut starch upon cooking: a solid state 13C CP MAS NMR and enzymatic degradation
study. Journal of Agricultural and Food Chemistry 47, 4060-4063.
Prior, R. L., Wu, X. L., Schaich, K., 2005. Standardized methods for the determination of
antioxidant capacity and phenolics in foods and dietary supplements. Journal of
Agricultural and Food Chemistry 53, 4290-4302.
Sajilata, M. G., Singhal, R. S., Kulkarni, P. R., 2006. Resistant starch: A review.
Comprehensive Reviews in Food Science and Food Safety 5, 1-17.
Seline, K. G., Johein, H., 2007. The determination of L-carnitine in several food samples.
Food Chemistry 105, 793-804.
Stratil, P., Klejdus, B., Kuban, V., 2007. Determination of phenolic compounds and their
antioxidant activity in fruits and cereals. Talanta 71, 1741-1751.
Journal of Food Composition and Analysis Fardet et al.
18
Tiwari, B. K., O'Donnell, C. P., Patras, A., Cullen, P. J., 2008. Anthocyanin and ascorbic acid
degradation in sonicated strawberry juice. Journal of Agricultural and Food Chemistry 56,
10071-10077.
U.S. Department of Agriculture, Agricultural Research Service, 2005. USDA National
Nutrient Database for Standard Reference, Release 18. Retrieved 2009-2010 from
Nutrient Data Laboratory Home Page:
http://www.nal.usda.gov/fnic/foodcomp/Data/SR18/reports/sr18page.htm
Vinson, J. A., Su, X., Zubik, L., Bose, P., 2001. Phenol antioxidant quantity and quality in
foods: fruits. Journal of Agricultural and Food Chemistry 49, 5315-5321.
Wadden, T. A., 1993. Treatment of obesity by moderate and severe caloric restriction -
Results of clinical research trials. Annals of Internal Medicine 119, 688-693.
Wheeler, E. L., Ferrel, R. E., 1971. Method for phytic acid determination in wheat and wheat
fractions. Cereal Chemistry 48, 312-320.
Xu, P., Price, J., Aggett, P. J., 1992. Recent advances in methodology for analysis of phytate
and inositol phosphates in foods. Progress in Food and Nutrition Science 16, 245-262
Journal of Food Composition and Analysis Fardet et al.
1
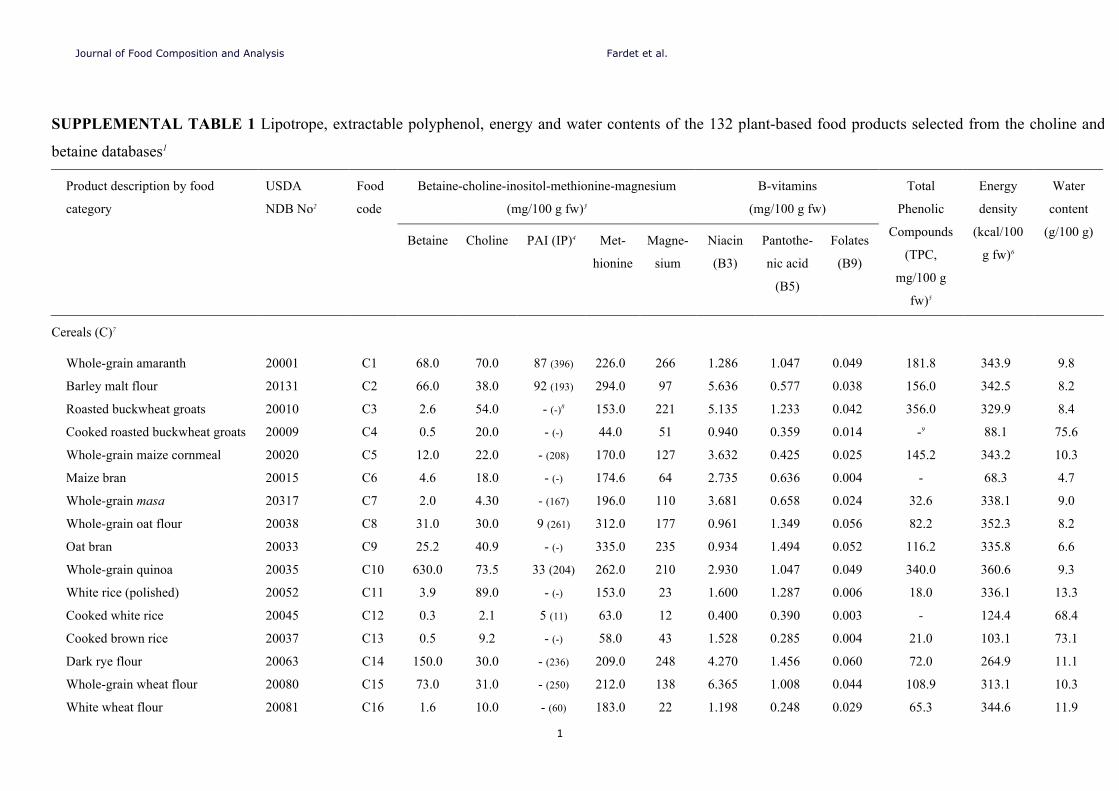
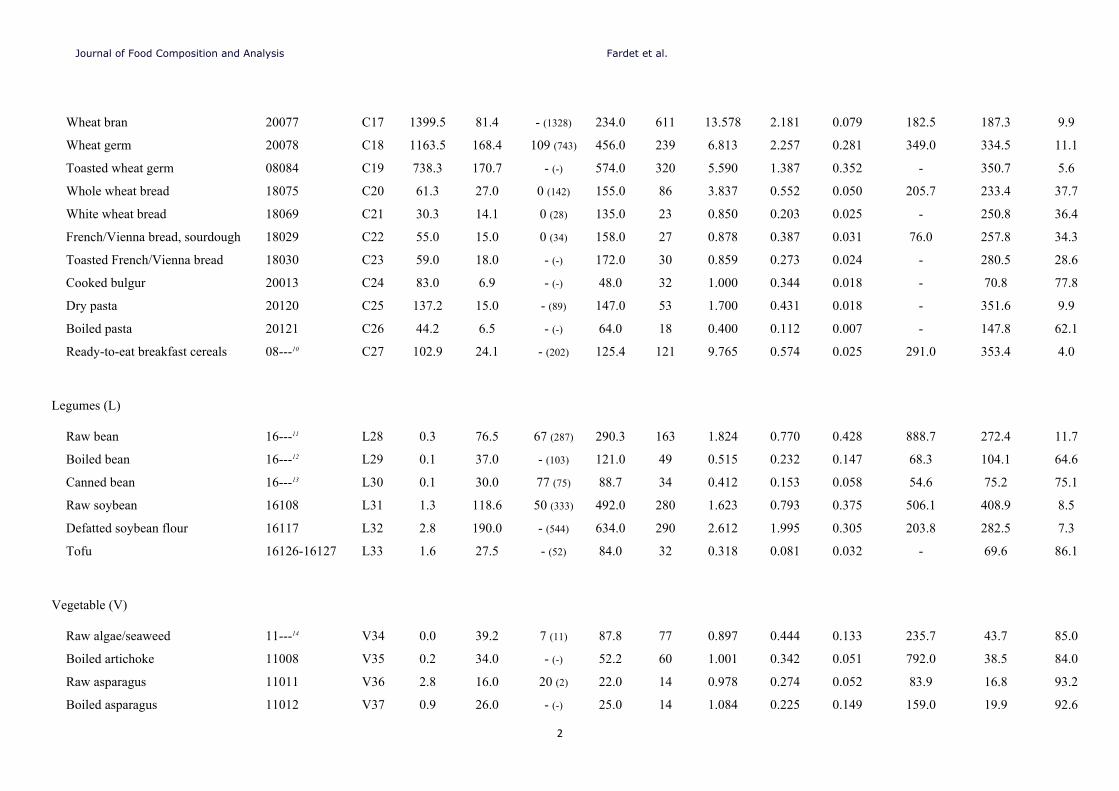
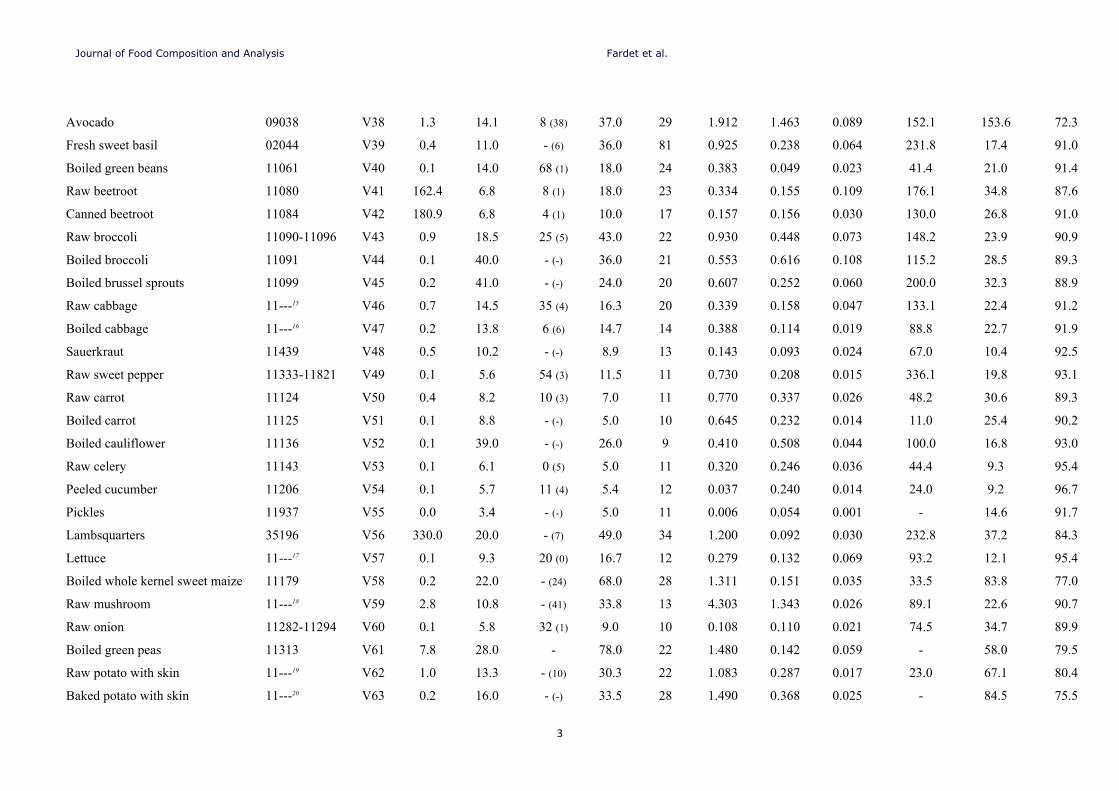
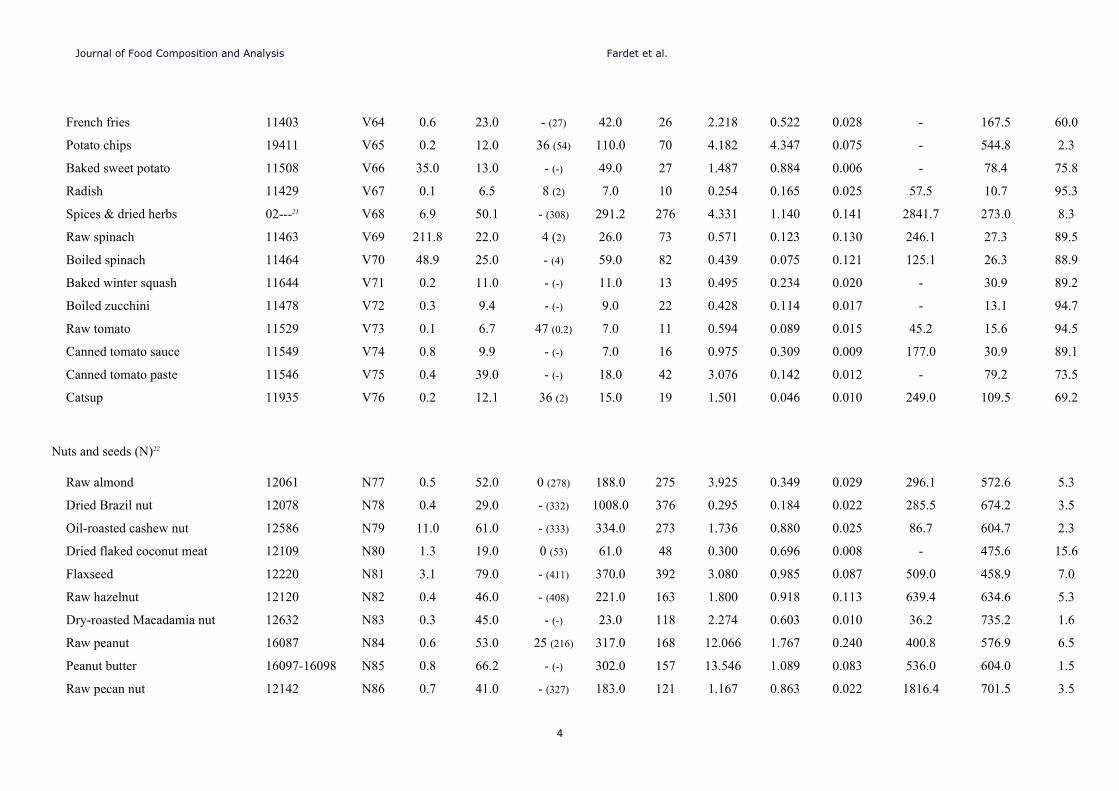
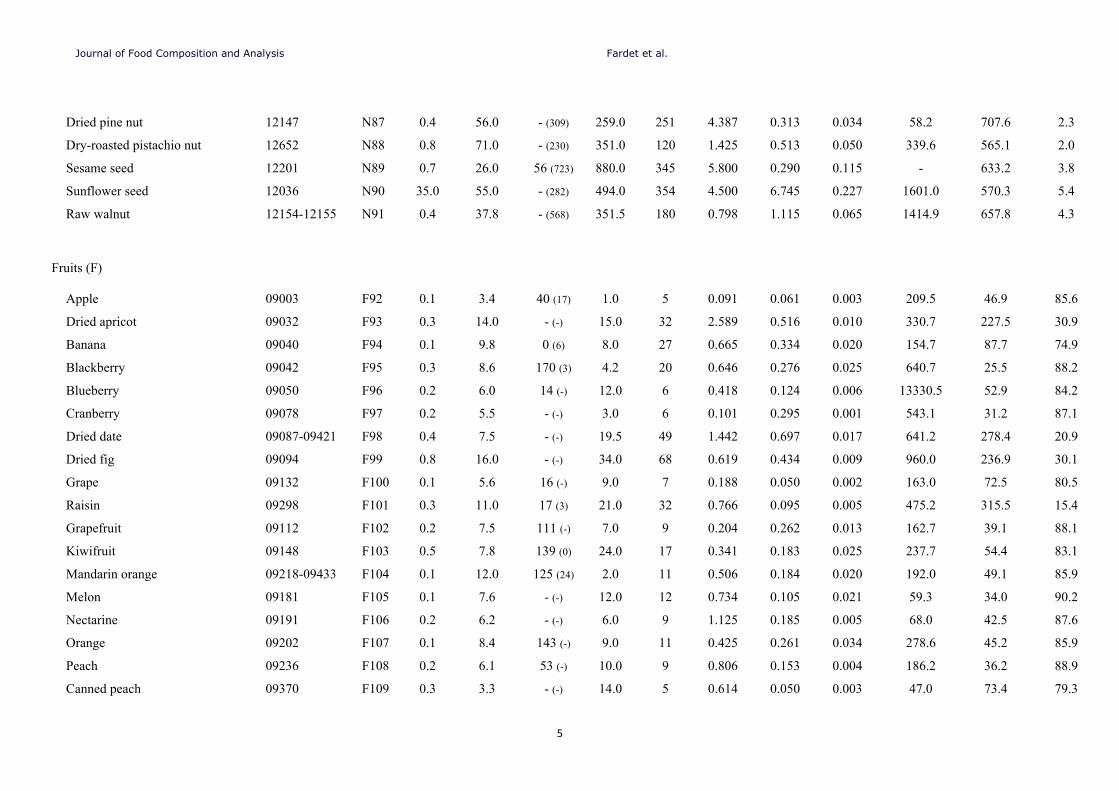
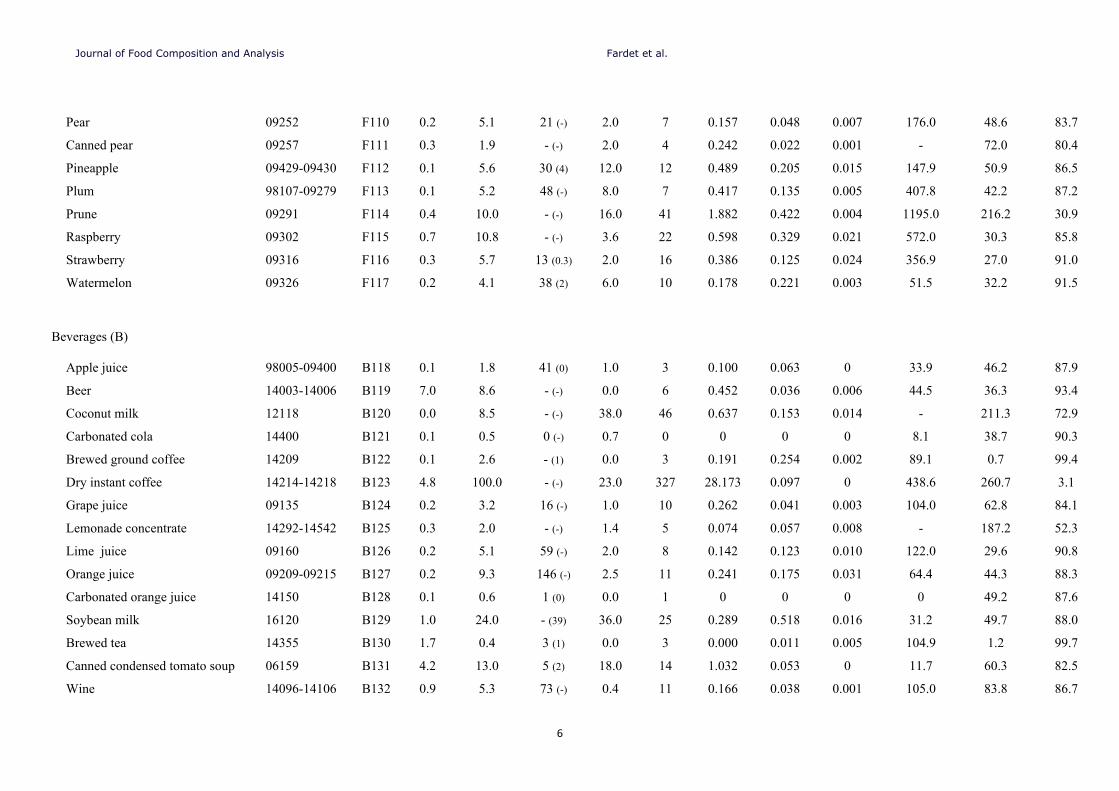
SUPPLEMENTAL TABLE 1 Lipotrope, extractable polyphenol, energy and water contents of the 132 plant-based food products selected from the choline and
betaine databases1
Betaine-choline-inositol-methionine-magnesium
(mg/100 g fw)3
B-vitamins
(mg/100 g fw)
Product description by food
category
USDA
NDB No2
Food
code
Betaine Choline PAI (IP)4 Met-
hionine
Magne-
sium
Niacin
(B3)
Pantothe-
nic acid
(B5)
Folates
(B9)
Total
Phenolic
Compounds
(TPC,
mg/100 g
fw)5
Energy
density
(kcal/100
g fw)6
Water
content
(g/100 g)
Cereals (C)7
Whole-grain amaranth 20001 C1 68.0 70.0 87 (396) 226.0 266 1.286 1.047 0.049 181.8 343.9 9.8
Barley malt flour 20131 C2 66.0 38.0 92 (193) 294.0 97 5.636 0.577 0.038 156.0 342.5 8.2
Roasted buckwheat groats 20010 C3 2.6 54.0 - (-)8 153.0 221 5.135 1.233 0.042 356.0 329.9 8.4
Cooked roasted buckwheat groats 20009 C4 0.5 20.0 - (-) 44.0 51 0.940 0.359 0.014 -9 88.1 75.6
Whole-grain maize cornmeal 20020 C5 12.0 22.0 - (208) 170.0 127 3.632 0.425 0.025 145.2 343.2 10.3
Maize bran 20015 C6 4.6 18.0 - (-) 174.6 64 2.735 0.636 0.004 - 68.3 4.7
Whole-grain masa 20317 C7 2.0 4.30 - (167) 196.0 110 3.681 0.658 0.024 32.6 338.1 9.0
Whole-grain oat flour 20038 C8 31.0 30.0 9 (261) 312.0 177 0.961 1.349 0.056 82.2 352.3 8.2
Oat bran 20033 C9 25.2 40.9 - (-) 335.0 235 0.934 1.494 0.052 116.2 335.8 6.6
Whole-grain quinoa 20035 C10 630.0 73.5 33 (204) 262.0 210 2.930 1.047 0.049 340.0 360.6 9.3
White rice (polished) 20052 C11 3.9 89.0 - (-) 153.0 23 1.600 1.287 0.006 18.0 336.1 13.3
Cooked white rice 20045 C12 0.3 2.1 5 (11) 63.0 12 0.400 0.390 0.003 - 124.4 68.4
Cooked brown rice 20037 C13 0.5 9.2 - (-) 58.0 43 1.528 0.285 0.004 21.0 103.1 73.1
Dark rye flour 20063 C14 150.0 30.0 - (236) 209.0 248 4.270 1.456 0.060 72.0 264.9 11.1
Whole-grain wheat flour 20080 C15 73.0 31.0 - (250) 212.0 138 6.365 1.008 0.044 108.9 313.1 10.3
White wheat flour 20081 C16 1.6 10.0 - (60) 183.0 22 1.198 0.248 0.029 65.3 344.6 11.9
Journal of Food Composition and Analysis Fardet et al.
2
Wheat bran 20077 C17 1399.5 81.4 - (1328) 234.0 611 13.578 2.181 0.079 182.5 187.3 9.9
Wheat germ 20078 C18 1163.5 168.4 109 (743) 456.0 239 6.813 2.257 0.281 349.0 334.5 11.1
Toasted wheat germ 08084 C19 738.3 170.7 - (-) 574.0 320 5.590 1.387 0.352 - 350.7 5.6
Whole wheat bread 18075 C20 61.3 27.0 0 (142) 155.0 86 3.837 0.552 0.050 205.7 233.4 37.7
White wheat bread 18069 C21 30.3 14.1 0 (28) 135.0 23 0.850 0.203 0.025 - 250.8 36.4
French/Vienna bread, sourdough 18029 C22 55.0 15.0 0 (34) 158.0 27 0.878 0.387 0.031 76.0 257.8 34.3
Toasted French/Vienna bread 18030 C23 59.0 18.0 - (-) 172.0 30 0.859 0.273 0.024 - 280.5 28.6
Cooked bulgur 20013 C24 83.0 6.9 - (-) 48.0 32 1.000 0.344 0.018 - 70.8 77.8
Dry pasta 20120 C25 137.2 15.0 - (89) 147.0 53 1.700 0.431 0.018 - 351.6 9.9
Boiled pasta 20121 C26 44.2 6.5 - (-) 64.0 18 0.400 0.112 0.007 - 147.8 62.1
Ready-to-eat breakfast cereals 08---10 C27 102.9 24.1 - (202) 125.4 121 9.765 0.574 0.025 291.0 353.4 4.0
Legumes (L)
Raw bean 16---11 L28 0.3 76.5 67 (287) 290.3 163 1.824 0.770 0.428 888.7 272.4 11.7
Boiled bean 16---12 L29 0.1 37.0 - (103) 121.0 49 0.515 0.232 0.147 68.3 104.1 64.6
Canned bean 16---13 L30 0.1 30.0 77 (75) 88.7 34 0.412 0.153 0.058 54.6 75.2 75.1
Raw soybean 16108 L31 1.3 118.6 50 (333) 492.0 280 1.623 0.793 0.375 506.1 408.9 8.5
Defatted soybean flour 16117 L32 2.8 190.0 - (544) 634.0 290 2.612 1.995 0.305 203.8 282.5 7.3
Tofu 16126-16127 L33 1.6 27.5 - (52) 84.0 32 0.318 0.081 0.032 - 69.6 86.1
Vegetable (V)
Raw algae/seaweed 11---14 V34 0.0 39.2 7 (11) 87.8 77 0.897 0.444 0.133 235.7 43.7 85.0
Boiled artichoke 11008 V35 0.2 34.0 - (-) 52.2 60 1.001 0.342 0.051 792.0 38.5 84.0
Raw asparagus 11011 V36 2.8 16.0 20 (2) 22.0 14 0.978 0.274 0.052 83.9 16.8 93.2
Boiled asparagus 11012 V37 0.9 26.0 - (-) 25.0 14 1.084 0.225 0.149 159.0 19.9 92.6
Journal of Food Composition and Analysis Fardet et al.
3
Avocado 09038 V38 1.3 14.1 8 (38) 37.0 29 1.912 1.463 0.089 152.1 153.6 72.3
Fresh sweet basil 02044 V39 0.4 11.0 - (6) 36.0 81 0.925 0.238 0.064 231.8 17.4 91.0
Boiled green beans 11061 V40 0.1 14.0 68 (1) 18.0 24 0.383 0.049 0.023 41.4 21.0 91.4
Raw beetroot 11080 V41 162.4 6.8 8 (1) 18.0 23 0.334 0.155 0.109 176.1 34.8 87.6
Canned beetroot 11084 V42 180.9 6.8 4 (1) 10.0 17 0.157 0.156 0.030 130.0 26.8 91.0
Raw broccoli 11090-11096 V43 0.9 18.5 25 (5) 43.0 22 0.930 0.448 0.073 148.2 23.9 90.9
Boiled broccoli 11091 V44 0.1 40.0 - (-) 36.0 21 0.553 0.616 0.108 115.2 28.5 89.3
Boiled brussel sprouts 11099 V45 0.2 41.0 - (-) 24.0 20 0.607 0.252 0.060 200.0 32.3 88.9
Raw cabbage 11---15 V46 0.7 14.5 35 (4) 16.3 20 0.339 0.158 0.047 133.1 22.4 91.2
Boiled cabbage 11---16 V47 0.2 13.8 6 (6) 14.7 14 0.388 0.114 0.019 88.8 22.7 91.9
Sauerkraut 11439 V48 0.5 10.2 - (-) 8.9 13 0.143 0.093 0.024 67.0 10.4 92.5
Raw sweet pepper 11333-11821 V49 0.1 5.6 54 (3) 11.5 11 0.730 0.208 0.015 336.1 19.8 93.1
Raw carrot 11124 V50 0.4 8.2 10 (3) 7.0 11 0.770 0.337 0.026 48.2 30.6 89.3
Boiled carrot 11125 V51 0.1 8.8 - (-) 5.0 10 0.645 0.232 0.014 11.0 25.4 90.2
Boiled cauliflower 11136 V52 0.1 39.0 - (-) 26.0 9 0.410 0.508 0.044 100.0 16.8 93.0
Raw celery 11143 V53 0.1 6.1 0 (5) 5.0 11 0.320 0.246 0.036 44.4 9.3 95.4
Peeled cucumber 11206 V54 0.1 5.7 11 (4) 5.4 12 0.037 0.240 0.014 24.0 9.2 96.7
Pickles 11937 V55 0.0 3.4 - (-) 5.0 11 0.006 0.054 0.001 - 14.6 91.7
Lambsquarters 35196 V56 330.0 20.0 - (7) 49.0 34 1.200 0.092 0.030 232.8 37.2 84.3
Lettuce 11---17 V57 0.1 9.3 20 (0) 16.7 12 0.279 0.132 0.069 93.2 12.1 95.4
Boiled whole kernel sweet maize 11179 V58 0.2 22.0 - (24) 68.0 28 1.311 0.151 0.035 33.5 83.8 77.0
Raw mushroom 11---18 V59 2.8 10.8 - (41) 33.8 13 4.303 1.343 0.026 89.1 22.6 90.7
Raw onion 11282-11294 V60 0.1 5.8 32 (1) 9.0 10 0.108 0.110 0.021 74.5 34.7 89.9
Boiled green peas 11313 V61 7.8 28.0 - 78.0 22 1.480 0.142 0.059 - 58.0 79.5
Raw potato with skin 11---19 V62 1.0 13.3 - (10) 30.3 22 1.083 0.287 0.017 23.0 67.1 80.4
Baked potato with skin 11---20 V63 0.2 16.0 - (-) 33.5 28 1.490 0.368 0.025 - 84.5 75.5
Journal of Food Composition and Analysis Fardet et al.
4
French fries 11403 V64 0.6 23.0 - (27) 42.0 26 2.218 0.522 0.028 - 167.5 60.0
Potato chips 19411 V65 0.2 12.0 36 (54) 110.0 70 4.182 4.347 0.075 - 544.8 2.3
Baked sweet potato 11508 V66 35.0 13.0 - (-) 49.0 27 1.487 0.884 0.006 - 78.4 75.8
Radish 11429 V67 0.1 6.5 8 (2) 7.0 10 0.254 0.165 0.025 57.5 10.7 95.3
Spices & dried herbs 02---21 V68 6.9 50.1 - (308) 291.2 276 4.331 1.140 0.141 2841.7 273.0 8.3
Raw spinach 11463 V69 211.8 22.0 4 (2) 26.0 73 0.571 0.123 0.130 246.1 27.3 89.5
Boiled spinach 11464 V70 48.9 25.0 - (4) 59.0 82 0.439 0.075 0.121 125.1 26.3 88.9
Baked winter squash 11644 V71 0.2 11.0 - (-) 11.0 13 0.495 0.234 0.020 - 30.9 89.2
Boiled zucchini 11478 V72 0.3 9.4 - (-) 9.0 22 0.428 0.114 0.017 - 13.1 94.7
Raw tomato 11529 V73 0.1 6.7 47 (0.2) 7.0 11 0.594 0.089 0.015 45.2 15.6 94.5
Canned tomato sauce 11549 V74 0.8 9.9 - (-) 7.0 16 0.975 0.309 0.009 177.0 30.9 89.1
Canned tomato paste 11546 V75 0.4 39.0 - (-) 18.0 42 3.076 0.142 0.012 - 79.2 73.5
Catsup 11935 V76 0.2 12.1 36 (2) 15.0 19 1.501 0.046 0.010 249.0 109.5 69.2
Nuts and seeds (N)22
Raw almond 12061 N77 0.5 52.0 0 (278) 188.0 275 3.925 0.349 0.029 296.1 572.6 5.3
Dried Brazil nut 12078 N78 0.4 29.0 - (332) 1008.0 376 0.295 0.184 0.022 285.5 674.2 3.5
Oil-roasted cashew nut 12586 N79 11.0 61.0 - (333) 334.0 273 1.736 0.880 0.025 86.7 604.7 2.3
Dried flaked coconut meat 12109 N80 1.3 19.0 0 (53) 61.0 48 0.300 0.696 0.008 - 475.6 15.6
Flaxseed 12220 N81 3.1 79.0 - (411) 370.0 392 3.080 0.985 0.087 509.0 458.9 7.0
Raw hazelnut 12120 N82 0.4 46.0 - (408) 221.0 163 1.800 0.918 0.113 639.4 634.6 5.3
Dry-roasted Macadamia nut 12632 N83 0.3 45.0 - (-) 23.0 118 2.274 0.603 0.010 36.2 735.2 1.6
Raw peanut 16087 N84 0.6 53.0 25 (216) 317.0 168 12.066 1.767 0.240 400.8 576.9 6.5
Peanut butter 16097-16098 N85 0.8 66.2 - (-) 302.0 157 13.546 1.089 0.083 536.0 604.0 1.5
Raw pecan nut 12142 N86 0.7 41.0 - (327) 183.0 121 1.167 0.863 0.022 1816.4 701.5 3.5
Journal of Food Composition and Analysis Fardet et al.
5
Dried pine nut 12147 N87 0.4 56.0 - (309) 259.0 251 4.387 0.313 0.034 58.2 707.6 2.3
Dry-roasted pistachio nut 12652 N88 0.8 71.0 - (230) 351.0 120 1.425 0.513 0.050 339.6 565.1 2.0
Sesame seed 12201 N89 0.7 26.0 56 (723) 880.0 345 5.800 0.290 0.115 - 633.2 3.8
Sunflower seed 12036 N90 35.0 55.0 - (282) 494.0 354 4.500 6.745 0.227 1601.0 570.3 5.4
Raw walnut 12154-12155 N91 0.4 37.8 - (568) 351.5 180 0.798 1.115 0.065 1414.9 657.8 4.3
Fruits (F)
Apple 09003 F92 0.1 3.4 40 (17) 1.0 5 0.091 0.061 0.003 209.5 46.9 85.6
Dried apricot 09032 F93 0.3 14.0 - (-) 15.0 32 2.589 0.516 0.010 330.7 227.5 30.9
Banana 09040 F94 0.1 9.8 0 (6) 8.0 27 0.665 0.334 0.020 154.7 87.7 74.9
Blackberry 09042 F95 0.3 8.6 170 (3) 4.2 20 0.646 0.276 0.025 640.7 25.5 88.2
Blueberry 09050 F96 0.2 6.0 14 (-) 12.0 6 0.418 0.124 0.006 13330.5 52.9 84.2
Cranberry 09078 F97 0.2 5.5 - (-) 3.0 6 0.101 0.295 0.001 543.1 31.2 87.1
Dried date 09087-09421 F98 0.4 7.5 - (-) 19.5 49 1.442 0.697 0.017 641.2 278.4 20.9
Dried fig 09094 F99 0.8 16.0 - (-) 34.0 68 0.619 0.434 0.009 960.0 236.9 30.1
Grape 09132 F100 0.1 5.6 16 (-) 9.0 7 0.188 0.050 0.002 163.0 72.5 80.5
Raisin 09298 F101 0.3 11.0 17 (3) 21.0 32 0.766 0.095 0.005 475.2 315.5 15.4
Grapefruit 09112 F102 0.2 7.5 111 (-) 7.0 9 0.204 0.262 0.013 162.7 39.1 88.1
Kiwifruit 09148 F103 0.5 7.8 139 (0) 24.0 17 0.341 0.183 0.025 237.7 54.4 83.1
Mandarin orange 09218-09433 F104 0.1 12.0 125 (24) 2.0 11 0.506 0.184 0.020 192.0 49.1 85.9
Melon 09181 F105 0.1 7.6 - (-) 12.0 12 0.734 0.105 0.021 59.3 34.0 90.2
Nectarine 09191 F106 0.2 6.2 - (-) 6.0 9 1.125 0.185 0.005 68.0 42.5 87.6
Orange 09202 F107 0.1 8.4 143 (-) 9.0 11 0.425 0.261 0.034 278.6 45.2 85.9
Peach 09236 F108 0.2 6.1 53 (-) 10.0 9 0.806 0.153 0.004 186.2 36.2 88.9
Canned peach 09370 F109 0.3 3.3 - (-) 14.0 5 0.614 0.050 0.003 47.0 73.4 79.3
Journal of Food Composition and Analysis Fardet et al.
6
Pear 09252 F110 0.2 5.1 21 (-) 2.0 7 0.157 0.048 0.007 176.0 48.6 83.7
Canned pear 09257 F111 0.3 1.9 - (-) 2.0 4 0.242 0.022 0.001 - 72.0 80.4
Pineapple 09429-09430 F112 0.1 5.6 30 (4) 12.0 12 0.489 0.205 0.015 147.9 50.9 86.5
Plum 98107-09279 F113 0.1 5.2 48 (-) 8.0 7 0.417 0.135 0.005 407.8 42.2 87.2
Prune 09291 F114 0.4 10.0 - (-) 16.0 41 1.882 0.422 0.004 1195.0 216.2 30.9
Raspberry 09302 F115 0.7 10.8 - (-) 3.6 22 0.598 0.329 0.021 572.0 30.3 85.8
Strawberry 09316 F116 0.3 5.7 13 (0.3) 2.0 16 0.386 0.125 0.024 356.9 27.0 91.0
Watermelon 09326 F117 0.2 4.1 38 (2) 6.0 10 0.178 0.221 0.003 51.5 32.2 91.5
Beverages (B)
Apple juice 98005-09400 B118 0.1 1.8 41 (0) 1.0 3 0.100 0.063 0 33.9 46.2 87.9
Beer 14003-14006 B119 7.0 8.6 - (-) 0.0 6 0.452 0.036 0.006 44.5 36.3 93.4
Coconut milk 12118 B120 0.0 8.5 - (-) 38.0 46 0.637 0.153 0.014 - 211.3 72.9
Carbonated cola 14400 B121 0.1 0.5 0 (-) 0.7 0 0 0 0 8.1 38.7 90.3
Brewed ground coffee 14209 B122 0.1 2.6 - (1) 0.0 3 0.191 0.254 0.002 89.1 0.7 99.4
Dry instant coffee 14214-14218 B123 4.8 100.0 - (-) 23.0 327 28.173 0.097 0 438.6 260.7 3.1
Grape juice 09135 B124 0.2 3.2 16 (-) 1.0 10 0.262 0.041 0.003 104.0 62.8 84.1
Lemonade concentrate 14292-14542 B125 0.3 2.0 - (-) 1.4 5 0.074 0.057 0.008 - 187.2 52.3
Lime juice 09160 B126 0.2 5.1 59 (-) 2.0 8 0.142 0.123 0.010 122.0 29.6 90.8
Orange juice 09209-09215 B127 0.2 9.3 146 (-) 2.5 11 0.241 0.175 0.031 64.4 44.3 88.3
Carbonated orange juice 14150 B128 0.1 0.6 1 (0) 0.0 1 0 0 0 0 49.2 87.6
Soybean milk 16120 B129 1.0 24.0 - (39) 36.0 25 0.289 0.518 0.016 31.2 49.7 88.0
Brewed tea 14355 B130 1.7 0.4 3 (1) 0.0 3 0.000 0.011 0.005 104.9 1.2 99.7
Canned condensed tomato soup 06159 B131 4.2 13.0 5 (2) 18.0 14 1.032 0.053 0 11.7 60.3 82.5
Wine 14096-14106 B132 0.9 5.3 73 (-) 0.4 11 0.166 0.038 0.001 105.0 83.8 86.7
Journal of Food Composition and Analysis Fardet et al.
7
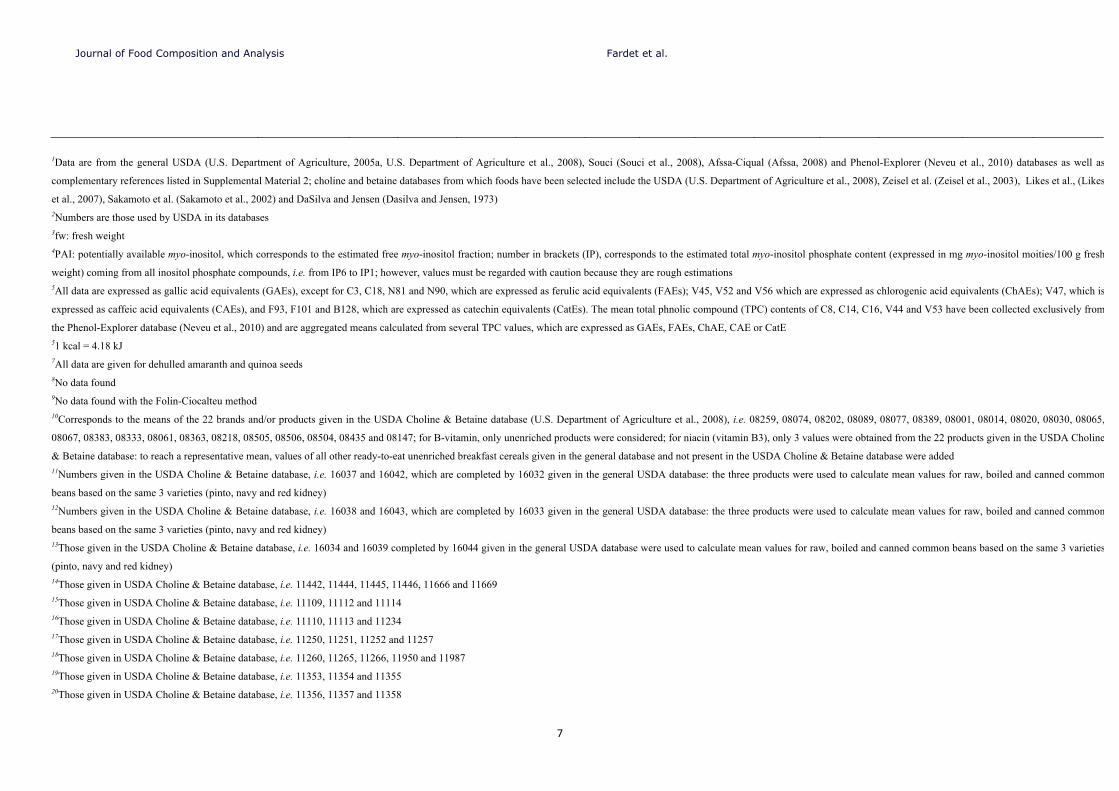
1Data are from the general USDA (U.S. Department of Agriculture, 2005a, U.S. Department of Agriculture et al., 2008), Souci (Souci et al., 2008), Afssa-Ciqual (Afssa, 2008) and Phenol-Explorer (Neveu et al., 2010) databases as well as
complementary references listed in Supplemental Material 2; choline and betaine databases from which foods have been selected include the USDA (U.S. Department of Agriculture et al., 2008), Zeisel et al. (Zeisel et al., 2003), Likes et al., (Likes
et al., 2007), Sakamoto et al. (Sakamoto et al., 2002) and DaSilva and Jensen (Dasilva and Jensen, 1973)
2Numbers are those used by USDA in its databases 3fw: fresh weight 4PAI: potentially available myo-inositol, which corresponds to the estimated free myo-inositol fraction; number in brackets (IP), corresponds to the estimated total myo-inositol phosphate content (expressed in mg myo-inositol moities/100 g fresh
weight) coming from all inositol phosphate compounds, i.e. from IP6 to IP1; however, values must be regarded with caution because they are rough estimations 5All data are expressed as gallic acid equivalents (GAEs), except for C3, C18, N81 and N90, which are expressed as ferulic acid equivalents (FAEs); V45, V52 and V56 which are expressed as chlorogenic acid equivalents (ChAEs); V47, which is
expressed as caffeic acid equivalents (CAEs), and F93, F101 and B128, which are expressed as catechin equivalents (CatEs). The mean total phnolic compound (TPC) contents of C8, C14, C16, V44 and V53 have been collected exclusively from
the Phenol-Explorer database (Neveu et al., 2010) and are aggregated means calculated from several TPC values, which are expressed as GAEs, FAEs, ChAE, CAE or CatE 51 kcal = 4.18 kJ 7All data are given for dehulled amaranth and quinoa seeds
8No data found 9No data found with the Folin-Ciocalteu method 10Corresponds to the means of the 22 brands and/or products given in the USDA Choline & Betaine database (U.S. Department of Agriculture et al., 2008), i.e. 08259, 08074, 08202, 08089, 08077, 08389, 08001, 08014, 08020, 08030, 08065,
08067, 08383, 08333, 08061, 08363, 08218, 08505, 08506, 08504, 08435 and 08147; for B-vitamin, only unenriched products were considered; for niacin (vitamin B3), only 3 values were obtained from the 22 products given in the USDA Choline
& Betaine database: to reach a representative mean, values of all other ready-to-eat unenriched breakfast cereals given in the general database and not present in the USDA Choline & Betaine database were added 11Numbers given in the USDA Choline & Betaine database, i.e. 16037 and 16042, which are completed by 16032 given in the general USDA database: the three products were used to calculate mean values for raw, boiled and canned common
beans based on the same 3 varieties (pinto, navy and red kidney)
12Numbers given in the USDA Choline & Betaine database, i.e. 16038 and 16043, which are completed by 16033 given in the general USDA database: the three products were used to calculate mean values for raw, boiled and canned common
beans based on the same 3 varieties (pinto, navy and red kidney)
13Those given in the USDA Choline & Betaine database, i.e. 16034 and 16039 completed by 16044 given in the general USDA database were used to calculate mean values for raw, boiled and canned common beans based on the same 3 varieties
(pinto, navy and red kidney)
14Those given in USDA Choline & Betaine database, i.e. 11442, 11444, 11445, 11446, 11666 and 11669
15Those given in USDA Choline & Betaine database, i.e. 11109, 11112 and 11114
16Those given in USDA Choline & Betaine database, i.e. 11110, 11113 and 11234
17Those given in USDA Choline & Betaine database, i.e. 11250, 11251, 11252 and 11257
18Those given in USDA Choline & Betaine database, i.e. 11260, 11265, 11266, 11950 and 11987
19Those given in USDA Choline & Betaine database, i.e. 11353, 11354 and 11355
20Those given in USDA Choline & Betaine database, i.e. 11356, 11357 and 11358

Journal of Food Composition and Analysis Fardet et al.
8
21Those given in USDA Choline & Betaine database, i.e. 02003, 02009, 02010, 02011, 02015, 02020, 02021, 02024, 02026, 02027, 02028, 02029, 02030, 02033, and 02043 were completed by other spices and dried herbs given in the general
USDA database (U.S. Department of Agriculture, 2005g), i.e. 02006, 02014, 02013, 02005, 02039, 02004, 02066, 02036, 02023, 02019, 02017, 02012, 02042, 02038, and one value given by the Afssa-Ciqual database for an undefined spice
entitled “spice, average food” (Afssa, 2008) 22All data are given for shelled unblanched (that is the kernel with skin) nuts and dehulled seeds (i.e. flax, sesame and sunflower seeds)

Journal of Food Composition and Analysis Fardet et al.
9
SUPPLEMENTAL TABLE 2 Lipotrope contents of 14 commonly consumed animal-based food products
Betaine-choline-inositol-methionine-magnesium
(mg/100 g of food)
B vitamins
(mg/100 g of food)
Product description
USDA
NDB No.
Betaine Choline PAI1 Met-
hionine
Magne-
sium
Niacin Vit. B5 Folates
Energy
density
(kcal/100 g
of food)2
A1: Salted butter 01001 0.3 19 1 21 2 0.042 0.110 0.003 717
A2: Creamed cottage cheese 01012 0.7 18 2 376 5 0.126 0.213 0.012 103
A3: Raw whole egg 01123 0.6 250 9 380 12 0.070 1.438 0.047 147
A4: Whole milk (3.25% milk fat) 01077 0.6 14 4 75 10 0.107 0.362 0.005 60
A5: Plain yogurt, low fat 01117 0.9 15 6 155 17 0.114 0.591 0.011 63
A6: Cooked/roasted chicken, broiler 05009 5.6 66 8 726 23 8.487 1.030 0.005 239
A7: Cooked/baked pork, bacon 10860 3.4 120 23 795 30 10.623 1.033 0.002 548
A8: Cooked/broiled pork top loin, chops 10068 2.8 78 14 789 28 10.308 0.828 0.001 166
A9: Canned crab 15138 13 34 5 578 39 1.370 0.360 0.043 99
A10: Canned tuna, drained solids 15121 2.1 66 15 755 27 13.280 0.214 0.004 116
A11: Cooked/dry heat cod 15016 9.7 84 2 676 42 2.513 0.180 0.008 105
A12: Cooked/broiled beef, ground, patty 23573 8 81 37 654 20 5.098 0.665 0.010 271
A13: Raw beef, chuck, steak 23039 12 87 15 55 25 5.320 0.861 0.007 140
Journal of Food Composition and Analysis Fardet et al.
10
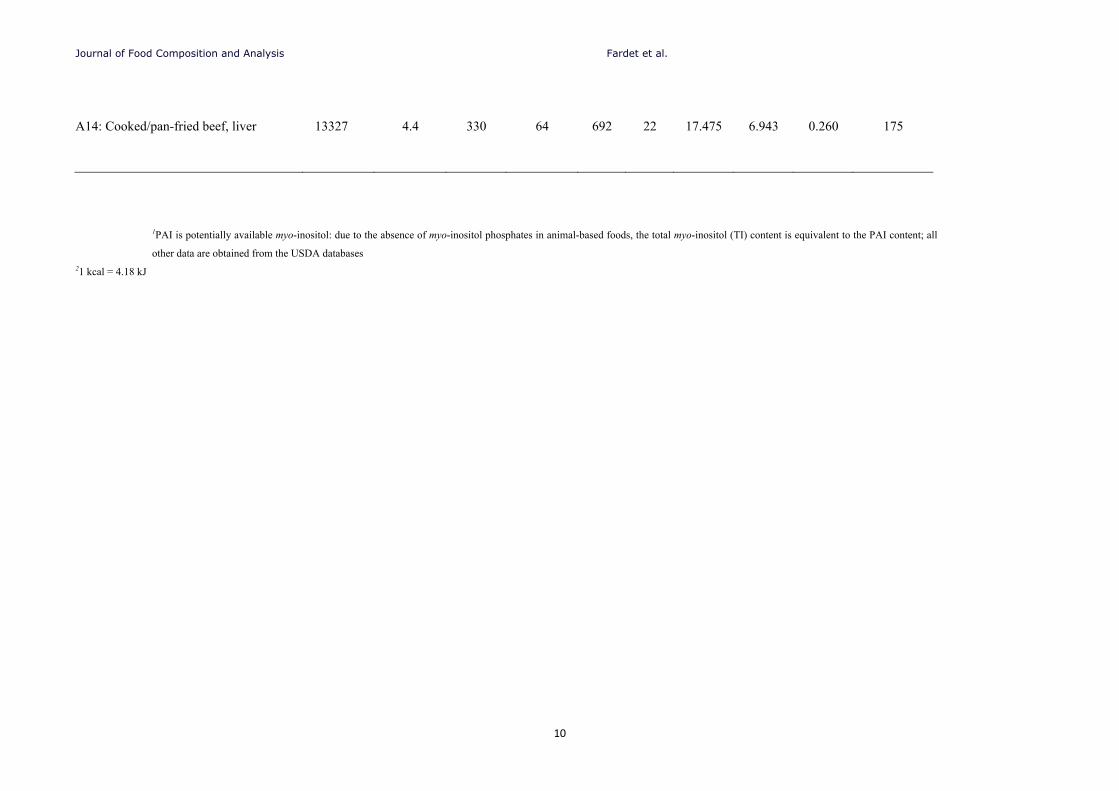
A14: Cooked/pan-fried beef, liver
13327
4.4
330
64
692
22
17.475
6.943
0.260
175
1PAI is potentially available myo-inositol: due to the absence of myo-inositol phosphates in animal-based foods, the total myo-inositol (TI) content is equivalent to the PAI content; all
other data are obtained from the USDA databases 21 kcal = 4.18 kJ
Journal of Food Composition and Analysis Fardet et al.
11
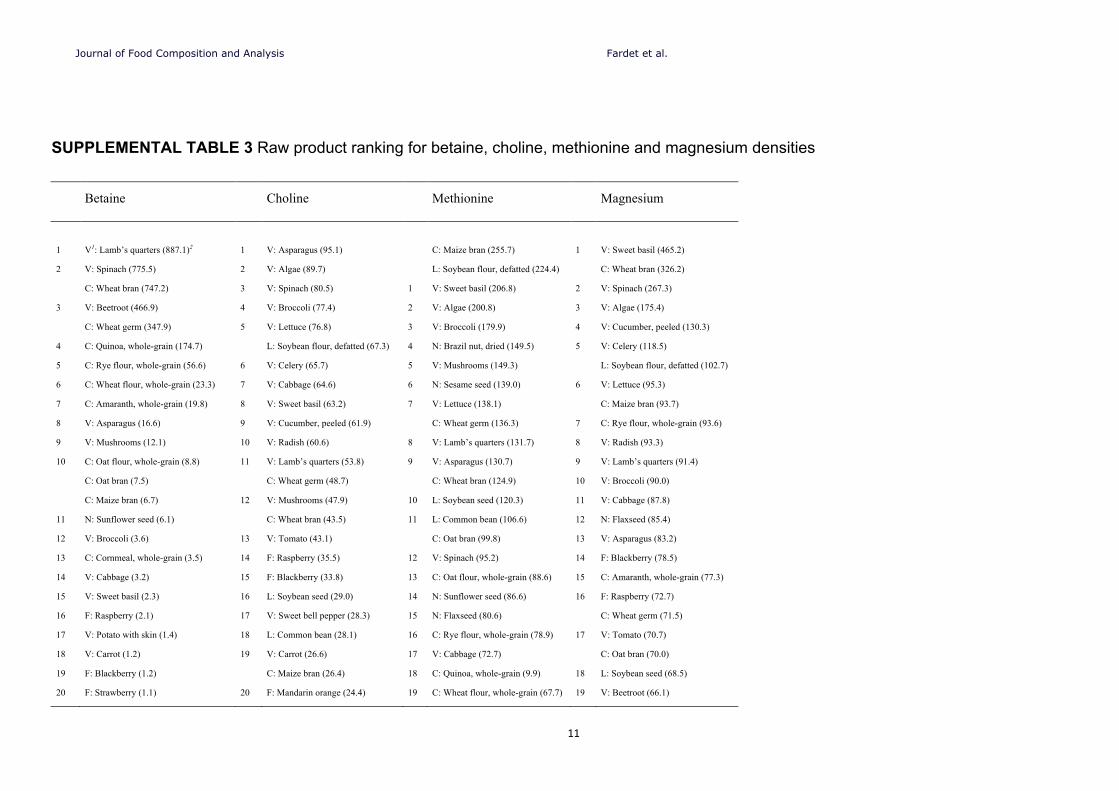
SUPPLEMENTAL TABLE 3 Raw product ranking for betaine, choline, methionine and magnesium densities
Betaine Choline Methionine Magnesium
1
2
3
4
5
6
7
8
9
10
11
12
13
14
15
16
17
18
19
20
V1: Lamb’s quarters (887.1)2
V: Spinach (775.5)
C: Wheat bran (747.2)
V: Beetroot (466.9)
C: Wheat germ (347.9)
C: Quinoa, whole-grain (174.7)
C: Rye flour, whole-grain (56.6)
C: Wheat flour, whole-grain (23.3)
C: Amaranth, whole-grain (19.8)
V: Asparagus (16.6)
V: Mushrooms (12.1)
C: Oat flour, whole-grain (8.8)
C: Oat bran (7.5)
C: Maize bran (6.7)
N: Sunflower seed (6.1)
V: Broccoli (3.6)
C: Cornmeal, whole-grain (3.5)
V: Cabbage (3.2)
V: Sweet basil (2.3)
F: Raspberry (2.1)
V: Potato with skin (1.4)
V: Carrot (1.2)
F: Blackberry (1.2)
F: Strawberry (1.1)
1
2
3
4
5
6
7
8
9
10
11
12
13
14
15
16
17
18
19
20
V: Asparagus (95.1)
V: Algae (89.7)
V: Spinach (80.5)
V: Broccoli (77.4)
V: Lettuce (76.8)
L: Soybean flour, defatted (67.3)
V: Celery (65.7)
V: Cabbage (64.6)
V: Sweet basil (63.2)
V: Cucumber, peeled (61.9)
V: Radish (60.6)
V: Lamb’s quarters (53.8)
C: Wheat germ (48.7)
V: Mushrooms (47.9)
C: Wheat bran (43.5)
V: Tomato (43.1)
F: Raspberry (35.5)
F: Blackberry (33.8)
L: Soybean seed (29.0)
V: Sweet bell pepper (28.3)
L: Common bean (28.1)
V: Carrot (26.6)
C: Maize bran (26.4)
F: Mandarin orange (24.4)
1
2
3
4
5
6
7
8
9
10
11
12
13
14
15
16
17
18
19
C: Maize bran (255.7)
L: Soybean flour, defatted (224.4)
V: Sweet basil (206.8)
V: Algae (200.8)
V: Broccoli (179.9)
N: Brazil nut, dried (149.5)
V: Mushrooms (149.3)
N: Sesame seed (139.0)
V: Lettuce (138.1)
C: Wheat germ (136.3)
V: Lamb’s quarters (131.7)
V: Asparagus (130.7)
C: Wheat bran (124.9)
L: Soybean seed (120.3)
L: Common bean (106.6)
C: Oat bran (99.8)
V: Spinach (95.2)
C: Oat flour, whole-grain (88.6)
N: Sunflower seed (86.6)
N: Flaxseed (80.6)
C: Rye flour, whole-grain (78.9)
V: Cabbage (72.7)
C: Quinoa, whole-grain (9.9)
C: Wheat flour, whole-grain (67.7)
1
2
3
4
5
6
7
8
9
10
11
12
13
14
15
16
17
18
19
V: Sweet basil (465.2)
C: Wheat bran (326.2)
V: Spinach (267.3)
V: Algae (175.4)
V: Cucumber, peeled (130.3)
V: Celery (118.5)
L: Soybean flour, defatted (102.7)
V: Lettuce (95.3)
C: Maize bran (93.7)
C: Rye flour, whole-grain (93.6)
V: Radish (93.3)
V: Lamb’s quarters (91.4)
V: Broccoli (90.0)
V: Cabbage (87.8)
N: Flaxseed (85.4)
V: Asparagus (83.2)
F: Blackberry (78.5)
C: Amaranth, whole-grain (77.3)
F: Raspberry (72.7)
C: Wheat germ (71.5)
V: Tomato (70.7)
C: Oat bran (70.0)
L: Soybean seed (68.5)
V: Beetroot (66.1)

Journal of Food Composition and Analysis Fardet et al.
12
21
22
23
24
25
26
27
28
29
30
31
32
33
34
35
36
37
38
39
40
41
42
43
44
45
46
47
48
49
50
V: Cucumber, peeled (1.1)
V: Celery (1.1)
L: Soybean flour, defatted (1.0)
V: Lettuce (1.0)
F: Kiwifruit (0.9)
V: Avocado (0.8)
N: Flaxseed (0.7)
F: Cranberry (0.6)
V: Radish (0.6)
F: Grapefruit (0.5)
V: Sweet bell pepper (0.5)
F: Nectarine (0.5)
F: Watermelon (0.5)
V: Tomato (0.4)
F: Peach (0.4)
F: Blueberry (0.4)
L: Soybean seed (0.3)
F: Pear (0.3)
F: Melon (0.3)
F: Plum (0.2)
F: Orange (0.2)
V: Onion (0.2)
F: Apple with skin (0.2)
F: Mandarin orange (0.2)
F: Pineapple (0.2)
N: Sesame seed (0.1)
N: Peanut (0.1)
N: Pecan nut (0.1)
F: Grape (0.1)
L: Common bean (0.1)
N: Almond (0.1)
21
22
23
24
25
26
27
28
29
30
31
32
33
34
35
36
37
38
39
40
41
42
43
44
45
46
47
48
49
50
F: Melon (22.4)
F: Strawberry (21.1)
C: Quinoa, whole-grain (20.4)
C: Amaranth, whole-grain (20.4)
V: Potato with skin (19.9)
V: Beetroot (19.4)
F: Grapefruit (19.2)
F: Orange (18.6)
F: Cranberry (17.6)
N: Flaxseed (17.2)
F: Peach (16.8)
V: Onion (16.7)
F: Nectarine (14.6)
F: Kiwifruit (14.3)
F: Watermelon (12.7)
F: Plum (12.3)
C: Oat bran (12.2)
F: Blueberry (11.3)
C: Rye flour, whole-grain (11.3)
F: Banana (11.2)
F: Pineapple (10.9)
F: Pear (10.5)
C: Wheat flour, whole-grain (9.9)
N: Sunflower seed (9.6)
N: Peanut (9.2)
V: Avocado (9.2)
N: Almond (9.1)
C: Oat flour, whole-grain (8.5)
N: Pine nut, dried (7.9)
F: Grape (7.8)
N: Hazelnut (7.2)
20
21
22
23
24
25
26
27
28
29
30
31
32
33
34
35
36
37
38
39
40
41
42
43
44
45
46
47
48
49
50
C: Amaranth, whole-grain (65.7)
V: Radish (65.3)
V: Cucumber, peeeled (58.9)
V: Sweet bell pepper (58.2)
N: Peanut (55.0)
V: Celery (53.9)
N: Walnut (53.4)
V: Beetroot (51.8)
C: Cornmeal, whole-grain (49.5)
V: Potato with skin (45.2)
V: Tomato (45.0)
F: Kiwifruit (44.1)
N: Pine nut, dried (36.6)
F: Melon (35.3)
N: Hazelnut (34.8)
N: Almond (32.8)
F: Peach (27.6)
N: Pecan nut (26.1)
V: Onion (26.0)
V: Avocado (24.1)
F: Pineapple (23.6)
V: Carrot (22.9)
F: Blueberry (22.7)
F: Orange (19.9)
F: Plum (19.0)
F: Watermelon (18.7)
F: Grapefruit (17.9)
F: Blackberry (16.4)
F: Nectarine (14.1)
F: Grape (12.4)
F: Raspberry (11.9)
20
21
22
23
24
25
26
27
28
29
30
31
32
33
34
35
36
37
38
39
40
41
42
43
44
45
46
47
48
49
50
N: Sunflower seed (62.1)
L: Common bean (59.8)
F: Strawberry (59.3)
C: Quinoa, whole-grain (58.2)
N: Brazil nut, dried (55.8)
V: Sweet bell pepper (55.7)
V: Mushroom (55.6)
N: Sesame seed (54.5)
C: Oat flour, whole-grain (50.2)
N: Almond (48.0)
C: Wheat flour, whole-grain (44.1)
C: Cornmeal, whole-grain (37.0)
V: Carrot (35.9)
N: Pine nut, dried (35.5)
F: Melon (35.3)
V: Potato with skin (32.8)
F: Kiwifruit (31.3)
F: Watermelon (31.1)
F: Banana (30.8)
N: Peanut (29.1)
V: Onion (27.4)
N: Walnut (27.3)
N: Hazelnut (25.7)
F: Peach (24.8)
F: Orange (24.3)
F: Pineapple (23.6)
F: Grapefruit (23.0)
F: Mandarin orange (22.4)
F: Nectarine (21.2)
F: Cranberry (19.2)
V: Avocado (18.9)
Journal of Food Composition and Analysis Fardet et al.
13
51
52
53
54
55
56
N: Hazelnut (0.1)
N: Brazil nut, dried (0.1)
F: Banana (0.1)
N: Pine nut, dried (0.1)
N: Walnut (0.1)
V: Algae (0)
Means ±SD3: 44.3 ±166.9
Quartiles3: 0.2-0.6-2.5
51
52
53
54
55
56
F: Apple with skin (7.2)
C: Cornmeal, whole-grain (9.9)
N: Pecan nut (5.8)
N: Walnut (5.7)
N: Brazil nut, dried (4.3)
N: Sesame seed (4.1)
Means ±SD: 27.4 ±24.5
Quartiles: 9.8-18.1-34.2
51
52
53
54
55
56
F: Cranberry (9.6)
F: Banana (9.1)
F: Strawberry (7.4)
F: Pear (4.1)
F: Mandarin orange (4.1)
F: Apple with skin (2.1)
Means ±SD: 61.1 ±52.1
Quartiles: 22.0-47.4-82.1
51
52
53
54
55
56
N: Pecan nut (17.2)
F: Plum (16.6)
F: Pear (14.4)
F: Blueberry (11.3)
F: Apple with skin (10.6)
F: Grape (9.7)
Means ±SD: 63.4 ±70.3
Quartiles: 25.5-49.1-77.6
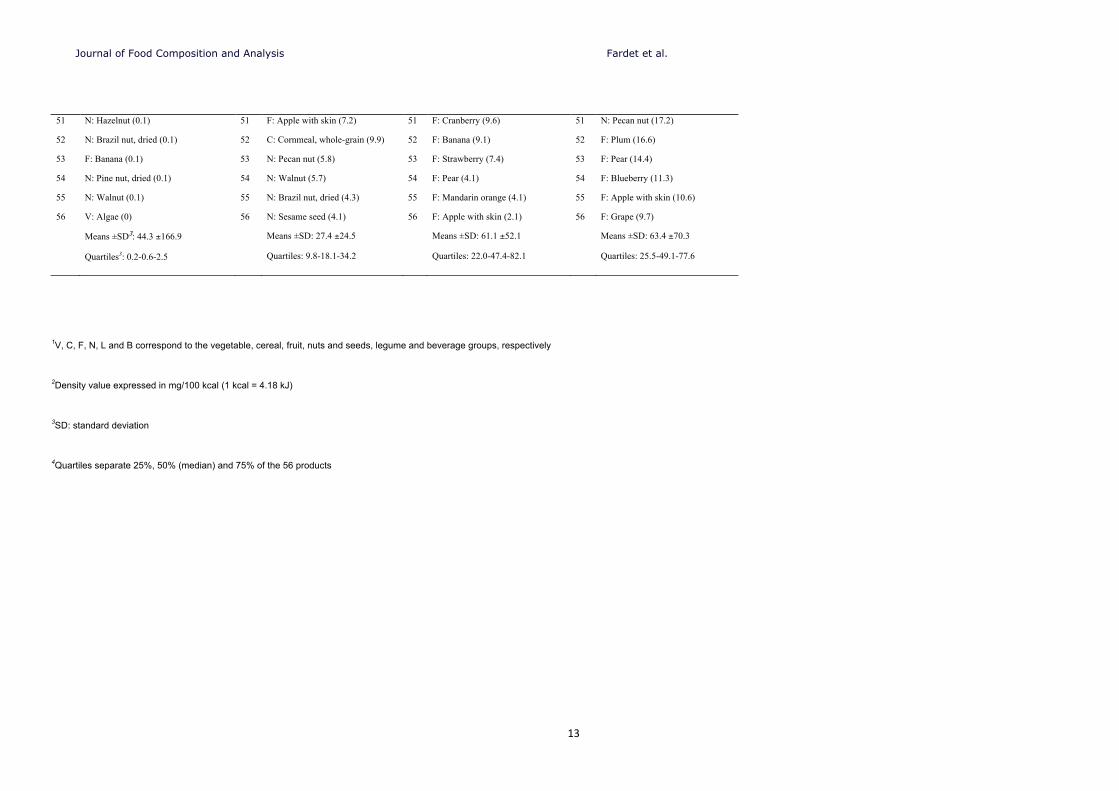
1V, C, F, N, L and B correspond to the vegetable, cereal, fruit, nuts and seeds, legume and beverage groups, respectively
2Density value expressed in mg/100 kcal (1 kcal = 4.18 kJ)
3SD: standard deviation
4Quartiles separate 25%, 50% (median) and 75% of the 56 products
Journal of Food Composition and Analysis Fardet et al.
14
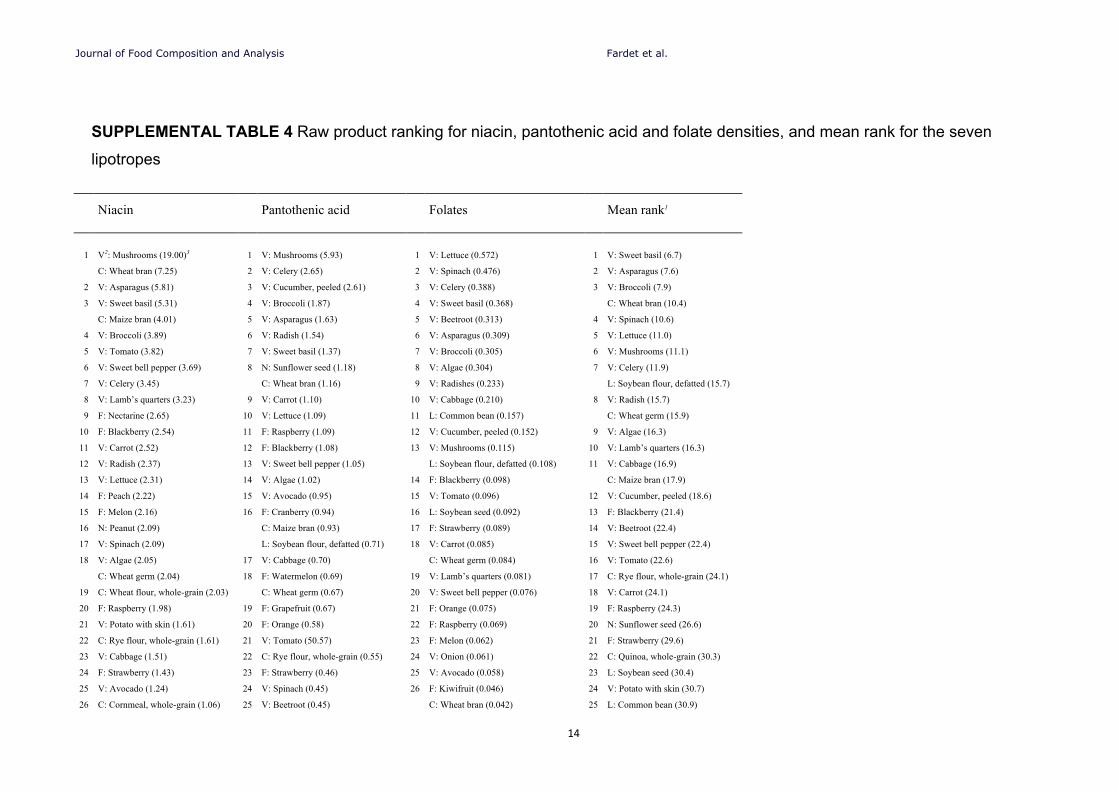
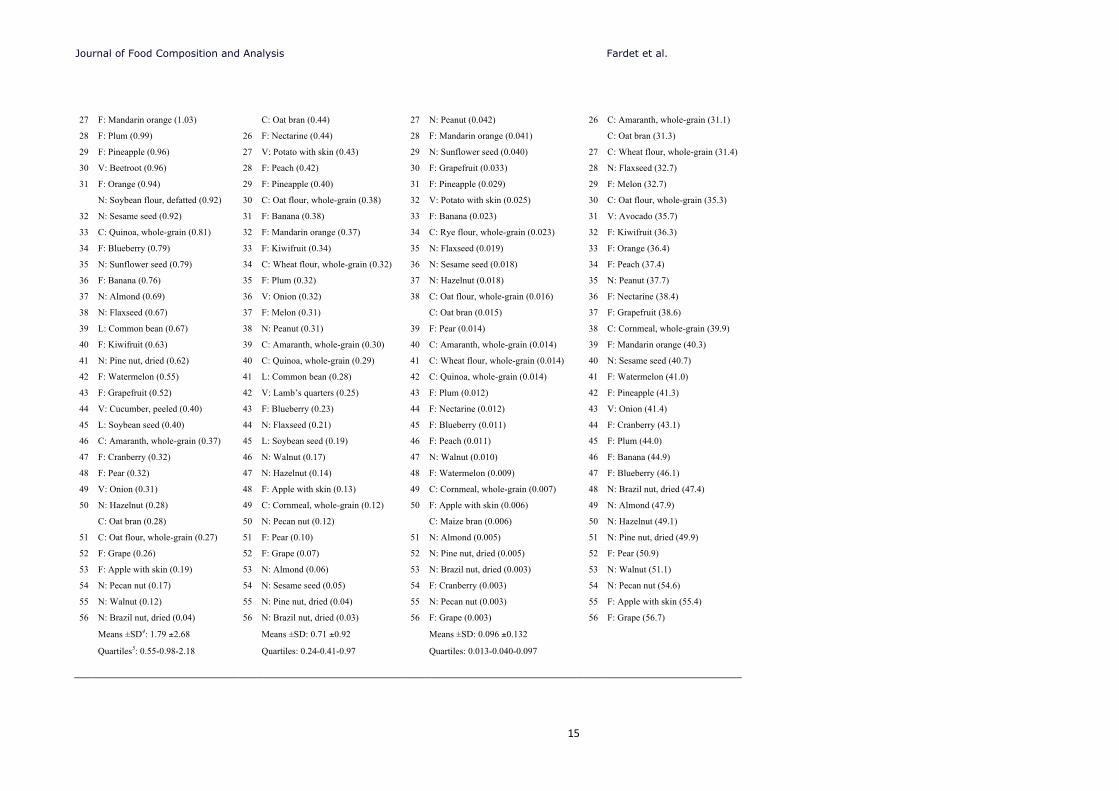
SUPPLEMENTAL TABLE 4 Raw product ranking for niacin, pantothenic acid and folate densities, and mean rank for the seven
lipotropes
Niacin Pantothenic acid Folates Mean rank1
1 V2: Mushrooms (19.00)3 1 V: Mushrooms (5.93) 1 V: Lettuce (0.572) 1 V: Sweet basil (6.7)
C: Wheat bran (7.25) 2 V: Celery (2.65) 2 V: Spinach (0.476) 2 V: Asparagus (7.6)
2 V: Asparagus (5.81) 3 V: Cucumber, peeled (2.61) 3 V: Celery (0.388) 3 V: Broccoli (7.9)
3 V: Sweet basil (5.31) 4 V: Broccoli (1.87) 4 V: Sweet basil (0.368) C: Wheat bran (10.4)
C: Maize bran (4.01) 5 V: Asparagus (1.63) 5 V: Beetroot (0.313) 4 V: Spinach (10.6)
4 V: Broccoli (3.89) 6 V: Radish (1.54) 6 V: Asparagus (0.309) 5 V: Lettuce (11.0)
5 V: Tomato (3.82) 7 V: Sweet basil (1.37) 7 V: Broccoli (0.305) 6 V: Mushrooms (11.1)
6 V: Sweet bell pepper (3.69) 8 N: Sunflower seed (1.18) 8 V: Algae (0.304) 7 V: Celery (11.9)
7 V: Celery (3.45) C: Wheat bran (1.16) 9 V: Radishes (0.233) L: Soybean flour, defatted (15.7)
8 V: Lamb’s quarters (3.23) 9 V: Carrot (1.10) 10 V: Cabbage (0.210) 8 V: Radish (15.7)
9 F: Nectarine (2.65) 10 V: Lettuce (1.09) 11 L: Common bean (0.157) C: Wheat germ (15.9)
10 F: Blackberry (2.54) 11 F: Raspberry (1.09) 12 V: Cucumber, peeled (0.152) 9 V: Algae (16.3)
11 V: Carrot (2.52) 12 F: Blackberry (1.08) 13 V: Mushrooms (0.115) 10 V: Lamb’s quarters (16.3)
12 V: Radish (2.37) 13 V: Sweet bell pepper (1.05) L: Soybean flour, defatted (0.108) 11 V: Cabbage (16.9)
13 V: Lettuce (2.31) 14 V: Algae (1.02) 14 F: Blackberry (0.098) C: Maize bran (17.9)
14 F: Peach (2.22) 15 V: Avocado (0.95) 15 V: Tomato (0.096) 12 V: Cucumber, peeled (18.6)
15 F: Melon (2.16) 16 F: Cranberry (0.94) 16 L: Soybean seed (0.092) 13 F: Blackberry (21.4)
16 N: Peanut (2.09) C: Maize bran (0.93) 17 F: Strawberry (0.089) 14 V: Beetroot (22.4)
17 V: Spinach (2.09) L: Soybean flour, defatted (0.71) 18 V: Carrot (0.085) 15 V: Sweet bell pepper (22.4)
18 V: Algae (2.05) 17 V: Cabbage (0.70) C: Wheat germ (0.084) 16 V: Tomato (22.6)
C: Wheat germ (2.04) 18 F: Watermelon (0.69) 19 V: Lamb’s quarters (0.081) 17 C: Rye flour, whole-grain (24.1)
19 C: Wheat flour, whole-grain (2.03) C: Wheat germ (0.67) 20 V: Sweet bell pepper (0.076) 18 V: Carrot (24.1)
20 F: Raspberry (1.98) 19 F: Grapefruit (0.67) 21 F: Orange (0.075) 19 F: Raspberry (24.3)
21 V: Potato with skin (1.61) 20 F: Orange (0.58) 22 F: Raspberry (0.069) 20 N: Sunflower seed (26.6)
22 C: Rye flour, whole-grain (1.61) 21 V: Tomato (50.57) 23 F: Melon (0.062) 21 F: Strawberry (29.6)
23 V: Cabbage (1.51) 22 C: Rye flour, whole-grain (0.55) 24 V: Onion (0.061) 22 C: Quinoa, whole-grain (30.3)
24 F: Strawberry (1.43) 23 F: Strawberry (0.46) 25 V: Avocado (0.058) 23 L: Soybean seed (30.4)
25 V: Avocado (1.24) 24 V: Spinach (0.45) 26 F: Kiwifruit (0.046) 24 V: Potato with skin (30.7)
26 C: Cornmeal, whole-grain (1.06) 25 V: Beetroot (0.45) C: Wheat bran (0.042) 25 L: Common bean (30.9)
Journal of Food Composition and Analysis Fardet et al.
15
27 F: Mandarin orange (1.03) C: Oat bran (0.44) 27 N: Peanut (0.042) 26 C: Amaranth, whole-grain (31.1)
28 F: Plum (0.99) 26 F: Nectarine (0.44) 28 F: Mandarin orange (0.041) C: Oat bran (31.3)
29 F: Pineapple (0.96) 27 V: Potato with skin (0.43) 29 N: Sunflower seed (0.040) 27 C: Wheat flour, whole-grain (31.4)
30 V: Beetroot (0.96) 28 F: Peach (0.42) 30 F: Grapefruit (0.033) 28 N: Flaxseed (32.7)
31 F: Orange (0.94) 29 F: Pineapple (0.40) 31 F: Pineapple (0.029) 29 F: Melon (32.7)
N: Soybean flour, defatted (0.92) 30 C: Oat flour, whole-grain (0.38) 32 V: Potato with skin (0.025) 30 C: Oat flour, whole-grain (35.3)
32 N: Sesame seed (0.92) 31 F: Banana (0.38) 33 F: Banana (0.023) 31 V: Avocado (35.7)
33 C: Quinoa, whole-grain (0.81) 32 F: Mandarin orange (0.37) 34 C: Rye flour, whole-grain (0.023) 32 F: Kiwifruit (36.3)
34 F: Blueberry (0.79) 33 F: Kiwifruit (0.34) 35 N: Flaxseed (0.019) 33 F: Orange (36.4)
35 N: Sunflower seed (0.79) 34 C: Wheat flour, whole-grain (0.32) 36 N: Sesame seed (0.018) 34 F: Peach (37.4)
36 F: Banana (0.76) 35 F: Plum (0.32) 37 N: Hazelnut (0.018) 35 N: Peanut (37.7)
37 N: Almond (0.69) 36 V: Onion (0.32) 38 C: Oat flour, whole-grain (0.016) 36 F: Nectarine (38.4)
38 N: Flaxseed (0.67) 37 F: Melon (0.31) C: Oat bran (0.015) 37 F: Grapefruit (38.6)
39 L: Common bean (0.67) 38 N: Peanut (0.31) 39 F: Pear (0.014) 38 C: Cornmeal, whole-grain (39.9)
40 F: Kiwifruit (0.63) 39 C: Amaranth, whole-grain (0.30) 40 C: Amaranth, whole-grain (0.014) 39 F: Mandarin orange (40.3)
41 N: Pine nut, dried (0.62) 40 C: Quinoa, whole-grain (0.29) 41 C: Wheat flour, whole-grain (0.014) 40 N: Sesame seed (40.7)
42 F: Watermelon (0.55) 41 L: Common bean (0.28) 42 C: Quinoa, whole-grain (0.014) 41 F: Watermelon (41.0)
43 F: Grapefruit (0.52) 42 V: Lamb’s quarters (0.25) 43 F: Plum (0.012) 42 F: Pineapple (41.3)
44 V: Cucumber, peeled (0.40) 43 F: Blueberry (0.23) 44 F: Nectarine (0.012) 43 V: Onion (41.4)
45 L: Soybean seed (0.40) 44 N: Flaxseed (0.21) 45 F: Blueberry (0.011) 44 F: Cranberry (43.1)
46 C: Amaranth, whole-grain (0.37) 45 L: Soybean seed (0.19) 46 F: Peach (0.011) 45 F: Plum (44.0)
47 F: Cranberry (0.32) 46 N: Walnut (0.17) 47 N: Walnut (0.010) 46 F: Banana (44.9)
48 F: Pear (0.32) 47 N: Hazelnut (0.14) 48 F: Watermelon (0.009) 47 F: Blueberry (46.1)
49 V: Onion (0.31) 48 F: Apple with skin (0.13) 49 C: Cornmeal, whole-grain (0.007) 48 N: Brazil nut, dried (47.4)
50 N: Hazelnut (0.28) 49 C: Cornmeal, whole-grain (0.12) 50 F: Apple with skin (0.006) 49 N: Almond (47.9)
C: Oat bran (0.28) 50 N: Pecan nut (0.12) C: Maize bran (0.006) 50 N: Hazelnut (49.1)
51 C: Oat flour, whole-grain (0.27) 51 F: Pear (0.10) 51 N: Almond (0.005) 51 N: Pine nut, dried (49.9)
52 F: Grape (0.26) 52 F: Grape (0.07) 52 N: Pine nut, dried (0.005) 52 F: Pear (50.9)
53 F: Apple with skin (0.19) 53 N: Almond (0.06) 53 N: Brazil nut, dried (0.003) 53 N: Walnut (51.1)
54 N: Pecan nut (0.17) 54 N: Sesame seed (0.05) 54 F: Cranberry (0.003) 54 N: Pecan nut (54.6)
55 N: Walnut (0.12) 55 N: Pine nut, dried (0.04) 55 N: Pecan nut (0.003) 55 F: Apple with skin (55.4)
56 N: Brazil nut, dried (0.04) 56 N: Brazil nut, dried (0.03) 56 F: Grape (0.003) 56
Means ±SD4: 1.79 ±2.68 Means ±SD: 0.71 ±0.92 Means ±SD: 0.096 ±0.132
Quartiles5: 0.55-0.98-2.18 Quartiles: 0.24-0.41-0.97 Quartiles: 0.013-0.040-0.097
F: Grape (56.7)
Journal of Food Composition and Analysis Fardet et al.
16
1Means of the seven ranks obtained for each raw PBF based on betaine, choline, methionine, magnesium, niacin, pantothenic acid and folate densities
2V, C, F, N, L and B correspond to the vegetable, cereal, fruit, nuts and seeds, legume and beverage groups, respectively
3Density value are expressed in mg/100 kcal (1 kcal = 4.18 kJ)
4SD: standard deviation
5Quartiles separate 25%, 50% (median) and 75% of the 56 products
Journal of Food Composition and Analysis Fardet et al.
17
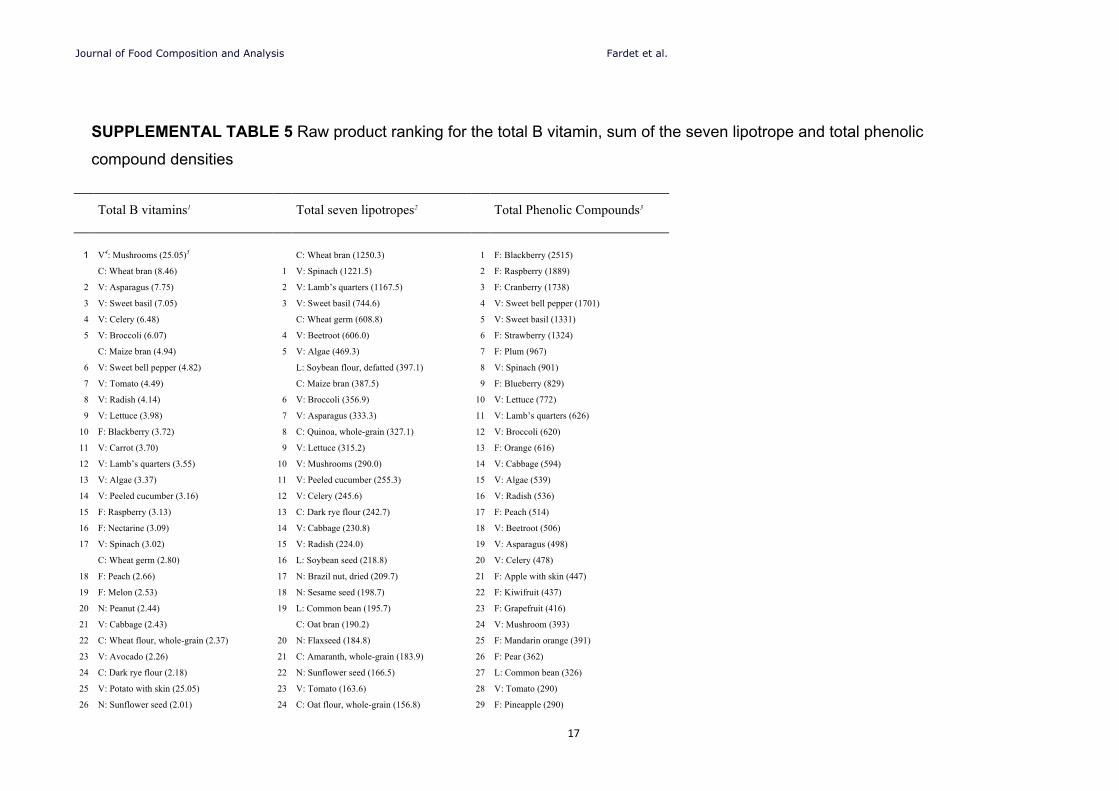
SUPPLEMENTAL TABLE 5 Raw product ranking for the total B vitamin, sum of the seven lipotrope and total phenolic
compound densities
Total B vitamins1 Total seven lipotropes2 Total Phenolic Compounds3
1 V4: Mushrooms (25.05)5 C: Wheat bran (1250.3) 1 F: Blackberry (2515)
C: Wheat bran (8.46) 1 V: Spinach (1221.5) 2 F: Raspberry (1889)
2 V: Asparagus (7.75) 2 V: Lamb’s quarters (1167.5) 3 F: Cranberry (1738)
3 V: Sweet basil (7.05) 3 V: Sweet basil (744.6) 4 V: Sweet bell pepper (1701)
4 V: Celery (6.48) C: Wheat germ (608.8) 5 V: Sweet basil (1331)
5 V: Broccoli (6.07) 4 V: Beetroot (606.0) 6 F: Strawberry (1324)
C: Maize bran (4.94) 5 V: Algae (469.3) 7 F: Plum (967)
6 V: Sweet bell pepper (4.82) L: Soybean flour, defatted (397.1) 8 V: Spinach (901)
7 V: Tomato (4.49) C: Maize bran (387.5) 9 F: Blueberry (829)
8 V: Radish (4.14) 6 V: Broccoli (356.9) 10 V: Lettuce (772)
9 V: Lettuce (3.98) 7 V: Asparagus (333.3) 11 V: Lamb’s quarters (626)
10 F: Blackberry (3.72) 8 C: Quinoa, whole-grain (327.1) 12 V: Broccoli (620)
11 V: Carrot (3.70) 9 V: Lettuce (315.2) 13 F: Orange (616)
12 V: Lamb’s quarters (3.55) 10 V: Mushrooms (290.0) 14 V: Cabbage (594)
13 V: Algae (3.37) 11 V: Peeled cucumber (255.3) 15 V: Algae (539)
14 V: Peeled cucumber (3.16) 12 V: Celery (245.6) 16 V: Radish (536)
15 F: Raspberry (3.13) 13 C: Dark rye flour (242.7) 17 F: Peach (514)
16 F: Nectarine (3.09) 14 V: Cabbage (230.8) 18 V: Beetroot (506)
17 V: Spinach (3.02) 15 V: Radish (224.0) 19 V: Asparagus (498)
C: Wheat germ (2.80) 16 L: Soybean seed (218.8) 20 V: Celery (478)
18 F: Peach (2.66) 17 N: Brazil nut, dried (209.7) 21 F: Apple with skin (447)
19 F: Melon (2.53) 18 N: Sesame seed (198.7) 22 F: Kiwifruit (437)
20 N: Peanut (2.44) 19 L: Common bean (195.7) 23 F: Grapefruit (416)
21 V: Cabbage (2.43) C: Oat bran (190.2) 24 V: Mushroom (393)
22 C: Wheat flour, whole-grain (2.37) 20 N: Flaxseed (184.8) 25 F: Mandarin orange (391)
23 V: Avocado (2.26) 21 C: Amaranth, whole-grain (183.9) 26 F: Pear (362)
24 C: Dark rye flour (2.18) 22 N: Sunflower seed (166.5) 27 L: Common bean (326)
25 V: Potato with skin (25.05) 23 V: Tomato (163.6) 28 V: Tomato (290)
26 N: Sunflower seed (2.01) 24 C: Oat flour, whole-grain (156.8) 29 F: Pineapple (290)

Journal of Food Composition and Analysis Fardet et al.
18
27 F: Strawberry (1.98) 25 V: Sweet bell pepper (147.6) 30 N: Sunflower seed (281)
L: Soybean flour, defatted (1.74) 26 C: Wheat flour, whole-grain (147.4) 31 V: Cucumber, peeled (261)
28 V: Beetroot (1.72) 27 F: Blackberry (133.5) 32 N: Pecan nut (259)
29 F: Orange (1.59) 28 F: Raspberry (125.3) 33 F: Grape (225)
30 F: Mandarin orange (1.45) 29 V: Potato with skin (101.4) 34 N: Walnut (215)
31 F: Pineapple (1.39) 30 C: Cornmeal, whole-grain (97.6) 35 V: Onion (215)
32 F: Plum (1.32) 31 N: Peanut (95.8) 36 F: Banana (176)
33 F: Cranberry (1.27) 32 F: Melon (95.8) 37 F: Melon (174)
34 F: Watermelon (1.25) 33 F: Kiwifruit (91.7) 38 F: Watermelon (160)
35 F: Grapefruit (1.23) 34 F: Strawberry (91.0) 39 F: Nectarine (160)
36 C: Cornmeal, whole-grain (1.19) 35 N: Almond (90.8) 40 V: Carrot (157)
37 F: Banana (1.16) 36 V: Carrot (90.4) 41 L: Soybean seed (124)
38 C: Quinoa, whole-grain (1.12) 37 N: Walnut (86.8) 42 N: Flaxseed (111)
39 L: Common bean (1.11) 38 N: Pine nut, dried (80.7) C: Wheat germ (104)
40 F: Blueberry (1.04) 39 F: Peach (72.3) 43 N: Hazelnut (101)
41 F: Kiwifruit (1.01) 40 V: Onion (71.0) 44 V: Avocado (99)
42 N: Sesame seed (0.98) 41 N: Hazelnut (68.3) C: Wheat bran (97)
43 N: Flaxseed (0.90) 42 F: Orange (64.6) 45 C: Quinoa, whole-grain (94)
44 N: Almond (0.75) 43 F: Watermelon (64.1) L: Soybean flour, defatted (72)
C: Oat bran (0.74) 44 F: Grapefruit (61.8) 46 N: Peanut (69)
45 C: Amaranth, whole-grain (0.69) 45 F: Pineapple (59.6) 47 C: Amaranth, whole-grain (53)
46 V: Onion (0.69) 46 V: Avocado (55.2) 48 N: Almond (52)
47 L: Soybean seed (0.68) 47 F: Nectarine (53.4) 49 N: Brazil nut, dried (42)
48 C: Oat flour, whole-grain (0.67) 48 F: Mandarin orange (52.6) 50 C: Cornmeal, whole-grain (42)
49 N: Pine nut, dried (0.67) 49 F: Banana (52.3) 51 C: Wheat flour, whole-grain (35)
50 N: Hazelnut (0.45) 50 N: Pecan nut (49.6) C: Oat bran (35)
51 F: Pear (0.44) 51 F: Plum (49.5) 52 V: Potato with skin (34)
52 F: Grape (0.33) 52 F: Cranberry (48.3) 53 C: Rye flour, whole-grain (27)
53 F: Apple (0.33) 53 F: Blueberry (46.8) 54 C: Oat flour, whole-grain (23)
54 N: Walnut (0.30) 54 F: Grape (30.3) 55 N: Pine nut, dried (8)
55 N: Pecan nut (0.29) 55 F: Pear (29.8)
56 N: Brazil nut, dried (0.07) 56 F: Apple (20.5)
Means ±SD5: 2.60 ±3.53 Means ±SD: 198.8 ±238.7 Means ±SD: 474 ±526
Quartiles6: 0.96-1.66-3.14 Quartiles: 64.5-113.4-225.7 Quartiles: 117-290-567
1The total B vitamin density is the sum of niacin (vitamin B3), pantothenic acid (vitamin B5) and folates (vitamin B9) densities 2The total seven lipotropes are the sum of betaine, choline, methionine, magnesium and B vitamin densities
Journal of Food Composition and Analysis Fardet et al.
19
3V, C, F, N, L and B correspond to the vegetable, cereal, fruit, nuts and seeds, legume and beverage groups, respectively 4Density value is expressed in mg/100 kcal (1 kcal = 4.18 kJ) 5SD: standard deviation 6Quartiles separate 25%, 50% (median) and 75% of the 56 products
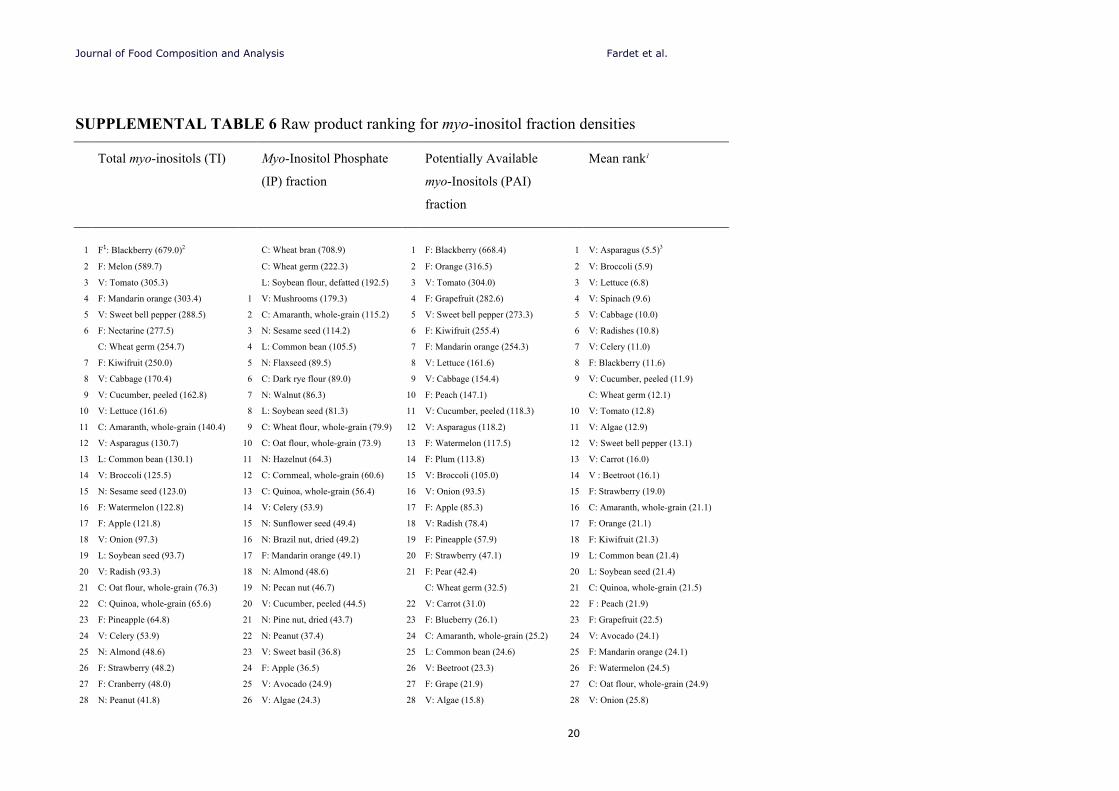
Journal of Food Composition and Analysis Fardet et al.
20
SUPPLEMENTAL TABLE 6 Raw product ranking for myo-inositol fraction densities
Total myo-inositols (TI) Myo-Inositol Phosphate
(IP) fraction
Potentially Available
myo-Inositols (PAI)
fraction
Mean rank1
1 F1: Blackberry (679.0)2
C: Wheat bran (708.9) 1 F: Blackberry (668.4) 1 V: Asparagus (5.5)3
2 F: Melon (589.7) C: Wheat germ (222.3) 2 F: Orange (316.5) 2 V: Broccoli (5.9)
3 V: Tomato (305.3) L: Soybean flour, defatted (192.5) 3 V: Tomato (304.0) 3 V: Lettuce (6.8)
4 F: Mandarin orange (303.4) 1 V: Mushrooms (179.3) 4 F: Grapefruit (282.6) 4 V: Spinach (9.6)
5 V: Sweet bell pepper (288.5) 2 C: Amaranth, whole-grain (115.2) 5 V: Sweet bell pepper (273.3) 5 V: Cabbage (10.0)
6 F: Nectarine (277.5) 3 N: Sesame seed (114.2) 6 F: Kiwifruit (255.4) 6 V: Radishes (10.8)
C: Wheat germ (254.7) 4 L: Common bean (105.5) 7 F: Mandarin orange (254.3) 7 V: Celery (11.0)
7 F: Kiwifruit (250.0) 5 N: Flaxseed (89.5) 8 V: Lettuce (161.6) 8 F: Blackberry (11.6)
8 V: Cabbage (170.4) 6 C: Dark rye flour (89.0) 9 V: Cabbage (154.4) 9 V: Cucumber, peeled (11.9)
9 V: Cucumber, peeled (162.8) 7 N: Walnut (86.3) 10 F: Peach (147.1) C: Wheat germ (12.1)
10 V: Lettuce (161.6) 8 L: Soybean seed (81.3) 11 V: Cucumber, peeled (118.3) 10 V: Tomato (12.8)
11 C: Amaranth, whole-grain (140.4) 9 C: Wheat flour, whole-grain (79.9) 12 V: Asparagus (118.2) 11 V: Algae (12.9)
12 V: Asparagus (130.7) 10 C: Oat flour, whole-grain (73.9) 13 F: Watermelon (117.5) 12 V: Sweet bell pepper (13.1)
13 L: Common bean (130.1) 11 N: Hazelnut (64.3) 14 F: Plum (113.8) 13 V: Carrot (16.0)
14 V: Broccoli (125.5) 12 C: Cornmeal, whole-grain (60.6) 15 V: Broccoli (105.0) 14 V : Beetroot (16.1)
15 N: Sesame seed (123.0) 13 C: Quinoa, whole-grain (56.4) 16 V: Onion (93.5) 15 F: Strawberry (19.0)
16 F: Watermelon (122.8) 14 V: Celery (53.9) 17 F: Apple (85.3) 16 C: Amaranth, whole-grain (21.1)
17 F: Apple (121.8) 15 N: Sunflower seed (49.4) 18 V: Radish (78.4) 17 F: Orange (21.1)
18 V: Onion (97.3) 16 N: Brazil nut, dried (49.2) 19 F: Pineapple (57.9) 18 F: Kiwifruit (21.3)
19 L: Soybean seed (93.7) 17 F: Mandarin orange (49.1) 20 F: Strawberry (47.1) 19 L: Common bean (21.4)
20 V: Radish (93.3) 18 N: Almond (48.6) 21 F: Pear (42.4) 20 L: Soybean seed (21.4)
21 C: Oat flour, whole-grain (76.3) 19 N: Pecan nut (46.7) C: Wheat germ (32.5) 21 C: Quinoa, whole-grain (21.5)
22 C: Quinoa, whole-grain (65.6) 20 V: Cucumber, peeled (44.5) 22 V: Carrot (31.0) 22 F : Peach (21.9)
23 F: Pineapple (64.8) 21 N: Pine nut, dried (43.7) 23 F: Blueberry (26.1) 23 F: Grapefruit (22.5)
24 V: Celery (53.9) 22 N: Peanut (37.4) 24 C: Amaranth, whole-grain (25.2) 24 V: Avocado (24.1)
25 N: Almond (48.6) 23 V: Sweet basil (36.8) 25 L: Common bean (24.6) 25 F: Mandarin orange (24.1)
26 F: Strawberry (48.2) 24 F: Apple (36.5) 26 V: Beetroot (23.3) 26 F: Watermelon (24.5)
27 F: Cranberry (48.0) 25 V: Avocado (24.9) 27 F: Grape (21.9) 27 C: Oat flour, whole-grain (24.9)
28 N: Peanut (41.8) 26 V: Algae (24.3) 28 V: Algae (15.8) 28 V: Onion (25.8)
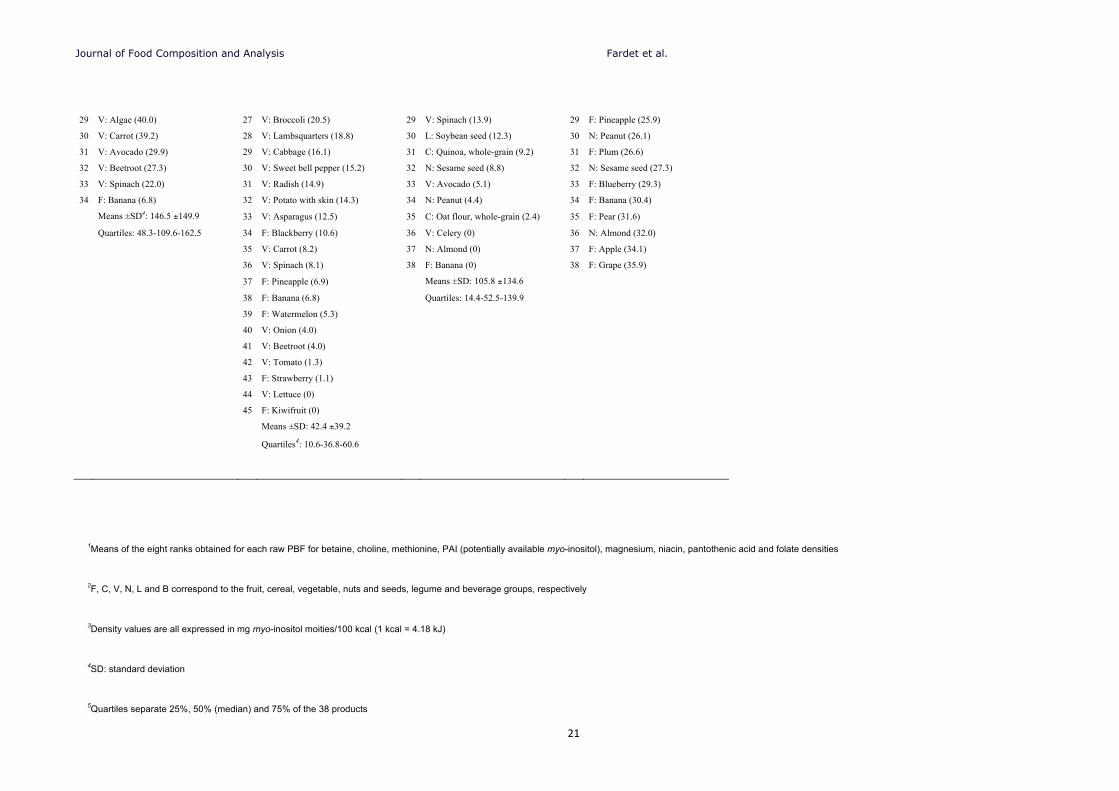
Journal of Food Composition and Analysis Fardet et al.
21
29 V: Algae (40.0) 27 V: Broccoli (20.5) 29 V: Spinach (13.9) 29 F: Pineapple (25.9)
30 V: Carrot (39.2) 28 V: Lambsquarters (18.8) 30 L: Soybean seed (12.3) 30 N: Peanut (26.1)
31 V: Avocado (29.9) 29 V: Cabbage (16.1) 31 C: Quinoa, whole-grain (9.2) 31 F: Plum (26.6)
32 V: Beetroot (27.3) 30 V: Sweet bell pepper (15.2) 32 N: Sesame seed (8.8) 32 N: Sesame seed (27.3)
33 V: Spinach (22.0) 31 V: Radish (14.9) 33 V: Avocado (5.1) 33 F: Blueberry (29.3)
34 F: Banana (6.8) 32 V: Potato with skin (14.3) 34 N: Peanut (4.4) 34 F: Banana (30.4)
Means ±SD4: 146.5 ±149.9 33 V: Asparagus (12.5) 35 C: Oat flour, whole-grain (2.4) 35 F: Pear (31.6)
Quartiles: 48.3-109.6-162.5 34 F: Blackberry (10.6) 36 V: Celery (0) 36 N: Almond (32.0)
35 V: Carrot (8.2) 37 N: Almond (0) 37 F: Apple (34.1)
36 V: Spinach (8.1) 38 F: Banana (0) 38 F: Grape (35.9)
37 F: Pineapple (6.9) Means ±SD: 105.8 ±134.6
38 F: Banana (6.8) Quartiles: 14.4-52.5-139.9
39 F: Watermelon (5.3)
40 V: Onion (4.0)
41 V: Beetroot (4.0)
42 V: Tomato (1.3)
43 F: Strawberry (1.1)
44 V: Lettuce (0)
45 F: Kiwifruit (0)
Means ±SD: 42.4 ±39.2
Quartiles4: 10.6-36.8-60.6
1Means of the eight ranks obtained for each raw PBF for betaine, choline, methionine, PAI (potentially available myo-inositol), magnesium, niacin, pantothenic acid and folate densities
2F, C, V, N, L and B correspond to the fruit, cereal, vegetable, nuts and seeds, legume and beverage groups, respectively
3Density values are all expressed in mg myo-inositol moities/100 kcal (1 kcal = 4.18 kJ)
4SD: standard deviation
5Quartiles separate 25%, 50% (median) and 75% of the 38 products
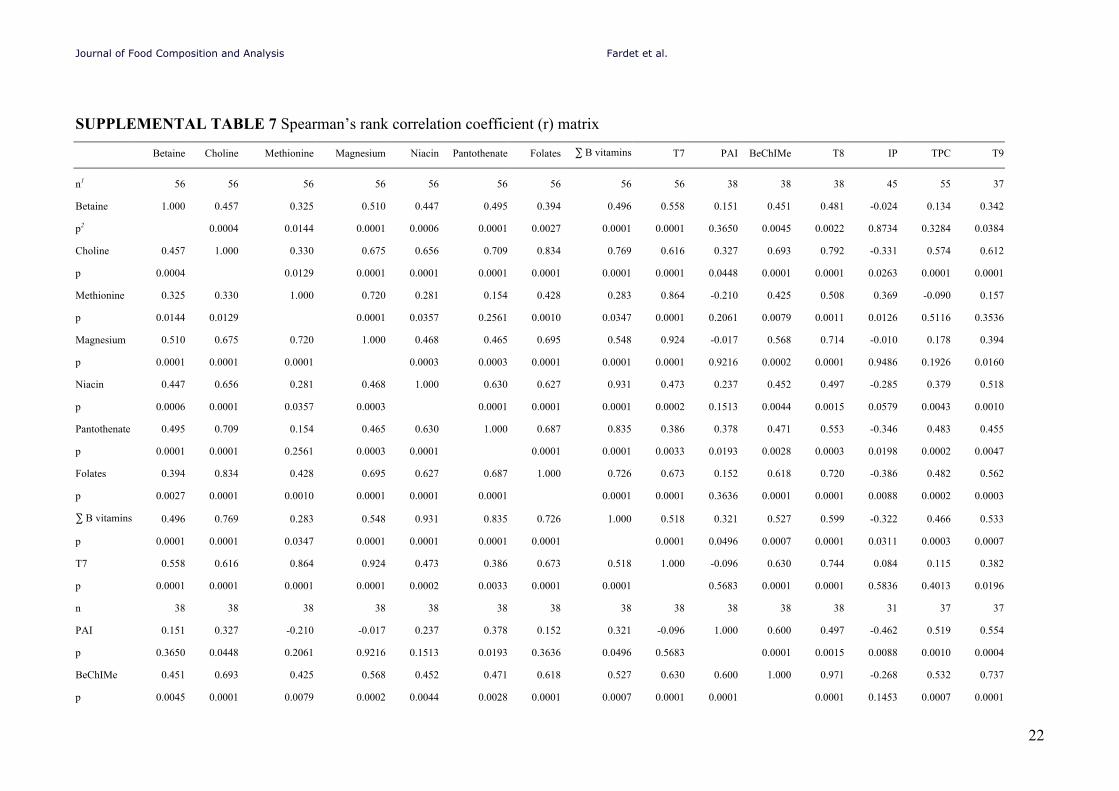
Journal of Food Composition and Analysis Fardet et al.
22
SUPPLEMENTAL TABLE 7 Spearman’s rank correlation coefficient (r) matrix
Betaine Choline Methionine Magnesium Niacin Pantothenate Folates ∑ B vitamins T7 PAI BeChIMe T8 IP TPC T9
n1 56 56 56 56 56 56 56 56 56 38 38 38 45 55 37
Betaine 1.000 0.457 0.325 0.510 0.447 0.495 0.394 0.496 0.558 0.151 0.451 0.481 -0.024 0.134 0.342
p2 0.0004 0.0144 0.0001 0.0006 0.0001 0.0027 0.0001 0.0001 0.3650 0.0045 0.0022 0.8734 0.3284 0.0384
Choline 0.457 1.000 0.330 0.675 0.656 0.709 0.834 0.769 0.616 0.327 0.693 0.792 -0.331 0.574 0.612
p 0.0004 0.0129 0.0001 0.0001 0.0001 0.0001 0.0001 0.0001 0.0448 0.0001 0.0001 0.0263 0.0001 0.0001
Methionine 0.325 0.330 1.000 0.720 0.281 0.154 0.428 0.283 0.864 -0.210 0.425 0.508 0.369 -0.090 0.157
p 0.0144 0.0129 0.0001 0.0357 0.2561 0.0010 0.0347 0.0001 0.2061 0.0079 0.0011 0.0126 0.5116 0.3536
Magnesium 0.510 0.675 0.720 1.000 0.468 0.465 0.695 0.548 0.924 -0.017 0.568 0.714 -0.010 0.178 0.394
p 0.0001 0.0001 0.0001 0.0003 0.0003 0.0001 0.0001 0.0001 0.9216 0.0002 0.0001 0.9486 0.1926 0.0160
Niacin 0.447 0.656 0.281 0.468 1.000 0.630 0.627 0.931 0.473 0.237 0.452 0.497 -0.285 0.379 0.518
p 0.0006 0.0001 0.0357 0.0003 0.0001 0.0001 0.0001 0.0002 0.1513 0.0044 0.0015 0.0579 0.0043 0.0010
Pantothenate 0.495 0.709 0.154 0.465 0.630 1.000 0.687 0.835 0.386 0.378 0.471 0.553 -0.346 0.483 0.455
p 0.0001 0.0001 0.2561 0.0003 0.0001 0.0001 0.0001 0.0033 0.0193 0.0028 0.0003 0.0198 0.0002 0.0047
Folates 0.394 0.834 0.428 0.695 0.627 0.687 1.000 0.726 0.673 0.152 0.618 0.720 -0.386 0.482 0.562
p 0.0027 0.0001 0.0010 0.0001 0.0001 0.0001 0.0001 0.0001 0.3636 0.0001 0.0001 0.0088 0.0002 0.0003
∑ B vitamins 0.496 0.769 0.283 0.548 0.931 0.835 0.726 1.000 0.518 0.321 0.527 0.599 -0.322 0.466 0.533
p 0.0001 0.0001 0.0347 0.0001 0.0001 0.0001 0.0001 0.0001 0.0496 0.0007 0.0001 0.0311 0.0003 0.0007
T7 0.558 0.616 0.864 0.924 0.473 0.386 0.673 0.518 1.000 -0.096 0.630 0.744 0.084 0.115 0.382
p 0.0001 0.0001 0.0001 0.0001 0.0002 0.0033 0.0001 0.0001 0.5683 0.0001 0.0001 0.5836 0.4013 0.0196
n 38 38 38 38 38 38 38 38 38 38 38 38 31 37 37
PAI 0.151 0.327 -0.210 -0.017 0.237 0.378 0.152 0.321 -0.096 1.000 0.600 0.497 -0.462 0.519 0.554
p 0.3650 0.0448 0.2061 0.9216 0.1513 0.0193 0.3636 0.0496 0.5683 0.0001 0.0015 0.0088 0.0010 0.0004
BeChIMe 0.451 0.693 0.425 0.568 0.452 0.471 0.618 0.527 0.630 0.600 1.000 0.971 -0.268 0.532 0.737
p 0.0045 0.0001 0.0079 0.0002 0.0044 0.0028 0.0001 0.0007 0.0001 0.0001 0.0001 0.1453 0.0007 0.0001
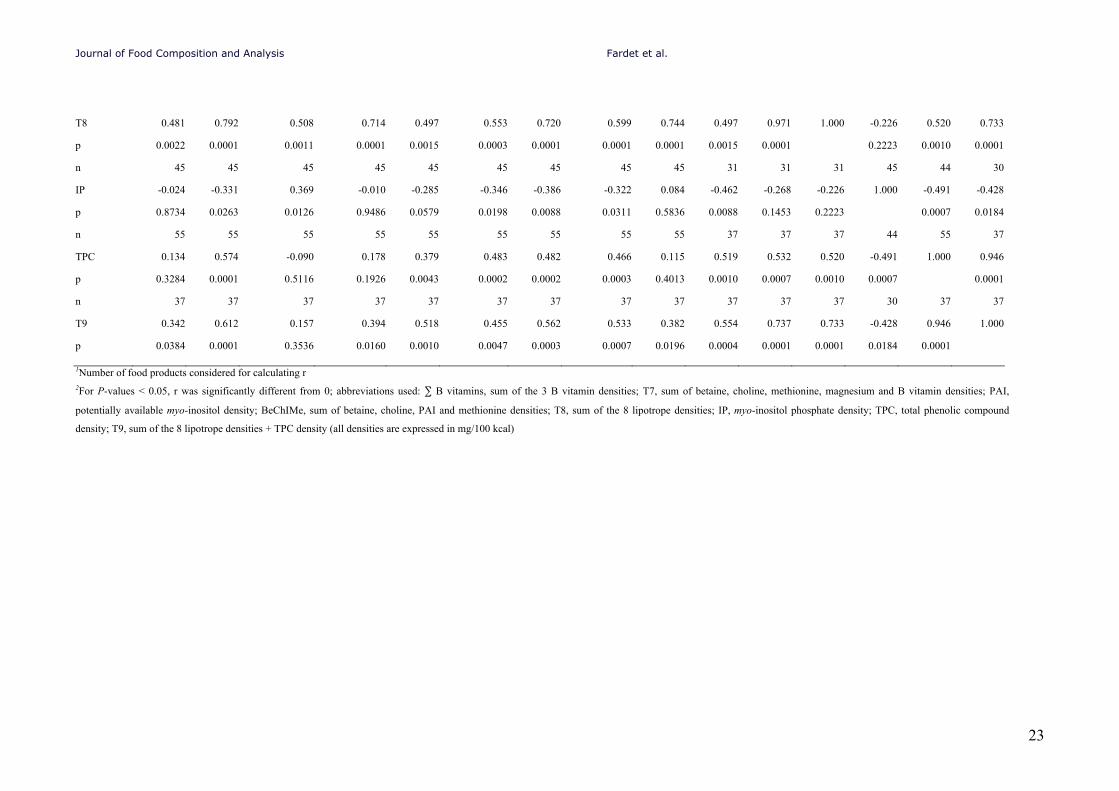
Journal of Food Composition and Analysis Fardet et al.
23
T8 0.481 0.792 0.508 0.714 0.497 0.553 0.720 0.599 0.744 0.497 0.971 1.000 -0.226 0.520 0.733
p 0.0022 0.0001 0.0011 0.0001 0.0015 0.0003 0.0001 0.0001 0.0001 0.0015 0.0001 0.2223 0.0010 0.0001
n 45 45 45 45 45 45 45 45 45 31 31 31 45 44 30
IP -0.024 -0.331 0.369 -0.010 -0.285 -0.346 -0.386 -0.322 0.084 -0.462 -0.268 -0.226 1.000 -0.491 -0.428
p 0.8734 0.0263 0.0126 0.9486 0.0579 0.0198 0.0088 0.0311 0.5836 0.0088 0.1453 0.2223 0.0007 0.0184
n 55 55 55 55 55 55 55 55 55 37 37 37 44 55 37
TPC 0.134 0.574 -0.090 0.178 0.379 0.483 0.482 0.466 0.115 0.519 0.532 0.520 -0.491 1.000 0.946
p 0.3284 0.0001 0.5116 0.1926 0.0043 0.0002 0.0002 0.0003 0.4013 0.0010 0.0007 0.0010 0.0007 0.0001
n 37 37 37 37 37 37 37 37 37 37 37 37 30 37 37
T9 0.342 0.612 0.157 0.394 0.518 0.455 0.562 0.533 0.382 0.554 0.737 0.733 -0.428 0.946 1.000
p 0.0384 0.0001 0.3536 0.0160 0.0010 0.0047 0.0003 0.0007 0.0196 0.0004 0.0001 0.0001 0.0184 0.0001
1Number of food products considered for calculating r 2For P-values < 0.05, r was significantly different from 0; abbreviations used: ∑ B vitamins, sum of the 3 B vitamin densities; T7, sum of betaine, choline, methionine, magnesium and B vitamin densities; PAI,
potentially available myo-inositol density; BeChIMe, sum of betaine, choline, PAI and methionine densities; T8, sum of the 8 lipotrope densities; IP, myo-inositol phosphate density; TPC, total phenolic compound
density; T9, sum of the 8 lipotrope densities + TPC density (all densities are expressed in mg/100 kcal)
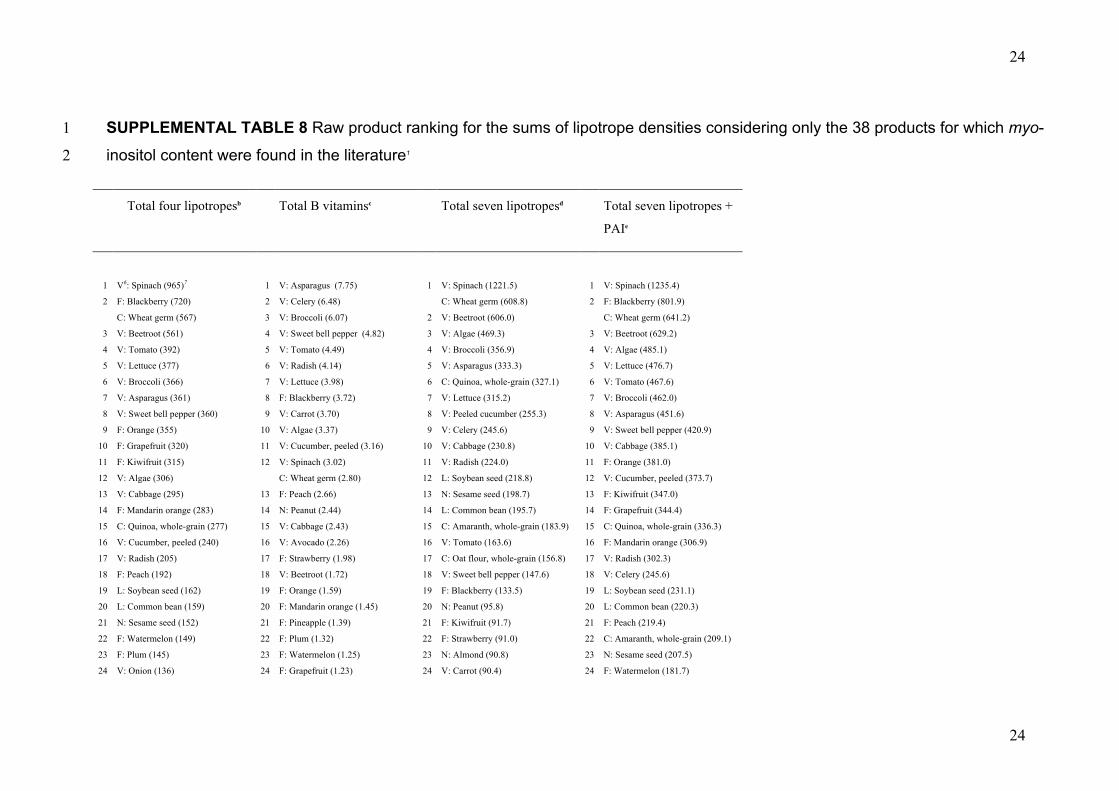
24
24
SUPPLEMENTAL TABLE 8 Raw product ranking for the sums of lipotrope densities considering only the 38 products for which myo-1
inositol content were found in the literature1 2
Total four lipotropesb
Total B vitaminsc
Total seven lipotropesd
Total seven lipotropes +
PAIe
1 V6: Spinach (965)7 1 V: Asparagus (7.75) 1 V: Spinach (1221.5) 1 V: Spinach (1235.4)
2 F: Blackberry (720) 2 V: Celery (6.48) C: Wheat germ (608.8) 2 F: Blackberry (801.9)
C: Wheat germ (567) 3 V: Broccoli (6.07) 2 V: Beetroot (606.0) C: Wheat germ (641.2)
3 V: Beetroot (561) 4 V: Sweet bell pepper (4.82) 3 V: Algae (469.3) 3 V: Beetroot (629.2)
4 V: Tomato (392) 5 V: Tomato (4.49) 4 V: Broccoli (356.9) 4 V: Algae (485.1)
5 V: Lettuce (377) 6 V: Radish (4.14) 5 V: Asparagus (333.3) 5 V: Lettuce (476.7)
6 V: Broccoli (366) 7 V: Lettuce (3.98) 6 C: Quinoa, whole-grain (327.1) 6 V: Tomato (467.6)
7 V: Asparagus (361) 8 F: Blackberry (3.72) 7 V: Lettuce (315.2) 7 V: Broccoli (462.0)
8 V: Sweet bell pepper (360) 9 V: Carrot (3.70) 8 V: Peeled cucumber (255.3) 8 V: Asparagus (451.6)
9 F: Orange (355) 10 V: Algae (3.37) 9 V: Celery (245.6) 9 V: Sweet bell pepper (420.9)
10 F: Grapefruit (320) 11 V: Cucumber, peeled (3.16) 10 V: Cabbage (230.8) 10 V: Cabbage (385.1)
11 F: Kiwifruit (315) 12 V: Spinach (3.02) 11 V: Radish (224.0) 11 F: Orange (381.0)
12 V: Algae (306) C: Wheat germ (2.80) 12 L: Soybean seed (218.8) 12 V: Cucumber, peeled (373.7)
13 V: Cabbage (295) 13 F: Peach (2.66) 13 N: Sesame seed (198.7) 13 F: Kiwifruit (347.0)
14 F: Mandarin orange (283) 14 N: Peanut (2.44) 14 L: Common bean (195.7) 14 F: Grapefruit (344.4)
15 C: Quinoa, whole-grain (277) 15 V: Cabbage (2.43) 15 C: Amaranth, whole-grain (183.9) 15 C: Quinoa, whole-grain (336.3)
16 V: Cucumber, peeled (240) 16 V: Avocado (2.26) 16 V: Tomato (163.6) 16 F: Mandarin orange (306.9)
17 V: Radish (205) 17 F: Strawberry (1.98) 17 C: Oat flour, whole-grain (156.8) 17 V: Radish (302.3)
18 F: Peach (192) 18 V: Beetroot (1.72) 18 V: Sweet bell pepper (147.6) 18 V: Celery (245.6)
19 L: Soybean seed (162) 19 F: Orange (1.59) 19 F: Blackberry (133.5) 19 L: Soybean seed (231.1)
20 L: Common bean (159) 20 F: Mandarin orange (1.45) 20 N: Peanut (95.8) 20 L: Common bean (220.3)
21 N: Sesame seed (152) 21 F: Pineapple (1.39) 21 F: Kiwifruit (91.7) 21 F: Peach (219.4)
22 F: Watermelon (149) 22 F: Plum (1.32) 22 F: Strawberry (91.0) 22 C: Amaranth, whole-grain (209.1)
23 F: Plum (145) 23 F: Watermelon (1.25) 23 N: Almond (90.8) 23 N: Sesame seed (207.5)
24 V: Onion (136) 24 F: Grapefruit (1.23) 24 V: Carrot (90.4) 24 F: Watermelon (181.7)
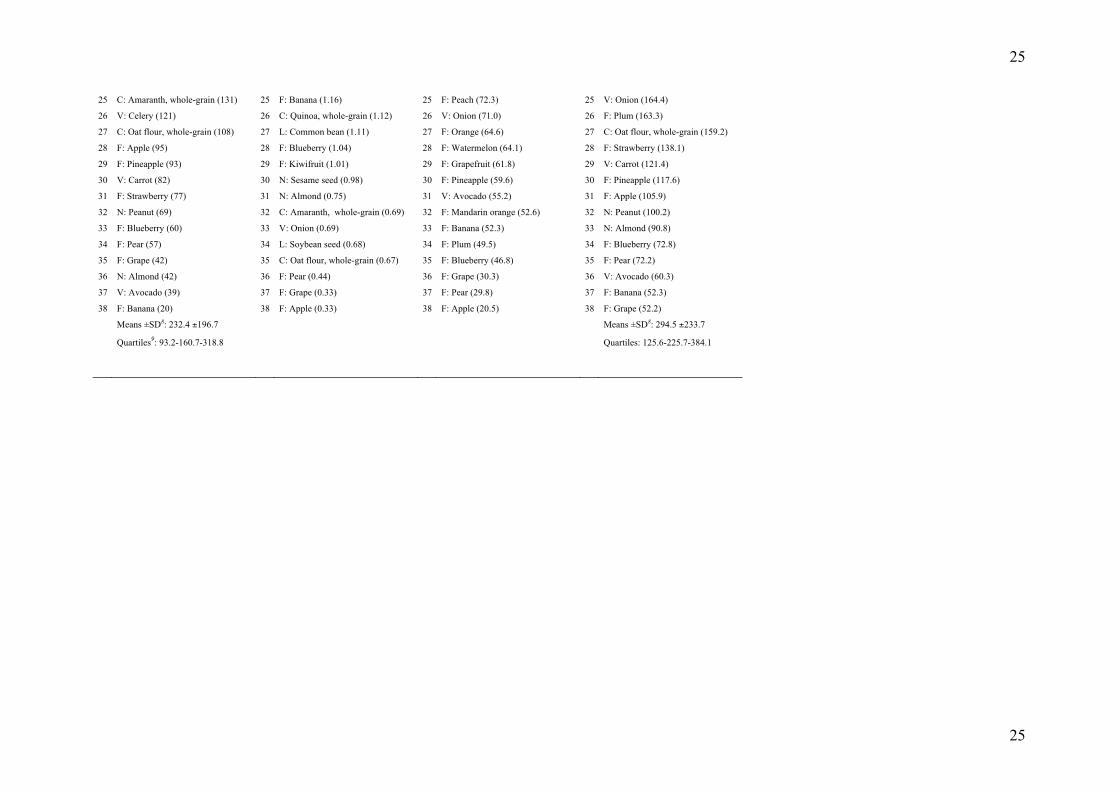
25
25
25 C: Amaranth, whole-grain (131) 25 F: Banana (1.16) 25 F: Peach (72.3) 25 V: Onion (164.4)
26 V: Celery (121) 26 C: Quinoa, whole-grain (1.12) 26 V: Onion (71.0) 26 F: Plum (163.3)
27 C: Oat flour, whole-grain (108) 27 L: Common bean (1.11) 27 F: Orange (64.6) 27 C: Oat flour, whole-grain (159.2)
28 F: Apple (95) 28 F: Blueberry (1.04) 28 F: Watermelon (64.1) 28 F: Strawberry (138.1)
29 F: Pineapple (93) 29 F: Kiwifruit (1.01) 29 F: Grapefruit (61.8) 29 V: Carrot (121.4)
30 V: Carrot (82) 30 N: Sesame seed (0.98) 30 F: Pineapple (59.6) 30 F: Pineapple (117.6)
31 F: Strawberry (77) 31 N: Almond (0.75) 31 V: Avocado (55.2) 31 F: Apple (105.9)
32 N: Peanut (69) 32 C: Amaranth, whole-grain (0.69) 32 F: Mandarin orange (52.6) 32 N: Peanut (100.2)
33 F: Blueberry (60) 33 V: Onion (0.69) 33 F: Banana (52.3) 33 N: Almond (90.8)
34 F: Pear (57) 34 L: Soybean seed (0.68) 34 F: Plum (49.5) 34 F: Blueberry (72.8)
35 F: Grape (42) 35 C: Oat flour, whole-grain (0.67) 35 F: Blueberry (46.8) 35 F: Pear (72.2)
36 N: Almond (42) 36 F: Pear (0.44) 36 F: Grape (30.3) 36 V: Avocado (60.3)
37 V: Avocado (39) 37 F: Grape (0.33) 37 F: Pear (29.8) 37 F: Banana (52.3)
38 F: Banana (20) 38 F: Apple (0.33) 38 F: Apple (20.5) 38 F: Grape (52.2)
Means ±SD8: 232.4 ±196.7 Means ±SD8: 294.5 ±233.7
Quartiles9: 93.2-160.7-318.8 Quartiles: 125.6-225.7-384.1
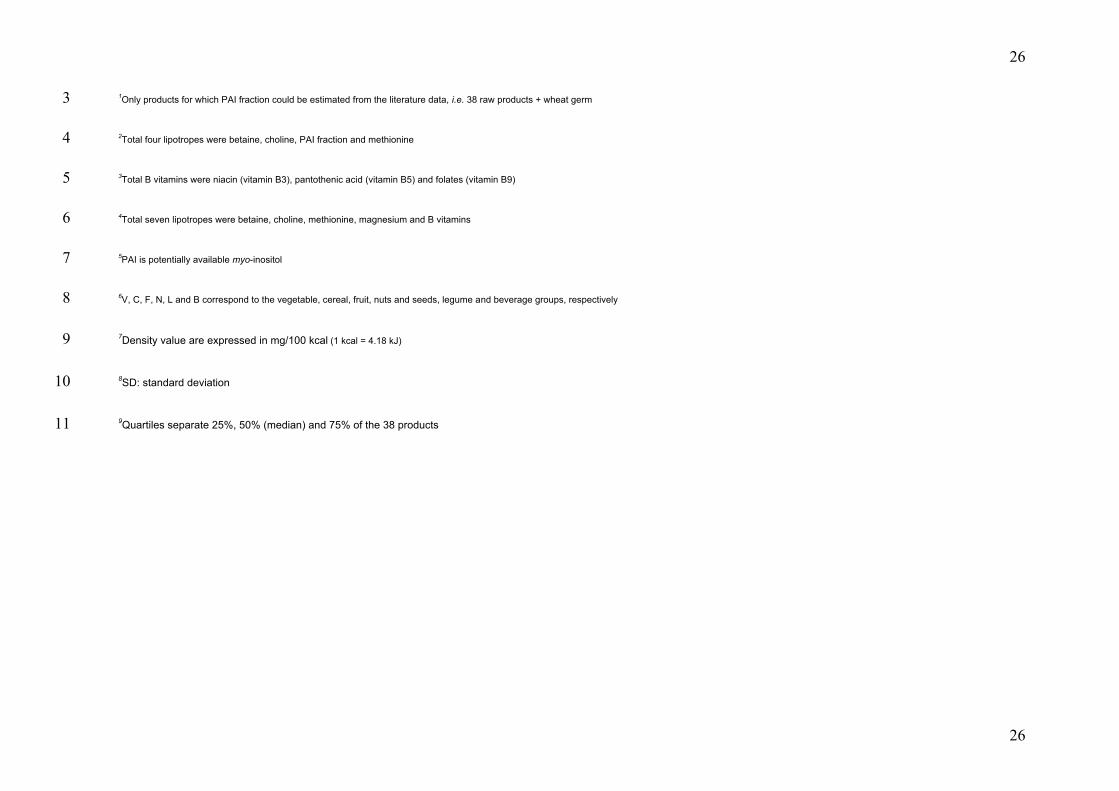
26
26
1Only products for which PAI fraction could be estimated from the literature data, i.e. 38 raw products + wheat germ 3
2Total four lipotropes were betaine, choline, PAI fraction and methionine 4
3Total B vitamins were niacin (vitamin B3), pantothenic acid (vitamin B5) and folates (vitamin B9) 5
4Total seven lipotropes were betaine, choline, methionine, magnesium and B vitamins 6
5PAI is potentially available myo-inositol 7
6V, C, F, N, L and B correspond to the vegetable, cereal, fruit, nuts and seeds, legume and beverage groups, respectively 8
7Density value are expressed in mg/100 kcal (1 kcal = 4.18 kJ) 9
8SD: standard deviation 10
9Quartiles separate 25%, 50% (median) and 75% of the 38 products 11
Journal of Food Composition and Analysis Fardet et al.
1
Supplementary Material 2
References used to collect data about water, proteins, lipids, available carbohydrates, ethanol,
betaine, choline, myo-inositol (and derived compounds), methionine, magnesium, niacin,
pantothenic acid, folates, total phenolic compounds, organic acid and polyol contents of plant-based
foods
1.1 Water, proteins, lipids, available carbohydrates, ethanol, magnesium and folates
(U.S. Department of Agriculture, 2005)
1.2 Organic acids
(Afssa, 2008; Colaric et al., 2006; Cortacero-Ramirez et al., 2005; Galli and Barbas, 2004; Gillooly
et al., 1983; Gokmen et al., 2001; Gonzalez-Castro et al., 1997; Hamauzu et al., 2008; Herrmann,
1974; Kelebek et al., 2009; Klampfl, 1999; Mato et al., 2007; Peres et al., 2009; Picha, 1985;
Rodrigues et al., 2007; Souci et al., 2008; Vérette et al., 1995; Wei and Gregory, 1998)
1.3 Polyols
(Caputi et al., 1992; Makinen and Soderling, 1980; Niculescu et al., 2003; Shindou et al., 1989;
Souci et al., 2008; Vérette et al., 1995; West et al., 1992; Wrolstad and Shallenberger, 1981;
Yanniotis et al., 2007; Zubia et al., 2008)
1.4 Betaine
(De Zwart et al., 2003; Likes et al., 2007; Sakamoto et al., 2002; Slow et al., 2005; U.S. Department
of Agriculture et al., 2008; Zeisel et al., 2003)
Journal of Food Composition and Analysis Fardet et al.
2
1.5 Choline
(Dasilva and Jensen, 1973; Horowitz and Beadle, 1943; Ikawa et al., 1968; Koziol, 1992; Likes et
al., 2007; Souci et al., 2008; U.S. Department of Agriculture et al., 2008; Zeisel et al., 2003)
1.6 Myo-inositol and derived compounds
(Adeyeye et al., 2000; Adeyeye and Fagbohun, 2005; Aletor et al., 2007; Aletor, 1995; Al-Wahsh et
al., 2005; Amrein et al., 2003; Atukorala and Waidyanatha, 1987; Becker et al., 1981; Beleia et al.,
1990; Bhatty and Cherdkiatgumchai, 1990; Bieleski et al., 1997; Bressani et al., 2002; Calhoun et
al., 1958; Calhoun et al., 1960; Camire and Clydesdale, 1982; Carlavilla et al., 2006; Cataldi et al.,
1998; Chan et al., 2007; Chen, 2004; Clements and Darnell, 1980; Darbre and Norris, 1956; De
Oliveira et al., 2009; Diaz-Batalla et al., 2006; Ekanem and Ubengama, 2002; Febles et al., 2002;
Ferguson et al., 1993; Fredlund et al., 1997; Gao et al., 2007; Garcia-Estepa et al., 1999; García-
Estepa et al., 1999; Greiner et al., 2001; Haraldsson et al., 2004; Harland and Frolich, 1989;
Harland and Oberleas, 1987; Harland et al., 2004; Helfrich and Bettmer, 2004; Hooda and Jood,
2003; Horbowicz and Obendorf, 1994; Ikawa et al., 1968; Isiguro et al., 2005; Jährig et al., 2000;
Kirby and Nelson, 1988; Koziol, 1992; Le Francois, 1988; Lee, 1990; Lehrfeld, 2002; Lestienne et
al., 2005; Liu and Chang, 2004; Lolas et al., 1976; Lorenz and Wright, 1984; Lott et al., 2000; Ma
et al., 2005; Macfarlane et al., 1988; Mameesh and Tomar, 1993; Masuda et al., 2003; Matsunaga et
al., 1989; Mckenzie, 1984; Mckenzie-Parnell and Guthrie, 1986; Michalska et al., 2007; Morris and
Hill, 1995; Morris and Hill, 1996; Nayini and Markakis, 1983; Ola and Oboh, 2001; Olguin et al.,
2003; Oomah et al., 1996; Oyetayo and Akindahunsi, 2004; Pattee et al., 2000; Phillippy et al.,
2003; Phillippy et al., 1988; Phillippy and Wyatt, 2001; Plaami and Kumpulainen, 1995; Pradeep et
al., 1993; Proskova, 1998; Ramirez-Cardenas et al., 2008; Ravindran et al., 1994; Repo-Carrasco-
Valencia et al., 2009; Sanz et al., 2004; Schweizer et al., 1978; Scriban, 1970; Seifert, 1972;
Simonet et al., 2003; Somsub et al., 2008; Soria et al., 2009; Sosulski et al., 1982; Souci et al.,
2008; Sponholz and Dittrich, 1985; Steadman et al., 2000; Tahmida Begum and Anisur Rahman
Journal of Food Composition and Analysis Fardet et al.
3
Khan, 1998; Thompson and Erdman Jr., 1982; Toda et al., 2006; Trugo et al., 1999; Udosen and
Ukpanah, 1993; Umeta et al., 2005; Valencia et al., 1999; Venkatachalam and Sathe, 2006; Vitali et
al., 2008; Yadav and Sehgal, 2003)
1.7 Methionine
(Barrado et al., 2009; Hernandez-Orte et al., 2003; Livingston et al., 1976; Soufleros et al., 2003;
U.S. Department of Agriculture, 2005)
1.8 Niacin
(Souci et al., 2008; U.S. Department of Agriculture, 2005)
1.9 Pantothenic acid
(Afssa, 2008; U.S. Department of Agriculture, 2005)
1.10 Total phenolic compounds
(Cheung et al., 2003; Chludil et al., 2008; Choi et al., 2007; Choi et al., 2006; De La Parra et al.,
2007; Devi et al., 2008; Dewanto et al., 2002; García-Casal et al., 2009; Heimler et al., 2006; Iwai,
2008; Jiratanan and Liu, 2004; Kahkonen et al., 1999; Maillard et al., 1996; Neveu et al., 2010;
Ninfali et al., 2005; Pasko et al., 2009; Perez-Jimenez and Saura-Calixto, 2005; Podsedek et al.,
2006; Puupponen-Pimiä et al., 2003; Ramírez-Anguiano et al., 2007; Repo-Carrasco-Valencia et al.,
2009; Reyes and Cisneros-Zevallos, 2003; Shiroma-Kian et al., 2008; Sikora et al., 2008; Slavin et
al., 2009; Sommer et al., 2009; Sun et al., 2009; Turkmen et al., 2005; Velioglu et al., 1998; Verma
et al., 2008; Vivar-Quintana et al., 1999; Wu et al., 2004; Xu and Chang, 2008a, b, c, 2009; Xu and
Chang, 2008d; Yu and Zhou, 2004; Yu et al., 2003; Zielinski et al., 2009)
Journal of Food Composition and Analysis Fardet et al.
4
Reference
Adeyeye, E. I., Arogundade, L. A., Akintayo, E. T., Aisida, O. A., Alao, P. A., 2000. Calcium, zinc
and phytate interrelationships in some foods of major consumption in Nigeria. Food Chemistry
71, 435-441.
Adeyeye, E. I., Fagbohun, E. D., 2005. Proximate, mineral and phytate profiles of some selected
spices found in Nigeria. Pakistan Journal of Scientific and Industrial Research 48, 14-22.
Afssa, Centre d’information sur la qualité des aliments, 2008. Table CIQUAL. Composition
nutritionnelle des aliments. Retrieved 2009-2010 from: http://www.afssa.fr/TableCIQUAL/
Aletor, O., Agbede, J. O., Adeyeye, S. A., Aletor, V. A., 2007. Chemical and physio-chemical
characterization of the flours and oils from whole and rejected cashew nuts cultivated in
Southwest Nigeria. Pakistan Journal of Nutrition 6, 89-93.
Aletor, V. A., 1995. Compositional studies on edible tropical species of mushrooms. Food
Chemistry 54, 265-268.
Al-Wahsh, I. A., Horner, H. T., Palmer, R. G., Reddy, M. B., Massey, L. K., 2005. Oxalate and
phytate of soy foods. Journal of Agricultural and Food Chemistry 53, 5670-5674.
Amrein, T. M., Granicher, P., Arrigoni, E., Amado, R., 2003. In vitro digestibility and colonic
fermentability of aleurone isolated from wheat bran. Lebensmittel-Wissenschaft Und-
Technologie-Food Science and Technology 36, 451-460.
Atukorala, T. M. S., Waidyanatha, U. S. D. S., 1987. Zinc and copper content of some common
foods. Journal of the National Science Council of Sri Lanka 15, 61-69.
Barrado, E., Rodriguez, J. A., Castrillejo, Y., 2009. Determination of primary amino acids in wines
by high performance liquid magneto-chromatography. Talanta 78, 672-675.
Becker, R., Wheeler, E. L., Lorenz, K., Stafford, A. E., Grosjean, O. K., Betschart, A. A., Saunders,
R. M., 1981. A compositional study of amaranth grain. Journal of Food Science 46, 1175-1180.
Beleia, A., Ida, E. I., Lethi, T. T., 1990. Phosphorus and phytic acid distribution during soy milk
processing. Arquivos de Biologia E Tecnologia 33, 623-629.
Journal of Food Composition and Analysis Fardet et al.
5
Bhatty, R., Cherdkiatgumchai, P., 1990. Compositional analysis of laboratory-prepared and
commercial samples of linseed meal and of hull isolated from flax. Journal of the American Oil
Chemists' Society 67, 79-84.
Bieleski, R. L., Clark, C. J., Klages, K. U., 1997. Identification of myo-inositol as a major
carbohydrate in kiwifruit, Actinidia deliciosa. Phytochemistry 46, 51-55.
Bressani, R., Turcios, J. C., de Ruiz, A. S. C., 2002. Nixtamalization effects on the contents of
phytic acid, calcium, iron and zinc in the whole grain, endosperm and germ of maize. Food
Science and Technology International 8, 81-86.
Calhoun, W. K., Bechtel, W. G., Bradley, W. B., 1958. The vitamin content of wheat, flour, and
bread. Cereal Chemistry 35, 350-359.
Calhoun, W. K., Hepburn, F. N., Bradley, W. B., 1960. The distribution of the vitamins of wheat in
commercial mill products. Cereal Chemistry 37, 755 - 761.
Camire, A. L., Clydesdale, F. M., 1982. Analysis of phytic acid in foods by HPLC. Journal of Food
Science 47, 575-578.
Caputi, A., Christensen, E., Biedenweg, N., Miller, S., 1992. Liquid-chromatographic method for
determination of glycerol in wine and grape juice - Collaborative study. Journal of AOAC
International 75, 379-383.
Carlavilla, D., Villamiel, M., Martinez-Castro, I., Moreno-Arribas, M. V., 2006. Occurrence and
significance of quercitol and other inositols in wines during oak wood aging. American
Journal of Enology and Viticulture 57, 468-473.
Cataldi, T. R. I., Margiotta, G., Zambonin, C. G., 1998. Determination of sugars and alditols in food
samples by HPAEC with integrated pulsed amperometric detection using alkaline eluents
containing barium or strontium ions. Food Chemistry 62, 109-115.
Chan, S. S. L., Ferguson, E. L., Bailey, K., Fahmida, U., Harper, T. B., Gibson, R. S., 2007. The
concentrations of iron, calcium, zinc and phytate in cereals and legumes habitually consumed by
Journal of Food Composition and Analysis Fardet et al.
6
infants living in East Lombok, Indonesia. Journal of Food Composition and Analysis 20, 609-
617.
Chen, Q., 2004. Determination of pytic acid and inositol pentakisphosphates in foods by high-
performance ion chromatography. Journal of Agricultural and Food Chemistry 52, 4604-4613.
Cheung, L. M., Cheung, P. C. K., Ooi, V. E. C., 2003. Antioxidant activity and total phenolics of
edible mushroom extracts. Food Chemistry 81, 249-255.
Chludil, H. D., Corbino, G. B., Leicach, S. R., 2008. Soil quality effects on chenopodium album
flavonoid content and antioxidant potential. Journal of Agricultural and Food Chemistry 56,
5050-5056.
Choi, Y., Jeong, H. S., Lee, J., 2007. Antioxidant activity of methanolic extracts from some grains
consumed in Korea. Food Chemistry 103, 130-138.
Choi, Y., Lee, S. M., Chun, J., Lee, H. B., Lee, J., 2006. Influence of heat treatment on the
antioxidant activities and polyphenolic compounds of Shiitake (Lentinus edodes) mushroom.
Food Chemistry 99, 381-387.
Clements, R., Jr, Darnell, B., 1980. Myo-inositol content of common foods: development of a high-
myo- inositol diet. American Journal of Clinical Nutrition 33, 1954-1967.
Colaric, M., Stampar, F., Solar, A., Hudina, M., 2006. Influence of branch bending on sugar,
organic acid and phenolic content in fruits of 'Williams' pears (Pyrus communis L.). Journal of
the Science of Food and Agriculture 86, 2463-2467.
Cortacero-Ramirez, S., Segura-Carretero, A., de Castro, M. H. B., Fernandez-Gutierrez, A., 2005.
Determination of low-molecular-mass organic acids in any type of beer samples by
coelectroosmotic capillary electrophoresis. Journal of Chromatography A 1064, 115-119.
Darbre, A., Norris, F. W., 1956. Vitamins in germination - Determination of free and combined
inositol in germinating oats. Biochemical Journal 64, 441-446.
DaSilva, E., Jensen, A., 1973. Benthic marine and blue-green algal species as a source of choline.
Journal of the Science of Food and Agriculture 24, 855-861.
Journal of Food Composition and Analysis Fardet et al.
7
de la Parra, C., Serna Saldivar, S. O., Rui Hai, L., 2007. Effect of processing on the phytochemical
profiles and antioxidant activity of corn for production of masa, tortillas, and tortilla chips.
Journal of Agricultural and Food Chemistry 55, 4177-4183.
de Oliveira, M. N., Freitas, A. L. P., Carvalho, A. F. U., Sampaio, T. M. T., Farias, D. F., Alves
Teixeira, D. I., Gouveia, S. T., Pereira, J. G., Sena, M. M. d. C. C. d., 2009. Nutritive and non-
nutritive attributes of washed-up seaweeds from the coast of Ceará, Brazil. Food Chemistry 115,
254-259.
de Zwart, F. J., Slow, S., Payne, R. J., Lever, M., George, P. M., Gerrard, J. A., Chambers, S. T.,
2003. Glycine betaine and glycine betaine analogues in common foods. Food Chemistry 83,
197-204.
Devi, K. P., Suganthy, N., Kesika, P., Pandian, S. K., 2008. Bioprotective properties of seaweeds:
In vitro evaluation of antioxidant activity and antimicrobial activity against food borne bacteria
in relation to polyphenolic content. BMC Complementary and Alternative Medicine 8,
Dewanto, V., Wu, X., Liu, R. H., 2002. Processed sweet corn has higher antioxidant activity.
Journal of Agricultural and Food Chemistry 50, 4959-4964.
Diaz-Batalla, L., Widholm, J. M., Fahey, G. C., Castano-Tostado, E., Paredes-Lopez, O., 2006.
Chemical components with health implications in wild and cultivated Mexican common bean
seeds (Phaseolus vulgaris L.). Journal of Agricultural and Food Chemistry 54, 2045-2052.
Ekanem, E. O., Ubengama, V. S., 2002. Chemical composition, anti-nutritional factors and shelf-
life of oyster mushroom (Pleurotus ostreatus). Journal of Food Science and Technology-
Mysore 39, 635-638.
Febles, C. I., Arias, A., Hardisson, A., Rodriquez-Alvarez, C., Sierra, A., 2002. Phytic acid level in
wheat flours. Journal of Cereal Science 36, 19-23.
Ferguson, E. L., Gibson, R. S., Opare-Obisaw, C., Osei-Opare, F., Stephen, A. M., Lehrfeld, J.,
Thompson, L. U., 1993. The Zinc, calcium, copper, manganese, nonstarch polysaccharide and
Journal of Food Composition and Analysis Fardet et al.
8
phytate content of seventy-eight locally grown and prepared African foods. Journal of Food
Composition and Analysis 6, 87-99.
Fredlund, K., Asp, N. G., Larsson, M., Marklinder, I., Sandberg, A. S., 1997. Phytate reduction in
whole grains of wheat, rye, barley and oats after hydrothermal treatment. Journal of Cereal
Science 25, 83-91.
Galli, V., Barbas, C., 2004. Capillary electrophoresis for the analysis of short-chain organic acids in
coffee. Journal of Chromatography A 1032, 299-304.
Gao, Y., Shang, C., Maroof, M. A. S., Biyashev, R. M., Grabau, E. A., Kwanyuen, P., Burton, J.
W., Buss, G. R., 2007. A modified colorimetric method for phytic acid analysis in soybean.
Crop Science 47, 1797-1803.
García-Casal, M. N., Ramírez, J., Leets, I., Pereira, A. C., Quiroga, M. F., 2009. Antioxidant
capacity, polyphenol content and iron bioavailability from algae (Ulva sp., Sargassum sp. and
Porphyra sp.) in human subjects. British Journal of Nutrition 101, 79-85.
Garcia-Estepa, R. M., Garcia-Villanova, B., Guerra-Hernandez, E., 1999. Determination of phytic
acid in legumes using indirect complexometry. Alimentaria 36, 111-116.
García-Estepa, R. M., Guerra-Hernández, E., García-Villanova, B., 1999. Phytic acid content in
milled cereal products and breads. Food Research International 32, 217-221.
Gillooly, M., Bothwell, T. H., Torrance, J. D., MacPhail, A. P., Derman, D. P., Bezwoda, W. R.,
Mills, W., Charlton, R. W., Mayet, F., 1983. The effects of organic acids, phytates and
polyphenols on the absorption of iron from vegetables. British Journal of Nutrition 49, 331-342.
Gokmen, V., Artik, N., Acar, J., Kahraman, N., Poyrazoglu, E., 2001. Effects of various
clarification treatments on patulin, phenolic compound and organic acid compositions of apple
juice. European Food Research and Technology 213, 194-199.
Gonzalez-Castro, M. J., Oruna-Concha, M. J., Lopez-Hernandez, J., Simal-Lozano, J., 1997. Effects
of freezing on the organic acid content of frozen green beans and Padron peppers. Zeitschrift
Journal of Food Composition and Analysis Fardet et al.
9
Fur Lebensmittel-Untersuchung Und-Forschung a-Food Research and Technology 204, 365-
368.
Greiner, R., Alminger, M. L., Carlsson, N.-G., 2001. Stereospecificity of myo-inositol
hexakisphosphate dephosphorylation by a phytate - Degrading enzyme of baker's yeast. Journal
of Agricultural and Food Chemistry 49, 2228-2233.
Hamauzu, Y., Irie, M., Kondo, M., Fujita, T., 2008. Antiulcerative properties of crude polyphenols
and juice of apple, and Chinese quince extracts. Food Chemistry 108, 488-495.
Haraldsson, A. K., Rimsten, L., Alminger, M. L., Andersson, R., Andlid, T., Aman, P., Sandberg,
A. S., 2004. Phytate content is reduced and beta-glucanase activity suppressed in malted barley
steeped with lactic acid at high temperature. Journal of the Science of Food and Agriculture 84,
653-662.
Harland, B. F., Frolich, W., 1989. Effects of phytase from 3 yeasts on phytate reduction in
Norwegian whole wheat-flour. Cereal Chemistry 66, 357-358.
Harland, B. F., Oberleas, D., 1987. Phytate in foods. World Review of Nutrition and Dietetics 52,
235-259.
Harland, B. F., Smikle-Williams, S., Oberleas, D., 2004. High performance liquid chromatography
analysis of phytate (IP6) in selected foods. Journal of Food Composition and Analysis 17, 227-
233.
Heimler, D., Vignolini, P., Dini, M. G., Vincieri, F. F., Romani, A., 2006. Antiradical activity and
polyphenol composition of local Brassicaceae edible varieties. Food Chemistry 99, 464-469.
Helfrich, A., Bettmer, J., 2004. Determination of phytic acid and its degradation products by ion-
pair chromatography (IPC) coupled to inductively coupled plasma-sector field-mass
spectrometry (ICP-SF-MS). Journal of Analytical Atomic Spectrometry 19, 1330-1334.
Hernandez-Orte, P., Ibarz, M. J., Cacho, J., Ferreira, V., 2003. Amino Acid Determination in Grape
Juices and Wines by HPLC Using a modification of the 6-aminoquinolyl-N-
hydroxysuccinimidyl carbamate (AQC) method. Chromatographia 58, 29-35.
Journal of Food Composition and Analysis Fardet et al.
10
Herrmann, K., 1974. Occurrence of main organic-acids in vegetables, potatoes and cereals.
Zeitschrift Fur Lebensmittel-Untersuchung Und-Forschung 155, 220-233.
Hooda, S., Jood, S., 2003. Effect of soaking and germination on nutrient and antinutrient contents
of fenugreek (Trigonella foenum graecum L.). Journal of Food Biochemistry 27, 165-176.
Horbowicz, M., Obendorf, R. L., 1994. Seed desiccation tolerance and storability: Dependence on
flatulence-producing oligosaccharides and cyclitols? - Review and survey. Seed Science
Research 4, 385-405.
Horowitz, N. H., Beadle, G. W., 1943. A microbiological method for the determination of choline
by use of a mutant of neurospora. Journal of Biological Chemistry 150, 325-333.
Ikawa, M., Borowski, P. T., Chakrava.A, 1968. Choline and inositol distribution in algae and fungi.
Applied Microbiology 16, 620-623.
Isiguro, T., Ono, T., Nakasato, K., Tsukamoto, C., 2005. Rapid measurement of phytate in soy
products by mid-infrared spectroscopy. Journal of Food Science 70, C63-C66.
Iwai, K., 2008. Antidiabetic and antioxidant effects of polyphenols in brown alga Ecklonia
stolonifera in genetically diabetic KK-A(y) mice. Plant Foods for Human Nutrition 63, 163-169.
Jährig, A., Martens, U., Meuser, F., 2000. Investigations regarding the contents of selected vitamins
and m-inositol in different steps of a biotechnological process of bread. Getreide, Mehl und Brot
54, 103-109.
Jiratanan, T., Liu, R. H., 2004. Antioxidant activity of processed table beets (Beta vulgaris var,
conditiva) and green beans (Phaseolus vulgaris L.). Journal of Agricultural and Food Chemistry
52, 2659-2670.
Kahkonen, M. P., Hopia, A. I., Vuorela, H. J., Rauha, J. P., Pihlaja, K., Kujala, T. S., Heinonen, M.,
1999. Antioxidant activity of plant extracts containing phenolic compounds. Journal of
Agricultural and Food Chemistry 47, 3954-3962.
Journal of Food Composition and Analysis Fardet et al.
11
Kelebek, H., Selli, S., Canbas, A., Cabaroglu, T., 2009. HPLC determination of organic acids,
sugars, phenolic compositions and antioxidant capacity of orange juice and orange wine made
from a Turkish cv. Kozan. Microchemical Journal 91, 187-192.
Kirby, L. K., Nelson, T. S., 1988. Total and phytate phosphorus - Content of some feed ingredients
derived from grains. Nutrition Reports International 37, 277-280.
Klampfl, C. W., 1999. Analysis of organic acids and inorganic anions in different types of beer
using capillary zone electrophoresis. Journal of Agricultural and Food Chemistry 47, 987-990.
Koziol, M. J., 1992. Chemical composition and nutritional evaluation of quinoa (Chenopodium
quinoa Willd.). Journal of Food Composition and Analysis 5, 35-68.
Le Francois, P., 1988. Phytic acid and zinc contents of cereal products: Relation to the
manufacturing process : 1. Phytic acid. Journal of Food Composition and Analysis 1, 139-145.
Lee, W. J., 1990. Phytic acid content and phytase activity of barley malt. Journal of the American
Society of Brewing Chemists 48, 62-65.
Lehrfeld, J., 2002. HPLC Separation and quantitation of phytic acid and some inositol phosphates
in foods: Problems and solutions. Journal of Agricultural and Food Chemistry 42, 2726 LP -
2731.
Lestienne, I., Icard-Vernière, C., Mouquet, C., Picq, C., Trèche, S., 2005. Effects of soaking whole
cereal and legume seeds on iron, zinc and phytate contents. Food Chemistry 89, 421-425.
Likes, R., Madl, R. L., Zeisel, S. H., Craig, S. A. S., 2007. The betaine and choline content of a
whole wheat flour compared to other mill streams. Journal of Cereal Science 46, 93-95.
Liu, Z. S., Chang, S. K. C., 2004. Effect of soy milk characteristics and cooking conditions on
coagulant requirements for making filled tofu. Journal of Agricultural and Food Chemistry 52,
3405-3411.
Livingston, A. L., Knowles, R. E., Edwards, R. H., Kohler, G. O., 1976. Processing of fresh
artichoke trimmings for use in animal feeds. Journal of Agricultural and Food Chemistry 24,
1158-1161.
Journal of Food Composition and Analysis Fardet et al.
12
Lolas, G. M., Palamidis, N., Markakis, P., 1976. Phytic acid total phosphorus relationship in barley,
oats, soybeans, and wheat. Cereal Chemistry 53, 867-871.
Lorenz, K., Wright, B., 1984. Phytate and tannin content of amaranth. Food Chemistry 14, 27-34.
Lott, J. N. A., Ockenden, I., Raboy, V., Batten, G. D., 2000. Phytic acid and phosphorus in crop
seeds and fruits: a global estimate. Seed Science Research 10, 11-33.
Ma, G., Jin, Y., Piao, J., Kok, F., Guusje, B., Jacobsen, E., 2005. Phytate, calcium, iron, and zinc
contents and their molar ratios in foods commonly consumed in China. Journal of Agricultural
and Food Chemistry 53, 10285-10290.
Macfarlane, B., Bezwoda, W., Bothwell, T., Baynes, R., Bothwell, J., MacPhail, A., Lamparelli, R.,
Mayet, F., 1988. Inhibitory effect of nuts on iron absorption. American Journal of Clinical
Nutrition 47, 270-274.
Maillard, M. N., Soum, M. H., Boivin, P., Berset, C., 1996. Antioxidant activity of barley and malt:
Relationship with phenolic content. Food Science and Technology-Lebensmittel-Wissenschaft
& Technologie 29, 238-244.
Makinen, K. K., Soderling, E., 1980. Quantitative study of mannitol, sorbitol, xylitol, and xylose in
wild berries and commercial fruits. Journal of Food Science 45, 367-&.
Mameesh, M. S., Tomar, M., 1993. Phytate content of some popular Kuwaiti foods. Cereal
Chemistry 70, 502-503.
Masuda, T., Kawano, A., Kitahara, K., Nagashima, K., Aikawa, Y., Arai, S., 2003. Quantitative
determination of sugars and myo-inositol in citrus fruits grown in Japan using high-performance
anion-exchange chromatography. Journal of Nutritional Science and Vitaminology 49, 64-68.
Mato, I., Suarez-Luque, S., Huidobro, J. F., 2007. Simple determination of main organic acids in
grape juice and wine by using capillary zone electrophoresis with direct UV detection. Food
Chemistry 102, 104-112.
Journal of Food Composition and Analysis Fardet et al.
13
Matsunaga, A., Yamamoto, A., Mizukami, E., 1989. Analysis of inositol phosphates in foods e.g.
soybeans, wheat flour, rice bran, sesame seeds, rice vinegar by high-performance liquid
chromatography. Annual Report of Toyama Institute of Health (12), 157-161.
McKenzie, J. M., 1984. Content of phytate and minerals in instant coffee, coffee beans and coffee
beverage. Nutrition Reports International 29, 387-395.
McKenzie-Parnell, J., Guthrie, B., 1986. The phytate and mineral content of some cereals, cereal
products, legumes, legume products, snack bars, and nuts available in New Zealand. Biological
Trace Element Research 10, 107-121.
Michalska, A., Ceglinska, A., Zielinski, H., 2007. Bioactive compounds in rye flours with different
extraction rates. European Food Research and Technology 225, 545-551.
Morris, E. R., Hill, A. D., 1995. Inositol phosphate, calcium, magnesium, and zinc contents of
selected breakfast cereals. Journal of Food Composition and Analysis 8, 3-11.
Morris, E. R., Hill, A. D., 1996. Inositol phosphate content of selected dry beans, peas, and lentils,
raw and cooked. Journal of Food Composition and Analysis 9, 2-12.
Nayini, N. R., Markakis, P., 1983. Effect of milling extraction on the inositol phosphates of wheat-
flour and bread. Journal of Food Science 48, 1384-&.
Neveu, V., Perez-Jimenez, J., Vos, F., Crespy, V., du Chaffaut, L., Mennen, L., Knox, C., Eisner,
R., Cruz, J., Wishart, D., Scalbert, A., 2010. Phenol-Explorer: An online comprehensive
database on polyphenol contents in foods. Database 2010, bap024-.
Niculescu, M., Mieliauskiene, R., Laurinavicius, V., Csöregi, E., 2003. Simultaneous detection of
ethanol, glucose and glycerol in wines using pyrroloquinoline quinone-dependent
dehydrogenases based biosensors. Food Chemistry 82, 481-489.
Ninfali, P., Mea, G., Giorgini, S., Rocchi, M., Bacchiocca, M., 2005. Antioxidant capacity of
vegetables, spices and dressings relevant to nutrition. British Journal of Nutrition 93, 257-266.
Ola, F. L., Oboh, G., 2001. Nutrient distribution and zinc bioavailability. Estimation in some
tropical edible mushrooms. Nahrung-Food 45, 67-68.
Journal of Food Composition and Analysis Fardet et al.
14
Olguin, M. C., Hisano, N., D'Ottavio, A. E., Zingale, M. I., Revelant, G. C., Calderari, S. A., 2003.
Nutritional and antinutritional aspects of an Argentinian soy flour assessed on weanling rats.
Journal of Food Composition and Analysis 16, 441-449.
Oomah, B. D., Kenaschuk, E. O., Mazza, G., 1996. Phytic acid content of flaxseed as influenced by
cultivar, growing season, and location. Journal of Agricultural and Food Chemistry 44, 2663-
2666.
Oyetayo, F. L., Akindahunsi, A. A., 2004. Nutrient distribution in wild and cultivated edible
mushroom, Pleurotus sajor-caju. Journal of Food, Agriculture & Environment 2, 166-168.
Pasko, P., Barton, H., Zagrodzki, P., Gorinstein, S., Folta, M., Zachwieja, Z., 2009. Anthocyanins,
total polyphenols and antioxidant activity in amaranth and quinoa seeds and sprouts during their
growth. Food Chemistry 115, 994-998.
Pattee, H. E., Isleib, T. G., Giesbrecht, F. G., McFeeters, R. F., 2000. Investigations into genotypic
variations of peanut carbohydrates. Journal of Agricultural and Food Chemistry 48, 750-756.
Peres, R. G., Moraes, E. P., Micke, G. A., Tonin, F. G., Tavares, M. F. M., Rodriguez-Amaya, D.
B., 2009. Rapid method for the determination of organic acids in wine by capillary
electrophoresis with indirect UV detection. Food Control 20, 548-552.
Perez-Jimenez, J., Saura-Calixto, F., 2005. Literature data may underestimate the actual antioxidant
capacity of cereals. Journal of Agricultural and Food Chemistry 53, 5036-5040.
Phillippy, B. Q., Bland, J. M., Evens, T. J., 2003. Ion chromatography of phytate in roots and
tubers. Journal of Agricultural and Food Chemistry 51, 350-353.
Phillippy, B. Q., Johnston, M. R., Tao, S. H., Fox, M. R. S., 1988. Inositol phosphates in processed
foods. Journal of Food Science 53, 496-499.
Phillippy, B. Q., Wyatt, C. J., 2001. Degradation of phytate in foods by phytases in fruit and
vegetable extracts. Journal of Food Science 66, 535-539.
Picha, D. H., 1985. Organic-acid determination in sweet-potatoes by HPLC. Journal of Agricultural
and Food Chemistry 33, 743-745.
Journal of Food Composition and Analysis Fardet et al.
15
Plaami, S., Kumpulainen, J., 1995. Inositol phosphate content of some cereal-based foods. Journal
of Food Composition and Analysis 8, 324-335.
Podsedek, A., Sosnowska, D., Redzynia, M., Anders, B., 2006. Antioxidant capacity and content of
Brassica oleracea dietary antioxidants. International Journal of Food Science and Technology
41, 49-58.
Pradeep, K. U., Geervani, P., Eggum, B. O., 1993. Common Indian spices: Nutrient composition,
consumption and contribution to dietary value. Plant Foods for Human Nutrition (Formerly
Qualitas Plantarum) 44, 137-148.
Proskova, A., 1998. Determination of phytic acid content in food raw-materials from vegetable
sources. Czech Journal of Food Sciences 16, 215-220.
Puupponen-Pimiä, R., Häkkinen, S. T., Aarni, M., Suortti, T., Lampi, A.-M., Eurola, M., Piironen,
V., Nuutila, A. M., Oksman-Caldentey, K.-M., 2003. Blanching and long-term freezing affect
various bioactive compounds of vegetables in different ways. Journal of the Science of Food
and Agriculture 83, 1389-1402.
Ramírez-Anguiano, A. C., Santoyo, S., Reglero, G., Soler-Rivas, C., 2007. Radical scavenging
activities, endogenous oxidative enzymes and total phenols in edible mushrooms commonly
consumed in Europe. Journal of the Science of Food and Agriculture 87, 2272-2278.
Ramirez-Cardenas, L., Leonel, A. J., Costa, N. M. B., 2008. Effect of domestic processing on
nutrient and antinutritional factor content in different cultivars of common beans. Ciencia e
Tecnologia de Alimentos 28, 200-213.
Ravindran, V., Ravindran, G., Sivalogan, S., 1994. Total and phytate phosphorus contents of
various foods and feedstuffs of plant-origin. Food Chemistry 50, 133-136.
Repo-Carrasco-Valencia, R., Pena, J., Kallio, H., Salminen, S., 2009. Dietary fiber and other
functional components in two varieties of crude and extruded kiwicha (Amaranthus caudatus).
Journal of Cereal Science 49, 49 (42) 219-224.

Journal of Food Composition and Analysis Fardet et al.
16
Reyes, L. F., Cisneros-Zevallos, L., 2003. Wounding stress increases the phenolic content and
antioxidant capacity of purple-flesh potatoes (Solanum tuberosum L.). Journal of Agricultural
and Food Chemistry 51, 5296-5300.
Rodrigues, C. I., Marta, L., Maia, R., Miranda, M., Ribeirinho, M., Maguas, C., 2007. Application
of solid-phase extraction to brewed coffee caffeine and organic acid determination by
UV/HPLC. Journal of Food Composition and Analysis 20, 440-448.
Sakamoto, A., Nishimura, Y., Ono, H., Sakura, N., 2002. Betaine and homocysteine concentrations
in foods. Pediatrics International 44, 409-413.
Sanz, M. L., Villamiel, M., Martinez-Castro, I., 2004. Inositols and carbohydrates in different fresh
fruit juices. Food Chemistry 87, 325-328.
Schweizer, T. F., Horman, I., Würsch, P., 1978. Low molecular weight carbohydrates from
leguminous seeds; a new disaccharide: Galactopinitol. Journal of the Science of Food and
Agriculture 29, 148-154.
Scriban, R., 1970. Vitamins of barley, malt and beer. Annales De La Nutrition Et De
L'Alimentation 24, B377-B399.
Seifert, R. M., 1972. Analysis of myoinositol in dry beans by gas-chromatography of its
hexaacetate. Journal of the Association of Official Analytical Chemists 55, 1194-1198.
Shindou, T., Sasaki, Y., Miki, H., Eguchi, T., Hagiwara, K., Ichikawa, T., 1989. Identification of
erythritol by HPLC and GC-Ms and quantitative measurement in pulps of various fruits. Journal
of Agricultural and Food Chemistry 37, 1474-1476.
Shiroma-Kian, C., Tay, D., Manrique, I. n., Giusti, M. M., Rodriguez-Saona, L. E., 2008.
Improving the screening process for the selection of potato breeding lines with enhanced
polyphenolics content. Journal of Agricultural and Food Chemistry 56, 9835-9842.
Sikora, E., Cieslik, E., Leszczynska, T., Filipiak-Florkiewicz, A., Pisulewski, P. M., 2008. The
antioxidant activity of selected cruciferous vegetables subjected to aquathermal processing.
Food Chemistry 107, 55-59.
Journal of Food Composition and Analysis Fardet et al.
17
Simonet, B. M., Rios, A., Grases, F., Valcarcel, M., 2003. Determination of myo-inositol
phosphates in food samples by flow injection-capillary zone electrophoresis. Electrophoresis 24,
2092-2098.
Slavin, M., Cheng, Z., Luther, M., Kenworthy, W., Yu, L. L., 2009. Antioxidant properties and
phenolic, isoflavone, tocopherol and carotenoid composition of Maryland-grown soybean lines
with altered fatty acid profiles. Food Chemistry 114, 20-27.
Slow, S., Donaggio, M., Cressey, P. J., Lever, M., George, P. M., Chambers, S. T., 2005. The
betaine content of New Zealand foods and estimated intake in the New Zealand diet. Journal of
Food Composition and Analysis 18, 473-485.
Sommer, I., Schwartz, H., Solar, S., Sontag, G., 2009. Effect of γ-irradiation on agaritine, γ-
glutaminyl-4-hydroxybenzene (GHB), antioxidant capacity, and total phenolic content of
mushrooms (Agaricus bisporus). Journal of Agricultural and Food Chemistry 57, 5790-5794.
Somsub, W., Kongkachuichai, R., Sungpuag, P., Charoensiri, R., 2008. Effects of three
conventional cooking methods on vitamin C, tannin, myo-inositol phosphates contents in
selected Thai vegetables. Journal of Food Composition and Analysis 21, 187-197.
Soria, A. C., Sanz, M. L., Villamiel, M., 2009. Determination of minor carbohydrates in carrot
(Daucus carota L.) by GC-MS. Food Chemistry 114, 758-762.
Sosulski, F. W., Elkowicz, L., Reichert, R. D., 1982. Oligosaccharides in eleven legumes and their
air-classified protein and starch fractions. Journal of Food Science 47, 498-502.
Souci, S. W., Fachmann, W., Kraut, H., 2008. Food composition and nutritional tables,
7th revised and completed edition. Medpharm Scientific Publishers, Stuttgart,
Germany: Taylor & Francis, CRC Press.
Soufleros, E. H., Bouloumpasi, E., Tsarchopoulos, C., Biliaderis, C. G., 2003. Primary amino acid
profiles of Greek white wines and their use in classification according to variety, origin and
vintage. Food Chemistry 80, 261-273.
Journal of Food Composition and Analysis Fardet et al.
18
Sponholz, W. R., Dittrich, H. H., 1985. Alditols and myoinositol in wines and sherries. Vitis 24, 97-
105.
Steadman, K. J., Burgoon, M. S., Schuster, R. L., Lewis, B. A., Edwardson, S. E., Obendorf, R. L.,
2000. Fagopyritols, d-chiro-inositol, and other soluble carbohydrates in buckwheat seed milling
fractions. Journal of Agricultural and Food Chemistry 48, 2843-2847.
Sun, T., Simon, P. W., Tanumihardjo, S. A., 2009. Antioxidant phytochemicals and antioxidant
capacity of biofortified carrots (Daucus carota L.) of various colors. Journal of Agricultural and
Food Chemistry 57, 4142-4147.
Tahmida Begum, Z. N., Anisur Rahman Khan, M., 1998. Antinutritional factors of three freshwater
green algae. Bangladesh Journal of Botany 27, 51-54.
Thompson, D. B., Erdman JR., J. W., 1982. Phytic acid determination in soybeans. Journal of Food
Science 47, 513-517.
Toda, K., Takahashi, K., Ono, T., Kitamura, K., Nakamura, Y., 2006. Variation in the phytic acid
content of soybeans and its effect on consistency of tofu made from soybean varieties with high
protein content. Journal of the Science of Food and Agriculture 86, 212-219.
Trugo, L. C., Muzquiz, M., Pedrosa, M. M., Ayet, G., Burbano, C., Cuadrado, C., Cavieres, E.,
1999. Influence of malting on selected components of soya bean, black bean, chickpea and
barley. Food Chemistry 65, 85-90.
Turkmen, N., Sari, F., Velioglu, Y. S., 2005. The effect of cooking methods on total phenolics and
antioxidant activity of selected green vegetables. Food Chemistry 93, 713-718.
U.S. Department of Agriculture, Agricultural Research Service, 2005. USDA National
Nutrient Database for Standard Reference, Release 18. Retrieved 2009-2010 from
Nutrient Data Laboratory Home Page:
http://www.nal.usda.gov/fnic/foodcomp/Data/SR18/reports/sr18page.htm
Journal of Food Composition and Analysis Fardet et al.
19
U.S. Department of Agriculture, Agricultural Research Service, 2008. USDA database for the
choline content of common foods, Release 2. Retrieved 2009-2010 from Nutrient Data
Laboratory Home Page: http://www.nal.usda.gov/fnic/foodcomp/Data/Choline/Choln02.pdf
Udosen, E. O., Ukpanah, U. M., 1993. The toxicants and phosphorus content of some Nigerian
vegetables. Plant Foods for Human Nutrition (Formerly Qualitas Plantarum) 44, 285-289.
Umeta, M., West, C. E., Fufa, H., 2005. Content of zinc, iron, calcium and their absorption
inhibitors in foods commonly consumed in Ethiopia. Journal of Food Composition and Analysis
18, 803-817.
Valencia, S., Svanberg, U., Sandberg, A. S., Ruales, J., 1999. Processing of quinoa (Chenopodium
quinoa, Willd): effects on in vitro iron availability and phytate hydrolysis. International Journal
of Food Sciences and Nutrition 50, 203-211.
Velioglu, Y. S., Mazza, G., Gao, L., Oomah, B. D., 1998. Antioxidant activity and total phenolics in
selected fruits, vegetables, and grain products. Journal of Agricultural and Food Chemistry 46,
4113-4117.
Venkatachalam, M., Sathe, S. K., 2006. Chemical composition of selected edible nut seeds. Journal
of Agricultural and Food Chemistry 54, 4705-4714.
Vérette, E., Qian, F., Mangani, F., 1995. On-line dialysis with high-performance liquid
chromatography for the automated preparation and analysis of sugars and organic acids in foods
and beverages. Journal of Chromatography A 705, 195-203.
Verma, B., Hucl, P., Chibbar, R. N., 2008. Phenolic Content and antioxidant properties of bran in
51 wheat cultivars. Cereal Chemistry 85, 544-549.
Vitali, D., Dragojevic, I. V., Sebecic, B., 2008. Bioaccessibility of Ca, Mg, Mn and Cu from whole
grain tea-biscuits: Impact of proteins, phytic acid and polyphenols. Food Chemistry 110, 62-68.
Vivar-Quintana, A. M., González-San José, M. L., Collado-Fernández, M., 1999. Influence of
canning process on colour, weight and grade of mushrooms. Food Chemistry 66, 87-92.
Journal of Food Composition and Analysis Fardet et al.
20
Wei, M.-M., Gregory, J. F., 1998. Organic acids in selected foods inhibit intestinal brush border
pteroylpolyglutamate hydrolase in vitro: Potential mechanism affecting the bioavailability of
dietary polyglutamyl folate. Journal of Agricultural and Food Chemistry 46, 211-219.
West, J. A., Zuccarello, G. C., Pedroche, F. F., Karsten, U., 1992. Marine red algae of the
mangroves in Pacific Mexico and their polyol content. Botanica Marina 35, 567-572.
Wrolstad, R. E., Shallenberger, R. S., 1981. Free sugars and sorbitol in fruits - A compilation from
the literature. Journal of the Association of Official Analytical Chemists 64, 91-103.
Wu, X., Beecher, G. R., Holden, J. M., Haytowitz, D. B., Gebhardt, S. E., Prior, R. L., 2004.
Lipophilic and hydrophilic antioxidant capacities of common foods in the United States. Journal
of Agricultural and Food Chemistry 52, 4026-4037.
Xu, B., Chang, S. K. C., 2008a. Antioxidant capacity of seed coat, dehulled bean, and whole black
soybeans in relation to their distributions of total phenolics, phenolic acids, anthocyanins, and
isoflavones. Journal of Agricultural and Food Chemistry 56, 8365-8373.
Xu, B., Chang, S. K. C., 2008b. Characterization of phenolic substances and antioxidant properties
of food soybeans grown in the North Dakota-Minnesota region. Journal of Agricultural and
Food Chemistry 56, 9102-9113.
Xu, B., Chang, S. K. C., 2008c. Total phenolics, phenolic Acids, isoflavones, and anthocyanins and
antioxidant properties of yellow and black soybeans as affected by thermal processing. Journal
of Agricultural and Food Chemistry 56, 7165-7175.
Xu, B. J., Chang, S. K. C., 2008d. Total phenolic content and antioxidant properties of Eclipse
black beans (Phaseolus vulgaris L.) as affected by processing methods. Journal of Food Science
73, H19-H27.
Xu, B., Chang, S. K. C., 2009. Total phenolic, phenolic acid, anthocyanin, flavan-3-ol, and flavonol
profiles and antioxidant properties of pinto and black beans (Phaseolus vulgaris L.) as affected
by thermal processing. Journal of Agricultural and Food Chemistry 57, 4754-4764.

Journal of Food Composition and Analysis Fardet et al.
21
Yadav, S. K., Sehgal, S., 2003. Effect of domestic processing and cooking on selected antinutrient
contents of some green leafy vegetables. Plant Foods for Human Nutrition (Formerly Qualitas
Plantarum) 58, 1-11.
Yanniotis, S., Kotseridis, G., Orfanidou, A., Petraki, A., 2007. Effect of ethanol, dry extract and
glycerol on the viscosity of wine. Journal of Food Engineering 81, 399-403.
Yu, L., Zhou, K., 2004. Antioxidant properties of bran extracts from 'Platte' wheat grown at
different locations. Food Chemistry 90, 311-316.
Yu, L. L., Perret, J., Harris, M., Wilson, J., Haley, S., 2003. Antioxidant properties of bran extracts
from "Akron" wheat grown at different locations. Journal of Agricultural and Food Chemistry
51, 1566-1570.
Zeisel, S. H., Mar, M. H., Howe, J. C., Holden, J. M., 2003. Concentrations of choline-containing
compounds and betaine in common foods. Journal of Nutrition 133, 1302-1307.
Zielinski, H., Michalska, A., Amigo-Benavent, M., del Castillo, M. D., Piskula, M. K., 2009.
Changes in protein quality and antioxidant properties of buckwheat seeds and groats induced by
roasting. Journal of Agricultural and Food Chemistry 57, 4771-4776.
Zubia, M., Payri, C., Deslandes, E., 2008. Alginate, mannitol, phenolic compounds and biological
activities of two range-extending brown algae, Sargassum mangarevense and Turbinaria ornata
(Phaeophyta: Fucales), from Tahiti (French Polynesia). Journal of Applied Phycology 20,
1033-1043.