EFFICIENT UTILITY MINING OF NUTRITION CALCULATION
95
EFFICIENT UTILITY MINING OF NUTRITION CALCULATION A Report for the Evaluation 3 of Project 2 Submitted by ABHISHEK BHAGAT (1613101027/16SCSE101213) In partial fulfillment for the award of the degree Bachelor of Technology IN Computer Science and Engineering SCHOOL OF COMPUTING SCIENCE AND ENGINEERING Under the Supervision of Dr. S RAJU, Dean IQAC APRIL / MAY-2020
-
Upload
khangminh22 -
Category
Documents
-
view
2 -
download
0
Transcript of EFFICIENT UTILITY MINING OF NUTRITION CALCULATION

EFFICIENT UTILITY MINING OF NUTRITION
CALCULATION
A Report for the Evaluation 3 of Project 2
Submitted by
ABHISHEK BHAGAT
(1613101027/16SCSE101213)
In partial fulfillment for the award of the degree
Bachelor of Technology
IN
Computer Science and Engineering
SCHOOL OF COMPUTING SCIENCE AND ENGINEERING
Under the Supervision of
Dr. S RAJU, Dean IQAC
APRIL / MAY-2020

SCHOOL OF COMPUTING AND SCIENCE AND
ENGINEERING
BONAFIDE CERTIFICATE
Certified that this project report “EFFICIENT UTILITY MINING FOR NUTRITION
CALCULATION” is the bonafide work of “ABHISHEK BHAGAT (1613101027)”
who carried out the project work under my supervision.
SIGNATURE OF HEAD SIGNATURE OF SUPERVISOR
Dr. MUNISH SHABARWAL, Dr. RAJU SHANMUGAM
PhD (Management), PhD (CS) ME, PhD (CSE)
Professor & Dean, DEAN-IQAC
School of Computing Science & Professor
Engineering School of Computing Science
& Engineering
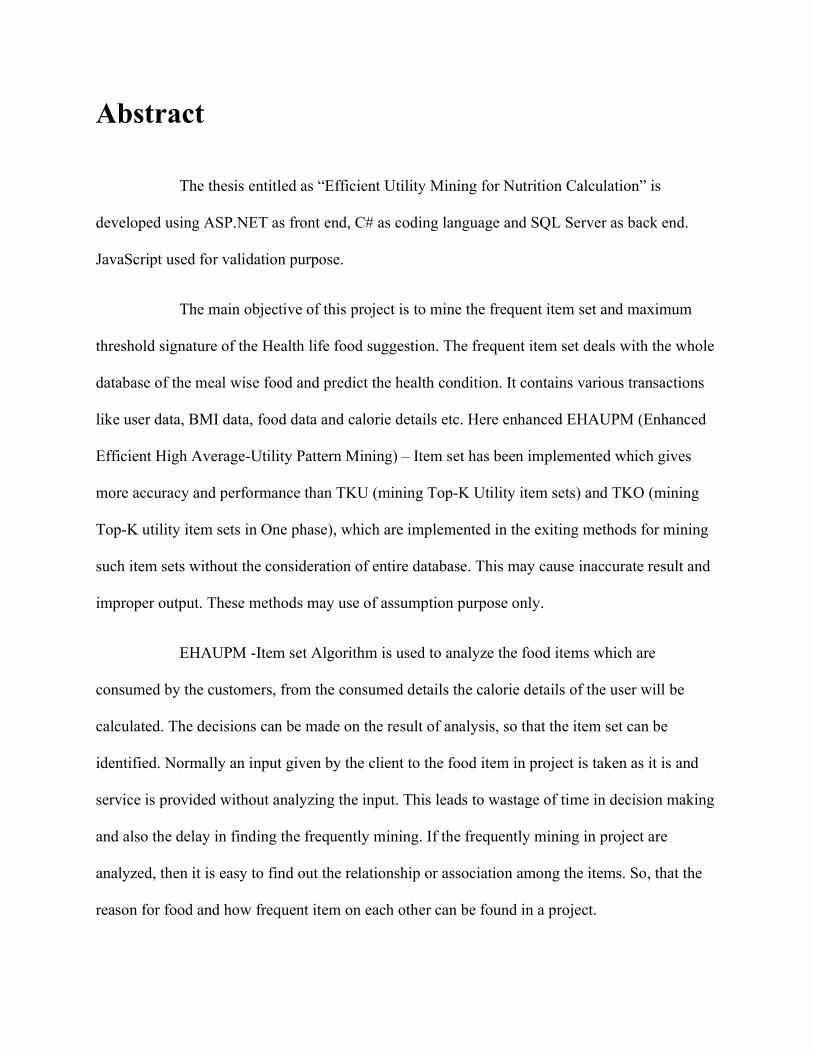
Abstract
The thesis entitled as “Efficient Utility Mining for Nutrition Calculation” is
developed using ASP.NET as front end, C# as coding language and SQL Server as back end.
JavaScript used for validation purpose.
The main objective of this project is to mine the frequent item set and maximum
threshold signature of the Health life food suggestion. The frequent item set deals with the whole
database of the meal wise food and predict the health condition. It contains various transactions
like user data, BMI data, food data and calorie details etc. Here enhanced EHAUPM (Enhanced
Efficient High Average-Utility Pattern Mining) – Item set has been implemented which gives
more accuracy and performance than TKU (mining Top-K Utility item sets) and TKO (mining
Top-K utility item sets in One phase), which are implemented in the exiting methods for mining
such item sets without the consideration of entire database. This may cause inaccurate result and
improper output. These methods may use of assumption purpose only.
EHAUPM -Item set Algorithm is used to analyze the food items which are
consumed by the customers, from the consumed details the calorie details of the user will be
calculated. The decisions can be made on the result of analysis, so that the item set can be
identified. Normally an input given by the client to the food item in project is taken as it is and
service is provided without analyzing the input. This leads to wastage of time in decision making
and also the delay in finding the frequently mining. If the frequently mining in project are
analyzed, then it is easy to find out the relationship or association among the items. So, that the
reason for food and how frequent item on each other can be found in a project.

TABLE OF CONTENTS
CHAPTER NO. TITLE PAGE NO
ABSTRACT III
LIST OF TABLES XLV
LIST OF FIGURES XLI
LIST OF SYMBOLS LXXIX
1 INTRODUCTION 8
1.1 Data mining concept 8
1.2 Data mining vs query tools 8
1.3 Operational database 8
1.4 Objectives 9
1.5 Modules 9
1.6 Modules description 9
1.6.1 Data set processing 10
1.6.2 Calculating BMI 10
1.6.3 Implementing K mine process 10
1.6.4 Mining Utility Item Set 11
1.6.5 Statistical Representation 11
1.7 HARDWARE SPECIFICATION 12
1.8 SOFTWARE CONFIGURATION 13
2 LITERATURE REVIEW 13

2.1 The CN2 induction algorithm”, Machine Learning 13
2.2 Mining Association Rules between Sets of Items 14
2.3 Deliver smarter products and services 15
2.4. Learning Decision Trees 16
2.5 Logical Design of Data Warehouses from XML 17
2.6 A multisession-based multidimensional model 18
2.7 Transaction Management for a Main-Memory 19
2.8 Discovering business intelligence 19
2.9 Crowd sourcing Predictors 20
2.10 Feature Selection Based on Class 21
3 METHODOLOGIES 27
3.1 Mine the transaction Data 27
3.2 Association rules to find out relationship 29
3.3 High utility mining 31
3.4 Implementing High utility mining 32
3.5 Method of FP growth 34
3.6 Database Shrinking 36
4 SYSTEM STUDY 38
4.1 EXISTING SYSTEM 38
4.1.1 Drawbacks in existing system 39
4. 2 PROPOSED SYSTEM 39
5 SYSTEM DESIGN 41
5.1 Data flow diagram 41
5.2 ER diagram 44
5.3 Table design 45
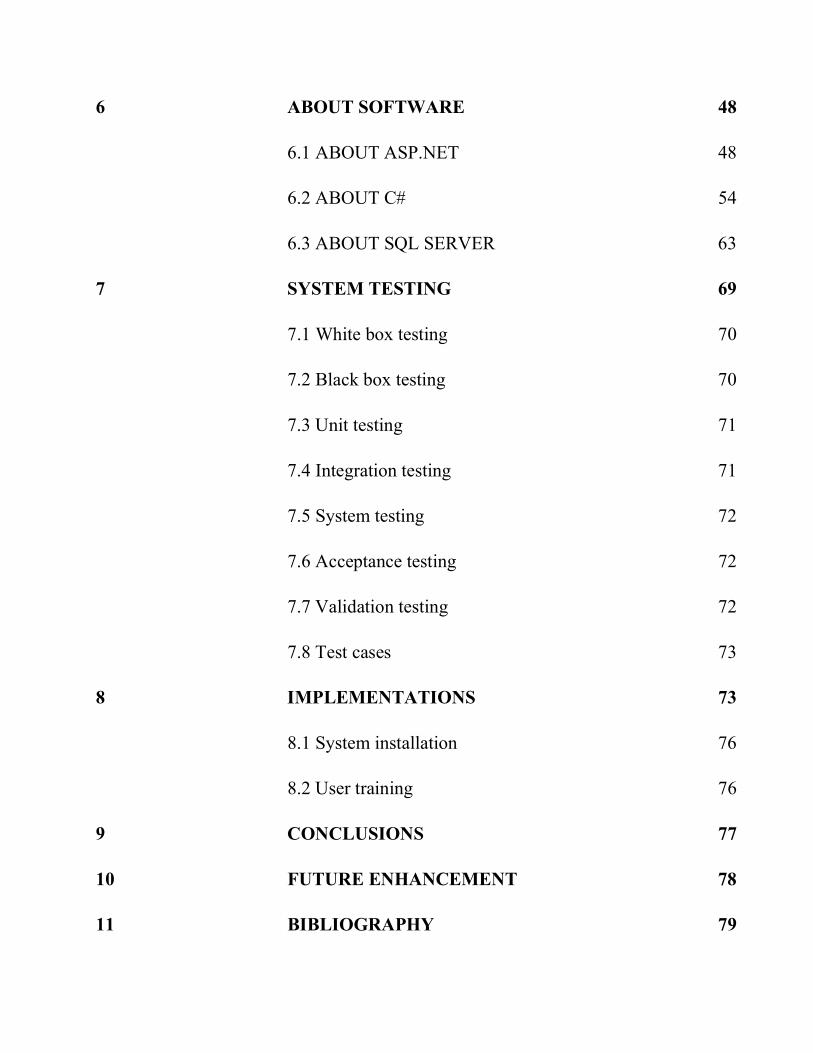
6 ABOUT SOFTWARE 48
6.1 ABOUT ASP.NET 48
6.2 ABOUT C# 54
6.3 ABOUT SQL SERVER 63
7 SYSTEM TESTING 69
7.1 White box testing 70
7.2 Black box testing 70
7.3 Unit testing 71
7.4 Integration testing 71
7.5 System testing 72
7.6 Acceptance testing 72
7.7 Validation testing 72
7.8 Test cases 73
8 IMPLEMENTATIONS 73
8.1 System installation 76
8.2 User training 76
9 CONCLUSIONS 77
10 FUTURE ENHANCEMENT 78
11 BIBLIOGRAPHY 79

12 SAMPLE SCREENSHOTS 80
13 SAMPLE CODE 81
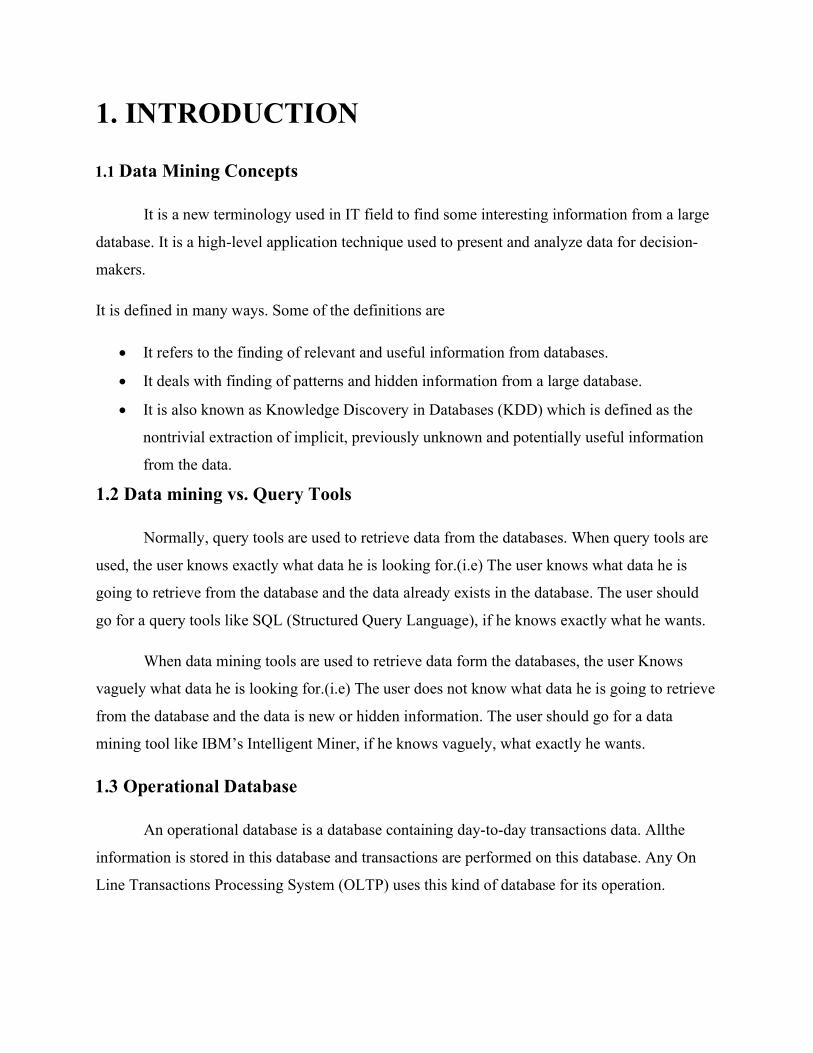
1. INTRODUCTION
1.1 Data Mining Concepts
It is a new terminology used in IT field to find some interesting information from a large
database. It is a high-level application technique used to present and analyze data for decision-
makers.
It is defined in many ways. Some of the definitions are
It refers to the finding of relevant and useful information from databases.
It deals with finding of patterns and hidden information from a large database.
It is also known as Knowledge Discovery in Databases (KDD) which is defined as the
nontrivial extraction of implicit, previously unknown and potentially useful information
from the data.
1.2 Data mining vs. Query Tools
Normally, query tools are used to retrieve data from the databases. When query tools are
used, the user knows exactly what data he is looking for.(i.e) The user knows what data he is
going to retrieve from the database and the data already exists in the database. The user should
go for a query tools like SQL (Structured Query Language), if he knows exactly what he wants.
When data mining tools are used to retrieve data form the databases, the user Knows
vaguely what data he is looking for.(i.e) The user does not know what data he is going to retrieve
from the database and the data is new or hidden information. The user should go for a data
mining tool like IBM’s Intelligent Miner, if he knows vaguely, what exactly he wants.
1.3 Operational Database
An operational database is a database containing day-to-day transactions data. Allthe
information is stored in this database and transactions are performed on this database. Any On
Line Transactions Processing System (OLTP) uses this kind of database for its operation.

Once the data is identified for mining, it is been selected from this database and copied to
a data warehouse. An operational database plays a vital role in the data mining methodology; it is
because the first process itself is data selection which is performed on an operational database.
Data Mining Applications
Data mining was initially successful in marketing. Now, it is used in many areas like wed
mining, banking, medical, scientific research etc. It is widely used in Internet to personalize the
website in order to provide the necessary information required by the users in a faster way.
1.4 Objectives
Primary Objectives
The main objective of this project is to mine the frequent item set and maximum
threshold signature of the Health suggestion.
The suggestion will be generated through the food consumed and calorie information.
Here EHAUPM - Enhanced Efficient High Average-Utility Pattern Mining for efficient
data retrieval.
A new concept called data engineering is used in the system to find associations with the
calories used and generate some health tips.
Rule Mining Concepts like Association rules has been implemented to make the result
much better
All the result will be shown in chart and graph
1.5 MODULES:
Pre processing
Calculating BMI and work out calculation
Implementing K mine
Mining utility item set
Statistical representation
1.6 MODULES DESCRIPTION:

1.6.1 Data Set Pre Processing.
Pre process is the initial process, where data format will be processed for understandable
data, which can be stored in the data base for further use. Now a day, people are going for this
new technique to retrieve data from their databases. It is because the volume of their databases
has become larger and larger very day. Normally, query tools are used to retrieve data from the
database. But, if the database is larger, then it is difficult to retrieve data in an effective way
using query tools. Sometimes data loss or data mismatch or data transaction failure may occur.
Using data mining techniques, the relevant information can be extracted in an effective manner.
It is applied only on specific records or historical data in the database and retrieves some
interesting or hidden information from the database. So that pre processing make the data set
more efficient to access and execute. The pre processed data will be current data set. This
process contains manual input process.
1.6.2 Calculating BMI and work out calculation
This module contains two process BMI and Workout process calculation. Both process will
works individual as a user interface model. Initially workout time, sleeping time, rest time and
sitting will be fetched from the user. Using Fmod function the average work out time of the user
will be calculated. The same case will be applied for BMI calculation. For BMI calculation
Height and weight of the user will be taken as input and calculate the corresponding body mass
index of the user.
1.6.3 Implementing K mine process
This module is the implementation of the core content. According
to the K mining process "bottom up" approach has been used. Here all the data training will be
done internally. Here various considerations will be done like calorie range, protein range,
vitamin range and etc. These ranges will process with the user input data to create a suggestion
on their health and insufficient details.
1.6.4 Mining Utility Item Set

Mining high utility item sets from a transactional database refers to the discovery of item sets
with high utility of various statistical information. A number of relevant approaches have been
used in this module for more consideration in the analysis part. This module deals with both
trained data and input data process. These consideration will be done for individual users. This
modules works well on bulk information. This module calculates the daily input of the user,
while getting the input the user’s meal detail will be taken as the input like breakfast lunch and
dinner. The average result of daily conception will be calculated and result will be generated in
three various types like Insufficient, Normal and excess. For insufficient columns the relevant
disease details will be displayed.
1.6.5 Statistical Representation
Statistics is a special subject that deals with large (usually) numerical data. The statistical data
can be represented graphically. In fact, the graphical representation of statistical data is an
essential step during statistical analysis. This is the representation of data by using graphical
symbols such as lines, bars, pie slices, dots etc. A graph does represent a numerical data in the
form of a qualitative structure and provides important information. A bar graph is a very
frequently used graph in statistics as well as in media. A bar graph is a type of graph which
contains rectangles or rectangular bars. The lengths of these bars should be proportional to the
numerical values represented by them. In bar graph, the bars may be plotted either horizontally
or vertically. But a vertical bar graph (also known as column bar graph) is used more than a
horizontal one. The rectangular bars are separated by some distance in order to distinguish them
from one another. The bar graph shows comparison among the given categories. Mostly,
horizontal axis of the graph represents specific categories and vertical axis shows the discrete
numerical values.
1.7 HARDWARE SPECIFICATION
PROCESSOR : Intel Pentium Dual Core 1.8 GHz
MOTHERBOARD : Intel 915GVSR chipset board
RAM : 4 GB DDR3 RAM

HARD DISK DRIVE : 750 GB
DVD/CD DRIVE : Sony 52 x Dual layer drive
MONITOR : 17” Color TFT Monitor
KEYBOARD : Multimedia Keyboard 108 Keys
MOUSE : Logitech Optical Mouse
CABINET : ATX iball.
1.8 SOFTWARE CONFIGURATION
FRONTEND : ASP.NET 2012
CODING LANDUAGE : C#
BACK END : SQL SERVER 2010
CLIENT SERVER TOOL : AJAX 2.0
OPERATING SYSTEMS : Microsoft Windows 7
DOCUMENTATION : Microsoft word 2007.
SCRIPTING LANGUAGE : Java Script
2. LITERATURE REVIEW
1. The CN2 induction algorithm”, Machine Learning
Clark, P. and Niblett, T., “The CN2 induction algorithm”, Machine Learning, Vol. 3(4), pp.
261–283, 1999.
The subgroup discovery, domain of application of CN2-SD, is defined as:
‘‘given a population of individuals and a property of those individuals, we are interested in
finding a population of subgroups as large as possible and have the most unusual statistical
characteristic with respect to the property of interest’’. The subgroup discovery algorithm CN2-
SD, based on a separate and conquer strategy, has to face the scaling problem which appears in
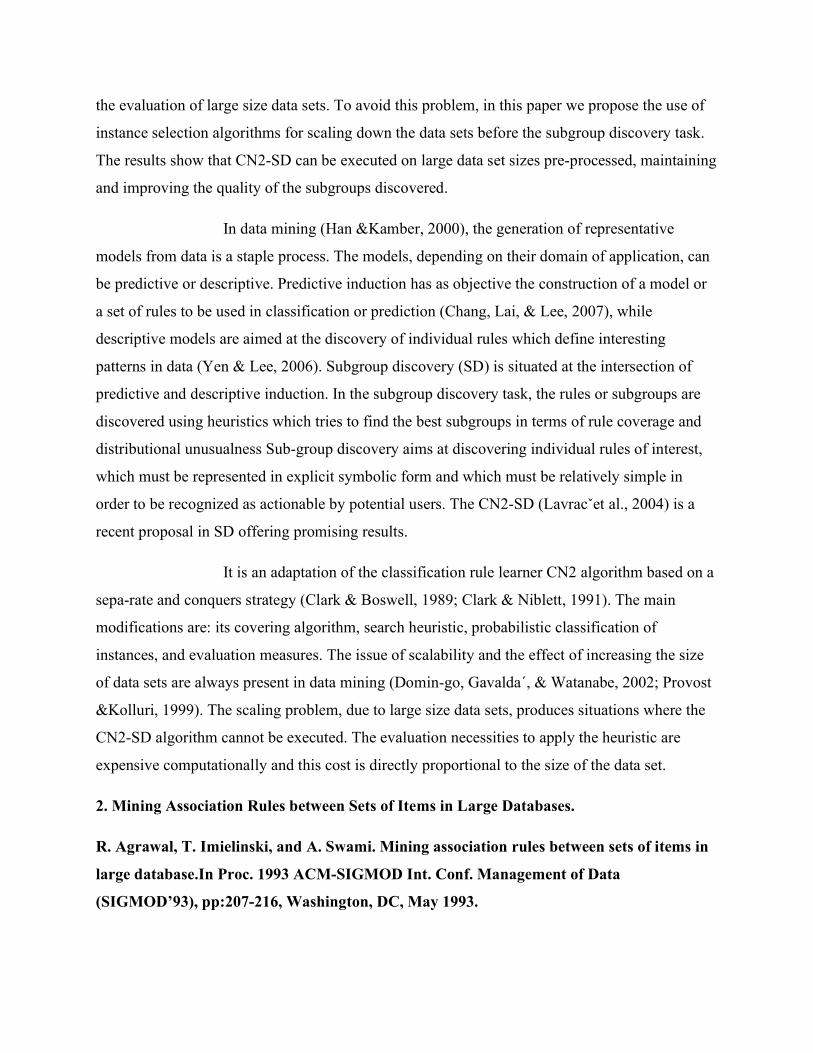
the evaluation of large size data sets. To avoid this problem, in this paper we propose the use of
instance selection algorithms for scaling down the data sets before the subgroup discovery task.
The results show that CN2-SD can be executed on large data set sizes pre-processed, maintaining
and improving the quality of the subgroups discovered.
In data mining (Han &Kamber, 2000), the generation of representative
models from data is a staple process. The models, depending on their domain of application, can
be predictive or descriptive. Predictive induction has as objective the construction of a model or
a set of rules to be used in classification or prediction (Chang, Lai, & Lee, 2007), while
descriptive models are aimed at the discovery of individual rules which define interesting
patterns in data (Yen & Lee, 2006). Subgroup discovery (SD) is situated at the intersection of
predictive and descriptive induction. In the subgroup discovery task, the rules or subgroups are
discovered using heuristics which tries to find the best subgroups in terms of rule coverage and
distributional unusualness Sub-group discovery aims at discovering individual rules of interest,
which must be represented in explicit symbolic form and which must be relatively simple in
order to be recognized as actionable by potential users. The CN2-SD (Lavracˇet al., 2004) is a
recent proposal in SD offering promising results.
It is an adaptation of the classification rule learner CN2 algorithm based on a
sepa-rate and conquers strategy (Clark & Boswell, 1989; Clark & Niblett, 1991). The main
modifications are: its covering algorithm, search heuristic, probabilistic classification of
instances, and evaluation measures. The issue of scalability and the effect of increasing the size
of data sets are always present in data mining (Domin-go, Gavalda´, & Watanabe, 2002; Provost
&Kolluri, 1999). The scaling problem, due to large size data sets, produces situations where the
CN2-SD algorithm cannot be executed. The evaluation necessities to apply the heuristic are
expensive computationally and this cost is directly proportional to the size of the data set.
2. Mining Association Rules between Sets of Items in Large Databases.
R. Agrawal, T. Imielinski, and A. Swami. Mining association rules between sets of items in
large database.In Proc. 1993 ACM-SIGMOD Int. Conf. Management of Data
(SIGMOD’93), pp:207-216, Washington, DC, May 1993.

We are given a large database of customer transactions. Each transaction consists of items
purchased by a customer in a visit. We present an efficient algorithm that generates all
significant association rules between items in the database. The algorithm incorporates buffer
management and novel estimation and pruning techniques. We also present results of applying
this algorithm to sales data obtained from a large retailing company, which shows the
effectiveness of the algorithm.
Consider a supermarket with a large collection of items. Typical business decisions that the
management of the supermarket has to make include what to put on sale, how to design coupons,
how to place merchandise on shelves in order to maximize the profit, etc. Analysis of past
transaction data is a commonly used approach in order to improve the quality of such decisions.
Until recently, however, only global data about the cumulative sales during some time period (a
day, week, a month, etc.) was available on the computer. Progress in bar-code technology has
made it possible to store the so called basket data that stores items purchased on a per-transaction
basis. Basket data type transactions do not necessarily consist of items bought together at the
same point of time. It may consist of items bought by a customer over a period of time.
Examples include monthly purchases by members of a book club or a music club.
The work reported in this paper could be viewed as a step towards enhancing databases with
functionalities to process queries such as (we have omitted the confidence factor specification):
Find all rules that have \Diet Coke" as consequent. These rules may help plan what the store
should do to boost the sale of Diet Coke. Find all rules that have \bagels" in the antecedent.
These rules may help determine what products may be impacted if the store discontinues selling
bagels.
Find all rules that have \sausage" in the antecedent and \mustard" in the consequent. This query
can be phrased alternatively as a request for the additional items that have to be sold together
with sausage in order to make it highly likely that mustard will also be sold.
Find all the rules relating items located on shelves A and B in the store. These rules may help
shelf planning by determining if the sale of items on shelf A is related to the sale of items on
shelf B.

3. Deliver smarter products and services by unifying software development and IT
operations.
IBM, “Deliver smarter products and services by unifying software development and IT
operations,” Issue Date : Sep. 2009, ISBN RAW14175-USEN-00.
At first consideration the answers to these questions are simple: Yes, the organizational
separation of development and IT operations serves an economic purpose. Development and IT
operations serve very distinct functions. Not only do they undertake different work streams with
different tools, processes, and cultures, they are also two very distinct activities from an
economic perspective. Software development focuses on creating new value and IT operations
focuses on assuring the health of that value stream after it has been created. Given this
distinction, specialization within development and operations makes sense. As with many
undertakings, specialization underpins organizational effectiveness, creating value by allowing
teams to focus on a subset of well defined objectives. Specialization, however, only works up to
the point where work flows are contained within organizational boundaries. When focus is put
on the on the larger goal of end-to-end service delivery where workflows must be coupled across
teams, this specialization of tools, skills, and processes can expose the business to unwarranted
risk.Such composite applications are truly powerful: they enable businesses to transform existing
processes without having to rewrite large numbers of existing applications. That said, they tend
to couple the development and IT operation processes. Because composite applications link
many existing applications together in a complex way, many problems may not emerge until the
application runs in a live production environment. This is not a problem with testing — good
tools are available to ensure new applications work correctly— but rather it’s a question of how
the new application impacts the existing environment. We increase costs because we overlap the
processes in development and operations. Take the deployment of applications, for example.
From an operations perspective, deployment into production is typically a well understood,
controlled activity with some level of tooling, process management, and quality assurance in
place. Applications are, however, often deployed—in fact, much more frequently deployed—into
test environments. This process, for most testing organizations, is much less controlled, process-
oriented, or automated than its operational counterpart.

4. Learning Decision Trees Using the Area under the ROC Curve
Cesar Ferri-Ram´ ırez, Peter A. Flach, and Jose Hernandez-Orallo. Learning decision trees
using the area under the roc curve. In Proceedings of the Nineteenth International
Conference on Machine Learning, pages 139–146, Morgan Kaufmann, 2002.
ROC analysis is increasingly being recognised as an important tool for evaluation and
comparison of classifiers when the operating characteristics (i.e. class distribution and cost
parameters) are not known at training time. Usually, each classifier is characterised by its
estimated true and false positive rates and is represented by a single point in the ROC diagram.
In this paper, we show how a single decision tree can represent a set of classifiers by choosing
different labelling of its leaves, or equivalently, an ordering on the leaves. In this setting, rather
than estimating the accuracy of a single tree, it makes more sense to use the area under the ROC
curve (AUC) as a quality metric. We also propose a novel splitting criterion which chooses the
split with the highest local AUC. To the best of our knowledge, this is the first probabilistic
splitting criterion that is not based on weighted average impurity. We present experiments
suggesting that the AUC splitting criterion leads to trees with equal or better AUC value, without
sacrificing accuracy if a single labelling is chosen.Traditionally, classification accuracy (or
error), i.e., the percentage of instances that are correctly classified (respectively incorrectly
classified) has been used as a measure of the quality of classifiers. However, in many situations,
not every misclassification has the same consequences, and problem-dependent misclassification
costs have to be taken into account. If the cost parameters are not known at training time,
Receiver Operating Characteristic (ROC) analysis can be applied (Provost & Fawcett 1997;
Swets, Dawes & Monahan 2000). ROC analysis provides tools to distinguish classifiers that are
optimal under some class and cost distributions from classifiers that are always sub-optimal, and
to select the optimal classifier once the cost parameters are known. ROC analysis for two classes
is based on plotting the true-positive rate (TPR) on the y-axis and the false-positive rate (FPR) on
the x-axis. This gives a point for each classifier. A curve is obtained because, given two
classifiers, we can obtain as many derived classifiers as we want along the segment that connects
them, just by voting them with different weights. Consequently, any point “below” that segment
will have greater cost for any class distribution and cost matrix, because it has lower TPR and/or
higher FPR. According to that property, given several classifiers, one can discard the classifiers

that fall under the convex hull formed by the points representing the classifiers and the points
(0,0) and (1,1), which represent the default classifiers always predicting negative and positive,
respectively.
5. Logical Design of Data Warehouses from XML
M. Banek, Z. Skocir, and B. Vrdoljak.Logical Design of Data Warehouses from XML . In
ConTEL ’05: Proceedings of the 8th international conference on Telecommunications,
volume 1, pages 289–295, 2005.
Data warehouse is a database that collects and integrates data from heterogeneous sources
in order to support a decision making process. Data exchanged over the Internet and intranets has
recently become an important data source, having XML as a standard format for exchange. The
possibility of integrating available XML data into data warehouses plays an important role in
providing enterprise managers with up-to-date and relevant information about their business
domain. We have developed a methodology for data warehouse design from the source XML
Schemas and conforming XML documents. As XML data is semi-structured, data warehouse
design from XML brings many particular challenges. In this paper the final steps of deriving a
conceptual multidimensional scheme are described, followed by the logical design, where a set
of tables is created according to the derived conceptual scheme. A prototype tool has been
developed to test and verify the proposed methodology.
Data warehousing system is a set of technologies and tools that enable decision-makers
(managers and analysts) to acquire, integrate and flexibly analyze information coming from
different sources. The central part of the system is a large database specialized for complex
analysis of historical data, called a data warehouse. The process of building a data warehousing
system includes analysis of the data sources, design of a warehouse model that can successfully
integrate them and later the construction of the warehouse according to the proposed model.
Decision-makers use OLAP (OnLine Analytical Processing) tools to put queries against the
warehouse in a quick, intuitive and interactive way. OLAP tools use the multidimensional data
model, which enables focusing on small pieces of data, generally a few numerical parameters,
that are most interesting for the decision making process. Other data in the warehouse are

organized hierarchically into several independent groups, called dimensions, and used to perform
calculations with the few important parameters. Data warehouses, owned by big enterprises and
organizations, integrate data from heterogeneous sources: relational databases or other legacy
database models, semi-structured data and different file formats. Recently, the World Wide Web,
Web services and different information systems for exchanging data over the Internet and private
networks have become an important data source.
6. A multisession-based multidimensional model
M. Body, M. Miquel, Y. B´edard, and A. Tchounikine. A multidimensional and multi
version structure for OLAP applications. In DOLAP ’02: Proceedings of the 5th ACM
international workshop on Data Warehousing and OLAP, pages 1–6, New York, NY,
USA,2002. ACM.
This paper addresses the problem of how to specifychanges in multidimensional
databases. These changes may be motivated by evolutions ofuser requirements as well as
changes of operationalsources. The multiversion-based multidimensional model we provide
supports both data and structure changes. The approach consists in storing star versions
according to relevant structure changes whereas data changes are recordedthrough dimension
instances and fact instances in a star version. Themodel is able to integrate mapping functions to
populate multiversion-based multidimensional databases.
On-Line Analytical Processing (OLAP) has emerged tosupport multidimensional data analysis
by providing manipulations through aggregations of data drawn from various transactional
databases. This approach is often based on a Multidimensional DataBase (MDB). A MDB
schema [1] is composed of a fact (subject of analysis) and dimensions (axes of analysis). A fact
contains indicators or measures. A measure is the data item of interest. As mentioned in [2], fact
data reflect the dynamic aspect whereas dimension data represent more static information.
However, sources (transactional databases) may evolve and these changes have an impact on
structures and contents of the MDB built on them. In the same way, user requirement evolutions
may induce schema changes; eg. to create a new dimension or a new “dimension member” [3],
to add a new measure,…Changes occur on dimensions as well as facts. This paper addresses the
problem of how to specify changes in a MDB. The changes may be related to contents as well as

schema structures. Our work is not limited to represent the mapping data into the mostrecent
version of the schema. We intend to keep trace of changes of multidimensionalstructures.
7.Transaction Management for a Main-Memory Database
P. Burte, B. Aleman-meza, D. B. Weatherly, R. Wu, S. Professor, and J. A. Miller.
Transaction Management for a Main-Memory Database. The 38th Annual South eastern
ACM Conference, Athens, Georgia, pages 263–268, January 2001.
As part of research by members of the Department of Computer Science at the University
of Georgia, we have developed a Java-based Transaction Manager that fits into the multi-layered
design of MMODB, a main-memory database system. We have sought to maximize the benefits
of the Java programming language and to implement transaction principles that are suitable for
in-memory databases. In this paper, we examine the details of thread concurrency and resource
locking protocols, our deadlock prevention scheme, and the Java-based implementation of these
design decisions. We show the effectiveness of our design with performance tests that simulate
typical transactions on a highly concurrent database system.
8. Discovering business intelligence from online product reviews: A rule-induction
framework.
W. Chung and H. Chen. Web-Based Business Intelligence Systems: A Review and
CaseStudies. In G. Adomavicius and A. Gupta,editors, Business Computing, volume
3,chapter 14, pages 373–396. Emerald GroupPublishing, 2009.
Online product reviews are a major source of business intelligence (BI) that helps
managers and marketers understand customers’ concerns and interests. The large volume of
review data makes it difficult tomanually analyze customers’ concerns. Automated tools have
emerged to facilitate this analysis, howevermost lack the capability of extracting the
relationships between the reviews’ rich expressions and thecustomer ratings. Managers and
marketers often resort to manually read through voluminous reviewsto find the relationships. To
address these challenges, we propose the development of a new class of BIsystems based on
rough set theory, inductive rule learning, and information retrieval methods. We developed a

new framework for designing BI systems that extract the relationship between the customer
ratings and their reviews. Using reviews of different products from Amazon.com, we conducted
bothqualitative and quantitative experiments to evaluate the performance of a BI system
developed basedon the framework. The results indicate that the system achieved high accuracy
and coverage related torule quality, and produced interesting and informative rules with high
support and confidence values.The findings have important implications for market sentiment
analysis and e-commerce reputation management.
As e-commerce supports higher interactivity among users withWeb 2.0 applications,
user-generated content posted on these sitesis growing significantly. Users not only consume
Web content, butalso produce massive data of their participation, often affectingother users’
decisions. A study finds that more than three-quartersof the 2078 users reported that online
product reviews had a significant influence on their purchase decisions (comScore, 2007).These
online product reviews contain descriptions about user preferences, comments, and
recommendations that serve as a majorsource of business intelligence (BI), helping managers
and marketers to better understand customers. Management scholar PeterDrucker emphasizes
that ‘‘what is value to the customer’’ may bethe most important question to answer in order to
realize a business’s mission and purpose (Drucker, 2003). However, the largevolume of online
product review data creates significant information overload problems (Bowman, Danzig,
Manber, & Schwartz,1994), making it difficult to discover BI from the reviews and toanalyze
customer concerns.
9. Crowd sourcing Predictors of Behavioural Outcomes.
Josh C. Bongard, Member, IEEE, Paul D. H. Hines, Member, IEEE, Dylan Conger, Peter
Hurd, and Zhenyu Lu. IEEE TRANSACTIONS ON KNOWLEDGE AND DATA
ENGINEERING YEAR 2013.
Generating models from large data sets—and deter-mining which subsets of data to
mine—is becoming increasinglyautomated. However choosing what data to collect in the
firstplace requires human intuition or experience, usually suppliedby a domain expert. This paper
describes a new approachto machine science which demonstrates for the first time thatnon-
domain experts can collectively formulate features, andprovide values for those features such
that they are predictiveof some behavioural outcome of interest. This was accomplishedby
building a web platform in which human groups interact toboth respond to questions likely to
help predict a behavioural outcome and pose new questions to their peers. This resultsin a
dynamically-growing online survey, but the result of thiscooperative behaviour also leads to
models that can predict user’soutcomes based on their responses to the user-generated
surveyquestions. Here we describe two web-based experiments thatinstantiate this approach: the
first site led to models that canpredict users’ monthly electric energy consumption; the other
ledto models that can predict users’ body mass index. As exponentialincreases in content are
often observed in successful onlinecollaborative communities, the proposed methodology may,
inthe future, lead to similar exponential rises in discovery andinsight into the causal factors of
behavioural outcomes.
There are many problems in which one seeks to developpredictive models to map between a set
of predictor variablesand an outcome. Statistical tools such as multiple regressionor neural
networks provide mature methods for computingmodel parameters when the set of predictive
covariates and themodel structure are pre-specified. Furthermore, recent researchis providing
new tools for inferring the structural form ofnon-linear predictive models, given good input and
output data. However, the task of choosing which potentiallypredictive variables to study is
largely a qualitative task thatrequires substantial domain expertise. For example, a
surveydesigner must have domain expertise to choose questions thatwill identify predictive
covariates. An engineer must developsubstantial familiarity with a design in order to
determinewhich variables can be systematically adjusted in order tooptimize performance.
10. Feature Selection Based on Class-Dependent Densities for High-Dimensional Binary
Data.
Kashif Javed, Haroon A. Babri, and Mehreen Saeed. Ieee transactions on knowledge and
data engineering, vol. 24, no. 3, march 2012.
Data and knowledge management systems employ feature selection algorithms
for removing irrelevant, redundant, and noisy information from the data. There are two
well-known approaches to feature selection, feature ranking (FR) and feature subset
selection (FSS). In this paper, we propose a new FR algorithm, termed as class-dependent
density-based feature elimination (CDFE), for binary data sets. Our theoretical analysis
shows that CDFE computes the weights, used for feature ranking, more efficiently as
compared to the mutual information measure. Effectively, rankings obtained from both
the two criteria approximate each other. CDFE uses a fill trapper approach to select a
final subset. For data sets having hundreds of thousands of features, feature selection with
FR algorithms is simple and computationally efficient but redundant information may not
be removed. On the other hand, FSS algorithms analyze the data for redundancies but
may become computationally impractical on high-dimensional data sets. We address
these problems by combining FR and FSS methods in the form of a two-stage feature
selection algorithm. When introduced as a pre processing step to the FSS algorithms,
CDFE not only presents them with a feature subset, well in terms of classification, but
also relieves them from heavy computations. Two FSS algorithms are employed in the
second stage to test the two-stage feature selection idea. We carry out experiments with
two different classifiers (naive Bayes’ and kernel ridge regression) on three different real-
life data sets (NOVA, HIVA, and GINA) of the “Agnostic Learning versus Prior
Knowledge” challenge. As a stand-alone method, CDFE shows up to about 92 percent
reduction in the feature set size. When combined with the FSS algorithms in two-stages,
CDFE significantly improves their classification accuracy and exhibits up to 97 percent
reduction in the feature set size. We also compared CDFE against the winning entries of
the challenge and found that it outperforms the best results on NOVA and HIVA while
obtaining a third position in case of GINA.
11. Techniques, Process, and Enterprise Solutions of Business Intelligence.
Li Zeng, Lida Xu, Zhongzhi Shi, Maoguang Wang, and Wenjuan Wu. 2006 IEEE
Conference on Systems, Man, and Cybernetics October 8-11, 2006, Taipei, Taiwan.
Business Intelligence (BI) has been viewed as sets of powerful tools and approaches to
improving business executive decision-making, business operations, and increasing the value of
the enterprise. The technology categories of BI mainly encompass Data Warehousing, OLAP,
and Data Mining. This article reviews the concept of Business Intelligence and provides a
survey, from a comprehensive point of view, on the BI technical framework, process, and
enterprise solutions. In addition, the conclusions point out the possible reasons for the difficulties
of broad deployment of enterprise BI, and the proposals of constructing a better BI system. As
businesses continue to use computer systems for a growing number of functions in today’s
competitive, fast-evolving world, most companies face the challenges of processing and
analyzing huge amounts of data and turning it into profits. They have large volumes of detailed
operational data, but key business analysts and decision makers still cannot get the answers they
need to react quickly enough to changing conditions because the data are spread across many
departments in the organization or are locked in a sluggish technology environment. In these
cases, Business Intelligence (BI) is presented, which are sets of tools, technologies and solutions
designed for end users to efficiently extract useful business information from oceans of data.
Nowadays, BI has been viewed as sets of powerful tools and approaches to increasing the value
of the enterprise. More and more business sectors have deployed advanced BI solutions to
enhance their competitiveness since it is important to the effective and efficient running of the
enterprises.
12. Support vector machine with adaptive parameters in financial time series forecasting.
Cao, L.J. ; Dept. of Mech. Eng., Nat. Univ. of Singapore, Singapore ; Tay, F.E.H. EEE
Transactions on, On page(s): 1167 - 1178 Volume: 19, Issue: 7, July 2008
A novel type of learning machine called support vector machine (SVM) has been
receiving increasing interest in areas ranging from its original application in pattern recognition
to other applications such as regression estimation due to its remarkable generalization
performance. This paper deals with the application of SVM in financial time series forecasting.
The feasibility of applying SVM in financial forecasting is first examined by comparing it with
the multilayer back-propagation (BP) neural network and the regularized radial basis function
(RBF) neural network. The variability in performance of SVM with respect to the free
parameters is investigated experimentally. Adaptive parameters are then proposed by
incorporating the nonstationarity of financial time series into SVM. Five real futures contracts
collated from the Chicago Mercantile Market are used as the data sets. The simulation shows that
among the three methods, SVM outperforms the BP neural network in financial forecasting, and
there are comparable generalization performance between SVM and the regularized RBF neural
network. Furthermore, the free parameters of SVM have a great effect on the generalization

performance. SVM with adaptive parameters can both achieve higher generalization
performance and use fewer support vectors than the standard SVM in financial forecasting.
13. Financial time series modelling with discounted least squares back-propagation.
A. N. Refenes, Y. Bentz, D. W. Bunn, A. N. Burgess, and A. D. Zapranis, "Financial time
series modeling with discounted least squares back-propagation", Neuro computing, vol.
14, pp.123 -138 1997.
We propose a simple modification to the error back propagation procedure which takes
into account gradually changing input-output relations. The procedure is based on the principle
of Discounted least squares whereby learning is biased towards more recent observations with
long term effects experiencing exponential decay through time. This is particularly important in
systems in which the structural relationship between input and response vectors changes
gradually over time but certain elements of long term memory are still retained. The procedure is
implemented by a simple modification of the least-squares cost function commonly used in error
back propagation. We compare the performance of the two cost functions using both a controlled
simulation experiment and a non-trivial application in estimating stock returns on the basis of
multiple factor exposures. We show that in both cases the DLS procedure gives significantly
better results. Typically, there is an average improvement of above 30% (in MSE terms) for the
stock return modelling problem.
14. Stock Market Value Prediction Using Neural Networks.
T. Kimoto, K. Asakawa, M. Yoda, and M. Takeoka, "Stock market prediction system with
modular neural networks", Neural Networks in Finance and Investing, pp.343 -357 1993
Neural networks, as an intelligent data mining method, have been used in
many different challenging pattern recognition problems such as stock market prediction.
However, there is no formal method to determine the optimal neural network for prediction
purpose in the literature. In this paper, two kinds of neural networks, a feed forward multi layer
Perception (MLP) and an Elman recurrent network, are used to predict a company’s stock value
based on its stock share value history. The experimental results show that the application of MLP
neural network is more promising in predicting stock value changes rather than Elman recurrent
network and linear regression method. However, based on the standard measures that will be
presented in the paper we find that the Elman recurrent network and linear regression can predict
the direction of the changes of the stock value better than the MLP.From the beginning of time it
has been man’s common goal to make his life easier. The prevailing notion in society is that
wealth brings comfort and luxury, so it is not surprising that there has been so much work done
on ways to predict the markets. Therefore forecasting stock price or financial markets has been
one of the biggest challenges to the AI community. Various technical, fundamental, and
statistical indicators have been proposed and used with varying results. However, none of these
techniques or combination of techniques has been successful enough. The objective of
forecasting research has been largely beyond the capability of traditional AI research which has
mainly focused on developing intelligent systems that are supposed to emulate human
intelligence. By its nature the stock market is mostly complex (non-linear) and volatile. With the
development of neural networks, researchers and investors are hoping that the market mysteries
can be unravelled.
15. Application of a Case Base Reasoning Based Support Vector Machine for Financial
Time Series Data Forecasting.
Pei-Chann Chang, Chi-Yang Tsai, Chiung-Hua Huang, Chin-Yuan Fan 5th International
Conference on Intelligent Computing, ICIC 2009 Ulsan, South Korea, September 16-19,
2009 Proceedings
This paper establishes a novel financial time series-forecasting model, by clustering and
evolving support vector machine for stocks on S&P 500 in the U.S. This forecasting model
integrates a data clustering technique with Case Based Reasoning (CBR) weighted clustering and
classification with Support Vector Machine (SVM) to construct a decision-making system based
on historical data and technical indexes. The future price of the stock is predicted by this
proposed model using technical indexes as input and the forecasting accuracy of the model can
also be further improved by dividing the historic data into different clusters. Overall, the results
support the new stock price predict model by showing that it can accurately react to the current
tendency of the stock price movement from these smaller cases. The hit rate of CBR-SVM model
is 93.85% the highest performance among others.
16. Self-Organizing Roles on Agile Software Development Teams.
Rashina Hoda,Member, IEEE, James Noble, Member, IEEE, and Stuart Marshall,
Member, IEEE. IEEE TRANSACTIONS ON SOFTWARE ENGINEERING, VOL. 39,
NO. 3, MARCH 2013
Self-organizing teams have been recognized and studied in various forms—as
autonomous groups in socio-technicalsystems, enablers of organizational theories, agents of
knowledge management, and as examples of complex-adaptive systems. Overthe last decade,
self-organizing teams have taken centre stage in software engineering when they were
incorporated as a hallmark ofagile methods. Despite the long and rich history of self-organizing
teams and their recent popularity with Agile methods, there hasbeen little research on the topic
within software engineering. Particularly, there is a dearth of research on how Agile teams
organizethemselves in practice. Through a Grounded Theory research involving 58 Agile
practitioners from 23 software organizations in NewZealand and India over a period of four
years, we identified informal, implicit, transient, and spontaneous roles that make Agile
teamsself-organizing. These roles—Mentor, Coordinator, Translator, Champion, Promoter, and
Terminator—are focused toward providinginitial guidance and encouraging continued adherence
to Agile methods, effectively managing customer expectations and coordinatingcustomer
collaboration, securing and sustaining senior management support, and identifying and removing
team members threateningthe self-organizing ability of the team. Understanding these roles will
help software development teams and their managers bettercomprehend and execute their roles
and responsibilities as a self-organizing team. SELF-ORGANIZINGteams have been recognized
and studiedin various forms—as autonomous groups in socio-technical systems as early as in the
1950s, as enablers ofholographic organizations in organizational theory and asagents of
knowledge creation and management around the1980s, and as examples of entities exhibiting
spontaneousorder in Complex Adaptive Systems (CAS) in the 1990s. Morerecently, with the rise
of Agile methods in the late 1990s andearly 2000s, self-organizing teams took centre stage in
thesoftware engineering arena when they were incorporated asa hallmark of Agile software
development.Self-organizing teams are at the heart of Agile softwaredevelopment Self-
organizing Agileteams are composed of “individuals [that] manage their ownworkload, shift

work among themselves based on need and best fit,and participate in team decision making”.
Self-organizingteams must have common focus, mutual trust, respect, andthe ability to organize
repeatedly to meet new challenges.The scrum method specifically mentions self-organizingagile
teams and the concept of “empowered” teams hasrecently been added to XP. Self-organizing
teams are not only seen as enabling Agileengineering practices, but also as capturing the spirit of
Agilevalues and principles, which focus on human and socialaspects of software engineering.
Self-organizing teams is oneof the principles behind the Agile Manifesto and have beenidentified
as one of the critical success factors of Agileprojects.
3. METHODOLOGIES
3.1 Mine the transaction Data
3.1.1 Introduction to Transaction data
Transactional data will be data straightforwardly determined because of exchanges. Not
at all like different sorts of information, value-based information contains a period measurement
which implies that there is timeline to it and after some time, it turns out to be less pertinent.
Instead of being the question of exchanges like the item being acquired or the personality of the
client, it is all the more a reference information portraying the time, put, costs, instalment
techniques, markdown qualities, and amounts identified with that specific exchange, as a rule at
the purpose of offer
Transactional data depicts an interior or outer occasion which happens as the association
conducts business and can be budgetary, calculated or any business-related process including
exercises, for example, buys, demands, protection claims, stores, pulls back, and so on.
Transactional data bolster continuous business operations and are incorporated into the data and
application frameworks that are utilized to mechanize an association's key business procedures,
for example, online transaction processing (OLTP) systems.
It is assembled with its related and references ace information, for example, item data and
charging sources. As a piece of value-based records, value-based information is gathered with

related ace information and reference information. Value-based information records a period and
pertinent reference information required for a Transactional data record.
3.1.2 Mining
Transaction Data
from Database
At whatever point
data or information is put
away, controlled, or
"oversaw" in a database, the
operation is thought to be a database transaction. The term demonstrates that there has been work
achieved inside the database administration framework or in the database itself. So as to
guarantee security, a database exchange happens independently from different exchanges inside
the framework to guarantee that all data put away stays available, secure, and rational.
A transaction database is a DBMS those backings the moving back of exchanges on the
information stores if not finished legitimately. Interference in the transaction can be caused by
control misfortune or an intrusion in availability to the information store. The lion's share of
databases being used today bolster exchanges. These operations can comprise of one or
numerous information control questions or proclamations. Since information trustworthiness and
consistency are basic to legitimate database operation, most exchanges utilize SQL or a SQL-like
dialect to lead operations utilizing the accompanying following pattern:
Step 1: Initiate the transaction process.
Step 2: Execute the keyword provided from the data queries or else manipulate manually.
Step 3: Process the transaction to be complete it if there are no errors or warning during the
process.

Step 4: If any error occurs during the transaction, roll back the process to the operation end and
start again.
The above mentioned process will provide transaction dataset from a database using keywords.
Even in case of error occurrence, there is a possibility to roll back the database to the original
position and can start the process from the beginning.
3.1.2 Fetching transaction data
The SQL language is in a general sense value-based in nature. There are various database
usage of the SQL standard being used today which expand the dialect and execute an express
"Begin TRANSACTION" proclamation; in any case, this activity basically deactivates the auto
submit articulation.
After this point, no operations on the database wind up noticeably obvious to different
employments of the information store until a COMMIT articulation is process by the framework.
A SQL deep ROLLBACK articulation can likewise be executed which will fix any work led on
the framework since the last fruitful exchange. The ROLLBACK and COMMIT explanations
will finish up an exchange and begin the following. On the off chance that the DBMS debilitated
the auto submit highlight utilizing a START TRANSACTION explanation, it will be re-
empowered. Elective usage of SQL likewise utilize the accompanying articulations: BEGIN,
BEGIN WORK, and BEGIN TRANSACTION.
3.2 Association rules to find out relationship
3.2.1 Association Rules
Association rule mining is a technique which is intended to discover frequent patterns,
connections, affiliations, or causal structures from informational collections found in different
sorts of databases, for example, social databases, value-based databases, and different types of
information vaults.
Given an arrangement of exchanges, affiliation manage mining plans to discover the
principles which empower us to foresee the event of a particular thing in view of the events of
alternate things in the exchange. Affiliation administer mining is the information mining
procedure of finding the standards that may oversee affiliations and causal questions between
sets of things. So in a given exchange with numerous things, it tries to discover the principles
that represent how or why such things are frequently purchased together.
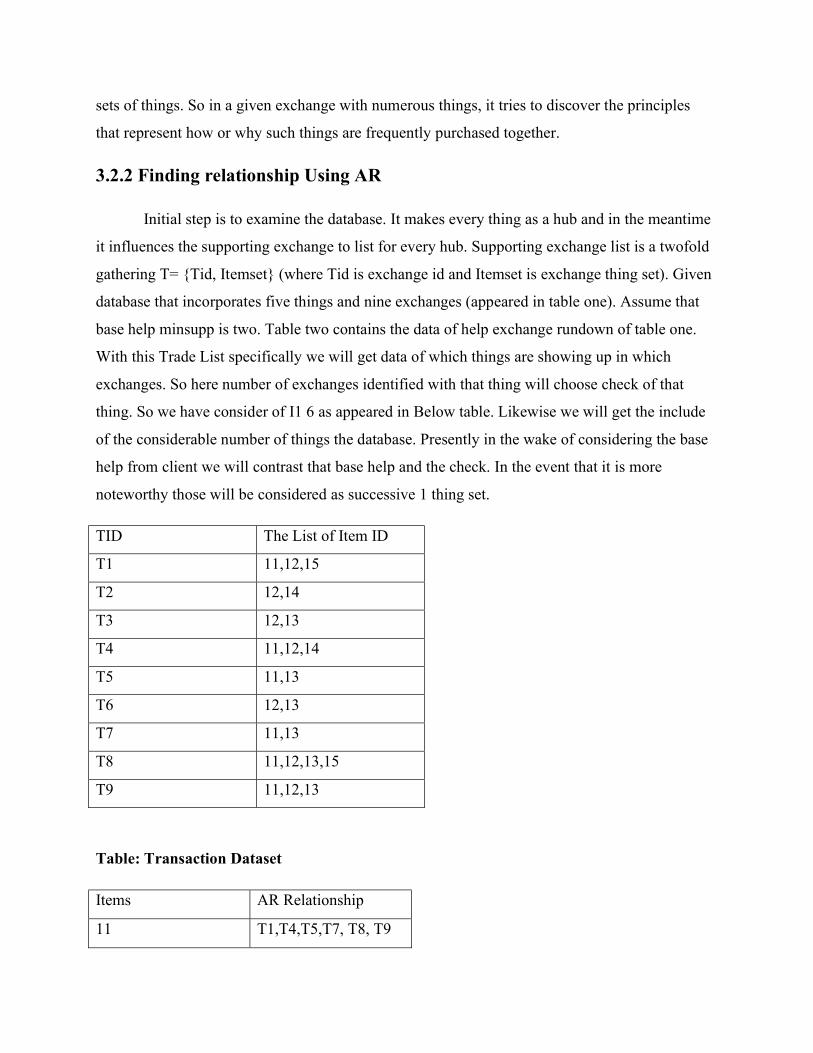
3.2.2 Finding relationship Using AR
Initial step is to examine the database. It makes every thing as a hub and in the meantime
it influences the supporting exchange to list for every hub. Supporting exchange list is a twofold
gathering T= {Tid, Itemset} (where Tid is exchange id and Itemset is exchange thing set). Given
database that incorporates five things and nine exchanges (appeared in table one). Assume that
base help minsupp is two. Table two contains the data of help exchange rundown of table one.
With this Trade List specifically we will get data of which things are showing up in which
exchanges. So here number of exchanges identified with that thing will choose check of that
thing. So we have consider of I1 6 as appeared in Below table. Likewise we will get the include
of the considerable number of things the database. Presently in the wake of considering the base
help from client we will contrast that base help and the check. In the event that it is more
noteworthy those will be considered as successive 1 thing set.
TID The List of Item ID
T1 11,12,15
T2 12,14
T3 12,13
T4 11,12,14
T5 11,13
T6 12,13
T7 11,13
T8 11,12,13,15
T9 11,12,13
Table: Transaction Dataset
Items AR Relationship
11 T1,T4,T5,T7, T8, T9
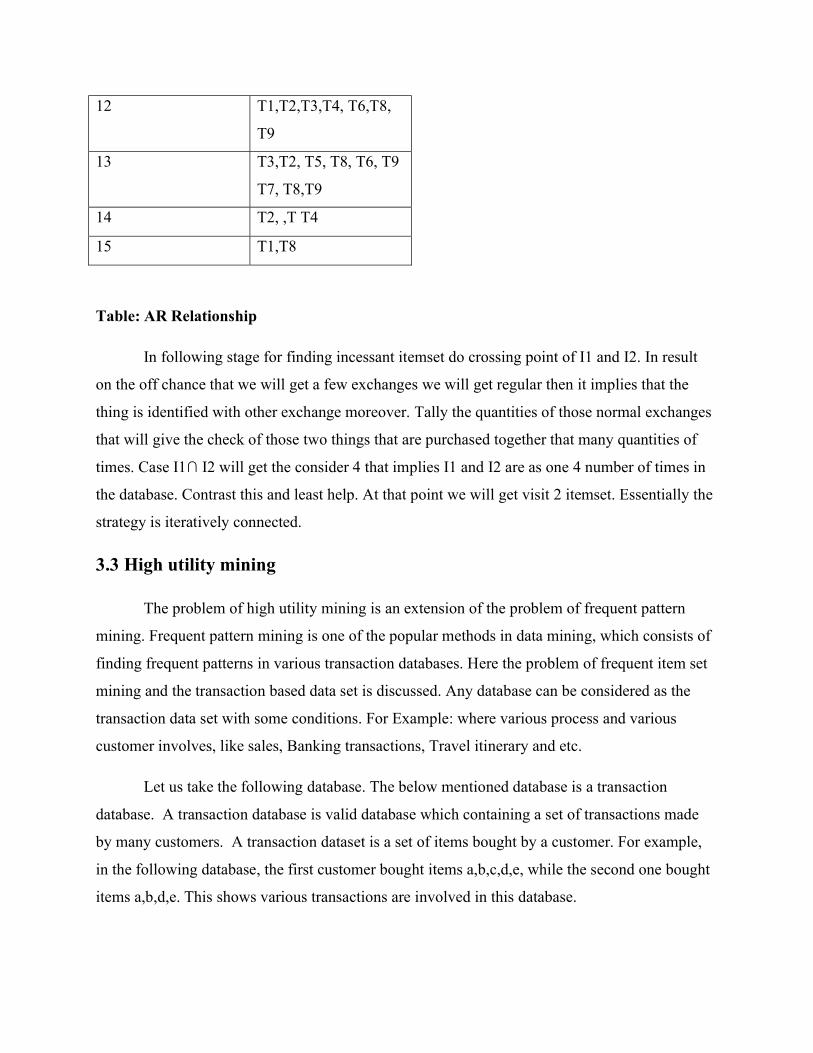
12 T1,T2,T3,T4, T6,T8,
T9
13 T3,T2, T5, T8, T6, T9
T7, T8,T9
14 T2, ,T T4
15 T1,T8
Table: AR Relationship
In following stage for finding incessant itemset do crossing point of I1 and I2. In result
on the off chance that we will get a few exchanges we will get regular then it implies that the
thing is identified with other exchange moreover. Tally the quantities of those normal exchanges
that will give the check of those two things that are purchased together that many quantities of
times. Case I1∩ I2 will get the consider 4 that implies I1 and I2 are as one 4 number of times in
the database. Contrast this and least help. At that point we will get visit 2 itemset. Essentially the
strategy is iteratively connected.
3.3 High utility mining
The problem of high utility mining is an extension of the problem of frequent pattern
mining. Frequent pattern mining is one of the popular methods in data mining, which consists of
finding frequent patterns in various transaction databases. Here the problem of frequent item set
mining and the transaction based data set is discussed. Any database can be considered as the
transaction data set with some conditions. For Example: where various process and various
customer involves, like sales, Banking transactions, Travel itinerary and etc.
Let us take the following database. The below mentioned database is a transaction
database. A transaction database is valid database which containing a set of transactions made
by many customers. A transaction dataset is a set of items bought by a customer. For example,
in the following database, the first customer bought items a,b,c,d,e, while the second one bought
items a,b,d,e. This shows various transactions are involved in this database.
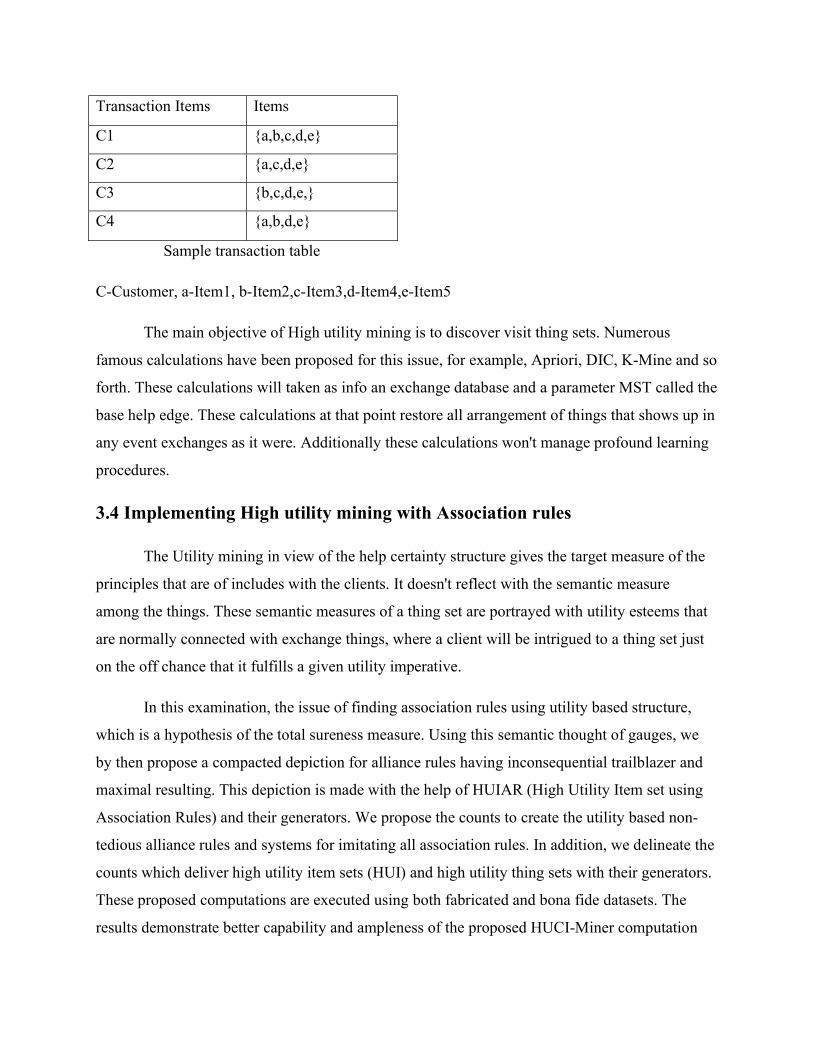
Sample transaction table
C-Customer, a-Item1, b-Item2,c-Item3,d-Item4,e-Item5
The main objective of High utility mining is to discover visit thing sets. Numerous
famous calculations have been proposed for this issue, for example, Apriori, DIC, K-Mine and so
forth. These calculations will taken as info an exchange database and a parameter MST called the
base help edge. These calculations at that point restore all arrangement of things that shows up in
any event exchanges as it were. Additionally these calculations won't manage profound learning
procedures.
3.4 Implementing High utility mining with Association rules
The Utility mining in view of the help certainty structure gives the target measure of the
principles that are of includes with the clients. It doesn't reflect with the semantic measure
among the things. These semantic measures of a thing set are portrayed with utility esteems that
are normally connected with exchange things, where a client will be intrigued to a thing set just
on the off chance that it fulfills a given utility imperative.
In this examination, the issue of finding association rules using utility based structure,
which is a hypothesis of the total sureness measure. Using this semantic thought of gauges, we
by then propose a compacted depiction for alliance rules having inconsequential trailblazer and
maximal resulting. This depiction is made with the help of HUIAR (High Utility Item set using
Association Rules) and their generators. We propose the counts to create the utility based non-
tedious alliance rules and systems for imitating all association rules. In addition, we delineate the
counts which deliver high utility item sets (HUI) and high utility thing sets with their generators.
These proposed computations are executed using both fabricated and bona fide datasets. The
results demonstrate better capability and ampleness of the proposed HUCI-Miner computation
Transaction Items Items
C1 {a,b,c,d,e}
C2 {a,c,d,e}
C3 {b,c,d,e,}
C4 {a,b,d,e}

appeared differently in relation to other without a doubt comprehended existing figurings.
Additionally, the exploratory results demonstrate better quality in the compacted depiction of the
entire control set under the contemplated structure
3.4.2 High Utility mining Transaction with AR
The traditional association rules mining (ARM) techniques depend on support confidence
framework in which all items are given same importance by considering the presence of an item
within a transaction, but not the profit of item in that transaction. The goal of such techniques is
to extract all the frequent item sets, where the item sets having the given minimum support such
that the support is the percentage of transactions containing the itemset, which generate all the
valid association rules A → B from frequent item set A ∪ B whose confidence has at least the
user defined confidence such that the confidence is the percentage of transactions containing
item set B among the set of transactions containing A. In other words, given a subset of the items
in an item set, we need to predict the probability of the purchase of the remaining items in a
transactional database. In general, from confidence of a rule generated from an item set, we can
know the percentage of number transactions of the items, which is sold together with remaining
items of that item set. However, we may not know the percentage of its profit obtained.
Therefore, if we can know the percentage of the items’ profit, we are in a position to find out a
rule, which is more valuable than support and confidence, and as a result, it can allow us to
permit with more accurate financial analysis and decisions. Nevertheless, this support-confidence
framework does not provide the semantic measure of the rule but only it provides the statistical
measure as the relative importance of items is not considered. However, such measure is not an
adequate measure to the decision maker as the item set cannot be measured in terms of stock,
cost or profit, called utility. Consider a sales manager who aims to promote item sets to increase
the item selling. The following example is evident that a support-confidence based framework
for association rule mining may mislead the manager in the decision making for determining the
financial implications of an item set.
Tid Transaction
T1 A(4),C(1), E(6), F(2)
T2 D(1), E(4), F(5)

T3 B(4), D(1), E(5), F(1)
T4 D(1), E(2), F(6)
T5 A(3),C(1), E(1)
T6 B(1), F(2), H(1)
T7 D(1), E(1), F(4), G(1), H(1)
T8 D(7), E(3)
T9 G(10)
Table : High utility with AR
3.5 Method of FP growth
3.5.1 FP growth
FP Growth is a certainty is utilized as intriguing measures for deciding the significance of an
affiliation run the show. The help of a manage exactly gives the factual valuable data of the
comparing itemset from which the administer is inferred yet it doesn't show the relative
significance of itemsets, which confines its money related ramifications. The certainty measure
demonstrates the factual contingent measure of the intriguing quality of the affiliation run the
show. In any case, it doesn't give any esteem based choice as demonstrated in Example 1. Note
that there are other fascinating measures in view of the likelihood, for example, Lift, Conviction
and Leverage, which are clarified. Nonetheless, these fascinating measures don't think about the
amount of every thing in an exchange and the benefit of every thing.
3.5.2 FP Growth Definition
Definition 1. The utility of a thing iℓ in an exchange td is signified by u(iℓ, td) and characterized
by the result of inner utility q(iℓ, td) and outer utility pℓ of iℓ, that is, u(iℓ, td) = pℓ × q(iℓ, td).
Definition 2. The utility of an itemset X contained in an exchange td, signified by u(X, td) and
characterized by the aggregate of utility of each thing of X in td. As it were, u(X, td) = P
iℓ∈X∧X⊆td u(iℓ, td).
Definition 3. The utility of an itemset X in D is indicated by u(X) and characterized by the total
of the utilities of X in every one of the exchanges containing X in D, that is, u(X) = P
X⊆td∧td∈D u(X, td) = P X⊆td∧td∈D P iℓ∈X u(iℓ, td). The arrangement of exchanges
containing an itemset X, in database D is known as the anticipated database of itemset X and it is
indicated by DX.
Definition 4. An itemset X is known as a high utility itemset, if the utility of X has at any rate the
client indicated least utility limit, min util. Else, it is known as a low utility itemset. Give H a
chance to be the total arrangement of high utility itemsets. At that point, H = {X|X ∈F , u(X) ≥
min util}.
Example
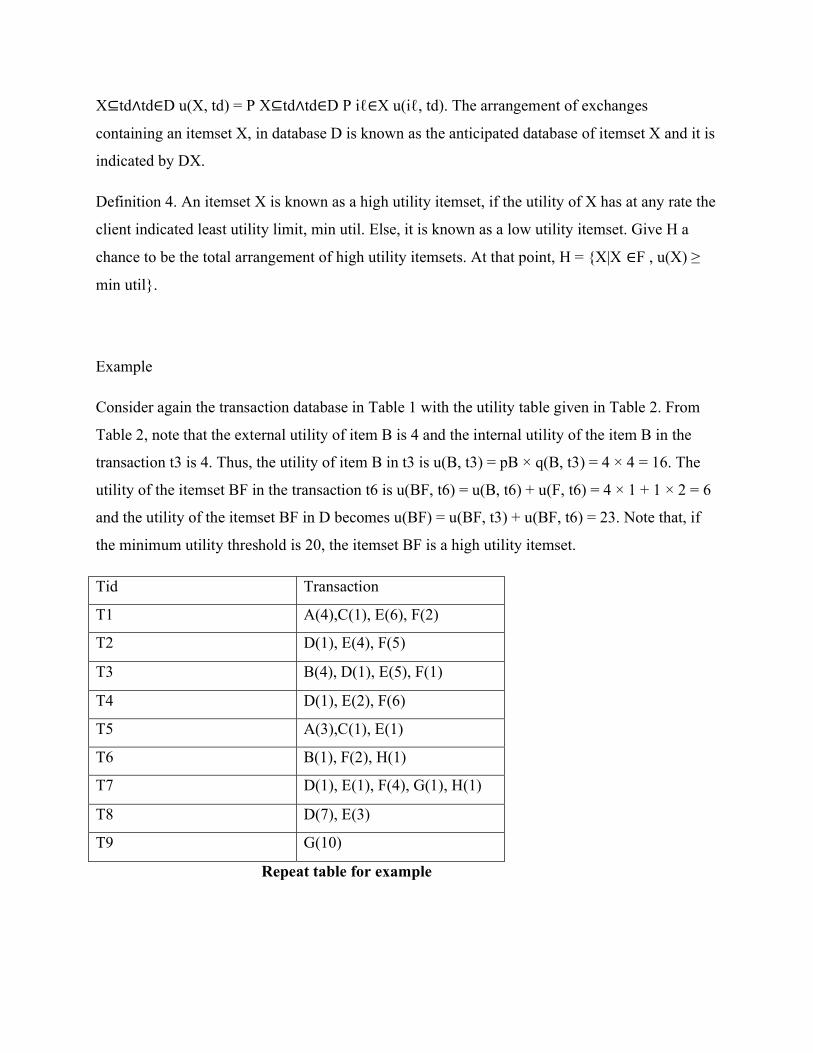
Consider again the transaction database in Table 1 with the utility table given in Table 2. From
Table 2, note that the external utility of item B is 4 and the internal utility of the item B in the
transaction t3 is 4. Thus, the utility of item B in t3 is u(B, t3) = pB × q(B, t3) = 4 × 4 = 16. The
utility of the itemset BF in the transaction t6 is u(BF, t6) = u(B, t6) + u(F, t6) = 4 × 1 + 1 × 2 = 6
and the utility of the itemset BF in D becomes u(BF) = u(BF, t3) + u(BF, t6) = 23. Note that, if
the minimum utility threshold is 20, the itemset BF is a high utility itemset.
Tid Transaction
T1 A(4),C(1), E(6), F(2)
T2 D(1), E(4), F(5)
T3 B(4), D(1), E(5), F(1)
T4 D(1), E(2), F(6)
T5 A(3),C(1), E(1)
T6 B(1), F(2), H(1)
T7 D(1), E(1), F(4), G(1), H(1)
T8 D(7), E(3)
T9 G(10)
Repeat table for example

Item Utility
A 3
B 4
C 5
D 2
E 1
F 1
G 2
H 1
3.6 Database Shrinking using Memory Management
3.6.1 Memory Management
In this proposal memory administration includes keeping up ideal sizes for the Transactional
Database occurrence memory structures as requests on the database change. The memory
structures that must be overseen are the system global area (SGA) and the instance program
global area(instance PGA).
The Transaction Database bolsters different memory administration strategies, which are picked
by introduction parameter settings. The framework suggests that strategy empower in this
proposal is known as programmed memory administration.
3.6.2 Data shrinking in Transaction database
DBCC SHRINKDATABASE-SRDB
( database_name | database_id | 0
[ ,target_percent, provide keyword ]
[ , { NOTRUNCATE | TRUNCATEONLY | TRUNCATE } ]

) [ WITH NO_INFOMSGS ]
database_name | database_id | 0
Is the name or ID of the database to be contracted. In the event that 0 is determined, the present
database is utilized.
target_percent
Is the level of free space that you need left in the database document after the database has been
contracted.
NO TRUNCATE
Compacts the information in information documents by moving designated pages from the finish
of a record to unallocated pages in the front of the document. target_percent is discretionary. The
free space toward the finish of the document isn't came back to the working framework, and the
physical size of the record does not change. In this way, when NOTRUNCATE is determined,
the database shows up not to recoil. NOTRUNCATE is relevant just to information records. The
log record isn't influenced.
TRUNCATEONLY
Discharges all free space toward the finish of the document to the working framework however
does not play out any page development inside the record. The information document is
contracted just to the last designated degree. target_percent is disregarded if determined with
TRUNCATEONLY.
TRUNCATEONLY influences the log record. To truncate just the information record, utilize
DBCC SHRINKFILE.
WITH NO_INFOMSGS
Stifles every enlightening message that have seriousness levels from 0 through 10.

4. SYSTEM STUDY
4.1 EXISTING SYSTEM
The problem of frequent item set mining is prominent. In any case, it has some critical
constraints with regards to investigating client exchanges. A vital constraint is that buy amounts
are not considered. In this manner, a thing may just show up once or zero time in an exchange. In
this manner, if a client has purchased five breads, ten breads or twenty breads, it is seen as the
same.
A moment imperative restriction is that all things are seen as having a similar significance, utility
of weight. For instance, if a client purchases an extremely costly container of wine or a modest
bit of bread, it is seen as being similarly vital.
In data mining, frequent pattern mining (FPM) is a standout amongst the most seriously explored
issues as far as computational and algorithmic advancement. In the course of the most recent two
decades, various calculations have been proposed to tackle visit design mining or some of its
variations, and the enthusiasm for this issue still continues. Distinctive systems have been
characterized for visit design mining. The most widely recognized one is the help based system,
in which item sets with recurrence over a given edge are found. Be that as it may, such item sets
may now and then not speak to intriguing positive connections between's things since they don't
standardize for the total frequencies of the things. Thusly, elective measures for intriguing
quality have been characterized in the writing.
Frequent mining will concentrate on the help based system in light of the fact that the
calculations in view of the intriguing quality structure are given in an alternate section. One of
the fundamental purposes behind the abnormal state of enthusiasm for visit design mining
calculations is because of the computational test of the undertaking. Notwithstanding for a direct
measured dataset, the pursuit space of FPM is tremendous, which is exponential to the length of
the exchanges in the dataset. This normally makes challenges for item set age, when the help
levels are low. Truth be told, in most viable situations, the help levels at which one can mine the
relating item sets are restricted (limited underneath) by the memory and computational
imperatives. Along these lines, it is basic to have the capacity to play out the examination in a

space-and time-proficient way. Amid the initial couple of years of research here, the essential
concentration of work was to discover FPM calculations with better computational proficiency.
4.1.1 Drawbacks in existing system
Frequent pattern mining in K mine is the patterns which appear frequently in database
and it takes more time for execution.
For example a set of items, such as milk and bread, that appear frequently together in a
transaction data set is a frequent itemset. A subsequence, such as buying first a PC, then a
digital camera, and then a memory card, if it occurs frequently in a shopping history
database, is a (frequent) sequential pattern. If Pattern occurs frequently, it is called a
frequent pattern. Finding such frequent patterns is more difficult in the existing system
Frequent pattern mining has become an existing data mining task and it only focused
theme in data mining research so there is no wide range of analysis is available. A typical
example of frequent item set mining is market basket analysis.
This process analyzes customer buying habits by finding associations between the
different items that customers place in their “shopping baskets”.
The discovery of such associations cannot help retailers to develop marketing strategies
by gaining insight into which items are frequently purchased together by customers
4.2 PROPOSED SYSTEM
K – Mining is introducing in Data mining as an important part
of knowledge discovery process that we can analyze an enormous set of data and get hidden and
useful knowledge. Data mining is applied effectively not only in the business environment but
also in other fields such as weather forecast, medicine, transportation, healthcare, insurance,
government…etc.
Here the data engineering has been applied for health prediction through food consumed. Data
mining has a lot of advantages when using in a specific industry. Besides those advantages, data
mining also has its own disadvantages e.g., privacy, security and misuse of information. We will
examine those advantages and disadvantages of data mining in different industries in a greater
detail.
Here Data mining used for the process of selecting, exploring and modelling large amounts of
food data. This process has become an increasingly pervasive activity in all areas of medical
science research. Data mining has resulted in the discovery of useful hidden patterns from
massive databases. Data mining problems are often solved using different approaches from both
computer sciences, such as multi-dimensional databases, machine learning, soft computing and
data visualization; and statistics, including hypothesis testing, clustering, classification, and
regression techniques.
The mining model that an algorithm creates from your data can take various forms, including:
A set of clusters that describe how the cases in a dataset are related.
A decision tree that predicts an outcome, and describes how different criteria affect that
outcome.
A mathematical model that forecasts sales.
A set of rules that describe how products are grouped together in a transaction, and the
probabilities that products are purchased together.
ADVANTAGES OF PROPOSED SYSTEM
Major Techniques in data mining
A few noteworthy information mining methods have been produced and utilized as a part of
information mining ventures as of late including affiliation, order, grouping, forecast and
consecutive examples. We will quickly analyze the entire example to have a decent look up with
them.
Association
Association is a standout amongst other known information mining system. In affiliation, an
example is found in light of a relationship of a specific thing on different things in a similar
exchange. For design, the affiliation strategy is utilized as a part of reservation frameworks
examination to recognize in which territory clients as often as possible reserve a spot. In view of

this information organizations can set up comparing reservation counters here to offer more
tickets and influence more to benefit
Classification
Classification is the popular process which mostly depends on machine learning approach.
Arrangement strategy makes utilization of numerical strategies, for example, choice trees,
straight programming, neural system and measurements. Fundamentally characterization is
utilized to order everything in an arrangement of information into one of predefined set of
classes or groups. For design, we can apply order in application that "given every single past
record of workers who left the organization, anticipate which current representatives are most
likely to leave later on." For this situation, we partition the representative's records into two
gatherings that are "leave" and "remain".
5. SYSTEM DESIGN
5.1 DATA FLOW DIAGRAM
DFD: Level 0:
User Utility Mining
Database
Request for username & Password
Retrieve Response
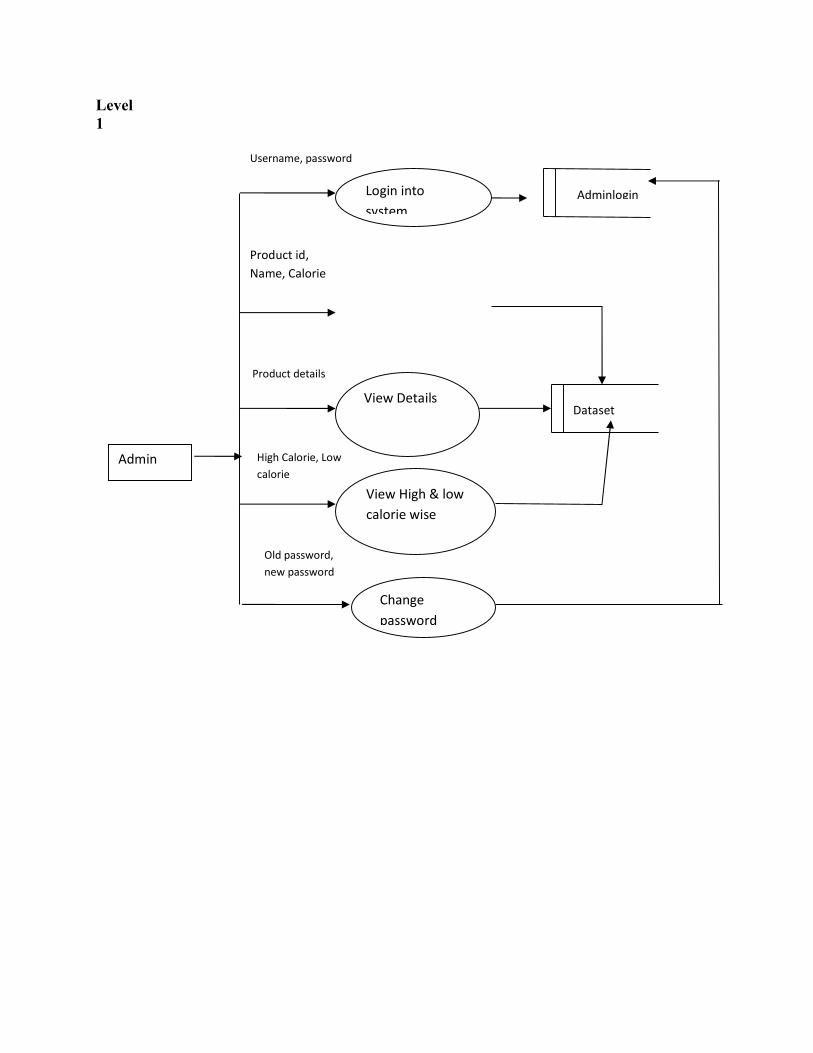
Level 1
Admin
Username, password
Product id, Name, Calorie
Login into system
Dataset
Product details
High Calorie, Low calorie
Change password
View Details
View High & low calorie wise
Old password, new password
Adminlogin

Level 2:
5.2 ER DIAGRAM
User
Name, gender, profession, hobbies, interest, address
Username, password
Work time, sleep time, BMI Enter Process
details
newuser
dailytab
Login into system
totcal
Uname, calorie, protein
Category, pid, pname, calorie
View Report chart
Change password
Signup details
Enter daily meal details
Calculate Calorie
Uname, date, calorie
Calorie, Iron etc
Old password, new password
View suggestion and insufficient
Cal data
insuffi
Chat table

ER Diagram:
User
Admin
suggestion
Insufficient
Dataset det User details Signup
View
input view
Calorie details
Username Password
Username
Password
calorie pid
category
Username phone
age gender
date
calorie protein
uname
vitA
protein
calorie
etc
iron Pid
usermane
1
1
1 N
1
N
1
N
N
1
Process
Daily meal
D BF
L
1 N
Upload
vitB6 potassh

5.3 TABLE DESIGN
TABLE DESIGN :
Table Name : adlogintbl
Primary key : username
Fieldname Datatype Size Constraints Description
Uname Varchar 50 Not Null Admin username
Pwd Varchar 50 Not Null Admin password
Table Name : datasetdet
Fieldname Datatype Size Constraints Description
Cat Varchar 50 Not Null Food category
Pid Varchar 50 Not Null Food id
Pname Varchar 50 Not Null Food name
Calories Varchar 50 Not Null Food calories
Protein Varchar 50 Not Null Food protein
Carbo Varchar 50 Not Null Foodcarbohydrates
Pott Varchar 50 Not Null Food pottasium
Iron Varchar 50 Not Null Food iron
calc Varchar 50 Not Null Food calcium
Vitamin A Varchar 50 Not Null Food vitamin A
Vitamin B Varchar 50 Not Null Food vitamin B
Vitamin C Varchar 50 Not Null Food vitamin C
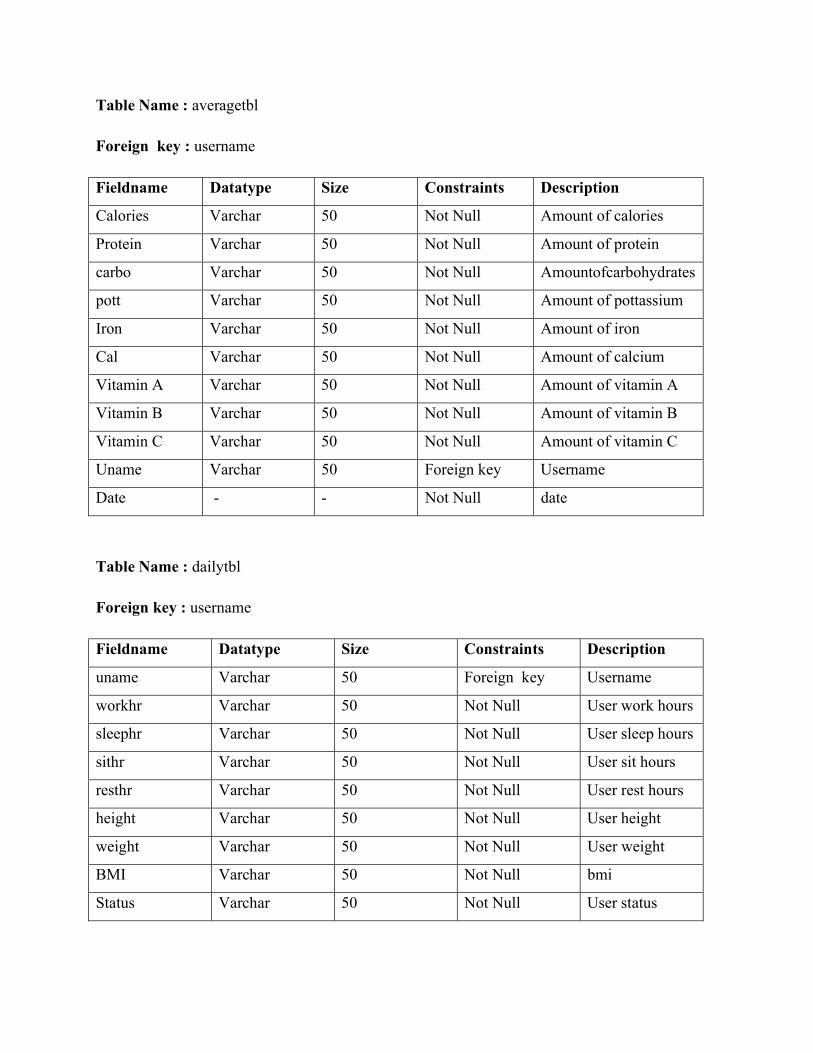
Table Name : averagetbl
Foreign key : username
Fieldname Datatype Size Constraints Description
Calories Varchar 50 Not Null Amount of calories
Protein Varchar 50 Not Null Amount of protein
carbo Varchar 50 Not Null Amountofcarbohydrates
pott Varchar 50 Not Null Amount of pottassium
Iron Varchar 50 Not Null Amount of iron
Cal Varchar 50 Not Null Amount of calcium
Vitamin A Varchar 50 Not Null Amount of vitamin A
Vitamin B Varchar 50 Not Null Amount of vitamin B
Vitamin C Varchar 50 Not Null Amount of vitamin C
Uname Varchar 50 Foreign key Username
Date - - Not Null date
Table Name : dailytbl
Foreign key : username
Fieldname Datatype Size Constraints Description
uname Varchar 50 Foreign key Username
workhr Varchar 50 Not Null User work hours
sleephr Varchar 50 Not Null User sleep hours
sithr Varchar 50 Not Null User sit hours
resthr Varchar 50 Not Null User rest hours
height Varchar 50 Not Null User height
weight Varchar 50 Not Null User weight
BMI Varchar 50 Not Null bmi
Status Varchar 50 Not Null User status

Table Name : insufficiencytbl
Foreign key : username
Fieldname Datatype Size Constraints Description
Calories Varchar 50 Not Null Calories insufficiency
Protein Varchar 50 Not Null Protein insufficiency
carbo Varchar 50 Not Null Carbohydratesinsuffiency
pott Varchar 50 Not Null Potassium insufficiency
Iron Varchar 50 Not Null Iron insufficiency
Cal Varchar 50 Not Null Calcium insufficiency
Vitamin A Varchar 50 Not Null Vitamin A insufficiency
Vitamin B Varchar 50 Not Null Vitamin B insuffiency
Vitamin C Varchar 50 Not Null Vitamin C insuffiency
Uname Varchar 50 Foreign key Username
Date - - Not Null date
Table Name : totcaltbl
Foreign key : username
Fieldname Datatype Size Constraints Description
Calories Varchar 50 Not Null Total calories
Protein Varchar 50 Not Null Total protein
carbo Varchar 50 Not Null Total carbohydrates
pott Varchar 50 Not Null Total pottassium
Iron Varchar 50 Not Null Total iron
Cal Varchar 50 Not Null Total calcium
Vitamin A Varchar 50 Not Null Total vitamin A
Vitamin B Varchar 50 Not Null Total vitamin B
Vitamin C Varchar 50 Not Null Total vitamin C
Uname Varchar 50 Foreign key Username

Date - - Not Null date
Table name : userdet
Primary key: username
Fieldname Datatype Size Constraints Description
Id Varchar 50 Not Null User id
Name Varchar 50 Not Null Username
Gender Varchar 50 Not Null User gender
Ph Varchar 50 Not Null User phone no
Email Varchar 50 Not Null User email
Uname Varchar 50 Primary key Username
Pwd Varchar 50 Not Null User password
Age Varchar 50 Not Null User age
6. ABOUT SOFTWARE
6.1 ABOUT ASP.NET
Asp.net is a server-side web application framework designed for web development to produce
dynamic web pages. It was developed by Microsoft to allow programmers to build dynamic web
sites, web applications and web services. It was first released in January 2002 with version 1.0 of
the.net framework, and is the successor to Microsoft’s active server pages (asp) technology.
Asp.net is built on the common language runtime(clr), allowing programmers to write asp.net
code using any supported .net language. The asp.net soap extension framework allows asp.net
components to process soap messages.
After four years of development, and a series of beta releases in 2000 and 2001, asp.net 1.0 was
released on January 5, 2002 as part of version 1.0 of the .net framework. Even prior to the
release, dozens of books had been written about asp.net, and Microsoft promoted it heavily as

part of its platform for web services. Scott Guthrie became the product unit manager for asp.net,
and development continued apace, with version 1.1 being released on April 24, 2003 as a part of
windows server 2003. This release focused on improving asp. Net’s support for mobile devices.
Characteristics
Asp.net web pages, known officially as web forms, are the main building blocks for application
development. web forms are contained in files with a ".aspx" extension; these files typically
contain static (x)html markup, as well as markup defining server-side web controls and user
controls where the developers place all the rccontent[further explanation needed] for the web
page. Additionally, dynamic code which runs on the server can be placed in a page within a
block <% -- dynamic code -- %>, which is similar to other web development technologies such
as php, jsp, and asp. With asp.net framework 2.0, Microsoft introduced a new code-behind model
which allows static text to remain on the .aspx page, while dynamic code remains in an
.aspx.vbor .aspx.cs or .aspx.fs file (depending on the programming language used).
Directives
A directive is a special instruction on how asp.net should process the page.the most common
directive is <%@ page %> which can specify many attributes used by the asp.net page parser
and compiler.
Examples
Inline code[edit source | editbeta]
<%@ page language="c#" %>
<!Doctype html public "---//w3c//dtdxhtml1.0 //en"
"http://www.w3.org/tr/xhtml1/dtd/xhtml1-transitional.dtd">
<script runat="server">
protected void page_load(object sender, eventargs e)
{ // assign the datetime to label control

lbl1.text = datetime.now.tolongtimestring();
}
</script>
<html xmlns="http://www.w3.org/1999/xhtml">
<head runat="server">
<title>sample page</title>
</head>
<body>
<form id="form1" runat="server">
Code-behind solutions[edit source | editbeta]
<%@ page language="c#" codefile="samplecodebehind.aspx.cs"
inherits="website.samplecodebehind"
Autoeventwireup="true" %>
The above tag is placed at the beginning of the aspx file. The codefile property of the @ page
directive specifies the file (.cs or .vbor .fs) acting as the code-behind while the inherits property
specifies the class from which the page is derived. In this example, the @ page directive is
included in samplecodebehind.aspx, then (samplecodebehind.aspx.cs) acts as the code-behind for
this page:
Source language c#:
Using system;
Namespace website
{
public partial class samplecodebehind :system.web.ui.page

{
protected void page_load(object sender, eventargs e)
{
response.write("hello, world");
}
}
}
Source language visual basic.net:
Imports system
Namespace website
public partial class samplecodebehind
inherits system.web.ui.page
protected sub page_load(byval sender as object, byval e as eventargs)
response.write("hello, world")
end sub
end class
End namespace
In this case, the page_load() method is called every time the aspx page is requested. The
programmer can implement event handlers at several stages of the page execution process to
perform processing.
User controls

User controls are encapsulations of sections of pages which are registered and used as controls in
asp.net, etc.
Custom controls
Programmers can also build custom controls for asp.net applications. Unlike user controls, these
controls do not have an ascxmarkup file, having all their code compiled into a dynamic link
library (dll) file. Such custom controls can be used across multiple web applications and visual
studio projects.
Rendering technique
Asp.net uses a visited composites rendering technique. During compilation, the template (.aspx)
file is compiled into initialization code which builds a control tree (the composite) representing
the original template. Literal text goes into instances of the literal control class, and server
controls are represented by instances of a specific control class. The initialization code is
combined with user-written code (usually by the assembly of multiple partial classes) and results
in a class specific for the page. The page doubles as the root of the control tree.
Actual requests for the page are processed through a number of steps. First, during the
initialization steps, an instance of the page class is created and the initialization code is executed.
This produces the initial control tree which is now typically manipulated by the methods of the
page in the following steps. As each node in the tree is a control represented as an instance of a
class, the code may change the tree structure as well as manipulate the properties/methods of the
individual nodes. Finally, during the rendering step a visitor is used to visit every node in the
tree, asking each node to render itself using the methods of the visitor. The resulting html output
is sent to the client.
After the request has been processed, the instance of the page class is discarded and with it the
entire control tree. This is a source of confusion among novice asp.net programmers who rely on
the class instance members that are lost with every page request/response cycle.
State management

Asp.net applications are hosted by a web server and are accessed using the stateless http
protocol. As such, if an application uses state full interaction, it has to implement state
management on its own. Asp.net provides various functions for state management. Conceptually,
Microsoft treats "state" as gui state. Problems may arise if an application needs to keep track of
"data state"; for example, a finite-state machines which may be in a transient state between
requests (lazy evaluation) or which takes a long time to initialize. State management in asp.net
pages with authentication can make web scraping difficult or impossible.
Application
Application state is held by a collection of shared user-defined variables. These are set and
initialized when the application_onstart event fires on the loading of the first instance of the
application and are available until the last instance exits. Application state variables are accessed
using the applications collection, which provides a wrapper for the application state. Application
state variables are identified by name.
Session state
Server-side session state is held by a collection of user-defined session variables that are
persistent during a user session. These variables, accessed using the session collection, are
unique to each session instance. The variables can be set to be automatically destroyed after a
defined time of inactivity even if the session does not end. Client-side user session is maintained
by either a cookie or by encoding the session id in the url itself.
Asp.net supports three modes of persistence for server-side session variables:
In-process mode
The session variables are maintained within the asp.net process. This is the fastest way; however,
in this mode the variables are destroyed when the asp.net process is recycled or shut down.

Asp state mode
Asp.net runs a separate windows service that maintains the state variables. Because state
management happens outside, the asp.net process, and because the asp.net engine accesses data
using .net removing, asp state is slower than in-process. This mode allows an asp.net application
to be load-balanced and scaled across multiple servers. Because the state management service
runs independently of asp.net, the session variables can persist across asp.net process shutdowns.
However, since session state server runs as one instance, it is still one point of failure for session
state. The session-state service cannot be load-balanced, and there are restrictions on types that
can be stored in a session variable.
6.2 ABOUT C#
C# has a unified type system. This unified type system is called Common Type System (CTS). A
unified type system implies that all types, including primitives such as integers, are subclasses of
the class. For example, every type inherits a method.
C# is a modern, general-purpose object oriented programming language developed by Microsoft
and approved by Ecma and ISO.
C# was developed by Anders Hejlsberg and his team during the development of .Net
Framework.
C# is designed for Common Language Infrastructure (CLI), which consists of the executable
code and runtime environment that allows use of various high-level languages to be used on
different computer platforms and architectures.
The following reasons make C# a widely used professional language:
Modern, general purpose programming language
Object oriented.
Component oriented.
Easy to learn.

Structured language.
It produces efficient programs.
It can be compiled on a variety of computer platforms.
Part of .Net Framework.
Strong Programming Features of C#
Although C# constructs closely follows traditional high level languages C and C++ and being an
object oriented programming language, it has strong resemblance with Java, it has numerous
strong programming features that make it endearing to multitude of programmers worldwide.
Following is the list of few important features:
Boolean Conditions
Automatic Garbage Collection
Standard Library
Assembly Versioning
Properties and Events
Delegates and Events Management
Easy to use Generics
Indexers
Conditional Compilation
Simple Multithreading
LINQ and Lambda Expressions
Integration with Windows
Categories of data types
CTS separates data types into two categories:
Value types
Reference types
Instances of value types do not have referential identity nor referential comparison semantics -
equality and inequality comparisons for value types compare the actual data values within the
instances, unless the corresponding operators are overloaded. Value types are derived from ,
always have a default value, and can always be created and copied. Some other limitations on
value types are that they cannot derive from each other (but can implement interfaces) and
cannot have an explicit default (parameterless) constructor. Examples of value types are all
primitive types, such as (a signed 32-bit integer), (a 32-bit IEEE floating-point number), (a 16-
bit Unicode code unit), and (identifies a specific point in time with nanosecond precision). Other
examples are (enumerations) and (user defined structures).
In contrast, reference types have the notion of referential identity - each instance of a reference
type is inherently distinct from every other instance, even if the data within both instances is the
same. This is reflected in default equality and inequality comparisons for reference types, which
test for referential rather than structural equality, unless the corresponding operators are
overloaded (such as the case for ). In general, it is not always possible to create an instance of a
reference type, nor to copy an existing instance, or perform a value comparison on two existing
instances, though specific reference types can provide such services by exposing a public
constructor or implementing a corresponding interface (such as or ). Examples of reference
types are (the ultimate base class for all other C# classes), (a string of Unicode characters),
and (a base class for all C# arrays).
Both type categories are extensible with user-defined types.
Boxing and unboxing
Boxing is the operation of converting a value-type object into a value of a corresponding
reference type. Boxing in C# is implicit.

Unboxing is the operation of converting a value of a reference type (previously boxed) into a
value of a value type. Unboxing in C# requires an explicit type cast. A boxed object of type T
can only be unboxed to a T (or a nullable T).
Example:
int foo = 42; // Value type.
object bar = foo; // foo is boxed to bar.
int foo2 = (int)bar; // Unboxed back to value type.
Preprocessor
C# features "preprocessor directives" (though it does not have an actual preprocessor) based on
the C preprocessor that allow programmers to define symbols, but not macros. Conditionals such
as , , and are also provided. Directives such as give hints to editors for code folding.
public class Foo
{
#region Constructors
public Foo() {}
public Foo(int firstParam) {}
#endregion
#region Procedures
public void IntBar(int firstParam) {}
public void StrBar(string firstParam) {}
public void BoolBar(bool firstParam) {}
#endregion
}
Code comments
C# utilizes a double slash to indicate the rest of the line is a comment. This is inherited
from C++.
public class Foo
{
// a comment
public static void Bar(int firstParam) {} // also a comment
}
Multi-line comments can start with slash-asterisk and end asterisk-slash . This is inherited
from standard C.
public class Foo
{
/* A Multi-Line
comment */
public static void Bar(int firstParam) {}
}
XML documentation system
C#'s documentation system is similar to Java's Avado, but based on XML. Two methods of
documentation are currently supported by the C# compiler.
Single-line documentation comments, such as those commonly found in Visual Studio generated
code, are indicated on a line beginning with .
public class Foo
{
/// <summary>A summary of the method.</summary>
/// <param name="firstParam">A description of the parameter.</param>
/// <remarks>Remarks about the method.</remarks>
public static void Bar(int firstParam) {}
}
Multi-line documentation comments, while defined in the version 1.0 language specification,
were not supported until the .NET 1.1 release. These comments start with slash-asterisk-asterisk
and end asterisk-slash
public class Foo
{
/** <summary>A summary of the method.</summary>
* <param name="firstParam">A description of the parameter.</param>
* <remarks>Remarks about the method.</remarks> */
public static void Bar(int firstParam) {}
}
Note there are some stringent criteria regarding white space and XML documentation when
using the slash/asterisk/asterisk () technique.
This code block:
/**

* <summary>
* A summary of the method.</summary>*/
produces a different XML comment from this code block:
/**
* <summary>
A summary of the method.</summary>*/
Syntax for documentation comments and their XML markup is defined in a non-normative
annex of the ECMA C# standard. The same standard also defines rules for processing of such
comments, and their transformation to a plain XML document with precise rules for mapping
of CLI identifiers to their related documentation elements. This allows any C# IDE or other
development tool to find documentation for any symbol in the code in a certain well-defined
way.
The effect is to write the following text to the output console:
Hello world!
Each line has a purpose:
using System;
The above line of code tells the compiler to use System as a candidate prefix for types
used in the source code. In this case, when the compiler sees use of the Console type later in the
source code, it tries to find a type named Console, first in the current assembly, followed by all
referenced assemblies. In this case the compiler fails to find such a type, since the name of the
type is actually System.Console. The compiler then attempts to find a type
named System.Console by using the System prefix from the statement, and this time it succeeds.
The statement allows the programmer to state all candidate prefixes to use during compilation
instead of always using full type names.
class Program

Above is a class definition. Everything between the following pair of braces
describes .
static void Main()
This declares the class member method where the program begins execution. The .NET runtime
calls the method. (Note: may also be called from elsewhere, like any other method, e.g. from
another method of .) The keyword makes the method accessible without an instance of . Each
console application's entry point must be declared . Otherwise, the program would require an
instance, but any instance would require a program. To avoid that irresolvable circular
dependency, C# compilers processing console applications (like that above) report an error, if
there is no method. The keyword declares that has no return value.
Console.WriteLine("Hello world!");
This line writes the output. is a static class in the namespace. It provides an interface to
the standard input, output, and error streams for console applications. The program calls
the method , which displays on the console a line with the argument, the string .
A GUI example:
using System.Windows.Forms;
class Program
{
static void Main()
{
MessageBox.Show("Hello world!");
}
}

This example is similar to the previous example, except that it generates a dialog box that
contains the message "Hello world!" instead of writing it to the console.
Standardization and licensing
In August 2000, Microsoft Corporation, Hewlett-Packard and Intel Corporation co-sponsored the
submission of specifications for C# as well as the Common Language Infrastructure (CLI) to the
standards organization International. In December 2001, ECMA released ECMA-334 C#
Language Specification. C# became an ISO standard in 2003 (ISO/IEC 23270:2003 -
Information technology — Programming languages — C#). ECMA had previously adopted
equivalent specifications as the 2nd edition of C#, in December 2002.
In June 2005, ECMA approved edition 3 of the C# specification, and updated ECMA-334.
Additions included partial classes, anonymous methods, nullable types, and generics (similar to
C++ templates).
In July 2005, ECMA submitted the standards and related TRs to ISO/IEC JTC 1 via the latter's
Fast-Track process. This process usually takes 6–9 months.
The C# language definition and the CLI are standardized under ISO and Emma standards that
provide reasonable and non-discriminatory licensing protection from patent claims. However,
Microsoft uses C# and the CLI in its Base Class Library (BCL) that is the foundation of its
proprietary .NET framework, and which provides a variety of non-standardized classes
(extended I/O, GUI, Web services, etc.). Some cases where Microsoft patents apply to standards
used in the .NET framework are documented by Microsoft and the applicable patents are
available on either RAND terms or through Microsoft's Open Specification Promise that releases
patent rights to the public, but there is some concern and debate as to whether there are
additional aspects patented by Microsoft that are not covered, which may deter independent
implementations of the full framework.
Microsoft has agreed not to sue open source developers for violating patents in non-profit
projects for the part of the framework that is covered by the OSP. Microsoft has also agreed not
to enforce patents relating to Novell products against Novell's paying customers with the
exception of a list of products that do not explicitly mention C#, .NET or Novell's

implementation of .NET (The Mono Project). However, Novell maintains that Mono does not
infringe any Microsoft patents. Microsoft has also made a specific agreement not to enforce
patent rights related to the Moonlight browser plugin, which depends on Mono, provided it is
obtained through Novell.
6.3 ABOUT SQL SERVER
SQL Server is Microsoft's relational database management system (RDBMS). It is a full-featured
database primarily designed to compete against competitors Oracle Database (DB) and MySQL.
Like all major RBDMS, SQL Server supports ANSI SQL, the standard SQL language.
However, SQL Server also contains T-SQL, its own SQL implemention.SQL
Server Management Studio (SSMS) (previously known as Enterprise Manager) is SQL Server’s
main interface tool, and it supports 32-bit and 64-bit environments.
SQL Server is sometimes referred to as MSSQL and Microsoft SQL Server.
Originally released in 1989 as version 1.0 by Microsoft, in conjunction with Sybase, SQL
Server and its early versions were very similar to Sybase. However, the Microsoft-Sybase
partnership dissolved in the early 1990s, and Microsoft retained the rights to the SQL
Server trade name. Since then, Microsoft has released 2000, 2005 and 2008 versions, which
feature more advanced options and better security.
Examples of some features include: XML data type support, dynamic management views
(DMVs), full-text search capability and database mirroring.SQL Server is offered in several
editions with different feature set and pricing options to meet a variety of user needs, including
the following:
Enterprise: Designed for large enterprises with complex data requirements, data warehousing and
Web-enabled databases. Has all the features of SQL Server, and its license pricing is the most
expensive.
Standard: Targeted toward small and medium organizations. Also supports e-commerce and data
warehousing.

Workgroup: For small organizations. No size or user limits and may be used as the backend
database for small Web servers or branch offices.
Express: Free for distribution. Has the fewest number of features and limits database size and
users. May be used as a replacement for an Access database.
Mainstream editions
Datacenter
SQL Server 2008 R2 Datacenter is the full-featured edition of SQL Server and is designed for
datacenters that need the high levels of application support and scalability. It supports 256
logical processors and virtually unlimited memory. Comes with StreamInsight Premium
edition. The Datacenter edition has been retired in SQL Server 2012, all its features are available
in SQL Server 2012 Enterprise Edition.
Enterprise
SQL Server Enterprise Edition includes both the core database engine and add-on services, with
a range of tools for creating and managing a SQL Server cluster. It can manage databases as
large as 524 megabytes and address 2 terabytes of memory and supports 8 physical processors.
SQL 2012 Enterprise Edition supports 160 Physical Processors
Standard
SQL Server Standard edition includes the core database engine, along with the stand-alone
services. It differs from Enterprise edition in that it supports fewer active instances (number of
nodes in a cluster) and does not include some high-availability functions such as hot-add
memory (allowing memory to be added while the server is still running), and parallel indexes.
Web
SQL Server Web Edition is a low-TCO option for Web hosting.
Business Intelligence
Introduced in SQL Server 2012 and focusing on Self Service and Corporate Business
Intelligence. It includes the Standard Edition capabilities and Business Intelligence tools:
PowerPivot, Power View, the BI Semantic Model, Master Data Services, Data Quality Services
and xVelocity in-memory analytics.
Workgroup
SQL Server Workgroup Edition includes the core database functionality but does not include the
additional services. Note that this edition has been retired in SQL Server 2012.
Express
SQL Server Express Edition is a scaled down, free edition of SQL Server, which includes the
core database engine. While there are no limitations on the number of databases or users
supported, it is limited to using one processor, 1 GB memory and 4 GB database files (10 GB
database files from SQL Server Express 2008 R2). It is intended as a replacement forMSDE.
Two additional editions provide a superset of features not in the original Express Edition. The
first is SQL Server Express with Tools, which includes SQL Server Management
Studio Basic. SQL Server Express with Advanced Services adds full-text search capability and
reporting services.
Specialized editions
Azure
Microsoft SQL Azure Database is the cloud-based version of Microsoft SQL Server, presented
as software as a service on Azure Services Platform.
Compact (SQL CE)
The compact edition is an embedded database engine. Unlike the other editions of SQL Server,
the SQL CE engine is based on SQL Mobile (initially designed for use with hand-held devices)
and does not share the same binaries. Due to its small size (1 MB DLL footprint), it has a
markedly reduced feature set compared to the other editions. For example, it supports a subset of
the standard data types, does not support stored procedures or Views or multiple-statement
batches (among other limitations). It is limited to 4 GB maximum database size and cannot be

run as a Windows service, Compact Edition must be hosted by the application using it. The 3.5
version includes support for ADO.NET Synchronization Services. SQL CE does not support
ODBC connectivity, unlike SQL Server proper.
Developer
SQL Server Developer Edition includes the same features as SQL Server 2012 Enterprise
Edition, but is limited by the license to be only used as a development and test system, and not as
production server. This edition is available to download by students free of charge as a part
of Microsoft's DreamSpark program
Embedded (SSEE)
SQL Server 2005 Embedded Edition is a specially configured named instance of the SQL Server
Express database engine which can be accessed only by certain Windows Services.
Evaluation
SQL Server Evaluation Edition, also known as the Trial Edition, has all the features of the
Enterprise Edition, but is limited to 180 days, after which the tools will continue to run, but the
server services will stop.
Fast Track
SQL Server Fast Track is specifically for enterprise-scale data warehousing storage and business
intelligence processing, and runs on reference-architecture hardware that is optimized for Fast
Track.
LocalDB
Introduced in SQL Server Express 2012, LocalDB is a minimal, on-demand, version of SQL
Server that is designed for application developers.It can also be used as an embedded database.
Parallel Data Warehouse (PDW)
Data warehouse Appliance Edition
Pre-installed and configured as part of an appliance in partnership with Dell & HP base on the
Fast Track architecture. This edition does not include SQL Server Integration Services, Analysis
Services, or Reporting Services.
Architecture
The protocol layer implements the external interface to SQL Server. All operations that can be
invoked on SQL Server are communicated to it via a Microsoft-defined format, called Tabular
Data Stream (TDS). TDS is an application layer protocol, used to transfer data between a
database server and a client. Initially designed and developed by Sybase Inc. for their Sybase
SQL Serverrelational database engine in 1984, and later by Microsoft in Microsoft SQL Server,
TDS packets can be encased in other physical transport dependent protocols,
including TCP/IP, Named pipes, and Shared memory. Consequently, access to SQL Server is
available over these protocols. In addition, the SQL Server API is also exposed over web
services.
Data storage
Data storage is a database, which is a collection of tables with typed columns. SQL Server
supports different data types, including primary types such
as Integer, Float, Decimal, Char (including character strings), Varchar (variable length character
strings), binary (for unstructured blobs of data), Text (for textual data) among others.
The rounding of floats to integers uses either Symmetric Arithmetic Rounding or Symmetric
Round Down (Fix) depending on arguments: SELECT Round(2.5, 0) gives 3.
Microsoft SQL Server also allows user-defined composite types (UDTs) to be defined and used.
It also makes server statistics available as virtual tables and views (called Dynamic Management
Views or DMVs). In addition to tables, a database can also contain other objects
including views, stored procedures, indexes and constraints, along with a transaction log. A SQL
Server database can contain a maximum of 231 objects, and can span multiple OS-level files
with a maximum file size of 260 bytes. The data in the database are stored in primary data files

with an extension .mdf. Secondary data files, identified with a .ndf extension, are used to store
optional metadata. Log files are identified with the .ldf extension.
Storage space allocated to a database is divided into sequentially numbered pages, each 8 KB in
size. A page is the basic unit of I/O for SQL Server operations. A page is marked with a 96-byte
header which stores metadata about the page including the page number, page type, free space on
the page and the ID of the object that owns it. Page type defines the data contained in the page -
data stored in the database, index, allocation map which holds information about how pages are
allocated to tables and indexes, change map which holds information about the changes made to
other pages since last backup or logging, or contain large data types such as image or text. While
page is the basic unit of an I/O operation, space is actually managed in terms of anextent which
consists of 8 pages. A database object can either span all 8 pages in an extent ("uniform extent")
or share an extent with up to 7 more objects ("mixed extent"). A row in a database table cannot
span more than one page, so is limited to 8 KB in size. However, if the data exceeds 8 KB and
the row contains Varchar or Varbinary data, the data in those columns are moved to a new page
(or possibly a sequence of pages, called an Allocation unit) and replaced with a pointer to the
data.
For physical storage of a table, its rows are divided into a series of partitions (numbered 1 to n).
The partition size is user defined; by default all rows are in a single partition. A table is split into
multiple partitions in order to spread a database over a cluster. Rows in each partition are stored
in either B-tree or heap structure. If the table has an associated index to allow fast retrieval of
rows, the rows are stored in-order according to their index values, with a B-tree providing the
index. The data is in the leaf node of the leaves, and other nodes storing the index values for the
leaf data reachable from the respective nodes. If the index is non-clustered, the rows are not
sorted according to the index keys. An indexed view has the same storage structure as an indexed
table. A table without an index is stored in an unordered heap structure. Both heaps and B-trees
can span multiple allocation units.
Buffer management
SQL Server buffers pages in RAM to minimize disc I/O. Any 8 KB page can be buffered in-
memory, and the set of all pages currently buffered is called the buffer cache. The amount of

memory available to SQL Server decides how many pages will be cached in memory. The buffer
cache is managed by the Buffer Manager. Either reading from or writing to any page copies it to
the buffer cache. Subsequent reads or writes are redirected to the in-memory copy, rather than
the on-disc version. The page is updated on the disc by the Buffer Manager only if the in-
memory cache has not been referenced for some time. While writing pages back to disc,
asynchronous I/O is used whereby the I/O operation is done in a background thread so that other
operations do not have to wait for the I/O operation to complete. Each page is written along with
its checksum when it is written. When reading the page back, its checksum is computed again
and matched with the stored version to ensure the page has not been damaged or tampered with
in the meantime.
7. SYSTEM TESTING
Software testing is an investigation conducted to provide stakeholders with information
about the quality of the product or service under test. Software testing can also provide an
objective, independent view of the software to allow the business to appreciate and understand
the risks of software implementation. Test techniques include, but are not limited to the process
of executing a program or application with the intent of findingsoftware bugs (errors or other
defects).
Development Testing is a software development process that involves synchronized
application of a broad spectrum of defect prevention and detection strategies in order to reduce
software development risks, time, and costs. It is performed by the software developer or
engineer during the construction phase of the software development lifecycle. Rather than
replace traditional QA focuses, it augments it. Development Testing aims to eliminate
construction errors before code is promoted to QA; this strategy is intended to increase the
quality of the resulting software as well as the efficiency of the overall development and QA
process.Software testing can be stated as the process of validating and verifying that a computer
program/application/product:
meets the requirements that guided its design and development,
works as expected,

can be implemented with the same characteristics,
and satisfies the needs of stakeholders.
White-box testing,
Black-box testing,
Unit testing,
Integration testing,
System testing,
Acceptance testing,
Validation testing
WHITE-BOX TESTING
White-box testing is a method of testing software that tests internal structures or
workings of an application, as opposed to its functionality (i.e. black-box testing). In white-box
testing an internal perspective of the system, as well as programming skills, are used to design
test cases. The tester chooses inputs to exercise paths through the code and determine the
appropriate outputs. This is analogous to testing nodes in a circuit, e.g. in-circuit testing (ICT).
While white-box testing can be applied at the unit, integration and system levels of
the software testing process, it is usually done at the unit level. It can test paths within a unit,
paths between units during integration, and between subsystems during a system–level test.
Though this method of test design can uncover many errors or problems, it might not detect
unimplemented parts of the specification or missing requirements.
BLACK-BOX TESTING
Black box testing is designed to validate functional requirements without regard to the internal
workings of a program. Black box testing mainly focuses on the information domain of the software,
deriving test cases by partitioning input and output in a manner that provides through test coverage.
Incorrect and missing functions, interface errors, errors in data structures, error in functional logic are the
errors falling in this category.
UNIT TESTING
unit testing is a method by which individual units of source code, sets of one or more
computer program modules together with associated control data, usage procedures, and
operating procedures, are tested to determine if they are fit for use. Intuitively, one can view a
unit as the smallest testable part of an application. In procedural programming a unit could be an
entire module but is more commonly an individual function or procedure. In object-oriented
programming a unit is often an entire interface, such as a class, but could be an individual
method. Unit tests are created by programmers or occasionally by white box testers during the
development process.
Ideally, each test case is independent from the others: substitutes like method stubs, mock
objects, fakes and test harnesses can be used to assist testing a module in isolation. Unit tests are
typically written and run by software developers to ensure that code meets its design and behaves
as intended. Its implementation can vary from being very manual (pencil and paper) to being
formalized as part of build automation.
INTEGRATION TESTING:
Testing can be used in both software and hardware integration testing. The basis behind
this type of integration testing is to run user-like workloads in integrated user-like environments.
In doing the testing in this manner, the environment is proofed, while the individual components
are proofed indirectly through their use. Usage Model testing takes an optimistic approach to
testing, because it expects to have few problems with the individual components. The strategy
relies heavily on the component developers to do the isolated unit testing for their product. The
goal of the strategy is to avoid redoing the testing done by the developers, and instead flesh-out
problems caused by the interaction of the components in the environment.
For integration testing, Usage Model testing can be more efficient and provides better
test coverage than traditional focused functional integration testing. To be more efficient and
accurate, care must be used in defining the user-like workloads for creating realistic scenarios in
exercising the environment. This gives confidence that the integrated environment will work as
expected for the target customers.

SYSTEM TESTING:
System testing takes, as its input, all of the "integrated" software components that have
passed integration testing and also the software system itself integrated with any applicable
hardware system(s). The purpose of integration testing is to detect any inconsistencies between
the software units that are integrated together (called assemblages) or between any of the
assemblages and the hardware. System testing is a more limited type of testing; it seeks to detect
defects both within the "inter-assemblages" and also within the system as a whole.
ACCEPTANCE TESTING:
Acceptance test cards are ideally created during sprint planning or iteration planning
meeting, before development begins so that the developers have a clear idea of what to develop.
Sometimes acceptance tests may span multiple stories (that are not implemented in the same
sprint) and there are different ways to test them out during actual sprints. One popular technique
is to mock external interfaces or data to mimic other stories which might not be played out
during iteration (as those stories may have been relatively lower business priority). A user story
is not considered complete until the acceptance tests have passed.
VALIDATION TESTING:
Verification is intended to check that a product, service, or system (or portion thereof, or
set thereof) meets a set of initial design specifications. In the development phase, verification
procedures involve performing special tests to model or simulate a portion, or the entirety, of a
product, service or system, then performing a review or analysis of the modeling results. In the
post-development phase, verification procedures involve regularly repeating tests devised
specifically to ensure that the product, service, or system continues to meet the initial design
requirements, specifications, and regulations as time progresses. It is a process that is used to
evaluate whether a product, service, or system complies with regulations, specifications, or
conditions imposed at the start of a development phase. Verification can be in development,
scale-up, or production. This is often an internal process.
7.2 TEST CASE
A test case normally consists of a unique identifier, requirement references from a design
specification, preconditions, events, a series of steps (also known as actions) to follow, input,
output, expected result, and actual result. Clinically defined a test case is an input and an
expected result.This can be as pragmatic as 'for condition x your derived result is y', whereas
other test cases described in more detail the input scenario and what results might be expected. It
can occasionally be a series of steps (but often steps are contained in a separate test procedure
that can be exercised against multiple test cases, as a matter of economy) but with one expected
result or expected outcome.
The optional fields are a test case ID, test step, or order of execution number, related
requirement(s), depth, test category, author, and check boxes for whether the test is automatable
and has been automated. Larger test cases may also contain prerequisite states or steps, and
descriptions. A test case should also contain a place for the actual result. These steps can be
stored in a word processor document, spreadsheet, database, or other common repository. In a
database system, you may also be able to see past test results, who generated the results, and
what system configuration was used to generate those results. These past results would usually
be stored in a separate table.
8. IMPLEMENTATION
System implementation generally benefits from high levels of user involvement and management
support. User participation in the design and operation of information systems has several
positive results. First, if users are heavily involved in systems design, they move opportunities to
mold the system according to their priorities and business requirements, and more opportunities
to control the outcome. Second, they are more likely to react positively to the change process.
Incorporating user knowledge and expertise leads to better solutions.
The relationship between users and information systems specialists has traditionally been a
problem area for information systems implementation efforts. Users and information systems
specialists tend to have different backgrounds, interests, and priorities. This is referred to as
the user-designer communications gap. These differences lead to divergent organizational
loyalties, approaches to problem solving, and vocabularies
Conversions to new systems often get off track because companies fail to plan the project
realistically or they don’t execute or manage the project by the plan. Remember that major
systems conversions are not just IT projects. Companies should maintain joint responsibility with
the vendor in the project-planning process, maintenance of the project-plan status, as well as
some degree of control over the implementation.
All key user departments should have representation on the project team, including the call
center, website, fulfillment, management, merchandising, inventory control, marketing and
finance. Team members should share responsibilities for conversion, training and successful
completion of the project tasks.
The software vendor should have a time-tested project methodology and provide a high-level
general plan. As the merchant client, your job is to develop the detailed plan with the vendor,
backed up with detail tasks and estimates.
For example, a generalized plan may have a list of system modifications, but lack the details that
need to be itemized. These may include research, specifications, sign-offs, program specs,
programming, testing and sign-off, and the various levels of testing and program integration back
into the base system.
Plan for contingencies, and try to keep disruptions to the business to a minimum. We have seen
systems go live and with management initially unable to get their most frequently used reports
— this can be a big problem.
The systems project should have a senior manager who acts as the project sponsor. The project
should be reviewed periodically by the steering committee to track its progress. This ensures that
senior management on down to the department managers are committed to success.
Once you have a plan that makes sense, make sure you manage by the plan. This sounds
elementary, but many companies and vendors stumble on it.
Early in the project publish a biweekly status report. Once you get within a few months, you may
want to have weekly conference call meetings and status updates. Within 30 days of “go live,”
hold daily meetings and list what needs to be achieved.
Project management is the discipline of planning, organizing, motivating, and controlling
resources to achieve specific goals. A project is a temporary endeavor with a defined beginning

and end (usually time-constrained, and often constrained by funding or deliverables), undertaken
to meet unique goals and objectives, typically to bring about beneficial change or added value.
The temporary nature of projects stands in contrast with business as usual (or operations), which
are repetitive, permanent, or semi-permanent functional activities to produce products or
services. In practice, the management of these two systems is often quite different, and as such
requires the development of distinct technical skills and management strategies.
The primary challenge of project management is to achieve all of the project goals and objectives
while honoring the preconceived constraints. The primary constraints are scope, time, quality
and budget. The secondary —and more ambitious— challenge is to optimize the allocation of
necessary inputs and integrate them to meet pre-defined objectives.
Documentation:
Requirements come in a variety of styles, notations and formality. Requirements can be goal-like
(e.g., distributed work environment), close to design (e.g., builds can be started by right-clicking
a configuration file and select the 'build' function), and anything in between. They can be
specified as statements in natural language, as drawn figures, as detailed mathematical formulas,
and as a combination of them all.
A good architecture document is short on details but thick on explanation. It may suggest
approaches for lower level design, but leave the actual exploration trade studies to other
documents.
It is very important for user documents to not be confusing, and for them to be up to date. User
documents need not be organized in any particular way, but it is very important for them to have
a thorough index.
Change Management within ITSM (as opposed to software engineering or project management)
is often associated with ITIL, but the origins of change as an IT management process predate
ITIL considerably, at least according to the IBM publication A Management System for the
Information Business.
In the ITIL framework, Change Management is a part of "Service Transition" - transitioning
something newly developed (i.e. an update to an existing production environment or deploying
something entirely new) from the Service Design phase into Service Operation (AKA Business

As Usual) and aims to ensure that standardized methods and procedures are used for efficient
handling of all changes.
8.1 SYSTEM INSTALLATION:
Installation performed without using a computer monitor connected. In attended forms of
headless installation, another machine connects to the target machine (for instance, via a local
area network) and takes over the display output. Since a headless installation does not need a
user at the location of the target computer, unattended headless installers may be used to install a
program on multiple machines at the same time.
An installation process that runs on a preset time or when a predefined condition transpires, as
opposed to an installation process that starts explicitly on a user's command. For instance, a
system willing to install a later version of a computer program that is being used can schedule
that installation to occur when that program is not running. An operating system may
automatically install a device driver for a device that the user connects. (See plug and play.)
Malware may also be installed automatically. For example, the infamous Conficker was installed
when the user plugged an infected device to his computer.
8.2 USER TRAININGS:
It forms the core of apprenticeships and provides the backbone of content at institutes of
technology (also known as technical colleges or polytechnics). In addition to the basic training
required for a trade, occupation or profession, observers of the labor-marketrecognize as of
2008 the need to continue training beyond initial qualifications: to maintain, upgrade and update
skills throughout working life. People within many professions and occupations may refer to this
sort of training as professional development.
• Training Tips
• Train people in groups, with separate training programs for distinct groups
• Select the most effective place to conduct the training
• Provide for learning by hearing, seeing, and doing
• Prepare effective training materials, including interactive tutorials
Rely on previous trainees

Convert a subset of the database. Apply incremental updates on the new system or the old
system to synchronize the updates taking place. Use this method when the system is deployed in
releases. For example, updates are applied to the old system if a pilot project is applying updates
against the new system so that areas outside the pilot have access to the data.
Some commentators use a similar term for workplace learning to improve performance:
"training and development". There are also additional services available online for those who
wish to receive training above and beyond that which is offered by their employers. Some
examples of these services include career counseling, skill assessment, and supportive
services. One can generally categorize such training as on-the-job or off-the-job:
On-the-job training method takes place in a normal working situation, using the
actual tools, equipment, documents or materials that trainees will use when fully trained. On-the-
job training has a general reputation as most effective for vocational work. It involves Employee
training at the place of work while he or she is doing the actual job. Usually a professional
trainer (or sometimes an experienced employee) serves as the course instructor using hands-on
training often supported by formal classroom training.
Off-the-job training method takes place away from normal work situations — implying
that the employee does not count as a directly productive worker while such training takes place.
Off-the-job training method also involves employee training at a site away from the actual work
environment. It often utilizes lectures, case studies, role playing and simulation, having the
advantage of allowing people to get away from work and concentrate more thoroughly on the
training itself. This type of training has proven more effective in inculcating concepts and ideas.
A more recent development in job training is the On the Job Training Plan, or OJT Plan.
According to the United States Department of the Interior, a proper OJT plan should include:
An overview of the subjects to be covered, the number of hours the training is expected to
take, an estimated completion date, and a method by which the training will be evaluated.
9. CONCLUSION
Towards the conclusion, all the output has been verified as per the commitment. The HUIAR
performed very well according to the expectations. All the output has been generated according

to the given input. From the pre process itself the input dataset generated more information
according to the interface. The High Utility Item set generated more appropriate results; in add
with AR more hidden information has been revealed. The output has been verified with three
different data types in various conditions.
Thus this project has been executed successfully and the output has been verified. All obtained
outputs are according to committed in abstract. Initially more problems occurred during the
architecture creation. As mentioned above architecture has been implemented successfully. All
networks are working perfectly in the architecture. And these networks will works on
independent process too. These features will make this project more successful and efficient.
Displaying results will be more relevant. As mentioned in the abstract all the output has been
verified.
10. FUTURE ENHANCEMENT
Even thou K-Mine have been implemented successfully, in future some enhancements
can be done in this method. The system can be further enhanced by adding new features and
facilities. Now the system is platform dependent and it can be made as platform independent
software. If it is developed in oracle environment means, it is made as platform independent
software, it is can be used by any intranet user of the shop. The system can be also be added with
other data mining techniques such as K-nearest neighbours search, neural network and genetic
algorithm to find some interesting patterns in the data base.
Some of the enhancements are follows:
Combining algorithm
The current system is working well, But we can combine K-Mine with A-
priori algorithm for efficient data process. Also features can be enhanced.
Web data analysis
The current system is working under a single window platform. This can be
enhanced to a web data analysis model. By using this method data analyst can fetch the data
from online and K-Mine can be used anywhere at any time though internet.

Structure Improvement
Basically the current system works on decision tree, high utility item sets
and top-k item set. In added with some architectures like hybrid or grid architecture has been
implemented.
11. BIBLIOGRAPHY
BOOKS REFFERED
1. Alistair McMonnies, “Object-oriented programming in ASP.NET”, Pearson Education,
and ISBN: 81-297-0649-0, First Indian Reprint 2004.
2. Jittery R.Shapiro, “The Complete Reference ASP.NET” Edition 2002, Tata McGraw-
Hill, Publishing Company Limited, New Delhi.
3. Robert D.Schneider, JetteyR.Garbus, “Optimizing SQL Server”, Second Edition, Pearson
Education Asia, ISBN: 981-4035-20-3
WEBSITESREFFERED :
1. http://www.microsoft.com/dotnet/visual basic
2. http://www.dotnetheaven.com
3. http://www.codeproject.com
4. http://www.Planetcode.com
5. http://www.stackoverflow.com

12. SAMPLE SCREENSHOTS

13. SAMPLE CODE
using System;
using System.Collections.Generic;
using System.Linq;
using System.Web;
using System.Web.UI;
using System.Web.UI.WebControls;
using System.Data.SqlClient;
using System.Drawing;
using System.Web.Configuration;
public partial class caloriecalculator :System.Web.UI.Page

{
SqlConnection con;
SqlCommandcmd;
string query,a;
protected void Page_Load(object sender, EventArgs e)
{
a = Session["user"].ToString();
data();
query = "select age from userdet where uname='" + a.ToString() + "'";
cmd = new SqlCommand(query, con);
SqlDataReaderrd = cmd.ExecuteReader();
while (rd.Read())
{
lblage.Text = rd[0].ToString();
}
rd.Close();
con.Close();
if (!Page.IsPostBack)
{
data();
query = "select * from dailytab where uname='" + a.ToString() + "'";

cmd = new SqlCommand(query, con);
SqlDataReaderdr = cmd.ExecuteReader();
while (dr.Read())
{
txtworkout.Text = dr[1].ToString();
lblworkoutmins.Text = ((Convert.ToInt32(txtworkout.Text)) * 60).ToString();
txtsleeping.Text = dr[2].ToString();
lblsleepmins.Text = ((Convert.ToInt32(txtsleeping.Text)) * 60).ToString();
txtrest.Text = dr[3].ToString();
lblrestmins.Text = ((Convert.ToInt32(txtrest.Text)) * 60).ToString();
txtsitting.Text = dr[4].ToString();
lblsittingmins.Text = ((Convert.ToInt32(txtsitting.Text)) * 60).ToString();
txtheight.Text = dr[5].ToString();
txtweight.Text = dr[6].ToString();
lblbmi.Text = dr[7].ToString();
}
dr.Close();
con.Close();
double bmi = Convert.ToDouble(lblbmi.Text);
if ((bmi>= 0.0) && (bmi<= 18.5))
{

lblweightcal.Text = "UNDER WEIGHT";
lblweightcal.ForeColor = Color.Orange;
}
else if ((bmi>= 18.6) && (bmi<= 24.9))
{
lblweightcal.Text = "HEALTHY";
lblweightcal.ForeColor = Color.Green;
}
else if ((bmi>= 25.0) && (bmi<= 29.9))
{
lblweightcal.Text = "OVER WEIGHT";
lblweightcal.ForeColor = Color.Yellow;
}
else if ((bmi>= 30.0) && (bmi<= 40.0))
{
lblweightcal.Text = "OBESE";
lblweightcal.ForeColor = Color.Red;
}
}
workcalculate();

}
public void data()
{
string connstring =
WebConfigurationManager.ConnectionStrings["connect"].ConnectionString;
con = new SqlConnection(connstring);
con.Open();
}
protected void txtworkout_TextChanged(object sender, EventArgs e)
{
lblworkoutmins.Text = ((Convert.ToInt32(txtworkout.Text)) * 60).ToString();
}
protected void txtsleeping_TextChanged(object sender, EventArgs e)
{
lblsleepmins.Text = ((Convert.ToInt32(txtsleeping.Text)) * 60).ToString();
}
protected void txtrest_TextChanged(object sender, EventArgs e)
{
lblrestmins.Text = ((Convert.ToInt32(txtrest.Text)) * 60).ToString();
}
protected void txtsitting_TextChanged(object sender, EventArgs e)

{
lblsittingmins.Text=((Convert.ToInt32(txtsitting.Text)) * 60).ToString();
}
int per,currentworkout,needw;
public void workcalculate()
{
per = Convert.ToInt32(lblsleepmins.Text) + Convert.ToInt32(lblrestmins.Text) +
Convert.ToInt32(lblsittingmins.Text);
per = (per * 60) / 100;
per = per / 10;
lblwork.Text = per.ToString();
currentworkout = Convert.ToInt32(lblworkoutmins.Text);
if (currentworkout> per)
{
lblworkoutack.Text = "You Are Good in Your Workout";
}
else if (currentworkout< per)
{
needw = per - currentworkout;
lblworkoutack.Text = "Improve Your Workout by Working " + needw.ToString() + "mins
more";
}

}
protected void Button1_Click(object sender, EventArgs e)
{
lblbmi.Text = ((Convert.ToDecimal(txtweight.Text)) / ((Convert.ToDecimal(txtheight.Text)) *
(Convert.ToDecimal(txtheight.Text)))).ToString("0.##");
double bmi = Convert.ToDouble(lblbmi.Text);
if ((bmi>= 0.0) && (bmi<= 18.5))
{
lblweightcal.Text = "UNDER WEIGHT";
lblweightcal.ForeColor = Color.Orange;
}
else if((bmi>= 18.6) && (bmi<= 24.9))
{
lblweightcal.Text = "HEALTHY";
lblweightcal.ForeColor = Color.Green;
}
else if ((bmi>= 25.0) && (bmi<= 29.9))
{
lblweightcal.Text = "OVER WEIGHT";
lblweightcal.ForeColor = Color.Yellow;

}
else if ((bmi>= 30.0) && (bmi<= 40.0))
{
lblweightcal.Text = "OBESE";
lblweightcal.ForeColor = Color.Red;
}
}
string pid,meal;
decimal rowcount;
decimal nos;
decimal calorie, protein, carbo, potta, iron, calci, vitA, vitB6, vitC;
protected void Button3_Click(object sender, EventArgs e)
{
if (txtdate.Text == "")
{
lblack.Visible = true;
lblack.Text = "Please Select the date!!!";
}
else
{
lblack.Visible = false;

if (RadioButton1.Checked == true)
{
meal = "Breakfast";
}
else if (RadioButton2.Checked == true)
{
meal = "Lunch";
}
else if (RadioButton3.Checked == true)
{
meal = "Dinner";
}
nos = Convert.ToDecimal(txtnos.Text);
data();
query = "select * from datasetdet where Category='" + dropcategory.SelectedItem + "'
and Productname='" + dropitem.SelectedItem + "'";
cmd = new SqlCommand(query, con);
SqlDataReaderrd = cmd.ExecuteReader();
while (rd.Read())
{
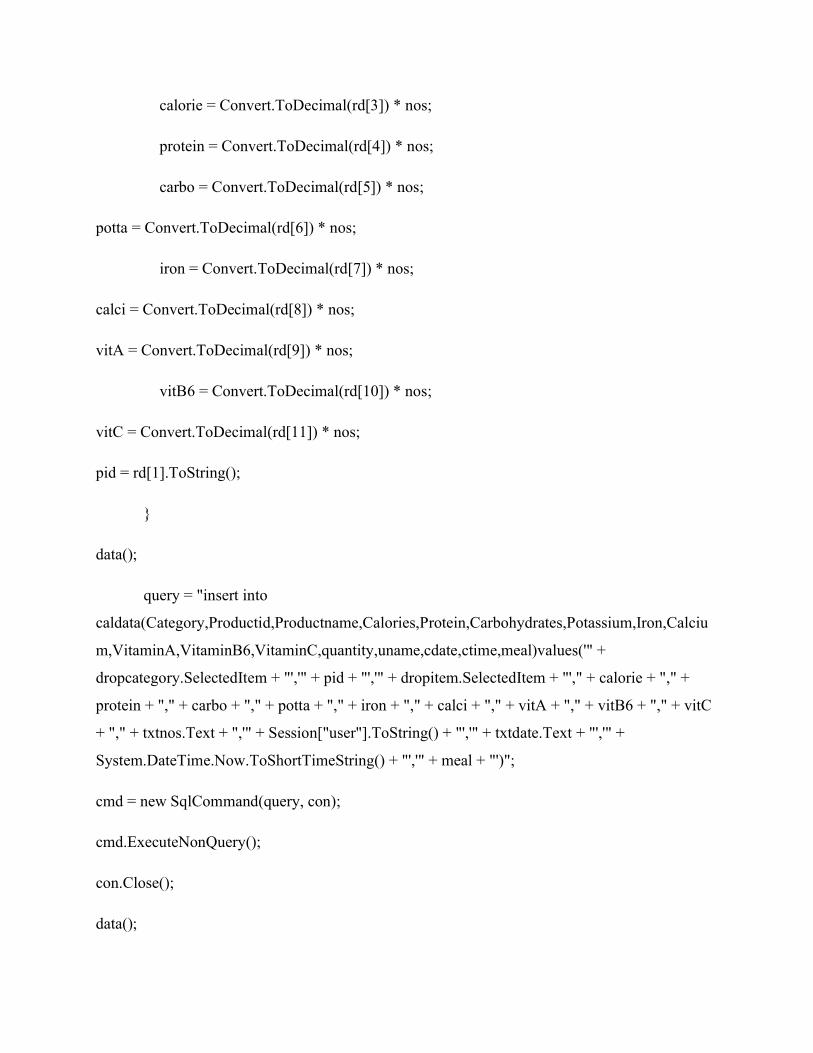
calorie = Convert.ToDecimal(rd[3]) * nos;
protein = Convert.ToDecimal(rd[4]) * nos;
carbo = Convert.ToDecimal(rd[5]) * nos;
potta = Convert.ToDecimal(rd[6]) * nos;
iron = Convert.ToDecimal(rd[7]) * nos;
calci = Convert.ToDecimal(rd[8]) * nos;
vitA = Convert.ToDecimal(rd[9]) * nos;
vitB6 = Convert.ToDecimal(rd[10]) * nos;
vitC = Convert.ToDecimal(rd[11]) * nos;
pid = rd[1].ToString();
}
data();
query = "insert into
caldata(Category,Productid,Productname,Calories,Protein,Carbohydrates,Potassium,Iron,Calciu
m,VitaminA,VitaminB6,VitaminC,quantity,uname,cdate,ctime,meal)values('" +
dropcategory.SelectedItem + "','" + pid + "','" + dropitem.SelectedItem + "'," + calorie + "," +
protein + "," + carbo + "," + potta + "," + iron + "," + calci + "," + vitA + "," + vitB6 + "," + vitC
+ "," + txtnos.Text + ",'" + Session["user"].ToString() + "','" + txtdate.Text + "','" +
System.DateTime.Now.ToShortTimeString() + "','" + meal + "')";
cmd = new SqlCommand(query, con);
cmd.ExecuteNonQuery();
con.Close();
data();

query = "delete from totcal where uname='" + Session["user"].ToString() + "' and
cdate='" + txtdate.Text + "'";
cmd = new SqlCommand(query, con);
cmd.ExecuteNonQuery();
con.Close();
data();
query = "select
sum(Calories),sum(Protein),sum(Carbohydrates),sum(Potassium),sum(Iron),sum(Calcium),sum(
VitaminA),sum(VitaminB6),sum(VitaminC) from caldata where uname='" +
Session["user"].ToString() + "' and cdate='" + txtdate.Text + "'";
cmd = new SqlCommand(query, con);
SqlDataReaderdr = cmd.ExecuteReader();
while (dr.Read())
{
data();
query = "insert into
totcal(uname,Calories,Protein,Carbohydrates,Potassium,Iron,Calcium,VitaminA,VitaminB6,Vita
minC,cdate)values('" + Session["user"].ToString() + "'," + dr[0] + "," + dr[1] + "," + dr[2] + "," +
dr[3] + "," + dr[4] + "," + dr[5] + "," + dr[6] + "," + dr[7] + "," + dr[8] + ",'" + txtdate.Text + "')";
cmd = new SqlCommand(query, con);
cmd.ExecuteNonQuery();
con.Close();

}
dr.Close();
con.Close();
GridView1.DataBind();
GridView2.DataBind();
//average calc
rowcount = GridView1.Rows.Count;
data();
query = "delete from averagetab where uname='" + Session["user"].ToString() + "' and
cdate='" + txtdate.Text + "'";
cmd = new SqlCommand(query, con);
cmd.ExecuteNonQuery();
con.Close();
data();
query = "select * from totcal where uname='" + Session["user"].ToString() + "' and
cdate='" + txtdate.Text + "'";
cmd = new SqlCommand(query, con);
SqlDataReader red = cmd.ExecuteReader();
while (red.Read())

{
data();
query = "insert into
averagetab(Calories,Protein,Carbohydrates,Potassium,Iron,Calcium,VitaminA,VitaminB6,Vitam
inC,uname,cdate)values(" + (Convert.ToDecimal(red[1]) / rowcount).ToString("0.##") + "," +
(Convert.ToDecimal(red[2]) / rowcount).ToString("0.##") + "," + (Convert.ToDecimal(red[3]) /
rowcount).ToString("0.##") + "," + (Convert.ToDecimal(red[4]) / rowcount).ToString("0.##") +
"," + (Convert.ToDecimal(red[5]) / rowcount).ToString("0.##") + "," +
(Convert.ToDecimal(red[6]) / rowcount).ToString("0.##") + "," + (Convert.ToDecimal(red[7]) /
rowcount).ToString("0.##") + "," + (Convert.ToDecimal(red[8]) / rowcount).ToString("0.##") +
"," + (Convert.ToDecimal(red[9]) / rowcount).ToString("0.##") + ",'" +
Session["user"].ToString() + "','" + txtdate.Text + "')";
cmd = new SqlCommand(query, con);
cmd.ExecuteNonQuery();
con.Close();
}
red.Close();
con.Close();
// GridView3.DataBind();
}
}
protected void Button2_Click(object sender, EventArgs e)
{
data();
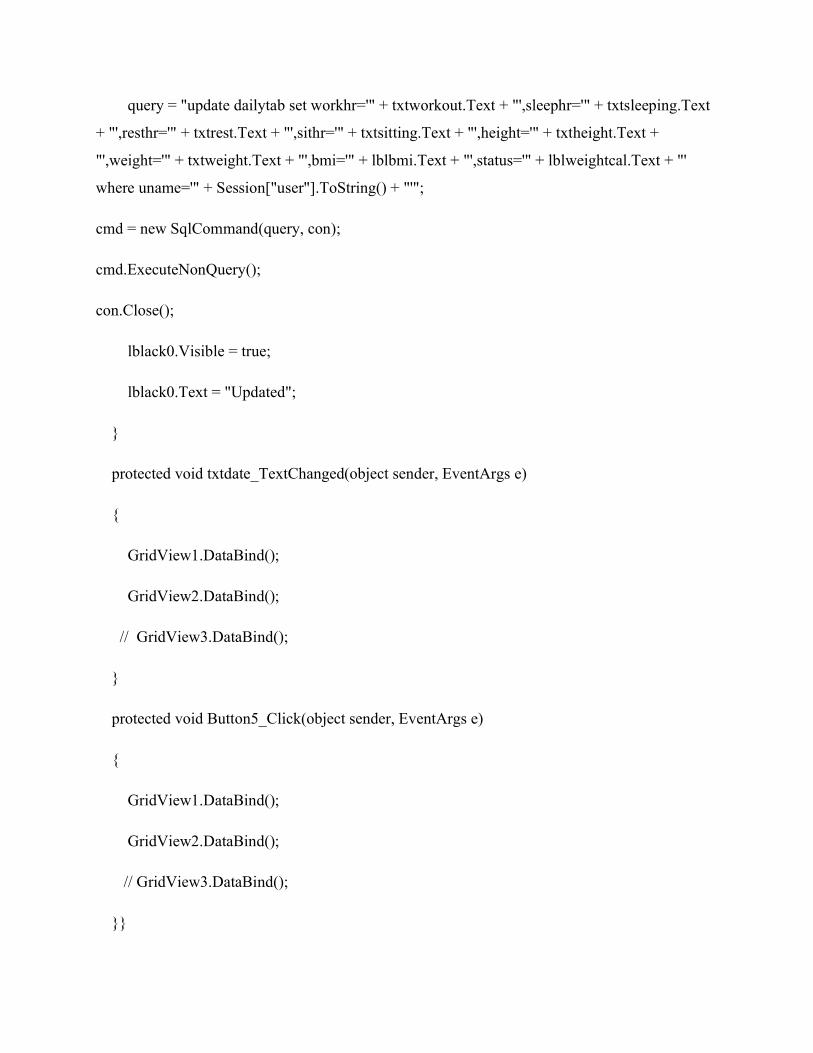
query = "update dailytab set workhr='" + txtworkout.Text + "',sleephr='" + txtsleeping.Text
+ "',resthr='" + txtrest.Text + "',sithr='" + txtsitting.Text + "',height='" + txtheight.Text +
"',weight='" + txtweight.Text + "',bmi='" + lblbmi.Text + "',status='" + lblweightcal.Text + "'
where uname='" + Session["user"].ToString() + "'";
cmd = new SqlCommand(query, con);
cmd.ExecuteNonQuery();
con.Close();
lblack0.Visible = true;
lblack0.Text = "Updated";
}
protected void txtdate_TextChanged(object sender, EventArgs e)
{
GridView1.DataBind();
GridView2.DataBind();
// GridView3.DataBind();
}
protected void Button5_Click(object sender, EventArgs e)
{
GridView1.DataBind();
GridView2.DataBind();
// GridView3.DataBind();
}}