Market structure, jobs, and productivity: Observations from Jamaica
Upload
khangminh22Category
view
1download
0
EFFICIENCY, PRODUCTIVITY CHANGE AND
MARKET STRUCTURE OF THE BANKING
INDUSTRY IN SRI LANKA
A dissertation submitted by
Senarath Lalithananda Seelanatha
MAcc, MBA, BSc. (Pub. Admin)
For the award
of
Doctor of Philosophy
School of Accounting, Economics and Finance Faculty of Business
University of Southern Queensland Australia
2007
CORE Metadata, citation and similar papers at core.ac.uk
Provided by University of Southern Queensland ePrints

- ii -
ABSTRACT
During the last 27 years, the banking industry in Sri Lanka has undergone a series of
changes through financial reforms, advancement of communication and information
technologies, globalisation of financial services, and economic development. Those
changes should have had a considerable effect on efficiency, productivity change,
market structure and performance in the banking industry. The motivation of this
study is to investigate empirically the impact of those changes on the banking
industry. Thus, this study aims to address three main research issues related to the
banking industry in Sri Lanka, namely:
1. Whether deregulation of the financial services sector has led to improvement in
efficiency and productivity gains.
2. Whether banks’ inefficiency in the banking industry in Sri Lanka is determined
by a set of microeconomic and macroeconomic variables.
3. Whether the changes in efficiency or changes in market structure have
influenced the overall operational performance of banks in Sri Lanka.
This study adopts a non-parametric Data Envelopment Analysis (DEA) and
Malmquist Productivity Index (MPI) to measure efficiency and productivity gains of
banks in Sri Lanka using financial and other information representing all local banks
over a sixteen year period from 1989 to 2004. Input and output variables are refined
to represent the intermediation and assets transformation roles of banks. Window
analysis of mean estimated efficiency scores in both aspects indicates a negative
trend in estimated efficiency during the study period. However, the analysis of
efficiency scores (intermediation) of different forms of banks shows a negative trend
during the first half of the study period and a slight positive trend during the end of
the second half. These results imply that deregulation may have failed to improve
the efficiency of the Sri Lankan banking industry in the short-term. However, the
expected benefits of deregulation can be achieved in the long-term. Interestingly, the
two state-owned banks have responded poorly to the initial phase of Sri Lankan

- iii -
financial reforms. However, the improved autonomy given to boards of management
under the commercialisation process has led not only to improved efficiency, but
also to the reduction of the efficiency gap between the state-owned banks and
privately-owned banks. The analysis of efficiency scores (asset transformation) of
different forms of banks records a stable trend in estimated efficiency. On the other
hand, estimated MPIs show that Sri Lankan banks have focused on improving
productivity in the asset transformation process rather than the intermediation
process.
Analysis of determinants of technical efficiency shows that technical efficiency in
intermediation has positive relationships with variables such as profitability,
operational risk, purchased funds, liquidity and stock market capitalization; and
negative relationships with variables such as product quality and line of business
(commercial bank). Further, results show that efficiency in the asset transformation
process has positive relationships with capital strength, operational risk, and market
capitalisation; and negative relationships with line of business ownership (privately-
owned banks) and old banks. The investigation of influence of market structure and
efficiency on operational performance finds that banks’ relative market power and
technical efficiency have a significant influence on their return on assets (ROA). No
evidence supports any relationship of net interest margin with variables such as
market power, concentration and efficiency.

- iv -
CERTIFICATION OF DISSERTATION
I certify that the work contained in this dissertation is entirely my own effort, except
where otherwise acknowledged. I also certified that the work is original and has not
been previously submitted for any other award, except where otherwise
acknowledged.
_______________________________
Signature of Candidature
Date…………………………………….
ENDORSEMENT
_________________________________
Signature of the Supervisor
Date…………………………………….

- v -
ACKNOWLEDGEMENT
There are many people who have directly and indirectly supported me in the
completion of my PhD program. However, firstly, I would like to acknowledge my
two principal supervisors, Dr. Sarath Delpachitra and Associate Professor Diana
Beal. I am indebted to Dr. Delpachitra for encouraging me to do research in a
banking and finance field and providing the necessary guidance for this research. I
admire you immensely for your invaluable times used to motivate, support and
mentor me during my PhD candidature. I am also thankful to Associate Professor
Diana Beal for her support and guidance extended in this research. I also appreciated
her quick readings of the draft thesis and the suggestions for improvements.
Without the financial assistance received from the Faculty of Business, University of
Southern Queensland, SIDA/SAREC Staff Development Programme-University of
Sri Jayewardenepura, and the National Centre for Advanced Studies in Humanities
and Social Sciences-University Grant Commission-Sri Lanka, I would not have
completed my studies in Australia. Therefore, I am indebted to all those institutions.
I would like to thank Dr. Martin Hovey, Head of Department (Finance and
Banking), Noel Brown, Arabella Volkov, Dr. Glenda Adkins, Chris O'Reilly,
Cassandra Bate, Hilary E. Silva and Dr.Y.K.Weerakoon for their support during my
studies at the University of Southern Queensland.
Dear Ammi (Mum) and Appachchie (Dad), I am always remembering you for your
guidance and encouragement given to me more than 42 years of my life. I am also
thankful to all members of my wife’s family for their support given, especially in the
time I was here in Australia for looking after my wife and son. Last but not least, I
would like to thank my beloved wife Champa and my wonderful son Chamath for
their understanding and tolerance of the amount of time I took from them. Finally, I
would like to dedicate this study to my wife Champa, son Chamath and my late
parents.

- vi -
TABLE OF CONTENTS
ABSTRACT...................................................................................................................... ii CERTIFICATION OF DISSERTATION .........................................................................iv ACKNOWLEDGEMENT ..................................................................................................v TABLE OF CONTENTS..................................................................................................vi LIST OF TABLES ............................................................................................................xi LIST OF FIGURES.........................................................................................................xii LIST OF ABBREVIATIONS ..........................................................................................xiii CHAPTER ONE: INTRODUCTION
1.1 Introduction............................................................................................................1
1.2 Conceptual Framework..........................................................................................2
1.3 Rationale for the Research .....................................................................................4
1.4 Objectives of the Research .....................................................................................5
1.5 Propositions and Hypotheses..................................................................................5
1.6 Methodology ...........................................................................................................6
1.7 Contribution of the Study.......................................................................................7
1.8 Organisation of the Thesis......................................................................................8
CHAPTER TWO: DEREGULATION, MARKET STRUCTURE AND TH E
BANKING INDUSTRY IN SRI LANKA
2.1 Introduction..........................................................................................................10
2.2 Deregulation in the Financial services Sector ......................................................11
2.2.1 Deregulation ..............................................................................................11
2.2.2 Reasons for the regulation of the financial-services industry.......................12
2.2.3 Modes of deregulation................................................................................14
2.2.4 Impact of deregulation ...............................................................................16
2.3 Financial Reforms in Sri Lanka ...........................................................................18
2.3.1 Historical background ................................................................................18
2.3.2 Objectives of deregulation..........................................................................19
2.3.3 Main phases in deregulation .......................................................................20
2.3.4 Setbacks to deregulation.............................................................................26
2.4 Impact of Financial Reforms on the Banking Industry.......................................27
2.4.1 Organization of the financial service sector in Sri Lanka after reforms........28
2.4.2 Operational environment of banks ..............................................................32

- vii -
2.4.3 Deposit and lending interest rates ...............................................................36
2.4.4 Total assets and liabilities of commercial banks..........................................39
2.4.5 Ownership of commercial banks’ assets .....................................................40
2.4.6 Banking concentration................................................................................41
2.5 Synthesise..............................................................................................................42
CHAPTER THREE: CONCEPTS AND MEASUREMENTS OF
EFFICIENCY AND PRODUCTIVITY CHANGE AND
THEIR APPLICATION IN THE BANKING
INDUSTRY
3.1 Introduction..........................................................................................................44
3.2 Productivity Concepts ..........................................................................................45
3.3 Production Frontier Approaches .........................................................................49
3.3.1 Parametric approaches................................................................................49
3.3.2 Non-parametric approaches........................................................................50
3.3.3 Choice of frontier analysis methods............................................................52
3.4 Data Envelopment Analysis..................................................................................53
3.4.1 Different specifications of DEA .................................................................55
3.4.2 Selection of the DEA model .......................................................................56
3.4.3 MPI, scale efficiency and technological change..........................................59
3.4.4 Restriction on number of inputs and outputs ...............................................60
3.5 Input and Output Specification............................................................................61
3.5.1 Issue 1: Definition of inputs and outputs.....................................................61
3.5.2 Issue 2: Measurement of inputs and outputs................................................67
3.5.3 Issue 3: Non-traditional activities ...............................................................67
3.5.4 Issue 4: Quality aspects ..............................................................................68
3.5.5 Implications of input-output specification...................................................69
3.6 Application of DEA in the Banking Industry ......................................................69
3.6.1 Methodological issues ................................................................................71
3.6.2 Sources of inefficiency...............................................................................76
3.6.3 Policy issues ..............................................................................................77
3.7 Synthesise..............................................................................................................87

- viii -
CHAPTER FOUR: AN ANALYSIS OF EFFICIENCY AND
PRODUCTIVITY CHANGES OF THE BANKING
INDUSTRY IN SRI LANKA
4.1 Introduction..........................................................................................................89
4.2 The Study Proposition ..........................................................................................90
4.3 Method of Estimating Banks’ Efficiency and Productivity Changes ..................90
4.3.1 DEA model formulation.............................................................................91
4.3.2 Malmquist total productivity index (MPI)...................................................98
4.4 The Banking Model ............................................................................................100
4.5 Data and Sample.................................................................................................103
4.6 Analysis of Estimated Efficiency Scores ............................................................105
4.6.1 Mean and standard deviation of input and output variables .......................105
4.6.2 Efficiency in intermediation .....................................................................108
4.6.3 Efficiency in asset transformation.............................................................117
4.6.4 Nature of RTS..........................................................................................124
4.6.5 Findings of the assessment of banks’ efficiency........................................126
4.7 Analysis of Productivity Changes.......................................................................129
4.8 Conclusion...........................................................................................................135
CHAPTER FIVE DETERMINANTS OF EFICIENCY OF BANKS IN SRI
LANKA
5.1 Introduction................................................................................................. 137
5.2 Background of the Analytical Framework ............................................... 138
5.2.1 Determinants of bank efficiency ....................................................... 138
5.2.2 Empirical approaches used in previous studies................................. 140
5.2.3 Previous applications ........................................................................ 141

- ix -
5.3 Methodology ................................................................................................ 145
5.3.1 Model Selection ................................................................................145
5.3.2 Determinants of banks’ efficiency in Sri Lanka ............................... 147
5.4 Results and Discussion................................................................................ 150
5.4.1 An overview...................................................................................... 150
5.4.2 Firm-specific variables...................................................................... 154
5.4.3 Macroeconomic variables ................................................................. 159
5.4.4 Qualitative variables..........................................................................160
5.5 Conclusion.................................................................................................... 163
CHAPTER SIX: MARKET STRUCTURE, EFFICIENCY AND
PERFORMANCE
6.1 Introduction........................................................................................................165
6.2 Market Behaviour...............................................................................................166
6.2.1 EFS hypothesis vs SCP hypothesis ...........................................................167
6.2.2 Measures of market concentration ............................................................170
6.2.3 Previous applications ...............................................................................171
6.3 Methodology .......................................................................................................173
6.3.1 Empirical model.......................................................................................175
6.3.2 Selection of variables ...............................................................................176
6.3.3 Data .........................................................................................................179
6.4 Results and Discussion........................................................................................179
6.5 Conclusion...........................................................................................................186
CHAPTER SEVEN: CONCLUSION AND POLICY IMPLICATIONS 7.1 Introduction........................................................................................................187
7.2 Main Findings.....................................................................................................188
7.2.1 Analysis of productivity and efficiency ....................................................188
7.2.2 Determinants of technical efficiency.........................................................190
7.2.3 Market structure, efficiency and operational performance.........................191
7.3 Policy Implications and Recommendations .......................................................192
7.3.1 Speed of reforms......................................................................................193
7.3.2 Banks’ operational environment ...............................................................195
7.3.3 Institutional framework for financial reforms............................................196
7.4 Limitations of the Study .....................................................................................197

- x -
7.5 Future Research..................................................................................................198
7.6 Conclusion...........................................................................................................199
APPENDIXES
Appendix 1: Applications of DEA in the financial services sector .......................201 Appendix 2: Applications of DEA in the financial service sector; Input and output
specification ...................................................................................208 Appendix 3: Coefficients of variation (Input and output data) .............................214 Appendix 4: Window analysis – (Mean estimated efficiency scores in individual
window periods) .............................................................................215 Appendix 5: Mean estimated efficiency scores....................................................221 Appendix 6: Nature of return to scale....................................................................223 Appendix 7: Regression results – Determinants of technical efficiency................225 Appendix 8: Regression results - Market structure, efficiency and operational
performance....................................................................................226 LIST OF REFERENCES.............................................................................................229

- xi -
LIST OF TABLES
Table 2.1: Financial-service sector reforms from 1977-2003 ................................. 21
Table 2.2: Infrastructural developments in deposit-taking institutions in Sri Lanka30
Table 2.3: Development in banking facilities in Sri Lanka..................................... 33
Table 2.4: Bank market concentration (HH index) ................................................. 42
Table 3.1: Forms of DEA used in banking literature.............................................. 56
Table 3.2: Input variables used in previous banking productivity studies .............. 65
Table 3.3: Output variables used in previous banking productivity studies ........... 66
Table 4.1: Specification of input and output variables ..................................................102
Table 4.2: Corresponding periods of each window .......................................................104
Table 4.3: Descriptive statistics of input and output data ..............................................106
Table 4.4: Correlation of input and output variables (pooled data) ................................107
Table 4.5: Descriptive statistics - Efficiency in intermediation .....................................113
Table 4.6: Mann-Whitney test scores - Efficiency in intermediation .............................114
Table 4.7: Descriptive statistics – Efficiency in asset transformation ............................121
Table 4.8: Mann-Whitney test scores – Efficiency in asset transformation....................123
Table 4.9: Nature of RTS (efficiency in intermediation) ...............................................125
Table 4.10: Nature of RTS (efficiency in asset transformation) ......................................125
Table 4.11: Productivity gains/losses in intermediation ..................................................130
Table 4.12: Productivity gains/losses in asset transformation..........................................131
Table 5.1: Microeconomic, macroeconomic and other factors affecting banks’
efficiency ....................................................................................................139
Table 5.2: Variables and definitions.............................................................................149
Table 5.3 Descriptive statistics of firm-specific variables ............................................150
Table 5.4: Correlation coefficient of variables tested....................................................151
Table 5.5 Tobit regression results................................................................................153
Table 6.1 Variables and their definitions .....................................................................180
Table 6.2: Pearson correlation coefficient.....................................................................181
Table 6.3: Regression results .......................................................................................183

- xii -
LIST OF FIGURES
Figure 1.1: Financial reform, market structure, efficiency and productivity change
of the banking industry in Sri Lanka.............................................................4
Figure 2.1: Composition of the financial-services sector in Sri Lanka ................. 29
Figure 2.2: Financial-services sector contribution to the GDP.............................. 34
Figure 2.3: Monetary aggregates ........................................................................... 35
Figure 2.4: Banks assets as proportion of GDP..................................................... 35
Figure 2.5: Domestic savings, investment and financial services sector
contribution to GDP............................................................................ 36
Figure 2.6: Commercial bank lending and deposit rates ....................................... 37
Figure 2.7: Commercial banks’ ownership of government debt as a percentage of
total domestic loans............................................................................. 38
Figure 2.8: Funding sources of banks.................................................................... 39
Figure 2.9: Uses of commercial banks assets ........................................................ 40
Figure 2.10: Ownership of commercial banks assets .............................................. 41
Figure 3.1: Production frontier and technical efficiency....................................... 45
Figure 3.2: Productivity, technical efficiency and scale efficiency....................... 46
Figure 3.3: Envelopment surface under CCR and BCC formulation .................... 54
Figure 3.4: Mode of assigning efficiency indices.................................................. 55
Figure 4.1: Average TE(I) - Window analysis ............................................................109
Figure 4.2: Average PTE(I) - Window analysis ..........................................................109
Figure 4.3: Average SE(I) - Window analysis ............................................................109
Figure 4.4: TE(I)-Mid-year ........................................................................................112
Figure 4.5: PTE(I)-Mid-year ......................................................................................112
Figure 4.6: SE(I)-Mid-year.........................................................................................112
Figure 4.7: Average TE(A) - Window analysis...........................................................118
Figure 4.8: Average PTE(A) - Window analysis.........................................................118
Figure 4.9: Average SE(A) - Window analysis ...........................................................118
Figure 4.10: TE(A) – Mean value of mid-year..............................................................122
Figure 4.11: PTE(A) – Mean value of mid-year............................................................122
Figure 4.12: SE(A) – Mean value of mid-year..............................................................122
Figure 6. 1. The structure conduct performance theory................................................167

- xiii -
LIST OF ABBREVIATIONS
ADA - Allocative data envelopment analysis
ADI - Authorised depository institutions
ASP - All share price index
ATM - Automatic teller machine
BCC - Banker, Charnes, and Cooper
CAMEL - Capital adequacy, assets quality, management quality, earnings ability and
liquidity of banks
CAR - Capital-adequacy ratio
CAT - Productivity gain on catch-up
CBSL - Central Bank of Sri Lanka
CCR - Charnes, Cooper and Rhodes (1978) formulation
CD - Certificate of deposits
CIB - Credit information bureau
CLT - Central limit theory
COLS - Corrected ordinary least square method
CR - Concentration ratio
CRS - Constant return to scale
CSE - Colombo Stock Exchange
DEA - Data envelopment analysis
DFA - Distribution free approach
DMU - Decisions making units
DRS - Decreasing return to scale
EMU - European Monetary Union
EFS - Efficient structure hypothesis
FDH - Free disposal hull method
FRN - Productivity gain on frontier shift
GDP - Gross domestic product
GIM - Gross interest margin
GOBU - Government-owned-business-undertakings
HHI - Herfendathal Hix index
ICT - Information and communication technologies
IMF - International Monetary Fund
- xiv -
IRTS - Increasing return to scale
JB - Jarque-Bera test
M1 - Narrow money
M2 - Time and saving deposits plus the M1
M3 - Broad money supply
MPI - Malmquist productivity index
NIM - Net interest margin
NSB - National Savings Bank
PERC - Public Enterprise Reform Commission
PFA - Production frontier analysis
PLC - Public limited company
PTE - Pure-technical efficiency
PTE(A) - PTE in assets transformation
PTE(I) - PTE in intermediations
REPO - Market for repurchasing treasury bills
RMP - Relative market power
RRDB - Regional rural development banks
RTS - Return to scale SCP - Structure conduct performance
SE - Scale efficiency
SE(A) - SE in asset transformation
SE(I) - SE in intermediations
SFA - Stochastic frontier approach
SRR - Statutory reserve requirements
TB - Treasury bill
TE - Technical efficiency
TE(A) - TE in assets transformation
TE(I) - TE in intermediations
TFA - Thick frontier approach
TFP - Total factor productivity
UK - United Kingdom
USA - United State of America
VRS - Variable return to scale

- xv -

Chapter One Introduction
- 1 -
CHAPTER ONE
INTRODUCTION
1.1 Introduction
Efficient intermediation of funds from savers to borrowers enables the allocation of
resources to their most productive uses. The more efficient a financial system is in
such resource generation and in its allocation, the greater its contribution to
productivity and economic growth (McKinnon 1973). Hence, an efficient financial
intermediation system is a prime requirement for a country’s economic
development. Consequently, improvement in real returns in the economy may result
in higher savings which would presumably, in turn, produce higher resource
generation. Thus, development of the financial system is essential for the general
enhancement of productivity and economic growth of a country.
This thesis will focus on the banking industry in Sri Lanka. The banking industry in
Sri Lanka, which holds approximately 60% of the total financial assets of the
country (World Bank 2003), is the main intermediary in the financial services sector
in Sri Lanka. Therefore, efficiency and productivity of the banking industry is an
important requirement for the development of the financial services sector. Prior to
1977, Sri Lankan policy makers relied on a planned economic system in which the
markets were dominated by government institutions (Dunham & Kelegama 1996).
After nearly 30 years of inward-looking economic policies and financial repression,
the newly-elected Sri Lankan government (elected in 1977) introduced an
economic-policy reforms package that paved the way for structural transformation of
the overall economy (Dunham & Kelegama 1996). The reform package included

Chapter One Introduction
- 2 -
some drastic policy changes in relation to deregulation of the financial services
sector, together with other economic reforms.
In response to the reforms, the financial services sector in Sri Lanka and the banking
sector, in particular, have undergone substantial changes which may have impacted
on efficiency and productivity change1, and competition and market structure. The
main driving forces behind these changes were financial deregulation, development
in information and communication technologies and the globalization of the
financial services industry in general. The consequent changes were observable in
areas such as the scope of banking operations, number of banks and bank branches,
technologies used and quality of human resources in the banking industry. These
changes might ultimately be reflected in efficiency and productivity gains. Even
though there is a growing body of literature that focuses on efficiency and
productivity gains, market structure and the performance of banking industries in
other countries (see Casu & Molyneux 2003; Chakrabarti & Chawla 2002;
Girardone, Molyneux & Gardener 1997; Hondroyiannis, Lolos & Papapetrou 1999;
Maudos & Pastor 2002), no major study has been conducted in Sri Lanka. This study
empirically explores the impact of all these forces described above on efficiency and
productivity gains, and market structure and operational performance of the banking
industry in Sri Lanka.
1.2 Conceptual Framework
As mentioned previously, the banking industry in Sri Lanka has been influenced by
the deregulation of the financial services sector, development in information and
communication technologies (ICT) and globalisation of financial services industries.
Figure 1.1 illustrates the way these forces have influenced the performance of the
banking industry. The deregulation process, which began in 1977, is aimed at
making structural changes in the financial services industries to enhance
1 Productivity is defined as a ratio of output to input in a given production situation. However,
efficiency relates the input and output in a given decision making unit with the best practice in the industry.
Chapter One Introduction
- 3 -
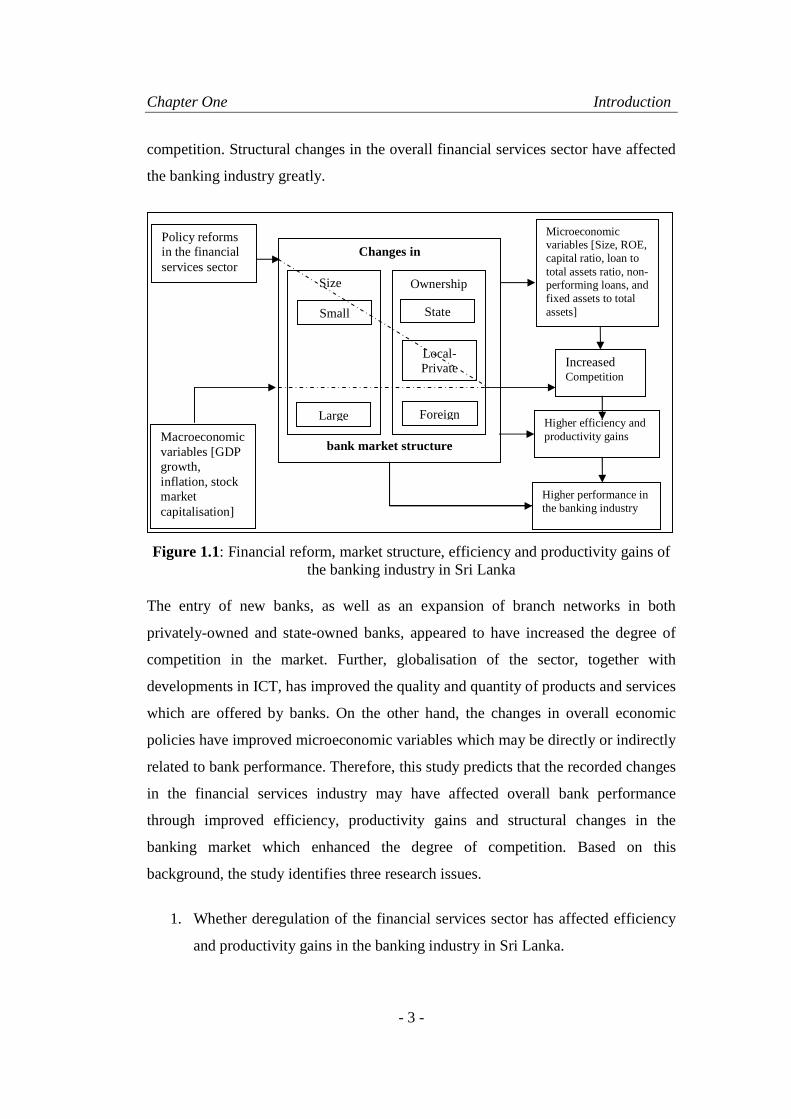
competition. Structural changes in the overall financial services sector have affected
the banking industry greatly.
Figure 1.1: Financial reform, market structure, efficiency and productivity gains of the banking industry in Sri Lanka
The entry of new banks, as well as an expansion of branch networks in both
privately-owned and state-owned banks, appeared to have increased the degree of
competition in the market. Further, globalisation of the sector, together with
developments in ICT, has improved the quality and quantity of products and services
which are offered by banks. On the other hand, the changes in overall economic
policies have improved microeconomic variables which may be directly or indirectly
related to bank performance. Therefore, this study predicts that the recorded changes
in the financial services industry may have affected overall bank performance
through improved efficiency, productivity gains and structural changes in the
banking market which enhanced the degree of competition. Based on this
background, the study identifies three research issues.
1. Whether deregulation of the financial services sector has affected efficiency
and productivity gains in the banking industry in Sri Lanka.
Policy reforms in the financial services sector
Increased Competition
Higher efficiency and productivity gains Macroeconomic
variables [GDP growth, inflation, stock market capitalisation]
Changes in
bank market structure
Ownership
State
Local- Private
Size
Higher performance in the banking industry
Foreign
Small
Large
Microeconomic variables [Size, ROE, capital ratio, loan to total assets ratio, non-performing loans, and fixed assets to total assets]

Chapter One Introduction
- 4 -
2. Whether inefficiency in the banking industry in Sri Lanka is determined by a
set of microeconomic and macroeconomic variables.
3. Whether the changes in efficiency or changes in market structure have
influenced the overall performance of the banks in Sri Lanka and, if so, how.
1.3 Rationale for the Research
As explained above, efficiency and productivity gains of the banks, as well as
market structure of the banking industry, have been regarded as crucial areas in
contemporary public policy concerned with a country’s economic development.
Empirical analysis of efficiency, productivity change, and market structure is a vital
requirement for further policy changes. Accordingly, studies in these areas are
important in the following aspects.
First, improvements in efficiency and productivity gains in financial institutions are
a vital requirement for providing a more efficient system of asset allocation in the
financial services sector. Since Sri Lanka has a bank-led financial services sector,
efficiency and productivity gains in firms in the banking industry are more important
for providing supportive financial infrastructure for economic development.
Improvements in efficiency and productivity gains may reduce the cost of
intermediation, which directly affects the intermediation margin in the market.
Secondly, this study addresses a contemporary policy issue in relation to market
structure. It examines how the banking structure, improvement in efficiency and
productivity change affect bank performance (measured by profitability and net
interest margins). This type of analysis is essential in providing evidence for policy
changes related to market competition.
It should be noted that there are large numbers of studies of economic liberalisation
in Sri Lanka. However, only a few studies have focused on financial liberalisation in
Sri Lanka. To the best of the author’s knowledge, no in-depth study has been
conducted to investigate the impact of financial deregulation on efficiency and
productivity changes in the banking industry in Sri Lanka. Thus, this research

Chapter One Introduction
- 5 -
intends to fill a gap in research as the first in-depth study in to efficiency,
productivity, and market structure of the banking industry in Sri Lanka.
1.4 Objectives of the Research
The main objective of the research is to examine how changes which occurred in the
financial services sector during the 16 year period (1989-2004) affected the
efficiency, productivity change, and market structure of the banking industry in Sri
Lanka. Furthermore, this research is aimed at achieving the following specific
objectives:
1. To investigate the banks’ efficiency and productivity improvements gained
during the post-liberalisation era by focusing on efficiency and productivity
gains as a primary method for creating a more economical and efficient
banking industry in Sri Lanka.
2. To undertake a comprehensive review of financial reforms and their impact
on the banking industry.
3. To investigate determinants of efficiency of banks in Sri Lanka and their
significance.
4. To conduct a complementary analysis using the structure-conduct-
performance literature to understand the interaction of market structure,
efficiency and banks’ operational performance.
1.5 Propositions and Hypotheses
Since 1977, the banking industry in Sri Lanka has undergone a transition period in
response to the regulatory reforms introduced and resultant changes in the
operational environment of the industry2. The regulatory reforms aimed at enhancing
the efficiency and productivity gains of the industry. Those reforms also led to
changes in the structure of the banking industry. Together with financial reforms,
globalisation and developments in ICT have also led to changes in the operational
2 More detailed discussion on regulatory and environmental changes in the financial services
sector is presented in Chapter Two.

Chapter One Introduction
- 6 -
environment of the banking industry in Sri Lanka. These changes have been used as
the rationale for the development of the following three propositions.
Proposition I. Financial reforms have improved the efficiency and
productivity gains of the banking industry in Sri Lanka.
Proposition II. The efficiency of banks in Sri Lanka is affected by a range of
microeconomic and macroeconomic factors, together with financial
deregulation.
Proposition III. Improvements in efficiency have influenced the banks’
operational performance than changes in the structure of the market.
The study hypothesises that financial reforms have improved the banks’ efficiency
in Sri Lanka. The above mentioned proposition are analysed in Chapter Four to Five.
Chapter Four addresses the first proposition through assessing and analysing banks’
efficiency and productivity change. Chapter Five addresses the second proposition.
A range of macroeconomic and microeconomic factors has been traced as factors
which may influence bank efficiency. The hypothesised relationships for each factor,
with estimated efficiency scores and evidence found in the study, have been
recorded in the chapter. Chapter Six addresses the third proposition using four joint
hypotheses. These hypotheses investigate the influence of market structure and
technical efficiency on banks’ operational performance (measured in profitability
and net interest margin).
1.6 Methodology
The study uses a research framework which comprises three phases to examine three
research propositions. Methodologies, results and discussion in each phase are
separately presented in three of the following chapters.
The first phase—Estimation and decomposition of bank efficiency (Chapter 4):
The first study phase examines Proposition I. For that, efficiency of individual banks
for each year during the sample period is estimated using a non-parametric frontier
approach called data envelopment analysis (DEA). Using constant and variable

Chapter One Introduction
- 7 -
return to scale DEA models, technical efficiency, scale efficiency and pure technical
efficiency are estimated. Furthermore, descriptive statistics, together with Mann-
Whitney test scores, are used to identify the efficiency differences in different forms
of banks. In addition, Malmquist productivity indices (MPI) are used to examine the
productivity improvements recorded from different sources during the study period.
The second phase—Determinants of bank efficiency in Sri Lanka (Chapter 5):
The second phase is used to empirically investigate determinants of technical
efficiency (Proposition II). Since dependent variables are estimated and limited this
phase uses a truncated Tobit regression model.
The third phase—Market structure and efficiency (Chapter 6): This phase is
based on Proposition III. It investigates the influence of market structure and
efficiency on banks’ operational performance measured by return on total assets and
net interest margin. The research framework proposed by Berger and Hannan (1993)
has been used as an appropriate empirical framework to test influences of the market
structure and the estimated efficiency on banks’ operational performance.
1.7 Contribution of the Study
There are studies of financial reforms and their influence on banks’ efficiency and
productivity change which have been conducted in the banking industries in other
countries. However, despite financial services sector reforms first being introduced
almost 27 years ago, no such study has been conducted in the banking industry in Sri
Lanka. Thus, this study attempts to fill the gap in literature by providing empirical
evidence to the existing body of knowledge in efficiency and productivity change,
market structure and performance in the banking industry in a developing country.
Accordingly, the research contributes to knowledge of reforms in the financial
services sector and their influence on the banking industry in Sri Lanka in four
respects. Firstly, the study contributes to government policy with an empirical
evaluation of the impact of deregulation and subsequent changes in the financial
services sector and their influences on the banking industry. Secondly, it contributes

Chapter One Introduction
- 8 -
to the existing literature on banking efficiency and productivity change by providing
evidence from the banking industry in Sri Lanka. Thirdly, the study contributes to
the existing literature in ‘structure conduct performance’ by empirically
investigating the influence of market structure and efficiency on banks’ operational
performance from a developing country perspective. Further, the findings of this
study may assist policy makers and bankers in understanding the way the regulatory
changes might affect banks’ efficiency, productivity change, market structure and
operational performance.
1.8 Organisation of the Thesis
This dissertation contains seven chapters, of which three chapters are empirical by
design. The first chapter presents an introduction to the study and provides the
background, rationale, objectives, hypotheses, methodology and study outline.
Chapter Two reviews literature related to the financial reforms. The aim of this
chapter is to highlight the operational environment of the banking industry of Sri
Lanka during the pre and post-deregulation period. The issues highlighted in this
chapter are used to explain the trends in estimated efficiency scores in Chapter Four.
Chapter Two contains three sections which cover literature related to motives,
modes and outcomes of financial deregulation processes, financial reforms in Sri
Lanka and the impact of financial reforms on the banking industry in Sri Lanka.
Chapter Three reviews literature on efficiency and productivity change and their
application in the banking industry. The aim of this particular chapter is to form a
theoretical framework for assessment of efficiency and productivity chanage of the
banking industry in Sri Lanka. Findings in this chapter have been used to formulate
the analytical framework for Chapter Four.
The next three chapters of this dissertation are used to present the details of the
empirical analyses conducted in the study. The study comprises three stages, as
explained in section 1.6 of this chapter. Methodologies used in empirical analyses,
results, discussions and conclusions in each phase are presented in these chapters.

Chapter One Introduction
- 9 -
Accordingly, the Chapter Four presents an analysis of efficiency and productivity
change of the banking industry in Sri Lanka. It investigates the trends in estimated
efficiency scores and the possible reasons for them. Based on the findings of that
chapter, Chapter Five investigates the impact of the other macroeconomic and
microeconomic factors on banks’ efficiency.
The aim of Chapter Six is to investigate the relationship between market structure
and the bank efficiency. It uses structure-conduct-performance (SCP) literature to
investigate the influence of efficiency and market structure on the operational
performance of banks.
The seventh and final chapter presents overall findings and policy implications of
the study. It also discusses limitations faced in the study and makes
recommendations for further research.

Chapter Two Deregulation, market structure and the banking industry in Sri Lanka
- 10 -
CHAPTER TWO
DEREGULATION, MARKET STRUCTURE AND THE
BANKING INDUSTRY IN SRI LANKA
2.1 Introduction
Currently, and in the recent past, the private-sector in Sri Lanka has been seen as
vital to economic development. Governments throughout advanced nations have
introduced economic policies to promote private-sector involvement in economic
decision making (Fu and Heffernan, 2005; Harper and Leslie, 1993; Hogan, 1992;
Maghyereh, 2004). Following the global trend, Sri Lanka also commenced economic
reforms in 1977. These reforms have changed market structures and the degree of
market competition in the banking industry. This chapter aims to present a
comprehensive review of financial reforms and their influences on the banking
industry in Sri Lanka.
The chapter consists of four sections. The next section introduces means and modes
of financial sector deregulation in general. The third section presents the sequence of
financial services sector reforms in Sri Lanka. The fourth section evaluates how the
reforms in the financial services sector have influenced the banking industry. The
last section summarises the findings of initial analysis of financial reforms and their
influence on the banking industry.

Chapter Two Deregulation, market structure and the banking industry in Sri Lanka
- 11 -
2.2 Deregulation in the Financial Services Sector
This section reviews the available literature that considers deregulation and related
issues. The processes, modes and influences of deregulation are discussed. Evidence
and accompanying analyses from previous empirical studies of Sri Lanka’s and
other nations’ deregulation processes and their evident consequences are outlined
and briefly compared.
2.2.1 Deregulation
The financial services sector’s circumstances influence a nation’s capital
accumulation and allocation processes throughout an economy (McKinnon, 1973).
These circumstances fundamentally influence the nation’s social, economic and
political environments. Since a nation’s financial sector is the major source of
capital accumulation, both the government and the private-sectors play a significant
role. However, economists typically have emphasised the necessity of reducing
government intervention in the financial services sector through deregulation. By
this political process, policy makers have focussed on improving the private-sector
operations throughout their nation’s financial services industry.
Deregulation does not merely mean removing all legal restrictions imposed on the
market. The existence of a comprehensive and stable set of laws and procedures is
necessary for more secure, stable and efficient financial markets. Pertinent
legislation allows parties to undertake financial transactions with a degree of
certainty (Hogan, 1992). Pertinent and well defined regulations are ‘legislative and
administrative arrangements where the activities of market participants are subject to
the direction of and scrutiny by various authorities’ (Hogan 1992, p1). Appropriate
regulation should specify both the qualitative circumstances of business activities
conducted by banks and the quantitative considerations of asset portfolios (Hogan,
1992). Hence, the term deregulation should be interpreted strictly in terms of the
context of the social environment previously fostered by the prior regulation of the
qualitative and quantitative aspects of banking and financial activities.

Chapter Two Deregulation, market structure and the banking industry in Sri Lanka
- 12 -
Dunham and Kelegama (1996, p. 254) defined economic liberalisation as a ‘process
of transition from an inward looking, heavily protected and highly regulated
economic regime toward an open economy that strives for efficiency through
competition in the market’. Accordingly, liberalisation of financial sectors aimed to
improve the allocation of resources to lead to greater efficiency, to expand output
and to accelerate growth.
McKinnon (1973) and Shaw (1973) advocate financial deregulation to free banking
from financial repression, to increase deposit rates and to enhance financial
deepening. Their analyses inferred that financial liberalisation may encourage
greater competition among financial institutions while enhancing the efficiency and
productivity gains of the sector’s financial institutions. McKinnon (1973) and Shaw
(1973) also noted that removal of interest rate ceilings may encourage savings in the
household sector. In their view, liberalisation of a nation’s financial services sector
may lead to an increase in the volume and the quality of overall national investment
(McKinnon, 1973; Shaw, 1973). However, many of the countries that deregulated
their financial services industries were unable to reap the anticipated benefits
because of other fundamental factors such as the prevailing social, political and
economic environments (Arestis, Nissanke and Stein, 2003).
2.2.2 Reasons for the regulation of the financial s ervices industry
Stigler (1971) noted that the need for regulation in a particular industry may stem
from different sources. In some industries, regulation may be formulated and
implemented primarily for the industries’ benefit. In some other industries,
regulation has been enforced for some other reasons (Stigler, 1971). Moreover,
Stigler (1971) showed that private interest theory and public interest theory can be
used to explain motives of regulation. The ‘private interest theory’ proposes that
well organized groups use the coercive power of the state to capture rents at the
expense of less privileged groups. Consequently, regulation is instituted for the
protection of these groups (Stigler, 1971). The ‘public interest theory’ posits that
government intervention is necessary to avert market failures and maximise social

Chapter Two Deregulation, market structure and the banking industry in Sri Lanka
- 13 -
welfare (Kroszner and Strahan, 1999). The public interest theory sees need for
welfare-enhancing regulation but not for regulation that reduces competition
(Kroszner and Strahan, 1999).
Many studies have supported the private interest theory as the theory which best
describes regulation of the financial services industry. Using the event of the
elimination of restrictions on bank branching in different states in the USA,
Kroszner and Strahan (1999) examined the explanatory power of these two theories.
Their study noted that the beneficiaries of the branching regulation had supported a
coalition favouring geographical restrictions despite its cost to consumers in terms of
financial services.
La-Porta, Lopez-de-Silanes and Shleifer (2002) provided two competing views
regarding government intervention in the banking industry. The ‘development view’
emphasises the necessity of government intervention in financial development for
economic growth. It notes that privately-owned commercial banks were the key
institutions for channelling savings into industries in industrial countries in the
nineteenth century. Since privately-owned banks in less-developed countries were
not able to provide the basic borrowing needs of the society, governments actively
intervened in the banking sector (La-Porta, Lopez-de-Silanes and Shleifer, 2002).
The second view, the ‘political view’, argues that government intervention in the
banking industry has resulted from the determination of politicians to control
investment.
This viewpoint is best illustrated by the financial environments in developing
countries (especially in Sri Lanka). In such countries, governments intervene in the
banking industry in different ways, for example, by creating subsidiaries, imposing
regulations, and by owning banking firms. Incorporating information from 92
countries, La-Porta, Lopez-de-Silanes and Shleifer (2002) concluded that
government ownership in banking is commonplace and pervasive throughout the
world. Government ownership of banks is greater in countries with low per-capita
incomes, under-developed financial systems, interventionist and inefficient

Chapter Two Deregulation, market structure and the banking industry in Sri Lanka
- 14 -
governments and poor protection of property rights. Their research revealed the
countries that have higher government intervention have characteristically relatively
low economic growth.
2.2.3 Modes of deregulation
As explained by Dunham and Kelegama (1996), modes of deregulation cover three
aspects; (1) the speed of deregulation, (2) the stages of deregulation and (3) the order
of deregulation of various segments in the market. The first, speed of deregulation,
considers whether the process of deregulation should be gradual or ‘all at once’.
Dunham and Kelegama (1996) pointed out that if deregulation led to a regime with a
more superior, less distorted market system, it is preferable to introduce new policies
as rapidly as possible. However, in reality, factors such as the social cost of
adjustment which may create political consequences, microeconomic situations,
income distributions and protection of local industries may limit the speed of
reforms. The second, stages of deregulation, implied that an economic system may
progress into a fully liberalised economic system based on a few stages, depending
on the structure of the economy. The third indicates the order of liberalising different
markets such as commodity, labour and financial markets.
Different financial reform measures have been implemented in different countries.
Hogan (1992) identified three main areas of financial reform: namely, relaxation of
operating constraints; lifting barriers to entry of foreign banks; and strengthening of
prudential standards. Abiad and Mody (2000) identified six modes of financial
reforms: namely, policies related to credit control, interest rate controls, entry norms,
prudential regulations and security markets, as well as policies relating to
privatization and international financial transactions. Their research noted that the
nature, extent and timing of financial reforms differ from country to country.
Different countries have used different approaches for financial reforms, ranging
from minor modification to complete overhauls. Abiad and Mody’s (2000) findings
suggested that:

Chapter Two Deregulation, market structure and the banking industry in Sri Lanka
- 15 -
• countries whose financial sectors are fully repressed are the ones with the
strongest tendency to maintain their policy stance and hence to stay fully
repressed;
• the direction of the chosen actions is not predetermined;
• different types of crises have systematically different effects on financial
sector policy;
• political cycles and political orientation matter and external influence has a
moderate, but not statistically significant, effect on reform.
However, reforms need not be all-or-nothing. If political conditions are such that
large-scale reforms are not feasible, then it may still be worth implementing the few
readily-feasible reforms (Abiad and Mody, 2000). Since the reform process tends to
create its own momentum, even a small reform may potentially constitute a
considerable victory for the policy makers. Secondly, there is scope for taking
advantage of certain circumstances in which policy changes become more
acceptable:
• Big economic crises are generally found to have led to facilitate reforms. For
example, governments have used currency crises, in particular, to push
through reforms (Abiad and Mody, 2000; Hoj et al., 2006).
• Reforms in trading partners tend to go along with stronger domestic product
market reforms (whereas the association with labour market reforms is more
ambiguous) (Abiad and Mody, 2000; Hoj et al., 2006).
• The longer the period that the governments in office contributed to further
reforms but, on average, left -of- centre governments tend to undertake less
reform (Hoj et al., 2006).
• The beginning of a new political term is a circumstance where policy
changes are more acceptable (Abiad and Mody, 2000).
Various countries have experienced different outcomes as a consequence of the
introduction of financial services sector reforms. Financial reforms in Spain started
with the removal of interest rate ceilings in 1970. However, the banking crises

Chapter Two Deregulation, market structure and the banking industry in Sri Lanka
- 16 -
during 1978-1984 reduced the momentum of deregulation (Grifell-Tatje and Lovell,
1996). It was not until 25 years later that branching restrictions on saving banks
were removed in 1995. In 1997, investment and reserve requirements were relaxed.
Deregulation in the Australian context has involved a controlled removal of
restrictions on the quantity, quality and pricing standards of financial services
offered by banks (Hogan, 1992). To harmonise banking regulation with the
European Monetary Union (EMU) the Turkish government imposed structural
changes in the financial services sector (Isik and Hassan, 2003). Those changes
focussed on freeing foreign exchange and interest rates from government
intervention, thereby allowing foreign exchange deposits for residents and non-
residents; permitting new forms of financial institutions; and granting more freedom
for operational activities.
In the United Kingdom (UK), deregulation enhanced diversification and merger
activities and the de-mutualization of segments of both life assurance companies and
the building society industry (Drake, 2001). Deregulation and its consequences in
Greece were similar to those of Spain - both were aimed at harmonising the
regulatory system with the EMU by freeing interest rates; abolition of various credit
controls; development of capital market; enhancement of competition from non-
bank institutions; and relaxation of entry-exit norms. These examples demonstrate
that the expectation, nature and extent of deregulation have differed significantly
from country to country.
2.2.4 Impact of deregulation
The impact of deregulation is highly dependent on prevailing social factors, such as
economic freedom and ‘property rights’ protection (Demirguc-Kunt, Laeven and
Levine, 2003). The regulatory system in a well-established economic system, which
provides adequate economic freedom, facilitates a harmonious operation of a
nation’s banking activities. Demirguc-Kunt, Laeven and Levine (2003) examined
the consequences of bank regulation, bank concentration and institutional setting on
bank margins. Their extensive research incorporated data from 1,400 banks across

Chapter Two Deregulation, market structure and the banking industry in Sri Lanka
- 17 -
72 countries. Their findings were that tighter regulations on bank entry and bank
activities, together with the rate of inflation, increased net interest margins. Banks in
countries which have strict entry controls, operational barriers on off-balance-sheet
activities, high reserve requirements and greater operational restrictions have a
relatively high interest rate margin. They also reported that greater economic
freedom had reduced the unfavourable consequences of bank regulation.
Regulation by the government can restrict operational activities in the commercial
banking sector. There are two types of entry restrictions, namely, expansion
restrictions on existing banks’ branch networks and the prevention or limiting of the
entry of new banks. Restricting bank branching limits a bank’s ability to diversify its
portfolio risk. Both restrictions may adversely affect the free entry to and exit from
the banking industry and thereby diminish market competition. Jayeratne and
Strahan (1996) examined the outcomes of the removal of entry restrictions on
banking efficiency in the United States of America (USA). Their research identified
a sharp reduction in banks’ operating costs and loan losses after states removed the
bank branching restriction within and between states. They concluded that branching
restrictions reduced the performance of typical banking activities by passing
economic rents to bank borrowers.
The preceding section presented a brief discussion of the meaning of deregulation,
reasons for regulating the financial services sector, mode of reforms and expected
outcome of financial reforms. The main objective of deregulation is enhancing
efficiency and productivity gains by reinforcing competitiveness in the financial
services sector. There are a limited number of studies which evaluate the financial
reforms and their influence. These studies focus on different issues related to
deregulation, for example, improvement in efficiency and productivity gains and the
changes in market competition; only a few studies have focused on less-developed
countries such as Sri Lanka.

Chapter Two Deregulation, market structure and the banking industry in Sri Lanka
- 18 -
2.3 Financial Reforms in Sri Lanka
This section presents a review of the banking industry and its significance in the
financial system in Sri Lanka. It begins by presenting a brief review of the historical
background and follows with the deregulation process and its influences on the
banking industry in Sri Lanka. The reforms and their expected consequences are
discussed. The institutional structure of Sri Lanka’s financial services industry and
the significance of the banking industry in the financial system are outlined. This
section also shows that the microeconomic environment directly influences the
performance of the financial system. It ends with a discussion of the impact of
financial reforms on the banking industry in Sri Lanka.
2.3.1 Historical background
Banking in Sri Lanka was introduced by British planters in the country’s Central
Province at the beginning of the nineteenth century. Sri Lanka had a liberal
economic system with little direct government involvement in economic activities
until the early 1950s. For example, there was neither government intervention in
international trade nor exchange controls (Karunasena, 1999). Subsidiaries of
foreign banks dominated the banking sector which mainly met the financial
requirements of international trade and the working capital requirements of Sri
Lanka’s plantation sector.
Direct intervention by the government in the banking industry began after the
country gained its independence from Britain in 1948. The goal of a self-sufficient
economic system led the government to set priority areas for development, namely
to control the allocation of loan funds; to intervene in setting interest rates; and to
introduce strict foreign exchange regulations. The government resolved to use banks
as the main vehicles for mobilizing financial resources in the process of economic
development and for providing the most fundamental financial intermediary and
payment functions.

Chapter Two Deregulation, market structure and the banking industry in Sri Lanka
- 19 -
The government of Sri Lanka legislated to develop and to expand financial services
to remote areas by setting up the Central Bank of Sri Lanka (CBSL) in 1950
(Fernando, 1991). In 1961, the Bank of Ceylon1 was nationalised and the Peoples’
Bank was established, thus increasing the government’s position in the financial
services sector (Fernando, 1991). The state banks were allowed to increase their
share of the banking sector gradually. This was achieved by legislating to allow
these banks to expand their services into new areas such as specialized lending
facilities, international trade finance and as the sole bankers for the government
(Karunasena, 1999). The private-sector was not allowed to establish new banks or to
expand existing operations. Thus, as with many other countries, the banking sector
in Sri Lanka is led by the state banks, which have taken the role of assigning funds
from savers to borrowers. Today, the banking sector is the main provider of the
funding needs of both the corporate sector as well as the household sector.
2.3.2 Objectives of deregulation 2
In 1977, the newly-elected government introduced open economic policies to
encourage the private-sector to lead economic decision-making in the country
(Karunasena, 1999). At the beginning, economic reforms mainly targeted trade
liberalisation. Jayesundara and Indrarathna (1991) outlined five main issues which
the financial reforms in Sri Lanka were intended to address:
1. Development of an effective financial system composed of efficient banking
and financial institutions for the mobilisation of domestic resources;
2. Elimination of institutional barriers and removal of other policy-imposed
distortions to encourage competition in the financial sector and thereby
reduce intermediation costs;
3. Strengthening of the regulatory environment in the financial services sector;
4. Introduction of a market-based interest rates structure; and
5. Liberalisation of financial transactions. 1 Bank of Ceylon commenced its operations in 1931 as a private bank. Currently, both the Bank
of Ceylon and the Peoples’ Bank are functioning as state-owned banks. 2 Discussion in this section is mainly based on Central Bank of Sri Lanka (CBSL) annual reports
in various years.
Chapter Two Deregulation, market structure and the banking industry in Sri Lanka
- 20 -
Financial reforms in Sri Lanka were designed to establish a finance environment
favourable to rapid and sustainable economic growth through greater savings and
investment. Specific government legislation focused on the private-sector, while
coordinating monetary and financial policies for the development of the financial
sector. As an example, CBSL (1999) identified 12 major areas to be considered in
future economic reforms in Sri Lanka. Among them, four areas3 are directly related
to the financial services sector.
However, the Sri Lankan government relied on ‘gradual reforms’ rather than ‘all at
once reforms’. This seemed appropriate because of the lack of experience in open
economic policies and a lack of the skilled human resources required. The
circumstances dictated the legislation that slowed down the reform process.
2.3.3 Main phases in deregulation
Three phases are evident in the deregulation of the financial services sector in Sri
Lanka (i.e. 1977-1988; 1988-1995 and after 1995 to date). The sequence of the
reform process is outlined in Table 2.1. Initial reforms from 1977 to 1988 were
intended to expand the institutional structure of the financial services sector. The
financial reforms introduced since then focused on two main issues: promotion of
financial intermediation through the establishment and promotion of sound financial
infrastructure and the deregulation of interest rates. The remaining part of this
section highlights the major reform measures introduced in each phase.
3 The CBSL Annual Report (1999) recognised 12 issues to be included in the future economic
reform agendas in Sri Lanka. Among them, there were four issues which may be directly or indirectly related to the financial services sector. They are (1) improvement of efficiency of the state banks, (2) further development of the domestic debt and capital market by permitting foreign investor participation, (3) gradual relaxation of all exchange controls and (4) gradual move towards a complete free float of the exchange rate system.

Chapter Two Deregulation, market structure and the banking industry in Sri Lanka
- 21 -
Table 2.1: Financial services sector reforms from 1977-20034 Year Action 1977 • Abandonment of the former exchange control regulation by introducing a unified
exchange system under a floating exchange rate regime 1979 • Relaxation of operational restrictions by:
− Opening the banking market to foreign participants − Granting new banking licences to the private-sector − Allowing existing banks to expand their branch networks
• National Development Bank was incorporated to provide long-term funds for the development of industrial, agricultural and commercial activities
• Banks were allowed to establish foreign currency banking units to promote offshore banking services and international money market transactions
1980 • M25 and broad monetary aggregate was introduced to monitor money supply in the
economy • The export credit refinance facility was increased by 15% to Rs.30 million • The bank rate was increased from 10% to 12% • Commercial banks’ lending and savings ratios were increased
1981 • Statutory reserve requirements (SRR) were increased with respect to: − demand deposit from 12% to14% − savings deposit from 5% to 6%
• For the first time, CBSL used quantitative measures such as open market operations and the variation of SRR to control money supply
• The American Express Bank introduced CDs to the local market. CBSL encouraged other institutions to use such instruments to attract black money to the market.
• CBSL incorporated a secondary market for treasury bills (TB) and offered TBs at discounted rates between 15% to 16%
• Government incorporated the Employee Trust Funds and National Insurance Corporations
• CBSL granted licences to establish several new finance companies 1982 • Two merchant banks were established by Bank of Ceylon and Peoples’ Bank
• Credit ceilings on bank credit to residents or companies registered in Sri Lanka for the purchase of estates or immovable property were withdrawn
• Colombo Stock Exchange Ltd was established 1983 • Credit ceilings on selected non-priority sectors were removed 1984 • National Saving Bank (NSB) was allowed to set its own deposit rates
• State Mortgage and Investment Bank was reorganised as a specialised housing bank and was authorised to accept deposits
1985 • CBSL established 17 regional rural development banks (RRDB) to enhance savings mobilisation in rural areas
1987 • Securities Council was established for regulating the Colombo stock market • Two new private-sector commercial banks (Sampath Bank and Seylan Bank) were
incorporated and commenced business • CBSL removed the limits placed on commercial banks re the issue of CDs
4 This table was compiled using information in Ariyarathna (1993), Athukorala and Rajapatirana
(2000), Bandara (1998), Cooray (2000), Dunham and Kelegama (1997), Fernando (1991), Karunasena (1999) Karunasena and Jayatissa (1987), Karunatilaka (1986; 1988), Yapa (2003) and various issues of CBSL annual reports.
5 M2 includes currency in use and time and savings deposits.

Chapter Two Deregulation, market structure and the banking industry in Sri Lanka
- 22 -
Table 2.1: Financial services sector reforms from 1977-2003 (Continued) Year Action 1988 • The Banking Act 1988 gave more power to the CBSL for regulation and control
of banking in Sri Lanka 1990 • CBSL established the Credit Information Bureau (CIB) to function as a resources
base for banks in screening borrowers to avoid loan defaults 1991 • Two state-owned commercial banks have asked to make sufficient provisions for
non-performed loans 1992 • Disclosure requirements and loan recovery mechanisms were introduced 1993 • CBSL established a market (REPO-market) for repurchasing treasury bills with a
view to establishing the lower end of the call money market • The private-sector started to issue commercial paper for covering short-term
funding needs 1994 • Acceptance of article VIII of the International Monetary Fund (IMF) agreement
allowed external ‘liberalisation’ • Commercial banks started to issue international credit cards
1998 • CBSL introduced bidding through electronic means in government bond market 1999 • The CBSL:
− further strengthened its supervising role by imposing 10% minimum capital requirements, specific areas which should be covered in auditors’ reports and measures which were to be taken on non-performing loans
− introduced specified disclosure requirements to all banks as a means of promoting a sound and efficient banking system
− set the single borrower limits to 30% of the capital of the banks as of the end of its preceding financial year
• The CBSL started to publish Sri Lanka’s inter bank offer rate (SLIBOR) from June
• The stock market was opened to foreign individual and institutional investors 2000 • Limits on foreign ownership of local commercial banks and insurance companies
were raised to 60% and 90% respectively • CBSL allowed independent floating of the exchange rate
2002 • The financial sector reform committee was established • The lower limit on Statutory Reserve Requirements was removed • Minimum required maturity period of deposits in finance companies was reduced
to one month from three months • Prudential norms applicable to the domestic banking units were extended to the
offshore banking units • Stamp duty and the national security levy on financial transactions were removed • Debit tax on all withdrawals from checking accounts was introduced
2003 • CBSL reduced the ‘repurchase rate’ and the ‘reserve repurchase rate’ by 225 basis points
• Daily determination of SRR on commercial banks’ deposits was introduced • The risk-weighted capital-adequacy ratio (CAR) for banks was raised by 10%

Chapter Two Deregulation, market structure and the banking industry in Sri Lanka
- 23 -
During the first phase of reforms, the banking industry was opened to new entrants,
having been closed for more than 30 years. The private-sector was allowed to
establish new banks subject to minimum capital requirements. At the same time, the
banking industry was opened to foreign banks. For all practical purposes, domestic
banks were permitted to open new branches after gaining permission from the
CBSL. Accordingly, the government was directly involved in expanding branch
networks of state-owned banks throughout the country. However, the expansion of
the branch networks of state-owned banks was aimed at enhancing the popularity of
the governing political party. (Moreover, the government used state banks to provide
employment opportunities to political supporters resulting in excess employment in
the banks).
Initial steps to let market forces determine interest rates were taken by creating an
open market for government treasury bills and bonds in 1993. Restrictions on the
foreign exchange market were relaxed. Banks were allowed to open foreign currency
banking units. However, a reversal of economic reforms occurred in the middle of
the 1980s. During the initial period, Sri Lanka’s foreign exchange rate appreciated
noticeably due to the huge foreign currency inflow for three major foreign-funded
development projects (Dunham and Kelegama, 1997). This had the effect of
decreasing the export income of the country and increasing the trade account deficit.
Hence, in the mid 1980s, the government reintroduced preferential credit facilities
for some sectors. On the other hand, the reform process was further undermined by
the escalated ethnic crises after 1983 and the insurgencies during the 1987-1989
periods. Furthermore, as indicated by Dunham and Kelegama, (1996), consequent
high interest rates, high inflation and the greater expense of welfare and defence
reduced the speed of reform processes.
The second phase of deregulation commenced after the re-election of the ruling
party for the third term, though under a new leadership. The new leadership
managed to crush the insurgents in the south in 1989 and earned an opportunity for
accelerating the economic reforms (Yapa, 2003). As explained by Dunham and
Kelegama (1996), the second stage of liberalisation reforms was aimed at

Chapter Two Deregulation, market structure and the banking industry in Sri Lanka
- 24 -
stabilisation of the economy and further liberalisation to promote the private-sector
as an effective ‘engine of growth’. Accordingly, the government’s fiscal policy
aimed to reduce the budget deficit. The privatisation process was expedited using a
popular term ‘Peoplisation’ (Salih,1999). During this period many of the
government corporations were privatised. The government made some unsuccessful
attempts to privatise the two state banks which led to frequent work stoppages in the
banking sector (CBSL, 2000).
In 1994, a third regime of reforms commenced after a left-wing alliance came into
power. The alliance did not approve the economic deregulation mechanism of the
previous government. However, in the political campaign, they pledged to continue
economic reforms even though they believed that the state should intervene in
priority sectors to provide better services. Political lobbying against the privatisation
of state banks by the strong labour unions in the banking sector also affected the
reforms. In 1996, the government created the Public Enterprise Reform Commission
(PERC). PERC was entrusted to find alternative ways to enhance the performance of
government-owned-business-undertakings (GOBU) and to stem growing public
criticism.
As an alternative to the privatisation of state banks, the government decided to
reorganize two state-owned banks using a process called commercialization. State-
owned banks were converted into limited public companies giving some freedom to
bank management to take radical decisions on the banks’ operations. Further, the
government forced a write-off of non-performing assets in state-owned banks (Bank
of Ceylon, 1999; People’s Bank, 1999). The state banks’ management were given
authority to recruit consultants with international reputations for the reorganization.
The main aim of these initiatives was to improve the banking services offered by the
state banks.
During the last three decades, various governments in Sri Lanka have introduced
different policies to liberalise the financial services sector. The major reforms (see

Chapter Two Deregulation, market structure and the banking industry in Sri Lanka
- 25 -
Table 2.1) in the financial services sector were in the following areas (Karunasena
and Jayatissa, 1987):
• Deregulation of the financial industry (relaxation of entry/exit norms,
reduction in public ownership in banking industry);
• Reforms of institutions and instruments;
• Allowing interest rates to respond to market forces;
• Allowing credit to be allocated according to market dictates;
• Reducing the cost of financial intermediation;
• Strengthening the legal, accounting and regulatory frameworks for financial
institutions;
• Development of money, capital and debt markets; and
• Giving operational flexibility to banks in the management of their assets and
liabilities.
These reforms, which were very similar to those made in Australia, facilitated the
entry of new financial services providers including unit trusts, funds managers,
venture capitalists and investment bankers. Removal of entry restrictions also
allowed the entry of foreign banks and the expansion of the activities of the existing
foreign banks. The government privatised the two major development banks, the
National Development Bank and the Development Finance Corporation.
Commercial banks were encouraged to offer new forms of financial products and
facilities such as credit cards, automatic teller machines (ATM), non-residence
foreign-currency accounts and branded deposits schemes. In 1987, Sampath Bank
and Seylan Bank entered the market as privately-owned commercial banks.
However, the government continued to function as the major participant in the
commercial banking industry by retaining the two large commercial banks, namely
the Bank of Ceylon and the Peoples’ Bank.
The previous section summarised the major reform measures introduced during the
last 23-year period. As explained above, Sri Lanka has opted to use gradual reforms
rather than ‘all at once’. However, measures have been taken for liberalising the

Chapter Two Deregulation, market structure and the banking industry in Sri Lanka
- 26 -
financial services sector at the initial stage of economic deregulation. Moreover, the
reform process has taken a relatively long time. However, even today, policy makers
are not able to introduce sufficient measures to deregulate the banking industry from
government intervention. Previous researchers have suggested that introduction of
economic reforms at the most appropriate time is a major factor underlying the
success of deregulation.
2.3.4 Setbacks to deregulation
As explained previously, beginning in 1977, the government introduced various
measures to deregulate the financial services sector. However, some measures have
given greater freedom to the market forces and some have not. Some reforms have
been reversed in subsequent policy changes. As a consequence, not all the expected
benefits from economic reform have been realised after 27 years of reforms. As
pointed out by Dunham and Kelegama (1997), initial conditions, economic
circumstances, and the nature of the political system adversely affected the
government’s attempts at reform. Further, the policy formulation conflict in
stabilization and adjustment slowed the speed of the economic reform process.
Similarly, Karunatilaka (1986) indicated that short-term political objectives also
undermined the economic reforms.
The World Bank (2003) indicated that the state commercial banks accounted for
49% of banking sector assets, while the private domestic banks accounted for 39%
of the assets (with the rest apparently held by foreign banks) in Sri Lanka. This
indicates that two state banks have a significant influence on the financial system.
The government mainly uses domestic loans to finance budget deficits (CBSL,
2002). The use of commercial banks to fund government deficits at high short-term
interest rates leads to high windfall profits which may mask inefficiency in the
banking system. Bandara (1998) stated that the government intervenes in fixing the
nominal rate of interest on treasury bills. It also encourages deposits with the
National Savings Bank which ultimately determines bank deposit and lending rates.
Politically-driven lending decisions in the state banks have increased intermediation

Chapter Two Deregulation, market structure and the banking industry in Sri Lanka
- 27 -
costs as a consequence of non-performing loans (Bandara, 1998). Further, the under-
developed financial system and the rigid financial institutional structure have
constrained the speed and effectiveness of financial reform (Karunasena and
Jayatissa, 1987).
2.4 Impact of Financial Reforms on the Banking Indu stry
The previous section of this chapter briefly discussed the major financial reforms
implemented after 1977 and the consequent structure of the banking industry in Sri
Lanka. These reforms have affected the financial services sector in different ways.
Edey and Gray (1996) identified three areas which reforms can influence. These are:
(1) the role of financial regulatory policies, (2) improvements in technology used in
institutions and (3) changes in the cost and pricing structures of the intermediation
process. In the Sri Lankan context, the reforms further changed the institutional
structure of the financial services sector in general.
Financial deregulation in Sri Lanka began in the late 1970s and is still being
undertaken to this date. One of the main goals of the policy makers was to increase
the efficiency and productivity gains of the entire financial services sector by
promoting competition among the different forms of financial intermediaries. The
Sri Lankan financial services sector is still dominated by the banking industry. The
deregulation process which commenced in 1977 allowed more freedom to local
banks. Foreign banks were encouraged to enter and to expand banking operations in
Sri Lanka. From 1977 to today, the government of Sri Lanka has introduced
different measures to free the market from government intervention. Table 2.1
highlighted major reform measures introduced. The remaining part of this chapter
discusses how those reforms affected the banking market in general.

Chapter Two Deregulation, market structure and the banking industry in Sri Lanka
- 28 -
2.4.1 Organization of the financial services sector in Sri Lanka
after reforms
Figure 2.1 and Table 2.2 illustrate the composition of the financial services industry
in Sri Lanka. It is composed of the organised sector and an unorganised sector. The
organised sector includes a diverse institutional system. In contrast, the unorganised
sector does not have a formal institutional framework and is based on short-term,
small-scale lending markets. Even after the reforms, the banking sector dominates
the financial services sector in Sri Lanka. The capital market was not able to reach
the anticipated level of development. As a consequence, the debt and the stock
markets have made a very low contribution to the capital accumulation process in
the corporate sector.
The banking sector in Sri Lanka comprises fully-licensed banks and specialised
banks. Fully-licensed banks, which are also called commercial banks, have been
permitted to provide all of the banking services. There are different types of
specialised banks which provide specific services to industry. These specialised
banks are also allowed limited freedom to accept deposits. There are three savings
banks, namely, National Savings Bank (NSB)6, Sanasa Bank and Seylan Saving
Bank. NSB leads the deposits market in Sri Lanka. Savings banks can accept both
long-term and short-term deposits. However, these banks are not allowed to accept
demand deposits. Before 1997, NSB invested its savings mainly in government
treasury bills and it had very limited autonomy to set interest rates. However,
financial reforms have permitted NSB to set interest rates and to determine its
lending portfolio. There are two main development banks which are authorised to
accept long-term deposits and to grant long-term and medium-term loans to
entrepreneurs. By divesting, the government, in effect, gave full control of the
development banks to the private-sector in the late 1980s.
Financial reforms also increased the number of finance companies in the sector at
the beginning. However, the formalisation of the regulatory structure of financial
6 NSB is legally required to invest 60% of its deposits in government securities.
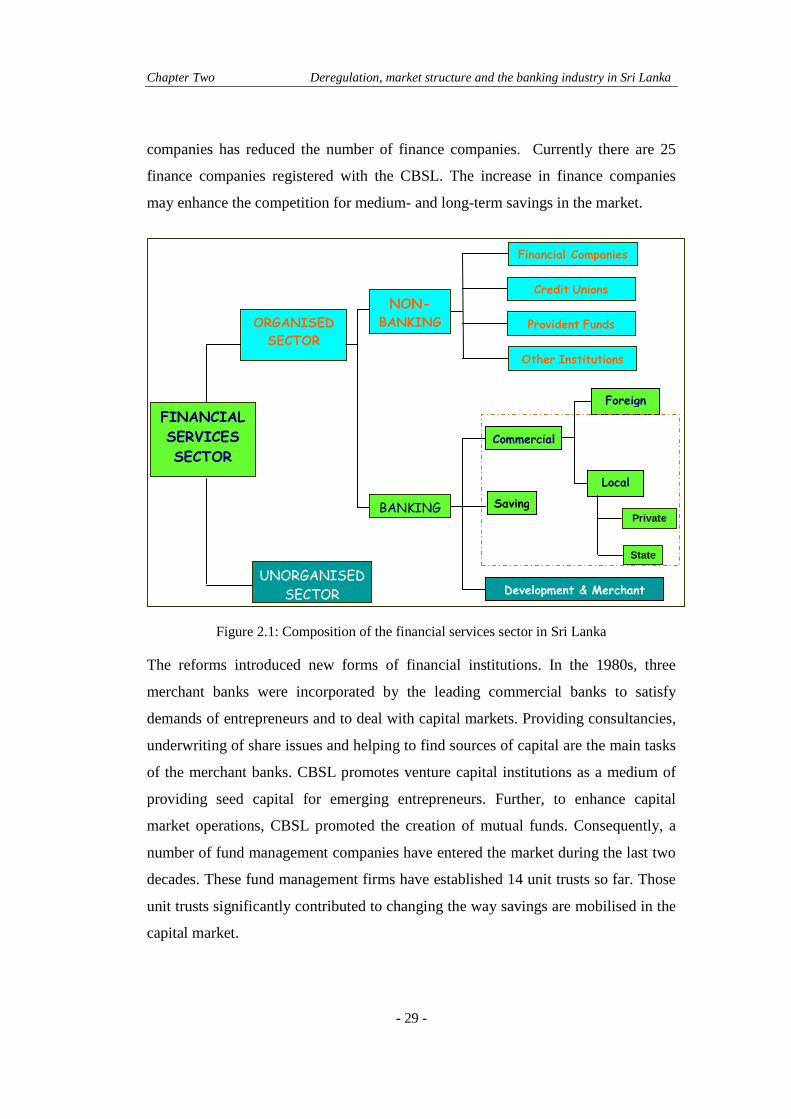
Chapter Two Deregulation, market structure and the banking industry in Sri Lanka
- 29 -
companies has reduced the number of finance companies. Currently there are 25
finance companies registered with the CBSL. The increase in finance companies
may enhance the competition for medium- and long-term savings in the market.
Figure 2.1: Composition of the financial services sector in Sri Lanka
The reforms introduced new forms of financial institutions. In the 1980s, three
merchant banks were incorporated by the leading commercial banks to satisfy
demands of entrepreneurs and to deal with capital markets. Providing consultancies,
underwriting of share issues and helping to find sources of capital are the main tasks
of the merchant banks. CBSL promotes venture capital institutions as a medium of
providing seed capital for emerging entrepreneurs. Further, to enhance capital
market operations, CBSL promoted the creation of mutual funds. Consequently, a
number of fund management companies have entered the market during the last two
decades. These fund management firms have established 14 unit trusts so far. Those
unit trusts significantly contributed to changing the way savings are mobilised in the
capital market.
FINANCIAL
SERVICES
SECTOR
ORGANISED
SECTOR
NON- BANKING
Financial Companies
Commercial
Saving
Development & Merchant
Credit Unions
Provident Funds
Foreign
Local
UNORGANISED
SECTOR
BANKING Private
State
11
Other Institutions

Chapter Two Deregulation, market structure and the banking industry in Sri Lanka
- 30 -
Table 2.2: Infrastructural developments in deposit-taking institutions in Sri
Lanka
Yea
r
Loca
l Com
mer
cial
B
anks
For
eign
Com
mer
cial
B
anks
Reg
iona
l Dev
elop
men
t B
ank
-Bra
nche
s
Sav
ings
Ban
ks
Rur
al B
ank
Bra
nche
s
Lice
nsed
Spe
cial
ised
B
anks
Uni
t Tru
sts
Fin
ance
Com
pani
es
1977 4 [298] 7 - 1 [25] 544 Na - 29
1980 4 [486] 17 - 1 [42] 641 Na - 27
1985 4 [600] 21 - 1 [57] 914 Na - 56
1986 4 [604] 21 - 1 [60] 932 Na - 56
1987 4 [608] 21 - 1 [62] 955 Na - 53
1988 6 [678] 19 80 1 [64] Na Na - 54
1989 6 [690] 18 [21] 89 1 [69] Na Na - 60
1990 6 [719] 18 [23] 100 1 [76] Na Na 2 40
1991 6 [737] 18 [25] 124 1 [81] Na Na 2 24
1992 6 [781] 17 [29] 156 1 [84] Na Na 2 27
1993 6 [845] 23 [33] 163 1 [85] Na Na 2 26
1994 6[876] 23 [36] 169 1 [90] 1216 Na 2 26
1995 6 [876] 26 [37] 171 1 [96] 1251 Na 4 24
1996 7 [906] 26 [37] 175 1 [99] 1293 Na 5 24
1997 8 [949] 18 [38] 176 1 [101] 1329 6 10 25
1998 8 [988] 18 [40] 176 1 [102] 1351 8 10 25
1999 9 [1009] 17 [38] 177 1 [101] 1418 12 12 25
2000 10 [1042] 16 [38] 181 2 [101] 1476 12 12 25
2001 11 [1080] 14 [37] 188 2 [101] 1507 12 12 25
2002 11 [1185] 12 [31] 190 2 [103] 1554 14 13 26
2003 11 [1285] 12 [40 ] 194 2 [112] 1594 14 13 26
2004 11 [1342] 11 [38] 196 2 [112] 1594 14 14 27
[Number of commercial banks’ and savings banks’ branches are in parentheses; Na = data are not available] [Sources: various issues of CBCL annual reports]

Chapter Two Deregulation, market structure and the banking industry in Sri Lanka
- 31 -
Table 2.2 shows the expansion of the deposit-taking institutions in Sri Lanka during
the period 1977 to 2004. In 1977, Sri Lanka had only four local commercial (fully
licensed) banks with 298 branches. Reforms aimed to expand the commercial
banking operations throughout Sri Lanka. In 2004, there were 12 local commercial
banks with 1342 branches. There were also 11 foreign banks that have established
38 branches in the country. As a consequence of the collapse of a private savings
bank in 2000, the government introduced further regulatory changes to strengthen
the supervisory role of the CBSL. In the deregulated environment, the rapid growth
in the financial services sector blurred the differences between fully-licensed banks
and the specialised financial institutions. This led to the introduction of innovative
financial products by the banking institutions.
Financial reforms have reduced the monopoly of commercial banks in the financial
services sector. In the early stage of the financial reforms, newly-established
specialised non-bank financial institutions have taken over some traditional
commercial banking functions such as granting project finance and accepting long-
term deposits. Moreover, financial reforms have allowed capital markets to emerge
as the main avenue of private-sector direct financing in Sri Lanka.
Fully-licensed banks have to compete with other financial institutions in lending
markets as well as in the deposit markets. Most other financial institutions can offer
long-term and medium-term deposit instruments to attract savers. Other financial
institutions such as development banks, venture capitalist and mortgage institutions
operate in the lending markets more assertively than the fully-licensed banks. On the
other hand, foreign banks have emerged as main players in the domestic banking
market with greater freedom in both deposit and lending markets. Those banks were
allowed to offer similar banking products (both deposits and lending) to the local
banks. As a consequence, fully-licensed banks are forced to diversify their product
lines and to find new fee-based services instead of interest-based products.
The scope of the Sri Lanka’s financial services industry has been widened.
Particularly, operations of the banking industry have expanded both in the number of

Chapter Two Deregulation, market structure and the banking industry in Sri Lanka
- 32 -
banks and the number of branches. New financial instruments have been introduced
to the market. The financial reforms allowed more freedom to open up different
forms of financial intermediaries. However, the banking industry is the main
intermediary in the financial services sector in Sri Lanka. Prevailing market-based
interest rates offer a positive real interest rate for savers and consequently enhance
domestic savings. On the other hand, trade liberalisation has increased the demand
for funds. Concomitantly, the new forms of financial intermediaries have increased
competition in the financial services market.
2.4.2 Operational environment of banks
Along with the structural changes, widening of operational activities of other forms
of financial institutions such as insurance, leasing, unit trust and superannuation
funds has increased competition in the financial services sector. The new banks have
started to use ICT as part of their strategy to provide customer-friendly banking
services. Consequently, those banks were able to achieve better competitive
positions than the old commercial banks. Accordingly, old banks also commenced
gradually to transform their out-dated manual-based banking systems to ICT-based
modern automated banking systems. However, a premeditated (less aggressive)
approach followed by existing banks did not allow them to reap the full benefits of
automation. Local banks tended to introduce new products and improve their
existing facilities and delivery channels. This strategy was needed to attract new
customers and to retain their existing customers in a competitive environment.
During the period, some banks introduced entirely new banking facilities such as
internet banking and phone banking, which added new features to their automatic
teller machine (ATM) facilities.
The number of ATMs operated and the number of credit cards issued has
significantly increased during the period (see Table 2.3). With the increasing
number of bank branches operating, the bank density ratio7 has significantly
improved from 0.58 in 1998 to 0.71 in 2004 as shown in Table 2.3. During the
7 Number of bank branches available for 10,000 people

Chapter Two Deregulation, market structure and the banking industry in Sri Lanka
- 33 -
1970s, private-sector and foreign banks were not allowed to expand their bank
branch networks. Deregulation measures introduced in the early stage of financial
reforms removed this restriction. As a result, the total number of bank branches has
increased from 298 branches in 1977 to 1342 branches and 1109 business centres8 in
2004 (see Table 2.2).
Table 2.3: Development in banking facilities in Sri Lanka Year Banking
Density
Number of
ATMs
Number of credit
cards issued
1998
1999
2000
2001
2002
2003
2004
0.58
0.58
0.59
0.60
0.61
0.69
0.71
270
316
379
466
635
710
810
85,964
161,079
205,324
253,258
349,524
393,854
507,591
[Source: Various issues of CBSL Annual Reports]
Another objective of the financial reforms in Sri Lanka is to deepen the financial
services sector. In particular, changes in the institutional structure and the regulatory
environment have helped to deepen the financial services sector activities.
Consequently, the sector contribution in the gross domestic product (GDP) improved
during the period from 1977 to 2004. As exhibited in Figure 2.2, the contribution
increased from 1.6% of GDP in 1977 to 12.2% of GDP in 2004 indicating a clear
upward trend in the sector’s contribution after 1990, which commenced the second
phase of the reforms. This improvement in the sector coincided with a widening of
economic activities in the country with open economic policies. This substantial
growth has verified that the financial services sector has played a notable role in Sri
Lanka’s economic development, confirming McKinnon’s (1973) and Shaw’s (1973)
arguments.
8 A business centre is a banking unit which provides limited banking services such as accepting
deposits, collecting loan repayments and providing consumer loans by mortgaging.

Chapter Two Deregulation, market structure and the banking industry in Sri Lanka
- 34 -
[Source: Various issues of CBSL Annual Reports]
Figure 2.2: Financial services sector contribution to the GDP
The changes in aggregate money supply in the economy during the last 27 year
period reflect how the reform process has deepened the financial system. CBSL
annually provides statistics for three different measures of monetary aggregates.
These annual aggregate sums incorporate currency, commercial banks’ demand
deposits, time and savings deposits and deposits with finance companies. Narrow
money (M1) supply comprises currency and commercial banks’ demand deposits.
M2 adds time and saving deposits to the M1. Broad Money supply (M4) takes in all
currencies and savings including deposits with finance companies.
Figure 2.3 outlines the behaviour of money supply during the period. The graph
indicates the gradual expansion of Sri Lanka’s money supply. The rapid increase in
M2 identifies the expansion of commercial banking activities in the financial
services sector. In 1985, commercial banks’ contribution to broad money supply was
relatively insignificant. However, by 1990 it had become a significant portion of
broad money supply. Accordingly, developments in the financial services sector
have widened the market for deposits.
0.0%
3.0%
6.0%
9.0%
12.0%
1975 1980 1985 1990 1995 2000 2005
Year

Chapter Two Deregulation, market structure and the banking industry in Sri Lanka
- 35 -
[Sources: Various issues of CBSL Annual Reports]
Figure 2.3: Monetary aggregates
Figure 2.4 shows how the total assets base of commercial banks has been widened
during the period 1987 to 2004. The evolution of the financial services sector has
increased the assets base of the commercial banks. The percentage of the
commercial banks’ assets to GDP grew from 43% in 1987 to 58% in 2004 (CBSL,
2004). In rupee terms, the assets base of the commercial banks has significantly
increased from Rs.76.8 billion in 1987 to Rs.1028 billion in 2004 (CBSL, 2004).
[Sources: Various issues of CBSL Annual Reports]
Figure 2.4: Banks’ assets as proportion of GDP
0
200
400
600
800
1,000
1,200
1985 1988 1991 1994 1997 2000 2003 Year
Rs
billi
on
s
M1 M2 M4
40%
50%
60%
70%
1986 1988 1990 1992 1994 1996 1998 2000 2002 2004
Year

Chapter Two Deregulation, market structure and the banking industry in Sri Lanka
- 36 -
However, the financial services sector was unable to attract all of the domestic
savings in the economy. In 2004, the financial services sectors total contribution to
the GDP was 12.2% while the total domestic savings was 16%. In the same year, the
total investment was 25% of GDP. This indicates that a significant portion of
financial assets is flowing through institutional systems other than the financial
services sector. However, Figure 2.5 shows that the financial services sector was
able to improve its intake during the last 16 year period.
[Sources: Various issues of CBSL Annual Reports]
Figure 2.5: Domestic savings, investment and financial services sector contribution to GDP
2.4.3 Deposit and lending interest rates
Deregulation gave more freedom to market forces in determining interest rates by
removing preferential credit schemes and by establishing a market for government
debt instruments. CBSL uses two key policy interest rates, repurchase (repo),9 and
reverse repurchase (reverse repo)10 to guide the market interest rates. NSB (a state-
owned savings bank) is given latitude in determining its deposit rates. These policy
rates and the NSB deposit rates are the main factors in determining the market rates.
Market interest rates are sensitive to both local rates and international interest rates.
9 The rate at which commercial banks and primary dealers invest their surplus funds in
government securities sold by the CBSL under short-term repurchase agreements. 10 The rate at which commercial banks and primary dealers can obtain funds from the CBSL by
selling government securities to CBSL under short-term repurchase agreements.
0%
10%
20%
30%
1989 1991 1993 1995 1997 1999 2001 2003 2005 Year
Financial services sector Investment Domestic Savings

Chapter Two Deregulation, market structure and the banking industry in Sri Lanka
- 37 -
The economic recession in the industrialised countries in the late 1990s occasioned a
reduction in both the levels of deposits and a reduction in the interest rates in the
international markets.
[Sources: Various issues of CBSL Annual Reports]
Figure 2.6: Commercial bank lending and deposit interest rates
Commercial banks use multiple interest rates for their different deposit and lending
products. Interest rate differentiation was the main strategy which commercial banks
used to counter peer rivalry in the market. The establishment of the CIB and
publication of all deposit and lending interest rates of commercial banks by the
CBSL assisted in keeping the market informed regarding interest rates. During the
last two decades, market interest rates have readily responded to both changes in
locally- and internationally determined interest rates. Figure 2.6 indicates the gradual
reduction in the lending and deposit rates by commercial banks during this period.
The average weighted deposit rates, which are based on the weighted average of the
outstanding interest bearing deposits of commercial banks, declined commensurately
during the period. Similarly, lending rates indicated a slower downward trend. The
‘interest rate spread’ is commonly used as an indicator of the efficiency of financial
intermediation (Heffernan, 1996). During the period being considered, the interest
rate spread declined at a slower rate. This may be a result of slow adjustments in
lending rates, high operational costs, lower quality lending portfolios and less
0%
5%
10%
15%
20%
25%
1992 1994 1996 1998 2000 2002 2004
Year
ADR-Com Prime Lending Spread

Chapter Two Deregulation, market structure and the banking industry in Sri Lanka
- 38 -
reliance on the non-interest bearing activities. However, the financial reforms have
forced banks to adopt rigid risk control procedures, to cut down unnecessary
expenses and to be more responsive to market changes. The declining trend in the
interest rate spread indicates that the measures used to reduce interest rates have
been successful.
During the 1990s, the Sri Lankan government introduced an open-market policy for
government securities (see Table 2.1). Aggressive open-market operations affected
banks’ holdings of government debt. As shown in Figure 2.7, since 1991 the banks’
stake in government debt grew significantly. On the other hand, banks’ involvement
in the open market for government securities has affected the market determined
interest rate. The increase in banks’ involvement in the open market resulted in an
upward trend in interest rates. Furthermore, the government used overdraft facilities
provided by the two state banks to feed short-term funding needs. Higher total
contribution was reported to be mainly due to the overdraft facilities provided by the
two state banks to the public corporations. As indicated in the CBSL 2001 Annual
Report, the two state banks provided SLR. 38.1 billion overdraft facilities to the
government in 2001. In 2002, the government used market-oriented instruments
such as treasury bonds and government restructuring bonds to pay out this debt
obligation (Peoples Bank, 2002; Bank of Ceylon, 2002).
[Sources: Various issues of CBSL Annual Reports]
Figure 2.7: Commercial banks’ ownership of government debt as a percentage of total domestic loans
0%
10%
20%
30%
40%
1984 1989 1994 1999 2004 Year

Chapter Two Deregulation, market structure and the banking industry in Sri Lanka
- 39 -
2.4.4 Total assets and liabilities of commercial ba nks
During the past two decades, the total assets and liabilities base of commercial banks
has drastically changed. Figure 2.8 and Figure 2.9 exhibit how the assets and
liabilities have improved during this period. Compared to 1987 records, the total
assets of commercial banks grew by ten-fold in 2004. The improvements were
mainly achieved by the expansion of the deposit and lending portfolios of
commercial banks. Banks’ investment portfolios recorded a comparatively slow
growth rate. Even though the total assets base significantly increased, total capital
contribution recorded a relatively and comparatively small growth rate.
[Sources: Various issues of CBSL Annual Reports]
Figure 2.8: Funding sources of banks
The new banks were first to use ICT in the banking industry. Prior to 1977, the local
banks used manual procedures for banking activities. Manual processing
characteristically took a relatively long time to complete each transaction. However,
new private-sector banks applied ICT. They also introduced the uni-banking system
to Sri Lanka’s financial sector. The new banks pioneered the expansion of
automated banking facilities throughout the country. These new trends in the
industry first started with the introduction of an automated teller machine in the city
office of a foreign bank.
0
200
400
600
800
1000
1200
1984 1986 1988 1990 1992 1994 1996 1998 2000 2002 2004 Year
Rs.
Bill
ion
s
Total assets Total deposits Capital Borrowings

Chapter Two Deregulation, market structure and the banking industry in Sri Lanka
- 40 -
[Sources: CBSL Annual Reports]
Figure 2.9: Uses of commercial banks’ assets
In the beginning, new banks used ICT to stay ahead of the market. Their success in
the application of technology caused the established banks to change from manual
procedures to automated operations. Under the previous regulated regime, banks
tended to offer very limited services to the market with no encouragement for new
banking products. With the opening up of the economy, banks differentiated their
product lines by introducing services with various features. During the past two
decades, many banks, including the foreign banks, have introduced various
competitive preferential deposit and lending schemes. Consequently, a significant
improvement in the total asset base of banks in Sri Lanka have been recorded.
2.4.5 Ownership of commercial banks’ assets
The financial reforms also aimed to reduce the state banks’ monopoly in the
commercial banking sector. As stated previously, the influence of the powerful trade
unions have prevented the ‘privatisation’ of the two state banks. The reforms
enhanced private-sector participation in commercial banking. In 1989, more than
65% of commercial banks’ assets were owned by the government sector. However,
the state banks’ proportion of the total assets declined to 48% in 2004. Figure 2.10
illustrates the changes in ownership of banking assets during the study period.
Increase in market share of the private banks has affected the market competition. In
0
200
400
600
800
1,000
1,200
1984 1986 1988 1990 1992 1994 1996 1998 2000 2002 2004 Year
Rs.
Bill
ion
s
Assets Loan Investments

Chapter Two Deregulation, market structure and the banking industry in Sri Lanka
- 41 -
short, the changes in the market structure and competition were attributed to the
development in technology. This may have improved the efficiency and productivity
of the sector.
[Sources: CBSL Annual Reports]
Figure 2.10: Ownership of commercial banks’ assets
2.4.6 Banking concentration
Table 2.4 illustrates the concentration of the Sri Lankan banking industry [which is
measured using the Herfindahl-Hirshman index (HHI)11] for some market indicators
of banking industry such as total deposits, total loans and advances, total assets and
total turnover. The concentration ratio shows the changes in market structure
throughout the period. All estimated concentration ratios have indicated a gradual
reduction in market concentration evidencing an increase in the degree of market
competition in the banking industry. The changes in market concentration have
resulted from the entrance of new banks as well as the expansion of operational
activities of the existing banks.
11
2
1∑
=
=N
i
i
V
vHHI , N = number of firms, vi = market share of ith firm, V =total market share
(See chapter 6 ).
0%
20%
40%
60%
80%
1989 1991 1993 1995 1997 1999 2001 2003 Year
State Private

Chapter Two Deregulation, market structure and the banking industry in Sri Lanka
- 42 -
Table 2.4: Bank market concentration (HH index) Year Deposits Loans Total Assets Turnover 1989 26% 35% 27% 25% 1990 26% 33% 27% 25% 1991 25% 29% 25% 24% 1992 23% 25% 24% 22% 1993 22% 25% 23% 22% 1994 22% 25% 22% 22% 1995 21% 24% 21% 22% 1996 21% 21% 21% 21% 1997 20% 21% 20% 21% 1998 19% 20% 19% 19% 1999 18% 18% 18% 19% 2000 18% 19% 19% 18% 2001 17% 20% 18% 18% 2002 17% 17% 16% 17% 2003 16% 16% 16% 15% 2004 16% 15% 15% 15%
2.5 Synthesise
This chapter examined the extent of regulatory reforms in the financial services
sector and their apparent influence on the banking industry in Sri Lanka. The
analysis in the chapter has highlighted that the financial services sector in Sri Lanka
has experienced a gradual reform process. However, reforms were not undertaken at
the same speed throughout the study period. Socioeconomic barriers such as
leftwing political upsurge, civil war and the influence of trade unionists have slowed
down the reforms. Further, the policy makers have not capitalised on all favorable
opportunities to introduce reforms.
Moreover, the chapter has shown that the reforms have affected the structure of the
banking sector, generating significant improvements in banking activities during the
period. The analysis found in summary:
1. An increase in the contribution of the financial services sector to GDP and
the deepening of the sectors’ operations;
2. Improvement in the institutional infrastructure of the financial services sector
with the number of institutions and scope of operations;
3. Improvement in the assets base and deposit base of commercial banks;

Chapter Two Deregulation, market structure and the banking industry in Sri Lanka
- 43 -
4. Reduction in government ownership of commercial banks’ assets;
5. A negative trend in the interest rate margin;
6. High reliance on commercial banks for government budget deficit financing;
and
7. A reduction in bank concentration.
Consequently, the banking industry in Sri Lanka has gained improvement in terms
of depth of the industry (new entrants, number of branches, foreign banks’
involvement, total assets) and resilience (on responding to the concurrent regulatory
reforms). Furthermore, these reforms have changed the technology used and the
products offered by the banking sector. The changes in market structure have
intensified competition not only in the banking industry but also in the overall
financial services sector. Diversification of operational activities of banking firms
has changed the relative importance of the traditional sources of income of the
banking sector, from reliance on interest earned to greater emphasis on fees earned.
Currently, policy makers are focusing on further reforms in the financial services
sector. However, there has been no formal evaluation of the outcome of the financial
reforms. As stated in the literature, financial reforms target multiple objectives. A
comprehensive study leading to an examination of the accomplishments of these
objectives is important at this stage. It is worthwhile to examine how the reforms
have affected the market structure, competition, efficiency and productivity gains.
The next chapter will review the literature related to efficiency and productivity
gains and their applications in the banking industry. The findings in the next chapter
are used to form a research framework for the study.

Chapter Three Concepts and measurements of efficiency and productivity change and their application in the banking industry
- 44 -
CHAPTER THREE
CONCEPTS AND MEASUREMENTS OF EFFICIENCY
AND PRODUCTIVITY CHANGE AND THEIR
APPLICATION IN THE BANKING INDUSTRY
3.1 Introduction
Efficiency and productivity measures supplement the other financial performance
measurement methods such as return on total assets, return on capital employed,
margin ratios and market to book value ratio. In the recent past, researchers have
focused on the issue of efficiency and productivity gains in various industries
including the financial services sector. The aim of this chapter is to review the
literature related to productivity and measurements of productivity, giving special
reference to productivity analysis in the financial services sector.
The chapter is set out as follows. The first section introduces various concepts of
productivity. The second and third sections discuss the approaches which can be
applied for measuring productivity in a business unit in a given industry. The fourth
section provides a general review of the data envelopment analysis (DEA) approach.
The fifth and sixth sections mainly focus on issues related to the banking industry;
the fifth section presents a literature survey on input and output issues, while the
sixth section reviews empirical studies in commercial banking efficiency and
productivity which used DEA to measure efficiency and productivity gains.

Chapter Three Concepts and measurements of efficiency and productivity change and their application in the banking industry
- 45 -
3.2 Productivity Concepts
Productivity is generally defined as the relation between output (produced goods)
and input (consumed resources) and can be regarded as one of the most vital factors
affecting competitiveness of a business firm (Robert, 1998). A firm can achieve
productivity gains by producing either a greater output from a given level of inputs
or by using a minimum amount of inputs to produce a given level of outputs (Coelli,
Rao and Battese, 1998). In this context, productivity can be defined as the ratio of
the output(s) to the input(s) used.
[Source: An extension of Coelli, Rao and Battese (1998, p. 4)]
Figure 3.1: Production frontier and technical efficiency
The terms efficiency and productivity are not precisely the same thing. Coelli, Rao
and Battese (1998) used a simple production process which produces a single output
using a single input to illustrate the difference between efficiency and productivity
based on a diagram reproduced above. The curve 0Q in Figure 3.1 depicts the
production frontier, which indicates the maximum possible level of output that can
be attained using inputs with maximum efficiency. Accordingly, the production
frontier reflects the current state of the technology in the industry under review.
Points A, B, C, D and E are current levels of production of respective decision-
making unit (DMU) (Coelli, Rao and Battese, 1998). All input and output
C
Q
B
A
y
0 x
D E
Where; y = Outputs x = Inputs 0Q = Production Frontier (period one) A, B, C, D & E = DMUs
•
• •

Chapter Three Concepts and measurements of efficiency and productivity change and their application in the banking industry
- 46 -
combinations on and underneath the production frontier are considered as the
feasible production set. Any firm which has a combination of inputs and outputs on
the production frontier is considered to be technically efficient. Similarly, firms
having input and output combinations below the frontier are considered to be
technically inefficient. The technically efficient firms are able to produce the
maximum amount of output using a given quantity of inputs with existing
technology. Accordingly, firms B, C and D can be considered as the technically
efficient firms while A and E are inefficient.
[Source: An extension of Coelli, Rao and Battese (1998, p. 5)]
Figure 3.2: Productivity, technical efficiency and scale efficiency
Figure 3.2 illustrates the difference between efficiency and productivity. Since
productivity is defined as the ratio of outputs to inputs, the slope of the ray drawn
from the origin to a particular data point can be used to measure productivity. If the
firm ‘A’ wants to achieve the technically efficient output level enjoyed by firm ‘B’,
firm ‘A’ must be able to gain a higher level of productivity than before. Even firm
‘B’, which is operating as an efficient firm, can gain a higher level of productivity
by achieving the current production level of ‘C’. Since firm ‘C’ has the highest
output to input ratio, that point is regarded as the point which exhibits the optimum
scale of production. This implies any firm which is operating at any point other than
point ‘C’ has lower productivity. Thus, economically efficient firms should lie on
Optimal Scale
C
Q’’
B
A
y
0
x
D
Where; y = Outputs x = Inputs 0Q’ = Production Frontier (period one) 0Q2’ = Production Frontier (period two) A, B, C, D & E = DMUs
Q2’’
Technical Change B2
● E

Chapter Three Concepts and measurements of efficiency and productivity change and their application in the banking industry
- 47 -
the point which indicates the optimum scale of operation in the production frontier.
All other firms on the production frontier are technically efficient but not
allocatively efficient1. As indicated in Figure 3.2, only firm ‘C’ is operating at
optimal scale. The other firms, ‘B’ and ‘D’, are technically efficient but not efficient
in scale. Hence, those firms are not economically fully efficient. Firms ‘B’ and ‘D’
should seek improvements in allocative efficiency. For example, firm ‘B’ can gain
economic efficiency by moving to point B2 without increasing inputs or by moving
to point C by reducing both inputs and outputs. In economics, this process is referred
to as obtaining scale efficiency or return to scale (RTS).
There are three ways of achieving optimum scale. The first involves constant returns
to scale (CRS). CRS exists when a proportional increase in all inputs results in the
same proportional increase in output. The second is increasing returns to scale
(IRTS) which exists when a proportional increase in all inputs results in a more than
proportional increase in output. The last, decreasing returns to scale (DRS) exists
when an increase in inputs results in a lower percentage of increase in outputs. The
influence of the return to scale depends on the firm’s characteristics such as firm
size, nature of the industry and overall environment of the economy. As indicated by
Coelli, Rao and Battese (1998), the RTS can be investigated by estimating the total
elasticity of production2.
The consideration of scale moves firms from the short-run to the long-run where all
inputs may be varied. In the long-run, productivity improvements are expected to
stem from both increases in technical efficiency and technical change. Technological
change produces an upward shift of the production frontier. Allocative efficiency
exists when a firm is able to select an input mix to produce an output mix at a
minimum cost. Allocative efficiency and technical efficiency collectively contribute
to economic efficiency (Coelli, Rao and Battese, 1998).
1 A firm’s ability to use an optimal mix of inputs to produce outputs 2 The total elasticity of production measures the proportional change in output resulting from a
change in inputs

Chapter Three Concepts and measurements of efficiency and productivity change and their application in the banking industry
- 48 -
Productivity measurement may be limited to single physical units or may involve
prices of factors and outputs. The concept of productivity is linked closely with the
issues of efficiency and encompasses several efficiency elements such as price
efficiency3, allocative efficiency, technical efficiency and scale efficiency. The
overall productivity level of an organisation depends on all these elements.
Improvements in efficiency and productivity gains can be considered as one of the
goals of a firm in a competitive market. Therefore, measurements in efficiency and
productivity gains provide supplementary information about the firm’s performance.
These measurements can be considered as non-financial performance indicators as
they consider all of the contributors to the firm’s performance. In any organisation,
whether it is profit-oriented or not, measurements of productivity help to analyse the
efficiency of resource use in the organisation. Moreover, productivity indices help to
set realistic targets for monitoring activities during an organisational development
process by highlighting bottle-necks and barriers to performance. Reynolds and
Thompson (2002) stressed that productivity measurement, monitoring and
improvement leads to overall gains in profitability. Berger and Humphrey (1997)
indicated that the first task in evaluating performance in an institution is to separate
those production units which performed better than the other units.
Productivity can be measured by using either partial-factor productivity, which is the
ratio of output (measured in specific units) to any input (also measured in specific
units), or total factor productivity (TFP), which is the ratio of total outputs to total
inputs used in production. Partial measures can be defined for specific operational
attributes such as total revenue per labour unit, expenses as a percentage of total
assets, and return on assets. In contrast, TFP measures estimate the overall
effectiveness of utilization of inputs to produce the outputs. Production frontier
analysis (PFA) and index number approaches can be used to estimate TFP. The main
PFA approaches which are used for estimating TFP are explained in the section 3.3.
The index number approach is an alternative method which can be applied for
3 Price efficiency is the firm’s ability to purchase inputs that meet the required quality and standard
of the lowest prices.

Chapter Three Concepts and measurements of efficiency and productivity change and their application in the banking industry
- 49 -
estimating total productivity. Grifell-Tatje and Lovell (1996) identified the
Tornquvist Index, the Fisher Ideal Index (which is geometric mean of the Laspeyres
and Paasche Indices) and Malmquist Productivity Index (MPI) as the main indices
that can be used in productivity analysis.
3.3 Production Frontier Approaches
Out of several available alternative approaches the PFA is more popular in empirical
studies in efficiency and productivity. The majority of contemporary researchers
have relied on relative productivity measures based on PFA. Those studies have
used observed data to construct the production frontier for estimating efficiency and
productivity gains.
Both econometric (parametric) approaches and linear programming (non-parametric)
approaches can be applied to construct a production frontier. The econometric
approach uses pre-specified functional forms such as ‘the translog production
function’ (Coelli, Rao and Battese, 1998). The relative efficiency and productivity
gains of the firms in a given industry have been measured using the production
frontier. Berger and Humphrey (1997) identified two advantages of using frontier
analysis as a tool for measuring efficiency and productivity gains. The first is that
PFA allows an analyst to select the best performing firms (or branches) within a
given industry (or within the branches in the same firms) by measuring relative
productivity. The second is that it allows management to objectively identify areas
of best practice within complex service operations.
3.3.1 Parametric approaches
There are three parametric approaches, namely, stochastic frontier approach (SFA),
distribution free approach (DFA) and the thick frontier approach (TFA). SFA is also
known as the econometric frontier approach, which specifies a functional form for
the cost, profit or production relationship among inputs, outputs and environmental
factors. SFA allows for random error. DFA uses more flexible functional forms and
is based on no strong assumptions about the specific distributions of the inefficiency

Chapter Three Concepts and measurements of efficiency and productivity change and their application in the banking industry
- 50 -
or random error. TFA specifies a functional form and assumes that deviations from
predicted performance values within the highest and lowest performance quartiles of
observations represent random error, while deviations in predicted performance
between the highest and lowest quartiles represent inefficiencies. Berger, Hunter and
Timme (1993) found that the studies based on parametric approaches were not able
to incorporate the technologies of both large and small banks together in a single
model. For instance, the commonly used translog cost functional specification gives
a poor approximation when applied to banks of all sizes (McAllister and McManus,
1993). Favero and Papi (1995) presented the following arguments against the
parametric approaches in general:
• Parametric approaches use a specific functional form. Hence the shape of the
production frontier is pre-supposed;
• Parametric approaches need to specify assumptions about the form of the
production function;
• It becomes impossible to implement diagnostic checking on the fitted model
based upon the estimated residual due to the assumptions;
• It is difficult to implement in multi-input multi-output settings.
The outcome of the parametric approaches is significantly influenced by the size of
the sample. If the sample is not able to provide an adequate number of observations
to be applied for estimating the variables for constructing the production frontier, the
estimated econometric model may provide misleading information.
3.3.2 Non-parametric approaches
Contrary to the parametric approaches, non-parametric methods are not based on a
pre-specified functional form. DEA and free disposal hull (FDH) are the two main
non-parametric approaches used for measuring productivity. DEA provides
benchmark indices for evaluating the relative productive efficiency of DMUs in a
given industry or sub-units in a firm. Different forms of DEA models have been
developed based on different perspectives (see Table 2.2). DEA was first used for
comparing the performance of a matched set of school districts (Charnes et al.,

Chapter Three Concepts and measurements of efficiency and productivity change and their application in the banking industry
- 51 -
1997). Since then, DEA has been widely used for analysing efficiency and
productivity gains in many industries including the service sector. It integrates
multiple inputs and outputs into one productivity indicator using a linear
programming technique (Reynolds and Thompson, 2002). The linear programming
technique allows both controllable and uncontrollable variables and produces a
productivity index which relates all units under comparison. The FDH model is an
alternative specification of the DEA model in which the points on the line
connecting the DEA vertices are not included in the frontier.
In general, non-parametric approaches have the following features/assumptions:
• A specific functional form is not used (Drake and Hall, 2003);
• No measurement error in constructing the frontier (Drake and Hall, 2003);
• No scope for ‘luck’ to temporarily give a DMU an apparently better
measured performance one year than the next;
• No inaccuracies created by accounting rules that would make measured
outputs and inputs deviate from economic output and inputs.
However, non-parametric approaches also have some inherent weaknesses. These
weaknesses reduce the usefulness of the non-parametric methods to some extent.
Some of these weaknesses are listed below (Berger and Mester, 1997):
• Do not allow for random error;
• DEA ignores price information;
• Estimate technical efficiency only and do not account for allocative
efficiency;
• Comparability problem arises on the heterogeneity of product mixes of
DMUs;
• Difficult to find out whether the output being produced is optimal without
value information on the outputs;
• Focus on technological rather than the economical optimization.
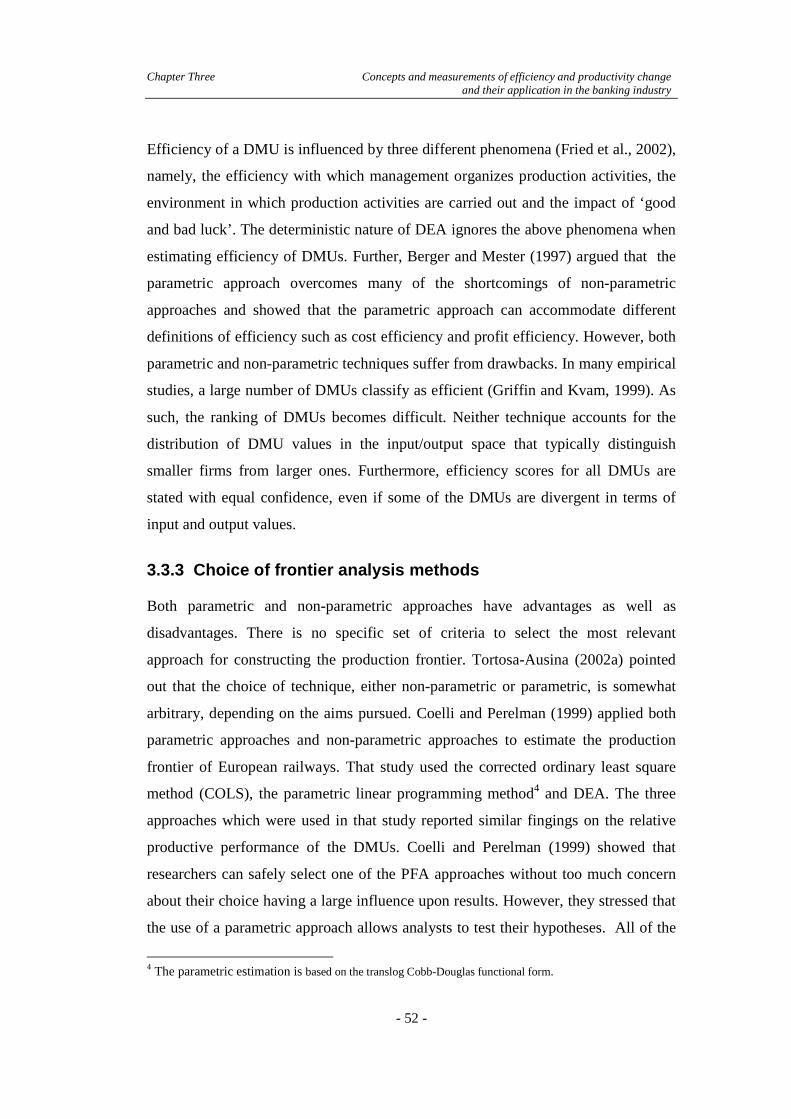
Chapter Three Concepts and measurements of efficiency and productivity change and their application in the banking industry
- 52 -
Efficiency of a DMU is influenced by three different phenomena (Fried et al., 2002),
namely, the efficiency with which management organizes production activities, the
environment in which production activities are carried out and the impact of ‘good
and bad luck’. The deterministic nature of DEA ignores the above phenomena when
estimating efficiency of DMUs. Further, Berger and Mester (1997) argued that the
parametric approach overcomes many of the shortcomings of non-parametric
approaches and showed that the parametric approach can accommodate different
definitions of efficiency such as cost efficiency and profit efficiency. However, both
parametric and non-parametric techniques suffer from drawbacks. In many empirical
studies, a large number of DMUs classify as efficient (Griffin and Kvam, 1999). As
such, the ranking of DMUs becomes difficult. Neither technique accounts for the
distribution of DMU values in the input/output space that typically distinguish
smaller firms from larger ones. Furthermore, efficiency scores for all DMUs are
stated with equal confidence, even if some of the DMUs are divergent in terms of
input and output values.
3.3.3 Choice of frontier analysis methods
Both parametric and non-parametric approaches have advantages as well as
disadvantages. There is no specific set of criteria to select the most relevant
approach for constructing the production frontier. Tortosa-Ausina (2002a) pointed
out that the choice of technique, either non-parametric or parametric, is somewhat
arbitrary, depending on the aims pursued. Coelli and Perelman (1999) applied both
parametric approaches and non-parametric approaches to estimate the production
frontier of European railways. That study used the corrected ordinary least square
method (COLS), the parametric linear programming method4 and DEA. The three
approaches which were used in that study reported similar fingings on the relative
productive performance of the DMUs. Coelli and Perelman (1999) showed that
researchers can safely select one of the PFA approaches without too much concern
about their choice having a large influence upon results. However, they stressed that
the use of a parametric approach allows analysts to test their hypotheses. All of the
4 The parametric estimation is based on the translog Cobb-Douglas functional form.

Chapter Three Concepts and measurements of efficiency and productivity change and their application in the banking industry
- 53 -
methods are not able to provide robust estimation of the relative efficiency of
DMUs. Therefore, they suggested using the geometric average of the efficiency
indices identified using alternative approaches.
3.4 Data Envelopment Analysis
DEA is a performance analysis technique which is not based on a pre-defined
functional form. It measures the relative productivity of the DMUs. Productivity
indexes for each unit are determined by using actual data. The original Charnes,
Cooper and Rhodes (1978) formulation (called the CCR model) determines the
relative efficiency measure for a DMU by maximising the ratio of weighted outputs
to inputs based on the condition that similar ratios for all DMUs are less than or
equal to one. Hence, each efficient DMU has a weight equal to unity and inefficient
DMUs should have a weight less than one.
The CCR model and Banker, Charnes and Cooper (1984) model (called the BCC
model) are the two basic DEA formulations which have been commonly used in
empirical studies. The CCR model uses an optimization method of mathematical
programming to generalize the single output/input technical measure to the multiple
output/multiple input case. It is based on CRS when enveloping the actual data to
determine the shape of the production frontier. Contrary to the CCR model, the BCC
model uses variable returns to scale (VRS) for identifying the envelopment surface.
Figure 3.3 graphically illustrates the shape of envelopment surfaces for a single
input and single output case under CCR and BCC models. Points A, B, C, D, E and
F represent the observed performance of six DMUs. The CCR model develops the
production frontier on the assumption that all firms are operating at an optimum
scale. The line extending from the origin through point B and C is the production
frontier identified by the CCR model. Contrarily, BCC ignores the above assumption
and introduces a convexity condition to the basic CCR model which allows
benchmarking of the inefficient DMUs with similar size DMUs (Coelli, Rao and
Battese, 1998). The curve which connects points A, B, C, D and E represents the
BCC production frontier.

Chapter Three Concepts and measurements of efficiency and productivity change and their application in the banking industry
- 54 -
[Source: An extension of Coelli, Rao and Battese (1998, p. 152)]
Figure 3.3: Envelopment surface under CCR and BCC formulation
As stated above, CCR ignores the relative size of the DMUs when estimating
efficiency. It is assumed an increase in output is always proportional to an increase
in inputs and thus the scale of production is ignored. On the other hand, BCC models
give precedence to the scale of operation in estimating efficiency. Hence, efficiency
estimated using BCC refer to pure-technical efficiency5 while estimates using CCR
refer to technical efficiency. The difference between estimated CCR and BCC
efficiency scores is denoted as scale efficiency.
DEA uses three projection paths of inefficient units to the envelopment surface for
measuring the efficiency, namely, input-oriented, output-oriented and additive.
Figure 3.4 graphically represents those projection paths. The input-oriented model
identifies technical inefficiency as a proportional reduction in input usage for a given
level of output. Contrarily, the output-oriented model identifies technical
inefficiency as a proportional augmentation of output for a given level of input.
Additive models combine both effects of input utilization and output augmentation
(Coelli, Rao and Battese, 1998).
5 Pure-technical efficiency considers both managerial (technical) and scale effect on the
performance of DMUs under consideration (Cooper, Seiford and Kaoru, 2000).
CRS: Production frontier under the CCR formulation
VRS: Production frontier under the BCC formulation
A,B,C,D,E & F are DMUs
Scale inefficiency
Output
Input
VRS
0
E D C
B
A
• F
CRS
Technical efficiency
Pure-technical efficiency
Optimum Points

Chapter Three Concepts and measurements of efficiency and productivity change and their application in the banking industry
- 55 -
Figure 3.4: Mode of assigning efficiency indices
The traditional DEA limits the efficiency scores of efficient units to 100% in both
input-oriented models and output-oriented models. DEA scores for inefficient units
are lower than 100%. Both input-oriented and output-oriented models recognize the
same DMUs as efficient. However, scores assigned to the inefficient units are not
the same in the two projection modes (Lovell and Rouse, 2003).
3.4.1 Different specifications of DEA
Since the publication of the CCR model, DEA techniques have emerged as the most
favoured methodology for efficiency analysis. Several alternative DEA models have
been formulated and presented by various researchers to overcome problems and
weaknesses of the initial DEA specification6. Charnes et al. (1997) identified four
such DEA models and pointed out that those models address managerial and
economic issues and provide useful information on the DMU. Subsequently, Bowlin
(1998) highlighted seven DEA models. These supplementary DEA models
attempted to address issues such as economics of scale, super efficiency, and
statistical noise in the data. Table 3.1 summarises some basic DEA models that have
been used in empirical studies of banking and the financial services sector. 6 See appendix 1 for various applications of DEA in the financial services sector
Output
Input
0
A,B,C, D & E = DMUs F’ =Production frontier
F’
D C
B
A
E E’
E
Input Oriented
Output Oriented
Additive
Projection paths for “DMU E”
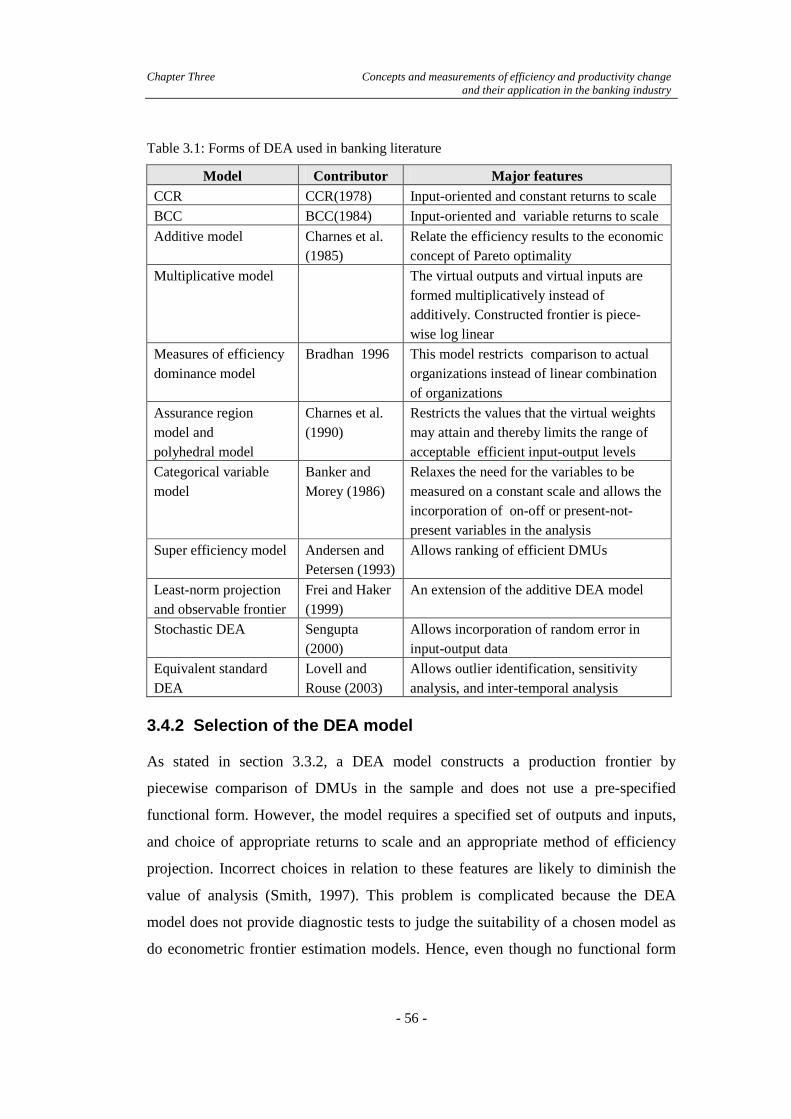
Chapter Three Concepts and measurements of efficiency and productivity change and their application in the banking industry
- 56 -
Table 3.1: Forms of DEA used in banking literature
Model Contributor Major features CCR CCR(1978) Input-oriented and constant returns to scale
BCC BCC(1984) Input-oriented and variable returns to scale
Additive model Charnes et al. (1985)
Relate the efficiency results to the economic concept of Pareto optimality
Multiplicative model The virtual outputs and virtual inputs are formed multiplicatively instead of additively. Constructed frontier is piece-wise log linear
Measures of efficiency dominance model
Bradhan 1996 This model restricts comparison to actual organizations instead of linear combination of organizations
Assurance region model and polyhedral model
Charnes et al. (1990)
Restricts the values that the virtual weights may attain and thereby limits the range of acceptable efficient input-output levels
Categorical variable model
Banker and Morey (1986)
Relaxes the need for the variables to be measured on a constant scale and allows the incorporation of on-off or present-not-present variables in the analysis
Super efficiency model Andersen and Petersen (1993)
Allows ranking of efficient DMUs
Least-norm projection and observable frontier
Frei and Haker (1999)
An extension of the additive DEA model
Stochastic DEA
Sengupta (2000)
Allows incorporation of random error in input-output data
Equivalent standard DEA
Lovell and Rouse (2003)
Allows outlier identification, sensitivity analysis, and inter-temporal analysis
3.4.2 Selection of the DEA model
As stated in section 3.3.2, a DEA model constructs a production frontier by
piecewise comparison of DMUs in the sample and does not use a pre-specified
functional form. However, the model requires a specified set of outputs and inputs,
and choice of appropriate returns to scale and an appropriate method of efficiency
projection. Incorrect choices in relation to these features are likely to diminish the
value of analysis (Smith, 1997). This problem is complicated because the DEA
model does not provide diagnostic tests to judge the suitability of a chosen model as
do econometric frontier estimation models. Hence, even though no functional form

Chapter Three Concepts and measurements of efficiency and productivity change and their application in the banking industry
- 57 -
is specified in DEA, model specification must be a central concern. Smith (1997)
used Monto-Carlo simulations to examine the impact of model miss-specification on
the estimated efficiency scores using DEA. Omissions of a significant variable,
inclusion of an irrelevant variable, inappropriate choice of returns to scale
assumptions and sample size are probable areas of miss-specification in DEA.
Smith’s study produced the following implications on model miss-specification.
• The complexity of the production process may diminish the success with
which DEA can indicate true efficiency. If the model is simple and DEA
representation well specified, DEA provides accurate estimates of true
efficiency;
• In a simple production process, an omission of a relevant variable may have
a significant effect on the estimated efficiency;
• Inclusion of inappropriate variables may have a modest influence on the
estimate;
• Variable returns to scale may be used on the grounds that it offers
conservative estimates of achievable productivity improvements. However,
incorrect choice of the RTS setting may lead to an incorrect estimation of
productivity improvements;
• The distortion from true productivity is reduced with increasing sample size.
Different DEA models address different issues of productivity. These models have
attempted to overcome the limitations of initial DEA models. Mainly CCR and BCC
models have been applied for estimating efficiency of financial institutions. Most
analysts have measured technical efficiency based on input-oriented DEA models.
Few studies have used output-oriented models. Since the regulatory environment
restricts the flexibility of managerial decision making, the majority of banking
productivity studies have applied input-oriented models. Furthermore, the maturity
of the industry has affected the selection of orientation methods. Industries in a
mature production stage seek to maximize production using standardised production
technologies which focus on input minimisation (Golany and Storbeck, 1999).
Hence, output-oriented models are more appropriate for measuring the efficiency in

Chapter Three Concepts and measurements of efficiency and productivity change and their application in the banking industry
- 58 -
such industries. Contrarily, industries in a growth stage seek to minimize the input
usage. Hence, efficiency studies in banking industries considered to be in growth
stage are mainly based on the input-orientation (Golany and Storbeck, 1999).
Selection of returns to scale setting is another critical issue in DEA-based studies.
Berg et al. (1993) emphasised that VRS is the most appropriate assumption since the
scale classification in banking is a classical issue. They proposed that the efficiency
scores given by the VRS (BCC) model are more robust to mis-specifications. On the
other hand, CRS allows comparison of large banks with much smaller banks. Thus,
CRS (CCR) avoids the over-estimation of efficiency of small DMUs in the target
sample. However, simultaneous use of CCR and BCC DEA-models allows analysts
to decompose technical efficiency into scale and pure-technical efficiency. Hence,
the majority of studies on financial institutions have used both CCR and BCC
models. The use of both approaches permits analysts to decompose the efficiency
estimation into overall technical efficiency, pure-technical efficiency and scale
efficiency.
Homogeneity of DMUs is one of the assumptions behind DEA. This assumption
does not hold for various reasons. Lack of homogeneity among the firms (size,
forms of organization) in the industry and the geographical locations of firms have
influenced the model specification. The homogeneity assumption does not hold
when there are outliers in the sample. The outliers may significantly over-state or
under-state the estimated efficiency scores. In many empirical studies, the outliers
have been removed from the study sample to avoid possible distortions in estimated
efficiency scores.
Another problem related to the homogeneity assumption arises when the sample is
composed of DMUs from different environmental backgrounds. This could be
addressed by stratification of the study sample according to the homogeneous
features of DMUs. Thereafter, separate production frontiers could be constructed for
each cluster to estimate the efficiency (Alam, 2001; Brown, 2001; Drake and Hall,
2003). Unless stratification is done to alleviate heterogeneity in financial

Chapter Three Concepts and measurements of efficiency and productivity change and their application in the banking industry
- 59 -
intermediaries, issues outside managers’ control may result in incorrect conclusions
on the overall efficiency of an industry as well as individual units within the industry
(Brown, 2001). Brown illustrated the way of using stratification of DMUs based on
the common features for constructing production frontiers for each cluster
separately. The sample of 326 Australian credit unions in Brown’s study was
stratified into four sub-groups according to size, region, assets mix and survived or
merger. Brown’s result revealed that the efficiency estimation may be distorted if the
heterogeneous features are not recognized. As an alternative way of addressing
heterogeneity, a categorical variable approach can also be used. Categorical
variables can be introduced to DEA models as inputs or outputs to recognize the
various features inherent to DMUs which may influence the estimated efficiency
(Banker and Morey, 1986). This strategy is mainly used in cross-country
comparisons of efficiency.
3.4.3 MPI, scale efficiency and technological chang e
MPI originally developed by Caves, Christensen and Diewert (1982), has been used
in previous studies to decompose various components of estimated productivity
improvements and efficiency7. A variant of MPI has been used to decompose scale
efficiency from technical efficiency. In DEA-based efficiency studies, efficiency
losses from scale and managerial decisions have been identified using the MPI
(Coelli, Rao and Battese, 1998). Scale efficiency is measured using BCC-DEA and
CCR-DEA models. The estimated efficiency using the CCR-DEA model is
identified as technical efficiency. Similarly, the estimated efficiency using BCC-
DEA is identified as pure-technical efficiency (Cooper, Seiford and Kaoru, 2000).
DMUs with estimated efficiency scores of ‘1’ for both CCR-DEA and BCC-DEA
models are considered as fully efficient (Banker et al., 2004). If there is a difference
in the CRS and VRS estimated efficiency for a particular firm, it is not regarded as a
fully efficient DMU (Coelli, Rao and Battese, 1998). The difference between CCR
and BCC estimated efficiencies is regarded as scale inefficiency. It can be
decomposed by dividing the technical efficiency estimated by CCR by the estimated
7 Section 4.3.2 describes MPI and its application in productivity improvements.

Chapter Three Concepts and measurements of efficiency and productivity change and their application in the banking industry
- 60 -
efficiency using BCC. However, the estimated scale efficiency may distort the real
scale efficiency when the sizes of DMUs under consideration are significantly
different (Dyson et al., 2001).
3.4.4 Restriction on number of inputs and outputs
According to the DEA techniques, the number of inputs and outputs is always
restricted by the number of DMUs in the sample. The ability of DEA to discriminate
between efficient DMUs and inefficient DMUs depends on the number of inputs and
outputs which are incorporated in the DEA model. Hence, the product of the number
of inputs and the number of outputs should not exceed the number of DMUs in the
sample (Cooper, Seiford and Kaoru, 2000). As a rule of thumb, Dyson et al. (2001)
proposed that the product of the total number of inputs and outputs should be no
more than fifty percent of the number of units under investigation to achieve a
reasonable level of discrimination. On the other hand, limiting the number of
variables may also understate the relative efficiency estimations.
Cinca, Molinero and Garcia (2002) investigated sensitivity of the estimated
efficiency to various approaches of input-output specifications and pointed out that
two institutions in a given industry may achieve the same efficiency but under
different management strategies. These differences are reflected in different weight
structures for inputs and outputs. They estimated the efficiency of Spanish savings
banks by employing a variety of input-output mixtures. The estimated efficiency
scores were derived by using principal component (PC) analysis. They found that
the way deposits are treated in the model specification is a vital factor in deciding
efficiency scores. Following Avkiran (2000), Cinca, Molinero and Garcia (2002)
suggested that the efficiency of DMUs should be estimated using alternative
specification methods and should rely on the average estimated efficiency.
There are two ways of using a panel data set to construct the production frontier to
overcome the small sample size problem: window analysis and construction of a
common frontier for all observations (Cooper, Seiford and Kaoru, 2000; Yue, 1992).
However, construction of a common frontier using all available data over several
Chapter Three Concepts and measurements of efficiency and productivity change and their application in the banking industry
- 61 -
time periods may reduce the comparability of estimated efficiency changes. DEA
window analysis is simply based on the concept of moving averages. Each DMU in
different periods is treated as a different unit in the productivity assessment. When
there are ‘n’ number of DMUs with a window of ‘m’ periods, then the production
frontier can constructed using ‘n*m’ DMUs (Cooper, Seiford and Kaoru, 2000).
However, there are no pre-specified criteria for selecting an appropriate width for
the window size. Too small a window may reduce the explanatory power of the
estimated production frontier. On the other hand, a window of a relatively longer
period may distort the information about efficiency changes. However, window
analysis may be a useful alternative to overcome the problem of small sample size.
3.5 Input and Output Specification
Input and output specification is another issue which is still to be resolved in DEA
studies in the banking industry. There are two main issues to be addressed when
recognizing inputs and outputs for the productivity analysis. Firstly, inputs and
outputs need to be defined. Secondly, suitable measurements of inputs and outputs
need to be used. This section summarises literature on the issues related to banking
inputs and outputs.
3.5.1 Issue 1: Definition of inputs and outputs
A fundamental problem in relation to input and output specification arises due to
different treatment of deposits. A significant portion of the loan and investment
portfolio of a bank is sourced from deposits. On the other hand, commercial banks
offer deposit products with various features such as integrated deposit accounts,
checking accounts, and accounts linked to loan plans to enhance the banks’
competitive positions (Leong and Dollery, 2002). Mester (1987) highlighted two
approaches (production and intermediation) which are mainly used in banking
literature. Leong and Dollery (2002) identified the production, intermediation and
assets approaches as three approaches for recognising banking output. However,
Favero and Papi (1995) had previously identified five approaches for input-output
specification in the banking industry: the production, intermediation and assets

Chapter Three Concepts and measurements of efficiency and productivity change and their application in the banking industry
- 62 -
approaches, which are directly linked to operational functions of banks, plus the user
cost and value-added approaches, which are not directly linked to the operational
functions of banks. These two approaches mainly consider the nature and
significance of banking activities. In practice, researchers have selected different
variables even though they have used identical approaches.
Sealey and Lindley (1977) first attempted to develop a positive theory for the
behaviour of financial institutions. They highlighted two different views, namely,
the technical view and the economic view of financial institutions. They pointed out
that the transformation process for a financial firm involves borrowing of funds from
savers (surplus spending units) and lending those funds to borrowers (deficit
spending units), i.e., financial intermediation. Therefore, outputs of authorised
depository institutions (ADI) in a technical sense are a set of financial services to
depositors and borrowers. Accordingly, ADI provide three categories of services,
namely, administration of the payments mechanism for demand deposit customers,
intermediation services to depositor and borrowers, and other services such as trust
department activities and portfolio advisory services.
As explained by Sealey and Lindley (1977), both borrowers and depositors have
received some utility from the banking services. Hence, they suggested the value
addition to each input and output should be considered when defining the firm’s
products in an economic sense. Based on the theory of the firm, they emphasised
that the firms must consider the output of economic production to be priced higher
when compared with input prices. Further, market prices should be used to value
products. Hence, some services which are considered as outputs in financial
institutions in technical sense do not have market prices, they can not be considered
as output in the economic sense.
The production approach treats banks as producers of services which use labour and
capital to generate deposits and loans (Avkiran, 2000). Under this framework,
deposits are included among the outputs because they are viewed as part of the
banking services offered (Golany and Storbeck, 1999). Commercial banks provide

Chapter Three Concepts and measurements of efficiency and productivity change and their application in the banking industry
- 63 -
intermediary services in the financial system, and thus satisfy the expectations of
both borrowers (deficit holders) as well as savers (surplus holders). The success of a
bank depends on its ability to serve both parties. Banks use loan products to satisfy
borrowers and deposit products to satisfy savers. Hence, the production approach
considers services provided to both parties as outputs.
Contrary to the production approach, the intermediation approach regards deposits
as an input, which is used for producing the other banking outputs. It is based on the
assumption that the main role of banks is to arrange a meeting place for the savers
and borrowers to make financial transactions. Banks collect deposits from savers and
use these savings to produce loans and other products such as investments. Favero
and Papi (1995) indicated that the intermediation approach is most appropriate for
banks where most activities consist of turning large deposits and funds purchased
from other financial institutions into loans and financial investments.
Elyasiani and Mehdian (1990b) stressed that the production approach can be applied
only when functional cost analysis data are available. Since the data on the number
of deposits and loan accounts are available only as a part of the functional cost
analysis, the ability to use the production approach appears to be limited. Contrarily,
the intermediation approach allows the use of the value of the input and output
variables. Elyasiani and Mehdian (1990b) highlighted the following advantages of
the intermediation approach over the production approach:
• The intermediation approach is more inclusive of total banking costs. These
expenses constitute a substantial portion of banks’ total costs and their
exclusion may distort the empirical results.
• Since the deposits are used for making loans and investments with other
inputs, they should be considered as inputs.
• By using the currency value of the input output data, the intermediation
approach reduces the potential quality problems of input-output data.

Chapter Three Concepts and measurements of efficiency and productivity change and their application in the banking industry
- 64 -
The assets approach is similar to the intermediation approach (Camanho and Dyson,
2004). Outputs are strictly defined by assets and mainly by the production of loans.
This approach recognises labour, capital, deposits and other liabilities as inputs. The
user cost approach considers the net contribution of the banking revenue when
determining input and output. The opportunity cost of each asset and liability item is
compared with the financial cost and return. If the opportunity cost of a liability is
greater than the financial cost, the item is recognized as an output; otherwise it
should be considered as an input. Similarly, if the opportunity cost of an asset is
greater than the financial return, it should be recognised as an input; otherwise it
should be considered as an output. Under the value-added approach, items in the
balance sheet with a substantial share of value-added are considered as the outputs.
This approach considers both deposits and loans as outputs of banks.
Berger and Mester (1997) introduced a variation to the value-added approach called
the profit approach for recognising input and output variables to measure the profit
efficiency. According to them, profit efficiency allows measurement of how close a
bank is to producing its maximum possible profit given a particular level of input
prices and output prices. Thus, the standard profit function specifies all revenues as
output variables and all expenses (mainly variable costs) as input variables. That is,
the profit dependent variable allows for consideration of revenues that can be earned
by varying outputs as well as inputs.
As stated above, there is no general agreement about the components of banking
inputs and outputs. Many studies have applied either the intermediation or the
production approaches. Some studies have sought alternative ways of defining
inputs and outputs. A summary of input and output variables used in previous
studies is presented in Tables 3.2 and 3.3. Nevertheless, the differences in input and
output definition have reduced the generalisability of findings from efficiency
studies in the financial services sector.

Chapter Three Concepts and measurements of efficiency and productivity change and their application in the banking industry
- 65 -
Table 3.2: Input variables used in previous banking productivity studies8 Type Input
Bank specific Branch size
Number of Computer terminals
Number of banks
Number of computers /Office
space/Teller hours
Borrowed funds Borrowed money Purchased funds
Capital Capital/Equity Financial capital/Net profits
Deposits Call deposits
Demand deposits
Deposits
Funds from customers
Retail and wholesale deposits
Savings deposits
Short term deposits
Small denomination time and savings
Deposits
Time and savings deposits
Non interest
expenses
Operating expenses
Depreciation cost
Establishment expenses
General and administrative
Non interest expenses
Non-establishment expenses
Non-personnel expenses
Other expenses
Total cost
Interest expenses Interest expenditure Interest spread
Fixed assets Fixed assets /Net fixed assets
Net physical capital
Net worth
Physical capital
Labour Clerical staff
Labour (average salary)
Labour (number / hours)
Managerial personnel
No. of staff
Number of tellers
Personnel cost
Problem loans Credit loss cost
Loan loss provisions
Problem loans
Others Banking funds
Net funds from other banks
Economic status of the area
Income from non-banking sources
Investments
Loanable funds
Market size
Environmental variables
8 See Appendix 2 for references

Chapter Three Concepts and measurements of efficiency and productivity change and their application in the banking industry
- 66 -
Table 3.3: Output variables used in previous banking productivity studies9 Type Output Variables
Bank specific Number of business accounts
Number of branches
Number of employees
Service hours
Service variety
Interest spread
Transaction volume
Capital Net worth
Deposits Total deposits (value/number)
New accounts (time savings,
certificates of deposits)
Core deposits
Customer deposits
Deposit withdrawals
Commercial accounts
Current accounts (value/number)
Deposit not at call
Time and saving deposits
Transaction deposits
Investments Earning assets
Investment/Investment
securities/Bonds/Other
Liquid assets
Other productive assets
Securities
Loans and
advances
Loans and advances/Net loan
Number of loans
Long-term loan/Short-term loan
Commercial and industry loans
Personal loans/Housing loans
Real estate loans
Non-housing loans
Inter bank loans
Loans to other banks
Small loans/Other loans
No. credit applications
Non-traditional
activity
Non-traditional activity
Risk adjusted off-balance sheet
activities
Risk-weighted assets
Travellers’ cheques
Revenue Income (banking and non-banking)
Interest income (gross/net/average)
Non-interest income (gross/net)
Operating income/Other earnings
Revenues/Net profits
Net commission income/Fee-based
income/Foreign currency
income/Investment income/Real
estate income
Other Annual average increase in total assets
Bills discounted
Borrowing
Interbank assets/ liabilities
9 See Appendix 2 for references
Chapter Three Concepts and measurements of efficiency and productivity change and their application in the banking industry
- 67 -
3.5.2 Issue 2: Measurement of inputs and outputs
The second major problem related to the input and output specification arises when
selecting a suitable method of measurement. There are three main measurement
approaches for banking outputs and inputs that could be used in productivity
analysis. They are flow measures (the number of transactions processed on deposits
and loan accounts), stock measures based on money value (the real or constant
monetary values of funds in the deposit and loan accounts), and stock measures
based on the number of deposit and loan accounts serviced (Humphrey, 1991). The
majority of productivity studies on banks have applied stock measures based on
monetary values due to the more ready availability of the required information.
However, the use of monetary value-based stock measures may distort estimated
efficiency. For instance, Drake and Hall (2003) signalled that the use of personnel
expenses rather than employee numbers could result in some bias against those
banks that hire quality workers at a higher cost. Some banks hire high calibre
banking professionals and pay relatively higher salaries. Since a high personnel cost
could be a result of employing high quality labour, analysts have to be mindful of
the objective of the research as there is a possibility to bias results.
3.5.3 Issue 3: Non-traditional activities
In the past, efficiency and productivity studies on banks have only considered the
traditional services of financial institutions included in the balance sheet. Changes in
market competition and the advancement of technology have provided more
opportunities for banks to transform their traditional banking products to non-
traditional products. Banks’ responses to changing financial systems are reflected
not only in their balance sheets but also in their off-balance sheet activities. Off-
balance sheet activities permit banks to diversify their product range in order to
maintain their degree of competition, to expand their customer bases and to improve
the significance of fee income in total revenue (Tortosa-Ausina, 2003). Thus, in
addition to traditional banking products, banks offer a range of products and services
from collection of utility bills to more sophisticated investment and insurance.
Berger and Mester (1997) considered those off-balance sheet items as an effective

Chapter Three Concepts and measurements of efficiency and productivity change and their application in the banking industry
- 68 -
substitute for directly-issued loans which incur information gathering cost of
origination and ongoing monitoring and control. They stressed that if off-balance
sheet items are ignored from the efficiency estimation, a scale bias may result.
However, contemporary studies have paid little attention to incorporation of the off-
balance sheet activities as an output in efficiency estimation models. Rogers (1998)
indicated the ability to use non-interest income to proxy for non-traditional products.
Tortosa-Ausina (2003) examined the impact of non-traditional activities to banks’
efficiency using two different models based on two different specifications of
output. She found supportive evidence that non-traditional activities have an
influence on bank efficiency.
3.5.4 Issue 4: Quality aspects
The usefulness of productivity measurements can be improved by incorporating
quality aspects into the analysis. Quality in this context is defined as the non-
operational aspects which may have an influence on efficiency. Various researchers
have attempted to incorporate the various quality issues such as market structure,
government intervention in the industry, size of the banks, and problem loans into
efficiency studies. When direct measurements are available, these quality aspects
can be included as inputs. Categorical variables model may be used represent
quality issues (Banker and Morey, 1986).
Further, DEA modelling allows analysts to select inputs and outputs objectively.
Some researchers have used this capability to advantage by developing DEA models
which may uncover different aspects of management. Chen (2002) used alternative
input and output specifications to identify the operational, financial and marketing
efficiency of Taiwan’s commercial banks. Denizer, Dinç and Tarimcilar (2000) used
a two-stage procedure for estimating productive efficiency to overcome the input-
output specification problem. They highlighted that the estimated efficiency by the
two approaches provided different information about the firms’ efficiency. As
explained by them, the production approach signalled the managers’ ability to use

Chapter Three Concepts and measurements of efficiency and productivity change and their application in the banking industry
- 69 -
the available resources effectively. The intermediation approach provided
information about the overall efficiency.
3.5.5 Implications of input-output specification
The specification of inputs and outputs in productivity analysis may have a
significant influence on the estimated efficiency. However, there is no general
agreement with regard to specification of banking inputs and outputs. Discussion in
the previous studies has provided the following implications, which may be useful
for future research in banking and financial services:
1. The production and the intermediation approaches are the methods which are
most widely used.
2. The production approach is more appropriate when evaluating productive
performance among the branches of the same bank.
3. The input and output specification may directly affect the outcome of the
analysis.
4. It is useful to apply more than one input and output specification before
making an inference from the results.
5. The difficulty of collecting accurate data restricts the use of some approaches
such as user cost and value added.
6. Traditional input and output specification has ignored the quality aspects.
7. Analysts can select input and output combinations to represent their
expectation in efficiency evaluations.
3.6 Application of DEA in the Banking Industry
Since 1978, DEA has been extensively used for measuring efficiency and
productivity gains in the service sector industries. Tavares (2002) found 3,203
publications (including 1,259 journal articles and 50 books) related to DEA during
the period 1978-2001. This shows the popularity of DEA as a method of estimating
efficiency of DMUs. The ability to use DEA for measuring efficiency and
productivity gains in service-oriented organizations without defining input and

Chapter Three Concepts and measurements of efficiency and productivity change and their application in the banking industry
- 70 -
output prices encourages the use of DEA in such studies on the banking industry.
This section makes an analytical evaluation of DEA applications on the banking
industry10.
Berger, Hunter and Timme (1993)11, and Berger and Humphrey (1997)12 presented
two literature surveys on the application of frontier based efficiency and productivity
studies in the financial services sector. An interesting observation of these literature
reviews is that only a few studies have addressed efficiency and productivity issues
in developing countries. Previous studies have mainly focused on evaluating
efficiency and productivity gains in the developed world. Thus, efficiency and
productivity in the financial services sector in developing countries have been given
a very low priority by researchers. However, with globalization of financial services
sector activities, it is important to understand the operational performance of the
financial services sector in developing countries as well as the developed countries.
The purpose of this section is to investigate the existing efficiency and productivity
gains-related studies in the financial services sector which primarily used DEA to
estimate efficiency and productivity gains. Previous literature can be divided into
two broad streams: research based on methodological issues and research based on
empirical issues. Research based on methodological issues has tested the further
development of DEA as a tool of estimating productive efficiency in the banking
industry. These researchers have focused on development of a statistical basis for
making inferences from efficiency scores estimated by DEA and alternative models
which overcome the deterministic nature of the traditional DEA methodology.
Research on empirical issues has mainly addressed government policy, managerial
decision making, market structure and competition.
10 See appendix 3.1 for various applications of DEA in banking industry. 11 Berger, Hunter and Timme (1993) found six main areas of financial services sector
productivity covered by studies, namely, scale and scope efficiency in banking, X-efficiency in banking, the efficiency implications of bank mergers, the efficiency of thrifts and governmental financial institutions, the efficiency of the insurance industry, and the determinants of financial institutions efficiency.
12 Berger and Humphrey (1997) identified three clusters of empirical studies in financial services sectors, namely on the aim of the studies: (1) informing government policy, (2) address research issue and (3) improve managerial performance.

Chapter Three Concepts and measurements of efficiency and productivity change and their application in the banking industry
- 71 -
3.6.1 Methodological issues
Research on methodological issues has covered empirical investigation of the
theoretical soundness of DEA for estimating efficiency and productivity gains.
These studies have examined alternative ways which can be used to overcome the
inherent weakness of the traditional DEA model. Issues include:
• comparability of DEA-based estimates of efficiency and productivity gains
with the estimated efficiency and productivity indexes using alternative
frontier methods and traditional productivity measurements methods (see
Barr and Siems, 1998; Bauer et al., 1998; Coelli and Perelman, 1999; Huang
and Wang, 2002; Kumbhakar and Heshmati, 1999; Leong and Dollery, 2002;
Premachandra, 2001; Resti, 1997);
• sensitivity of the DEA-estimated efficiency and productivity indexes to the
changes in various specification issues (such as input-output, sample size and
categorical variables) (see Cinca, Molinero and Garcia, 2002; Tortosa-
Ausina et al., 2003);
• ranking of efficient DMUs (see Bauer et al., 1998; Fethi, Jackson and
Weyman-Jones, 2002; Lovell and Rouse, 2003); and
• alternative ways for finding statistical evidence for DEA-estimated efficiency
indexes (see Alam, 2001).
The following section discusses methodological issues addressed in the previous
studies and their implications.
3.6.1.1 Comparability of estimated efficiency and p roductivity indexes with alternative methods
The existence of alternative methods together with traditional rating-based
performance evaluation methods raises an important question about the most reliable
efficiency and productivity estimation approach. Since different productivity
estimation approaches are based on different sets of assumptions, the estimated
efficiency from different approaches may not be the same. Bauer et al. (1998)
examined the properties of different frontier analysis methods based on six

Chapter Three Concepts and measurements of efficiency and productivity change and their application in the banking industry
- 72 -
consistency conditions13. These consistency conditions indicated the minimum
requirements for simultaneous use for efficiency rankings derived from various
frontier methods in order to be useful in a policy analysis. Different researchers have
applied these consistency conditions in various contexts to examine the
comparability of productivity indexes estimated using varying approaches.
Bauer et al. (1998) found that main frontier productivity assessment methods
(parametric and non-parametric) tend to yield the same distribution of efficiency.
Roughly, all methods identified the same banks in the best practice group and in the
worst practice group. Compared to the other methods, DEA reported low estimated
efficiency. Overall, this study found that all parametric approaches provide
efficiency and productivity estimations that are consistent with one another, while
DEA does not. Another study in Taiwan (Huang and Wang, 2002,) where four of the
Bauer et al. consistency conditions were applied to find the consistency of estimated
efficiency based on three frontier methods (DEA, SFA and DFA), found different
evidence from Bauer et al.. Huang and Wang’s evidence indicated a similar
distribution pattern in estimated efficiency with all three methods. However, results
indicate different rankings of DMUs when using parametric and non-parametric
methods. Estimated efficiency with parametric methods showed less variation across
the periods and indicated closer correlation with traditional measures than with the
non-parametric methods.
Leong, Dollery and Coelli (2002) used these consistency conditions to examine the
observable differences in estimated efficiency indexes using different model
specification with DEA productivity estimations. They reached a similar conclusion
to Bauer at al. (1998) about the distribution of estimated efficiency indexes.
However, different DEA models showed an inconsistent trend throughout the study
period. Resti (1997) found that the efficiency and productivity estimations did not
13 Bauer at al. (2002) identified six consistency conditions [(1) consistent distribution, (2) ranking
consistency, (3) identification of best and worst practice firms, (4) consistency of the estimated efficiency over time, (5) consistency with market conditions, and (6) consistency with standard non-frontier performance measures] with which the efficiency estimates derived from the various approaches should comply.

Chapter Three Concepts and measurements of efficiency and productivity change and their application in the banking industry
- 73 -
differ dramatically when using the same data and conceptual framework. However,
results derived using allocative DEA (ADEA) and SFA (based on a translog flexible
form) provided dissimilar explanations about the scale of the large banks. Even
though the SFA results provided evidence of increasing returns to scale for large
banks, the estimated result on BCC-DEA and CCR-DEA indicated that most large
banks had decreasing returns to scale. Even though efficiency scores estimated using
the two approaches reported a high correlation, their distributions were not similar.
Weill (2004) applied a similar approach to find the comparability of estimated
efficiency using SFA, DFA and DEA using data from five European countries. Weill
found that the different frontier approaches do not give comparable efficiency
indexes.
The longitudinal efficiency analysis approach used by Barr et al. (1999) found
strong and consistent relationships between estimated efficiency indexes using DEA
and traditional methods. This study suggested that the estimated DEA scores have a
positive relationship with variables such as non-interest income to average assets,
interest income to average assets, earning assets to average assets, and return on
assets. It also indicated negative relationships with bank size, salary expenses to
average assets, other non-interest expenses to average assets, interest expenses to
average assets, fixed assets to average assets, non-performing loans to average assets
and loans to average assets. A similar approach was applied by Leong and Dollery
(2002) to examine the productive efficiency of Singaporean banks.
As stated above, the empirical studies provide dissimilar evidence about different
efficiency and productivity evaluation methods, even if the same data set is used.
Based on the above discussion, the following implications can be identified:
1. Different methods provide different efficiency estimation even though the
same data set is used because of differences in assumptions that have been
used for each method. DEA ignores the potential for random error when
estimating efficiency. On the other hand, SFA or econometric approaches are
based on pre-specified functional forms and allow for random error. VRS

Chapter Three Concepts and measurements of efficiency and productivity change and their application in the banking industry
- 74 -
and CRS models suggest the shape of the frontier. These assumptions are
reflected in the differences in estimated efficiency.
2. Even though individual efficiency estimations are not similar in many cases,
the average efficiency estimation with different approaches is often similar.
However, distributions of efficiency estimates from different approaches are
not similar.
3. Relative to SFA, DEA provides a lower estimation of efficiencies. DEA is
affected by the assumption of random error.
4. There are no clear guidelines to identify the most appropriate methods for
any particular study.
3.6.1.2 Sensitivity of DEA-estimated efficiency ind exes DEA is based on different assumptions, model specifications and selection of inputs
and outputs. As stated above, the number of variables included as inputs and outputs
in DEA analysis is constrained by the number of DMUs in the sample. Because of
this limitation, some important variables which may have a significant effect on the
estimation of efficiency may be excluded from the basic DEA model. Some studies
have tested whether the omitted variables have a significant influence over the
estimated efficiency indexes (Cinca, Molinero and Garcia, 2002; Tortosa-Ausina et
al., 2003). Cinca, Molinero and Garcia found that the estimated efficiency using
DEA may be inaccurate if there are any errors in variable definition and model
specification.
The wrong choice of basic DEA models such as CRS and VRS, as well as the wrong
choice of input and output variables, give incorrect assessment of efficiency.
Tortosa-Ausina (2002b) examined how the different specification of inputs and
outputs can influence the estimated efficiency. That study found the shape of the
distribution of estimated efficiency varies greatly according to the output definition.
In general, these studies indicated that issues such as the model specification and the
input and output definition may have a great influence over estimated efficiency.

Chapter Three Concepts and measurements of efficiency and productivity change and their application in the banking industry
- 75 -
3.6.1.3 Finding the best ranking method One main task of evaluating efficiency is to identify the most efficient production
units in a given industry. DEA assigns equal scores (100% efficient) for all firms on
the estimated production frontier. Thus, all DMUs located on the production frontier
are given equal ranking in terms of performance. Since these DMUs may not
operationally have the same strength, ranking them equally may mislead the users of
these indexes. Therefore, ranking the DMUs which are considered to be equally
efficient is an unsolved problem associated with traditional DEA models (such as
CCR, BCC and Additive).
To overcome this problem, some studies have applied super-efficiency DEA models
(Fethi, Jackson and Weyman-Jones, 2002; Lovell and Rouse, 2003). These models
allow estimating the super-efficiency scores for the DMUs which are considered to
be equally efficient by conventional DEA models. Super-efficiency scores can be
used for ranking of efficient DMUs into extremely efficient and non-extremely
efficient DMUs, observing the sensitivity of efficiency classifications, identifying
outliers, overcoming the truncation problem, and calculating and decomposing a
MPI. However, these super-efficiency models have not been tested to a great extent
in the financial services sector. One such study has been done by Fethi, Jackson and
Weyman-Jones (2002) using data from the Turkish banking industry. This study
indicated a wide variation of estimated efficiency using traditional DEA models and
the stochastic DEA model.
3.6.1.4 Statistical inference from estimated effici ency The lack of statistical evidence for the significance of estimated efficiency is one of
the main criticisms of the DEA. The majority of empirical studies have used
descriptive statistics to make inferences from estimated efficiency. However, these
explanations have been inadequate to get clear evidence of the reliability of
estimated efficiency. Therefore, some researchers have attempted to explore
alternative ways of making statistical inferences from estimated efficiency. To
overcome this disadvantage, some studies have employed statistical methods such as
the central limit theory (CLT), and non-parametric bootstrapping (Alam, 2001). CLT

Chapter Three Concepts and measurements of efficiency and productivity change and their application in the banking industry
- 76 -
assumes that the distribution of time means (averaging over firms at a point in time)
become asymptotically normal in a sample with a large number of firms. The
appropriate confidence intervals can be found using the student ‘t’ distribution.
However they indicate that the CLT can not be applied when the sample is not large.
3.6.2 Sources of inefficiency
A bank may improve efficiency and productivity gains through three main sources,
namely, pure-technical, scale and technological change. Due to the inadequacy of
available price information for inputs and outputs in the banking industry, few
studies have investigated inefficiency resulting from non-optimum allocation of
resources. Scale and pure-technical inefficiency are estimated using BCC and CCR
DEA models. Technical change is estimated from the frontier shift in two
consecutive periods. The sources of inefficiencies are observed by MPI-like indexes.
Identification of sources of inefficiency helps DMUs in two ways. Firstly, they are
informed of the reasons for the inefficiency. Secondly, they are helped to formulate
strategies for enhancing DMUs’ efficiency and productivity gains.
Empirical studies have given mixed signals on sources of efficiency gains. Yue
(1992) found that the main source of inefficiency in the largest 60 commercial banks
in Missouri is technical inefficiency. The contribution of scale diseconomies is
relatively low. Drake (2001) investigated the efficiency of 10 UK banks during
1984-1995. That study found increasing returns to scale in small banks and
decreasing returns to scale in large banks. Consequently, Drake suggested that the
banking industry in the UK suffers from scale diseconomies particularly for the
smallest and the largest banks (i.e., except medium sized banks).
Darrat, Topaz and Yousef (2002) found that allocative (regulatory) and technical
inefficiency (managerial) have affected the efficiency of Kuwait banks. Over the
period 1990-1993, the productivity growth in US rural banks was attributed to
technological change rather than the pure-technical change or scale change
(Devaney and Weber, 2000). Elyasiani and Mehdian (1990a) found that during the
period 1980-1985, US banks enjoyed a positive technical change. Drake and Hall

Chapter Three Concepts and measurements of efficiency and productivity change and their application in the banking industry
- 77 -
(2003) investigated technical and scale efficiency in Japanese banks using a cross-
section of data to find evidence for efficiency of potential bank mergers. The result
signalled that the Japanese banks exhibited considerable overall inefficiency with a
sample mean for overall efficiency of 72.36%. Drake and Hall found that the main
reason for productive inefficiency is pure-technical inefficiency, and the exclusion
of problem loans from productivity analysis may overestimate the potential
economies of scale. In another study in Turkey, which aimed to find the
improvement in efficiency and productivity gains from deregulation, the main
source of productivity gain was found to be catching up with the best practice banks
rather than technical progress (Isik and Hassan, 2003a). This result further suggested
that the domestic banks suffer from diseconomies of scale.
In contemporary frontier-analysis studies, many researchers have focused on the
short-run production frontiers. Prior (2003) attempted to construct long-term and
short-term cost frontiers using non-parametric methods to find the capacity
efficiency in Spanish savings banks. Prior separated inputs into variable and fixed
inputs, with the short-run frontier constructed by considering variable inputs and the
long-run frontier constructed using both fixed and variable inputs. The difference
between estimated efficiencies using long-run and short-run cost frontiers is
identified as capacity efficiency. The study revealed that a significant portion of
inefficiency in Spanish commercial banks arose due to capacity underutilization.
One main objective of these studies was to find an appropriate scale of operation for
banking institutions. However, the results are somewhat complicated. Many studies
suggested that either large banks or small banks were not able to gain the benefit of
economies of scale of operations. The problem of optimum scales for banking
operations is yet to be resolved.
3.6.3 Policy issues
A large number of previous studies have examined how commercial banks have
reacted to various policy issues introduced by policy makers. The financial services
sector is the backbone of an economy. Since the behaviour of the financial services
Chapter Three Concepts and measurements of efficiency and productivity change and their application in the banking industry
- 78 -
sector directly influences the performance of overall economic activities, policy
makers generally attempt to introduce more productive policies. The outcomes of
implemented policies must be evaluated to identify probable policy changes. Hence,
this area is popular in efficiency and productivity studies. Previous research on
policy issues can be classified into six areas: (1) deregulation, (2) economic crises,
(3) the effect of mergers and acquisitions, (4) ownership structures of banks and
their influence, (5) management performance and (6) market structures. This section
describes research related to these policy issues.
3.6.3.1 Deregulation of the financial industry The main aim of deregulation of the financial services industry is to provide
opportunities for technological advancement to improve service quality and to
enhance competition by reducing government intervention. Improvements in
resources allocation is a primary goal of financial deregulation that can be achieved
only on enhancement in efficiency and productivity gains (Humphrey, 1991). Many
studies of efficiency and productivity gains in the banking industry have been
focused on the success of policy changes related to deregulation. Deregulation
studies have mainly focused on the following issues in relation to efficiency and
productivity gains:
• Productivity improvements after deregulation
• Entry of new firms and productivity
• Entry of foreign banks
• State-owned banks and privately-owned banks
• Mergers and acquisitions.
Although the primary goal of deregulation and liberalisation has been to improve
bank efficiency and productivity gains, empirical studies have provided mixed
results. Most studies have found that the short-term effects of deregulation on
efficiency and productivity gains are negative. Some studies have indicated that the
benefits of liberalisation and deregulation can be expected only in the long run.
Furthermore, outcomes of liberalisation in different countries are not similar.

Chapter Three Concepts and measurements of efficiency and productivity change and their application in the banking industry
- 79 -
Elyasiani and Mehdian (1990a) reported a 12.98% non-neutral and labour-biased
rate of technological change during the deregulation period in the USA. In another
study, they found that the productivity gap between small banks and large banks has
widened during the post-deregulation period (after 1979). Their results showed
relatively low average estimated efficiency for small banks with both pooled and
separate production frontiers. However, the small banks were able to report
technological progress over the period 1979 to 1986. These results suggested that
small banks in the USA were adversely affected by the relaxation of some favorable
regulatory restrictions to small banks, such as the branching restriction and interest
rate ceilings. Alam (2001) examined differences in productivity improvements in
various states in the USA during the post-deregulation period and found that the
outcomes of regulatory changes lag for a few periods.
New banks in Portugal reported relatively higher efficiency scores than the old
banks, indicating 59% overall efficiency improvements in the banking industry after
deregulation (Canhoto and Dermine, 2003). Canhoto and Dermine stressed that a
rapid deregulation process with a well-staffed banking system may lead to positive
efficiency gains from deregulation.
A study in Austria reported a decline in estimated efficiency immediately after
deregulation (1990-1996) and later an increase in estimated efficiency (1996-1997)
(Ali and Gstach, 2000). Conversely, Denizer, Dinç and Tarimcilar (2000) found
relatively stable productivity growth during the period before deregulation and a
negative productivity growth after deregulation. The estimated scale inefficiency
scores indicated the Turkish banking system suffered from 5% to 25% efficiency
loss in production processes and 7% to 36% in intermediation due to the scale
problem. A similar fluctuation pattern in the estimated efficiency of all banks during
the study period (1970-1994) signalled that banks were responding to economic
changes in a similar pattern.
Deregulation may cause a bank to improve its management practices (technical
efficiency), to change the scale of operations (scale efficiency) and to improve

Chapter Three Concepts and measurements of efficiency and productivity change and their application in the banking industry
- 80 -
service quality by introducing new technologies (technological change). Further
investigation of the productivity improvements due to deregulation of the banking
industry in Turkey revealed that these changes have resulted from better
management practices rather than improved scale (Isik, 2003). Furthermore, that
study signalled that the inefficient banks may imitate efficient banks to catch up with
best practice. Isik and Hassan (2003b) revealed that the impact of deregulation on
different banking groups was not uniform. Even though all banks reported
significant improvements in productivity after deregulation, their technology may
not have advanced as expected. Diseconomies of scale are one main factor which
has affected estimated efficiency and productivity gains.
The literature related to deregulation shows different results with regard to
improvement in efficiency and productivity gains from deregulation. The research
investigating productivity improvements has provided the following implications:
1. The relationship between productivity improvements and deregulation is not
clear.
2. The productivity improvements from deregulation depend on the prevailing
environment in the banking industry. The economic, social and political
environments directly influence the way the deregulation benefits are realised.
Countries with well-staffed banking systems reported positive efficiency gains
from deregulation.
3. In most countries, the deregulation process has taken a relatively long period
and the expected gains could not be realised immediately after deregulation.
According to some research, rapid deregulation facilitates more positive
efficiency improvements.
4. The benefits of deregulation can be realised in the long run.
3.6.3.2 Economic crises
In the early 1990s, after enjoying economic booms, many Asian countries suffered
economic recessions which influenced all economic activities in the affected
countries. Fukuyama (1995) investigated how the Japanese banking industry was

Chapter Three Concepts and measurements of efficiency and productivity change and their application in the banking industry
- 81 -
affected by the economic downturn and by the intensified competitive pressures
among the different forms of banks14. The research indicated that the recession had
mixed results among different forms of banks, but that technical efficiency was
stable over the next three years. The average values of the three productivity change
indexes in the first time period (1989-90) (before the collapse) were greater than
those in the second period (1990-91). The results indicated that the collapse had
reduced the efficiency of all banks in the second period except for one former sogo
(mutual) bank15. However, two-period productivity indexes indicated technological
advance but not technical efficiency progress. Further, these results indicated an
inverse relationship between bank size (revenue) with both the technological change
indexes and the MPI.
3.6.3.3 Mergers, acquisitions and organisational st ructural changes The optimum scale of banking operations is a controversial issue which has been
debated among practitioners as well as researchers during the past few decades.
With liberalisation of the financial services industry, smaller firms were not able to
survive the intense competitive pressure from large banking institutions. On the
other hand, larger banks were not able to utilize their excess resources optimally. To
protect smaller financial institutions, policy makers in some countries have
encouraged mergers and acquisitions and changes to the forms of business. In
Australia, smaller credit unions were encouraged to merge. Similarly, in the UK,
credit unions were forced to convert to limited liability companies. With these
changes, policy makers expected to enhance the efficiency and productivity gains of
the financial services industry.
Avkiran (1999) used DEA-based efficiency scores to examine the public benefits of
mergers using data from 25 Australian commercial banks. The efficiency gains were
examined by measuring overall operating efficiency, employee productivity, profit
performance and the industry mean relative efficiency scores. Outcomes of bank
mergers have been reviewed by comparing the pre-merger and post-merger 14 As stated by Fukuyama (1995), the banking industry in Japan consists of five forms of
banks: city banks, regional banks, sogo banks, trust banks and long-term credit banks. 15 Sogo banks is a regional banking system which operated in Japan before 1989.
Chapter Three Concepts and measurements of efficiency and productivity change and their application in the banking industry
- 82 -
estimated efficiency. The results indicated that the role of the merger in efficiency
gains is not necessarily positive. It depends on the acquiring firm’s ability to
maintain pre-merger efficiency levels. In contrast, Worthington (2001) found that
there were efficiency improvements for the merged credit unions in Australia during
1993-1997 relative to those that did not merge. Using an unbalanced panel data set
and Tobit model, Worthington (2001) investigated factors that influenced post-
merger efficiency in co-operative deposit-taking institutions in Australia. The study
found that credit unions with a higher proportion of real estate and commercial
loans, a higher level of non-interest income, and a higher expenditure on information
technology have high technical efficiency. Further, regression results indicate that
credit union mergers have positively influenced technical efficiency.
Batchelor and Gerrard (2002) found that takeovers have effected productivity
improvements through technological advancement in local banks in Singapore.
Ralston, Wright and Garden (2001) revealed that technical and scale efficiency
benefits were gained by both acquirers and targets in some credit union mergers in
Australia, but almost an equal number of mergers reported efficiency decreases post-
merger. However, the study was not able to find where an acquirer’s superior
efficiency was transfered to a target. Fried, Lovell and Yaisawarng (1999)
investigated merger benefits for credit union members, both acquired and acquiring,
and features of successful and unsuccessful mergers using a large sample of US
credit unions which were subject to merger during 1998-1995. The study suggested
that there was no deterioration in service provision in the acquiring credit unions
after merger. The acquired credit union members often received some benefit during
the first three years. However, some credit unions showed poorer performance after
the merger.
In another study, Kohers, Huang and Kohers (2000) used two hypotheses (the
relative efficiency hypothesis and the low efficiency hypothesis16) to investigate the
16 The relative efficiency hypothesis suggests that, after acquiring a poorly managed bank, an
efficient bidder can make value enhancing changes. The low efficiency hypothesis suggests that the lower the frontier efficiency level of either or both the bidder and the target, the greater the potential for value enhancement.
Chapter Three Concepts and measurements of efficiency and productivity change and their application in the banking industry
- 83 -
relationship between the potential performance gain from mergers and the stock
market returns. The study employed both SFA and DEA to estimate the relative
efficiency. The study found that the two-day cumulative abnormal returns in the
stock market after the merger announcement had a significant negative relationship
with the estimated efficiency both in the target and bidder banks, thus confirming the
low efficiency hypothesis.
Drake and Simper (2003) investigated the influence of the conversion of UK mutual
credit unions into public limited companies (PLC) on productive efficiency. Credit
unions and PLCs operate under different management and ownership styles. The
prime objective of co-operative credit unions is to improve the welfare of the
members. In contrast, PLCs aim to maximize profits to enhance the wealth of the
shareholders. Hence, the conversion made a drastic change in the activities and
policies of the previous credit unions. Before the conversion, credit unions’
operations concentrated on the mortgage market, especially residential finance. They
were expected to earn a return for entrepreneurship. On the other hand, PLCs rely on
equity financing, and must earn a return for shareholders. Drake and Simper (2003)
used DEA to estimate the efficiency gain from the conversion. The estimated
efficiencies showed that the conversion had a temporary positive effect on the firms’
efficiencies.
Studies on the mergers and acquisitions of financial institutions have provided
contradictory evidence from different countries for efficiency and productivity gains.
Previous studies have indicated that getting larger will not always have a positive
influence on efficiency and productivity gains. Some studies have suggested mergers
of financial institutions may have affected positive improvements to productivity
(Batchelor and Gerrard, 2002; Crystal, Dages and Goldberg, 2002; Fried, Lovell and
Yaisawarng, 1999) and some have not (Avkiran, 1999). There are no adequate
studies on which to base a general conclusion about the relationship between
organizational changes and banks’ productivity.

Chapter Three Concepts and measurements of efficiency and productivity change and their application in the banking industry
- 84 -
3.6.3.4 Ownership forms and their influence Previous studies have predicted that ownership forms or organizational forms which
produce stronger incentives to control inputs and boost output may lead to more
efficient and productive operations. These studies also have presumed that the
quality of management of state-owned banks generally is not good when compared
with that of the privately-owned and foreign banks. Lack of continuity, seniority-
based promotion, politically-motivated employment and recruitment, low salaries
and politically-influenced operational decisions have decreased productivity in state-
owned banks (Denizer, Dinç and Tarimcilar, 2000). The profit motivation of the
privately-owned and foreign banks leads to more productive use of banking assets
than the state-owned banks. Contrary to the case in state-owned banks, these banks
give precedence to performance when making human resource management and
operational decisions.
The less bureaucratic management system in privately-owned banks allows more
flexible operational environments. However, in many countries, a few large state-
owned banks have controlled a significant portion of banking activities, and
governments in less developed countries mainly take assistance from state-owned
banks to fund huge budget deficits (Denizer, Dinç and Tarimcilar, 2000).
Governments have given the priority to state-owned banks to serve as bankers to
government institutions. Further, regulatory control may not be favourable for the
expansion of privately-owned banks. These factors may affect a level playing field
for the banking firms. Financial liberalisation in many countries has removed some
of the previous impediments to equal opportunities for all banks.
When compared to the other institutions, foreign banks have less autonomy to offer
banking activities freely in a host country. However, entry of foreign banks allows
local banks to identify and easily implement new banking services and technologies
which leading foreign commercial banks are using (Isik and Hassan, 2003a). The
foreign banks may increase the capital and services provided and strengthen the
technology which the local banks use.

Chapter Three Concepts and measurements of efficiency and productivity change and their application in the banking industry
- 85 -
Based on these arguments, some previous studies have investigated the influences of
foreign and state banks on efficiency in local banks. These studies predicted that
public-sector banks may have relatively lower efficiency and foreign banks may
have relatively higher efficiency than their counterparties. Isik and Hassan (2003)
found financial deregulation in Turkey has reduced the performance gap between
public-sector banks and private-sector banks. In another study in Turkey, Denizer,
Dinç and Tarimcilar (2000) found that the relative efficiency of private-sector banks
is higher than that of the state and foreign banks. However, foreign banks
outperformed the state banks. Furthermore, the study indicated that the foreign
banks operated at a relatively better scale when compared to the local banks by
confirming their ability to utilise banking resources with more productive
operational technologies.
Noulas (2001) found that, although the private banks appear to be more efficient
than the state banks in Greece, the efficiency gap between them is not significant.
The study indicated that the private-sector banks are better in controlling non-
interest expenses. However, another study in the Hellenic banking industry provided
somewhat different evidence (Noulas, 1997). That study found that the state banks
recoded productivity gains through technological progress. Noulas also found that
the private-sector banks in Hellenic recoded productivity gains through increased
efficiency. Pal, Mukherjee and Nath (2000) found that private-sector banks, as well
as foreign banks, performed better than state banks by estimating operational
efficiency of 68 major Indian commercial banks with an output-oriented DEA
model. On the other hand, Sathye (2000) found that private-sector banks are less
efficient than state banks. Further, his study found that reform has affected
efficiency gains in Indian banks.
The influence of foreign banks on efficiency is best illustrated by studies in
European Economic Community (EC) countries. After the establishment of a
common monetary union, the banks have had an opportunity to extend their services
to other EC countries. Hence, some studies have investigated how the common
financial market has affected efficiency. In general, these studies have found the

Chapter Three Concepts and measurements of efficiency and productivity change and their application in the banking industry
- 86 -
opening-up of the European financial system intensified competition in the banking
industry. The intense competition has encouraged banking firms to improve their
services drastically to compete with the more efficient banks in the region (Hasan,
Lozano-Vivas and Pastor, 2000). The main differences in these studies are that the
DEA models incorporate country-specific variables, such as demography, regulation
and environmental conditions. Hasan, Lozano-Vivas and Pastor17 found that the
commercial banks in Spain, Denmark, and Portugal are relatively more efficient than
those in other EC countries. However, this study found the specific benefits which
the major international banks enjoyed were outweighed by the home country
benefits which the local banks experienced.
3.6.3.5 Management performance Managerial decisions directly affect the efficiency of DMUs. Policy makers are
particularly interested in identifying how managers make decisions to cope with
future uncertainty. Generally, policy makers use CAMEL (capital adequacy, assets
quality, management quality, earnings ability and liquidity of banks) ratings which
mainly rely on traditional accounting measures for evaluating banks. However,
traditional accounting measures are not able to provide accurate information about
the quality of management which is vital for predicting the future of a bank. Barr,
Seiford and Siems (1994) indicated that since managers make decisions which affect
overall performance, DEA-based efficiency estimation can be used for determining
managers’ performance.
One main advantage of using DEA for analysing efficiency and productivity gains is
its flexibility in selection of input and output combinations. In some efficiency and
productivity studies, different input and output specifications have been applied as
proxies for various forms of managerial efficiency. In one such study,
Athanassopoulos, Soteriou and Zanios (1997) used three different input and output
combinations to estimate efficiency of three different managerial activities, namely
transaction, production and intermediation. In another study, efficiency has been
estimated based on three different perspectives: operating, marketing and financial
17 This study used data from 612 commercial banks in 10 EC countries.

Chapter Three Concepts and measurements of efficiency and productivity change and their application in the banking industry
- 87 -
(profitability) aspects in Taiwanese commercial banks (Chen, 2002). Estimated
efficiency was regressed with variables which represented ownership and size. That
study indicated that the state banks enjoyed relatively high marketing and financial
efficiency, but less operational efficiency when compared to the private-sector
banks. It also revealed that large-scale banks operated at higher financial and
marketing efficiency but lower operational efficiency.
3.6.3.6 Market structure Market structure and concentration are considered to be another research cluster
focused on government policy. Market power explanations indicate a positive
relationship between market concentration and profitability. The efficient structure
paradigm indicates that efficient firms compete more aggressively in the market and
gain dominant market shares and also have high profits because of their low cost of
production. One of the main arguments for mergers and acquisitions is the potential
productivity improvements. The empirical studies in this paradigm have investigated
whether there are any productivity improvements resulting from the mergers and
acquisitions in the banking industry. Berger and Humphrey (1997) pointed out that
existence of a high degree of local market overlap between merging institutions
(which allows greater potential for eliminating duplicated expenditure on bank
operations) and the greater existing efficiency level of the acquiring firm are two
plausible pre-conditions which may affect the expected benefit from mergers.
3.7 Synthesise
This chapter has provided a brief review of the theoretical and empirical literature on
efficiency and productivity studies, with special reference to the banking industry
and DEA-based studies. Several important issues needing further attention are
identified and outlined below.
The empirical studies have mixed evidence on the outcomes of financial
liberalisation. While some countries have enjoyed positive outcomes, some other
countries have not been able to maintain previous gains which they had before

Chapter Three Concepts and measurements of efficiency and productivity change and their application in the banking industry
- 88 -
liberalisation. Therefore, it is difficult to derive a conclusion about the outcome of
financial liberalisation in a particular country based on studies made in other
countries. The majority of those studies have focused mainly the influence of
deregulation on efficiency and productivity change. Few studies have investigated
that how the deregulation have effected to change the market structure and their on
to the improvements in efficiency and productivity gains. Changes in market
structures and competition may have a direct impact on efficiency and productivity
gains. Thus, this study aims to investigate how the structural changes resulted on
financial reforms influenced to the efficiency and productivity change and overall
operational performance in DMUs.
Only a few studies have investigated the ability of firm-specific factors to explain
the changes in banks’ efficiency and productivity. Moreover, the explanatory power
of macroeconomic factors has been taken into consideration only in cross-country
studies. Together with firm-specific factors, changes in macroeconomic factors may
have a significant influence on efficiency and productivity gains. On the other hand,
liberalisation measures may directly or indirectly affect the macroeconomic
environment of the country. Therefore, it is worthwhile to investigate these factors
and their influence on the banking industry. Overall, this survey has highlighted that
the financial services sectors in developing countries have not been adequately
researched. In-depth analysis of these markets is essential to formulate the required
policies. The findings in other countries are probably irrelevant to a particular
country. Not only are differences in the social, political and economic environments
important but the geographical environment may also have a significant influence
over efficiency and productivity gains. Therefore, it is essential to do a country-
specific analysis.
The literature discussed in this chapter provides an insight about the contemporary research
in efficiency and productivity gains in the banking industries. The next two chapters will use
these literatures to form an analytical framework for analysis of efficiency and productivity
gains and to identify factors affecting the banks’ technical efficiency.

Chapter Four An analysis of efficiency and productivity changes of the banking industry in Sri Lanka
- 89 -
CHAPTER FOUR
AN ANALYSIS OF EFFICIENCY AND PRODUCTIVITY
CHANGES OF THE BANKING INDUSTRY IN SRI
LANKA
4.1 Introduction
This chapter investigates efficiency and productivity improvements of the Sri
Lankan banking industry during the post liberalisation era. Discussion in this chapter
is based on Proposition I, set out in section 1.5 which assumes that “financial reforms
have improved the efficiency and productivity gains of the banking industry in Sri Lanka”.
The previous chapter presented models of efficiency and productivity measurements
used in the literature. This chapter extends those models to analyse the efficiency
and productivity changes of the Sri Lankan banking industry. The chapter comprises
eight sections. The next section elaborates on Proposition I. The third section
introduces and justifies methodologies adopted in estimating efficiency and
productivity changes. The fourth section introduces input and output specifications
used for measuring efficiency and productivity changes. The fifth section explains
the composition of the sample data. The sixth section presents results, discussion and
implications of efficiency analysis. The penultimate section presents discussion and
implications of assessment of productivity improvements. The final section presents
conclusions on the analysis of efficiency and productivity changes in banks in Sri
Lanka.

Chapter Four An analysis of efficiency and productivity changes of the banking industry in Sri Lanka
- 90 -
4.2 The Study Proposition
Chapter Two highlighted that the financial services sector in Sri Lanka has
undergone a series of regulatory reforms during the period 1977-2004. The reforms
aimed at reducing government intervention in the market by allowing greater
participation by the private sector. The ‘political view’1 shows that government
intervention in the banking industry is driven by the determination of politicians to
control investment (La-Porta, Lopez-de-Silanes and Shleifer, 2002). Such
intervention may lead to underutilisation of the capacity of the financial services.
Relaxation of regulatory provisions, which gave distinct advantages to the
government-owned institutions in an industry, allowed all institutions to perform in a
similar regulatory and operational environment. This may result in greater
competition and lead to improved efficiency and productivity gains of the industry.
It is proposed that financial deregulation in Sri Lanka may have led to improved
efficiency and productivity of the banking industry in the country. The next section
presents the analytical framework used for addressing the proposition.
4.3 Method of Estimating Banks’ Efficiency and Prod uctivity Changes
This study adopts DEA, a non-parametric frontier approach, in order to evaluate the
efficiency of banks in Sri Lanka and incorporates an analytical framework similar to
those applied by other researchers (Barr et al., 1999; Denizer, Dinç and Tarimcilar,
2000; 1996; Drake, 2001; Elyasiani and Mehdian, 1990). The size of the Sri Lankan
banking sector is comparatively small. As such, the sample does not allow
application of parametric frontier approaches, as those approaches need a relatively
large sample to make unbiased predictions. In contrast, the mathematical
programming approach used in DEA allows the construction of a production frontier
using a relatively small sample. It also provides researchers with more freedom to
select appropriate model specifications to suit the objective of the analysis. The
DEA process has the capacity to incorporate multi-inputs and multi-outputs in its
assessment, and allows the progressive assembling of production frontiers without 1 See Chapter Two section 2.2.2 (page 13).

Chapter Four An analysis of efficiency and productivity changes of the banking industry in Sri Lanka
- 91 -
using a pre-specified functional form. For these reasons, this study adopts DEA
methodology.
Either input-oriented or output-oriented DEA models can be used to estimate
efficiency. Input-oriented models measure cost efficiency (input efficiency) aimed at
cost minimisation. Similarly, output-oriented models measure profit efficiency
(output efficiency) based on revenue maximisation. Output-oriented DEA
estimations are preferred when measuring efficiency in a mature industry, and input-
oriented models are more appropriate for infant industries. Input-oriented DEA
models are useful to understand how an industry has improved its efficiency while
optimising the usage of inputs in the production process. Accordingly, the input-
oriented approach identifies the input waste (or excess capacity) in the production
process. On the other hand, the output-orientation estimates the efficiency—
assuming that the inputs are fixed. As such, output-oriented estimations are not
appropriate for assessing efficiency in an industry that is evolving.
Financial reforms, as well as development in information and communication
technologies, have effectively expanded operational activities of the banking
industry during the last two decades. Further, banks tend to introduce more cost
effective innovative products to challenge competition from new institutions
entering the financial services sector. Hence, this study adopts input-oriented models
following previous research (Barr et al., 1999; Denizer, Dinç and Tarimcilar, 2000;
Dietsch and Lozano-Vivas, 2000; Drake, 2001; Elyasiani and Mehdian, 1990).
4.3.1 DEA model formulation
Several mathematical programming DEA models have been represented in the
literature. However, the basic DEA model is based on a productivity ratio index
which is measured by the ratio of weighted outputs to weighted inputs. DEA
extrapolates Ferrell’s (1957) single-output to single-input technical measure to a
multiple-output to multiple-input technical measure. This model assumed that jth
DMU uses a ‘m’ dimensional input vector, xij (i = 1,2,…m) to produce a ‘k’

Chapter Four An analysis of efficiency and productivity changes of the banking industry in Sri Lanka
- 92 -
dimensional output vector, yrj (r = 1,2,…,k). The DMU under evaluation is denoted
by ‘0’.
∑
∑
=
==m
iijr
k
rrjr
xv
yuw
10
10
0 Equation 4.1
where w0 is the relative efficiency, x and y are the input and output vectors
respectively, and ur and vi are the weights of output r and input i. The above ratio
accommodates multiple inputs and outputs in efficiency estimation and measures the
relative efficiency based on input and output weights. However, a unique set of
weights for all DMUs may be difficult to identify, because different DMUs have
different input and output combinations (Charnes, Cooper and Rhodes, 1978)
(CCR). CCR proposed the use of a set of weights that accommodates those
differences. They suggested that each DMU should assign weights that allow it to be
shown more favourably, compared with all other DMUs under comparison. Thus,
the respective weights for each DMU should be derived using the actual observed
data instead of fixing in advance (Cooper, Seiford and Kaoru, 2000). CCR
introduced the following fractional programming problem to obtain values for input
weights and output weights.
Basic CCR formulation
∑
∑=
iijr
rrjr
xv
yuwMax
0
0
0 Equation 4.2
Subject to
mikrvu
njeachforxv
yu
ir
ijr
rir
...,,1...,,10,
...,,1,1
==≥
=≤∑∑
[Source: Cooper, Seiford & Kaoru (2000)]
where w0 is the relative efficiency, x and y are the input and output vectors
respectively, ur and vi are the weights of output r, and input i, n, m and k denote the

Chapter Four An analysis of efficiency and productivity changes of the banking industry in Sri Lanka
- 93 -
number of DMUs, inputs and outputs respectively. The above fractional
programming problem is based on the objective to estimate the optimum input and
output weights for each DMU under evaluation. It measures the relative efficiency
of DMU0 based on the performance of the other banks in the industry. For that, the
weighted input and output ratio is maximised subject to given constraints. The first
constraint of the model limits the estimated efficiency of the DMUs to one. The
second constraint in the above model indicates that all variables, including input and
output weights, are non-negative. Estimated input and output weights are used to
find the efficiency index ‘w’. The fractional programming problem can be
transformed into a linear programming model (CCR), as illustrated in equation 4.3.
Basic CCR formulation (Multiplier form)
∑=r
rjor yuwMax 0
Subject to
miforv
krforu
njforxvyu
xv
i
r
riji
rrjr
rijoi
,...2,10
,...2,10
,...2,10
1
=≥=≥
=≤−
=
∑∑
∑
Equation 4.3
[Source: Cooper, Seiford & Kaoru (2000)]
The above linear programming problem aims to maximise the sum of weighted
outputs of DMU0 subject to virtual inputs of DMU0 while maintaining the condition
that the virtual outputs cannot be exceeded by virtual inputs of any DMUs. Both the
fractional programming problem and the linear programming problem have the same
objective function. CCR-inefficient firms are given an efficiency ratio W0 < 1.
Efficiency indices of efficient firms are equal to ‘1’. Furthermore, there is at least
one efficient unit that is used as the referencing unit for estimating relative weights
for the inefficient units. Both linear programming problems outlined above can be
used to directly estimate ‘θ ’.
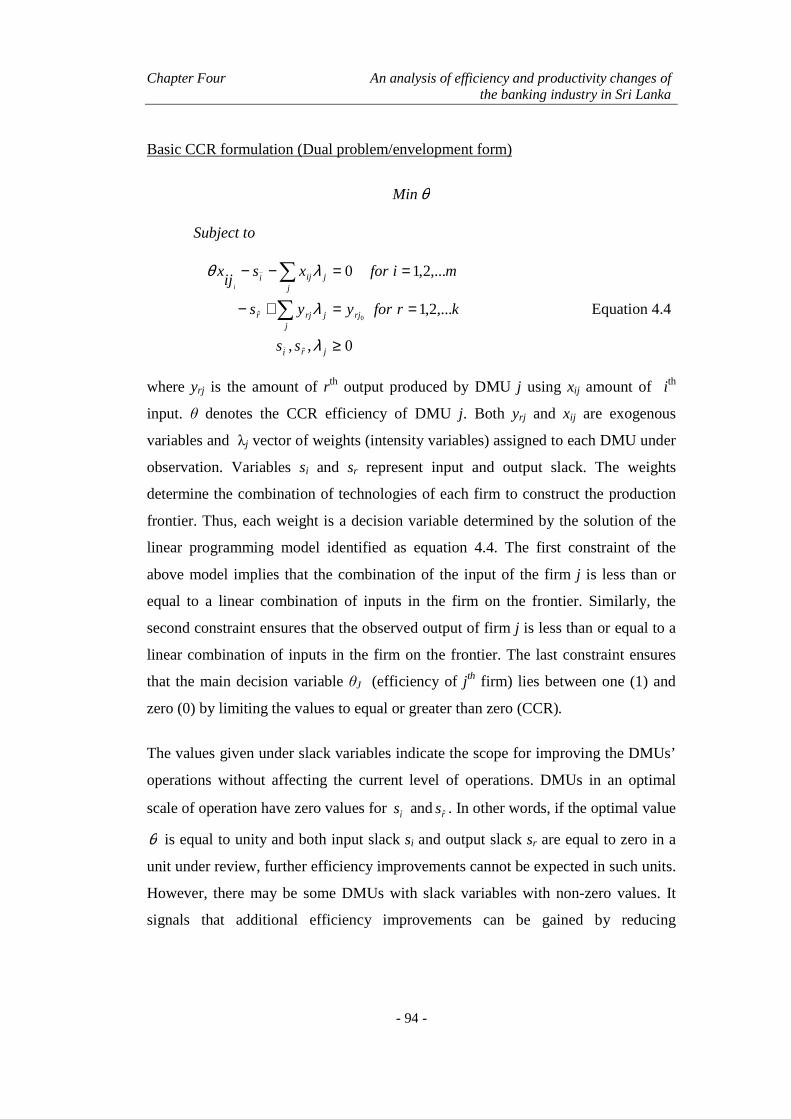
Chapter Four An analysis of efficiency and productivity changes of the banking industry in Sri Lanka
- 94 -
Basic CCR formulation (Dual problem/envelopment form)
θMin
Subject to
0,,
,...2,1
,...2,10
ˆ
ˆ 0
≥
==+−
==−−
∑
∑
jri
rjj
jrjr
jjiji
ss
krforyys
miforxsij
xi
λ
λ
λθ
Equation 4.4
where yrj is the amount of r th output produced by DMU j using xij amount of ith
input. θ denotes the CCR efficiency of DMU j. Both yrj and xij are exogenous
variables and λj vector of weights (intensity variables) assigned to each DMU under
observation. Variables si and sr represent input and output slack. The weights
determine the combination of technologies of each firm to construct the production
frontier. Thus, each weight is a decision variable determined by the solution of the
linear programming model identified as equation 4.4. The first constraint of the
above model implies that the combination of the input of the firm j is less than or
equal to a linear combination of inputs in the firm on the frontier. Similarly, the
second constraint ensures that the observed output of firm j is less than or equal to a
linear combination of inputs in the firm on the frontier. The last constraint ensures
that the main decision variable θJ (efficiency of jth firm) lies between one (1) and
zero (0) by limiting the values to equal or greater than zero (CCR).
The values given under slack variables indicate the scope for improving the DMUs’
operations without affecting the current level of operations. DMUs in an optimal
scale of operation have zero values for is and rsˆ . In other words, if the optimal value
θ is equal to unity and both input slack si and output slack sr are equal to zero in a
unit under review, further efficiency improvements cannot be expected in such units.
However, there may be some DMUs with slack variables with non-zero values. It
signals that additional efficiency improvements can be gained by reducing
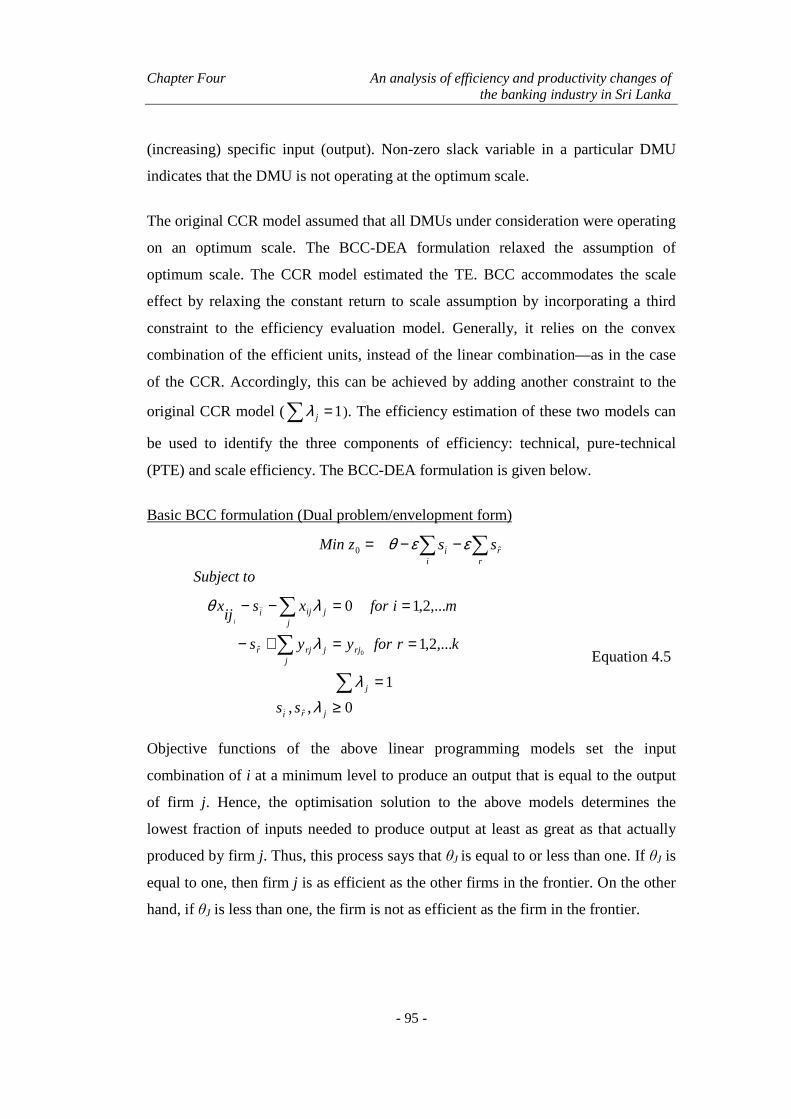
Chapter Four An analysis of efficiency and productivity changes of the banking industry in Sri Lanka
- 95 -
(increasing) specific input (output). Non-zero slack variable in a particular DMU
indicates that the DMU is not operating at the optimum scale.
The original CCR model assumed that all DMUs under consideration were operating
on an optimum scale. The BCC-DEA formulation relaxed the assumption of
optimum scale. The CCR model estimated the TE. BCC accommodates the scale
effect by relaxing the constant return to scale assumption by incorporating a third
constraint to the efficiency evaluation model. Generally, it relies on the convex
combination of the efficient units, instead of the linear combination—as in the case
of the CCR. Accordingly, this can be achieved by adding another constraint to the
original CCR model (∑ =1jλ ). The efficiency estimation of these two models can
be used to identify the three components of efficiency: technical, pure-technical
(PTE) and scale efficiency. The BCC-DEA formulation is given below.
Basic BCC formulation (Dual problem/envelopment form)
∑∑ −−=r
ri
i sszMin ˆ0 εεθ
Subject to
0,,
1
,...2,1
,...2,10
ˆ
ˆ 0
≥
=
==+−
==−−
∑
∑
∑
jri
j
rjj
jrjr
jjiji
ss
krforyys
miforxsij
xi
λλ
λ
λθ
Equation 4.5
Objective functions of the above linear programming models set the input
combination of i at a minimum level to produce an output that is equal to the output
of firm j. Hence, the optimisation solution to the above models determines the
lowest fraction of inputs needed to produce output at least as great as that actually
produced by firm j. Thus, this process says that θJ is equal to or less than one. If θJ is
equal to one, then firm j is as efficient as the other firms in the frontier. On the other
hand, if θJ is less than one, the firm is not as efficient as the firm in the frontier.

Chapter Four An analysis of efficiency and productivity changes of the banking industry in Sri Lanka
- 96 -
CCR and BCC formulations are applied to estimate the TE and PTE respectively.
Previous studies have employed an MPI-like index to decompose scale effect on a
DMU’s inefficiency. A firm’s TE is a function of PTE and the SE. Therefore, PTE
should be separated from the TE to identify SE (Coelli, Rao and Battese, 1998).
TECCR = PTEBCC × SE Equation 4.6
SE = TECCR ÷ PTEBCC Equation 4.7
where
TECCR = Technical efficiency
PTEBCC = Pure technical efficiency
SE = Scale efficiency
This study estimates the SE for each DMU based on the estimated efficiency in the
BCC and CCR models. This analysis has helped to identify the effectiveness of
existing scales of operation.
The study used a 16-year panel data set compiled from banks in Sri Lanka. During
this period, financial and regulatory environments of the country have gradually
changed. Thus, constructing a separate frontier for each year is more appropriate for
estimating the efficiency of banks. However, the number of banks in Sri Lanka does
not provide an adequate number of observations to construct a production frontier
with reasonable discriminatory power. DEA techniques’ power of discriminating
inefficient units from efficient units depends on the number of units under
observation, and the number of inputs and outputs in the model. Prior studies have
employed two approaches for improving the discriminatory power of small samples,
namely:
1. Pooled data: A common production frontier is constructed for the whole
sample using pooled data. Each DMU in the whole sample period is
considered as a separate DMU.
2. Window analysis (Asmild et al., 2004; Avkiran, 2000; Charnes et al., 1985;
Fu and Heffernan, 2005): The number of production frontiers is constructed

Chapter Four An analysis of efficiency and productivity changes of the banking industry in Sri Lanka
- 97 -
using pooled data of a pre-determined window period based on the principle
of moving averages (Charnes et al., 1994). Each DMU within a window
period is considered as a separate DMU.
There are two advantages of using pooled data to construct the production frontier.
The first allows comparison between the performances of a DMU in a particular
period with its own performance in other periods. The second enhances the
discriminatory power of DEA models by increasing the number of data points in the
analysis. It should be noted that there are no pre-specified criteria for determining
the length of a window period. However, many previous studies have used a
three-year window period as an appropriate window size. Once a window size is
defined the observation of that window is viewed in an inter-temporal manner
(Asmild et al., 2004). All observations related to a window period are treated as
separate DMUs in efficiency analysis with their original form ignored. However,
these approaches disregard technological changes that may take place within two
consecutive periods. Hence, the estimated efficiency scores may potentially be
distorted. These distortions may be severe in estimated efficiency on common
frontiers constructed using whole sample data. Therefore, this study uses the second
approach (constructing production frontiers based on three-year windows) for
constructing the production frontier.
In this study, descriptive statistics, window analysis and longitudinal graphical
analysis are used to investigate the influence of deregulation on the banking sector in
Sri Lanka. Further, descriptive statistics for each cluster of banks (which are defined
in section 4.5 of this chapter) are calculated and compared. The significance of the
identified differences in efficiency of the different forms of banks are tested using
the Mann-Whitney Test statistics (Sprent, 1990). The Mann-Whitney test, also
known as the Wilcoxon rank sum test, is a non-parametric test used to test the
difference between the medians of two independent groups. This test is a non-
parametric equivalent of the two sample ‘t test’. In most applications, this test is
called the Mann-Whitney U-test, but alternative names are sometimes used. Since
the theoretical distribution of estimated efficiency scores using DEA is not known,

Chapter Four An analysis of efficiency and productivity changes of the banking industry in Sri Lanka
- 98 -
this study uses the Mann-Whitney test to examine whether the distribution of
estimated efficiency in two banking segments is similar. The relevant test statistics
are estimated using SPSS version 11.5.
4.3.2 Malmquist total productivity index (MPI)
MPI has been widely used in previous research to measure productivity
improvements in the banking industry after government policy changes (Berg,
Forsund and Jansen, 1992; Casu and Girardone, 2005; Grifell-Tatje and Lovell,
1996; Isik and Hassan, 2003; Sturm and Williams, 2004). Two alternative
methods—base period method and adjacent period method—have been used to
estimate MPI. The adjacent period method estimates productivity change in two
consecutive periods and estimates productivity changes on a yearly basis, while the
base period method estimates productivity changes using a pre-specified base
period. Thus, the adjacent period method is more suitable for studies based on
unbalanced panel data. Hence, this study applies the adjacent period MPI to
investigate productivity improvements.
The MPI uses a distance function2 approach to measure productivity improvements.
Caves, Christensen and Diewert (1982) first introduced the idea of using a distance
function approach to analyse changes in productivity based on a general production
function. DEA-based MPI was first introduced by Fare et al. (1994) in a study of
productivity improvements in Swedish hospitals using the conceptual basis provided
by Ferrell (1957) and Caves, Christensen and Diewert (1982). Following Fare et al.
(1994), the input-oriented MPI was expressed using input distance functions with
respect to two periods as follows. The equation represents the productivity change of
a production unit over the time span of ‘t’ and ‘t+1’.
( ) ( )( )
( )( )
2/1
111
111
11 ,
,*
,
,,,,
= +
+++
++++
tttci
tttci
tttci
tttci
ttttixyD
xyD
xyD
xyDyxyxM Equation 4.8
2 The input (/output) distance function addresses the impact of the minimum proportional
reduction (/increase) of the input(/output) mixture for a given output (/input) mix (Coelli et al. 1998)

Chapter Four An analysis of efficiency and productivity changes of the banking industry in Sri Lanka
- 99 -
where ‘D (●)’ 3 is the input distance function and ( )tttti yxyxM ,,, 11 ++ is the MPI
which shows the change in productivity of the DMU under review on the constant
return to scale (‘c’). ‘yt’, ‘x t’, ‘y t+1’ and ‘xt+1’ are shown as outputs (y) and inputs
(x) of the year ‘t’ and the year ‘t+1’ respectively.
The productivity change in a given two consecutive period contains two
components, namely, change in technical efficiency (catching up effect4) and change
in production technology (frontier shift effect). Fare et al. (1994) showed that MPI
can be decomposed into two elements to find the catching-up effect and frontier-
shift by reproducing the above equation as follows:
( ) ( )( )
( )( )
( )( )
2/1
111
11
1
1111
,
,*
,
,*
,
,,,,
=
+++
+++
++++
tttci
tttci
tttci
tttci
tttci
tttci
ttttiyxD
yxD
yxD
yxD
yxD
yxDyxyxM
Equation 4.9
shiftFrontierchangeEfficiencychangetyproductiviTotal ×=
The first element of the equation on the right hand side stands for the efficiency
change, and the second element stands for the frontier shift between time period ‘t’
and ‘t+1’. Based on the above equation, two separate equations have been
constructed to estimate the efficiency change and impact of frontier shift (Fare et al.,
1994).
( )( )
= ++
tttci
tttci
yxD
yxDchangeEfficiency
,
, 11 Equation 4.10
( )( )
( )( )
2/1
111
11
1 ,
,*
,
,
=
+++
+++
tttci
tttci
tttci
tttci
yxD
yxD
yxD
yxDshiftFrontier Equation 4.11
3 ‘D (●)’ denotes a distance function. 4 Catching-up effect is the improvement of technical efficiency in a given two consecutive
period by reducing the efficiency gap between efficient and inefficient DMUs

Chapter Four An analysis of efficiency and productivity changes of the banking industry in Sri Lanka
- 100 -
If productivity of a DMU has improved between two periods, the MPI reveals a
value greater than one. Conversely, an MPI less than one indicates declining
productivity between two periods. Productivity improvements from technological
changes and efficiency changes are also interpreted in a similar manner (Coelli, Rao
and Battese, 1998).
Both parametric and non-parametric approaches have been applied in previous
studies to estimate MPI. This study relies on a non-parametric DEA5 approach.
Respective MPIs are estimated using ‘DEA-Solver software’ developed by Kaoru
Tone. Both VRS and CRS approaches have been applied in applications on
productivity changes (Krishnasamy, 2004; Mukherjee, Ray and Miller, 2001). MPI
estimated using the CRS approach ignores the difference in size between DMUs in
the sample, thus providing relatively higher discriminatory power when using a
small sample. Therefore, this study is limited to the CRS-based MPI. Respective
MPIs are estimated from individual year data to facilitate the estimation of
productivity and technical and technological changes.
4.4 The Banking Model
As stated in Chapter Three, previous studies have used a number of approaches of
input and output specification, namely, production, intermediation, assets, user-cost
and value-added. However, there is no apparent consensus evident in the literature to
identify the most appropriate approach. This study uses two input and output
specifications to recognise the significance of intermediary roles and assets
transformation roles in the banking industry in Sri Lanka (Arshadi and Karels,
1997). The main reasons to restrict this study to the above two models are explained
below.
• Availability of required data: data for this study are gathered through
secondary sources. Therefore, specification of input and output is limited to
the available information.
5 See Coelli, Rao and Battese (1998) for more information on DEA models used for estimating MPIs.

Chapter Four An analysis of efficiency and productivity changes of the banking industry in Sri Lanka
- 101 -
• Sample size: this study is based on a relatively small sample. The number of
inputs and outputs which can be incorporated into a DEA model is restricted
by the sample size (Cooper, Seiford and Kaoru, 2000). Therefore, all
important input and output variables cannot be incorporated into a single
model.
• Various sources of efficiency and productivity improvement: different
combinations of input and output can be used to estimate the different
aspects of firm efficiency and productivity improvement. The two
specifications used mainly focus on two functions of banking institutions,
namely, intermediation and asset transformation.
• Completeness of the assessment process: these two models incorporate all
important input and output variables to the assessment process.
• Discriminating power of the specific DEA models: DEA discriminatory
power is controlled by the number of inputs and outputs in the model and the
number of DMUs under observation. Inclusion of more input and output
variables into a model reduces the DEA’s discriminatory power. As such, use
of a few models with different input and output variables may permit the
assessment of efficiency under different perspectives.
The first model used in this study aims to measure efficiency in intermediation. It
specifies inputs and outputs based on the standard intermediation and the profit
approaches (which is a variation of the value-added approach). Thus, it allows
incorporation of the impact of both risk and return of intermediation process in
efficiency estimation. Table 4.1 presents input and output variables used in this
study and their definitions. All variables in Model One, except loans and other
advances, were extracted from banks’ income statements. Since all those variables
are related to the day-to-day operation of banks, estimated efficiency scores using
Model One can be used to proxy the operational efficiency in intermediation.

Chapter Four An analysis of efficiency and productivity changes of the banking industry in Sri Lanka
- 102 -
Table 4.1: Specification of input and output variables Variables Definition Model One Model Two
Interest expenses The amount paid as interest on all liabilities including deposits, debentures and other long-term and short-term loans.
Input
Personnel costs The total expenses of banking staff, such as wages and retirement benefits.
Input
Premises and establishment expenses
Expenses incurred in providing other basic infrastructure such as communication, rent, depreciation and insurance.
Input
Deposits Total funds collected on deposit mobilisation.
Input
Other loanable funds
Funds which can be used for granting loans and advances from all sources, including debentures and other long term and short term borrowings other than deposits.
Input
Number of employees
Total number of full-time workers. Input
Loans and advances
Rupee amounts of total loans provided. Output Output
Interest income Income received as the interest on banks’ loan portfolios.
Output
Other income The income generated from sources other than banking activities.
Output
Other earning assets
Total investment made on operational assets other than the loans and advances such as investments.
Output
Input and output variables which are included the second model aim to measure
efficiency of the asset transformation role of Sri Lankan banks. The model measures
how banks’ resources have been effectively allocated in different asset portfolios. It
includes three input variables: deposits, other loanable funds and number of
employees; and two output variables: loans and advances and other earning assets.
All non-revenue-generating assets are excluded from the model. All output and input
variables, except the number of employees, are proxied by corresponding monetary
values in published financial statements.

Chapter Four An analysis of efficiency and productivity changes of the banking industry in Sri Lanka
- 103 -
4.5 Data and Sample
In this study, it was assumed that the bank generates funds for lending activities
through deposit mobilisation (customer deposits). Thus, the study sample includes
all locally established commercial and savings banks in Sri Lanka. Both savings and
commercial banks use customer deposits for financing their products. As explained
before, the savings banks are not allowed to accept the current (checking account)
deposit. However both savings and commercial banks in Sri Lanka operate under the
same operational and regulatory infrastructure. Further, both savings and
commercial banks have maintained an island-wide branch network.
Registered finance companies which are authorised to accept only time deposits can
be considered as major players in the domestic deposit market. However, their
operational activities are entirely different from commercial and savings banks.
Similarly, some licensed specialised banks (such as merchant and development
banks) are entitled to accept customers’ deposits. However, they mainly rely on
borrowings and other sources. Therefore, those licensed specialised banks and
registered finance companies were excluded from the study sample.
Foreign banks primarily provide wholesale banking services to the corporate sector
through their limited branch networks spread only in the urban areas. On the other
hand, local banks in Sri Lanka mainly provide retail banking services. Further, their
branch networks are not limited to the urban areas. Therefore, this study is limited
to local banks. The sample covers a 16-year cross section from 1989 to 2004. Bank-
related data for the study are mainly collected from published financial statements of
local banks. The macroeconomic data are collected from various annual reports and
other publications of the CBSL.
Before 1988, the corporate sector in Sri Lanka followed conservative financial
information disclosure policies. The minimum disclosure policy adopted before
1988 restricted information contained in the annual final accounts. In 1988, changes
in accounting standards, which aimed to improve the quality and coverage of
financial information contained in the corporate annual reports, were introduced.

Chapter Four An analysis of efficiency and productivity changes of the banking industry in Sri Lanka
- 104 -
The new format of accounts introduced in 1988 provides all required information for
the study in the annual reports of local banks. Therefore, this study is restricted to a
16-year period that uses the new format of accounts. Further, all banks which have
operated for more than three years within the study period are included in the
sample.
DEA models need data to be free from measurement errors or noise to make more
accurate estimations (Mester, 1996). Since the data used in this study are mainly
extracted from audited accounts, it is expected those data will have an acceptable
level of reliability. As previously stated, the new format of annual accounts6
provides a broad view of operational results and financial status of reporting firms.
Therefore, it is possible to develop a comprehensive database for the study using the
annual report data.
Table 4. 2: Corresponding periods of each window
Window Corresponding years in each windows
Point of estimation
WIN_1 1989, 1990, 1991 1990 WIN_2 1990, 1991, 1992 1991 WIN_3 1991, 1992, 1993 1992 WIN_4 1992, 1993, 1994 1993 WIN_5 1993, 1994, 1995 1994 WIN_6 1994, 1995, 1996 1995 WIN_7 1995, 1996, 1997 1996 WIN_8 1996, 1997, 1998 1997 WIN_9 1997, 1998, 1999 1998 WIN_10 1998, 1999, 2000 1999 WIN_11 1999, 2000, 2001 2000 WIN_12 2000, 2001, 2002 2001 WIN_13 2001, 2002, 2003 2002 WIN_14 2002, 2003, 2004 2003
[win = window]
As stated before, the sample is composed of 16 years of unbalanced panel data. Only
six banks are represented in the first year of the sample period. However, the number
increased to 12 banks in the last year, thus aggregating to 157 observations. Fourteen
three-year moving windows have been drawn from the sample period and used as
the pooled data to construct 14 production frontiers for efficiency assessment. The
6 See SLAS 03 : Presentation of Financial Statements

Chapter Four An analysis of efficiency and productivity changes of the banking industry in Sri Lanka
- 105 -
three-year windows are named by their respective middle years as shown in Table
4.2.
Three modes of classification are used to cluster banks in the sample for analysis of
estimated efficiency and productivity scores as given below:
• by function: banks which are functioning as savings banks and banks which
are functioning as commercial banks;
• by ownership: privately-owned banks and state-owned banks;
• by relative experiences: banks which existed before 1987 (old) and banks
which commenced operation after 1987 (new).
Efficiency differences in various types of banking units are examined on the mean
estimated efficiency scores. The Mann-Whitney test is used to test the significance
of differences in efficiency distributions of various forms of banks. The trends in
estimated efficiency in various forms of banking firms are examined using a
longitudinal graphical representation.
4.6 Analysis of Estimated Efficiency Scores
This section presents results and discussion of an analysis of estimated efficiency
scores. First, it presents mean values, standard deviations and correlation
coefficients of input and output variables used in the efficiency analysis. Second, it
produces the results and discussion of efficiency analysis using the intermediary and
assets approach.
4.6.1 Mean and standard deviation of input and outp ut variables
Table 4.3 presents descriptive statistics of all input and output variables used in this
study. These statistics indicate that mean deposits of banks have increased four-fold
(1990-Rs.14,376 million and 2003-Rs.68,664 million) and other loanable funds
approximately six-fold (1990-Rs.2,010 million and 2003-Rs.13,149 million) during
the study period. Similar trends to the deposits were recorded by loans and advances

Chapter Four An analysis of efficiency and productivity changes of the banking industry in Sri Lanka
- 106 -
(1990-Rs.9,450 million and 2003-Rs.42,996 million). Personnel cost has increased
from Rs.386 million in 1990 to Rs.1721 million in 2003.
Table 4.3: Descriptive statistics of input and output data
Win
dow
-per
iod
Inte
rest
Exp
ense
s
Per
sonn
el E
xpen
ses
Est
ablis
hmen
t
Exp
ense
s
Adv
ance
s
Dep
osits
Num
ber
of
Em
ploy
ees
Inte
rest
Inco
me
Oth
er In
com
e
Oth
er L
oana
ble
Fun
ds
Ear
ning
Ass
ets
1990
1,343
(1,269)
386
(459)
223
(215)
9,450
(10,669)
14,376
(13,191)
3,881
(4,051)
1,911
(1,746)
359
(308)
2,010
(2,741)
4,638
(7,685)
1991
1,804
(1586)
477
(539)
300
(287)
11,365
(11,464)
18,051
(15,481)
4,019
(4,036)
2,468
(2,113)
445
(363)
2,691
(3,888)
6,016
(9,174)
1992
2,313
(1,897)
602
(657)
405
(386)
13,531
(12,587)
22,162
(17,612)
4,150
(4,007)
3,194
(2,619)
581
(521)
3,542
(5,398)
7,435
(10,862)
1993
2,839
(2,222)
739
(790)
515
(470)
16,546
(14,763)
27,371
(20,757)
4,267
(3,950)
4,061
(3,205)
695
(658)
5,241
(7,617)
10,280
(13,765)
1994
3,053
(2,594)
816
(883)
582
(584)
18,823
(18,172)
30,549
(25,566)
3,996
(3,915)
4,570
(3,884)
763
(765)
5,780
(8,083)
10,860
(15,463)
1995
3,361
(3,066)
861
(940)
623
(707)
20,620
(20,167)
33,679
(29,946)
3,805
(3,906)
5,014
(4,513)
814
(888)
6,427
(8,824)
12,336
(17,676)
1996
3,497
(3,435)
881
(1,035)
622
(813)
21,766
(22,364)
35,099
(33,995)
3,515
(3,873)
5,177
(5,055)
887
(1,091)
6,666
(9,317)
12,861
(19,519)
1997
3,646
(3,558)
976
(1,158)
593
(796)
23,838
(24,285)
38,592
(37,077)
3,515
(3,871)
5,485
(5,330)
962
(1,176)
7,619
(10,537)
14,165
(20,759)
1998
3,650
(3,708)
1,050
(1,272)
509
(669)
25,948
(26,605)
40,726
(40,015)
3,367
(3,823)
5,510
(5,497)
931
(1,203)
8,101
(11,696)
14,531
(21,870)
1999
3,874
(3,946)
1,154
(1,403)
463
(486)
29,805
(30,585)
44,282
(43,175)
3,307
(3,775)
5,862
(5,810)
953
(1,212)
10,857
(17,559)
15,087
(22,974)
2000
4,769
(4,963)
1,249
(1,523)
471
(415)
34,313
(36,727)
48,576
(47,432)
3,214
(3,712)
6,780
(6,898)
1,011
(1,246)
12,356
(20,321)
16,989
(25,388)
2001
5,157
(5,260)
1,342
(1,625)
542
(470)
37,546
(39,091)
53,884
(53,025)
3,111
(3,607)
7,453
(7,494)
1,118
(1,224)
13,112
(19,841)
19,905
(29,181)
2002
5,103
(5,179)
1,517
(1,832)
603
(513)
39,833
(40,296)
60,492
(60,022)
2,998
(3,459)
7,823
(7,730)
1,272
(1,276)
12,540
(15,920)
25,047
(35,300)
2003
4,429
(4,383)
1,721
(2,082)
668
(560)
42,996
(41,555)
68,378
(67,664)
2,912
(3,291)
7,650
(7,364)
1,459
(1,532)
13,149
(13,453)
27,492
(39,702)
Pooled 3,606
(3,911)
1,090
(1,479)
521
(568)
27,524
(32,263)
42,574
(48,343)
3,458
(3,766)
5,537
(5,991)
957
(1,191)
8,757
(13,636)
15,857
(26,762)
[Note: Standard deviations are in parentheses. All values in the table except number of employees are in millions of Sri
Lankan rupees.]

Chapter Four An analysis of efficiency and productivity changes of the banking industry in Sri Lanka
- 107 -
After adjusting for the change in the number of workers, the mean labour expenses
have increased six-fold. The main reason for the decrease in the average number of
workers may be the entrance of medium-scale banking institutions to the industry.
On the other hand, increases in labour costs may have been due to both normal
salary increases and the increase in more highly-skilled banking professionals.
Almost all of the variables indicate high standard deviations. Specifically, variables
such as personnel expenses, number of employees, other loanable funds and earning
assets indicate high coefficients of variation7. The Sri Lankan banking industry
comprises few big banks and a number of medium- and small-scale banks. Thus, the
recorded differences in values of observed variables result from those scale
differences. However, the methodology used allows assessment of efficiency and
productivity improvements of DMUs ignoring their scale of operations (Cooper,
Seiford and Kaoru, 2000).
Table 4.4: Correlation of input and output variables (pooled data)
Interest expenses
Personnel expenses
Establish-ment
Deposits Other loanable
funds
No. of employees
Advances 0.762 0.936 0.822 0.857 0.873 0.732
Interest income 0.976 0.882 0.765 0.968 0.733 0.723
Other income 0.659 0.855 0.833 0.781 0.890 0.685
Other earning assets
0.799 0.520 0.340 0.799 0.362 0.321
Table 4.4 identifies correlations among input and output variables. As explained by
Avkiran (1990), correlation coefficients among input and output variables can be
used to show the appropriateness of such variables. The recorded high correlation
coefficients between input and output variables, except in a few cases, confirm that
selected input and output variables for performance evaluations are appropriate.
However, other earnings assets which have been used as an output in the second
specification show low correlations with establishment expenses, other loanable
funds and number of employees. The recorded low correlation of other earnings
7 See Appendix 3 for coefficients of variation

Chapter Four An analysis of efficiency and productivity changes of the banking industry in Sri Lanka
- 108 -
assets with loanable funds and number of employees may have little effect on the
estimation of efficiency in the asset transformation process since such assets
represent a small proportion of total assets.
The remainder of this section presents the estimated efficiency scores. The
discussion of estimated efficiency scores begins by reproducing the average
estimated efficiency scores in each window. Second, average efficiency scores of
different forms of banks (which is based on mid-year mean efficiency scores of three
year windows) are presented, together with the Mann-Whitney test scores. Further,
graphical presentation is used to highlight the trends in efficiency and differences in
estimated efficiency scores in different forms of banking units. Graphical
presentation is used to make a longitudinal analysis of estimated efficiency trends.
4.6.2 Efficiency in intermediation
Figures 4.1, 4.2 and 4.3 represent an estimated mean efficiency score of 14
three-year moving windows8. In general, these graphs show a negative trend in
estimated efficiency scores throughout the period, indicating three phases of
efficiency evaluation as outlined below:
• from 1989 to 1994, a declining trend in estimated efficiency;
• from 1995 to 2000, a stable trend;
• from 2001 to 2002, a sharp decline followed with a little recovery.
The first window (in Figure 4.1) shows that the average TE score in intermediation
[TE(I)] is 98.9% in 1989, indicating a low wastage of inputs (inefficiency) in the
production processes. However, in 2004 the estimated TE(I) declined to 90.2%,
indicating an overall downward trend in efficiency. A similar trend is also exhibited
in PTE in intermediation [PTE(I)] (1989—100%, versus 2004—90.9%) and SE in
intermediation [SE(I)] (1989—98.9%, versus 2004—91.5%). The remaining part of
this section discusses the efficiency trends and the potential grounds for those trends.
8 Mean estimated efficiency scores in each window are presented in Appendix 4

Chapter Four An analysis of efficiency and productivity changes of the banking industry in Sri Lanka
- 109 -
Figure 4.1: Average TE(I) - Window analysis
Figure 4.2: Average PTE(I) - Window analysis
Figure 4.3: Average SE(I) - Window analysis
0.76
0.80
0.84
0.88
0.92
0.96
1.00
1989 1990 1991 1992 1993 1994 1995 1996 1997 1998 1999 2000 2001 2002 2003 2004 Year
Eff
icie
ncy
0.80
0.84
0.88
0.92
0.96
1.00
1989 1990 1991 1992 1993 1994 1995 1996 1997 1998 1999 2000 2001 2002 2003 2004 Year
Eff
icie
ncy
0.80
0.84
0.88
0.92
0.96
1.00
1989 1990 1991 1992 1993 1994 1995 1996 1997 1998 1999 2000 2001 2002 2003 2004 Year
Eff
icie
ncy
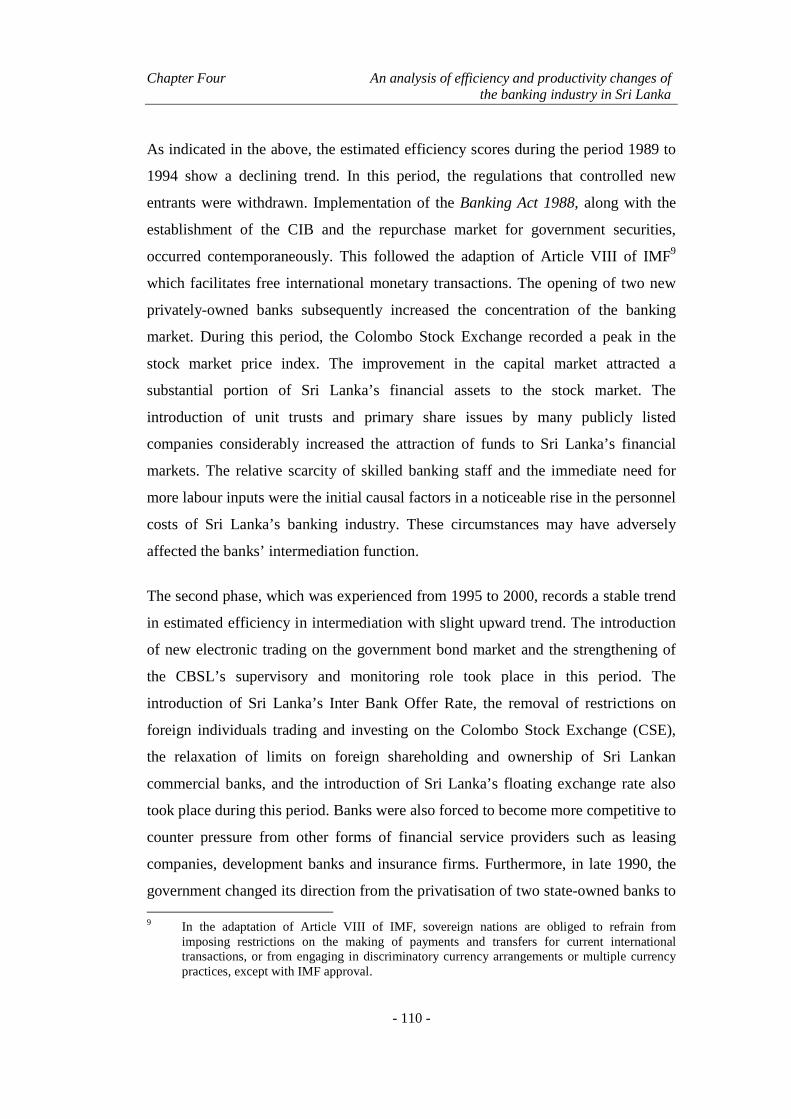
Chapter Four An analysis of efficiency and productivity changes of the banking industry in Sri Lanka
- 110 -
As indicated in the above, the estimated efficiency scores during the period 1989 to
1994 show a declining trend. In this period, the regulations that controlled new
entrants were withdrawn. Implementation of the Banking Act 1988, along with the
establishment of the CIB and the repurchase market for government securities,
occurred contemporaneously. This followed the adaption of Article VIII of IMF9
which facilitates free international monetary transactions. The opening of two new
privately-owned banks subsequently increased the concentration of the banking
market. During this period, the Colombo Stock Exchange recorded a peak in the
stock market price index. The improvement in the capital market attracted a
substantial portion of Sri Lanka’s financial assets to the stock market. The
introduction of unit trusts and primary share issues by many publicly listed
companies considerably increased the attraction of funds to Sri Lanka’s financial
markets. The relative scarcity of skilled banking staff and the immediate need for
more labour inputs were the initial causal factors in a noticeable rise in the personnel
costs of Sri Lanka’s banking industry. These circumstances may have adversely
affected the banks’ intermediation function.
The second phase, which was experienced from 1995 to 2000, records a stable trend
in estimated efficiency in intermediation with slight upward trend. The introduction
of new electronic trading on the government bond market and the strengthening of
the CBSL’s supervisory and monitoring role took place in this period. The
introduction of Sri Lanka’s Inter Bank Offer Rate, the removal of restrictions on
foreign individuals trading and investing on the Colombo Stock Exchange (CSE),
the relaxation of limits on foreign shareholding and ownership of Sri Lankan
commercial banks, and the introduction of Sri Lanka’s floating exchange rate also
took place during this period. Banks were also forced to become more competitive to
counter pressure from other forms of financial service providers such as leasing
companies, development banks and insurance firms. Furthermore, in late 1990, the
government changed its direction from the privatisation of two state-owned banks to 9 In the adaptation of Article VIII of IMF, sovereign nations are obliged to refrain from
imposing restrictions on the making of payments and transfers for current international transactions, or from engaging in discriminatory currency arrangements or multiple currency practices, except with IMF approval.

Chapter Four An analysis of efficiency and productivity changes of the banking industry in Sri Lanka
- 111 -
commercialisation, allowing management greater freedom to give more market
orientation to operations of those banks. Accordingly, the limited autonomy offered
to state commercial banks has favourably affected their performance.
The third phase starts with a sharp drop in estimated efficiency score in 2001. This
period is most important in terms of the contemporary social, political and economic
environment. Due to the growing threats of terrorism, the Sri Lankan government
increased its defence expenditure in 2000 which resulted in a considerable budget
deficit. The government relied on domestic borrowings to finance the fiscal deficit.
First, the use of domestic debt for financing the deficit created a short-term credit
restriction by local commercial banks, especially the two state-owned banks.
Second, the government introduced a tax on debit transactions on all deposit
accounts in banks from 2002. These actions had an impact on the estimated
efficiency scores (especially the estimated efficiency scores for the window period
2000-2002) of the Sri Lankan banking system.
A number of changes took place during the same period. These included the
withdrawal of the lower limits on statutory reserve requirements (SRR); the increase
in the risk-weighted capital adequacy ratio (CAR) (by 10%), the introduction of
daily determination of SRR on commercial banks’ deposits, the removal of stamp
duty and the national security levy from financial transactions, the reduction of the
repurchase rate and reverse repurchase rate, and the introduction of single borrower
limits. These regulatory changes impacted on the efficiency of the banks. However,
the removal of stamp duty and the national security levy from financial transactions
was not sufficient to counter the negative influences of the other policy changes on
the evident performance of the banks.
Figures 4.4, 4.5 and 4.6 depict mid-year estimated mean efficiency scores in
three-year windows. Tables 4.5 and 4.6 present overall means and the
Mann-Whitney Test scores, which measure the significance of the differences in
estimated efficiency between banking clusters. The aim of these figures and tables is
to demonstrate differences in efficiency among different types of banks.

Chapter Four An analysis of efficiency and productivity changes of the banking industry in Sri Lanka
- 112 -
Figure 4.4: TE(I)-Mid-year
Figure 4.5: PTE(I)-Mid-year
Figure 4.6: SE (I)-Mid-year
0.60
0.80
1.00
1990 1991 1992 1993 1994 1995 1996 1997 1998 1999 2000 2001 2002 2003
Year
Eff
icie
ncy
0.90
0.94
0.98
1.02
1990 1991 1992 1993 1994 1995 1996 1997 1998 1999 2000 2001 2002 2003
Year
Effi
cien
cy
0.60
0.80
1.00
1990 1991 1992 1993 1994 1995 1996 1997 1998 1999 2000 2001 2002 2003
Year
Eff
icie
ncy
All banks Commercial Saving State commercial Private commercial Old commercial New commercial

Chapter Four An analysis of efficiency and productivity changes of the banking industry in Sri Lanka
- 113 -
The estimated mean efficiency scores, based on mid-year results10 in each three-year
window, are a better indication of the banks’ efficiency. All graphs representing
different types of Sri Lankan banks record a declining trend in efficiency during the
first half of the study period (1989-1996). However, during the second half of the
study period, all banks show a very slight upward trend in efficiency. This upward
trend coincides with the third phase of the financial reforms.
Table 4.5: Descriptive statistics - Efficiency scores in intermediation TE(I) PTE(I) SE(I)
All banks 0.931
(0.090) 0.984
(0.026) 0.945
(0.079)
Commercial banks 0.922
(0.095) 0.981
(0.028) 0.939
(0.085)
Saving banks 0.973
(0.028) 0.996
(0.008) 0.978
(0.026)
Privately-owned commercial banks 0.951
(0.051) 0.982
(0.023) 0.967
(0.042)
State-owned commercial banks 0.843
(0.135) 0.977
(0.037) 0.860
(0.118)
Old banks 0.906
(0.117) 0.987
(0.028) 0.916
(0.103)
New banks 0.940
(0.055) 0.974
(0.026) 0.964
(0.045) [Standard deviations are given in parentheses]
All banks: The estimated overall means of the TE(I), PTE(I) and SE(I) scores show
a similar trend. The first window (1990) produces a TE(I) of 97.2%, a PTE(I) of
99.6%, and a scale efficiency score of 97.7%. The last window indicates a slight
drop in efficiency with a TE score of 93.6%, PTE score of 97.4% and SE score of
92.6%. However, during the early part of the period from 1990 to 1996, a sharp drop
in the TE(I) was experienced by Sri Lankan banks. This may be due to the combined
effect of the entry of new banks, the investment in the adaption of technology, and
competition with new entrants such as unit trusts, leasing firms and other specialised
financial services—all competing for market share. Furthermore, developments in
financial markets, especially in the CSE, may have affected the financial services
10 See Appendix 5 for mean estimated efficiency scores for different types of banks

Chapter Four An analysis of efficiency and productivity changes of the banking industry in Sri Lanka
- 114 -
industry in Sri Lanka. The trend in overall average efficiency scores indicates that
efficiency improvements as a result of the financial sector reforms may not be
achieved in the short-run but, rather, in the long-run.
Table 4.6: Mann-Whitney test scores – Efficiency in intermediation TE(I) PTE(I) SE(I)
Savings vs. commercial banks 573.0 [-3.22**]
544 [-3.58**]
696 [-2.39**]
Privately-owned vs. state-
owned commercial banks 462.0 [-4.47**]
979 [-0.74]
348 [-5.30**]
Old vs. new commercial banks 1264.0 [-0.70]
764.0 [-4.02**]
994.0 [-2.43**]
[‘Z’ scores are given in parentheses. ‘**’ indicates that test scores are significant under 5% level.]
Savings and commercial banks: The sample includes both savings banks and
commercial banks. It is important to note that there was only one state-owned
savings bank (National Savings Bank (NSB)) in operation until 1997. The
government directly promoted national savings through NSB by granting various
types of tax concessions and other incentives. In return, NSB is used as a major
funding source for the government. The NSB also provides various lending and
savings products nationwide via its branch network and through state post offices.
The financial reforms introduced in the third phase withdrew some of the incentives
granted to NSB. In addition, the government allowed NSB to set its own interest
rates.
Table 4.5 shows that savings banks produced a TE(I) score of 97.3%, a PTE(I) score
of 99.6% and a SE(I) score of 97.8% and commercial banks reported a TE(I) score
of 92.2%, a PTE(I) score of 98.1% and a SE(I) score of 93.9% during the period
1989-2004. The estimated Mann-Whitney test statistics for the efficiency scores
given in Table 4.6 indicate that differences between scores in all three measures are
significant in the case of savings banks versus commercial banks. However, the
differences in estimated efficiency scores between commercial banks and savings
banks have narrowed during the latter part of the study, indicating that financial
reforms have improved the efficiency of commercial banks in the long-run.

Chapter Four An analysis of efficiency and productivity changes of the banking industry in Sri Lanka
- 115 -
Privately-owned and state-owned commercial banks: Financial reforms aimed to
reduce government involvement in the banking industry by removing some
operational restrictions which controlled the privately-owned banks’ performance.
Thus, examination of improvements in efficiency of privately-owned banks relative
to the state-owned banks is important. The analysis of estimated efficiency scores
shows that state-owned commercial banks have recorded the lowest estimated
efficiency scores during the study period. Those banks record an average TE(I) score
of 84.3%—with a PTE(I) score of 97.7% and a SE(I) score of 86%—signalling that
the main source of inefficiency is the scale of operation. On the other hand,
compared to state-owned commercial banks, privately-owned commercial banks
report a relatively higher average TE(I) score of 95.1%—with a PTE(I) score of
98.2% and a SE(I) score of 96.7%. The results also show that the efficiency gaps
between Sri Lanka’s state-owned commercial banks and privately-owned
commercial banks have widened, particularly during the first part of the study
period. This result shows that the removal of operational restrictions has generated
improvement in the average efficiency of privately-owned commercial banks.
Furthermore, results show that the commercialisation process introduced in 1995 has
improved the efficiency of state-owned banks and has reduced the efficiency gap
when compared with privately-owned banks. In other words, state-owned
commercial banks would have been equally efficient as privately-owned banks if the
boards of management had a similar level of autonomy in decision making.
Differences in estimated efficiency scores, especially in state-owned commercial
banks, may have been a consequence of the scale losses due to persistent control by
the government. The Mann-Whitney statistics presented in Table 4.6 indicate that
there are significance differences in estimated TE(I) scores and SE(I) scores between
privately-owned and state-owned commercial banks. However, estimated PTE(I)
scores are not significantly different. Differences in ownership, autonomy of
management, operational environment, as well as objectives of the institutions, may
have impacted on the differences in estimated efficiency scores.

Chapter Four An analysis of efficiency and productivity changes of the banking industry in Sri Lanka
- 116 -
Old banks and new banks: Although financial reforms came into effect in 1977,
the first new local bank entered the banking market in early 1987. However, the
number of Sri Lankan local banks doubled by the end of 2004. The newly-entered
banks pioneered information communication technologies in the Sri Lankan banking
industry. Old banks still mainly relied on manual-based traditional banking
transaction methods. The diversified range of services offered by the new banks
intensified competition throughout the banking industry. This is confirmed by higher
efficiency scores of new banks compared to the old banks over the period 1989 to
2004. For instance, new banks recorded TE(I), PTE(I) and SE(I) efficiency scores
of 94%, 97.4% and 96.4% respectively. The corresponding figures for old banks are
90.6%, 98.7% and 91.6%. Although the overall average efficiency score of new
banks is higher than that of the old banks, the efficiency of new banks in the last
window period (2002-2004) has decreased in comparison with the first window
period (1989-1991). The average TE(I), PTE(I) and SE(I) scores in the first window
period are 97.7%, 98.7% and 98.9% respectively, whereas these values reduce to
93.3%, 95.4% and 97.8% in the last window period. During the period under review,
old banks recorded a higher PTE(I) in many of the years, while maintaining
relatively high scale inefficiency. On the other hand, new banks are able to
outperform old banks in technical and scale efficiency. The Mann-Whitney test
scores indicate that there is not a significant difference in TE(I) between the
recorded performances of the new and the old banks. However, the differences in
PTE(I) and SE(I) are significant.
Overall, the analysis provides mixed evidence relating to the financial reforms. The
shift from a negative trend in the second half of the study to a positive trend shows
that banks took a long time to respond to policy changes. The next section examines
the effectiveness of the asset transformation process in the banking industry in Sri
Lanka.

Chapter Four An analysis of efficiency and productivity changes of the banking industry in Sri Lanka
- 117 -
4.6.3 Efficiency in asset transformation
Transformation of financial assets into small units that satisfy the expectations of
borrowers and savers is a main function of banking institutions (Santomero, 1984).
Under the asset transformation function, banks collect deposits and use those
deposits to produce products (such as loans, advances and leasing) and invest excess
cash in earning assets (such as treasury bills, debentures and shares). Asset
transformation requires the intermediary to produce services and bear the associated
risk (Arshadi and Karels, 1997). Banks have to maximise their use of the financial
resources they hold after maintaining liquidity ratios and other legal reserve
requirements. Furthermore, a bank’s ability to allocate financial resources optimally
to income generating uses may allow it to gain superior performance over other
banks. Therefore, the second model examines efficiency in asset transformation.
Figures 4.7, 4.8 and 4.9 graphically present the estimated mean TE in asset
transformation [TE(A)], PTE in asset transformation [PTE(A)] and SE in asset
transformation [SE(A)] scores for each three-year window. The trend exhibited in
those figures is dissimilar to the trend recorded in Figures 4.1, 4.2 and 4.3. Overall,
the trend in estimated efficiency scores suggests that there is a reduction in
efficiency during the study period.
As explained previously, asset transformation is aimed at maximising the use of the
banks’ resources to create portfolios of income generating assets. Recorded
efficiency scores indicate that the banks were not able to utilise their funds fully to
create such assets. In general, an economic development strategy would increase the
demand for funds. Banks contribute to economic development by providing
intermediary services to channel excess funds from savers (surplus holders) to
satisfy borrowers’ (deficit holders’) demand for funds. In turn, efficiency of asset
transformation helps banks to increase their market potential in the future. The
overall downward trends reported in efficiency scores show that the amount of
non-productive assets was increasing in banks in Sri Lanka.

Chapter Four An analysis of efficiency and productivity changes of the banking industry in Sri Lanka
- 118 -
Figure 4.7: Average TE(A) - Window analysis
Figure 4.8: Average PTE(A) - Window analysis
Figure 4.9: Average SE(A) - Window analysis
0.80
0.84
0.88
0.92
0.96
1.00
1989 1990 1991 1992 1993 1994 1995 1996 1997 1998 1999 2000 2001 2002 2003 2004 Year
Eff
icie
ncy
0.80
0.84
0.88
0.92
0.96
1.00
1.04
1989 1990 1991 1992 1993 1994 1995 1996 1997 1998 1999 2000 2001 2002 2003 2004 Year
Effi
cien
cy
0.80
0.84
0.88
0.92
0.96
1.00
1.04
1989 1990 1991 1992 1993 1994 1995 1996 1997 1998 1999 2000 2001 2002 2003 2004 Year
Eff
icie
ncy

Chapter Four An analysis of efficiency and productivity changes of the banking industry in Sri Lanka
- 119 -
Relatively stable trends with slight fluctuations in estimated efficiency scores are
recorded until 2001. Thus, the estimated efficiency in asset transformation also
records sharp drops in efficiency in 2001. The drop in estimated efficiency scores in
2001 indicates that the credit restrictions following the financing of the government
fiscal deficit have adversely affected banks’ efficiency. Further, this result indicates
that financial distress in the economy may reduce the operational efficiency of
banks. Overall, Figures 4.7, 4.8 and 4.9 indicate that Sri Lankan banks have not
shown significant efficiency changes until 2001. Further, the estimated efficiency
scores recorded in the rest of the study period show a recovery in the recorded
efficiency drop during the previous period.
Some reform measures which were introduced during the period 1989-2004 affected
the asset transformation process. The establishment of a secondary market for
government securities, along with the removal of credit ceilings on loans and
advances granted for the purchase of immovable properties, expanded the
investment opportunities for banks. Furthermore, establishment of the credit
information bureau facilitated banks to be more aggressive in the lending market.
Altogether, these reforms enhanced the asset transformation process of banks in Sri
Lanka. On the other hand, the new provision introduced for issuing certificates of
deposit helped banks in increasing their deposit bases. In addition, the establishment
of a secondary market for government securities provided new alternative ways of
managing the banks’ liquidity positions.
Factors such as changes in cash and near-cash balances in banking firms11 and lower
growth in productive assets compared with growth in the total assets base of banks12
adversely affected the banks’ efficiency. Furthermore, the government’s fiscal
policies also negatively influenced banks’ operational efficiency. The debit tax
imposed in 2001 on all debit transactions in bank accounts adversely affected short-
11 As indicated in CBSL Annual Report – 1999, the total amount maintained as cash balances by
all commercial banks increased by 12% in 1998 and 41% in 1999. 12 Commercial banks reported 59% growth in total assets in 1999 and only 15.6% growth in total
loans and advances. In particular, due to the fear of the Millennium-bug, banks tended to keep more liquid assets during the period 1998-1999.

Chapter Four An analysis of efficiency and productivity changes of the banking industry in Sri Lanka
- 120 -
term deposits in banks. The unofficial credit ceiling imposed on all loans granted by
state commercial banks affected the investment portfolio of those banks.
The results also indicate that the change in government at the beginning of the
second half (in 1994) negatively affected the asset transformation function of banks.
The commencement of a new political regime created a sharp drop in the financial
services sector in general. As an example, the CSE reported a drop in the all-share
price index13 during the same period (1994-1996). Stagnation of economic activities
was reported due to the fear of possible economic policy changes, which may have
lead to a more controlled economy. However, no such radical changes in economic
polices were reported after 1994. Further, the banking sector severely suffered from
irrecoverable loans granted on political intervention during the 1987 to 1994 period
(Bandara, 1998). Accordingly, the recorded stable trend in estimated efficiency
scores, especially during the period 1989 to 2000, means that early financial reforms
have not made either negative or positive effects on the asset transformation process.
Table 4.7 shows the mean estimated efficiency (of asset transformation) scores of
different forms of banks. As indicated in the table, Sri Lankan banks record a TE(A)
score of 94.2%, a PTE(A) score of 97.6% and a SE(A) score of 96.5%, indicating
relatively high efficiency levels with very low standard deviations. It appears that
savings banks, which record a TE(A) score of 99.4%, a PTE(A) score of 99.8% and
a SE(A) score of 99.6%, are most efficient in asset transformation. Moreover,
commercial banks record a TE(A) score of 93.2%, a PTE(A) score of 97.2% and a
SE(A) score of 95.9%. State-owned banks report the lowest mean estimated
efficiency scores during the period 1989-2004. The recorded low mean efficiency
score in state-owned banks suggests that those banks have not fully utilised
resources such as deposits, other loanable funds and human resources to produce
productive asset portfolios. Furthermore, the recorded low mean SE(A) score
relative to the average PTE(A) score suggests that a large portion of the inefficiency
in asset transformation originates from a sub-optimal scale of operations. 13 The all-share price index (ASP) is the main index which reflects the movement in overall price
levels of the Colombo Stock Exchange. As indicated in the CBSL Annual Report 1999, the average ASP dropped by 323 points in the first period (1994—986.7 and 1995—663.7).

Chapter Four An analysis of efficiency and productivity changes of the banking industry in Sri Lanka
- 121 -
Table 4.7: Descriptive statistics – Efficiency in asset transformation TE(A) PTE(A) SE(A)
All banks 0.942
(0.057) 0.976
(0.030) 0.965
(0.045)
Commercial banks 0.932
(0.058) 0.972
(0.031) 0.959
(0.046)
Saving banks 0.994
(0.010) 0.998
(0.004) 0.996
(0.008) Privately-owned commercial banks
0.940 (0.051)
0.969 (0.032)
0.969 (0.033)
State-owned commercial banks 0.912
(0.069) 0.980
(0.026) 0.930
(0.064)
Old commercial banks 0.922
(0.060) 0.975
(0.028) 0.946
(0.054)
New commercial banks 0.943
(0.052) 0.968
(0.034) 0.973
(0.031) [Standard deviations are in parentheses]
Table 4.7 shows that new banks record high mean estimated efficiency scores
(TE(A) score of 94.3%, PTE(A) score of 96.8% and SE(A) score of 97.3%) relative
to old banks (TE(A) score of 92.2%, PTE(A) score of 97.5% and SE(A) score of
94.6%). Even though the average size of old banks is larger than the new banks, new
banks record a higher average SE(A) score than old banks. The production
technologies used in asset transformation by the new banks may have influenced
their recorded efficiency.
Figures 4.10 (a & b), 4.11(a & b) and 4.12 (a & b) graphically present mean
estimated efficiency scores in asset transformation in each window of different types
of banks. Overall, all banks record a stable trend in estimated efficiency scores, with
minor fluctuations. State-owned commercial banks report the lowest TE(A) scores
of 85.5% and SE(A) scores of 86% in 1998. The lowest PTE(A) score of 93.6% is
reported by state-owned commercial banks in 2000. Overall, figures indicate there is
very little gap in estimated efficiency among different forms of banks.

Chapter Four An analysis of efficiency and productivity changes of the banking industry in Sri Lanka
- 122 -
Figure 4.10a: TE(A) of all banks
Figure 4.10b: TE(A) of Commercial banks
Figure 4.10: TE(A) – Mean value of mid-year
Figure 4.11a: PTE(A) of all banks
Figure 4.11b: PTE(A) of commercial banks
Figure 4.11: PTE(A) – Mean value of mid-year
Figure 4.12a: SE(A) of all banks
Figure 4.12b: SE(A) of commercial banks
Figure 4.12: SE(A) – Mean value of mid-year
0.85
0.90
0.95
1.00
1990 1992 1994 1996 1998 2000 2002 Year
Eff
icie
ncy
All Commercial Saving
0.85
0.90
0.95
1.00
1990 1992 1994 1996 1998 2000 2002 Year
Eff
icie
ncy
State Private Old New
0.92
0.96
1.00
1990 1992 1994 1996 1998 2000 2002 Year
Eff
icie
ncy
All Commercial Saving
0.92
0.96
1.00
1990 1992 1994 1996 1998 2000 2002 Year
Eff
icie
ncy
State Private Old New
0.92
0.96
1.00
1.04
1990 1992 1994 1996 1998 2000 2002 Year
Effi
cien
cy
All Commercial Saving
0.84
0.88
0.92
0.96
1.00
1.04
1990 1992 1994 1996 1998 2000 2002 Year
Eff
icie
ncy
State Private Old New

Chapter Four An analysis of efficiency and productivity changes of the banking industry in Sri Lanka
- 123 -
The estimated TE(A) and SE(A) of state-owned commercial banks are lower than
the estimated efficiency scores of privately-owned banks. However, state-owned
banks have shown relatively high PTE(A) than the privately-owned banks. The
recorded high PTE(A) and low SE(A) indicate that the main cause for technical
inefficiency of state-owned banks is the under-utilisation of their productive
capacity. Moreover, new banks out-performed old banks by reporting higher
estimated efficiency scores throughout the study period.
The year 1994 coincided with major political change and the start of the third stage
of the financial reforms. As mentioned before, regulatory changes related to the risk
management in commercial banks, the minimum capital requirements, the statutory
reserve requirements and the CBSL supervisory capacity took place in this period.
These changes adversely affected the asset transformation role, particularly in
commercial banks.
Table 4.8: Mann-Whitney test scores – Efficiency in asset transformation TE(A) PTE(A) SE(A)
Savings vs. commercial banks 182.5 (-5.84**)
525.5 (-5.93**)
261.5 (-5.31**)
Privately-owned vs. state-
owned commercial banks 858.0
(-1.59) 824.0
(-1.85) 716.0
(-2.62**)
Old vs. new commercial banks 981.5 (-1.79)
1204.0 (-0.60)
821.5 (-2.52**)
[‘Z’ scores are given in parenthesis. ‘**’ indicates that test scores are significant under 5% level.]
The Mann-Whitney Test scores presented in Table 4.8 reveal that differences in
estimated efficiency scores between savings and commercial banks are statistically
significant. On the other hand, estimated SE(A) scores have shown significant
differences for all cases. These findings suggest that recorded efficiency differences
in different forms of commercial banks mainly resulted from issues related to the
scale of operations.

Chapter Four An analysis of efficiency and productivity changes of the banking industry in Sri Lanka
- 124 -
Recorded estimated efficiency scores in savings banks in all years are very much
closer to 100%, indicating that such banks were able to maintain high level of
efficiency throughout the study period. Further, these results suggest that
commercial banks are less efficient than savings banks. Overall, estimated efficiency
scores using the asset approach shows that the banking industry in Sri Lanka is adept
in performing the asset transformation role. The next section reviews the outcome of
efficiency analysis made in the previous section and highlights the implications of
the overall analysis.
4.6.4 Nature of RTS
Tables 4.9 and 4.10 present information on the RTS recorded by each bank in each
window14. As can be seen in both tables, CRS were evident in the majority of
efficient banks. CRS is considered as the most productive scale of operations
(Avkiran, 2000). Further, evidence on RTS indicates some banks achieved CRS
even though they were not technically efficient. Interestingly, only a few banks were
in the IRS. As indicated in previous research, banks in IRS may enter into a market
merger or other form of business collaboration with the major banks to expand their
scale of operations (Avkiran, 2000). However, this study does not support such
strategic moves since the majority of banks are either in CRS or DRS.
Both efficiency measurements show that a large number of inefficient banks in Sri
Lanka were in the DRS during the study period. Particularly during the latter part of
the study, the number of banks in DRS has increased. Further, as identified in
efficiency analyses, most large and old banks were scale inefficient. The result on
RTS confirms that the main cause of inefficiency of those banks were the excessive
scale of operations. As suggested by Avkiran, those banks which were in the DRS
are required to downsize their scale of operations. The operations of such banks may
be rationalised by reducing the number of bank branches and restructuring human
resources.
14 See Appendix 6 for information on RTS for different type of banks
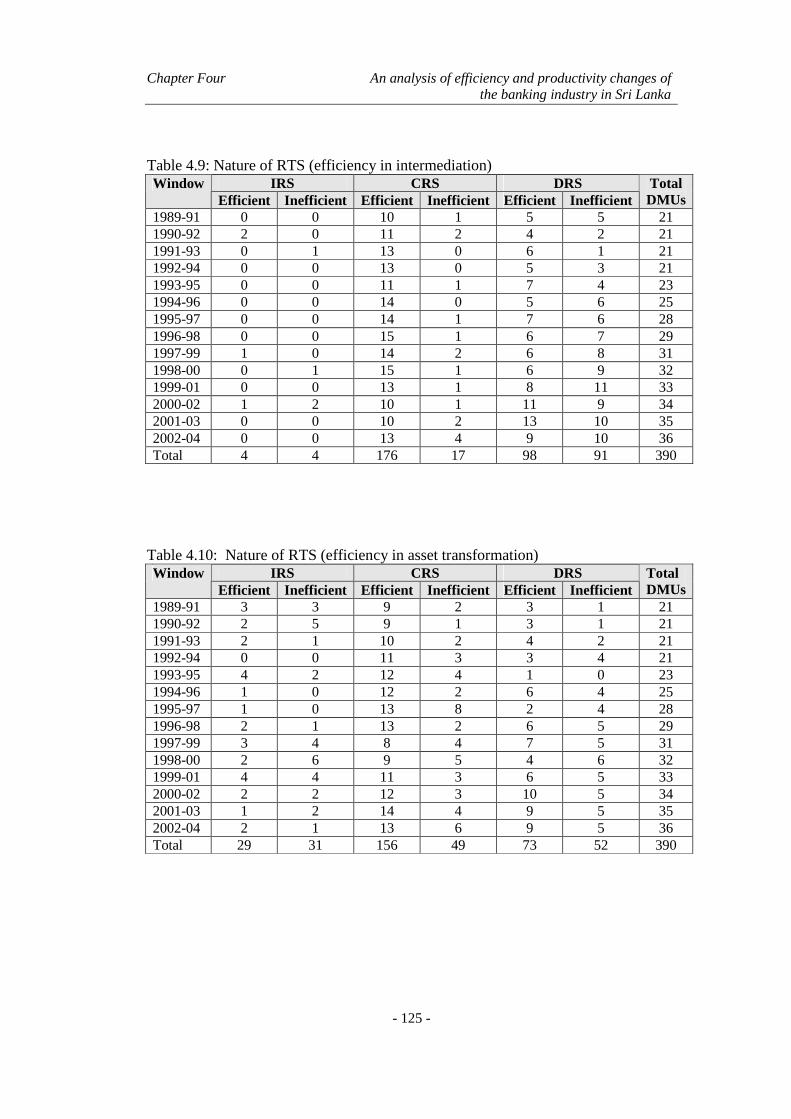
Chapter Four An analysis of efficiency and productivity changes of the banking industry in Sri Lanka
- 125 -
Table 4.9: Nature of RTS (efficiency in intermediation)
IRS CRS DRS Window Efficient Inefficient Efficient Inefficient Efficient Inefficient
Total DMUs
1989-91 0 0 10 1 5 5 21 1990-92 2 0 11 2 4 2 21 1991-93 0 1 13 0 6 1 21 1992-94 0 0 13 0 5 3 21 1993-95 0 0 11 1 7 4 23 1994-96 0 0 14 0 5 6 25 1995-97 0 0 14 1 7 6 28 1996-98 0 0 15 1 6 7 29 1997-99 1 0 14 2 6 8 31 1998-00 0 1 15 1 6 9 32 1999-01 0 0 13 1 8 11 33 2000-02 1 2 10 1 11 9 34 2001-03 0 0 10 2 13 10 35 2002-04 0 0 13 4 9 10 36 Total 4 4 176 17 98 91 390
Table 4.10: Nature of RTS (efficiency in asset transformation)
IRS CRS DRS Window Efficient Inefficient Efficient Inefficient Efficient Inefficient
Total DMUs
1989-91 3 3 9 2 3 1 21 1990-92 2 5 9 1 3 1 21 1991-93 2 1 10 2 4 2 21 1992-94 0 0 11 3 3 4 21 1993-95 4 2 12 4 1 0 23 1994-96 1 0 12 2 6 4 25 1995-97 1 0 13 8 2 4 28 1996-98 2 1 13 2 6 5 29 1997-99 3 4 8 4 7 5 31 1998-00 2 6 9 5 4 6 32 1999-01 4 4 11 3 6 5 33 2000-02 2 2 12 3 10 5 34 2001-03 1 2 14 4 9 5 35 2002-04 2 1 13 6 9 5 36 Total 29 31 156 49 73 52 390

Chapter Four An analysis of efficiency and productivity changes of the banking industry in Sri Lanka
- 126 -
4.6.5 Findings of the assessment of banks’ efficien cy
The DEA technique identifies benchmarking units for measuring relative efficiency
of DMUs from the sample of DMUs under observation by piece-wise comparison of
DMUs. Thus, estimated efficiency scores of a sample of DMUs are not appropriate
to compare with the estimated efficiency scores from another sample of DMUs.
Furthermore, issues related to model specification and input and output orientation
used in assessment of efficiency may also reduce the comparability of estimated
efficiency scores with other studies. Therefore, comparison of estimated efficiency
scores of a sample with another may distort the reality. Thus, the comparison of
estimated efficiency scores has to be limited to samples which have similar political,
economic and social characteristics. In other words, it is important to consider the
homogeneity of samples. Accordingly, the study needs to limit the comparison of
estimated efficiency scores to banks in Sri Lanka.
Sri Lanka commenced its financial services sector reforms in the late 1970s. This
study covered the second and third phases of financial reforms. Since the reforms
did not progress in a gradual fashion as planned, the impact of the reforms on banks’
efficiency is difficult to highlight. However, the estimated efficiency scores in
intermediation and asset transformation show that Sri Lankan banks have recorded a
high level of efficiency with an overall downward momentum throughout the study
period. Mean average efficiency scores slightly reduced by the end of the period. On
the other hand, existing commercial banks, both private-sector and state, were not
able to respond to regulatory reforms and intense competition from new entrants to
the banking industry.
The trends in estimated efficiency scores also suggest that the gradual reforms may
have adversely affected the stability of the banking industry at the time of reforms.
The introduction of new policies, as well as the reversal of policies, is common in
countries which have adopted gradual reform processes (Hoj et al., 2006). The
patterns of the estimated efficiency movements indicate the impact of concurrent
policy adjustments on the banks’ planning, operational and strategic decisions.

Chapter Four An analysis of efficiency and productivity changes of the banking industry in Sri Lanka
- 127 -
Window analyses of mean estimated efficiency scores show that banks in Sri Lanka
had a negative trend in estimated efficiency scores in intermediation and a stable
trend in estimated efficiency scores in the asset transformation process with slight
fluctuations during the study period. Estimated efficiency scores in both aspects
record a clear drop in estimated efficiency scores in the window which represents
years 2001, 2002 and 2003. However, overall estimated efficiency scores imply that
banks’ responses to regulatory changes are not uniform in different aspects of
banking, such as asset transformation and intermediation. These findings suggest
that the intermediation process, which links banks’ operations with the external
environment, takes a relatively longer time period to respond to regulatory changes
than the asset transformation process. Since the asset transformation process is
dependent on internal operational decisions, banks are able to respond quickly to
policy changes related to the asset transformation.
The recorded drops in estimated efficiency in 2001-2003 show the financial
repercussions created by fiscal deficit as well as debit taxes which restricted banking
operations. The sensitivity of the banking industry to political change has been
manifest in both estimations. In both cases, trends in estimated efficiency scores
have turned during the period 1994 to 1996, during which Sri Lanka experienced a
swing in the general election results.
The estimated efficiency (intermediation) scores of different types of banks show a
negative trend at the first half of the study period which turned into a positive trend
in the second half—indicating that the financial reforms have contributed to increase
banks’ efficiency in the long-term. This suggests that banks may take a relatively
long period to respond to regulatory changes.
Except in the case of PTE(I), the privately-owned commercial banks record higher
mean efficiency scores than the state-owned commercial banks in the intermediation
models. Further, recorded mean scores in SE(A) for privately-owned commercial
banks and state-owned commercial banks have shown significant differences. The
results also indicate a reduction in efficiency gap between state-owned and

Chapter Four An analysis of efficiency and productivity changes of the banking industry in Sri Lanka
- 128 -
privately-owned banks during the second half of the study period. This coincides
with the introduction of a commercialisation program of state-owned commercial
banks. Thus, the results imply that the ownership structure is not important in the
banking industry in Sri Lanka. However, autonomy in strategic and operational
decision-making may have a significant influence on efficiency. Further, the results
show that commercialisation is a success as an alternative approach to privatisation
of state-owned banks.
The analysis of sources of efficiency shows that a large portion of banks’
inefficiency originated from the scale of operations. New banks, which are
predominantly small, have recorded a relatively lower level of scale inefficiency. In
both the asset transformation and the intermediation processes, new banks show
superior performance. Further, analysis of the nature of RTS shows that the majority
of inefficient banks were in the DRS. This implies that the excessive size of
operations of old commercial banks is one of the main barriers to efficiency
improvements. The differences in banking technologies which those banks are using
may be a main reason for the low efficiency which old banks record. New banks
have used new information and communication technologies to gain a higher level
of efficiency over their more experienced competitors.
Overall, the analyses of trends of the estimated efficiency scores in each window
period show a slight downward trend in efficiency during the study period. But
further analyses on mean estimated efficiency scores (intermediation) of each
window of different types of banks provide some interesting evidence about the
effect of financial reforms on banks’ efficiency. The results show that all banks in
Sri Lanka were not able to respond to regulatory reforms successfully at the time of
introduction. However, the upward trend recorded in the latter part of the study
period confirms the fact that the efficiency (intermediation) improvements from
financial reforms can be realised in the long run. These findings are similar to Ali
and Gstach (2000) who reported a declining trend in Austria immediately after
deregulation and later an upward trend, and Denizer, Dinç and Tarimcilar (2000)
who found a declining trend immediately after deregulation in Turkey.

Chapter Four An analysis of efficiency and productivity changes of the banking industry in Sri Lanka
- 129 -
4.7 Analysis of Productivity Changes
This section presents results of the assessment of productivity changes in the
intermediation and asset transformation processes. The respective productivity
indices are estimated using DEA-based MPI. Tables 4.11 and 4.12 report geometric
means15 of the MPIs aggregated into sub-groups based on different types of banks,
together with decomposition into the constituent components of productivity
changes: the catch-up (CAT) and frontier shift (FRN). Those indices are calculated
on the basis of individual banks’ data for the period 1989 to 2004 using an adjacent
period method. If a recorded value of an index is greater than one it indicates
productivity progress. If a recorded value of an index is lower than one it indicates
deterioration (regress) of productivity of that bank. An index value equal to one
indicates that there is neither progress nor regression in productivity.
The two models (intermediation and asset transformation) show slightly different
evidence about productivity changes. As shown in Table 4.11, Sri Lankan banks do
not record either productivity gains or losses in the intermediation process.
However, a 3.4% (geometric means of all banks’ productivity) total productivity
improvement has been recorded in asset transformation (see Table 4.12).
Decomposition of the productivity change shows that the recorded gain has, for the
most part, mainly resulted from FRN (by 5%). During the period, a small
productivity regress has been recorded from CAT. This finding suggests that some
Sri Lankan banks have improved their technologies in asset transformation during
the study period.
15 Reported geometric means are subject to errors resulted on aggregation. It may not satisfy the
basic property which says that the total productivity change (MPI) is equal to the product of efficiency change (CAT) and frontier shift (FRN).

Chapter Four An analysis of efficiency and productivity changes of the banking industry in Sri Lanka
- 130 -
Table 4.11: Productivity gains/losses in intermediation
Average Savings Commercial Privately-owned State-owned Old New Win
MPI CAT FRN MPI CAT FRN MPI CAT FRN MPI CAT FRN MPI CAT FRN MPI CAT FRN MPI CAT FRN
1989-90 0.872 0.946 0.921 1.006 0.956 1.052 0.851 0.946 0.921 0.801 0.881 0.909 1.030 1.150 0.895 0.966 1.075 0.899 0.661 0.730 0.906
1990-91 0.916 0.972 0.942 0.836 0.885 0.945 0.930 0.972 0.942 0.956 1.022 0.936 0.847 0.916 0.925 0.896 0.968 0.925 1.004 1.028 0.977
1991-92 0.946 0.943 1.003 1.150 1.224 0.939 0.916 0.943 1.003 0.900 0.885 1.017 0.793 0.787 1.008 0.881 0.859 1.024 0.990 0.996 0.994
1992-93 1.007 0.978 1.029 1.047 1.000 1.047 1.000 0.978 1.029 1.004 0.990 1.014 1.080 1.012 1.068 1.027 0.996 1.031 0.949 0.932 1.017
1993-94 1.024 1.061 0.965 0.925 0.925 1.000 1.042 1.061 0.965 1.020 1.091 0.934 1.201 1.074 1.118 1.081 1.104 0.979 0.967 1.048 0.922
1994-95 1.040 0.961 1.081 0.947 0.941 1.006 1.056 0.961 1.081 1.007 0.918 1.097 1.139 1.009 1.128 1.102 0.983 1.121 0.970 0.930 1.043
1995-96 0.931 0.898 1.037 1.553 1.351 1.151 0.840 0.898 1.037 0.816 0.786 1.039 0.985 1.045 0.943 0.934 0.961 0.972 0.755 0.701 1.077
1996-97 0.987 0.997 0.989 0.783 0.949 0.825 1.015 0.997 0.989 1.005 0.995 1.010 1.034 1.062 0.973 1.036 1.057 0.980 0.995 0.952 1.046
1997-98 0.922 0.930 0.992 0.511 0.506 1.011 1.024 1.044 0.981 1.037 1.057 0.981 1.111 1.130 0.983 1.068 1.063 1.005 1.070 1.104 0.969
1998-99 0.972 1.020 0.954 1.154 1.088 1.061 0.976 1.032 0.946 0.915 0.983 0.931 1.056 1.142 0.925 0.998 1.074 0.929 0.870 0.937 0.928
1999-00 0.960 0.974 1.039 1.010 0.949 1.092 0.931 0.951 1.032 0.942 0.984 1.022 1.072 1.138 1.007 1.052 1.076 1.023 0.874 0.909 1.030
2000-01 0.897 1.001 0.897 1.025 0.960 1.068 0.890 1.004 0.887 0.862 1.012 0.852 0.995 1.161 0.857 0.942 1.050 0.897 0.818 0.979 0.835
2001-02 1.043 1.042 1.002 0.965 1.050 0.919 1.052 1.049 1.003 1.083 1.065 1.017 0.949 0.918 1.033 1.010 1.019 0.991 1.105 1.057 1.045
2002-03 1.062 0.986 1.077 0.928 1.004 0.925 1.072 0.985 1.088 1.074 0.967 1.111 1.194 0.936 1.274 1.114 0.952 1.170 1.078 1.006 1.071
2003-04 1.069 1.002 1.067 0.923 0.994 0.928 1.080 1.003 1.076 1.072 0.985 1.088 1.224 1.048 1.168 1.130 0.981 1.152 1.084 1.022 1.060
Mean 0.990 0.983 0.999 0.992 0.977 1.003 0.987 0.990 0.996 0.977 0.984 0.995 1.052 1.018 1.015 1.021 1.006 1.003 0.965 0.971 0.993
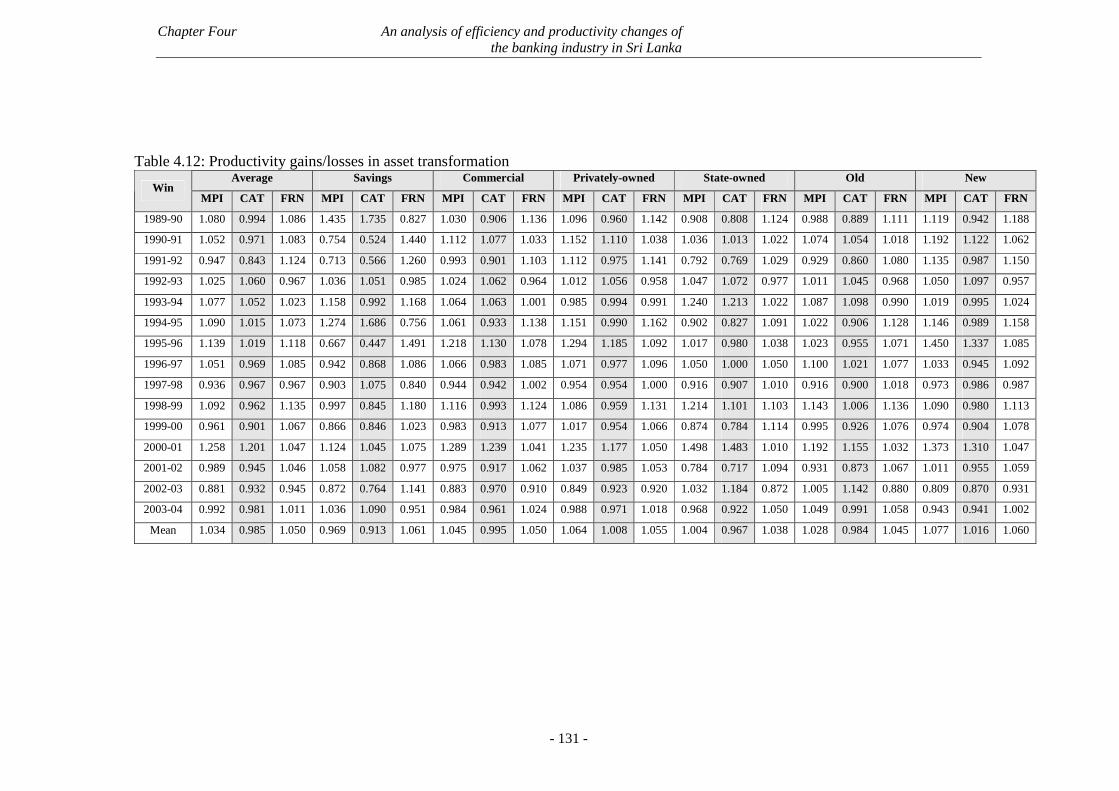
Chapter Four An analysis of efficiency and productivity changes of the banking industry in Sri Lanka
- 131 -
Table 4.12: Productivity gains/losses in asset transformation
Average Savings Commercial Privately-owned State-owned Old New Win
MPI CAT FRN MPI CAT FRN MPI CAT FRN MPI CAT FRN MPI CAT FRN MPI CAT FRN MPI CAT FRN
1989-90 1.080 0.994 1.086 1.435 1.735 0.827 1.030 0.906 1.136 1.096 0.960 1.142 0.908 0.808 1.124 0.988 0.889 1.111 1.119 0.942 1.188
1990-91 1.052 0.971 1.083 0.754 0.524 1.440 1.112 1.077 1.033 1.152 1.110 1.038 1.036 1.013 1.022 1.074 1.054 1.018 1.192 1.122 1.062
1991-92 0.947 0.843 1.124 0.713 0.566 1.260 0.993 0.901 1.103 1.112 0.975 1.141 0.792 0.769 1.029 0.929 0.860 1.080 1.135 0.987 1.150
1992-93 1.025 1.060 0.967 1.036 1.051 0.985 1.024 1.062 0.964 1.012 1.056 0.958 1.047 1.072 0.977 1.011 1.045 0.968 1.050 1.097 0.957
1993-94 1.077 1.052 1.023 1.158 0.992 1.168 1.064 1.063 1.001 0.985 0.994 0.991 1.240 1.213 1.022 1.087 1.098 0.990 1.019 0.995 1.024
1994-95 1.090 1.015 1.073 1.274 1.686 0.756 1.061 0.933 1.138 1.151 0.990 1.162 0.902 0.827 1.091 1.022 0.906 1.128 1.146 0.989 1.158
1995-96 1.139 1.019 1.118 0.667 0.447 1.491 1.218 1.130 1.078 1.294 1.185 1.092 1.017 0.980 1.038 1.023 0.955 1.071 1.450 1.337 1.085
1996-97 1.051 0.969 1.085 0.942 0.868 1.086 1.066 0.983 1.085 1.071 0.977 1.096 1.050 1.000 1.050 1.100 1.021 1.077 1.033 0.945 1.092
1997-98 0.936 0.967 0.967 0.903 1.075 0.840 0.944 0.942 1.002 0.954 0.954 1.000 0.916 0.907 1.010 0.916 0.900 1.018 0.973 0.986 0.987
1998-99 1.092 0.962 1.135 0.997 0.845 1.180 1.116 0.993 1.124 1.086 0.959 1.131 1.214 1.101 1.103 1.143 1.006 1.136 1.090 0.980 1.113
1999-00 0.961 0.901 1.067 0.866 0.846 1.023 0.983 0.913 1.077 1.017 0.954 1.066 0.874 0.784 1.114 0.995 0.926 1.076 0.974 0.904 1.078
2000-01 1.258 1.201 1.047 1.124 1.045 1.075 1.289 1.239 1.041 1.235 1.177 1.050 1.498 1.483 1.010 1.192 1.155 1.032 1.373 1.310 1.047
2001-02 0.989 0.945 1.046 1.058 1.082 0.977 0.975 0.917 1.062 1.037 0.985 1.053 0.784 0.717 1.094 0.931 0.873 1.067 1.011 0.955 1.059
2002-03 0.881 0.932 0.945 0.872 0.764 1.141 0.883 0.970 0.910 0.849 0.923 0.920 1.032 1.184 0.872 1.005 1.142 0.880 0.809 0.870 0.931
2003-04 0.992 0.981 1.011 1.036 1.090 0.951 0.984 0.961 1.024 0.988 0.971 1.018 0.968 0.922 1.050 1.049 0.991 1.058 0.943 0.941 1.002
Mean 1.034 0.985 1.050 0.969 0.913 1.061 1.045 0.995 1.050 1.064 1.008 1.055 1.004 0.967 1.038 1.028 0.984 1.045 1.077 1.016 1.060

Chapter Four An analysis of efficiency and productivity changes of the banking industry in Sri Lanka
- 132 -
Further, the above findings suggest that banks in Sri Lanka have recorded relatively
higher productivity in the asset transformation process than the intermediation
process during the study period. Additionally, the result indicates that protective
regulations related to interest rate determinations, lack of external and internal
competition and a highly collusive environment in the banking industry may have
forced Sri Lankan banks to adhere to non-price competition. Thus, banks have
focused on improvements in productivity in asset transformation, rather than
focusing on improvements in intermediation.
Geometric means of all banks’ productivity indices (intermediation) show eight
increases (in the periods 1991-92, 1992-93, 1994-95, 1995-96, 1999-2000, 2001-02,
2002-03 and 2003-04) from FRN and five increases (in the periods of 1993-94,
1998-99, 2000-01, 2001-02 and 2003-04) from CAT, resulting in five increases in
total productivity (in the periods 1992-93, 1993-94, 1994-95, 2001-02, 2002-03 and
2003-04) out of 15 comparisons made during the period 1989 to 2004. Neither the
commercial banking sector nor the savings banking sector recorded significant gains
from productivity improvements in intermediation.
MPIs in asset transformation show 12 increases in FRN (excluding the periods
1992-93, 1997-98 and 2002-03) during the same period. Further, the results show
only five increases in CAT (in the periods 1992-93, 1993-94, 1994-95, 1995-96 and
2001-02) confirming that the main contributor to productivity improvements in asset
transformation is the FRN which resulted from advancement of technologies used.
Further analysis of estimated productivity indices shows that both the savings (6.1%)
and the commercial banking (5%) sectors gained productivity improvements in asset
transformation from FRN during the study period. Overall, these findings suggest
that banks in Sri Lanka have focused more on improvement in asset transformation
than in intermediation.
No productivity gain in intermediation has been made either by the commercial
banking or by the savings banking sectors. The commercial banking sector recorded

Chapter Four An analysis of efficiency and productivity changes of the banking industry in Sri Lanka
- 133 -
the highest total productivity loss (-11%) in intermediation in 2000-01 and the
highest total productivity gain (8%) in 2003-04. The estimated productivity indices
for individual periods show that most of the productivity gains in commercial banks
originated from FRN. Further, changes in CAT have not significantly contributed to
overall productivity gains, suggesting that the main aim of commercial banks was to
seek improvements in productivity through the adoption of new technologies.
Commercial banks recorded considerable productivity gains (4.5%) in asset
transformation mainly from FRN (5%). However, the savings banking sector records
a total productivity loss (-3.1%) even though the sector records a 6.1% gain on FRN.
Both sectors have recorded productivity losses on CAT. In the commercial banking
sector, both privately-owned (5%) and state-owned (3.8%) banks record productivity
improvements from FRN. State-owned commercial banks (1.8% on CAT and 1.5%
on FRN) and old commercial banks (0.6% on CAT and 0.3% on FRN) record 5.2%
and 2.1% total productivity gains respectively during the study period. These results
indicate old and state-owned banks have improved their performance by expanding
existing technologies and achieving higher levels of efficiency. Further, recorded
MPIs suggest that both new commercial banks and privately-owned commercial
banks have not gained productivity improvements either on FRN or CAT during the
study period.
Among all forms of banks, new banks have recorded the highest total productivity
gain (7.7%) in asset transformation during the study period. The highest total
productivity gain of the commercial banking sector is reported in 1995-96 (21.8%)
which is mainly contributed by the privately-owned commercial banks recording a
(29.4%) total productivity gain. However, the state-owned commercial banks
recorded a marginal total productivity improvement during the study period. These
results suggest that increased threat of competition on commercialisation of state-
owned banks may have affected the productivity gains in the sector.
While old banks record a modest productivity gain (2.1%) in intermediation, new
banks record a productivity regress (-4.5%). The decomposition of old banks’ total

Chapter Four An analysis of efficiency and productivity changes of the banking industry in Sri Lanka
- 134 -
factor productivity gains shows that the main contributor for productivity gains in
intermediation is the FRN. Both the negative FRN (technological change) and the
negative effect of CAT (losses in efficiency) have caused productivity regress in
new banks. The primary reasons for productivity regress in intermediation may be
that new banks have given less attention to improving either technical efficiency or
advancement of technologies in the belief that they are at the most productive scale
of operation. Similarly, old banks may have attempted to mitigate differences in
operational efficiency with new banks in order to maintain their competitive position
in the market.
On the other hand, recorded total productivity indices in asset transformation shows
that new banks achieved higher productivity gains (7.7%) both in frontier shift (6%)
and catch-up (1.6%) compared to the old banks (2.8% on total productivity gain,
4.5% on frontier shift and -1.6% on catch-up). These results indicate that new banks
are more successful in incorporating new technological advances to improve asset
transformation than the old banks.
Overall, assessment of productivity change suggests that Sri Lankan banks have
been able to gain improvements in productivity in asset transformation. However,
the results show that there are no significant improvements in intermediation
processes. Further, results show that most productivity gains have been achieved in
the latter part of the study. It also signifies that regulatory reforms may have helped
banks to improve their productivity in the long-term. Based on the results of
productivity analysis, the following observations can be highlighted:
1. Banks in Sri Lanka have recorded productivity gains in asset transformation,
indicating that banks have focused on gaining advantage through non-price
competition. There is no productivity gain recorded in intermediation
processes.
2. Productivity gains on assets transformation have been recorded from FRN
(advancement of technologies, rather than improvement of efficiency).

Chapter Four An analysis of efficiency and productivity changes of the banking industry in Sri Lanka
- 135 -
3. State-owned commercial banks and old commercial banks made relatively
higher improvements in productivity.
4.8 Conclusion
This chapter examines the trends in efficiency and productivity changes of the
banking industry during the post-deregulation period and the responses of different
forms of banking firms to the reform process. Efficiency scores and total factor
productivity growth are estimated using the input-oriented DEA model. Two input
and output specifications are used to represent efficiency and productivity gains in
intermediation and asset transformation. The main limitation faced in this study is
the number of banks in the sample. Hence, efficiency scores are estimated based on
three-year moving averages for the local bank sample. All productivity indices are
estimated based on adjacent period MPI.
This chapter is based on a proposition which assumed that financial reform has
improved banking efficiency and productivity gains. The analysis of mean estimated
efficiency scores in both models—which used intermediation and asset approaches
for specification of input and output variables—indicated a reduction in estimated
efficiency. However, the mean estimated efficiency (intermediation) scores of
different types of banks show that there is a negative trend in efficiency in the first
half and a positive trend at the end of the second half of the study period. Overall,
this study found no evidence to support the view that reforms improved the banks’
efficiency. However, the results suggest that reforms may bring efficiency
improvements in the long term. These findings are similar to Ali and Gstach’s
(2000) findings in Austria which reported a negative trend in the early years.
Since the intermediation process is externally driven, even firms that have made the
necessary adjustments take some time to gain the benefits of reforms. Low
variations in estimated efficiency scores for asset transformation confirm this
argument. Since many decisions related to asset transformation are internal
decisions, banks were able to respond quickly to the policy adjustments related to

Chapter Four An analysis of efficiency and productivity changes of the banking industry in Sri Lanka
- 136 -
the asset transformation function, indicating that banks’ responses depend on the
type of decisions affected by policy change. Further, these results suggest that the
main source of inefficiency of banks in Sri Lanka is scale inefficiency arising from
sub-optimal size of operation. Particularly, the scale issue more severely affects old
banks (including both state-owned banks and privately-owned banks) which can be
regarded as the large banks in the industry. Small, new commercial banks were able
to perform better than the old banks.
The estimated MPIs show that Sri Lankan banks have recorded no improvement in
productivity in intermediation. However, the asset transformation process records
total productivity gains mainly from frontier shift. For the most part, old banks and
state-owned banks have shown productivity gains. This finding suggests that banks
in Sri Lanka mainly focus on non-price competition.
Overall, this chapter shows how the efficiency and productivity changes have
evolved during the last 16 year (1989-2004) period. Furthermore, the recorded
trends have shown that the changes in efficiency of banks may have been affected by
some other factors with the financial reforms. Thus, the next chapter investigates the
factors affecting the technical efficiency of banks in Sri Lanka.

Chapter Five Determinants of efficiency of banks in Sri Lanka
- 137 -
CHAPTER FIVE
DETERMINANTS OF EFICIENCY OF BANKS
IN SRI LANKA
5.1 Introduction
The results outlined in Chapter Four show that efficiency and productivity of the
banking industry in Sri Lanka has changed during the study period. However, the
results indicate that movement in the estimated efficiency of banks during the period
is dissimilar across banks. For example, although financial reforms have removed
distortions in the market, responses of the banks were different. While some banks
recorded improvements in efficiency and productivity gain, others did not. This
suggests that there are factors, other than regulatory, which may control banks’
performance. Thus, analysis in this chapter is based on Proposition II which states
that “the efficiency of banks in Sri Lanka is affected by a range of micro and
macroeconomic factors, together with financial deregulation”.
The performance of institutions depends upon the strengths, weaknesses,
opportunities and threats they are facing. Those forces originate from both external
and internal environments of the firm. Hence, both firm-specific and environmental
factors may influence the efficiency of a bank. Consequently, banks with sound
internal and external environments may perform better than other banks in the
industry. Thus, the investigation of factors which influence firms’ efficiency is
important.

Chapter Five Determinants of efficiency of banks in Sri Lanka
- 138 -
5.2 Background of the Analytical Framework
A production process can be regarded as a complex, adaptive, on-going social
system that is sensitive to changes in socio-economic environments. Convergence of
labour, capital and socio-economic environments and the way they are balanced and
coordinated into an integrated whole are important, particularly in service-oriented
industries (Prokopenko, 1987). Therefore, recognition and utilisation of key factors
from socio-economic environments which have significant influence over firms’
performance are necessary conditions for improvement in efficiency and
productivity gains.
5.2.1 Determinants of bank efficiency
Variables representing socio-economic environments can be broadly divided into
three groups, namely, microeconomic, macroeconomic, and other factors.
Microeconomic factors have limited influence over particular industry segments and
include endogenous factors such as product lines, capital employed, input utilisation,
people, the organization and system, work methods, and management styles—all of
which a firm’s management can control. Microeconomic factors also include
exogenous factors such as market share, which may not be quite so susceptible to
control through managerial decisions. Macroeconomic factors such as per capita
income of the consumer population, inflation, gross national product, economic
growth rates and population may influence the improvement in efficiency and
productivity gains of all industries in general. Other factors include all non-
economic factors. Table 5.1 summarises some factors which have been considered in
previous studies.
Researchers have arbitrarily selected different combinations of variables according
to the objectives of their analyses. For example, when researchers address policy
matters they have given greater weight to regulatory factors such as capital
adequacy, type of ownership, nature of banking activities and problem loans (Ali
and Gstach, 2000; Barr, Seiford and Siems, 1994; Dietsch and Lozano-Vivas, 2000;
Grifell-Tatje and Lovell, 1996; Hermalin and Wallace, 1994).

Chapter Five Determinants of efficiency of banks in Sri Lanka
- 139 -
Table 5.1: Microeconomic, macroeconomic and other factors affecting banks’
efficiency
Factor Study
Microeconomic factors Size Barr et al. (1999); Darrat, Topuz and Yousef (2002); Favero and
Papi (1995); Leong and Dollery (2002); Leong, Dollery and Coelli
(2002); McKillop, Glass and Ferguson (2002); Miller and Noulas
(1996)
Profitability Casu and Molyneux (2003); Casu, Girardone and Molyneux (2004);
Darrat, Topuz and Yousef (2002); Maghyereh (2004); Miller and
Noulas (1996)
Capital ratio Casu and Molyneux (2003); Casu, Girardone and Molyneux (2004);
Darrat, Topuz and Yousef (2002); Leong and Dollery (2002);
Maghyereh (2004)
Loans to total assets Leong and Dollery (2002); McKillop, Glass and Ferguson (2002)
Fixed assets to total assets Leong and Dollery (2002)
Problem loans Barr et al. (1999); Maghyereh (2004); McKillop, Glass and
Ferguson (2002); Pastor (2002)
Risk Leong and Dollery (2002)
Purchased funds Barr et al. (1999)
Liquidity McKillop, Glass and Ferguson (2002)
Market power Darrat, Topuz and Yousef (2002); Devaney and Weber (2000);
Favero and Papi (1995); Maghyereh (2004); Miller and Noulas
(1996)
Macroeconomic factors Per capita income Chaffai, Dietsch and Lozano-Vivas (2001); Grigorian and Manole
(2002); Hasan, Lozano-Vivas and Pastor (2000)
Inflation ratio Grigorian and Manole (2002)
Stock market capitalization Grigorian and Manole (2002)
Liberalisation Maghyereh (2004)
Other Factors Specialization Favero and Papi (1995); Mukherjee, Ray and Miller (2001)
Location Casu and Molyneux (2003); Casu, Girardone and Molyneux (2004);
Devaney and Weber (2000); Favero and Papi (1995); Miller and
Noulas (1996)
Ownership Favero and Papi (1995); Maghyereh (2004)
Number of branches Dietsch and Lozano-Vivas (2000); McKillop, Glass and Ferguson
(2002)
Bank branch concentration Chaffai, Dietsch and Lozano-Vivas (2001); Dietsch and Lozano-
Vivas (2000)
Population concentration Dietsch and Lozano-Vivas (2000); Hasan, Lozano-Vivas and Pastor
(2000)

Chapter Five Determinants of efficiency of banks in Sri Lanka
- 140 -
However, for general assessment of efficiency, researchers have freely selected
variables from the sample environment. For instance, Leong and Dollery (2002)
used factors such as agency problems1, regulator and organizational structure2, risk
management3, and size and technology4 in a study which aimed to identify the
properties of DEA-estimated efficiency scores.
Favero and Papi (2002) used variables such as firm size, productive specialization,
of each ownership, market structure and localisation as explanatory variables of
DEA-estimated efficiency in a study which focused on factors determining the
efficiency of banks in Italy. Miller and Noulas (1996) investigated the resultant high
competition in the banking market from regulatory changes and identified bank size,
profitability, market power and location as the most influential factors. Grigorian
and Manole (2002) examined determinants of the efficiency of financial institutions
in transition countries and tested the relationships of DEA-estimated efficiency
scores with bank-specific variables to represent financing, market concentration,
foreign versus local banks, and new versus old banks. Therefore, these applications
confirm that the objective analysis determines the selection of factors for further
studies.
5.2.2 Empirical approaches used in previous studies
Prior studies have applied three techniques for investigating factors affecting the
estimated efficiency and productivity gains indexes. They are:
• multivariate regression analysis (generalised least square methods and Tobit)
(Ali and Gstach, 2000; Darrat, Topuz and Yousef, 2002; Favero and Papi,
1995; Grigorian and Manole, 2002; Miller and Noulas, 1998);
1 Agency problems arise when ownership and management are separate. 2 Firm structure and organization depend on existing regulation. 3 A bank management’s capability to predict the future will lead to a reduction in unanticipated
loses. 4 Bank size and technology indicate the firm’s overall ability to respond to environmental
uncertainty (Leong & Dollery 2002)

Chapter Five Determinants of efficiency of banks in Sri Lanka
- 141 -
• longitudinal graphical approach (Barr et al., 1999; Leong and Dollery, 2002);
and
• DEA itself (Chaffai, Dietsch and Lozano-Vivas, 2001; Pastor, 1999, 2002).
The first approach, multivariate regression analysis, uses DEA-estimated efficiency
scores as dependent variables and a range of other factors as the explanatory
variables. The second, longitudinal approach, examines the general trends of
estimated productivity within a longer time period and uses graphical representation
to exhibit the relationship between estimated productivity and each factor. The third
approach uses the DEA technique, together with Malmquist type indices, to find the
aggregate effect of other (non-production) variables on estimated efficiency5 (Pastor,
1999, 2002).
Both DEA techniques and the longitudinal approach do not provide sufficient
information to test hypotheses. However, the statistical significance level provided
with the estimated coefficient for each explanatory variable included in the model
allows analysts to test the hypotheses when using regression techniques.
Accordingly, previous studies employed this approach to test the hypotheses. On the
other hand, the longitudinal approach has been used to identify the influence of
factors which may lag over a longer time period, such as the impact of policy
changes on productivity (Barr et al., 1999). In contrast, DEA-based approaches have
been used in cross-country comparison of estimated efficiency to separate the
country-specific environmental influences from estimated efficiency to find the true
efficiency. The main advantage of multivariate regression analysis over other
approaches is its ability to test the hypotheses. Accordingly, this study uses the
regression method to investigate determinants of banks’ efficiency. The remaining
discussion is limited to prior studies using a similar approach.
5 There are two DEA models, in which the first incorporated only input and output variables
directly related with the production process (for estimating the true efficiency) and the second model included both production and non-production factors affecting the production process (to estimate the total efficiency), used for estimating efficiency. The difference between estimated efficiency scores in these two models is decomposed using a Malmquist type index and identifies the aggregates affecting the other variables (Pastor 1999; 2002).

Chapter Five Determinants of efficiency of banks in Sri Lanka
- 142 -
5.2.3 Previous applications
Previous empirical research presents mixed evidence of factors affecting the
estimated efficiency scores of banks. However, methodological differences, as well
as differences in regulatory and economic environments, have greatly influenced the
outcome of these studies. Thus, the comparison of these results with other research
needs careful analysis.
As stated previously, the combination of factors and their proxy variables
investigated in different studies are not comparable. For example, the same variable
has been used as proxy for different factors, or different proxy variables have been
used to account for the same factor in different studies. For example, return on total
assets and return on equity are used alternatively to represent profitability.
Furthermore, the predicted signs for explanatory variables are also not comparable.
Favero and Papi (2002) and Isik and Hassan (2003) used different size groups which
were incorporated as dummy variables in these models to understand the size effect
on estimated efficiency. In another study, Miller and Noulas (2000) regressed the
value of the total assets directly with estimated efficiency scores. Consequently, the
estimated coefficient for the variable may be greatly influenced by the definition
used for the variable.
Previous studies produced dissimilar evidence on factors affecting banks’ technical
efficiency. Favero and Papi (2002) found that inefficiency is best explained by
productive specialization6, size and, to a lesser extent, location in Italian banks. In
another study, Miller and Noulas (2000) found bank size and profitability have a
significant positive relationship with pure-technical efficiency in large US banks. In
a study of transition countries (located in eastern Europe), Grigorian and Manole
(2002) found that equity capital ratios, market shares, foreign ownership and old
banks were positively related to estimated efficiency scores. Ali and Gstach (2000)
6 Productive specialization = (total intermediation margin)
margininterestervicesbankingnonfromprofitservicesbankingfromprofit
servicesbankingfromProfit
+−+=
s

Chapter Five Determinants of efficiency of banks in Sri Lanka
- 143 -
found that small banks in Austria performed better than medium-sized banks. Darrat,
Topuz and Yousef (2002) found a negative relationship between bank size and
estimated efficiency in Kuwait, which was similar to the findings of Ali and Gstach
(2000). Further, Ali and Gstach (2000) pointed out that low competition in the
banking industry may adversely affect estimated efficiency in large and medium-
sized banks.
Darrat, Topuz and Yousef (2002) also found that market power, profitability and
capitalization are positively related to estimated efficiency. Naceur and Goaied
(2001) found that the principal determinants of a bank's performance are, by order of
importance, labour productivity, bank portfolio composition, capital productivity
and bank capitalization. Sathye (2000) measured the productive efficiency of banks
in India using DEA and found that the efficiency of private-sector commercial
banks as a group is, paradoxically, lower than that of public-sector banks and foreign
banks in India. He suggested that the existing policy of reducing non-performing
assets and rationalization of staff and branches may have enhanced the productivity
of Indian banks.
Casu and Molyneux (2003) examined the factors influencing European commercial
banks after convergence into a common monetary union by using bootstrap methods
for computing the confidence intervals for efficiency scores derived from
non-parametric frontier methods. Their regression results indicated that the
geographic location has the most significant influence on bank efficiency. They did
not find significant evidence for the relationship of estimated efficiency with
average capital ratio and the return on average equity.
The DEA-based approach has been used in cross-country comparisons of bank
efficiency. Pastor (1999) proposed the use of a sequential DEA procedure consisting
of three phases7 to address the influence of loan losses and environmental factors
7 Pastor (1999) suggested separating bad loans into two segments according to cause - managerial
actions and outside factors. In the first phase, he suggested estimating efficiency without environmental factors. In the second phase, the DEA or SFA is used to estimate efficiency with
Chapter Five Determinants of efficiency of banks in Sri Lanka
- 144 -
when evaluating efficiency improvements. He used DEA to disaggregate the
estimated technical efficiency into risk management effect, environmental effect and
pure-technical effect. Pastor (2002) extended this framework by developing separate
DEA models which incorporate risk and environment factors. He found a high
variation in efficiency estimations between two countries using a model that did not
incorporate the environmental variables. The model that incorporated the
environmental variables reported comparatively low efficiency variations between
two countries. Hence, Pastor argued that the cross-country differences arise not only
as a result of differences in managerial decision-making, but also environmental
differences.
Lozano-Vivas, Pastor and Pastor (2002)8 used a similar approach to Pastor (1999) to
examine the operating efficiency differences among commercial banks across 10
European countries. They used two different models with and without environmental
variables to examine the influence of the country. The estimated efficiency without
environmental variables was significantly different from the efficiency estimated
with environment variables. Pastor (2002) employed a quite different methodology
for comparing the input-oriented efficiency among four European Union countries.
Pastor (2002) emphasised the significance of incorporation of the risk factors
together with environmental variables in cross-country studies. Country-specific risk
factors indicate the social and political environment which may directly influence
firms’ operational decisions. Pastor used provisions for loan losses as a proxy for the
risk factor. He employed both parametric and non-parametric approaches to estimate
productivity and used graphical representation to compare the outcomes. His
analysis incorporated environmental as well as risk factors, and found relatively low
productivity estimations for all countries.
the bad loans resulting from managerial actions. In the third phase, he suggested estimating efficiency with the environmental variables.
8 Lozano-Vivas, Pastor and Pastor (2002) recognised three types of environmental variables as the variables that affect the efficiency variation in a given market. These are variables representing the country’s economic conditions (per capita income, per capita salary, the population density and density of demand), variables representing the bank performance (income per branch, deposits per branch, and branches per capita) and the regulatory environment and competitiveness (average capital ratios and return on equity).

Chapter Five Determinants of efficiency of banks in Sri Lanka
- 145 -
The main implication of previous studies is that the relationships among efficiency,
productivity and other factors are not consistent. The outcome depends on the
relative importance of factors in a given country. However, only a few studies have
examined the explanatory power of macroeconomic factors on technical efficiency.
Stock markets and debt markets may have a very limited influence over a bank-
based financial system. However, financial system liberalisation aims to enhance the
direct capital transfers through stock and capital markets too. Particularly in
developing countries, financial liberalisation policies are aimed at both the banking
sector and the capital markets. With liberalisation, changes in the purchasing power
of money, interest rates, and international trade activities may have influenced
technical efficiency of the banking industry. However, previous studies have given
very little emphasis to such factors.
5.3 Methodology
Having considered the previous studies, this study uses the multivariate regression
analysis approach to examine the characteristics and their influence. This section
introduces the empirical model and potential determinant variables of technical
efficiency.
5.3.1 Model selection
The empirical model used in this study is taken from the literature9 which
investigates the explanatory variables of the efficiency of DMUs. Most previous
studies have used two-stage procedures to regress the point estimation of efficiency
with a number of explanatory variables. At the first stage, point estimation of
efficiency has been measured based on a non-parametric DEA approach. As a
second stage, the estimated efficiency scores are regressed with a range of
explanatory variables.
There are two main problems in using DEA-estimated data in regression analysis.
As explained by Xue and Harker (1999), since DEA-estimated efficiency scores are
9 See section 3.6.2.
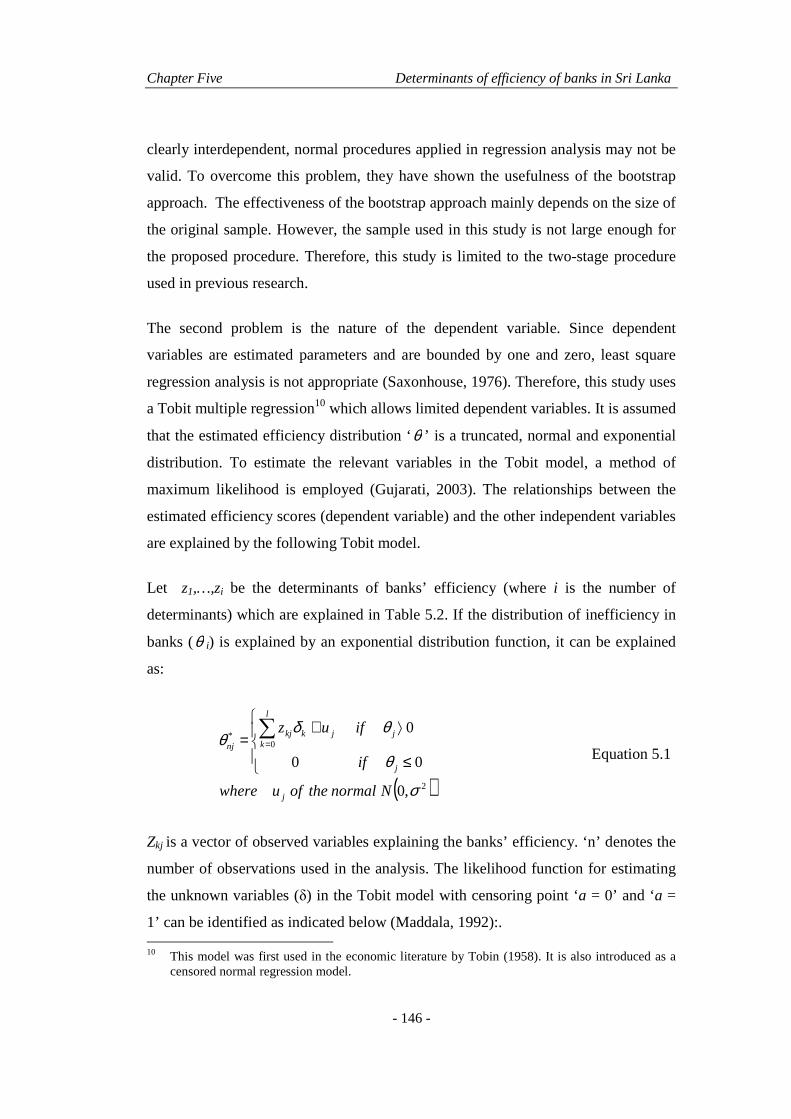
Chapter Five Determinants of efficiency of banks in Sri Lanka
- 146 -
clearly interdependent, normal procedures applied in regression analysis may not be
valid. To overcome this problem, they have shown the usefulness of the bootstrap
approach. The effectiveness of the bootstrap approach mainly depends on the size of
the original sample. However, the sample used in this study is not large enough for
the proposed procedure. Therefore, this study is limited to the two-stage procedure
used in previous research.
The second problem is the nature of the dependent variable. Since dependent
variables are estimated parameters and are bounded by one and zero, least square
regression analysis is not appropriate (Saxonhouse, 1976). Therefore, this study uses
a Tobit multiple regression10 which allows limited dependent variables. It is assumed
that the estimated efficiency distribution ‘θ ’ is a truncated, normal and exponential
distribution. To estimate the relevant variables in the Tobit model, a method of
maximum likelihood is employed (Gujarati, 2003). The relationships between the
estimated efficiency scores (dependent variable) and the other independent variables
are explained by the following Tobit model.
Let z1,…,zi be the determinants of banks’ efficiency (where i is the number of
determinants) which are explained in Table 5.2. If the distribution of inefficiency in
banks (θ i) is explained by an exponential distribution function, it can be explained
as:
( )2
0*
,0
00
0
σ
θ
θδθ
Nnormaltheofuwhere
if
ifuz
j
j
l
kjjkkj
nj
≤
⟩+= ∑
= Equation 5.1
Zkj is a vector of observed variables explaining the banks’ efficiency. ‘n’ denotes the
number of observations used in the analysis. The likelihood function for estimating
the unknown variables (δ) in the Tobit model with censoring point ‘a = 0’ and ‘a =
1’ can be identified as indicated below (Maddala, 1992):. 10 This model was first used in the economic literature by Tobin (1958). It is also introduced as a
censored normal regression model.

Chapter Five Determinants of efficiency of banks in Sri Lanka
- 147 -
∏∏≤⟩
−
−=ay
iii
ay ii
zf
zyfL
σδ
σδ
σ1
Equation 5.2
By maximising this likelihood function (L) with respect to δ and σ, the estimation for
the parameters can be derived in the Tobit models. The characteristics incorporated
in the regression model, proxy variables and expected relationships are summarised
in Table 5.2. The estimation process can be performed using ‘EViews 5’ statistical
software. The use of a Tobit regression model allows estimation of parameters by
coping with the heteroskedastic problems in estimated limited variables. It offers
insight into the probable influence of those characteristics.
Two separate Tobit regression models are estimated based on technical efficiency
scores estimated for the local banks’ sample using the intermediation approach and
the assets approach as outlined in Chapter Four. As stated early in this chapter, data
availability for branches of foreign operations limited the analysis to only the local
banks. Furthermore, analysis was limited to estimated technical efficiency scores,
since CRS-DEA has better discriminatory power than the VRS-DEA.
5.3.2 Determinants of banks’ efficiency in Sri Lank a
This section introduces a range of microeconomic and macroeconomic factors and
their expected relationships with estimated technical efficiency scores. To address
Proposition II, a number of hypotheses are developed based on the theories related to
each factor. Theories related to the factors, related hypotheses and corresponding
evidence found in this study are presented separately in the section 5.4.
As previously stated, prior studies have tested the influence of three categories of
variables on technical efficiency. The empirical evidence highlighted above showed
that banking industries in some countries were able to report productivity
improvements due to favourable microeconomic and macroeconomic factors, even
under a rigid regulatory environment. Existence of favourable characteristics in the
market may provide DMUs with a better opportunity for efficiency gains through
reforms. On the other hand, unfavourable characteristics may diminish the efficiency

Chapter Five Determinants of efficiency of banks in Sri Lanka
- 148 -
improvement even under a deregulated environment. Thus, it is important to
investigate various factors and the nature and significance of their influence on
firms’ efficiency. Following previous research, this study concentrates on three types
of variables in regression analysis: (1) microeconomic characteristics such as assets
quality, capital adequacy, collateral value (ratio of fixed assets), interest margin,
leverage, liquidity, operational risk and profitability; (2) macro economic
characteristics, stock market capitalization, inflation ratio, per capita income and
GDP growth; and (3) qualitative characteristics such as line of business (commercial
banks), ownership (privately-owned banks), relative experience (old banks) and one
variable to represent major political change in 1994.
Firms’ specific (microeconomic) variables are given precedence over other variables
since those variables are specific to individual banks. Macroeconomic variables are
introduced to the model to control environment-related influences which all banks
equally enjoy. In regression analysis, a qualitative variable is used to proxy
regulatory conditions which banks face. Overall, the analysis concentrates on 14
explanatory variables. Predicted relationships and proxies used for representing each
variable are briefly defined in Table 5.2. Detailed discussion of each factor is
provided within the results of the regression analysis. Information about
firm-specific explanatory variables was obtained from the published annual reports
of banks. Information about macroeconomic variables was obtained from various
issues of CBSL annual reports.
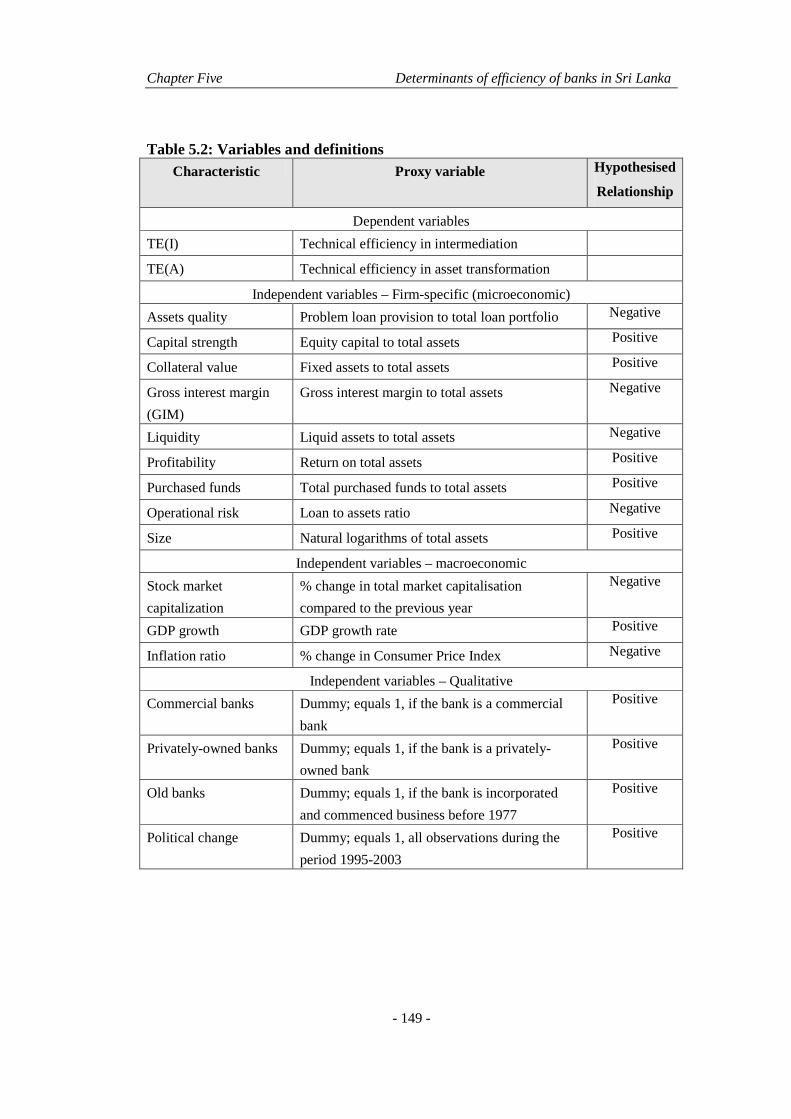
Chapter Five Determinants of efficiency of banks in Sri Lanka
- 149 -
Table 5.2: Variables and definitions Characteristic Proxy variable Hypothesised
Relationship
Dependent variables
TE(I) Technical efficiency in intermediation
TE(A) Technical efficiency in asset transformation
Independent variables – Firm-specific (microeconomic)
Assets quality Problem loan provision to total loan portfolio Negative
Capital strength Equity capital to total assets Positive
Collateral value Fixed assets to total assets Positive
Gross interest margin
(GIM)
Gross interest margin to total assets Negative
Liquidity Liquid assets to total assets Negative
Profitability Return on total assets Positive
Purchased funds Total purchased funds to total assets Positive
Operational risk Loan to assets ratio Negative
Size Natural logarithms of total assets Positive
Independent variables – macroeconomic
Stock market
capitalization
% change in total market capitalisation
compared to the previous year
Negative
GDP growth GDP growth rate Positive
Inflation ratio % change in Consumer Price Index Negative
Independent variables – Qualitative
Commercial banks Dummy; equals 1, if the bank is a commercial
bank
Positive
Privately-owned banks Dummy; equals 1, if the bank is a privately-
owned bank
Positive
Old banks Dummy; equals 1, if the bank is incorporated
and commenced business before 1977
Positive
Political change Dummy; equals 1, all observations during the
period 1995-2003
Positive

Chapter Five Determinants of efficiency of banks in Sri Lanka
- 150 -
5.4 Results and Discussion
5.4.1 An overview
Tables 5.3 and 5.4 present descriptive statistics and correlation coefficients for the
independent and dependent variables used in the regression analysis. The mean
values and the standard deviations of each variable show that there are no outliers
among the explanatory variable which may affect the estimated regression
coefficients. The mean value of the variable which represents collateral value shows
that banks have invested relatively low amounts of total funds in fixed assets with
high collateral value. Further, the descriptive statistics show that banks have
maintained relatively high liquidity positions while investing a large portion of their
assets in loans and advances (operation risk). However, the recorded mean value for
profitability has shown that banks in Sri Lanka gain a low return on total assets.
Further, the mean value of the capital ratio indicates that banks have mainly relied
on deposit mobilisation for funding their operations.
Table 5.3 Descriptive statistics of firm-specific variables Variable Mean Std. Dev.
TE(Intermediation) [TE(I)] 93.1% [8.9%]
TE(Asset transformation) [TE(A)] 94.2% [5.8%
Assets quality 4.5% [4.1%]
Capital strength 6.9% [7.3%]
Collateral value 2.4% [1.15%]
Gross interest margin (GIM) 34.7% [11.2%]
Liquidity 15.3% [8.7%]
Profitability 0.8% [0.79%]
Purchased funds 10.2% [7.43%]
Operational risk 54.4% [17.6%]
Size (ln[total assets]) 10.15 [1.47]
Stock market capitalization 24.6% [27.7%]
GDP 4.6% [1.1%]
Inflation 10.1% [2.3%]
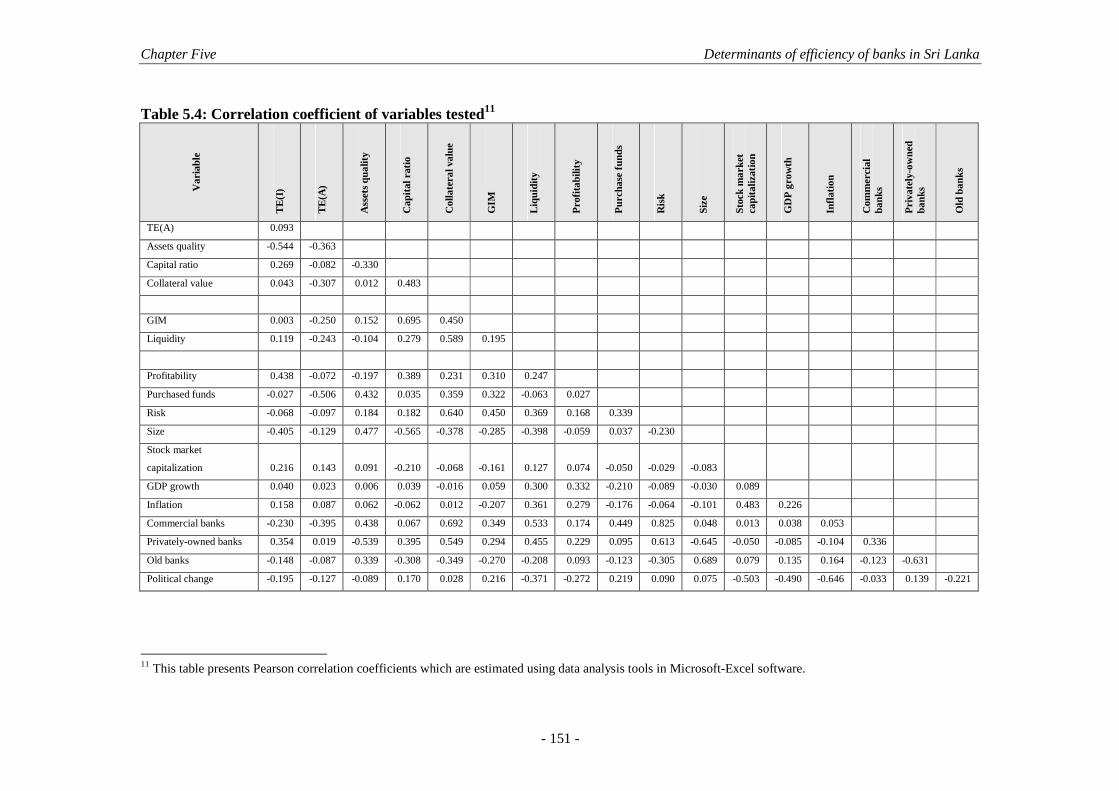
Chapter Five Determinants of efficiency of banks in Sri Lanka
- 151 -
Table 5.4: Correlation coefficient of variables tested11
Var
iabl
e
TE
(I)
TE
(A)
Ass
ets
qua
lity
Cap
ital r
atio
Col
late
ral v
alue
GIM
Liqu
idity
Pro
fitab
ility
Pur
chas
e fu
nds
Ris
k
Siz
e
Sto
ck m
ark
et
capi
taliz
atio
n
GD
P g
row
th
Infla
tion
Com
mer
cial
ba
nks
Priv
atel
y-ow
ned
bank
s
Old
ban
ks
TE(A) 0.093
Assets quality -0.544 -0.363
Capital ratio 0.269 -0.082 -0.330
Collateral value 0.043 -0.307 0.012 0.483
GIM 0.003 -0.250 0.152 0.695 0.450
Liquidity 0.119 -0.243 -0.104 0.279 0.589 0.195
Profitability 0.438 -0.072 -0.197 0.389 0.231 0.310 0.247
Purchased funds -0.027 -0.506 0.432 0.035 0.359 0.322 -0.063 0.027
Risk -0.068 -0.097 0.184 0.182 0.640 0.450 0.369 0.168 0.339
Size -0.405 -0.129 0.477 -0.565 -0.378 -0.285 -0.398 -0.059 0.037 -0.230
Stock market
capitalization 0.216 0.143 0.091 -0.210 -0.068 -0.161 0.127 0.074 -0.050 -0.029 -0.083
GDP growth 0.040 0.023 0.006 0.039 -0.016 0.059 0.300 0.332 -0.210 -0.089 -0.030 0.089
Inflation 0.158 0.087 0.062 -0.062 0.012 -0.207 0.361 0.279 -0.176 -0.064 -0.101 0.483 0.226
Commercial banks -0.230 -0.395 0.438 0.067 0.692 0.349 0.533 0.174 0.449 0.825 0.048 0.013 0.038 0.053
Privately-owned banks 0.354 0.019 -0.539 0.395 0.549 0.294 0.455 0.229 0.095 0.613 -0.645 -0.050 -0.085 -0.104 0.336
Old banks -0.148 -0.087 0.339 -0.308 -0.349 -0.270 -0.208 0.093 -0.123 -0.305 0.689 0.079 0.135 0.164 -0.123 -0.631
Political change -0.195 -0.127 -0.089 0.170 0.028 0.216 -0.371 -0.272 0.219 0.090 0.075 -0.503 -0.490 -0.646 -0.033 0.139 -0.221
11 This table presents Pearson correlation coefficients which are estimated using data analysis tools in Microsoft-Excel software.

Chapter Five Determinants of efficiency of banks in Sri Lanka
- 152 -
Estimated correlation coefficients between explanatory variables are presented in
Table 5.4. The table shows very little correlation between variables. Only the
relationship between operational risk and commercial banks shows a correlation
coefficient greater than 0.800. Overall, the low correlation between the variables
implies that there is no risk in multicolinearity in the regression analysis (Gujarati,
2003).
Table 5.5 presents Tobit regression results. The relatively high values of the
estimated Tobit R2s (which are the counterparts of OLS R2) indicate that both
models were able to explain the influence of the variables on TE. Further, high
estimated log likelihood values also confirm the models’ ability to explain TE. As
explained by Gujarati (2003), the violation of the normality assumption in limited
dependent variable models may be quite severe. Bera, Jarque and Lee (1984) pointed
out that the maximum likelihood estimation may be inconsistent under non-
normality. This study applied the Jarque-Bera (JB) test of normality to examine
whether distributions of residuals are normal. The JB test of normality is an
asymptotic or large sample test (Gujarati, 2003). The estimated JB test statistic for
the first regression model [TE(I)] is not able to provide sufficient evidence to
support the assumption that residuals of the regression estimates are normally
distributed. However, the recorded JB test statistic for the second model [TE(A)]
shows that residuals of the regression are normally distributed.
Variables representing risk, market capitalization and commercial banks provide
statistically significant evidence for both models. Estimated coefficients for
profitability, product quality, liquidity and purchased funds are statistically
significant only with the TE(I). Variables such as capital adequacy, privately-owned
banks and old banks show significant relationships with the estimated TE(A). All
other variables fail to provide sufficient evidence for the existence of statistically
significant relationships under a 90% confidence level with either of the dependent
variables.

Chapter Five Determinants of efficiency of banks in Sri Lanka
- 153 -
Table 5.5 Tobit regression results
Explanatory variables TE(I) TE(A)
Assets quality -1.770* [-1.82]
-0.219 [-0.50]
Capital strength 0.480
[0.57] 0.383*
[1.72]
Collateral -3.046
[-1.03] -0.021
[-0.02]
GIM -0.475
[-1.15] -0.246
[-1.44]
Liquidity 0.967* [1.90]
-0.017 [-0.09]
Profitability 6.641*** [3.00]
-0.892 [-0.75]
Purchased funds 1.737*** [3.94]
-0.115 [-0.91]
Operational risk 0.824** [2.26]
0.853*** [5.46]
Size -0.021
[-0.63] 0.016
[1.07]
Stock market capitalization 0.254*** [3.22]
0.072** [2.30]
GDP growth -0.265
[-0.16] 0.481
[0.64]
Inflation -1.361
[-1.47] 0.053
[0.12]
Commercial banks -0.577*** [-2.53]
-0.453*** [-3.90]
Privately-owned banks -0.070
[-0.76] -0.088**
[-2.06]
Old banks 0.067
[0.96] -0.070***
[-2.49]
Political change -0.046
[-1.02] -0.031
[-1.41]
Intercept 1.339*** [3.49]
0.909*** [5.03]
R-squared Adjusted R-squared Log likelihood Avg. log likelihood Akaike info-criterion Schwarz criterion Jarque-Bera
0.75 0.70
203.84 1.96
-3.57 -3.11 32.93
0.62 0.55
242.31 2.181 -4.04 -3.60 3.06
[‘z’ values are in the parentheses. ‘***’ indicates significant coefficients under 1% confidence level, ‘**’ indicates significant coefficients under 5% confidence level,‘*’ indicates significant coefficients under 10% confidence level]

Chapter Five Determinants of efficiency of banks in Sri Lanka
- 154 -
To examine the robustness of the estimated coefficients, four alternative
regressions12 have been performed omitting the non-commercial banks from the
original sample and limiting the regression only for explanatory variables which
record significant relationships with TE(I) and TE(A). These results are not
dissimilar to the results derived from the original regressions. The remainder of this
section presents and discusses the regression results related to individual explanatory
variables.
5.4.2 Firm-specific variables
Assets Quality: The ratio of problem loans to total assets has been used to represent
assets quality. Problem loan provision can be regarded as an indicator of the quality
of loan assets. Berger and De-Young (1997) presented three hypothetical
relationships between operational efficiency and problem loans, namely; bad luck
hypothesis, bad management hypothesis, and skimping hypothesis13. Both the bad
luck and bad management hypotheses predict a negative relationship between
operational efficiency and problem loan provision. However, the skimping
hypothesis, which relates the cost of managing loan assets with problem loans,
predicts a positive relationship. This study relies on the bad management hypothesis
and predicts that there is a negative association between problem loan provision and
operational efficiency. The empirical findings support a significant negative
relationship between TE(I) and assets quality only at the 10% confidence level. This
result indicates that banks with well managed loan portfolios experience higher
TE(I) than those with a need for high loss provisions. This result supports Isik and
Hassan (2003). However, the estimated coefficient for assets quality in the TE(A) is
not statistically significant and fails to support the hypothesised relationship.
12 See Appendix 7. 13 The bad-luck hypothesis predicts that problem loans arise due to exogenous factors such as
weather disasters that are impossible to control through managerial decisions. The bad management hypothesis predicts that bad management of loan origination and monitoring affects problem loans (Berger & De-Young 1997). The skimping hypothesis says that:
‘a bank maximising long-run profits may rationally choose to have lower costs in the short-run bear the consequences of greater loan performance problems and possible costs of dealing with these problems in the future’ (Berger & De-Young 1997, p. 853).

Chapter Five Determinants of efficiency of banks in Sri Lanka
- 155 -
Capital Strength: Prior studies have considered capital adequacy as a prime
requirement for the smooth operation of banking firms. Moreover, maintaining a
minimum capital ratio is a major prudential regulatory requirement in the banking
industry which aims to reduce gambling incentives that put bank equity at risk
(Hellmann, Murdock and Stiglitz, 2000). Further, a bank’s capital strength can be
seen as an indicator of its ability to face risk related to insolvency. Claeys and
Vennet (2003) stated that a strong capital base implies a lower default risk of the
bank. Consequently, banks with healthier capital strength incur lower funding costs
than banks with low capital strength. On the other hand, since capital is considered
to be one of the most expensive forms of liabilities in terms of expected return,
holding capital above the regulatory minimum is a credible signal of
creditworthiness on the part of the bank. Thus, this study predicts a priori that the
relationship between capital strength and TE will be positive.
Testing of the estimated coefficient for capital strength in the first regression fails to
show a statistically significant relationship with TE(I). In the second TE(A) model,
there is a statistically significant positive relationship with capital ratios (but only at
the 10% confidence level) showing that managers in banks with a high capital ratio
are more efficient in TE(A) than those in banks with low capital ratios. The result
supports other findings—Grigorian and Manole (2002); Naceur and Goaied (2001);
Darrat, Topuz and Yousef (2002); and Havrylchyk and Scharrnstrabe (2004)—
which confirms that banks with a sound capital base are able to operate better than
poorly capitalised banks.
Collateral (Fixed assets ratio) : Fixed assets to total assets ratio is an indicator that
shows the extent of collateral which a bank can provide to its deposit holders by
using its long-term assets. Generally, fixed assets include assets such as properties
and freehold which carry higher collateral value. Increases in such assets reduce the
funds available for funding operational activities. On the other hand, banks with a
higher level of fixed assets may provide higher creditworthiness and consequently
those banks may gain the confidence of deposit holders. Those investments can be
regarded as an apparent insurance to deposit holders against risk of loan losses.
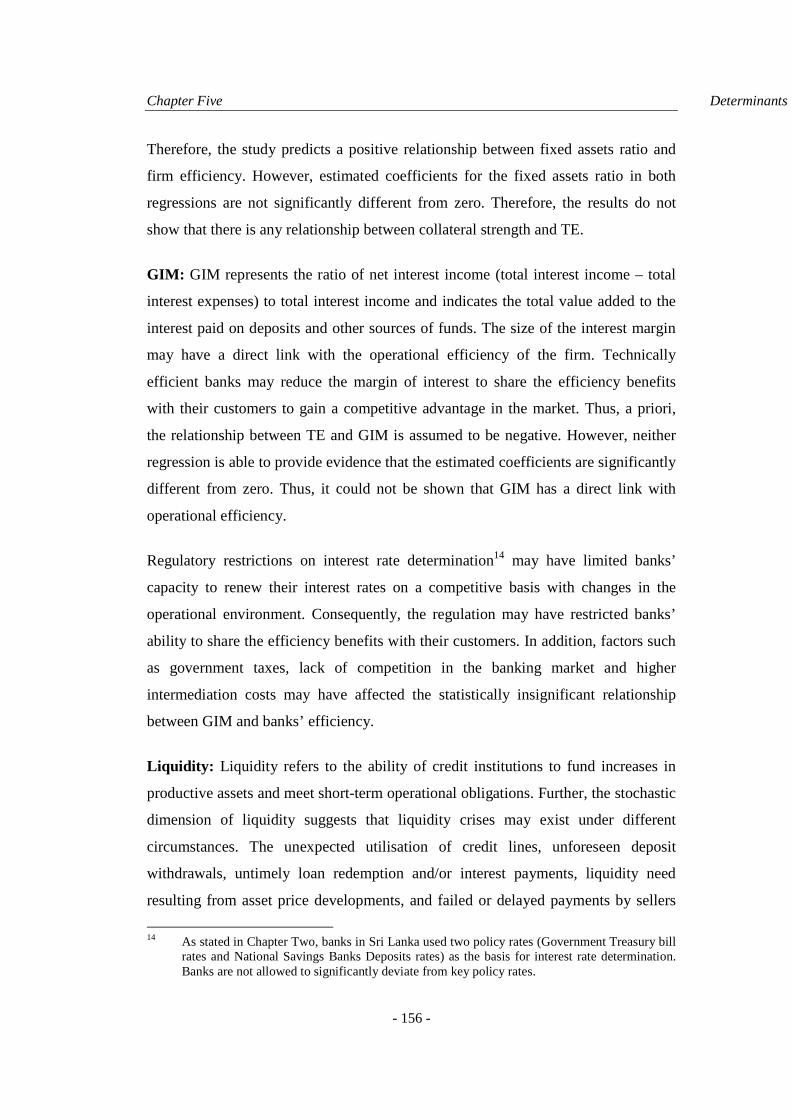
Chapter Five Determinants of efficiency of banks in Sri Lanka
- 156 -
Therefore, the study predicts a positive relationship between fixed assets ratio and
firm efficiency. However, estimated coefficients for the fixed assets ratio in both
regressions are not significantly different from zero. Therefore, the results do not
show that there is any relationship between collateral strength and TE.
GIM: GIM represents the ratio of net interest income (total interest income – total
interest expenses) to total interest income and indicates the total value added to the
interest paid on deposits and other sources of funds. The size of the interest margin
may have a direct link with the operational efficiency of the firm. Technically
efficient banks may reduce the margin of interest to share the efficiency benefits
with their customers to gain a competitive advantage in the market. Thus, a priori,
the relationship between TE and GIM is assumed to be negative. However, neither
regression is able to provide evidence that the estimated coefficients are significantly
different from zero. Thus, it could not be shown that GIM has a direct link with
operational efficiency.
Regulatory restrictions on interest rate determination14 may have limited banks’
capacity to renew their interest rates on a competitive basis with changes in the
operational environment. Consequently, the regulation may have restricted banks’
ability to share the efficiency benefits with their customers. In addition, factors such
as government taxes, lack of competition in the banking market and higher
intermediation costs may have affected the statistically insignificant relationship
between GIM and banks’ efficiency.
Liquidity: Liquidity refers to the ability of credit institutions to fund increases in
productive assets and meet short-term operational obligations. Further, the stochastic
dimension of liquidity suggests that liquidity crises may exist under different
circumstances. The unexpected utilisation of credit lines, unforeseen deposit
withdrawals, untimely loan redemption and/or interest payments, liquidity need
resulting from asset price developments, and failed or delayed payments by sellers
14 As stated in Chapter Two, banks in Sri Lanka used two policy rates (Government Treasury bill
rates and National Savings Banks Deposits rates) as the basis for interest rate determination. Banks are not allowed to significantly deviate from key policy rates.

Chapter Five Determinants of efficiency of banks in Sri Lanka
- 157 -
of credit risk protection (ECB, 2002) are some such circumstances. To prevent
liquidity crises, banks maintain a buffer of liquid assets on the asset side (Heffernan,
1996). However, provisioning a buffer of liquid assets to face shocks may reduce the
amount of income-generating assets of the bank and it also may contribute
negatively to firm performance. On the whole, the study predicts a negative
relationship between TE and liquidity. The regression results shows a statistically
significant positive relationship between TE(I) and liquidity at the 10% confidence
level and reject the hypothesised relationship. This result suggests that banks with a
better liquidity position are more technically efficient in the intermediation function
than the banks with poor liquidity positions. Conversely, the estimated coefficient
for liquidity in the TE(A) model is not statistically significant.
Profitability: In line with prior studies, this study applied return on total assets as a
proxy for banks’ profitability. Profitability, in general, indicates a firm’s ability to
earn an excess over its total expenditure. Efficiency also shows the quality of the
management and demonstrates how management is effective in producing maximum
outputs using a minimum level of inputs. The results of the first regression provide
statistically significant evidence to support the proposition that there is a significant
positive relationship between TE(I) and profitability. It shows that more profitable
banks are more efficient than others. Accordingly, the result shows that performance
in the intermediation process has a direct link with banks’ profitability. Higher
efficiency in intermediation lowers the cost of bank operations which, in turn, leads
to higher profitability. Accordingly, managers in profitable banks have more
incentive to efficiently perform in the intermediation process than those in the less
profitable banks. The findings of the regression based on TE(I) supports the findings
of Darrat, Topuz and Yousef (2002), Maghyereh (2004), and Casu and Molyneux
(2003) that profitability is positively related to bank efficiency. The second
regression, which tests determinants of TE(A), is not able to provide statistically
significant evidence to support the association between banks’ profitability and the
assets allocation process.

Chapter Five Determinants of efficiency of banks in Sri Lanka
- 158 -
Purchased Funds: Traditionally, banks are concerned with two main payment
functions, namely, deposit mobilisation and funding loans. Banks mainly use
deposits to produce their lending products. Purchased funds which are borrowed
from other financial institutions and/or from individuals can be regarded as a
substitute for funds generated from deposits (Heffernan, 1996). Generally, banks use
purchased funds to satisfy the minimum capital requirements that are recommended
by regulatory authorities (Carey, 2002). On the other hand, purchased funds can be
considered as an alternative source of funds which can be used to satisfy excess
demand for lending products. Since purchased funds increase the availability of
loanable funds, this study has predicted a positive relationship between technical
efficiency and purchased funds. The regression results provide statistically
significant evidence to support the predicted positive relationship between TE(I) and
purchased funds. However, the recorded relationship between TE(A) and purchased
funds is not statistically significant.
Operational Risk: Operational risk can be regarded as another major variable that
determines banks’ operational efficiency. Prior studies in both banking and non-
banking sectors have used earnings’ variability as a proxy for operational risk.
However, going beyond prior studies, this study applies the total loans to total assets
ratio as an alternative measure to proxy operational risk. Loan to assets ratios can be
considered a measure of the risk-taking nature of the banks’ management.
Profit-seeking banks may tend to put their funds in risky lending portfolios to
capture higher interest income. Consequently, high loan to assets ratios may lead to
wider interest margins and to large loan losses. Furthermore, the amount of loans
granted is directly related to the loan administration costs, because loans need to be
originated, serviced and monitored (Heffernan, 1996), and recovered. This leads to a
reduction in the net interest margin. However, if a bank applies a mark-up pricing
strategy to set its lending rates, the increased cost in maintaining a large loan level
may adversely affect future lending potential. On the other hand, risk takers may
prefer to find more productive investments while reducing the other overhead costs.
Keeping a significant portion of funds in income generating assets may improve the

Chapter Five Determinants of efficiency of banks in Sri Lanka
- 159 -
firm’s operational efficiency. Hence, a positive relationship between operation risk
and firm efficiency can be expected.
Both TE(I) and TE(A) have recorded statistically significant positive relationships
with operational risk which are consistent with the predicted relationship. These
results show that risk-taking banks have achieved comparatively higher efficiency
than banks less aggressive in taking risk. It supports the findings of Darrat, Topuz
and Yousef (2002) and Burki and Niazi (2003) and rejects the findings of McKillop,
Glass and Ferguson (2002) and Havrylchyk and Scharrnstrabe (2004). The major
implication of these results is that the banks’ ability to put more funds into
productive resources may improve operational efficiency. Regulatory restrictions
may lead to control of banks’ lending capacity and may undermine their operational
efficiency.
Size: Prior studies in banking predicted a strong positive association between firm
size and efficiency (Isik and Hassan, 2003). These studies used two methods for
controlling the size effect in regression analysis, namely, clustering banks based on
different size groups (large banks, small banks, and medium sized banks) (Isik and
Hassan, 2003), and introducing a proxy to represent firm size such as total turnover
and total assets (Darrat, Topuz and Yousef, 2002). This study used total assets
(converted into natural logs) of individual banks to represent their size. The
estimated coefficients for total assets in both models are not statistically significant.
Thus, the study does not provide evidence for a relationship between TE and size.
5.4.3 Macroeconomic variables
Country-specific microeconomic variables are included to capture the impact of the
external environment on banking operations. In order to control country-specific
macroeconomic conditions, the growth in stock market capitalisation (to identify
competitive threats made by other capital market participants), inflation (to account
for changes in price level) and GDP growth rate (to capture the influence of general
economic growth) are included in the regression model. However, only the growth

Chapter Five Determinants of efficiency of banks in Sri Lanka
- 160 -
in stock market capitalisation shows a statistically significant relationship with
estimated efficiency scores.
Changes in stock market capitalisation may influence banks’ efficiency in three
ways. First, savers may withdraw their deposit investments and may invest their
savings in the stock market, thereby reducing the funds available for investments.
Second, investors in the market may tend to use borrowings from banks for their
investments and make profits from improved markets. Third, banks themselves may
capitalise on profit-making opportunities in the stock market by investing their
excess cash in active portfolios. The result indicates that the adverse effect of the
withdrawal of deposits in favour of the stock market is over-shadowed by the
lending opportunities arising from the same developments. Consequently,
improvements in capital markets on one side assist banks to smooth the
intermediation function and give more opportunities to diversify their investments.
Further, the short-term investment opportunities arising in the stock market assist
banks in keeping temporary cash surpluses in active portfolios. Ultimately, extra
income generated from investments, as well as new lending opportunities, may have
enhanced banks’ efficiency. These results reject Grigorian and Manole’s (2002)
argument that developments in security markets and non-bank financial institutions
have reduced the performance of banks, and confirm Fat and Hua’s (1998) findings
that stock market performance is closely related to bank efficiency. These findings
indicate that the expansion of stock market activities is not hindering but, rather,
widening the profit-making opportunities of banking firms.
5.4.4 Qualitative variables
The influence of four qualitative characteristics—namely, the line of business
(commercial), ownership form (privately-owned), experiences (old) and political
change—is tested. The regression results relating to qualitative characteristics are
detailed below.
Commercial banks: Estimated coefficients for the dummy variable, which
represents the line of business, produce statistically significant negative relationships
in both regressions. These results indicate that the commercial banking sector is less

Chapter Five Determinants of efficiency of banks in Sri Lanka
- 161 -
efficient than the savings banking sector. Until the late 1990s, the savings banking
sector was dominated by state-owned banks. The Sri Lankan government has used
the state-owned savings bank (NSB) to promote national savings, offering various
incentives such as income tax and wealth tax relief. NSB offered its banking services
island-wide through post offices, providing greater access to depositors. On the other
hand, commercial banks have established their bank branches mostly in urban areas
in the country. Further, the savings banks are permitted to provide a limited range of
products which basically covers accepting customer deposits and granting loans
products. Conversely, commercial banks have offered more freedom with various
deposit and lending products. The results of the study found statistically significant
evidence that the commercial banks were less efficient than the savings banks in
both in TE(I) and TE(A). The main reasons for reporting higher efficiency by
savings banks may be the easy access to savings banks and the public confidence
created by high government intervention in the sector.
Privately-owned banks: Privately-owned and state-owned firms are operated with
different objectives that are closely aligned between the types of ownership. The
impact of private ownership of banks is tested ignoring the functional orientation
(either savings or commercial) of those banks. Theories15 such as public interest
theory, private interest theory (Kroszner and Strahan, 1999), and the development
view and political view (La-Porta, Lopez-de-Silanes and Shleifer, 2002) have
predicted that state ownership of firms has unfavourably affected their performance.
La-Porta, Lopez-de-Silanes and Shleifer (2002) pointed out that the direct
involvement of the state sector in economic activities, not only in the banking
industry but also in any other industry, might undermine the performance and
growth of that industry. Accordingly, those theories pointed out that the
non-transferable and widely dispersed ownership structure of public firms reduces
the incentive of state-ownership to monitor the performance of management.
Conversely, private ownerships provide incentives to enhance the firms’ efficiency
15 See Chapter 2 Section 2.

Chapter Five Determinants of efficiency of banks in Sri Lanka
- 162 -
and, thereby, to maximise the firms’ wealth. To investigate this issue, this study
predicts that privately-owned banks are more efficient than the state-owned banks.
The study does not provide evidence for a statistically significant relationship
between TE(I) and privately-owned banks. However, the testing of the estimated
coefficient in the second model shows a statistically significant negative relationship
between TE(A) and privately-owned banks. This result rejects the predicted
relationship that the privately-owned banks (commercial and savings) are more
efficient than the state banks (commercial and savings). These findings confirm
findings of Isik and Hassan (2003) in Turkey and Sathye (2000) in India.
Havrylchyk and Scharrnstra (2004) suggested interpreting the coefficient of state
banks with caution and argued that the data used for the estimation of efficiency in
state banks may be distorted by non-compliance with accounting regulations. This
argument may not be valid to banks in Sri Lanka, since it is mandatary for all banks
to apply the Sri Lankan Accounting Standard—regardless of ownership.
The input and output specification used in the assessment of TE(A) included loans,
advances and other earning assets as outputs. Other earning assets include the
investments made in government securities. The investments in government
securities are allowed to be deducted from deposits which are required to be
maintained in the CBSL as the statutory reserve requirement (SRR). Deposits
maintained in the CBSL as the SRR are not considered as income generating assets
and not included as liquid assets. Since state-owned banks have invested a
considerable portion of their total assets in government securities, they need to
maintain a smaller proportion of assets in the CBSL as SRR relative to the privately-
owned banks. Thus, the recorded relationship may have been influenced by the
regulation relating to the SRR.
Old banks: Previous studies have predicted that relatively greater experience in the
market helps the old banks to perform better than the new banks which have
relatively little experience (Isik and Hassan, 2003). Mester (1996) highlighted that
new banks incur relatively higher start-up costs required to build customer
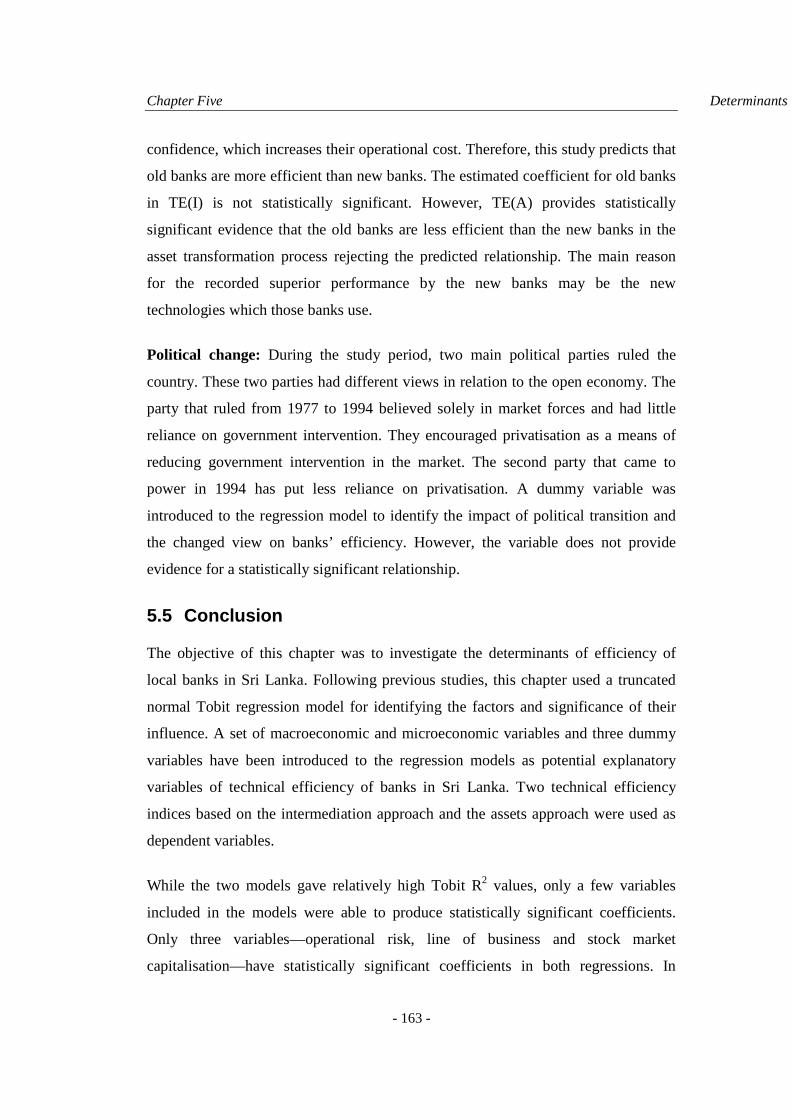
Chapter Five Determinants of efficiency of banks in Sri Lanka
- 163 -
confidence, which increases their operational cost. Therefore, this study predicts that
old banks are more efficient than new banks. The estimated coefficient for old banks
in TE(I) is not statistically significant. However, TE(A) provides statistically
significant evidence that the old banks are less efficient than the new banks in the
asset transformation process rejecting the predicted relationship. The main reason
for the recorded superior performance by the new banks may be the new
technologies which those banks use.
Political change: During the study period, two main political parties ruled the
country. These two parties had different views in relation to the open economy. The
party that ruled from 1977 to 1994 believed solely in market forces and had little
reliance on government intervention. They encouraged privatisation as a means of
reducing government intervention in the market. The second party that came to
power in 1994 has put less reliance on privatisation. A dummy variable was
introduced to the regression model to identify the impact of political transition and
the changed view on banks’ efficiency. However, the variable does not provide
evidence for a statistically significant relationship.
5.5 Conclusion
The objective of this chapter was to investigate the determinants of efficiency of
local banks in Sri Lanka. Following previous studies, this chapter used a truncated
normal Tobit regression model for identifying the factors and significance of their
influence. A set of macroeconomic and microeconomic variables and three dummy
variables have been introduced to the regression models as potential explanatory
variables of technical efficiency of banks in Sri Lanka. Two technical efficiency
indices based on the intermediation approach and the assets approach were used as
dependent variables.
While the two models gave relatively high Tobit R2 values, only a few variables
included in the models were able to produce statistically significant coefficients.
Only three variables—operational risk, line of business and stock market
capitalisation—have statistically significant coefficients in both regressions. In
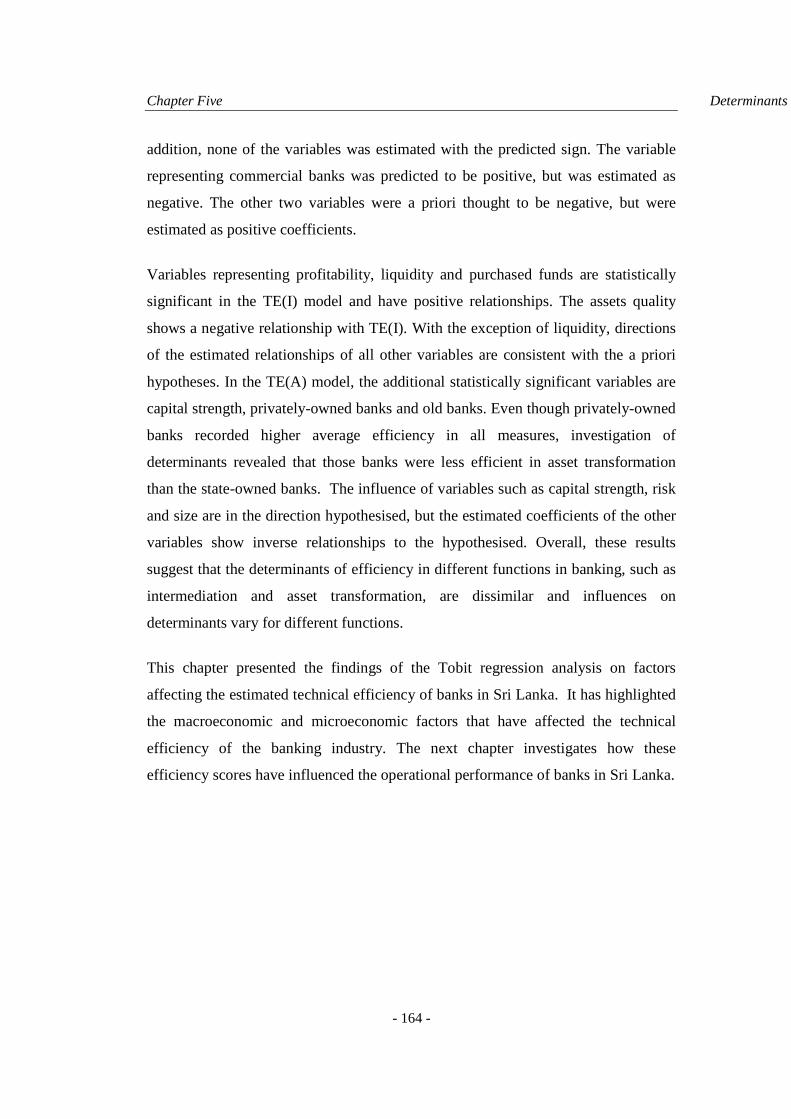
Chapter Five Determinants of efficiency of banks in Sri Lanka
- 164 -
addition, none of the variables was estimated with the predicted sign. The variable
representing commercial banks was predicted to be positive, but was estimated as
negative. The other two variables were a priori thought to be negative, but were
estimated as positive coefficients.
Variables representing profitability, liquidity and purchased funds are statistically
significant in the TE(I) model and have positive relationships. The assets quality
shows a negative relationship with TE(I). With the exception of liquidity, directions
of the estimated relationships of all other variables are consistent with the a priori
hypotheses. In the TE(A) model, the additional statistically significant variables are
capital strength, privately-owned banks and old banks. Even though privately-owned
banks recorded higher average efficiency in all measures, investigation of
determinants revealed that those banks were less efficient in asset transformation
than the state-owned banks. The influence of variables such as capital strength, risk
and size are in the direction hypothesised, but the estimated coefficients of the other
variables show inverse relationships to the hypothesised. Overall, these results
suggest that the determinants of efficiency in different functions in banking, such as
intermediation and asset transformation, are dissimilar and influences on
determinants vary for different functions.
This chapter presented the findings of the Tobit regression analysis on factors
affecting the estimated technical efficiency of banks in Sri Lanka. It has highlighted
the macroeconomic and microeconomic factors that have affected the technical
efficiency of the banking industry. The next chapter investigates how these
efficiency scores have influenced the operational performance of banks in Sri Lanka.

Chapter Six Market structure, efficiency and performance
- 165 -
CHAPTER SIX
MARKET STRUCTURE, EFFICIENCY AND
PERFORMANCE
6.1 Introduction
The deregulation of the financial services sector, development in management
information systems (MIS) supported by information and communication
technology (ICT), and globalisation have changed the structure, size and scope of
the banking industry in Sri Lanka. The emergence of new banks (both local and
foreign), the expansion of branch networks, the integration of business services and
the expansion of the activities of other forms of financial services institutions have
changed the market structure of the banking industry. Such changes in the banking
industry may have impacted on both the degree of competition and the operational
efficiency of banks.
Research on banking and financial institutions has identified three strategies that
may help to create healthy competition in a larger and more liberal market (Lloyd-
Williams, Molyneux and Thornton, 1994). The first strategy is to encourage mergers
among banks to increase bank size in order to pursue economies of scale.
Accordingly, three factors may stimulate mergers: (1) creating large banks with
market dominance; (2) deterring potential hostile acquisitions and takeovers;
and (3) making the banking market more efficient. The second strategy involves
sharing common resources/facilities such as ATMs and branch networks with other
banks in the industry. The third strategy seeks to enhance the productivity and

Chapter Six Market structure, efficiency and performance
- 166 -
efficiency of institutions in the industry. The strategy that is most appropriate to the
banking industry is an empirical question that requires the attention of policy
makers. Thus, Proposition III suggests that “improvements in efficiency have influenced
the banks’ operational performance than changes in the structure of the market”. This
chapter empirically investigates Proposition III to determine the appropriateness of
the strategies described above for the banking industry in Sri Lanka, using the
framework developed by Berger and Hannan (1993).
This chapter consists of five sections, commencing with this introduction. The next
section presents a brief review of literature related to market structure and bank
efficiency, with particular reference to the banking industry. The third details the
empirical framework used in this chapter. The penultimate section presents the
outcomes and implications of the analysis. The final chapter presents the conclusions
of the analysis.
6.2 Market Behaviour
In the literature, both structural and non-structural approaches have been used to
investigate the behaviour of the banking industry. Structural approaches are mainly
based on traditional industrial organisation theory, which focuses on the efficient
structure (EFS) hypothesis and the SCP hypothesis (Figure 6.1 illustrates basic
elements of the theory behind structural approaches). Research based on structural
approaches assumes that market concentration weakens market competition by
fostering collusive behaviour among firms. Conversely, non-structural approaches
assume that factors other than market structure and concentration may affect
competitive behaviour, such as barriers to entry/exit and the general contestability of
the market (Panzar and Rosse, 1987; Rosse and Panzar, 1977). Non-structural
approaches have been developed in the context of the new empirical industrial
organisation (NEIO) literature.

Chapter Six Market structure, efficiency and performance
- 167 -
[ An extension of Worthington, Briton & Rees (2004, p. 211)]
Figure 6. 1. The structure-conduct-performance theory
6.2.1 EFS hypothesis vs SCP hypothesis
The EFS hypothesis states that the aggressive behaviour of efficient firms in the
market leads to an increase in those firms’ size and market share. This behaviour
allows efficient firms to concentrate on earning higher profits while further
enhancing their market shares. Those firms can maximise profits either by
maintaining the present level of price and firm size, or by reducing price and
expanding the firm size (Lloyd-Williams, Molyneux and Thornton, 1994). Berger
and Hannan (1989) stated that firms in markets with a large dispersion of efficiency
within the market create an unequal market share and a high level of concentration.
Accordingly, the EFS hypothesis states that the positive relationship between profit
and concentration results in lower cost achieved through superior operational
management and an efficient production process (Goldberg and Rai, 1996). Thus,
proponents of the EFS hypothesis argue that differences in efficiencies among
DMUs within markets create high levels of concentration. The high concentration
ratio in the market creates greater than average efficiency in these markets, yielding
a positive profit concentration relationship (Berger and Hannan, 1989).
STRUCTURE CONDUCT PERFORMANCE
Environment determines competitive relations
Firm operational behaviour
Outcome of the firm’s operations
• Nature of the product • Cost conditions • Economics of scale • No. firms in the market • Buyers • Entry and exit norms • Demand conditions
• Pricing policy • Marketing & advertising • Financing policy • Degree of competition • Output decisions • R&D • Growth and merger
• Productive efficiency • Profitability • Size and growth of the
firm • Innovations of product
and technology

Chapter Six Market structure, efficiency and performance
- 168 -
As mentioned previously, deregulation and MIS, including ICT and globalisation,
have changed the nature of competition in the banking industry. The improved level
of competition has forced banks to be more efficient. As explained in the EFS
hypothesis, there is no need to encourage mergers in the banking industry, since
efficient banks can improve their market share by providing more cost-effective
banking services and weak banks will either exit the industry or face an acquisition
or merger. Therefore, the EFS hypothesis suggests that public policy makers should
focus on the identification and implementation of strategies leading to enhancing
productivity and efficiency.
On the other hand, the SCP hypothesis simply states that the more a bank grows, the
more efficient it becomes. The SCP hypothesis propounds that concentration is a
source of greater profitability, rather than the consequence of more efficient firms
increasing their share of the market (Berger et al., 2004). According to the SCP
hypothesis, market concentration fosters collusion among large firms in the industry,
which subsequently leads to higher profits. Hence, the SCP hypothesis suggests that
changes in market concentration may have a positive influence on a firm’s financial
performance (Goldberg and Rai, 1996). Furthermore, the SCP hypothesis recognises
the consequent positive relationship between market concentration and performance
as a result of the anti-competitive behaviour of firms with a large market share
(Berger and Hannan, 1989).
The Relative Market Power (RMP) hypothesis, which is a special case of the SCP
hypothesis, proposes that only firms with large market shares and a range of
differentiated product lines are able to exercise market power to gain superior profits
over non-competitive price-setting behaviour (Berger, 1995). The basic argument
underlined by the SCP hypothesis supports the collusive power of the market and
encourages the strategies that enhance market concentration. Consequently, if SCP
holds in the banking industry, such strategies can be promoted.
The EFS and SCP hypotheses diverge on the basis that the causality of market
concentration and performance is viewed differently. According to the SCP

Chapter Six Market structure, efficiency and performance
- 169 -
hypothesis, market concentration is exogenous; however, according to the EFS
hypothesis, it is endogenous and dependent on bank efficiency. This means that each
hypothesis provides a contrasting view for policy makers. According to the SCP
hypothesis, anti-trust legislation would be socially beneficial. However, if the EFS
predominates, such policies that penalize or impair mergers would be socially costly.
As explained by Berger and Hannan (1989), the EFS and SCP hypotheses offer
similar observations about the relationship between concentration and performance
(profitability). The difference between these two theories mainly centres on ways of
interpreting the relationship. Some studies have challenged the acceptability of the
positive relationship predicted between market concentration and profitability of
SCP. Smirlock (1985) pointed out that there is no relationship between concentration
and profitability, but between profitability and market share. He found strong
evidence to support the relationship between market shares (which were used as
proxies for firms’ efficiency) and profitability, and showed that market
concentration is not a sign of collusive behaviour but the superior efficiency of
leading firms.
Berger and Hannan (1994) pointed out four sources of anti-competitive behaviour
that may have arisen as a consequence of high market concentration, namely:
1. A dominant firm in a market, able to set the prices in excess of competitive
levels, may have lower pressure on managers to maintain operating costs at
or near their competitive level;
2. Managers’ self-interested behaviour may lead to riskier financing decisions
(which may be detrimental to the shareholders’ expectations) to reduce
variation in earnings to protect their positions;
3. Increase in the political cost associated with obtaining and maintaining
existing market power; and
4. The retention of inefficient managers or the maintenance of inefficient
practices that allow managers to live a ‘quiet life’ to pursue other objectives
or maintain market power gains.

Chapter Six Market structure, efficiency and performance
- 170 -
Berger & Hannan’s (1994) study has presented an alternative to the EFS and SCP,
called the ‘quiet life’ hypothesis. It assumes that the managers of firms with
relatively large market shares may not attempt to improve the efficiency of the use
of resources since they can make adequate profits using their price-setting power
(Punt and Rooij, 1999). This hypothesis predicts that large firms in the market use
their market power to be ‘quiet’ in the market and earn profits without improving
efficiency.
Early EFS studies used market shares as a proxy for a firm’s efficiency instead of
direct efficiency measures (Molyneux and Forbes, 1995). However, the firm’s
market share did not represent the overall productivity and efficiency level of the
firm. The first application of direct efficiency measures by Berger and Hannan
(1995) captured the impact of all factors affecting a firm’s performance.
6.2.2 Measures of market concentration
Variables such as the buyer and seller cost relationship, the degree of product
differentiation, market concentration, market share and entry conditions have been
used in previous studies to represent market structure (Ashton, 1999). However, the
majority of SCP studies have used a concentration ratio to represent market
structure. Previous empirical analyses have applied two methods for estimating
market concentration:
1. ‘k’ bank concentration ratio (CR k); CRk takes the total market share of the
kth largest bank in the market (‘k’ denotes the number of banks considered in
measuring the concentration ratio). Accordingly, this ratio ignores relatively
small banks in the market and uses only a select number of firms in that
market (Bikker and Haaf, 2002). CRk indicates the percentage of a market or
an industry accounted for by dominating firms only (Worthington, Briton
and Rees, 2004). This ratio can be estimated in different ways, such as the
percentage of employment, percentage of production and percentage of sales.

Chapter Six Market structure, efficiency and performance
- 171 -
1. Herfindahl-Hirshman Index (HHI) 1; HHI defines concentration as
aggregates of weighted market shares of individual firms in the market, and
stresses the importance of larger banks by assigning them a greater weight
than smaller banks. It counts all banks and weights them according to their
market share and thereby avoids an arbitrary cut-off level (Bikker and Haaf,
2002).
The literature identifies two major criticisms of the use of concentration ratios to
proxy market structure (Hannan, 1997). First, the concentration ratio is dependent on
the size and number of firms in the market. Second, it ignores the influence of
non-bank financial institutions in the context of banking concentration.
Nevertheless, concentration indices such as HHI use weighted averages of market
shares, which account for both the size distribution and the number of banks.
Therefore, this ratio has often been used as a simple proxy of the market structure in
previous research.
6.2.3 Previous applications
The theoretical basis of market structure and performance emerged more than 50
years ago. However, most of the empirical studies that used this theory were limited
to a few developed countries in North America and Europe. Gilbert (1984)
summarised 44 such studies, which were based on the US banking industry. Whilst
they are important for understanding the theory behind the market structure, they
have less empirical validity in relation to developing countries because there are
significant differences between the banking industries in developing countries and in
developed countries.
Previous empirical studies have used either price information (Berger and Hannan,
1989) or profitability information to proxy firm performance (Molyneux and Forbes,
1995). In a multi-product environment, the use of a single measure of price to
1
2
1∑
=
=N
i
i
V
vHHI , N = number of firms, vi = market share of ith firm, V =total market share

Chapter Six Market structure, efficiency and performance
- 172 -
represent a firm’s overall performance is not appropriate in the context of banking.
Conversely, profitability measures can be introduced as a comprehensive
performance indicator since they integrate both cost and revenue into one measure.
In some studies, increased market concentration was found to be associated with
higher prices and greater than usual profits. Smirlock (1985) found that higher
profits in concentrated markets could be the result of greater operational efficiency.
Berger (1995) found some evidence that the efficiency hypothesis holds true in US
banking.
A positive relationship between bank concentration and return on equity (ROE) was
found by Short (1979) in a study based on a sample of banks from Canada, Western
Europe and Japan. Moore (1998) examined the impact of advanced communication
technology on the ability of banks to serve distant customers. Advanced technology
helped bank managers to serve distant customers using alternative banking methods
such as tele-banking and Internet banking. Moore examined the changes in the
relationship between the concentration ratio and profitability using both univariate
and multivariate regressions, and found that even though the technology had
changed, bank concentration had positively affected performance. Molyneux and
Forbes (1995) found evidence to support the traditional SCP in European banking.
Lloyd-Williams, Molyneux and Thornton (1994) examined the applicability of the
SCP and efficient market paradigm to analyse the Spanish banking structure using
the concentration ratio and market share of an individual firm to represent its
efficiency. The result indicated a positive relation between the concentration and the
return on assets (ROA) which was used to proxy for performance, thus supporting
the applicability of the SCP hypothesis to the Spanish banking industry.
Several empirical studies have employed different methodologies to test the SPC
hypotheses. Thus, differences in variables used and hypotheses tested have made
comparisons difficult. Berger and Hannan’s (1993) research framework provided a
comprehensive methodology for testing potential relationships between market
structure and performance under both SCP and efficient market hypotheses. They
proposed to test four hypotheses, namely, the traditional SCP hypothesis, the RMP
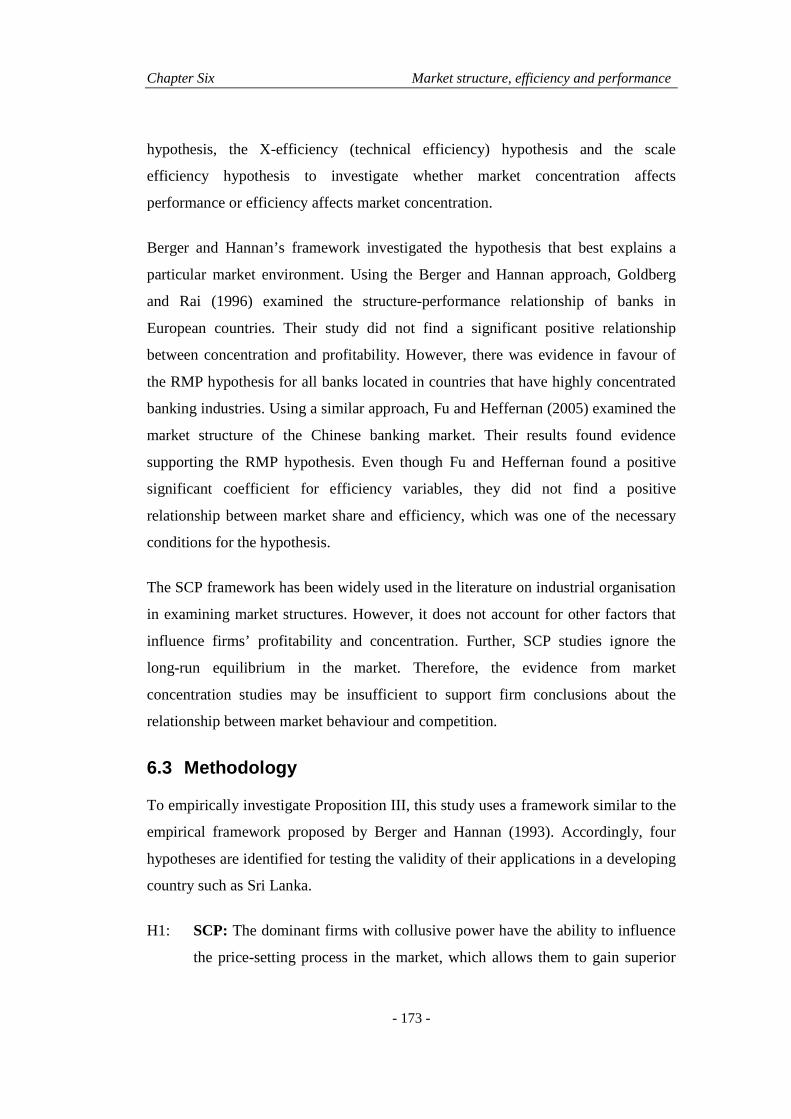
Chapter Six Market structure, efficiency and performance
- 173 -
hypothesis, the X-efficiency (technical efficiency) hypothesis and the scale
efficiency hypothesis to investigate whether market concentration affects
performance or efficiency affects market concentration.
Berger and Hannan’s framework investigated the hypothesis that best explains a
particular market environment. Using the Berger and Hannan approach, Goldberg
and Rai (1996) examined the structure-performance relationship of banks in
European countries. Their study did not find a significant positive relationship
between concentration and profitability. However, there was evidence in favour of
the RMP hypothesis for all banks located in countries that have highly concentrated
banking industries. Using a similar approach, Fu and Heffernan (2005) examined the
market structure of the Chinese banking market. Their results found evidence
supporting the RMP hypothesis. Even though Fu and Heffernan found a positive
significant coefficient for efficiency variables, they did not find a positive
relationship between market share and efficiency, which was one of the necessary
conditions for the hypothesis.
The SCP framework has been widely used in the literature on industrial organisation
in examining market structures. However, it does not account for other factors that
influence firms’ profitability and concentration. Further, SCP studies ignore the
long-run equilibrium in the market. Therefore, the evidence from market
concentration studies may be insufficient to support firm conclusions about the
relationship between market behaviour and competition.
6.3 Methodology
To empirically investigate Proposition III, this study uses a framework similar to the
empirical framework proposed by Berger and Hannan (1993). Accordingly, four
hypotheses are identified for testing the validity of their applications in a developing
country such as Sri Lanka.
H1: SCP: The dominant firms with collusive power have the ability to influence
the price-setting process in the market, which allows them to gain superior

Chapter Six Market structure, efficiency and performance
- 174 -
profit over the other firms. The SCP predicts a positive relationship between
market concentration and firm performance. This hypothesis uses a
concentration ratio to proxy the collusive market power of dominating firms.
H2: RMP: Firms with relatively bigger market shares and differentiated product
lines have a superior market power and use it to set market prices and
thereby earn an above-average profit. Therefore, market share and firm
performance may have a positive relationship.
H3: Technical efficiency (TE): Technically efficient firms with superior
management and/or business processes are able to operate at a lower cost and
subsequently gain a high profit and market share. The high technical
efficiency allows respective firms to achieve a higher market share at the
expense of less efficient firms. Therefore, profitability is expected to have a
positive relationship with variables such as technical efficiency, market share
and concentration.
H4: Scale efficiency (SE): The differences in performance among firms are not
due to variations in management styles and business processes but because of
the difference in levels of economies of scale. Thus, SE predicts that firms
that are operating under an optimum scale produce goods and services at
relatively lower cost and are able to make a high profit, which leads to a high
market share.
The SCP and RMP hypotheses test the influence of two market structure variables
on firms’ performance. In particular, the SCP hypothesis examines how collusive
behaviour affects firm performance. The RMP hypothesis examines how individual
firms’ market power affects their performance. To accept either of these hypotheses,
the estimated coefficient for respective variables (concentration and market power)
should be positive and significantly different from zero.
The TE and SE hypotheses examine the validity of the efficient-structure paradigm.
The proponents of the EFS hypothesis argue that both superior performance and
high market share result in the operational efficiency of individual decision-making
units in the market. Accordingly, efficiency variables are incorporated as
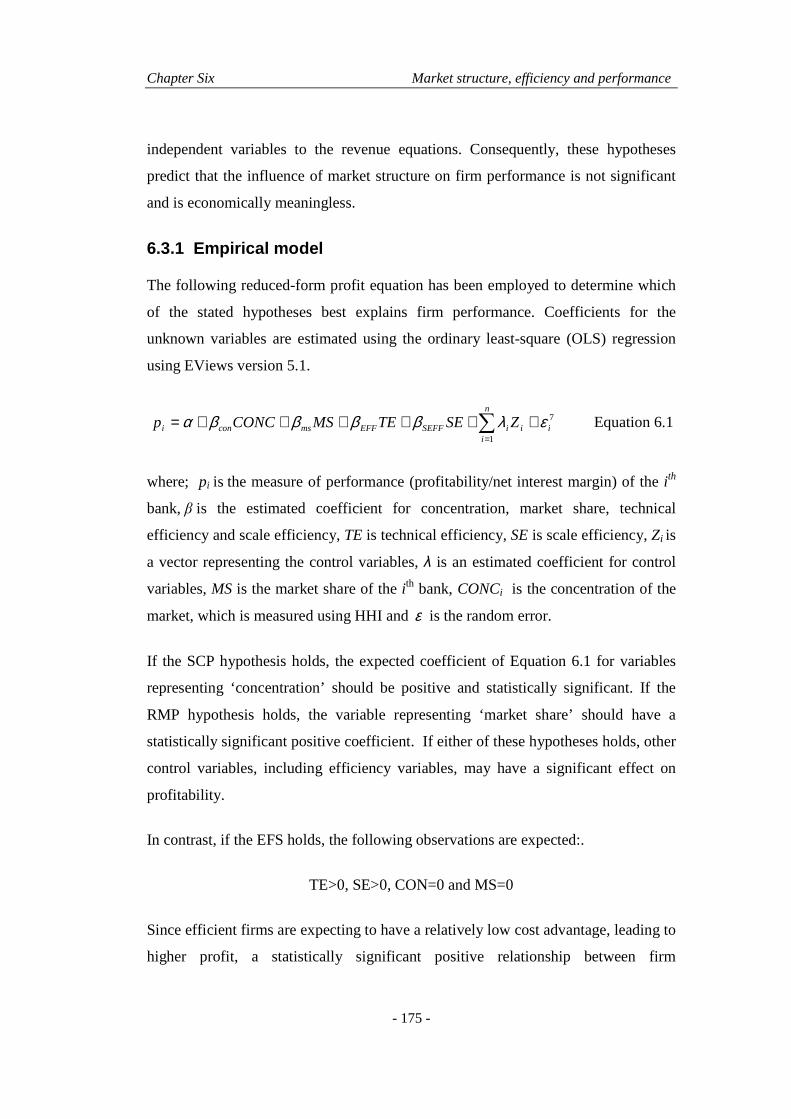
Chapter Six Market structure, efficiency and performance
- 175 -
independent variables to the revenue equations. Consequently, these hypotheses
predict that the influence of market structure on firm performance is not significant
and is economically meaningless.
6.3.1 Empirical model
The following reduced-form profit equation has been employed to determine which
of the stated hypotheses best explains firm performance. Coefficients for the
unknown variables are estimated using the ordinary least-square (OLS) regression
using EViews version 5.1.
7
1i
n
iiiSEFFEFFmsconi ZSETEMSCONCp ελββββα ++++++= ∑
=
Equation 6.1
where; pi is the measure of performance (profitability/net interest margin) of the ith
bank, β is the estimated coefficient for concentration, market share, technical
efficiency and scale efficiency, TE is technical efficiency, SE is scale efficiency, Zi is
a vector representing the control variables, λ is an estimated coefficient for control
variables, MS is the market share of the ith bank, CONCi is the concentration of the
market, which is measured using HHI and ε is the random error.
If the SCP hypothesis holds, the expected coefficient of Equation 6.1 for variables
representing ‘concentration’ should be positive and statistically significant. If the
RMP hypothesis holds, the variable representing ‘market share’ should have a
statistically significant positive coefficient. If either of these hypotheses holds, other
control variables, including efficiency variables, may have a significant effect on
profitability.
In contrast, if the EFS holds, the following observations are expected:.
TE>0, SE>0, CON=0 and MS=0
Since efficient firms are expecting to have a relatively low cost advantage, leading to
higher profit, a statistically significant positive relationship between firm

Chapter Six Market structure, efficiency and performance
- 176 -
performance and efficiency is expected. A necessary condition to hold the EFS
hypothesis is that there should be a positive relationship between efficiency and
market structure. Hence, the following models are specified (these two equations use
the same variables as in Equation 6.1).
2
1i
n
iiiSEFFEFFi ZSETEMS ελββα ++++= ∑
=
Equation 6.2
3
1i
n
iiiSEFFEFFi ZSETECON ελββα ++++= ∑
=
Equation 6.3
If the above models are able to generate statistically positive coefficients for TE and
SE variables, a sufficient condition for the relationship between the efficiency and
the market structure is met.
6.3.2 Selection of variables
Different measures of performance have been used in the previous empirical
literature. For instance, both profitability indicators and price indicators have been
applied to proxy bank performance (Gilbert, 1984). Following Goldberg and Rai
(1996), Smirlock (1985) and Yu and Neus (2005), this study uses profitability and
net interest margin (NIM) as proxies for banks’ performance.
Previous studies have mainly used two measures, namely return on assets (i.e. the
ROA) (Goldberg and Rai, 1996; Yu and Neus, 2005) and the return on equity (i.e.
the ROE) (Smirlock, 1985; Yu and Neus, 2005) to represent the profitability of
banks. In principle, ROA reflects the ability of a bank’s management to generate
profits from assets, although it may be biased due to off balance sheet transactions.
ROE indicates the return to shareholders on their equity and equals ROA times the
total assets to equity ratio or the equity multiplier, which measures financial
leverage. Banks with lower leverage (higher equity) report higher ROA, but lower
ROE. Since an analysis of ROE disregards the greater risks associated with high
financial leverage often determined by regulation, ROA emerges as the key ratio for

Chapter Six Market structure, efficiency and performance
- 177 -
the evaluation of bank profitability (Sundararajan et al., 2002). Thus, this study
applies ROA as an appropriate measure of banks’ profitability.
This study also uses NIM as a proxy for banks’ performance. NIM also can be
regarded as a direct measure of performance that shows the residual interest income
generated on efficient management decision making (Goldberg & Rai 1996). The
NIM was estimated by dividing the net interest income (the difference between total
interest income and interest expenses) by total assets.
Equations 6.1, 6.2 and 6.3 incorporate three sets of explanatory variables. The first
set constitutes proxies for market concentration and market power, which are used to
examine the influence of market structure on banks’ performance. The second set is
used to represent efficiency variables and the third set of variables is specified to
control the influence of variables other than market structure and efficiency.
Banks are regarded as multi-product firms that use multiple inputs. As stated in
Chapter Three, the literature provides no consensus as to which input generates
which outputs. Consequently, finding a single variable to represent the banking
market is a difficult task. Total deposits held (Goldberg and Rai, 1996; Smirlock,
1985), total loans granted and total assets held are some of the variables that can be
used as proxies for market capacity. This study identifies total assets held by all
banks in the industry to represent the size of the banking market. This is appropriate
given that the total assets represent the combined outcome of all banking activities
and off balance sheet transactions which are still evolving in the banking sector in
Sri Lanka. Accordingly, this study uses percentages of the total assets held by
individual banks to measure market power and aggregates of weighted market shares
of individual banks in the market (HHI) to measure market concentration.
Following Berger and Hannan (1993), this study applies direct efficiency measures,
which are estimated in Chapter Four, to proxy TE (X-efficiency) and SE. The study
measures the efficiency of Sri Lankan banks, focusing on two major functions of
banks, namely, the intermediation function and asset transformation function. Since

Chapter Six Market structure, efficiency and performance
- 178 -
the intermediation function is more closely related to the market of the banking
industry, this analysis is limited to the intermediation role. Therefore, the estimated
technical and scale efficiency scores based on input and output variables with the
intermediation approach are used to proxy TE and SE in the analysis in this chapter.
In addition to the variables described above, a set of variables is included to capture
the impact of firm-specific and macroeconomic variables on banks’ profit. Capital
strength has been incorporated to represent a bank’s capacity for diversification.
Since a high capital ratio increases a bank’s credit-worthiness, it may provide more
strength to the bank’s management to diversify its assets portfolio. Thus, the study
predicts a positive relationship with the bank’s performance. Since investment in
liquid assets reduces banks’ productive assets, a negative relationship between the
liquidity ratio and performance is expected. To control the risk-taking behaviour of
profit-seeking banks, the loan to total assets ratio is included. Since a high loan to
assets ratio acts to increase the cost of monitoring and other loans administration
costs, a negative relationship between performance and loans to assets ratio is
expected. The product quality variable (which measures the extent of the effect of
problem loans on the total loan portfolio) is included for controlling the impact of
well-managed loan portfolios. The ownership structure of banks may also limit the
decision-making capabilities of banking institutions, especially in state-owned banks
(Goldberg and Rai, 1996; Molyneux, 1999). Most previous studies have shown that
privately owned banks have relatively more freedom to set firms’ operational
policies and procedures and have expected a positive relationship with banks’
operational performance. Further, two variables, commercial banks and old banks,
are included to control the influence of the major business focus and the relative
experience in the market. GDP growth and inflation have been incorporated as
macroeconomic variables. Since GDP growth and inflation affect numerous factors
related to the demand and supply of deposit and loan products, this study predicts
positive relationships with the ROA and NIM.

Chapter Six Market structure, efficiency and performance
- 179 -
6.3.3 Data
The third phase of the study relied on two sources of data, as in the case of the
second phase. Information regarding all variables, except firm efficiency, was
gathered from an unbalanced panel data set spread over a sixteen-year
cross-sectional time period from published financial statements of local commercial
banks. Three-year moving averages of all data related to variables are estimated to
be in line with the estimated efficiency scores with the three-year moving windows
used previously.
6.4 Results and Discussion
Tables 6.1 and 6.2 summarise the descriptive data and Pearson correlation
coefficients of test data, respectively. The standard deviation shows the small
statistical dispersion in data used for estimating equations. This confirmed that there
are no outliers that may affect the estimation of coefficients using OLS. Further, the
estimated correlation coefficients showed very little correlation among variables
included in the model, except in three cases: SE(I) and TE(I); ownership and market
power; and operational risk and commercial banks. As explained by Gujarati (2003),
in a regression that has high R2 values with individually significant regression
coefficients for the explanatory variables, such relationships may not pose any
serious multicolinearity problems. However, the study has performed two alternative
regressions to test the robustness of original regression results. Since the outcome of
the alternative regression related to NIM is not different from the original results,
that result is recorded as an appendix. Additionally, since original regression results
based on ROA differ from complementary regression results, these results are
presented in Table 6.3 with other results.

Chapter Six Market structure, efficiency and performance
- 180 -
Table 6.1 Variables and their definitions Variable Definition Mean
Profitability (ROA) Return on total assets (ROA) 0.008
[0.008]
NIM Net interest margin to total assets 0.037
[0.011]
Market power (MP) Total assets share in the market 0.112
[0.104] Concentration ratio (HHI)
HHI (Total assets) 0.202
[0.030]
SE(I) BCC DEA estimated scores in first phase
0.945 [0.079]
TE(I) CCR DEA estimated scores in first phase
0.931 [0.090]
Risk Loan and advances to total assets 0.544
[0.176]
Capital strength Total equity capital to total assets 0.069
[0.073]
Assets quality Total problem loan provision to total loan portfolio
0.045 [0.041]
Liquidity Total liquid assets to total assets 0.544
[0.176]
Inflation Change in Colombo consumer price index
0.101 [0.023]
GDP growth National accounts 0.046
[0.011]
Privately-owned banks Dummy; equals 1, if the bank is a privately-owned bank
Old banks Dummy; equals 1, if the bank is incorporated and commenced business before 1977
Commercial banks Dummy; equals 1, if the bank is a commercial bank
[Standard deviations are within parentheses]
.

Chapter Six Market structure, efficiency and performance
- 181 -
Table 6.2: Pearson correlation coefficient
NIM ROA MP HHI SE(I) TE(I) Risk Capital
strength
Assets
quality
Liquidity Inflation GDP
Growth
Private Old
ROA -0.081
MP -0.137 -0.060
HHI 0.005 0.274 0.234
SE(I) -0.067 0.356 -0.468 0.112
TE(I) -0.132 0.438 -0.383 0.161 0.972
Risk 0.311 0.168 -0.351 -0.077 -0.036 -0.068
Capital strength -0.102 0.389 -0.417 -0.065 0.267 0.269 0.182
Assets quality 0.146 -0.197 0.690 0.051 -0.550 -0.544 0.184 -0.330
Liquidity 0.291 0.247 -0.344 0.465 0.145 0.119 0.369 0.279 -0.104
Inflation -0.077 0.279 0.158 0.639 0.129 0.158 -0.064 -0.062 0.062 0.361
GDPG -0.029 0.332 0.131 0.574 0.020 0.040 -0.089 0.039 0.006 0.300 0.226
Privately-owned 0.140 0.229 -0.884 -0.153 0.413 0.354 0.613 0.395 -0.539 0.455 -0.104 -0.085
Old -0.233 0.093 0.712 0.251 -0.244 -0.148 -0.305 -0.308 0.339 -0.208 0.164 0.135 -0.631
Commercial 0.447 0.174 -0.039 0.063 -0.195 -0.230 0.825 0.067 0.438 0.533 0.053 0.038 0.336 -0.123

Chapter Six Market structure, efficiency and performance
- 182 -
Table 6.3 presents the regression results related to Equations 6.1, 6.2 and 6.3. Four
separate OLS regressions are performed on Equation 6.1 by incorporating ROA and
NIM as dependent variables. All equations seemed consistent with a priori
expectations and fit the panel data set reasonably well. All the regressions show
reasonable ‘adjusted R2’ values and significant ‘F’ statistics. With the exception of
the equation with ROA as the dependent variable, the normality test performed using
the Jarque-Berra test is not able to provide satisfactory evidence to support the claim
that residuals are normally distributed.
The second column of Table 6.3 presents the regression results based on ROA. The
variable representing market power (MP) shows a positive relationship with ROA
and a negative relationship with NIM, but recorded relationships in both regressions
are not statistically significant. Similarly, the concentration variable (HHI) also
indicates an opposing relationship with no apparent significance. These findings
reject the SCP and the RMP hypotheses in relation to the Sri Lankan banking
industry. Accordingly, this result indicates that the collusive power of large banks
and high market power enjoyed by individual banks have not improved the
operational performance of the banks.
Further, the estimated coefficient for TE(I) shows a statistically significant positive
relationship with ROA, supporting the EFS, which predicts that the more technically
efficient firms are able to maintain superior operational performance than the less
technically efficient banks. However, the variable SE has showed a statistically
significant inverse relationship with the ROA, suggesting that the scale of operation
is not a pre-condition for superior profit.
The estimated coefficients for Equation 6.1, which is based on NIM, are not able to
provide evidence to support either the SCP hypothesis or the EFS hypothesis.
Furthermore, the recorded statistically significant negative relationship between
NIM and MP is not in line with the predicted relationship. Thus, the RMP
hypothesis is rejected.

Chapter Six Market structure, efficiency and performance
- 183 -
Table 6.3: Regression results
Explanatory variables
ROA (Equation 6.1)
NIM (Equation 6.1)
Market power (Equation 6.2)
Concentration (Equation 6.3)
ROA12 (Equation 6.1)
ROA23 (Equation 6.1)
MP 0.025
[1.45] -0.082***
[-2.70] 0.031**
[2.27] 0.043***
[3.29]
HHI -0.031
[-0.91] 0.077
[1.26] -0.072**
[-2.15] -0.069**
[-2.01]
SE(I) -0.099***
[-3.06] 0.024
[0.42] -0.845***
[-5.05] -0.080
[-0.96] -0.080**
[-2.47]
TE(I) 0.116***
[4.04] -0.019
[-0.37] 0.751***
[5.07] 0.112
[1.52] 0.103***
[3.58] 0.034***
[4.76]
Risk -0.008
[-1.01] -0.013
[-0.87] -0.130***
[-2.99] 0.063***
[2.89] 0.018***
[4.30] 0.020***
[4.91]
Capital strength 0.035***
[4.59] -0.033**
[-2.40] -0.040
[-0.95] -0.043**
[-2.03] 0.031***
[4.00] 0.034***
[4.33]
Assets quality -0.041*
[-1.56] -0.043
[-0.91] 0.511***
[3.62] -0.056
[-0.80] -0.056**
[-2.18] -0.075***
[-3.00]
Liquidity -0.024**
[-2.02] -0.001
[-0.07] -0.219***
[-3.99] 0.150***
[5.48] 0.004
[0.52] 0.004
[0.47]
Inflation 0.089***
[3.15] -0.149
[-1.51] 0.288**
[2.02] 0.398***
[5.62] 0.086***
[2.91] 0.085***
[2.82]
GDPG 0.223***
[4.04] -0.055
[-1.09] 0.553**
[2.03] 0.847***
[6.27] 0.241***
[4.21] 0.235***
[4.01]
Ownership 0.007*
[1.93] -0.020***
[-3.23] -0.111***
[-6.67] -0.027***
[-3.20]
Old banks 0.002
[1.44] -0.004
[-1.49] 0.036***
[4.66] 0.002
[0.40] 0.001
[0.77] 0.002
[1.02]
Commercial banks 0.011***
[2.77] 0.029***
[3.94] 0.103***
[5.10] -0.023**
[-2.33]
Constant -0.029***
[-3.20] 0.040**
[2.49] 0.209***
[4.42] 0.074***
[3.14] -0.031***
[-3.32] -0.045***
[-6.09] R2 Adjusted R2 F-statistic Jarque-Bera
0.609 0.563
13.305 3.036
0.397 0.327 5.625
565.756
0.923 0.916
123.810 118.701
0.711 0.683
25.327 20.799
0.564 0.522
13.305 4.766
0.541 0.500
13.421 4.377
[‘t’ values are in parentheses, ‘***’ indicates significant coefficients under 1% confidence level, ‘**’ indicates significant coefficients under 5% confidence level and ‘*’ indicates significant coefficients under 10% confidence level]
2 ROA1 excludes explanatory variables which are not considered as structural variables (such as commercial banks and privately-owned banks) and have
demonstrated higher correlation coefficients (more than 0.800) with other explanatory variables. 3 ROA2 excludes all explanatory variables which have demonstrated higher correlation coefficients (more than 0.800) with other explanatory variables.

Chapter Six Market structure, efficiency and performance
- 184 -
Column four and column five of Table 6.3 present the results recorded for Equations
6.2 and 6.3 respectively. Evidence found in these regressions confirms that the EFS
holds in the Sri Lankan banking industry. As mentioned previously, a necessary
condition for EFS to hold is that technical efficiency must be positively related to
market concentration and market power. Thus, the positive relationship of TE with
MP implies that efficient firms can gain a higher market share, which subsequently
leads to high concentration in the market. Further, the results confirm that
technically efficient firms can enjoy both higher profitability, as well as higher
market share, than less efficient banks.
Estimated coefficients for control variables provide mixed evidence. For instance, in
Equation 6.1, firm-specific variables such as capital strength and commercial banks
have shown significant relationships in both (ROA and NIM) regressions. Variables
such as risk and old banks do not provide significant evidence to support a
relationship with either ROA or NIM. Capital strength shows a statistically
significant positive relationship with ROA and a negative relationship with NIM.
The other firm-specific variables such as assets quality and liquidity have shown
negative relationships with ROA. These results indicate that high investment in
liquid assets, as well as high provision for problem loans resulting from low quality
loan portfolios, have a negative effect on banks’ profit, which is more aligned with
the theoretical expectations. Further, the variable representing ownership indicates
that the privately-owned banks earn relatively higher profits while charging lower
interest margins than state-owned banks. This result shows that privately-owned
banks are in a better position to manage operational costs and subsequently earn
higher profit than state banks. GDP growth and inflation have shown a similar
relationship with the ROA and the NIM. These results indicate that economic
growth, as well as inflation, may act to improve banks’ profit. On the other hand, the
regression based on NIM does not provide evidence to support the relationship with
GDP growth and inflation. Further, the estimated coefficients for commercial banks
in both regressions show that commercial banks have a higher ROA and NIM than
savings banks.

Chapter Six Market structure, efficiency and performance
- 185 -
The regression based on Equation 6.2 shows that market power is positively related
to TE(I), product quality, inflation, GDP growth, commercial banks and old banks
and negatively related to SE(I), operation risk, liquidity and ownership. Since
state-owned banks have a significant portion of banking assets in the country, it is
obvious that privately-owned banks have a negative relationship with MP. However,
the graphical analysis presented in Chapter Two revealed that privately-owned banks
were able to improve their stake in the banking market during the study period. The
regression results also indicate that not only improvements of technical efficiency,
but also degrading the product quality (which results in the high ratio of problem
loans), may act to increase a bank’s market share. However, the findings in Equation
6.1 show that the product quality has a negative influence (under 10% confidence
level) on the ROA of the banks by increasing the cost of bad loans.
The results of the regression based on the concentration ratio are presented in the
fifth column of Table 6.3. The results show that market concentration is positively
related to variables such as risk, liquidity, inflation and GDP growth and negatively
related to variables such as capital strength, privately-owned banks and commercial
banks.
The regression results, which exclude explanatory variables that recorded high
correlation coefficients with other explanatory variables, are presented in the last
two columns of Table 6.34. The results of the regression ROA1 (which excludes
non-structural explanatory variables) and ROA2 (which excludes all explanatory
variables with high correlation coefficients) show a statistically significant positive
coefficient for both variables which represent the MP and the TE(I). This finding is
different from the original regression results, which support the TE version of EFS.
Since the variable representing MP is statistically significant, both EFS (TE and SE)
hypotheses are rejected. Further, the coefficient recorded for the variable
representing MP supports the RMP hypothesis, which predicts that market share has
a positive effect on banks’ profit. Among the other control variables, variables
4 The results of the supplementary regressions which are based on NIM are not different to the original
regression results. Thus, those results are presented in Appendix 8.

Chapter Six Market structure, efficiency and performance
- 186 -
representing risk and liquidity have provided results different from the original
findings. Contrary to expectations, both regressions record statistically significant
negative coefficients for HHI and SE(I) and reject the SCH and SE hypotheses.
6.5 Conclusion
In summary, this chapter has examined the main structural and performance features
of the banking industry in Sri Lanka based on Proposition III. The study used four
hypotheses proposed by Berger and Hannan (1993) and two performance measures,
namely ROA (profitability) and NIM. Generally, empirical results are not consistent
with the SCP hypothesis. Confirming the major arguments raised by Molyneux
(1999) against the profit-concentration relationship, this study totally rejects the
existence of the traditional SCP hypothesis in the banking industry in Sri Lanka. The
study’s findings also reject Goldberg and Rai’s (1996) findings which showed a
significant profit-market power relationship. Empirical results confirmed Proposition
III that the efficient operation of banking firms is vital for higher operational
performance. Furthermore, these results indicate that banks can earn superior
performance only by improving their operational efficiency. However, the
supplementary regressions, which omit some variables with the original regression
equations, show that these results are more sensitive to the selection of variables.

Chapter Seven Conclusion and policy implications
- 187 -
CHAPTER SEVEN
CONCLUSION AND POLICY IMPLICATIONS
7.1 Introduction
This research examined trends in the efficiency and productivity of the banking
industry in Sri Lanka during a 16-year period from 1989 to 2004. It covered three
research issues, namely, whether efficiency and productivity of the banking industry
in Sri Lanka has improved after introducing financial reforms, what are the
determinants of Sri Lankan banks’ efficiency, and how does the market structure of
the banking industry and the banks’ efficiency influence the banks’ operational
performance (ROA and NIM). Through addressing these three research issues, this
study provides empirical evidence from the Sri Lankan banking industry to
supplement the existing body of knowledge in efficiency and productivity, market
structure and performance from a developing country perspective.
The study was presented in five main chapters, which followed the introductory
chapter (Chapter One). Chapters Two and Three presented two literature reviews on
financial services sector reforms in Sri Lanka and their influence on the banking
industry, and on concepts and measurements of efficiency and productivity and their
application in the banking industry. Chapter Four analysed efficiency and
productivity of the banking industry in Sri Lanka. Chapter Five investigated
determinants of technical efficiency of banks. Chapter Six investigated the influence
of market structure and efficiency on banks’ operational performance. The
remainder of this chapter presents the main findings of the study, policy implications
and recommendations, limitations of the research, recommendations for further
research and the overall conclusion of the study.
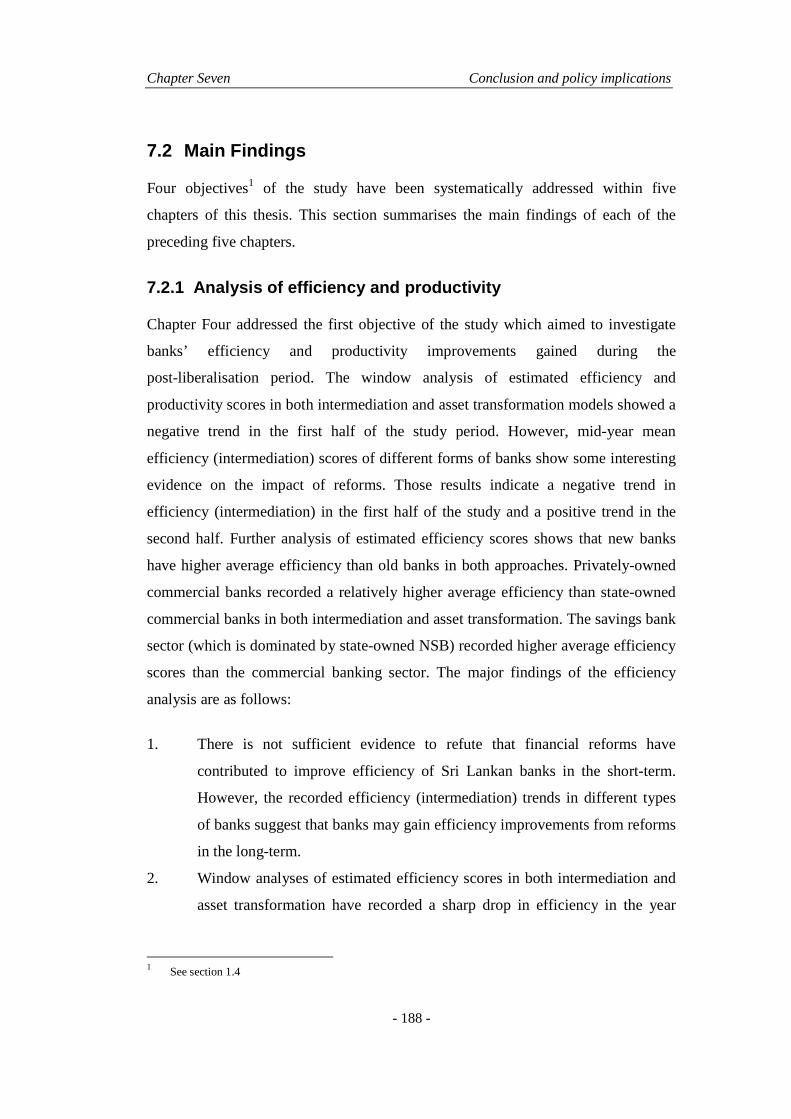
Chapter Seven Conclusion and policy implications
- 188 -
7.2 Main Findings
Four objectives1 of the study have been systematically addressed within five
chapters of this thesis. This section summarises the main findings of each of the
preceding five chapters.
7.2.1 Analysis of efficiency and productivity
Chapter Four addressed the first objective of the study which aimed to investigate
banks’ efficiency and productivity improvements gained during the
post-liberalisation period. The window analysis of estimated efficiency and
productivity scores in both intermediation and asset transformation models showed a
negative trend in the first half of the study period. However, mid-year mean
efficiency (intermediation) scores of different forms of banks show some interesting
evidence on the impact of reforms. Those results indicate a negative trend in
efficiency (intermediation) in the first half of the study and a positive trend in the
second half. Further analysis of estimated efficiency scores shows that new banks
have higher average efficiency than old banks in both approaches. Privately-owned
commercial banks recorded a relatively higher average efficiency than state-owned
commercial banks in both intermediation and asset transformation. The savings bank
sector (which is dominated by state-owned NSB) recorded higher average efficiency
scores than the commercial banking sector. The major findings of the efficiency
analysis are as follows:
1. There is not sufficient evidence to refute that financial reforms have
contributed to improve efficiency of Sri Lankan banks in the short-term.
However, the recorded efficiency (intermediation) trends in different types
of banks suggest that banks may gain efficiency improvements from reforms
in the long-term.
2. Window analyses of estimated efficiency scores in both intermediation and
asset transformation have recorded a sharp drop in efficiency in the year
1 See section 1.4

Chapter Seven Conclusion and policy implications
- 189 -
2001. This drop suggests that the financial repercussions created by the
fiscal deficit may have adversely affected banks’ efficiency.
3. In both the intermediation and asset transformation approaches, the state-
owned commercial banks recorded lower average efficiency scores than the
privately-owned commercial banks, indicating that state-owned commercial
banks are the main contributor to low efficiency in Sri Lankan banks.
4. The efficiency gap between privately-owned commercial banks and
state-owned commercial banks lessened during the second half of the study
period. This provides evidence that the limited autonomy offered to the
state-owned commercial banks through the commercialisation program in
1994 has affected an improvement in the efficiency of those commercial
banks.
5. New commercial banks, which include predominantly medium and
small-scale banks, show higher average technical and scale efficiency scores
in both intermediation and asset transformation than old banks. This result
suggests that old banks have not fully utilised their production capacity,
implying that non-optimal scale of operations is a major contributor to
technical inefficiency of Sri Lankan banks.
Empirical investigation of productivity improvements gained by banks in Sri Lanka
during the 16 year period from 1989-2004 has provided mixed evidence. With the
exception of state-owned commercial banks and old commercial banks, all other
banks have recorded a regress in total factor productivity in intermediation during
the study period. However, the asset transformation process shows productivity
improvement mainly from frontier shift. The estimated MPIs indicate that even
though banks in Sri Lanka have invested in advancement of technologies in asset
transformation, no productivity gains have been achieved from improvement of
efficiency. This is evident particularly in the case of state–owned commercial banks
and old commercial banks.
The second objective of the study was to undertake a comprehensive review of the
literature related to financial reforms and their impact on the banking industry in Sri

Chapter Seven Conclusion and policy implications
- 190 -
Lanka and efficiency and productivity change (concepts and measurements) and
their application in the banking industry. Two literature reviews and their findings
are presented in Chapter Two and Chapter Three respectively of this dissertation.
7.2.2 Determinants of technical efficiency
The third objective of the study was to investigate the determinants of technical
efficiency of banks in Sri Lanka. The study results (see Chapter Five) show that
TE(I) has:
• positive relationships with variables such as profitability, operational risk,
purchased funds, liquidity (but only at the 10% confidence level) and market
capitalisation;
• negative relationships with product quality (but only at the 10% confidence
level) and line of business (commercial banks);
• no relationship with the other variables tested.
On the other hand, regression based on TE(A) provided evidence for:
• positive relationships with capital strength (but only at the 10% confidence
level), operational risk, and stock market capitalisation;
• negative relationships with line of business, ownership (private banks) and
old banks;
• no relationship with other variables tested.
Recorded relationships of operational risk and product quality with TE(I) show that
achieving a trade-off between operational risk and product quality is a pre-condition
for having high technical efficiency in intermediation. Further, positive relationships
recorded by market capitalisation show that the improved competition as a result of
developments in the financial market has improved the TE in the banking industry.
These results suggest that policies aimed at improving efficiency in other financial
institutions in the sector may bring similar gains in the banking industry. The
recorded relationships between capital strength and TE(A), and between purchased

Chapter Seven Conclusion and policy implications
- 191 -
funds and TE(I), indicate the significance of expanding the banks’ capital base. The
evidence recorded on state-ownership in the investigation of determinants of TE is
not consistent with evidence found in the analysis of estimated efficiency scores in
intermediation. The finding suggests that state-owned banks are more efficient than
the privately-owned banks in asset transformation. However, this finding may have
been influenced by regulation related to the SRR.
7.2.3 Market structure, efficiency and operational performance
The fourth objective of the study was to investigate the influences of market
structure and efficiency on banks’ operational performance. This analysis was
limited to the intermediation role, which is directly related to the external operation
of banks. The study uses both ROA and NIM to represent banks’ operational
performance. The regression based on NIM does not provide evidence to support
any of the predicted relationships. However, the estimated coefficients for ROA
show that the banks’ profitability is positively related to the TE(I) and not related
with the HHI and the MP, thus supporting the EFS. This result suggests that banks’
operational performance can be improved only by gaining efficiency improvements.
However, the recorded correlation coefficients for some explanatory variables
indicate that the estimated coefficients of the original regression may have been
affected by the multicolinearity. Thus, two supplementary regression analyses have
been performed, excluding some variables which record high correlation coefficients
with other explanatory variables. The estimated coefficients of regression based on
NIM provide similar results to the original regression, although the ROA model
records positive relationships for both variables which represent MP and TE(I).
These results indicate that banks with high MP may have higher profit than the
banks with low MP, thereby supporting the RMP hypothesis. Further, positive
relationships recorded by TE(I) with ROA and MP indicate that efficient banks can
have a greater MP—which may lead to higher operational performance. Overall, the
study findings suggest that the collusive power does not have a significant impact on
the operational performance of Sri Lankan banks.

Chapter Seven Conclusion and policy implications
- 192 -
7.3 Policy Implications and Recommendations
Development in the financial services sector is considered a prime requirement for a
country’s economic development (McKinnon 1973; Shaw 1973). Thus, as part of the
development strategy, the government of Sri Lanka commenced regulatory reforms
to the financial services sector in 1977 (Dunham & Jayasuriya 2005; Kelegama,
1989). Those reforms aimed to enhance the capital accumulation process by
improving efficiency and productivity of the financial services sector. These reforms
brought various benefits to the banking industry (see Chapter Two). However, the
analyses of efficiency, productivity and market structure show that the banking
industry in Sri Lanka was not able to capitalise on the opportunities created by the
reforms by gaining sufficient efficiency and productivity gains.
Overall, banks in Sri Lanka have recorded a low level of improvement in efficiency
and productivity gains especially in the case of intermediation during the study
period. If these trends continue, the Sri Lankan banking sector may deviate from
developments in the international banking industry. With globalisation of the
sector’s operations, the local banks will suffer from competition coming from
international competitors. Furthermore, recorded low efficiency and unused capacity
of banks may lead to an increase in the operational cost of banks in the future which
may, in turn, result in large interest rate rises. Thus, policy makers should give
priority to promoting policies and strategies which may enhance efficiency
improvements and productivity gains in the sector in general. Those strategies must
target all small and large banks, irrespective of their ownership structure and
business focus. Further, the findings of the investigation of determinants of technical
efficiency suggest that the future reforms should focus on:
• overall competitiveness of the financial services sector (including all
segments in the sector such as the banking industry, debt markets, stock
market, and all other financial and information intermediaries) to enhance the
inter-industry market competition;

Chapter Seven Conclusion and policy implications
- 193 -
• removal of operational differences in different forms of authorised
deposit-taking institutions such as savings banks, development banks and
commercial banks to enhance competition in the banking industry;
• strengthening the capital bases of banks to control the risk-taking behaviour
of banks’ management; and
• formulating strategies for achieving a trade-off between operational risk and
product quality.
The empirical analysis which examines the influence of market structure and
efficiency on operational performance of banks suggests that collusive power in the
banking industry does not have any impact on operational performance. However,
the relative market power and operational efficiency which individual banks hold
have a significant effect on operational performance. Thus, policy makers need to
focus on polices and strategies which strengthen the operational efficiency (and
improve the market competition) and relative market power of individual banks.
Accordingly, in order to bolster efficiency and productivity gains in the banking
industry in Sri Lanka, this study suggests policy concentration on areas such as
speed of reforms, banks’ operational environment, and institutional framework. The
remainder of this section focuses on these proposed policy areas.
7.3.1 Speed of reforms
Speed of reforms encompasses the sequences and timing of reforms. As explained
by Lal (1986), the sequence of economic liberalisation should be: (1) the reduction
of fiscal deficit accompanied by removal of capital market distortions; (2) the
floating of the exchange rate; and (3) the introduction and implementation of a
phased program for removing commodity market distortions. Previous reforms in Sri
Lanka have attempted to cover all these three phases in economic liberalisation. Hoj
et al. (2006) pointed out that reforms must be consistent with governments’
objectives outside the field of economic efficiency. Therefore, it is necessary to have
strong political will to face the political difficulty of creating the necessary pro-

Chapter Seven Conclusion and policy implications
- 194 -
reform consensus in the electorate and/or overcoming strong opposition to reform
(Hoj et al. 2006).
Conflicting economic goals such as stabilisation and development, as well as lack of
strong political will, have adversely affected the success of reforms in Sri Lanka.
Reforms introduced in the late 1970s aimed to free the market completely from
government intervention. However, latter reforms have given more precedence to
stabilisation goals than to development goals (Dunham & Kelegama 1997).
Accordingly, policy makers relied on ad-hoc policy adjustment which gave more
emphasis to short-term, rather than long-term, economic consequences. The
recorded efficiency trends show how those circumstances have affected the banks’
efficiency improvements and productivity changes.
This study recognises that issues related to the speed of reforms have adversely
affected banks’ efficiency and productivity gains. Thus, this study suggests a phased
program for further reforms in the financial services sector which addresses all
problems faced during the last 27 year period. Such program can be used to:
• recognise, define and establish the objectives, tasks, priorities and timing of
further reforms;
• identify potential challenges in implementation of the reforms;
• formulate strategies for overcoming such challenges; and
• inform all constituencies which may be affected by the proposed reforms.
The program should include:
• removal of all restrictions in determination of interest rates (which are
currently linked to the two policy interest rates, namely, NSB deposit rates
and return on government securities), all forms of credit restriction on banks,
and taxes which increase the cost of banking transactions (such as debit tax
and various forms of stamp duties); and
• further relaxation of entry and exit barriers (which currently require the
consent of CBSL) by providing more room for foreign banks to expand their

Chapter Seven Conclusion and policy implications
- 195 -
operations within the country (these may provide greater competition and
more information about advanced banking technologies).
7.3.2 Banks’ operational environment
Analysis of estimated efficiency scores and investigation of determinants of
technical efficiency have identified a number of factors which may affect banks’
efficiency. The results suggest that the autonomy of decision-making enjoyed by
banks’ boards of management, irrespective of the form of ownership, have impacted
on banks’ efficiency improvements and productivity gains. This has been
highlighted by the reduction of efficiency gaps between the privately-owned
commercial banks and the state-owned commercial banks with the introduction of
the commercialisation program in late 1994. Thus, this study suggests that further
commercialisation should be undertaken in state-owned banks, with reduced
political interference. The study results also highlight the necessity of freeing state-
owned banks completely from government control. Further, the study proposes
reducing the dependency on state-owned banks for financing fiscal deficit since it
may have adversely affected not only those banks’ efficiency, but also the market
competition in the banking industry by crowding out private investment.
TE(A) shows a significant negative relationship with the old banks, indicating that
the new banks are more efficient in asset transformation than the old banks.
Furthermore, analysis of efficiency scores found significant differences in estimated
efficiency scores (both in intermediation and asset approaches) between new and old
banks. On the other hand, the analysis of productivity improvement indicates that
old banks attempted to improve their productivity through improving their
production frontier. It is suggested that old banks have focused on reducing the
differences in operational environments of new and old banks by mainly focusing on
advancement of the production technologies they use. However, old banks were not
able to improve their productivity from efficiency gains. Thus, these findings
suggest that there is a need to formulate strategies, not only to speed-up the

Chapter Seven Conclusion and policy implications
- 196 -
upgrading of existing product-delivering technologies used in old banks, but also to
enhance the current efficiency level.
Developments in other industries in the financial services sector have increased the
degree of competition in the sector. Gaining efficiency improvements is the most
appropriate approach to facing increased competition. Cost advantages gained
through efficiency improvements assist banks in reducing their intermediation
margin by being able to offer their products at a lower price than their competitors.
The recorded relationship between TE and stock market capitalisation can be
considered as an indicator of the impact of developments in other institutions in the
financial services sector on banks’ technical efficiency. Further, such developments
in the other industries may allow banks to focus on new business opportunities.
Thus, any reforms aimed at expanding activities in the financial services sector are
important for further development in the banking industry.
7.3.3 Institutional framework for financial reforms
Lack of a well-defined institutional framework for policy reforms may also impact
on regulatory reforms in Sri Lanka. Currently, the CBSL is responsible for
regulation and supervision of financial institutions. The CBSL also provides
statutory protection to deposit holders of the authorised deposit taking institutions.
Contemporary researchers point out that maintaining both supervisory and
regulatory roles under government control may reduce the impartiality of outcomes
(Barth, Caprio & Levine 2004). Hence, those studies suggest transferring the banks’
supervision to private institutions which are independent from direct government
control (Barth, Caprio & Levine 2004). As Barth, Caprio & Levine pointed out,
private sector supervision may improve the soundness of both the supervisory and
regulatory functions. Therefore, this study proposes the following changes to the
institutional framework of the financial services industry:
1. Governments must limit intervention in the banking industry to formulating
and implementing policies and procedures which may be helpful to the
smooth operation of the banking industry.
Chapter Seven Conclusion and policy implications
- 197 -
2. The CBSL should give priority to identifying, formulating and implementing
sound banking regulatory practices.
3. Prudential supervision is a prime requirement to constrain risk-taking
behaviour in a liberalised financial environment. Thus, there is a need to
allow an independent agency to supervise financial institutions.
4. Deposit insurance aims to protect deposit holders in the case of the
bankruptcy of a bank, and to provide an environment that is conducive to the
smooth operation of banks and general stability in the financial sector. Thus,
this study proposes establishing a separate institution for deposit insurance,
which is responsible for introducing deposit insurance mechanisms to protect
the deposit holders of authorised deposit taking institutions.
5. Banks—even state-owned banks—and other institutions operating in the
financial services sector should adopt management structures that ensure
they are primarily autonomous profit centres. Those institutions might be
able to respond to the market passively to satisfy the market needs in
intermediation and asset transformation. Regulatory intervention in their
activities should be limited to ensure solvent, safe and fair operations.
7.4 Limitations of the Study
A number of factors have limited the empirical analysis of this study. Accordingly,
all measures have been taken within the study to restrict any cause that may result in
bias in the study due to the limitations explained below.
This study is based on secondary data, mainly collected from banks’ annual reports.
Therefore, the data may be subject to measurement and allocation errors which are
common to traditional accounting reports.
This study aimed to evaluate the impact of financial reforms which commenced in
1977. However, the accounting disclosures made in the banks’ annual reports before
1989 were limited to minimum disclosure requirements stipulated by the regulatory
institutions. Thus, this study has to be limited to the period from 1989 to 2004.

Chapter Seven Conclusion and policy implications
- 198 -
The study used non-parametric DEA to estimate productivity efficiency of banks in
Sri Lanka. Discriminatory power of DEA is mainly dependent on the sample size
and the number of inputs and outputs considered in the efficiency assessment. Since
there are only a small number of banks in the Sri Lankan banking industry, this
study used three-year moving windows for constructing production frontiers for
efficiency assessment. The estimated efficiency scores based on three-year windows
may have been influenced by the technological improvements reported during the
window period.
DEA measures efficiency scores by pair-wise comparisons of DMUs in the sample.
Benchmarking units for efficiency assessment are identified from the sample under
review. These benchmarks are endogenous and have very little value in
comparability with benchmarks created from another sample. Therefore,
comparisons of estimated efficiency and productivity scores with other studies may
not be appropriate. Branches of foreign banks can be considered as a major force in
the banking industry in Sri Lanka. However, available information from those banks
does not provide all required information for this study. Thus, the study is limited to
local banks.
7.5 Future Research
Efficiency, productivity, market structure and competition are some important
aspects of banking operations in a country. This study covered only efficiency,
productivity and market structure. Accordingly, this study suggests future research
should concentrate on several areas related to banks’ efficiency and productivity.
Estimated efficiency scores using DEA for one sample may not be compared with
the estimated efficiency scores for another sample. Further, the estimated scores may
not reflect the true efficiency level of the DMUs under review. Thus, this study
suggests that measuring efficiency and productivity change using cross-country data
may lead to a better understanding of the performance of the banking industry in Sri
Lanka. Such a study may provide information about comparable efficiency scores
for banks in Sri Lanka with other countries in the sample.

Chapter Seven Conclusion and policy implications
- 199 -
Furthermore, this study focused only on financial aspects of the banks’ performance.
In a small banking industry, some behavioural aspects may severely affect efficiency
and productivity of banks. Hence, studying non-financial factors which may
influence the banks’ efficiency and productivity gains may be more important.
Some recent studies (Fried, Schmidt and Yaisawarng, 1999; Drake, Hall and Simper,
2006 and Dietsch and Lozano-Vivas, 2000) suggest using a three-stage procedure
for estimating efficiency scores. Those studies suggest decomposing impact of
environment effect form estimated efficiency scores. However, this study has been
based on the two-stage procedures for investigating factors influencing the technical
efficiency. Thus, it is proposed to conduct future research based on the three-stage
procedure.
This study has been limited to the impact of financial reforms on the efficiency and
productivity change in the banking industry in Sri Lanka. However, various forms of
government intervention in the industry may have greatly affected the banks’
efficiency and productivity gains. Thus, this study stresses the significance of
investigating the impact of such interventions on the operational performance of the
banking industry.
The Sri Lankan financial services sector consists of a few industries. An inter-
industry analysis on efficiency and productivity change may provide information
about the influence of financial reforms. Hence, this study suggests undertaking an
inter-industry analysis on efficiency and productivity change in the financial services
sector would be useful future research.
7.6 Conclusion
Financial liberalisation has resulted in a significant change in the infrastructure and
operational environment of the banking industry in Sri Lanka. As discussed in
Chapter Two, financial services sector reforms widened the overall activities of the
banking industry. During this period the banking industry emerged as a main
economic agent that facilitates the transformation of financial assets in the capital

Chapter Seven Conclusion and policy implications
- 200 -
market. However, further analysis in the study found that banks were not able to
capitalise on the favourable environment created by financial reforms through
efficiency and productivity improvements. The analysis of factors affecting the
technical efficiency of banks in Sri Lanka shows that the impacts of those factors on
the different aspects of banking operations are not similar. The overall study
findings suggest that policy reforms on their own may not be enough to improve the
efficiency and productivity gains of the banking industry. The introduction of
financial reforms may affect efficiency and productivity gains if individual banks are
able to capture the opportunities created by such reforms and if the government is
able to attain and sustain microeconomic stability in the country.

Appendixes
201
Appendix 1: Applications of DEA in the financial s ervices sector Researcher (Year) Sample Issues addressed Findings
Deregulation Alam (2001) US
1980-89 166 Banks
Branching restrictions • Banks take a considerable time to respond to regulatory reforms.
Ali and Gstach (2000)
Austria 1990-97 216 Banks
Foreign banks • All banks recorded a declining trend in estimated technical efficiency scores. • Performance gaps between best performing banks and the other banks have been
widened. • Small banks performed better than big banks
Avkiran (1999) Australia 1986-95 25 banks
Bank mergers and outcome of deregulation
• Mergers were not able to gain in productivity improvements • Acquiring firms were not always able to maintain the pre-merger productivity
gains Avkiran (2000) Australia
1986-95 10 banks
Deregulation • Interest expenses were identified as an important source of inefficiency • Regional banks were in the IRS and trading banks were in the DRS
Berg, Forsund and Jansen (1992)
Norway 1980-89 152 banks
Deregulation • There was a productivity regress during the pre-deregulated period and rapid growth in productivity during post-deregulation.
• Deregulation has lessened dispersion of productivity levels within the industry Canhoto and Dermine (2003)
Portugal 1990-95 20 banks
Relative efficiency of new domestic banks
• Deregulation affected efficiency improvements • New banks are more efficient than old banks
Denizer, Dinç and Tarimcilar (2000)
Turkey 1970-94 29-53 banks
Productivity improvements • Estimated efficiency indicated a declining trend in post deregulations. • There were no significant differences in estimated efficiency among different
types of banks Elyasiani and Mehdian, (1990a)
USA 1980-85 191 banks
Technological change • 12.98% non-neutral technology change has been reported
Elyasiani and Mehdian (1995)
USA 1979, 1986 300 banks
Deregulation
• Small banks were more efficient than large banks in the pre-deregulated periods and equally efficient in the post-deregulated period.
Isik and Hassan (2003a) Turkey 1981-90 41-56 banks
Deregulation • Efficiency improvements were reported mostly owing to management practices rather than improved scale.
• New environment created through deregulation reduced the efficiency gap between private and public banks.

Appendixes
202
Isik and Hassan (2003b) Turkey 1988-96 52-55 banks
Deregulation • State-owned banks and foreign banks outperformed privately-owned banks in terms of cost and technical efficiency where as state-owned banks dominated both in terms of allocative efficiency.
• Publicly traded banks recorded relatively high efficiency. • No evidence found to support that bank size has a significant effect on estimated
cost efficiency. Maghyereh, (2004) Jordan
1984-2001 8 banks
Productivity improvements • Deregulation improved bank efficiency indicating a faster push of productivity growth in large banks.
Noulas (2001) Greece 1994-98 19 banks
Deregulation • Privately-owned banks positively responded to the deregulation. • No evidence was found for significant gap between state-owned and privately-
owned banks. Sathye (2001) India - All Productive efficiency gained
on reforms • The efficiency of privately-owned banks was paradoxically lower than that of
state-owned banks and foreign banks. Sturm and Williams (2004)
Australia 1988-2001
Foreign bank entry • Foreign banks were more efficient, however, those banks were not able to convert recorded efficiency into profit
• The main source of technical inefficiency was excessive scale of operation. Webb (2003) UK
1985-95 7 banks
Performance of retail banks • The main source of inefficiency is the scale of operation • Small banks suffered from technical inefficiency • Large banks were in the DRS
Policy issues Batchelor and Gerrard (2002)
Singapore 1997-2001 3 banks
Local take over • Productivity improvement in banks primarily resulted from technological change • Local take-over has a positive influence on technological change
Barr et al. (1999) USA 1984-98
Performance evaluation approaches
• Traditional measures of bank performance and DEA scores has a close relationship
Bauer et al. (1998) USA 638 banks 1977-88
Consistency of efficiency scores among different methods
• Efficiency estimations based on parametric approaches are closely related. However, there are big differences in estimated efficiency scores using parametric and non-parametric approaches.
• Non-parametric approaches report relatively low average efficiency. Casu and Girardone (2002)
Italy 1995 110 banks
Performance comparison • Result suggests bank group is less efficient when compared to the parents’ banks and subsidiary banks.
• Estimated efficiency scores showed a higher variation of efficiency between banking group of companies, and parents and subsidiary companies
• Banks’ size plays a very little role in determining banks’ efficiency

Appendixes
203
Drake and Hall (2003) Japan 1997 149 banks
Problem loans • Small banks were in the economics of scale. • Technical efficiency was improved with bank size. • Problem loans was an important source of inefficiency especially for the smaller
regional banks Elyasiani and Mehdian (1990b)
USA 1980-85 144 banks
Rate of technology change • Size (total assets or total revenue) has positive effect on bank efficiency. • Large banks were able to gain efficiency improvements on scale of operation
Fried, Lovell and Yaisawarng (1999)
USA 1988-95 6000 credit unions
Mergers • Merger has a mixed effect on the estimated efficiency
Fukuyama (1995) Japan 1989-91 155 banks
Policy issue • During the economic crises, the estimated average efficiency report a stable trend • Bank size (revenue) inversely correlated with the estimated efficiency
Jackson Fethi and Inal (1998)
Turkish 1992-1996 38 banks
Policy analysis • Productivity improved on deregulation
Noulas (1997) Hellenic 1991-92 20 banks
Productivity growth • Productivity growth was reported by both state-owned (mainly on technological progress) and privately-owned (mainly on catching-up) banks.
Worthington (2001) Australia 1993-1997 323 credit unions
Merger • Merged credit unions recorded higher productivity improvements than non-merged credit unions
Sathye (2001) Australia 1996 29 banks
Merger • Domestic banks were more efficient than the foreign banks • Market power and size variables were negatively associated with the bank
efficiency. Methodological issues
Asmild et al. (2004) Canada 1981-2000 5 main banks
Window analysis with MPI • Decomposition of frontier shift and catching-up effects of the MPIs estimated using window based DEA are not accurate.
Brown (2001) Australia 1992-95 credit unions 326
Sample stratification • Stratification of the sample improves discriminatory power of inefficient units from efficient units.
Cinca, Molinero and Garcia (2002)
Spain 2000 47 banks
Review on input output specifications
• DEA estimated efficiency scores was influenced by input and output specifications used.
• Better estimation of relative efficiency can be derived on average value of the estimated efficiency scores under different combinations of input output specification.

Appendixes
204
Favero and Papi (1995) Italy 1991 174 banks
Scale efficiency and influence of input-output specifications
• Productive specialisation, size and location are identified as determinants of banks’ efficiency.
Huang and Wang (2002) Taiwan 1982-97 22 banks
Comparison of estimated efficiency on different approaches
• DEA and other two parametric methods used for estimation of efficiency scores recorded similar distribution patterns.
• Parametric and non-parametric methods gave slightly different results in ranking of DMUs
• Parametric methods showed a highly persistence distribution across periods and a close correlation with traditional measures.
Leong and Dollery (2002) Singapore 1993-99 35 banks
Tested Barr et al (1999) approach
• A longitudinal approach has been applied to examine relationship between estimated efficiency scores and other performance indicators.
• A positive relationship between estimated efficiency and traditional measures of bank efficiency was found
Leong, Dollery and Coelli (2002)
Singapore 1993-99 35 banks
Consistency of DEA estimated efficiency scores with other methods
• DEA estimated efficiency scores were consistent with best practice conditions, model specification condition, and market condition. However the results did not comply with the time consistency condition.
Pastor (1999) Spain 1985-95 165-132 banks
Risk • A sequential DEA procedure was proposed to decompose the banking risk into internal and external components in order to obtain efficiency measures free from risk.
Resti (1997) Italy 1988-92 270 banks
Performance • Differences of efficiency scores estimated using econometric and mathematical programming approaches are not significant when the same data-set and conceptual framework used.
• Estimated efficiency scores using ADEA (VRS and CRS) and SFA were shown a high positive correlation.
Saha and Ravisankar (2000)
India 1992-95 25 public banks
Performance • Public sector banks have improved their efficiency • More efficient banking units listed in stock market were able to recorded higher
stock return within a short period after IPO. Tortosa-Ausina (2002) Spain Sensitivity of estimated
efficiency productivity scores • Estimated productivity and efficiency scores are more sensitive to specifications
of input/output Tortosa-Ausina (2003) Spain
1986-97 77 banks
Non-traditional activity and bank efficiency
• Inclusion of non-traditional activities in efficiency analysis contributes to improve the estimation of efficiency scores of some clusters of DMUs under review.
• The results depend on the bank size, type of the firm, and the time

Appendixes
205
Weill (2004) 5 EC countries
1992-98 588 banks
A comparison of frontier techniques
• All five countries have given un comparable average efficiency scores for three frontier approaches (DEA, SFA and DFA)
• Except with DEA, estimated efficiency using parametric approaches are positively correlated
• All three methods provide consistent efficiency scores with the standard measures of performance
Managerial performance Ayadi, Adebayo and Omolehinwa (1998)
Nigeria 1991-1994 10 banks
Quality of bank management • Old banks are more efficient • Main sources of inefficiency is the poor management of bank resources • Deregulation creates threats to safety of the banking system demand for close
supervision of banking firms Berg et al. (1993) Nordic Countries
• Both in country specific production frontiers and common frontiers (constructed
using pooled data from all countries) were recorded that a large number of Swedish banks were on the frontier having higher efficiency scores.
• The results showed that efficiency spreads between banks were most important in Finland and Norway and least important in Sweden.
Bergendahl (1998) 4 Nordic Countries 1992/1993 48 banks
Benchmarking • DEA is a best approach to identify benchmark for inefficient bank
Chen (2002) Taiwan 1997-1998 44 banks
Managerial performance • Three specifications were applied to stand for operating, marketing and financial efficiency of banking firms.
• Significant differences are observed in estimated efficiency scores • State banks [and large] exhibited superior performance in profitability and
private sector banks [and small banks] exhibited operational capability. Drake (2001) UK
1984-1995 10 banks
Productive performance • Reported improvements in productivity throughout the period • Main sources of inefficiency is the scale diseconomies • Over the period, UK banks reported a positive productivity growth over the period
due to the frontier shift and negative catch-up Darrat, Topuz and Yousef (2002)
Kuwait 1994-1997 8 banks
Productivity improvements
• Mainly technical and allocative inefficiencies are caused by inefficiency of banking system
• Small banks are more efficient • Capitalization and profitability are positively related to banks’ inefficiency

Appendixes
206
Drake and Simper (2003) UK 1995-2001 20 institutions1
Ownership change • Conversion of mutual building societies to public limited companies brought only temporary benefits in efficiency and productivity gains
Grabowski, Rangan and Rezvanian (1993)
USA 1989 7,721 banks 2
Organization structure • Branch banking firms are more efficient than the banks belonging to the holding companies.
• Statistically significant differences were reported among scale efficiency, allocative efficiency and pure technical efficiency.
• The efficiency improvements are mainly reported on technical sources Grigorian and Manole (2002)
Transition3 countries 1995-1998 17 banks
Sources of productivity • Banking system with few large well capitalised banks are likely to generate better efficiency and higher rate of intermediation
• The influence of prudential tightening on efficiency varies across different prudential norms
• Transferring banks’ ownership from state to local (not to foreigners) does not make statistically significant efficiency improvements.
Hasan, Lozano-Vivas and Pastor (2000)
European countries 1993 612 banks
Cross country differences • Research findings suggested that a [un]favourable environment condition could be an exogenous [good] bad competitive strategy for the home country banks.
Miller and Noulas (1996) USA 1984-1990 201 large banks
Technical efficiency • Majority of banks indicate DRS. • Large and more profitable banks report less inefficiency.
Mukherjee, Ray and Miller (2001)
USA 1984-1990 201 large banks
Productivity growth • 4.5% productivity change was reported during 1984-1990 mainly on technical change.
• Bank size and product specialisation was positively related with the efficiency change while equity to total assets ratio was negatively related.
Noulas (1997) Hellenic 1991-92 20 banks
Post-deregulation analysis • State-owned banks reported relatively high productivity change • Technical efficiency has improved in privately-owned banks and declined in the
state-owned banks Sherman and Ladino (1995)
USA 33 branches of a bank
Benchmarking • The study found that DEA can easily accommodate for some of the traditional bank monitoring techniques with relatively low cost.
• DEA can be used to analytically review complex transaction Yue (1992) USA 1992/1993
60 banks Managerial performance • Recorded technical efficiency is purely a result of excessive use of inputs
1 sample consisted of 8 credit unions, 3 converted credit unions into PLC and 9 banks 2 this sample consisted of 3,627 banks affiliated to multi-bank holding company and 4,094 banks with branch banks. 3 Former communist countries

Appendixes
207
Zanios et al. (1999) Bank of Cyprus Branch network
Benchmarking • DEA is a powerful tool which can account impact of the external environment that the managers have less control
• DEA measurements can be used to provide constructive recommendation for improvements
Cross country studies Berg et al (1993) 3 Nordic countries
779 banks Cross country • Country differences in estimated efficiency scores and dispersion of those scores
existed Casu and Molyneux (2003)
5 EUCs 1993-96
Cross country • There was no evidence to support that convergence to a single market has caused improvement in banks’ productivity in the region.
• The efficiency distribution among the EU countries appears to be mainly determined by country specific factors.
Grigorian and Manole (2002)
Transition4 countries 1995-1998 17 banks
Cross country • Large banks and foreign banks recorded relatively high efficiency scores • Per capita income has a positive relationship with estimated efficiency • Developments in security market and non-bank financial institutions have
negatively affected the performance of banks. Lozano-Vivas, Pastor and Pastor (2002)
10 EUCs 1993 612 banks
Cross country • Cross country variations in estimated efficiency have been affected by the environmental variables.
Pastor (2002) France, Italy, Spain and Germany 1988-1994
Cross country variations • Average cross country efficiency estimations were relatively low. • DEA scores which were not adjusted for risk are substantially different from the
risk adjusted scores. Other application
Fat and Hua (1998) Singapore 1992-1996 30 banks
Stock market reaction • Stock market performance closely associated with the estimated efficiency scores.
Kantor and Maital (1999) USA Mideast bank 250 branches
Activity-based cost accounting and DEA
• Combines use of activity-based costing and DEA for activity-based management provides managers with detailed quantitative performance benchmarks for the specific business activities of their firms or divisions.
4 Former communist countries

Appendixes
208
Appendix 2: Applications of DEA in financial servic es sector; Input and output specification Researcher Issues addressed Approach used Input Output
Deregulation Alam (2001) Branching restrictions Intermediation (different
combination of input-output has been used)
Physical capital, labour, purchased funds, demand deposits, other deposits, core deposits, and loanable funds (Dollar value)
Securities, real estate loans, commercial and industrial loans, instalments loans, total loans (Dollar value)
Ali and Gstach (2000)
Foreign banks Intermediation /Value added Labour, physical capital, purchased funds, interbank deposits, equity
Customer deposits, inter bank loans, small loans, securities
Avkiran (1999) Bank mergers and deregulation
Intermediation Staff number, deposits, interest expenses and non-interest expenses
Net loans, net interest income and non-interest income
Canhoto and Dermine (2003)
Efficiency of new domestic banks
Intermediation Number of employees and physical capital
Loans, deposits, securities, and interbank assets/ liabilities
Denizer Dinc and Tarimcilar (2000)
Productive improvements Stage 1: Production Stage 2: Intermediation
Total personnel expenses, interest and fees Total deposits, income from non-banking sources and non-personnel operating expenses
Total deposits and income from non-banking sources Total loan and banking income
Elyasiani and Mehdian (1990a)
Technological change Intermediation Deposits (saving and time), labour, capital
Real estate loans, commercial and industrial loans, other loans and investment
Elyasiani and Mehdian (1995)
Deregulation Intermediation Time and savings deposits, demand deposits, capital and labour
Investment real estate loans, commercial and industrial loans, and other loans
Isik (2003) Deregulation Intermediate Value-added approach
Labour (number of full time employees), capital (book valve of fixed assets), banking funds Labour, capital and funds
Short-term loans, long-term loans, other earnings assets Short-term loans, long-term loans, other earnings assets and risk adjusted off-balance sheet activities
Isik and Hassan (2003a)
Deregulation Intermediation Labour, loanable funds, and capital Short-term loans, long-term loans, other earnings assets and risk adjusted off-balance sheet activities

Appendixes
209
Maghyereh (2004) Productivity improvements
Intermediation Labour, capital and deposits Loans and liquid assets, investments and other income
Noulas (2001) Deregulation User cost Interest expenses and non-interest expenses
Interest revenue and non-interest revenue
Sathye (2001) Productive efficiency gained on reforms
Intermediation Net worth, borrowing, operating expenses, number of employees, number of banks
Deposits, net profits, advances, non-interest income interest spread
Tortosa-Ausina (2003)
Non-traditional activity and bank efficiency
Intermediation approach (1) Restricted (2) Unrestricted
Labour, funding and physical capital Same as above
Loans and other earnings Loans, other earnings, and non-traditional activity
Policy issues Barr, Seiford and Siems (1994)
Bank failure Production approach Full-time equivalent employees, salary, premises and fixed assets, other non-interest expenses, total interest expenses and purchase funds
Core deposits, earning assets, and total interest income
Batchelor and Gerrard (2002)
Local take over Intermediation approach Labour, net fixed assets, and total deposits
Loans and advances, investment securities, and liquid assets
Bauer et al.(1998) Methodological/ policy issues
Production Labour, physical capital, small denomination time and savings deposits, and purchased funds
Demand deposits, real estate loans, commercial and industry loans and instalments loans
Berger (1997) Problem loans and cost efficiency
Intermediation approach Operating expenses Commercial loans, real estate loans, transaction deposits and fee-based income
Casu and Girardone (2002)
Performance comparison Intermediation Labour costs, deposits and physical capital
Total loans and other earning assets
Dietsch and Vivas (1996)
Impact of environmental variables
Value added approach Labour, physical capital, deposits Loans, produced deposits, other productive assets including short term investment
Drake and Hall (2003)
Mergers, problem loans Intermediation approach General and administrative expenses fixed assets, retail and wholesale deposits and problem loans
Total loan and bills discounted, liquid assets and other investment and other income
Elyasiani and Mehdian (1990b)
Rate of technology change
Intermediation Deposits, labour (number of employee), and capital
Loans and investments
English et al. (1993) Bank mergers Assets approach Labour, capital, deposits and borrowings
Investment income, real estates income consumer loans, and commercial loans

Appendixes
210
Fried, Lovell and Yaisawarng (1999)
Bank mergers Alternative All operating expenses Nos. deposit, deposit interest rate, nos. loan, loan interest rate, transaction volume and service variety
Fukuyama (1995) Policy issue Intermediation Labour, capital and funds from customers
Returns from loans and returns from investments
Jackson, Fethi and Inal (1998)
Policy analysis Value added Number of employees, sum of non-labour operating cost, depreciation expenditure and material expenditure
Loans, demand deposit and time deposits
Kohers, Huang and Kohers (2000)
Policy issue/ Merger and stock prices
Intermediation Labour, physical capital, time and saving deposits, and purchased funds
Demand deposits, time and saving deposits, real estate loans, other loans and net non-interest income
Noulas (1997) Productivity growth Intermediation Physical capital, labour and deposits Liquid assets, loans and advances, and investments
Worthington (2001) Merger Intermediation Physical capital, at call deposits, notice-of-withdrawal deposits, interest and non-interest expenses
Personal loans, commercial loans, residential loans, investment, and interest and non-interest income
Methodological issues Alternative Operating costs Loans, deposits, average interest
paid, average interest received Brown (2001) Outcome of firm mergers
Alternative Operating costs Housing loans, non-housing loans, deposit not at call, average interest paid and received
Cinca, Molinero and Garcia (2002)
Review on input-output specifications
Alternative (different combinations)
Number of employees, fixed assets and deposits
Operating income, deposits and loans
Favero and Papi (1995)
Scale efficiency and influence of input-output specifications
Assets Labour (number of employees), capital (book vale of fixed assets and premises), loanable funds, and net funds from other banks [and financial capital]
Loans to other banks and non-financial institutions, investment and security and non-interest income
Fethi, Jackson and Weyman (2002)
Intermediation Number of employees, total interest expenditure, depreciation expenditure and material expenditure
Loans and demand deposits
Fukuyama and Weber (2002)
Methodological issues Assets Labour, physical capital, and funds from customers
Loans and security investments
Huang and Wang (2002)
Comparison of methods Intermediation Deposits and borrowed money, labour and net physical capital
Investment, short term loans, and long term loans

Appendixes
211
Leong and Dollery (2002)
Methodology Intermediation Deposits and fixed assets
Loans and risk weighted assets
Leong Dollery and Coelli (2002)
Methodology Model A Model B Model C
Interest expenses and operating expenses Deposits and fixed assets Deposits and fixed assets
Interest income and other income loans Risk weighted assets
Resti (1997) Methodological/ Performance
Value added Labour (staff expenses), and capital (non-staff expenses and depreciations)
Loans and deposits
Saha and Ravisankar (2000)
Methodological/ Performance
Production Interest expenses, establishment expenses, non-establishment expenses and fixed assets
Deposits, advances, investments, non-interest income, spread and total income
Cross country studies Athanassopoulos, Soteriou and Zanios (1997)
Cross country difference of efficiency gain
Production approach Labour cost, number of computer terminals, branch size
Savings, checking, business and loan accounts
Berg et al.(1993) Cross country comparison Alternative approach Labour and capital Total loans, total deposits and number of branches
Casu and Molyneux (2003)
Cross country Intermediation Total cost and total customer and short-term deposits
Total loans and other earnings assets
Lozano-Vivas, Pastor and Pastor (2002)
Cross country comparisons/ Methodological
Personnel expenses and non-personnel expenses and a set of environmental variables
Loans, deposits, and other earnings assets
Pastor (2002) Cross country variations Value added Personnel expenses, and non-personnel operating costs (with environmental and risk variables)
Loan, deposits, other earning assets
Managerial performance Athanassopoulos and Giokas (2000)
Branch performance Production approach Labour hours, branch size, computer terminals, and operating expenses
Number of transactions, (credit, deposits and foreign exchange)
Ayadi, Adebayo and Omolehinwa (1998)
Performance measurements
Intermediation Interest paid, and personnel and other expenses
Total loans, interest income and non-interest income
Barr et al. (1999) Efficiency performance/ Methodological
Integrated Salary expenses, premises and fixed assets, other non-interest expenses, interest expenses
Earning assets, interest income and non-interest income

Appendixes
212
Bergendahl (1998) Benchmarking Production Personnel cost, cost of materials, and credit loss cost
Lending, deposits and gross revenue
Chen (2002) Managerial performance Alternative approach Operation efficiency Bank staff, assets and deposits Marketing efficiency Loans, investments and exchange Financial efficiency Interest revenue, non-interest revenue, service quality and performing loans
Loan, investments and exchange Interest revenue, non-interest revenue, service quality and non-performing loans Profit and equity
Drake (2001) Productive performance Production Intermediation
Fixed assets, nos. employees Fixed assets, no. employees and deposits
Loans, liquid assets & investments, other income and deposits Loans, liquid assets & investments and other income
Drake and Simper (2003)
Ownership change Alternative Employee expenses, non-interest expenses and loan loss provisions
Net interest income, net commission income and total other income
Darrat, Topuz and Yousef (2002)
Productivity improvements
Intermediation Labour, capital, and deposits Loans and investments
Golany and Storbeck (1998)
Performance evaluations Production approach Teller hours, operating expenses, market size, economic status of the area, competitive activity
Loan (direct, indirect, commercial and equity), deposits (checking, savings and deposit certificates), average number of accounts per customer, customer satisfaction
Grabowski, Rangan and Rezvanian (1993)
Managerial issues Intermediate Labour, capital and loanable fund Commercial and industrial loans, consumer loans, real estate loans, demand deposits and investment security
Grigorian and Manole (2002)
Sources of productivity Alternative Labour, fixed assets, and interest expenditure
Revenues, net loans and liquid assets
McAllister and McManus (1993)
Scale efficiency Value added approach Purchased funds, savings deposits, fixed assets, and labour
Real estate loans, commercial and industrial loans, instalment loans, demand deposits and savings deposits

Appendixes
213
Miller and Noulas (1996)
Technical efficiency Intermediation Transaction deposits, non-transaction deposits, total interest expenses, and total non-interest expenses
Commercial and industrial loans, consumer loans, real estate loans, investments and total non-interest income
Mukherjee, Ray and Miller (2001)
Productivity growth Intermediation Transaction deposits, non-transaction deposits, equity labour, and capital.
Commercial and industrial loans, consumer loans, real estate loans, investments and total non-interest income
Pal, Mukherjee and Nath (2000)
Performance Production Deposits, net profits, advances, non-interest income and interest spread
Net worth, borrowing, operating expenses, number of employees and number of banks
Sherman and Ladino (1995)
Benchmarking Alternative Teller, platform, managerial personnel, office space, branch operating cost
Deposits (withdrawals and cheques chased), bank cheques traveller’s cheques, bonds (sold, redeemed and coupon), loans (mortgage and consumer) and new accounts (time savings, certificates of deposits)
Yue (1992) Managerial performance Intermediary Interest expenses, transaction deposits, non-transaction deposits, non-interest expenses
Interest income, non-interest income and total loans
Zanios et al. (1999) Benchmarking Production Clerical staff, managerial staff,
computer terminals and working space
Number of current accounts, savings accounts, foreign currency and commercial accounts, credit application and service hours
Other application Fat and Hua (1998) Share market performance Alternative Non-interest expenses, interest
expenses, and financial capital Annual average increase in total assets and total income from interest and non-interest activities

Appendixes
214
Appendix 3: Coefficients of variation (Input and ou tput data) Window Interest
Expenses Personnel Expenses
Establishment Expenses
Advances Deposits Number of Employees
Interest Income
Other Income
Other Loanable Funds
Earning Assets
1990 0.95 1.19 0.96 1.13 0.92 1.04 0.91 0.86 1.36 1.66
1991 0.88 1.13 0.96 1.01 0.87 1.00 0.86 0.82 1.45 1.53
1992 0.82 1.09 0.95 0.93 0.79 0.97 0.82 0.90 1.52 1.46
1993 0.78 1.07 0.91 0.89 0.76 0.93 0.79 0.95 1.45 1.34
1994 0.85 1.08 1.00 0.97 0.84 0.98 0.85 1.00 1.40 1.42
1995 0.91 1.09 1.14 0.98 0.89 1.03 0.90 1.09 1.37 1.43
1996 0.98 1.18 1.31 1.03 0.97 1.10 0.98 1.23 1.40 1.52
1997 0.98 1.19 1.34 1.02 0.96 1.10 0.97 1.22 1.38 1.47
1998 1.02 1.21 1.31 1.03 0.98 1.14 1.00 1.29 1.44 1.51
1999 1.02 1.22 1.05 1.03 0.96 1.14 0.99 1.27 1.62 1.52
2000 1.04 1.22 0.88 1.07 0.98 1.16 1.02 1.23 1.65 1.49
2001 1.02 1.21 0.87 1.04 0.98 1.16 1.01 1.10 1.51 1.47
2002 1.02 1.21 0.85 1.01 0.99 1.15 0.99 1.00 1.27 1.41
2003 0.99 1.21 0.84 0.97 0.99 1.13 0.96 1.05 1.02 1.44
Pooled sample data
1.08 1.36 1.09 1.17 1.14 1.09 1.08 1.25 1.56 1.69
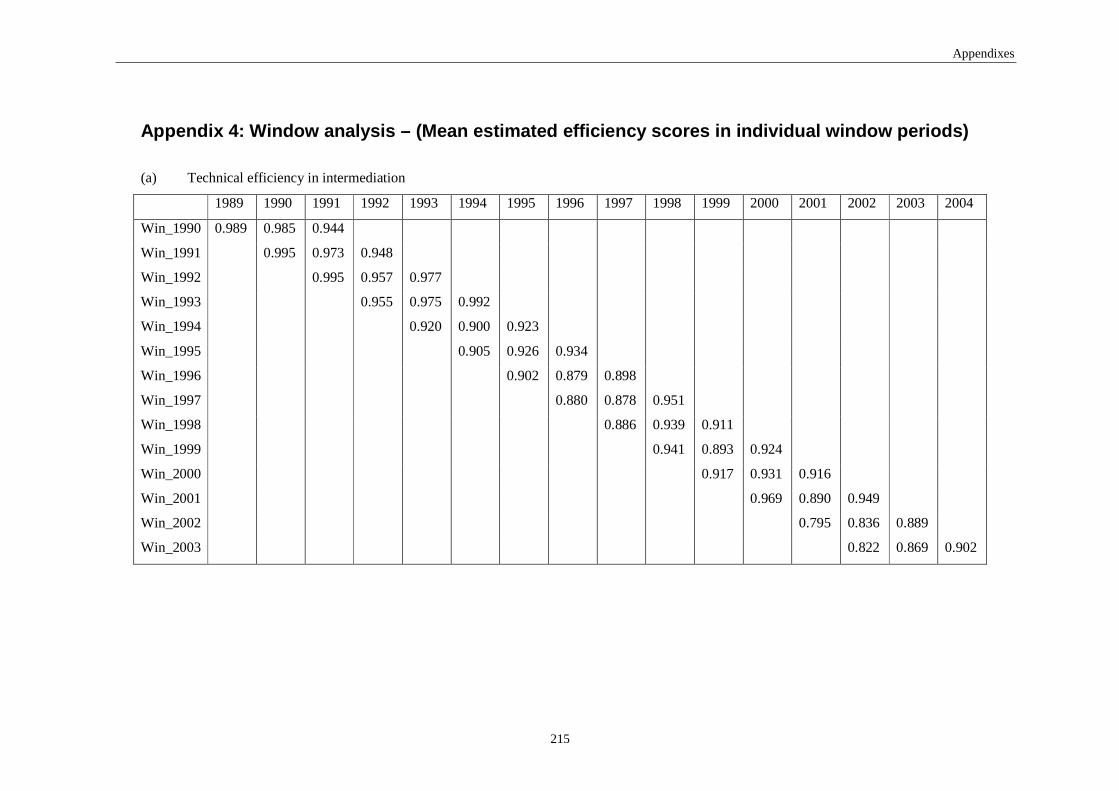
Appendixes
215
Appendix 4: Window analysis – (Mean estimated effic iency scores in individual window periods)
(a) Technical efficiency in intermediation
1989 1990 1991 1992 1993 1994 1995 1996 1997 1998 1999 2000 2001 2002 2003 2004
Win_1990 0.989 0.985 0.944
Win_1991 0.995 0.973 0.948
Win_1992 0.995 0.957 0.977
Win_1993 0.955 0.975 0.992
Win_1994 0.920 0.900 0.923
Win_1995 0.905 0.926 0.934
Win_1996 0.902 0.879 0.898
Win_1997 0.880 0.878 0.951
Win_1998 0.886 0.939 0.911
Win_1999 0.941 0.893 0.924
Win_2000 0.917 0.931 0.916
Win_2001 0.969 0.890 0.949
Win_2002 0.795 0.836 0.889
Win_2003 0.822 0.869 0.902

Appendixes
216
(b) Pure-technical efficiency in intermediation
1989 1990 1991 1992 1993 1994 1995 1996 1997 1998 1999 2000 2001 2002 2003 2004
Win_1990 1.000 0.994 0.994
Win_1991 1.000 0.999 0.971
Win_1992 1.000 0.982 1.000
Win_1993 0.983 0.992 1.000
Win_1994 0.987 0.987 0.989
Win_1995 0.987 0.987 0.998
Win_1996 0.983 0.982 0.989
Win_1997 0.976 0.971 0.995
Win_1998 0.973 0.989 0.968
Win_1999 0.989 0.964 0.993
Win_2000 0.976 0.989 0.976
Win_2001 0.994 0.961 0.988
Win_2002 0.886 0.900 0.905
Win_2003 0.888 0.899 0.909

Appendixes
217
(c) Scale efficiency in intermediation
1989 1990 1991 1992 1993 1994 1995 1996 1997 1998 1999 2000 2001 2002 2003 2004
Win_1990 0.989 0.990 0.950
Win_1991 0.995 0.974 0.976
Win_1992 0.995 0.975 0.977
Win_1993 0.971 0.983 0.992
Win_1994 0.930 0.913 0.934
Win_1995 0.917 0.938 0.936
Win_1996 0.917 0.893 0.906
Win_1997 0.898 0.900 0.954
Win_1998 0.907 0.948 0.939
Win_1999 0.951 0.925 0.930
Win_2000 0.936 0.941 0.938
Win_2001 0.974 0.927 0.961
Win_2002 0.822 0.852 0.900
Win_2003 0.855 0.892 0.915

Appendixes
218
(d) Technical efficiency in asset transformation 1989 1990 1991 1992 1993 1994 1995 1996 1997 1998 1999 2000 2001 2002 2003 2004
Win_1990 0.942 0.951 0.981
Win_1991 0.944 0.948 0.939
Win_1992 0.961 0.941 0.966
Win_1993 0.939 0.959 0.990
Win_1994 0.947 0.955 0.985
Win_1995 0.905 0.939 0.950
Win_1996 0.870 0.922 0.968
Win_1997 0.923 0.962 0.943
Win_1998 0.920 0.889 0.953
Win_1999 0.904 0.945 0.956
Win_2000 0.926 0.925 0.965
Win_2001 0.914 0.948 0.960
Win_2002 0.869 0.880 0.865
Win_2003 0.886 0.872 0.852

Appendixes
219
(e) Pure-technical efficiency in asset transformation 1989 1990 1991 1992 1993 1994 1995 1996 1997 1998 1999 2000 2001 2002 2003 2004
Win_1990 0.975 0.968 0.993
Win_1991 0.965 0.971 0.981
Win_1992 0.997 0.956 1.000
Win_1993 0.948 0.982 0.992
Win_1994 0.978 0.964 1.000
Win_1995 0.957 0.988 1.000
Win_1996 0.930 0.975 0.994
Win_1997 0.970 0.992 0.977
Win_1998 0.961 0.943 1.000
Win_1999 0.947 0.975 0.986
Win_2000 0.959 0.959 0.999
Win_2001 0.958 0.987 0.991
Win_2002 0.904 0.900 0.898
Win_2003 0.906 0.905 0.897

Appendixes
220
(f) Scale efficiency in asset transformation 1989 1990 1991 1992 1993 1994 1995 1996 1997 1998 1999 2000 2001 2002 2003 2004
Win_1990 0.966 0.981 0.988
Win_1991 0.976 0.976 0.958
Win_1992 0.964 0.982 0.966
Win_1993 0.989 0.976 0.999
Win_1994 0.968 0.990 0.985
Win_1995 0.947 0.951 0.950
Win_1996 0.928 0.945 0.974
Win_1997 0.950 0.969 0.965
Win_1998 0.958 0.944 0.953
Win_1999 0.955 0.969 0.970
Win_2000 0.966 0.964 0.965
Win_2001 0.952 0.959 0.969
Win_2002 0.881 0.895 0.884
Win_2003 0.903 0.890 0.876

Appendixes
221
Appendix 5: Mean estimated efficiency scores (a) Intermediation process
Win_ 1990
Win_ 1991
Win_ 1992
Win_ 1993
Win_ 1994
Win_ 1995
Win_ 1996
Win_ 1997
Win_ 1998
Win_ 1999
Win_ 2000
Win_ 2001
Win_ 2002
Win_ 2003
Average St-dev
Technical efficiency All Banks 0.972 0.972 0.976 0.974 0.915 0.922 0.893 0.903 0.912 0.920 0.921 0.936 0.916 0.936 0.934 0.029 Saving 0.977 0.979 0.988 1.000 0.988 1.000 0.983 0.920 0.930 0.965 0.956 0.989 0.967 0.984 0.973 0.024 Commercial 0.972 0.971 0.975 0.970 0.902 0.909 0.882 0.901 0.899 0.911 0.909 0.924 0.901 0.925 0.925 0.032
State-owned
0.949 0.932 0.933 0.921 0.756 0.781 0.669 0.713 0.748 0.815 0.850 0.944 0.882 0.909 0.843 0.095
Privately-owned
0.983 0.991 0.995 0.994 0.976 0.973 0.953 0.964 0.949 0.943 0.926 0.919 0.907 0.929 0.957 0.029
Old 0.969 0.965 0.966 0.961 0.874 0.884 0.823 0.845 0.854 0.888 0.905 0.936 0.894 0.914 0.906 0.048 New 0.977 0.983 0.991 0.988 0.960 0.957 0.941 0.957 0.944 0.934 0.912 0.915 0.907 0.933 0.950 0.028
Pure-technical efficiency All Banks 0.996 0.990 0.994 0.991 0.987 0.991 0.984 0.981 0.977 0.982 0.981 0.981 0.979 0.974 0.984 0.026 Saving 1.000 1.000 0.991 1.000 1.000 1.000 1.000 1.000 0.978 0.978 1.000 1.000 1.000 1.000 0.997 0.007 Commercial 0.995 0.988 0.994 0.990 0.985 0.989 0.982 0.978 0.974 0.980 0.976 0.977 0.974 0.969 0.981 0.028
State-owned
0.999 0.973 0.983 0.974 0.985 0.997 0.973 0.944 0.942 0.953 0.957 0.998 0.997 1.000 0.977 0.037
Privately-owned
0.993 0.996 1.000 0.998 0.986 0.986 0.985 0.990 0.984 0.989 0.982 0.971 0.967 0.961 0.982 0.023
Old 0.999 0.986 0.992 0.987 0.991 0.997 0.984 0.968 0.970 0.977 0.979 0.999 0.996 0.991 0.987 0.028 New 0.987 0.993 1.000 0.996 0.975 0.975 0.980 0.988 0.977 0.984 0.974 0.960 0.956 0.954 0.974 0.026
Scale efficiency All Banks 0.977 0.982 0.982 0.982 0.926 0.930 0.905 0.917 0.931 0.935 0.938 0.954 0.936 0.962 0.945 0.079 Saving 0.977 0.979 0.997 1.000 0.988 1.000 0.983 0.920 0.953 0.988 0.956 0.989 0.967 0.984 0.981 0.022 Commercial 0.977 0.982 0.980 0.979 0.915 0.919 0.896 0.917 0.920 0.927 0.930 0.946 0.925 0.955 0.939 0.085
State-owned
0.949 0.957 0.948 0.945 0.767 0.783 0.686 0.749 0.788 0.851 0.884 0.946 0.885 0.909 0.860 0.118
Privately-owned
0.990 0.995 0.995 0.996 0.989 0.987 0.966 0.973 0.964 0.953 0.943 0.946 0.937 0.967 0.967 0.042
Old 0.970 0.978 0.974 0.973 0.881 0.887 0.833 0.866 0.875 0.906 0.922 0.938 0.897 0.922 0.916 0.103 New 0.989 0.990 0.991 0.992 0.983 0.982 0.958 0.967 0.965 0.948 0.936 0.953 0.948 0.978 0.964 0.045

Appendixes
222
(b) Asset transformation process
Win_ 1990
Win_ 1991
Win_ 1992
Win_ 1993
Win_ 1994
Win_ 1995
Win_ 1996
Win_ 1997
Win_ 1998
Win_ 1999
Win_ 2000
Win_ 2001
Win_ 2002
Win_ 2003
Average St-dev
Technical efficiency All Banks 0.958 0.944 0.956 0.963 0.962 0.931 0.920 0.942 0.921 0.935 0.939 0.941 0.951 0.943 0.942 0.057 Saving 0.996 1.000 1.000 0.993 0.993 1.000 1.000 1.000 0.995 1.000 1.000 1.000 1.000 1.000 0.994 0.010 Commercial 0.951 0.934 0.949 0.958 0.957 0.920 0.910 0.935 0.905 0.921 0.928 0.930 0.940 0.931 0.932 0.058
State-owned
0.971 0.941 0.933 0.929 0.958 0.894 0.895 0.892 0.855 0.896 0.894 0.895 0.928 0.882 0.912 0.069
Privately-owned
0.942 0.931 0.956 0.972 0.957 0.933 0.915 0.949 0.921 0.930 0.938 0.940 0.944 0.944 0.940 0.051
Old 0.970 0.956 0.955 0.953 0.962 0.913 0.914 0.907 0.861 0.887 0.901 0.910 0.922 0.904 0.922 0.060 New 0.914 0.891 0.935 0.967 0.947 0.934 0.907 0.963 0.948 0.956 0.950 0.946 0.955 0.949 0.943 0.052
Pure-technical efficiency All Banks 0.979 0.973 0.984 0.974 0.981 0.982 0.966 0.980 0.968 0.969 0.972 0.979 0.982 0.978 0.976 0.030 Saving 1.000 1.000 1.000 0.993 0.993 1.000 1.000 1.000 0.996 1.000 1.000 1.000 1.000 1.000 0.998 0.004 Commercial 0.975 0.968 0.982 0.971 0.979 0.979 0.962 0.977 0.960 0.963 0.968 0.974 0.979 0.973 0.972 0.031
State-owned
0.992 0.991 0.972 0.954 0.982 0.998 0.976 0.992 0.994 0.984 0.936 0.966 0.994 0.992 0.980 0.026
Privately-owned
0.967 0.956 0.987 0.979 0.977 0.969 0.957 0.972 0.949 0.956 0.977 0.976 0.974 0.969 0.969 0.032
Old 0.982 0.983 0.984 0.970 0.977 0.989 0.978 0.973 0.959 0.952 0.949 0.979 0.990 0.980 0.975 0.028 New 0.960 0.938 0.976 0.972 0.982 0.957 0.946 0.981 0.962 0.975 0.983 0.970 0.970 0.969 0.968 0.034
Scale efficiency All Banks 0.978 0.970 0.971 0.988 0.981 0.949 0.949 0.961 0.952 0.965 0.965 0.960 0.967 0.964 0.965 0.045 Saving 0.996 1.000 1.000 1.000 1.000 1.000 1.000 1.000 0.999 1.000 1.000 1.000 1.000 1.000 0.996 0.008 Commercial 0.975 0.965 0.966 0.986 0.978 0.941 0.943 0.957 0.943 0.957 0.959 0.954 0.960 0.956 0.959 0.046
State-owned
0.979 0.950 0.959 0.973 0.975 0.895 0.916 0.899 0.860 0.910 0.956 0.925 0.933 0.889 0.930 0.064
Privately-owned
0.973 0.973 0.970 0.992 0.980 0.963 0.952 0.976 0.971 0.972 0.960 0.962 0.968 0.973 0.969 0.033
Old 0.988 0.972 0.970 0.981 0.985 0.923 0.933 0.933 0.900 0.933 0.950 0.929 0.931 0.923 0.946 0.054 New 0.950 0.950 0.959 0.995 0.965 0.975 0.952 0.981 0.986 0.980 0.967 0.974 0.984 0.978 0.973 0.031

Appendixes
223
Appendix 6: Nature of return to scale (a) Efficiency in intermediation
2002-
04
2001-
03
2000-
02
1999-
01
1998-
00
1997-
99
1996-
98
1995-
97
1994-
96
1993-
95
1992-
94
1991-
93
1990-
92
1989-
91
IRS 0 0 3 0 1 1 0 0 0 0 0 1 2 0
CRS 17 12 11 14 16 16 16 15 14 12 13 13 13 11
All banks
DRS 19 23 20 19 15 14 13 13 11 11 8 7 6 10
IRS 0 0 0 0 0 0 0 0 0 0 0 1 0 0
CRS 5 2 4 5 4 5 3 2 3 2 3 2 2 2
Savings
DRS 1 4 2 1 2 1 2 2 0 1 0 0 1 1
IRS 0 0 3 0 1 1 0 0 0 0 0 0 2 0
CRS 12 10 7 9 12 11 13 13 11 10 10 11 11 9
Commercial
DRS 18 19 18 18 13 13 11 11 11 10 8 7 5 9
IRS 0 0 3 0 1 1 0 0 0 0 0 0 2 0
CRS 11 9 6 6 10 10 12 13 11 10 10 10 8 6
Privately-
owned
commercial DRS 13 14 13 15 9 8 6 5 5 4 2 2 2 6
IRS 0 0 0 0 0 0 0 0 0 0 0 0 0 0
CRS 1 1 1 3 2 1 1 0 0 0 0 1 3 3
State-
owned
commercial DRS 5 5 5 3 4 5 5 6 6 6 6 5 3 3
IRS 0 0 0 0 0 0 0 0 0 0 0 0 0 0
CRS 2 1 3 5 5 3 3 4 4 5 6 6 7 7
Old
commercial
DRS 10 11 9 7 7 9 9 8 8 7 6 6 4 5
IRS 0 0 3 0 1 1 0 0 0 0 0 0 2 0
CRS 10 9 4 4 7 8 10 9 7 5 4 5 4 2
New
commercial
DRS 8 8 9 11 6 4 2 3 3 3 2 1 1 4

Appendixes
224
(b) Efficiency in asset transformation
2002-
04
2001-
03
2000-
02
1999-
01
1998-
00
1997-
99
1996-
98
1995-
97
1994-
96
1993-
95
1992-
94
1991-
93
1990-
92
1989-
91
IRS 3 3 4 8 8 7 3 1 1 6 0 3 7 6
CRS 19 18 15 14 14 12 15 21 14 16 14 12 10 11
All banks
DRS 14 14 15 11 10 12 11 6 10 1 7 6 4 4
IRS 0 1 2 2 1 3 1 0 0 0 0 0 0 1
CRS 6 5 4 4 5 3 4 3 3 3 3 3 3 2
Savings
DRS 0 0 0 0 0 0 0 0 0 0 0 0 0 0
IRS 3 2 2 6 7 4 2 1 1 6 0 3 7 5
CRS 3 2 2 6 7 4 2 1 1 6 0 3 7 5
Commercial
DRS 13 13 11 10 9 9 11 18 11 13 11 9 7 9
IRS 14 14 15 11 10 12 11 6 10 1 7 6 4 4
CRS 13 13 11 8 8 8 10 15 9 8 7 5 3 7
Privately-
owned
commercial DRS 8 8 9 7 5 7 6 3 6 0 5 4 2 0
IRS 0 0 0 0 0 0 0 0 0 0 0 0 0 0
CRS 0 0 0 2 1 1 1 3 2 5 4 4 4 2
State-
owned
commercial DRS 6 6 6 4 5 5 5 3 4 1 2 2 2 4
IRS 0 0 0 0 0 0 0 0 0 2 0 1 3 1
CRS 1 1 1 3 3 3 4 9 5 9 7 7 6 7
Old
commercial
DRS 11 11 10 9 9 9 8 3 7 1 5 4 3 4
IRS 3 2 2 6 7 4 2 1 1 4 0 2 4 4
CRS 12 12 10 7 6 6 7 9 6 4 4 2 1 2
New
commercial
DRS 3 3 5 2 1 3 3 3 3 0 2 2 1 0

225
Appendix 7: Regression results – Determinants of te chnical efficiency
Commercial banks only All banks -Significant variables only Explanatory Variables
T(I) T(A) T(I) T(A)
Assets quality -1.542
[-1.50] -0.031
[-0.07] --1.172***
[-2.94]
Capital strength 0.374
[0.42] 0.242
[1.11] 0.0355
[0.35]
Collateral -4.766
[-1.44] -0.991
[-0.88]
GIM -0.177
[-0.37] -0.040
[-0.23]
Liquidity 0.851
[1.59] -0.150
[-0.79]
Profitability 5.994***
[2.56] -1.475
[-1.22] 6.408***
[3.78]
Purchased funds 1.669***
[3.70] -0.137
[-1.11] 1.530***
[1.13]
Operational risk 0.826**
[2.17] 0.858***
[5.62] 0.767***
[5.41] 0.998***
[5.92]
Size -0.042
[-1.08] -0.001
[-0.04]
Stock market capitalization 0.220***
[2.62] 0.053*
[1.78] 0.242***
[3.57] -0.087***
[-2.80]
GDP growth -0.468
[-0.26] 0.241
[0.33]
Inflation -1.086
[-1.09] 0.224
[0.52]
Commercial banks
-0.3751*** [-3.49]
-0.619*** [-5.21]
Privately-owned banks -0.030
[-0.30] -0.057
[-1.36] -0.083***
[-3.11]
Old banks 0.092
[1.21] -0.048*
[-1.73] -0.053**
[-2.49]
Political change -0.048
[-1.01] -0.032
[-1.51]
Intercept 0.891
[1.53] 0.569**
[2.48] 0.940***
[10.49] 1.045***
[8.60] R-squared Adjusted R-squared Log likelihood Avg. log likelihood Akaike info-criterion Schwarz criterion Jarque-Bera
0.75 0.70
168.03 1.87 -3.36 -2.88
14.90
0.60 0.53
215.99 2.12 -3.90 -3.46 2.84
0.70 0.68
197.67 190
-3.63 -3.53 29.23
0.58 0.55
236.23 2.13
-4.11 -3.92 1.411
[‘Z’ values are in the parentheses, ‘***’ indicates significant coefficients under 1% confidence level,‘**’ indicates significant coefficients under 5% confidence level and ‘*’ indicates significant coefficients under 10% confidence level]

226
Appendix 8: Regression results - Market structure, efficiency and operational performance
Explanatory variables NIM15 (Equation 6.1)
NIM26 (Equation 6.1)
MP 0.012
[0.46] 0.015
[0.60]
HHI 0.028
[0.44]
SE(I) 0.098
[1.62] 0.097
[1.60]
TE(I) -0.089
[-1.66]* -0.087
[-1.64]
Risk 0.010
[1.24] 0.010
[1.27]
Capital strength -0.032
[-2.21**] -0.033
[-2.31]**
Assets quality 0.022
[0.46] 0.018
[0.39]
Liquidity 0.045
[2.81]*** 0.048
[3.31]***
Inflation -0.066
[-1.21] -0.055
[-1.14]
GDPG -0.145
[-1.36] -0.122
[-1.31]
Old banks -0.005
[-1.60] -0.005
[-1.61]
Constant 0.025
[1.46] 0.027
[1.61] R2 Adjusted R2 F-statistic Jarque-Bera
0.270 0.199 3.797
376.130
0.269 0.204 4.186
384.000 [‘t’ values are in the parentheses, ‘***’ indicates significant coefficients under 1% confidence level,‘**’ indicates significant coefficients under 5% confidence level and ‘*’ indicates significant coefficients under 10% confidence level]
5 NIM1 excludes explanatory variables which are not considered as structural variables (such as
commercial banks and privately owned banks) and have demonstrated higher correlation coefficients (more than 0.800) with other explanatory variables.
6 NIM2 excludes all explanatory variables which have demonstrated higher correlation coefficients (more than 0.800) with other explanatory variables.

227
List of References
Abiad, A and Mody, A 2000, The Determinants of Financial Reform: Findings from a New Data Base, viewed 12th Augest 2004, <http://www.banxico.org.mx/ sitebanxicoingles/gpublicaciones/Seminarios/ing/dgie/apec/Financial%20Reform.pdf>.
Alam, IMS 2001, 'A Nonparametric Approach for Assessing Productivity Dynamics of Large U.S. Banks', Journal of Money, Credit & Banking, vol. v33, no. 1, pp. 121-39.
Ali, AI and Gstach, D 2000, 'The Impact of Deregulation during 1990-1997 on Banking in Austria', EMPIRICA, vol. 27, no. 3, pp. 265-81.
Andersen, P and Petersen, CN 1993, 'A Procedure for Ranking Efficient Units in Data Envelopment Analysis', Management Science, vol. 39, no. 10, pp. 1261-4.
Arestis, P, Nissanke, M and Stein, H 2003, Financial and Development: Institutional and Policy Alternatives to Financial Liberalization, The Levy Economics Institute of Bard Collage, New York.
Ariyarathna, TW 1993, 'Changes in the banking and the Financial sector in Sri Lanka Since 1985', Sri Lanka Economic Journal, vol. 8, no. 1, pp. 1-29.
Arshadi, N and Karels, GV 1997, Modern Financial Intermediaries and Markets, 1st edn, Prentice Hall, New Jersey.
Ashton, J 1999, A Test of Perfect Competition in the UK Retail-banking Deposit Market, 1999-15, School of Finance and Law, Bournemouth University, Bournemouth.
Asmild, M, Paradi, JC, Aggarwall, V and Schaffnit, C 2004, 'Combining DEA Window Analysis with the Malmquist Index Approach in a Study of the Canadian Banking Industry', Journal of Productivity Analysis, vol. 21, no. 1, pp. 67-89.
Athanassopoulos, AD and Giokas, D 2000, 'The Use of Data Envelopment Analysis In Banking Institutions; Evidence from the Commercial Bank of Greece', Interfaces, vol. 30, no. 2, pp. 81-95.
AD, Soteriou, A and Zanios, S 1997, Disentangling within-and between-Country Efficiency Differences of Bank Branches, Financial Institution Centre, Wharton School of Business, University of Pennsylvania.
Athukorala, P and Rajapatirana, S 2000, 'Liberalization and Industrial Transformation: Lessons From the Sri Lankan Experience', Economic Development & Cultural Change;, vol. 48, no. 3, pp. 543-73.

228
Avkiran, NK 1990, Productivity Analysis in the Service Sector with Data Envelopment Analysis, Second Edition edn, Camira, Queensland.
---- 1999, 'The Evidence on Efficiency Gains: The Role of Mergers and the Benefits to the Public', Journal of Banking & Finance, vol. 23, no. 7, pp. 991-1013.
---- 2000a, 'Rising Productivity of Australian Trading Banks Under Deregulation 1986-1995', Journal of Economics and Finance, vol. 24, no. 2, pp. 122-40.
---- 2000b, Decomposition the Technical Efficiency of Trading Banks in the Deregulated Period, Department of Finance, University of Queensland, <http://afbc.banking.unsw.edu.au /afbc12/papers/avkiran.pdf>.
Ayadi, OF, Adebayo, AO and Omolehinwa, E 1998, 'Bank Performance Measurement in a Developing Economy: An Application of Data Envelopment Analysis', Managerial Finance, vol. 24, no. 7, pp. 5-16.
Bandara, A 1998, Implication of Financial Reforms In Sri Lanka, Economic Development Management for Asia and the Pacific Joint Policy Studies No. 5, Korea.
Banker, RD and Morey, RC 1986, 'Efficiency Analysis for Exogenously Fixed Inputs and outputs', Operations Research, vol. 34, no. 4, pp. 513-21.
Banker, RD, Charnes, A and Cooper, WW 1984, 'Some Models for Estimating Technical and Scale Efficiencies in Data Envelopment Analysis', Management Science, vol. 30, no. 9, pp. 1078-92.
Banker, RD, Cooper, WW, Seiford, LM, Thrall, RM and Zhu, J 2004, 'Returns to Scale in Different DEA Models', European Journal of Operational Research, vol. 154, no. 2, pp. 345-62.
Bank of Ceylon (1999), Annual Report 1999, Bank of Ceylon, Colombo.
Barr, R and Siems, T 1998, Benchmarking the Productive Efficiency of U.S. Banks, Financial Industry Studies, Federal Reserve Bank, Dallas.
Barr, R, Seiford, LM and Siems, T 1994, 'Forecasting Bank Failure; Non-parametric Frontier Estimation Approach', Recherches Economiques de Louvain, vol. 60, no. 4, pp. 417-29.
Barr, RS, Killgo, KA, Siems, TF and Zimmel, S 1999, 'Evaluating the Productive Efficiency and Performance of U.S. Commercial Banks', Managerial Finance, vol. 28, no. 8, pp. 3-25.
Barth, JR, Caprio, J, Gerard and Levine, R 2004, 'Bank regulation and supervision: what works best?' Journal of Financial Intermediation, vol. 13, no. 2, pp. 205-48.

229
Batchelor, VB and Gerrard, P 2002, 'The Productivity Growth of Commercial Banks in Singapore from 1997 to 2001', paper presented to Hawaii International Conference on Business, Sheraton Waikiki Hotel, Honolulu, Hawaii, USA, June 18 -21, 2003.
Bauer, PW, Berger, AN, Ferrier, GD and Humphrey, DB 1998, 'Consistency Conditions for Regulatory Analysis of Financial Institutions: A Comparison of Frontier Efficiency Methods', Journal of Economics and Business, vol. 50, no. 2, pp. 85-114.
Bera, AK, Jarque, CM and Lee, L-F 1984, 'Testing the Normality Assumption in Limited Dependent Variable Models', International Economic Review, vol. 25, no. 3, pp. 563-78.
Berg, SA, Forsund, FR and Jansen, ES 1992, 'Malmquist Indices of Productivity Growth during the Deregulation of Norwegian Banking, 1980-89', Scandinavian Journal of Economics, vol. 94, no. Supplement, pp. 211-28.
Berg, SA, Forsund, FR, Hjalmarsson, L and Suminen, M 1993, 'Banking Efficiency in the Nordic Countries', Journal of Banking and Finance, vol. 17, no. 2 & 3, pp. 371-88.
Bergendahl, G 1998, 'DEA and Benchmarks, An Application to Nordic Banks', Annals of Operation Research, vol. 82, pp. 233-49.
Berger, AN 1995, 'The Profit-Structure Relationship in Banking-Tests of Market-Power and Efficient-Structure Hypotheses', Journal of Money, Credit and Banking., vol. 27, no. 2, pp. 404-31.
Berger, AN and Hannan, T 1989, 'The Price-Concentration Relationship in Banking', Review of Economics & Statistics, vol. 71, no. 2, pp. 291-9.
---- 1993, Using Efficiency Measures to Distinguish Among Alternative Explanations of the Structure Performance Relationship, Working Paper - Federal Reserve Board, Washington, DC.
---- 1994, The Efficiency Cost of Market Power in the Banking Industry: A Test of the 'Quiet Life' and Related Hypotheses, Financial Institutions Centre, The What School, University of Pennsylvania, viewed May 4 2006, <http://fic.wharton.upenn.edu/ fic/papers/94/9429.pdf>.
Berger, AN and De Young, R 1997, 'Problems Loans and Cost Efficiency in Commercial Banks', Journal of Banking and Finance, vol. 21, no. 6, pp. 849-70.
Berger, AN and Mester, LJ 1997, 'Inside the Black Box: What Explains Differences in the Efficiencies of Financial Institutions?' Journal of Banking and Finance, vol. 21, no. 7, pp. 895-947.

230
Berger, AN and Humphrey, DB 1997, 'Efficiency of Financial Institutions: International Survey and Direction for the Future Research', European Journal of Operation Research, vol. 98, no. 2, pp. 175-212.
Berger, AN, Hunter, WC and Timme, SG 1993, 'The Efficiency of Financial Institutions: A review and preview of research past, present and future', Journal of Banking and Finance, vol. 17, no. 2-3, pp. 221-49.
Berger, AN, Kunt, D, Levine, R and Haubrich, GJ 2004, 'Bank Concentration and Competition: An Evolution in the Making', Journal of Money, Credit & Banking, vol. 36, no. 3, pp. 433-52.
Bikker, JA and Haaf, K 2002, 'Competition, Concentration and Their Relationship: An Empirical Analysis of the Banking Industry', Journal of Banking & Finance, vol. 26, no. 11, pp. 2191-214.
Bowlin, WF 1998, 'Measuring Performance, Introduction to Data Envelopment Analysis', Journal of Cost Analysis, vol. 1998, no. Fall, pp. 3-27.
Brown, R 2001, Data Envelopment Analysis; Application Issues in the Financial Service Sector, Department of Finance, The University of Melbourne, Melbourne.
Burki, AA and Niazi, GSK 2003, 'The Effect of Privatisation, Competition and Regulation on Banking Efficiency in Pakistan, 1991-2000', paper presented to Regulatory Impact Assume: Strengthening Regulation Policy and Practice, Chancellor Conference Center, University of Manchester, Manchester, UK, 12th November 2003.
Camanho, A and Dyson, R 2004, 'Cost Efficiency, Production and Value-added Models in the Analysis of Bank Branch Performance', Journal of the Operational Research Society, vol. 56, no. 5, pp. 483-94.
Canhoto, A and Dermine, J 2003, 'A Note on Banking Efficiency in Portugal, New vs. Old banks', Journal of Banking & Finance, vol. 27, no. 11, pp. 2087-98.
Carey, M 2002, 'A guide to choosing absolute bank capital requirements', Journal of Banking & Finance, vol. 26, no. 5, pp. 929-51.
Casu, B and Girardone, C 2002, 'A Comparative Study of the Cost Efficiency of Italian Bank Conglomerates', Managerial Finance, vol. 28, no. 9, pp. 3-23.
Casu, B and Girardone, C 2005, 'An analysis of the relevance of off-balance sheet items in explaining productivity change in European banking', Applied Financial Economics, vol. 15, no. 15, p. 1053–61.
Casu, B, Girardone, C and Molyneux, P 2004, 'Productivity Change in European Banking: A Comparison of Parametric and Non-parametric Approaches', Journal of Banking & Finance, vol. 28, no. 10, pp. 2521-40.

231
Casu, B and Molyneux, P 2003, 'A Comparative Study of Efficiency in European Banking', Applied Economics, vol. 35, no. 17, p. 1865–76.
Caves, DW, Christensen, LR and Diewert, WE 1982, 'The Economic Theory of Index Numbers and the Measurement of Input, Output, and Productivity', Econometrica, vol. 50, no. 6, pp. 1393-414.
CBSL, Annual Reports (Various issues), Central banks of Sri Lanka, Colombo.
Chaffai, ME, Dietsch, M and Lozano-Vivas, A 2001, 'Technological and Environmental Differences in the European Banking Industries', Journal of Financial Services Research, vol. 19, no. 2-3, pp. 147-62.
Chakrabarti, R and Chawla, G 2002, Bank Efficiency in India Since the Reforms – An Assessment, viewed 5th December 2005, <http://www.prism.gatech.edu/ ~rc166/bank%20efficiency.pdf>.
Charnes, A, Cooper, WW and Rhodes, E 1978, 'Measuring Efficiency of Decision Making Units', European Journal of Operation Research, vol. 2, no. 6, pp. 429-44.
Charnes, A, Cooper, WW, Huang, ZM and Sun, DB 1990, 'Polyhedral Cone Ratio DEA Models with an Illustrative Application in Large Commercial Banks', Journal of Econometrics, vol. 46, no. 1-2, pp. 73-91.
Charnes, A, Cooper, WW, Lewin, A and Seiford, LM 1997, Data Envelopment Analysis: Theory, Methodology and Application, Kluwer Academic Publishers, Boston/ Dordrecht, London.
Charnes, A, Cooper, WW, Golany, B, Seiford, L and Stutz, J 1985, 'Foundations of Data Envelopment Analysis for Pareto-Koopmans Efficient Empirical Production Functions', Journal of Econometrics, vol. 30, no. 1-2, p. 91–107.
Chen, T-y 2002, 'Measuring Operation, Market and Financial Efficiency in the Management of Taiwan’s Banks', Services Marketing Quarterly, vol. 24, no. 2, pp. 15-27.
Cinca, CS, Molinero, CM and Garcia, FC 2002, Behind DEA Efficiency in Financial Institutions, Discussion Papers in Accounting and Finance AF02, University of Southampton, viewed 13th November 2004, <http://www.management.soton.ac.uk/research/publications/documents/AF02-7.pdf>.
Claeys, S and Vennet, VR 2003, Determinants of bank interest margins in Central and Eastern Europe. Convergence to the West?, Faculteit Economie en Bedrijfskunde, Universiteit Gent, viewed 12th January 2006, <http://www.feb.ugent.be/fac/research/WP/Papers/ wp_03_203.pdf>.

232
Coelli, T and Perelman, S 1999, 'A Comparison of Parametric and Non-parametric Distance Functions: With Application to European Rail Way', European Journal of Operation Research, vol. 117, no. 2, pp. 326-39.
Coelli, T, Rao, DSP and Battese, GE 1998, An Introduction to Efficiency and Productivity Analysis, Kulvwer Academic Publisher, London.
Cooper, WW, Seiford, LM and Kaoru, T 2000, Data Envelopment Analysis; A comprehensive Text with Models, Application, References and DEA-Solver Software, Kluwer Academic Publishers, Boston.
Cooray, A 2000, 'The Impact of Deregulation on Financial Market Efficiency in Sri Lanka', PhD thesis, The University of New South Wales.
Crystal, JS, Dages, BG and Goldberg, LS 2002, 'Has Foreign Bank Entry Led to Sounder Banks in Latin America?' Current Issues in Economic and Finance, vol. 8, no. 1, pp. 1-6.
Darrat, AF, Topuz, C and Yousef, T 2002, 'Assessing Cost and Technical Efficiency of Banks in Kuwait', paper presented to ERF 8th Annual Conference, Cairo, Egypt, January 2002.
Demirguc-Kunt, A, Laeven, L and Levine, R 2003, The Impact of Bank Regulations, Concentration, and Institution on Bank Margins, Working Paper - 3030, World Bank Policy Research Papers.
Denizer, CA, Dinç, M and Tarimcilar, M 2000, Measuring Banking Efficiency in the Pre- and Post-Liberalization Environment: Evidence from the Turkish Banking System, Working Paper - 2476, World Bank Policy Research Papers.
Devaney, M and Weber, WL 2000, 'Productivity Growth, Market Structure and Technological Change; Evidence from the Rural Banking Sector', Applied Financial Economics, vol. 10, no. 6, pp. 587-95.
Dietsch, M and Lozano-Vivas, A 2000, ‘How the Environment Determine the Efficiency of Banks: A Comparison Between French and Spanish Banking Industry’, Journal of Banking and Finance, Vol 24, no 6, pp. 985-1004.
Drake, L 2001, 'Efficiency and Productivity Change in UK Banking', Applied Financial Economics, vol. 11, no. 5, pp. 557-71.
Drake, L and Hall, MJB 2003, 'Efficiency in Japanese Banking: An Empirical Analysis', Journal of Banking & Finance, vol. 27, no. 5, pp. 891-917.
Drake, L and Simper, R 2003, Competition and Efficiency in UK Banking; The Impact of Corporate Ownership Structure, Working Papers - ERP03-07, Department of Economics, Loughborough University, Loughborough.

233
Drake, L, Hall, MJB and Simper, R 2006, 'The Impact of Macroeconomic and Regulatory Factors on Bank Efficiency: A Non-parametric Analysis of Hong Kong’s Banking System', Journal of Banking & Finance, vol. 30, no. 5, pp. 1443-66.
Dunham, D and Kelegama, S 1996, 'Economic Liberalisation and Structural Reforms: The experience of Sri Lanka 1977-93', in RN Ghosh, YM Melotte and S M.A.B. (eds), Economic Development and Change - South Asia and the Third World, New Age International Publishers, New Delhi.
---- 1997, 'Stabilization and adjustment: A Second Look at the Sri Lankan Experience, 1977-1993', The Developing Economies, vol. XXXV, no. 2, pp. 166-84.
Dunham, D and Jayasuriya, S 2005, Economic Liberalisation and Socio-Political Decay: A Case Study of Sri Lanka, Institute of Social Studies, The Hague, viewed December 2005, <http://www.devstud.org.uk/publications/papers/ conf01/ conf01dunham.doc>.
Dyson, RG, Allen, R, Camanho, AS, Podinovski, VV, Sarrico, CS and Shale, EA 2001, 'Pitfalls and protocols in DEA', European Journal of Operational Research, vol. 132, no. 2, pp. 245-59.
ECB 2002, Developments in Banks' Liquidity Profile and Management, European Central Bank, viewed December 2006, <http://www.ecb.int/pub/pdf/other/ banksliquidityprofile02en.pdf>.
Edey, M and Gray, B 1996, 'The Evolving Structure of the Australian Financial System', paper presented to The Future of the Financial System, H.C. Coombes Centre for Financial Studies, Kirribilli, NSW, 8-9 July 1996.
Elyasiani, E and Mehdian, SM 1990a, 'A Non-parametric Approach of Efficiency and Technological Change; The Case of Large Commercial Banks', Journal of Financial Services Research, vol. 4, no. 2, pp. 157-68.
---- 1990b, 'Efficiency in the Commercial Banking Industry: A Production Frontier Approach', Applied Economics, vol. 22, no. 4, pp. 539-52.
---- 1995, 'The Comparative Efficiency Performance of Small and Large US Commercial Banks in the Pre- and Post-deregulated Eras', Applied Economics, vol. 27, no. 11, pp. 1069-79.
English, M, Grosskopf, S, Hayes, K and Yaisawarng, S 1993, 'Output Allocative and Technical Efficiency of Banks', Journal of Banking & Finance, vol. 17, no. 2-3 SU -, pp. 349-66.
Fare, R, Grosskopf, S, Lindgre N, B and Roos, P 1994, 'Productivity change in Swedish pharmacies 1980–1989: A non parametric Malmquist approach', in A Charnes, WW Cooper, A Lewin and L Seiford (eds), Data Envelopment Analysis:

234
Theory, Methodology and Applications, Kluwer Academic Publisher, Boston, pp. 253-72.
Farrell, MJ 1957, 'The Measurement of Productivity and Efficiency', Journal of the Royal Statistical Society (Series A- General), vol. 120, no. 2, pp. 253-81.
Fat, CS and Hua, LG 1998, Share Performance and Efficiency of Banks in an Oligopolistic Market; Evidence form Singapore, National University of Singapore, Singapore.
Favero, CA and Papi, L 1995, 'Technical Efficiency and Scale Efficiency in the Italian Banking Sector: A Non-parametric Approach', Applied Economics, vol. 27, no. 4, pp. 385-96.
Fernando, DJG 1991, Financial Reforms in Sri Lanka 1977-1987, Central Bank of Sri Lanka, Colombo.
Fethi, MD, Jackson, PM and Weyman-Jones, TG 2002, An empirical study of Stochastic DEA and financial performance: The case of the Turkish commercial banking industry, Discussion Paper in Management and Organisation Studies 01/16, University of Leicester Management Centre,, Leicester.
Frei, FX and Haker, PT 1999, 'Projection Onto Efficient Frontiers; Theoretical and Computational Extensions to DEA', Journal of Productivity Analysis, vol. 11, no. 3, pp. 275-300.
Fried, HO, Lovell, CAK and Yaisawarng, S 1999, 'The Impact of Mergers on Credit Union Service Provision', Journal of Banking & Finance, vol. 23, no. 2-4, pp. 367-86.
Fried, HO, Lovell, CAK, Schmidt, SC and Yaisawarng, S 2002, 'Accounting for Environment Effects and Statistical Noise in Data Envelopment Analysis', Journal of Productivity Analysis, vol. 17, no. 1-2, pp. 157-74.
Fu, XM and Heffernan, S 2005, China: The Effects of Bank Reform on Structure and Performance, Cass Business School, City University, <http://www.cass.city.ac.uk/facfin/papers/WP2005/WP19_Fu_Heffernan.pdf>.
Fukuyama, H 1995, 'Measuring Efficiency and Productivity Growth in Japanese Banking: A Nonparametric Frontier Approach', Applied Financial Economics, vol. 5, no. 2, pp. 95-107.
Fukuyama, H and Weber, WL 2002, 'Estimating Output Allocative Efficiency and Productivity Change: Application to Japanese Banks', European Journal of Operational Research, vol. 137, no. 1, pp. 177-90.

235
Gilbert, RA 1984, 'Bank Market Structure and Competition', Journal of Money, Credit & Banking, vol. 16, no. 4 (Part II), pp. 617-45.
Girardone, C, Molyneux, P and Gardener, EPM 1997, Analysing the Determinants of Bank Efficiency: The Case of Italian Banks, School of Accounting, Banking and Economics, University of Wales, United Kndom, viewed 23rd March 2005, <http://www.ivie.es/downloads/ws/ireb/ponencia04.pdf>.
Golany, B and Storbeck, JE 1998, 'A Data Envelopment Analysis of the Operational Efficiency of Bank Branches', Interfaces, vol. 29, no. 3. pp. 14-26.
Goldberg, LG and Rai, A 1996, 'The Structure-performance Relationship for European Banking', Journal of Banking & Finance, vol. 20, no. 4, pp. 745-71.
Grabowski, R, Rangan, N and Rezvanian, R 1993, 'Organizational Forms in Banking: An Empirical Investigation of Cost Efficiency', Journal of Banking & Finance, vol. 17, no. 2-3, pp. 531-8.
Grifell-Tatje, E and Lovell, CAK 1996, 'Deregulation and Productivity Decline: The Case of Spanish Savings Banks', European Economic Review, vol. 40, no. 6, pp. 1281-303.
Griffin, PM and Kvam, PH 1999, 'A Quantile-based Approach for Relative Efficiency Measurement', Managerial and Decision Economics, vol. 20, no. 8, pp. 403-10.
Grigorian, DA and Manole, V 2002, Determinants of Commercial Bank Performance in Transition: An Application of Data Envelopment Analysis., Working Paper 2850, World Bank Policy Research.
Gujarati, DN 2003, Basic Econometric, International Edition (Fourth Edition) edn, McGraw Hill, Boston.
Hannan, T 1997, 'Market Share Inequality, the Number of Competitors, and the HHI: An Examination of Bank Pricing', Review of Industrial Organization, vol. 12, no. 1, pp. 23-35.
Harper, IR and Leslie, P 1993, 'The Case of Financial Deregulation: Economic Rationalism on Trial', in S King and P Lloyd (eds), Economic Rationalism: Dead End or Way Forward?, Allen and Unwin, 84-107.
Hasan, I, Lozano-Vivas, A and Pastor, JT 2000, 'Cross-broader Performance in European Banking', paper presented to Competition Among Banks; Good or Bad", Frankfurt, Germany.
Havrylchyk, O and Scharrnstrabe, G 2004, 'Efficiency of the Polish Banking Industry - Foreign versus Domestic Banks.' paper presented to Economic, Econometric

236
and Cross-Disciplinary Aspects of European Union Enlargement, Conference at EUI (Florence), on May 13th - 15th, 2004.
Heffernan, S 1996, Modern Banking Theory and Practice, Johan Wiley and Sons, Chichester, New York, Brisbane.
Hellmann, TF, Murdock, KC and Stiglitz, JE 2000, 'Liberalization, Moral Hazard in Banking, and Prudential Regulation: Are Capital Requirements Enough?' American Economic Review, vol. 90, no. 1, pp. 147-65.
Hermalin, BE and Wallace, NE 1994, 'The Determinants of Efficiency and Solvency in Savings and Loans', RAND Journal of Economics, vol. 25, no. 3, pp. 361-81.
Hogan, WP 1992, Financial Deregulation: Fact and Fantasy, 171, The University of Sydney, Sydney, Australia.
Hoj, J, Galasso, V, Nicoletti, G and Dang, T-T 2006, The Political Economy of Structural Reform: Empirical Evidence from OECD Countries, Organisation of Economic Co-operation and Development, viewed June 2006, <http://www.olis.oecd.org/olis/2006doc.nsf/43bb6130e5e86e5fc 12569fa005d 004c/ 774ebe91ccc3c6cec12571b8002c30fd/$FILE/JT03212138.DOC>.
Hondroyiannis, G, Lolos, S and Papapetrou, E 1999, 'Assessing Competitive Condition in the Greek Banking system', International Financial Markets, Institutions and Money, vol. 9, no. 4, pp. 377-91.
Huang, T-H and Wang, M-H 2002, 'Comparison of Continue Efficiency Estimation Methods: Parametric and Non-parametric Techniques', The Manchester School, vol. 70, no. 5, pp. 682-709.
Humphrey, DB 1991, 'Productivity in Banking and Effect from Deregulation', Economic Review; Federal Bank of Richmond, vol. 1991 March/April, pp. 16-28.
Isik, I 2003, Efficiency Change, Technical Progress and Productivity Growth in Banking; The Initial Liberalisation Experience of Turkey, The Merrill Lynch Center, Hofstra University, Hempstead, NY.
Isik, I and Hassan, KM 2003a, 'Financial deregulation and total factor productivity change: An empirical study of Turkish commercial banks', Journal of Banking & Finance, vol. 27, no. 8, pp. 1455-85.
---- 2003b, 'Efficiency, Ownership and Market Structure, Corporate Control and Governance in the Turkish Banking Industry', Journal of Business Finance & Accounting, vol. 30, no. 9-10, pp. 1363-421.
Jackson, PM, Fethi, MD and Inal, G 1998, 'Efficiency and Productivity Growth in Turkish Commercial Banking Sector: A Non-parametric Approach', paper presented to The European Symposium on Data Envelopment Analysis-Recent

237
Development and Applications, The Hochschule Harz, Wernigerode, Germany, 16-18 October, 1998.
Jayeratne, J and Strahan, PE 1996, 'Entry Restriction, Industry Evolution and Dynamic Efficiency; Evidence from Commercial Banking', The Journal of Law and Economics, vol. 41, no. 1, pp. 239-74.
Jayesundara, PB and Indrarathna, Y 1991, 'Sri Lanka's Financial Sector Development with Special reference to Taxation of Financial Instruments', Staff Studies-Central Bank of Sri Lanka, vol. 21, no. 1&2, pp. 27-62.
Kantor, J and Maital, S 1999, 'Measuring Efficiency by Product Group; Integrating DEA with Activity Based Accounting in a Large Mideast Bank', Interfaces, vol. 29, no. 3 (1999 May-June), pp. 27-36.
Karunasena, AG 1999, 'Implication of Financial Sector Reforms in Sri Lanka', in M Tait, H Tracey and W Michael (eds), Policy Studies-5 - Financial Deregulation, Capital Flows and Macro-economic Management in the Asia Pacific, EDAP-UNDP Regional Project.
Karunasena, AG and Jayatissa, RA 1987, 'Implication of Monetary and Financial Reforms Adjustment and Growth: Sri Lanka's Experience', Staff Studies-Central Bank of Sri Lanka, vol. 17, no. 1&2, pp. 119-40.
Karunatilaka, HNS 1986, 'Fiscal and Monetary Policy in Sri Lanka with Special reference to the Period after 1997', Sri Lanka Economic Journal, vol. 1, no. 1, pp. 113-38.
---- 1988, 'An Examination of the New banking act', Sri Lanka Economic Journal, vol. 3, no. 1, pp. 1-16.
Kelegama, S 1989, 'The Speed and Stages of a trade Liberalisation Strategy: The case of Sri Lanka', Marga, vol. 10, no. 1, pp. 59-93.
Kohers, T, Huang, M-h and Kohers, N 2000, 'Market Perception of Efficiency in Bank Holding Company Mergers; The Role of the DEA and the SFA Models in Capturing Merger Potential', Review of Financial Economics, vol. 9, no. 2, pp. 101-20.
Krishnasamy, G 2004, 'Malaysian post Merger Banks' Productivity: Application of Malmquist Productivity Index', Managerial Finance, vol. 30, no. 4, pp. 63-74.
Kroszner, RS and Strahan, PE 1999, 'What Drives Deregulation? Economics and Politics of the Relaxation of Bank Branching Restrictions', Quarterly Journal of Economics, vol. 114, no. 4, pp. 1437-67.

238
Kumbhakar, SC and Heshmati, A 1999, 'Parametric Approaches to Productivity Measurement: A Comparison Among Alternative Models', Scandinavian Journal of Economics, vol. 101, no. 3, pp. 405-25.
Lal, D 1986, 'The political economy of Economic Liberalization', The World Bank Economic Review, vol. 1, no. 2, pp. 273-99.
La-Porta, RF, Lopez-de-Silanes and Shleifer, A 2002, 'Government Ownership of Banks', Journal of Finance, vol. 57, no. 1, pp. 265-301.
Leong, WH and Dollery, B 2002, The Productive Efficiency Of Singapore Banks: An Application and Extension Of The Barr Et Al (1999) Approach, Faculty of Economics, Business & Law, University of New England, viewed Jan 2004, <http://www.une.edu.au/economics/publications/econ_2002_9.pdf>.
Leong, WH, Dollery, B and Coelli, T 2002, 'Measuring Technical Efficiency of Banks in Singapore for the Period 1993-1999: An Application and Extension of the Bauer Et Al (1997) Technique', Working Paper Series in Economics: School of Economics, University of New England, Australia, vol. 2002-10.
Lloyd-Williams, DM, Molyneux, P and Thornton, J 1994, 'Market Structure and Performance in Spanish Banking', Journal of Banking & Finance, vol. 18, no. 3, pp. 433-43.
Lovell, CAK and Rouse, APB 2003, 'Equivalent Standard DEA Models to Provide Super-efficiency Scores', Journal of Operation Research Society, vol. 54, pp. 101-8.
Lozano-Vivas, A, Pastor, JT and Pastor, JM 2002, 'An Efficiency Comparison of European Banking Systems Operating under Different Environmental Conditions', Journal of Productivity Analysis, vol. 18, no. 1, pp. 59-77.
Maddala, GS 1992, Introduction to Econometrics, Second edn, Prantice Hall, Englewood, Cliffs, NJ.
Maghyereh, A 2004, 'The Effect of Financial Liberalization on the Efficiency of Financial Institutions: The Case of Jordanian Commercial Banks', Hashemite University.
Maudos, J, J. M. Pastor, 2002, 'Competition and Efficiency in the Spanish Banking Sector', Applied Financial Economics, vol. 12, no. 7, pp. 505-16.
McAllister, PH and McManus, DA 1993, 'Resolving the Scale Efficiency Puzzles in Banking', Journal of Banking & Finance, vol. 17, no. 2-3, pp. 389-405.
McKillop, DG, Glass, JC and Ferguson, C 2002, 'Investigating the Cost Performance of UK Credit Unions Using Radial and Non-radial Efficiency Measures.' Journal of Banking & Finance, vol. 26, no. 8, pp. 1563-92.

239
McKinnon, R 1973, Money and Capital in Economic Development, Brooking Institution, Washington, D.C.
Mester, L 1987, 'Efficient Production of Financial services; Scale and Scope economics', Business Review of Federal Reserve Bank of Philadelphia, vol. 1987, no. January/February.
Mester, LJ 1996, 'A study of Bank Efficiency Taking into Account Risk-preferences', Journal of Banking & Finance, vol. 20, no. 6, pp. 1025-45.
Miller, SM and Noulas, AG 1996, 'The technical efficiency of large bank production', Journal of Banking & Finance, vol. 20, no. 3, pp. 495-509.
---- 1998, Explaining Recent Connecticut Bank Failures: Did Managerial Inefficiency Play a Role, Department of Economics - The University of Connecticut, viewed 4th January 2005, <http://www.unlv.edu/ faculty/smiller/ CTBKDEA_PAPER.pdf>.
Molyneux, P 1999, Increasing Concentration and Competition in European Banking: The End of Anti-trust?, Cahiers Papers - European Investment Bank, viewed 8th March 2005, <http://www.eib.org/Attachments/efs/eibpapers/ y99n1v4/ y99n1a09.pdf>.
Molyneux, P and Forbes, W 1995, 'Market Structure and Performance in European Banking', Applied Economics, vol. 27, no. 2, pp. 155-9.
Moore, RR 1998, Concentration, Technology, and Market Power in Banking: Is Distance Dead?, Financial Industry Studies, Federal Reserve Bank of Dallas, viewed 12th December 2004, <http://faculty.smu.edu/barr/pubs/ fis98_12.pdf>.
Mukherjee, K, Ray, SC and Miller, SM 2001, 'Productivity Growth in Large US Commercial Banks: The Initial Post-deregulation Experience', Journal of Banking & Finance, vol. 25, no. 5, pp. 913-39.
Naceur, SB and Goaied, M 2001, 'The Determinants of the Tunisian Deposit banks' Performance', Applied Financial Economics, vol. 11, no. 3, pp. 317-9.
Noulas, AG 1997, 'Productivity Growth in the Hellenic Banking Industry: State Versus Private Banks', Applied Financial Economics, vol. 7, no. 3, pp. 223-8.
---- 2001, 'Deregulation and Operating Efficiency: The Case of the Greek Banks', Managerial Finance, vol. 27, no. 8, pp. 35-47.
Pal, M, Mukherjee, A and Nath, P 2000, Performance Analysis of The Indian Banks - An Exploration, Indian Institute of Management, viewed 12th December 2004.

240
Panzar, JC and Rosse, JN 1987, 'Testing for Monopoly Equilibrium', Journal of Industrial Economics, vol. 35, no. 4, pp. 443-56.
Pastor, JM 1999, 'Efficiency and Risk Management in Spanish Banking: A Method to Decompose Risk', Applied Financial Economics, vol. 9, no. 4, pp. 371-85.
---- 2002, 'Credit Risk and Efficiency in the European Banking System: A Three-Stage Analysis', Applied Financial Economics, vol. 12, no. 12, pp. 895-912.
People’s Bank (1999), Annual Report 1999, People’s Bank, Colombo.
Premachandra, IM 2001, 'A note on DEA vs principal component analysis: An improvement to Joe Zhu's approach', European Journal of Operational Research, vol. 132, no. 3, pp. 553-60.
Prior, D 2003, 'Long- and Short-run Non-parametric Cost Frontier Efficiency: An Application to Spanish Savings Banks', Journal of Banking & Finance, vol. 27, no. 4, pp. 655-71.
Prokopenko, J 1987, Productivity Management, Practical Handbook, International Labour Office, Geneva.
Punt, LW and Rooij, MCJV 1999, The Profit-structure Relationship, Efficiency and Mergers in the European Banking Industry: An Empirical Assessment, Research Department, Netherlands Central Bank, viewed 5th March 2006, <http://www.dnb.nl/dnb/pagina.jsp?pid=tcm:8-19233-64>.
Ralston, D, Wright, A and Garden, K 2001, 'Can Mergers Ensure the Survival of Credit Unions in the Third Millennium?' Journal of Banking & Finance, vol. 25, no. 12, pp. 2277-304.
Resti, A 1997, 'Evaluating the Cost-efficiency of the Italian Banking System: What can be Learned From the Joint Application of Parametric and Non-parametric techniques', Journal of Banking & Finance, vol. 21, no. 2, pp. 221-50.
Reynolds, D and Thompson, GM 2002, Multiunit Restaurant-Productivity Assessment; A Test of Data Envelopment Analysis, The Center for Hospitality Research, Cornell University, Cornell.
Robert, WV 1998, Market Power, Industrial Concentration and Innovative Activity, 98B20, Research Institute Systems, Organisations and Management, University of Groningen, Groningen.
Rogers, KE 1998, 'Nontraditional activities and the efficiency of US commercial banks', Journal of Banking & Finance, vol. 22, no. 4, pp. 467-82.

241
Rolf, F, Shawna, G, Mary, N and Zhongyang, Z 1994, 'Productivity Growth, Technical Progress, and Efficiency Change in Industrialized Countries', American Economic Review, vol. 84, no. 1, pp. 66-83.
Rosse, JN and Panzar, JC 1977, Chamberlin vs Robinson: An Empirical Study for Monopoly Rents, 90, Bell Laboratories Economic Discussion Papers.
Saha, A and Ravisankar, TS 2000, 'Rating of Indian Commercial Banks: A DEA Approach', European Journal of Operational Research, vol. 124, no. 1, pp. 187-203.
Salih, R 1999, Privatization in Sri Lanka, International Labour Organisation, viewed July 04 2005, <http://www.ilo.org/public/english/region/asro/bangkok/paper/ privatize/chap6.pdf>.
Santomero, AM 1984, 'Modelling the Banking Firm -A Survey', Journal of Money, Credit & Banking, vol. 16, no. 4 (Part II), pp. 576-602.
Sathye, M 2000, Efficiency of Banks in a Developing Economy: The Case of India, School of Accounting, Banking and Finance, University of Canberra, Canberra.
---- 2001, 'X-efficiency in Australian banking: An empirical investigation', Journal of Banking & Finance, vol. 25, no. 3, pp. 613-30.
Saxonhouse, GR 1976, 'Estimated Parameters as Dependent Variables', American Economic Review, vol. 66, no. 1, pp. 178-84.
Sealey, CW and Lindley, JT 1977, 'Inputs, Outputs and a theory of Production and Cost at Depositary Financial Institutions', The Journal of Finance, vol. 32, no. 4, pp. 1251-65.
Sengupta, JK 2000, 'Efficiency Analysis by Stochastic Data Envelopment Analysis.' Applied Economics Letter, vol. 7, no. 6, pp. 379-86.
Shaw, E 1973, Financial Deepening in Economic Development, Oxford University Press, New York.
Sherman, HD and Ladino, G 1995, 'Managing Bank Productivity Using Data Envelopment Analysis', Interfaces, vol. 25, no. 2.
Short, BK 1979, 'The Relation Between Commercial Bank Profit Rates and Banking Concentration in Canada, Western Europe, and Japan', Journal of Banking & Finance, vol. 3, no. 3, pp. 209-19.
Smirlock, M 1985, 'Evidence on the (Non) Relationship between Concentration and Profitability in Banking', Journal of Money, Credit and Banking, vol. 17, no. 1, pp. 69-83.

242
Smith, P 1997, 'Model Misspecification in Data Envelopment Analysis', Annals of Operation Research, vol. 73, pp. 233-52.
Sprent, P 1990, Applied Nonparametric Statistical Methods, Chapman and Hall, London, New York.
Stigler, GJ 1971, 'The Theory of Economic Regulation', The Bell Journal of Economics and Management Science, vol. 2, no. 1 (Spring), pp. 3-21.
Sturm, J-E and Williams, B 2004, 'Foreign Bank Entry, Deregulation and Bank Efficiency: Lessons from the Australian Experience', Journal of Banking & Finance, vol. 28, no. 7, pp. 1775-99.
Sundararajan, V, Enoch, C, San Jose, AS, Hilbers, PLC and Krueger, RCM, Marina Slack, Graham L. 2002, Financial Soundness Indicators: Analytical Aspects and Country Practices, Occasional Papers No 212, International Monetary Fund, Washington.
Tavares, G 2002, A Bibliography of Data Envelopment Analysis (1978-2001), Rutgers Center for Operation Research, Rutgers University, viewed 12th December 2005, <http://rutcor.rutgers.edu/pub/rrr/reports2002/ 1_2002.pdf>.
Tobin, J 1958, 'Estimation of Relationships for Limited Dependent Variables', Econometrica, vol. 26, no. 1, pp. 24-36.
Tortosa-Ausina, E 2002a, 'Exploring Efficiency Differences Over Time in the Spanish Banking Industry', European Journal of Operation Research, vol. 139, no. 3, pp. 643-64.
---- 2002b, 'Bank cost Efficiency and Output specification', Journal of Prductivity Analysis, vol. 18, no. 3, pp. 199-222.
---- 2003, 'Nontraditional Activities and Bank Efficiency Revisited: A Distributional Analysis for Spanish Financial Institutions', Journal of Economics and Business, vol. 55, no. 4, pp. 371-95.
Tortosa-Ausina, E, Grifell-Tatje, E, Armero, C and Conesa, D 2003, Sensitivity Analysis of Efficiency and Malmquist Productivity Indices: An Application to Spanish Savings Banks, Working Paper 2003/02, Center for Applied Economic Research, Departament d' Economia, Universitat Jaume I, Campus.
Webb, RM 2003, 'Levels of Efficiency in UK Retail Banks: A DEA Window Analysis', International Journal of the Economics of Business, vol. 10, no. 3, pp. 305-22.
Weill, L 2004, 'Measuring Cost Efficiency in European Banking: A Comparison of Frontier Techniques', Journal of Productivity Analysis, vol. 21, no. 2, pp. 133-52.

243
World Bank 2003, Sri Lanka-Financial Sector Quarterly Update-Highlights - Second Quarter 2003, World Bank Office, Colombo, <http://lnweb18.worldbank.org/sar/sa.nsf/Attachments/lanka7/$File/lanka7.pdf#search%22central%20bank%20of%20sri%20lanka%20Financial%20Sector%20Quarterly%20%22>.
Worthington, AC 2001, 'Efficiency in Pre-merger and Post-merger Non-bank Financial Institutions', Managerial and Decision Economics, vol. 22, no. 8, pp. 439-52.
Worthington, I, Briton, C and Rees, A 2004, Economics for Business: Blending Theory and Practice, 2nd edn, Prentice Hall, London.
Xue, M and Harker, PT 1999, Overcoming the Inherent Dependency of DEA Efficiency Scores:A Bootstrap Approach, Financial Institiution Center, The Wharton School, University of Pennsylvania, viewed 5th March 2005, <http://opim.wharton.upenn.edu/~harker/DEAboot.pdf>.
Yapa, MWYB 2003, 'Trade liberalisation and the Productivity Imperative In Manufacturing Industries of Sri Lanka', PhD thesis, The University of Queensland.
Yu, P and Neus, W 2005, Market Structure, Scale Efficiency, and Risk as Determinants of German Banking Profitability, Faculty of Economics and Business, University of Tübingen, viewed 20th March 2006, <http://w210.ub.uni-tuebingen.de/dbt/volltexte/2005/1787/>.
Yue, P 1992, 'Data Envelopment Analysis and Commercial Bank Performance: A Primer with Applications to Missouri Banks', Review, Federal Reserve Bank of St. Louis, vol. 74, no. 2, pp. 31-43.
Zanios, C, Zanios, S, Agathocleous, K and Soteriou, A 1999, 'Benchmark of the Efficiency of Bank Branches', Interfaces, vol. 29, no. 3 (1999 May-June).
Copyright © 2022 FDOKUMEN