Governing Militaries in Liberalizing Economies: China, Iran ...
Upload
khangminh22Category
view
3download
0
RESEARCH Open Access
Size, efficiency, market power, andeconomies of scale in the Africanbanking sectorSimplice A. Asongu1,2* and Nicholas M. Odhiambo1
* Correspondence:[email protected];[email protected] of Economics,University of South Africa, P. O. Box392, Pretoria 0003, South Africa2Department of Economics &Development Studies, CovenantUniversity, Ota, Nigeria
Abstract
There is a growing body of evidence that interest rate spreads in Africa are higherfor big banks compared to small banks. One concern is that big banks might beusing their market power to charge higher lending rates as they become larger,more efficient, and unchallenged. In contrast, several studies found that when banksize increases beyond certain thresholds, diseconomies of scale are introduced thatlead to inefficiency. In that case, we also would expect to see widened interestmargins. This study examines the connection between bank size and efficiency tounderstand whether that relationship is influenced by exploitation of market poweror economies of scale. Using a panel of 162 African banks for 2001–2011, weanalyzed the empirical data using instrumental variables and fixed effects regressions,with overlapping and non-overlapping thresholds for bank size. We found two keyresults. First, bank size increases bank interest rate margins with an inverted U-shapednexus. Second, market power and economies of scale do not increase or decrease theinterest rate margins significantly. The main policy implication is that interest ratemargins cannot be elucidated by either market power or economies of scale. Otherimplications are discussed.
Keywords: Sub-Saharan Africa, Banks, Lending rates, Efficiency, Quiet life hypothesis,Competition
JEL classifications: E42, E52, E58, G21, G28
IntroductionOver the decade since the 2008 financial crisis, the literature on banking and finance
has seen renewed interest in a number of areas, including the nexus between loan
growth, regulation, diversification, and competition, and the development indicators
for risk, capital management, and efficiency of banks (Kashif et al. 2016; Bokpin 2016;
Fanta 2016; Zheng et al. 2017; Ozili 2017; Khraisha and Arthur 2018). Interest has also
grown regarding banking industry performance in terms of allocation efficiency, risk
management and profitability (Moudud-Ul-Huq 2017; Hamdi et al. 2018), the applica-
tion of manifold learning approaches (Huang and Kou 2014; Yan et al. 2017), and the
implications of Basel III for banking sector development (Ramlall and Mamode 2017).
Financial intermediation represents the fundamental mission of banks to mobilize
deposits into credit for economic operators. This paper was motivated by two main
Financial Innovation
© The Author(s). 2019 Open Access This article is distributed under the terms of the Creative Commons Attribution 4.0 InternationalLicense (http://creativecommons.org/licenses/by/4.0/), which permits unrestricted use, distribution, and reproduction in any medium,provided you give appropriate credit to the original author(s) and the source, provide a link to the Creative Commons license, andindicate if changes were made.
Asongu and Odhiambo Financial Innovation (2019) 5:4 https://doi.org/10.1186/s40854-019-0120-x
considerations in scholarly and policy circles: (1) the ongoing debate about the relation-
ship between bank size and the efficiency of financial intermediation, and (2) gaps in
the existing literature regarding this subject. Questions about the role of bank size in
improving efficiency in the banking sector are reflected in the work of various
researchers, including Asongu et al. (2016); Boateng et al. (2018), and Asongu and
Odhiambo (2018). Existing research maintains that some big banks might abuse their
market power instead of leveraging economies of scale to increase their efficiency in
financial intermediation. The mechanisms for enhancing financial intermediation
include, inter alia, increasing the quantity of loans, decreasing the price of loans (i.e.,
interest rates and fees), and reducing information asymmetry between borrowers and
lenders (Kusi et al. 2017; Kusi and Opoku Mensah 2018; Tchamyou 2018a, b).
There is a growing body of evidence that for big banks in Africa, interest rate spreads
are higher as compared to small banks (Beck and Hesse 2006; Ahokpossi 2013).1
Interest rate spreads have been used widely in the literature to indicate the level of
banking sector efficiency (Dabla-Norris and Floerkemeier 2007; Chortareas et al. 2012;
Asongu 2017). Big banks are expected to have lower margins because they have more
opportunities to leverage their size to achieve economies of scale. This capacity for
leverage should allow the larger banks to benefit from lower funding costs compared to
the smaller banks. Therefore, it would be reasonable to surmise that one of the main
benefits of bigger size would be gains in efficiency that transfer to the banks’ customers
through higher deposit rates, lower lending rates, and lower overall interest spreads.
However, research indicates that this expectation is not being met. Big banks worldwide
continue to be more inefficient than their smaller counterparts, which is a paradox
(Mitchell and Onvural 1996; Karray and Chichti 2013; Asongu et al. 2018a; Asongu
and Biekpe 2018).2 Therefore, concerns are emerging about the role of bank size in
improving efficiency in the banking sector (Karray and Chichti 2013).
Two arguments have been put forward that attempt to explain this paradox. The first
view holds that as big banks become bigger, more efficient, and unchallenged, they tend
to abuse their power to exploit customers by creating monopolistic practices (Mitchell
and Onvural 1996). The second argument is that increased bank size beyond certain
thresholds introduces diseconomies of scale that in turn lead to inefficiency. According
to this view, larger banks find themselves with higher and higher average costs as they
grow beyond a crucial threshold, and these costs lead to wider interest margins and
inefficiency (Berger et al. 1987; Noulas et al. 1990; Mester 1992; Clark 1996; Karray and
Chichti 2013).3 In other words, contrary to expectations, increased size beyond the
identified threshold would widen interest margins to the detriment of customers.
In the light of the above, the problem to be addressed can be stated as follows: “Is
the relationship between bank size and efficiency influenced by exploitation of market
power or economies of scale?” To the best of our knowledge, the existing literature
regarding African financial development has not focused on this underlying question
for banks.4 This paper contributes to the literature by providing a deep examination of
the connection between bank size and efficiency in Africa, with the concurrent goal of
determining whether that association is influenced by abuse of market power or
economies of scale. For this research, we used a panel of 162 African banks with data
for 2001–2011, and we analyzed the empirical evidence using instrumental variables
and fixed effects regressions. Our research provided two key results. First, we found
Asongu and Odhiambo Financial Innovation (2019) 5:4 Page 2 of 22
that bank size increases the interest rate margins enjoyed by a bank, following an inverted
U-shaped curve. Second, market power and economies of scale do not increase or de-
crease the interest rate margins significantly. The main policy implication is that interest
rate margins cannot be elucidated by market power or economies of scale.
The remainder of this paper is organized as follows. Literature review and
clarification of concepts section provides a review of the related literature and clarifica-
tion of the concepts used in this work. Bank size, market power, and efficiency section
presents our data and methodology, and the empirical results are given in Economies
and efficiency in the banking industry section. Cost efficiency section provides our con-
clusion, including the implications of our findings and suggestions for future research.
Literature review and clarification of conceptsBank size, market power, and efficiency
An examination of the existing literature reveals that there is no consensus about the
relationship between bank size, market power, and efficiency. The research findings
about the direction of the possible effects are subtle and sometimes ambiguous at best.
In this section of the paper, we take a detailed look at the prior literature and the
concepts related to our two lines of consideration: first, the relationship between bank
size and efficiency, and second, the nexus between market power and efficiency.
From an intuitive standpoint, we would expect to find a positive relationship between
bank size and efficiency because larger banks are more likely to develop technical,
financial, material, and human resources that enhance efficiency. However, since prob-
lems connected to agency, coordination, and other dysfunctionalities are more apparent
in larger firms, we might expect their smaller counterparts to generate relatively higher
efficiency scores.5 In addition to the U-shaped curve mentioned above, there is empir-
ical evidence regarding economies of scale in the banking industry. Berger and Mester
(1997) found that while bigger banks were slightly more cost effective, smaller banks
were more cost efficient. Their results demonstrated that with increasing size, the
banks studied were more able to increase control over costs, but they found it more
difficult to generate income and profit efficiently. This position was shared by
Srivastava (1999), who found higher average efficiencies for medium-sized banks,
followed by large banks. The finding that small banks were the least efficient confirmed
the position that the nexus between these factors is not positively monotonic. No clear
relationship between efficiencies and size has been established in the wealth of litera-
ture (Fukuyama 1993; Lang and Welzel 1996; Altunbas et al. 2000; Karray and Chichti
2013; Goldberg and Rai 1996; and Allen and Rai 1996), which both negates and sup-
ports the hypothesis that larger banks are associated with higher levels of inefficiency.
Empirical investigation of the connection between market power and efficiency has
included testing the Quiet Life Hypothesis (QLH). This view suggests that firms enjoy the
advantages of market power in terms of forgone revenues and cost savings. According to
this hypothesis, firms with higher market power put less effort into pursuing cost and
profit efficiencies. Instead of leveraging their size to cut costs and increase intermediation
efficiency, large banks prefer to enjoy a “quiet life” or the “exploitation of market power”
to reap higher profit margins (Hicks 1935; Maudos and De Guevara 2007; Koetter and
Vins 2008; Coccorese and Pellecchia 2010; Asongu and Nwachukwu 2018).
Asongu and Odhiambo Financial Innovation (2019) 5:4 Page 3 of 22
Economies and efficiency in the banking industry
In this part of the paper, we examine the seven economies of banking in terms of five
main considerations: cost efficiency, revenue efficiency, captivity efficiency, concentra-
tion efficiency, and the view that includes Xefficiency, scale efficiency, and scope
efficiency.
Cost efficiency
Many authors have argued that size brings economies of scale and accompanying cost
reductions (Mitchell and Onvural 1996; Karray and Chichti 2013). This view is based
on the belief that unavoidable costs, such as branding, commercial networks, informa-
tion and communication technology (ICT), and regulatory expenses, are more easily
absorbed through large volumes of business. However, as highlighted earlier, the litera-
ture has instead documented a U-shaped nexus between bank size and the unit costs of
banks. Moreover, large banks appear to work with more advanced technology, which
potentially limits their economies of scale.
Revenue efficiency
Consistent with De Keuleneer and Leszczynska (2012), revenue efficiency is determined
by bank-specific factors or other independent variables rather than bank size. There is
a threefold intuition motivating this line of thought. (1) Very large corporations use
banks of all sizes, provided that the banks offer good services. Hence, the idea that
large corporations request extensive privileges as a condition for dealing with a bank
(or conversely, that large clients are the most profitable and loyal) is not always
accurate. (2) It may be claimed that banks with large international networks can offer
superior services. However, a good network of correspondent banks can offer services
equivalent, or even superior, to a proprietary network whose foreign branches might be
insignificant locally and of little added value. (3) Whereas better diversification of risk
is also mentioned by advocates of large banks, risk diversification can be achieved in vari-
ous ways, notably through credit syndications and various credit insurance mechanisms
(Tchamyou et al. 2018).
Captivity efficiency
In accordance with De Keuleneer and Leszczynska (2012), captivity efficiency focuses
on the ambitions of large continental banks that aim to increase their control over the
distribution of financial products. While controlling their investments according to the
directive on Undertakings for Collective Investment in Transferable Securities (UCITS),
these banks also underwrite all kinds of structured products that they distribute, leaving
little choice to the clients they claim to advise. In so doing, they disclose little in-
formation to allow for transparent competition. Size procures an advantage in this
kind of abuse.
Concentration efficiency
The concept of concentration efficiency reflects the finding that many bankers still
pursue size as an objective in spite of the lack of a proven nexus between size and
efficiency or size and profitability (De Keuleneer and Leszczynska 2012). Advocates of
Asongu and Odhiambo Financial Innovation (2019) 5:4 Page 4 of 22
this idea note that relative size within a market is useful because market concentration
is rather well-correlated with higher profitability. Banking sectors with a higher degree
of concentration enable banks to charge higher margins, which justifies higher remu-
nerations for managers.
X-efficiency, scale efficiency, and scope efficiency
In line with Wagenvoort and Schure (1999), this view holds that when assessing
efficiency, a researcher should be interested in X-efficiency (whether banks use their
available inputs efficiently), scale efficiency (whether banks produce the right amount
of outputs), and scope efficiency (whether banks choose an efficient combination of
outputs).
Measurements
In this section, we discuss measures of market power and bank size, and indicators of
efficiency and economies of scale. In the banking literature, market power is measured
primarily with the Lerner index (Ariss 2010; Asongu et al. 2018b). This indicator
measures the extent to which a bank can set prices above its marginal costs. An
increase in the Lerner index is associated with greater market power. Two measures of
bank size have been used predominantly in the literature: systemic and absolute bank
size. Systemic bank size is measured either as the ratio of gross income to GDP
(Demirgüç-Kunt and Harry 2011) or bank assets as a percentage of GDP. A bank’s ab-
solute size may be defined as the log of total assets (Demirgüç-Kunt and Harry 2011)
or the ratio of bank total assets to total financial system assets (Beck et al. 1999).
Of the five categories of efficiencies described in Section 2.2 above, the concepts of
captivity and concentration efficiencies are not widely used in the empirical literature.
Hence, we consider the other three main themes: revenue efficiency, cost efficiency,
and economies of scale.6 As we have already highlighted above, interest rate
spreads are used to measure banking sector profit efficiency (Dabla-Norris and
Floerkemeier 2007; Chortareas et al. 2012). Profit efficiency scores from the trans-
log profit function are also indicators for revenue efficiency in the mainstream
banking literature (Koetter and Vins 2008; Ariss 2010). Cost efficiency is measured
with cost efficiency scores from the translog cost function (Koetter and Vins 2008;
Ariss 2010; Coccorese and Pellecchia 2010).
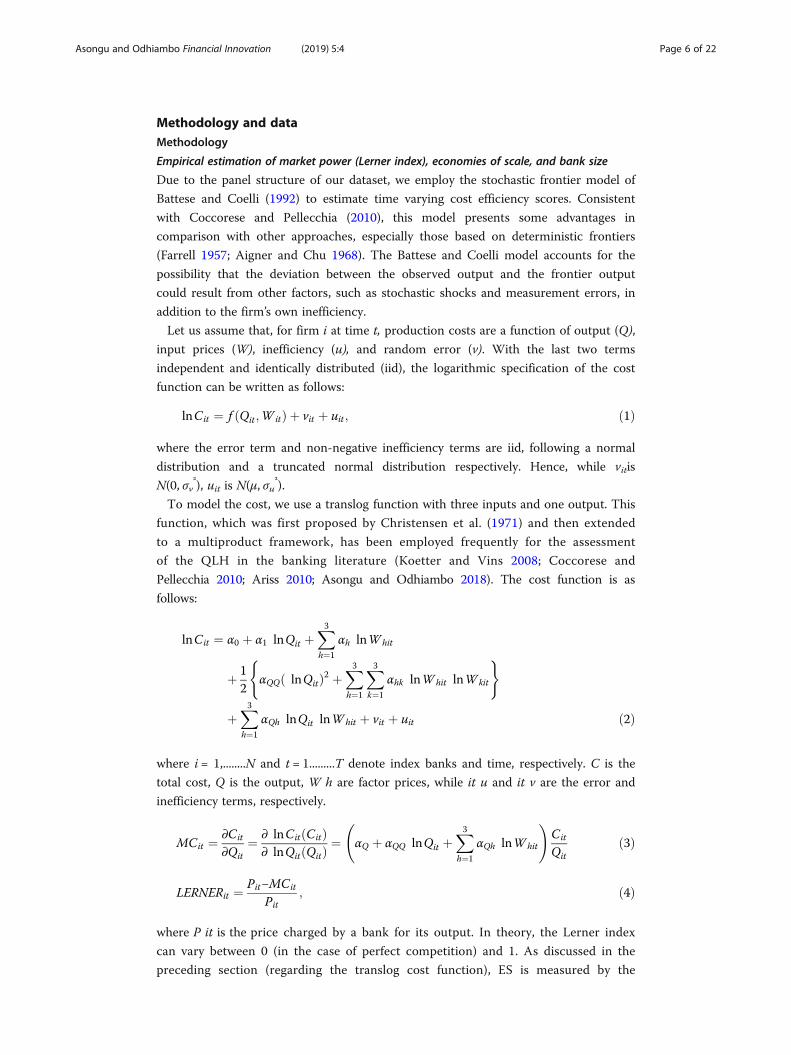
Economies of scale (ES) may be measured using various asset size classes (Wagenvoort
and Schure 1999). Dummy variables are then assigned to these asset classes and used as
independent variables in the cost equation. Returns to scale (RS) are appreciated based on
parameter estimates. While Wagenvoort and Schure (1999) employed a Cobb-Douglas
cost function, we use the translog to overcome some of the restrictive properties of the
Cobb-Douglas approach, namely single product output and a log-linear cost curve.
Consistent with Brown and O’Connor (1995 pp.7–8), from a translog cost function, ES is
measured by the sum of the derivations in the cost equation with respect to output. A
sum equal to one denotes constant RS, whereas a sum less (or greater) than one repre-
sents increasing (decreasing) RS. Accordingly, within the framework of this study, the ES
variable is the sum of the derivation of Cost (lnC) with respect to Output or Loans (LnQ).
Asongu and Odhiambo Financial Innovation (2019) 5:4 Page 5 of 22
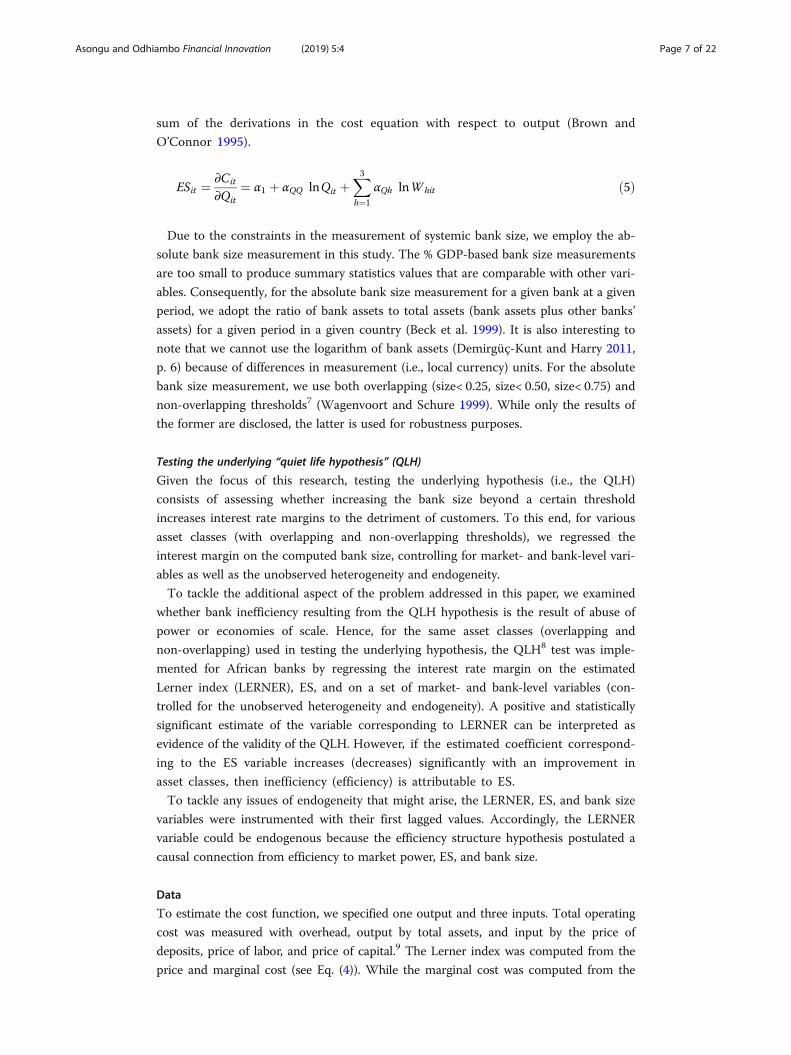
Methodology and dataMethodology
Empirical estimation of market power (Lerner index), economies of scale, and bank size
Due to the panel structure of our dataset, we employ the stochastic frontier model of
Battese and Coelli (1992) to estimate time varying cost efficiency scores. Consistent
with Coccorese and Pellecchia (2010), this model presents some advantages in
comparison with other approaches, especially those based on deterministic frontiers
(Farrell 1957; Aigner and Chu 1968). The Battese and Coelli model accounts for the
possibility that the deviation between the observed output and the frontier output
could result from other factors, such as stochastic shocks and measurement errors, in
addition to the firm’s own inefficiency.
Let us assume that, for firm i at time t, production costs are a function of output (Q),
input prices (W), inefficiency (u), and random error (v). With the last two terms
independent and identically distributed (iid), the logarithmic specification of the cost
function can be written as follows:
lnCit ¼ f Qit ;Witð Þ þ vit þ uit ; ð1Þ
where the error term and non-negative inefficiency terms are iid, following a normal
distribution and a truncated normal distribution respectively. Hence, while vitis
N(0, σv²), uit is N(μ, σu
²).
To model the cost, we use a translog function with three inputs and one output. This
function, which was first proposed by Christensen et al. (1971) and then extended
to a multiproduct framework, has been employed frequently for the assessment
of the QLH in the banking literature (Koetter and Vins 2008; Coccorese and
Pellecchia 2010; Ariss 2010; Asongu and Odhiambo 2018). The cost function is as
follows:
lnCit ¼ α0 þ α1 lnQit þX3
h¼1
αh lnWhit
þ 12
αQQ lnQitð Þ2 þX3
h¼1
X3
k¼1
αhk lnWhit lnWkit
( )
þX3
h¼1
αQh lnQit lnWhit þ vit þ uit ð2Þ
where i = 1,........N and t = 1.........T denote index banks and time, respectively. C is the
total cost, Q is the output, W h are factor prices, while it u and it v are the error and
inefficiency terms, respectively.
MCit ¼ ∂Cit
∂Qit¼ ∂ lnCit Citð Þ
∂ lnQit Qitð Þ ¼ αQ þ αQQ lnQit þX3
h¼1
αQh lnWhit
!Cit
Qitð3Þ
LERNERit ¼ Pit−MCit
Pit; ð4Þ
where P it is the price charged by a bank for its output. In theory, the Lerner index
can vary between 0 (in the case of perfect competition) and 1. As discussed in the
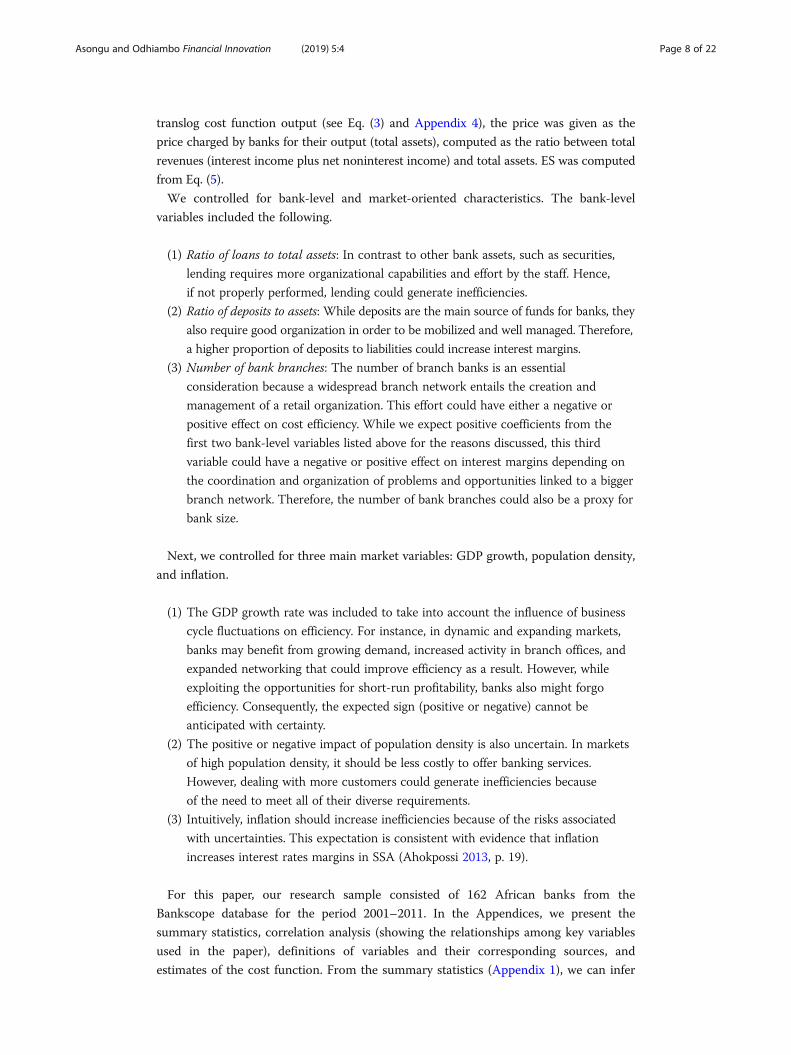
preceding section (regarding the translog cost function), ES is measured by the
Asongu and Odhiambo Financial Innovation (2019) 5:4 Page 6 of 22
sum of the derivations in the cost equation with respect to output (Brown and
O’Connor 1995).
ESit ¼ ∂Cit
∂Qit¼ α1 þ αQQ lnQit þ
X3
h¼1
αQh lnWhit ð5Þ
Due to the constraints in the measurement of systemic bank size, we employ the ab-
solute bank size measurement in this study. The % GDP-based bank size measurements
are too small to produce summary statistics values that are comparable with other vari-
ables. Consequently, for the absolute bank size measurement for a given bank at a given
period, we adopt the ratio of bank assets to total assets (bank assets plus other banks’
assets) for a given period in a given country (Beck et al. 1999). It is also interesting to
note that we cannot use the logarithm of bank assets (Demirgüç-Kunt and Harry 2011,
p. 6) because of differences in measurement (i.e., local currency) units. For the absolute
bank size measurement, we use both overlapping (size< 0.25, size< 0.50, size< 0.75) and
non-overlapping thresholds7 (Wagenvoort and Schure 1999). While only the results of
the former are disclosed, the latter is used for robustness purposes.
Testing the underlying “quiet life hypothesis” (QLH)
Given the focus of this research, testing the underlying hypothesis (i.e., the QLH)
consists of assessing whether increasing the bank size beyond a certain threshold
increases interest rate margins to the detriment of customers. To this end, for various
asset classes (with overlapping and non-overlapping thresholds), we regressed the
interest margin on the computed bank size, controlling for market- and bank-level vari-
ables as well as the unobserved heterogeneity and endogeneity.
To tackle the additional aspect of the problem addressed in this paper, we examined
whether bank inefficiency resulting from the QLH hypothesis is the result of abuse of
power or economies of scale. Hence, for the same asset classes (overlapping and
non-overlapping) used in testing the underlying hypothesis, the QLH8 test was imple-
mented for African banks by regressing the interest rate margin on the estimated
Lerner index (LERNER), ES, and on a set of market- and bank-level variables (con-
trolled for the unobserved heterogeneity and endogeneity). A positive and statistically
significant estimate of the variable corresponding to LERNER can be interpreted as
evidence of the validity of the QLH. However, if the estimated coefficient correspond-
ing to the ES variable increases (decreases) significantly with an improvement in
asset classes, then inefficiency (efficiency) is attributable to ES.
To tackle any issues of endogeneity that might arise, the LERNER, ES, and bank size
variables were instrumented with their first lagged values. Accordingly, the LERNER
variable could be endogenous because the efficiency structure hypothesis postulated a
causal connection from efficiency to market power, ES, and bank size.
Data
To estimate the cost function, we specified one output and three inputs. Total operating
cost was measured with overhead, output by total assets, and input by the price of
deposits, price of labor, and price of capital.9 The Lerner index was computed from the
price and marginal cost (see Eq. (4)). While the marginal cost was computed from the
Asongu and Odhiambo Financial Innovation (2019) 5:4 Page 7 of 22
translog cost function output (see Eq. (3) and Appendix 4), the price was given as the
price charged by banks for their output (total assets), computed as the ratio between total
revenues (interest income plus net noninterest income) and total assets. ES was computed
from Eq. (5).
We controlled for bank-level and market-oriented characteristics. The bank-level
variables included the following.
(1) Ratio of loans to total assets: In contrast to other bank assets, such as securities,
lending requires more organizational capabilities and effort by the staff. Hence,
if not properly performed, lending could generate inefficiencies.
(2) Ratio of deposits to assets: While deposits are the main source of funds for banks, they
also require good organization in order to be mobilized and well managed. Therefore,
a higher proportion of deposits to liabilities could increase interest margins.
(3) Number of bank branches: The number of branch banks is an essential
consideration because a widespread branch network entails the creation and
management of a retail organization. This effort could have either a negative or
positive effect on cost efficiency. While we expect positive coefficients from the
first two bank-level variables listed above for the reasons discussed, this third
variable could have a negative or positive effect on interest margins depending on
the coordination and organization of problems and opportunities linked to a bigger
branch network. Therefore, the number of bank branches could also be a proxy for
bank size.
Next, we controlled for three main market variables: GDP growth, population density,
and inflation.
(1) The GDP growth rate was included to take into account the influence of business
cycle fluctuations on efficiency. For instance, in dynamic and expanding markets,
banks may benefit from growing demand, increased activity in branch offices, and
expanded networking that could improve efficiency as a result. However, while
exploiting the opportunities for short-run profitability, banks also might forgo
efficiency. Consequently, the expected sign (positive or negative) cannot be
anticipated with certainty.
(2) The positive or negative impact of population density is also uncertain. In markets
of high population density, it should be less costly to offer banking services.
However, dealing with more customers could generate inefficiencies because
of the need to meet all of their diverse requirements.
(3) Intuitively, inflation should increase inefficiencies because of the risks associated
with uncertainties. This expectation is consistent with evidence that inflation
increases interest rates margins in SSA (Ahokpossi 2013, p. 19).
For this paper, our research sample consisted of 162 African banks from the
Bankscope database for the period 2001–2011. In the Appendices, we present the
summary statistics, correlation analysis (showing the relationships among key variables
used in the paper), definitions of variables and their corresponding sources, and
estimates of the cost function. From the summary statistics (Appendix 1), we can infer
Asongu and Odhiambo Financial Innovation (2019) 5:4 Page 8 of 22
that there was a sufficient degree of variation in the data to allow confidence that
reasonable estimated connections would emerge. The objective of the correlation
analysis (Appendix 2) was to mitigate issues of multicollinearity, and from an initial
assessment, there were no concerns in terms of the relationships to be estimated. There
was no correlation higher than 0.500, which is the rule of thumb for the absence of
multicollinearity. The highest correlation coefficient was 0.350. Moreover, the vari-
ance inflation factor was less than 10 (O’brien 2007). The definitions of variables
(and corresponding sources) are provided in Appendix 3, while components of the
cost function needed for the computation of marginal cost, the Lerner index, and
ES are provided in Appendix 4.
Empirical resultsPresentation of results
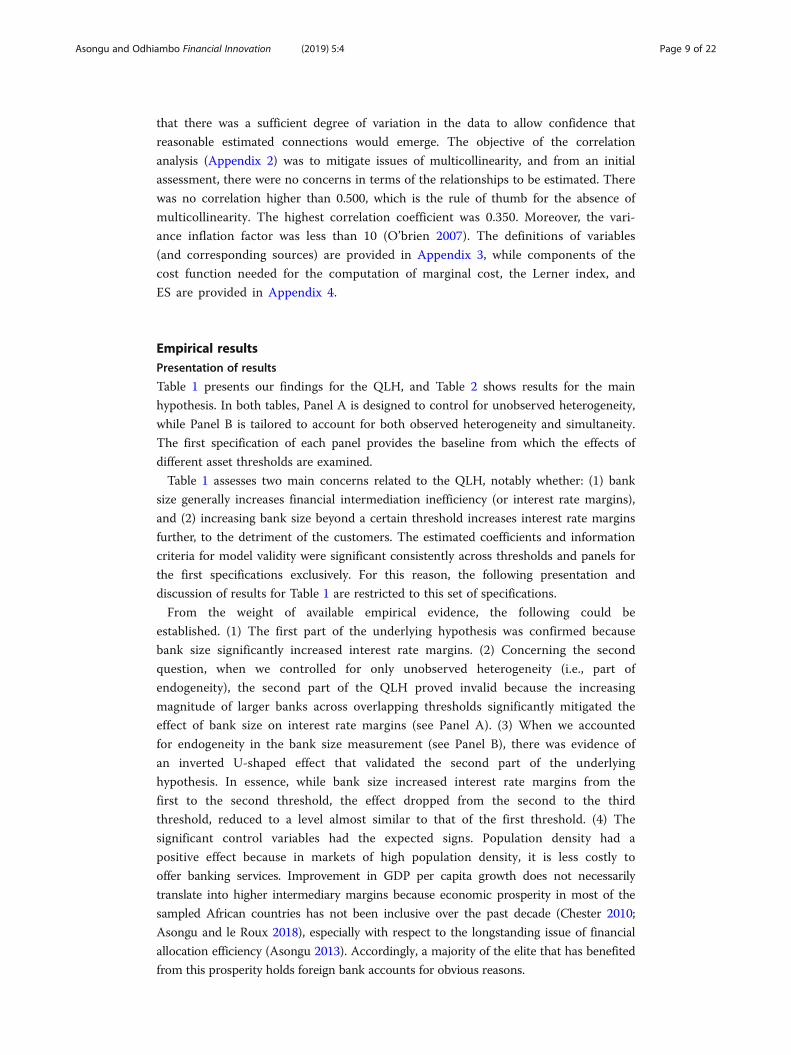
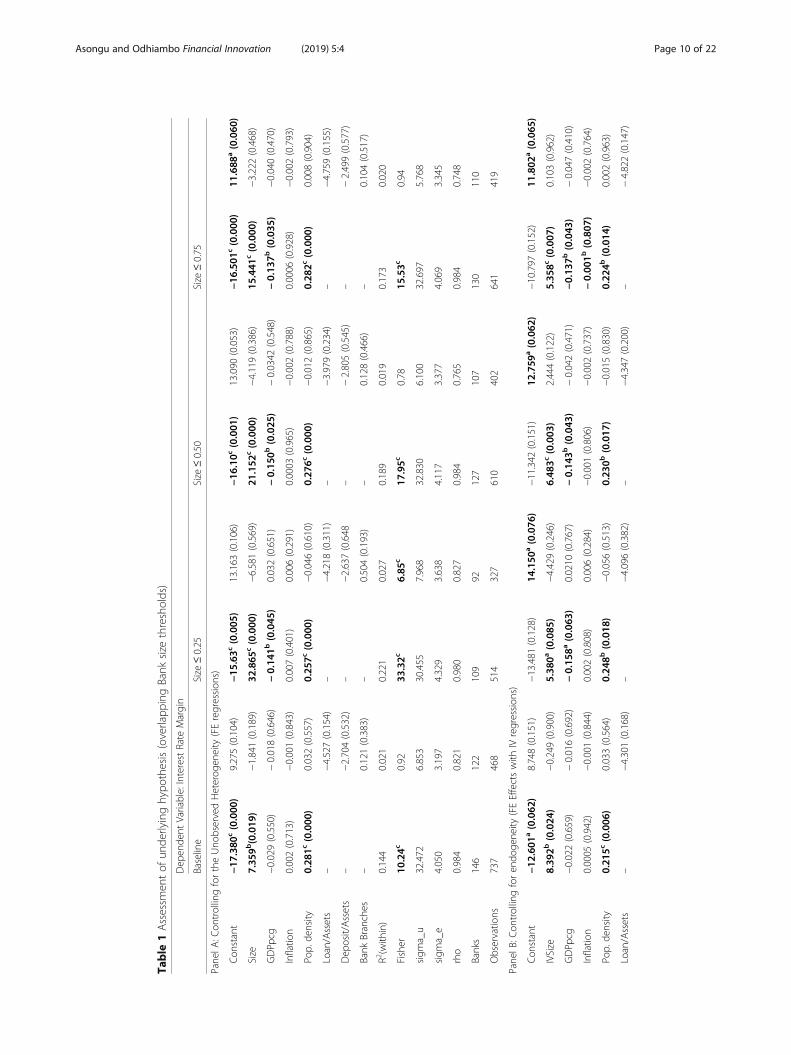
Table 1 presents our findings for the QLH, and Table 2 shows results for the main
hypothesis. In both tables, Panel A is designed to control for unobserved heterogeneity,
while Panel B is tailored to account for both observed heterogeneity and simultaneity.
The first specification of each panel provides the baseline from which the effects of
different asset thresholds are examined.
Table 1 assesses two main concerns related to the QLH, notably whether: (1) bank
size generally increases financial intermediation inefficiency (or interest rate margins),
and (2) increasing bank size beyond a certain threshold increases interest rate margins
further, to the detriment of the customers. The estimated coefficients and information
criteria for model validity were significant consistently across thresholds and panels for
the first specifications exclusively. For this reason, the following presentation and
discussion of results for Table 1 are restricted to this set of specifications.
From the weight of available empirical evidence, the following could be
established. (1) The first part of the underlying hypothesis was confirmed because
bank size significantly increased interest rate margins. (2) Concerning the second
question, when we controlled for only unobserved heterogeneity (i.e., part of
endogeneity), the second part of the QLH proved invalid because the increasing
magnitude of larger banks across overlapping thresholds significantly mitigated the
effect of bank size on interest rate margins (see Panel A). (3) When we accounted
for endogeneity in the bank size measurement (see Panel B), there was evidence of
an inverted U-shaped effect that validated the second part of the underlying
hypothesis. In essence, while bank size increased interest rate margins from the
first to the second threshold, the effect dropped from the second to the third
threshold, reduced to a level almost similar to that of the first threshold. (4) The
significant control variables had the expected signs. Population density had a
positive effect because in markets of high population density, it is less costly to
offer banking services. Improvement in GDP per capita growth does not necessarily
translate into higher intermediary margins because economic prosperity in most of the
sampled African countries has not been inclusive over the past decade (Chester 2010;
Asongu and le Roux 2018), especially with respect to the longstanding issue of financial
allocation efficiency (Asongu 2013). Accordingly, a majority of the elite that has benefited
from this prosperity holds foreign bank accounts for obvious reasons.
Asongu and Odhiambo Financial Innovation (2019) 5:4 Page 9 of 22
Table
1Assessm
entof
unde
rlyinghypo
thesis(overlapp
ingBank
size
thresholds)
Dep
ende
ntVariable:InterestRate
Margin
Baseline
Size
≤0.25
Size
≤0.50
Size
≤0.75
Pane
lA:C
ontrollingfortheUno
bservedHeterog
eneity
(FEregression
s)
Con
stant
−17
.380
c(0.000
)9.275(0.104)
−15
.63c
(0.005
)13.163
(0.106)
−16
.10c
(0.001
)13.090
(0.053)
−16
.501
c(0.000
)11
.688
a(0.060
)
Size
7.35
9b(0.019
)−1.841(0.189)
32.865
c(0.000
)−6.581(0.569)
21.152
c(0.000
)−4.119(0.386)
15.441
c(0.000
)−3.222(0.468)
GDPp
cg−0.029(0.550)
−0.018(0.646)
−0.14
1b(0.045
)0.032(0.651)
−0.15
0b(0.025
)−0.0342
(0.548)
−0.13
7b(0.035
)−0.040(0.470)
Inflatio
n0.002(0.713)
−0.001(0.843)
0.007(0.401)
0.006(0.291)
0.0003
(0.965)
−0.002(0.788)
0.0006
(0.928)
−0.002(0.793)
Pop.
density
0.28
1c(0.000
)0.032(0.557)
0.25
7c(0.000
)−0.046(0.610)
0.27
6c(0.000
)−0.012(0.865)
0.28
2c(0.000
)0.008(0.904)
Loan/Assets
–−4.527(0.154)
–−4.218(0.311)
–−3.979(0.234)
–−4.759(0.155)
Dep
osit/Assets
–−2.704(0.532)
–−2.637(0.648
–−2.805(0.545)
–−2.499(0.577)
Bank
Branches
–0.121(0.383)
–0.504(0.193)
–0.128(0.466)
–0.104(0.517)
R2(with
in)
0.144
0.021
0.221
0.027
0.189
0.019
0.173
0.020
Fisher
10.24c
0.92
33.32c
6.85
c17
.95c
0.78
15.53c
0.94
sigm
a_u
32.472
6.853
30.455
7.968
32.830
6.100
32.697
5.768
sigm
a_e
4.050
3.197
4.329
3.638
4.117
3.377
4.069
3.345
rho
0.984
0.821
0.980
0.827
0.984
0.765
0.984
0.748
Banks
146
122
109
92127
107
130
110
Observatio
ns737
468
514
327
610
402
641
419
Pane
lB:C
ontrollingforen
doge
neity
(FEEffectswith
IVregression
s)
Con
stant
−12
.601
a(0.062
)8.748(0.151)
−13.481
(0.128)
14.150
a(0.076
)−11.342
(0.151)
12.759
a(0.062
)−10.797
(0.152)
11.802
a(0.065
)
IVSize
8.39
2b(0.024
)−0.249(0.900)
5.38
0a(0.085
)−4.429(0.246)
6.48
3c(0.003
)2.444(0.122)
5.35
8c(0.007
)0.103(0.962)
GDPp
cg−0.022(0.659)
−0.016(0.692)
−0.15
8a(0.063
)0.0210
(0.767)
−0.14
3b(0.043
)−0.042(0.471)
−0.13
7b(0.043
)−0.047(0.410)
Inflatio
n0.0005
(0.942)
−0.001(0.844)
0.002(0.808)
0.006(0.284)
−0.001(0.806)
−0.002(0.737)
−0.00
1b(0.807
)−0.002(0.764)
Pop.
density
0.21
5c(0.006
)0.033(0.564)
0.24
8b(0.018
)−0.056(0.513)
0.23
0b(0.017
)−0.015(0.830)
0.22
4b(0.014
)0.002(0.963)
Loan/Assets
–−4.301(0.168)
–−4.096(0.382)
–−4.347(0.200)
–−4.822(0.147)
Asongu and Odhiambo Financial Innovation (2019) 5:4 Page 10 of 22
Table
1Assessm
entof
unde
rlyinghypo
thesis(overlapp
ingBank
size
thresholds)(Con
tinued)
Dep
ende
ntVariable:InterestRate
Margin
Baseline
Size
≤0.25
Size
≤0.50
Size
≤0.75
Dep
osit/Assets
–−2.886(0.510)
–−2.658(0.652)
–−3.231(0.489)
–−2.745(0.545)
Bank
Branches
–0.129(0.352)
–0.488(0.218
–0.1741
(0.312)
–0.122(0.433)
R2(with
in)
0.076
0.018
0.071
0.028
0.070
0.019
0.065
0.018
Fisher
2.95
b0.88
2.99
b7.70
c4.12
c0.94
3.62
c0.87
sigm
a_u
25.193
6.949
30.556
8.664
28.384
6.177
27.212
5.691
sigm
a_e
4.013
3.219
4.563
3.667
4.214
3.399
4.133
3.368
rho
0.975
0.823
0.978
0.848
0.978
0.767
0.977
0.740
Banks
144
122
107
92125
107
128
110
Observatio
ns658
464
449
323
542
398
571
415
FEFixedeffects,Size
Bank
size,IVInstrumen
talv
ariable,
IVSize
Instrumen
tedba
nksize,G
DPp
cgGDPpe
rcapita
grow
th,P
op.d
ensity
Popu
latio
nde
nsity
a ,b,c :
sign
ificanceat
10%,5
%an
d1%
respectiv
ely.Bo
ldvalues
deno
tesign
ificant
estim
ated
coefficientsan
dtheFisher
statistics
Asongu and Odhiambo Financial Innovation (2019) 5:4 Page 11 of 22

Table
2Con
strainingwith
Bank
Size
(overlapp
ingBank
size
thresholds)
Dep
ende
ntVariable:InterestRate
Margin
Baseline
Size
≤0.25
Size
≤0.50
Size
≤0.75
Pane
lA:C
ontrollingfortheUno
bservedHeterog
eneity
(FEregression
s)
Con
stant
205.897(0.102)
205.07
(0.105)
184.386(0.359)
199.596(0.227)
176.131(0.289)
158.287(0.310)
197.983(0.167)
176.516(0.206)
Lerner
1.302(0.454)
1.494(0.444)
0.761(0.719)
1.184(0.612)
0.894(0.651)
1.017(0.638)
0.845(0.655)
0.959(0.638)
ES−225.92
(0.115)
−222.89
(0.119)
−200.25
(0.389)
−213.458(0.263)
−188.169(0.323)
−165.13
(0.355)
−213.85
(0.191)
−187.545(0.238)
GDPp
cg0.032(0.380)
−0.031(0.428)
−0.011(0.869)
0.028(0.689)
−0.028(0.611)
−0.041(0.477)
−0.032(0.551)
−0.0474
(0.412)
Inflatio
n0.001(0.829)
−0.0003
(0.967)
0.01
1b(0.034
)0.007(0.311)
−.00003
(0.997)
−0.001(0.904)
0.0002
(0.980)
−0.0009
(0.910)
Pop.
density
0.100(0.190)
0.099(0.201)
0.068(0.622)
0.020(0.888)
0.056(0.615)
0.044(0.707)
0.0808
(0.385)
0.070(0.486)
Loan/Assets
–−2.338(0.289)
–−2.600(0.484)
–−3.060(0.219)
–−3.063(0.209)
Dep
osit/Assets
–−3.666(0.373)
–−3.446(0.547)
–−4.159(0.357)
–−3.798(0.378)
Bank
Branches
–0.254(0.200)
–0.671(0.177)
–0.231(0.341)
–0.227(0.338)
AdjustedR2(with
in)
0.026
0.043
0.018
0.043
0.016
0.033
0.022
0.036
Fisher
0.64
1.48
9.30
c7.74
c0.54
1.00
0.75
1.17
sigm
a_u
14.187
15.326
10.328
9.753
9.904
9.505
12.038
11.605
sigm
a_e
2.987
3.236
3.575
3.674
3.264
(3.434)
3.188
3.399
rho
0.957
0.957
0.892
0.875
0.902
0.884
0.9344
0.920
Banks
132
118
9589
111
103
115
106
Observatio
ns540
447
338
316
426
384
454
400
Pane
lB:C
ontrollingforen
doge
neity
(FEEffectswith
IVregression
s)
Con
stant
79.954
(0.135)
62.016
(0.142)
39.372
(0.751)
12.227
(0.885)
52.258
(0.632)
7.352(0.927)
75.642
(0.178)
51.023
(0.241)
Lerner
0.985(0.627)
1.393(0.537)
−0.052(0.980)
0.347(0.884)
0.170(0.934)
0.337(0.878)
0.452(0.833)
0.764(0.739)
IVES
−84.649
(0.165)
−60.273
(0.212)
−33.208
(0.817)
4.109(0.966)
−46.979
(0.708)
9.185(0.920)
−75.702
(0.237)
−43.902
(0.373)
GDPp
cg0.0239
(0.484)
−0.0362
(0.496)
−0.019(0.739)
0.030(0.680)
−0.038(0.433)
−0.039(0.507)
−0.044(0.347)
−0.047(0.420)
Inflatio
n0.0003
(0.966)
−0.0006
(0.941)
0.008(0.052)
0.007(0.377)
−0.001(0.823)
−0.001(0.857)
−0.001(0.867)
−0.001(0.882)
Asongu and Odhiambo Financial Innovation (2019) 5:4 Page 12 of 22
Table
2Con
strainingwith
Bank
Size
(overlapp
ingBank
size
thresholds)(Con
tinued)
Dep
ende
ntVariable:InterestRate
Margin
Baseline
Size
≤0.25
Size
≤0.50
Size
≤0.75
Pop.
density
0.061(0.262)
0.061(0.329)
−0.007(0.943)
−0.056(0.640)
−0.002(0.981)
−0.019(0.838)
0.0332
(0.585)
0.028(0.707)
Loan/Assets
–−5.25
3a(0.083
)–
−5.761(0.187)
–−5.57
4a(0.066
)–
−5.66
8a(0.083
)
Dep
osit/Assets
–−4.487(0.371)
–−4.890(0.468)
–−5.269(0.318)
–−4.548(0.375)
Bank
Branches
–0.178(0.364)
–0.514(0.315)
–0.139(0.557)
–0.1574
(0.514)
AdjustedR2(with
in)
0.010
0.034
0.005
0.034
0.003
0.028
0.007
0.030
Fisher
0.51
1.31
11.12c
7.31
c0.24
0.98
0.69
1.12
sigm
a_u
9.254
10.026
5.428
8.751
6.268
6.379
7.691
6.983
sigm
a_e
3.060
3.292
3.680
3.757
3.354
3.491
3.277
3.455
rho
0.901
0.902
0.685
0.844
0.777
0.769
0.846
0.803
Banks
132
118
9589
111
103
115
106
Observatio
ns515
436
325
306
410
374
437
390
FEFixedeffects,Size
Bank
size,ESEcon
omiesof
scale,
IVInstrumen
talv
ariable,
IVES
Instrumen
tedecon
omiesof
scale,
GDPp
cgGDPpe
rcapita
grow
th,P
op.d
ensity
Popu
latio
nde
nsity
a ,b,c :
sign
ificanceat
10%,5
%an
d1%
respectiv
ely.Bo
ldvalues
deno
tesign
ificant
estim
ated
coefficientsan
dtheFisher
statistics
Asongu and Odhiambo Financial Innovation (2019) 5:4 Page 13 of 22
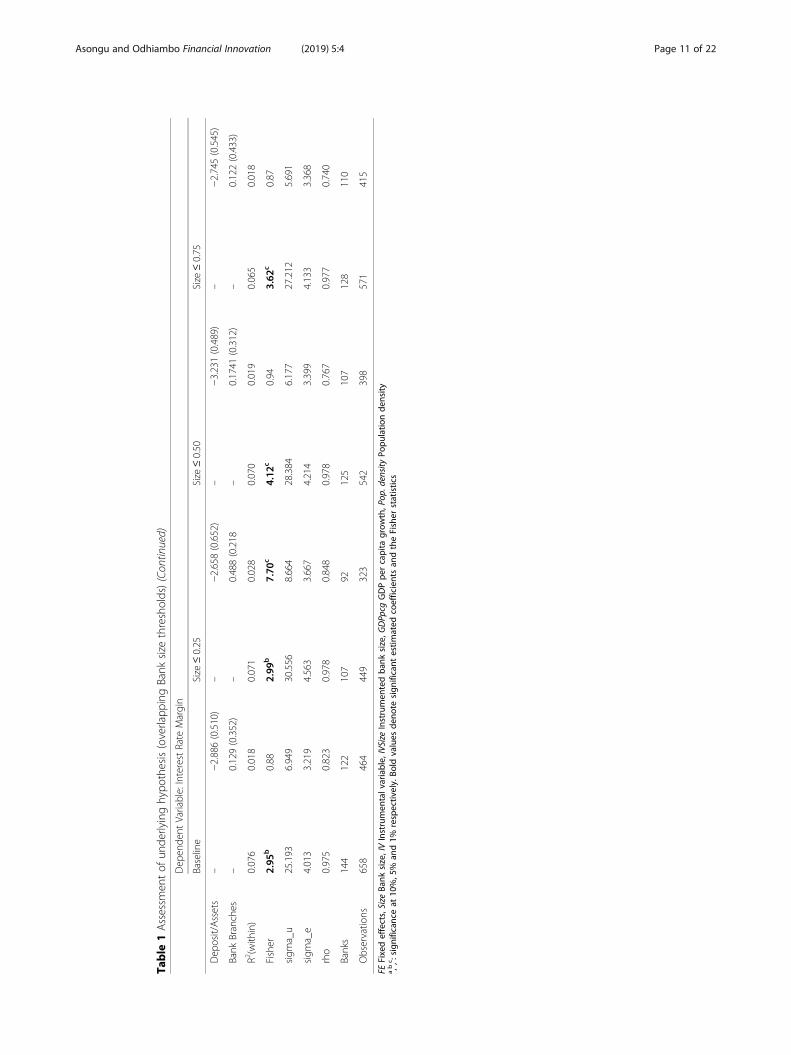
Given the demonstrated validity of the QLH, we proceeded to assess the second
related question motivating the study: whether inefficiency is due to economies of
scale or abuse of power. Unfortunately, for both panels of Table 2, the findings
were not significant across the specifications, asset thresholds, and panels. Following the
procedure used for Table 1, we replicated the analysis using non-overlapping
thresholds, and found similar results. If statistical significance is overlooked, from
the first threshold (i.e., Size ≤0.25), increasing interest margins or intermediation
inefficiency was traceable to market power (Lerner),10 while the category of econ-
omies of scale was a source of intermediation efficiency. It follows that other factors
explain significant variations in interest rate margins besides market power and econ-
omies of scale.
Further discussion and policy implications
The following discussion of our findings proceeds in the light of the existing literature
regarding bank size and efficiency, the QLH, and ES and efficiency. First, our results
regarding the connection between bank size and efficiency were broadly consistent with
the findings of Ahokpossi (2013, p. 1), who concluded that policies that promote
competition and reduce market concentration help lower interest margins in SSA. Bank
size contributed significantly to variations in bank spreads and margins (Beck and
Hesse 2006, p. 1) since the high cost of loans was more favorable to big banks than
small lenders (Ngigi 2013a, 2013b).
Second, while our findings regarding the Quiet Life Hypothesis were statistically
insignificant, they confirmed the potential for applying the QLH in the African
banking industry. This evidence broadly confirmed mainstream findings by Tu and
Chen (2000) in Taiwan for 1986–1999, whose results were valid only before 1991;
Koetter and Vins (2008) for Germany from 1996 to 2006, although the magnitude
of the estimated effects of the QLH were small; Schaeck and Cihak (2008) for
Europe and the USA from 1995 to 2005; Solis and Maudos (2008) regarding the
loans market in Mexico for the years 1993–2005; Delis and Tsionas (2009) for
Europe from 1996 to 2006, using a local maximum likelihood technique; Ariss
(2010) in a sample of developing countries for cost efficiency; Coccorese and
Pellecchia (2010) in Italy during 1992–2007, although the impact of market power
on efficiency was not particularly remarkable in magnitude; and Asongu and
Odhiambo (2018) in Africa.
Third, since the negative, although insignificant effect of ES may also be syn-
onymous with the absence of market power, our findings also were broadly in ac-
cordance with studies that have not validated the QLH, including Weill (2004) in
Europe for the years 1994–1999, who calibrated competition using the
Panzar-Rosse H-statistic; Maudos and De Guevara (2007) for Europe from 1993 to
2002; Koetter et al. (2008) in the USA from 1986 to 2006; Pruteanu-Podpiera et al.
(2008) who used Granger causality for their work regarding the Czech Republic from
1994 to 2005; Solis and Maudos (2008) for the deposits market in Mexico from 1993
to 2005; Al-Muharrami and Methews (2009) in the Arab Gulf from 1993 to 2002; Fu
and Heffernan (2009) for China during 1985–2002; and Ariss (2010) for a sample of
developing countries with respect to profit efficiency.
Asongu and Odhiambo Financial Innovation (2019) 5:4 Page 14 of 22
It is vital to address the policy implications of the issues presented in this paper to
ensure the soundness and regulation of the banking sector of Africa. The banking
industry must have the capacity to serve the economy with a degree of competition that
is sufficient in productivity to provide for its customers. Therefore, based on the weight
of available empirical evidence, we recommend that regulatory and government policies
should aim to meet the following objectives:
(1) Competition in the banking industry should be promoted in order to mitigate the
potentially upward pressure of market power on interest margins to the detriment
of customers.
(2) Market concentration should be discouraged because an increase in bank size is
not associated with intermediation efficiency.
(3) Mergers and acquisitions should be discouraged if they lead to an increase in bank
size beyond a mid-level threshold. This recommendation is based on the evidence
found of an inverted U-shaped nexus in the relationship between bank size and
inefficiency.
Moreover, because the banking sector is more concentrated in SSA than in the rest
of the world (Ahokpossi 2013), policies designed to promote competition are important
because they help to improve financial intermediation by lowering interest margins.
However, given that markets tend to be small in SSA countries, the attendant policies
should not focus exclusively on increasing the number of banks. Evidence indicates that
increasing the number of banks within a small market framework to increase competi-
tion may not yield the desired outcome in Africa. The presence of a substantial number
of financial institutions may not necessarily breed competition because there is a risk
that banks may collude through channels such as bankers’ associations. The promotion
of competition will result most feasibly from better enforcement of antitrust laws in
particular, and from encouragement of laws that promote competition in general.
Proper regulation is also indispensable because size provides large banks with many
commercial opportunities that can amount to outright corruption tools.
Conclusion, caveats, and directions for future researchThere is a growing body of evidence indicating that interest rate spreads in Africa are
higher for big banks compared to small banks. Interest rate spreads have been used
widely in the banking literature to indicate the level of banking sector efficiency. It is
indisputable that big banks have opportunities to leverage their size to benefit from
lower funding costs based on economies of scale as compared to small banks.
Therefore, we would expect that one of the main benefits of big size would be gains in
efficiency that transfer to the banks’ customers through higher deposit rates, lower
lending rates, and lower overall interest spreads. However, this reduction in rates has
not occurred. Therefore, questions are emerging about the role of bank size in improv-
ing efficiency in the banking sector.
One concern is that the big banks might be using their market power to charge
higher lending rates as they become larger, more efficient, and unchallenged. However,
several studies have found that increasing size beyond certain thresholds introduces
diseconomies of scale that lead to inefficiency. Increased size beyond these thresholds
Asongu and Odhiambo Financial Innovation (2019) 5:4 Page 15 of 22
would be expected to widen interest margins to the detriment of customers. Therefore,
on the basis of these observations, the outlook for improving financial inclusion
through mergers and consolidation is doubtful. The main question remains whether
increased bank size is necessarily good for banking sector efficiency.
Using a panel of 162 African banks for the period 2001–2011, this study examined
the connection between bank size and efficiency to understand whether the relation-
ship is influenced by exploitation of market power or economies of scale. We analyzed
the empirical evidence using instrumental variables and fixed effects regressions. The
following findings were established. First, bank size increased the interest rate margins
enjoyed by banks, with an inverted U-shaped nexus. Second, market power and
economies of scale did not increase or decrease the interest rate margins significantly.
The main policy implication is that the interest rate margins cannot be elucidated by
market power or economies of scale.
The main caveat of this study is that our resulting policy recommendations are based
on a broad sample of African countries that exhibit some significant heterogeneity.
Future papers should aim to provide findings with more targeted country-specific
implications. A step in this direction would be to place some emphasis on the legal
origins of a country’s civil laws in the light of the work by Muazu and Alagidede
(2017), who examined the nexus between information asymmetry and financial
development. In addition, it would be worthwhile to apply the updated methodology
from Tsionas et al. (2018) to estimate the interplay between efficiency and market
power. They have developed a unified econometric approach for the formal assessment
of the relationship between market power and cost efficiency. Their technique can
accommodate a mutually dependent connection between market power and a financial
firm’s cost efficiency. The framework allows for varying hierarchical orderings between
a firm’s efficiency and market power, and does not place any prior restrictions on the
sign of the connection between the two.
In addition, improvements have been made in the computation of the Lerner index.
A notable example is the stochastic frontier estimator of market power, an approach
that can be used in both the primal framework and the dual cost function (Kumbhakar
et al. 2012; Coccorese 2014; Anginer et al. 2014).
Endnotes1Ahokpossi (2013, p. 1) concludes that policies that promote competition and reduce
market concentration would help lower interest margins in sub-Saharan Africa (SSA).
Beck and Hesse (2006, p.1) have also established that bank size significantly contributes to
bank variation in spreads and margins. A case in point is the situation in Kenya where the
high cost of loans is favorable to big banks over small lenders (Ngigi 2013a, 2013b).2Karray and Chichti (2013) have recently assessed a panel of 402 commercial banks
from 15 developing countries for the period 2000–2003 and found high levels of scale
inefficiency among the largest banks.3Consistent with Karray and Chichti (2013), a majority of studies have led to
functions of estimated average cost with U-shaped profile. Accordingly, they decrease
with size up to a certain value of total assets and unit costs rise beyond this level,
indicating that it is the medium-sized banks that seem to have a more efficient scale
than large and small banks.
Asongu and Odhiambo Financial Innovation (2019) 5:4 Page 16 of 22

4Accordingly, the bulk of recent African financial development literature has not
engaged the problem statement (Daniel 2017; Fowowe 2014; Wale and Makina 2017;
Tchamyou and Asongu 2017; Chikalipah 2017; Bocher et al. 2017; Osah and Kyobe
2017; Obeng and Sakyi 2017; Ofori-Sasu et al. 2017; Chapoto and Aboagye 2017; Iyke
and Odiambo 2017; Boadi et al. 2017; Triki and Gajigo 2014).5Efficiency scores within the context of the study are based on cost efficiency,
estimated with the translog cost function. The established association between bank
size and efficiency is based on whether banks are fulfilling their fundamental mis-
sion of improving financial intermediation efficiency, notably: whether bank size
generally increases financial intermediary inefficiency (or interest rate margins).6Economies of scale and scale economies are used interchangeably throughout the study.7Bank size ≤0.10; 0.10 < Bank Size ≤0.25; 0.25 < Bank Size ≤0.50; 0.50 < Bank
Size ≤0.75; 0.75 < Bank Size ≤0.90; 0.90 < Bank Size.8Firms with higher market power put less effort in pursuing cost efficiency: instead of
taking advantage of their favorable position by cutting costs, they prefer to enjoy a
‘quiet life’ or an exploitation of market power (Hicks 1935; Maudos and De Guevara
2007; Koetter and Vins 2008; Coccorese and Pellecchia 2010).9The price of deposits is computed by dividing interest expenses by the sum of
deposits, money market plus short term funding. The price of labor is defined as the
ratio of personnel expenses to total assets. The price of capital is equal to the ratio of
‘other operating costs’ to the value of fixed assets.10It should be noted that IVLerner is not used in Panel B of Table 2 because its
explanatory power (R2) is very low after instrumentation with first lags and first differ-
ences. Accordingly, while IVLener is perfectly synonymous to Lerner, it has a low R2.
Table 3 Summary statistics
Mean S.D Minimum Maximum Observations
Translog cost function variables Ln. Cost (C) 2.748 1.325 −1.468 5.667 1065
Ln. Output (Q) 3.747 1.342 −0.045 6.438 1091
Deposit Price (W1) 0.539 8.196 0.000 176.00 1031
Labour Price (W2) 0.022 0.016 0.000 0.201 961
Capital Price (W3) 1.733 3.884 −0.074 72.750 1043
Market variables GDP per capita growth 13.912 96.707 −15.306 926.61 1782
Inflation 10.239 22.695 −9.823 325.00 1749
Population density 81.098 106.06 2.085 633.52 1782
Bank level variables Loan/Assets 0.449 0.183 0.000 0.966 1092
Deposits/Assets 0.664 0.198 0.000 1.154 1052
Bank Branches 6.112 6.158 0.383 37.209 1129
Output Price (P) 0.338 0.929 0.000 25.931 1045
Other variables Interest Rate Margin 3.804 5.534 −23.620 27.310 1257
Lerner Index 0.513 0.587 −13.787 0.969 894
Bank Size 0.264 0.334 0.000 1.000 1267
Economies of Scale 0.915 0.017 0.867 0.950 1091
Ln Logarithm, GDP Gross domestic product, S.D. Standard deviation
Appendix
Asongu and Odhiambo Financial Innovation (2019) 5:4 Page 17 of 22
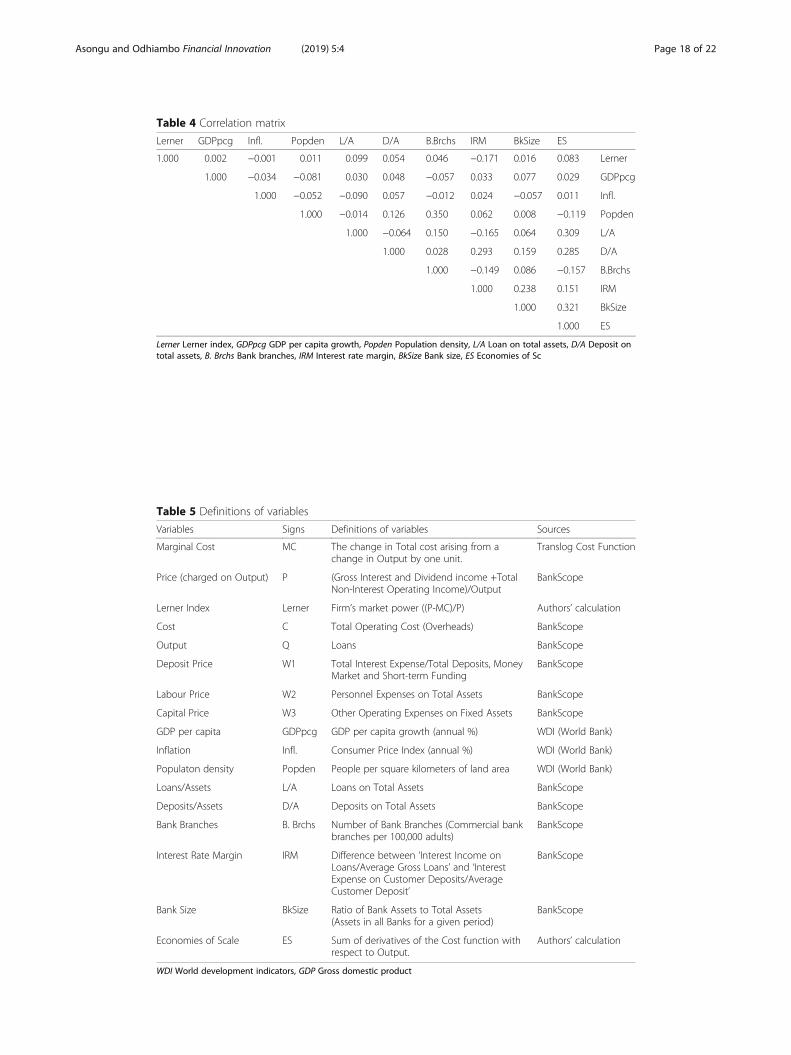
Table 4 Correlation matrix
Lerner GDPpcg Infl. Popden L/A D/A B.Brchs IRM BkSize ES
1.000 0.002 −0.001 0.011 0.099 0.054 0.046 −0.171 0.016 0.083 Lerner
1.000 −0.034 −0.081 0.030 0.048 −0.057 0.033 0.077 0.029 GDPpcg
1.000 −0.052 −0.090 0.057 −0.012 0.024 −0.057 0.011 Infl.
1.000 −0.014 0.126 0.350 0.062 0.008 −0.119 Popden
1.000 −0.064 0.150 −0.165 0.064 0.309 L/A
1.000 0.028 0.293 0.159 0.285 D/A
1.000 −0.149 0.086 −0.157 B.Brchs
1.000 0.238 0.151 IRM
1.000 0.321 BkSize
1.000 ES
Lerner Lerner index, GDPpcg GDP per capita growth, Popden Population density, L/A Loan on total assets, D/A Deposit ontotal assets, B. Brchs Bank branches, IRM Interest rate margin, BkSize Bank size, ES Economies of Sc
Table 5 Definitions of variables
Variables Signs Definitions of variables Sources
Marginal Cost MC The change in Total cost arising from achange in Output by one unit.
Translog Cost Function
Price (charged on Output) P (Gross Interest and Dividend income +TotalNon-Interest Operating Income)/Output
BankScope
Lerner Index Lerner Firm’s market power ((P-MC)/P) Authors’ calculation
Cost C Total Operating Cost (Overheads) BankScope
Output Q Loans BankScope
Deposit Price W1 Total Interest Expense/Total Deposits, MoneyMarket and Short-term Funding
BankScope
Labour Price W2 Personnel Expenses on Total Assets BankScope
Capital Price W3 Other Operating Expenses on Fixed Assets BankScope
GDP per capita GDPpcg GDP per capita growth (annual %) WDI (World Bank)
Inflation Infl. Consumer Price Index (annual %) WDI (World Bank)
Populaton density Popden People per square kilometers of land area WDI (World Bank)
Loans/Assets L/A Loans on Total Assets BankScope
Deposits/Assets D/A Deposits on Total Assets BankScope
Bank Branches B. Brchs Number of Bank Branches (Commercial bankbranches per 100,000 adults)
BankScope
Interest Rate Margin IRM Difference between ‘Interest Income onLoans/Average Gross Loans’ and ‘InterestExpense on Customer Deposits/AverageCustomer Deposit’
BankScope
Bank Size BkSize Ratio of Bank Assets to Total Assets(Assets in all Banks for a given period)
BankScope
Economies of Scale ES Sum of derivatives of the Cost function withrespect to Output.
Authors’ calculation
WDI World development indicators, GDP Gross domestic product
Asongu and Odhiambo Financial Innovation (2019) 5:4 Page 18 of 22
AbbreviationsES: Economies of scale; GDP: Gross Domestic Product; ICTs: Information & Communication Technology; QLH: Quiet LifeHypothesis; SSA: Sub-Saharan Africa; UCITS: Transferable Securities Directives; USA: United States of America
AcknowledgementsThe authors are indebted to the editor and reviewers for constructive comments.
FundingThis is an unfunded paper.
Availability of data and materialsThe data for this paper is available upon request.
Authors’ contributionsSAA participated in the writing of the manuscript and data analysis and NMO participated in the revision andproofreading of the manuscript. Both authors read and approved the final manuscript.
Ethics approval and consent to participateNot applicable.
Consent for publicationNot applicable.
Competing interestsThe authors declare that they have no competing interests.
Publisher’s NoteSpringer Nature remains neutral with regard to jurisdictional claims in published maps and institutional affiliations.
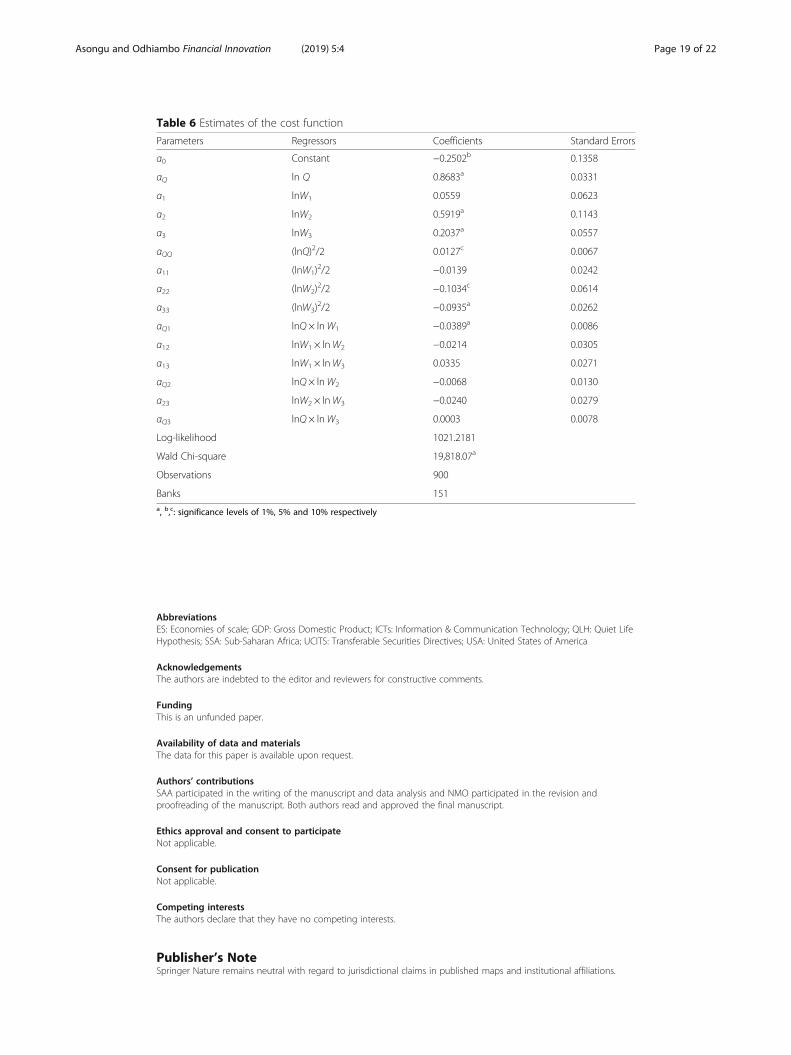
Table 6 Estimates of the cost function
Parameters Regressors Coefficients Standard Errors
α0 Constant −0.2502b 0.1358
αQ ln Q 0.8683a 0.0331
α1 lnW1 0.0559 0.0623
α2 lnW2 0.5919a 0.1143
α3 lnW3 0.2037a 0.0557
αQQ (lnQ)2/2 0.0127c 0.0067
α11 (lnW1)2/2 −0.0139 0.0242
α22 (lnW2)2/2 −0.1034c 0.0614
α33 (lnW3)2/2 −0.0935a 0.0262
αQ1 lnQ × lnW1 −0.0389a 0.0086
α12 lnW1 × lnW2 −0.0214 0.0305
α13 lnW1 × lnW3 0.0335 0.0271
αQ2 lnQ × lnW2 −0.0068 0.0130
α23 lnW2 × lnW3 −0.0240 0.0279
αQ3 lnQ × lnW3 0.0003 0.0078
Log-likelihood 1021.2181
Wald Chi-square 19,818.07a
Observations 900
Banks 151a, b,c: significance levels of 1%, 5% and 10% respectively
Asongu and Odhiambo Financial Innovation (2019) 5:4 Page 19 of 22
Received: 28 February 2018 Accepted: 16 January 2019
ReferencesAhokpossi C (2013) Determinants of bank interest margins in Sub-Saharan Africa. In: IMF Working Paper No. 13/34,
Washington D.CAigner DJ, Chu SF (1968) On estimating the industry production function. Am Econ Rev 58(4):826–839Allen L, Rai A (1996) Operational efficiency in banking: an international comparison. J Bank Financ 20(4):655–672Al-Muharrami S, Methews K (2009) Market power versus efficient-structure in Arab GCC banking. Appl Financ Econ 19(18):
1487–1496Altunbas Y, Liu MH, Molyneux P, Seth RR (2000) Efficiency and risk in Japanese banking. J Bank Financ 24(10):1605–1628Anginer D, Demirguc-Kunt A, Zhu M (2014) How does competition affect bank systemic risk? J Financ Intermed 23(1):1–26Ariss RT (2010) On the implications of market power in banking: evidence from developing countries. J Bank Financ 34(4):
765–775Asongu S, Bauto M, Nwachukwu J, Tchamyou V (2018a) Is information diffusion a threat to market power for financial access?
Insights from the African banking industry. J Multinatl Financ Manag 45(June):88–104Asongu SA (2013) Investment and inequality in Africa: which financial channels are good for the poor? Afr Financ J 15(2):44–66Asongu SA (2017) The effect of reducing information asymmetry on loan price and quantity in the African banking industry.
Res Int Bus Financ 41(October):185–197Asongu SA, Biekpe N (2018) ICT, information asymmetry and market power in African banking industry. Res Int Bus Financ
44(April):518–531Asongu SA, le Roux S (2018) Understanding sub-Saharan Africa’s extreme poverty tragedy. Int J Public Adm. https://doi.org/
10.1080/01900692.2018.1466900Asongu SA, le Roux S, Tchamyou VS (2018b) Essential information sharing thresholds for reducing market power in financial
access: a study of the African banking industry. J Bank Regul. https://doi.org/10.1057/s41261-018-0065-4Asongu SA, Nwachukwu J, Tchamyou VS (2016) Information asymmetry and financial development dynamics in Africa. Rev
Dev Financ 6(2):126–138Asongu SA, Nwachukwu JC (2018) Bank size, information sharing and financial access in Africa. Int J Manag Financ 14(2):188–209Asongu SA, Odhiambo N (2018) Testing the quiet life hypothesis in the African banking industry. J Ind Compet Trade.
https://doi.org/10.1007/s10842-018-0278-3Battese GE, Coelli TJ (1992) Frontier production function, technical efficiency and panel data with application to Paddy
farmers in India. J Prod Anal 3(3–4):153–169Beck T, Demirgüç-Kunt A, Levine R (1999) A New Database on Financial Development and Structure. In: World Bank Policy
Research Working Paper No. 2146, Washington D.CBeck T, Hesse H (2006) Bank efficiency, ownership and market structure: why are interest spreads so high in Uganda? In:
Policy Research Working Paper Series No. 4027, Washington D.CBerger AN, Hanweck TN, Humphrey DB (1987) Competitive viability in banking: scale, scope and product mix economies.
J Monet Econ 20(3):501–520Berger AN, Mester LJ (1997) Inside the black box: what explains differences in the efficiencies of financial institutions. J Bank
Financ 21(7):895–947Boadi I, Dana LP, Mertens G, Mensah L (2017) SMEs’ financing and banks’ profitability: a “good date” for banks in Ghana?
J Afr Bus 17(2):257–277Boateng A, Asongu SA, Akamavi R, Tchamyou VS (2018) Information asymmetry and market power in the African banking
industry. J Multinatl Financ Manag 44(March):69–83Bocher FT, Alemu BA, Kelbore ZG (2017) Does access to credit improve household welfare? Evidence from Ethiopia using
endogenous regime switching regression. Afr J Econ Manag Stud 8(1):51–65Bokpin GA (2016) Bank governance, regulation and risk-taking in Ghana. J Afr Bus 17(1):52–68Brown R, O’Connor I (1995) Measurement of economies of scale in Victorian credit unions. Aust J Manag 20(1):1–24Chapoto T, Aboagye AQQ (2017) African innovations in harnessing farmer assets as collateral. Afr J Econ Manag Stud 8(1):66–75Chester P (2010) Inclusive Growth and Employment in Africa. United Nations Dispatch http://www.undispatch.com/inclusive-
growth-employment-in-africa (accessed: 13 Sept 2013)Chikalipah S (2017) What determines financial inclusion in sub-Saharan Africa? Afr J Econ Manag Stud 8(1):8–18Chortareas GE, Garza-Garcia JG, Girardone C (2012) Competition, efficiency and interest rate margins in Latin American
banking. Int Rev Financ Anal 24(September):93–103Christensen LR, Jorgenson DW, Lau LJ (1971) Transcendental logarithmic production Frontiers. Rev Econ Stat 55(1):28–45Clark J (1996) Economic cost, scale efficiency and competitive viability in banking. J Money Credit Bank 28(3):342–364Coccorese P (2014) Estimating the Lerner index for the banking industry: a stochastic frontier approach. Appl Financ Econ
24(2):73–88Coccorese P, Pellecchia A (2010) Testing the ‘quiet life’ hypothesis in the Italian banking industry. Econ Notes 39(3):173–202Dabla-Norris E, Floerkemeier H (2007) Bank efficiency and market structure: what determines banking spreads in Armenia? In:
IMF Working Paper 07/134, Washington D.CDaniel A (2017) Introduction to the financial services in Africa special issue. Afr J Econ Manag Stud 8(1):2–7De Keuleneer E, Leszczynska N (2012) Size in banking: efficiency of scale vs. abuse of power. Global Economic Intersection
http://econintersect.com/wordpress/?p=19616 (accessed: 12 Sept 2013)Delis MD, Tsionas EG (2009) The joint estimation of Bank-level market power and efficiency. J Bank Financ 33(10):1842–1850Demirgüç-Kunt A, Harry H (2011) Do we need big banks? Evidence on performance, strategy and market discipline. In: Policy
Research Working Paper No. 5576, Washington D.CFanta AB (2016) Complementarity between relationship lending and collateral in SME access to Bank credit: evidence from
Ethiopia. J Afr Bus 17(3):308–318Farrell MJ (1957) The measurement of productive efficiency. J R Stat Soc 120(3):253–290Fowowe B (2014) Law and finance revisited: evidence from African countries. S Afr J Econ 82(2):193–208
Asongu and Odhiambo Financial Innovation (2019) 5:4 Page 20 of 22
Fu X, Heffernan S (2009) The effects of reform on China’s Bank structure and performance. J Bank Financ 33(1):39–52Fukuyama W (1993) Technical and scale efficiency of Japanese commercial banks: a non-parametric approach.
Appl Econ 25(8):1101–1112Goldberg LG, Rai AA (1996) The structure-performance relationship for European banking. J Bank Financ 20(4):745–771Hamdi H, Hakimi A, Zaghdoudi K (2018) Diversification, bank performance and risk: have Tunisian banks adopted the
new business model? Financ Innov 3(22):1–25Hicks J (1935) Annual survey of economic theory: the theory of monopoly. Econometrica 3(1):1–20Huang Y, Kou G (2016) A kernel entropy manifold learning approach for financial data analysis. Decis Support Syst
64(2014):31–42Iyke BN, Odiambo NM (2017) Foreign exchange markets and the purchasing power parity theory: evidence from two
southern African countries. Afr J Econ Manag Stud 8(1):89–102Karray SC, Chichti JE (2013) Bank size and efficiency in developing countries: intermediation approach versus value added
approach and impact of non-traditional activities. Asian Econ Financ Rev 3(5):593–613Kashif M, Iftikhar SF, Iftikhar K (2016) Loan growth and bank solvency: evidence from the Pakistan banking sector. Financ
Innov 2(22):1–13Khraisha T, Arthur K (2018) Can we have a general theory of financial innovation processes? A conceptual review. Financ
Innov 4(4):1–27Koetter M, Kolari JW, Spierduk L (2008) Efficient competition ? Testing the ‘quiet life’ of U. S banks with adjusted Lerner
indices. In: Proceedings of the 44th ‘Bank structure and competition’ conference, Federal Reserve Bank of ChicagoKoetter M, Vins O (2008) The quiet life hypothesis in banking-evidence from German savings banks. In: Department of
Finance, Goethe University, Working Paper Series: Finance and Accounting No. 190, FrankfurtKumbhakar SC, Baardsen S, Lien G (2012) A new method for estimating market power with an application to Norwegian
sawmilling. Rev Ind Organ 40(2):109–129Kusi BA, Agbloyor EK, Ansah-Adu K, Gyeke-Dako A (2017) Bank credit risk and credit information sharing in Africa: does credit
information sharing institutions andcontext matter? Res Int Bus Financ 42(December):1123–1136Kusi BA, Opoku Mensah M (2018) Does credit information sharing affect funding cost of banks? Evidence from African banks.
Int J Financ Econ 23(1):19–28Lang G, Welzel P (1996) Efficiency and technical progress in banking: empirical results for a panel of German cooperative
banks. J Bank Financ 20(6):1003–1023Maudos J, De Guevara JF (2007) The cost of market power in banking: social welfare loss vs. cost inefficiency. J Bank Financ
31(7):2103–2125Mester LJ (1992) Traditional and nontraditional banking: an information-theoretic approach. J Bank Financ 16(3):545–566Mitchell K, Onvural NM (1996) Economies of scale and scope at large commercial banks: evidence from the Fourier flexible
form. J Money Credit Bank 28(2):178–199Moudud-Ul-Huq S (2017) Performance of banking industry in Bangladesh: insights of CAMEL rating. Int J Financ Eng 4(2):1–15Muazu I, Alagidede P (2017) Financial development, growth volatility and information asymmetry in sub-Saharan Africa: does
law matter? S Afr J Econ 85(4):570–588Ngigi G (2013a) CBK puts big banks on the spot over high interest rates. Business Daily http://www.businessdailyafrica.com/CBK-
puts-big-banks-on-the-spot-over-high-interest-rates/-/539552/1908098/-/7t6949z/-/index.html (accessed: 22 July 2013)Ngigi G (2013b) High cost of loans favours big banks over small lenders. Business Daily http://www.businessdailyafrica.com/
High-cost-of-loans-favours-big-banks-over-small-lenders/-/539552/1744902/-/awkd24/-/index.html (accessed: 22 July 2013)Noulas AG, Ray SC, Miller SM (1990) Returns to scale and input substitution for large banks. J Money Credit Bank 22(1):94–108O’brien RM (2007) (2007). “A caution regarding rules of thumb for variance inflation factors”. Qual Quant 41:673–690Obeng SK, Sakyi D (2017) Macroeconomic determinants of interest rate spreads in Ghana. Afr J Econ Manag Stud 8(1):76–88Ofori-Sasu D, Abor JY, Osei AK (2017) Dividend policy and shareholders’ value: evidence from listed companies in Ghana. Afr
Dev Rev 29(2):293–304Osah O, Kyobe M (2017) Predicting user continuance intention towards M-pesa in Kenya. Afr J Econ Manag Stud 8(1):36–50Ozili PK (2017) Bank profitability and capital regulation: evidence from listed and non-listed banks in Africa. J Afr Bus 18(2):143–168Pruteanu-Podpiera A, Weill L, Schobert F (2008) Banking competition and efficiency: a micro-data analysis on the Czech
banking industry. Comp Econ Stud 50(2):253–273Ramlall I, Mamode F (2017) A critical assessment of Basel III and its implications on the Mauritian banking sector. J Afr Bus
18(1):70–101Schaeck K, Cihak M (2008) How does competition affect efficiency and soundness in banking? New empirical evidence. In:
ECB Working Paper Series, No. 932, European Central Bank, FrankfurtSolis L, Maudos J (2008) The social costs of Bank market power: evidence from Mexico. J Comp Econ 36(3):467–488Srivastava P (1999) Size, efficiency and financial reforms in Indian banking. In: Indian Council for Research on International
Economic Relations, Working Paper No. 49, New DelhiTchamyou VS (2018a) Education, lifelong learning, inequality and financial access: evidence from African countries. Contemp
Soc Sci. https://doi.org/10.1080/21582041.2018.1433314Tchamyou VS (2018b) The role of information sharing in modulating the effect of financial access on inequality. J Afr Bus.Tchamyou VS, Asongu SA (2017) Information sharing and financial sector development in Africa. J Afr Bus 18(1):24–49Tchamyou VS, Asongu SA, Nwachukwu JC (2018) Effects of asymmetric information on market timing in the mutual fund
industry. Int J Manag Finance 14(5):542–557Triki T, Gajigo O (2014) Credit bureaus and registries and access to finance: new evidence from 42 African countries.
J Afr Dev 16(2):73–101Tsionas EG, Milikov E, Kumbhakar SC (2018) An internally consistent approach to the estimation of market power and cost
efficiency with an application to U.S. banking. Eur J Oper Res 270(2):747–760Tu AH, Chen S (2000) Bank market structure and performance in Taiwan before and after the 1991 liberalization.
Rev Pac Basin Financ Mark Policies 3(2000):475–490Wagenvoort R, Schure P (1999) Economies of scale and efficiency in European banking: new evidence. In: ) (ed) Economic
and Financial Reports 1999/1, Economic Investment, European Central Bank, Frankfurt
Asongu and Odhiambo Financial Innovation (2019) 5:4 Page 21 of 22
Wale LE, Makina D (2017) Account ownership and use of financial services among individuals: evidence from selectedsub-Saharan African economies. Afr J Econ Manag Stud 8(1):19–35
Weill L (2004) On the relationship between competition and efficiency in the EU banking sectors. Kredit und Kapital37(3):329–352
Yan H, Gang K, Yi P (2017) Nonlinear manifold learning for early warnings in financial markets. Eur J Oper Res 258(2):692–702Zheng C, Gupta AD, Moudud-Ul-Huq S (2017) Do market competition and development indicators matter for banks’ risk,
capital, and efficiency relationship? Int J Financ Eng 4(2):1–27
Asongu and Odhiambo Financial Innovation (2019) 5:4 Page 22 of 22
Copyright © 2022 FDOKUMEN