VPA response in SMA is suppressed by the fatty acid translocase CD36
Upload
independentCategory
view
4download
0
EMBOopen
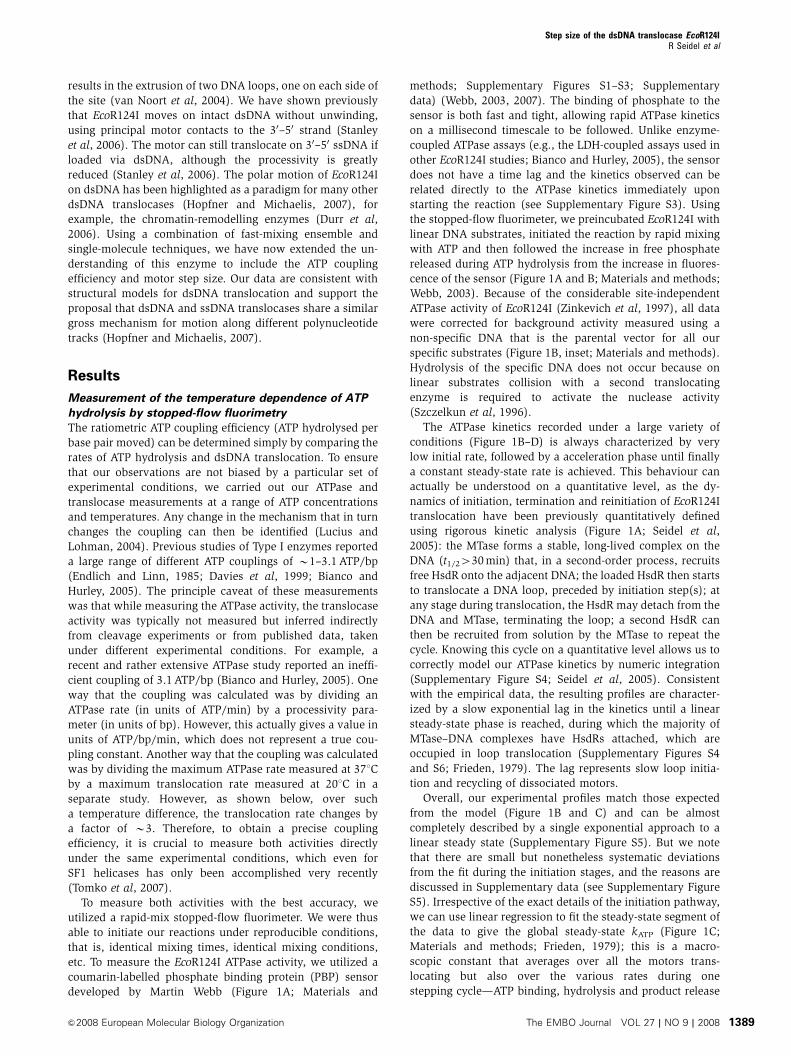
Motor step size and ATP coupling efficiency of thedsDNA translocase EcoR124I
This is an open-access article distributed under the terms of the Creative Commons Attribution License, which permitsdistribution, andreproduction inanymedium,provided theoriginalauthorandsourcearecredited.This licensedoesnotpermit commercial exploitation or the creation of derivative works without specific permission.
Ralf Seidel1,2, Joost GP Bloom1,Cees Dekker1,* and Mark D Szczelkun3,*1Kavli Institute of Nanoscience, Delft University of Technology, Delft,The Netherlands, 2DNA Motors Group, Biotechnological Centre,University of Technology Dresden, Dresden, Germany and3DNA–Protein Interactions Unit, Department of Biochemistry,University of Bristol, Bristol, UK
The Type I restriction-modification enzyme EcoR124I is an
archetypical helicase-based dsDNA translocase that moves
unidirectionally along the 30–50 strand of intact duplex
DNA. Using a combination of ensemble and single-mole-
cule measurements, we provide estimates of two physico-
chemical constants that are fundamental to a full
description of motor protein activity—the ATP coupling
efficiency (the number of ATP consumed per base pair)
and the step size (the number of base pairs transported per
motor step). Our data indicate that EcoR124I makes small
steps along the DNA of 1 bp in length with 1 ATP con-
sumed per step, but with some uncoupling of the ATPase
and translocase cycles occurring so that the average num-
ber of ATP consumed per base pair slightly exceeds unity.
Our observations form a framework for understanding
energy coupling in a great many other motors that trans-
locate along dsDNA rather than ssDNA.
The EMBO Journal (2008) 27, 1388–1398. doi:10.1038/
emboj.2008.69; Published online 3 April 2008
Subject Categories: genome stability & dynamics
Keywords: ATPase; helicase; molecular motor; single mole-
cule; stopped flow
Introduction
Molecular motor proteins have numerous roles in DNA
metabolism and are central to replication, recombination
and repair. An important class of nucleic acid motors are
the helicases, which can be classified on the basis of homo-
logous amino-acid motifs into superfamilies (SF) 1–5
(Singleton et al, 2007). For many helicases—all those char-
acterized thus far from SF1 for example—directional translo-
cation takes place on a single-stranded polynucleotide.
Accordingly, a duplex DNA (or RNA) must be melted to
gain access to the linear track. This structural transition in
a nucleic acid is the classical role for which helicases are
known, and indeed named. However, there are also a great
many enzymes—a large proportion of those found in SF2 for
example—that, although classified as helicases, are actually
dsDNA translocases that move along intact duplex polynucleo-
tides (Hopfner and Michaelis, 2007; Seidel and Dekker, 2007;
Singleton et al, 2007). These enzymes do not directly unwind
DNA and are thus not helicases in the eponymous sense. One
such example is the chromatin-remodelling factors (Lia et al,
2006; Zhang et al, 2006; Seidel and Dekker, 2007). Compared
to the ssDNA motors, very little is known about dsDNA
translocation. A key piece of information in developing a
mechanistic framework for understanding these enzymes is
how efficiently the motor couples ATP hydrolysis to protein
stepping on dsDNA: how much energy in the form of ATP is
required to move a step along DNA and how big is that step?
Knowing this information puts a physical constraint on how
domain motions of the helicase motor core are coupled to the
nucleic acid.
To solve this fundamental puzzle for the dsDNA translo-
cases, we have examined the motor activity of an archetype
dsDNA motor (Singleton et al, 2007), the ATP-dependent
Type I restriction-modification (RM) enzyme EcoR124I. The
extensive characterization of the dynamics of initiation,
translocation and termination of this enzyme (Seidel et al,
2005), alongside extensive kinetic analysis of translocation
(Firman and Szczelkun, 2000; Seidel et al, 2004; McClelland
et al, 2005; Stanley et al, 2006), means that EcoR124I is the
best test system for addressing this question.
The Type I RM enzymes are widely distributed in both
bacteria and archaea, and have a beneficial role in protecting
a host cell from invasion by foreign DNA such as bacterio-
phages and plasmids (Murray, 2000). Type I RM enzymes
comprise three protein subunits: HsdS, HsdM and HsdR.
HsdS and HsdM (HsdS1HsdM2) form independently active
methyltransferases (MTase) that recognize specific, bipartite
sequences (e.g., GAAnnnnnnRTCG for EcoR124I) (Janscak
et al, 1996). The HsdR subunits are fusions of PDE(x)K
nuclease and SF2 helicase domains (McClelland and
Szczelkun, 2004). To cleave DNA, HsdR must bind the
MTase and use its helicase motor to translocate along intact
dsDNA using ATP hydrolysis (Stanley et al, 2006). As the
HsdR motor remains bound to the MTase during transloca-
tion, a growing loop of DNA is extruded (van Noort et al,
2004). The MTase core can recruit two HsdRs to form an
HsdS1HsdM2HsdR2 complex where each HsdR acts indepen-
dently (Janscak et al, 1996; Seidel et al, 2004, 2005). As a
consequence, translocation by both HsdRs in a complexReceived: 18 October 2007; accepted: 3 March 2008; publishedonline: 3 April 2008
*Corresponding authors. C Dekker, Kavli Institute of Nanoscience,Delft University of Technology, Lorentzweg 1, 2628 CJ Delft,The Netherlands. Tel.: þ 31 15 278 6094; Fax: þ 31 15 278 1202;E-mail: [email protected] or MD Szczelkun, DNA–ProteinInteractions Unit, Department of Biochemistry, University of Bristol,Bristol BS8 1TD, UK. Tel.: þ 44 117 331 2158;Fax: þ 44 117 331 2168; E-mail: [email protected]
The EMBO Journal (2008) 27, 1388–1398 | & 2008 European Molecular Biology Organization |Some Rights Reserved 0261-4189/08
www.embojournal.org
The EMBO Journal VOL 27 | NO 9 | 2008 &2008 European Molecular Biology Organization
EMBO
THE
EMBOJOURNAL
THE
EMBOJOURNAL
1388
results in the extrusion of two DNA loops, one on each side of
the site (van Noort et al, 2004). We have shown previously
that EcoR124I moves on intact dsDNA without unwinding,
using principal motor contacts to the 30–50 strand (Stanley
et al, 2006). The motor can still translocate on 30–50 ssDNA if
loaded via dsDNA, although the processivity is greatly
reduced (Stanley et al, 2006). The polar motion of EcoR124I
on dsDNA has been highlighted as a paradigm for many other
dsDNA translocases (Hopfner and Michaelis, 2007), for
example, the chromatin-remodelling enzymes (Durr et al,
2006). Using a combination of fast-mixing ensemble and
single-molecule techniques, we have now extended the un-
derstanding of this enzyme to include the ATP coupling
efficiency and motor step size. Our data are consistent with
structural models for dsDNA translocation and support the
proposal that dsDNA and ssDNA translocases share a similar
gross mechanism for motion along different polynucleotide
tracks (Hopfner and Michaelis, 2007).
Results
Measurement of the temperature dependence of ATP
hydrolysis by stopped-flow fluorimetry
The ratiometric ATP coupling efficiency (ATP hydrolysed per
base pair moved) can be determined simply by comparing the
rates of ATP hydrolysis and dsDNA translocation. To ensure
that our observations are not biased by a particular set of
experimental conditions, we carried out our ATPase and
translocase measurements at a range of ATP concentrations
and temperatures. Any change in the mechanism that in turn
changes the coupling can then be identified (Lucius and
Lohman, 2004). Previous studies of Type I enzymes reported
a large range of different ATP couplings of B1–3.1 ATP/bp
(Endlich and Linn, 1985; Davies et al, 1999; Bianco and
Hurley, 2005). The principle caveat of these measurements
was that while measuring the ATPase activity, the translocase
activity was typically not measured but inferred indirectly
from cleavage experiments or from published data, taken
under different experimental conditions. For example, a
recent and rather extensive ATPase study reported an ineffi-
cient coupling of 3.1ATP/bp (Bianco and Hurley, 2005). One
way that the coupling was calculated was by dividing an
ATPase rate (in units of ATP/min) by a processivity para-
meter (in units of bp). However, this actually gives a value in
units of ATP/bp/min, which does not represent a true cou-
pling constant. Another way that the coupling was calculated
was by dividing the maximum ATPase rate measured at 371Cby a maximum translocation rate measured at 201C in a
separate study. However, as shown below, over such
a temperature difference, the translocation rate changes by
a factor of B3. Therefore, to obtain a precise coupling
efficiency, it is crucial to measure both activities directly
under the same experimental conditions, which even for
SF1 helicases has only been accomplished very recently
(Tomko et al, 2007).
To measure both activities with the best accuracy, we
utilized a rapid-mix stopped-flow fluorimeter. We were thus
able to initiate our reactions under reproducible conditions,
that is, identical mixing times, identical mixing conditions,
etc. To measure the EcoR124I ATPase activity, we utilized a
coumarin-labelled phosphate binding protein (PBP) sensor
developed by Martin Webb (Figure 1A; Materials and
methods; Supplementary Figures S1–S3; Supplementary
data) (Webb, 2003, 2007). The binding of phosphate to the
sensor is both fast and tight, allowing rapid ATPase kinetics
on a millisecond timescale to be followed. Unlike enzyme-
coupled ATPase assays (e.g., the LDH-coupled assays used in
other EcoR124I studies; Bianco and Hurley, 2005), the sensor
does not have a time lag and the kinetics observed can be
related directly to the ATPase kinetics immediately upon
starting the reaction (see Supplementary Figure S3). Using
the stopped-flow fluorimeter, we preincubated EcoR124I with
linear DNA substrates, initiated the reaction by rapid mixing
with ATP and then followed the increase in free phosphate
released during ATP hydrolysis from the increase in fluores-
cence of the sensor (Figure 1A and B; Materials and methods;
Webb, 2003). Because of the considerable site-independent
ATPase activity of EcoR124I (Zinkevich et al, 1997), all data
were corrected for background activity measured using a
non-specific DNA that is the parental vector for all our
specific substrates (Figure 1B, inset; Materials and methods).
Hydrolysis of the specific DNA does not occur because on
linear substrates collision with a second translocating
enzyme is required to activate the nuclease activity
(Szczelkun et al, 1996).
The ATPase kinetics recorded under a large variety of
conditions (Figure 1B–D) is always characterized by very
low initial rate, followed by a acceleration phase until finally
a constant steady-state rate is achieved. This behaviour can
actually be understood on a quantitative level, as the dy-
namics of initiation, termination and reinitiation of EcoR124I
translocation have been previously quantitatively defined
using rigorous kinetic analysis (Figure 1A; Seidel et al,
2005): the MTase forms a stable, long-lived complex on the
DNA (t1/2430min) that, in a second-order process, recruits
free HsdR onto the adjacent DNA; the loaded HsdR then starts
to translocate a DNA loop, preceded by initiation step(s); at
any stage during translocation, the HsdR may detach from the
DNA and MTase, terminating the loop; a second HsdR can
then be recruited from solution by the MTase to repeat the
cycle. Knowing this cycle on a quantitative level allows us to
correctly model our ATPase kinetics by numeric integration
(Supplementary Figure S4; Seidel et al, 2005). Consistent
with the empirical data, the resulting profiles are character-
ized by a slow exponential lag in the kinetics until a linear
steady-state phase is reached, during which the majority of
MTase–DNA complexes have HsdRs attached, which are
occupied in loop translocation (Supplementary Figures S4
and S6; Frieden, 1979). The lag represents slow loop initia-
tion and recycling of dissociated motors.
Overall, our experimental profiles match those expected
from the model (Figure 1B and C) and can be almost
completely described by a single exponential approach to a
linear steady state (Supplementary Figure S5). But we note
that there are small but nonetheless systematic deviations
from the fit during the initiation stages, and the reasons are
discussed in Supplementary data (see Supplementary Figure
S5). Irrespective of the exact details of the initiation pathway,
we can use linear regression to fit the steady-state segment of
the data to give the global steady-state kATP (Figure 1C;
Materials and methods; Frieden, 1979); this is a macro-
scopic constant that averages over all the motors trans-
locating but also over the various rates during one
stepping cycle—ATP binding, hydrolysis and product release
Step size of the dsDNA translocase EcoR124IR Seidel et al
&2008 European Molecular Biology Organization The EMBO Journal VOL 27 | NO 9 | 2008 1389

steps—and is typically governed by one step, which is rate
limiting in the cycle.
To determine accurately the rate of ATP hydrolysis per
HsdR molecule, we need to know the concentration of motors
that contribute to the observed steady-state rate. As two HsdR
molecules can be loaded by each DNA-bound MTase (Seidel
et al, 2005), the maximum concentration of translocating
HsdR molecules is equal to twice the concentration of DNA
sites (i.e., 0.5 nM DNA sites saturated with MTase correspond
to 1 nM HsdR binding sites; Materials and methods).
Consequently, there are two sources of systematic error that
can contribute to the accuracy of the ATPase rate (see
Supplementary data): firstly, uncertainty in the DNA concen-
tration gives an error in the concentration of HsdR loading
sites of 76%; secondly, although we ensured that the reac-
tion rate was saturated with respect to the HsdR (Figure 1B),
motor turnover during translocation leads to subsaturation of
the steady state (Seidel et al, 2005). Under the conditions
used here and based on the kinetic parameters determined
previously (Seidel et al, 2005), there is an additional 5%
uncertainty in the concentration of the steady-state popula-
tion (Supplementary Figure S6). These errors become impor-
tant when we consider the coupling ratios below (see
Figure 3C; Supplementary data).
ATPase rates were examined at five temperatures (10, 15,
20, 25 and 301C) and across a range of ATP concentrations
above and below the KM,app. An example of ATP titration
taken at 151C is shown (Figure 1D). kATP values were
determined from the linear phases of the profiles. The
dependence of kATP on the ATP concentration and tempera-
ture is shown in Figure 1E. At all temperatures, the rates
increase hyperbolically with increasing ATP, to reach a satu-
rated maximum. The temperature dependence gives a
Q10¼B2.0 (where Q10 is the temperature coefficient, defined
as the change in rate when the temperature is increased by
101C; data not shown). The data could be fitted to equation (4)
(see Materials and methods) to give apparent KM values that
were, within error, invariant of temperature (Figure 1E, inset).
Measurement of the temperature dependence of DNA
translocation by stopped-flow fluorimetry
DNA translocation can be measured in bulk solution by the
triplex displacement assay (Firman and Szczelkun, 2000;
McClelland et al, 2005), which allows variation in both
temperature and ATP concentration. Using the stopped-flow
fluorimeter, we preincubated our enzyme with specific linear
DNA substrates containing a fluorescent triplex bound at
varying distances downstream of the recognition site, in-
itiated the reaction by rapid mixing with ATP and then
followed the increase in the fluorescence of the triplex
probe as it was displaced following collision of the HsdR
(Figure 2A; Materials and methods). By following this proto-
Figure 1 The temperature dependence of ATP hydrolysis during steady-state loop extrusion. (A) Cartoon showing the cycle of initiation,translocation and termination of DNA translocation by an EcoR124I HsdR subunit (white oval). For clarity, translocation on one side of theMTase only is shown. DNA is shown as a black line and the EcoR124I MTase as a black oval. The binding of free inorganic phosphate by PBP isindicated. (B) Dependence of phosphate release on the availability of free HsdR (concentrations indicated). One-site linearized pLKS5 was at0.5 nM, MTase at 60 nM and ATP at 80 mM. (inset) Example of background correction at 128 nM HsdR. The phosphate release measured usingthe specific linear pLKS5 (S) was corrected by the background level using non-specific linear pTYB11 (NS) to generate the corrected profile (C).(C) Example kinetic profiles at 10 and 301C. The steady-state phase of the reaction was fitted to equation (3) to give kATP; the x-axis interceptgives the initiation time (data not shown; Frieden, 1979). (D) Example of an ATP titration (mM concentrations of ATP indicated), with eachprofile fitted to equation (3). (E) Hyperbolic dependence of kATP on [ATP] as a function of temperature. Solid lines show fits to equation (4).Statistical error bars are smaller than the scatter of the data points. Fitting to equation (4) was not weighted to either the statistical or systematicerrors (discussed in Supplementary data). (inset) Dependence of KM on temperature. Error bars are the standard error of the mean (s.e.m.)of the fitted values. The dotted line shows the average KM across the temperature range and the grey box the associated standard deviation(s.d.). Vmax,calc and s.e.m. (bp/s) calculated from the fits were 24673 (101C), 37677 (151C), 503723 (201C), 807711 (251C) and 99877 (301C).
Step size of the dsDNA translocase EcoR124IR Seidel et al
The EMBO Journal VOL 27 | NO 9 | 2008 &2008 European Molecular Biology Organization1390

col, we could measure translocation under exactly the same
conditions used above for the ATPase measurements. Data
from five different triplex spacings were fitted to the global
kinetic model considered above in the ATPase data to obtain
kstep (Materials and methods; Seidel et al, 2005). As with
kATP, this is a macroscopic constant that averages over ATP
binding/hydrolysis/release and motor steps in one stepping
cycle.
Translocation rates were examined at four temperatures
(10, 15, 20 and 301C) and across a range of ATP concentra-
tions above and below the KM,app. Similar measurements at
251C were obtained previously (Seidel et al, 2005). Examples
of displacement profiles are shown in Figure 2B. The depen-
dence of kstep on the ATP concentration and temperature is
shown in Figure 2C. At all temperatures, the data show that
the rates increase hyperbolically with increasing ATP. As
above, the temperature dependence gives a Q10¼B2.0
(data not shown). The apparent KM values obtained from
fits to equation (4) are, within error, equal to the values
obtained in the ATPase assays (Figure 2C, inset)
ATP coupling efficiency of EcoR124I
To compare directly the ATPase and translocation rates
obtained above, we must ensure that changes in ATP con-
centration and/or temperature do not result in changes in the
kinetic pathway (Lucius and Lohman, 2004; Tomko et al,
2007). If this were to occur such that the ATPase and translo-
case reactions were rate-limited by different steps in the
pathway, then the coupling ratio observed would be specific
to a particular solution condition. The experimental kATP and
kstep values presented in Figures 1E and 2C and the Vmax,calc
values obtained from the corresponding fits were compared
using the Arrhenius relationship:
n ¼ n0e�Ea=kBT ð1Þ
where v is the observed rate, v0 is the pre-exponential factor,
Ea is the activation energy barrier height and kBT is the
energy of the surrounding heat bath. ATPase and translocase
data at each ATP concentration were fitted to equation (1)
independently (Figure 3A; Supplementary Figures S7 and S8).
No significant deviations from equation (1) were observed
over the temperature ranges examined, indicating that the
same kinetic pathway exists under all conditions. Within
experimental error, the Ea values obtained for the ATPase
and translocase activities were similar and invariant with
ATP concentration (Figure 3B). These observations can be
justified as follows.
For our measurements, the translocation pathway can be
described in a simplified manner by the kinetic scheme
below:
! ATPþ EDn Ðk1
k�1
ATP � EDn �!kf
EDnþ1 ! ðScheme 1Þ
where EDn and EDnþ 1 represent the motor (E) bound to the
DNA (D) at positions n and nþ 1, respectively, k1 and k�1
represent the reversible ATP association and kf represents a
subsequent rate-limiting step that could reflect any part of the
cycle thereafter (ATP hydrolysis, protein domain motions,
ADP/Pi release, etc.; Lucius and Lohman, 2004). We assume
that there is only one rate-limiting step per cycle (i.e., there is
no other step with a similar rate to the slowest step). Our data
are consistent with Scheme 1 only if ATP binding is in rapid
equilibrium (i.e., k�1bkf; Lucius and Lohman, 2004). Under
these conditions, the same repeated step (kf) will remain rate
limiting at all ATP concentrations. Consequently, we would
expect that, as observed, varying the ATP concentration will
vary the rate in a hyperbolic manner but that the same
energetic barrier (that for the kf step) will exist at all
concentrations.
Because of the invariant Arrhenius relationship for both
ATPase and translocase rates over a range of ATP concentra-
tions, we are confident that the kinetic mechanism does not
vary appreciably across the conditions examined.
Consequently, we are also confident in directly comparing
the ATPase and translocase rates to obtain an apparent
coupling efficiency that is valid over a wide range of solution
Figure 2 The temperature dependence of translocation rate measured using ensemble triplex displacement assays. (A) Cartoon as in Figure 1Ashowing displacement of a fluorescent triplex (green line) during translocation of EcoR124I. The triplex assay returns the translocation rate forone HsdR, regardless of whether it is part of an R1 or R2 complex (McClelland et al, 2005). (B) Representative fluorescent triplex displacementprofiles. Final reaction conditions were 1 nM linear pMDS44a (of which 0.5 nM carries the triplex), 30nM MTase and 120 nM HsdR. Red linesare fits to the kinetic traces based on the model in Figure 1A and as described in Materials and methods to give kstep. (Left panel) Displacementprofiles at 101C at ATP concentrations (right to left) 12.5, 25, 48, 96, 170, 320, 600 and 1200mM. (right panel) Displacement profiles at a range oftemperatures as indicated. (C) Hyperbolic dependence of kstep on [ATP] as a function of temperature. Solid lines show fits to equation (4). Thedotted line represents the fitted trace from data obtained previously (Seidel et al, 2005). Statistical error bars are smaller than the scatter of thedata points. Fitting to equation (4) was not weighted to the statistical errors (discussed in Supplementary data). (inset) Dependence of the KM
on temperature. Error bars are the s.e.m. of the fitted values. The dotted line shows the average KM across the temperature range and the greybox the associated s.d. Vmax,calc and s.e.m. (bp/s) calculated from the fits or those described previously (Seidel et al, 2005) were 20875 (101C),31675 (151C), 46375 (201C), 57672 (251C; Seidel et al, 2005) and 84075 (301C).
Step size of the dsDNA translocase EcoR124IR Seidel et al
&2008 European Molecular Biology Organization The EMBO Journal VOL 27 | NO 9 | 2008 1391

conditions. The kATP:kstep ratios at each temperature and ATP
concentration are shown in Figure 3C. The values obtained
do not show any systematic relationship with either ATP or
temperature. The scatter is most likely due to statistical
experimental error (Supplementary data). We therefore
calculated an average coupling constant from the sample
of 1.26ATP/bp with an s.d. of 70.14 (N¼ 35). However, an
important source of error in this value comes from the
systematic errors in the kATP values (see above and
Supplementary data). To quantify the precision of the sample
mean, we calculated the error propagation from the sum of
the 95% confidence interval (74%) and the additive sys-
tematic errors in kATP (þ 11 and �6%; Supplementary data),
to give a coupling constant of 1.26�0.13þ 0.19 ATP/bp. Given the
wide range of solution conditions explored and the error
range in our measurements, we can assert that EcoR124I
hydrolyses between 1.1 and 1.5 ATPs for every base pair of
dsDNA translocated.
Measurement of the temperature dependence of DNA
translocation by single-molecule measurements
One of the most compelling reasons to use EcoR124I as an
archetype dsDNA translocase in these studies is that we can
measure the activity of single enzyme molecules using a well-
established magnetic tweezers set-up (Figure 4A; Seidel et al,
2004, 2005; Stanley et al, 2006). Motor events can be
observed as a transient decrease in the end-to-end length of
the DNA due to the formation of DNA loops. Both the rate
and lifetime of a translocation event can be scored. As the
reported rates correspond to the total velocity of shortening
of the end-to-end length of the DNA, events with only one
motor running (R1) can be distinguished from those with two
motors running (R2), as the latter cause a temporary doubling
of the rate. As in the ensemble experiments, the use of a one-
site linear DNA substrate significantly reduces the chance of
DNA cleavage occurring (Szczelkun et al, 1996; Seidel et al,
2004).
To assess the physical step size of the enzyme, which is
required to obtain the ATP coupling efficiency, it would be
ideal if one could resolve individual steps directly from the
tracking profiles. However, EcoR124I motor events can only
be observed for forces o5 pN (Seidel et al, 2004), conditions
where large Brownian fluctuations of the DNA in combina-
tion with the high motor velocity limit the spatial resolution
of individual steps to step sizes of 410 bp at 10Hz. But it is
possible to calculate a smaller step size from a noise analysis
of a measured translocation profile following many thou-
sands of steps (Charvin et al, 2002; Neuman et al, 2005).
When the motor cycle is governed by a single rate-limiting
step (i.e., as in Scheme 1), the stochastic nature of stepping
produces a random deviation from a straight line in the
position–time relationship. This stepping noise, which is
proportional to the step size, has distinct spectral character-
istics at low frequencies compared to the approximately
Gaussian noise of the magnetic bead fluctuations (Charvin
et al, 2002; Neuman et al, 2005). Consequently, it is possible
to extract the step size from a Fourier analysis of multiple
steps during a translocation run in the magnetic tweezers. For
example, this method has been used to determine an
unwinding step size for the UvrD helicase of 6 bp
(Dessinges et al, 2004).
To carry out this analysis on EcoR124I, we assume that
Scheme 1 holds, that is, each enzymatic cycle is governed by
a single rate-limiting step. (Multiple rate-limiting steps would
lead to a decrease in the stepping randomness and thus a
lower stepping signal compared to background noise.) To
validate this under the single-molecule conditions, tweezers
experiments were performed at different temperatures with a
fixed, saturating concentration of ATP (Materials and
Figure 3 Coupling efficiency of ATP hydrolysis to DNA transloca-tion. (A) Temperature dependence of the rate of ATP hydrolysis (leftpanel) and translocation (right panel) at ATP concentrations (bot-tom to top in both panels) 12.5, 25, 48, 96, 170, 320, 600 and1200mM. The topmost line in each panel represents the Vmax,calc
data obtained from the hyperbolic fits in Figures 1E and 2C, andSeidel et al (2005). Solid lines represent independent fits to equation(1). Statistical error bars are smaller than the scatter of the datapoints. Fitting to equation (1) was not weighted to the statisticalerrors (discussed in Supplementary data). Each individual fit isshown in Supplementary Figures S7 and S8. (B) Dependence of theactivation energies (Ea) obtained in (A) on [ATP]. Error bars are thes.e.m. Vmax,calc values are arbitrarily plotted at 8mM ATP. Dottedlines represent the average Ea values and the grey boxes theassociated s.d. values. (C) The effect of temperature and [ATP] onthe ATP coupling ratio (kATP/kstep). Grey lines show the ratios ofATP hydrolysed to base pairs translocated, as indicated. The dottedline shows the mean coupling ratio, 1.26ATP/bp. The s.d. of thesample mean is 70.14 (N¼ 35). The grey box represents theprecision of the mean (þ 0.19
�0.13 ) and is calculated by error propagationas the sum of the 95% confidence interval of the sample and thesystematic error in kATP (discussed in Supplementary data).
Step size of the dsDNA translocase EcoR124IR Seidel et al
The EMBO Journal VOL 27 | NO 9 | 2008 &2008 European Molecular Biology Organization1392

methods); example profiles at two temperatures are shown
in Figure 4B.
For each temperature examined, data were collated for the
translocation velocity and lifetime for both R1 and R2 events
and fitted to equation (1) (Figure 4C and D). In agreement
with the stopped-flow measurements, linear Arrhenius rela-
tionships were obtained, which supports the assumption that
speed is limited by a single rate (modelling additional tem-
perature-dependent and temperature-independent rates
causes significant deviations from the data; Supplementary
Figure S9). The activation energies for the R1 and R2 events
are similar, whereas the absolute speeds are two-fold differ-
ent across the temperature range examined (Figure 4C).
These results are consistent with previous independent ob-
servations that the R2 rate is simply the sum of translocation
rates for each of the divergent HsdR motors (Seidel et al,
2004). Comparison of the data from the tweezers assay with
that from the triplex assay shows that there is excellent
agreement in the HsdR translocation rates (Supplementary
Figure S10). The duration of both R1 and R2 motor events
Figure 4 Temperature dependence of EcoR124I step size measured using single-molecule magnetic tweezers assays. (A) Magnetic tweezersset-up (Seidel et al, 2004). A DNA molecule with a single EcoR124I site is anchored between a glass coverslip and a magnetic bead. Magnets areused to maintain the DNA in a stretched conformation. Translocation of one (not shown) or two (shown) HsdR results in the formation ofexpanding DNA loops, which reduce the apparent end-to-end DNA length and this is monitored by video microscopy. (B) Example time tracesrecorded at two different temperatures with MTase at 20 nM, HsdR at 160nM, ATP at 4mM and the applied stretching force at 3 pN. Each traceshows a similar profile, with the initiation of the first motor to form an R1 event (1), the initiation of the second motor to form an R2 event (2),the dissociation of one or other motor with the concomitant release of a trapped DNA loop to return to an R1 event (3) and finally thedissociation of the remaining motor (4). The graphs below the time traces show the development of the translocation rate, which has beendetermined from a straight line fit to the data (data not shown) and calculating its derivative. R2 events have a rate that is twice that of R1 events(Seidel et al, 2004). (C) Temperature dependence of the R1 or combined R2 translocation velocity from the magnetic tweezers. Solid linesrepresent independent fits to equation (1). Error bars in the y-axis represent s.e.m. and errors bars in the x-axis represent the systematic error inthe temperature. (D) Temperature dependence of the motor lifetime (tmotor) for single HsdR within an R1 or R2 complex. Solid lines representindependent fits to equation (1) where v¼ 1/tmotor. Error bars as in (C). (E) Example of a long-duration R2 translocation event recorded at 181Cand 3pN. The average spectral density of such events was examined to obtain estimates of the step size. (F) Power spectrum averaged over 14translocation events at 181C. The blue line represents the fit to equation (2). The two dotted lines indicate step sizes of precisely 1 or 3 bp. Thegreen data are the power spectrum of the noise during periods of inactivity. Error bars represent s.e.m. (G) The temperature dependence of thestep size. The dotted line represents the mean across the temperature range. Error bars represent the s.e. returned from the fit (see (F)).
Step size of the dsDNA translocase EcoR124IR Seidel et al
&2008 European Molecular Biology Organization The EMBO Journal VOL 27 | NO 9 | 2008 1393

(tmotor) decreased with increasing temperature. Linear
Arrhenius relationships were again obtained, with activation
energies for the R1 and R2 species, which are two-fold
different (Figure 4D). These results are also consistent with
previous work, which showed that translocation termination
(defined as the dissociation of a single HsdR from the MTase
loader complex) is governed by a single rate (Seidel et al,
2004, 2005).
Step size of EcoR124I measured by magnetic tweezers
To determine the step size, we examined long-lived R2
translocation events at different temperatures (Materials
and methods). The activity of each motor in an R2 complex
is statistically independent (Figure 4C; Szczelkun, 2002;
Seidel et al, 2004, 2005), and the resulting stepping profiles
will be indistinguishable from those of one motor in an R1
complex (except for a doubling in the overall rate). To provide
the best balance between decreasing instrumental noise (by
minimizing Brownian motion of the bead) while increasing
the run length (which in turn maximizes the occurrence of
low-frequency noise), we chose to examine R2 tweezers data
for conditions of [ATP]¼ 4mM and F¼ 3 pN. Note that we
can neglect any influence of the applied force on the apparent
step size, as the stepping rate is independent of force up to
5 pN, most likely because the force-producing step never
becomes rate limiting before the complex collapses (Seidel
et al, 2004). A typical profile under these conditions is shown
(Figure 4E). Under the assumption, validated above, of a
single rate-limiting step per stepping cycle, the power spec-
trum of a translocation run can be analysed by
hSXðf Þi ¼ehni2p2f 2
þ b ð2Þ
where f is the frequency, e the step size, n the speed and b the
experimental background noise (Charvin et al, 2002; Neuman
et al, 2005). To improve precision further, the power spectra
of multiple translocation events were averaged (Figure 4F).
The power spectrum of instrumental noise (i.e., during
periods of motor inactivity) is shown for comparison. For
this example, a step size of 2.4 bp can be estimated from a fit
to equation (2). The dashed lines in Figure 4F show the
relationship expected for steps of 1 or 3 bp. Clearly, these do
not describe the data well.
Step sizes estimated in this way were determined at a
range of temperatures (Figure 4G). Although enzyme speed
changes considerably over the temperature range (Figure 4C),
the step sizes are, within experimental limits, constant. From
this, we can estimate a temperature-independent mean step
size of 1.970.6 bp. We note that any additional source of
error—nonlinearities in the length measurements—increase
the low-frequency noise (additional deviation from a straight
line in the position–time relationship) and therefore might
lead to a slight overestimation of the real step size. Moreover,
if EcoR124I occasionally makes short pauses during translo-
cation (see discussion about uncoupling below) or exhibits a
slight sequence dependence of its translocation rate, then
again the step size would be somewhat overestimated. Our
data thus clearly exclude step sizes exceeding 2. EcoR124I
most likely makes steps of 2 bp or perhaps 1 bp at a time
along the dsDNA track.
Discussion
We have shown above that motion of the dsDNA motor
EcoR124I along intact dsDNA can occur in steps of 1–2 bp,
with B1 ATP consumed for each base pair moved. Most
notably, both results are consistent with a model in which the
motor makes small steps on DNA of p2 bp. Much larger
differences between the coupling ratio and the apparent step
size have been found for other helicase motors (see below).
A small step size explains a number of features of the
EcoR124I mechanism: (1) DNA translocation produces
changes in DNA twist, with one supercoil induced every
1172bp (Seidel et al, 2004). This is consistent with a small
step size where the motor will track closely the helical pitch of
the DNA. (2) The translocation rate is independent of force up
to B5pN (above which DNA tension significantly reduces the
lifetime of translocation; Seidel et al, 2004). This is consistent
with a small step size, which would only slow down any force-
producing step by a factor of B1.4 (calculated assuming a
force-dependent Arrhenius relationship (Seidel et al, 2004), a
step size of 1 bp and a force of 4 pN). (3) DNA translocation is
sensitive to changes in the DNA backbone as minor as a single
missing phosphate group at a nick (Stanley et al, 2006). This is
consistent with the enzyme tracking the DNA backbone
closely. (4) EcoR124I is a true dsDNA translocase (Stanley
et al, 2006). Any transient DNA unwinding during transloca-
tion would most likely lead to a strong sequence-dependent
translocation rate, as seen for some true helicases (Johnson
et al, 2007), which in turn should significantly increase the
observed stepping noise. However, our small step size is
inconsistent with large sequence-dependent effects.
Despite a rather close match between ATPase coupling and
apparent physical step size, both measured values are, how-
ever, not entirely in agreement with a simple uniform step-
ping model in which 1 or 2 bp steps are made by the enzyme
with precisely 1 ATP hydrolysed per step. On the one hand,
the ATPase coupling is significantly larger than 1:1
(Figure 3C) and, on the other hand, the apparent step size
is close to 2 and thus larger than the coupling ratio
(Figure 4G). In the following discussion, we will therefore
consider several models, each of which can explain this.
2:2 Tightly coupled Model
The motor makes a 2 bp step along the DNA lattice after
hydrolysis of 2 ATP (Figure 5A). Within this model, two
sequential ATP-binding–hydrolysis–release cycles must
occur; simultaneous, cooperative ATP binding at two inde-
pendent ATP binding sites is not supported by the strictly
hyperbolic ATP dependence of kstep and kATP (Figures 1E and
2C). This in turn implies that the energy of the first hydrolysis
event must be stored (e.g., within a strained conformational
intermediate state of the motor) to be made available follow-
ing the second hydrolysis event. Note that this model can
only give rise to an apparent step size of 2 bp from a Fourier
analysis if one allows the rates of the two ATP hydrolysis
events to be different. Otherwise, a step size of 1 bp would be
obtained (this corresponds to the Clockwork Model with
kfast/kslow¼ 1, which is discussed below and in Figure 6A).
1:1 Spring-loaded Model
The motor makes 1 bp steps along the DNA lattice with 1 ATP
hydrolysed per step, but with an elastic linkage between the
Step size of the dsDNA translocase EcoR124IR Seidel et al
The EMBO Journal VOL 27 | NO 9 | 2008 &2008 European Molecular Biology Organization1394

HsdR and, for example, the MTase, such that measurable
DNA shortening is observed only after a threshold strain has
accumulated. This model has been adapted from the recently
proposed mechanism of HCV NS3 helicase (Myong et al,
2007). The threshold could be reached every 2 bp, as depicted
in Figure 5B. As noted above, this model only returns an
apparent step size 41 bp from a Fourier analysis if there are
rate differences within the cycle before DNA shortening.
1:1 Clockwork Model
The motor makes 1 bp steps along the DNA lattice with 1 ATP
hydrolysed per step, but with a pause every n steps
(Figure 5C). This model has been recently proposed for the
translocation of UvrD along ssDNA to explain the difference
between an apparent kinetic step size of 4.6 nt and an ATPase
coupling of 1ATP/nt (Tomko et al, 2007). Depending on the
ratio between the fast stepping rate and the slow pausing rate,
one could obtain an apparent step size anywhere between 1
and n from a Fourier analysis (Figure 6A).
1:1 Uncoupled Model
Based on the coupling of 41ATP/bp observed here, we
propose a new model that has not been discussed previously.
It assumes 1 bp steps along the DNA lattice with 1 ATP
hydrolysed per step, but additionally allows non-productive
(uncoupled) steps. In the latter case, the motor enters a cycle
of ATP hydrolysis that does not lead to movement of the
enzyme (Figure 5D). Consequently, a coupling of 41ATP/bp
is observed. If one allows the rate of the uncoupled cycle to
be slower than the stepping rate, an apparent step size
significantly larger than 1 can also be observed (Figure 6B).
Based on the data presented here, we cannot absolutely
rule out any of these models, as, under particular conditions,
all can return an apparent step size of B2 bp. Although there
is some value in attempting to discuss the plausibility of the
different models, one has to keep in mind that our current
knowledge about the dynamics and mechanisms of SF2
helicases, and helicases in general, is rather limited.
Although there are now a large number of structural and
biochemical studies of SF1 and SF2 helicases that provide
strong support for a coupling ratio of 1ATP/bp (Roman and
Kowalczykowski, 1989; Dillingham et al, 2000; Soultanas and
Wigley, 2001; Lee and Yang, 2006; Buttner et al, 2007,
Hopfner and Michaelis, 2007), model-based step size deter-
minations (Dessinges et al, 2004; Tomko et al, 2007) and
single-molecule experiments resolving individual steps
(Dumont et al, 2006; Myong et al, 2007) have provided
evidence that are not in agreement with a simple uniform
stepping model with a step size of 1 bp. Our study of dsDNA
translocation also provides support for a non-uniform step-
ping mechanism. However, in addition to the previously
suggested mechanisms, that is, the Spring-loaded and
Clockwork Models (see above), we propose that one should
also consider models in which uncoupling between hydro-
lysis and forward stepping is allowed.
From the examination of SF1 and SF2 structures, it has
been proposed that helicases have evolved to use the same
underlying inchworm-like motion of two RecA domains for
motion on both ssDNA and dsDNA (Hopfner and Michaelis,
2007; Singleton et al, 2007). Given that the magnitude of
domain motions between ATP-bound and nucleotide-free
conformations has been determined to be B0.34 nm
(Buttner et al, 2007; Hopfner and Michaelis, 2007), we favour
Figure 5 Models for different stepping modes of EcoR124I. EcoR124I MTase (M) is represented as a rectangle, HsdR (R) as a circle or square(with the protein–protein connection to the MTase as a line) and the DNA as beads-on-a-string with each base pair as a separate bead. (A) 2:2Tightly-coupled Model. Starting at position 0, HsdR consumes 2 ATP before making a step of 2 bp, so pumping 2 bp into the expanding DNAloop at each step. (B) 1:1 Spring-loaded Model (Myong et al, 2007), with an elastic linkage between the HsdR and MTase. HsdR consumes 1 ATPfor each step on the DNA, partitioning 1 bp at a time into the expanding loop. Forward stepping causes the linkage between the HsdR andMTase to stretch until, at a threshold (here, 2 bp), recoil causes the HsdR to be pulled back. (C) 1:1 Clockwork Model (Tomko et al, 2007). HsdRconsumes 1 ATP for each step on the DNA, partitioning 1 bp at a time into the expanding loop. After a set number of steps (n), a slow stepoccurs before stepping restarts. The pause most likely represents a conformational resetting of the HsdR. (D) 1:1 Uncoupled Model. HsdRconsumes 1 ATP for each step on the DNA, pumping 1 bp into the expanding loop at each step with a rate kATP,productive. Alternatively, HsdR canenter a cycle of ATP hydrolysis that does not move the HsdR forward (or backward): HsdR can stall at its current position with a rate kuncouple,before returning to a translocation competent state with a rate kATP,non-productive.
Step size of the dsDNA translocase EcoR124IR Seidel et al
&2008 European Molecular Biology Organization The EMBO Journal VOL 27 | NO 9 | 2008 1395

mechanisms where the smallest step taken on DNA is 1 bp.
The 1:1 Uncoupled Model (Figure 5D) is the only one
considered here that can also accommodate a coupling of
41ATP/bp, as depicted in Figure 3C (even higher errors of
up to 10% in the DNA concentration would still return a
coupling 41). However, there is no reason why uncoupled
ATPase activity could not occur within the context of a
Spring-loaded and/or Clockwork mechanism. What could
be the structural rationale for uncoupling? Comparison of
processive and non-processive SF2 helicases has revealed
that duplex unwinding is powered by very similar RecA
domain motions in both systems (Sengoku et al, 2006;
Buttner et al, 2007). The additional structural element that
assists processive motion has been identified as a so-called
ratchet domain, which clamps the nucleic acid template
during forward movement (Buttner et al, 2007). Potentially,
this clamping may not be 100% efficient, leading to occa-
sional ATP binding and hydrolysis without forward motion. A
definitive view of the stepping mechanism(s) of dsDNA
translocases such as EcoR124I will probably be achieved
only by simultaneously resolving the base-pair-sized motor
steps and ATPase cycle in single-molecule experiments,
where, in particular, the latter measurements are challenging.
Materials and methods
Preparation of proteins and DNAEcoR124I was purified, reconstituted and tested as previouslydescribed (Stanley et al, 2006). For magnetic tweezers experiments,DNA substrates were prepared from pRSgap (Stanley et al, 2006)into which a 1.4 kbp PCR fragment from pSFVI (3780–5140 bp)carrying a single EcoR124I site was cloned between the XhoI and theHindIII sites. DNA tails with biotin- and digoxigen-modified baseswere ligated as described previously (Stanley et al, 2006) at the SacIand PciI sites of the plasmid. This provides a 9.7 kbp DNA constructwith the EcoR124I site close to the centre of the molecule. Forphosphate release experiments, ApaI-linearized versions of single-site specific (pLKS5; Stanley and Szczelkun, 2006) and non-specific(pTYB11; New England Biolabs) plasmids were prepared asdescribed (Seidel et al, 2005). For the triplex assays, ApaI-linearizedversions of the single-site specific plasmids pMDS43a, -44a, -45a,-46a and -47a were prepared as described (McClelland et al, 2005).Both this family of plasmids and pLKS5 are based on the parentalvector pTYB11 and show 498% sequence identity. DNA for theensemble experiments was highly purified by density gradientcentrifugation in CsCl–ethidium bromide (Vipond et al, 1995). DNAconcentrations were measured by absorbance at 260 nm in a PerkinElmer Lambda 14 spectrophotometer using an average extinctioncoefficient for dsDNA of 0.02ml/mg/cm (Sambrook and Russell,2001). The specific DNA and non-specific DNA were checked byethidium bromide fluorescence following agarose gel electrophor-esis to ensure that the concentrations matched. The errorsassociated with the determination of DNA concentration arediscussed in Supplementary data.
Phosphate release assayCoumarin-labelled PBP was prepared, characterized, calibrated andtested according to Webb (2003) (Supplementary data; Supplemen-tary Figures S1–S3). Rapid mixing fluorescence was performedusing an SF61-DX2 stopped-flow fluorimeter (TgK ScientificLimited, Bradford-on-Avon, UK) with lex¼ 435 nm (B2nm band-width) with a 455 nm band pass filter placed between the samplehousing and photomultiplier tube (PMT). Temperature was main-tained between 10 and 301C by a waterbath connected to thechamber housing the syringes and flow cell. Pre-equilibratedsamples in reaction buffer (50mM Tris–HCl, pH 8.0, 10mM MgCl2,1mM DTT) containing 1 nM linear DNA, 120nM MTase, 0–400 nMHsdR, 12 mM PBP, 30mM 7-methylguanosine (Sigma) and 0.05–0.005U/ml purine nucleoside phosphorylase (Sigma) were loadedinto syringe ‘C’ of the SF61-DX2. Pre-equilibrated samplesin reaction buffer containing 0–2400mM ATP, 12mM PBP, 30mM7-methylguanosine and 0.05–0.005U/ml purine nucleoside phos-phorylase were loaded into syringe ‘D’. (Mg2þ ions are required forboth the ATPase (and thus translocase) and nuclease activities. TheMg2þ ion concentration was chosen to be saturating with respect tothe in vitro nucleotide concentration, which parallels cellularconditions in Escherichia coli (Kuzminov, 1999).) Equal volumes(50 ml) of C and D were mixed and the progress of the reaction wasmonitored using default hardware settings. For the standardreactions, the final conditions were 0.5 nM linear DNA, 60 nMMTase, 200 nM HsdR and 0–1200mM ATP. The PMT response wascalibrated using titration of a Pi standard according to Webb (2003)and was shown to be linear at all temperatures (Supplementarydata; Supplementary Figure S2; Supplementary Table S1). Theaccuracy of the assay was validated by comparison to a radioactiveATPase assay (Supplementary Figure S3).
Figure 6 The effect of different translocation modes on the appar-ent step size of a motor with a true step size of 1 bp. Using themodels in Figure 5, Poisson stepping profiles were simulated usingthe parameters shown. Apparent step sizes were then estimatedfrom a Fourier analysis of the simulated traces (see Supplementarydata for further details). (A) The effect of a pause every n steps (theClockwork Model in Figure 5C). 1 bp steps are made at the rate kfast.After completing n steps, the motor undergoes a conformationalchange at the rate kslow during which no stepping occurs. The effectof the number of steps before pausing and the relative rates of thefast and slow steps are shown. Increasing the number of stepsbefore the pause and decreasing the rate of the pause step cause anoverestimation of the step size. (B) The effect of uncoupled steps(the Uncoupled Model in Figure 5D). The effect of changes in thecoupling ratio (ATP/bp) and the rate ratio of the two ATPase stepsare shown. Uncoupled steps can lead to occasional slow cycles thatcan result in an over- or underestimation of the apparent step size.Similar uncoupling events could account for the large kinetic stepsizes seen in some other helicase studies (see main text).
Step size of the dsDNA translocase EcoR124IR Seidel et al
The EMBO Journal VOL 27 | NO 9 | 2008 &2008 European Molecular Biology Organization1396

Triplex displacement assayTriplex displacement measurements were carried out in the SF61-DX2 stopped-flow fluorimeter as described (McClelland et al, 2005;Seidel et al, 2005). Temperature was maintained between 10 and301C by a waterbath connected to the chamber housing the syringesand flow cell. Final reaction conditions were 1 nM linear DNA(0.5 nM tetramethylrhodamine triplex), 60 nM MTase, 200nMHsdR, 12mM phosphocreatine, 10U/ml creatine phosphokinaseand 0–1200 mM ATP in reaction buffer. kstep values were determinedfrom reactions at each of five different triplex spacings (484, 917,1414, 2054 and 2774bp).
Magnetic tweezers assaysMagnetic tweezers experiments have been carried out as previouslydescribed using M-280 dynabeads (Invitrogen) (Seidel et al, 2004).Enzyme reactions have been carried out in reaction buffer using20nMMTase, 160nM HsdR and a DNA stretching force of 370.3 pNin all experiments. Under these conditions, the translocation rate isindependent of the force (Seidel et al, 2004). The temperatureduring the measurements was varied by controlling the temperatureof the surrounding room or by simultaneously controlling thetemperature of the objective using an objective heater (Bioptechs)and the temperature of the flow cell system using transparentheating elements (Alflex) placed on top of the cell.
Data analysisPreviously described methods were used to analyse the triplexdisplacement profiles (McClelland et al, 2005; Seidel et al, 2005)and the time traces from the magnetic tweezers (Seidel et al, 2004,2005; Stanley et al, 2006). Linear steady-state phases of the ATPaserate profiles were fitted to
CP ¼1
kATPt þ tini ð3Þ
where Cp is the phosphate concentration, kATP is the macroscopicsteady-state ATPase rate, tini is the macroscopic initiation delay timeand t is the reaction time. ATP dependence data were fit to aMichaelis–Menten relationship:
n ¼Vmax½ATP�KM þ ½ATP�
ð4Þ
Fits to equations (1) and (4) were not weighted to statistical orsystematic errors (the statistical and systematic errors associatedwith the ensemble experiments are discussed in Supplementarydata). Systematic errors associated with kATP were incorporated inthe analysis of the average coupling ratio (see above and Figure 3C).
Single-molecule translocation events were analysed as describedpreviously (Seidel et al, 2004). Segments of constant enzymevelocity were fitted with straight lines to extract translocation ratesand processivities. For step size estimation by noise analysis, werecorded at each temperature typically 10–20 translocation eventscontaining a segment of constant R2 velocity of more than 6.7 s (or400 data points at 60Hz sampling rate). From each segment, theconstant slope was subtracted and the resulting data weresubdivided into 6.7 s subsegments that were slightly overlapping.For each subsegment, the power spectrum was calculated and allpower spectra from all subsegments at a given temperature wereaveraged to reduce the statistical error. For power spectrumcalculations, a Hanning window was applied, but similar resultswere obtained if no window was applied (data not shown). Theaveraged power spectrum was subsequently fit by equation (2) toextract the step size. Background noise was treated the same way byanalysing segments where no enzymatic activity has beenobserved.
Supplementary dataSupplementary data are available at The EMBO Journal Online(http://www.embojournal.org).
Acknowledgements
We thank Martin Webb for the gift of the PBP clones. This work wassupported by grants from Bionanoswitch and NWO (CD) and theWellcome Trust (067439, MDS). MDS is a Wellcome Trust SeniorResearch Fellow in Basic Biomedical Sciences.
References
Bianco PR, Hurley EM (2005) The type I restriction endonucleaseEcoR124I, couples ATP hydrolysis to bidirectional DNA transloca-tion. J Mol Biol 352: 837–859
Buttner K, Nehring S, Hopfner KP (2007) Structural basis for DNAduplex separation by a superfamily-2 helicase. Nat Struct Mol Biol14: 647–652
Charvin G, Bensimon D, Croquette V (2002) On the relationbetween noise spectra and the distribution of time betweensteps for single molecular motors. Single Mol 3: 43–48
Davies GP, Kemp P, Molineux IJ, Murray NE (1999) The DNAtranslocation and ATPase activities of restriction-deficient mu-tants of Eco KI. J Mol Biol 292: 787–796
Dessinges MN, Lionnet T, Xi XG, Bensimon D, Croquette V (2004)Single-molecule assay reveals strand switching and enhancedprocessivity of UvrD. Proc Natl Acad Sci USA 101: 6439–6444
Dillingham MS, Wigley DB, Webb MR (2000) Demonstration ofunidirectional single-stranded DNA translocation by PcrA heli-case: measurement of step size and translocation speed.Biochemistry 39: 205–212
Dumont S, Cheng W, Serebrov V, Beran RK, Tinoco Jr I, Pyle AM,Bustamante C (2006) RNA translocation and unwinding mechan-ism of HCV NS3 helicase and its coordination by ATP. Nature 439:105–108
Durr H, Flaus A, Owen-Hughes T, Hopfner KP (2006) Snf2 familyATPases and DExx box helicases: differences and unifying con-cepts from high-resolution crystal structures. Nucleic Acids Res34: 4160–4167
Endlich B, Linn S (1985) The DNA restriction endonuclease ofEscherichia coli B. I. Studies of the DNA translocation and theATPase activities. J Biol Chem 260: 5720–5728
Firman K, Szczelkun MD (2000) Measuring motion on DNA by thetype I restriction endonuclease EcoR124I using triplex displace-ment. EMBO J 19: 2094–2102
Frieden C (1979) Slow transitions and hysteretic behavior inenzymes. Annu Rev Biochem 48: 471–489
Hopfner KP, Michaelis J (2007) Mechanisms of nucleic acid trans-locases: lessons from structural biology and single-moleculebiophysics. Curr Opin Struct Biol 17: 87–95
Janscak P, Abadjieva A, Firman K (1996) The type I restrictionendonuclease R.EcoR124I: over production and biochemicalproperties. J Mol Biol 257: 977–991
Johnson DS, Bai L, Smith BY, Patel SS, Wang MD (2007) Single-molecule studies reveal dynamics of DNA unwinding by the ring-shaped T7 helicase. Cell 129: 1299–1309
Kuzminov A (1999) Recombinational repair of DNA damage inEscherichia coli and bacteriophage lambda. Microbiol Mol BiolRev 63: 751–813
Lee JY, Yang W (2006) UvrD helicase unwinds DNA one basepair at a time by a two-part power stroke. Cell 127:1349–1360
Lia G, Praly E, Ferreira H, Stockdale C, Tse-Dinh YC, Dunlap D,Croquette V, Bensimon D, Owen-Hughes T (2006) Directobservation of DNA distortion by the RSC complex. Mol Cell 21:417–425
Lucius AL, Lohman TM (2004) Effects of temperature andATP on the kinetic mechanism and kinetic step-size for E. coliRecBCD helicase-catalyzed DNA unwinding. J Mol Biol 339:751–771
McClelland SE, Dryden DTF, Szczelkun MD (2005) Continuousassays for DNA translocation using fluorescent triplex dissocia-tion: application to type I restriction endonucleases. J Mol Biol348: 895–915
McClelland SE, Szczelkun MD (2004) The type I and III restrictionendonucleases: structural elements in molecular motors thatprocess DNA. In Restriction Enzymes, Nucleic Acids andMolecular Biology, Pingound A (ed), Vol. 14, pp 111–135.Germany: Springer Verlag
Murray NE (2000) Type I restriction systems: sophisticated mole-cular machines (a legacy of Bertani and Weigle). Microbiol MolBiol Rev 64: 412–434
Step size of the dsDNA translocase EcoR124IR Seidel et al
&2008 European Molecular Biology Organization The EMBO Journal VOL 27 | NO 9 | 2008 1397

Myong S, Bruno MM, Pyle AM, Ha T (2007) Spring-loaded mechan-ism of DNA unwinding by hepatitis C virus NS3 helicase. Science317: 513–516
Neuman KC, Saleh OA, Lionnet T, Lia G, Allemand J-F, Bensimon D,Croquette V (2005) Statistical determination of the stepsize of molecular motors. J Phys Condens Matter 17:S3811–S3820
Roman LJ, Kowalczykowski SC (1989) Characterization of theadenosinetriphosphatase activity of the Escherichia coli RecBCDenzyme: relationship of ATP hydrolysis to the unwinding ofduplex DNA. Biochemistry 28: 2873–2881
Sambrook J, Russell DW (2001) Molecular Cloning: A LaboratoryManual, 3rd edn. Cold Spring Harbor, NY: Cold Spring Harbor Press
Seidel R, Bloom JG, van Noort J, Dutta CF, Dekker NH, Firman K,Szczelkun MD, Dekker C (2005) Dynamics of initiation, termina-tion and reinitiation of DNA translocation by the motor proteinEcoR124I. EMBO J 24: 4188–4197
Seidel R, Dekker C (2007) Single-molecule studies of nucleic acidmotors. Curr Opin Struct Biol 17: 80–86
Seidel R, van Noort J, van der Scheer C, Bloom JG, Dekker NH,Dutta CF, Blundell A, Robinson T, Firman K, Dekker C (2004) Real-time observation of DNA translocation by the type I restrictionmodification enzyme EcoR124I. Nat Struct Mol Biol 11: 838–843
Sengoku T, Nureki O, Nakamura A, Kobayashi S, Yokoyama S(2006) Structural basis for RNA unwinding by the DEAD-boxprotein Drosophila Vasa. Cell 125: 287–300
Singleton MR, Dillingham MS, Wigley DB (2007) Structure andmechanism of helicases and nucleic acid translocases. Annu RevBiochem 76: 23–50
Soultanas P, Wigley DB (2001) Unwinding the ‘Gordian knot’ ofhelicase action. Trends Biochem Sci 26: 47–54
Stanley LK, Seidel R, van der Scheer C, Dekker NH, Szczelkun MD,Dekker C (2006) When a helicase is not a helicase:dsDNA tracking by the motor protein EcoR124I. EMBO J 25:2230–2239
Stanley LK, Szczelkun MD (2006) Direct and random routing of amolecular motor protein at a DNA junction. Nucleic Acids Res 34:4387–4394
Szczelkun MD (2002) Kinetic models of translocation, head-oncollision, and DNA cleavage by type I restriction endonucleases.Biochemistry 41: 2067–2074
Szczelkun MD, Dillingham MS, Janscak P, Firman K, Halford SE(1996) Repercussions of DNA tracking by the type IC restrictionendonuclease EcoR124I on linear, circular and catenated sub-strates. EMBO J 15: 6335–6347
Tomko EJ, Fischer CJ, Niedziela-Majka A, Lohman TM (2007) Anonuniform stepping mechanism for E. coli UvrD monomertranslocation along single-stranded DNA. Mol Cell 26: 335–347
van Noort J, van der Heijden T, Dutta CF, Firman K, Dekker C(2004) Initiation of translocation by Type I restriction-modifica-tion enzymes is associated with a short DNA extrusion. NucleicAcids Res 32: 6540–6547
Vipond IB, Baldwin GS, Oram M, Erskine SG, Wentzell LM,Szczelkun MD, Nobbs TJ, Halford SE (1995) A general assayfor restriction endonucleases and other DNA-modifying enzymeswith plasmid substrates. Mol Biotechnol 4: 259–268
Webb MR (2003) A fluorescent sensor to assay inorganic phosphate.In Kinetic Analysis: A practical Approach, Johnson KA (ed), pp131–152. Oxford, UK: Oxford University Press
Webb MR (2007) Development of fluorescent biosensors for probingthe function of motor proteins. Mol Biosyst 3: 249–256
Zhang Y, Smith CL, Saha A, Grill SW, Mihardja S, Smith SB, CairnsBR, Peterson CL, Bustamante C (2006) DNA translocation andloop formation mechanism of chromatin remodeling by SWI/SNFand RSC. Mol Cell 24: 559–568
Zinkevich V, Popova L, Kryukov V, Abadjieva A, Bogdarina I,Janscak P, Firman K (1997) The HsdR subunit of R.EcoR124II:cloning and over-expression of the gene and unexpected proper-ties of the subunit. Nucleic Acids Res 25: 503–511
The EMBO Journal is published by NaturePublishing Group on behalf of European
Molecular Biology Organization. This article is licensedunder a Creative Commons Attribution License <http://creativecommons.org/licenses/by/2.5/>
Step size of the dsDNA translocase EcoR124IR Seidel et al
The EMBO Journal VOL 27 | NO 9 | 2008 &2008 European Molecular Biology Organization1398
Copyright © 2022 FDOKUMEN