VPA response in SMA is suppressed by the fatty acid translocase CD36
30
1 © The Author 2012. Published by Oxford University Press. All rights reserved. For Permissions, please email: [email protected] VPA response in SMA is suppressed by the fatty acid translocase CD36 Lutz Garbes 1 , Ludwig Heesen 1,5 , Irmgard Hölker 1 , Tim Bauer 2 , Julia Schreml 1 , Katharina Zimmermann 1 , Michaela Thoenes 1 , Michael Walter 3 , John Dimos 4 , Michael Peitz 5 , Oliver Brüstle 5 , Raoul Heller 1 and Brunhilde Wirth 1,* 1 Institute of Human Genetics, Institute of Genetics and Center for Molecular Medicine Cologne, University of Cologne, Cologne, Germany 2 Institute of Pharmacology, University of Cologne, Cologne, Germany 3 The Microarray Facility, University of Tübingen, Tübingen, Germany 4 iPierian Inc., 951 Gateway Blvd, South San Francisco, CA 94080 USA 5 Institute of Reconstructive Neurobiology, LIFE & BRAIN Center, University of Bonn and Hertie Foundation, Bonn, Germany * Corresponding author: Prof. Dr. Brunhilde Wirth, Institute of Human Genetics, University of Cologne, Kerpener Str. 34, 50931 Cologne, Germany, Phone: +49-(0)221-478-86464, Fax: +49-(0)221-478-86465, e-mail: [email protected], www.humangenetik.uni- koeln.de HMG Advance Access published October 16, 2012 by guest on June 4, 2016 http://hmg.oxfordjournals.org/ Downloaded from
-
Upload
independent -
Category
Documents
-
view
0 -
download
0
Transcript of VPA response in SMA is suppressed by the fatty acid translocase CD36

1
© The Author 2012. Published by Oxford University Press. All rights reserved. For Permissions, please email: [email protected]
VPA response in SMA is suppressed by the fatty acid translocase CD36
Lutz Garbes1, Ludwig Heesen1,5, Irmgard Hölker1, Tim Bauer2, Julia Schreml1,
Katharina Zimmermann1, Michaela Thoenes1, Michael Walter3, John Dimos4, Michael
Peitz5, Oliver Brüstle5, Raoul Heller1 and Brunhilde Wirth1,*
1Institute of Human Genetics, Institute of Genetics and Center for Molecular Medicine
Cologne, University of Cologne, Cologne, Germany
2Institute of Pharmacology, University of Cologne, Cologne, Germany
3The Microarray Facility, University of Tübingen, Tübingen, Germany
4iPierian Inc., 951 Gateway Blvd, South San Francisco, CA 94080 USA
5Institute of Reconstructive Neurobiology, LIFE & BRAIN Center, University of Bonn and
Hertie Foundation, Bonn, Germany
*Corresponding author: Prof. Dr. Brunhilde Wirth, Institute of Human Genetics, University of Cologne, Kerpener Str. 34, 50931 Cologne, Germany, Phone: +49-(0)221-478-86464, Fax: +49-(0)221-478-86465, e-mail: [email protected], www.humangenetik.uni-koeln.de
HMG Advance Access published October 16, 2012 by guest on June 4, 2016
http://hmg.oxfordjournals.org/
Dow
nloaded from

2
Abstract:
Functional loss of SMN1 causes proximal spinal muscular atrophy (SMA), the most common
genetic condition accounting for infant lethality. Hence, the hypomorphic copy gene SMN2 is
the only resource of functional SMN protein in SMA patients and influences SMA severity in
a dose-dependent manner. Consequently, current therapeutic approaches focus on SMN2.
Histone deacetylase inhibitors (HDACi), such as the short chain fatty acid VPA (valproic
acid), ameliorate the SMA phenotype by activating the SMN2 expression.
By analyzing blood SMN2 expression in 16 VPA-treated SMA patients, about one third of
individuals were identified as Positive Responders presenting increased SMN2 transcript
levels. In 66% of enrolled patients, a concordant response was detected in the respective
fibroblasts. Most importantly, by taking the detour of reprogramming SMA patients’
fibroblasts, we showed that VPA response was maintained even GABAergic neurons derived
from iPS cells.
Differential expression micro-array analysis revealed a complete lack of response to VPA in
Non-Responders, which was associated with an increased expression of the fatty acid
translocase CD36. The pivotal role of CD36 as the cause of non-responsiveness was proven in
various in vitro approaches. Most importantly, knockdown of CD36 in SMA fibroblasts
converted Non- into Pos-Responders. In summary, the concordant response from blood to the
CNS to VPA may allow selection of Pos-Responders prior to therapy. Increased CD36
expression accounts for VPA non-responsiveness. These findings may be essential not only
for SMA but also for other diseases such as epilepsy or migraine frequently treated with VPA.
by guest on June 4, 2016http://hm
g.oxfordjournals.org/D
ownloaded from

3
INTRODUCTION
The group of proximal spinal muscular atrophies – combined as SMA - represents one of the
most prevalent autosomal recessive disorders in humans. Onset and severity of the disease
vary remarkably between patients and represent a continuous phenotypic spectrum. Based on
the highest individually achieved motor function (1), the SMA phenotype has been subdivided
into three different types termed SMA type I (severest form) to III (juvenile form). The
characteristic feature common to all types of proximal SMA is a progressive degeneration of
-motor neurons in the anterior horns of the spinal cord. Estimated incidence is 1 in 6,000
live births while the carrier frequency varies between 1:25 and 1:105 (2, 3). In more than 96%
of all SMA patients the SMN1 gene (survival motor neuron 1, OMIM 600354) - encoding the
essential SMN protein - is homozygously deleted. In the remainder of the patients, SMN1
mutations hamper proper SMN function (4, 5). As a result of a primate exclusive duplication
of the genomic region harbouring SMN1, a variable number of copy genes, termed SMN2, are
present in the human genome (6, 7). Yet, due to a synonymous variation in exon 7 altering
splicing, each SMN2 copy produces merely 10% functional full-length protein (8). Although
not capable of compensating for the loss of the SMN1 gene, SMN2 is the only resource of
SMN protein in SMA patients. As such, it influences SMA disease severity in a dose-
dependent manner. While e.g. most severely affected type I patients usually carry two SMN2
copies, three copies are most often found in patients with intermediate SMA (type II) and four
copies in mild SMA (type III) (2).
To date, there is no cure available for SMA. However, among the prospective therapeutics for
SMA, the histone deacetylase inhibitor (HDACi) valproic acid (VPA) advanced the most and
entered phase II clinical trials (9-17). Mechanistically, VPA activates SMN2 by promoter
hyperacetylation and thereby increases the SMN amount generated from each SMN2 locus.
Several clinical trials already investigated the potential of VPA as a SMA therapeutic (11-14,
18). However, the results were inconsistent. In the initial pilot study using blood SMN
by guest on June 4, 2016http://hm
g.oxfordjournals.org/D
ownloaded from

4
transcripts as the only readout, a positive effect was noted in 1/3 of patients (9). Subsequent
open label clinical trials with type II and III/IV SMA patients assessing their motor abilities
demonstrated significant improvements, particularly in the younger type II patients (<5 years)
(11, 14, 18). The motor improvements in young SMA patients were confirmed in a double-
blind, randomized, placebo-controlled clinical trial in type II and III SMA patients, however,
no significant effect was found in the group of older individuals (12, 13).
In summary, the accomplished clinical trials demonstrated that VPA is only beneficial to a
restricted subset of SMA patients: These individuals show indeed the desired SMN2 activation
in blood while others do not or even exhibit the opposite (9, 16). The underlying factors
influencing the individual response were unknown. Several important questions arose from
these observations. First, is it feasible to extrapolate from circulating blood monocyte SMN2
transcripts to a second, easily available specimen such as skin? Second, is such extrapolation
even valid to the central nervous system? And, most importantly, what is the pivotal factor
influencing VPA response?
RESULTS About one third of SMA Patients are VPA Pos-Responders
In an initial clinical trial with VPA in 20 SMA patients using circulating blood monocyte
SMN2 transcripts as readout, we have been able to show that about one third of the patients
are Pos-Responders (FL-SMN2 ↑), while in the remainder of patients FL-SMN2 levels
remained constant or even declined (Non-Responders) (9). To prove that this is indeed a
reproducible observation and not a random finding, we analyzed another 16 SMA patients
currently undergoing experimental VPA therapy. Again, circulating SMN2 transcripts were
quantified to assess VPA response. We identified five Pos-Responders and eleven Non-
Responders (Table S1). Of note, for three of the Pos-Responders attenuation in the VPA
response was observed, i.e. SMN2 levels returned to baseline during the course of time. In
by guest on June 4, 2016http://hm
g.oxfordjournals.org/D
ownloaded from

5
summary, these results are comparable to those of our previous study (9) and confirmed that
about one third of patients are VPA Pos-Responders.
Response to VPA treatment is concordant across blood, fibroblasts and GABAergic neurons
Although the finding that about 1/3 of SMA patients are Pos-Responders was verified, it
remained disputable whether blood data allow inference of VPA response in other tissues.
Therefore, primary fibroblast lines were established from skin biopsies of 15 VPA-treated
SMA patients. Triplicates of each culture were treated with VPA and SMN levels assessed by
semi-quantitative western blotting. Initially, some of the fibroblast lines were treated with
VPA doses between 5 and 500 µM as published previously (10). However, during the course
of the experiments, VPA concentrations were adapted since higher concentrations provided
more robust results (Table S2).
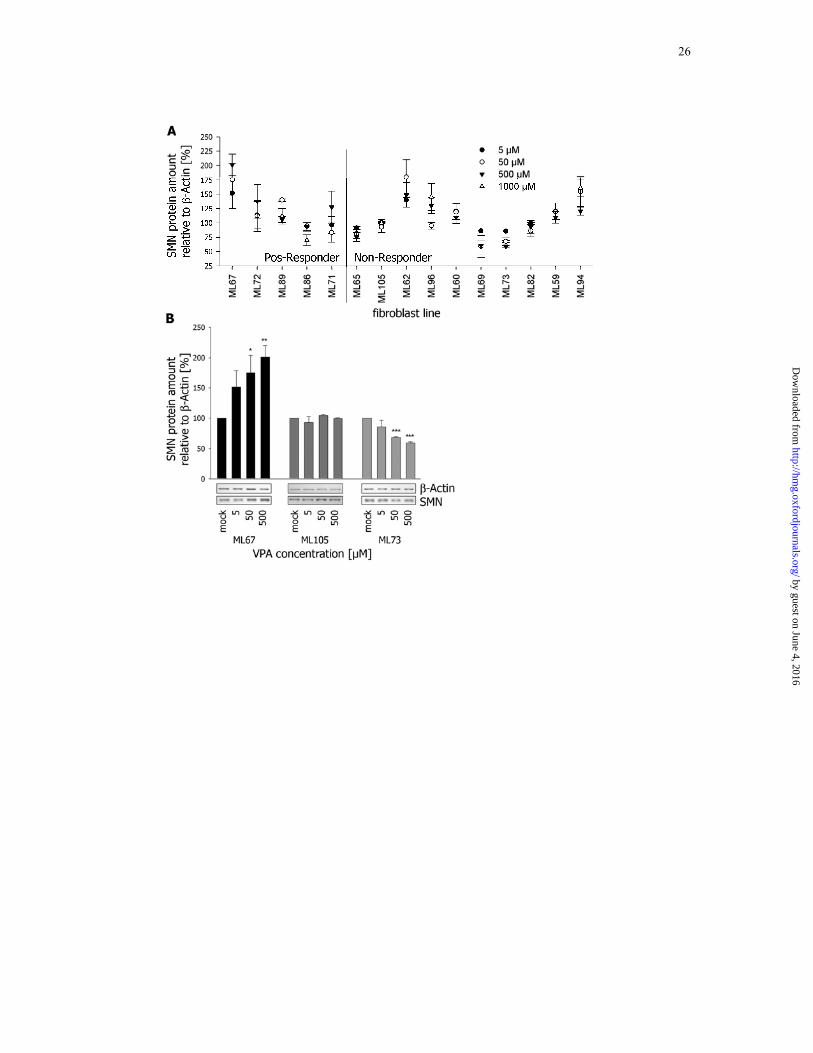
A concordant response between blood and fibroblasts was recorded in about 66% across all
analyzed cell lines (Figure 1 and Table S2). Within the group of concordant Pos-Responder
fibroblast lines (ML67, ML72 and ML89), SMN levels were increased by 30 to 120% on
average. As expected, no notable change in SMN expression was detected for six and
decreased levels for two Non-Responders. Of note, increased SMN2 expression was recorded
unexpectedly for three Non-Responders (ML62, ML96 and ML94). All discordant fibroblast
lines were excluded from subsequent experiments.
While the fibroblast data indicated a mostly concordant response, it remained elusive whether
this allows inference to the CNS. Since it is not feasible to sample neurons from SMA
patients, we took the detour of generating iPSCs (induced pluripotent stem cells) from SMA
fibroblast and differentiating them into neurons. Using the classical four-factor approach (19),
iPSCs were generated from a Pos-Responder (HGK1, ML17) and a Non-Responder (HGK4,
ML73) fibroblast cell line. Following extensive validation and characterization regarding their
pluripotency (Figure S1 to S4), these iPSCs were differentiated into GABAergic neurons
by guest on June 4, 2016http://hm
g.oxfordjournals.org/D
ownloaded from

6
(Figure 2A and 2B) via the intermediate step of long-term self-renewing rosette-type
neuroepithelial stem cells (lt-NES) (20). GABAergic neurons were selected for two reasons:
First, they are the primarily affected population of neurons in epilepsy patients, who represent
the majority of VPA-treated individuals world-wide. Second, differentiation into motor
neurons would be desirable, but the efficiency of this process is too low to allow proper
assessment of VPA response. qRT-PCR analysis revealed increased SMN2 expression in Pos-
Responder HGK1 (ML17) under VPA treatment but showed no change in Non-Responder
HGK4 (ML73) neurons (Figure 2C). Since GABA release is typically stimulated by VPA
application (21), we also quantified GABA levels in the cell culture supernatant of these
cultures. Accordingly, a nearly 2.5-fold increase in GABA release upon VPA application was
recorded for the Pos-Responder HGK1. Moreover, the opposite was found for the Non-
Responder HGK4 (Figure 2D).
Taken together, these data strongly suggest that response to VPA treatment is concordant
among blood, fibroblasts and CNS neurons.
VPA does not trigger any response in Non-Responders
Next, we focused on understanding which factor prevents a positive treatment outcome.
Therefore, all ten concordant fibroblast lines were analyzed in more detail. To increase the
power of our subsequent analysis, we included the well-characterized Pos-Responder
fibroblast lines ML5, ML16 and ML17 (10, 22, 23). Unfortunately, no blood data from the
respective donors was available.
Initially, we tested the effect of VPA on SMN2 promoter hyperacetylation in Pos- and Non-
Responders by ChIP analysis. As expected, acetylation was increased by 20 to 100% in Pos-
Responders, whereas no change or even decreased levels were detected in Non-Responder
fibroblast lines (Figure 3A). This lack of promoter induction offers a good explanation why
SMN protein is not increased by VPA treatment. To test whether this is a VPA-specific
by guest on June 4, 2016http://hm
g.oxfordjournals.org/D
ownloaded from

7
observation, SMA fibroblasts were treated with other HDACi known to activate SMN2 gene
expression. Similar to VPA, sodium butyrate, another short-chain fatty acid HDACi, did not
trigger any response in Non-Responders, while LBH589 (hydroxamic acid) and phenyl
butyrate (aromatic acid) increased SMN levels expectedly (Figure 3B). This suggested that
the effect of VPA is not specifically suppressed but rather prohibited by a more general
mechanism. To determine whether this is occurring on the level of HDACs, PKA activity as a
HDAC-independent read-out of VPA treatment was assessed (24). Within the group of Pos-
Responders, PKA activity was VPA-dose dependently reduced to approximately 50% (Figure
3C). In contrast, no such effect was observed in the Non-Responders. These data together
with the aforementioned ChIP assays confirmed that in Non-Responders the effect of VPA is
not HDAC specifically suppressed, but rather on a more general level.
Transcriptome profiling identifies CD36 as a candidate for VPA non-responsiveness
To identify the pivotal factor(s) preventing a positive response to VPA treatment, we
performed transcriptome-wide differential expression analysis of mock and VPA-treated
SMA fibroblasts. Applying initially relatively loose criteria (Figure S5), we reduced the
number of potential candidates by increasing the stringency of the analysis: First, Benjamini-
Hochberg correction for multiple testing was applied. Second, all transcripts not showing at
least a 1.0 log2FC expression difference were excluded. Applying these criteria, no single
transcript was differentially expressed upon VPA treatment in Non-Responders whereas in the
Pos-Responders only ANKRD1 met these requirements (Figure 4A). Interestingly, eight genes
were detected as significantly differentially expressed between mock-treated Pos- and Non-
Responders, presumably representing an initial set of genes regulating the response to VPA
(Figure 4A and Table S3).
Based on extensive data mining of public databases, the focus was laid on CD36 in the
subsequent experiments (Table 1). In the context that short-chain fatty acid HDACi failed to
by guest on June 4, 2016http://hm
g.oxfordjournals.org/D
ownloaded from

8
trigger any response in Non-Responders, the involvement of CD36 – a fatty acid translocase
(25) - was striking. CD36 was expressed in Non-Responders at 5-fold higher RNA levels
(Figure 4B), while differences on protein level were less pronounced than expected (Figure
4C). Since CD36 undergoes post-translational modifications (26), certain portions of CD36
protein might not have been properly detected.
CD36 suppresses VPA response
Initially, we tested whether CD36 is capable to suppress the response to VPA. For this
purpose, CD36- or GFP-transfected HEK293 cells were treated with VPA. Semiquantitative
western blotting demonstrated that CD36 indeed prevented SMN induction by VPA
application (Figure 5A). While in GFP-transfected cells SMN was increased 1.4-fold, no
change in SMN protein levels was recorded for the CD36-transfected cells (Figure 5B). In
line with this, also the effect of VPA on SMN2 promoter acetylation was strikingly reduced in
CD36-transfected HEK293 cells (Figure 5C). This clearly demonstrated that CD36
overexpression suppresses the HDAC inhibiting effect of VPA. Based on the function of
CD36 as a fatty acid translocase (25, 27, 28), an altered transport of VPA across the plasma
membrane in fibroblasts is suggestive. However, no direct effect of CD36 on either VPA
import or export could be detected (Figure S6).
Finally, as a reciprocal experiment to the CD36 overexpression, we also performed a
knockdown of CD36 in Non-Responder fibroblasts to test whether this overcomes VPA non-
responsiveness. While in fibroblasts transfected with a control siRNA, VPA treatment did not
affect SMN2 expression, SMN levels were increased by 20-50% when VPA treatment was
combined with a knockdown of CD36 (Figure 5D & E).
In summary, these data prove that CD36 is indeed one of the determinants of VPA non-
responsiveness and might become a valuable target to turn Non- into Pos-Responders.
by guest on June 4, 2016http://hm
g.oxfordjournals.org/D
ownloaded from

9
DISCUSSION
Proper drug evaluation for human diseases is labour intensive, but without doubt the most
critical part in the introduction of experimental drugs to routine clinics. In contrast to other
drugs currently evaluated for the use in SMA, VPA has already passed all requirements for
application in humans, since it has long been a recognized therapy of epilepsy (29).
Nevertheless, the efficacy of VPA for the treatment of SMA still has to be conclusively
shown (9, 11, 12).
In contrast to other diseases for which VPA is indicated, its impact in SMA could possibly be
monitored by measuring SMN2 transcripts and protein. Indeed, debate is ongoing on whether
circulating blood cell SMN2 mRNA is an appropriate surrogate marker for the therapeutic
success of SMA drugs (9, 11, 30-32). Histological parameters such as neuromuscular junction
maturation or motor neuron degeneration may be appropriate in animal models (33, 34), but
are not feasible in humans. Motor function tests in SMA patients can be a powerful tool to
assess disease progression, but are complex and strongly dependent on the stage of disease
progression (35). Applying SMN2 transcripts as a surrogate marker, roughly one third of
enrolled patients exhibited a positive response while the remainder either showed no or a
negative response to VPA. Although such an observation is not uncommon in pharmacology
(and sometimes referred to as the “rule of thirds”), only little attention has been paid to the
molecular basis of drug non-responsiveness in the field of SMA (11, 17, 18). However, with a
growing list of potential SMA candidate drugs, biomarkers are of utmost importance to
predict treatment outcome and to allow stratification of patients in clinical trials.
Drug response often differs among tissues (36). Therefore, it was essential to verify that the
employed fibroblasts are indeed an accurate surrogate to anticipate CNS response. During the
past years, iPS cells generated from fibroblasts have emerged as a versatile source of diverse
cell types – among them CNS neurons (37, 38). Although the introduction of viral transgenes
is still considered problematic, extensive validation pipelines, as they were applied in this
by guest on June 4, 2016http://hm
g.oxfordjournals.org/D
ownloaded from

10
study, mostly exclude the occurrence of artefacts (39). We conclusively demonstrate that
response to VPA is concordant among peripheral blood cells, fibroblasts and the CNS
neurons. Although only two iPSC clones were incorporated in this study, this finding is
crucial for SMA drug research, since it suggests that fibroblasts are an appropriate specimen
for drug evaluation. Moreover, treatment of fibroblasts with VPA may help identifying Pos-
Responders prior to therapy, which might be considered in terms of outcome and costs for
future clinical trials.
Using differential transcriptome microarray analysis, CD36 was identified as the crucial
factor controlling VPA response in SMA fibroblasts. Within this analysis, Non-Responders
completely lacked response to VPA, while in Pos-Responders – like in studies with other
HDACi (40) - a reasonable number of transcripts was identified.
CD36 is involved in diverse cellular processes (41, 42), among these transport of fatty acids
across the plasma membrane (25, 27). Although suggestive, we could not find any hint that
the suppression of VPA response by CD36 is a matter of VPA transport. Nevertheless, since
VPA Non-Responders also failed to respond to sodium butyrate while other HDACi took full
effect, supposable a yet unidentified downstream factor is triggered by increased CD36 levels.
One consequence of such a factor could, among others, be an altered fatty acid metabolism.
Since the knockdown of CD36 effectively overcame VPA non-responsiveness, the relation
between this putative factor and CD36 must be quite tight.
In summary, we aimed to discover the underlying cause of VPA non-responsiveness and by
this an appropriate biomarker to identify those patients who will benefit the most from VPA
treatment. Our data suggest that CD36 may be such a biomarker for VPA response.
Furthermore, targeting CD36 may help to overcome VPA non-responsiveness – not only in
SMA but also in e.g. epilepsy patients, which are the majority of patients treated with VPA.
by guest on June 4, 2016http://hm
g.oxfordjournals.org/D
ownloaded from

11
MATERIALS AND METHODS
Treatment of SMA patients with VPA and patients sampling
Detailed procedures are given in the supplementary material. In brief, two blood samples were
taken to establish baseline SMN2 expression, while another two to five samples were taken
under VPA treatment. Following RNA extraction, SMN2 expression was analyzed by qRT-
PCR as described previously (9). Fibroblast lines were established from SMA patients’ skin
biopsies. This study has been approved by the ethical committee of the University Hospital of
Cologne.
Fibroblast and HEK293 cell culture
Primary human fibroblast lines and HEK293 cells were cultured under standard conditions.
For drug treatment, cells, seeded out the previous day (2x10⁵ cells/10 cm dish or 1x10⁵
cells/6-well plate), were treated with the indicated compound under previously described
conditions (10, 22, 43). VPA and sodium butyrate (both Sigma) were dissolved in ddH2O,
phenyl butyrate (Sigma), LBH589 (Novartis) in DMSO.
iPSC generation and expansion
Using retroviruses harbouring the four Yamanaka-factors SOX2, OCT4, KLF4, and c-MYC
(44), iPierian (South San Francisco, CA, USA) generated the iPSC (induced pluripotent stem
cells) lines HGK1 from the VPA Pos-Responder (ML17) and HGK4 from a Non-Responder
(ML73). Stable iPSC lines were cultured on irradiated murine embryonic fibroblasts (MEFs)
in Knockdown-DMEM containing 20% KnockOut Serum Replacement, 1% non-essential
amino acids, 1 mM L-glutamine, 0.1 mM β-mercaptoethanol and 6-10 ng/ml basic fibroblast
growth factor (all from Life Technologies). Regular passaging was performed by lifting iPSC
colonies with collagenase (Life Technologies) and careful titration in a 1:3 or 1:4 ratio every
3-4 days. A human embryonic stem cell (ESC)-derived cell line (a kind gift of L. Studer),
by guest on June 4, 2016http://hm
g.oxfordjournals.org/D
ownloaded from

12
termed Ctrl ESC, containing a bacterial artificial chromosome (BAC) expressing GFP under
the control of the mouse Hb9 promoter was used as a control in all experiments (45)
Generation of lt-NES
Long-term, self-renewing neuroepithelial stem cells (lt-NES) were generated as described
(20). In brief, iPSCs colonies were detached by collagenase treatment and transferred to
non-adhesive Petri dishes for EB formation in DMEM/F12 containing 10% KnockOut Serum
Replacement, 1% non-essential amino acids, 1 mM L-glutamine, 1% pyruvate and 0.1 mM
β-mercaptoethanol. Medium was changed every other day, and at day 6 EBs were plated on
poly-L-ornithine/laminin (both Sigma) coated tissue culture plates. Emergence of rosette-like
neural structures was observed during the next days. Neural rosettes were carefully picked
and cultured in suspension for two further days in DMEM/F12, 2 mM L-glutamine, 1.6 g/l
glucose, 0.1mg/ml penicillin/streptomycin and N2 supplement (1:100; Life Technologies).
Finally, neural spheres were dissociated by trypsin and single cells seeded out on poly-L-
ornithine/laminin coated dishes. lt-NES were expanded in N2 medium supplemented with
B27 (1 µl/ml, Life Technologies), 10 ng/ml FGF2 and 10 ng/ml EGF (both from R&D
systems). Cells were split at a ratio of 1:2-1:3 every 2-3 days by trypsin treatment.
Neuronal differentiation of lt-NES
Differentiation was induced by withdrawal of the growth factors FGF2 and EGF and further
propagation in Neurobasal medium supplemented with B27 (1:50, Life Technologies) and
DMEM/F12 supplemented with N2 (1:100) mixed at a 1:1 ratio. 300 ng/ml cAMP was added
to the differentiation media (20).
by guest on June 4, 2016http://hm
g.oxfordjournals.org/D
ownloaded from

13
Immunocytochemistry in iPCSs
Cells were fixed with 4% PFA in 1xPBS for 10 min at room temperature and blocked in 10%
FCS (Life Technologies) in HBSS. Pluripotency-associated surface markers TRA-1-60,
TRA-1-81, SSEA-3 were detected by incubating samples with primary antibodies overnight at
4 °C. After washing three times with HBSS, samples were treated with secondary antibodies
for 1 h at room temperature, stained with DAPI and mounted with Mowiol 4-88 mounting
solution (Carl Roth). For every other antibody, blocking solution was additionally
supplemented with 0.1% Triton X-100 (Sigma).
The following primary antibodies were employed: TRA-1-60 (1:500, Life Technologies),
TRA-1-81 (1:500, Life Technologies), SSEA3 (1:80, gift from P. Andrews; ESTOOLS
consortium), SOX2 (1:500, R&D Systems), PLZF (1:50, Calbiochem), ZO-1 (1:100, Zymed),
βIII-tubulin (1:1,000, Covance), GAD65/67 (1:1,000, Chemicon), nestin (1:200, Millipore),
AFP (1:100, Dako), SMA (1:100, Dako). Secondary antibodies were Alexa488 anti-ms,
Alexa555 anti-ms, Alexa488 anti-rb, Alexa555 anti-rb (all 1:1,000, Life Technologies), Cy3
anti-rat (1:300, Jackson/Dianova). Images were acquired with an AxioCam MRn and
processed using the Axiovision Software (Zeiss).
Spontaneous differentiation of iPSCs
Undirected in vitro differentiation of mesoderm and endoderm occurred by transferring
detached iPSC colonies to non-adhesive Petri dishes in Knockdown-DMEM containing 20%
KnockOut Serum Replacement, 1% non-essential amino acids and 1 mM L-glutamine to
induce embryoid body (EB) formation. After one week, EBs were plated on gelatine-coated
dishes for further differentiation in DMEM containing 10% FCS, 1% pyruvate and 1% non-
essential amino acids.
by guest on June 4, 2016http://hm
g.oxfordjournals.org/D
ownloaded from

14
GABA-ELISA
Following GABAergic neuronal differentiation, neurons were treated daily with 500 µM VPA
from day 17 onwards. Before VPA treatment and on day 25 cell culture supernatant was
collected and analyzed for GABA release. Concentration of GABA was determined by an
ELISA (Abnova) according to manufacturer’s instructions.
Chromatin immunoprecipitation (ChIP)
To determine SMN2 promoter acetylation, chromatin was isolated, precipitated and purified
using the LowCell chip Kit together with anti-acetyl H3K9 antibodies following the
manufacturer’s instructions (Diagenode). Subsequent qRT-PCR of the SMN2 promoter region
was performed on an ABI 7500 machine (Life Technologies) (22).
Determination of cAMP-dependent protein kinase (PKA) assay
Quantification of in vitro PKA activity was performed using the PepTag-Assay for non-
radioactive detection of PKA (Promega) according to the manufacturer’s instructions.
Phosphorylated and non-phosphorylated dyes were separated by agarose gel electrophoresis
and dye intensity was determined using a microplate reader (Tecan).
Whole transcriptome analysis and quantitative realtime RT-PCR (qRT-PCR)
For expression analysis, total RNA from cells was isolated employing the RNeasy Mini Kit
plus the RNase-free DNase I set and reversely transcribed using the QuantiTect Reverse
transcription kit (all Qiagen). HuGene1.0 ST v1 Gene Chips (Affymetrix) were used as
outlined in the supplementary methods for the identification of expression differences
between Pos- and Non-Responders. Except for SMN2 transcripts (delineated in (9)), all qRT-
by guest on June 4, 2016http://hm
g.oxfordjournals.org/D
ownloaded from

15
PCRs were performed on an ABI 7500 machine using the Power SYBR green master mix
(both Life Technologies). Respective primers and conditions are given in Table S4.
Western blot analysis
Whole cell lysates (WCL) from cells were prepared with RIPA buffer (Sigma-Aldrich). SDS-
PAGE (Tris/HCl) and subsequent wet blot were performed following standard protocols. For
CD36, WCLs from fibroblasts were prepared with NP40-buffer and deglycosylated overnight
with PNGase F (NEB) according to the manufacturer’s instructions. The following primary
antibodies were used: mouse mAb anti-β-actin (1:20,000, Sigma-Aldrich), mouse mAb anti-
SMN (1:2,000, BD Transduction laboratories), mouse mAb anti-CD36 (1:300, Santa Cruz).
Transfection experiments
CD36 cDNA (corresponding to NM_001001547) was amplified from fibroblast RNA and
cloned into the pcDNA3.1/V5-His TOPO vector (Life Technologies). Correct sequence was
verified by Sanger sequencing. Transfection into HEK293 cells was carried out using
Lipofectamin 2000 (Life Technologies). For stable overexpression, transfected HEK293 cells
were selected for four weeks with G-418 (Life Technologies). Primary human fibroblasts
were transfected with plasmid DNA using a Nucleofector (Program U-20) together with the
Basic Nucleofector Kit for Primary Mammalian Fibroblasts (both Lonza) according to the
manufacturer’s guidelines. CD36 knockdown was achieved using a commercially available
siRNA (Qiagen, r(GAA CCU AUU GAU GGA UUA ATT)dTdT)) together with
Dharmafect1 (Thermo Fisher) following standard protocols.
Statistical analysis
Excel 2003 (Microsoft) and Sigma Plot 9.0 (Systat Software) were used to perform statistical
analysis. Significant differences between data sets were identified using a two-sample two-
by guest on June 4, 2016http://hm
g.oxfordjournals.org/D
ownloaded from

16
tailed Student’s t test. Three levels of statistical significance were distinguished: * = P < 0.05;
** = P < 0.01; *** = P < 0.001.
Further materials and methods are given in the supplementary material.
by guest on June 4, 2016http://hm
g.oxfordjournals.org/D
ownloaded from

17
Acknowledgements:
We are grateful to SMA patients and clinicians for their help in this study. This work was
supported by grants to B.W. provided from the Deutsche Forschungsgemeinschaft [Wi-
945/12-3], the Center for Molecular Medicine Cologne [D5] and the Initiative “Forschung
und Therapie für SMA”. Furthermore, we would like to thank Karin Boss for critically
reading the manuscript.
Conflict of interest
John Dimos is a full-time employee of iPierian Inc., 951 Gateway Blvd, South San Francisco,
CA 94080 USA.
Lt-NES® is a registered trademark of LIFE & BRAIN GmbH.
by guest on June 4, 2016http://hm
g.oxfordjournals.org/D
ownloaded from

18
REFERENCES 1. Munsat, T. and Davies, K. (1996) Spinal muscular atrophy. 32nd ENMC International Workshop.
Naarden, The Netherlands, 10-12 March 1995. Neuromuscul Disord, 6, 125-7. 2. Feldkotter, M., Schwarzer, V., Wirth, R., Wienker, T.F. and Wirth, B. (2002) Quantitative analyses of
SMN1 and SMN2 based on real-time lightCycler PCR: fast and highly reliable carrier testing and prediction of severity of spinal muscular atrophy. Am J Hum Genet, 70, 358-68.
3. Hendrickson, B.C., Donohoe, C., Akmaev, V.R., Sugarman, E.A., Labrousse, P., Boguslavskiy, L., Flynn, K., Rohlfs, E.M., Walker, A., Allitto, B. et al. (2009) Differences in SMN1 allele frequencies among ethnic groups within North America. J Med Genet, 46, 641-4.
4. Lefebvre, S., Burglen, L., Reboullet, S., Clermont, O., Burlet, P., Viollet, L., Benichou, B., Cruaud, C., Millasseau, P., Zeviani, M. et al. (1995) Identification and characterization of a spinal muscular atrophy-determining gene. Cell, 80, 155-65.
5. Wirth, B. (2000) An update of the mutation spectrum of the survival motor neuron gene (SMN1) in autosomal recessive spinal muscular atrophy (SMA). Hum Mutat, 15, 228-37.
6. Chen, Q., Baird, S.D., Mahadevan, M., Besner-Johnston, A., Farahani, R., Xuan, J., Kang, X., Lefebvre, C., Ikeda, J.E., Korneluk, R.G. et al. (1998) Sequence of a 131-kb region of 5q13.1 containing the spinal muscular atrophy candidate genes SMN and NAIP. Genomics, 48, 121-7.
7. Lefebvre, S., Burlet, P., Liu, Q., Bertrandy, S., Clermont, O., Munnich, A., Dreyfuss, G. and Melki, J. (1997) Correlation between severity and SMN protein level in spinal muscular atrophy. Nat Genet, 16, 265-9.
8. Lorson, C.L., Hahnen, E., Androphy, E.J. and Wirth, B. (1999) A single nucleotide in the SMN gene regulates splicing and is responsible for spinal muscular atrophy. Proc Natl Acad Sci U S A, 96, 6307-11.
9. Brichta, L., Holker, I., Haug, K., Klockgether, T. and Wirth, B. (2006) In vivo activation of SMN in spinal muscular atrophy carriers and patients treated with valproate. Ann Neurol, 59, 970-5.
10. Brichta, L., Hofmann, Y., Hahnen, E., Siebzehnrubl, F.A., Raschke, H., Blumcke, I., Eyupoglu, I.Y. and Wirth, B. (2003) Valproic acid increases the SMN2 protein level: a well-known drug as a potential therapy for spinal muscular atrophy. Hum Mol Genet, 12, 2481-9.
11. Swoboda, K.J., Scott, C.B., Reyna, S.P., Prior, T.W., LaSalle, B., Sorenson, S.L., Wood, J., Acsadi, G., Crawford, T.O., Kissel, J.T. et al. (2009) Phase II open label study of valproic acid in spinal muscular atrophy. PLoS One, 4, e5268.
12. Kissel, J.T., Scott, C.B., Reyna, S.P., Crawford, T.O., Simard, L.R., Krosschell, K.J., Acsadi, G., Elsheik, B., Schroth, M.K., D'Anjou, G. et al. (2011) SMA CARNIVAL TRIAL PART II: a prospective, single-armed trial of L-carnitine and valproic acid in ambulatory children with spinal muscular atrophy. PLoS One, 6, e21296.
13. Swoboda, K.J., Scott, C.B., Crawford, T.O., Simard, L.R., Reyna, S.P., Krosschell, K.J., Acsadi, G., Elsheik, B., Schroth, M.K., D'Anjou, G. et al. (2010) SMA CARNI-VAL trial part I: double-blind, randomized, placebo-controlled trial of L-carnitine and valproic acid in spinal muscular atrophy. PLoS One, 5, e12140.
14. Darbar, I.A., Plaggert, P.G., Resende, M.B., Zanoteli, E. and Reed, U.C. (2011) Evaluation of muscle strength and motor abilities in children with type II and III spinal muscle atrophy treated with valproic acid. BMC Neurol, 11, 36.
15. Sumner, C.J., Huynh, T.N., Markowitz, J.A., Perhac, J.S., Hill, B., Coovert, D.D., Schussler, K., Chen, X., Jarecki, J., Burghes, A.H. et al. (2003) Valproic acid increases SMN levels in spinal muscular atrophy patient cells. Ann Neurol, 54, 647-54.
16. Piepers, S., Cobben, J.M., Sodaar, P., Jansen, M.D., Wadman, R.I., Meester-Delver, A., Poll-The, B.T., Lemmink, H.H., Wokke, J.H., van der Pol, W.L. et al. (2011) Quantification of SMN protein in leucocytes from spinal muscular atrophy patients: effects of treatment with valproic acid. J Neurol Neurosurg Psychiatry, 82, 850-2.
17. Swoboda, K.J., Scott, C.B., Crawford, T.O., Simard, L.R., Reyna, S.P., Krosschell, K.J., Acsadi, G., Elsheik, B., Schroth, M.K., D'Anjou, G. et al. (2011) SMA CARNI-VAL trial part I: double-blind, randomized, placebo-controlled trial of L-carnitine and valproic acid in spinal muscular atrophy. PLoS One, 5, e12140.
18. Weihl, C.C., Connolly, A.M. and Pestronk, A. (2006) Valproate may improve strength and function in patients with type III/IV spinal muscle atrophy. Neurology, 67, 500-1.
19. Takahashi, K., Okita, K., Nakagawa, M. and Yamanaka, S. (2007) Induction of pluripotent stem cells from fibroblast cultures. Nat Protoc, 2, 3081-9.
20. Koch, P., Opitz, T., Steinbeck, J.A., Ladewig, J. and Brustle, O. (2009) A rosette-type, self-renewing human ES cell-derived neural stem cell with potential for in vitro instruction and synaptic integration. Proc Natl Acad Sci U S A, 106, 3225-30.
by guest on June 4, 2016http://hm
g.oxfordjournals.org/D
ownloaded from

19
21. Johannessen, C.U. (2000) Mechanisms of action of valproate: a commentatory. Neurochem Int, 37, 103-10.
22. Garbes, L., Riessland, M., Holker, I., Heller, R., Hauke, J., Trankle, C., Coras, R., Blumcke, I., Hahnen, E. and Wirth, B. (2009) LBH589 induces up to 10-fold SMN protein levels by several independent mechanisms and is effective even in cells from SMA patients non-responsive to valproate. Hum Mol Genet, 18, 3645-58.
23. Riessland, M., Brichta, L., Hahnen, E. and Wirth, B. (2006) The benzamide M344, a novel histone deacetylase inhibitor, significantly increases SMN2 RNA/protein levels in spinal muscular atrophy cells. Hum Genet, 120, 101-10.
24. Boeckeler, K., Adley, K., Xu, X., Jenkins, A., Jin, T. and Williams, R.S. (2006) The neuroprotective agent, valproic acid, regulates the mitogen-activated protein kinase pathway through modulation of protein kinase A signalling in Dictyostelium discoideum. Eur J Cell Biol, 85, 1047-57.
25. Coburn, C.T., Knapp, F.F., Jr., Febbraio, M., Beets, A.L., Silverstein, R.L. and Abumrad, N.A. (2000) Defective uptake and utilization of long chain fatty acids in muscle and adipose tissues of CD36 knockout mice. J Biol Chem, 275, 32523-9.
26. Hoosdally, S.J., Andress, E.J., Wooding, C., Martin, C.A. and Linton, K.J. (2009) The Human Scavenger Receptor CD36: glycosylation status and its role in trafficking and function. J Biol Chem, 284, 16277-88.
27. Abumrad, N.A., el-Maghrabi, M.R., Amri, E.Z., Lopez, E. and Grimaldi, P.A. (1993) Cloning of a rat adipocyte membrane protein implicated in binding or transport of long-chain fatty acids that is induced during preadipocyte differentiation. Homology with human CD36. J Biol Chem, 268, 17665-8.
28. Endemann, G., Stanton, L.W., Madden, K.S., Bryant, C.M., White, R.T. and Protter, A.A. (1993) CD36 is a receptor for oxidized low density lipoprotein. J Biol Chem, 268, 11811-6.
29. Meunier, H., Carraz, G., Neunier, Y., Eymard, P. and Aimard, M. (1963) [Pharmacodynamic properties of N-dipropylacetic acid]. Therapie, 18, 435-8.
30. Tsai, L.K., Yang, C.C., Hwu, W.L. and Li, H. (2007) Valproic acid treatment in six patients with spinal muscular atrophy. Eur J Neurol, 14, e8-9.
31. Wadman, R.I., Bosboom, W.M., van den Berg, L.H., Wokke, J.H., Iannaccone, S.T. and Vrancken, A.F. (2010) Drug treatment for spinal muscular atrophy types II and III. Cochrane Database Syst Rev, CD006282.
32. Sumner, C.J., Kolb, S.J., Harmison, G.G., Jeffries, N.O., Schadt, K., Finkel, R.S., Dreyfuss, G. and Fischbeck, K.H. (2006) SMN mRNA and protein levels in peripheral blood. Biomarkers for SMA clinical trials. Neurology.
33. Riessland, M., Ackermann, B., Forster, A., Jakubik, M., Hauke, J., Garbes, L., Fritzsche, I., Mende, Y., Blumcke, I., Hahnen, E. et al. (2010) SAHA ameliorates the SMA phenotype in two mouse models for spinal muscular atrophy. Hum Mol Genet, 19, 1492-506.
34. Mattis, V.B., Ebert, A.D., Fosso, M.Y., Chang, C.W. and Lorson, C.L. (2009) Delivery of a read-through inducing compound, TC007, lessens the severity of a spinal muscular atrophy animal model. Hum Mol Genet, 18, 3906-13.
35. Krosschell, K.J., Maczulski, J.A., Crawford, T.O., Scott, C. and Swoboda, K.J. (2006) A modified Hammersmith functional motor scale for use in multi-center research on spinal muscular atrophy. Neuromuscul Disord, 16, 417-26.
36. Also-Rallo, E., Alias, L., Martinez-Hernandez, R., Caselles, L., Barcelo, M.J., Baiget, M., Bernal, S. and Tizzano, E.F. (2011) Treatment of spinal muscular atrophy cells with drugs that upregulate SMN expression reveals inter- and intra-patient variability. Eur J Hum Genet, 19, 1059-65.
37. Robinton, D.A. and Daley, G.Q. (2012) The promise of induced pluripotent stem cells in research and therapy. Nature, 481, 295-305.
38. Ebert, A.D., Yu, J., Rose, F.F., Jr., Mattis, V.B., Lorson, C.L., Thomson, J.A. and Svendsen, C.N. (2009) Induced pluripotent stem cells from a spinal muscular atrophy patient. Nature, 457, 277-80.
39. Mostoslavsky, G. (2011) Concise review: The magic act of generating induced pluripotent stem cells: many rabbits in the hat. Stem Cells, 30, 28-32.
40. Ellis, L., Pan, Y., Smyth, G.K., George, D.J., McCormack, C., Williams-Truax, R., Mita, M., Beck, J., Burris, H., Ryan, G. et al. (2008) Histone deacetylase inhibitor panobinostat induces clinical responses with associated alterations in gene expression profiles in cutaneous T-cell lymphoma. Clin Cancer Res, 14, 4500-10.
41. Silverstein, R.L., Baird, M., Lo, S.K. and Yesner, L.M. (1992) Sense and antisense cDNA transfection of CD36 (glycoprotein IV) in melanoma cells. Role of CD36 as a thrombospondin receptor. J Biol Chem, 267, 16607-12.
42. Means, T.K., Mylonakis, E., Tampakakis, E., Colvin, R.A., Seung, E., Puckett, L., Tai, M.F., Stewart, C.R., Pukkila-Worley, R., Hickman, S.E. et al. (2009) Evolutionarily conserved recognition and innate immunity to fungal pathogens by the scavenger receptors SCARF1 and CD36. J Exp Med, 206, 637-53.
by guest on June 4, 2016http://hm
g.oxfordjournals.org/D
ownloaded from

20
43. Andreassi, C., Angelozzi, C., Tiziano, F.D., Vitali, T., De Vincenzi, E., Boninsegna, A., Villanova, M., Bertini, E., Pini, A., Neri, G. et al. (2004) Phenylbutyrate increases SMN expression in vitro: relevance for treatment of spinal muscular atrophy. Eur J Hum Genet, 12, 59-65.
44. Takahashi, K., Tanabe, K., Ohnuki, M., Narita, M., Ichisaka, T., Tomoda, K. and Yamanaka, S. (2007) Induction of pluripotent stem cells from adult human fibroblasts by defined factors. Cell, 131, 861-72.
45. Placantonakis, D.G., Tomishima, M.J., Lafaille, F., Desbordes, S.C., Jia, F., Socci, N.D., Viale, A., Lee, H., Harrison, N., Tabar, V. et al. (2009) BAC transgenesis in human embryonic stem cells as a novel tool to define the human neural lineage. Stem Cells, 27, 521-32.
46. Kernochan, L.E., Russo, M.L., Woodling, N.S., Huynh, T.N., Avila, A.M., Fischbeck, K.H. and Sumner, C.J. (2005) The role of histone acetylation in SMN gene expression. Hum Mol Genet, 14, 1171-82.
47. Chang, J.G., Hsieh-Li, H.M., Jong, Y.J., Wang, N.M., Tsai, C.H. and Li, H. (2001) Treatment of spinal muscular atrophy by sodium butyrate. Proc Natl Acad Sci U S A, 98, 9808-13.
48. Febbraio, M., Hajjar, D.P. and Silverstein, R.L. (2001) CD36: a class B scavenger receptor involved in angiogenesis, atherosclerosis, inflammation, and lipid metabolism. J Clin Invest, 108, 785-91.
49. Ren, Y., Silverstein, R.L., Allen, J. and Savill, J. (1995) CD36 gene transfer confers capacity for phagocytosis of cells undergoing apoptosis. J Exp Med, 181, 1857-62.
50. Kunjathoor, V.V., Febbraio, M., Podrez, E.A., Moore, K.J., Andersson, L., Koehn, S., Rhee, J.S., Silverstein, R., Hoff, H.F. and Freeman, M.W. (2002) Scavenger receptors class A-I/II and CD36 are the principal receptors responsible for the uptake of modified low density lipoprotein leading to lipid loading in macrophages. J Biol Chem, 277, 49982-8.
by guest on June 4, 2016http://hm
g.oxfordjournals.org/D
ownloaded from

21
FIGURE LEGENDS
Figure 1: VPA-treatment of SMA fibroblasts identifies Pos- and Non-Responder
(A) Schematic overview of the VPA treatment of SMA patient’s fibroblasts. Depicted are
SMN protein levels as mean ± SEM after treatment with increasing VPA concentrations for
16 hrs (n = 3 for each data point). Dashed line represents mock SMN levels set as 100%.
ML67, ML72 and ML89 were considered as concordant Pos-Responders, while all Non-
Responders except ML62, ML96 and ML94 were concordant. Statistical significances and
details on how fibroblast lines were categorized are given in Table S2. Furthermore, SMN2
transcript levels in the blood of the respective patient under VPA treatment are summarized in
Table S1.
(B) Representative western blot illustrating the variable response to VPA in fibroblasts. Bar
chart gives mean protein levels ± SEM of three independent experiments for all three
fibroblasts lines. ML67 is a Pos-Responder, while ML105 is a Non-Responder with constant
SMN levels and M73 a Non-Responder with decreased SMN levels. (* = P < 0.05; ** = P <
0.01; *** = P < 0.001)
Figure 2: Response to VPA is maintained in GABAergic neurons
(A) Immunohistological verification of stably expandable lt-NES generated from patients’
and control iPSCs. As expected, the key markers PLZF (promyelocytic leukaemia zinc finger)
and ZO-1 (zona occludens 1 protein) of rosette-type NSCs were expressed. In addition,
expression of general NSC markers such as SOX2 ((sex determining region Y)-box 2) and
nestin was confirmed. Scale bar is 20 µm. In brackets, the respective donor fibroblast line as
well as the classification as Pos-Responder (PR) or Non-Responder (NR) is given.
(B) Validation of the successful neuronal differentiation of patients’ and control lt-NES into
GABAergic neurons by staining for the classical marker of GABAergic neurons GAD65/67
by guest on June 4, 2016http://hm
g.oxfordjournals.org/D
ownloaded from

22
(glutamate decarboxylase) as well as for the general neuronal marker TUJ1 (III-tubulin).
Scale bar is 20 µm.
(C) SMN2 expression measured by qRT-PCR in RNA extracted from GABAergic neurons
treated with 500 µM VPA for nine days. PPIB (cyclophilin B) was used to normalize data.
(D) Relative GABA-release of GABAergic neurons derived from iPSCs following VPA
treatment (500 µM) for nine days quantified by ELISA. Data are given as mean ± SD (* = P <
0.05; *** = P < 0.001).
Figure 3: VPA neither inhibits HDACs nor the PKA in Non-Responders
(A) ChIP analysis of the human SMN2 promoter using antibodies directed against acetylated
histone H3 in Pos- (ML17, ML67 and ML72) and Non-Responders (ML59, ML73 and
ML82). Both, ML17 and ML73, were used for iPS cell generation. Fibroblasts were treated
for 16 hrs with 500 µM VPA or mock. Four regions of the SMN2 promoter prone to undergo
hyperacetylation by HDAC inhibition (46) were analyzed by qRT-PCR. P-value for group-
wise comparison was at least below 0.05 for all four regions.
(B) Western blot analysis of Pos- (ML5) and Non-Responders (ML59) treated with different
HDACi known to increase SMN levels. Small numbers indicate x-fold change of SMN
protein levels. For all compounds published treatment conditions were employed (22, 43, 47).
-Actin was used as loading control.
(C) PKA activity as an HDAC-independent readout of VPA treatment determined in three
Pos- (ML16, ML17 and ML67) and three Non-Responders (ML59, ML73 and ML105).
Fibroblasts were treated for 16 hrs with the indicated VPA concentrations (n.s. = not
significant; * = P < 0.05, ** = P < 0.01, *** = P < 0.001).
by guest on June 4, 2016http://hm
g.oxfordjournals.org/D
ownloaded from

23
Figure 4: Microarray analysis identifies potential candidates for VPA non-
responsiveness
(A) Diagram illustrating the number of differentially expressed transcripts after Benjamini-
Hochberg correction and assuming at least >1.0 log2FC. Arrows indicate in which group
transcripts were higher expressed. Thick numbering indicates total number of differentially
expressed transcripts. Transcripts shaded in grey differed in both treated and untreated
fibroblasts. Pos-Responders were ML67, ML72, ML5, ML16 and ML17. Non-Responders
were ML82, ML69, ML59 and ML73. ML17 and ML73 were also used for iPS cell
generation.
(B) Gene-wise comparison of micro-array and qRT-PCR data obtained for CD36 among the
different fibroblast lines analyzed by micro-array. Dashed line indicates total mean for each
group ± SD.
(C) Expression of CD36 protein determined by semi-quantitative western blotting using -
actin as loading control. Fibroblasts were either mock-treated for 16 hrs or treated with 500
µM VPA. Three Pos- and three Non-Responders were analyzed in triplicates. Data are given
as mean ± SEM (M = mock; V =VPA)
Figure 5: CD36 suppresses HDAC inhibition by VPA
(A) Representative western blot illustrating SMN amounts 32 hrs post transfection in
HEK293 cells either transfected with GFP or CD36 and treated for 16 hrs with 500 µM VPA.
(B) Quantified protein amounts given as mean ± SEM using -actin as loading control (n=3)
(C) ChIP analysis of the SMN2 promoter with antibodies directed against acetylated histone
H3 in VPA-treated HEK293 cells either transfected with GFP or CD36. Data are given as
mean ± SEM of three independent experiments.
by guest on June 4, 2016http://hm
g.oxfordjournals.org/D
ownloaded from

24
(D) Representative western blot illustrating SMN amounts 32 hrs post-transfection in the
Non-Responder fibroblast lines ML69 and ML73 following siRNA-mediated knockdown of
CD36 and 16 hrs of treatment with 500 µM VPA. (Scr = scrambled control siRNA). ML73
was also used for iPS cell generation.
(E) Quantified protein amounts given as mean ± SEM using -actin as loading control (n=3).
(n.s. = not significant; * = P < 0.05; ** = P < 0.01; *** = P < 0.001)
by guest on June 4, 2016http://hm
g.oxfordjournals.org/D
ownloaded from

25
TABLES
Table 1: Tabularised summary of CD36 functions
Aliases and identifiers for CD36 in some databases are given. Described functions of CD36
are outlined by keywords and a representative reference is given.
Symbol Aliases Identifiers Described function Reference SCARB3 Entrez Gene 948 Scavenger receptor (42)
Platelet glycoprotein IV OMIM 173510 Thrombospondin receptor (48) Glycoprotein IIIb HGNC 1663 Clearance of apoptotic cells (49)
Cluster determinant 36 OxLDL binding (50) CD36
Fatty acid translocase LCFA transport (25)
by guest on June 4, 2016http://hm
g.oxfordjournals.org/D
ownloaded from
26
by guest on June 4, 2016http://hm
g.oxfordjournals.org/D
ownloaded from

27
by guest on June 4, 2016http://hm
g.oxfordjournals.org/D
ownloaded from

28
by guest on June 4, 2016http://hm
g.oxfordjournals.org/D
ownloaded from

29
by guest on June 4, 2016http://hm
g.oxfordjournals.org/D
ownloaded from

30
by guest on June 4, 2016http://hm
g.oxfordjournals.org/D
ownloaded from