Efficiency measurement of research groups using Data Envelopment Analysis and Bayesian networks
11
Efficiency measurement of research groups using Data Envelopment Analysis and Bayesian networks Cristhian Fabia ´n Ruiz • Ricardo Bonilla • Diego Chavarro • Luis Antonio Orozco • Roberto Zarama • Xavier Polanco Received: 17 November 2009 / Published online: 16 December 2009 Ó Akade ´miai Kiado ´, Budapest, Hungary 2009 Abstract Applications of non-parametric frontier production methods such as Data Envelopment Analysis (DEA) have gained popularity and recognition in scientometrics. DEA seems to be a useful method to assess the efficiency of research units in different fields and disciplines. However, DEA results give only a synthetic measurement that does not expose the multiple relationships between scientific production variables by discipline. Although some papers mention the need for studies by discipline, they do not show how to take those differences into account in the analysis. Some studies tend to homogenize the behaviour of different practice communities. In this paper we propose a framework to make inferences about DEA efficiencies, recognizing the underlying relationships between production variables and efficiency by discipline, using Bayesian Network (BN) analysis. Two different DEA extensions are applied to calculate the efficiency of research groups: one called CCRO and the other Cross Efficiency (CE). A BN model is proposed as a method to analyze the results obtained from DEA. BNs allow us to recognize peculiarities of each discipline in terms of scientific production and the efficiency frontier. Besides, BNs provide the possibility for a manager to propose what-if scenarios based on the relations found. Keywords Data Envelopment Analysis Bayesian Networks Scientific production Efficiency measurement Research groups C. F. Ruiz (&) R. Bonilla R. Zarama Center for Basic and Applied Interdisciplinary Studies on Complexity, CeiBA-Complejidad, Universidad de los Andes, Calle 19 No. 1 – 11, Bogota ´, DC, Colombia e-mail: [email protected] D. Chavarro Vice-Rectory for Research, Universidad de los Andes, Bogota ´, DC, Colombia L. A. Orozco School of Management, Universidad de los Andes, Bogota ´, DC, Colombia X. Polanco Center for Basic and Applied Interdisciplinary Studies on Complexity, CeiBA-Complejidad, Universidad del Rosario, Bogota ´, DC, Colombia 123 Scientometrics (2010) 83:711–721 DOI 10.1007/s11192-009-0122-y
-
Upload
independent -
Category
Documents
-
view
0 -
download
0
Transcript of Efficiency measurement of research groups using Data Envelopment Analysis and Bayesian networks
Efficiency measurement of research groups using DataEnvelopment Analysis and Bayesian networks
Cristhian Fabian Ruiz • Ricardo Bonilla • Diego Chavarro •
Luis Antonio Orozco • Roberto Zarama • Xavier Polanco
Received: 17 November 2009 / Published online: 16 December 2009� Akademiai Kiado, Budapest, Hungary 2009
Abstract Applications of non-parametric frontier production methods such as Data
Envelopment Analysis (DEA) have gained popularity and recognition in scientometrics.
DEA seems to be a useful method to assess the efficiency of research units in different
fields and disciplines. However, DEA results give only a synthetic measurement that does
not expose the multiple relationships between scientific production variables by discipline.
Although some papers mention the need for studies by discipline, they do not show how to
take those differences into account in the analysis. Some studies tend to homogenize the
behaviour of different practice communities. In this paper we propose a framework to
make inferences about DEA efficiencies, recognizing the underlying relationships between
production variables and efficiency by discipline, using Bayesian Network (BN) analysis.
Two different DEA extensions are applied to calculate the efficiency of research groups:
one called CCRO and the other Cross Efficiency (CE). A BN model is proposed as a
method to analyze the results obtained from DEA. BNs allow us to recognize peculiarities
of each discipline in terms of scientific production and the efficiency frontier. Besides, BNs
provide the possibility for a manager to propose what-if scenarios based on the relations
found.
Keywords Data Envelopment Analysis � Bayesian Networks � Scientific production �Efficiency measurement � Research groups
C. F. Ruiz (&) � R. Bonilla � R. ZaramaCenter for Basic and Applied Interdisciplinary Studies on Complexity, CeiBA-Complejidad,Universidad de los Andes, Calle 19 No. 1 – 11, Bogota, DC, Colombiae-mail: [email protected]
D. ChavarroVice-Rectory for Research, Universidad de los Andes, Bogota, DC, Colombia
L. A. OrozcoSchool of Management, Universidad de los Andes, Bogota, DC, Colombia
X. PolancoCenter for Basic and Applied Interdisciplinary Studies on Complexity,CeiBA-Complejidad, Universidad del Rosario, Bogota, DC, Colombia
123
Scientometrics (2010) 83:711–721DOI 10.1007/s11192-009-0122-y
Introduction
In this paper we measure the efficiencies of research groups. Research groups are con-
sidered ‘‘decision making units’’ (DMUs). Our proposal combines two methods: Data
Envelopment Analysis (DEA) and Bayesian Networks (BNs). DEA gives an overview of
the relative efficiency of a research group in terms of its production. Complementarily,
BNs provide a useful representation of the influence between production variables and
DEA efficiency. Our major contribution is the use of BNs as a graphical probabilistic
reasoning tool to assess the influence of production variables on the efficiency of a group.
With this tool it is possible to propose dynamic scenarios to simulate changes in the
variables and obtain a reconfiguration of the influence network based on those changes.
A review of the literature shows that DEA has become useful to approximate the
efficiency of science and technology (S&T). Bonaccorsi and Daraio (2004) highlight the
use of non-parametric efficiency frontier methods (e.g. DEA) as the most useful to evaluate
efficiency in S&T systems. In scientometrics, the DEA method has been applied to
countries (Bonaccorsi and Daraio 2004; Rousseau and Rousseau 1997, 1998), scientific
fields (Garg et al. 2005; Meng et al. 2006), universities (Bonaccorsi et al. 2006), research
centres (Korhonen et al. 2001), and research groups (Guan and Wang 2004; Restrepo and
Villegas 2007).
Although it is frequently suggested to perform DEA analyses by scientific disciplines,
the differences between those disciplines are not shown empirically. Bonaccorsi and Da-
raio (2004, p. 53) suggest the introduction of ‘‘…assumptions about the structure of the
technology and the behaviour of producers’’. This suggestion points to the need for a
grouping criterion before applying DEA. Grouping by similar characteristics (disciplines,
in this case) is a way to produce comparable DMUs. However, once the results of DEA are
obtained, it is necessary to apply a method to go further and provide a mean for the
interpretation of the results. As Cherchye and Vanden Abeele (2005, p. 499) state:
It is important to emphasize that the computed efficiency values can have different
interpretations. (…) A related point concerns the possible interpretation of the
(in)efficiency results in terms of the unobservable characteristics of the research
inputs; this essentially means that efficiency differences between research programs
may at least partially reflect differences in the quality of the researchers who com-
pose the programs. In our opinion, such quality differences equally refer to diverging
efficiencies in the research production process
To map the internal configuration of efficiency results to comprehend those diverging
efficiencies we propose the use of BNs. BNs are widely used in data mining, machine
learning, and decision theory. BNs are used to construct influence diagrams, decision
making tools, and classifiers.
However, BNs are not widely used in scientometrics. BNs have been used to classify
authors according to citation patterns (Lehmann et al. 2008), to assess the impact of
variables in the innovation collaboration process (Kim and Park 2008) and webometrics
(Lamirel et al. 2004). Leydesdorff (1992) proposed a Bayesian approach to science studies
that can be understood as the analysis of the interaction between two dynamic principles:
hypotheses and evidences. In this paper we propose a BN analysis of DEA results. This
analysis is proposed to take into account both the underlying relationships of the variables
of the production of each discipline and the impact of production variables on the effi-
ciency. In that way it becomes possible to predict the network’s reconfiguration after
applying changes.
712 C. F. Ruiz et al.
123
Methodology
DEA is a method to make comparative analyses of the relative efficiencies of research
groups. The unit of analysis is called a Decision Making Unit (DMU). A DMU is the entity
that transforms a certain number of inputs into outputs through a specific process (Cooper
et al. 2004). The measurement of efficiency quantifies the distance between one DMU and
the efficiency frontier. Two DEA extensions were applied: CCRO, proposed by Charnes
et al. (1978) output oriented, and cross-efficiency (CE), proposed by Sexton et al. (1986).
CCRO constructs an efficiency frontier to compare all DMUs. The efficiency frontier is
delimited by the DMUs with the better ratio between outputs and inputs (O/I), i.e. those
that obtain a greater ratio. In this case a matrix of N rows (DMUs) and M columns (Input
and output variables) is transformed into a vector of N rows that contains the efficiency
values. An N-dimensional efficiency frontier is constructed based on the output values for
the transformation.
Geometrically, each DMU is a point in the M-dimensional space using the column
values as coordinates. Outstanding DMUs are the ones that reach greater production using
fewer resources. DMUs that have efficiency equal to 1 are the most efficient. The border is
delineated by them. To establish the relative efficiency of other research groups, these are
projected onto the hyperplane perpendicular to the border of the outputs (CCRO). Doyle
and Green (1994, p. 569) argue that CCRO high efficiency can be reached by having a high
value in one single output.
CE take not only the efficient DMUs but also the rest of them into account. It compares
each DMU with all other DMUs (Doyle and Green 1994, p. 570). Thus CE is a peer
appraisal approach. We use the implementation of Restrepo and Villegas (2007)1 in Matlab
for CCRO and CE. This implementation was programmed using the optimization linprogtoolbox, and it solves the linear program by means of the Simplex Method.
The results, obtained applying the CE extension by discipline, were incorporated into a
BN model. A BN is a probabilistic graphical model that represents a set of random
variables and their relationship (probabilistic independencies) by means of a Direct Acy-
clic Graph (DAG) and a set of probability tables (Heckerman 1999; Kjaerulff and Madsen
2008). BNs allow information analysis based on relationship dependence between vari-
ables. This approach is useful to figure out the effect of a particular intervention on a
variable (Heckerman 1999).
The BN graph shows dependent and independent relationships between variables. Those
relationships are built using the D-separation concept (Pearl 2000). The D-separation
criterion sets the conditions by which information is transferred between variables. We
speak of information transmission when an instantiated variable modifies the degree of
belief or plausibility of another. It is said that two variables are d-separated when infor-
mation cannot be transmitted between them. The graph in Fig. 1 shows three basic forms
of three nodes: serial, divergent and convergent.
In a serial structure the transfer of information between variables A and C occur as long
as there is no evidence of the intermediate variable B. The transfer is possible indepen-
dently of the direction of the links. The criterion shows how the degree of belief or
plausibility of the variable C is modified by evidence of variable A and vice versa. If there
is evidence of the intermediate variable B, then information transmission is not possible
between A and C, and it is said that the variables are d-separated. In a divergent structure
1 Retrieved February 2009, from http://industrial.udea.edu.co/jgvillegas/Pagina%20DEA/index.html.
Efficiency measurement of research groups 713
123
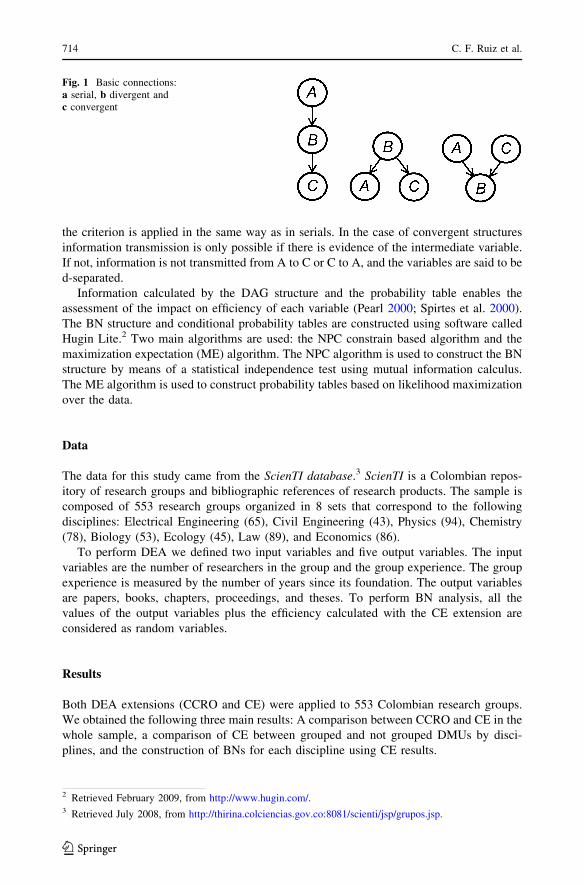
the criterion is applied in the same way as in serials. In the case of convergent structures
information transmission is only possible if there is evidence of the intermediate variable.
If not, information is not transmitted from A to C or C to A, and the variables are said to be
d-separated.
Information calculated by the DAG structure and the probability table enables the
assessment of the impact on efficiency of each variable (Pearl 2000; Spirtes et al. 2000).
The BN structure and conditional probability tables are constructed using software called
Hugin Lite.2 Two main algorithms are used: the NPC constrain based algorithm and the
maximization expectation (ME) algorithm. The NPC algorithm is used to construct the BN
structure by means of a statistical independence test using mutual information calculus.
The ME algorithm is used to construct probability tables based on likelihood maximization
over the data.
Data
The data for this study came from the ScienTI database.3 ScienTI is a Colombian repos-
itory of research groups and bibliographic references of research products. The sample is
composed of 553 research groups organized in 8 sets that correspond to the following
disciplines: Electrical Engineering (65), Civil Engineering (43), Physics (94), Chemistry
(78), Biology (53), Ecology (45), Law (89), and Economics (86).
To perform DEA we defined two input variables and five output variables. The input
variables are the number of researchers in the group and the group experience. The group
experience is measured by the number of years since its foundation. The output variables
are papers, books, chapters, proceedings, and theses. To perform BN analysis, all the
values of the output variables plus the efficiency calculated with the CE extension are
considered as random variables.
Results
Both DEA extensions (CCRO and CE) were applied to 553 Colombian research groups.
We obtained the following three main results: A comparison between CCRO and CE in the
whole sample, a comparison of CE between grouped and not grouped DMUs by disci-
plines, and the construction of BNs for each discipline using CE results.
Fig. 1 Basic connections:a serial, b divergent andc convergent
2 Retrieved February 2009, from http://www.hugin.com/.3 Retrieved July 2008, from http://thirina.colciencias.gov.co:8081/scienti/jsp/grupos.jsp.
714 C. F. Ruiz et al.
123
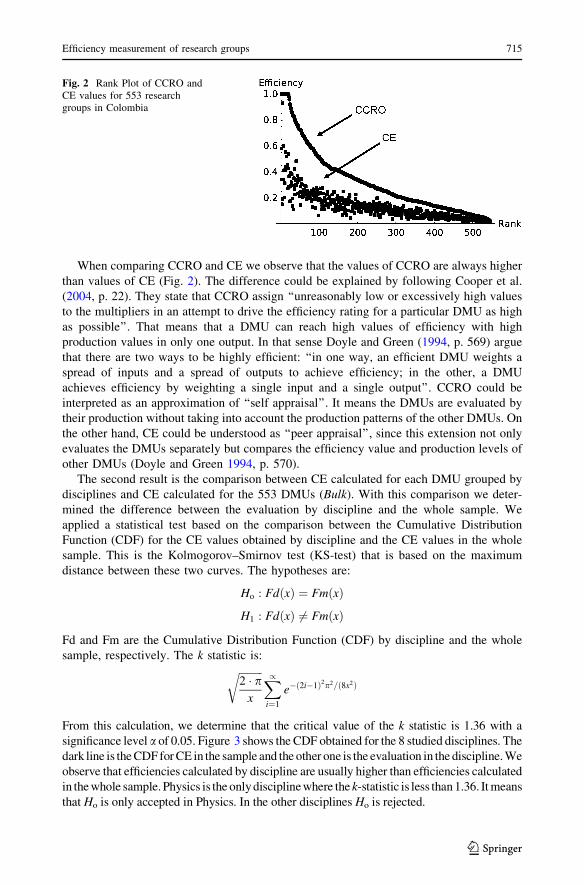
When comparing CCRO and CE we observe that the values of CCRO are always higher
than values of CE (Fig. 2). The difference could be explained by following Cooper et al.
(2004, p. 22). They state that CCRO assign ‘‘unreasonably low or excessively high values
to the multipliers in an attempt to drive the efficiency rating for a particular DMU as high
as possible’’. That means that a DMU can reach high values of efficiency with high
production values in only one output. In that sense Doyle and Green (1994, p. 569) argue
that there are two ways to be highly efficient: ‘‘in one way, an efficient DMU weights a
spread of inputs and a spread of outputs to achieve efficiency; in the other, a DMU
achieves efficiency by weighting a single input and a single output’’. CCRO could be
interpreted as an approximation of ‘‘self appraisal’’. It means the DMUs are evaluated by
their production without taking into account the production patterns of the other DMUs. On
the other hand, CE could be understood as ‘‘peer appraisal’’, since this extension not only
evaluates the DMUs separately but compares the efficiency value and production levels of
other DMUs (Doyle and Green 1994, p. 570).
The second result is the comparison between CE calculated for each DMU grouped by
disciplines and CE calculated for the 553 DMUs (Bulk). With this comparison we deter-
mined the difference between the evaluation by discipline and the whole sample. We
applied a statistical test based on the comparison between the Cumulative Distribution
Function (CDF) for the CE values obtained by discipline and the CE values in the whole
sample. This is the Kolmogorov–Smirnov test (KS-test) that is based on the maximum
distance between these two curves. The hypotheses are:
Ho : FdðxÞ ¼ FmðxÞ
H1 : FdðxÞ 6¼ FmðxÞ
Fd and Fm are the Cumulative Distribution Function (CDF) by discipline and the whole
sample, respectively. The k statistic is:ffiffiffiffiffiffiffiffiffi
2 � px
r
X
/
i¼1
e�ð2i�1Þ2p2=ð8x2Þ
From this calculation, we determine that the critical value of the k statistic is 1.36 with a
significance level a of 0.05. Figure 3 shows the CDF obtained for the 8 studied disciplines. The
dark line is the CDF for CE in the sample and the other one is the evaluation in the discipline. We
observe that efficiencies calculated by discipline are usually higher than efficiencies calculated
in the whole sample. Physics is the only discipline where the k-statistic is less than 1.36. It means
that Ho is only accepted in Physics. In the other disciplines Ho is rejected.
Fig. 2 Rank Plot of CCRO andCE values for 553 researchgroups in Colombia
Efficiency measurement of research groups 715
123
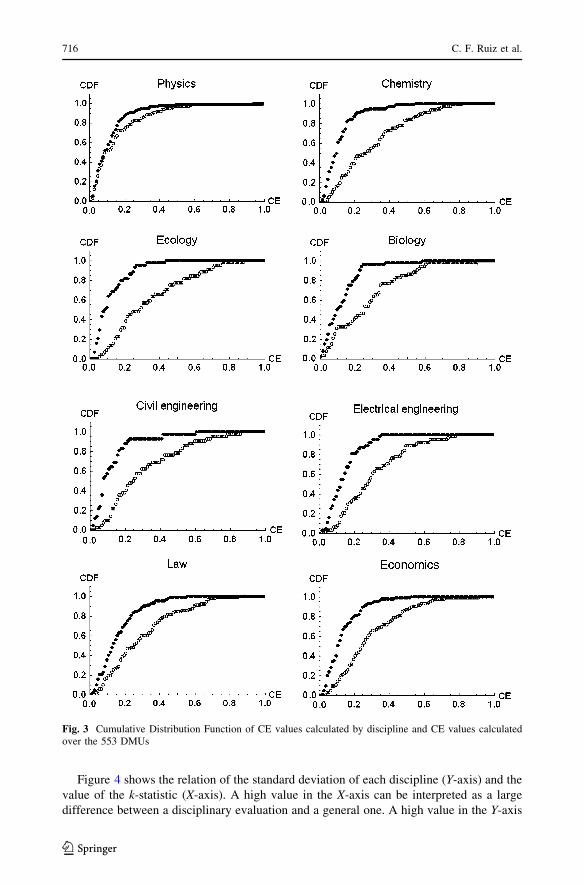
Figure 4 shows the relation of the standard deviation of each discipline (Y-axis) and the
value of the k-statistic (X-axis). A high value in the X-axis can be interpreted as a large
difference between a disciplinary evaluation and a general one. A high value in the Y-axis
Fig. 3 Cumulative Distribution Function of CE values calculated by discipline and CE values calculatedover the 553 DMUs
716 C. F. Ruiz et al.
123
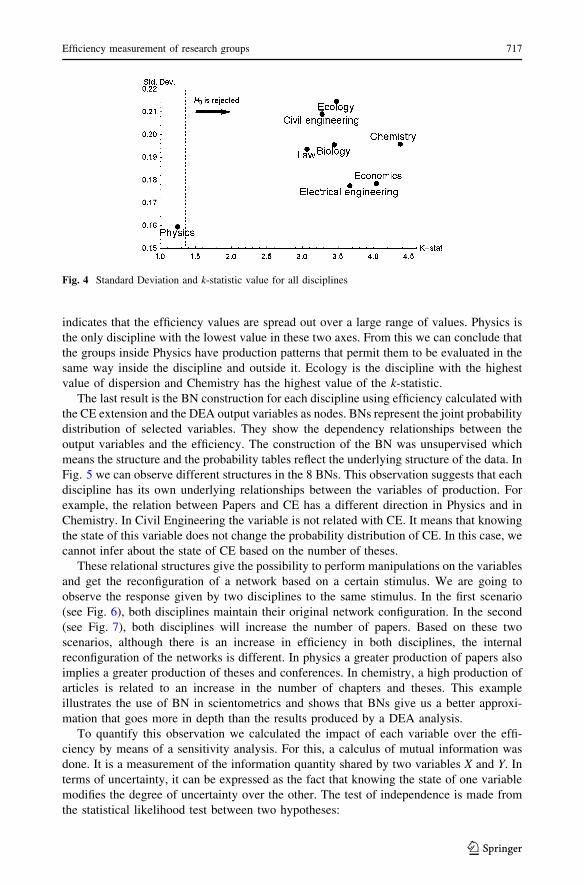
indicates that the efficiency values are spread out over a large range of values. Physics is
the only discipline with the lowest value in these two axes. From this we can conclude that
the groups inside Physics have production patterns that permit them to be evaluated in the
same way inside the discipline and outside it. Ecology is the discipline with the highest
value of dispersion and Chemistry has the highest value of the k-statistic.
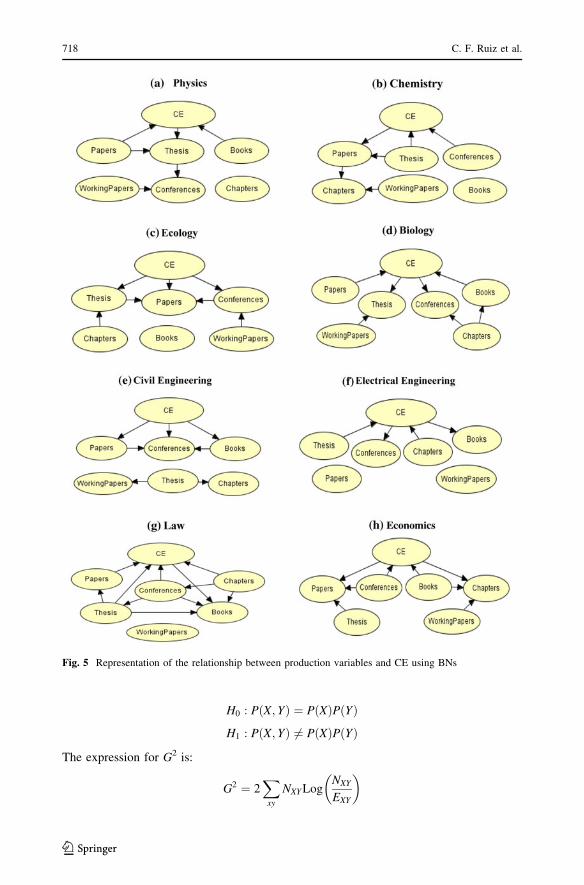
The last result is the BN construction for each discipline using efficiency calculated with
the CE extension and the DEA output variables as nodes. BNs represent the joint probability
distribution of selected variables. They show the dependency relationships between the
output variables and the efficiency. The construction of the BN was unsupervised which
means the structure and the probability tables reflect the underlying structure of the data. In
Fig. 5 we can observe different structures in the 8 BNs. This observation suggests that each
discipline has its own underlying relationships between the variables of production. For
example, the relation between Papers and CE has a different direction in Physics and in
Chemistry. In Civil Engineering the variable is not related with CE. It means that knowing
the state of this variable does not change the probability distribution of CE. In this case, we
cannot infer about the state of CE based on the number of theses.
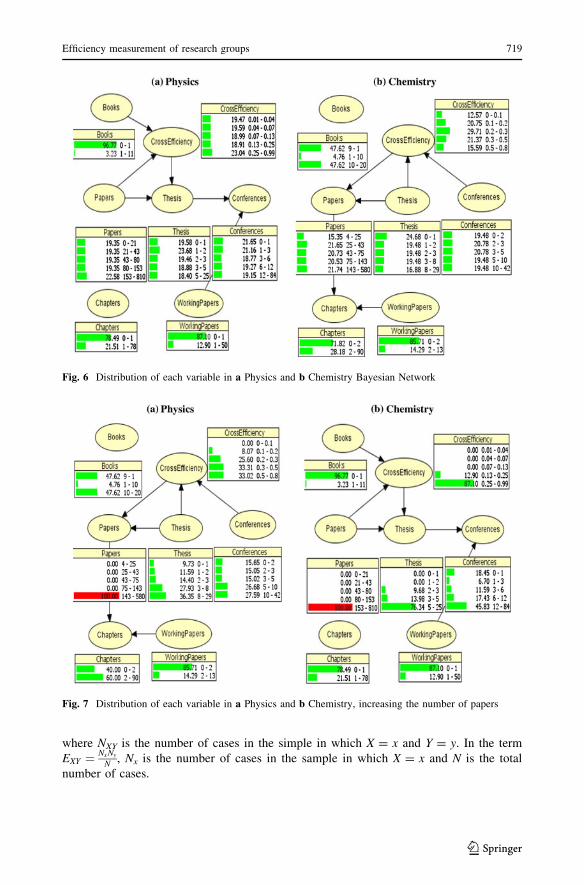
These relational structures give the possibility to perform manipulations on the variables
and get the reconfiguration of a network based on a certain stimulus. We are going to
observe the response given by two disciplines to the same stimulus. In the first scenario
(see Fig. 6), both disciplines maintain their original network configuration. In the second
(see Fig. 7), both disciplines will increase the number of papers. Based on these two
scenarios, although there is an increase in efficiency in both disciplines, the internal
reconfiguration of the networks is different. In physics a greater production of papers also
implies a greater production of theses and conferences. In chemistry, a high production of
articles is related to an increase in the number of chapters and theses. This example
illustrates the use of BN in scientometrics and shows that BNs give us a better approxi-
mation that goes more in depth than the results produced by a DEA analysis.
To quantify this observation we calculated the impact of each variable over the effi-
ciency by means of a sensitivity analysis. For this, a calculus of mutual information was
done. It is a measurement of the information quantity shared by two variables X and Y. In
terms of uncertainty, it can be expressed as the fact that knowing the state of one variable
modifies the degree of uncertainty over the other. The test of independence is made from
the statistical likelihood test between two hypotheses:
Fig. 4 Standard Deviation and k-statistic value for all disciplines
Efficiency measurement of research groups 717
123
H0 : PðX; YÞ ¼ PðXÞPðYÞ
H1 : PðX; YÞ 6¼ PðXÞPðYÞ
The expression for G2 is:
G2 ¼ 2X
xy
NXY LogNXY
EXY
� �
Fig. 5 Representation of the relationship between production variables and CE using BNs
718 C. F. Ruiz et al.
123
where NXY is the number of cases in the simple in which X = x and Y = y. In the term
EXY ¼ NxNy
N , Nx is the number of cases in the sample in which X = x and N is the total
number of cases.
Fig. 6 Distribution of each variable in a Physics and b Chemistry Bayesian Network
Fig. 7 Distribution of each variable in a Physics and b Chemistry, increasing the number of papers
Efficiency measurement of research groups 719
123
The value G2 allows accepting or rejecting H0. If G2 is small enough (G2 \ c), the
hypothesis cannot be rejected. The level of significance a is used to set the value of the
threshold c. This value was manually adjusted in the software.
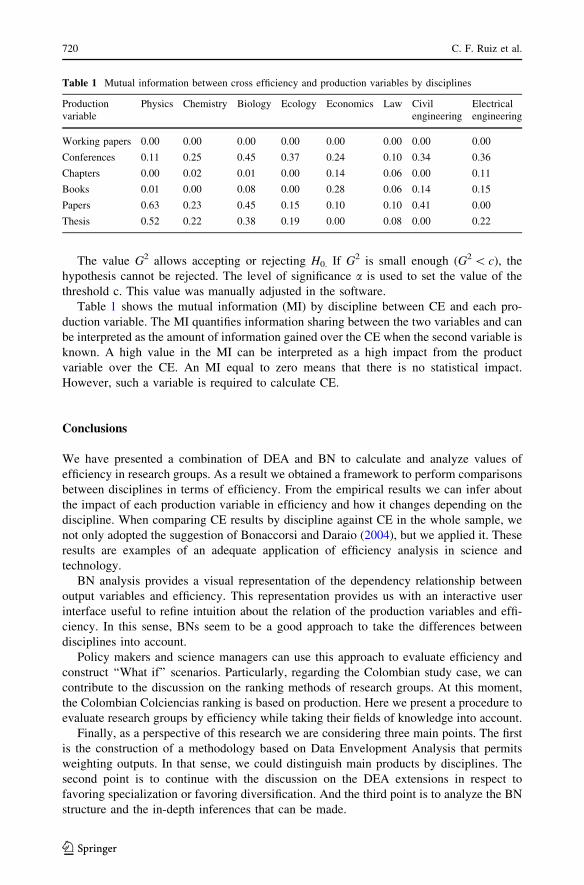
Table 1 shows the mutual information (MI) by discipline between CE and each pro-
duction variable. The MI quantifies information sharing between the two variables and can
be interpreted as the amount of information gained over the CE when the second variable is
known. A high value in the MI can be interpreted as a high impact from the product
variable over the CE. An MI equal to zero means that there is no statistical impact.
However, such a variable is required to calculate CE.
Conclusions
We have presented a combination of DEA and BN to calculate and analyze values of
efficiency in research groups. As a result we obtained a framework to perform comparisons
between disciplines in terms of efficiency. From the empirical results we can infer about
the impact of each production variable in efficiency and how it changes depending on the
discipline. When comparing CE results by discipline against CE in the whole sample, we
not only adopted the suggestion of Bonaccorsi and Daraio (2004), but we applied it. These
results are examples of an adequate application of efficiency analysis in science and
technology.
BN analysis provides a visual representation of the dependency relationship between
output variables and efficiency. This representation provides us with an interactive user
interface useful to refine intuition about the relation of the production variables and effi-
ciency. In this sense, BNs seem to be a good approach to take the differences between
disciplines into account.
Policy makers and science managers can use this approach to evaluate efficiency and
construct ‘‘What if’’ scenarios. Particularly, regarding the Colombian study case, we can
contribute to the discussion on the ranking methods of research groups. At this moment,
the Colombian Colciencias ranking is based on production. Here we present a procedure to
evaluate research groups by efficiency while taking their fields of knowledge into account.
Finally, as a perspective of this research we are considering three main points. The first
is the construction of a methodology based on Data Envelopment Analysis that permits
weighting outputs. In that sense, we could distinguish main products by disciplines. The
second point is to continue with the discussion on the DEA extensions in respect to
favoring specialization or favoring diversification. And the third point is to analyze the BN
structure and the in-depth inferences that can be made.
Table 1 Mutual information between cross efficiency and production variables by disciplines
Productionvariable
Physics Chemistry Biology Ecology Economics Law Civilengineering
Electricalengineering
Working papers 0.00 0.00 0.00 0.00 0.00 0.00 0.00 0.00
Conferences 0.11 0.25 0.45 0.37 0.24 0.10 0.34 0.36
Chapters 0.00 0.02 0.01 0.00 0.14 0.06 0.00 0.11
Books 0.01 0.00 0.08 0.00 0.28 0.06 0.14 0.15
Papers 0.63 0.23 0.45 0.15 0.10 0.10 0.41 0.00
Thesis 0.52 0.22 0.38 0.19 0.00 0.08 0.00 0.22
720 C. F. Ruiz et al.
123
References
Bonaccorsi, A., & Daraio, C. (2004). Econometric approaches to the analysis of productivity of R&Dsystems. Production functions and production frontiers. In W. Glanzel, U. Schmoch, M. Zitt,E. Bassecoulard, & M. Luwel (Eds.), Handbook of quantitative science and technology research(pp. 51–74). Amsterdam, Netherlands: Springer.
Bonaccorsi, A., Daraio, C., & Simar, L. (2006). Advanced indicators of productivity of universities. Anapplication of robust nonparametric methods to Italian data. Scientometrics, 66(2), 389–410.
Charnes, A., Cooper, W. W., & Rhodes, E. (1978). Measuring the efficiency of decision-making units.European Journal of Operational Research, 2(6), 429–444.
Cherchye, L., & Vanden Abeele, P. (2005). Onresearch efficiency: A microanalysis of Dutch universityresearch in economic and business management. Research Policy, 34, 495–516.
Cooper, W. W., Seiford, L. M., & Zhu, J. (2004). In J. Zhu, W. W. Cooper, R. D. Banker, & L. M. Seiford(Eds.), Handbook on data envelopment analysis (pp. 1–39). Boston: Kluwer Academic.
Doyle, J., & Green, R. (1994). Efficiency and cross-efficiency in DEA: Derivations, meanings and uses.The Journal of the Operational Research Society, 45(5), 567–578.
Garg, K. C., Gupta, B. M., Jamal, T., Roy, S., & Kumar, S. (2005). Assessment of impact of AICTE fundingon R&D and educational development. Scientometrics, 65(2), 151–160.
Guan, J. C., & Wang, J. X. (2004). Evaluation and interpretation of knowledge production efficiency.Scientometrics, 59(1), 131–155.
Heckerman, D. (1999). A tutorial on learning with Bayesian networks. In M. Jordan (Ed.), Learning ingraphical models. Cambridge, MA: MIT Press.
Kim, H., & Park, Y. (2008). The impact of R&D collaboration on innovative performance in Korea: ABayesian network approach. Scientometrics, 75(3), 535–554.
Kjaerulff, U. B., & Madsen, A. L. (2008). Bayesian networks and influence diagrams. A guide to con-struction and analysis. New York: Springer.
Korhonen, P., Tainio, R., & Wallenius, J. (2001). Value efficiency analysis of academic research. EuropeanJournal of Operational Research, 130(1), 121–132.
Lamirel, J. C., Al Shehabi, S., Francois, C., & Polanco, X. (2004). Using a compound approach based onelaborated neural network for Webometrics: An example issued from the EICSTES project.Scientometrics, 61(3), 427–441.
Lehmann, S., Jackson, A. D., & Lautrup, B. E. (2008). A quantitative analysis of indicators of scientificperformance. Scientometrics, 76(2), 369–390.
Leydesdorff, L. (1992). Knowledge representations, Bayesian inferences, and empirical science studies.Social Science Information, 31(2), 213–237.
Meng, W., Hu, Z., & Liu, W. (2006). Efficiency evaluation of basic research in China. Scientometrics, 69(1),85–101.
Pearl, J. (Ed.). (2000). Causality: Models, reasoning, and inference (pp. 1–40). Cambridge: CambridgeUniversity Press.
Restrepo, M., & Villegas, J. (2007). Clasificacion de grupos de investigacion colombianos aplicando analisisenvolvente de datos. Revista Facultad de Ingenierıa Universidad de Antioquia, 42, 105–119.
Rousseau, S., & Rousseau, R. (1997). Data envelopment analysis as a tool for constructing scientometricindicators. Scientometrics, 40(1), 45–56.
Rousseau, S., & Rousseau, R. (1998). The scientific wealth of European nations: Taking effectiveness intoaccount. Scientometrics, 42(1), 75–87.
Sexton, T. R., Slinkman, R. H., & Hogan, A. (1986). Data envelopment analysis: Critique and extensions.In R. H. Silkman (Ed.), Measuring efficiency: An assessment of Data Envelopment Analysis (Vol. 32,pp. 73–105). San Francisco: Jossey-Bass.
Spirtes, P., Glymour, C. N., & Scheines, R. (2000). Discovery algorithms for causally sufficient structures.In P. Spirtes, C. N. Glymour, & R. Scheines (Eds.), Causation, prediction, and search (pp. 73–122).Cambridge, MA: MIT Press.
Efficiency measurement of research groups 721
123