
Application of differential evolution for data envelopment analysis
Upload
independentCategory
view
0download
0
TI 2006-0963 Tinbergen Institute Discussion Paper
Efficiency and Productivity of Italian Tourist Destinations A Quantitative Estimation based on Data Envelopment Analysis and the Malmquist Method
Maria Francesca Cracoliciab
Peter Nijkampbc
Miranda Cuffaroa
a University of Palermo b Vrije Universiteit Amsterdam c Tinbergen Institute
Tinbergen Institute The Tinbergen Institute is the institute for economic research of the Erasmus Universiteit Rotterdam Universiteit van Amsterdam and Vrije Universiteit Amsterdam Tinbergen Institute Amsterdam Roetersstraat 31 1018 WB Amsterdam The Netherlands Tel +31(0)20 551 3500 Fax +31(0)20 551 3555 Tinbergen Institute Rotterdam Burg Oudlaan 50 3062 PA Rotterdam The Netherlands Tel +31(0)10 408 8900 Fax +31(0)10 408 9031 Most TI discussion papers can be downloaded at httpwwwtinbergennl
EFFICIENCY AND PRODUCTIVITY OF ITALIAN TOURIST DESTINATIONS A QUANTITATIVE ESTIMATION BASED ON DATA
ENVELOPMENT ANALYSIS AND THE MALMQUIST METHOD
Maria Francesca Cracoliciab Peter Nijkampb and Miranda Cuffaroa
aDepartment of National Accounting and Analysis of Social Processes University of Palermo
Vle delle Scienze Ed 2 90133 Palermo Italy E-mail cracoliciunipait cuffarounipait
bDepartment of Spatial Economics Free University Amsterdam De Boelelaan 1105 1081 HV Amsterdam The Netherlands
E-mail pnijkampfewebvunl
PN229mfcmc
Abstract
This paper aims to provide a statistical analysis of the relative economic performance of
Italian tourist areas It uses two modelling approaches to estimate the competitiveness of these
regions viz data envelopment analysis (DEA) and the Malmquist method Our results show
that the competitiveness position of several Italian regions has not improved over the years
under consideration
2
1 Introduction
The rising importance of tourism and its expected positive impacts on economic growth
have put tourist policy in the center of development strategies of many countries and regions
With more international openness more geographical mobility cheap air fares and rising
income levels in many countries tourism is expected to become an important growth engine
The permanent rise in tourism has prompted innovative ideas on growth and marketing
strategies of tourist destinations (niche marketing e-tourism etc) with the aim to attract a
maximum share of relevant tourist flows to a particular region (see eg Giaoutzi and
Nijkamp 2006 and Wall and Mathieson 2006) Consequently tourism policy tends to
become a fierce competition effort between alternative tourist destinations
Which tourist sites have been very successful in attracting a significant ndash increasing ndash
flow of tourists And why These questions call for solid theoretical and applied work to
identify the critical success factors for regional or national tourist policy Tourist research
should of course provide insights into the determining factors of tourist behaviour on both
the demand and the supply side An optimal matching of demand and supply attractiveness
will guarantee an optimal use of tourist capacities both quantitative and qualitative in
destination areas An important element here is the great heterogeneity in terms of tourist
needs on the demand side and tourist attraction profiles on the supply side (see also Poon
2002 Swarbrooke and Honner 2001 and Uysel 1998) Furthermore an optimal use of a
tourist destinationsrsquo capacity should also respect the social ecological cultural or artistic
carrying capacity of a destination area as violation of a carrying capacity may erode the
future growth potential of the area concerned (see eg Butler 1999 Fayos-Solagrave 1996
Giaoutzi and Nijkamp 1995 and Poon 2003)
In assessing a proper usage of existing tourist capacity or infrastructure it would ideally
be important to look into different socio-economic categories of tourists into the
attractiveness features of tourist sites as well as into the transport and communication
characteristics between origin and destination The overall economic estimation of benefits
accruing from tourism to a certain area requires the use of consistent tourist statistics In
recent years the Tourism Satellite Accounts ndash incorporating a systematic collection of
numerical data on tourism supply and demand ndash have played a pivotal role in properly
assessing the economic importance of the tourist industry for given region
Tourism tends to become a competitive activity among regions who are forced to
enhance their performance in order to attract more tourists and to increase their revenues (see
eg Crouch and Ritchie 1999 Dwyer et al 2000 Enright and Newton 2004 Pearce 1997
and Ritchie and Crouch 2000 2001) A tourist destination (eg city region or site) is often
no longer seen as a set of distinct natural cultural artistic or environmental resources but as
3
an overall appealing product available in a certain area a complex and integrated portfolio of
services offered by a destination that supplies a holiday experience which meets the needs of
the tourist A tourist destination thus produces a compound package of tourist services based
on its indigenous supply potential (see Buhalis 2000 and Murphy et al 2000) In this context
Dwyer et al (2000) claimed that ldquoit is useful for the industry and government to understand
where a countryrsquos competitive position is weakest and strongestrdquo (p10) while Enright and
Newton (2004 p777) reinforced this view stating that ldquohellipit is important to know how and
why competitiveness is changingrdquo (p777)
The previous observations call for solid applied research but unfortunately there is a
serious limitation in statistical data and empirical modelling work at both a micro and macro
level (eg Alavi and Yasin 2000 Enright and Newton 2004 Kozak and Rimmington 1999
and Kozak 2002)
The present study intends to enrich the tourism literature in this specific aspect by
focussing on destination competitiveness and by providing a measure of competitiveness at
regional level in terms of technical efficiency and total factor productivity (TFP) Our aim is
to investigate whether tourist destinations operate efficiently ie are able to deploy the inputs
at their disposal in an efficient manner in order to attract a maximum share of tourist demand
and to be competitive against key competitors Most literature on tourism efficiency considers
as statistical units hotels and restaurants but we will perform our analysis on territorial areas
(or tourist destinations) In other words we hypothesize that tourist destinations are
heterogeneous multi-product multi-client business organisations In the light of the
competitive behaviour on the tourism market they have to maximize their market share
given the available resources Consequently industry-oriented models (such as frontier
analysis) may be applied at territorial level as well1 A concise illustrative summary of
industry-oriented models used in tourism economics is offered
In the tourism literature the analysis of efficiency is limited to a small number of studies
which focus the analysis on micro-units (eg hotels corporate travel departments etc)
Among the earliest Morey and Dittman (1995) ndash using data envelopment analysis with 7
inputs and 4 outputs ndash evaluated the general-manager performance of 54 hotels of an
American tourism chain ndash geographically dispersed over continental United States ndash for the
year 1993 Hwang and Chang (2003) using data envelopment analysis and the Malmquist
productivity index measured the managerial performance of 45 hotels in 1998 and the
efficiency change of 45 hotels from 1994 to 1998 They found there was a significant
difference in efficiency change due to a difference in sources of customers and management
styles Barros and Mascarenhas (2005) again using data envelopment analysis with 3 inputs
and outputs analysed the technical and allocative efficiency of 43 hotels in Portugal for the
1 In recent years several regional applications of frontier analysis in other economic sectors have emerged see Macmillan (1986) Charnes et al (1989) Susiluoto and Loikaanen (2001) Martić and Savić (2001) and Cuffaro and Vassallo (2002)
4
year 2001 Anderson et al (1999a) proposed an evaluation of managerial efficiency levels in
the hotel industry by using the stochastic frontier technique An overview of efficiency
analysis on the restaurant industry can be found in Reynolds (2003) For other applications on
efficiency measures at micro level in the tourism field we refer to Baker and Riley (1994)
Bell and Morey (1995) Anderson et al (1999b) Barros (2004) and Barros (2005)
Using a non-parametric (data envelopment analysis DEA) method the present paper aims
to assess production frontiers and efficiency coefficients of alternative tourist destinations
The analysis concerns 103 Italian regions for the year 2001 Moreover we will also use the
Malmquist productivity approach (see Faumlre et al 1992) to measure the efficiency change of
Italian regions between 1998 and 2001
The chapter is structured as follows Section 2 introduces the DEA model foundations by
offering synthetically a description of production frontier analysis Then Section 3 contains
a description of the study area and the characteristic of the variables used in our study In
Section 4 the empirical findings are presented and discussed while Section 6 offers
concluding remarks
2 Analytical Framework for Assessing the Performance of Tourist Destinations
The analysis of the economic performance of tourist areas has already a long history
Using Porterrsquos model (1990) Crouch and Ritchie (1999) have developed a conceptual model
of tourist competitiveness that allowed to extend the previous studies that focussed on
destination image or attractiveness (see Chon et al 1991 and Hu and Ritchie 1993) Crouch
and Ritchie argue that tourist destination competitiveness fits into the national industry
competition level They provide a detailed framework in which the different perspectives on
competitiveness are coherently organized by making a distinction into two interrelated
environments micro and macro The micro-environment incorporates the details of the tourist
destination and travel to it which have to be compared with the competitors The macro-
environment includes elements outside the micro-environment which nevertheless influence
it such as the increasing attention for the natural environment the economic restructuring of
economies occurring worldwide the shifting demographics of the marketplace the
increasingly complex technology-human resource interface etc We will use their framework
for an empirical work In particular we will provide an evaluation of tourist site
competitiveness in terms of efficiency
For our aim we use a non-parametric method (a DEA and a Malmquist approach) of
production analysis ndash generally used to evaluate the efficiency of firms or non-profit
organizations ndash in order to assess empirically the production frontiers and efficiency
coefficients for tourist destinations (and their change in efficiency) We will now concisely
present the DEA and the Malmquist method
5
In order to estimate the efficiency and the productivity change we assume that the tourist
sitersquos production technology can be characterised by a production function which provides
the maximum possible output (ie output target) given the proper inputs (see also Cracolici
2004 2005 and Cracolici and Nijkamp 2006) For our aim the following lsquovisitor production
functionrsquo for tourism is deployed
Tourist output = f (material capital cultural heritage human capital labour) (1)
As the functional form of the production function is not known while we have to manage
multiple inputs and outputs a non-parametric method (ie DEA) is used The main advantage
of the DEA over a parametric approach is that it does not require any assumption concerning
the production technology while DEA can also easily accommodate multiple outputs2 DEA
is a non-parametric linear programming method of measuring efficiency to assess a
production frontier The efficiency of each tourist destination is evaluated against this frontier
In other words the efficiency of a destination is evaluated in comparison with the
performance of other destinations
DEA is based on Farrellrsquos (1957) original work further elaborated by Charnes et alrsquos
(1978) CCR model and Banker et alrsquos (1984) BCC Model Generally DEA can be applied to
efficiency problems in public sector agencies (eg schools hospitals airports courts etc)
and private sector agencies (banks hotels etc) Here we apply DEA to tourist sites
considering them as a generic private tourist unit (eg hotels and restaurant) which use
proper inputs to reach multiple outputs For this purpose we adopt an output-oriented DEA
model because we want to explore how well the regions in Italy deploy their input resources
for tourism In other words given a stock of tourist resources the aim of a tourist area is to
maximize tourist flows
DEA models assess efficiency by using the actual economic distance to the production
frontier giving the highest possible efficiency The efficiency measure proposed by Charnes et
al (1978) maximizes efficiency in terms of the ratio of total weighted output to total weighted
input subject to the condition that for every destination this efficiency measure is smaller
than or equal to 1 Given J destinations with I inputs and R outputs the measure of efficiency
of a destination k can then be specified as
2 For details on frontier techniques and their strength and weakness we refer to Coelli (1995) Foslashrsund and Lovell (1980) Bauer (1990) Bjurek et al (1990) Seiford and Thrall (1990) Battese (1992) Bravo-Ureta and Pinheiro (1993) and Fried et al (1993)
6
1
1
1
1
Max
st 1 for j 1J
0
R
r rkr
Iu v
i iki
R
r rjr
I
i iji
i r
u y
v x
u y
v x
v u
=
=
=
=
le =
ge
sum
sum
sum
sum (2)
where xij is the amount of input i to destination j yrj the amount of output r from destination j
ur the weight given to output r and vi the weight given to input i
The maximization problem in (2) can in principle have an infinite number of solutions
Charnes et al (1978) show that the above fractional programming problem has the following
equivalent linear programming formulation which avoids this problem
1
1 1
1
Max
st 0 for j = 1J
1
0 for r 1R
0 for i 1I
R
r rku v
r
I R
i ij r rji r
I
i iki
r
i
u y
v x u y
v x
u
v
=
= =
=
minus ge
=
ge =ge =
sum
sum sum
sum (3)
The dual specification of this linear programming model can be written as follows
1
1
Min
st for r 1R
0 for i 1I
0 for j 1J
k
J
j rj rkj
J
k ik j ijj
j
y y
x x
θ λθ
λ
θ λ
λ
=
=
ge =
minus ge =
ge =
sum
sum (4)
The destination j is efficient if θ = 1 where an asterisk to a variable denotes its optimal
solution If this condition is not satisfied the destination j is inefficient (θ gt 1)
The efficiency coefficient can be either output-oriented (as in (4)) or input-oriented If the
output-oriented coefficient is greater than 1 in (4) it is possible to increase all outputs keeping
the inputs constant Likewise if the input coefficient is smaller than 1 it is possible to reduce
7
the inputs keeping the outputs constant Besides the DEA model can be different in the
assumption on returns to scale (constant or variable) The above DEA model (2)-(4) assumes
a constant returns to scale (CRS) technology a VRS technology (variable returns to scale) can
be obtained adding to (2)-(4) the constraint 1
1J
jj
λ=
=sum (Banker et al 1984) The estimate of
technical efficiency of each unit (in our case tourist destination) in the output-oriented VRS DEA model ( VRS
jθ ) will be higher than or equal to that in an output-oriented CRS DEA model
( CRSjθ ) as the VRS DEA is more flexible than the CRS DEA The scale efficiency measure
for the jth tourist destination denoted by SEjθ can be derived from this relationship
CRSjSE
j VRSj
θθ
θ= (5)
If the sum of weights 1
1J
jj
λ=
gtsum decreasing returns to scale are prevailing if 1
1J
jj
λ=
ltsum
increasing returns to scale are prevailing (see Banker 1984)
DEA can be used to evaluate the distant functions for measuring the Malmquist
productivity index (MPI) introduced by Caves et al (1982) The Malmquist productivity is a
normative measure in the sense that it is measured by the ratio of distance functions
pertaining to some benchmark technology This index can be interpreted as follows
Given a set of units for different times the MPI allows to measure total productivity change over time As shown in Fig1 tf represents the efficiency frontier in period t and
1tf + the efficiency frontier in period 1t + ( )t t tJ x y and 1 1 1( )t t tJ x y+ + + represent the inputs-
outputs vector of a destination j at time t and 1t + respectively
ltltFigure 1 about heregtgt
To deploy this method for measuring the efficiency change from time t to 1t + the efficiency distance function 1( )t t tD x y+ is defined as the following linear programming
problem
1
1 1
1
1 1
1
1
( ) Min
st for r 1R
0 for i 1I
0 for j 1J
t t tk
Jt t tj rj rk
j
Jt t t
k ik j ijj
tj
D x y
y y
x x
θ λθ
λ
θ λ
λ
+
+ +
=
+ +
=
+
=
ge =
minus ge =
ge =
sum
sum (6)
1( )t t tD x y+ measures the efficiency of a destination j at the period 1t + with respect to
8
the efficiency frontier at period t Similarly 1 1( )t t tD x y+ + measures the efficiency of a
destination j at time t using the efficiency frontier at time 1t + as a reference set it may be
defined in the following way
1 1
1
1
1
1
( ) Min
st for r 1R
0 for i 1I
0 for j 1J
t t tk
Jt t tj rj rk
j
Jt t t
k ik j ijj
tj
D x y
y y
x x
θ λθ
λ
θ λ
λ
+ +
+
=
+
=
=
ge =
minus ge =
ge =
sum
sum (7)
Both 1 1( )t t tD x y+ + and 1( )t t tD x y+ are an output-oriented model with constant returns to
scale (ie a CCR model) as (2)-(4)
From the geometric meaning of a distance function (see Fig1) we know that
1 1 1 1
1 1 1
1
( )
( )
( )
( )
t t t t
t t t t
t t t t
t t t t
D x y AB AJ
D x y CD CJ
D x y CE CJ
D x y AJ AF
+ + + +
+ + +
+
==
==
(8)
The MPI allows us to compare for each observed unit the real production at period t (or
1t + ) with the potential production in period 1t + (or t ) In other words we can evaluate
two Malmquist indices because we have two different technologies viz the technology in
period t and in 1t + So the MPIs are calculated in the following way
1 1 1( ) ( ) ( ) ( )t t t t t t t t tMPI D x y D x y CJ CE AJ AB+ + += = (9)
and 1 1 1 1 1 1 1( ) ( ) ( ) ( )t t t t t t t t t tMPI D x y D x y CJ CD AJ CJ+ + + + + + += = (10)
Using the geometric mean of the alternative expression of tMPI and 1tMPI + we obtain
1 21 1 1 1 1
11 1 1 1
( ) ( ) ( )
( ) ( ) ( )
t t t t t t t t tt t
t t t t t t t t t
D x y D x y D x yMPI
D x y D x y D x y
+ + + + ++
+ + + +
=
(11)
1t tMPI + is now the Malmquist productivity index it is used to measure the total
efficiency change According to the Malmquist productivity index developed by Faumlre et al
(1992) the first term in (11) is merely the ratio of technical efficiencies of the observed input-
9
output set in the two periods considered It shows the contribution of technical efficiency
change The second term represents the contribution of technical change (for details see Ray
2004) An extension of MPI from constant to variable returns to scale was offered by Faumlre et
al (1994)
In Section 4 the DEA CRS and VRS results and the efficiency change obtained by the
Malmquist index will be presented and discussed But first we will introduce briefly our
study area and the variables used in our empirical analysis
3 The Study Area and Summary Characteristics of Variables
For our application we have used data for two tourist outputs and five inputs evaluated
on the basis of non-financial measures The analysis concerns 103 Italian regions for the years
1998 and 2001
Tourist output is evaluated here by two non-financial measures international and
national bed-nights According to the destination concept the empirical findings and the
availability of data the following inputs were chosen number of beds in hotels as well as in
complementary accommodations divided by population (BH and BCC) the regional state-
owned cultural patrimony and heritage (CPH) (number of museums monuments and
archaeological sites) standardized for population tourist school graduates divided by working
age population (TSG) and the labour units (ULAs) employed in the tourism sector divided by
the total regional ULA3
Table 1 gives a summary description of input and output variables and highlights that
there are no strong disparities in each of the inputs considered whereas the output shows a
greater variability These results indicate that the mean value of CPH is 16 monuments per
1000 inhabitant in Italian regions the mean TSG is about 09 as a share of working
population while ULA is about 27 The mean value for national tourist bed-nights over
time has increased from 42507 to 47567 while the mean of international tourist bed-nights
increases from 22228 to 26632 All these data have been deployed in our DEA and
Malmquist approach The findings will now be presented in Section 4
ltltTable 1 about heregtgt 3 Data on output has been obtained from ISTAT (National Statistics Institute) (1998a 2001a) while the data on inputs has been obtained from different sources number of beds in the hotels and in complementary accommodation from ISTAT (1998a 2001a) provincial state-owned cultural patrimony and heritage (number of museums monuments and archaeological areas) from the Ministry of Cultural Heritage tourist school graduates from the Ministry of Education and labour units (ULA) employed in the tourism sector from ISTAT (1998 b 2001b) Because the statistics from the Ministry of Cultural Heritage do not provide the data of regions and provinces with special statute status (Sicily Aosta Trento and Bolzano) for these data we have used as a proxy for cultural heritage the region and province-owned cultural heritage (museums monuments and archaeological areas) supplied by the Regional and Provincial Bureaus of Cultural Heritage Finally ULA includes the following economic sectors commerce repairs hotels restaurants transport and communication If the indirect impact of tourism on commerce and repairs is considered any error with this variable may be neglected
10
4 Results and Discussion
Both our CRS and VRS models are estimated for the same Italian regions using the same
output and input variables The frequency distribution of efficiency scores and their summary
statistics are presented in Tables 2 and 3
ltltTables 2 and 3 about heregtgt
In the year 1998 the means of technical efficiency scores estimated by the CRS and VRS
approaches appear to be 077 and 084 respectively In the year 2001 the mean technical
scores are lower than or equal to 076 and 084 respectively For both years the high values
of the coefficient of variation highlight a great variability of efficiency among regions In fact
in 1998 the efficiency scores range from 032 to 1 for both the CRS and VRS technology In
2001 the efficiency varies between 024 and 1 (see Table 3)
In the years 1998 and 2001 the scale efficiency index estimated using (5) presents a
mean value equal to 093 and 091 respectively The share of regions with a full scale
efficiency (equal to 100) decreases from 3398 to 3107
With regard to the CRS model the comparison between the two years shows that the
percentage of full efficient destinations decreases from 3107 to 2816 the same
observation can be made with respect to the VRS model (5340 and 4951 for 1998 and
2001 respectively)
These results are confirmed by the Malmquist analysis We computed the Malmquist
index based on the CRS technology because by using this model the estimation problem has
always a feasible solution (Ray 2004) The Malmquist results are presented in Table 4
The frequency distribution of the Malmquist model shows there were only 10 regions
(97) with an efficiency change greater than 1 This means that over the 5 years the tourism
strategies in these tourist sites have been effective in order to improve their attractiveness or
competitiveness against their competitors The cluster of areas that improved their
productivity is mainly composed by regions with a business orientation (ie Milan
Pordenone Prato)
ltltTable 4 about heregtgt
11
It is noteworthy that the greater part of regions (93) ndash with a prevalent coastal and
cultural image ndash possesses a Malmquist index less than 1 This means that the productivity of
these tourist areas has been decreasing over the time Regarding the inefficiency of numerous
regions several hypotheses can be envisaged for the inefficient use of the inputs with a view
to enhancing the production potential for a maximum possible output
A more thorough analysis showed that the inefficiency of many Italian provinces may be
caused by an imbalance between inputs and outputs In particular for many traditional tourist
destinations this striking result can be interpreted as an under-utilisation of their productive
capability in relation to their tourist resources due to an inability to manage resources (or as
an expression of the phase of maturity of the tourist life cycle of the Italian product) This
may be caused by various deficiencies Destination management organizations (DMOs) do
perhaps not know which is the phase of their tourist destination life-cycle (eg growth
maturity and etc) and may thus be unable to adopt the correct strategy Moreover
uncontrollable factors or unexpected events can be causes of technical inefficiency (eg the
Twin Towers dramatic event on September 11 2001)
5 Conclusions
The aim of this paper has been to explore the tourist competitiveness of Italian regions
for the years 1998 and 2001 and their change over these years The performance of these
regions has been evaluated through the assessment of their efficiency Tourist sites are
considered like traditional tourist profit units (eg hotels restaurants etc) That is they
manage the proper inputs (eg artistic and cultural labour units) in order to reach more
outputs (ie national and international tourist bed-nights) In particular we have analyzed
one of the five elements that characterize the competitive advantage of tourist destinations
ie their efficient resource management
For our purpose DEA models were applied in order to evaluate the tourist efficiency or
competitiveness of different regions in Italy For both years 1998 and 2001 with respectively
constant and variable returns to scale models (CRS and VRS models) the empirical analysis
showed that the number of fully efficient regions has decreased even though slightly
In summary a cluster of efficient regions is able to maintain its position over the years
This result is supported by the Malmquist index which showed that only 10 regions have
improved their productivity In other words the Italian regions do not show a significant
change in efficiency over the years considered This means that because the tourist inputs
vary slowly over time regional tourist managers should increase the production of tourist
output (bed-nights) in order to improve the territorial efficiency This has not occurred in the
period analyzed and we may thus hypothesize that there has been the lack of strategic and
planning action from public agencies in Italy to improve the attractiveness of tourist sites
12
The general conclusion following from the inefficiency of the majority of Italian regions
is that local destination management organizations must work hard in order to improve the
tourist performance of Italian destinations by focusing more attention on the balance
inputsoutputs They must also give due attention to promoting the territorial (or regional)
tourist brands to supporting the development of ldquolocal tourist districtsrdquo and to addressing
financial resources in tourist infrastructures
References
Alavi J Yasin MM (2000) A Systematic Approach to Tourism Policy Journal of Business Research 48(2) 147ndash156
Anderson RI Fish M Xia Y Michello F (1999a) Measuring Efficiency in the Hotel Industry A Stochastic Frontier Approach International Journal of Hospitality Management 18(1) 45ndash57
Anderson RI Lewis D Parker ME (1999b) Another Look at the Efficiency of Corporate Travel Management Departments Journal of Travel Reasearch 37(3) 267ndash272
Baker M Riley M (1994) New Perspectives on Productivity in Hotels some Advances and New Directions International Journal of Hospitality Management 13(4) 297ndash311
Banker RD Charnes A Cooper WW (1984) Some Models of Estimating Technical and Scale Inefficiencies in Data Envelopment Analysis Management Science 9(9) 1078ndash1092
Barros CP (2004) A Sthocastic Cost Frontier in the Portuguese Hotel Industry Tourism Economics 10 177ndash192
Barros CP (2005) Measuring Efficiency in the Hotel Sector Annals of Tourism Research 32(2) 456ndash477
Barros CP Mascarenhas MJ (2005) Technical and Allocative Efficiency in Chain of Small Hotels International Journal of Hospitality Management 24 415ndash436
Battese GE (1992) Frontier Production Functions and Technical Efficiency A Survey of Empirical Applications in Agricultural Economics Agricultural Economics 7 185ndash208
Bauer PW (1990) Recent Developments in the Econometrics estimation of Frontiers Journal of Econometrics 46 39ndash56
Bell J Morey RC (1995) Increasing the Efficiency of Corporate Travel Management through Macro-benchmarking Journal of Travel Research 33(3) 11ndash20
Bjurek H Hjalmarsson L Foslashrsund FR (1990) Deterministic Parametric and Nonparametric estimation in Service Production Journal of Econometrics 46 213ndash227
Bravo-Ureta BE Pinheiro AE (1993) Efficiency Analysis of Developing Country Agriculture A Review of Frontier Function Agricultural and Resource Economics Review 22 88ndash101
Buhalis D (2000) Marketing the Competitive Destination of the Future Tourism Management 21 97ndash116
Butler RW (1999) The Concept of Tourism Capacity in Cooper CP and Wanhill S (eds) Tourism Development Wiley New York pp11-21
Caves DW Christensen LR Diewert WE (1982) The Economic Theory of Index Numbers and the Measurement of Input Output and Productivity Econometrica 50(6) 1393ndash1414
Charnes A Cooper WW Rhodes E (1978) Measuring the Efficiency of Decision Making Units European Journal of Operational Research 2(6) 429ndash444
13
Charnes A Cooper WW Li S (1989) Using Data Envelopment Analysis to Evaluate Efficiency in the Economic Performance of Chinese Cities SociondashEconomic Planning Sciences 23(6) 325ndash344
Coelli TJ (1995) Recent Developments in Frontier Modeling and Efficiency Measurement Australian Journal of Agricultural Economics 39 219ndash245
Chon KS Weaver PA Kim CY (1991) Marketing your Community Image Analysis in Norfolk The Cornell Hotel and Restaurant Administration Quarterly 31(4) 24ndash27
Cracolici MF (2004) Tourist Performance Evaluation a Novel Approach Atti XLII Riunione Scientifica della Societagrave Italiana di Statistica June 2004 Bari
Cracolici MF (2005) La Competitivitagrave tra Destinazioni Turistiche UnrsquoAnalisi di Destination Benchmarking PhD Dissertation Faculty of Economics University of Palermo Italy
Cracolici MF Nijkamp P (2006) Competition among Tourist Destination An Application of Data Envelopment Analysis to Italian Provinces in Giaoutzi M and Nijkamp P (eds) Tourism and Regional Development New Pathways Ashgate Aldershot UK
Crouch GI Ritchie JRB (1999) Tourism Competitiveness and Societal Prosperity Journal of Business Research 44 137ndash152
Cuffaro M Vassallo E (2002) Sviluppo Economico e Sviluppo Umano una Nota sulla Classificazione ONU di Alcuni Paesi Scritti di Statistica Economica 10
Dwyer L Forsyth P Rao P (2000) The Price Competitiveness of Travel and Tourism A Comparison of 19 Destinations Tourism Management 21(1) 9ndash22
Enright MJ Newton J (2004) Tourism Destination Competitiveness A Quantitative Approach Tourism Management 25(XX) 777ndash788
Faumlre R Grosskopf S Lindgren B Roos P (1992) Productivity Changes in Swedish Pharmacies 1980ndash1989 A Non-prametric Malmquist Approach The Journal of Productivity Analysis 3(1) 85ndash101
Faumlre R Grosskopf MN Zhang Z (1994) Productivity Growth Technical Progress and Efficiency Change in Industrialized Countries Reply American Economic Review 84 66ndash83
Farrell M J (1957) The Measurement of Productive Efficiency Journal of the Royal Statistical Society 120 211ndash281
FayosndashSola E (1996) Tourism Policy A Midsummer Nightrsquos Dream Tourism Management 17(6) 405ndash12
Foslashrsund FR Lovell CAK Schmidt P (1980) A Survey of Frontier Production Functions and of Their relationship to Efficiency Measurement Journal of Econometrics 13 5ndash25
Fried HO Lovell CAK Schmidt SS (eds) (1993) The Measurement of Productive Efficiency Techniques and Applications Oxford University Press New York
Giaoutzi M and Nijkamp P (eds) (2006) Tourism and regional Development Ashgate Aldershot UK
Giaoutzi M and Nijkamp P (eds) (1993) Decision Support Models for Regional Sustainable Development Ashgate Aldershot UK
Hu YZ Ritchie JRB (1993) Measuring Destination Attractiveness A Contextual Approach Journal of Travel Research 32(2) 25ndash35
Hwang S Chang T (2003) Using Data Envelopment Analysis to Measure Hotel Managerial Efficiency Change in Taiwan Tourism Management 24 357ndash369
ISTAT (1998a) Statistiche del Turismo ISTAT Roma ISTAT (1998b) Dati di Contabilitagrave Nazionale ISTAT Roma ISTAT (2001a) Statistiche del Turismo ISTAT Roma ISTAT (2001b) Dati di Contabilitagrave Nazionale ISTAT Roma
14
Kozak M Rimmington M (1999) Measuring Tourist Destination Competitiveness Conceptual Considerations and Empirical Findings Hospitality Management 18(3) 273ndash283
Kozak M (2002) Destination Benchmarking Annals of Tourism Research 29(2) 497ndash519 Macmillan WD (1986) The Estimation and Applications of Multindashregional Economic
Planning Models Using Data Envelopment Analysis Papers of the Regional Science Association 60 41ndash57
Martić M Savić G (2001) An Application of DEA for Comparative Analysis and Ranking of Regions in Serbia with Regard to SocialndashEconomic Development European Journal of Operational Research 132 343ndash356
Morey RC Dittman DA (1995) Evaluating a Hotel GMrsquos Performance A case Study in Benchmarking Cornell Hotel Restaurant and Administration Quarterly 36(5) 30ndash35
Murphy P Pritchard M P Smith B (2000) The Destination Product and its Impact on Traveller Perceptions Tourism Management 21 43-52
Pearce DG (1997) Competitiveness Destination Analysis in Southeast Asia Journal of Travel Research 35(4) 16ndash25
Poon A (1993) Tourism Technology and Competitive Strategies CAB Oxford Poon A (2002) Competitive Strategies for a ldquoNew Tourismrdquo in Cooper C (eds) Aspect of
Tourism Channell View Publ Clenadon pp 130ndash142 Porter ME (1990) The Competitive Advantage of Nations The Free Press New York Ray SC (2004) Data Envelopment Analysis Theory and Techniques for Economics and
Operations Research Cambridge University Press Cambridge UK Reynolds D (2003) Hospitality-productivity Assessment Using Data-envelopment Analysis
Cornell Hotel Restaurant and Administration Quarterly 44(2) 130ndash137 Ritchie JRB Crouch GI (2000) The Competitive Destination A Sustainability
Perspective Tourism Management 21 1ndash7 Ritchie JRB Crouch GI (2001) Developing Operational Measures for the Components of
a Destination CompetitivenessSustainability Model Consumer versus Managerial Perspectives in Mazanec JA (eds) Consumer Psychology of Tourism Hospitality and Leisure CABI Wallingford 1ndash17
Seiford LM Thrall RM (1990) Recent Developments in DEA The Mathematical Programming Approach to Frontier Analysis Journal of Econometrics 46 7ndash38
Susiluoto I Loikaanen H (2001) The Economic Efficiency of Finnish Regions 1988ndash1999 An Application of the DEA Method 41st Congress of the European Regional Science Association 29 August-1 September 2001 Zagreb Croatia
Swarbrooke J Honner S (2001) Consumer Behaviour in Tourism Butterworth-Heinemann Oxford
Uysel M (1998) The Determinants of Tourism Demand in Ioannides D and Debbage KG eds) The Geography of the Tourist Industry Rutledge London pp75ndash97
Wall G Mathieson A (2006) Tourism Change Impacts and Opportunities PearsonPrentice amp Hall Harlow UK
15
Table 1 Characteristics of the input and output variables (1998 and 2001)
Variables Mean SD
InputBH 40373 62397
BCC 44470 51810CPH 00016 00052TSG 00950 00513ULA 266058 48435
OutputBN 4250783 5848067BI 2222886 4352840
InputBH 42951 65181
BCC 52469 68086CPH 00016 00052TSG 00949 00509ULA 269824 47095
OutputBN 4756755 6337207BI 2663281 4737531
1998
2001
16
Table 2 Frequency distribution of technical and scale efficiency estimates from the DEA models (1998 and 2001)
No of Regions
of Regions
No of Regions
of Regions
No of Regions
of Regions
No of Regions
of Regions
No of Regions
of Regions
No of Regions
of Regions
1-48 11 1068 13 1262 5 485 8 777 1 097 0 00048-50 0 000 3 291 2 194 1 097 0 000 1 09750-52 2 194 1 097 0 000 1 097 1 097 0 00052-54 2 194 1 097 0 000 2 194 0 000 0 00054-56 1 097 0 000 2 194 1 097 0 000 0 00056-58 1 097 4 388 0 000 0 000 0 000 1 09758-60 1 097 5 485 2 194 1 097 0 000 2 19460-62 7 680 2 194 3 291 1 097 2 194 2 19462-64 3 291 3 291 1 097 4 388 0 000 0 00064-66 5 485 4 388 2 194 4 388 2 194 1 09766-68 4 388 2 194 1 097 3 291 2 194 3 29168-70 3 291 4 388 3 291 2 194 0 000 4 38870-72 3 291 2 194 4 388 2 194 3 291 0 00072-74 4 388 2 194 1 097 2 194 1 097 0 00074-76 3 291 3 291 2 194 2 194 2 194 1 09776-78 2 194 2 194 3 291 0 000 0 000 0 00078-80 1 097 1 097 3 291 1 097 2 194 3 29180-82 2 194 2 194 2 194 2 194 2 194 2 19482-84 2 194 4 388 3 291 2 194 0 000 2 19484-86 2 194 1 097 0 000 1 097 2 194 0 00086-88 3 291 3 291 0 000 1 097 0 000 2 19488-90 2 194 2 194 1 097 3 291 2 194 2 19490-92 1 097 2 194 2 194 3 291 4 388 6 58392-94 3 291 4 388 0 000 1 097 4 388 8 77794-96 1 097 1 097 0 000 1 097 5 485 7 68096-98 1 097 2 194 3 291 1 097 11 1068 7 68098-100 33 3204 30 2913 58 5631 53 5146 57 5534 49 4757
103 10000 103 10000 103 10000 103 10000 103 10000 103 10000100 32 3107 29 2816 55 5340 51 4951 35 3398 32 3107
Efficiency Score
CRS VRS SE1998 2001 1998 2001 1998 2001
17
Table 3 Summary statistics of efficiency estimates from DEA models
1998 2001 1998 2001 1998 2001Mean 0777 0762 0845 0837 0927 0914Minimun 0319 0237 0323 0237 0419 0486Maximun 1000 1000 1000 1000 1000 1000Variance 0041 0049 0040 0045 0015 0016Coefficient of Variation 16412 15717 16784 17063 38492 32412
Efficiency ScoreCRS VRS SE
18
Table 4 Frequency distribution of efficiency change from 1998 to 2001
No of Regions
of RegionsNo of
Regions of Regions
No of Regions
of RegionsNo of
Regions of Regions
No of Regions
of Regions
1-110 39 3786 38 3689 41 3981 28 2718 068075 2 194110-120 7 680 9 874 11 1068 12 1165 075-078 1 097120-130 7 680 7 680 7 680 4 388 078080 1 097130-140 9 874 5 485 8 777 8 777 080-082 2 1941-40-150 6 583 8 777 10 971 6 583 082-084 1 097150-160 10 971 6 583 5 485 7 680 084-086 6 583160-170 8 777 7 680 3 291 9 874 086-088 2 194170-180 1 097 5 485 5 485 7 680 088-090 7 680180-190 2 194 1 097 2 194 3 291 090-092 13 1262190-200 3 291 1 097 1 097 2 194 092-094 8 777200-210 2 194 6 583 3 291 5 485 094-096 13 1262210-220 3 291 1 097 0 000 0 000 096-098 17 1650220-230 1 097 1 097 0 000 3 291 098-100 20 1942230-240 0 000 0 000 1 097 2 194 100-102 5 485240-250 0 000 2 194 0 000 0 000 102-104 5 485250-260 0 000 0 000 1 097 1 097260-270 3 291 0 000 0 000 1 097270-280 1 097 0 000 1 097 1 097280-290 0 000 2 194 0 000 1 097290-300 0 000 0 000 1 097 1 097300-310 1 097 0 000 0 000 0 000310-320 0 000 4 388 3 291 2 194
gt320 0 000 0 000 0 000 0 000
103 10000 103 10000 103 10000 103 10000 103 100001 37 3592 29 2816 28 2718 37 3592 gt1 10 0097
D2001 (1998)Malmquist Index
Efficiency distancevalue
D1998 (1998) D2001 (2001) D1998 (2001)
19
YD f t+1
F
Yt+1 Jt+1 (X t+1 Yt+1 )
f t
E
Yt Jt (X t Yt )
A C X
B
Dt+1(xt+1 yt+1)Yt+1
Dt(xt+1 yt+1)Yt
Fig 1 The output based measurement of efficiency change
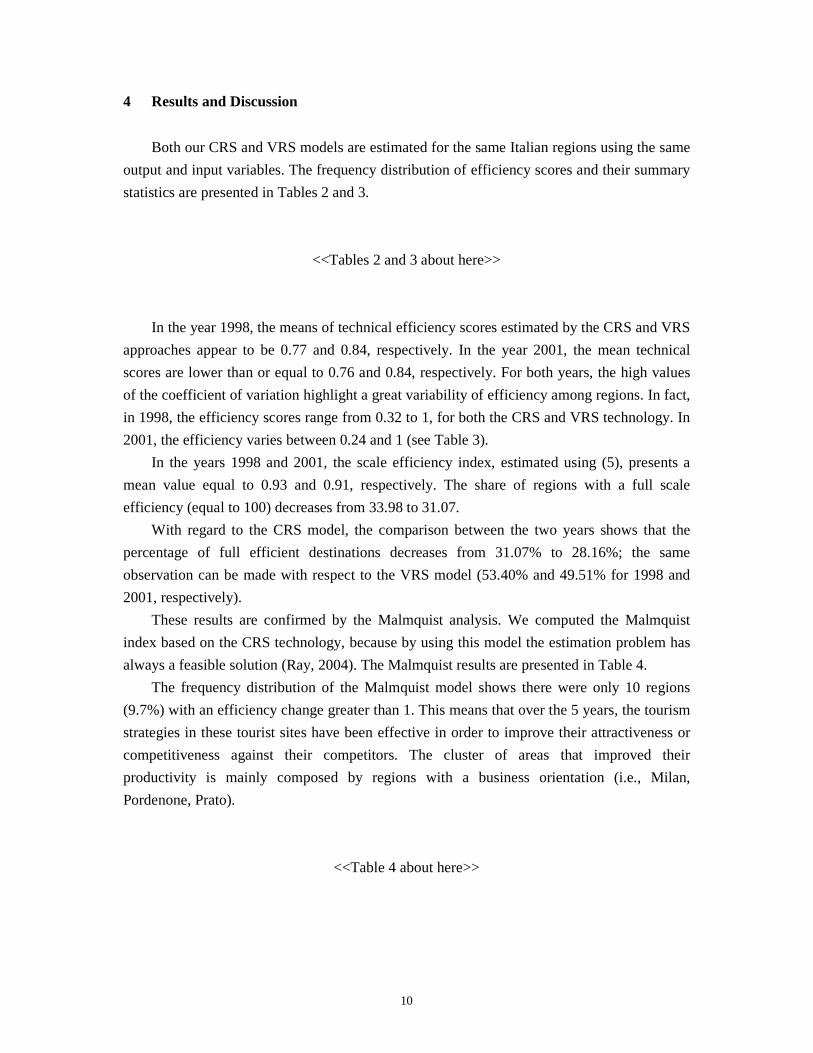
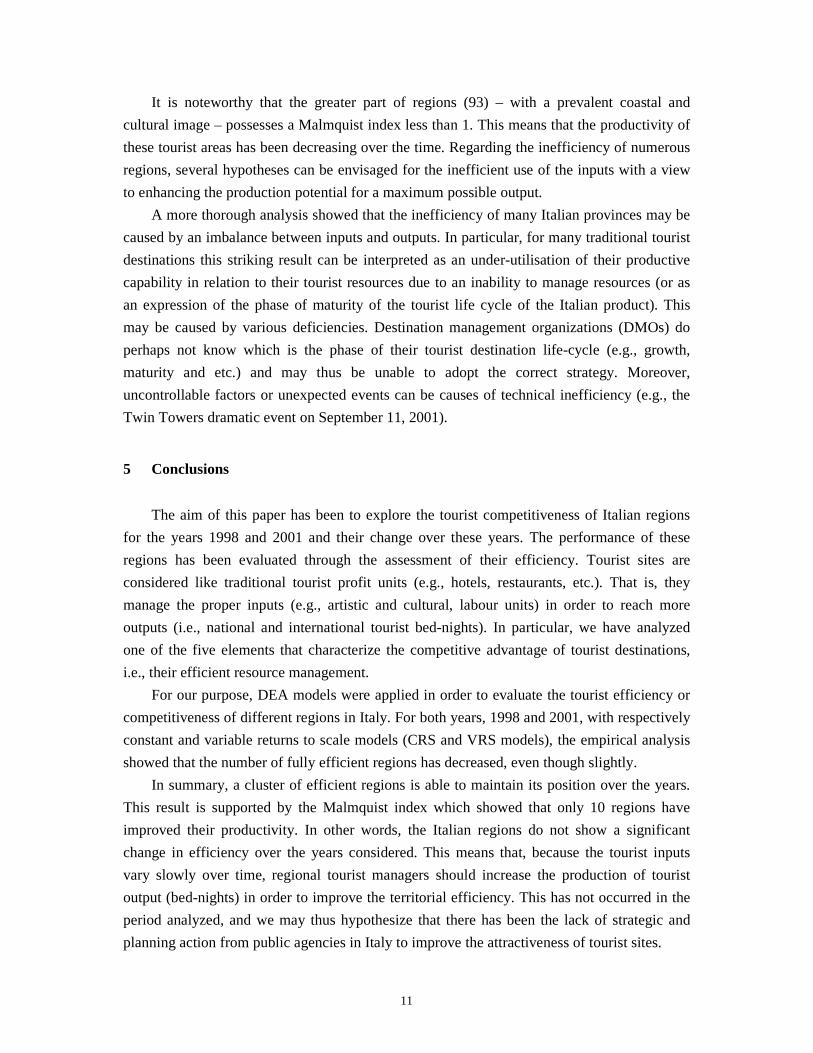
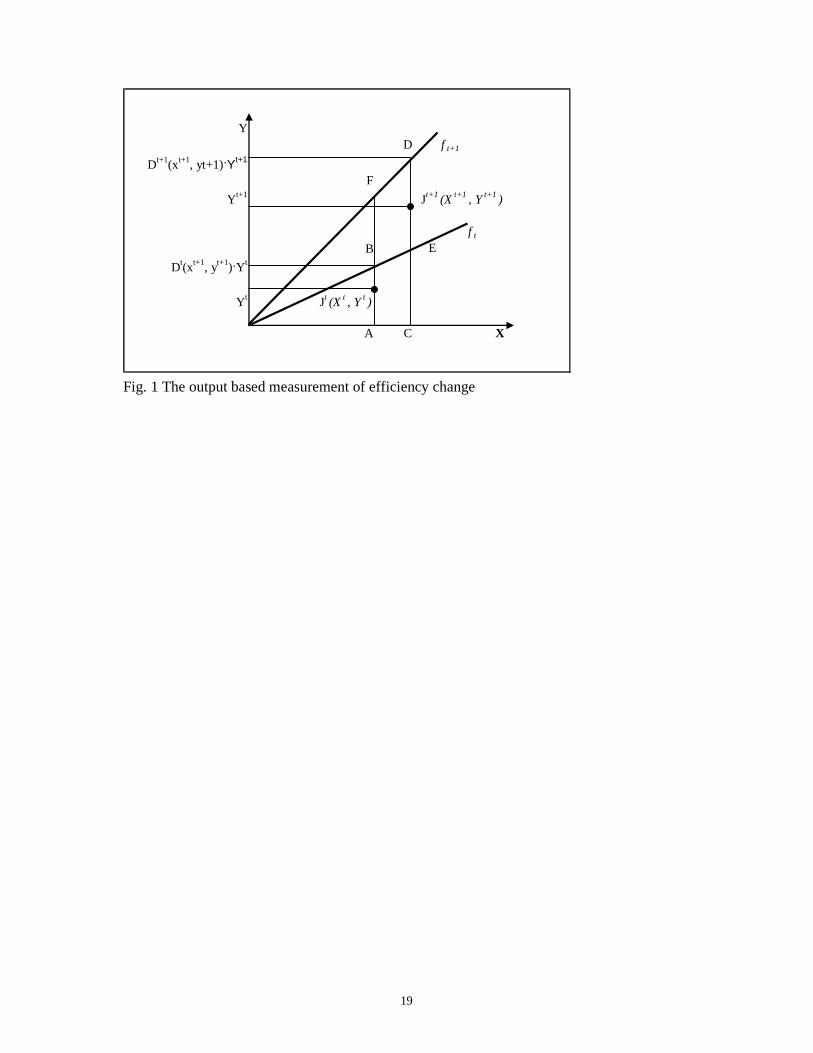
19
YD f t+1
F
Yt+1 Jt+1 (X t+1 Yt+1 )
f t
E
Yt Jt (X t Yt )
A C X
B
Dt+1(xt+1 yt+1)Yt+1
Dt(xt+1 yt+1)Yt
Fig 1 The output based measurement of efficiency change
Copyright © 2022 FDOKUMEN