
Construction prequalification using data envelopment analysis
11
Construction prequalification using data envelopment analysis Brenda McCabe, Viet Tran, and Joseph Ramani Abstract: Contractor prequalification is essential in most construction projects, and the process has been performed by many different methods in practice. Data envelopment analysis (DEA) had been recognized as a useful technique to prequalify contractors by assigning relative efficiency scores. Data envelopment analysis, however, usually requires a large amount of data and has not been fully developed to achieve reliable results. An enhanced contractor prequalifica- tion model using DEA was developed together with a methodology for determining a “practical frontier” of best con- tractors. The established practical frontier can be used as a regional performance standard for the owner in prequalification and as improvement guidelines for contractors. Key words: contractor prequalification, construction engineering, data envelopment analysis, practical frontier. Résumé : La préqualification des entrepreneurs est essentielle dans la plupart des projets de construction et, en pra- tique, ce processus a été effectué par plusieurs différentes méthodes. La méthode d’enveloppe des données (« Data Envelopment Analysis - DEA ») a été reconnue en tant que technique utile pour préqualifier les entrepreneurs en assi- gnant des scores relatifs d’efficacité. Toutefois, la DEA demande habituellement beaucoup de données et elle n’a pas été pleinement développée pour atteindre des résultats fiables. Un modèle amélioré de préqualification des entrepre- neurs, utilisant la DEA, a été développé de concert avec une méthodologie pour déterminer une « limite pratique » des meilleurs entrepreneurs. La limite pratique établie peut ensuite être utilisée comme norme de performance régionale lors de la préqualification et comme ligne directrice d’amélioration pour les entrepreneurs. Mots clés : préqualification des entrepreneurs, génie de la construction, méthode d’enveloppe des données (« Data Envelopment Analysis »), limite pratique. [Traduit par la Rédaction] McCabe et al. 193 Introduction Prequalification is a screening process applied to contrac- tors before tendering to reduce the risk of project failure. Most prequalification models use some form of a weighted scoring system where the contractors are scored according to weighted criteria that are finally summed to produce a single value. The problems inherent in this decision-making proce- dure are the biases and additive assumptions introduced in the development of the weights and the evaluation process. The authors considered that prequalification is similar to benchmarking in that the objective of the process is to iden- tify the best performers and the distance between the re- maining contractors and those best performers. The three ob- jectives of this research were (1) to establish an improved contractor prequalification model using data envelopment analysis (DEA) (2) to develop an adaptation of the P-DEA framework for the construction situation (3) to define a procedure that can be used to identify the practical frontier of contractors This paper develops and demonstrates the evaluation method called data envelopment analysis (typically used for benchmarking) to discriminate between contractors in the prequalification process. Data envelopment analysis is a nonparametric linear programming framework that produces a single measure of efficiency for each unit relative to its peers. Advancements in DEA processes are tested and com- pared, including a final modification of our own. All prequalification systems have the same basic steps (Russell and Skibniewski 1988): develop the criteria, gather contractor data, verify data, apply contractor data to criteria, and decide whether to prequalify the contractor. Most of the companies and public agencies that perform prequalification have their own model, and the continued interest in the prequalification process by industry is reflected in the array of systems that have been developed through research. The existing prequalification models employ frameworks that vary from simple weighted scoring systems to complex mathe- matical formulations. QUALIFIER-1 (Russell and Skibniewski 1990) employs a dimensional weighting procedure that produces aggregate Can. J. Civ. Eng. 32: 183–193 (2005) doi: 10.1139/L04-073 © 2005 NRC Canada 183 Received 7 April 2004. Revision accepted 26 July 2004. Published on the NRC Research Press Web site at http://cjce.nrc.ca on 16 February 2005. B. McCabe, 1 V. Tran, 2 and J. Ramani. 3 Department of Civil Engineering, University of Toronto, Toronto, ON M5S 1A4, Canada. Written discussion of this article is welcomed and will be received by the Editor until 30 June 2005. 1 Corresponding author (e-mail: [email protected]). 2 Present address: 1351 Lansdowne Ave., Toronto, ON M6H 3Z9, Canada. 3 Present address: Ontario Power Generation. P.O. Box 160 P72-3, Pickering, ON L1W 4A7, Canada.
-
Upload
independent -
Category
Documents
-
view
3 -
download
0
Transcript of Construction prequalification using data envelopment analysis

Construction prequalification using dataenvelopment analysis
Brenda McCabe, Viet Tran, and Joseph Ramani
Abstract: Contractor prequalification is essential in most construction projects, and the process has been performed bymany different methods in practice. Data envelopment analysis (DEA) had been recognized as a useful technique toprequalify contractors by assigning relative efficiency scores. Data envelopment analysis, however, usually requires alarge amount of data and has not been fully developed to achieve reliable results. An enhanced contractor prequalifica-tion model using DEA was developed together with a methodology for determining a “practical frontier” of best con-tractors. The established practical frontier can be used as a regional performance standard for the owner inprequalification and as improvement guidelines for contractors.
Key words: contractor prequalification, construction engineering, data envelopment analysis, practical frontier.
Résumé : La préqualification des entrepreneurs est essentielle dans la plupart des projets de construction et, en pra-tique, ce processus a été effectué par plusieurs différentes méthodes. La méthode d’enveloppe des données (« DataEnvelopment Analysis - DEA ») a été reconnue en tant que technique utile pour préqualifier les entrepreneurs en assi-gnant des scores relatifs d’efficacité. Toutefois, la DEA demande habituellement beaucoup de données et elle n’a pasété pleinement développée pour atteindre des résultats fiables. Un modèle amélioré de préqualification des entrepre-neurs, utilisant la DEA, a été développé de concert avec une méthodologie pour déterminer une « limite pratique » desmeilleurs entrepreneurs. La limite pratique établie peut ensuite être utilisée comme norme de performance régionalelors de la préqualification et comme ligne directrice d’amélioration pour les entrepreneurs.
Mots clés : préqualification des entrepreneurs, génie de la construction, méthode d’enveloppe des données (« DataEnvelopment Analysis »), limite pratique.
[Traduit par la Rédaction] McCabe et al. 193
Introduction
Prequalification is a screening process applied to contrac-tors before tendering to reduce the risk of project failure.Most prequalification models use some form of a weightedscoring system where the contractors are scored according toweighted criteria that are finally summed to produce a singlevalue. The problems inherent in this decision-making proce-dure are the biases and additive assumptions introduced inthe development of the weights and the evaluation process.
The authors considered that prequalification is similar tobenchmarking in that the objective of the process is to iden-tify the best performers and the distance between the re-
maining contractors and those best performers. The three ob-jectives of this research were(1) to establish an improved contractor prequalification
model using data envelopment analysis (DEA)(2) to develop an adaptation of the P-DEA framework for
the construction situation(3) to define a procedure that can be used to identify the
practical frontier of contractorsThis paper develops and demonstrates the evaluation
method called data envelopment analysis (typically used forbenchmarking) to discriminate between contractors in theprequalification process. Data envelopment analysis is anonparametric linear programming framework that producesa single measure of efficiency for each unit relative to itspeers. Advancements in DEA processes are tested and com-pared, including a final modification of our own.
All prequalification systems have the same basic steps(Russell and Skibniewski 1988): develop the criteria, gathercontractor data, verify data, apply contractor data to criteria,and decide whether to prequalify the contractor. Most of thecompanies and public agencies that perform prequalificationhave their own model, and the continued interest in theprequalification process by industry is reflected in the arrayof systems that have been developed through research. Theexisting prequalification models employ frameworks that varyfrom simple weighted scoring systems to complex mathe-matical formulations.
QUALIFIER-1 (Russell and Skibniewski 1990) employs adimensional weighting procedure that produces aggregate
Can. J. Civ. Eng. 32: 183–193 (2005) doi: 10.1139/L04-073 © 2005 NRC Canada
183
Received 7 April 2004. Revision accepted 26 July 2004.Published on the NRC Research Press Web site athttp://cjce.nrc.ca on 16 February 2005.
B. McCabe,1 V. Tran,2 and J. Ramani.3 Department ofCivil Engineering, University of Toronto, Toronto, ON M5S1A4, Canada.
Written discussion of this article is welcomed and will bereceived by the Editor until 30 June 2005.
1Corresponding author (e-mail: [email protected]).2Present address: 1351 Lansdowne Ave., Toronto, ONM6H 3Z9, Canada.
3Present address: Ontario Power Generation. P.O. Box 160P72-3, Pickering, ON L1W 4A7, Canada.

weighted ratings of candidate contractors based on data ob-tained from questionnaires. Equation [1] presents the linearformulation used in the model, and best represents modelsused most commonly in industry.
[1] ARk ii
n
ij ijkj
m
W w Ri
=⎡
⎣⎢⎢
⎤
⎦⎥⎥= =
∑ ∑1 1
( )( )
i n j mi= =1, 1,� �, ,
where ARk is the aggregate weighted rating of candidatecontractor k; n is the number of composite decision factors(CDF); Wi is the weight of CDF i (ranges from 0 to 1.0, sumof all Wi = 1); m is the number of decision factors (DF) de-scribing the CDF; wij is the weight of the DF j, describingCDF i (ranges from 0 to 1.0, sum of all wij = 1); Rijk is therating of DF j describing CDF i (ranges from 1 to 10) forcandidate contractor k.
Russell et al. (1990) developed QUALIFIER-2 shortly af-terward adding a knowledge-based expert system and athree-stage decision hierarchy where contractors must meeteach level of the decision criteria to proceed. This ensuredthat high scores in one, perhaps less important area, did nothide a low score in another category.
AbouRizk and Chehayeb (1995) developed the hypertextdecision support prequalification (HDSP) model primarily tohelp decision makers assign weights for the different crite-ria. Using multi-attribute decision making (MADM), factorsare compared two at a time rather than attempting to giveimportance weights to a larger number of factors at once.The system of pair-wise comparisons is solved using eigen-vectors. In Gong’s (1999) contractor prequalification pro-cess, a three-stage model combines the hierarchical frameworkof QUALIFIER-2 and the MADM of the HDSP model.
Several systems not based on weighted scores have beendeveloped. Fuzzy set theory was applied in conjunction withMonte Carlo simulation to enhance the contractor evaluationprocess (Elton et al. 1994). A utility model for comparingfuzzy numbers developed by Juang et al. (1987) was used,resulting in a contractor prequalification ranking index rangingfrom 0 to 1; the higher the index, the greater the perceivedcapability of the contractor. The primary disadvantages ofthe model are the number of parameters required and thecomplexity of the framework. Cluster analysis was used togroup the contractors with similar attributes (Holt 1996) andthe best subset would be invited to tender. Hanna et al.(1997) developed a system based on neural networks. Themajor disadvantage of neural networks is the requirement fora large amount of data, which may be difficult in this con-text because of the reluctance of many contractors to providedata and the generally small set of contractors prequalifyingfor any single project.
Prequalification criteria vary from model to model and areusually specific to the project; however, the most commoncriteria appear in most models in some form. Table 1 showscriteria used in eight different models listed from the mostcommon to the least common, where 1 is public owner’sprojects, QUALIFIER-1 (Russell and Skibniewski 1990); 2is private owner’s projects, QUALIFIER-1 (Russell andSkibniewski 1990); 3 is artificial neural network model(Hanna et al. 1997); 4 is fuzzy sets model (Elton et al.
1997); 5 is Canada (CCDC-11 1996); 6 is Saudi Arabia andUnited Kingdom (Bubshait and Al-Gobali 1996); 7 is Japan(Paulson and Aki 1980); and 8 is Australia (Liston 1994).
Data envelopment analysis
Throughout this paper and consistent with DEA terminol-ogy, the term “decision-making unit” or “DMU” will refer tothe individuals in the evaluation group. In the context of thisapplication, it will refer specifically to contractors.
In parametric analysis, the objective is to optimize a singleregression plane through the data; a single optimized regres-sion equation is assumed to represent the group. Data envel-opment analysis, on the other hand, generates a surface calledthe frontier that follows the peak performers and envelopsthe remainder (Charnes et al. 1994). Figure 1 illustrates theconcepts of the empirical and theoretical production fron-tiers in a two-dimensional surface to generalize the case of amulti-dimensional surface.
The theoretical frontier represents the absolute maximumpossible production that a DMU can achieve in any level ofinputs; however, theoretical relationships between input andoutput parameters to a system are generally difficult to iden-tify and to express mathematically. For this reason, the theo-retical frontier is usually unknown. The relative or empiricalfrontier, which is based upon real DMU is therefore used.The empirical frontier connects all the “relatively best”DMUs in the observed population. Note that if the perfor-mance of all of the observed DMUs is generally poor, thenyour empirical frontier only gives you the best of a bad lot!The theoretical frontier would clearly indicate that the poorDMUs were indeed poor.
Two efficiency values can be defined for DMUX in Fig. 1:absolute efficiency, A/C; and relative efficiency, A/B. TheDMUs that lie on the empirical frontier have a relative effi-ciency score of 1.0. Those that lie under this frontier aredeemed inefficient and have an efficiency score other than1.0.
The four basic DEA models are the Charnes CooperRhodes (CCR) model, the Banker Charnes Cooper (BCC)model, the multiplicative model, and the additive model.Only the CCR and BCC will be discussed here. These mod-els can be distinguished by the envelopment surface and theorientation. As shown in Fig. 2, the envelopment surface cantake the form of constant-return-to-scale (CRS) or variable-return-to-scale (VRS) as evaluated in the CCR model andthe BCC model, respectively. The CRS surface is repre-sented by a straight line that starts at the origin and passesthrough the first DMU that it meets as it approaches the ob-served population. The models with CRS envelopment sur-face assume that an increase in inputs will result in aproportional increase in outputs.
The VRS surface envelops the population by connectingthe outermost DMUs, including the one approached by theCRS surface. The VRS model allows an increase in inputvalues to result in a non-proportional increase of outputlevels — increasing returns to scale (IRS) occur below thepoint where CRS and VRS meet, and decreasing returns toscale (DRS) above.
The other essential characteristic of DEA models is orien-tation, which indicates the direction an inefficient DMU ap-
© 2005 NRC Canada
184 Can. J. Civ. Eng. Vol. 32, 2005

proaches the efficient frontier: either an increase in itsoutput levels while maintaining the same level of input (out-put oriented) or a decrease in its input while keeping thesame output level (input oriented). Input-oriented efficiencyscores range between 0 and 1.0, and whereas output-orientedefficiency scores range between 1.0 and infinity, in bothcases 1.0 is efficient. The output-oriented optimization ofDMUY in Fig. 2 is slightly different in that the DMU is notfully enveloped by the surface. In this case, DMUY first ap-proaches the frontier by increasing its output and then by us-ing the “slack” variables to reach the efficient frontier. The
VRS surface was used in this research; therefore, only theBCC model will be discussed in detail.
Banker Charnes Cooper (variable-return-to-scale)models
The linear programming system for the BCC input-orientedmodel is given in eq. [2], and the output-oriented model ineq. [3] (refer to Charnes et al. (1994) for more detail). Thecalculations provide a maximal performance measure using
© 2005 NRC Canada
McCabe et al. 185
Prequalification model
Prequalification criteria 1 2 3 4 5 6 7 8
Financial stability � � � � � � �
Capacity for assuming new projects � � � � � �
Safety � � � � � �
Type of contractor and years in business � � � � � �
Percentage of work performed � � � � � �
Location � � � � � �
Past performance � � � � �
Management � � � � �
Bonding � � � � �
Key personnel � � � �
Experience � � � �
Failure history � � � �
Equipment resources � � � �
Workforce resources � � � �
Annual value of work in 5 years � � �
Third party evaluation � � �
Similar or related projects completed � � �
Quality assurance and control program � � �
References evaluation � �
Shareholder information � �
Reputation to subs, unions, suppliers � �
Time and budget performance � �
Principal projects in 5 years � �
Litigation history �
Insurance performance �
Note: 1, public owner’s projects, QUALIFIER-1 (Russell and Skibniewski 1990); 2, private owner’sprojects, QUALIFIER-1 (Russell and Skibniewski 1990); 3, artificial neural network model (Hanna etal. 1997); 4, fuzzy sets model (Elton et al. 1997); 5, Canada (CCDC-11 1996); 6, Saudi Arabia andUnited Kingdom (Bubshait and Al-Gobali 1996); 7, Japan (Paulson and Aki 1980); and 8, Australia(Liston 1994).
Table 1. Comparison of prequalification criteria (Gong 1999).
Fig. 2. Envelopment surfaces and orientation.Fig. 1. Empirical frontier and theoretical frontier.

piecewise linear optimization on each DMU with respect tothe closest observation on the frontier.
[2] max h u y ur rr
s
0 01
0= +=∑
such that
v xi ii
m
01
1=∑ =
u y v x ur rj i iji
m
r
s
− + ≤==∑∑ 0
11
0
i m j n r s= = =1, 1, 1,� � �, ; , ; , ;
ur, vi ≥ ε; u0 free
[3] min q v x vi ii
m
0 0 01
= +=∑
such that
u yr rr
m
01
1==∑
v x u y vi ij r rjr
s
i
m
− + ≥==∑∑ 0
11
0
i m j n u vi r= = ≥1, 1,� �, ; , ; , ;εr s u= 1, freeo�, ;
where xij is the ith input of the jth DMU, yrj is the rth outputof the jth DMU, ur and vi are the output and input weight,respectively.
The objective of the function is to obtain the weights thatmaximize the efficiency of the DMU under evaluation, DMU0,while limiting the efficiency of all DMUs to less than orequal to 1.0 (for input-oriented models). Variables of thismodel are the efficiency score and the input–output weights;the inputs and outputs of the DMUs are known.
Charnes et al. (1978) recognized the difficulty in seekinga standard set of weights to calculate relative efficiency andthat DMUs might value inputs and outputs differently andtherefore adopt different weights. They therefore proposedthat each DMU should adopt weights that show it in themost favorable light relative to the other DMUs. This flexi-bility in the weights is both a weakness and strength of thisapproach. It is a weakness because the judicious choice ofweights by a DMU possibly unrelated to the value of any inputor output may allow a DMU to appear efficient but it mayhave more to do with the choice of weights than operationalefficiency. This flexibility may also be considered strengthbecause a DMU that is inefficient with even the most favor-able weights cannot argue that the weights are unfair. Asthat might be, relationships can be incorporated into themodel to constrain the weights as deemed appropriate.
It is very important to recognize that the efficiency valuesproduced by DEA are only valid within that particular groupof peers. A contractor that is efficient in one group may bequite inefficient when compared with another group. In other
words, if a group of very poor contractors were evaluatedusing DEA, you would still have efficient contractors. (Asdiscussed later, developing a practical frontier is one way ofaddressing this shortcoming.) Further, if the set of DMUs issmall, then there is little discrimination between them. Con-sider Fig. 2, where five of the nine DMUs are on the effi-cient frontier. A general rule is that there should be at leastthree times the DMUs as there are variables (inputs + out-puts) in the model (Banker et al. 1984). In the case of con-tractor prequalification, often there are 10 or fewer contrac-tors to evaluate per contract. This would restrict the numberof evaluation variables to three, which is simply too few fora thorough and reliable prequalification. It is, therefore, de-sirable to identify a standard set of best performers in con-struction prequalification, i.e., to identify the practicalfrontier that would act as a fixed framework from which allcontractors could be compared.
Practical frontier in data envelopmentanalysis
Sowlati (2001) asserted that it may be possible to create aseries of artificial DMUs that are equally or more efficientthan the best performers and that these DMUs could bebased upon practical improvements of current efficient DMUsjudged by expert opinion. From this premise, she developedP-DEA and the practical frontier. The resulting practicalfrontier is formed mostly by the artificial DMUs, as shownin Fig. 3. In essence, the practical frontier improves the em-pirical frontier and brings it closer to the theoretical frontier.
The procedure has three stages (Sowlati 2001). In stage I,conventional DEA, as shown in the input-oriented BCC formof eq. [2], is used to evaluate the efficiency of all DMUs andto identify the efficient units. Restrictions on the weights canbe applied to increase its discrimination power.
In stage II, expert opinions are obtained on possible effi-ciency improvements, δ, and on the allowable input–outputranges of efficient DMUs as Lxi0 ≤ xi0 ≤ Uxi0 and Lyr0 ≤ yr0 ≤Uyr0. Equation [4] is used to find the efficiency score, theweights ur and vi, and inputs and outputs xio and yro of thenew DMUs; eq. [4] is formed by substituting into eq. [2]:the variables:
~x piv
ri
0 ⋅ by
~y qru
ir
0 ⋅ by
© 2005 NRC Canada
186 Can. J. Civ. Eng. Vol. 32, 2005
Fig. 3. The theoretical, practical, and empirical frontiers (Sowlati2001).

the constraints:
L x U v L q v Uxi i xi i xi i i xi0 0 0 0 0≤ ≤ ⋅ ≤ ≤ ⋅~ by
L y U u L p u Uyr r yr r yr r r yr0 0 0 0 0≤ ≤ ⋅ ≤ ≤ ⋅~ by
[4] Max=1
s
p + ur 0r∑
such that
qii
m
==∑ 1
1
u y u v x jr rj i iji
m
r
s
+ − ≤ ∀==∑∑ 0
11
0
u y u v xr r i ii
m
r
s
0 0 011
0+ − ===∑∑
p u qr ii
m
r
s
+ − ≥==∑∑ 0
11
0
p u qr ii
m
r
s
+ − + ≥==∑∑ 0
11
1 0( )δ
v L q v U ii xi i i xi⋅ ≤ ≤ ⋅ ∀0 0,
u L p u U rr yr r r yr⋅ ≤ ≤ ⋅ ∀0 0,
i m j n u vi r= = ≥1, 1,� �, ; , ; , ;εr s u= 1, freeo�, ;
The addition of constraint 3, indicated by the box, is amodification to Sowlati’s P-DEA formulation. The objectiveof the formulation is to determine the weights and value ofinputs and outputs that maximize the efficiency within anupper limit (δ) of the DMU under evaluation, which origi-nally had an efficiency score of 1.0. The new DMU devel-oped from it will therefore have an efficiency score withinthe range of 1.0 to 1.0 + δ.
Constraint 2 ensures that the efficiency of other DMUswill not exceed 1.0 with the determined weights. This con-straint (2), however, allows the DMU under evaluation tohave an efficiency score of less than 1.0 and eventually per-mits the difference in efficiency between the original DMUand the new artificial DMU to be more than δ, the upperlimit value. Constraint 3, therefore, was included to enforcethe restriction of δ by controlling the efficiency score of theoriginal efficient DMU.
In stage III, the model is run again with the real and artifi-cial DMUs, and a new set of efficient units is defined, whichwill consist of some combination of real and artificial DMUs.The inputs and outputs of the artificial DMUs are shown ineq. [5].
[5] ~ ~xqv
ypu
ii
ir
r
r0 0∗
∗
∗∗
∗
∗= =and
Once the practical frontier is established, the requirementto have a minimum number of DMUs to run a reliable model
© 2005 NRC Canada
McCabe et al. 187
Fig. 4. Contractor prequalification model.

is removed. In fact, the analysis no longer has to be a batchprocess; it can be run with just a single DMU and the practi-cal frontier. Additionally, this practical frontier could serveas a measure of the quality of contractors vying for the pro-jects of a large owner over time.
Methodology, criteria selection, and data
The CPM (contractor prequalification model) frameworkinitially developed by Ramani (2000) and modified by Tran(2002) is based on data envelopment analysis and providesan evaluating method that is computationally advanced, ca-pable of reducing human and arithmetic bias, and is defensible.The model consists of three stages: (1) bonding capacity,(2) DEA, and (3) rank and (or) short-listing. Figure 4 pres-ents a graphical representation of the model.
Bonding capacity is one of the most important criteria inthe prequalification process, but it is not a quantitative vari-able. Stage 1 of the model eliminates from the process anycontractor that is unable to obtain the appropriate bondingfor the project. In stage 2, DEA is applied to evaluate therelative performance of the contractors in the form of effi-ciency scores. In stage 3, the efficiency scores are used torank the contractors. The qualified contractors are thenshort-listed.
As stated by Ramani (2000), the original model had fourmajor shortcomings. First, while DEA has the ability to si-multaneously handle multiple inputs and outputs, it does not
differentiate the relative importance of these variables. Theuse of weight restrictions would address this issue. The sec-ond limitation is the large quantity of units required to run areliable analysis — a minimum of three DMUs for eachvariable in the model. Third, the efficiency score is relativeto the DMU set; while a DMU may be efficient, it mightonly be the best of a bad lot. Finally, the analysis must berun as a batch process. The development of a practical fron-tier would address these other issues. Therefore, stage 2 wasmodified to incorporate P-DEA.
The model was tested on 10 contracts within a larger pro-ject in which prequalification was undertaken usingweighted scores. A series of experiments were run, eachcomparing the results with the weighted scores results, hereinreferred to as the baseline. The experiments proceeded fromthe original DEA model by Ramani (2000), DEA with vari-able weight restrictions, and P-DEA+ with weight restric-tions. It should be noted that the objective was not to matchthe results of the baseline but to examine the different modelresults and attempt to justify them.
Data collectionPrequalification data were examined from 1998 to 2000
for 10 contracts ranging from 3 to 12 million dollars. Eachcontract had at least 15 contractor prequalification packages.For brevity, only the results of contract A will be discussedhere. The prequalification package included
© 2005 NRC Canada
188 Can. J. Civ. Eng. Vol. 32, 2005
Evaluation criteria Points
Letter of consent of surety 10 Yes0 Not sufficient
–5 NoneWSIB clearance certificate 2 Yes
0 No informationCAD-7 report 4 Good standing
2 Average0 Poor or no information
Average annual value of construction 6 >CAN$5 million4 CAN$3–5 million1 CAN$2–3 million0 <$2 million
Related projects (with references) 10 Good experience5 Some experience
–10 None or no information providedKey personnel assigned to projects 5 Good experience
0 No experiencePersonnel resumes 2 Resumes
0 NoneType of company 4 Corporation
3 Partnership2 Individual
Financial references 4 Bank3 Bonding Co.0 None
Completed projects in last 5 years 3 4 or more1 1–3
–4 Nil
Table 2. Weighted score system.

• completed CCDC-11 form (Contractor’s QualificationStatement of the Canadian Construction Document Com-mittee (CCDC 1996)). The CCDC-11 contains the con-tractor’s legal structure, financial references, clientreferences, annual value of construction work for the past5 years, principal projects completed in the past 5 years,similar or related projects completed, major projects un-derway, and key office and site personnel proposed for theproject plus resumes of qualification.
• resumes of supervisory personnel to be assigned to theproject
• letter of Consent of Surety from a bonding company con-firming the contractor’s capacity to obtain bid, perfor-mance, and payment bonds and the minimum establishedbonding capacity
• certificate of Clearance from the Workplace Safety andInsurance Board (WSIB) stating that the contractor’s ac-count with WSIB is not delinquent
• current CAD-7, also from WSIB. This value consists oftwo parts: the cost of accidents and the frequency of acci-dents. These are combined into a firm performance index(FPI) ranging between –2 and +1. A FPI of 1 is the best,indicating that the contractor has had no or relatively fewminor accidents. The sector average score is 0, and ascore of –2 is the worst rating. Companies with a FPI be-tween 0 and 1 receive a rebate, while those with a valuebetween 0 and –2 are levied a surcharge (CSAO 2000).The baseline model is a weighted score system with 10
criteria shown in Table 2. The system awards a maximum of50 points, and each criterion has a different possible maximumscore. The scores for each contractor are summed, resultingin the prequalification ratings shown in Table 3. The bestpossible score is 50, with most contractors scoring in the 40s.
Weighted score prequalification models have shortcom-ings. In this case, there were some subjective decisions madein the assignment of scores to each contractor. Where datawere missing, the decision maker would complete the scor-ing using his (her) knowledge of the local industry. While itwas useful for the project management team, it made theprocess less defensible. Further, an excellent score in onefactor could overshadow a poor score in another factor. Forexample, consider contractors A7 and A10 to A15. They allreceived a score of 44 points. They received the same num-ber of points for personnel resumes, financial references,completed projects, letter of Consent of Surety, and, WSIBClearance certificate. Contractor A15 received the lowestrating for safety but instead made great points in related pro-jects. Are these equivalent? Contractor A13 also received ex-cellent points in related projects but lost points in keypersonnel and type of company. Although the company hasexperience with the specific type of project, would it not beequally or more important that the key persons assigned tothe project have similarly excellent experience? Further, thereappears to be redundancy in “key personnel” and “personnelresumes”. Finally, as in this case, points are often assignedin a step function. For example, if the company doesCAN$2.8 million of construction business a year, and an-other company does CAN$3.2 million, one could argue thatthose three points do not represent as much value to the pro-ject as the two points given for WSIB clearance certificate.
© 2005 NRC Canada
McCabe et al. 189
Con
trac
tor
Fin
anci
alre
fere
nces
Let
ter
ofco
nsen
tof
sure
tyTy
peof
com
pany
Com
plet
edpr
ojec
tsin
last
5ye
ars
Ave
rage
annu
alva
lue
ofco
nstr
ucti
on
Rel
ated
proj
ects
(wit
hre
fere
nces
)
Key
pers
onne
las
sign
edto
proj
ects
Per
sonn
elre
sum
esC
AD
-7re
port
WS
IBcl
eara
nce
cert
ific
ate
Tota
lsc
ore
A1
410
43
68
00
02
37A
24
104
30
82
24
239
A3
410
43
09
42
42
42A
44
104
36
94
20
042
A5
410
40
510
42
22
43A
64
104
31
94
24
243
A7
410
43
65
42
42
44A
84
104
35
104
24
248
A9
410
43
610
42
02
45A
104
104
36
54
24
244
A11
410
43
65
42
42
44A
124
104
36
54
24
244
A13
410
23
510
22
42
44A
144
104
36
54
24
244
A15
410
43
510
42
02
44A
164
104
35
90
04
241
Tab
le3.
Wei
ghte
dsc
ore
mod
elfo
rco
ntra
ctA
.
Particularly, it is noteworthy that criteria Financial Refer-ences, Letter of Consent of Surety, Type of Company, Com-pleted Projects in Last 5 Years, and WSIB ClearanceCertificates are not very discriminating. Financial Refer-ences, Letter of Consent of Surety, and WSIB ClearanceCertificate are external documents and, based on their im-portance, could be mandatory, thereby eliminating themfrom the evaluation process if the document is missing.
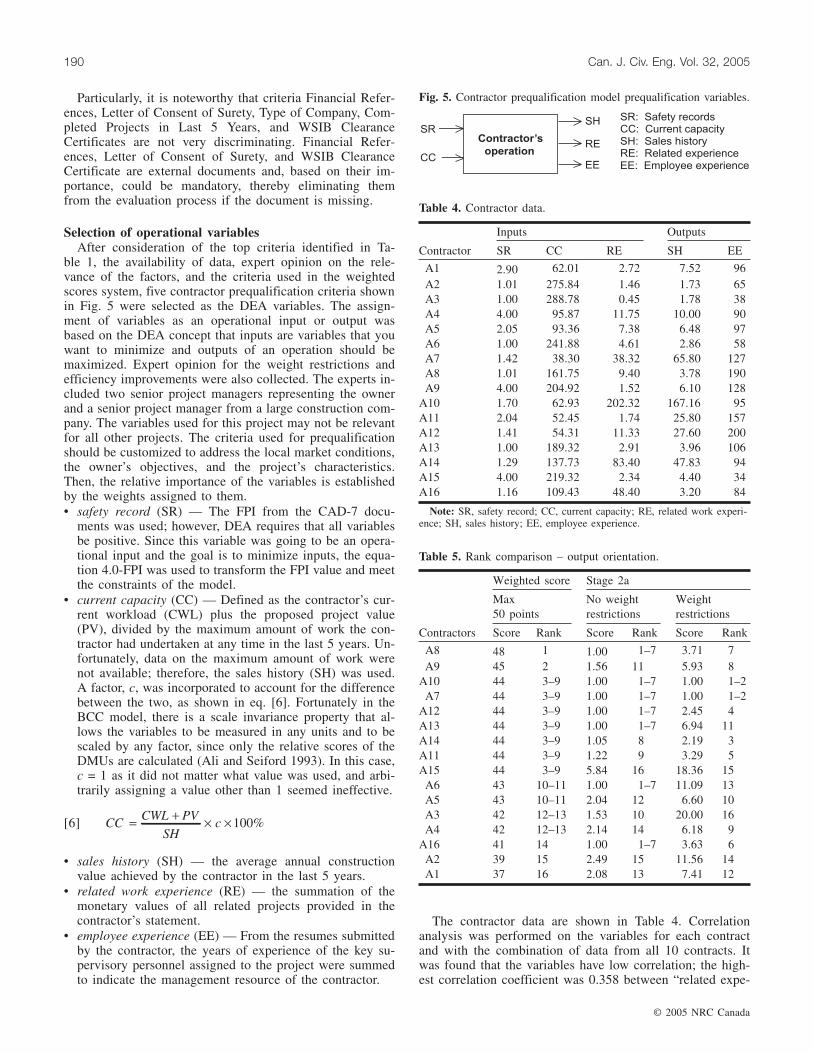
Selection of operational variablesAfter consideration of the top criteria identified in Ta-
ble 1, the availability of data, expert opinion on the rele-vance of the factors, and the criteria used in the weightedscores system, five contractor prequalification criteria shownin Fig. 5 were selected as the DEA variables. The assign-ment of variables as an operational input or output wasbased on the DEA concept that inputs are variables that youwant to minimize and outputs of an operation should bemaximized. Expert opinion for the weight restrictions andefficiency improvements were also collected. The experts in-cluded two senior project managers representing the ownerand a senior project manager from a large construction com-pany. The variables used for this project may not be relevantfor all other projects. The criteria used for prequalificationshould be customized to address the local market conditions,the owner’s objectives, and the project’s characteristics.Then, the relative importance of the variables is establishedby the weights assigned to them.• safety record (SR) — The FPI from the CAD-7 docu-
ments was used; however, DEA requires that all variablesbe positive. Since this variable was going to be an opera-tional input and the goal is to minimize inputs, the equa-tion 4.0-FPI was used to transform the FPI value and meetthe constraints of the model.
• current capacity (CC) — Defined as the contractor’s cur-rent workload (CWL) plus the proposed project value(PV), divided by the maximum amount of work the con-tractor had undertaken at any time in the last 5 years. Un-fortunately, data on the maximum amount of work werenot available; therefore, the sales history (SH) was used.A factor, c, was incorporated to account for the differencebetween the two, as shown in eq. [6]. Fortunately in theBCC model, there is a scale invariance property that al-lows the variables to be measured in any units and to bescaled by any factor, since only the relative scores of theDMUs are calculated (Ali and Seiford 1993). In this case,c = 1 as it did not matter what value was used, and arbi-trarily assigning a value other than 1 seemed ineffective.
[6] CCCWL PV
SHc= + × × 100%
• sales history (SH) — the average annual constructionvalue achieved by the contractor in the last 5 years.
• related work experience (RE) — the summation of themonetary values of all related projects provided in thecontractor’s statement.
• employee experience (EE) — From the resumes submittedby the contractor, the years of experience of the key su-pervisory personnel assigned to the project were summedto indicate the management resource of the contractor.
The contractor data are shown in Table 4. Correlationanalysis was performed on the variables for each contractand with the combination of data from all 10 contracts. Itwas found that the variables have low correlation; the high-est correlation coefficient was 0.358 between “related expe-
© 2005 NRC Canada
190 Can. J. Civ. Eng. Vol. 32, 2005
Weighted score Stage 2a
Max50 points
No weightrestrictions
Weightrestrictions
Contractors Score Rank Score Rank Score Rank
A8 48 1 1.00 1–7 3.71 7A9 45 2 1.56 11 5.93 8
A10 44 3–9 1.00 1–7 1.00 1–2A7 44 3–9 1.00 1–7 1.00 1–2
A12 44 3–9 1.00 1–7 2.45 4A13 44 3–9 1.00 1–7 6.94 11A14 44 3–9 1.05 8 2.19 3A11 44 3–9 1.22 9 3.29 5A15 44 3–9 5.84 16 18.36 15
A6 43 10–11 1.00 1–7 11.09 13A5 43 10–11 2.04 12 6.60 10A3 42 12–13 1.53 10 20.00 16A4 42 12–13 2.14 14 6.18 9
A16 41 14 1.00 1–7 3.63 6A2 39 15 2.49 15 11.56 14A1 37 16 2.08 13 7.41 12
Table 5. Rank comparison – output orientation.
Fig. 5. Contractor prequalification model prequalification variables.
Inputs Outputs
Contractor SR CC RE SH EE
A1 2.90 62.01 2.72 7.52 96A2 1.01 275.84 1.46 1.73 65A3 1.00 288.78 0.45 1.78 38A4 4.00 95.87 11.75 10.00 90A5 2.05 93.36 7.38 6.48 97A6 1.00 241.88 4.61 2.86 58A7 1.42 38.30 38.32 65.80 127A8 1.01 161.75 9.40 3.78 190A9 4.00 204.92 1.52 6.10 128
A10 1.70 62.93 202.32 167.16 95A11 2.04 52.45 1.74 25.80 157A12 1.41 54.31 11.33 27.60 200A13 1.00 189.32 2.91 3.96 106A14 1.29 137.73 83.40 47.83 94A15 4.00 219.32 2.34 4.40 34A16 1.16 109.43 48.40 3.20 84
Note: SR, safety record; CC, current capacity; RE, related work experi-ence; SH, sales history; EE, employee experience.
Table 4. Contractor data.

rience” and “sales history”. The five variables weretherefore not redundant and reasonably representative of thecontractors.
Analysis results
The DEA software used to run the model was the effi-ciency measurement system (EMS) developed at Universityof Dortmund, Germany. The EMS is capable of handlingDEA problems with over 5000 DMUs and 40 variables. TheBCC model was run on all 10 contracts; both input and out-put orientation were investigated. Only the output-orientedresults will be discussed here.
The contractors that did not meet the bonding require-ments were excluded from further analysis. The DEA modelwas first run without any restriction imposed on the variableweights. Then, the relative importance of the weights as-sessed by the experts were converted into constraints as ra-tios and added to the basic DEA model, and the analysis wasrun again, this time with more consistency in the weights.The mathematical forms of the weight constraints are
v1( )Safety records(Current capacity)
432v
=
u1( )Related experience(Sales history)
2062u
=
u1( )Related experience(Employee experience)
2072u
=
Ranking comparison for contract A between the weightedscores and the DEA models is presented in Table 5. Com-paring the results, the number of efficient DMUs decreasedsignificantly from seven in the run without weight restric-tions to only two with weight restrictions, indicating the im-proved discrimination power of DEA with the weightrestrictions. This trend was observed in all 10 contracts.Some differences in rank are worth discussing, particularlyDMUs A7 to A10, shown as the top four in Table 5. Thebaseline model resulted in top scores for contractors A8 andA9, but the DEA weight-restricted model placed those two asseventh and eighth, respectively. The primary difference be-tween the two evaluation methods is that step functions aregenerally used in weighted score systems to convert the ac-tual values of the evaluation variables into scores (as shownin Table 2), whereas continuous values are used directly inDEA models. Decision-making unit A9 lost 4 points in theweighted score because of a poor safety rating but made upfor it in the related projects category. One should be con-
cerned that a contractor with a poor safety record wasranked second.
That DMUs A7 and A10 were evaluated as efficient indicatesthat the actual values for the variable “related projects” didnot warrant the 5-point jump earned by A8 and A9 as comparedwith A7 and A10 in the weighted score model. Clearly, the ad-vantages in using the DEA model are that using real values al-lows the distinctions to be recognized proportionally andthat low scores in one area cannot override a higher score inanother category.
Stage 2b: Creating artificial improved decision-makingunits
The objective of this stage is to determine the possible im-provement in inputs and outputs of efficient contractors eval-uated in stage 2a and to use this information to create theartificial contractors using P-DEA+. The parameters enteredinto the model were the possible increase in efficiency ofbest practice units (δ) and the allowable ranges of variationof inputs and outputs (Lxi0 ≤ xi0 ≤ Uxi0, Lyr0 ≤ yr0 ≤ Uyr0). Theparameters used are• δ = 0.06• safety records:
(1 0.20) (1 0.20)0 0 0− ≤ ≤ +x x xi i i~
© 2005 NRC Canada
McCabe et al. 191
Contractor SR CC RE SH EE
Contract A A7 1.42 38.30 36.40 59.22 101.6A7N 1.17 34.72 38.32 65.8 127A10 1.70 62.93 202.32 167.16 95A10N 1.04 60.83 208.39 175.52 114
Note: SR, safety record; CC, current capacity; RE, related work experience; SH, sales history; EE,employee experience.
Table 6. Inputs and outputs of new contractors.
Variable weights
DMUEfficiencyscore SR CC RE SH EE
A7N 1.00 0.037 0.028 0.011 0.003 0.004A10N 1.00 0.021 0.016 0.003 0.001 0.001A10 1.05 0.020 0.015 0.003 0.001 0.001A7 1.17 0.033 0.025 0.010 0.003 0.003A14 2.30 0.055 0.007 0.008 0.002 0.003A12 2.72 0.024 0.018 0.011 0.003 0.004A11 3.66 0.024 0.018 0.016 0.005 0.005A16 3.82 0.019 0.009 0.013 0.004 0.004A8 3.91 0.010 0.006 0.013 0.004 0.005A9 6.25 0.045 0.004 0.021 0.006 0.007A4 6.51 0.020 0.010 0.022 0.006 0.008A5 6.95 0.035 0.010 0.023 0.007 0.008A13 7.31 0.010 0.005 0.024 0.007 0.008A1 7.80 0.026 0.015 0.026 0.008 0.009A6 11.68 0.539 0.002 0.039 0.012 0.014A2 12.17 0.015 0.004 0.040 0.012 0.014A15 19.34 0.248 0.001 0.064 0.019 0.022A3 21.07 0.052 0.003 0.070 0.021 0.025
Table 7. Stage 2c: contract A results.

• current capacity:
(1 0.20) (1 0.30)0 0 0− ≤ ≤ +x x xi i i~
• related experience:
(1 0.05) (1 0.03)0 0 0− ≤ ≤ +y y yi i i~
• sales history:
(1 0.10) (1 0.05)0 0 0− ≤ ≤ +y y yi i i~
• employee experience:
(1 0.20) (1 0.20)0 0 0− ≤ ≤ +y y yi i i~
The P-DEA+ model was solved for each efficient contractorfrom stage 2a with weight restrictions. Microsoft® Excel’ssolver was used to execute the P-DEA+ linear programmingfor all 10 contracts as the inverse mechanism of EMS, i.e., todetermine the new values of inputs and outputs from a maxi-mum efficiency score value by optimizing the weights. Theweight restrictions used in stage 2a were included as con-straints. Table 6 presents the results of contract A. The in-puts and outputs of new contractors are presented along withthe original efficient contractors upon which the new con-tractors, denoted by N, were based.
Stage 2c: Establishing the practical frontierThe objective of this stage was to define the practical
frontier by running the DEA model again with both theoriginal and the artificial contractors. Analysis was done onall 10 contracts with the same weight restrictions as in thelast stage. Table 7 shows stage 2c results for contract A. In-cluded are the efficiency scores of both the real and artifi-cial contractors and the weights used in the analysis. Thepractical frontier is believed to reflect the industry’s stan-dard in the Southern Ontario region, since the contracts un-der evaluation were relatively large and the contractors
involved in the prequalification are representative of the re-gional market.
Assuming that the top nine contractors in the weightedscores evaluation would have been prequalified, it is of interestto examine how they performed at the various stages of theCPM. The top nine ranked contractors in each evaluationmodel are shown in bold (Table 8). As noted earlier, it wasquestionable whether A13 and A15 should be in the top ninecontractors. The DEA models with weight restrictions cap-tured these anomalies and placed these two contractors at11th and 15th places, respectively. In addition, all DEAmodels would have brought A16 into the top nine, and theweight-restricted DEA would have included A4.
Conclusions
Prequalifying contractors in a construction project is a nota simple task, since the process involves comparing unitswith multiple criteria and qualitative information. Data en-velopment analysis, with its ability to measure the relativeperformance of organizational units that have multiple inputsand outputs, has been demonstrated as a feasible solution tothe contractor prequalification problem. A three-stage meth-odology that is able to create best-practice benchmarks(practical frontiers) for comparing contractors for a specificproject type was established.
The CPM framework could be extremely useful to majorowners that manage large annual budgets in construction,such as Departments or Ministries of Transportation, petro-chemical facilities, and large municipalities, where the prequa-lification process is often undertaken by these organizationsjust once per year. The variables used by each owner wouldbe customized to meet their needs. A standard practical fron-tier could be useful as a regional performance benchmarkagainst which contractors could measure themselves and iden-tify possible performance targets. As well, because they are
© 2005 NRC Canada
192 Can. J. Civ. Eng. Vol. 32, 2005
Weighted scores Stage 2a Stage 2c
Max 50 points No weight restrictions Weight restrictionsPractical frontier withweight restrictions
Contractors Score Rank Score Rank Score Rank Score Rank
A8 48 1 1.00 1–7 3.71 7 3.91 7A9 45 2 1.56 11 5.93 8 6.25 8A10 44 3–9 1.00 1–7 1.00 1–2 1.05 1A7 44 3–9 1.00 1–7 1.00 1–2 1.17 2A14 44 3–9 1.05 8 2.19 3 2.30 3A12 44 3–9 1.00 1–7 2.45 4 2.72 4A11 44 3–9 1.22 9 3.29 5 3.66 5A13 44 3–9 1.00 1–7 6.94 11 7.31 11A15 44 3–9 5.84 16 18.36 15 19.34 15A6 43 10–11 1.00 1–7 11.09 13 11.68 13A5 43 10–11 2.04 12 6.60 10 6.95 10A3 42 12–13 1.53 10 20.00 16 21.07 16A4 42 12–13 2.14 14 6.18 9 6.51 9A16 41 14 1.00 1–7 3.63 6 3.82 6A2 39 15 2.49 15 11.56 14 12.17 14A1 37 16 2.08 13 7.41 12 7.80 12
Note: The top nine ranked contractors in each evaluation model are shown in bold.
Table 8. Comparison of model results.

comparing themselves to artificial DMUs, confidentiality ismaintained. The model variables provided here may not workfor every project if the practical frontier is used for many,different projects. The authors strongly believe that this meth-odology has many more advantages than disadvantages overthe current systems used today, particularly for large buyersof construction.
Acknowledgements
The authors respectfully acknowledge and enthusiasticallyappreciate the financial and research support of the GreaterToronto Airports Authority and MGP Project Managers inconjunction with the Natural Sciences and Engineering Re-search Council Industrially Oriented Research Grant216754-98 in the development of this model.
References
AbouRizk, S.M., and Chehayeb, N.N. 1995. Hypertext decisionsupport model for contractor prequalification. Microcomputersin Civil Engineering, 10: 111–121.
Ali, A.I., and Seiford, L.M. 1993. The mathematical programmingapproach to efficiency analysis. In The measurement of produc-tive efficiency: techniques and applications. Edited by H. Fried,S.S. Schmidt, and C.A.K. Lovell. Oxford University Press, Lon-don. pp. 120–159.
Banker, R.D., Charnes, A., and Cooper, W.W. 1984. Some modelsfor estimating technical and scale inefficiencies in data envelop-ment analysis. Management Science, 30: 1078–1092.
Bubshait, A.A., and Al-Gobali, K.H. 1996. Contractorprequalification in Saudi Arabia. Journal of Management in En-gineering, 12: 50–54.
CCDC. 1996. Standard construction document – CCDC-11 – 1996.Canadian Construction Documents Committee, Ottawa, Ont.
Charnes, A., Cooper, W.W., and Rhodes, E.L. 1978. Measuring theefficiency of decision making units. European Journal of Opera-tional Research, 2: 429–444.
Charnes, A., Cooper, W.W., Lewin, A.Y., and Seiford, L.M. (Edi-tors). 1994. Introduction and basic DEA models. In Data envel-
opment analysis: theory, methodology and applications. KluwerAcademic Publishers, Boston, Mass. pp. 3–47.
CSAO. 2000. CAD-7 experience rating for Ontario construction.3rd revised ed. Construction Safety Association of Ontario,Etobicoke, Ont.
Elton, D.J., Juang, C.H., and Russell, J.S. 1994. Contractor prequa-lification using fuzzy sets. Civil Engineering Systems, 11: 1–17.
Gong, X. 1999. Contractor prequalification process. M.Eng. pro-ject, Department of Civil Engineering, University of Toronto,Toronto, Ont.
Hanna, A.S., Russell, J.S., Taha, M.A., and Park, S.C. 1997. Appli-cation of neural networks to owner-contractor prequalification.In Artificial neural networks for civil engineers: fundamentalsand applications. American Society of Civil Engineers, NewYork. pp. 124–136
Holt, G.D. 1996. Applying cluster analysis to construction contrac-tor classification. Building and Environment, 31: 557–568.
Juang, C.H., Burati, J.L., and Kalindindi, S.N. 1987. A fuzzy sys-tem for bid proposal evaluation using microcomputers. Civil En-gineering Systems, 4: 124–130.
Liston, J.W. 1994. Prequalification of contractors. National Con-struction and Management Conference. Institute of Engineers,Australia and University of New South Wales, Sydney, Austra-lia. pp. 396–411.
Paulson, B.C., Jr., and Aki, T. 1980. Construction management inJapan. Journal of the Construction Division, 106: 281–296.
Ramani, J. 2000. Reducing the bias in contractor prequalificationusing data envelopment analysis. M.A.Sc. thesis, Department ofCivil Engineering, University of Toronto, Ont.
Russell, J.S., and Skibniewski, M.J. 1990. QUALIFIER-1: contrac-tor prequalification model. Journal of Computing in Civil Engi-neering, 4: 77–90.
Russell, J.S., Skibniewski, M.J., and Cozier, D.R. 1990. QUAL-IFIER-2: knowledge-based system for contractor prequalification.Journal of Construction Engineering and Management, 116: 157–171.
Sowlati, T. 2001. Establishing the practical frontier in data envel-opment analysis. Ph.D. thesis, Department of Mechanical andIndustrial Engineering, University of Toronto, Ont.
Tran, V.H.Q. 2002. Practical frontier in construction prequalificationusing data envelopment analysis. M.A.Sc. thesis, Department ofCivil Engineering, University of Toronto, Ont.
© 2005 NRC Canada
McCabe et al. 193