Efficacy of Soil Extracting Solutions for Assessing Potential Phosphorus Loss from a Dairy Waste...
15
This article was downloaded by: [Dr D. G. McGahan] On: 18 April 2012, At: 17:10 Publisher: Taylor & Francis Informa Ltd Registered in England and Wales Registered Number: 1072954 Registered office: Mortimer House, 37-41 Mortimer Street, London W1T 3JH, UK Communications in Soil Science and Plant Analysis Publication details, including instructions for authors and subscription information: http://www.tandfonline.com/loi/lcss20 Efficacy of Soil Extracting Solutions for Assessing Potential Phosphorus Loss from a Dairy Waste Application Field Soil in North Central Texas L. A. Deubler a , D. G. McGahan b c , R. D. Wittie b & J. P. Muir c a U.S. Department of Agriculture, Natural Resource Conservation Service, Soil Survey Office, Kerrville, Texas, USA b Tarleton State University, Environmental and Agricultural Management, Stephenville, Texas, USA c Texas A&M, System Agrilife, Stephenville, Texas, USA Available online: 18 Apr 2012 To cite this article: L. A. Deubler, D. G. McGahan, R. D. Wittie & J. P. Muir (2012): Efficacy of Soil Extracting Solutions for Assessing Potential Phosphorus Loss from a Dairy Waste Application Field Soil in North Central Texas, Communications in Soil Science and Plant Analysis, 43:8, 1202-1215 To link to this article: http://dx.doi.org/10.1080/00103624.2012.662566 PLEASE SCROLL DOWN FOR ARTICLE Full terms and conditions of use: http://www.tandfonline.com/page/terms-and-conditions This article may be used for research, teaching, and private study purposes. Any substantial or systematic reproduction, redistribution, reselling, loan, sub-licensing, systematic supply, or distribution in any form to anyone is expressly forbidden. The publisher does not give any warranty express or implied or make any representation that the contents will be complete or accurate or up to date. The accuracy of any instructions, formulae, and drug doses should be independently verified with primary sources. The publisher shall not be liable for any loss, actions, claims, proceedings, demand, or costs or damages whatsoever or howsoever caused arising directly or indirectly in connection with or arising out of the use of this material.
Transcript of Efficacy of Soil Extracting Solutions for Assessing Potential Phosphorus Loss from a Dairy Waste...
This article was downloaded by: [Dr D. G. McGahan]On: 18 April 2012, At: 17:10Publisher: Taylor & FrancisInforma Ltd Registered in England and Wales Registered Number: 1072954 Registeredoffice: Mortimer House, 37-41 Mortimer Street, London W1T 3JH, UK
Communications in Soil Science and
Plant AnalysisPublication details, including instructions for authors andsubscription information:http://www.tandfonline.com/loi/lcss20
Efficacy of Soil Extracting Solutions for
Assessing Potential Phosphorus Loss from
a Dairy Waste Application Field Soil in
North Central Texas
L. A. Deubler a , D. G. McGahan b c , R. D. Wittie b & J. P. Muir c
a U.S. Department of Agriculture, Natural Resource ConservationService, Soil Survey Office, Kerrville, Texas, USAb Tarleton State University, Environmental and AgriculturalManagement, Stephenville, Texas, USAc Texas A&M, System Agrilife, Stephenville, Texas, USA
Available online: 18 Apr 2012
To cite this article: L. A. Deubler, D. G. McGahan, R. D. Wittie & J. P. Muir (2012): Efficacy of SoilExtracting Solutions for Assessing Potential Phosphorus Loss from a Dairy Waste Application Field Soilin North Central Texas, Communications in Soil Science and Plant Analysis, 43:8, 1202-1215
To link to this article: http://dx.doi.org/10.1080/00103624.2012.662566
PLEASE SCROLL DOWN FOR ARTICLE
Full terms and conditions of use: http://www.tandfonline.com/page/terms-and-conditions
This article may be used for research, teaching, and private study purposes. Anysubstantial or systematic reproduction, redistribution, reselling, loan, sub-licensing,systematic supply, or distribution in any form to anyone is expressly forbidden.
The publisher does not give any warranty express or implied or make any representationthat the contents will be complete or accurate or up to date. The accuracy of anyinstructions, formulae, and drug doses should be independently verified with primarysources. The publisher shall not be liable for any loss, actions, claims, proceedings,demand, or costs or damages whatsoever or howsoever caused arising directly orindirectly in connection with or arising out of the use of this material.

Communications in Soil Science and Plant Analysis, 43:1202–1215, 2012Copyright © Taylor & Francis Group, LLCISSN: 0010-3624 print / 1532-2416 onlineDOI: 10.1080/00103624.2012.662566
Efficacy of Soil Extracting Solutions for AssessingPotential Phosphorus Loss from a Dairy WasteApplication Field Soil in North Central Texas
L. A. DEUBLER,1 D. G. MCGAHAN,2,3 R. D. WITTIE,2
AND J. P. MUIR3
1U.S. Department of Agriculture, Natural Resource Conservation Service, SoilSurvey Office, Kerrville, Texas, USA2Tarleton State University, Environmental and Agricultural Management,Stephenville, Texas, USA3Texas A&M, System Agrilife, Stephenville, Texas, USA
Elevated phosphorus (P) from manure application field (MAF) soils transported tosurface waters is a concern throughout the world because of P’s role in eutrophication.Our goal was to determine why the common labile extractants alkaline-bufferedsodium bicarbonate (Olsen), ammonium bicarbonate–diethylenetriaminepentaaceticacid (DTPA), and dilute acid–fluoride (Mehlich III) produce different values given thesame soil sample. Ten sites within a dairy MAF were sampled by genetic horizons fromfine, mixed, Thermic, Udic Paleustalf (Windthorst) map units. In addition to determiningplant labile P, soluble and total P were determined. All P pools decreased with depth,but concentrations between the labile P were variable. Mehlich III extracted more plantlabile P at neutral and slightly alkaline pH values. Mehlich III also dissolved more car-bonates. The fraction of labile P that Mehlich III extracts in excess of Olsen and DTPAwarrants further characterization of carbonate associated P to assess its role in plantnutrition and environmental quality regulation.
Keywords DTPA, labile P, MAFs, Mehlich III, Olsen
Introduction
Concentrated animal feeding operations (CAFOs) produce a large quantity of waste, andland application is a common disposal method. Landowners often apply manure or othereffluents based on the nitrogen (N) needs of the field or crop. However, supplementingphosphorus (P) in livestock diets also increases P content in animal waste. With wasteapplication based on N requirements, overapplication of P may result (Havlin et al. 2005;Codling and Isensee 2005; Giasson, Bryan, and Bills 2003; Munster et al. 2004; and Simsand Kleinman 2005). Manure application fields (MAFs) and CAFOs in general have beenrecognized as a source of nonpoint P pollution from long-term application of fertilizers,manure, and effluent (Pote et al. 1996; Heathwaite et al. 2005; McFarland, Saleh, andHauck 2000).
Received 4 August 2010; accepted 17 July 2011.Address correspondence to D. G. McGahan, Tarleton State University, Department of
Environmental and Agricultural Management, 1333 W, Washington (Box T-0500), Stephenville, TX76402. E-mail: [email protected]
1202
Dow
nloa
ded
by [D
r D. G
. McG
ahan
] at 1
7:10
18
Apr
il 20
12
Efficacy of Labile P Extractants 1203
Phosphorus becomes an environmental concern because of its role in acceleratingeutrophication. Accelerated eutrophication is usually the result of increased nutrient accu-mulation in a water body, which causes a rapid growth of aquatic organisms such as algae,followed by their death and subsequent decomposition, leading to soluble oxygen depletion(Pierzynski, Sharpley, and Kovar 2009). Eutrophication impairs surface waters intended forhuman use and/or consumption. Availability of P is often considered the limiting factor foreutrophication because it does not freely exchange with the atmosphere like other nutrientssuch as carbon (C) and N (Sharpley and Withers 1994).
Because P in surface waters does not come from atmospheric sources, it enters surfacewaters primarily as contributions from the lithosphere. The lithosphere has an averagetotal P concentration of approximately 1200 mg P kg!1 and, in soils, total P concentrationsgenerally range from 200 to 5,000 mg P kg!1 with an average of 600 mg P kg!1. However,total soil P does not reflect biologically available soil P, because P is mostly associatedwith slightly soluble to insoluble compounds (Lindsay 1979).
Chemical soil P extractions are used to predict P availability for plants, termedlabile P, and are valuable when they can predict crop response and determine P amend-ment amounts. Phosphorus indices and thresholds, to better interpret risk of surface Ploss, have been developed based upon chemical extraction methods used to determinelabile P. Agencies that apply this strategy are both state and national in scope, such asthe U.S. Environmental Protection Agency (USEPA), U.S. Department of Agriculture–Natural Resources Conservation Service (USDA-NRCS), and Texas Commission onEnvironmental Quality (TCEQ) (Sharpley et al. 2003b; Munster et al. 2004). Phosphorusindices generally do not solely rely on labile extraction methods but also include sitecharacteristics including soil erosion potential, irrigation erosion potential, runoff class, Pfertilizer and organic P sources, and their application methods to help identify at-risk fieldsfor P loss (Lemunyon and Gilbert 1993; Pierzynski and Logan 1993; Giasson, Bryan, andBills 2003; Sharpley et al. 2001, 2003b, 1996; Osmond et al. 2006; Harmel et al. 2005).
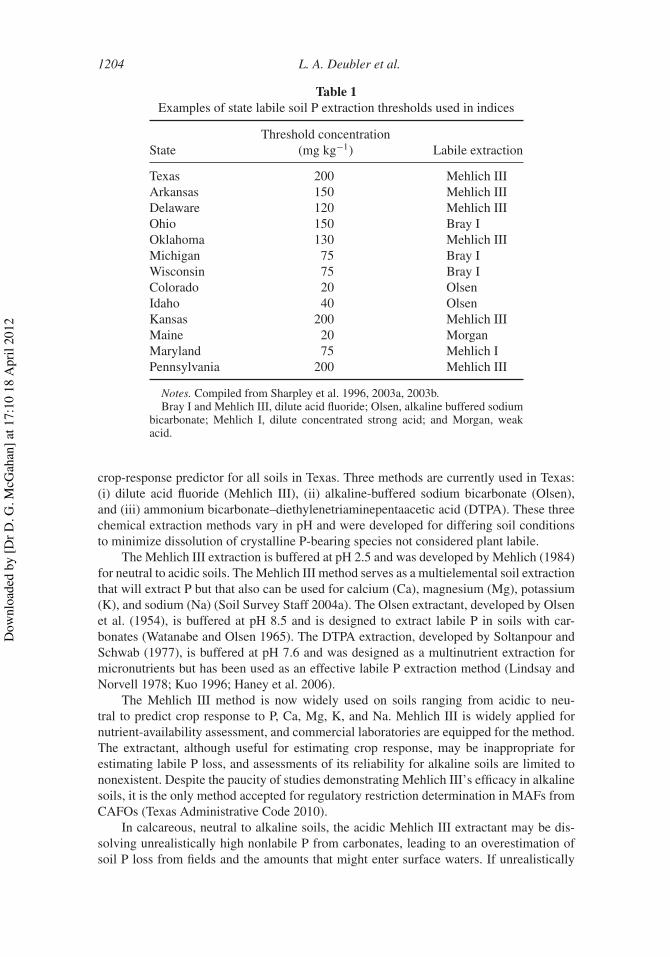
Kleinman et al. (2000) determined that chemical extraction methods may not begood predictors of runoff P vulnerability in conditions where there are P amendments.Nevertheless, the chemical soil P extractions are employed, and they trigger regulatoryaction to curtail P additions to fields. The labile P extractant level triggering regulatoryaction varies across state environmental agencies (Table 1). Of particular note for thisarticle is Texas, where 200 mg kg!1 currently triggers regulatory action. Because reg-ulatory agencies use labile P extraction methods in thresholds and indices to determinefield-level risks of excess P entering surface waters, the selection of an appropriate methodto determine the labile P value is important. This is because there are several plant-labileP extractions, and the concentration values returned by the extractants are not equivalent(Haney et al. 2006; Myers et al. 2005; Soil Survey Staff 2004a).
As stated, the extraction methods used to determine the labile P pool are the chemicalextraction methods developed to estimate crop response on an annual basis and are alsoused to predict potential P loss from soil. These methods rely heavily on pH to controlmineral forms of P dissolved from the soil. Any chemical extraction works best where thepH of the extractant is near the pH of the soil so as to extract sorbed P available to plantsbut exclude P-bearing crystalline species (Haney et al. 2006). Therefore, the implicationsof using an extraction solution poorly suited to the soil conditions could cause inaccurateresults due to dissolution of P-bearing crystalline mineral species that are not labile (Myerset al. 2005).
Texas soils are highly variable, ranging from acidic in the east to alkaline in the west.This variability makes it impossible to assign one labile P extraction method as a “fits-all”
Dow
nloa
ded
by [D
r D. G
. McG
ahan
] at 1
7:10
18
Apr
il 20
12
1204 L. A. Deubler et al.
Table 1Examples of state labile soil P extraction thresholds used in indices
StateThreshold concentration
(mg kg!1) Labile extraction
Texas 200 Mehlich IIIArkansas 150 Mehlich IIIDelaware 120 Mehlich IIIOhio 150 Bray IOklahoma 130 Mehlich IIIMichigan 75 Bray IWisconsin 75 Bray IColorado 20 OlsenIdaho 40 OlsenKansas 200 Mehlich IIIMaine 20 MorganMaryland 75 Mehlich IPennsylvania 200 Mehlich III
Notes. Compiled from Sharpley et al. 1996, 2003a, 2003b.Bray I and Mehlich III, dilute acid fluoride; Olsen, alkaline buffered sodium
bicarbonate; Mehlich I, dilute concentrated strong acid; and Morgan, weakacid.
crop-response predictor for all soils in Texas. Three methods are currently used in Texas:(i) dilute acid fluoride (Mehlich III), (ii) alkaline-buffered sodium bicarbonate (Olsen),and (iii) ammonium bicarbonate–diethylenetriaminepentaacetic acid (DTPA). These threechemical extraction methods vary in pH and were developed for differing soil conditionsto minimize dissolution of crystalline P-bearing species not considered plant labile.
The Mehlich III extraction is buffered at pH 2.5 and was developed by Mehlich (1984)for neutral to acidic soils. The Mehlich III method serves as a multielemental soil extractionthat will extract P but that also can be used for calcium (Ca), magnesium (Mg), potassium(K), and sodium (Na) (Soil Survey Staff 2004a). The Olsen extractant, developed by Olsenet al. (1954), is buffered at pH 8.5 and is designed to extract labile P in soils with car-bonates (Watanabe and Olsen 1965). The DTPA extraction, developed by Soltanpour andSchwab (1977), is buffered at pH 7.6 and was designed as a multinutrient extraction formicronutrients but has been used as an effective labile P extraction method (Lindsay andNorvell 1978; Kuo 1996; Haney et al. 2006).
The Mehlich III method is now widely used on soils ranging from acidic to neu-tral to predict crop response to P, Ca, Mg, K, and Na. Mehlich III is widely applied fornutrient-availability assessment, and commercial laboratories are equipped for the method.The extractant, although useful for estimating crop response, may be inappropriate forestimating labile P loss, and assessments of its reliability for alkaline soils are limited tononexistent. Despite the paucity of studies demonstrating Mehlich III’s efficacy in alkalinesoils, it is the only method accepted for regulatory restriction determination in MAFs fromCAFOs (Texas Administrative Code 2010).
In calcareous, neutral to alkaline soils, the acidic Mehlich III extractant may be dis-solving unrealistically high nonlabile P from carbonates, leading to an overestimation ofsoil P loss from fields and the amounts that might enter surface waters. If unrealistically
Dow
nloa
ded
by [D
r D. G
. McG
ahan
] at 1
7:10
18
Apr
il 20
12
Efficacy of Labile P Extractants 1205
high values are obtained from the use of Mehlich III extraction on calcareous soils, thisoverestimation of labile P could result in unnecessary regulation and costly remediationpractices. Sharpley, McDowell, and Kleinman (2004) found that, in heavily manured soils,pH was increased and extractability and solubility of P were dominated by Ca reactionproducts. They suggested that different relationships should be used to estimate potential Ploss to overland flow due to greater Mehlich III–extractable P when compared to alternativelabile extractable P methods with similar water-soluble P (WSP).
The fractionation of P into pools has a history of successful use and varied application,but understanding of the relationship between pool sizes for phytoremediation is lacking.The time required to successfully reduce P and reinstate the land’s use as a MAF is likelylong. Therefore, understanding the relationships among WSP, labile P, and total P as P isremoved by phytoremediation would be helpful for land-management decisions.
Critical to land-management decisions involving high P level soils, and phytoreme-diation thereof, is the selection of a labile P extraction method that correctly reflects theplant labile pool. This article reports on a data subset that is part of a larger study to esti-mate each pool size to assess phytoremediation viability for a MAF in north central Texas.Specifically, this study reports on findings about common labile P extractions in slightlyacidic (pH 6.1 to 6.5) to moderately alkaline (pH 7.9 to 8.4) soil that is common to northcentral Texas. The goal was to determine why the common labile-P extractants Olsen,DTPA, and Mehlich III report such different values in an attempt to justify using a sin-gle extractant to monitor future P phytoremediation of this and similar MAFs. Finally, wesuggest some P-availability assessment lines of inquiry that we believe should be followedbased on this study’s findings.
Materials and Methods
Site Selection
An inactive dairy farm near Stephenville in Erath County, Texas, was selected as the studysite. Ten sample locations were randomly selected based on labile-P values, determined byMehlich III from a previous study by Somenahally (2006), utilizing an area grid to ensurethat low, medium, and high P-value sample sites, <100, 100–400, and >400 mg P kg!1,respectively, would be obtained. Sample locations were also limited to areas mapped asWindthorst fine sandy loam, 1–3% slopes, eroded. Windthorst soil series is a fine, mixed,Thermic, Udic Paleustalf (Soil Survey Staff 1973).
You Collection
Ten locations were sampled from June to August 2008. The locations were recordedusing a handheld global positioning system (GPS) with an accuracy of ±1.83 m (GarmenInternational Inc., Olathe, Kan.). The pits were excavated using hand tools. The soils weredescribed and sampled following conventional procedures. At each location, four satel-lite locations 6 to 8 m from the main soil pit were excavated, and the A horizon will wasdescribed and sampled (Schoeneberger et al. 2002; Soil Survey Staff 2004a, 2006).
Laboratory Analysis
All samples were air dried and ground to pass a 2-mm sieve. Effervescence class wasdetermined with 1 N hydrochloric acid (HCl) after sieving and homogenizing the sample
Dow
nloa
ded
by [D
r D. G
. McG
ahan
] at 1
7:10
18
Apr
il 20
12
1206 L. A. Deubler et al.
(Schoeneberger et al. 2002). Effervescence classes 4 and 0 were reanalyzed in thelaboratory by performing the test while viewing the sample under a dissecting scope at10 " magnification. Phosphorus concentrations in extraction solutions were determinedby flame spectroscopy. Flame spectroscopy was by inductively coupled plasma–atomicemissions (flame) spectroscopy (ICP-AES) (Spectro Inc., Kleve, Germany) (Soltanpour1996).
Soil reaction (pH) was determined by 1:1 soil/water and 1:2 soil / 0.01 M cal-cium chloride (CaCl2) using an Accument Research AR20 pH meter (Fisher ScientificInternational, Pittsburgh, Penn. (Soil Survey Staff 2004a). Particle-size distribution anal-ysis (PSDA) was determined by the pipette method after dispersion with sodiumhexametaphosphate (Gee and Bauder 1986; Soil Survey Staff 2004a).
The method for calcium carbonate equivalents (CCE) was modified from Soil SurveyStaff (2004a) and Horvath, Opara-Nadi, and Beese (2005). The CCE was also determinedfor each sample after the Mehlich III, Olsen, and DTPA extractions were performed. TotalN was determined by the Dumas method (Bremner 1996; Soil Survey Staff 2004a) drycombustion as a percentage (Elementar Vario Macro CN analyzer, Hanau, Germany).
Water-soluble P (WSP) was determined by aqueous extraction method (Soil SurveyStaff 2004a) and analyzed by ICP-AES flame spectroscopy (Spectro Inc., Kleve,Germany). Total P pool was determined by Kjeldahl digest (TKP) after the methodsof Eaton, Clesceri, and Greenberg (1995) and Taylor (2000) and analyzed by ICP-AES (Spectro Inc., Kleve, Germany). Labile P pool values were determined by theOlsen alkaline buffered sodium–bicarbonate extraction (Soil Survey Staff 2004a), ammo-nium bicarbonate–diethylenetriaminepentaacetic acid extraction (DTPA) (Soltanpour andSchwab 1977; Gavlak et al. 1994; Kuo 1996), and Mehlich III dilute acid fluoride extrac-tion (Gavlak 1994; Soil Survey Staff 2004a), and all P concentrations were determined byICP-AES.
Total carbonate P (TCP) pool is P associated with calcium carbonate (CaCO3). Thefraction of the TCP solubilized by each labile P extractant was determined by the differ-ence from TCP and carbonate-associated P (CP) remaining after the extractant (CPMehlichIII,CPOlsen, CPDTPA). All carbonates were dissolved from 2.0 g soil with 20 mL of 6 Nhydrochloric acid (HCl) and P concentration determined by ICP-AES.
Statistical analyses were performed using SPSS version 17.0 (SPSS Inc. 2008).Phosphorus pools and labile P extractions were analyzed for differences within and acrosssites using analysis of variance (ANOVA, P # 0.05) with Tukey’s mean separation whererequired.
Results and Discussion
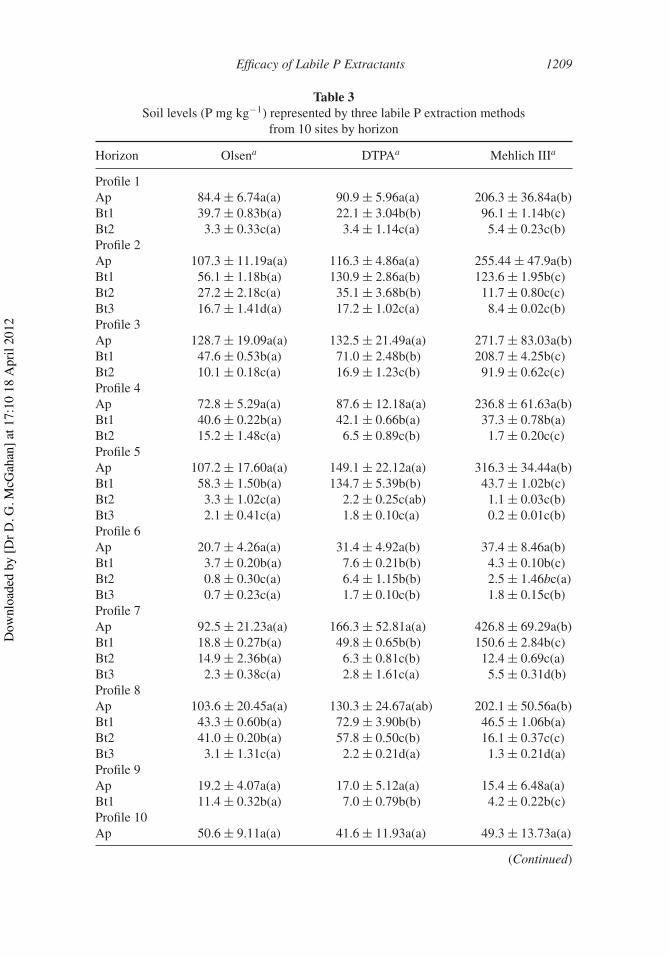
Site selection to capture variable P concentration representing the low, medium, and highMehlich III P values of less than 100, 100–400, and greater than 400 mg P kg!1 wassuccessful, and several expected trends were observed (Tables 2 and 3). The Ap horizonWSP, TKP, and labile P determined by the three extractants (Mehlich III, DTPA, and Olsen)were greater than the subsurface horizons at all sites except one (profile 2 by DTPA), andin all pools, the trend was an increase in P concentration with proximity to the surface.Interpretation of the distribution of P within the profile differed among the three labileextractants (Tables 2 and 3).
Solubility of P is generally low in soils. In slightly to moderately alkaline soils,calcium phosphate minerals and sorption to carbonates is the insoluble sink of P(Lindsay 1979; Stevenson and Cole 1989). A correlation between pH and percentage
Dow
nloa
ded
by [D
r D. G
. McG
ahan
] at 1
7:10
18
Apr
il 20
12

Efficacy of Labile P Extractants 1207
Table 2Soil P levels represented by water-soluble phosphorus (WSP) extraction, total phosphorusby Kjeldahl digest (TKP), and percentage N by Dumas method from 10 sites by horizon
Horizon WSPa (P mg kg!1) TKP a (P mg kg!1) N (%)
Profile 1Ap 18.8 ± 4.09a 908.2 ± 73.20 0.36Bt1 1.6 ± 0.28b 372.8 0.18Bt2 0.6 ± 0.23c 162.7 0.12
Profile 2Ap 18.9 ± 4.00a 858.9 ± 142.21 0.31Bt1 11.0 ± 0.19b 352.5 0.22Bt2 1.1 ± 0.07c 304.1 0.13Bt3 0.8 ± 0.06c 206.2 0.10
Profile 3Ap 20.5 ± 5.79a 1073.8 ± 181.17 0.32Bt1 6.0 ± 0.07b 568.4 0.13Bt2 1.1 ± 0.19c 303.9 0.10
Profile 4Ap 20.9 ± 0.17a 795.3 ± 99.94 0.40Bt1 1.7 ± 0.95b 335.0 0.15Bt2 0.6 ± 0.27b 82.7 0.11
Profile 5Ap 31.8 ± 4.83a 748.8 ± 143.32 0.33Bt1 1.0 ± 0.27b 433.7 0.14Bt2 0.1 ± 0.02c 155.3 0.09Bt3 0.1 ± 0.00c 89.4 0.08
Profile 6Ap 5.7 ± 1.26a 273.2 ± 27.83 0.24Bt1 0.2 ± 0.07b 93.6 0.11Bt2 0.1 ± 0.02b 62.2 0.10Bt3 <0.1 ± 0.01b 58.5 0.08
Profile 7Ap 32.6 ± 3.20a 1067.9 ± 276.28 0.39Bt1 8.5 ± 0.22b 355.8 0.14Bt2 0.7 ± 0.08c 282.4 0.12Bt3 0.1 ± 0.03c 116.8 0.12
Profile 8Ap 20.5 ± 2.30a 557.5 ± 146.60 0.24Bt1 5.1 ± 0.10b 165.5 0.11
(Continued)
Dow
nloa
ded
by [D
r D. G
. McG
ahan
] at 1
7:10
18
Apr
il 20
12

1208 L. A. Deubler et al.
Table 2(Continued)
Horizon WSPa (P mg kg!1) TKP a (P mg kg!1) N (%)
Bt2 4.9 ± 0.05b 192.9 0.10Bt3 <0.1 ± 0.01c 67.2 0.08
Profile 9Ap 2.1 ± 1.16a 226.0 ± 30.35 0.19Bt1 <0.1 ± <0.00b 156.2 0.14
Profile 10Ap 4.1 ± 1.80a 235.5 ± 93.19 0.17Bt1 <0.1 ± <0.00b 196.9 0.10Bt2 <0.1 ± <0.00b 74.8 0.08
aValues followed by the same letters are not significantly different within the profile, ! = 0.05.Mean ± standard deviation of three replicates. Ap WSP, n = 15; Ap horizon TKP, n = 5: Bt horizonsTKP, n = 1: %N, n = 1.
CCE might exist in neutral soils (pH of 7 or greater) through slightly alkaline (pH 7.4 to7.8) to moderately alkaline soils (pH 7.9 to 8.4) could be expected because of carbonatedomination of soil reactivity. However, the correlation between pH and percentage CCEwas less than expected (r = 0.486). Given the weakness of the pH to percentage CCEcorrelation, it is not surprising that the correlations of pH to P concentration of the differ-ent labile extractants are all weak. More important for this study, the correlations do notdifferentiate between the extractants (Table 4).
There was a correlation between labile extracted P and (total) N concentration(Table 4). The N concentration increased with proximity to the surface across the pro-files commensurate with organic-matter content and undoubtedly reflects anthropogenicP enrichment as a result of previous manure additions (Table 2). However, despite thestronger correlation between organic matter and labile P concentrations, the correlationsdo not differentiate between the labile extractants. Therefore, we conclude that we cannotdistinguish between the labile P extractants on the basis of any differences in their abilityto extract P associated with the organic fractions in the soil.
Correlation between CCE concentration and labile P was different among the differ-ent extractants, with Mehlich III showing the strongest, Olsen the weakest, and DTPAan intermediate correlation. None of the correlation coefficients were as great as the cor-relation coefficients of N to P concentrations (Table 4). Although CCE concentrationdistinguishes between the labile extractants, it is not a commonly requested agronomicsoil test.
A common soil morphological test to detect carbonate is effervescence with appli-cation of 1 N HCl to the soil. The assessment of the effervescence of a well-mixed,representative sample of the soil is also used as a qualitative measure of the amount ofcarbonates and placement into effervescence class (Soil Survey Staff 2004b).
The correlation coefficient for effervescence class to labile P extractant is some-what greater than for CCE to labile P and follows the same trend where Mehlich IIIshows a stronger correlation to effervescence class than does Olsen or DTPA (Table 4).Effervescence classes’ stronger correlation is likely due to the placement of soils into
Dow
nloa
ded
by [D
r D. G
. McG
ahan
] at 1
7:10
18
Apr
il 20
12
Efficacy of Labile P Extractants 1209
Table 3Soil levels (P mg kg!1) represented by three labile P extraction methods
from 10 sites by horizon
Horizon Olsena DTPAa Mehlich IIIa
Profile 1Ap 84.4 ± 6.74a(a) 90.9 ± 5.96a(a) 206.3 ± 36.84a(b)Bt1 39.7 ± 0.83b(a) 22.1 ± 3.04b(b) 96.1 ± 1.14b(c)Bt2 3.3 ± 0.33c(a) 3.4 ± 1.14c(a) 5.4 ± 0.23c(b)Profile 2Ap 107.3 ± 11.19a(a) 116.3 ± 4.86a(a) 255.44 ± 47.9a(b)Bt1 56.1 ± 1.18b(a) 130.9 ± 2.86a(b) 123.6 ± 1.95b(c)Bt2 27.2 ± 2.18c(a) 35.1 ± 3.68b(b) 11.7 ± 0.80c(c)Bt3 16.7 ± 1.41d(a) 17.2 ± 1.02c(a) 8.4 ± 0.02c(b)Profile 3Ap 128.7 ± 19.09a(a) 132.5 ± 21.49a(a) 271.7 ± 83.03a(b)Bt1 47.6 ± 0.53b(a) 71.0 ± 2.48b(b) 208.7 ± 4.25b(c)Bt2 10.1 ± 0.18c(a) 16.9 ± 1.23c(b) 91.9 ± 0.62c(c)Profile 4Ap 72.8 ± 5.29a(a) 87.6 ± 12.18a(a) 236.8 ± 61.63a(b)Bt1 40.6 ± 0.22b(a) 42.1 ± 0.66b(a) 37.3 ± 0.78b(a)Bt2 15.2 ± 1.48c(a) 6.5 ± 0.89c(b) 1.7 ± 0.20c(c)Profile 5Ap 107.2 ± 17.60a(a) 149.1 ± 22.12a(a) 316.3 ± 34.44a(b)Bt1 58.3 ± 1.50b(a) 134.7 ± 5.39b(b) 43.7 ± 1.02b(c)Bt2 3.3 ± 1.02c(a) 2.2 ± 0.25c(ab) 1.1 ± 0.03c(b)Bt3 2.1 ± 0.41c(a) 1.8 ± 0.10c(a) 0.2 ± 0.01c(b)Profile 6Ap 20.7 ± 4.26a(a) 31.4 ± 4.92a(b) 37.4 ± 8.46a(b)Bt1 3.7 ± 0.20b(a) 7.6 ± 0.21b(b) 4.3 ± 0.10b(c)Bt2 0.8 ± 0.30c(a) 6.4 ± 1.15b(b) 2.5 ± 1.46bc(a)Bt3 0.7 ± 0.23c(a) 1.7 ± 0.10c(b) 1.8 ± 0.15c(b)Profile 7Ap 92.5 ± 21.23a(a) 166.3 ± 52.81a(a) 426.8 ± 69.29a(b)Bt1 18.8 ± 0.27b(a) 49.8 ± 0.65b(b) 150.6 ± 2.84b(c)Bt2 14.9 ± 2.36b(a) 6.3 ± 0.81c(b) 12.4 ± 0.69c(a)Bt3 2.3 ± 0.38c(a) 2.8 ± 1.61c(a) 5.5 ± 0.31d(b)Profile 8Ap 103.6 ± 20.45a(a) 130.3 ± 24.67a(ab) 202.1 ± 50.56a(b)Bt1 43.3 ± 0.60b(a) 72.9 ± 3.90b(b) 46.5 ± 1.06b(a)Bt2 41.0 ± 0.20b(a) 57.8 ± 0.50c(b) 16.1 ± 0.37c(c)Bt3 3.1 ± 1.31c(a) 2.2 ± 0.21d(a) 1.3 ± 0.21d(a)Profile 9Ap 19.2 ± 4.07a(a) 17.0 ± 5.12a(a) 15.4 ± 6.48a(a)Bt1 11.4 ± 0.32b(a) 7.0 ± 0.79b(b) 4.2 ± 0.22b(c)Profile 10Ap 50.6 ± 9.11a(a) 41.6 ± 11.93a(a) 49.3 ± 13.73a(a)
(Continued)
Dow
nloa
ded
by [D
r D. G
. McG
ahan
] at 1
7:10
18
Apr
il 20
12
1210 L. A. Deubler et al.
Table 3(Continued)
Horizon Olsena DTPAa Mehlich IIIa
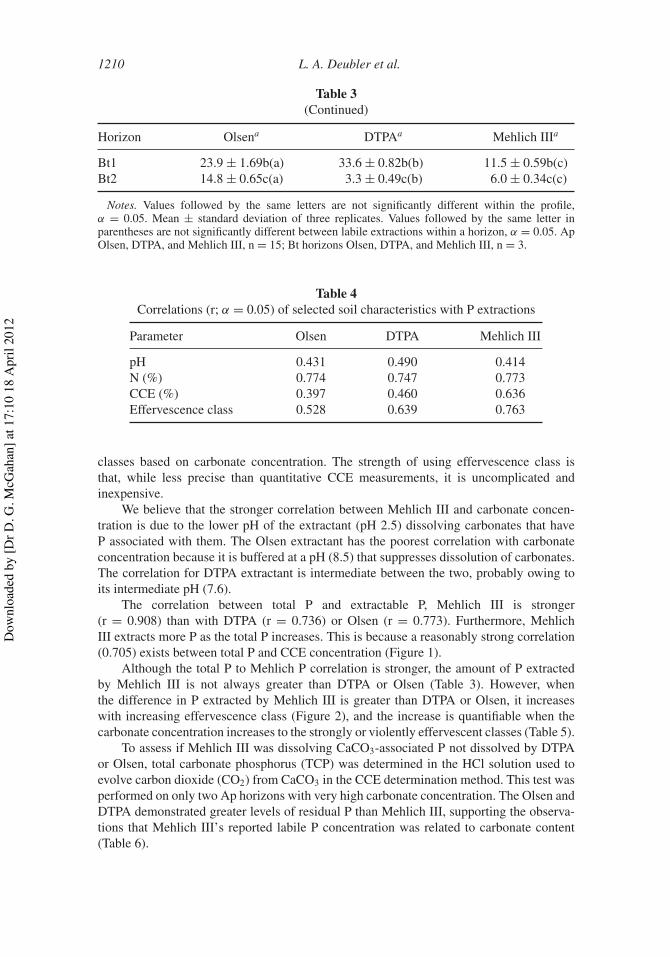
Bt1 23.9 ± 1.69b(a) 33.6 ± 0.82b(b) 11.5 ± 0.59b(c)Bt2 14.8 ± 0.65c(a) 3.3 ± 0.49c(b) 6.0 ± 0.34c(c)
Notes. Values followed by the same letters are not significantly different within the profile,! = 0.05. Mean ± standard deviation of three replicates. Values followed by the same letter inparentheses are not significantly different between labile extractions within a horizon, ! = 0.05. ApOlsen, DTPA, and Mehlich III, n = 15; Bt horizons Olsen, DTPA, and Mehlich III, n = 3.
Table 4Correlations (r; ! = 0.05) of selected soil characteristics with P extractions
Parameter Olsen DTPA Mehlich III
pH 0.431 0.490 0.414N (%) 0.774 0.747 0.773CCE (%) 0.397 0.460 0.636Effervescence class 0.528 0.639 0.763
classes based on carbonate concentration. The strength of using effervescence class isthat, while less precise than quantitative CCE measurements, it is uncomplicated andinexpensive.
We believe that the stronger correlation between Mehlich III and carbonate concen-tration is due to the lower pH of the extractant (pH 2.5) dissolving carbonates that haveP associated with them. The Olsen extractant has the poorest correlation with carbonateconcentration because it is buffered at a pH (8.5) that suppresses dissolution of carbonates.The correlation for DTPA extractant is intermediate between the two, probably owing toits intermediate pH (7.6).
The correlation between total P and extractable P, Mehlich III is stronger(r = 0.908) than with DTPA (r = 0.736) or Olsen (r = 0.773). Furthermore, MehlichIII extracts more P as the total P increases. This is because a reasonably strong correlation(0.705) exists between total P and CCE concentration (Figure 1).
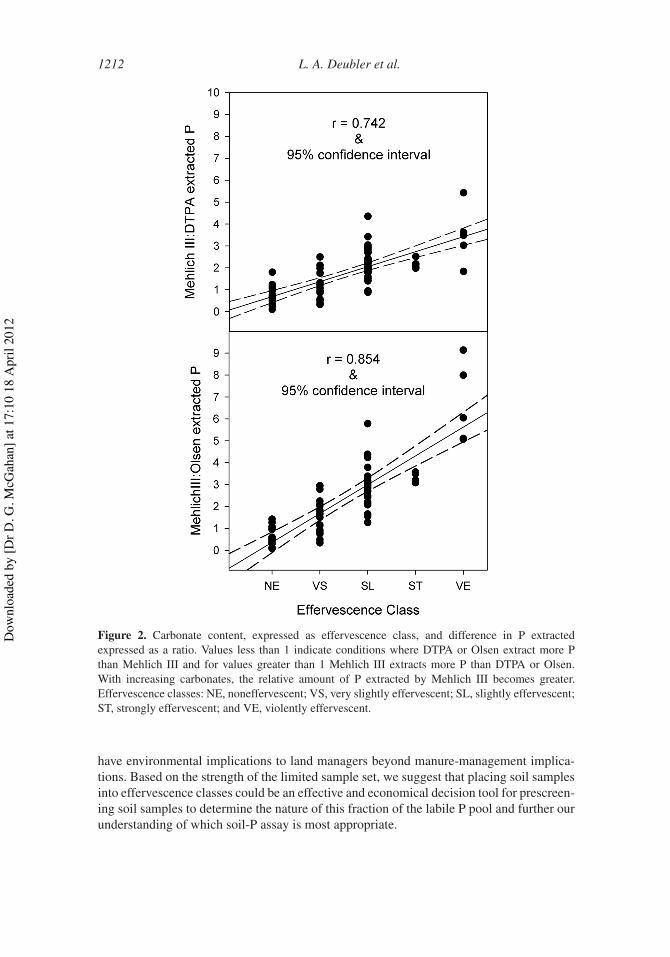
Although the total P to Mehlich P correlation is stronger, the amount of P extractedby Mehlich III is not always greater than DTPA or Olsen (Table 3). However, whenthe difference in P extracted by Mehlich III is greater than DTPA or Olsen, it increaseswith increasing effervescence class (Figure 2), and the increase is quantifiable when thecarbonate concentration increases to the strongly or violently effervescent classes (Table 5).
To assess if Mehlich III was dissolving CaCO3-associated P not dissolved by DTPAor Olsen, total carbonate phosphorus (TCP) was determined in the HCl solution used toevolve carbon dioxide (CO2) from CaCO3 in the CCE determination method. This test wasperformed on only two Ap horizons with very high carbonate concentration. The Olsen andDTPA demonstrated greater levels of residual P than Mehlich III, supporting the observa-tions that Mehlich III’s reported labile P concentration was related to carbonate content(Table 6).
Dow
nloa
ded
by [D
r D. G
. McG
ahan
] at 1
7:10
18
Apr
il 20
12

Efficacy of Labile P Extractants 1211
Figure 1. Relationships of soluble and labile P extractions to total Kjedahl digestion phosphorus(TKP).
Conclusions
The goal of this study was to determine why the common labile extractants Olsen, DTPA,and Mehlich III report such different values in an attempt to justify using a single extractantto monitor future P phytoremediation of this and similar MAFs. The Mehlich III methodto determine plant-available (labile) P generally results in a greater estimation of labile Pthan Olsen and DTPA in the presence of carbonates. The ratio of the greater estimation oflabile P increases as the carbonate concentration increases and becomes significant in thestrongly and violently effervescent classes.
This study did not determine that Mehlich III is the most valid method to estimatelabile P in this soil. However, it does raise several questions about the form, nature, andplant availability of the fraction that is the difference in the labile pool estimated from theseextractions. Although we are interested in P phytoavailability for a larger study, the fate of Pspecies from MAFs is intertwined with loss of P from soils due to the link to eutrophicationof surface waters. We see a need to understand the role carbonates play in the fate of P.Assessment of vegetation response to labile extractant values has validity, but to determineif the greater P extracted by Mehlich III would be more selectively reduced by phytoreme-diation has yet to be determined. Furthermore, determining if the fraction of the MehlichIII P pool that increases with increasing carbonates is selectively accessed by plants would
Dow
nloa
ded
by [D
r D. G
. McG
ahan
] at 1
7:10
18
Apr
il 20
12
1212 L. A. Deubler et al.
Figure 2. Carbonate content, expressed as effervescence class, and difference in P extractedexpressed as a ratio. Values less than 1 indicate conditions where DTPA or Olsen extract more Pthan Mehlich III and for values greater than 1 Mehlich III extracts more P than DTPA or Olsen.With increasing carbonates, the relative amount of P extracted by Mehlich III becomes greater.Effervescence classes: NE, noneffervescent; VS, very slightly effervescent; SL, slightly effervescent;ST, strongly effervescent; and VE, violently effervescent.
have environmental implications to land managers beyond manure-management implica-tions. Based on the strength of the limited sample set, we suggest that placing soil samplesinto effervescence classes could be an effective and economical decision tool for prescreen-ing soil samples to determine the nature of this fraction of the labile P pool and further ourunderstanding of which soil-P assay is most appropriate.
Dow
nloa
ded
by [D
r D. G
. McG
ahan
] at 1
7:10
18
Apr
il 20
12

Efficacy of Labile P Extractants 1213
Table 5Pre- and postextraction calcium carbonate equivalents (CCE) of samples by
effervescence class
Effervescence class CCE CCEOlsen CCE DTPA CCE Mehlich III
NE (17) 0.11 ± 0.14a 0.11 ± 0.14a 0.10 ± 0.13a 0.00 ± 0.00aVS (16) 0.26 ± 0.12a 0.26 ± 0.12a 0.25 ± 0.13a 0.00 ± 0.00bSL (31) 0.69 ± 0.53a 0.68 ± 0.55a 0.66 ± 0.56a 0.01 ± 0.04bST (5) 1.35 ± 0.53a 1.34 ± 0.55a 1.30 ± 0.56a 0.04 ± 0.04bVE (5) 3.97 ± 3.80a 3.95 ± 3.77a 3.90 ± 3.76a 1.50 ± 3.21b
Notes. Effervescence classes: noneffervescent, NE; very slightly effervescent, VS; slightly effer-vescent, SL; strongly effervescent, ST; and violently effervescent, VE. (n), sample population size.Mean ± standard deviation of three replicates. CCE values followed by the same letters are notsignificantly different within an effervescence class, ! = 0.05.
Table 6Pre- and postextraction total calcium phosphate (TCP, mg P kg!1) of two samples
from profile 7
Profile TCP TCPOlsen TCPDTPA TCPMehlich III
7Ap 1052.6 ± 6.57 968.7 ± 4.61a 815.7 ± 6.63b 170.4 ± 7.79c7Apsat1 1353.4 ± 10.93 1128.8 ± 5.49a 909.5 ± 8.20b 335.9 ± 7.12c
Notes. Mean ± standard deviation of three replicates. TCP (total carbonate phosphorus) followedby the same letters in parentheses are not significantly different between the labile extractions of eachsample.
References
Bremner, J. M. 1996. Nitrogen—Total. In Methods of soil analysis, part 3: Chemical Methods, ed.D. L. Sparks et al., 1086–1121. Madison, Wisc.: ASA, SSSA.
Codling, E. E., and A. R. Isensee. 2005. Effects of drinking water treatment residue on phos-phorus in runoff from poultry litter. Communications in Soil Science and Plant Analysis 36:1263–1275.
Eaton, A. D., L. S. Clesceri, and A. E. Greenberg. 1995. 4500-P.E. ascorbic acid method. InIn Standard methods for the examination of wastewater, 19th ed., ed. Eaton et al., 4–114.Washington, D.C.: American Public Health Association.
Gavlak, R. G., D. A. Horneck, and R. O. Miller. 1994. Extractable phosphorus, potassium, sulfatesulfur, zinc, iron, manganese, copper, nitrate. In Plant, soil, and water reference methods for thewestern region (Western Regional Extension Publication 125), ed. R. G. Gavlak et al., 25–26.Fairbanks, Alaska: University of Alaska Cooperative Extension Service.
Giasson, E., R. B. Bryan, and N. L. Bills. 2003. Optimization of phosphorus index and costs ofmanure management on a New York dairy farm. Agronomy Journal 95:987–983.
Gee, G. W., and J. W. Bauder. 1986. Particle-size analysis. In Methods of soil analysis, part 1:Physical and mineralogical methods, ed. A. Klute, 383–411. Madison, Wisc.: ASA, SSSA.
Haney, R. L., E. B. Haney, L. R. Hossner, and J. G. Arnold. 2006. Development of a new soilextractant for simultaneous phosphorus, ammonium, and nitrate analysis. Communications inSoil Science and Plant Analysis 37:1511–1523.
Dow
nloa
ded
by [D
r D. G
. McG
ahan
] at 1
7:10
18
Apr
il 20
12
1214 L. A. Deubler et al.
Harmel, R. D., H. A. Torbert, P. B. DeLaune, B. E. Haggard, and R. L. Haney. 2005. Field evalua-tion of three phosphorus indices on new application sites in Texas. Journal of Soil and WaterConservation 60:29–41.
Havlin, J. L., S. L. Tisdale., J. D. Beaton, and W. L. Nelson. 2005. Soil fertility and fertilizers: Anintroduction to nutrient management, 7th ed. Upper Saddle River, N.J.: Prentice Hall.
Heathwaite, A. L., A. N. Sharpley, M. Bechmann, and S. Rekolainen. 2005. Assessing the risk andmagnitude of agricultural nonpoint source phosphorus pollution. In Phosphorus: Agricultureand the environment (Agronomy Monograph 46), ed. J. T. Sims and A. N. Sharpley, 981–1020.Madison, Wisc.: ASA, CSSA, and SSSA.
Horvath, B., O. Opara-Nadi, and F. Beese. 2005. A simple method for measuring the carbonatecontent of soils. Soil Science Society of America Journal 69:1066–1068.
Kleinman, P. J. A., R. B. Bryant, W. S. Reid, A. N. Sharpley, and D. Pimental. 2000. Using soilphosphorus behavior to identify environmental thresholds. Soil Science 165:943–950.
Kuo, S. 1996. Phosphorus. In Methods of soil analysis, part 3: Chemical methods, ed. D. L. Sparkset al., 869–919. Madison, Wisc.: ASA and SSSA.
Lemunyon, J. L., and R. G. Gilbert. 1993. The concept and need for a phosphorus assessment tool.Journal of Production Agriculture 6:483–486.
Lindsay, W. L. 1979. Chemical equilibria in soils. New York: John Wiley and Sons.Lindsay, W. L., and W. A. Norvell. 1978. Development of a soil test for zinc, iron, manganese, and
copper. Soil Science Society of America Journal 42:42–428.McFarland, A., A. Saleh, and L. Hauck. 2000. Demonstration of phosphorus best management prac-
tices in the north Bosque river basin (Technical Report). Stephenville, TX: Texas Institute forApplied Environmental Research.
Mehlich, A. 1984. Mehlich 3 soil test extractant: A modification of Mehlich 2 extractant.Communications in Soil Science and Plant Analysis 15:1409–1416.
Munster, C. L., J. E. Hanzlik, D. M. Vietor, R. H. White, and A. McFarland. 2004. Assessment ofmanure phosphorus export through turfgrass sod production in Erath County, Texas. Journal ofEnvironmental Management 73:111–116.
Myers, R. G., A. N. Sharpley, S. J. Thien, and G. M. Pierzynski. 2005. Ion-sink phosphorus extractionmethods applied on 24 soils from the continental USA. Soil Science Society of America Journal69:511–521.
Olsen, S. R., C. V. Cole, F. S. Watanabe, and L. A. Dean. 1954. Estimation of available phosphorusin soils by extraction with sodium bicarbonate (USDA Circular 939). Washington, D.C.: U.S.Government Printing Office.
Osmond, D. L., M. L. Cabrera, S. E. Feagley, G. E. Hardee, C. C. Mitchell, P. A. Moore Jr., R.S. Mylavarapu, J. L. Oldham, J. C. Stevens, W. O. Thom, F. Walker, and H. Zhang. 2006.Comparing ratings of the southern phosphorus indices. Journal of Soil and Water Conservation61:325–337.
Pierzynski, G. M., and T. J. Logan. 1993. Crop, soil, and management effects on phosphorus soil testlevels. Journal of Production Agriculture 6:513–520.
Pierzynski, G. M., A. N. Sharpley, and J. L. Kovar. 2009. Methods of phosphorus analysis for soils,sediments, residuals, and waters: Introduction. In Methods of phosphorus analysis for soils,sediments, residuals, and waters (Southern Cooperative Ser. Bull. No. 408), 2nd ed., J. L. Kovarand G. M. Pierzynski, 1–3. Blacksburg, Va.: Virginia Tech University.
Pote, D. H., T. C. Daniel, A. N. Sharpley, P. A. Moore, D. R. Edwards, and D. J. Nichols. 1996.Relating extractable soil phosphorus to phosphorus losses in runoff. Soil Science Society ofAmerica Journal 60:855–859.
Schoeneberger, P. J., D. A. Wysocki, E. C. Benham, and W. D. Broderson (eds.). 2002. Field bookfor describing and sampling soils, version 2.0. Lincoln, Neb.: Natural Resources ConservationService, National Soil Survey Center.
Sharpley, A. N., and P. J. A. Withers. 1994. The environmentally sound management of agriculturalphosphorus. Fertilizer Research 39:133–146.
Sharpley, A. N., T. C. Daniel, J. T. Sims, and D. H. Pote. 1996. Determining environmentally soundsoil phosphorus levels. Journal of Soil and Water Conservation 51:160–166.
Dow
nloa
ded
by [D
r D. G
. McG
ahan
] at 1
7:10
18
Apr
il 20
12
Efficacy of Labile P Extractants 1215
Sharpley, A. N., R. W. McDowell, J. L. Weld, and P. J. A. Kleinman. 2001. Assessing site vul-nerability to phosphorus loss in an agricultural watershed. Journal of Environmental Quality30:2026–2036.
Sharpley, A. N., T. Daniel, T. Sims, J. Lemunyon, R. Stevens, and R. Parry. 2003a. Agriculturalphosphorus and eutrophication (ARS–149). University Park, Penn.: U.S. Department ofAgriculture–Agricultural Research Service.
Sharpley, A. N., R. W. McDowell, and P. J. A. Kleinman. 2004. Amounts, forms, and solubility ofphosphorus in soils receiving manure. Soil Science Society of America Journal 68:2048–2057.
Sharpley, A. N., J. L. Weld, D. B. Beegle, P. J. A. Kleinman, W. J. Gburek, P. A. Moore, andG. Mullins. 2003b. Development of phosphorus indices for nutrient management planningstrategies in the United States. Journal of Soil and Water Conservation 58:137–152.
Sims, J. T., and P. J. Kleinman. 2005. Managing agricultural phosphorus for environmental protec-tion. In Phosphorus: Agriculture and the environment (Agronomy Monograph 46), ed. J. T.Sims and A.N. Sharpley, 1021–1068. Madison, Wisc.: ASA, CSSA, and SSSA.
Soil Survey Staff. 1973. Soil survey of Erath County, Texas. Washington, D.C.: U.S. GovernmentPrinting Office.
Soil Survey Staff. 2004a. Soil survey laboratory methods manual, ver. 4.0, vol. 42. Washington, D.C.:U.S. USDA-NRCS.
Soil Survey Staff. 2004b. Soil survey technical note no. 5: Assessing carbonates in the field withdilute hydrochloric acid (HCL) solution. Available at http://soils.usda.gov/technical/technotes/. Washington, DC: U.S. Government Printing Office.
Soil Survey Staff. 2006. Keys to soil taxonomy, 10th ed. Washington, D.C.: U.S. Government PrintingOffice.
Soltanpour, P. N., and A. P. Schwab. 1977. A new soil test for simultaneous extraction of macro-and micro-nutrients in alkaline soils. Communications in Soil Science and Plant Analysis8:195–207.
Soltanpour, P. N., G. W. Johnson, S. M. Workman, J. B. Jones, and R. O. Miller. 1996. Inductivelycoupled plasma emission spectrometry and inductively coupled plasma–mass spectrometry. InMethods of soil analysis, part 3: Chemical methods, ed. D. L. Sparks et al., 91–139. Madison,Wisc.: ASA and SSSA.
Somenahally, A. 2006. Spatial variability soil test phosphorus in north central Texas dairy soils.PhD thesis, Tarleton State University.
Stevenson, F. J., and M. A. Cole. 1989. Cycles of soil: Carbon, nitrogen, phosphorus, sulfur,micronutrients. Hoboken, N.J.: John Wiley & Sons.
Taylor, M. D. 2000. Determination of total phosphorus in soil using simple Kjeldahl digestion.Communications in Soil Science and Plant Analysis 31:2665–2670.
Texas Administrative Code. 2010. Title 30: Environmental Quality. Part 1: Texas commissionon environmental quality. Chapter 321: Control of certain activities by rule. Subchapter B:Concentrated animal feeding operations. Rule §321.36: Texas pollutant discharge elimi-nation system general requirements for concentrated animal feeding operations (CAFO’s).Available online at http://info.sos.state.tx.us/pls/pub/readtacext.TacPage?sl=T&app=9&p_dir=P&p_rloc=113692&p_tloc=&p_ploc=1&pg=7&p_tac=&ti=30&pt=1&ch=321&rl=42. Accessed May, 27 2010.
Watanabe, F. S., and S. R. Olsen. 1965. Test of an ascorbic acid method for determining phosphorusin water and NaHCO3 extracts from soil. Soil Science Society of America Journal 29:667–668.
Dow
nloa
ded
by [D
r D. G
. McG
ahan
] at 1
7:10
18
Apr
il 20
12