Extracting the maximum energy from solar panels - EconStor
11
econstor Make Your Publications Visible. A Service of zbw Leibniz-Informationszentrum Wirtschaft Leibniz Information Centre for Economics Nfaoui, Mohamed; El-Hami, Khalil Article Extracting the maximum energy from solar panels Energy Reports Provided in Cooperation with: Elsevier Suggested Citation: Nfaoui, Mohamed; El-Hami, Khalil (2018) : Extracting the maximum energy from solar panels, Energy Reports, ISSN 2352-4847, Elsevier, Amsterdam, Vol. 4, pp. 536-545, http://dx.doi.org/10.1016/j.egyr.2018.05.002 This Version is available at: http://hdl.handle.net/10419/243537 Standard-Nutzungsbedingungen: Die Dokumente auf EconStor dürfen zu eigenen wissenschaftlichen Zwecken und zum Privatgebrauch gespeichert und kopiert werden. Sie dürfen die Dokumente nicht für öffentliche oder kommerzielle Zwecke vervielfältigen, öffentlich ausstellen, öffentlich zugänglich machen, vertreiben oder anderweitig nutzen. Sofern die Verfasser die Dokumente unter Open-Content-Lizenzen (insbesondere CC-Lizenzen) zur Verfügung gestellt haben sollten, gelten abweichend von diesen Nutzungsbedingungen die in der dort genannten Lizenz gewährten Nutzungsrechte. Terms of use: Documents in EconStor may be saved and copied for your personal and scholarly purposes. You are not to copy documents for public or commercial purposes, to exhibit the documents publicly, to make them publicly available on the internet, or to distribute or otherwise use the documents in public. If the documents have been made available under an Open Content Licence (especially Creative Commons Licences), you may exercise further usage rights as specified in the indicated licence. https://creativecommons.org/licenses/by-nc-nd/4.0/ www.econstor.eu
-
Upload
khangminh22 -
Category
Documents
-
view
1 -
download
0
Transcript of Extracting the maximum energy from solar panels - EconStor
econstorMake Your Publications Visible.
A Service of
zbwLeibniz-InformationszentrumWirtschaftLeibniz Information Centrefor Economics
Nfaoui, Mohamed; El-Hami, Khalil
Article
Extracting the maximum energy from solar panels
Energy Reports
Provided in Cooperation with:Elsevier
Suggested Citation: Nfaoui, Mohamed; El-Hami, Khalil (2018) : Extracting the maximum energyfrom solar panels, Energy Reports, ISSN 2352-4847, Elsevier, Amsterdam, Vol. 4, pp. 536-545,http://dx.doi.org/10.1016/j.egyr.2018.05.002
This Version is available at:http://hdl.handle.net/10419/243537
Standard-Nutzungsbedingungen:
Die Dokumente auf EconStor dürfen zu eigenen wissenschaftlichenZwecken und zum Privatgebrauch gespeichert und kopiert werden.
Sie dürfen die Dokumente nicht für öffentliche oder kommerzielleZwecke vervielfältigen, öffentlich ausstellen, öffentlich zugänglichmachen, vertreiben oder anderweitig nutzen.
Sofern die Verfasser die Dokumente unter Open-Content-Lizenzen(insbesondere CC-Lizenzen) zur Verfügung gestellt haben sollten,gelten abweichend von diesen Nutzungsbedingungen die in der dortgenannten Lizenz gewährten Nutzungsrechte.
Terms of use:
Documents in EconStor may be saved and copied for yourpersonal and scholarly purposes.
You are not to copy documents for public or commercialpurposes, to exhibit the documents publicly, to make thempublicly available on the internet, or to distribute or otherwiseuse the documents in public.
If the documents have been made available under an OpenContent Licence (especially Creative Commons Licences), youmay exercise further usage rights as specified in the indicatedlicence.
https://creativecommons.org/licenses/by-nc-nd/4.0/
www.econstor.eu

Energy Reports 4 (2018) 536–545
Contents lists available at ScienceDirect
Energy Reports
journal homepage: www.elsevier.com/locate/egyr
Research paper
Extracting the maximum energy from solar panelsMohamed Nfaoui *, Khalil El-HamiUniversity of Hassan 1St, Faculty of Khouribga, Laboratory of Nanosciences and Modeling, Khouribga, Morocco
h i g h l i g h t s
• Using programs through MATLAB to estimate the totality of the solar radiation on any inclined surface, we could determine the optimum tile angle fordaily, monthly and yearly solar radiation relative to the site of Khouribga city in Morocco. The method could be extrapolated to other cities.
• How to extract the appropriate angle under which the maximum energy could be captured and absorbed by the solar cells.
a r t i c l e i n f o
Article history:Received 7 July 2017Received in revised form 12 May 2018Accepted 15 May 2018Available online 7 September 2018
Keywords:Solar radiationEnergyInclinationOptimum tilt angle
a b s t r a c t
The performance of solar systems to convert solar radiation depends on its inclination angle to thehorizontal plane, independently from meteorological conditions. Sunlight should fall with steep angleto extract maximum power from solar panels. Therefore, optimum fixed tilt angles of solar panels shouldbe changed monthly and seasonally. In our study, MATLAB program is used to estimate the total solarradiation on a tilted panel surface with any inclination. The implementation developed to allow us toextract the correct angle at which the maximum energy could be absorbed by the solar cells. We coulddetermine the optimum tile angle for monthly, seasonal, and yearly solar radiation relative to the siteof Khouribga city (latitude 32◦52′ North and longitude −6◦54′ West), and we used the same method todraw the table of solar gains depending on the optimum tilt angle of the solar panels to themainMoroccancities.
© 2018 Published by Elsevier Ltd. This is an open access article under the CC BY-NC-ND license(http://creativecommons.org/licenses/by-nc-nd/4.0/).
1. Introduction
The design of solar systems requires knowledge of the usefulsolar radiation received on the surface of the installation, it is oneof the essential parameters of the preliminary study. For a givenenergy need, more energy received means fewer panels to installand vice versa, so in order to study the solar field available on aninclined surface at Khouribga city, a series of insolation and irradi-ation data compute according to the inclination and orientation ofthe solar panel, and then we apply the same strategy of this workin 20 Moroccan cities.
In a given city, the annual production of solar energy dependson various factors. Especially:
• Incidental solar radiation at the installation site.• Tilt and orientation of panels.• Presence where there is no shading.• Technical performance of system components (mainlymod-
ules and inverters).
* Corresponding author.E-mail addresses: [email protected] (M. Nfaoui),
[email protected] (K. El-Hami).
In this work, we precede some fundamental notions of astron-omy that give information on the radiation received by the ground(diffuse, direct and global).
We have developed a code by usingMatlab, andwe can give thedifferent coordinate systems used to calculate the solar irradiation,according to time in our city (Khouribga) of latitude 32◦52′ Northand Longitude −6◦54′ West.
2. Experimental data of solar irradiation in Khouribga city
Currently, inMorocco,measurements of solar radiation data areperformed in an instantaneous and continuous manner, this studyis carried in the Khouribga city of latitude 32◦52.86′ North andlongitude −6◦54.37′ West.
This section deals with the daily solar radiation reaching thesurface of the earth over a large area, taking full account of seasonalvariations in day length, the height of the sun above the horizon,and absorption by clouds and other atmospheric components.Solar radiation includes visible light and ultraviolet radiation.
https://doi.org/10.1016/j.egyr.2018.05.0022352-4847/© 2018 Published by Elsevier Ltd. This is an open access article under the CC BY-NC-ND license (http://creativecommons.org/licenses/by-nc-nd/4.0/).

M. Nfaoui, K. El-Hami / Energy Reports 4 (2018) 536–545 537
Nomenclature
θ Latitudeα Tilt angle.αopt Optimum tilt angle.δ The declinationAH The hour angleTSV The local solar timeH The elevationZ The zenith angleϕ The Azimuth angleZ ′ This is the angle between the vector normal to the
panel and the vertical of the place.ϕ′ It is the angle between the projection of the vector
to the normal panel on the horizontal plane andthe north.
ω Angle of IncidenceI0 Extraterrestrial solar radiation (solar constant).Idir Direct IrradiationIdif Diffused IrradiationRdif Correction factor of the diffuse radiation
Daily solar radiation incident on the earth’s surface know theextreme seasonal variation during the year (see Fig. 1).
The most radiant period of the year lasts 3, 6 months, from thefirst May to 22 August, with incident solar radiation greater than7.2 kWh/m2. The bright day of the year is 21 June, with an averageof 8, 3 kWh/m2 (Weather Spark, 0000).
The least radiated period of the year lasts 3, 4 months, from30th October to 10th February, with incident solar radiation below4,1 kWh/m2. The darkest day of the year is 17 December, with anaverage of 3.0 kWh/m2.
The typical day of the month:For a given magnitude, the typical day is the day of the month
approximating the monthly average of that magnitude (Klein,1977).
The list of the typical days proposed by Klein is shown inTable 1.
We summarize in Table 2, the data of the experimental results ofsolar irradiation obtained for each typical day in the year (WeatherSpark, 0000).
3. Study of global solar radiation at Khouribga city
The study or applications of the solar energy in a given site aredepending on more complete and detailed data on the geometricparameters and solar radiation of this site.
3.1. Modeling of geometric parameters — angle of incidence (ω)
The angle of incidence of the solar beam with any surface ofinclination and orientation is the angle formed by the directionvector of the solar beam and the normal leaving the surface (Wonet al., 1994; Sera et al., 2007) (see Fig. 2).
Where:
h: The angle of the solar height — ElevationThe angle of the sun’s height (h), or the altitude is the angle
between the direction of the sun and the horizontal surface; theelevation h from 0◦ to 90◦ towards the zenith (Oudrane et al.,2017).
sin (h) = sin (θ) sin (δ) + cos (θ) cos (δ) cos(Ah). (1)
Z: The zenith angle
Fig. 1. The daily solar radiation received on a surface of 1 m2 at Khouribga city(Weather Spark, 0000).
Fig. 2. The solar horizontal coordinates and the angle of incidence.
It is the angle between the direction of the sun and the verticalof the place (zenith). The angle Z is complementary to h (Oudraneet al., 2017).
cos (Z) = sin (δ) · sin (θ) + cos (δ) · cos (θ) · cos (Ah) . (2)
ϕ : The Azimuth angleThis is the angle between meridian and the location of the
vertical surface passing through the sun (Oudrane et al., 2017).
sin (ϕ) =cos (δ) *sin (Ah)
cos(h). (3)
Every day, the sun describes a trajectory whose twomain coor-dinates, ϕ and h, are represented on a graph (see Fig. 3).
Each geographical point potentially has its own graph of therace of the sun, whose graphs depend on the longitude, latitudeand altitude of the place.
The graph above presented the race of the sun at Khouribga city,with the hours of the day (Ennaoui, 2014).
AH: The hour angleThe hour angle AH is calculated by the daily rotation of the earth
around its axis.
AH = 15(TSV − 12) (4)
TSV is the local solar time.
δ: The DeclinationDeclination (δ) is the angle between the vector ‘‘center of the
earth–sun’’ and the equatorial surface of the earth (Oudrane et al.,

538 M. Nfaoui, K. El-Hami / Energy Reports 4 (2018) 536–545
Table 1List of typical days per month proposed by Klein.
Month Jan Feb Mar Apr may Jun Jul Aug Sep Oct Nov Dec
Days typical 17 16 16 15 15 11 17 16 15 15 14 10No. of days 17 47 75 105 135 162 198 228 258 288 318 344
Table 2Experimental data of solar radiation from Khouribga city.
Month No. of days Days typical Max flux kW/m2 Energy received kWh/m2
January 17 17 0,54 3,3February 47 16 0,66 4,4March 75 16 0,78 5,4April 105 15 0,89 6,7may 135 15 0,94 7,6June 162 11 0,99 8,2July 198 17 0,98 8,1August 228 16 0,95 7,3September 258 15 0,84 6,2October 288 15 0,69 5,0November 318 14 0,57 3,5December 344 10 0,50 3,1
Fig. 3. Diagrams of the azimuth φ and elevation h with the notion of time.
Fig. 4. Variation of the extraterrestrial solar irradiance.
2017; Crispim et al., 2007).
δ = 23.45 sin[2π365
(j + 284)]. (5)
j: the sequence number of days in the year.
θ: the latitude of the place.
Γ⃗: The unit vector carried by the direction of the solar rays.
n⃗: The unit vector carried by the normal to the surface.
ω : Angle of Incidence the angle between (Γ⃗ , n⃗).
Γ⃗ =
{sin (Z) · cos (ϕ)sin (Z) · sin (ϕ)
cos (Z)and n⃗ =
⎧⎨⎩cos
(Z ′
)· cos
(ϕ′
)cos
(Z ′
)· sin
(ϕ′
)cos
(Z ′
).
We make the scalar product of two vectors, Γ⃗ and n⃗ for deter-mining the angle ω;
Γ⃗ · n⃗ = ∥Γ⃗ ∥ · ∥n⃗∥ · cos(ω) = cos(ω) (6)
Γ⃗ · n⃗ = sin(Z) sin(Z ′) cos(ϕ) cos(ϕ′)+ sin(Z) · sin(ϕ) · sin(Z ′) · sin(ϕ′) + sin(Z) · sin(Z ′).
And we have:
sin(ϕ) sin(ϕ′) + cos(ϕ) cos(ϕ′) = cos(ϕ − ϕ′).
We thus find:
cos(ω) = cos(h) cos(ϕ − ϕ′) sin(Z ′) + sin(h) sin(Z ′). (7)
3.2. Solar radiation to the crossing of the atmosphere
The earth surrounded by its atmosphere intercepts some of thepower radiated by the sun; it radiates an approximately constantpower. The extraterrestrial irradiance on a surface normal to thesolar radiation is given by Won et al. (1994), Ennaoui (2014) andJan (2011) (see Fig. 4):
I0 = SC(1 + 0.034 cos
(360j365
)). (8)
3.3. Energy from the Sun at the Earth’s Surface
In the previous section,we posed a number of definitions allow-ing us to formulate the concept of solar radiation outside the atmo-sphere. This quantity is readilymeasurable because it is consideredthat it depends only on the distance between themeasuring pointsof the Sun. We will see in this paragraph, the passage throughthe atmosphere will tend to complicate the understanding of the

M. Nfaoui, K. El-Hami / Energy Reports 4 (2018) 536–545 539
phenomenon, the multiple interactions that may occur, in whatfollows, we consider the model of inclination of global radiationin the case of a clear sky.
• Direct-beam radiation: that passes in a straight line throughthe atmosphere to the receiver.
• Diffuse radiation: that has been scattered by molecules andaerosols in the atmosphere.
• Reflected radiation: that has bounced off the ground orother surface in front of the collector.
3.3.1. Direct irradiationThis irradiation is received directly from the sun traveling
through the atmosphere without modification. The capture area isplaced in the following conditions:
• The sun’s position is defined by its elevation (h) and azimuth(ϕ).
• The azimuth angle (ϕ) is measured relative to the South.• The collector plan is oriented with respect to the south and
inclined at an angle α as tilt angle.
The received power on the capture area is given by (Ennaoui, 2014;Crispim et al., 2007):
IDir = A · exp(−K · m). (9)
This is an amount that includes the geographic parameters of thesystem and the astronomical data of the sun in its movement.
A = 1160 + 75 · sin(360365
(j − 275))
W/m2 (10)
K = 0.175 + 0.035 sin(360365
(j − 100)) (11)
m =1
sin(h). (12)
A: apparent extraterrestrial flux.k: optical depth.j is the order of the day number in the year, and h is the elevationof the sun.m is the relative length of the path traveled by the sun’s raysthrough the atmosphere.The evaluation of the direct energy received in one day on anincline south facing is done by integrating the instantaneous powerreceived.
3.3.2. Diffused irradiationClouds, aerosols partly diffuse radiation (Markam and K, 2016;
Jan, 2011; Masoum and Sarvi, 2002), as we have previously quan-tified.
It is assumed that the diffuse flux is uniform in its distributionin the sky which is treated as an infinite surface. This assumptionallows us to calculate the correction factor Rdif on the diffuseradiation; once the chosen inclination (Sera et al., 2007; Ennaoui,2014).
Rdif =1 + cos(α)
2(13)
α is the tilt angle.The power received on a capture area is:
IDif = C · IDir · Rdif (14)
C = 0.095 + 0.04 sin(360365
(j − 100)). (15)
Fig. 5. Both direct and diffuse powers received in function of time.
Fig. 6. Annual powers radiations in Khouribga.
Rdif is the form factor between collector and sky. The diffusedenergy received is also calculated in the same way by integratingthe power (cf. Fig. 5).
The implementation of this formula gives a clear idea about thedifferent values of energy daily, monthly and yearly.
3.4. Calculation of average distribution of solar irradiation
3.4.1. Calculation of daily irradiationBy using a Matlab code, we can calculate the daily distribution
of solar radiation received on a horizontal surface in Khouribga city(the corresponding value of 21 June).
The Matlab code that we have developed, also allows calculat-ing and plotting the daily irradiation of typical days of each monthfor Khouribga city on a horizontal surface.
The results of daily variations of solar irradiation arriving on ahorizontal surface are given in Table 3.
3.4.2. Calculation of monthly irradiationThe graph below shows the evolution of themonthly irradiation
on a horizontal surface (see Fig. 6).The figure shows the values of the daily energies of the solar
radiation received on a surface relative of the Khouribga city,according to the days of the year in [kWh/(m2 day)].
The curve analysis obtained above indicates that the values ofdirect, diffuse and global solar radiation are maximum in summerand minimum in winter. The global solar energy has exceeded7000 Wh/m2 for summer days, on the other hand, for winter daysto extend between (3000 and 6000 Wh/m2).

540 M. Nfaoui, K. El-Hami / Energy Reports 4 (2018) 536–545
Table 3The energy received per days (Wh/m2).
Month Days typical No. of days Direct energy Diffuse energy Total energy
January 17 17 3442 397 3839February 16 47 4346 526 4872March 16 75 5490 713 6203April 15 105 6439 947 7386may 15 135 6906 1153 8059June 11 162 6982 1273 8255July 17 198 6804 1248 8052August 16 228 6350 1163 7513September 15 258 5546 970 6516October 15 288 4481 742 5223November 14 318 3535 544 4079December 10 344 3122 431 3553
Table 4The monthly and yearly energy received.
Months The energy received per month (kWh/m2)
Direct energy Diffuse energy Total energy
January 106,7 13,2 119.9February 121,7 14,7 136.4March 170,2 22,1 192.3April 193,2 28,4 221.6may 214,1 35,7 249.8June 209,4 38,2 247.6July 210,9 39,6 250.5August 196,9 36,0 232.9September 166,4 29,1 195.5October 138,9 23,0 161.9November 106,1 16,3 122.4December 96,8 13,4 110.2Annual radiation [kWh/m2 year] 1931,1 309,8 2240,9
Fig. 7. Distribution of monthly energy in Khouribga.
3.4.3. Cumulative energy for each month of the yearThe cumulative energy calculation is done by integrating the
power formulas between sunrise and sunset. This method makesit possible to estimate the energy received by a horizontal surface.Use the same Matlab code that calculates and tracks the evolutionof cumulative solar energy in each month of the year. In thefigure representing the energy of solar radiation calculated for theKhouribga site, the summary of the results is given in Table 4 (seeFig. 7).
The table and the histogram representing the monthly distri-bution of solar irradiation and for the whole year, informs us aboutthe cumulative energy distribution of themonths, we note that themaximum solar radiation greater than 200 kWh/m2 correspondingthe summer months (days with high sunstroke), and below 120kWh/m2 for the winter months, a very remarkable seasonal effect
Table 5The optimum inclination for each month of the year.
Months αopt tilt angle kWh/m2 month
Jan 57◦ 209,6Feb 48◦ 198Mar 43◦ 229,9Apr 18◦ 232May 6◦ 250,8Jun 0◦ 247,9Jul 5◦ 250,7Aug 13◦ 238,2Sep 28◦ 218,6Oct 43◦ 215,9Nov 54◦ 200,1Dec 59◦ 202,3Annual radiation [kWh/m2 year] 2694
appears on the form of grouping the bars of the histogram (Torres 1et al., 2017).
Through this representation, the annual energy received on ahorizontal plane of the Khouribga city is 2241 kWh/m2.
4. Optimum tilt of solar panels
Taking into account the above formulations, the counting en-ergy is developed in MATLAB to derive the energy received an-nually, seasonal and per month. This was achieved by a simpleintegral calculation in a regular time interval equal to 3 min, andapplied to a surface of panel 1 m2 choosing inclination anglesvarying from 0 to 90◦ with step 1◦ (Jamil Ahmad and Tiwari, 2009;Ulgen, 2006).
A Matlab code has been developed which calculates and plotsthe solar energy of each month according to the inclination of aphotovoltaic module.
The values of the optimummonthly angle given in the table areas follows (see Table 5).

M. Nfaoui, K. El-Hami / Energy Reports 4 (2018) 536–545 541
Table 6Seasonal and annual solar energy at seasonal tilt angle.
Period Months Seasonal tilt angle kWh/m2 Season
Winter Dec–Jan–Feb 55◦ 606,6Spring Mar–Apr–May 19◦ 697,8Summer Jun–Jul–Aug 5◦ 733,7Autumn Sep–Oct–Nov 42◦ 624,2Annual radiation [kWh/m2 year] 2662,5
This allows us to deduce the optimum tilt angle of the solarpanel which would lead to the maximum energy production fora given month and for a year.
The seasonal average was calculated by finding the averagevalue of the tilt angle for each season, and the implementation ofthis requires that the collector tilt be changed four times in a year.In winter (December, January, and February) the tilt should be 55◦,in spring (March, April, and May) 19◦, in summer (June, July, andAugust) 5◦, and in autumn (September, October, and November)42◦.
The figures showing the solar energy received for each season ofthe year, according to different angle of inclination and orientationof Khouribga city (see Fig. 8).
The value of the seasonal tilt angle receives the maximumof seasonal solar radiations on at this tilted surface are given inTable 6.
For fixed panels are installed in a correct position throughoutthe year,We can calculate the annual energy by a simple integral ina regular time interval froma surface of 1m2 with angles of inclina-tion different from 0◦ to 90◦ and the azimuth from 60◦ to 300◦ endDetermine the angle of inclination and the optimal orientation ofthe solar panels to access themaximumenergy output (Li and Lam,2007; Gunerhan and Hepbasli, 2007).
Accordingly, the annual solar energy yield was determined andis shown in Fig. 9. The peak value is 2524 kWh/m2 which is quitegood for active solar applications in Khouribga city.
When the tilt angle is beyond 30◦, the annual solar yield fallsslightly with increasing tilt angles. As the latitude of Khouribgacity is 32◦52′ north, the finding supports the argument that theoptimal tilt angle for solar energy collection would be very closeto the angle equivalent to the latitude of the location.
Results and discussion on optimal tilt angle in Khouribga city:We have taken a simple mathematical model (the Eqs. (8) to
(15)) to calculate the monthly, seasonal and annual average of theincident solar irradiation on a south-facing surface with a differenttilt angle relative to the horizontal, from 0◦ to 90◦ with step of1◦, and this by carrying a program executed under Matlab. See theresults in Table 7.
From the table, it can be seen that themaximum incident energyand that received on an inclined plane by an optimummonthly tiltangle. The choice of tilt depends on the load. For example, for solarrefrigeration, the best is to get the maximum energy in summer.
So to make the most of solar irradiation, the result of the tableshows that it is necessary to change the solar panels inclinationeach month, if this is not possible, opt for the seasonal tilt angle.The improvement of the capture efficiency by the orientation andinclination of the solar panels makes it possible to obtain a rationaluse of the incident solar energy, thus reducing the cost of the solarsystem being used.
The purpose of this study was to obtain results of optimum tiltangle desired at the allotted time (monthly, seasonal and annual)to optimize the solar irradiation received by the solar panels.Khouribga in winter, the sun is low compared to the horizon, toobtain the best performance it will be necessary to favor a widetilt angle. In spring the best tilt angle is at 19◦, and in summer theoptimal angle is at 5◦.
(a) Winter season.
(b) Spring season.
(c) Summer season.
(d) Autumn season.
Fig. 8. Optimal tilt angle, orientation and the solar energy received for each seasonof the year.

542 M. Nfaoui, K. El-Hami / Energy Reports 4 (2018) 536–545
Table 7Annual solar radiation at different tilt angle.
Optimum tilt angle Monthly tilt angle Seasonal tilt angle Annual tilt angle Horizontal surface
Energy received [kWh/m2/year] 2694,0 2662,5 2524,0 2240,9
Fig. 9. Annual solar energy yield (kWh/m2) for various tilt angles and orientations.
We can give examples of the importance of our study:• In solar thermal:We want to produce more heat in winter and less heat in
summer. So we will try to have an optimum angle of winter, thenearest possible 55◦.
• Air conditioners and solar refrigerators:We have to optimize the receive solar irradiation in summer,
as a result, it is preferable to favor production in summer, and todecrease a little the one of winter,
• In photovoltaic and thermal solar:Electricity and hot water needs were constant throughout the
year; the best inclination is therefore that of maximum sunshine,that is to say 30◦.
5. Calculation of solar radiation received on the optimum tiltangle surface
Wewill study in this part the influence of the optimum tilt angleon the amount of solar irradiation received on a surface of 1 m2, inKhouribga city we used the results of previous part, the optimal tiltangle is 30◦ and the direction of the azimuth 180◦ (south).
5.1. Daily irradiation
The Matlab code that we used, allows us to calculate and plotthe daily solar irradiation received on an optimal exposure surfaceof the typical days of each month. The results are given in Table 8.
We have added curves giving the daily variations of the so-lar irradiation, indicating the maximum of direct, diffuse andglobal solar energy arriving at a surface of optimal exposure (seeFig. 10).
The analysis of the curves obtained above indicates that thevalues of direct, diffuse and global solar radiation are maximumin summer and minimum in winter in Khouribga city. The globalradiation energy exceeds 7000Wh/m2 in the summer days, on theother hand, for the winter days extend between (5700 and 7000Wh/m2).
Fig. 10. Evolution of direct, diffuse and global solar radiation in the year, onoptimum exposure.
Fig. 11. Themonthly direct, diffuse and global solar radiation, of optimumexposure.
5.2. The energy that accumulates for each month
We used the same calculation method of the previous part; thecumulative energy calculation is done by integrating the powerformulas between sunrise and sunset. This method estimates themonthly energy received on an inclined surface of 30◦ and facingsouth. The results are shown in Fig. 11.
We can summarize the resultswhich are given by the histogramin Table 9.
The provides information on the distribution of solar energy foreachmonth, the energy is superior to 200 kWh/m2 of the 8months;corresponding the summer and intermediate months of the year,for the winter months their energy is below 200 kWh/m2.
In the end, we get on the global of annual energy receivedon a surface of the optimum tilt angle (30◦) and facing south; atKhouribga city is 2524 kW/m2.
Perspective the next step of our studyThe climate of Khouribga province is the semi-arid and conti-
nental with hot summers and cold winters, and has a number ofagricultural areas that need irrigation throughout the year, the bestway to do this is to use irrigation systems of photovoltaic pumping.

M. Nfaoui, K. El-Hami / Energy Reports 4 (2018) 536–545 543
Fig. 12. Need monograph in Irrigation Water, province of Khouribga (Hydraulic Basin, 0000).
Table 8Values of the daily irradiation of the typical days of each month.
Month The energy received per days (Wh/m2)
Days typical No. of days Direct energy Diffuse energy Total energy
January 17 17 5621 401 6022February 16 47 6288 505 6793March 16 75 6734 675 7409April 15 105 6736 891 7627May 15 135 6403 1083 7486June 11 162 6132 1194 7326July 17 198 6119 1207 7326August 16 228 6323 1101 7424September 15 258 6395 916 7311October 15 288 6094 699 6793November 14 318 5567 512 6079December 10 344 5286 411 5697
Table 9The monthly cumulative energy of optimum exposure.
Month The energy received per month (kWh/m2)
Direct energy Diffuse energy Total energy
January 173.08 12.33 185.41February 173.85 13.78 187.63March 207.54 20.74 228.28April 201.51 26.69 228.20may 198.19 33.60 231.79June 183.58 35.91 219.48July 189.82 37.17 226.99August 195.83 33.87 229.71September 191.27 27.27 218.55October 188.07 21.49 209.56November 166.60 15.20 181.80December 164.04 12.44 176.48All year 2233.4 290.6 2524
Our study aims to promote optimizing the use solar pumping inKhouribga province, according to the hydrological characteristicsfor each agricultural area in our province.
Solar pumping is characterized by a variable flow throughoutthe days of the year, when the photovoltaic field starts to produceelectricity; the flow is produced by the pump, and it is directlyrelated to the intensity of solar irradiation received on the photo-voltaic surface.
For this reason, we have thought of maximizing the productiv-ity of solar pump systems by integrating the seasonal tilt angleaccording to the borehole, the water source used and the otherparameters.
6. Study of solar radiation according to the optimum tilt anglein 20 Moroccan cities
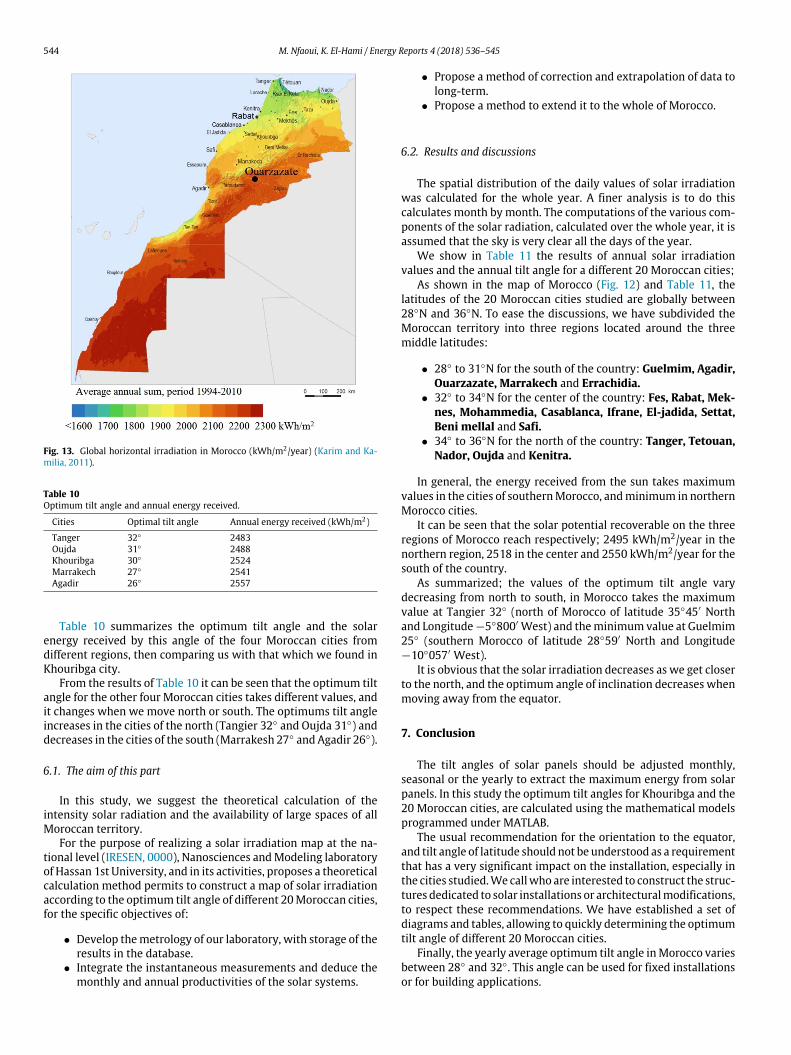
Solar radiation distribution is expressed as annual global solarenergy received on a horizontal plane (in kilowatt hours per squaremeter per year). The 1st parameter influenced on the solar energydistribution is the latitude, that is to say the distance from theequator. Solar irradiation decreases as we get closer to the poles(or move away from the equator) (Hochberg, 2016).
Morocco has a great potential for the production of solar energy,and the (photovoltaic and solar thermal) are the two technologiesfavored for the exploitation of this solar potential (see Fig. 13).
The solar potential is estimated at more than 3400 MWp. Withmore than 3000 h/year of sunshine, an average solar irradiationof 2500 kWh/m2/year, the Morocco enjoys a very significant solarpotential (Karim and Kamilia, 2011).
Fig. 13 shows that the energy received is strongly influencedby the geographical position. During the year it is the cities of thesouth that receive the maximum of irradiation.
544 M. Nfaoui, K. El-Hami / Energy Reports 4 (2018) 536–545
Fig. 13. Global horizontal irradiation in Morocco (kWh/m2/year) (Karim and Ka-milia, 2011).
Table 10Optimum tilt angle and annual energy received.
Cities Optimal tilt angle Annual energy received (kWh/m2)
Tanger 32◦ 2483Oujda 31◦ 2488Khouribga 30◦ 2524Marrakech 27◦ 2541Agadir 26◦ 2557
Table 10 summarizes the optimum tilt angle and the solarenergy received by this angle of the four Moroccan cities fromdifferent regions, then comparing us with that which we found inKhouribga city.
From the results of Table 10 it can be seen that the optimum tiltangle for the other four Moroccan cities takes different values, andit changes when we move north or south. The optimums tilt angleincreases in the cities of the north (Tangier 32◦ and Oujda 31◦) anddecreases in the cities of the south (Marrakesh 27◦ and Agadir 26◦).
6.1. The aim of this part
In this study, we suggest the theoretical calculation of theintensity solar radiation and the availability of large spaces of allMoroccan territory.
For the purpose of realizing a solar irradiation map at the na-tional level (IRESEN, 0000), Nanosciences andModeling laboratoryof Hassan 1st University, and in its activities, proposes a theoreticalcalculation method permits to construct a map of solar irradiationaccording to the optimum tilt angle of different 20Moroccan cities,for the specific objectives of:
• Develop themetrology of our laboratory, with storage of theresults in the database.
• Integrate the instantaneous measurements and deduce themonthly and annual productivities of the solar systems.
• Propose a method of correction and extrapolation of data tolong-term.
• Propose a method to extend it to the whole of Morocco.
6.2. Results and discussions
The spatial distribution of the daily values of solar irradiationwas calculated for the whole year. A finer analysis is to do thiscalculates month by month. The computations of the various com-ponents of the solar radiation, calculated over the whole year, it isassumed that the sky is very clear all the days of the year.
We show in Table 11 the results of annual solar irradiationvalues and the annual tilt angle for a different 20 Moroccan cities;
As shown in the map of Morocco (Fig. 12) and Table 11, thelatitudes of the 20 Moroccan cities studied are globally between28◦N and 36◦N. To ease the discussions, we have subdivided theMoroccan territory into three regions located around the threemiddle latitudes:
• 28◦ to 31◦N for the south of the country: Guelmim, Agadir,Ouarzazate, Marrakech and Errachidia.
• 32◦ to 34◦N for the center of the country: Fes, Rabat, Mek-nes, Mohammedia, Casablanca, Ifrane, El-jadida, Settat,Beni mellal and Safi.
• 34◦ to 36◦N for the north of the country: Tanger, Tetouan,Nador, Oujda and Kenitra.
In general, the energy received from the sun takes maximumvalues in the cities of southernMorocco, andminimum in northernMorocco cities.
It can be seen that the solar potential recoverable on the threeregions of Morocco reach respectively; 2495 kWh/m2/year in thenorthern region, 2518 in the center and 2550 kWh/m2/year for thesouth of the country.
As summarized; the values of the optimum tilt angle varydecreasing from north to south, in Morocco takes the maximumvalue at Tangier 32◦ (north of Morocco of latitude 35◦45′ Northand Longitude−5◦800′ West) and theminimum value at Guelmim25◦ (southern Morocco of latitude 28◦59′ North and Longitude−10◦057′ West).
It is obvious that the solar irradiation decreases as we get closerto the north, and the optimum angle of inclination decreases whenmoving away from the equator.
7. Conclusion
The tilt angles of solar panels should be adjusted monthly,seasonal or the yearly to extract the maximum energy from solarpanels. In this study the optimum tilt angles for Khouribga and the20 Moroccan cities, are calculated using the mathematical modelsprogrammed under MATLAB.
The usual recommendation for the orientation to the equator,and tilt angle of latitude should not be understood as a requirementthat has a very significant impact on the installation, especially inthe cities studied.We callwho are interested to construct the struc-tures dedicated to solar installations or architecturalmodifications,to respect these recommendations. We have established a set ofdiagrams and tables, allowing to quickly determining the optimumtilt angle of different 20 Moroccan cities.
Finally, the yearly average optimum tilt angle inMorocco variesbetween 28◦ and 32◦. This angle can be used for fixed installationsor for building applications.

M. Nfaoui, K. El-Hami / Energy Reports 4 (2018) 536–545 545
Table 11Annual solar radiation, according to optimum tilt angle in 20 Moroccan cities.
Cities Geographical data Optimal tilt angle Annual energy received (kWh/m2)
Latitude Longitude
Tanger 35◦45′N −5.800 W 32◦ 2483,27Tetouan 35◦34′N −5.366 W 32◦ 2512,52Nador 35◦10′N −2.933 W 31◦ 2484,67Oujda 34◦41′N −1.911 W 31◦ 2487,80Kenitra 34◦15′N −6.578 W 30◦ 2506,03Fes 34◦02′N −5.000 W 30◦ 2505,70Rabat 34◦01′N −6.841 W 30◦ 2509,71Meknes 33◦53′N −5.554 W 30◦ 2508,78Mohammedia 33◦41′N −7.382 W 30◦ 2514,91Casablanca 33◦32′N −7.583 W 30◦ 2517,08Ifrane 33◦31′N −5.116 W 30◦ 2512,40El-jadida 33◦14′N −8.500 W 29◦ 2522,40Settat 33◦00′N −7.616 W 29◦ 2523,73Beni mellal 32◦20′N −6.360 W 28◦ 2530,35Safi 32◦17′N −9.233 W 28◦ 2534,60Errachidia 31◦55′N −4.424 W 28◦ 2530,92Marrakech 31◦37′N −8.008 W 27◦ 2541,19Ouarzazate 30◦55′N −6.893 W 27◦ 2548,29Agadir 30◦25′N −9.600 W 26◦ 2556,95Guelmim 28◦59′N −10.057 W 25◦ 2573,30
References
Crispim, J., Carreira, M., Castro, R., 2007. Validation of photovoltaic electricalmodels against manufacturers data and experimental results. In: Proceedings.International Conference on Power Engineering, Energy and Electrical Drives,Powereng, pp. 556–561.
Ennaoui, Ahmed, 2014. Photovoltaic Solar Energy Conversion (PVSEC) Helmholtz-Zentrum Berlin Für Materialien Und Energie- Free. University of Berlin-Allemand.
Gunerhan, H., Hepbasli, A., 2007. Determination of the optimum ilt angle of solarcollectors for building applications. Build. Environ. 42 (2), 779–783.
Hochberg, Michael, 2016. Renewable Energy Growth in Morocco. In: Policy FocusSeries, Middle East Institute, p. 5.
Hydraulic Basin Agency of Oum Er Rbia, Khouribga Monograph Need IrrigationWater http://www.abhoer.ma 05-2018.
IRESEN, The ‘‘propre.ma’’ project of the draws photovoltaic Morocco, http://www.iresen.org/2014-2016.
Jamil Ahmad, M., Tiwari, G.N., 2009. Optimization of tilt angle for solar collector toreceive maximum radiation. Open Renew. Energy J. 2, 19–24.
Jan, Alain Ricaud, 2011. Gisement solaire et transferts énergétiques. In: MasterRenewable Energies. University of Cergy-Pontoise.
Karim, E., Kamilia, M., 2011. Study, design and dimensioning of the second trancheof the solar project of OUARZAZATE: The 100 MW photovoltaic plant, NationalSchool of Mineral Industry (ENIM), p. 18.
Klein, S.A., 1977. Calculation of monthly average insolation on tilted surfaces. Sol.Energy 19, 325–329.
Li, Danny H.W., Lam, Tony N.T., 2007. Determining the optimum tilt angle andorientation for solar energy collection based on measured solar radiance data.Int. J. Photoenergy 85402.
Markam, K., Sudhakar, K., 2016. Estimation of optimal tilt angle for solar photo-voltaic installations in India. Int. Res. J. Eng. Technol. 03 (05), 2737–2738.
Masoum, M.A.S., Sarvi, M., 2002. Design, simulation and construction of a newfuzzy-based maximum power point tracker for photovoltaic applications. In:Proceedings of the Australasian University Power System Engineering Confer-ence (AUPEC ’02).
Oudrane, A., Zeghmati, B., Chesneou, X., Aour, B., 2017. Modeling the radiate andenergy balance of a building located in the adrar region collection ofmechanics.El Wancharissi Univ. Cent. Tissemsilt 1 (002), 81–82.
Sera, D., Teodorescu, R., Rodriguez, P., 2007. PV panel model based on datasheetvalues. In: Proceedings. IEEE International Symposium on Industrial Electronics(ISIE), pp. 2392–2396.
Torres 1,M.J., Rus-Casas 1, C., Lemus-Zúñiga, L.G., Hontoria, L., 2017. The importanceof accurate solar data for designing solar photovoltaic systems case studies inSpain, University of Jaén Las Lagunillas Campus-Spain, Sustainability 2017, 9,247, http://dx.doi.org/10.3390/su9020247, pp. 10–11.
Ulgen, K., 2006. Optimum tilt angle for solar collectors. Energy Sources Part A 28,1171–1180.
Weather Spark, Ordinary weather in Khouribga https://fr.weatherspark.com 03-2018.
Won, Y., Kim, D.H., Kim, S.C., Kim,W.S., Kim, H.S., 1994. Newmaximumpower pointtracker of photovoltaic arrays using fuzzy controller. In: Proceedings of the 25thAnnual IEEE Power Electronics Specialists Conference, pp. 396–403, June.