Bremond et al 2012-GCB-Neotropical C3-C4 grass distributions
Upload
independentCategory
view
1download
0
Efferent Projections of C3 Adrenergic Neurons in theRat Central Nervous System
Charles P. Sevigny,1 Jaspreet Bassi,1 David A. Williams,1 Colin R. Anderson,2
Walter G. Thomas,3 and Andrew M. Allen1,4*1Department of Physiology, University of Melbourne, Melbourne, Victoria, Australia2Department of Anatomy and Cell Biology, University of Melbourne, Melbourne, Victoria, Australia3School of Biomedical Sciences, University of Queensland, Queensland, Australia4Florey Neurosciences Institutes, University of Melbourne, Melbourne, Victoria, Australia
ABSTRACTC3 neurons constitute one of three known adrenergic
nuclei in the rat central nervous system (CNS). While
the adrenergic C1 cell group has been extensively
characterized both physiologically and anatomically, the
C3 nucleus has remained relatively obscure. This study
employed a lentiviral tracing technique that expresses
green fluorescent protein behind a promoter selective
to noradrenergic and adrenergic neurons. Microinjection
of this virus into the C3 nucleus enabled the selective
tracing of C3 efferents throughout the rat CNS, thus
revealing the anatomical framework of C3 projections.
C3 terminal fields were observed in over 40 different
CNS nuclei, spanning all levels of the spinal cord, as
well as various medullary, mesencephalic, hypothalamic,
thalamic, and telencephalic nuclei. The highest den-
sities of C3 axon varicosities were observed in Lamina
X and the intermediolateral cell column of the thoracic
spinal cord, as well as the dorsomedial medulla (both
commissural and medial nuclei of the solitary tract,
area postrema, and the dorsal motor nucleus of
the vagus), ventrolateral periaqueductal gray, dorsal
parabrachial nucleus, periventricular and rhomboid
nuclei of the thalamus, and paraventricular and periven-
tricular nuclei of the hypothalamus. In addition, moder-
ate and sparse projections were observed in many
catecholaminergic and serotonergic nuclei, as well as
the area anterior and ventral to the third ventricle,
Lamina X of the cervical, lumbar, and sacral spinal
cord, and various hypothalamic and telencephalic
nuclei. The anatomical map of C3 projections detailed
in this survey hopes to lay the first steps toward devel-
oping a functional framework for this nucleus. J. Comp.
Neurol. 520:2352–2368, 2012.
VC 2012 Wiley Periodicals, Inc.
INDEXING TERMS: autonomic regulation; lentivirus; sympathetic preganglionic neurons; phenylethanolamine
N-methyltransferase; catecholamines
C3 neurons of the rostral dorsomedial medulla consti-
tute one of three known adrenergic nuclei in the rat
central nervous system (CNS), characterized by their
expression of all the catecholamine-synthesizing
enzymes, including tyrosine hydroxylase (TH), dopamine-
b-hydroxylase, and phenylethanolamine N-methyltrans-
ferase (PNMT). While their counterparts, the C1 neurons,
have been widely studied due to their role in regulating
sympathetic vasomotor activity (Reis et al., 1989; Card
et al., 2006; Guyenet, 2006; Stornetta, 2009), the C3 cell
group, which constitutes �15% of all adrenergic neurons
in the rat CNS (Minson et al., 1990), has yet to be
investigated in detail.
The C3 nucleus is a medullary midline structure in the
medial longitudinal fasciculus that spans from the ventral
surface of the fourth ventricle to the dorsal tip of raphe
obscurus, and rostrocaudally between the caudal tip of
the dorsal paragigantocellular nucleus and the rostral
extent of the hypoglossal nucleus. These cells were first
characterized as adrenergic (Hokfelt et al., 1973) and
have since been shown to express vesicular glutamate
transporter 2 (VGluT2), suggesting they are glutamatergic
Grant sponsor: Australian Research Council; Grant number: DP1094301;Grant sponsor: Australian National Health and Medical Research Council;Grant number: 566536; Grant sponsor: NHMRC Dora Lush PostgraduateScholarship (to C.P.S.).
*CORRESPONDENCE TO: A. Prof. Andrew M. Allen, Department ofPhysiology, University of Melbourne, Victoria 3010, Australia.E-mail: [email protected]
VC 2012 Wiley Periodicals, Inc.
Received August 9, 2011; Revised October 6, 2011; Accepted January 7,2012
DOI 10.1002/cne.23041
Published online January 11, 2012 in Wiley Online Library(wileyonlinelibrary.com)
2352 The Journal of Comparative Neurology | Research in Systems Neuroscience 520:2352–2368 (2012)
RESEARCH ARTICLE
(Stornetta et al., 2002). Subpopulations of C3 neurons
coexpress neuropeptide Y mRNA (Stornetta et al., 1999),
glucocorticoid receptor immunoreactivity (Sawchenko
and Bohn, 1989), and cocaine- and amphetamine-related
transcript (CART) immunoreactivity (Wittmann et al.,
2004). Various retrograde tracing studies have identified
that subsets of C3 neurons project to the thoracic spinal
cord (Minson et al., 1990), paraventricular nucleus of the
thalamus (PVT; Phillipson and Bohn, 1994; Otake and
Ruggiero, 1995), paraventricular, supraoptic, and tuberoma-
millary nuclei of the hypothalamus (Ericson et al., 1989;
Cunningham et al., 1990), dorsal raphe nucleus (Peyron
et al., 1996), periaqueductal gray (PAG; Herbert and Saper,
1992), ventral tegmental area (Mejias-Aponte et al., 2009),
and locus coeruleus (Pieribone et al., 1988). Physiologically,
C3 neurons increase expression of the immediate early
gene Fos during depressor responses elicited by sodium
nitroprusside (Murphy et al., 1994), but not during
hemorrhage (Dun et al., 1993). This collection of studies
implicates the C3 cell group as an autonomic integration
center, but stops short of providing a comprehensive over-
view of the anatomical distribution of C3 processes.
The purpose of the current study was to map C3 effer-
ents throughout the rat CNS by microinjecting a lentivirus
designed to induce expression of green fluorescent
protein (GFP) selectively in cells of a noradrenergic or
adrenergic phenotype. This anatomical survey reveals C3
efferents extending to a multitude of nuclei beyond those
previously identified, and provides a detailed anatomical
framework to further our understanding of this cell
group’s role within the CNS.
MATERIALS AND METHODS
Lentivirus preparationLentivirus expressing GFP under the control of a multi-
meric Phox2 binding site promoter (LV.PRSx8.EGFP;
Hwang et al., 2001) was prepared using methods previ-
ously described (Coleman et al., 2003; Teschemacher
et al., 2005; Sevigny et al., 2008).
AnimalsAll in vivo experiments were conducted in accordance
with the Australian National Health and Medical Research
Council ‘‘Code of Practice for the Care and Use of Animals
for Scientific Purposes’’ and were approved by the Univer-
sity of Melbourne Animal Experimentation Ethics and
Biosafety Committee. Seven male Sprague–Dawley rats
(300–400 g) were used for this study. Animals were
obtained from the University of Melbourne Biological
Resources Facility and housed with a 12-hour light:dark
cycle at a constant temperature (22 6 1�C) with
ad libitum access to standard rat chow and water.
Microinjection of lentivirus intothe C3 region
Rats were injected with a nonsteroidal, antiinflamma-
tory agent (meloxicam, 1 mg/kg, subcutaneously; Meta-
cam, Boehringer Ingelheim, NSW, Australia) prior to lenti-
viral injection protocol. For all surgical protocols
(including transcardial perfusions), animals were first
lightly anesthetized by inhalation of isoflurane (Rhodia
Australia, Notting Hill, VIC, Australia) prior to intramuscu-
lar injection of a mixture of ketamine (60 mg/kg; Lyp-
pard, Dingley, VIC, Australia) and medetomidine (250
mg/kg; Pfizer Animal Health, West Ryde, NSW, Australia).
After a deep plane of anesthesia was evidenced by loss of
pedal withdrawal and corneal reflexes, animals were
placed in a stereotaxic frame with the skull angled down-
wards 40�. An incision was made along the midline and
muscles separated to expose the atlanto-occipital mem-
brane. A small portion of the occipital bone (1–2 mm)
was removed by trepination and the atlanto-occipital
membrane opened to expose calamus scriptorius, which
was used as a reference point for stereotaxic coordi-
nates. Lentiviral solution was injected from a glass micro-
pipette (20–50 lm tip diameter) using a picospritzer
(World Precision Instruments, Sarasota, FL), and volume
of injectate was determined by measuring the movement
of the fluid meniscus with a monocular microscope con-
taining an eyepiece graticule. A series of injections (100
nl per injection, viral titer 0.75 � 1010 viral particles/ml)
were made along the midline at the following coordinates:
�0.8 and �1.4 mm DV each at 1.6, 1.9, 2.2, 2.4, and 2.6
mm rostral to calamus scriptorius. The incision was then
sutured and animals revived via an intramuscular injec-
tion of atipamazole (1 mg/kg; Pfizer Animal Health). Four
of seven injected animals were allowed to recover for 3
weeks in their home cages. However, subsequent histol-
ogy revealed this recovery time was not adequate for the
desired expression and transport of GFP. The next three
animals were allowed to recover for 5 weeks in their
home cages, which provided adequate expression of GFP
in the sacral spinal cord (the greatest distance from the
injection site). After the specified time, animals were
anesthetized as described above and killed by transcar-
dial perfusion with 50 ml of 0.9% saline followed by 500
ml of 4% formaldehyde in 0.1 M phosphate buffer. Brains
and spinal cords were removed and postfixed with 4%
formaldehyde in 0.1 M phosphate buffer for 1 day in prep-
aration for histological protocols.
HistologyPostfixed tissue was transferred to a 30% sucrose solu-
tion for 1 day prior to sectioning. Brains were bisected
along the coronal plane 8 mm from the caudal end of the
brain matrix (�1 mm rostral to the cerebellar peduncle).
Efferent projections of C3 neurons in the rat
The Journal of Comparative Neurology | Research in Systems Neuroscience 2353
Spinal cords were blocked transversely into sections
containing 3–4 spinal segments. All tissue was snap-
frozen in isopentane on dry ice before being sectioned on
a cryostat either coronally (brain) or horizontally (spinal
cord) at a thickness of 40 lm. Horizontal segments of
spinal cord were sectioned at a slight oblique angle
(3–7�) to ensure visualization of multiple structures
within a single section. All tissue was stored free-floating
in cryoprotectant (30% sucrose, 30% ethylene glycol,
1% polyvinyl-pyrrolidone in 50 mM phosphate buffer,
pH 7.2) at �20�C until subsequent immunohistochemical
procedures.
Immunohistochemistry and Nissl stainsNissl stains were performed on coronal brain sections
sampled every 240 lm using thionin solution to identify
landmarks for mapping purposes (detailed below). Immu-
nohistochemistry methods followed those detailed by
Llewellyn-Smith et al. (2003). Briefly, coronal sections of
brain were sampled every 240 lm and horizontal sections
of spinal cord every 160 lm. Sections were rinsed in Tris-
buffered saline with 0.05% merthiolate, pH 7.4 (TBS),
then transferred to blocking solution (10% normal horse
serum, 0.3% Triton in TBS) for 30 minutes at room tem-
perature (T�). Sections were then incubated in a primary
antibody cocktail (containing multiple antibodies where
appropriate) diluted in blocking solution for 72 hours at
T�, after which they were rinsed in TBS. Sections were
then incubated for 24 hours at T� in a secondary antibody
cocktail (containing multiple antibodies where appropri-
ate) diluted in a modified blocking solution (1% normal
horse serum, 0.3% Triton in TBS). Where appropriate, tis-
sue incubated with biotinylated secondary antibodies
were subsequently rinsed and incubated for 2 hours at T�
in a fluorophore conjugated streptavidin. All primary and
secondary antibodies used, along with concentrations,
sources, and catalog numbers are listed in Table 1. Note
that for double-labeling with GFP and choline acetyltrans-
ferase (ChAT), secondary antibodies were applied
sequentially (donkey antigoat Cy5, followed by goat anti-
chicken Alexa 488) to avoid possible cross-binding
between the secondary antibodies. Using this sequential
application of antibodies did not result in any colocaliza-
tion between GFP-ir and ChAT-ir elements. Sections were
finally rinsed in TBS, transferred to 0.1 M phosphate
buffer, and mounted onto gelatin-coated slides. Slides
were coverslipped using Cytoseal (JMS-Cole Parmer,
Balwyn, VIC, Australia) to preserve fluorescence.
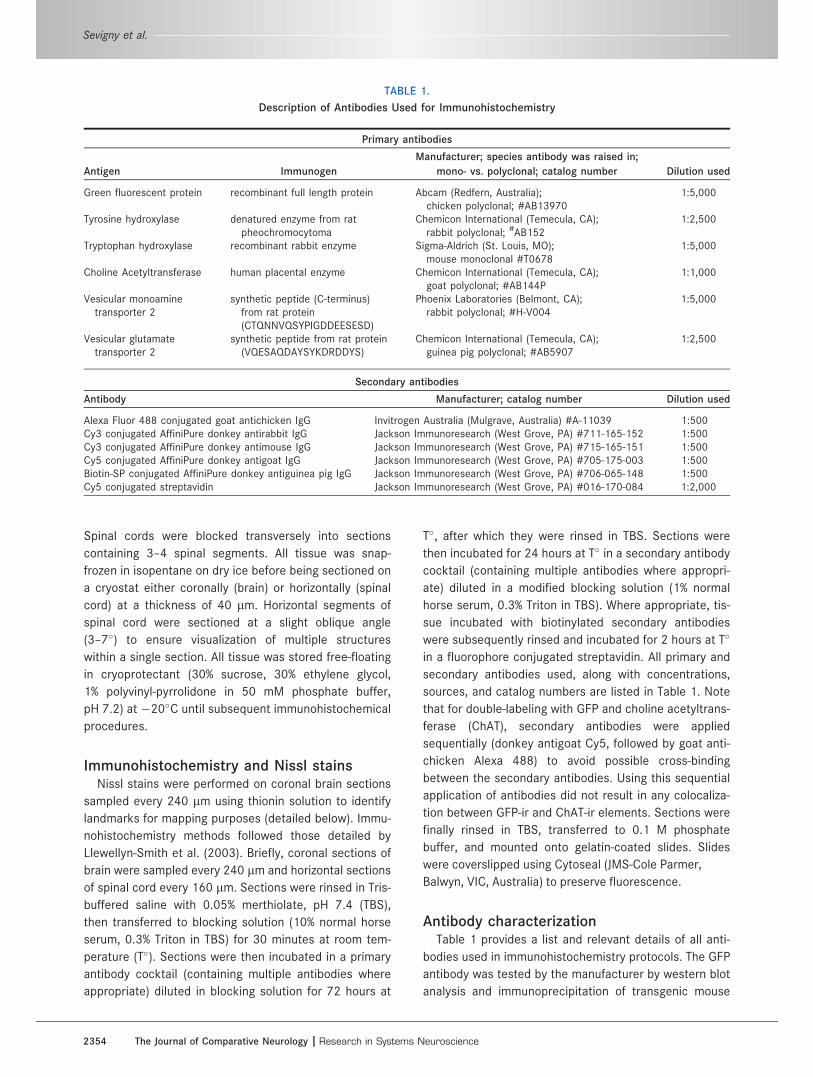
Antibody characterizationTable 1 provides a list and relevant details of all anti-
bodies used in immunohistochemistry protocols. The GFP
antibody was tested by the manufacturer by western blot
analysis and immunoprecipitation of transgenic mouse
TABLE 1.
Description of Antibodies Used for Immunohistochemistry
Primary antibodies
Antigen Immunogen
Manufacturer; species antibody was raised in;
mono- vs. polyclonal; catalog number Dilution used
Green fluorescent protein recombinant full length protein Abcam (Redfern, Australia);chicken polyclonal; #AB13970
1:5,000
Tyrosine hydroxylase denatured enzyme from ratpheochromocytoma
Chemicon International (Temecula, CA);rabbit polyclonal; #AB152
1:2,500
Tryptophan hydroxylase recombinant rabbit enzyme Sigma-Aldrich (St. Louis, MO);mouse monoclonal #T0678
1:5,000
Choline Acetyltransferase human placental enzyme Chemicon International (Temecula, CA);goat polyclonal; #AB144P
1:1,000
Vesicular monoaminetransporter 2
synthetic peptide (C-terminus)from rat protein(CTQNNVQSYPIGDDEESESD)
Phoenix Laboratories (Belmont, CA);rabbit polyclonal; #H-V004
1:5,000
Vesicular glutamatetransporter 2
synthetic peptide from rat protein(VQESAQDAYSYKDRDDYS)
Chemicon International (Temecula, CA);guinea pig polyclonal; #AB5907
1:2,500
Secondary antibodies
Antibody Manufacturer; catalog number Dilution used
Alexa Fluor 488 conjugated goat antichicken IgG Invitrogen Australia (Mulgrave, Australia) #A-11039 1:500Cy3 conjugated AffiniPure donkey antirabbit IgG Jackson Immunoresearch (West Grove, PA) #711-165-152 1:500Cy3 conjugated AffiniPure donkey antimouse IgG Jackson Immunoresearch (West Grove, PA) #715-165-151 1:500Cy5 conjugated AffiniPure donkey antigoat IgG Jackson Immunoresearch (West Grove, PA) #705-175-003 1:500Biotin-SP conjugated AffiniPure donkey antiguinea pig IgG Jackson Immunoresearch (West Grove, PA) #706-065-148 1:500Cy5 conjugated streptavidin Jackson Immunoresearch (West Grove, PA) #016-170-084 1:2,000
Sevigny et al.
2354 The Journal of Comparative Neurology |Research in Systems Neuroscience
spinal cords. It recognizes a single 27-kDa band and
application of this antibody to tissue from wildtype
animals yielded no labeling (Enjin et al., 2010). The TH
antibody recognizes a single 60-kDa band during western
blot analysis on PC12 lysates as detailed by the manufac-
turer. Labeling observed using this antibody in the current
study yielded the same patterns as previous reports
(Stornetta et al., 2002). The tryptophan hydroxylase
(TrOH) antibody yielded a single band at 55 kDa during
western blot analysis of rabbit pineal gland extract (manu-
facturer), and yielded labeling which corresponded to
known distributions of serotonergic neurons (Liu and
Wong-Riley, 2010). The ChAT antibody detects a single
70-kDa product in western blot analysis of rat brain
extract (manufacturer), and yielded labeling that corre-
sponds to patterns observed in previous reports (Gaillard
et al., 2008). The specificity of the vesicular monoamine
transporter 2 (VMAT2) antibody was determined through
selective transfection of monkey kidney fibroblasts (CV-1
cells) with either rat VMAT1 or rat VMAT2 clones. Trans-
fection and functionality of the VMATs were determined
via tritiated serotonin uptake, and immunolabeling for
VMAT2 was restricted to the VMAT2 transfected CV-1
cells, and absent in the control and VMAT1 transfected
lines (Weihe et al., 1994). Labeling was abolished in sec-
tions reacted with primary antibody preabsorbed with
excess VMAT2 antigen compared with labeled sections
reacted with untreated primary antibody (Weihe et al.,
2005). Immunolabeling with the VMAT2 antibody in the
rat CNS as reported by Weihe et al. (1994) coincided with
previous reports of VMAT2 distribution by in situ hybrid-
ization histochemistry and northern blot analysis (Erick-
son et al., 1992; Liu et al., 1992). The VGluT2 antibody
labels a single 62-kDa band in western blot analysis of
astrocytes from rat visual cortex (Montana et al., 2004)
and preadsorption with the immunogen peptide abolishes
labeling in nerve terminals (Masterson et al., 2009).
Brightfield and fluorescent microscopyBrightfield (Nissl-stained sections) and fluorescent
(injection sites) microscopy was performed using an Axio
Imager D.1 microscope connected to an AxioCam MRc5
digital camera (Zeiss Microimaging, Germany). Viral injec-
tion sites were confirmed using immunofluorescence for
GFP immunoreactivity (GFP-ir) and TH-ir to confirm loca-
tion and specificity of expression in catecholaminergic
neurons.
Confocal microscopySections were viewed with a Zeiss LSM 510 META con-
focal microscope. Images were acquired with either a
40� IR-Achroplan (NA 0.80) water immersion objective
or a 100� IR-Achroplan (NA 1.25) oil immersion objec-
tive. All sections labeled with multiple fluorescent probes
were scanned using settings adjusted to eliminate emis-
sion crosstalk between channels. Alexa 488-conjugated
fluorescent probes, Cy3-conjugated probes, and Cy5-con-
jugated probes were excited at 488 nm (100 mW argon
ion laser), 543 nm (10 mW green helium neon laser), and
633 nm (10 mW red helium neon laser), respectively.
Image postprocessingLow-magnification Nissl-stained images were adjusted
for brightness where appropriate using Adobe Photoshop
(San Jose, CA). Where appropriate, confocal microscopy
images were adjusted only for contrast using LSM Image
Browser v. 4.0.0.241 (Zeiss).
Mapping of C3 processesFor mapping purposes, Nissl-stained sections of brain
were sampled from a series immediately adjacent to
those labeled for GFP-ir, enabling structural identification
of regions observed to contain GFP-ir processes. Fluores-
cently labeled sections were systematically surveyed for
GFP-ir processes using the confocal microscope. Any
region containing GFP-ir processes was imaged and the
imaged region annotated on the corresponding adjacent
Nissl-stained image. The tissue was then surveyed again
using the fluorescent microscope to ensure all GFP-ir
processes had been accounted for. Spinal cord tissue
was surveyed using brightfield microscopy for structural
identification and fluorescent microscopy to identify
regions containing GFP-ir processes. After mapping these
sections, GFP-ir processes were imaged using confocal
microscopy.
For summary purposes, semiquantitative analysis was
performed based on comparative observations between
projection sites, as listed in Table 2. Regions containing
C3 varicosities were ranked þ, þþ, þþþ, or þþþþbased on relative observed densities of varicose fields,
where ‘‘þ’’ indicates a field containing sparse yet consist-
ent varicosities, and ‘‘þþþþ’’ represents the densest
observed fields. Some specific examples of each ranking
can be observed in the confocal micrographs within
the figures: þ: Figure 6D (lateral hypothalamus), þþ:
Figure 3C (rostral ventrolateral medulla), þþþ:
Figure 3H (dorsal motor nucleus of the vagus), and
þþþþ: Figure 3G (area postrema).
RESULTS
Injection sitesThe lentiviral injection protocol outlined in this study
resulted in GFP-ir expression in 79 6 3% of TH-ir neurons
within the C3 region (Fig. 1). GFP-ir C3 neurons were
observed across the full rostral-caudal extent of the
Efferent projections of C3 neurons in the rat
The Journal of Comparative Neurology | Research in Systems Neuroscience 2355
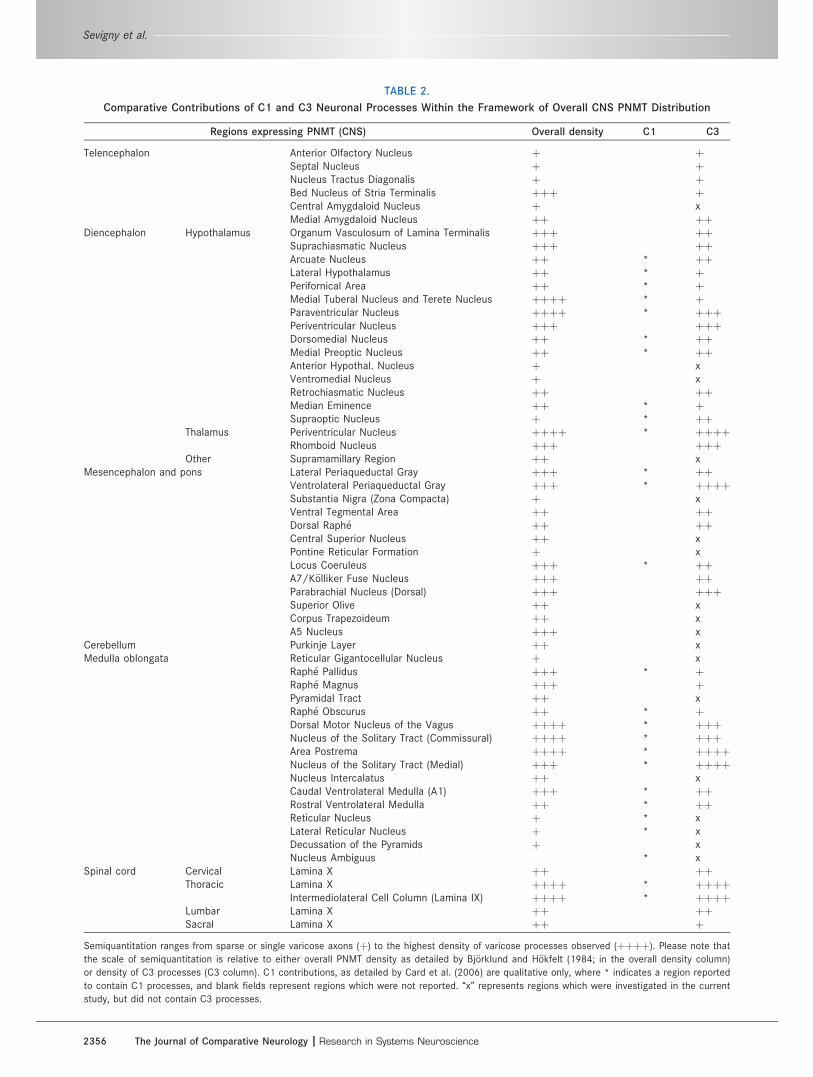
TABLE 2.
Comparative Contributions of C1 and C3 Neuronal Processes Within the Framework of Overall CNS PNMT Distribution
Regions expressing PNMT (CNS) Overall density C1 C3
Telencephalon Anterior Olfactory Nucleus þ þSeptal Nucleus þ þNucleus Tractus Diagonalis þ þBed Nucleus of Stria Terminalis þþþ þCentral Amygdaloid Nucleus þ xMedial Amygdaloid Nucleus þþ þþ
Diencephalon Hypothalamus Organum Vasculosum of Lamina Terminalis þþþ þþSuprachiasmatic Nucleus þþþ þþArcuate Nucleus þþ * þþLateral Hypothalamus þþ * þPerifornical Area þþ * þMedial Tuberal Nucleus and Terete Nucleus þþþþ * þParaventricular Nucleus þþþþ * þþþPeriventricular Nucleus þþþ þþþDorsomedial Nucleus þþ * þþMedial Preoptic Nucleus þþ * þþAnterior Hypothal. Nucleus þ xVentromedial Nucleus þ xRetrochiasmatic Nucleus þþ þþMedian Eminence þþ * þSupraoptic Nucleus þ * þþ
Thalamus Periventricular Nucleus þþþþ * þþþþRhomboid Nucleus þþþ þþþ
Other Supramamillary Region þþ xMesencephalon and pons Lateral Periaqueductal Gray þþþ * þþ
Ventrolateral Periaqueductal Gray þþþ * þþþþSubstantia Nigra (Zona Compacta) þ xVentral Tegmental Area þþ þþDorsal Raph�e þþ þþCentral Superior Nucleus þþ xPontine Reticular Formation þ xLocus Coeruleus þþþ * þþA7/K€olliker Fuse Nucleus þþþ þþParabrachial Nucleus (Dorsal) þþþ þþþSuperior Olive þþ xCorpus Trapezoideum þþ xA5 Nucleus þþþ x
Cerebellum Purkinje Layer þþ xMedulla oblongata Reticular Gigantocellular Nucleus þ x
Raph�e Pallidus þþþ * þRaph�e Magnus þþþ þPyramidal Tract þþ xRaph�e Obscurus þþ * þDorsal Motor Nucleus of the Vagus þþþþ * þþþNucleus of the Solitary Tract (Commissural) þþþþ * þþþArea Postrema þþþþ * þþþþNucleus of the Solitary Tract (Medial) þþþ * þþþþNucleus Intercalatus þþ xCaudal Ventrolateral Medulla (A1) þþþ * þþRostral Ventrolateral Medulla þþ * þþReticular Nucleus þ * xLateral Reticular Nucleus þ * xDecussation of the Pyramids þ xNucleus Ambiguus * x
Spinal cord Cervical Lamina X þþ þþThoracic Lamina X þþþþ * þþþþ
Intermediolateral Cell Column (Lamina IX) þþþþ * þþþþLumbar Lamina X þþ þþSacral Lamina X þþ þ
Semiquantitation ranges from sparse or single varicose axons (þ) to the highest density of varicose processes observed (þþþþ). Please note that
the scale of semiquantitation is relative to either overall PNMT density as detailed by Bj€orklund and H€okfelt (1984; in the overall density column)
or density of C3 processes (C3 column). C1 contributions, as detailed by Card et al. (2006) are qualitative only, where * indicates a region reported
to contain C1 processes, and blank fields represent regions which were not reported. ‘‘x’’ represents regions which were investigated in the current
study, but did not contain C3 processes.
Sevigny et al.
2356 The Journal of Comparative Neurology |Research in Systems Neuroscience
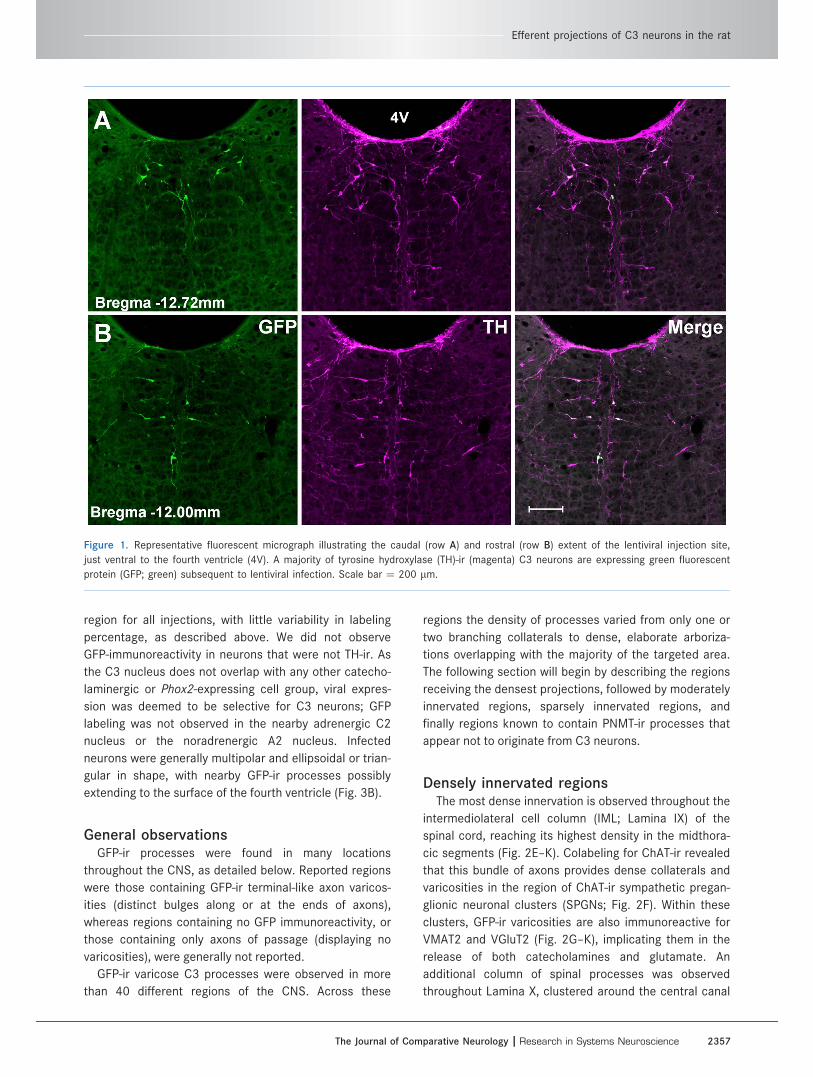
region for all injections, with little variability in labeling
percentage, as described above. We did not observe
GFP-immunoreactivity in neurons that were not TH-ir. As
the C3 nucleus does not overlap with any other catecho-
laminergic or Phox2-expressing cell group, viral expres-
sion was deemed to be selective for C3 neurons; GFP
labeling was not observed in the nearby adrenergic C2
nucleus or the noradrenergic A2 nucleus. Infected
neurons were generally multipolar and ellipsoidal or trian-
gular in shape, with nearby GFP-ir processes possibly
extending to the surface of the fourth ventricle (Fig. 3B).
General observationsGFP-ir processes were found in many locations
throughout the CNS, as detailed below. Reported regions
were those containing GFP-ir terminal-like axon varicos-
ities (distinct bulges along or at the ends of axons),
whereas regions containing no GFP immunoreactivity, or
those containing only axons of passage (displaying no
varicosities), were generally not reported.
GFP-ir varicose C3 processes were observed in more
than 40 different regions of the CNS. Across these
regions the density of processes varied from only one or
two branching collaterals to dense, elaborate arboriza-
tions overlapping with the majority of the targeted area.
The following section will begin by describing the regions
receiving the densest projections, followed by moderately
innervated regions, sparsely innervated regions, and
finally regions known to contain PNMT-ir processes that
appear not to originate from C3 neurons.
Densely innervated regionsThe most dense innervation is observed throughout the
intermediolateral cell column (IML; Lamina IX) of the
spinal cord, reaching its highest density in the midthora-
cic segments (Fig. 2E–K). Colabeling for ChAT-ir revealed
that this bundle of axons provides dense collaterals and
varicosities in the region of ChAT-ir sympathetic pregan-
glionic neuronal clusters (SPGNs; Fig. 2F). Within these
clusters, GFP-ir varicosities are also immunoreactive for
VMAT2 and VGluT2 (Fig. 2G–K), implicating them in the
release of both catecholamines and glutamate. An
additional column of spinal processes was observed
throughout Lamina X, clustered around the central canal
Figure 1. Representative fluorescent micrograph illustrating the caudal (row A) and rostral (row B) extent of the lentiviral injection site,
just ventral to the fourth ventricle (4V). A majority of tyrosine hydroxylase (TH)-ir (magenta) C3 neurons are expressing green fluorescent
protein (GFP; green) subsequent to lentiviral infection. Scale bar ¼ 200 lm.
Efferent projections of C3 neurons in the rat
The Journal of Comparative Neurology | Research in Systems Neuroscience 2357
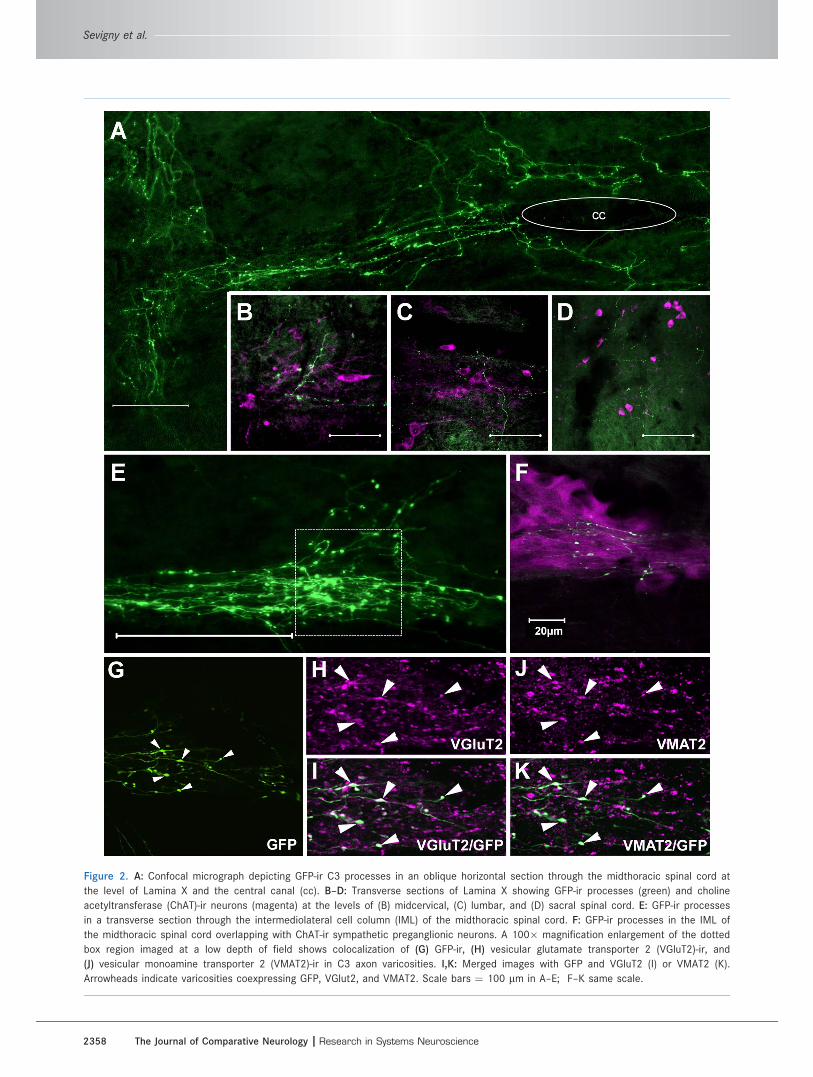
Figure 2. A: Confocal micrograph depicting GFP-ir C3 processes in an oblique horizontal section through the midthoracic spinal cord at
the level of Lamina X and the central canal (cc). B–D: Transverse sections of Lamina X showing GFP-ir processes (green) and choline
acetyltransferase (ChAT)-ir neurons (magenta) at the levels of (B) midcervical, (C) lumbar, and (D) sacral spinal cord. E: GFP-ir processes
in a transverse section through the intermediolateral cell column (IML) of the midthoracic spinal cord. F: GFP-ir processes in the IML of
the midthoracic spinal cord overlapping with ChAT-ir sympathetic preganglionic neurons. A 100� magnification enlargement of the dotted
box region imaged at a low depth of field shows colocalization of (G) GFP-ir, (H) vesicular glutamate transporter 2 (VGluT2)-ir, and
(J) vesicular monoamine transporter 2 (VMAT2)-ir in C3 axon varicosities. I,K: Merged images with GFP and VGluT2 (I) or VMAT2 (K).
Arrowheads indicate varicosities coexpressing GFP, VGlut2, and VMAT2. Scale bars ¼ 100 lm in A–E; F–K same scale.
Sevigny et al.
2358 The Journal of Comparative Neurology |Research in Systems Neuroscience
from upper cervical, through to sacral levels of the spinal
cord, reaching a peak density at the midthoracic seg-
ments (Fig. 2A–D). These processes formed densely inter-
woven networks displaying numerous axon varicosities
that invariably overlapped with ChAT-ir neurons or proc-
esses. Interestingly, the processes within Lamina X
appeared to be of a smaller axon diameter than those
that innervate the IML, implying a potential variability in
conduction velocity between these two branches of
collaterals.
Within the brain, high densities of C3 processes were
observed in several regions within the medulla oblongata,
mesencephalon, and diencephalon. In the dorsal medulla
the most dense fields of C3 processes were contained in
the commissural and medial portions of the nucleus of
the solitary tract (NTS), area postrema (AP), and the dor-
sal motor nucleus of the vagus (DMX; Fig. 3). Colabeling
of these regions with markers for TH and ChAT revealed
that the processes in the NTS at least partially overlap
with TH-ir C2 adrenergic neurons and their processes
(Fig. 3A), as well as the ChAT-ir parasympathetic pregan-
glionic neurons in DMX (Fig. 3H).
Within the midbrain, C3 processes densely innervate
the entire ventrolateral periaqueductal gray (vlPAG), with
elaborately branching collaterals (Fig. 4A). The nearby
lateral and medial parabrachial nuclei also contained a
high density of C3 terminal branches with the appearance
of more varicosities among that process in the lateral
division. In the lateral division GFP-ir axons contribute to
densely clustered TH-ir fibers forming fine ‘‘baskets’’ out-
lining somata (Fig. 4F,G).
One of the densest fields of C3 collaterals occurred
within the thalamus. Here, GFP-ir processes innervate a
rostral-caudal expanse of over 3 mm from bregma
�0.8 mm to �4.0 mm, encompassing the full extent of
the mediodorsal and paraventricular nuclei (Figs. 5A,B,
6C), as well as the rhomboid nucleus (data not shown).
Also within the diencephalon, C3 processes were observed
throughout many hypothalamic regions, with the highest
density of varicosities confined to the paraventricular
and periventricular hypothalamic nuclei (Fig. 6A,F,H).
Moderately innervated regionsThe largest classification of observed regions is those
receiving what were deemed to have moderate innerva-
tion. Within the medulla, these regions include the rostral
ventrolateral medulla (RVLM) and the caudal ventrolateral
medulla (CVLM). Sections colabeled for TH-ir reveal that
C3 processes appear in close proximity to C1 adrenergic
neurons in the RVLM (Fig. 3C), as well as the noradrener-
gic A1 neurons of the CVLM (Fig. 3I).
Several mesencephalic nuclei also received moderate
projections from C3 neurons. When this tissue was cola-
beled with markers for TH-ir and TrOH-ir, GFP-ir
processes appeared to be specifically projecting to the
region of serotonergic B6/B7 neurons of the dorsal raphe
nucleus, as well as the noradrenergic A7, A6, and A10
neurons of the K€olliker-Fuse nucleus (Fig. 4E), locus
coeruleus (Fig. 4H), and the ventral tegmental area
(Fig. 4D), respectively. Moderate innervation was also
observed in the lateral (data not shown) and superoculo-
motor (Fig. 4C) subdivisions of the PAG.
Moderate innervations of the diencephalon were
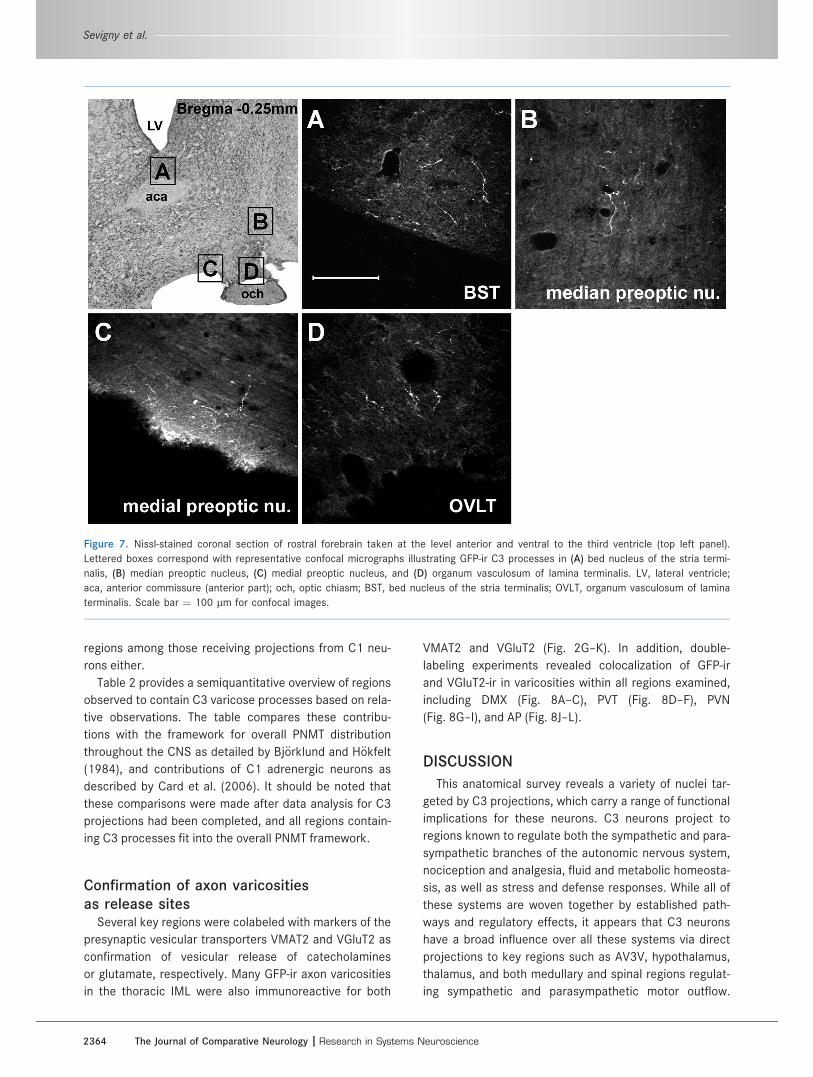
mainly restricted to the hypothalamus and AV3V (the
region anterior and ventral to the third ventricle). A
moderately dense projection was also observed in the
suprachiasmatic (data not shown), supraoptic (Fig. 6E),
retrochiasmatic (Fig. 6B), dorsomedial (Fig. 5D), arcuate
(Fig. 3I), and terete (Fig. 5G) nuclei. Within AV3V, moderate
numbers of processes were observed within the median
and medial preoptic nuclei (Fig. 7B,C), and the organum
vasculosum of lamina terminalis (OVLT; Fig. 7D).
Within other regions of the telencephalon a moderate
density of GFP-ir processes was observed in the medial
amygdala (Fig. 5H) and globus pallidus (data not shown).
When combined with TH-ir, GFP-ir fibers within globus
pallidus appear to contribute to TH-ir ‘‘fiber baskets’’
surrounding neuronal somata, as also observed in the
medial parabrachial nucleus. These fibers display very
few apparent varicosities, but nevertheless appear to
form intimate relationships with cell bodies in the region.
Sparsely innervated regionsAn assortment of additional regions receive sparse pro-
jections from C3 neurons. While these regions generally
contain only one or two branching varicose axons, similar
projections were observed across all animals in the study.
How much influence such modest innervations provide is
a point for discussion, but the consistency across animals
makes the observation worth reporting.
Within the raphe pallidus C3 processes appear to tar-
get the serotonergic B1 neurons in sections colabeled
with TrOH-ir (Fig. 3F), as well as the B2 neurons of raphe
obscurus (Fig. 3E), and B3 neurons within raphe magnus
(Fig. 4I). In the diencephalon, GFP-ir varicose axons are
observed in the lateral hypothalamus (Fig. 6D), arcuate
nucleus (Fig. 6I), median eminence (Fig. 6G), medial
tuberal nucleus (Fig. 5F), and the bed nucleus of stria
terminalis (Fig. 7A). The most rostral projections of C3
neurons were found in the olfactory tubercule, with iso-
lated axon varicosities appearing in the islands of Calleja,
along the ventromedial surface between bregma 2.52
and 1.68 (data not shown). Projections were also seen in
the lateral septal nucleus at bregma 0.96 and the horizon-
tal diagonal band (bregma 0.96–0.72, data not shown).
Efferent projections of C3 neurons in the rat
The Journal of Comparative Neurology | Research in Systems Neuroscience 2359
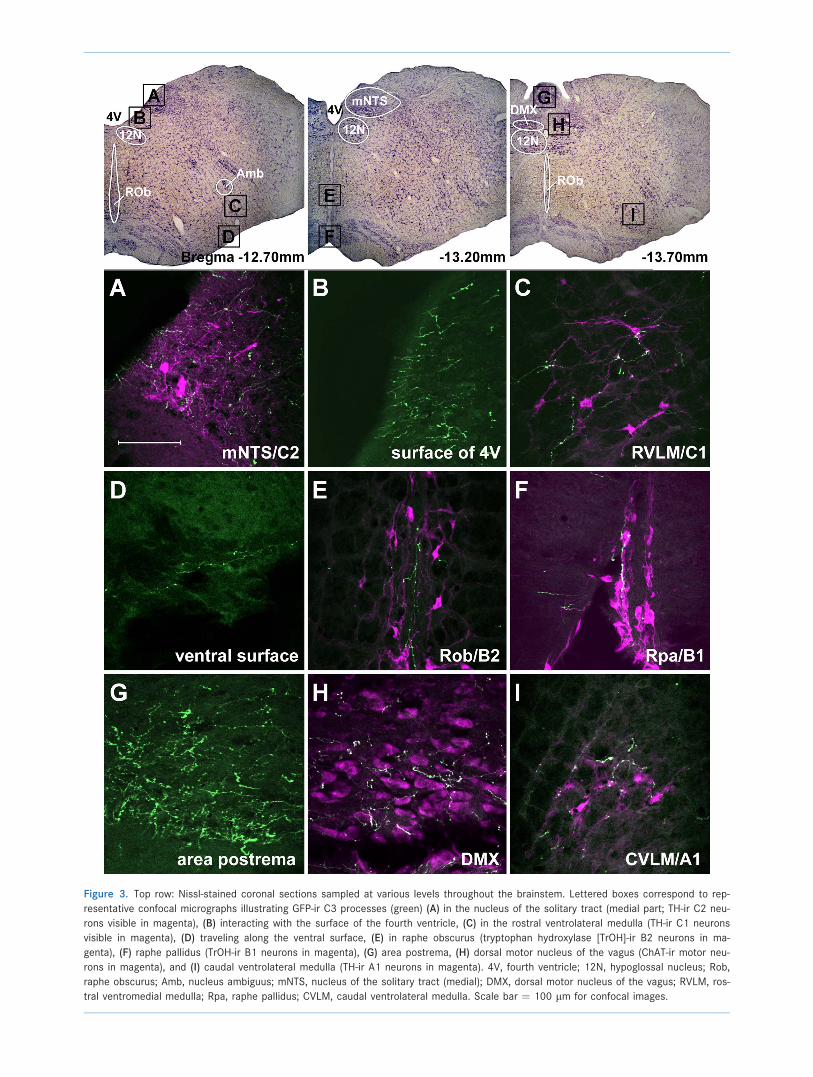
Figure 3. Top row: Nissl-stained coronal sections sampled at various levels throughout the brainstem. Lettered boxes correspond to rep-
resentative confocal micrographs illustrating GFP-ir C3 processes (green) (A) in the nucleus of the solitary tract (medial part; TH-ir C2 neu-
rons visible in magenta), (B) interacting with the surface of the fourth ventricle, (C) in the rostral ventrolateral medulla (TH-ir C1 neurons
visible in magenta), (D) traveling along the ventral surface, (E) in raphe obscurus (tryptophan hydroxylase [TrOH]-ir B2 neurons in ma-
genta), (F) raphe pallidus (TrOH-ir B1 neurons in magenta), (G) area postrema, (H) dorsal motor nucleus of the vagus (ChAT-ir motor neu-
rons in magenta), and (I) caudal ventrolateral medulla (TH-ir A1 neurons in magenta). 4V, fourth ventricle; 12N, hypoglossal nucleus; Rob,
raphe obscurus; Amb, nucleus ambiguus; mNTS, nucleus of the solitary tract (medial); DMX, dorsal motor nucleus of the vagus; RVLM, ros-
tral ventromedial medulla; Rpa, raphe pallidus; CVLM, caudal ventrolateral medulla. Scale bar ¼ 100 lm for confocal images.
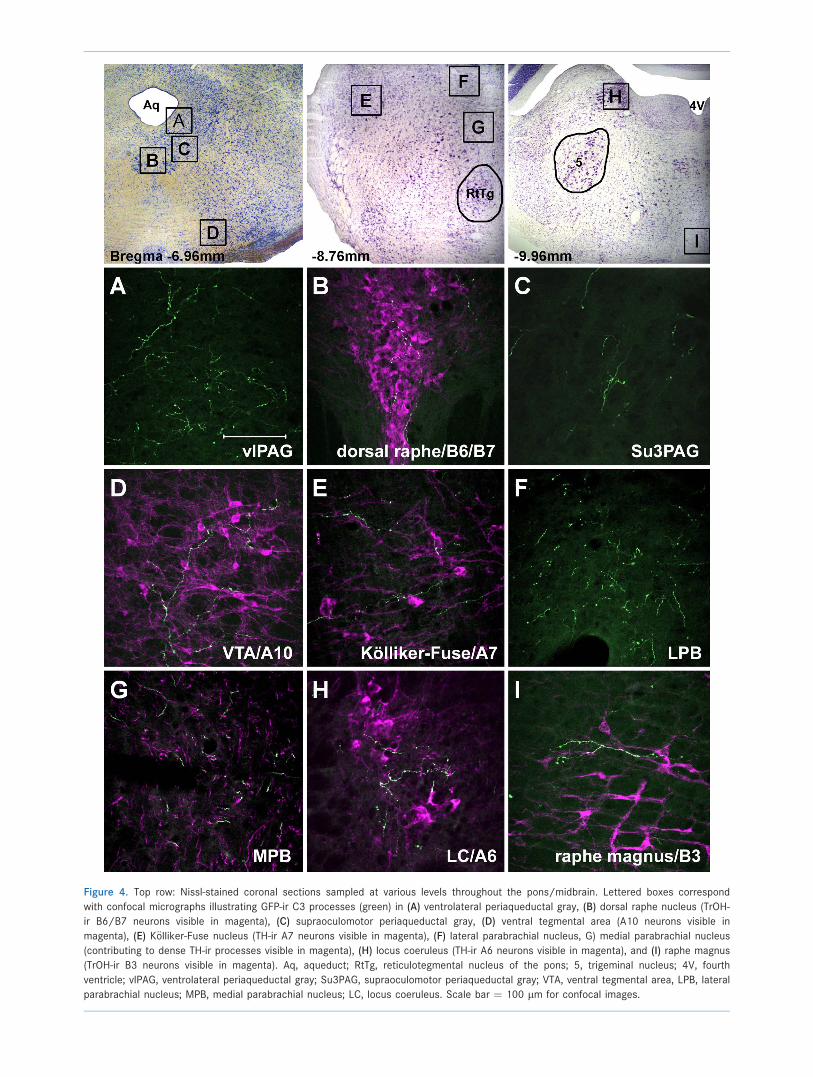
Figure 4. Top row: Nissl-stained coronal sections sampled at various levels throughout the pons/midbrain. Lettered boxes correspond
with confocal micrographs illustrating GFP-ir C3 processes (green) in (A) ventrolateral periaqueductal gray, (B) dorsal raphe nucleus (TrOH-
ir B6/B7 neurons visible in magenta), (C) supraoculomotor periaqueductal gray, (D) ventral tegmental area (A10 neurons visible in
magenta), (E) K€olliker-Fuse nucleus (TH-ir A7 neurons visible in magenta), (F) lateral parabrachial nucleus, G) medial parabrachial nucleus
(contributing to dense TH-ir processes visible in magenta), (H) locus coeruleus (TH-ir A6 neurons visible in magenta), and (I) raphe magnus
(TrOH-ir B3 neurons visible in magenta). Aq, aqueduct; RtTg, reticulotegmental nucleus of the pons; 5, trigeminal nucleus; 4V, fourth
ventricle; vlPAG, ventrolateral periaqueductal gray; Su3PAG, supraoculomotor periaqueductal gray; VTA, ventral tegmental area, LPB, lateral
parabrachial nucleus; MPB, medial parabrachial nucleus; LC, locus coeruleus. Scale bar ¼ 100 lm for confocal images.
Noninnervated regionsWhen compared with overall distribution of PNMT in
the rat brain as described by Bj€orklund and H€okfelt
(1984), there are several regions that contain PNMT-ir
varicosities that can be said not to originate from C3 neu-
rons. While many of these regions are reported to contain
only sparse fibers, those which contain a moderate or
high density of PNMT-ir fibers that do not originate from
C3 neurons include the supramamillary region of the
diencephalon, the mesencephalic central superior
nucleus, superior olive, corpus trapezoideum, and A5
nuclei, the Purkinje cell layer of the cerebellum, and the
pyramidal tract and intercalated nucleus within the
medulla. Notably, Card et al. (2006) did not report these
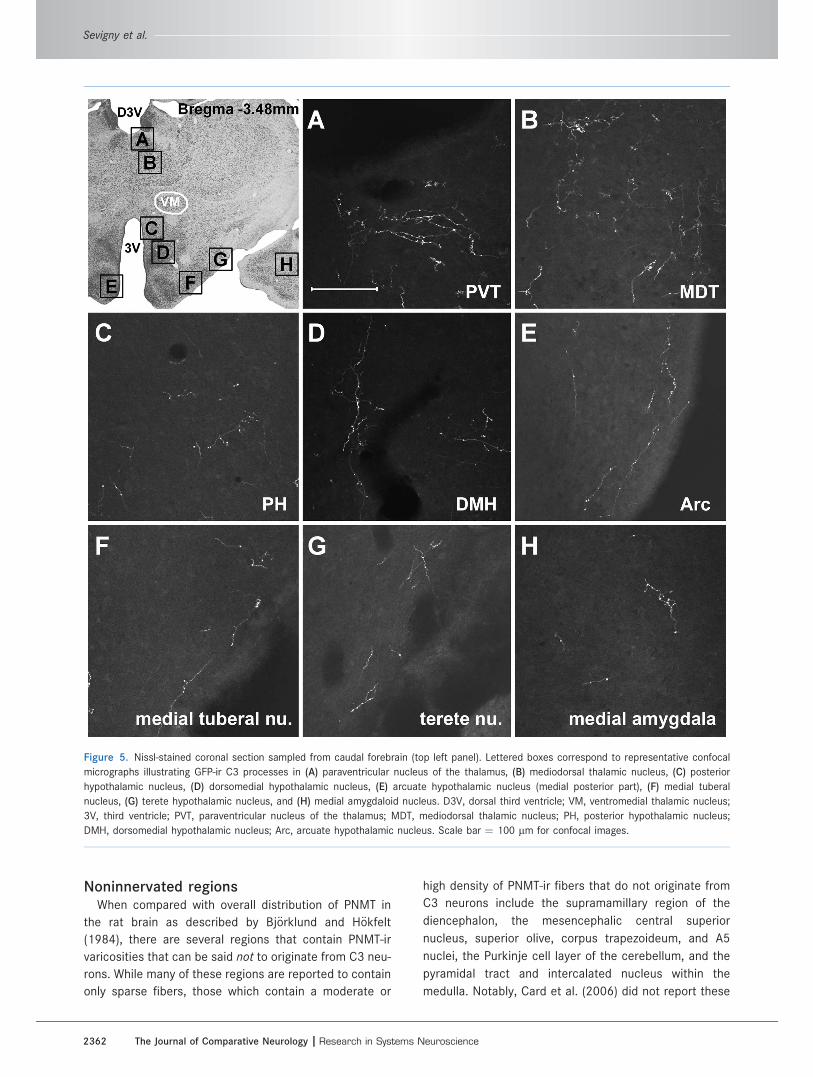
Figure 5. Nissl-stained coronal section sampled from caudal forebrain (top left panel). Lettered boxes correspond to representative confocal
micrographs illustrating GFP-ir C3 processes in (A) paraventricular nucleus of the thalamus, (B) mediodorsal thalamic nucleus, (C) posterior
hypothalamic nucleus, (D) dorsomedial hypothalamic nucleus, (E) arcuate hypothalamic nucleus (medial posterior part), (F) medial tuberal
nucleus, (G) terete hypothalamic nucleus, and (H) medial amygdaloid nucleus. D3V, dorsal third ventricle; VM, ventromedial thalamic nucleus;
3V, third ventricle; PVT, paraventricular nucleus of the thalamus; MDT, mediodorsal thalamic nucleus; PH, posterior hypothalamic nucleus;
DMH, dorsomedial hypothalamic nucleus; Arc, arcuate hypothalamic nucleus. Scale bar ¼ 100 lm for confocal images.
Sevigny et al.
2362 The Journal of Comparative Neurology |Research in Systems Neuroscience
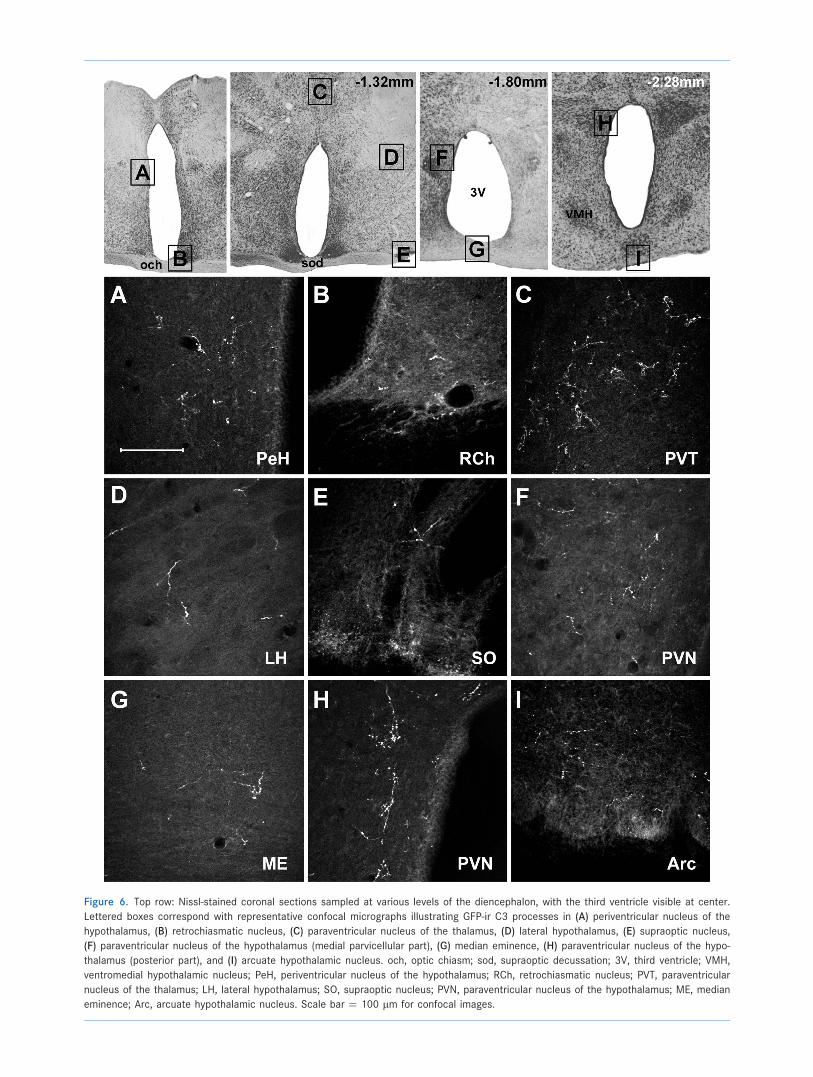
Figure 6. Top row: Nissl-stained coronal sections sampled at various levels of the diencephalon, with the third ventricle visible at center.
Lettered boxes correspond with representative confocal micrographs illustrating GFP-ir C3 processes in (A) periventricular nucleus of the
hypothalamus, (B) retrochiasmatic nucleus, (C) paraventricular nucleus of the thalamus, (D) lateral hypothalamus, (E) supraoptic nucleus,
(F) paraventricular nucleus of the hypothalamus (medial parvicellular part), (G) median eminence, (H) paraventricular nucleus of the hypo-
thalamus (posterior part), and (I) arcuate hypothalamic nucleus. och, optic chiasm; sod, supraoptic decussation; 3V, third ventricle; VMH,
ventromedial hypothalamic nucleus; PeH, periventricular nucleus of the hypothalamus; RCh, retrochiasmatic nucleus; PVT, paraventricular
nucleus of the thalamus; LH, lateral hypothalamus; SO, supraoptic nucleus; PVN, paraventricular nucleus of the hypothalamus; ME, median
eminence; Arc, arcuate hypothalamic nucleus. Scale bar ¼ 100 lm for confocal images.
regions among those receiving projections from C1 neu-
rons either.
Table 2 provides a semiquantitative overview of regions
observed to contain C3 varicose processes based on rela-
tive observations. The table compares these contribu-
tions with the framework for overall PNMT distribution
throughout the CNS as detailed by Bj€orklund and H€okfelt
(1984), and contributions of C1 adrenergic neurons as
described by Card et al. (2006). It should be noted that
these comparisons were made after data analysis for C3
projections had been completed, and all regions contain-
ing C3 processes fit into the overall PNMT framework.
Confirmation of axon varicositiesas release sites
Several key regions were colabeled with markers of the
presynaptic vesicular transporters VMAT2 and VGluT2 as
confirmation of vesicular release of catecholamines
or glutamate, respectively. Many GFP-ir axon varicosities
in the thoracic IML were also immunoreactive for both
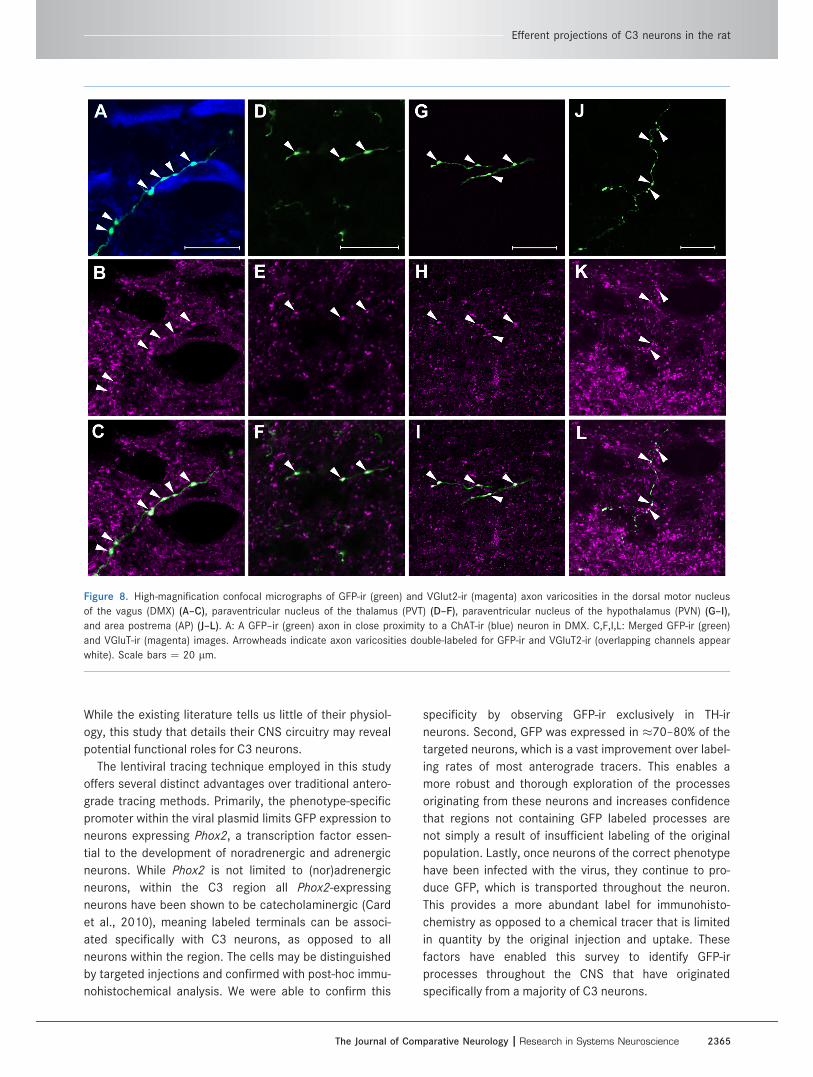
VMAT2 and VGluT2 (Fig. 2G–K). In addition, double-
labeling experiments revealed colocalization of GFP-ir
and VGluT2-ir in varicosities within all regions examined,
including DMX (Fig. 8A–C), PVT (Fig. 8D–F), PVN
(Fig. 8G–I), and AP (Fig. 8J–L).
DISCUSSION
This anatomical survey reveals a variety of nuclei tar-
geted by C3 projections, which carry a range of functional
implications for these neurons. C3 neurons project to
regions known to regulate both the sympathetic and para-
sympathetic branches of the autonomic nervous system,
nociception and analgesia, fluid and metabolic homeosta-
sis, as well as stress and defense responses. While all of
these systems are woven together by established path-
ways and regulatory effects, it appears that C3 neurons
have a broad influence over all these systems via direct
projections to key regions such as AV3V, hypothalamus,
thalamus, and both medullary and spinal regions regulat-
ing sympathetic and parasympathetic motor outflow.
Figure 7. Nissl-stained coronal section of rostral forebrain taken at the level anterior and ventral to the third ventricle (top left panel).
Lettered boxes correspond with representative confocal micrographs illustrating GFP-ir C3 processes in (A) bed nucleus of the stria termi-
nalis, (B) median preoptic nucleus, (C) medial preoptic nucleus, and (D) organum vasculosum of lamina terminalis. LV, lateral ventricle;
aca, anterior commissure (anterior part); och, optic chiasm; BST, bed nucleus of the stria terminalis; OVLT, organum vasculosum of lamina
terminalis. Scale bar ¼ 100 lm for confocal images.
Sevigny et al.
2364 The Journal of Comparative Neurology |Research in Systems Neuroscience
While the existing literature tells us little of their physiol-
ogy, this study that details their CNS circuitry may reveal
potential functional roles for C3 neurons.
The lentiviral tracing technique employed in this study
offers several distinct advantages over traditional antero-
grade tracing methods. Primarily, the phenotype-specific
promoter within the viral plasmid limits GFP expression to
neurons expressing Phox2, a transcription factor essen-
tial to the development of noradrenergic and adrenergic
neurons. While Phox2 is not limited to (nor)adrenergic
neurons, within the C3 region all Phox2-expressing
neurons have been shown to be catecholaminergic (Card
et al., 2010), meaning labeled terminals can be associ-
ated specifically with C3 neurons, as opposed to all
neurons within the region. The cells may be distinguished
by targeted injections and confirmed with post-hoc immu-
nohistochemical analysis. We were able to confirm this
specificity by observing GFP-ir exclusively in TH-ir
neurons. Second, GFP was expressed in �70–80% of the
targeted neurons, which is a vast improvement over label-
ing rates of most anterograde tracers. This enables a
more robust and thorough exploration of the processes
originating from these neurons and increases confidence
that regions not containing GFP labeled processes are
not simply a result of insufficient labeling of the original
population. Lastly, once neurons of the correct phenotype
have been infected with the virus, they continue to pro-
duce GFP, which is transported throughout the neuron.
This provides a more abundant label for immunohisto-
chemistry as opposed to a chemical tracer that is limited
in quantity by the original injection and uptake. These
factors have enabled this survey to identify GFP-ir
processes throughout the CNS that have originated
specifically from a majority of C3 neurons.
Figure 8. High-magnification confocal micrographs of GFP-ir (green) and VGlut2-ir (magenta) axon varicosities in the dorsal motor nucleus
of the vagus (DMX) (A–C), paraventricular nucleus of the thalamus (PVT) (D–F), paraventricular nucleus of the hypothalamus (PVN) (G–I),
and area postrema (AP) (J–L). A: A GFP–ir (green) axon in close proximity to a ChAT-ir (blue) neuron in DMX. C,F,I,L: Merged GFP-ir (green)
and VGluT-ir (magenta) images. Arrowheads indicate axon varicosities double-labeled for GFP-ir and VGluT2-ir (overlapping channels appear
white). Scale bars ¼ 20 lm.
Efferent projections of C3 neurons in the rat
The Journal of Comparative Neurology | Research in Systems Neuroscience 2365
Due to their dense innervation of SPGNs within the
IML, C3 neurons are likely to function as sympathetic pre-
motor neurons, potentially influencing a variety of general
visceral efferents. While this study did not investigate
which functional subtypes of SPGNs were innervated,
transneuronal labeling studies have shown a polysynaptic
pathway leading from C3 neurons to the stellate ganglion
(Jansen et al., 1995), testes (James et al., 2008), and
spleen (Cano et al., 2001), with no labeling of C3 neurons
reported following pseudorabies virus infection of renal
postganglionic neurons (Schramm et al., 1993). Fields of
C3 axon varicosities were also found in several medullary
autonomic regions including the RVLM, CVLM, raphe pal-
lidus, and raphe obscurus, with the densest fields in the
medulla observed within AP, DMX, and both medial and
commissural parts of the NTS. Within RVLM and CVLM,
C3 processes were observed forming apparent close
appositions with adrenergic C1 neurons and noradrener-
gic A1 neurons. The RVLM, CLVM, and NTS have been
extensively characterized as regions responsible for sym-
pathetic vasomotor outflow (Guyenet, 2006), neuroendo-
crine regulation (Blessing and Willoughby, 1985; Pilowsky
et al., 1987), and viscerosensory processing, respectively
(Boscan et al., 2002), as well as their role in baroreflex
circuitry (Chan and Sawchenko, 1998). In conjunction
with the projections to the IML, these observations sug-
gest that C3 neurons could play a pivotal, unexplored role
in regulation of sympathetic outflow.
C3 neurons are also labeled following transynaptic
tracing of the parasympathetic innervation of the pan-
creas (Loewy et al., 1994). Our data indicate this to be a
direct pathway based on an overlap of densely clustered
C3 varicosities with ChAT-ir motor neurons within DMX,
suggesting a functional role in parasympathetic modulation
in addition to the sympathetic targets described above.
While PNMT-ir fibers have been shown to form (presumably
inhibitory) symmetric synapses with parasympathetic pre-
ganglionic neurons in DMX (Pickel et al., 1986), this study
indicates that GFP-ir varicosities within DMX are glutama-
tergic. Within the hypothalamus and lamina terminalis, C3
varicosities were observed within nuclei known to project
(often reciprocally) to the medullary autonomic regions
outlined above. These varicosities were within the parvicel-
lular part of the paraventricular nucleus of the hypothala-
mus (PVN), the medial preoptic nucleus, and OVLT.
Together, these observations indicate a strong association
of C3 neurons with regulation of cardiovascular and
homeostatic facets of autonomic function.
C3 neurons are known to contribute to regulation of
the hypothalamic–pituitary–thyroid axis metabolic regula-
tory pathway. Studies have shown that a subset of C3
terminals within the PVN contain CART-ir, and closely
oppose thyroidotropin-releasing hormone-immunoreactive
neurons (Wittmann et al., 2004). This pathway is believed
to be responsible for feeding responses and energy
homeostasis. These PNMT-ir terminals have also been
shown to form asymmetric synapses with parvicellular
PVN neurons and to contain NPY (Alonso, 1993; Witt-
mann et al., 2002), which is known to inhibit indirectly
the hypothalamic–pituitary–thyroid axis (Fekete et al.,
2001). Thus, a subset of the C3 varicosities we observed
within the PVN could have a regulatory role in metabolic
homeostasis.
The PVT encompasses one of the densest clusters of
C3 axon varicosities in the brain. Indeed, this region has
been previously reported as not only containing PNMT-ir
processes (Hokfelt et al., 1973), but also receiving mono-
synaptic inputs from C1-3 neurons (Phillipson and Bohn,
1994; Otake and Ruggiero, 1995). In addition, many
regions which project to the PVT also contain PNMT-ir
varicosities, forming several disynaptic pathways
between medullary adrenergic cell groups and the PVT
(Otake et al., 1995). These regions include many that con-
tain varicose projections from C3 neurons, such as the
medial amygdala, bed nucleus of stria terminalis, PVN,
suprachiasmatic nucleus, paraventricular nucleus of the
hypothalamus, dorsomedial hypothalamus, lateral hypo-
thalamus, medial preoptic nucleus and median preoptic
nucleus. This outlines a set of convergent projections
from C3 to PVT composed of disynaptic and monosynap-
tic pathways. Given that stimulation of the PVT can
induce defense responses (Hilton and Redfern, 1986), its
responsiveness to a variety of stressors (Sharp et al.,
1991; Chastrette et al., 1991; Imaki et al., 1993), and its
intimate relationship with the hypothalamic–pituitary–
adrenal axis via the monosynaptic pathway from PVN,
ascending C3 collaterals could be relaying visceral infor-
mation to this region, which in turn contributes to defen-
sive responses to stressful stimuli.
The hypothalamic–pituitary–adrenal (HPA) axis could
also receive direct input from C3 neurons. Given the inter-
action between medullary PNMT-ir fibers and corticotro-
pin-releasing hormone-immunoreactive parvicellular
neurons within the PVN described by Wittmann et al.
(2004), it is likely that the C3 varicosities observed in the
current study are influencing this key component of the
stress pathway. In addition to direct interaction within the
PVN, C3 varicosities were also observed in brain regions
known to project to the PVN component of the HPA axis,
namely, the NTS, locus coeruleus, and the bed nucleus of
stria terminalis. Much like the thalamic convergence men-
tioned earlier, these multidimensional inputs into the HPA
axis suggest a potential modulating role for C3 neurons
within the stress response.
While the existing literature helps to develop functional
possibilities for some of the observed C3 projections,
Sevigny et al.
2366 The Journal of Comparative Neurology |Research in Systems Neuroscience
many remain unresolved. For example, the dense projec-
tions that innervate Lamina X throughout all levels of the
spinal cord and the robust innervations of the vlPAG could
either suggest a role in nociception and analgesia (Nahin
et al., 1983; Cavun et al., 2004; Dean, 2005; Tjen et al.,
2006; Palazzo et al., 2010), or autonomic regulation
(Pelosi et al., 2008; Llewellyn-Smith, 2009). In addition to
the regions containing a high density of C3 projections,
the many nuclei that contain only one or two varicose
axons remain a functional mystery. Given that these
projections were observed consistently across all ani-
mals, they may carry some functional relevance, despite
their limited anatomical presence. Perhaps delivering a
signal to a limited number of cells in these regions allows
C3 neurons to modulate certain nuclei subtly while simul-
taneously activating other, more densely innervated
regions with robust excitatory drive. While this survey can
only offer functional speculation, the high number of
regions receiving projections from C3 neurons, coupled
with the density of these projections in key autonomic
centers, suggests that this underexplored cluster of adre-
nergic neurons plays a larger role in autonomic regulation
than previously considered.
ACKNOWLEDGMENT
The authors thank Mr. D.A. Carter for technical
assistance.
LITERATURE CITEDAlonso G. 1993. Differential organization of synapses immuno-
reactive to phenylethanolamine-N-methyltransferase orneuropeptide Y in the parvicellular compartments of thehypothalamic paraventricular nucleus of the rat. J ChemNeuroanat 6:55–67.
Bj€orklund A, H€okfelt T. 1984. Handbook of chemical neuroan-atomy. Amsterdam, New York: Elsevier. p 157–276.
Blessing WW, Willoughby JO. 1985. Inhibiting the rabbit caudalventrolateral medulla prevents baroreceptor-initiated secre-tion of vasopressin. J Physiol 367:253–265.
Boscan P, Pickering AE, Paton JF. 2002. The nucleus of thesolitary tract: an integrating station for nociceptive andcardiorespiratory afferents. Exp Physiol 87:259–266.
Cano G, Sved AF, Rinaman L, Rabin BS, Card JP. 2001. Char-acterization of the central nervous system innervation ofthe rat spleen using viral transneuronal tracing. J CompNeurol 439:1–18.
Card JP, Sved JC, Craig B, Raizada M, Vazquez J, Sved AF. 2006.Efferent projections of rat rostroventrolateral medulla C1 cat-echolamine neurons: implications for the central control ofcardiovascular regulation. J Comp Neurol 499:840–859.
Card JP, Lois J, Sved AF. 2010. Distribution and phenotype ofPhox2a-containing neurons in the adult Sprague-Dawleyrat. J Comp Neurol 518:2202–2220.
Cavun S, Goktalay G, Millington WR. 2004. The hypotensionevoked by visceral nociception is mediated by delta opioidreceptors in the periaqueductal gray. Brain Res 1019:237–245.
Chan RK, Sawchenko PE. 1998. Organization and transmitterspecificity of medullary neurons activated by sustained
hypertension: implications for understanding baroreceptorreflex circuitry. J Neurosci 18:371–387.
Chastrette N, Pfaff DW, Gibbs RB. 1991. Effects of daytimeand nighttime stress on Fos-like immunoreactivity in theparaventricular nucleus of the hypothalamus, the habenula,and the posterior paraventricular nucleus of the thalamus.Brain Res 563:339–344.
Coleman JE, Huentelman MJ, Kasparov S, Metcalfe BL, PatonJF, Katovich MJ, Semple-Rowland SL, Raizada MK. 2003.Efficient large-scale production and concentration of HIV-1-based lentiviral vectors for use in vivo. Physiol Genomics12:221–228.
Cunningham ET Jr, Bohn MC, Sawchenko PE. 1990. Organiza-tion of adrenergic inputs to the paraventricular and supra-optic nuclei of the hypothalamus in the rat. J Comp Neurol292:651–667.
Dean C. 2005. Sympathoinhibition from ventrolateral peria-queductal gray mediated by the caudal midline medulla.Am J Physiol Regul Integr Comp Physiol 289:R1477–1481.
Dun NJ, Dun SL, Chiaia NL. 1993. Hemorrhage induces Fosimmunoreactivity in rat medullary catecholaminergic neu-rons. Brain Res 608:223–232.
Enjin A, Rabe N, Nakanishi ST, Vallstedt A, Gezelius H, MemicF, Lind M, Hjalt T, Tourtellotte WG, Bruder C, Eichele G,Whelan PJ, Kullander K. 2010. Identification of novel spinalcholinergic genetic subtypes disclose Chodl and Pitx2 asmarkers for fast motor neurons and partition cells. J CompNeurol 518:2284–2304.
Erickson JD, Eiden LE, Hoffman BJ. 1992. Expression cloningof a reserpine-sensitive vesicular monoamine transporter.Proc Natl Acad Sci U S A 89:10993–10997.
Ericson H, Blomqvist A, Kohler C. 1989. Brainstem afferentsto the tuberomammillary nucleus in the rat brain with spe-cial reference to monoaminergic innervation. J Comp Neu-rol 281:169–192.
Fekete C, Kelly J, Mihaly E, Sarkar S, Rand WM, Legradi G,Emerson CH, Lechan RM. 2001. Neuropeptide Y has acentral inhibitory action on the hypothalamic-pituitary-thyroid axis. Endocrinology 142:2606–2613.
Gaillard F, Bonfield S, Gilmour GS, Kuny S, Mema SC, MartinBT, Smale L, Crowder N, Stell WK, Sauve Y. 2008. Retinalanatomy and visual performance in a diurnal cone-rich lab-oratory rodent, the Nile grass rat (Arvicanthis niloticus).J Comp Neurol 510:525–538.
Guyenet PG. 2006. The sympathetic control of blood pres-sure. Nat Rev Neurosci 7:335–346.
Herbert H, Saper CB. 1992. Organization of medullary adre-nergic and noradrenergic projections to the periaqueductalgray matter in the rat. J Comp Neurol 315:34–52.
Hilton SM, Redfern WS. 1986. A search for brain stem cellgroups integrating the defence reaction in the rat. J Physiol378:213–228.
Hokfelt T, Fuxe K, Goldstein M, Johansson O. 1973. Evidencefor adrenaline neurons in the rat brain. Acta Physiol Scand89:286–288.
Hwang DY, Carlezon WA Jr, Isacson O, Kim KS. 2001. A high-efficiency synthetic promoter that drives transgene expres-sion selectively in noradrenergic neurons. Hum Gene Ther12:1731–1740.
Imaki T, Shibasaki T, Hotta M, Demura H. 1993. Intracerebro-ventricular administration of corticotropin-releasing factorinduces c-fos mRNA expression in brain regions related tostress responses: comparison with pattern of c-fos mRNAinduction after stress. Brain Res 616:114–125.
James P, Rivier C, Lee S. 2008. Presence of corticotrophin-releasing factor and/or tyrosine hydroxylase in cells of aneural brain-testicular pathway that are labelled by a trans-ganglionic tracer. J Neuroendocrinol 20:173–181.
Efferent projections of C3 neurons in the rat
The Journal of Comparative Neurology | Research in Systems Neuroscience 2367
Jansen AS, Wessendorf MW, Loewy AD. 1995. Transneuronallabeling of CNS neuropeptide and monoamine neuronsafter pseudorabies virus injections into the stellate gan-glion. Brain Res 683:1–24.
Liu Q, Wong-Riley MT. 2010. Postnatal changes in tryptophanhydroxylase and serotonin transporter immunoreactivity inmultiple brainstem nuclei of the rat: implications for a sen-sitive period. J Comp Neurol 518:1082–1097.
Liu Y, Peter D, Roghani A, Schuldiner S, Prive GG, EisenbergD, Brecha N, Edwards RH. 1992. A cDNA that suppressesMPPþ toxicity encodes a vesicular amine transporter. Cell70:539–551.
Llewellyn-Smith IJ. 2009. Anatomy of synaptic circuits control-ling the activity of sympathetic preganglionic neurons.J Chem Neuroanat 38:231–239.
Llewellyn-Smith IJ, Martin CL, Marcus JN, Yanagisawa M,Minson JB, Scammell TE. 2003. Orexin-immunoreactiveinputs to rat sympathetic preganglionic neurons. NeurosciLett 351:115–119.
Loewy AD, Franklin MF, Haxhiu MA. 1994. CNS monoaminecell groups projecting to pancreatic vagal motor neurons:a transneuronal labeling study using pseudorabies virus.Brain Res 638:248–260.
Masterson SP, Li J, Bickford ME. 2009. Synaptic organizationof the tectorecipient zone of the rat lateral posteriornucleus. J Comp Neurol 515:647–663.
Mejias-Aponte CA, Drouin C, Aston-Jones G. 2009. Adrenergicand noradrenergic innervation of the midbrain ventral teg-mental area and retrorubral field: prominent inputs frommedullary homeostatic centers. J Neurosci 29:3613–3626.
Minson J, Llewellyn-Smith I, Neville A, Somogyi P, Chalmers J.1990. Quantitative analysis of spinally projecting adrena-line-synthesising neurons of C1, C2 and C3 groups in ratmedulla oblongata. J Auton Nerv Syst 30:209–220.
Montana V, Ni Y, Sunjara V, Hua X, Parpura V. 2004. Vesicu-lar glutamate transporter-dependent glutamate releasefrom astrocytes. J Neurosci 24:2633–2642.
Murphy AZ, Ennis M, Shipley MT, Behbehani MM. 1994.Directionally specific changes in arterial pressure inducedifferential patterns of fos expression in discrete areas ofthe rat brainstem: a double-labeling study for Fos and cat-echolamines. J Comp Neurol 349:36–50.
Nahin RL, Madsen AM, Giesler GJ Jr. 1983. Anatomical andphysiological studies of the gray matter surrounding thespinal cord central canal. J Comp Neurol 220:321–335.
Otake K, Ruggiero DA. 1995. Monoamines and nitric oxideare employed by afferents engaged in midline thalamicregulation. J Neurosci 15(3 Pt 1):1891–1911.
Otake K, Ruggiero DA, Nakamura Y. 1995. Adrenergic innerva-tion of forebrain neurons that project to the paraventricu-lar thalamic nucleus in the rat. Brain Res 697:17–26.
Palazzo E, Rimoli MG, De Chiaro M, Guida F, Melisi D, CurcioA, de Novellis V, Marabese I, Rossi F, Abignente E, MaioneS. 2010. Intra-periaqueductal grey microinjections of animidazo[1,2-b]pyridazine derivative, DM2, affects rostralventromedial medulla cell activity and shows antinocicep-tive effect. Neuropharmacology 58:660–667.
Pelosi GG, Tavares RF, Antunes-Rodrigues J, Correa FM. 2008.Cardiovascular responses to noradrenaline microinjectionin the ventrolateral periaqueductal gray of unanesthetizedrats. J Neurosci Res 86:712–719.
Peyron C, Luppi PH, Fort P, Rampon C, Jouvet M. 1996.Lower brainstem catecholamine afferents to the rat dorsalraphe nucleus. J Comp Neurol 364:402–413.
Phillipson OT, Bohn MC. 1994. C1–3 adrenergic medullaryneurones project to the paraventricular thalamic nucleusin the rat. Neurosci Lett 176:67–70.
Pickel VM, Chan J, Park DH, Joh TH, Milner TA. 1986. Ultra-structural localization of phenylethanolamine N-methyl-
transferase in sensory and motor nuclei of the vagusnerve. J Neurosci Res 15:439–455.
Pieribone VA, Aston-Jones G, Bohn MC. 1988. Adrenergic andnon-adrenergic neurons in the C1 and C3 areas project tolocus coeruleus: a fluorescent double labeling study. Neu-rosci Lett 85:297–303.
Pilowsky PM, Morris MJ, Minson JB, West MJ, Chalmers JP,Willoughby JO, Blessing WW. 1987. Inhibition of vasode-pressor neurons in the caudal ventrolateral medulla of therabbit increases both arterial pressure and the release ofneuropeptide Y-like immunoreactivity from the spinal cord.Brain Res 420:380–384.
Reis DJ, Ruggiero DA, Morrison SF. 1989. The C1 area of therostral ventrolateral medulla oblongata. A critical brainstemregion for control of resting and reflex integration of arte-rial pressure. Am J Hypertens 2(12 Pt 2):363S–374S.
Sawchenko PE, Bohn MC. 1989. Glucocorticoid receptor-im-munoreactivity in C1, C2, and C3 adrenergic neurons thatproject to the hypothalamus or to the spinal cord in therat. J Comp Neurol 285:107–116.
Schramm LP, Strack AM, Platt KB, Loewy AD. 1993. Periph-eral and central pathways regulating the kidney: a studyusing pseudorabies virus. Brain Res 616:251–262.
Sevigny CP, Bassi J, Teschemacher AG, Kim KS, Williams DA,Anderson CR, Allen AM. 2008. C1 neurons in the rat ros-tral ventrolateral medulla differentially express vesicularmonoamine transporter 2 in soma and axonal compart-ments. Eur J Neurosci 28:1536–1544.
Sharp FR, Sagar SM, Hicks K, Lowenstein D, Hisanaga K.1991. c-fos mRNA, Fos, and Fos-related antigen inductionby hypertonic saline and stress. J Neurosci 11:2321–2331.
Stornetta RL. 2009. Neurochemistry of bulbospinal presympa-thetic neurons of the medulla oblongata. J Chem Neuroa-nat 38:222–230.
Stornetta RL, Akey PJ, Guyenet PG. 1999. Location and elec-trophysiological characterization of rostral medullary adre-nergic neurons that contain neuropeptide Y mRNA in ratmedulla. J Comp Neurol 415:482–500.
Stornetta RL, Sevigny CP, Guyenet PG. 2002. Vesicular gluta-mate transporter DNPI/VGLUT2 mRNA is present in C1and several other groups of brainstem catecholaminergicneurons. J Comp Neurol 444:191–206.
Teschemacher AG, Wang S, Lonergan T, Duale H, Waki H, PatonJF, Kasparov S. 2005. Targeting specific neuronal populationsusing adeno- and lentiviral vectors: applications for imagingand studies of cell function. Exp Physiol 90:61–69.
Tjen ALSC, Li P, Longhurst JC. 2006. Midbrain vlPAG inhibitsrVLM cardiovascular sympathoexcitatory responses duringelectroacupuncture. Am J Physiol Heart Circ Physiol 290:H2543–2553.
Weihe E, Sch€afer MKH, Erickson JD, Eiden LE. 1994. Localiza-tion of vesicular monoamine transporter isoforms (VMAT1and VMAT2) to endocrine cells and neurons in rat. J MolNeurosci 5:149–164.
Weihe E, Schutz B, Hartschuh W, Anlauf M, Schafer MK, EidenLE. 2005. Coexpression of cholinergic and noradrenergicphenotypes in human and nonhuman autonomic nervoussystem. J Comp Neurol 492:370–379.
Wittmann G, Liposits Z, Lechan RM, Fekete C. 2002. Medul-lary adrenergic neurons contribute to the neuropeptideY-ergic innervation of hypophysiotropic thyrotropin-releas-ing hormone-synthesizing neurons in the rat. Neurosci Lett324:69–73.
Wittmann G, Liposits Z, Lechan RM, Fekete C. 2004. Medul-lary adrenergic neurons contribute to the cocaine- andamphetamine-regulated transcript-immunoreactive innerva-tion of thyrotropin-releasing hormone synthesizing neuronsin the hypothalamic paraventricular nucleus. Brain Res1006:1–7.
Sevigny et al.
2368 The Journal of Comparative Neurology |Research in Systems Neuroscience
Copyright © 2022 FDOKUMEN