Addison's Disease Patients T Cells in Autoimmune + Specific ...
561
Effects of n-3 and n-6 Fatty Acids on the Activities and Expression of Hepatic Antioxidant Enzymes in Autoimmune-Prone NZBxNZW F 1 Mice Jaya T. Venkatraman a,1, Bysani Chandrasekar a, Jong Dai Kim b and Gabriel Femandes a'b'c'* Departments of aMedicine, bphysiology and CMicrobiology, The University of Texas Health Science Center, San Antonio, Texas 78284-7874
M e n h a d e n f ish oi l (FO) c o n t a i n i n g no3 fatty ac ids dramat~ ical ly e x t e n d s the life span and de lays the onse t and pro- g r e s s i o n o f a u t o i m m u n e d i s e a s e in (NZBxNZW)F 1 (B/W) f e m a l e m i c e as c o m p a r e d to t h o s e fed corn oi l (CO) r i ch in n-6 l ipids. As an inef f ic ient ant iox idant de fense s y s t e m has b e e n l i n k e d to a u t o i m m u n e d i s e a s e s , the presen t s tudy w a s u n d e r t a k e n to d e t e r m i n e w h e t h e r the p r o t e c t i v e ac t ion of n-3 l ip ids is m e d i a t e d t h r o u g h t h e i r ant iox idant de fense sys tem. WeAnling B/W m i c e w e r e fed a n u t r i t i o n a l l y a d e q u a t e , s e m i p u r i f i e d d ie t c o n t a i n i n g CO or kr i l l o i l (KO) or FO at 10% l e v e l (w/w) a d libitum unt i l the m i c e w e r e 6.5 m o n t h s old. All d i e t s c o n t a i n e d the s a m e l eve l o f v i t a m i n E (21.5 mg/100 g diet) . We com- pared the ef fects of f eed ing n-6 and n-3 l ipids on survival , k i d n e y d i s e a s e , h e p a t i c m i c r o s o m a l l ip id c o m p o s i t i o n , p e r o x i d a t i o n , and on the a c t i v i t y and m R N A e x p r e s s i o n o f the an t iox idant e n z y m e s cata lase , g lu ta th ione peroxi - dase (GSH-Px) and s u p e r o x i d e d i s m u t a s e (SOD) in 6.5- month-o ld B/W mice . The resu l t s s h o w e d that w h e n com- p a r e d to l i v e r s f r o m CO-fed m i c e , l i v e r s f r o m KO- and FO-fed m i c e s h o w e d : (i) s i g n i f i c a n t l y h i g h e r (P < 0.001) a c t i v i t i e s a n d e x p r e s s i o n o f CAT, GSH-Px and SOD; (ii) s i g n i f i c a n t l y l o w e r (P < 0.001) a r a c h i d o n i c ac id (20:4n-6) and l ino le ic ac id (18~n-6) and h i g h e r (P < 0.001) e i c o s a p e n t a e n o i c ac id (20:5n-3) and d o c o s a h e x a e n o i c ac id (22:6n-3) l e v e l s in h e p a t i c m i c r o s o m e s ; and (iii) sig- n i f i can t ly l o w e r (P < 0.001) e s t i m a t e d p e r o x i d a t i o n in- d i ces and th iobarb i tur ic ac id r e a c t i v e s u b s t a n c e s gener- at ion . The data i n d i c a t e that o n e o f the m e c h a n i s m s t h r o u g h w h i c h the n-3 l lp ids d e l a y the o n s e t o f a u t o i m - m u n e d i seases in B/W m i c e m a y be through m a i n t e n a n c e of h i g h e r ac t iv i t i e s and expres s ion of hepat i c ant iox idant e n z y m e s . Lipids 29, 561-568 (1994).
Auto immune-prone (NZBxNZW)F 1 (B/W) female mice spontaneously develop severe lupus nephritis as they age. At an ear ly age they also exhibit vascular lesions resem- bling systemic lupus e ry thema tosus (SLE) in humans , and these mice die be tween 6 and 12 months of age (1). Earl ier studies had shown tha t caloric restriction and the
1present address: Nutrition Program, State University of New York at Buffalo, Buffalo, NY I4214. *To whom correspondence should be addressed at The University of Texas Health Science Center, 7703 Floyd Curl Dr., San Antonio, TX 78284-7874. Abbreviations: B/W mice, (NZBxNZW) F 1 mice; CAT, catalase; CO, corn oil; EDTA, ethylenediaminetetraacetic acid; FO, fish oil; GAPDH, glyceraldehyde 3-phosphate dehydrogenase; GSH, glu- tathione reduced form; GSH-Px, glutathione peroxidase; KO, krill oil; NADPH, ~l-nicotinamide adenine dinucleotide phosphate, re- duced form; SDS, sodium dodecylsulfate; SLE, systemic lupus ery- thematosus; SOD, superoxide dismutase; SSC, sodium chloride/ sodium citrate buffer; TBARS, thiobarbituric acid reactive sub- stances.
source of dietary fat can have a profound effect on autoim- mune SLE in mice (2-5). Our ongoing studies have indi- cated tha t n-3 fat ty acid-rich menhaden fish oil (FO) dra- matically extends the life span and delays the onset of au- to immune disease, whereas corn oil (CO), rich in n-6 fat ty acids, significantly shortens the life span and accelerates au to immune processes in these mice (6,7). We also ob- served tha t feeding ad libitum a diet containing 20% FO and/or moderate caloric restriction inhibited auto immune disease in these mice. The beneficial effects observed have been pr imar i ly a t t r ibu ted to the increased eicosapen- taenoic acid (20:5n-3) and docosahexaenoic acid (22:6n-3) contents and to the markedly decreased 20:4n-6 levels in the FO-fed animals.
The deleterious effects of oxidative s t ress have previ- ously been associated with various pathological conditions (8--10), but the role of an impaired or defective antioxidant defense sys tem in au to immune diseases has been ex- plored only to a l imited extent (11-13). Our recent s tudy on MRL/lpr mice indicated tha t along with other immuno- logical abnormali t ies , these mice clearly showed a defec- t ive ant ioxidant defense sys tem as the expression of he- patic ant ioxidant enzymes was significantly lower when compared to t ha t of an MRL/+ s t ra in (14). I t is not ye t known, however, whe the r the n-3 d ie tary lipids of FO, which are known to ameliorate au to immune disease, are also able to modulate the liver antioxidant defense system in animals prone to developing au to immune disease. The susceptibi l i ty of an organism to oxidative damage is af- fected by the efficiency of the ant ioxidat ive defense sys- t em to cope with the oxidative stress which, in turn, can be influenced by nutr i t ional in tervent ion with antioxi- dants (15). Antioxidant enzymes, such as glutathione per- oxidase (GSH-Px), catalase (CAT) and superoxide dismu- tase (SOD), as well as antioxidant nutrients, such as vita- min E, v i t amin A, v i t amin C and selenium, can par- ticipate in controlling lipid peroxidation (16-18). Because antioxidant enzymes play an important role in the protec- tion against free radical damage, a decrease in the activi- t ies or expression of these enzymes m a y predispose tis- sues to free radical injury (19,20).
The present s tudy was unde r t aken to compare the ef- fects of d ie tary CO, krill oil (KO) and FO on hepatic mi- crosomal lipid composition, peroxidation and the expres- sion of mRNA for three antioxidant enzymes (CAT, GSH- Px and SOD) in B/W female mice. In addition, we also tes ted crude krill lecithin (KO) as an a l t e rna te source of n-3 lipids. The data we obtained indicate tha t besides hav- ing a decreased survival rate, the CO-fed B/W mice exhib- i ted lower activit ies and lower mRNA expression of the three ant ioxidant enzymes, as well as higher levels of 20:4n-6, and increased peroxidat ion in liver tissue. Our
Copyright �9 1994 by AOCS Press LIPIDS, Vol. 29, no. 8 (1994)
562
J.T. VENKATRAMAN ETAL.
present data also show tha t with adequate ant ioxidant supplements, FO can restore or enhance the antioxidant defense system and prolong the life span of autoimmune prone B/W mice.
MATERIALS AND METHODS
Experimental animals and diets. B/W female mice were purchased from the Jackson Laboratories (Bar Harbor, ME). The weanling mice (20/group; 15 mice for survival s tudy and 5 mice/group for cross sectional s tudy at 6.5 months) were fed ad libitum nutritionally adequate, semi- purified diets prepared weekly containing 10% (w/w) CO (ICN, Irvine, CA), crude KO (a generous gift from Itano Refrigerated Food Co., Ltd., Tokushima, Japan) or odor- free FO (U.S. Department of Commerce, National Marine Fisheries Service, Charleston, NC). The fatty acid compo- sition of the three oils is given in Table 1. The current AIN diet formula contains the following diet ingredients: ca- sein, 20%; dextrose, 30%; starch, 31%; oil, 10%; cellulose, 3.5%; AIN salt mixture, 3.5%; AIN vitamin mixture, 1.5%; DL-methionine, 0.3%; and choline, 0.2%. All three oils had equal levels of antioxidants, i.e., 1.3 g (1300 I.U.) a-toco- pherol per kg oil, 1.2 g (13.2 I.U.) T-tocopherol/kg and 1 g/kg tert-butylhydroquinone, as recommended by the National Inst i tutes of Heal th (NIH) to prevent peroxida- tion during storage. The FO and KO diets also contained 1% CO to meet essential fa t ty acid requirements . The final concentration of vitamin E (DL-a-tocopheryl acetate, 7-tocopherol and a-tocopherol) was -215 I.U./kg diet. Fresh food was provided daily in the evening, and precau- tions were taken to prevent oxidation of lipids and diets. The mice were mainta ined in plastic cages under a 12-h light/dark cycle. The body weights and proteinuria were recorded once a month. NIH guidelines were strictly fol- lowed. The animals (5 mice/group) were sacrificed at 6.5 months of age by cervical dislocation, livers were collected in ice-cold physiological saline, and par t of the livers was
T A B L E 1
F a t t y A c i d C o m p o s i t i o n o f t h e O i l s a
Fatty acid Corn oil (%) Fish oil (%) Krill oil (%)
14:0 0.03 8.40 9.67 16:0 10.33 13.97 17.00 18:0 1.99 2.51 1.07 20:0 -- 0.14 0.07 16:1 0.16 11.17 6.40 18:1 24.00 10.00 15.40 18:2n-6 52.60 0.66 1.64 18:3 0.09 20:4n-6 -- 1.45 0.52 20:5n-3 -- 13.37 11.14 22:4n-6 -- 0.11 - -
2 2 : 5 n - 6 - - 0 . 3 9 - -
2 2 : 5 n - 3 - - 2.06 0.38 22:6n-3 -- 8.60 6.77 Others 10.80 27.20 29.40 aThe analysis was carried out by the U.S. Department of Com- merce, NOAA, National Marine and Fisheries Service, Southeast Fisheries Center, Charleston Laboratory (Charleston, SC).
frozen in liquid nitrogen and stored at -80~ for RNA iso- lation.
Preparation of liver cytosol and microsomes. The livers were r insed in ice-cold physiological saline and minced with scissors. A 10% homogenate of livers was prepared in 0.15 M KC1 buffer (pH 7.4) and centrifuged at 12,000 x g for 10 min. The pellet was discarded, and the super- na tant was collected and centrifuged at 105,000 • for 90 min. The supernatant was the cytosolic fraction that was saved for determining the activities of the antioxidant en- zymes. The pellet was resuspended in the buffer and cen- trifuged at 12,000 x g for 15 min to wash and collect the microsomal pellet. The microsomal pellets then were re- suspended in the homogenization buffer. The protein con- tent of the microsomes was measured using the BCA Pro- tein Assay Reagent (Pierce, Rockford, IL). Fa t ty acid analyses and lipid peroxidation analyses were carried out on the liver microsomal fractions.
Measurement of thiobarbituric acid reactive substances (TBARS). TBARS in liver homogenates were measured using a modification of the thiobarbituric acid assay by Laganiere and Yu (21). A 10-min centrifugation at 2000 x g replaced the lengthy organic solvent extract ion of pig- ments. Malondialdehyde (as te t rae thyl acetal; Aldrich Chemical Company, Milwaukee, WI) was used as stan- dard.
Fatty acid analyses of liver microsomal total lipids. Lipids from liver microsomes were extracted with chloro- form/methanol (2:1, vol/vol). Fat ty acid methyl esters were obtained by t ransester if icat ion with borontrifluor- ide/methanol reagent (90~ 2 h) as described previously (22). The methyl esters were extracted with hexane and analyzed on a Perkin Elmer (San Jose, CA) 8420 gas chro- matograph equipped with a fused silica capillary column (22). Chromatographic conditions included an oven tem- pera ture of 205~ a flame-ionization detector set at 250~ and hel ium as carr ier gas a t a flow rate of 0.9 mL/min. Mixtures of fa t ty acid methyl es ter s tandards (Nu-Chek-Prep, Elysian, MN) were used for peak identifi- cation.
Expression of hepatic antioxidant enzymes (CAT,, GSH- Px, SOD) mRNA. Total RNA was isolated from the frozen livers using the acicYguanidinium isothiocyanate/phenol/ chloroform extract ion procedure (23), and the RNA was quantified spectrophotometrically. Twenty micrograms of total RNA was electrophoresed in 0.8% agarose/2.2 M formaldehyde gel. The gel contained e thidium bromide (0.5 ~g/mL) in order to verify RNA integri ty and loading equivalency. RNA was electroblotted onto nitrocellulose (Schleicher & Schuell, Keene, NH) and fixed to the mem- brane by cross-linking, using Stratagene UV crosslinker- 1800 (Stratagene, La Jolla, CA). The blots were prehy- bridized, hybridized and then washed following the proce- dure described in detail by Korc et al. (24). In brief, the blots were prehybridized overnight at 42~ in a buffer con- ta ining 50% formamide/0.1% sodium dodecylsulfate (SDS)/0.5X sodium chloride/sodium citrate buffer (SSC) ( lX SSC = 150 mM NaC1, 15 mM sodium citrate, pH 7.0)/2X Denhardt 's ( lX Denhardt 's = 0.02% each of Ficoll, polyvinylpyrrolidone and bovine serum albumin)/250 ~g/mL sonicated, dena tured salmon sperm DNA and
LIPIDS, Vol. 29, no. 8 (1994)
563
n-3 FATTY ACIDS AND ANTIOXIDANT ENZYME EXPRESSION
50 mM sodium phosphate, pH 6.5. The blots were then hy- bridized at 42~ for 18 h in the same buffer to which 10% dextran sulfate and the 32p-labeled cDNA probe (1 • 106 cpm/mL) were added. The blots were then washed at 23~ three t imes for 5 min each in a buffer containing 2X SSC/1.0% SDS, followed by three washes in 0.1X SSC/I% SDS (high stringency). The blots were exposed at -80~ to Kodak XAR-5 film with Dupont intensifying screens. The intensi ty of the autoradiographic bands was semi- quantif ied by videoimage analysis using NIH Image 1.4 program, and the values were expressed in fold change as a ratio of the densitometric value of CAT, GSH-Px and SOD to tha t of glyceraldehyde 3-phosphate dehydroge- nase (GAPDH). GAPDH was used as an internal control. The size of mRNA was determined by its relative positions to tha t of ethidium bromide-stained 28S and 18S riboso- mal RNA and 0.24-9.5 kb RNA ladder (Gibco-BRL, Grand Island, NY). The cDNA used in this s tudy were CAT (1.3 kb Bam HI/SphI fragment) (25), GSH-Px (0.55 kb EcoRI fragment) (26), SOD (0.65 kb Pst I f ragment) (27) and GAPDH (1.0 kb Barn H1-Pst I f ragment) (28). The cDNA probes (CAT, SOD, GAPDH) were obtained from American Type Culture Collection (Rockville, MD). The cDNA were labeled with [a-32P]dCTP (3000 Ci/mmol; Amersham, Arlington Heights, IL) by random prime la- beling (Boehringer Mannheim, Indianapolis, IN) to obtain a specific activity of 0.8-1.2 • 109 cpmJ~tg.
Measurement of SOD, GSH-Px and CAT enzyme activi- ties in the cytosolic fractions. The chemicals used in the enzyme assays were obtained from Sigma Chemical Company (St. Louis, MO). All three enzyme activities in the cytosolic fraction of livers were measured in a Shi- madzu UV-Visible recording spectrophotometer UV-265 (Shimadzu Scientific Ins t ruments , Houston, TX). CAT (EC 1.11.1.6) activity was measured by monitoring the de- composition of H202 at 240 nm as described by Aebi (29). The reaction mixture (3 mL) consisted of 50 mM phos- phate buffer (pH 7.0) and 1 mL 30 mM H202 in phosphate buffer and suitably diluted cytosol. CAT activity was ex- pressed as pmoles of hydrogen peroxide reduced/min/mg protein. GSH-Px (EC 1.11.1.9) activity was measured using the coupled-enzyme system as previously described (30). The reaction mixture consisted of 0.5 mL potassium phosphate buffer (pH 7.0) containing 1 mM ethylenedi- aminetetraacetic acid (EDTA), 0.1 mL of 10 mM GSH and 0.1 mL of 2.4 U/mL glutathione reductase. The mixture was preincubated for 10 min at 37~ Thereafter, 0.1 mL of 1.5 mM [Lnicotinamide adenine dinucleotide phos- phate, reduced form (NADPH) was added, and hydroper- oxide-independent consumption of NADPH was moni- tored for three min. The overall react ion was s tar ted by adding 0.1 mL of 12 mM t-butyl hydroperoxide solution, and the decrease in absorption at 340 um was monitored at 25~ GSH-Px activity was calculated based on the equation described by Flohe and Gunzier (31). SOD (EC 1.15.1.1) activity in the cytosolic fraction was deter- mined as described by McCord and Fridovich (32) using the xanthine oxidase/cytochrome C system. The reaction mixture consisted of 2.4 mL of 0.05 M potassium phos- phate buffer (pH 7.8) containing 0.1 mM EDTA, 0.3 mL of 0.1 mM ferricytochrome C, 0.1 mL of 1% deoxycholate,
0.1 mL of 1.5 mM potassium cyanide, 0.3 mL of 0.5 mM xanthine and 20 ~tL of appropriately diluted xanthine oxi- dase to produce a rate of reduction of ferricytochrome C at 550 nm of 0.025 absorbance unit/min at 25~ One unit of SOD was defined as the amount of SOD required to in- hibit the rate of reduction of cytochrome C by 50%.
Statistical analyses. The data shown are means _+ SEM. Data were statistically analyzed using Student 's t - t e s t with Bonferroni adjustment (33), and P < 0.05 was consid- ered significant.
RESULTS
Survivial, body weight and proteinuria levels. The body weights of B/W mice on all three diets showed a steady in- crease until four months, af ter which t ime the body weights plateaued (Table 2). The mice on the 10% CO diet showed slightly lower body weights after four months as compared to the mice on the KO or FO diets. The mice on 10% CO developed severe proteinuria relatively early (by seven months) compared to the mice on the n-3 lipid-based diets (Table 3). The three types of dietary lipids fed at the 10% level had a significant effect on the survival rates of these mice. The percent survival of B/W mice on the three dietary t rea tments is compiled in Table 4. At eleven months, all mice in the CO group had died, and 20% of the mice in the KO group and 47% of the mice in the FO group were still alive.
Fatty acid composition of microsomal fraction. In order to study the effect of dietary lipids on the membrane lipid composition of liver, microsomal membranes were isolated
TABLE 2
E f f e c t o f 10% (w/w) C o r n Oil-, Kri l l Oil- o r F i s h O i l - B a s e d D i e t s o n B o d y W e i g h t s o f (NZBxNZW) F I M i c e
Age (body weights in grams) a (months) Corn oil Krill oil Fish oil
1.0 20.2• 20.5• 20.0• 2.5 31.9• 33.7• 32.9r 4.5 40.8• 42.2• 41.8• 6.5 42.4• 46.1• 45.9• aValues are means • SEM of 20 mice/group.
TABLE 3
E f f e c t o f 10% (w/w) Corn Oil-, KriII Oil- o r F i s h O i l - B a s e d D i e t s o n P r o t e i n u r i a L e v e l s in (NZBxNZW) F 1 M i c e
Proteinuria levels a Age Number + ++ +++
(months) Diet of mice (30 mg/dL) (100 mg/dL) (500 mg/dL)
6.5 Corn oil 15 9 1 5 6.5 Krill oil 15 8 4 3 6.5 Fish oil 15 11 4 0
10 Corn oil 5 0 0 5 10 Krill oil 11 3 1 7 10 Fish oil 14 5 2 7
aProteinuria was determined by us ing Chemstrip (Boehringer Mannheim, Indianapolis, IN).
LIPIDS, Vol. 29, no. 8 (1994)
564
J.T. VENKATRAMAN ETAL.
TABLE 4
E f f e c t o f 10% (w/w) C o r n Oil-, Kr i l l Oil- o r F i s h Oi l -Based D i e t s o n Surv iva l ' R a t e i n (NZBxNZW) F 1 M i c e
Diets Survival (at 11 months)
Number of mice alive Percent survival
Corn oil 0/15 0 Krill oil 3/15 20.0 Fish oil 7/15 46.7
aBoth fish oil and krill oil significantly (P < 0.01) increased the sur- vival ra te of B/W mice.
a n d a n a l y z e d fo r f a t t y a c i d c o m p o s i t i o n . K O a n d F O h a d g e n e r a l l y s i m i l a r e f f e c t s o n t h e f a t t y a c i d c o m p o s i t i o n o f t h e m i c r o s o m a l f r a c t i o n s , w h e r e a s t h e e f f e c t o f C O w a s d i f f e r e n t (Tab le 5). T h e l e v e l s o f 16:0 a n d 16:1 w e r e s ign i f - i c a n t l y l o w e r ( P < 0 .001) , a n d t h e 18:0 l eve l w a s h i g h e r i n t h e C O - f e d g r o u p c o m p a r e d to t h e KO- a n d F O - f e d g r o u p s . T h e l e v e l s o f 18:2 a n d 2 0 : 4 n - 6 f a t t y a c i d s w e r e s i g n i f i - c a n t l y h i g h e r ( P < 0 . 0 0 1 ) i n t h e C O - f e d g r o u p , a n d 20 :5 a n d 22 :6 w e r e s i g n i f i c a n t l y h i g h e r ( P < 0 . 0 1 - 0 . 0 0 1 ) i n t h e n - 3 l i p i d s - f e d g r o u p s . W h e n c o m p a r i n g t h e K O a n d F O g r o u p s , w e f o u n d t h a t t h e l eve l s o f 18:1 ( P < 0 .01) w e r e sig- n i f i c a n t l y l o w e r a n d t h a t t h e 22 :6 l e v e l s w e r e h i g h e r ( P < 0 .01) i n t h e F O - f e d g r o u p .
TBARS. To d e t e r m i n e w h e t h e r t h e d i f f e r e n t m i c r o s o - m a l l i p i d c o m p o s i t i o n a f f e c t e d t h e s u s c e p t i b i l i t y o f t h e mi -
TABLE 5
E f f e c t o f 10% (w/w) C o r n Oil , Kri l l Oi l o r F i s h Oi l o n H e p a t i c M i c r o s o m a l F a t t y A c i d C o m p o s i t i o n o f B/W M i c e a
Fat ty acids Corn oil Fish oil Krill oil
14:0 0.76 _+ 0.04 0.98 • 0.12 0.90 • 0.20 14:1 0.49 • 0.06 0.61 • 0.11 0.64 • 0.09 16:0 20.03 • 0.495 33.81 • 0.43 c 30.24 • 1.03 c 16:1 1.54 • 0.305 3.69 • 0.38 e 4.98 • 0.45 c 18:0 20.33 • 5.11 13.96 • 1.09 12.75 • 1.34 18:1n-9 17.05 • 1.865 11.86 • 0.89 e 18.55 • 18:2n-6 23.92 • 1.24 b 10.64 • 0.53 c 8.99 • 0.31 c 18:3n-3 0.36 • 0.21 0.28 • 0.05 0.17 • 0.06 20:0 0.57 • 0.52 0.15 • 0.02 0.22 • 0.03 20:1 0.30 • 0.24 0.06 • 0.04 0.14 • 0.06 20:2 0.35 • 0.12 0.12 • 0.12 0.00 • 0.00 20:3n-6 0.17 _+ 0.10 0.00 • 0.00 0.31 • 0.18 20:4n-6 8.19 _+ 1.375 3.'40 • 0.08 c 3.11 • 0.43 c 20:3n-3 0.15 • 0.14 0.08 • 0.08 0.19 _+ 0.11 20:5n-3 0.00 • 0.00 b 7.04 • 1.00 c 8.59 +_ 0.83 r 22:0 0.35 • 0.15 0.08 • 0.05 0.00 • 0.00 22:1 0.10 • 0.06 0.00 • 0.00 0.00 • 0.00 22:4n-6 1.08 • 0.34 0.24 • 0.09 0.17 • 0.08 22:4n-3 0.00 • 0.00 0.30 • 0.09 0.40 • 0.13 22:5n-6 0.88 _+ 0.45 0.17 _+ 0.10 0.07 • 0.02 22:5n-3 0.00 • 0.005 0.78 • 0.13 c 0.61 • 0.10 c 22:6n-3 3.26 • 0.32 b 11.67 • 0.50 d 8.87 • 0.63 c 24:0 0.14 • 0.06 0.11 • 0.02 0.09 • 0.02 aValues are expressed as percent w/w. Values are mean • SEM of four mice/group. Abbreviation as in Table 4. b-dValues wi th different superscr ip ts in the same row are signifi- cant ly different at P < 0.05 as revealed by S tudent ' s t - tes t wi th Bonferroni adjustment.
240 ~ 220
~'* ~ 200
~ ~'160 Z ,,~ 140 N~ 120
[ . . .~ 411 2O
0 CORN OIL KRILL OIL FISH OIL
DIETS
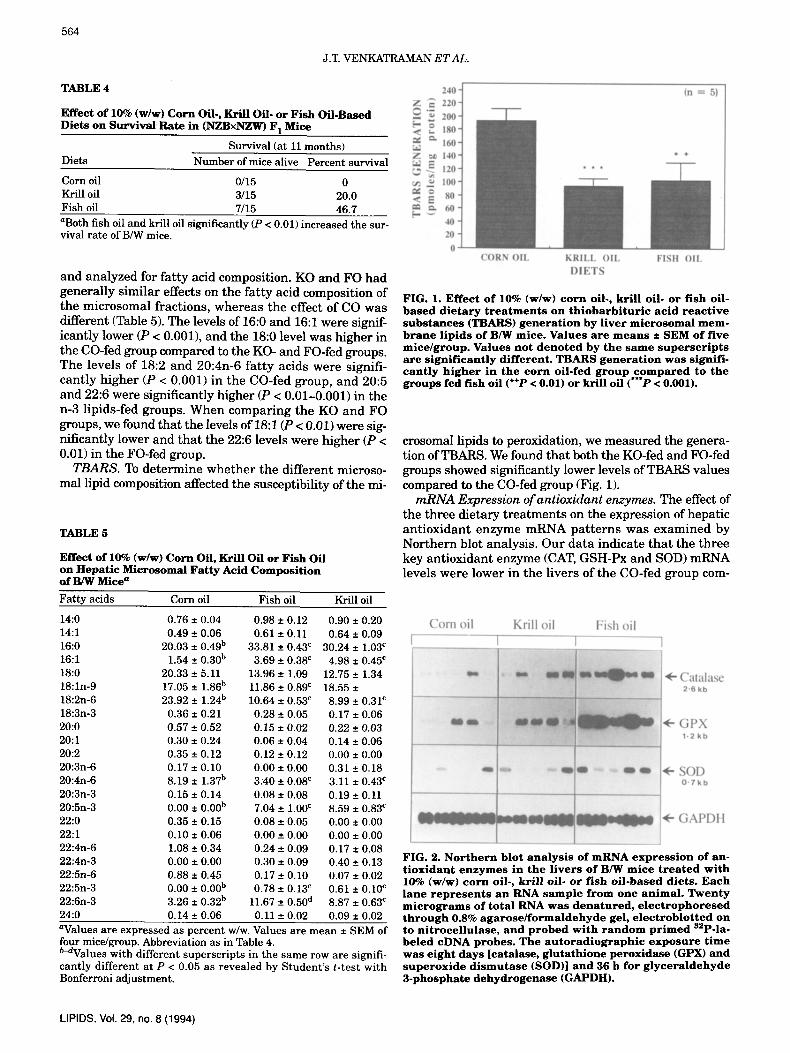
FIG. 1. E f f e c t o f 10% ( w / w ) c o r n oi l . , k r i l l o i l - or f i s h oi l - b a s e d d i e t a r y t r e a t m e n t s o n t h i o b a r b i t u r i c a c i d r e a c t i v e s u b s t a n c e s (TBARS) g e n e r a t i o n b y l i v e r m i c r o ~ m a l m e m - b r a n e l i p i d s o f B/W m i c e . V a l u e s a r e m e a n s • S E M o f f i v e m i c e / g r o u p . V a l u e s n o t d e n o t e d b y t h e s a m e s u p e r s c r i p t s a r e s i g n i f i c a n t l y d i f f e r e n t . T B A R S g e n e r a t i o n w a s s i gn i f i - c a n t l y h i g h e r i n t h e c o r n o i l - f e d g r o u p c o m p a r e d to t h e g r o u p s fed f i sh o i l (+§ < 0.01) or kr i l l o i l (***P < 0.001).
c r o s o m a l l i p i d s to p e r o x i d a t i o n , w e m e a s u r e d t h e g e n e r a - t i o n o f T B A R S . W e f o u n d t h a t b o t h t h e K O - f e d a n d F O - f e d g r o u p s s h o w e d s igaf i f i can t ly l o w e r l e v e l s of T B A R S v a l u e s c o m p a r e d to t h e C O - f e d g r o u p (Fig. 1).
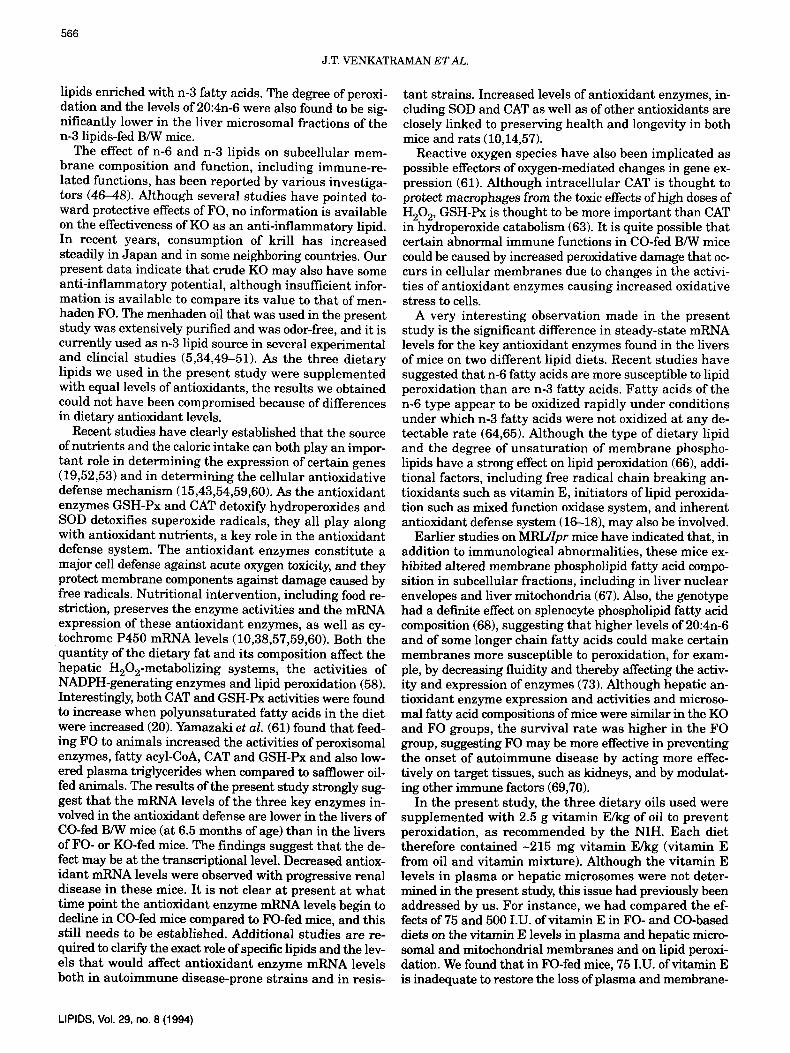
mRNA Expression of antioxidant enzymes. The e f fec t o f t h e t h r e e d i e t a r y t r e a t m e n t s o n t h e e x p r e s s i o n of h e p a t i c a n t i o x i d a n t e n z y m e m R N A p a t t e r n s w a s e x a m i n e d b y N o r t h e r n b l o t a n a l y s i s . O u r d a t a i n d i c a t e t h a t t h e t h r e e k e y a n t i o x i d a n t e n z y m e (CAT, G S H - P x a n d S O D ) m R N A l e v e l s w e r e l o w e r i n t h e l i v e r s o f t h e C O - f e d g r o u p com-
C o r n oil Kril l oil F i sh oil
I I
m ~
s o m 9 ~ Q I
I
Cata lase 2"6 kb
G P X 1 - 2 k b
~ - SOD 0 " T k b
' ~ - G A P D H
FIG. 2. N o r t h e r n b l o t a n a l y s i s o f m R N A e x p r e s s i o n o f an- t i o x i d a n t e n z y m e s in t h e l i v e r s o f B/W m i c e t r e a t e d w i t h 10% ( w / w ) c o r n oi l - , kr i l l o i l - o r f i s h o i l - b a s e d d i e t s . E a c h l a n e r e p r e s e n t s a n R N A s a m p l e f r o m o n e a n i m a l . T w e n t y m i c r o g r a m s o f t o t a l R N A w a s d e n a t u r e d , e l e c t r o p h o r e s e d t h r o u g h 0.8% a g a r o s e / f o r m a l d e h y d e ge l , e l e c t r o b l o t t e d o n to n i t r o c e l l u l a s e , a n d p r o b e d w i t h r a n d o m p r i m e d S2p-la- b e l e d c D N A p r o b e s . T h e a u t o r a d i o g r a p h i c e x p o s u r e t i m e w a s e i g h t d a y s [ ca ta lase , g l u t a t h i o n e p e r o x i d a s e (GPX) a n d s u p e r o x i d e d i s m u t a s e (SOD)] a n d 36 h for g l y c e r a l d e h y d e 3 - p h o s p h a t e d e h y d r o g e n a s e (GAPDH) .
LIPIDS, Vol. 29, no. 8 (1994)

565
n-3 FATTY ACIDS AND ANTIOXIDANT ENZYME EXPRESSION
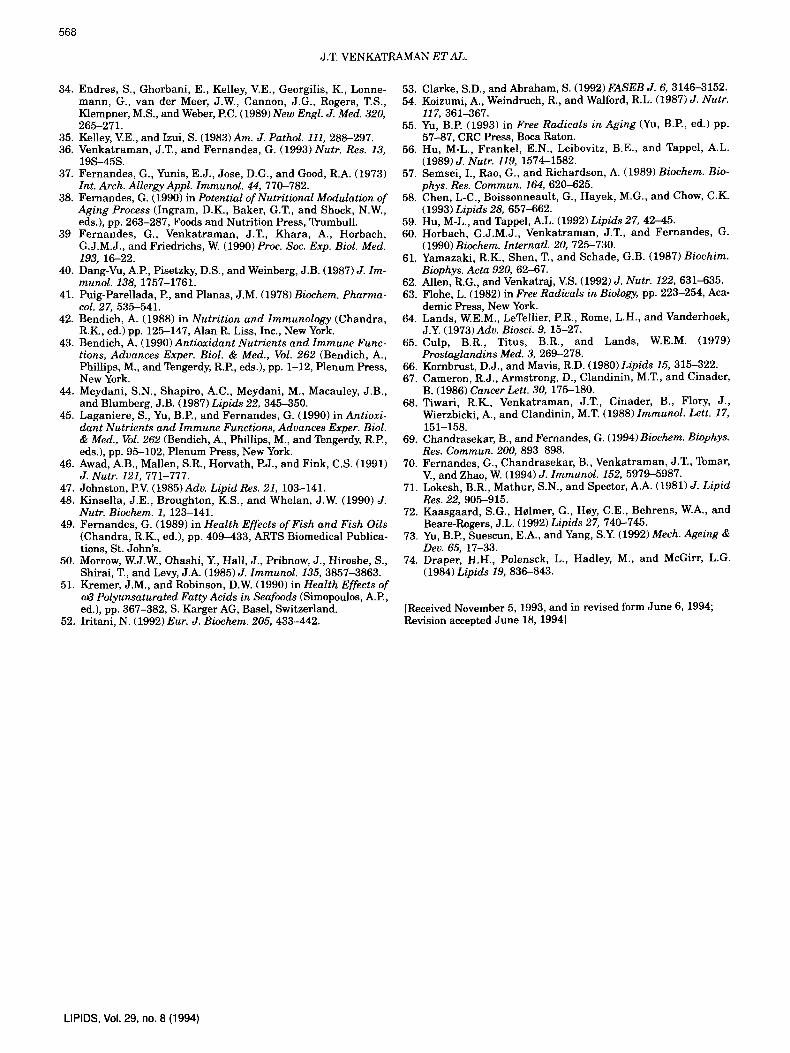
pared to those in the KO- and FO-fed groups (Fig. 2). FO feeding resul ted in a higher expression of these enzymes compared to KO feeding. The differences in mRNA levels were not due to variation in RNA loading, as GAPDH lev- els did not vary significantly. Loading equivalency was also confirmed by ethidium bromide-stained 18S and 28S. Densi tometr ic analysis of the autoradiographic bands, after s tandardizat ion relative to GAPDH, revealed (Fig. 3) a significantly increased expression of the antioxidant en- zymes in the FO group compared to the CO group (P < 0.01 level). However, when comparing the FO and the KO groups, CAT mRNA expression was significantly higher (P < 0.05) in the FO group.
Enzymatic activities of cytosolic CAT,, GSH-Px and SOD. The mice fed the KO- and FO-based diets expressed sig- nificantly higher enzyme activit ies (P < 0.001) for CAT (9-9-fold), GSH-Px (4-fold and SOD (1.4-fold) in the liver cytosols when compared to the group given the CO-based diet (Table 6). The enzyme activit ies were s imilar in the KO and FO groups suggesting tha t n-3 lipids have a more favorable effect on antioxidant s ta tus than does CO.
52
1.0
~ 0.8 e~ "<~ o.5
0.4
' ~ 0.2
o o 1.0
0.8
0.6
0.4
0.2
0.0
1.0
= o.8
�9 ~ 0.6
0.4
�9 r.~ 0.2
0.0
bc
Com oil Krill oil Fish oil
FIG. 3. D e n s i t o m e t r i e a n a l y s i s o f t h e a u t o r a d i o g r a p h i e b a n d s s e e n in F i g u r e 2. F o r t h e a n a l y s i s , v i d e o i m a g e ana ly - s i s w a s d o n e u t i l i z i n g t h e N a t i o n a l I n s t i t u t e s o f H e a l t h I m a g e 1.4 p r o g r a m , a n d t h e r e s u l t s are e x p r e s s e d as a ra t io o f t h e s p e c i f i c m e s s a g e t o t h e c o n s t i t u t i v e l y e x p r e s s e d G A P D H m e s s a g e . T h e v a l u e s w e r e t e s t e d for s i g n i f i c a n c e u s i n g S t u d e n t ' s t - tes t . A n y v a l u e s i n t h e f i g u r e n o t d e n o t e d b y the s a m e s u p e r s c r i p t are s i g n i f i c a n t l y d i f f erent . T h e sta- t i s t i c a l s i g n i f i c a n c e o f t h e v a l u e s t e s t e d w e r e as f o l l o w s : CAT-CO vs. KO: P < 0.05; CO vs . FO: P < 0.01; KO vs . FO: P < 0.05; G S H - P x - C O vs . FO: P < 0.01; KO vs . FO: P < 0.01; S O D - C O vs. FO: P < 0.01. A b b r e v i a t i o n s as in Figure 2; CAT, ca ta la se ; CO, c o r n oil; KO, kr i l l off; FO, f i sh oil; GSA-Px , g lu- t a t h i o n e p e r o x i d a s e .
TABLE 6
E f f e c t o f 10% (w/w) Corn Oil-, Kri l l Oil- or F i s h O i l - B a s e d D i e t s o n t h e A c t i v i t i e s o f H e p a t i c C y t o s o l i c A n t i o x i d a n t En- z y m e s in B/W M i c e a
Enzyme Corn oil Krill oil Fish oil
Catalase b 59.1 -+ 4.4 c 529.9 + 27.5 d 472.0 _+ GSH-Px e 25.5 -+ 2.0 c 98.7 _+ 5.9 d 106.0 _+ 3.4 d SOD f 7.2 _+ 0.3 c 9.9 -+ 0 .4 d 10.2 _+ 0.2 d aValues are means +_- SEM of five mice/group. Abbreviation as in Table 4. bCatalase activity is expressed as pmol H202 reduced/mg pro- tein/min. r with different superscript letters (c,d) in the same row are significantly different at P < 0.05 level as analyzed by Stu- dent's t-test with Bonferroni adjustment. ~GSH-Px (glutathione peroxidase) activity expressed as pmol ~-nicotinamide adenine dinucleotide phosphate oxidized/g pro- tein/min. fSOD (superoxide dismutase) activity is expressed in units/mg pro- tein.
DISCUSSION
Along with several therapeut ic approaches a imed at de- laying the pathology of au to immune diseases, nutri t ional in tervent ion is now also being recognized as having a major effect in the t r ea tmen t of several of these diseases (5,34-36). Our extensive work on dietary intervent ion in au to immune mice suggests tha t both die tary restr ict ion and an n-3 lipid diet adminis te red without reducing the caloric intake can dramat ical ly prolong the life span and delay the onset of immunological abnormal i t ies in B/W mice (37-39). The exact mechanism(s) involved in delay- ing au to immune disease e i ther by food restr ic t ion or by FO, is present ly not clear, a l though several possibili t ies have been suggested (4,5,9,34,35). I t is well es tabl ished tha t au to immune diseases have multifactorial etiologies (1,12). Along with genetic, hormonal , viral, immunologi- cal and other factors, the inabil i ty of the ant ioxidant de- fense sys tem to cope with oxidative s t ress has been pro- posed as one possible cause. More direct evidence, how- ever, has not yet been forthcoming (39,40).
The role of antioxidant nutr ients in membrane- re la ted and cellular immune fianctions has been addressed by sev- eral invest igators (41-44). Our ear l ier work on enzyme- dependent and nonenzymat ic in vitro lipid peroxidat ion in B/W mice fed high levels of CO or FO has indicated tha t v i tamin E supplementa t ion can significantly reduce per- oxidation in l iver mitochondrial and microsomal mem- branes (45). We thus become interested in testing whether the degree of peroxidation in subcellular membrane lipids in autoimmune mice was due to defects in the antioxidant defense system. Furthermore, it would be important to es- tabl ish whether different lipids have a differential effect on the antioxidant defense system at the molecular level. In the presen t study, we examined the effects of feeding n-6 and n-3 lipid-enriched diets on the activities and the mRNA expression of three key ant ioxidant enzymes, on microsomal lipid composition, and on the ex ten t of lipid peroxidation. Our da ta show tha t the activit ies and the mRNA levels of these antioxidant enzymes were higher in the livers of B/W mice on the KO and FO diets, i.e., fed
LIPIDS, Vol. 29, no. 8 (1994)
566
J.T. VENKATRAMAN ETAL.
lipids enriched with n-3 fatty acids. The degree of peroxi- dation and the levels of 20:4n-6 were also found to be sig- nificantly lower in the liver microsomal fractions of the n-3 lipids-fed B/W mice.
The effect of n-6 and n-3 lipids on subcellular mem- brane composition and function, including immune-re- lated functions, has been reported by various investiga- tors (46-48). Although several studies have pointed to- ward protective effects of FO, no information is available on the effectiveness of KO as an anti-inflammatory lipid. In recent years, consumption of krill has increased steadily in Japan and in some neighboring countries. Our present data indicate that crude KO may also have some anti-inflammatory potential, although insufficient infor- mation is available to compare its value to that of men- haden FO. The menhaden oil that was used in the present study was extensively purified and was odor-free, and it is currently used as n-3 lipid source in several experimental and clincial studies (5,34,49-51). As the three dietary lipids we used in the present study were supplemented with equal levels of antioxidants, the results we obtained could not have been compromised because of differences in dietary antioxidant levels.
Recent studies have clearly established that the source of nutrients and the caloric intake can both play an impor- tant role in determining the expression of certain genes (19,52,53) and in determining the cellular antioxidative defense mechanism (15,43,54,59,60). As the antioxidant enzymes GSH-Px and CAT detoxify hydroperoxides and SOD detoxifies superoxide radicals, they all play along with antioxidant nutrients, a key role in the antioxidant defense system. The antioxidant enzymes constitute a major cell defense against acute oxygen toxicity, and they protect membrane components against damage caused by free radicals. Nutritional intervention, including food re- striction, preserves the enzyme activities and the mRNA expression of these antioxidant enzymes, as well as cy- tochrome P450 mRNA levels (10,38,57,59,60). Both the quantity of the dietary fat and its composition affect the hepatic H202-metabolizing systems, the activities of NADPH-generating enzymes and lipid peroxidation (58). Interestingly, both CAT and GSH-Px activities were found to increase when polyunsaturated fatty acids in the diet were increased (20). Yamazaki et al. (61) found that feed- ing FO to animals increased the activities of peroxisomal enzymes, fatty acyl-CoA, CAT and GSH-Px and also low- ered plasma triglycerides when compared to safflower oil- fed animals. The results of the present study strongly sug- gest that the mRNA levels of the three key enzymes in- volved in the antioxidant defense are lower in the livers of CO-fed B/W mice (at 6.5 months of age) than in the livers of FO- or KO-fed mice. The findings suggest that the de- fect may be at the transcriptional level. Decreased antiox- idant mRNA levels were observed with progressive renal disease in these mice. It is not clear at present at what time point the antioxidant enzyme mRNA levels begin to decline in CO-fed mice compared to FO-fed mice, and this still needs to be established. Additional studies are re- quired to clarify the exact role of specific lipids and the lev- els that would affect antioxidant enzyme mRNA levels both in autoimmune disease-prone strains and in resis-
tant strains. Increased levels of antioxidant enzymes, in- cluding SOD and CAT as well as of other antioxidants are closely linked to preserving health and longevity in both mice and rats (10,14,57).
Reactive oxygen species have also been implicated as possible effectors of oxygen-mediated changes in gene ex- pression (61). Although intracellular CAT is thought to protect macrophages from the toxic effects of high doses of H202, GSH-Px is thought to be more important than CAT in hydroperoxide catabolism (63). It is quite possible that certain abnormal immune functions in CO-fed B/W mice could be caused by increased peroxidative damage that oc- curs in cellular membranes due to changes in the activi- ties of antioxidant enzymes causing increased oxidative stress to cells.
A very interesting observation made in the present study is the significant difference in steady-state mRNA levels for the key antioxidant enzymes found in the livers of mice on two different lipid diets. Recent studies have suggested that n-6 fatty acids are more susceptible to lipid peroxidation than are n-3 fatty acids. Fatty acids of the n-6 type appear to be oxidized rapidly under conditions under which n-3 fatty acids were not oxidized at any de- tectable rate (64,65). Although the type of dietary lipid and the degree of unsaturation of membrane phospho- lipids have a strong effect on lipid peroxidation (66), addi- tional factors, including free radical chain breaking an- tioxidants such as vitamin E, initiators of lipid peroxida- tion such as mixed function oxidase system, and inherent antioxidant defense system (16--18), may also be involved.
Earlier studies on MRL/Ipr mice have indicated that, in addition to immunological abnormalities, these mice ex- hibited altered membrane phospholipid fatty acid compo- sition in subcellular fractions, including in liver nuclear envelopes and liver mitochondria (67). Also, the genotype had a definite effect on splenocyte phospholipid fatty acid composition (68), suggesting that higher levels of 20:4n-6 and of some longer chain fatty acids could make certain membranes more susceptible to peroxidation, for exam- ple, by decreasing fluidity and thereby affecting the activ- ity and expression of enzymes (73). Although hepatic an- tioxidant enzyme expression and activities and microso- mal fatty acid compositions of mice were similar in the KO and FO groups, the survival rate was higher in the FO group, suggesting FO may be more effective in preventing the onset of autoimmune disease by acting more effec- tively on target tissues, such as kidneys, and by modulat- ing other immune factors (69,70).
In the present study, the three dietary oils used were supplemented with 2.5 g vitamin E/kg of oil to prevent peroxidation, as recommended by the NIH. Each diet therefore contained -215 mg vitamin E/kg (vitamin E from oil and vitamin mixture). Although the vitamin E levels in plasma or hepatic microsomes were not deter- mined in the present study, this issue had previously been addressed by us. For instance, we had compared the ef- fects of 75 and 500 I.U. of vitamin E in FO- and CO-based diets on the vitamin E levels in plasma and hepatic micro- somal and mitochondrial membranes and on lipid peroxi- dation. We found that in FO-fed mice, 75 I.U. of vitamin E is inadequate to restore the loss of plasma and membrane-
LIPIDS, Vol. 29, no. 8 (1994)
567
n-3 FATTY ACIDS AND ANTIOXIDANT ENZYME EXPRESSION
bound vi tamin E, and 500 I.U. was sufficient to replenish both s e rum and hepat ic v i t amin E levels and to reduce free radical generation (45).
Several studies have indicated tha t t issue lipid peroxi- dation may result from lowered antioxidant enzyme activ- ities (19,71) as well as f rom low t issue v i t amin E levels (18,72). However, by increasing dietary v i tamin E levels, peroxidat ion of hepat ic microsomes could be p reven ted (18,72). Also, by increasing dietary v i tamin E levels from 35 to 180 I.U., increased tissue vi tamin E levels in the FO group s imilar to those in the CO group were noted, whereas l iver and kidney v i t amin E levels were unaf- fected by dietary lipids (18). Although hepatic v i tamin E levels were not measured in the present study, our earlier observations (45) and studies reported by others suggest tha t tissue vi tamin E levels could be increased with an in- crease in dietary v i tamin E levels. I t is possible, however, t ha t the high level of d ie tary v i tamin E used in the pres- ent s tudy may have protected the target t issues of autoim- mune-prone B/W mice from peroxidat ive damage, espe- cially in FO-fed mice. In addition, the high d ie ta ry vita- min E supplementat ion and the well-designed feeding and s torage pract ices followed for oils in the presen t s tudy m a y have contr ibuted fu r the r to preserving the enzyme activities and the mRNA expression of enzymes involved in the ant ioxidant defense sys tem far be t te r in FO- and less so in CO-fed mice. Fur the r work is required to mea- sure the effects with and without different levels of vita- min E on tissue vi tamin E levels and lipid peroxidation as well as on antioxidant enzyme activities.
In summary , our da ta indicate t ha t a diet containing mar ine lipids wi th very long-chain n-3 fa t ty acids m a y delay the onset of auto immune disease in mice. I t appears t ha t a l tera t ion of the m e m b r a n e fa t ty acid composit ion due to n-3 lipids may enhance the efficiency of the antiox- idant defense system at the molecular level and may pre- vent the susceptibility of membranes to peroxidation. Fur- the r s tudies are needed to es tabl ish the role of var ious lipids in main ta in ing an ant ioxidant defense sys tem and in assur ing an extended life span in long-lived inbred s t ra ins of mice and rats . As FO contains highly unsa tu- ra ted and potent ial ly uns tab le n-3 fa t ty acids, concerns have been raised in the pas t about their tendency to per- oxidize dur ing storage, as an imals fed FO have been re- ported to excrete h igher levels of TBARS in ur ine (74). Our data, however, would indicate tha t by supplementing FO with adequate levels of antioxidants , it is possible to enhance the antioxidant defense system, especially in au- to immune-prone mice. This m a y be one of the mecha- n i sms by which the FO diet significantly increases the survival rate and delays the onset of autoimmuni ty in au- to immune prone B/W mice. The findings are encouraging in view of utilizing FO in therapeutic applications.
ACKNOWLEDGMENTS This research was supported by NIH grants RO1-AG 03417 and DE 10863. The authors wish to thank V. Tomar for his excellent technical assistance, Dr. Arlan G. Richardson, The Audie L. Mur- phy Veteran's Memorial Hospital and the University of Texas Health Science Center at San Antonio, for a generous giPe of GSH- Px cDNA, Itano Refrigerated Food Co., Ltd. (Tokushima, Japan) for providing krill oil, and the U.S. Department of Commerce, Na-
tional Marine Fisheries Service (Charleston, NC) for supplying menhaden fish oil.
REFERENCES 1. Talal, N., and Steinberg, A.D. (1974) Curr. Topics Microbiol.
Immunol. 64, 79-103. 2. Fernandes, G., Friend, P., Yunis, E.J., and Good, R.A. (1978)
Proc. Natl. Acad. Sci. USA 75, 1500-1504. 3. Fernandes, G., Yunis, E.J., and Good, R.A. (1976) Proc. Natl.
Acad. Sci. 73, 1279-1283. 4. Prickett, J.D., Robinson, D.R., and Steinberg, A.D. (1981) J.
Clin. Invest. 68, 556-559. 5. Venkatraman, J.T., and Fernandes, G. (1991) in Nutrition and
Immunology (Chandra, R.K., ed.) pp. 309-323, ARTS Biomed- ical Publishers and Distributors, St. John's.
6. Jeng, K.C., and Fernandes, G. (1989) Internatl. J. Im- munopathol. & Immunopharmacol. 126, 1999-2006.
7. Jeng, K.C., and Fernandes, G. (1991)Proc. Natl. Sci. Council. (Part. B, Life Sci.) 15, 105-110.
8. Ames, B.N., Shigenaga, M.K., and Hagen, T.M. (1993) Proc. Natl. Acad. Sci. USA 90, 7915-7922.
9. Weindruch, R. (1984) in Free Radicals in Molecular Biology, Aging, and Disease (Armstrong, D., ed.) pp. 181-202, Raven Press, New York.
10. Rao, G., Xia, E., and Richardson, A. (1990) Mech. Ageing & Dev. 53, 49--60.
11. Das, U.N. (1991) Prostagl. Leukot. Essen. Fatty Acids 44, 201-210.
12. Spallholz, J.E. (1990) in Antioxidant Nutrients and Immune Function (Bendich, A., ed.) pp. 145-158, Plenum Press, New York.
13. Rokutan, IL, Hosokawa, T., Nakamura, K., Koyama, K., Aoike, A., and Kawai, IL (1988)Int. Arch. Allergy. Appl. Immunol. 87, 113-119.
14. Venkatraman, J.T., Chandrasekar, B., Kim, J-D., and Fernan- des, G. (1994) Biochim. Biophys. Acta, in press.
15. Chow, C.K. (1988) in Cellular Antioxidant Defense Mechanism (Chow, C.K., ed.), 2nd edn., pp. 217-237, CRC Press, Boca Raton. Wills, E.D. (1985) in Oxidative Stress (Sies, H., ed.), pp. 197-218, Academic Press, New York. Machlin, Z.J., and Bendich, A. (1987) FASEB J. 1, 441-445. Leibovitz, B., Hu, M.L., and Tappel, A.L. (1990) J. Nutr. 120, 97-104. Huang, C-J., and Fwu, M-L. (1993)J. Nutr. 123, 803-810. L'Abbe, M.R., Trick, K.D., and Beare-Rogers, J.L. (1991) J. Nutr. 121, 1331-1340. Laganiere, S., and Yu, B.P. (1987) Biochem. Biophys. Res. Com- mun. 145, 1185-1191. Venkatraman, J.T., and Clandinin, M.T. (1988)Biochim. Bio- phys. Acta 940, 33-42. Chomczynski, P., and Sacchi, N. (1987)Anal. Chem. 162, 156-159. Korc, M., Chandrasekar, B., Yamanaka, Y., Friess, H., Buchler, M., and Berger, H.G. (1992)J. Clin. Invest. 90, 1352-1360. Koreluk, R.G., Quan, F., Lewis, W.H., Guise, K.S., Willard, H.F., Holmes, M.T., and Gravel, R.A. (1984)J. Biol. Chem. 259, 13819-13823. Mullenbach, G.T., Tabrizi, A., Irvine, B.D., Bell, G.I., and Hal- liwell, R.A. (1987) Nucleic Acid Res. 15, 13-16. Lieman-Hurwitz, J., Dafni, N., Lavie, V., and Groner, Y. (1982) Proc. Natl. Acad. Sci. USA 79, 2808-2811. Tso, J-Y., Sun, X-H., Kao, T-H., Reece, K.S., and Wu, R. (1985) Nucleic. Acid Res. 13, 2485-2502. Aebi, H. (1974) Methods Enzymol. 2, 673-678. Laganiere, S., and Yu, B.P. (1989) Mech. Ageing & Dev. 48, 221-230. Flohe, L., and Gunzler, W.A. (1991) Methods Enzymol. 105, 114-119. McCord, J.M., and Fridovich, I. (1969) J. Biol. Chem. 244, 6049-6055. Keppel, G. (1982) in Design and Analysis of a Researcher's Handbook, 2nd edn., pp. 146-150, Prentice-Hall Inc., Engel- wood Cliffs.
16.
17. 18.
19. 20.
21.
22.
23.
24.
25.
26.
27.
28.
29. 30.
31.
32.
33.
LIPIDS, Vol. 29, no. 8 (1994)
568
J.T. VENKATRAMAN ETAL.
34. Endres, S., Ghorbani, E., Kelley, V.E., Georgilis, K., Lonne- mann, G., van der Meer, J.W., Cannon, J.G., Rogers, T.S., Klempner, M.S., and Weber, P.C. (1989)New Engl. J. Med. 320, 265-271.
35. Kelley, V.E., and Izui, S. (1983) Am. J. Pathol. 111, 288-297. 36. Venkatraman, J.T., and Fernandes, G. (1993) Nutr. Res. 13,
19S-45S. 37. Fernandes, G., Yunis, E.J., Jose, D.G., and Good, R.A. (1973)
Int. Arch. Allergy Appl. Immunol. 44, 770-782. 38. Fernandes, G. (1990) in Potential of Nutritional Modulation of
Aging Process (Ingram, D.K., Baker, G.T., and Shock, N.W., eds.), pp. 263-287, Foods and Nutrition Press, Trumbull.
39 Fernandes, G., Venkatraman, J.T., Khara, A., Horbach, G.J.M.J., and Friedrichs, W. (1990) Proc. Soc. Exp. Biol. Med. 193, 16-22.
40. Dang-Vu, A.P., Pisetzky, D.S., and Weinberg, J.B. (1987) J. Im- munol. 138, 1757-1761.
41. Puig-Parellada, P., and Planas, J.M. (1978) Biochem. Pharma- col. 27, 535-541.
42. Bendich, A. (1988) in Nutrition and Immunology (Chandra, R.K., ed.) pp. 125-147, Alan R. Liss, Inc., New York.
43. Bendich, A. (1990) Antioxidant Nutrients and Immune Func- tions, Advances Exper. Biol. & Med., Vol. 262 (Bendich, A., Phillips, M., and Tengerdy, R.P., eds.), pp. 1-12, Plenum Press, New York.
44. Meydani, S.N., Shapiro, A.C., Meydani, M., Macauley, J.B., and Blumberg, J.B. (1987) Lipids 22, 345-350.
45. Laganiere, S., Yu, B.P., and Fernandes, G. (1990) in Antioxi- dant Nutrients and Immune Functions, Advances Exper. Biol. & Med., VoL 262 (Bendich, A., Phillips, M., and Tengerdy, R.E, eds.), pp. 95-102, Plenum Press, New York.
46. Awad, A.B., Mallen, S.R., Horvath, P.J., and Fink, C.S. (1991) J. Nutr. 121, 771-777.
47. Johnston, P.V. (1985)Adv. Lipid Res. 21, 103-141. 48. Kinsella, J.E., Broughton, K.S., and Whelan, J.W. (1990) J.
Nutr. Biochem. 1, 123-141. 49. Fernandes, G. (1989) in Health Effects ofFish and Fish Oils
(Chandra, R.K., ed.), pp. 409-433, ARTS Biomedical Publica- tions, St. John's.
50. Morrow, W.J.W., Ohashi, Y., Hall, J., Pribnow, J., Hiroshe, S., Shirai, T., and Levy, J.A. (1985) J. Immunol. 135, 3857-3863.
51. Kremer, J.M., and Robinson, D.W. (1990) in Health Effects of 0)3 Polyunsaturated Fatty Acids in Seafoods (Simopoulos, A.P., ed.), pp. 367-382, S. Karger AG, Basel, Switzerland.
52. Iritani, N. (1992) Eur. J. Biochem. 205, 433-442.
53. Clarke, S.D., and Abraham, S. (1992)FASEB J. 6, 3146-3152. 54. Koizumi, A., Weindruch, R., and Walford, R.L. (1987) J. Nutr.
117, 361-367. 55. Yu, B.P. (1993) in Free Radicals in Aging (Yu, B.P., ed.) pp.
57-87, CRC Press, Boca Raton. 56. Hu, M-L., Frankel, E.N., Leibovitz, B.E., and Tappel, A.L.
(1989) J. Nutr. 119, 1574-1582. 57. Semsei, I., Rao, G., and Richardson, A. (1989) Biochem. Bio-
phys. Res. Commun. 164, 620-625. 58. Chen, L-C., Boissonneault, G., Hayek, M.G., and Chow, C.K.
(1993) Lipids 28, 657-662. 59. Hu, M-L., and Tappel, A.L. (1992) Lipids 27, 42-45. 60. Horbach, G.J.M.J., Venkatraman, J.T., and Fernandes, G.
(1990) Biochem. Internatl. 20, 725-730. 61. Yamazaki, R.K., Shen, T., and Schade, G.B. (1987) Biochim.
Biophys. Acta 920, 62-67. 62. Allen, R.G., and Venkatraj, V.S. (1992)J. Nutr. 122, 631-635. 63. Flohe, L. (1982) in Free Radicals in Biology, pp. 223-254, Aca-
demic Press, New York. 64. Lands, W.E.M., LeTellier, P.R., Rome, L.H., and Vanderhoek,
J.Y. (1973)Adv. Biosci. 9, 15-27. 65. Culp, B.R., Titus, B.R., and Lands, W.E.M. (1979)
Prostaglandins Med. 3, 269-278. 66. Kornbrust, D.J., and Mavis, R.D. (1980) Lipids 15, 315-322. 67. Cameron, R.J., Armstrong, D., Clandinin, M.T., and Cinader,
B. (1986) Cancer Lett. 30, 175-180. 68. Tiwari, R.K., Venkatraman, J.T., Cinader, B., Flory, J.,
Wierzbicki, A., and Clandinin, M.T. (1988) Immunol. Lett. 17, 151-158.
69. Chandrasekar, B., and Fernandes, G. (1994)Biochem. Biophys. Res. Commun. 200, 893-898.
70. Fernandes, G., Chandrasekar, B., Venkatraman, J.T., Tomar, V., and Zhao, W. (1994)J. Immunol. 152, 5979-5987.
71. Lokesh, B.R., Mathur, S.N., and Specter, A.A. (1981) J. Lipid Res. 22, 905-915.
72. Kaasgaard, S.G., H01mer, G., Hey, C.E., Behrens, W.A., and Beare-Rogers, J.L. (1992) Lipids 27, 740-745.
73. Yu, B.P., Suescun, E.A., and Yang, S.Y. (1992)Mech. Ageing & Dev. 65, 17-33.
74. Draper, H.H., Polensck, L., Hadley, M., and McGirr, L.G. (1984) Lipids 19, 836-843.
[Received November 5, 1993, and in revised form June 6, 1994; Revision accepted June 18, 1994]
LIPIDS, Vol. 29, no. 8 (1994)
Copyright © 2022 FDOKUMEN