EFFECTS OF MULTI-GATES OPERATIONS ON BOTTOM VELOCITY PATTERN UNDER SUBMERGED FLOW CONDITIONS
14
Tenth International Water Technology Conference, IWTC10 2006, Alexandria, Egypt 267 EFFECTS OF MULTI-GATES OPERATIONS ON BOTTOM VELOCITY PATTERN UNDER SUBMERGED FLOW CONDITIONS A.M. Negm 1 , G.M. Abdel-Aal 2 , M.M. Elfiky 2 and Y. Abd-Alla Mohamed 3 1 Professor of Hydraulics, 2 Associate Professors and 3 Assistant Professor Water and Water Structures Engineering Dept., Faculty of Engineering, Zagazig University, Zagazig, Egypt. 1 E-mail: [email protected] ABSTRACT Failures of barrages or regulators or parts of them may be expected when excessive scour patterns are observed downstream of such structures. Severe and excessive scour may be largely due to unsymmetric operation of gates especially when a multi-vents barrages or regulator is being considered. Previous investigations proved that the scour patterns downstream hydraulic structures are functions of the bottom velocities among other relevant factors such as Froude number, operation of gates, …. etc. In this paper, the results of an experimental investigation on the effect of operations of gates of mutli-vents regulator on the pattern of bottom velocity (velocity near bed) are presented. The experimental program was carried under submeregd flow conditions. Symmetric and asymmetric operation of main gates, emergency gates and mixed operation of main and emergency gates are considered. An electromagetic flow meter is used to measure the velocity components (in x and y directions) near bed at a predefined mesh over both rigid and movable beds. The pattern of the velocity vectors for each run is plotted to indicate the relative magintude and direction of the bottom velocity, which in turn, could be used to predict the pattern of scour downstream of rigid bed of the multi-vents regulator. It is observed that the velocity pattern is a function of the operation of gates, type of gates (main or emergency), Froude number at the vena contracta, and submergence ratio. The qualitative and quantitative effects of all these parameters on the bottom velocity are presented in the present research paper. Keywords: Hydraulics, operations of gates, multivents regulators, Velocity pattern, scour pattern INTRODUCTION Most of the existing heading hydraulic structures as regulators consist of multivents and most of the problems downstream such structures are due to wrong operation of the multivents leading to unpredicted velocity patterns or (velocity distributions) which in turn leads to unexpected scour patterns. Due to the existence of piers and abutments as parts of these structures, the flow issuing out of their gates behaves as
Transcript of EFFECTS OF MULTI-GATES OPERATIONS ON BOTTOM VELOCITY PATTERN UNDER SUBMERGED FLOW CONDITIONS
Tenth International Water Technology Conference, IWTC10 2006, Alexandria, Egypt
267
EFFECTS OF MULTI-GATES OPERATIONS ON BOTTOM
VELOCITY PATTERN UNDER SUBMERGED FLOW CONDITIONS
A.M. Negm1, G.M. Abdel-Aal2, M.M. Elfiky2 and Y. Abd-Alla Mohamed3
1 Professor of Hydraulics, 2 Associate Professors and 3Assistant Professor Water and Water Structures Engineering Dept., Faculty of Engineering, Zagazig
University, Zagazig, Egypt. 1 E-mail: [email protected] ABSTRACT Failures of barrages or regulators or parts of them may be expected when excessive scour patterns are observed downstream of such structures. Severe and excessive scour may be largely due to unsymmetric operation of gates especially when a multi-vents barrages or regulator is being considered. Previous investigations proved that the scour patterns downstream hydraulic structures are functions of the bottom velocities among other relevant factors such as Froude number, operation of gates, …. etc. In this paper, the results of an experimental investigation on the effect of operations of gates of mutli-vents regulator on the pattern of bottom velocity (velocity near bed) are presented. The experimental program was carried under submeregd flow conditions. Symmetric and asymmetric operation of main gates, emergency gates and mixed operation of main and emergency gates are considered. An electromagetic flow meter is used to measure the velocity components (in x and y directions) near bed at a predefined mesh over both rigid and movable beds. The pattern of the velocity vectors for each run is plotted to indicate the relative magintude and direction of the bottom velocity, which in turn, could be used to predict the pattern of scour downstream of rigid bed of the multi-vents regulator. It is observed that the velocity pattern is a function of the operation of gates, type of gates (main or emergency), Froude number at the vena contracta, and submergence ratio. The qualitative and quantitative effects of all these parameters on the bottom velocity are presented in the present research paper. Keywords: Hydraulics, operations of gates, multivents regulators, Velocity pattern, scour pattern INTRODUCTION Most of the existing heading hydraulic structures as regulators consist of multivents and most of the problems downstream such structures are due to wrong operation of the multivents leading to unpredicted velocity patterns or (velocity distributions) which in turn leads to unexpected scour patterns. Due to the existence of piers and abutments as parts of these structures, the flow issuing out of their gates behaves as
Tenth International Water Technology Conference, IWTC10 2006, Alexandria, Egypt
268
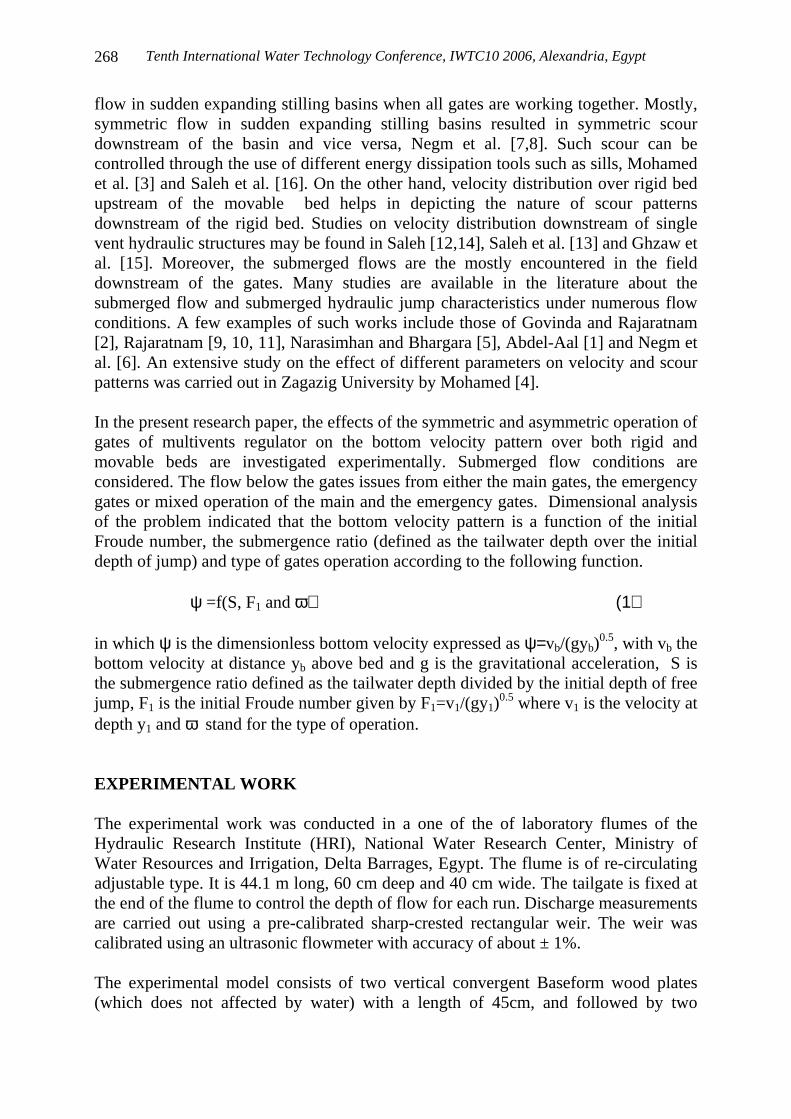
flow in sudden expanding stilling basins when all gates are working together. Mostly, symmetric flow in sudden expanding stilling basins resulted in symmetric scour downstream of the basin and vice versa, Negm et al. [7,8]. Such scour can be controlled through the use of different energy dissipation tools such as sills, Mohamed et al. [3] and Saleh et al. [16]. On the other hand, velocity distribution over rigid bed upstream of the movable bed helps in depicting the nature of scour patterns downstream of the rigid bed. Studies on velocity distribution downstream of single vent hydraulic structures may be found in Saleh [12,14], Saleh et al. [13] and Ghzaw et al. [15]. Moreover, the submerged flows are the mostly encountered in the field downstream of the gates. Many studies are available in the literature about the submerged flow and submerged hydraulic jump characteristics under numerous flow conditions. A few examples of such works include those of Govinda and Rajaratnam [2], Rajaratnam [9, 10, 11], Narasimhan and Bhargara [5], Abdel-Aal [1] and Negm et al. [6]. An extensive study on the effect of different parameters on velocity and scour patterns was carried out in Zagazig University by Mohamed [4]. In the present research paper, the effects of the symmetric and asymmetric operation of gates of multivents regulator on the bottom velocity pattern over both rigid and movable beds are investigated experimentally. Submerged flow conditions are considered. The flow below the gates issues from either the main gates, the emergency gates or mixed operation of the main and the emergency gates. Dimensional analysis of the problem indicated that the bottom velocity pattern is a function of the initial Froude number, the submergence ratio (defined as the tailwater depth over the initial depth of jump) and type of gates operation according to the following function. ψ =f(S, F1 and ω) (1) in which ψ is the dimensionless bottom velocity expressed as ψ=vb/(gyb)
0.5, with vb the bottom velocity at distance yb above bed and g is the gravitational acceleration, S is the submergence ratio defined as the tailwater depth divided by the initial depth of free jump, F1 is the initial Froude number given by F1=v1/(gy1)
0.5 where v1 is the velocity at depth y1 and ω stand for the type of operation. EXPERIMENTAL WORK The experimental work was conducted in a one of the of laboratory flumes of the Hydraulic Research Institute (HRI), National Water Research Center, Ministry of Water Resources and Irrigation, Delta Barrages, Egypt. The flume is of re-circulating adjustable type. It is 44.1 m long, 60 cm deep and 40 cm wide. The tailgate is fixed at the end of the flume to control the depth of flow for each run. Discharge measurements are carried out using a pre-calibrated sharp-crested rectangular weir. The weir was calibrated using an ultrasonic flowmeter with accuracy of about ± 1%. The experimental model consists of two vertical convergent Baseform wood plates (which does not affected by water) with a length of 45cm, and followed by two
Tenth International Water Technology Conference, IWTC10 2006, Alexandria, Egypt
269
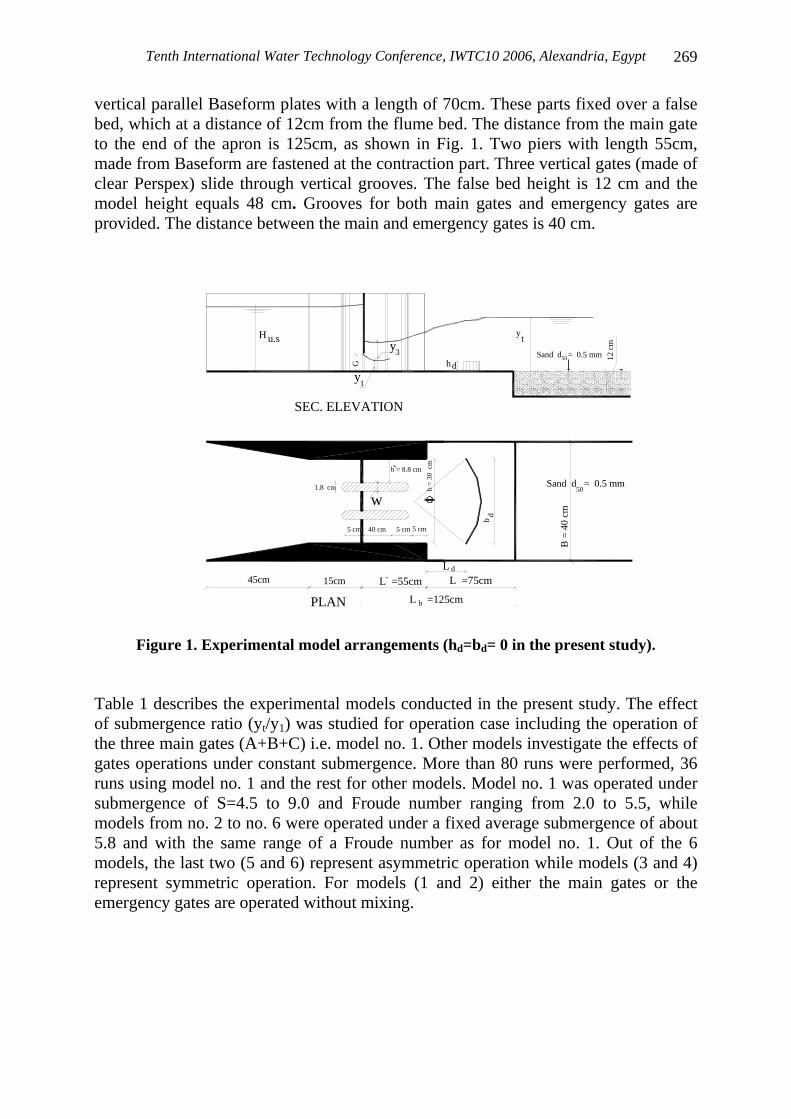
vertical parallel Baseform plates with a length of 70cm. These parts fixed over a false bed, which at a distance of 12cm from the flume bed. The distance from the main gate to the end of the apron is 125cm, as shown in Fig. 1. Two piers with length 55cm, made from Baseform are fastened at the contraction part. Three vertical gates (made of clear Perspex) slide through vertical grooves. The false bed height is 12 cm and the model height equals 48 cm. Grooves for both main gates and emergency gates are provided. The distance between the main and emergency gates is 40 cm.
d
12
cm
Sand d = 0.5 mmG
b = 8.8 cm
1.8 cm b =
30
cm
5 cm5 cm40 cm5 cm
B =
40
cm
50Sand d = 0.5 mm
15cm45cm
ty
hd
d
L =75cmL
L =125cmb
b
y
y
1
3
H u.s
w
SEC. ELEVATION
L =55cm-
PLAN
50
Figure 1. Experimental model arrangements (hd=bd= 0 in the present study). Table 1 describes the experimental models conducted in the present study. The effect of submergence ratio (yt/y1) was studied for operation case including the operation of the three main gates (A+B+C) i.e. model no. 1. Other models investigate the effects of gates operations under constant submergence. More than 80 runs were performed, 36 runs using model no. 1 and the rest for other models. Model no. 1 was operated under submergence of S=4.5 to 9.0 and Froude number ranging from 2.0 to 5.5, while models from no. 2 to no. 6 were operated under a fixed average submergence of about 5.8 and with the same range of a Froude number as for model no. 1. Out of the 6 models, the last two (5 and 6) represent asymmetric operation while models (3 and 4) represent symmetric operation. For models (1 and 2) either the main gates or the emergency gates are operated without mixing.
Tenth International Water Technology Conference, IWTC10 2006, Alexandria, Egypt
270
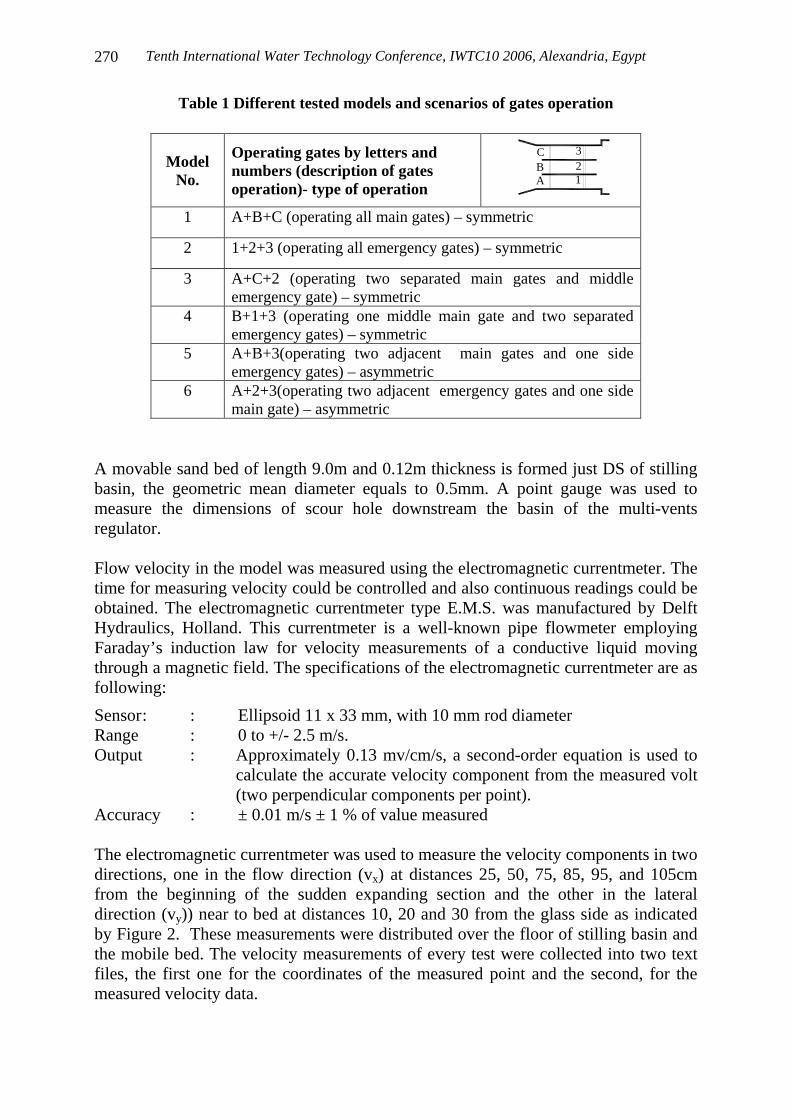
Table 1 Different tested models and scenarios of gates operation
Model No.
Operating gates by letters and numbers (description of gates operation)- type of operation
ABC 3
21
1 A+B+C (operating all main gates) – symmetric
2 1+2+3 (operating all emergency gates) – symmetric
3 A+C+2 (operating two separated main gates and middle emergency gate) – symmetric
4 B+1+3 (operating one middle main gate and two separated emergency gates) – symmetric
5 A+B+3(operating two adjacent main gates and one side emergency gates) – asymmetric
6 A+2+3(operating two adjacent emergency gates and one side main gate) – asymmetric
A movable sand bed of length 9.0m and 0.12m thickness is formed just DS of stilling basin, the geometric mean diameter equals to 0.5mm. A point gauge was used to measure the dimensions of scour hole downstream the basin of the multi-vents regulator. Flow velocity in the model was measured using the electromagnetic currentmeter. The time for measuring velocity could be controlled and also continuous readings could be obtained. The electromagnetic currentmeter type E.M.S. was manufactured by Delft Hydraulics, Holland. This currentmeter is a well-known pipe flowmeter employing Faraday’s induction law for velocity measurements of a conductive liquid moving through a magnetic field. The specifications of the electromagnetic currentmeter are as following:
Sensor : : Ellipsoid 11 x 33 mm, with 10 mm rod diameter Range : 0 to +/- 2.5 m/s. Output : Approximately 0.13 mv/cm/s, a second-order equation is used to
calculate the accurate velocity component from the measured volt (two perpendicular components per point).
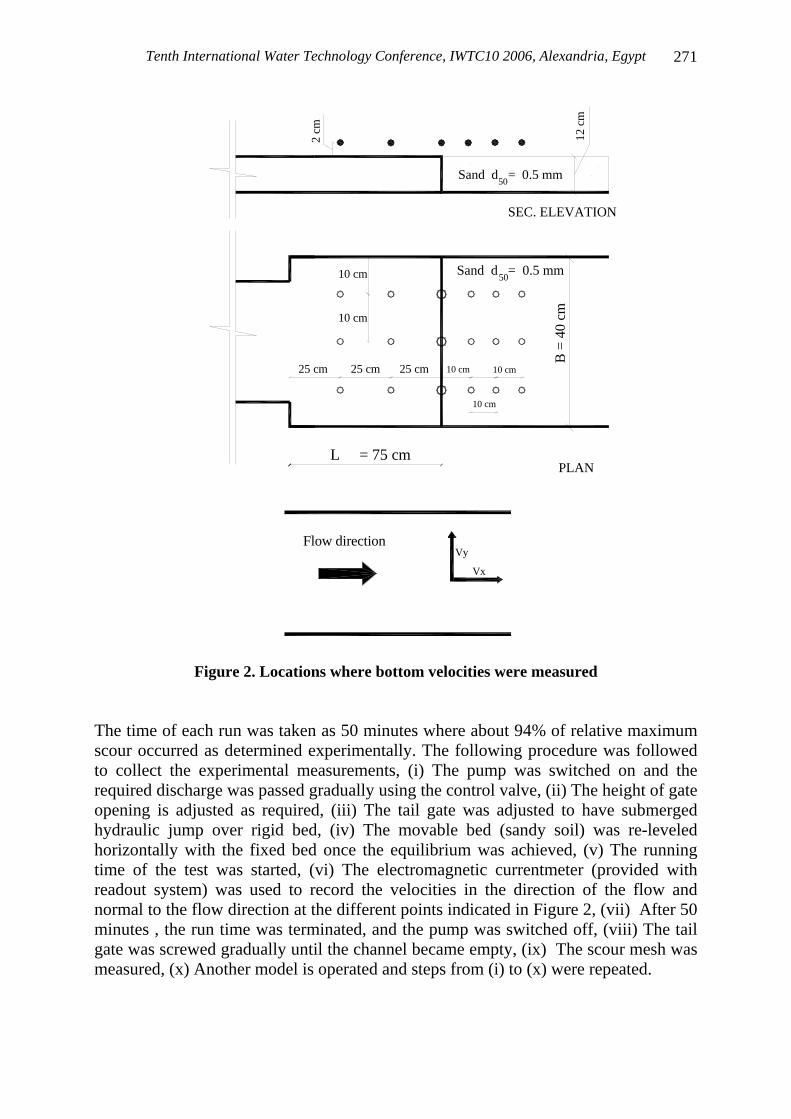
Accuracy : ± 0.01 m/s ± 1 % of value measured The electromagnetic currentmeter was used to measure the velocity components in two directions, one in the flow direction (vx) at distances 25, 50, 75, 85, 95, and 105cm from the beginning of the sudden expanding section and the other in the lateral direction (vy)) near to bed at distances 10, 20 and 30 from the glass side as indicated by Figure 2. These measurements were distributed over the floor of stilling basin and the mobile bed. The velocity measurements of every test were collected into two text files, the first one for the coordinates of the measured point and the second, for the measured velocity data.
Tenth International Water Technology Conference, IWTC10 2006, Alexandria, Egypt
271
PLAN
SEC. ELEVATION
2 cm
10 cm
10 cm
10 cm
10 cm10 cm25 cm25 cm25 cm
L = 75 cm
B =
40
cm
Sand d = 0.5 mm50
50Sand d = 0.5 mm
12
cm
VyFlow direction
Vx
Figure 2. Locations where bottom velocities were measured The time of each run was taken as 50 minutes where about 94% of relative maximum scour occurred as determined experimentally. The following procedure was followed to collect the experimental measurements, (i) The pump was switched on and the required discharge was passed gradually using the control valve, (ii) The height of gate opening is adjusted as required, (iii) The tail gate was adjusted to have submerged hydraulic jump over rigid bed, (iv) The movable bed (sandy soil) was re-leveled horizontally with the fixed bed once the equilibrium was achieved, (v) The running time of the test was started, (vi) The electromagnetic currentmeter (provided with readout system) was used to record the velocities in the direction of the flow and normal to the flow direction at the different points indicated in Figure 2, (vii) After 50 minutes , the run time was terminated, and the pump was switched off, (viii) The tail gate was screwed gradually until the channel became empty, (ix) The scour mesh was measured, (x) Another model is operated and steps from (i) to (x) were repeated.
Tenth International Water Technology Conference, IWTC10 2006, Alexandria, Egypt
272
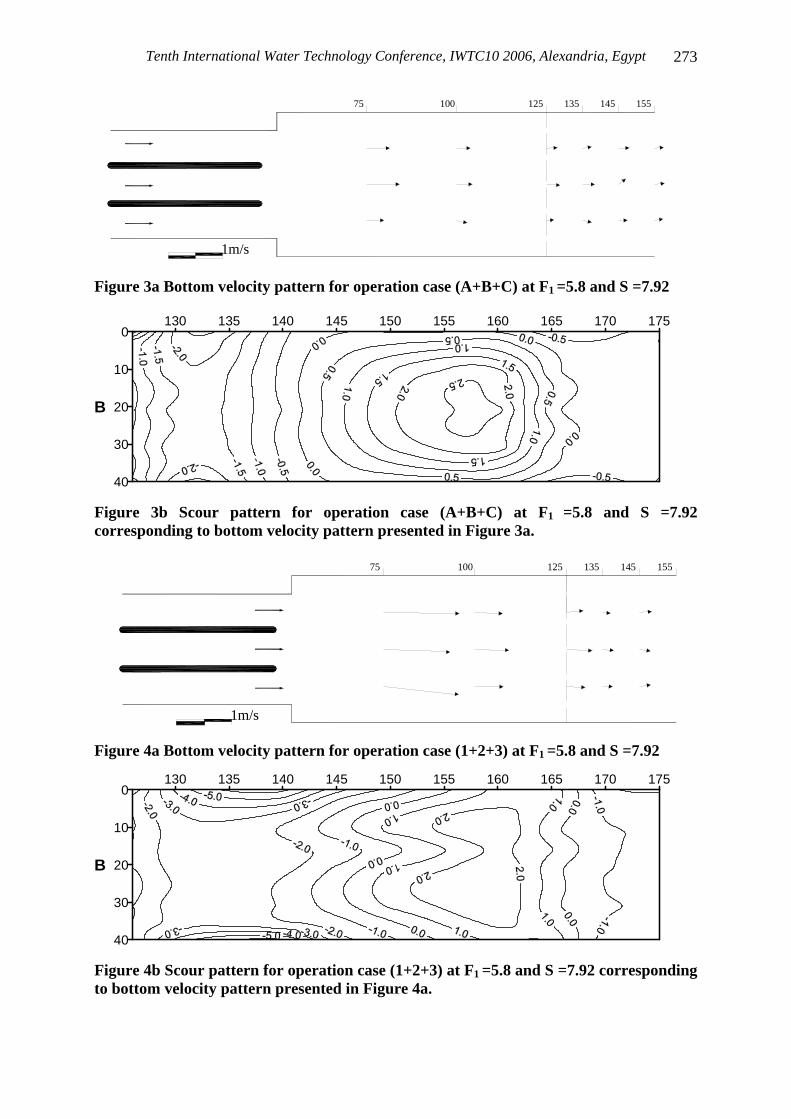
ANALYSIS AND DISCUSSIONS The results of all the runs were analyzed. The data files for velocities measurements were treated by vector velocity software available at HRI, to convert these data to script file which is converted to AutoCAD software. The AutoCAD software was used to draw the velocity vectors using the required scale. Since the scour downstream of the stilling is mostly affecting by the bottom velocity at the end of the basin. The maximum velocity at the end of the basin is extracted for all runs and converted into its corresponding dimensionless parameter as obtained from the dimensional analysis and is called the relative maximum bottom velocity and denoted by Ψ which is then correlated to the both submergence ratio and Froude number for the different models or scenarios of gates operation. At the main time the recorded scour measurements were plotted to indicate the scour pattern corresponding to each velocity pattern. From the analysis of all data and figures, the following observations may be noticed as per the following paragraphs. The operation of the three main gates (expansion ratio = 1.5), i.e., (A+B+C) yields lower values of the velocities and results in symmetrical velocity pattern at all Froude numbers as indicated in Figure 3a for F1=5.8 at S=7.92 as a typical case. It should be noted that the maximum velocity vector is observed in the middle of the channel where the horizontal velocity is maximum in open channels. The observed scour pattern in this case is in turn symmetrical and not severe compared to other operation case. Actually the minimum values of maximum scour depth are observed for this operation case. It is also observed that the scour and deposition are symmetric to the longitudinal axis of the channel. A considerable amount of the flow energy is lost due to the frictional resistance induced due to the presence of piers as all the flow pass between piers and suddenly expands at the end of the piers leading to more loss of the flow energy. The operation of the three emergency gates (1+2+3) produces the highest values of the velocities and hence the velocity pattern shows longer velocities vectors compared to all other operation cases as shown in Figure 4a. The velocity pattern shows a slight deviation from symmetricality which in turn leads to a slight asymmetrical scour pattern as shown in Figure 4b. At the same location in the basin, the flow has higher energy compared to all other cases due to its short pass as it emerges from the emergency grooves into the basin directly saving the lost energy between piers as in operation case (A+B+C). For this reason the flow reach the movable bed with high energy leading to maximum scour values compared to all other case.
Tenth International Water Technology Conference, IWTC10 2006, Alexandria, Egypt
273
155135 14512510075
1m/s
Figure 3a Bottom velocity pattern for operation case (A+B+C) at F1 =5.8 and S =7.92
0
10
20
30
40
B
130 135 140 145 150 155 160 165 170 175
Figure 3b Scour pattern for operation case (A+B+C) at F1 =5.8 and S =7.92 corresponding to bottom velocity pattern presented in Figure 3a.
75 100 125 145135 155
1m/s
Figure 4a Bottom velocity pattern for operation case (1+2+3) at F1 =5.8 and S =7.92
0
10
20
30
40
B
130 135 140 145 150 155 160 165 170 175
Figure 4b Scour pattern for operation case (1+2+3) at F1 =5.8 and S =7.92 corresponding to bottom velocity pattern presented in Figure 4a.
Tenth International Water Technology Conference, IWTC10 2006, Alexandria, Egypt
274
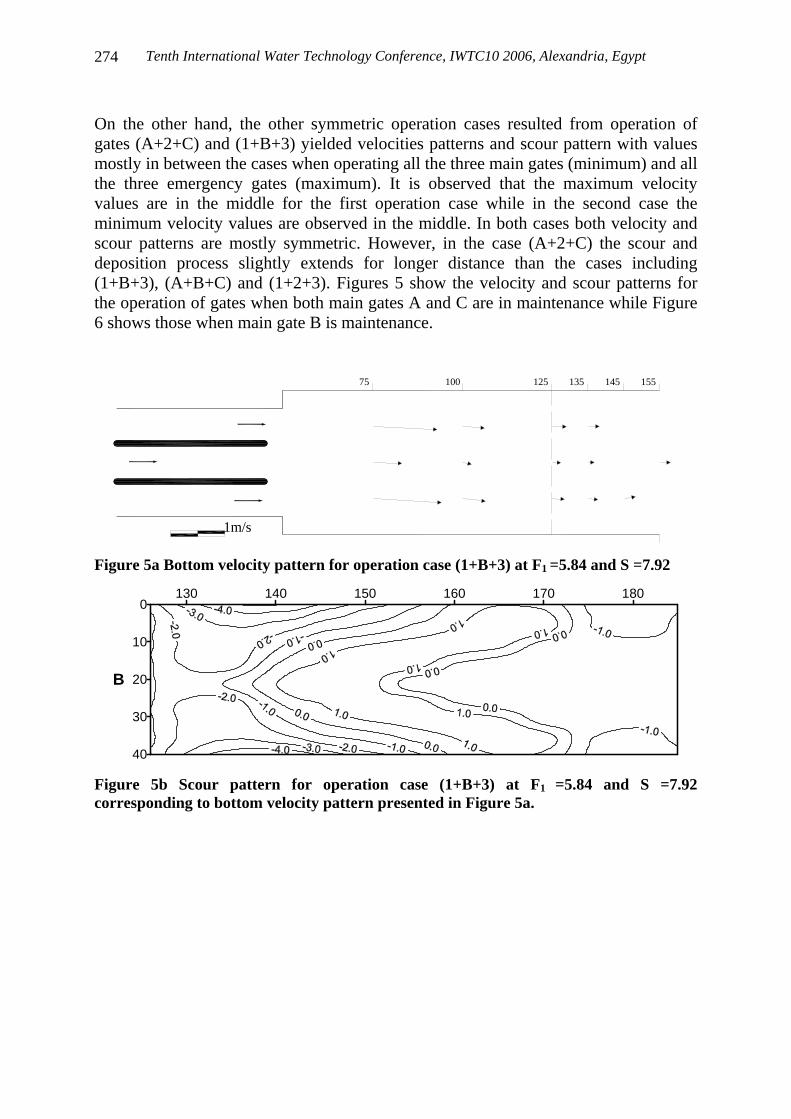
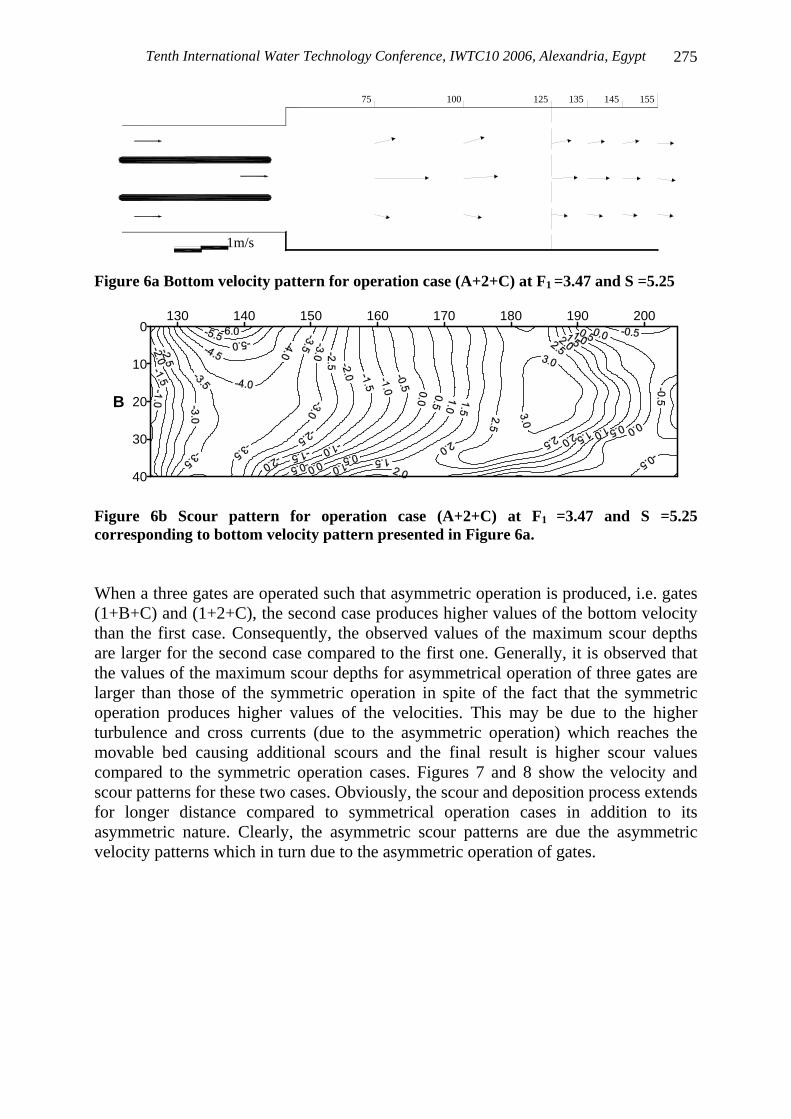
On the other hand, the other symmetric operation cases resulted from operation of gates (A+2+C) and (1+B+3) yielded velocities patterns and scour pattern with values mostly in between the cases when operating all the three main gates (minimum) and all the three emergency gates (maximum). It is observed that the maximum velocity values are in the middle for the first operation case while in the second case the minimum velocity values are observed in the middle. In both cases both velocity and scour patterns are mostly symmetric. However, in the case (A+2+C) the scour and deposition process slightly extends for longer distance than the cases including (1+B+3), (A+B+C) and (1+2+3). Figures 5 show the velocity and scour patterns for the operation of gates when both main gates A and C are in maintenance while Figure 6 shows those when main gate B is maintenance.
1m/s
75 100 145125 135 155
Figure 5a Bottom velocity pattern for operation case (1+B+3) at F1 =5.84 and S =7.92
0
10
20
30
40
B
130 140 150 160 170 180
Figure 5b Scour pattern for operation case (1+B+3) at F1 =5.84 and S =7.92 corresponding to bottom velocity pattern presented in Figure 5a.
Tenth International Water Technology Conference, IWTC10 2006, Alexandria, Egypt
275
13575 100 125 145 155
1m/s
Figure 6a Bottom velocity pattern for operation case (A+2+C) at F1 =3.47 and S =5.25
0
10
20
30
40
B
130 140 150 160 170 180 190 200
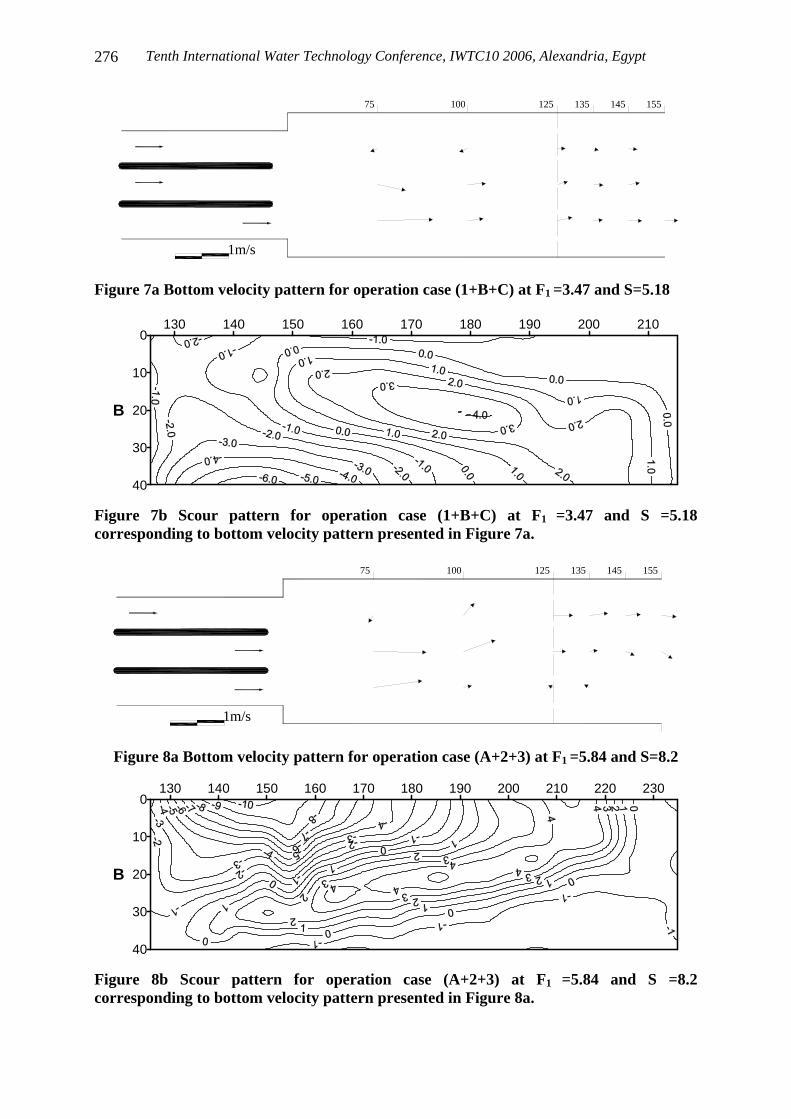
Figure 6b Scour pattern for operation case (A+2+C) at F1 =3.47 and S =5.25 corresponding to bottom velocity pattern presented in Figure 6a. When a three gates are operated such that asymmetric operation is produced, i.e. gates (1+B+C) and (1+2+C), the second case produces higher values of the bottom velocity than the first case. Consequently, the observed values of the maximum scour depths are larger for the second case compared to the first one. Generally, it is observed that the values of the maximum scour depths for asymmetrical operation of three gates are larger than those of the symmetric operation in spite of the fact that the symmetric operation produces higher values of the velocities. This may be due to the higher turbulence and cross currents (due to the asymmetric operation) which reaches the movable bed causing additional scours and the final result is higher scour values compared to the symmetric operation cases. Figures 7 and 8 show the velocity and scour patterns for these two cases. Obviously, the scour and deposition process extends for longer distance compared to symmetrical operation cases in addition to its asymmetric nature. Clearly, the asymmetric scour patterns are due the asymmetric velocity patterns which in turn due to the asymmetric operation of gates.
Tenth International Water Technology Conference, IWTC10 2006, Alexandria, Egypt
276
12575 100 135 145 155
1m/s
Figure 7a Bottom velocity pattern for operation case (1+B+C) at F1 =3.47 and S=5.18
0
10
20
30
40
B
130 140 150 160 170 180 190 200 210
Figure 7b Scour pattern for operation case (1+B+C) at F1 =3.47 and S =5.18 corresponding to bottom velocity pattern presented in Figure 7a.
1m/s
75 100 145125 135 155
Figure 8a Bottom velocity pattern for operation case (A+2+3) at F1 =5.84 and S=8.2
0
10
20
30
40
B
130 140 150 160 170 180 190 200 210 220 230
Figure 8b Scour pattern for operation case (A+2+3) at F1 =5.84 and S =8.2 corresponding to bottom velocity pattern presented in Figure 8a.
Tenth International Water Technology Conference, IWTC10 2006, Alexandria, Egypt
277
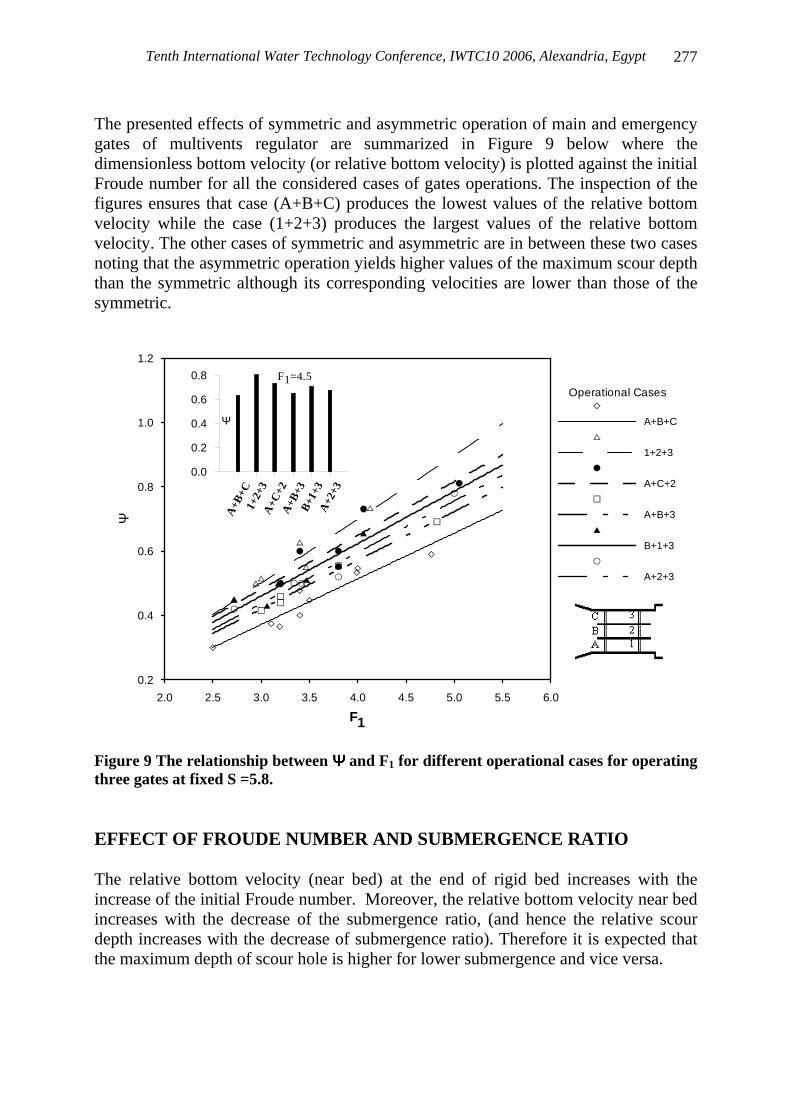
The presented effects of symmetric and asymmetric operation of main and emergency gates of multivents regulator are summarized in Figure 9 below where the dimensionless bottom velocity (or relative bottom velocity) is plotted against the initial Froude number for all the considered cases of gates operations. The inspection of the figures ensures that case (A+B+C) produces the lowest values of the relative bottom velocity while the case (1+2+3) produces the largest values of the relative bottom velocity. The other cases of symmetric and asymmetric are in between these two cases noting that the asymmetric operation yields higher values of the maximum scour depth than the symmetric although its corresponding velocities are lower than those of the symmetric.
2.0 2.5 3.0 3.5 4.0 4.5 5.0 5.5 6.0
F1
0.2
0.4
0.6
0.8
1.0
1.2
Ψ
Operational Cases
A+B+C
1+2+3
A+C+2
A+B+3
B+1+3
A+2+3
A+B
+C1+
2+3
A+C
+2A
+B+3
B+1+
3A
+2+3
0.0
0.2
0.4
0.6
0.8
Ψ
F1=4.5
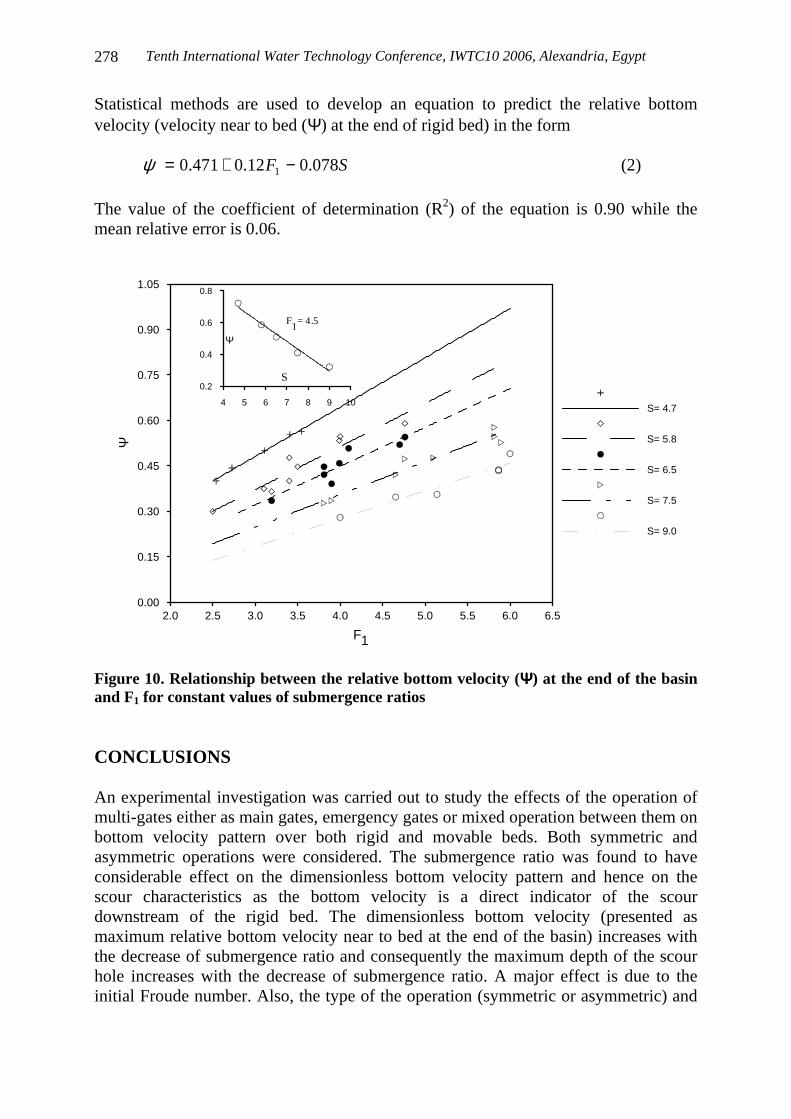
Figure 9 The relationship between ΨΨΨΨ and F1 for different operational cases for operating three gates at fixed S =5.8. EFFECT OF FROUDE NUMBER AND SUBMERGENCE RATIO The relative bottom velocity (near bed) at the end of rigid bed increases with the increase of the initial Froude number. Moreover, the relative bottom velocity near bed increases with the decrease of the submergence ratio, (and hence the relative scour depth increases with the decrease of submergence ratio). Therefore it is expected that the maximum depth of scour hole is higher for lower submergence and vice versa.
Tenth International Water Technology Conference, IWTC10 2006, Alexandria, Egypt
278
Statistical methods are used to develop an equation to predict the relative bottom velocity (velocity near to bed (Ψ) at the end of rigid bed) in the form SF 078.012.0471.0 1 −+=ψ (2) The value of the coefficient of determination (R2) of the equation is 0.90 while the mean relative error is 0.06.
2.0 2.5 3.0 3.5 4.0 4.5 5.0 5.5 6.0 6.5
F1
0.00
0.15
0.30
0.45
0.60
0.75
0.90
1.05
Ψ
S= 4.7
S= 5.8
S= 6.5
S= 7.5
S= 9.0
4 5 6 7 8 9 10
0.2
0.4
0.6
0.8
F1
= 4.5
S
Ψ
Figure 10. Relationship between the relative bottom velocity (ΨΨΨΨ) at the end of the basin and F1 for constant values of submergence ratios CONCLUSIONS An experimental investigation was carried out to study the effects of the operation of multi-gates either as main gates, emergency gates or mixed operation between them on bottom velocity pattern over both rigid and movable beds. Both symmetric and asymmetric operations were considered. The submergence ratio was found to have considerable effect on the dimensionless bottom velocity pattern and hence on the scour characteristics as the bottom velocity is a direct indicator of the scour downstream of the rigid bed. The dimensionless bottom velocity (presented as maximum relative bottom velocity near to bed at the end of the basin) increases with the decrease of submergence ratio and consequently the maximum depth of the scour hole increases with the decrease of submergence ratio. A major effect is due to the initial Froude number. Also, the type of the operation (symmetric or asymmetric) and
Tenth International Water Technology Conference, IWTC10 2006, Alexandria, Egypt
279
the type of operated gates (main, emergency and mixed) were found to have a remarkable effect on the maximum relative bottom velocity at the end of the rigid bed. The operation of the main gates yields the minimum values of the bottom velocity while the operation of the emergency gates produces the largest values of the maximum bottom velocity at the end of the rigid bed (end of basin). Asymmetric operation of gates (mixed main and emergency gates) is more severe than when the mixed operation is symmetric. It is advisable always to operate the gates in symmetric operations given priority to the main gates unless they need maintenance. REFERENCES 1. Abdel Alal, G.M., “Modeling of Rectangular Submerged Hydraulic Jumps”,
Alexandria Engineering Journal, Vol. 43, No. 6, 2004, pp.865-873. 2. Govinda Rao, N.S. and Rajaratnam, N., “The submerged hydraulic jump”,
Journal of Hydraulic Div., Vol. 89, No. HY1, 1963, pp. 139-163. 3. Mohamed, M.S., Negm, A.M., and El-Saiad, A.A., “Effect of Continuous Sill
on Scour Downstream of Hydraulic Structures” Civil Engineering Research Magazine, Faculty of Engineering, Al-Azhar University, Vol. 21, No. 3, July, 1999, pp 625-645.
4. Mohamed, Y.A., “Scour Characteristics Downstream of Divergent Stilling Basins”, Unpublished Ph.D. Thesis submitted to Faculty of Engineering, Zagazig University, Zagazig, Egypt, 2005.
5. Narasimhan, S., and Bhargara P., “Pressure Fluctuations in Submerged jump”, Journal of the Hydraulic Div., Vol. 102, No. HY3, 1976, pp. 339-350.
6. Negm, A.M., Abdel-Aal, G.M., Elfiky, M.I., and Mohmed, Y.A., “Characteristics of Submerged Hydraulic Jump in Radial basins with a Vertical Drop in the Bed”, AEJ, Faculty of Eng., Alexandria University, Egypt, 2002.
7. Negm, A.M., Abdel Aal, G.M., Saleh, O.K., and Sauida, M.F., “Effect of Supercritical Flow on Scour Characteristics Downstream of Sudden Expanding Stilling Basin”, EJEST Journal, Faculty of Engineering, Zagazig University, Vol. 6, No. 1, January, 2002, pp. 129-141.
8. Negm, A.M., Saleh, O.K., Abdel-Aal, G.M. & Sauida, M.F., “Investigating Scour Characteristics Downstream of Abruptly Enlarged Stilling Basins”, Proceedings of the International Conference on Fluvial Hydraulics, River Flow 2002, Sep. 1-4, Belgium, Published by D. Bousmar & Y. Zech, Editors, Swets & Zeitlinger, Lisse, The Netherlands, 2002, (ISBN 90-5809-509-6).
9. Rajaratnam, N., “Submerged Hydraulic Jump”, Journal of the Hydraulic Div., Vol. 91, No. HY4, 1965, pp. 71-96.
10. Rajaratnam, N., “Hydraulic Jump in Advances in Hydro-science”, Vol. 14 Edited by V.T. Chow, Academic Press, New York and London, 1967, pp. 197-280.
11. Rajaratnam, N., “Erosion by Submerged Circular Jets” Journal of the Hydraulic Division, Vol. 108, No. HY2, February, 1982, pp. 262-267.
Tenth International Water Technology Conference, IWTC10 2006, Alexandria, Egypt
280
12. Saleh, O.K., River Training and Protection for Reach Downstream of Hydraulic Structures”, Ph.D. Thesis, Submitted to Faculty of Engineering, Zagazig University, Zagazig, Egypt, 1995.
13. Saleh, O.K., Owais, T.M. and Drewes, Uwe, Riprap Design Downstream Hydraulic Structures”, Proc. of Al-Azhar Engineering 4th Int. Conf., Dec 15-19, Al-Azhar University, Cairo, Egypt, Vol. 4, 1995, pp. 633-644.
14. Saleh O. K., “Velocity Distribution Downstream Hydraulic Jump”, Engineering Research Journal, Vol. 62, April, Faculty of Engineering, Helwan University, Mataria, Cairo, Egypt, 1999, pp.103-114.
15. Ghzaw, Y., Saleh O. K. and Salem, A.A.S., “Sill Effect on the Velocity Distribution Downstream Hydraulic Jump”, Engineering Research Journal, Vol. 71, October, Faculty of Engineering, Helwan University, Mataria, Cairo, Egypt, 2000, pp. 18-31.
16. Saleh, O.K., Negm, Ahmed, N.G., “Effect of Asymmetric Side Sill on Scour Characteristics Downstream of Sudden Expanding Stilling Basins”, Al-Azhar Engineering 7th International Conference, Cairo, Egypt, 2003.
NOTATIONS B: The flume width, [L]. be: The width DS of working gates [L]. d50: The mean diameter of the sand base, [L] F1 Initial Froude number (F1=v1/(gy1)
0.5 [-] g: The gravitational acceleration, [LT-2]. S: The submergence ratio (yt/y1), [-]. v1: The velocity at the supercritical flow depth y1, [LT-1]. w: The pier width, [L]. y1: The supercritical flow depth, [L]. yb: The distance from the bottom to the location wheter the bottom velocity is
measured. yt, The tail water depth, [L]. ω: The scenario of operating gates systems, [-]. ψ: Τhe relative bottom velocity, ψ = vb/(gyb)
0.5.